
SteelFusion Edge User Guide, Version 6.5.0 - Riverbed Support
758
SteelFusion ™ Edge User Guide Models 2200, 3100 and 5100 Version 6.5.0 June 2022
-
Upload
khangminh22 -
Category
Documents
-
view
0 -
download
0
Transcript of SteelFusion Edge User Guide, Version 6.5.0 - Riverbed Support

SteelFusion™ Edge User Guide
Models 2200, 3100 and 5100
Version 6.5.0
June 2022

Riverbed Technology
680 Folsom Street
San Francisco, CA 94107
www.riverbed.com
Part Number
712-00073-09
© 2022 Riverbed Technology, Inc. All rights reserved.
Riverbed and any Riverbed product or service name or logo used herein are trademarks of Riverbed. All other trademarks used
herein belong to their respective owners. The trademarks and logos displayed herein cannot be used without the prior written
consent of Riverbed or their respective owners.
Akamai® and the Akamai wave logo are registered trademarks of Akamai Technologies, Inc. SureRoute is a service mark of
Akamai. Apple and Mac are registered trademarks of Apple, Incorporated in the United States and in other countries. Cisco is
a registered trademark of Cisco Systems, Inc. and its affiliates in the United States and in other countries. EMC, Symmetrix, and
SRDF are registered trademarks of EMC Corporation and its affiliates in the United States and in other countries. IBM, iSeries,
and AS/400 are registered trademarks of IBM Corporation and its affiliates in the United States and in other countries. Juniper
Networks and Junos are registered trademarks of Juniper Networks, Incorporated in the United States and other countries.
Linux is a trademark of Linus Torvalds in the United States and in other countries. Microsoft, Windows, Vista, Outlook, and
Internet Explorer are trademarks or registered trademarks of Microsoft Corporation in the United States and in other countries.
Oracle and JInitiator are trademarks or registered trademarks of Oracle Corporation in the United States and in other countries.
UNIX is a registered trademark in the United States and in other countries, exclusively licensed through X/Open Company, Ltd.
VMware, ESX, ESXi are trademarks or registered trademarks of VMware, Inc. in the United States and in other countries.
This product includes Windows Azure Linux Agent developed by the Microsoft Corporation (http://www.microsoft.com/).
Copyright 2017 Microsoft Corporation.
This product includes software developed by the University of California, Berkeley (and its contributors), EMC, and Comtech
AHA Corporation. This product is derived from the RSA Data Security, Inc. MD5 Message-Digest Algorithm.
The SteelHead Client Accelerator (virtual edition) includes VMware Tools. Portions Copyright © 1998-2016 VMware, Inc. All
Rights Reserved.
NetApp Manageability Software Development Kit (NM SDK), including any third-party software available for review with such
SDK which can be found at http://communities.netapp.com/docs/DOC-1152, and are included in a NOTICES file included
within the downloaded files.
For a list of open source software (including libraries) used in the development of this software along with associated copyright
and license agreements, see the Riverbed Support site at https://support.riverbed.com.
This documentation is furnished “AS IS” and is subject to change without notice and should not be construed as a commitment
by Riverbed. This documentation may not be copied, modified or distributed without the express authorization of Riverbed and
may be used only in connection with Riverbed products and services. Use, duplication, reproduction, release, modification,
disclosure or transfer of this documentation is restricted in accordance with the Federal Acquisition Regulations as applied to
civilian agencies and the Defense Federal Acquisition Regulation Supplement as applied to military agencies. This
documentation qualifies as “commercial computer software documentation” and any use by the government shall be
governed solely by these terms. All other use is prohibited. Riverbed assumes no responsibility or liability for any errors or
inaccuracies that may appear in this documentation.
Contents | 3
Contents
Welcome....................................................................................................................................................................9
Document conventions ..............................................................................................................................10
Contacting Riverbed....................................................................................................................................10
1 - SteelFusion Edge Overview........................................................................................................................... 11
Introducing SteelFusion Edge.................................................................................................................... 11
SteelFusion terminology...................................................................................................................... 12Benefits of SteelFusion Edge .............................................................................................................. 12SteelFusion Edge architecture............................................................................................................ 13
Software dependencies and compatibility ............................................................................................. 13
Software dependencies ....................................................................................................................... 14SCC compatibility .................................................................................................................................14Ethernet network compatibility ......................................................................................................... 15
SNMP-based management compatibility ............................................................................................... 15
Using the Management Console .............................................................................................................. 16
Navigating in the Management Console .........................................................................................18
Next steps ...................................................................................................................................................... 21
2 - Configuring DNS Caching.............................................................................................................................23
3 - Working with the Hypervisor ........................................................................................................................29
Before you begin...................................................................................................................................29Configuring the hypervisor ................................................................................................................ 30Viewing hypervisor operational status.............................................................................................. 31Working with the vSphere hypervisor during an upgrade........................................................... 46Adding a new image............................................................................................................................ 46
Managing the hypervisor and virtual machines with vSphere ........................................................... 49
Creating and configuring virtual machines ............................................................................................ 51
4 - Modifying Host and Network Interface Settings ......................................................................................53
Viewing the test result..........................................................................................................................57IPv6 support ...........................................................................................................................................58

4 | Contents
5 - Configuring Edge Connectivity and High Availability ..............................................................................75
Configuring Edge high availability ............................................................................................................78
Edge high availability with Core high availability............................................................................79Viewing configuration information ...................................................................................................83
6 - Configuring In-Path Rules.............................................................................................................................87
Creating in-path rules for packet-mode optimization ................................................................ 88
Default in-path rules................................................................................................................................... 90
7 - Configuring Optimization Features...........................................................................................................107
Enabling basic deployment options............................................................................................... 108Enabling failover ................................................................................................................................. 108Configuring general service settings ..............................................................................................110Configuring peering ........................................................................................................................... 118Encrypting the RiOS data store ........................................................................................................125Synchronizing peer RiOS data stores ............................................................................................. 127Clearing the RiOS data store ............................................................................................................128Improving SteelHead Mobile performance ...................................................................................129Receiving a notification when the RiOS data store wraps .........................................................130Selecting a RiOS data store segment replacement policy ......................................................... 131Optimizing the RiOS data store for high-throughput environments ...................................... 131Configuring CPU settings..................................................................................................................134Prerequisites.........................................................................................................................................135Configuring SaaS acceleration on a SteelFusion Edge ...............................................................135Configuring SaaS acceleration on multiple SteelFusion Edges using SCC ............................ 137Monitoring SaaS acceleration...........................................................................................................138Canceling SaaS acceleration ............................................................................................................138Prerequisites.........................................................................................................................................139Activating SaaS applications ............................................................................................................. 141Editing a prepopulation share ..........................................................................................................143Performing CIFS prepopulation share operations .......................................................................147Viewing CIFS prepopulation share logs .........................................................................................148Optimizing TCP and satellite WANs ................................................................................................149High-speed TCP optimization..........................................................................................................163When to use .........................................................................................................................................165Dependencies ......................................................................................................................................165Creating a domain label.....................................................................................................................167Modifying domains in a domain label.............................................................................................168Creating a host label...........................................................................................................................169Resolving hostnames .........................................................................................................................170Viewing the hostname resolution summary ................................................................................. 171Modifying hostnames or subnets in a host label.......................................................................... 171Modifying ports in a port label ......................................................................................................... 173CIFS enhancements by version........................................................................................................ 175Configuring SMB signing................................................................................................................... 181Encrypting SMB3 ................................................................................................................................ 190About HTTP optimization.................................................................................................................. 191Basic Steps............................................................................................................................................192

Contents | 5
Configuring HTTP optimization feature settings .........................................................................192Configuring a server subnet or host ...............................................................................................197Determining the deployment mode .............................................................................................. 204Enabling Oracle Forms optimization ............................................................................................. 204Optimizing MAPI Exchange in out-of-path deployments .........................................................213Deploying SteelHeads with Exchange Servers behind load balancers....................................213Encryption Optimization Servers table...........................................................................................221Unoptimized IP Address table ..........................................................................................................221Citrix enhancements by RiOS version ........................................................................................... 222Citrix version support ........................................................................................................................ 222Viewing FCIP connections ............................................................................................................... 229FCIP rules (VMAX-to-VMAX traffic only) ....................................................................................... 230Viewing SRDF connections.............................................................................................................. 234Setting a custom data reduction level for an RDF group .......................................................... 234Creating SRDF rules (VMAX-to-VMAX traffic only) ..................................................................... 236How a SteelHead optimizes SnapMirror traffic ........................................................................... 238Easy domain authentication configuration .................................................................................. 244Configuring domain authentication for delegation.................................................................... 248Status and logging ............................................................................................................................. 252Delegation ........................................................................................................................................... 253Autodelegation mode ....................................................................................................................... 259Configuring replication users (Kerberos) ...................................................................................... 265Granting replication user privileges on the Domain Controller............................................... 268Verifying the domain functional level ............................................................................................ 269Configuring PRP on the Domain Controller ................................................................................ 269
8 - Configuring QoS, Path Selection, and Hybrid Networking ..................................................................271
Best practices for QoS configuration .............................................................................................272Best practices for path selection configuration ...........................................................................273Topology properties .......................................................................................................................... 274Defining a network .............................................................................................................................275Defining a site ......................................................................................................................................277Defining uplinks.................................................................................................................................. 279QoS SteelFusion Edge appliance limits ......................................................................................... 289Bypassing LAN traffic......................................................................................................................... 290Overview .............................................................................................................................................. 294Viewing and editing the default QoS classes ............................................................................... 298Adding QoS profiles........................................................................................................................... 302Adding and editing QoS rules.......................................................................................................... 303Enabling MX-TCP queue policies ................................................................................................... 307Classifying and prioritizing OOB traffic using DSCP marking .................................................. 308How an appliance identifies and shapes inbound traffic............................................................ 311Using paths to steer packets.............................................................................................................313Path selection use cases....................................................................................................................315
9 - Configuring SSL and a Secure Inner Channel .........................................................................................319
How does SSL work?..........................................................................................................................319Prerequisite tasks ............................................................................................................................... 320
6 | Contents
Configuring SSL server certificates .................................................................................................327Preventing the export of SSL server certificates and private keys ........................................... 330Managing CRL distribution points .................................................................................................. 338Secure inner channel overview....................................................................................................... 340Enabling secure peers ........................................................................................................................341Configuring peer trust....................................................................................................................... 344Performing bulk imports and exports............................................................................................ 359
10 - Configuring Network Integration Features .......................................................................................... 363
Troubleshooting asymmetric routes.............................................................................................. 365Enabling flow export ..........................................................................................................................375Domain and local workgroup settings .......................................................................................... 382Preconfiguration checklist for joining a SteelHead to a Windows domain........................... 385Verifying a multiple in-path interface configuration .................................................................. 398Modifying WCCP group settings..................................................................................................... 398
11 - Managing SteelFusion Edges.................................................................................................................... 403
Upgrading your software..................................................................................................................406Downgrading your software............................................................................................................ 407Verifying your software image ........................................................................................................408Licensing overview ............................................................................................................................ 410Installing a license.............................................................................................................................. 410Upgrading an appliance model........................................................................................................412Removing a license.............................................................................................................................413Understanding account types ..........................................................................................................418Selecting a password policy ............................................................................................................ 423ACL management rules .................................................................................................................... 438Managing web SSL certificates.........................................................................................................441
12 - Configuring System Administrator Settings.......................................................................................... 447
Filtering logs by application or process ........................................................................................ 472Current NTP server status ................................................................................................................ 476NTP authentication.............................................................................................................................477NTP servers...........................................................................................................................................477
13 - Viewing Reports and Logs.........................................................................................................................491
Overview ..................................................................................................................................................... 493
Navigating the report layout............................................................................................................ 493Viewing the test results......................................................................................................................631Viewing the test status ...................................................................................................................... 635Viewing the test results..................................................................................................................... 635Troubleshooting ................................................................................................................................. 650Custom flag use examples................................................................................................................651IPv6 custom flag use examples........................................................................................................651Stopping a TCP dump after an event occurs ................................................................................651Viewing a TCP dump......................................................................................................................... 653Uploading a TCP dump .................................................................................................................... 653

Contents | 7
What this report tells you ................................................................................................................. 655About report data............................................................................................................................... 656
A - SteelFusion Edge MIB.................................................................................................................................. 659
Retrieving optimized traffic statistics by port...............................................................................660
SNMP traps .................................................................................................................................................660
B - SteelFusion Edge Ports ............................................................................................................................... 693
Secure ports forwarded by the SteelFusion Edge .............................................................................. 695
C - Application Signatures for AFE.................................................................................................................. 699

8 | Contents
Welcome | 9
Welcome
Welcome to the SteelFusion Edge User Guide (NFS mode). The iSCSI version of this guide can be found
on the Riverbed Support site at https://support.riverbed.com. This guide describes how to use the
SteelFusion Edge Management Console to configure product features, view reports, and modify network
settings.
This guide is written for storage and network administrators who are familiar with administering and
managing WANs using common network protocols such as TCP, CIFS, HTTP, FTP, and NFS. This guide
is also intended for users who are using the Riverbed command-line interface (CLI) as described in the
Riverbed Command-Line Interface Reference Manual.
This guide includes information relevant to these products:
• Riverbed Optimization System (RiOS)
• Riverbed SteelHead (SteelHead)
• Riverbed SteelHead CX (SteelHead CX)
• Riverbed SteelHead (in the cloud) (SteelHead-c)
• Riverbed SteelFusion Edge (Edge)
• Riverbed SteelHead (virtual edition) appliance (SteelHead-v)
• Riverbed command-line interface (CLI)
• Riverbed SteelFusion Core (Core)
• Riverbed SteelConnect Manager (SCM)
• Riverbed SaaS Accelerator
• Riverbed SteelCentral Controller for SteelHead (SCC)
• Riverbed SteelCentral Controller for SteelHead Mobile software (SteelCentral Controller forSteelHead Mobile)
• Riverbed SteelHead Mobile (SteelHead Mobile)
• Riverbed SteelHead Interceptor (SteelHead Interceptor)
• Riverbed Virtual Services Platform (VSP)
• Riverbed SkipWare software (SkipWare software)

10 | Welcome
Document conventions
Document conventionsThis guide uses this standard set of typographical conventions:
The most current version of all Riverbed documentation can be found on the Riverbed Support site at
https://support.riverbed.com.
See the Riverbed Knowledge Base for any known issues, how-to documents, system requirements, and
common error messages. You can browse titles or search for keywords and strings. To access the
Riverbed Knowledge Base, log in to the Riverbed Support site at https://support.riverbed.com.
Each software release includes release notes. The release notes list new features, known issues, and fixed
problems. To obtain the most current version of the release notes, go to the Software and
Documentation section of the Riverbed Support site at https://support.riverbed.com.
Examine the release notes before you begin the installation and configuration process.
Contacting RiverbedThis section describes how to contact departments within Riverbed.
• Technical support - Problems installing, using, or replacing Riverbed products? Contact RiverbedSupport or your channel partner who provides support. To contact Riverbed Support, open atrouble ticket by calling 1-888-RVBD-TAC (1-888-782-3822) in the United States and Canada or +1415-247-7381 outside the United States. You can also go to https://support.riverbed.com.
• Professional services - Need help with planning a migration or implementing a custom designsolution? Contact Riverbed Professional Services. Email [email protected] or go to http://www.riverbed.com/services/index.html.
• Documentation - Have suggestions about Riverbed’s online documentation or printed materials?Send comments to [email protected].
Convention Meaning
italics Within text, new terms and emphasized words appear in italic typeface.
boldface Within text, CLI commands, CLI parameters, and REST API properties appear in bold typeface.
Monospace Code examples appear in monospace font:
amnesiac > enableamnesiac # configure terminal
< > Values that you specify appear in angle brackets: interface <ip-address>
[ ] Optional keywords or variables appear in brackets: ntp peer <ip-address> [version <number>]
{ } Elements that are part of a required choice appear in braces: {<interface-name> | ascii <string> | hex <string>}
| The pipe symbol separates alternative, mutually exclusive elements of a choice. The pipe symbol is used in conjunction with braces or brackets; the braces or brackets group the choices and identify them as required or optional: {delete <filename> | upload <filename>}

SteelFusion Edge Overview | 11
1
SteelFusion Edge Overview
This chapter provides an overview of the SteelFusion Edge and the Management Console. The
Management Console makes managing your Edge simpler through a web browser interface. This
chapter includes these sections:
• “Introducing SteelFusion Edge” on page 11
• “Software dependencies and compatibility” on page 13
• “SNMP-based management compatibility” on page 15
• “Using the Management Console” on page 16
• “Next steps” on page 21
This chapter assumes you have installed and configured the Edge. For details, see the SteelFusion Edge
Installation and Configuration Guide.
This chapter also assumes you are familiar with the various deployment options available to you. For
details, see the SteelFusion Design Guide.
Introducing SteelFusion EdgeSteelFusion is a converged infrastructure solution, encompassing all branch services such as server,
storage, networking, and WAN optimization. SteelFusion is a dual-ended system that comprises two
logical components: SteelFusion Edge and SteelFusion Core.
SteelFusion Core is a physical or virtual appliance in the data center that mounts all NFS exports that need
to be made available to applications and servers at a remote location from the back-end storage array.
SteelFusion Core appliances communicate across the WAN with the SteelFusion Edge appliances at the
branch.
SteelFusion Edge is a physical appliance that is located at the branch. The Edge provides a high
performance, virtualized environment that hosts the branch application servers. The Edge also provides
network and optimization (depending on your order).
SteelFusion delivers local user performance while enabling data centralization, instant recovery, and
lower total operating costs. Unlike traditional converged infrastructures, SteelFusion enables stateless
branch services. You can access applications that run locally in your branch while the primary data is
centralized in your data center. Decoupling computation from its underlying storage allows your
applications to run in a stateless mode, which reduces your branch footprint and centralizes
management of your branch services.

12 | SteelFusion Edge Overview
Introducing SteelFusion Edge
This diagram shows a typical SteelFusion deployment.
Figure 1-1. Typical SteelFusion deployment
SteelFusion terminology
These terms will help you understand SteelFusion and its features:
• Hypervisor - The bare-metal VMware software that allows you to run and manage virtual machinesso that you can reduce the amount of hardware in your branch and data center.
• Virtual Services Platform (VSP) - VSP is software that runs as a part of the RiOS networking andoptimization software. VSP manages, communicates with, and reports on the hypervisor.
• Virtualization platform - The virtualization platform is made up of the hypervisor and VSP.
The hypervisor uses ESXi as the virtualization platform. The hypervisor is included in the Edge
functionality and does not require a separate download. You set up the hypervisor through the Edge
Management Console. You set up and configure virtual machines through the VMware vSphere Client
or vCenter.
You can install and use the VMware vSphere Client or use the vSphere Web Client to monitor and
manage a single instance of the ESXi server. You can download the vSphere applications from the
VMware website, or you can download the vSphere Client from the hypervisor host.
Benefits of SteelFusion Edge
SteelFusion Edge offers these benefits:
• A VMware-based virtualization platform with the benefits of the most commonly deployed andadvanced virtualization tool set.
• When teamed with SteelFusion Core, it provides the ability to present NFS version 3 storage exportsprojected from the data center as local NFS version 3 exports to applications and servers on thelocal branch network.
• SteelFusion Edge does not place any limitations on the number of virtual machines on a singlehypervisor, as long as there are enough resources available and you are within the maximumnumber supported by ESXi.
• Improved security.
SteelFusion Edge Overview | 13
Software dependencies and compatibility
• Fast recovery capabilities and instant provisioning at the branch.
• A simplified hypervisor configuration through an installer in the Management Console, as well asaccess by using the standard VMware administration tools, such as vSphere Client and vCenter.
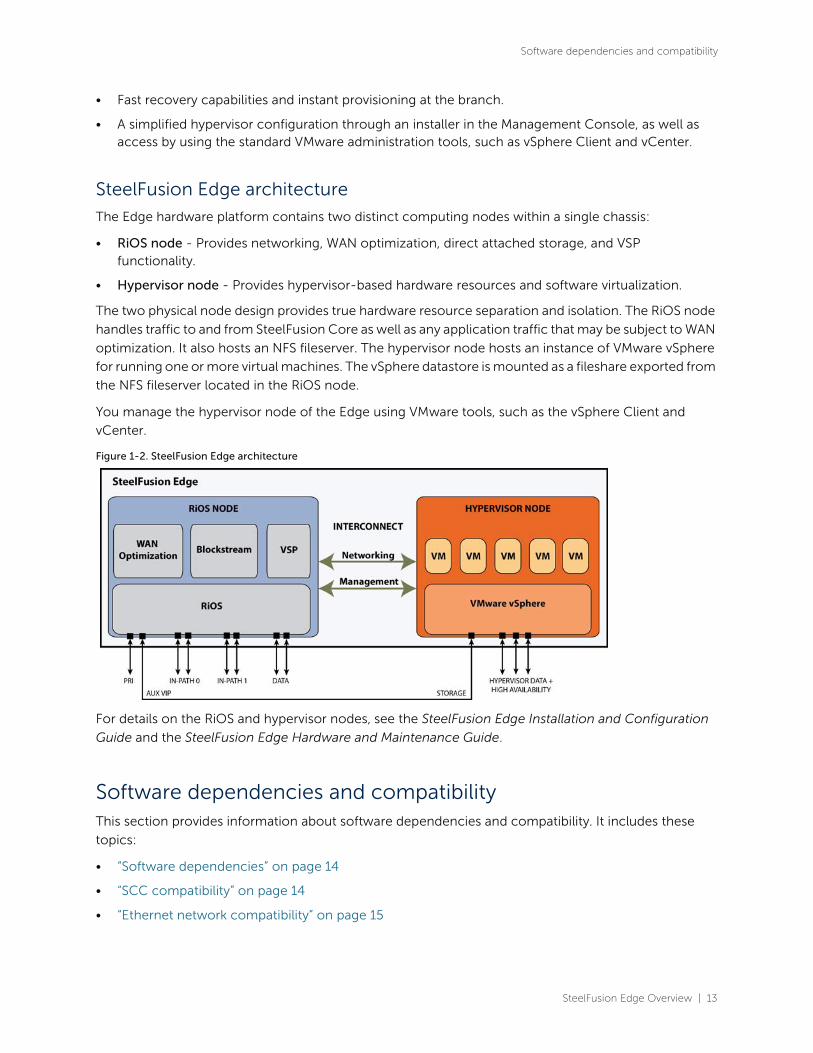
SteelFusion Edge architecture
The Edge hardware platform contains two distinct computing nodes within a single chassis:
• RiOS node - Provides networking, WAN optimization, direct attached storage, and VSPfunctionality.
• Hypervisor node - Provides hypervisor-based hardware resources and software virtualization.
The two physical node design provides true hardware resource separation and isolation. The RiOS node
handles traffic to and from SteelFusion Core as well as any application traffic that may be subject to WAN
optimization. It also hosts an NFS fileserver. The hypervisor node hosts an instance of VMware vSphere
for running one or more virtual machines. The vSphere datastore is mounted as a fileshare exported from
the NFS fileserver located in the RiOS node.
You manage the hypervisor node of the Edge using VMware tools, such as the vSphere Client and
vCenter.
Figure 1-2. SteelFusion Edge architecture
For details on the RiOS and hypervisor nodes, see the SteelFusion Edge Installation and Configuration
Guide and the SteelFusion Edge Hardware and Maintenance Guide.
Software dependencies and compatibilityThis section provides information about software dependencies and compatibility. It includes these
topics:
• “Software dependencies” on page 14
• “SCC compatibility” on page 14
• “Ethernet network compatibility” on page 15

14 | SteelFusion Edge Overview
Software dependencies and compatibility
Software dependencies
This table summarizes the software requirements for the SteelFusion Edge.
We strongly recommend that you read the SteelFusion Interoperability Matrix on the Riverbed
Community site at https://community.riverbed.com/helpcenter/s/article/DOC-4204 or on the Riverbed
Support site at https://support.riverbed.com.
For information on compatibility between RiOS, Edge, Core, and vSphere releases, see the Knowledge
Base article RiOS, SteelFusion Edge, SteelFusion Core and vSphere Release Matrix - https://
supportkb.riverbed.com/support/index?page=content&id=S:S27472.
SCC compatibility
To manage SteelFusion Edge appliances, you need to use a compatible version of SCC. For details about
SCC compatibility across versions, see the SteelCentral Controller for SteelHead Installation Guide.
Note: As a result of updating the version of Secure Shell (SSH), earlier versions of SCC cannot connect to newer
software on managed appliances. Upgrade the SCC before upgrading Edge appliances to avoid disconnections.
For more details, go to Knowledge Base article S27759.
Component Software requirements
SteelHead, SteelHead Management Console RiOS 9.12.2a
Any computer that supports a web browser with a color image display.
The Management Console has been tested with Mozilla Firefox Extended Support Release 38.0, Google Chrome, and Microsoft Internet Explorer 11.0.
JavaScript and cookies must be enabled in your web browser.
BlockStream, SteelFusion Core Management Console
Version 5.1 or later
Software versions for SteelFusion Core and SteelFusion Edge cannot be more than two major releases apart. For example, 4.0 and 4.2 are compatible, but 4.0 and 4.4 are not compatible.
VMware vSphere Hypervisor ESXi 7.0 Update 3c (shipped with Edge appliance)
Hypervisor can be optionally installed with ESXi 7.0 Update 1b, ESXi 6.7 Update 3, ESXi 6.7 P01, ESXi 6.5 EP20 , ESXi 6.5 P2 versions
These optional version require you to download the image
from the Riverbed Support site at https://support.riverbed.com.
The Edge appliance ships with a Riverbed-specific VMware vSphere Hypervisor license. This license enables basic hypervisor functions such as monitoring and management of a single instance of the ESXi server.
VMware vCenter ServervCenter Server provides a centralized platform for managing your VMware vSphere environments.
The vCenter Server requires a paid license that can be purchased from a VMware reseller.

SteelFusion Edge Overview | 15
SNMP-based management compatibility
Ethernet network compatibility
Edge supports these Ethernet networking standards. A SteelHead with a Gigabit Ethernet card supports
jumbo frames on in-path and primary ports.
The Edge ports support these connection types and speeds:
Edge supports VLAN Tagging (IEEE 802.3 - 2008). It does not support the ISL protocol.
Edge autonegotiates speed and duplex mode for all data rates and supports full duplex mode and flow
control (IEEE 802.3 - 2008).
For details on add-on NICs, see the SteelFusion Edge Hardware and Maintenance Guide.
SNMP-based management compatibilityThis product supports a proprietary Riverbed MIB accessible through SNMP. SNMPv1 (RFCs 1155, 1157,
1212, and 1215), SNMPv2c (RFCs 1901, 2578, 2579, 2580, 3416, 3417, and 3418), and SNMPv3 are
supported, although some MIB items might only be accessible through SNMPv2 and SNMPv3.
SNMP support enables the product to be integrated into network management systems such as
Hewlett-Packard OpenView Network Node Manager, BMC Patrol, and other SNMP-based network
management tools.
Ethernet standard IEEE standard
Ethernet Logical Link Control (LLC) IEEE 802.2 - 1998
Fast Ethernet 100BASE-TX IEEE 802.3 - 2008
Gigabit Ethernet over Copper 1000BASE-T (All copper interfaces are autosensing for speed and duplex.)
IEEE 802.3 - 2008
Gigabit Ethernet over Fiber 1000BASE-SX (LC connector) IEEE 802.3 - 2008
Gigabit Ethernet over Fiber 1000BASE-LX IEEE 802.3 - 2008
Gigabit Ethernet over Fiber 10GBASE-LR Single Mode IEEE 802.3 - 2008
Gigabit Ethernet over 10GBASE-SR Multimode IEEE 802.3 - 2008
Port Speed
Primary (PRI) 10/100/1000BASE-T, autonegotiating
Auxiliary (AUX) 10/100/1000BASE-T, autonegotiating
LAN 10/100/1000BASE-T, 1000BASE-SX, 1000BASE-LX, 10GBASE-LR, 10GBASE-SR (depending on configuration)
WAN 10/100/1000BASE-T, 1000BASE-SX, 1000BASE-LX, 10GBASE-LR, 10GBASE-SR (depending on configuration)
Hypervisor Data Interfaces
10/100/1000 BASE-T/10GBase-T, autonegotiating

16 | SteelFusion Edge Overview
Using the Management Console
Using the Management ConsoleThis section describes how to connect to and navigate in the Management Console. If you prefer, you
can use the CLI to perform configuring and monitoring tasks. For details, see the Riverbed Command-
Line Interface Reference Manual.
You can also use PowerCLI to manage the VMware vSphere components. For details, see the VMware
documentation.
Connecting to the Management Console
To connect to the Management Console you must know the URL and administrator password that you
assigned in the installation wizard of the SteelFusion Edge. For details, see the SteelFusion Edge
Installation and Configuration Guide.
To connect to the Management Console
1. Specify the URL for the Management Console in the location box of your web browser:
<protocol>://<host>.<domain>
The <protocol> variable is http or https. HTTPS uses the SSL protocol to ensure a secureenvironment. When you connect using HTTPS, the system prompts you to inspect and verify theSSL certificate. This is a self-signed certificate that provides encrypted web connections to theManagement Console. The system re-creates the certificate when you change the appliancehostname or when the certificate expires.
The secure vault does not protect the self-signed certificate used with HTTPS connections.
The <host> variable is the hostname you assigned to the SteelHead primary interface in theinstallation wizard. If your DNS server maps that IP address to a name, you can specify the DNSname.
The <domain> variable is the full domain name for the appliance.
Note: Alternatively, you can specify the IP address instead of the hostname and domain name.
The Management Console appears, displaying the Sign in page.
Figure 1-3. Sign in page

SteelFusion Edge Overview | 17
Using the Management Console
2. In the Username text box, specify the user login: admin, monitor, shark, a login from a RADIUS orTACACS+ database, or any local accounts created using the Role-Based Accounts feature. Thedefault login is admin. For details about role-based accounts, see “Managing user permissions” onpage 418.
Users with administrator (admin) privileges may configure and administer the SteelHead. Users withmonitor (monitor) privileges may view the reports, view the user logs, and change their ownpassword. A monitor user cannot make configuration changes. Users with SteelCentral NetShark(shark) privileges may use the Embedded SteelCentral NetShark function for detailed packet analysisthrough Packet Analyzer.
3. In the Password text box, specify the password you assigned in the installation wizard (SteelFusionEdge ships with the default password: password.)
4. Click Sign In to display the Dashboard.
Understanding the Dashboard
The Dashboard displays the system health status colored dot and the system hostname in the upper-left
corner. Mouse over the health status dot to view the system health state: Healthy, Degraded, or Critical.
The Dashboard also displays an at-a-glance view of all the virtualization, storage, optimization and
networking components. Click More in any section to see details.
• Alarms - Notifies you immediately of any alarms that need attention, separated into virtualization,storage, optimization, networking, and administrative components.
• Optimization Report - Summarizes total optimized data transmitted for all applications in the lastweek. Includes the LAN peak performance in megabits per second, the 95th Percentile WANthroughput increase calculated as 95p LAN / 95p WAN. The Dashboard also includes the LANaverage. Click More to view the Bandwidth Optimization report details.
• Hypervisor - Shows the hypervisor node information including the management IP address (if youhave more than one, a list appears), status, version information, resource usage, and storage. Forstatus details, see “Viewing hypervisor operational status” on page 31 (not available on Edge-v).
• VM Summary - Shows information about the VMs running on the hypervisor, including number ofVMs running, stopped, and suspended (not available on Edge-v).
• Storage Edge - Shows the storage software component on the Edge, including Edge and Coreconnectivity and a link to the connected Core.
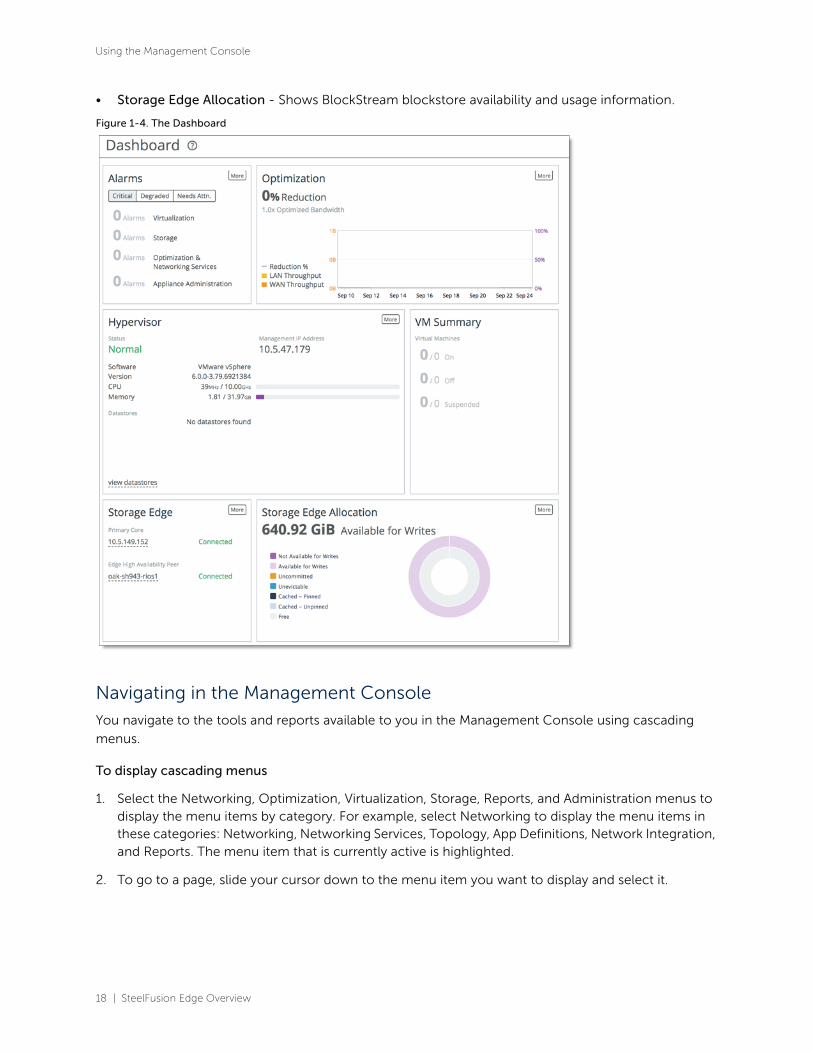
18 | SteelFusion Edge Overview
Using the Management Console
• Storage Edge Allocation - Shows BlockStream blockstore availability and usage information.
Figure 1-4. The Dashboard
Navigating in the Management Console
You navigate to the tools and reports available to you in the Management Console using cascading
menus.
To display cascading menus
1. Select the Networking, Optimization, Virtualization, Storage, Reports, and Administration menus todisplay the menu items by category. For example, select Networking to display the menu items inthese categories: Networking, Networking Services, Topology, App Definitions, Network Integration,and Reports. The menu item that is currently active is highlighted.
2. To go to a page, slide your cursor down to the menu item you want to display and select it.
SteelFusion Edge Overview | 19
Using the Management Console
Saving your configuration
As you apply page settings, the system applies the values to the running configuration. Most
Management Console configuration pages include an Apply button for you to commit your changes.
When you click Apply, the Management Console updates the running configuration. Your changes are
only written to disk when you save your configuration.
To save your changes, click Save to Disk to save the changes to disk.
A red outline around a control indicates that the field is required. You must specify a valid entry for all of
the required controls on a page before submitting the changes to the system.
Restarting the optimization service
The optimization service is a daemon that executes in the background, performing required operations.
Some configuration settings apply to the optimization service. When you change settings for features
that depend on the optimization service, you must restart the service for the changes to take effect.
To restart the service, choose Administration > Maintenance: Services and then restart the service from
the Services page. For details, see “Starting and stopping the optimization service” on page 403.
Signing out
Click Sign out in the upper-right corner of the page to sign out of the current session.
Printing pages and reports
You can print Management Console pages and reports using the print option on your web browser.
To print pages and reports
• Choose File > Print in your web browser to open the Print dialog box.
Getting help
The Help page provides these options:
• Online Help - View browser-based online help.
• Technical Support - View links and contact information for Riverbed Support.
• Appliance Details - View appliance information such as model number, hardware revision type, andserial number currently installed on the appliance.
• Software Version(s) - View the SteelFusion Edge version, the RiOS version, and the Storage Edgeversion.
• Hypervisor - View the running hypervisor version, the hypervisor version included in the originalimage, the supported versions, and the support status. The support status indicates the level ofRiverbed support available for the appliance:
– Normal - Indicates full Riverbed support for the current hypervisor version.

20 | SteelFusion Edge Overview
Using the Management Console
– Limited Qualification - VSP Managed - Indicates that the appliance is running a hypervisorversion that is different than the version supported by RiOS, resulting in limited Riverbedsupport. VSP services are running but might not be functioning correctly.
– Limited Qualification - Not VSP Managed - Indicates that the appliance is running a hypervisorversion that is different than the version supported by RiOS, resulting in limited Riverbedsupport. VSP services are not functioning correctly.
– Unsupported - Indicates that the appliance is running an unsupported hypervisor version. VSPservices are blocked.
– Unknown - Indicates that the appliance cannot retrieve the hypervisor version. The hypervisormight be disconnected or is not installed. VSP services are blocked.
• MIB Files - View Riverbed and appliance MIB files in text format.
Displaying online help
The Management Console provides page-level help for the appliance.
To display online help in the Management Console
• Click the question mark (?) icon next to the page title. The help for the page appears in a newbrowser window.
Downloading documentation
The Riverbed Support site contains PDF versions of the SteelHead User Guides and the Riverbed
Command-Line Interface Reference Manual.
To download PDF versions of the User Guide or Command-Line Interface Reference Manual
1. Select Help in the menu bar to display the Help page.
2. Click the link next to Documentation: https://support.riverbed.com/docs/index.htm
The Support site appears.
3. Select the product name.
4. Select the product version from the Display Version drop-down list. Ensure that you are selecting theappropriate protocol for your appliance (iSCSI/block or NFS/file).
5. Select PDF or HTML next to the document name to download the document.

SteelFusion Edge Overview | 21
Next steps
Next stepsThis table describes a basic approach to configuring the SteelFusion Edge.
Task Reference
1. Become familiar with basic and advanceddeployment types.
SteelFusion Design Guide
2. Make decisions about where to deployappliances and what features to use.
Riverbed Professional Services
3. Install appliances and optional interfacecards.
SteelFusion Edge Installation and Configuration Guide
SteelFusion Edge Hardware and Maintenance Guide
4. Before running the Hypervisor Installer, youmust configure and connect the Edge to theSteelFusion Core and set up the Edge. ACore allows you to access remote storage atyour data center and make that storageavailable to your hypervisor.
Choose Storage > Storage Edge Configuration.
For details, see “Connecting an Edge to a Core” on page 75.
For details, see “Configuring the hypervisor” on page 29.
For details on setting up NFS exports, see the SteelFusion Core User Guide.
For details on configuring the Edge, see “To connect the SteelFusion Edge to a SteelFusion Core appliance” on page 76.
5. Set up the hypervisor using the HypervisorInstaller. An installer guides you through theinitial configuration of the hypervisor.
Choose Virtualization > Hypervisor: Hypervisor Configuration page.
For details, see “Configuring the hypervisor” on page 29.
6. Configure optimization traffic with in-pathrules.
“Configuring in-path rules” on page 90
7. Enable optimization features related to yourdeployment.
“Configuring SSL server certificates and certificate authorities” on page 319 (if applicable)
“Configuring Optimization Features” on page 107
“Configuring Network Integration Features” on page 363 (if applicable)
“Managing licenses and model upgrades” on page 409 (if necessary)
8. Configure SaaS Accelerator “Configuring the SaaS Accelerator” on page 135
SaaS Accelerator User Guide
9. Distribute administrative responsibility byconfiguring secure access for otheradministrators, monitor users, or other typesof users you choose to create.
“Configuring general security settings” on page 417 (if applicable)
10. Modify default system administrationsettings.
“Configuring alarm settings” on page 447 (if desired)
11. Modify host and network settings you initially set with the installation wizard.
“Modifying Host and Network Interface Settings” on page 53 (if desired)

22 | SteelFusion Edge Overview
Next steps
12. Save your configuration changes and restartservices as necessary.
“Starting and stopping the optimization service” on page 403 (as necessary)
“Managing configuration files” on page 414 (as necessary)
13. View logs and reports to verify yourdeployment.
“Viewing current connection reports” on page 496
14. Troubleshoot (if necessary). SteelHead Deployment Guide
Riverbed Support - https://support.riverbed.com
Task Reference

Configuring DNS Caching | 23
2
Configuring DNS Caching
This chapter describes how to configure the DNS cache for the SteelHead. It includes this section:
• “DNS caching” on page 23
DNS cachingYou configure a local DNS name server for caching in the Optimization > Branch Services: Caching DNS
page. By default, the DNS cache is disabled.
A DNS name server resolves hostnames to IP addresses and stores them locally in a single appliance. Any
time your browser requests a URL, it first looks in the local cache to see if it is there before querying the
external name server. If it finds the resolved URL locally, it uses that IP address.
This feature is a nontransparent DNS caching service. Any client machine must point to the client-side
appliance as its DNS server.
Hosting the DNS name server function provides:
• improved performance for applications by saving the round trips previously needed to resolvenames. Whenever the name server receives address information for another host or domain, itstores that information for a specified period of time. That way, if it receives another nameresolution request for that host or domain, the name server has the address information ready, anddoes not need to send another request across the WAN.
• improved performance for services by saving round trips previously required for updates.
• continuous DNS service locally when the WAN is disconnected, with no local administrationneeded, eliminating the need for DNS servers at branch offices.
A cache holds the resolved address entries information. For information on DNS Statistics, see “Viewing
DNS cache hit reports” on page 573.

24 | Configuring DNS Caching
DNS caching
To enable the DNS name server
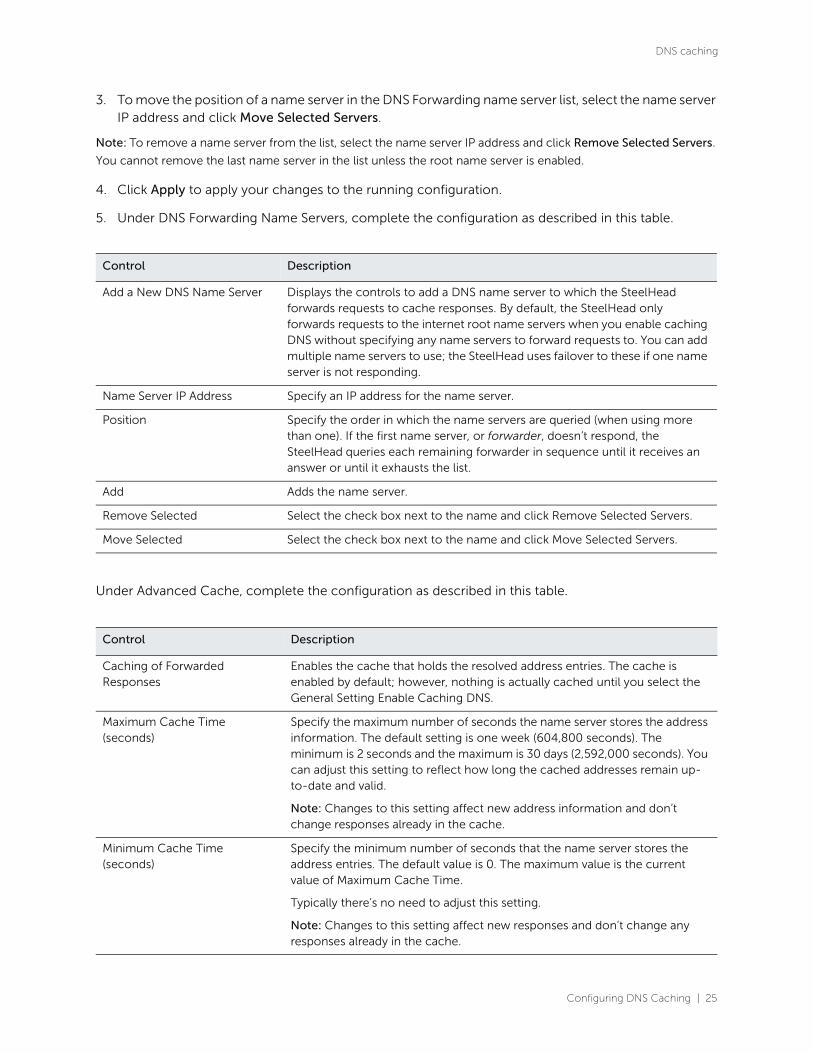
1. Choose Optimization > Branch Services: Caching DNS to display the Caching DNS page.
Figure 2-1. Caching DNS page
2. Under General Settings, complete the configuration as described in this table.
Control Description
Enable Caching DNS Enabled - Forwards name resolution requests to a DNS name server, then stores the address information locally in the SteelHead. By default, the requests go to the root name server, unless you specify another name server.
Disabled - Stops the SteelHead from acting as the DNS name server.
DNS Cache Size (bytes) Specifies the cache size, in bytes. The default value is 1048576. The range is from 524288 to 2097152.
Primary Interface Responding to DNS Requests
Enabled - Enables the name server to listen for name resolution requests on the primary interface.
Disabled - Stops the name server from using the primary interface.
Aux Interface Responding to DNS Requests
Enabled - Enables the name server to listen for name resolution requests on the auxiliary interface.
Disabled - Stops the name server from using the auxiliary interface.
Configuring DNS Caching | 25
DNS caching
3. To move the position of a name server in the DNS Forwarding name server list, select the name server IP address and click Move Selected Servers.
Note: To remove a name server from the list, select the name server IP address and click Remove Selected Servers.
You cannot remove the last name server in the list unless the root name server is enabled.
4. Click Apply to apply your changes to the running configuration.
5. Under DNS Forwarding Name Servers, complete the configuration as described in this table.
Under Advanced Cache, complete the configuration as described in this table.
Control Description
Add a New DNS Name Server Displays the controls to add a DNS name server to which the SteelHead forwards requests to cache responses. By default, the SteelHead only forwards requests to the internet root name servers when you enable caching DNS without specifying any name servers to forward requests to. You can add multiple name servers to use; the SteelHead uses failover to these if one name server is not responding.
Name Server IP Address Specify an IP address for the name server.
Position Specify the order in which the name servers are queried (when using more than one). If the first name server, or forwarder, doesn’t respond, the SteelHead queries each remaining forwarder in sequence until it receives an answer or until it exhausts the list.
Add Adds the name server.
Remove Selected Select the check box next to the name and click Remove Selected Servers.
Move Selected Select the check box next to the name and click Move Selected Servers.
Control Description
Caching of Forwarded Responses
Enables the cache that holds the resolved address entries. The cache is enabled by default; however, nothing is actually cached until you select the General Setting Enable Caching DNS.
Maximum Cache Time (seconds)
Specify the maximum number of seconds the name server stores the address information. The default setting is one week (604,800 seconds). The minimum is 2 seconds and the maximum is 30 days (2,592,000 seconds). You can adjust this setting to reflect how long the cached addresses remain up-to-date and valid.
Note: Changes to this setting affect new address information and don’t change responses already in the cache.
Minimum Cache Time (seconds)
Specify the minimum number of seconds that the name server stores the address entries. The default value is 0. The maximum value is the current value of Maximum Cache Time.
Typically there’s no need to adjust this setting.
Note: Changes to this setting affect new responses and don’t change any responses already in the cache.
26 | Configuring DNS Caching
DNS caching
Under Advanced Name Servers, complete the configuration as described in this table.
Neg DNS Maximum Cache Time (seconds)
Specify the maximum number of seconds that an unresolved negative address is cached. The valid range is from two seconds to 30 days (2,592,000 seconds). The default value is 10,800 seconds.
A negative entry occurs when a DNS request fails and the address remains unresolved. When a negative entry is in the cache, the appliance doesn’t request it again until the cache expires, the maximum cache time is reached, or the cache is cleared.
Neg DNS Minimum Cache Time (seconds)
Specify the TTL for a negative entry, which is always this value or above, even if the server returns a smaller TTL value. For example, when this value is set to 300 seconds and the client queries aksdfjh.com, the DNS service returns a negative answer with a TTL of 100 seconds, but the DNS cache stores the entry as having a TTL of 300 seconds. The default value is 0, which specifies that the SteelHead still caches negative responses; it doesn’t place a lower bound on what the TTL value for the entry can be.
Freeze Cache Freezes the cache contents. When the cache is frozen, entries don’t automatically expire from the cache. They are still returned in response to DNS queries. This feature is useful to keep local services available when the WAN is disconnected. By default, this setting is disabled.
Note: When the cache is frozen and full, entries can still be pushed out of the cache by newer entries.
Minimum TTL of a Frozen Entry (seconds)
Specify the minimum TTL in seconds that a response from a frozen cache has when sent to a branch office client. The default value is 10. For example, suppose this value is set to 60 seconds. At the time the cache is frozen, the cache entry for riverbed.com has a TTL of 300 seconds. For subsequent client requests for riverbed.com, the service responds with a TTL of 300 seconds minus however much time has elapsed since the cache freeze. After 240 seconds have elapsed, the service responds to all subsequent requests with a TTL of 60 seconds regardless of how much time elapses, until the cache is unfrozen.
Control Description
For Unresponsive Name Servers
Detects when one of the name servers is not responding and sends requests to a responsive name server instead.
Forwarder Down After (seconds)
Specify how many seconds can pass without a response from a name server until the appliance considers it unresponsive. The default value is 120. When the name server receives a request but doesn’t respond within this time and doesn’t respond after the specified number of failed requests, the appliance determines that it’s down. It then queries each remaining forwarder in sequence until it receives an answer or it exhausts the list. When the list is exhausted and the request is still unresolved, you can specify that the SteelHead try the root name server.
Control Description

Configuring DNS Caching | 27
DNS caching
Click Apply to apply your changes to the running configuration.
6. Click Save to save your settings permanently.
To clear the cache
• Under Cache Actions, complete the configuration as described in this table.
Related topics
• “Configuring HTTP optimization” on page 190
• “Viewing DNS cache utilization reports” on page 574
Forwarder Down After (requests)
Specify how many requests a name server can ignore before the appliance considers it unresponsive. The default value is 30. When the name server doesn’t respond to this many requests and doesn’t respond within the specified amount of time, the appliance determines that it’s down. It then queries each remaining forwarder in sequence until it receives an answer or it exhausts the list. When the list is exhausted and the request is still unresolved, you can specify that the SteelHead try the root name server.
Retry Forwarder After (seconds)
Specify the time limit, in seconds, that the appliance forwards the name resolution requests to name servers that are responding instead of name servers that are down. The appliance also sends a single query to name servers that are down using this time period. If they respond, the appliance considers them back up again. The default value is 300.
The single query occurs at intervals of this value if the value is set to 300. A request is allowed to go to a forwarder considered down about every 300 seconds until it responds to one.
Fallback to Root Name Servers
Forwards the request to a root name server when all other name servers have not responded to a request. This is the default setting; either this option must be enabled or a server must be present. When the fallback to root name servers option is disabled, the SteelHead only forwards a request to the forwarding name servers listed above. If it exhausts these name servers and doesn’t get a response, it doesn’t forward the request to a root name server and returns a server failure.
Note: If the name servers used by the SteelHead are internal name servers; that is, they can resolve hostnames that external name servers like the internet DNS root servers can’t, you must disable this option. Otherwise, if the name servers all fail, the root name servers might inform the SteelHead that a host visible only to internal name servers doesn’t exist, might cache that response, and return it to clients until it expires. This control prolongs the period of time until service comes back up after name servers are down.
Control Description
Clear Cache Removes entries from the cache, even if it is frozen. All cached data expires.
Note: A small amount of data remains in the cache for internal use only.
Control Description

28 | Configuring DNS Caching
DNS caching

Working with the Hypervisor | 29
3
Working with the Hypervisor
This chapter describes how to initialize and configure the VMware vSphere hypervisor. It includes these
sections:
• “Configuring the hypervisor” on page 29
• “Upgrading the hypervisor” on page 45
• “Managing the hypervisor and virtual machines with vSphere” on page 49
• “Creating and configuring virtual machines” on page 51
• “Understanding high availability” on page 51
Important: VMware ESXi 6.0 is no longer supported. Upgrade to a supported version of ESXi.
Configuring the hypervisorThis section describes how to configure the hypervisor for the Edge. It includes these topics:
• “Before you begin” on page 29
• “Configuring the hypervisor” on page 30
• “Viewing hypervisor operational status” on page 31
• “Using the Hypervisor Installer” on page 32
Note: The hypervisor feature is not available in Edge-v.
Before you begin
In SteelFusion version 5.5 and later, Edge provides support for ESXi. ESXi is preloaded in the Edge
software image—it does not require a separate download. The Hypervisor Installer gives you the option
to choose the ESXi version you want to use. To use an ESXi version other than preloaded default version,
download it through the Virtualization > Hypervisor: Software Upgrade page. For details, see “To add a
new image” on page 47.
You must use a SteelFusion Core for storage. Before you launch the Hypervisor Installer, configure and
connect the Core to access remote storage at your data center and make that storage available to your
hypervisor. To configure connectivity to SteelFusion Core, choose Storage > Storage Edge
Configuration. For details, see “Connecting an Edge to a Core” on page 75.
30 | Working with the Hypervisor
Configuring the hypervisor
Configuring the hypervisor
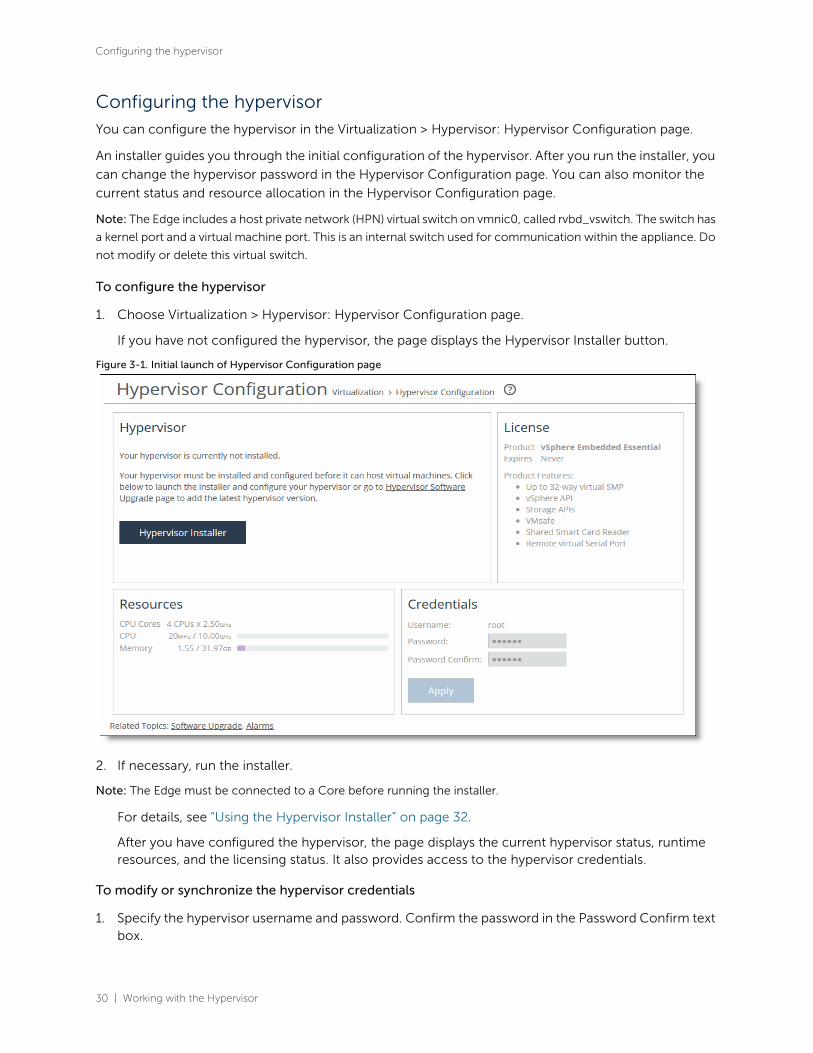
You can configure the hypervisor in the Virtualization > Hypervisor: Hypervisor Configuration page.
An installer guides you through the initial configuration of the hypervisor. After you run the installer, you
can change the hypervisor password in the Hypervisor Configuration page. You can also monitor the
current status and resource allocation in the Hypervisor Configuration page.
Note: The Edge includes a host private network (HPN) virtual switch on vmnic0, called rvbd_vswitch. The switch has
a kernel port and a virtual machine port. This is an internal switch used for communication within the appliance. Do
not modify or delete this virtual switch.
To configure the hypervisor
1. Choose Virtualization > Hypervisor: Hypervisor Configuration page.
If you have not configured the hypervisor, the page displays the Hypervisor Installer button.
Figure 3-1. Initial launch of Hypervisor Configuration page
2. If necessary, run the installer.
Note: The Edge must be connected to a Core before running the installer.
For details, see “Using the Hypervisor Installer” on page 32.
After you have configured the hypervisor, the page displays the current hypervisor status, runtime resources, and the licensing status. It also provides access to the hypervisor credentials.
To modify or synchronize the hypervisor credentials
1. Specify the hypervisor username and password. Confirm the password in the Password Confirm textbox.

Working with the Hypervisor | 31
Configuring the hypervisor
If you change the hypervisor password in vCenter or vSphere, you must also change it in this page. Changing the hypervisor password in vCenter or vSphere triggers an alarm in RiOS. When the passwords are not synchronized, RiOS cannot communicate with the hypervisor.
Note: The hypervisor password you specify must meet vSphere password complexity requirements. These
requirements have changed across ESXi releases. For ESXi 7.0, see https://docs.vmware.com/en/VMware-
vSphere/7.0/com.vmware.vsphere.security.doc/GUID-DC96FFDB-F5F2-43EC-8C73-05ACDAE6BE43.html.
2. Click Apply.
The system copies the settings to the hypervisor configuration.
3. Click Restart Hypervisor to restart the hypervisor.
If you receive a warning that the hypervisor is not in a safe state to restart, click Cancel to cancel therestart or Restart Hypervisor to proceed.
Viewing hypervisor operational status
A status in the Hypervisor section of the Dashboard describes the current hypervisor state. Each status
is color coded: green indicates a working state while red indicates a degraded or critical state. A status
followed by an ellipsis (…) indicates a transitory state such as when the installer is gathering information.
A transitory state appears briefly before the status appears. The hypervisor status shows one of these
states:
• Ready to Install - You can install the hypervisor.
• Normal - The hypervisor is running.
• Off - The hypervisor is off.
Note: For details on the hypervisor support status that appears on the Help page, see “Getting help” on page 19.
32 | Working with the Hypervisor
Configuring the hypervisor
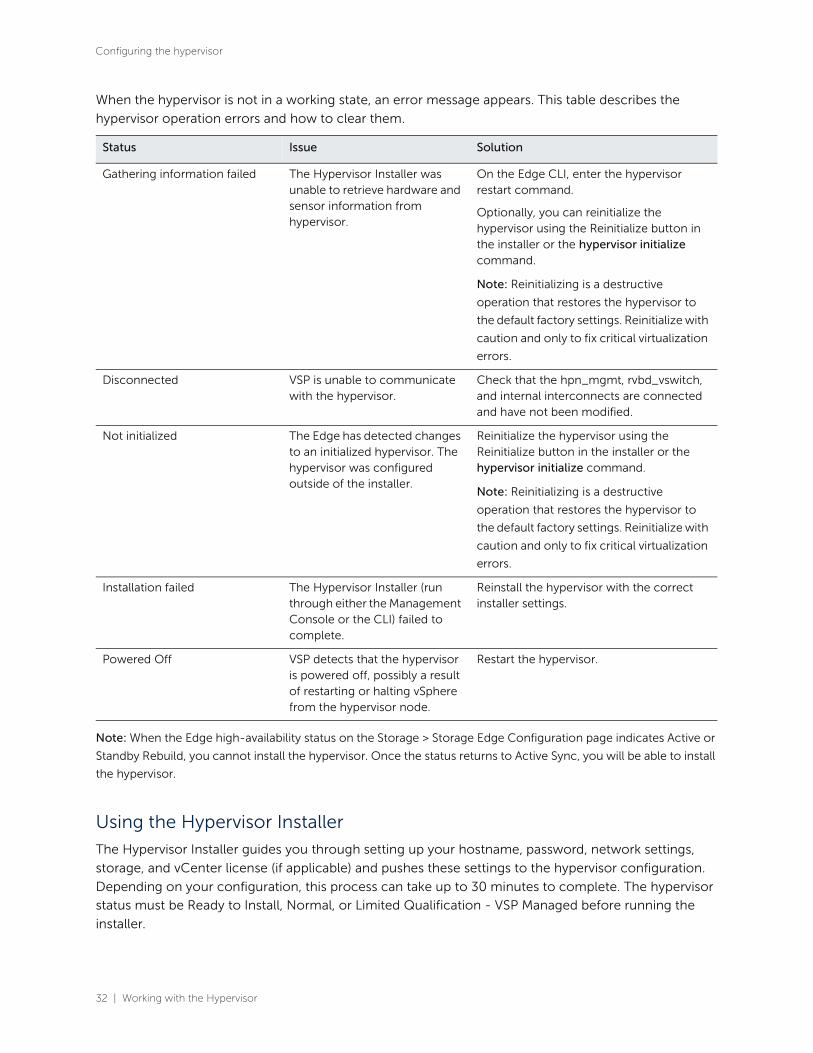
When the hypervisor is not in a working state, an error message appears. This table describes the
hypervisor operation errors and how to clear them.
Note: When the Edge high-availability status on the Storage > Storage Edge Configuration page indicates Active or
Standby Rebuild, you cannot install the hypervisor. Once the status returns to Active Sync, you will be able to install
the hypervisor.
Using the Hypervisor Installer
The Hypervisor Installer guides you through setting up your hostname, password, network settings,
storage, and vCenter license (if applicable) and pushes these settings to the hypervisor configuration.
Depending on your configuration, this process can take up to 30 minutes to complete. The hypervisor
status must be Ready to Install, Normal, or Limited Qualification - VSP Managed before running the
installer.
Status Issue Solution
Gathering information failed The Hypervisor Installer was unable to retrieve hardware and sensor information from hypervisor.
On the Edge CLI, enter the hypervisor restart command.
Optionally, you can reinitialize the hypervisor using the Reinitialize button in the installer or the hypervisor initialize command.
Note: Reinitializing is a destructive
operation that restores the hypervisor to
the default factory settings. Reinitialize with
caution and only to fix critical virtualization
errors.
Disconnected VSP is unable to communicate with the hypervisor.
Check that the hpn_mgmt, rvbd_vswitch, and internal interconnects are connected and have not been modified.
Not initialized The Edge has detected changes to an initialized hypervisor. The hypervisor was configured outside of the installer.
Reinitialize the hypervisor using the Reinitialize button in the installer or the hypervisor initialize command.
Note: Reinitializing is a destructive
operation that restores the hypervisor to
the default factory settings. Reinitialize with
caution and only to fix critical virtualization
errors.
Installation failed The Hypervisor Installer (run through either the Management Console or the CLI) failed to complete.
Reinstall the hypervisor with the correct installer settings.
Powered Off VSP detects that the hypervisor is powered off, possibly a result of restarting or halting vSphere from the hypervisor node.
Restart the hypervisor.

Working with the Hypervisor | 33
Configuring the hypervisor
As shipped, the hypervisor is initialized but not installed. You must install the hypervisor before it can host
virtual machines. The installer configures these settings:
Exiting the installer before completion will lose all changed settings. Changes are not committed until
the installer finishes. You can cancel and restart the installer at any time during the process to redo any
steps.
To configure the hostname, password, and license
1. Choose Virtualization > Installer: Installer to launch the installer. You can also click HypervisorInstaller in the Dashboard if a hypervisor has not been installed.
The Hypervisor Installer opens and displays the Welcome page. The Welcome page displays theavailable dedicated hypervisor node resources and the hypervisor status.
2. Click Next to display the Hypervisor page.
3. Select the hypervisor version you would like to install and click Next.
If you do not see the hypervisor version in the list, exit the Hypervisor Installer and add the imagebefore proceeding. For details, see “Adding a new image” on page 46.
4. If you have previously installed a hypervisor, you are prompted to confirm reinstallation. SelectReinstall hypervisor and click Next. In the Installer Default Settings page that appears next, clickPrevious Settings to continue using existing settings from the latest installation or click FactorySettings to reset the hypervisor to the original factory settings.
5. Click Next.
The Administration Overview page appears. The installer will guide you through configuring directattached storage after you configure the password, hostname, and license.
If you have not configured a Core, you will be prompted to configure and connect the Core. Afteryou have done so, relaunch the Hypervisor Installer.
6. Click Next. The Password Configuration page appears.
Task Overview Procedure
Administration — “To configure the hostname, password, and license” on page 33
Storage “Configuring hypervisor storage” on page 34
“To use remote storage for the hypervisor through a Core” on page 34
Network — “To configure network settings” on page 35
Advanced Administration, Storage and Network Settings
“Configuring advanced network settings” on page 36
“To configure administration settings (advanced settings)” on page 36
“To create a virtual switch (advanced settings)” on page 37
“To configure a gateway (advanced settings)” on page 44

34 | Working with the Hypervisor
Configuring the hypervisor
7. Specify the password that will be used to log in to the root user account of the hypervisor throughvSphere or vCenter client. The password must meet the default vSphere password complexityrequirements. Confirm the password in the Password Confirm text box.
Note: The hypervisor password you specify must meet vSphere password complexity requirements. These
requirements have changed across ESXi releases. For ESXi 7.0, see https://docs.vmware.com/en/VMware-
vSphere/7.0/com.vmware.vsphere.security.doc/GUID-DC96FFDB-F5F2-43EC-8C73-05ACDAE6BE43.html.
8. Click Next. The Hostname Configuration page appears.
9. Specify the hostname that maps to the IP address of your hypervisor.
10. Click Next. The License Configuration page appears.
11. Select the Riverbed license or select Specify an alternate license with additional features and specify
your own license.
The Riverbed VMware vSphere license, VSP (ESXi), enables basic hypervisor functions without
support for more advanced vSphere features such as vCenter, vMotion, high availability, and so on.
If you need additional features beyond what the embedded VSP(ESXi) level licensing provides, you
must purchase a license upgrade through your VMware reseller.
After installing the Riverbed hypervisor license, if you add functionality later, you can override the
Riverbed license with your own by entering it through vSphere Client.
12. Click Next. A summary of your administration settings appears.
13. Review the settings and click Next to configure the storage settings, or click Back to change any settings.
Configuring hypervisor storage
All hypervisor storage is provided by RiOS through NFS using Riverbed BlockStream technology. A
hypervisor has no local disks for storage. When a SteelFusion Core is connected to the Edge, you can
use it to manage remote storage at your data center. This configuration allows future expandability.
The Storage Overview page of the Hypervisor Installer displays all NFS exports that you mapped to this
Edge from the Core, and are available for use by the hypervisor. You can grant different access
permissions to these exports at the Core. Only exports mapped to the Edge and configured with one of
these permissions will be available for use by the hypervisor:
• Everyone
• Restrict to VSP service on the active Edge
• Restrict to a few hostnames and subnets. If you select this access permission, you must also selectthe Give VSP service on the Edge Read/Write access option. If your Edges are connected in a high-availability configuration, specify the VSP IP address for each Edge’s ESXi in this section to enablecommunication between each Edge’s VSP.
To use remote storage for the hypervisor through a Core
If you don’t see the NFS exports you expected:
• Make sure there is a working connection between the Edge and Core.

Working with the Hypervisor | 35
Configuring the hypervisor
• Check your export settings on the Core (if you don’t have access to Core settings, contact the Coreadministrator). It is possible that some exports weren’t exposed at the Edge, or that the exports aremapped but the hypervisor doesn’t have the appropriate permissions.
Figure 3-2. Storage Overview page
14. Click Next. Continue to “To configure network settings” on page 35.
The Network Settings or Network Overview page appears, depending on whether you havepreviously configured advanced network settings.
To configure network settings
1. Click Next to accept the default settings (you will get a chance to review the settings before they areinstalled) or Advanced Network Settings to configure the network settings manually.
The advanced network settings include adding vSwitches, configuring VMkernel adapters with IPand tag settings, adding uplinks, teaming interfaces, or adding VMkernel (VMK) services such asvMotion. See “Configuring advanced network settings” on page 36 for details on manual networkconfiguration.
By default, the installer:
– creates one vSwitch called vSwitch0.
– attaches all onboard hypervisor NIC uplinks to the vSwitch (the number of uplinks depend on the appliancemodel), but excludes add-on NICs for the hypervisor node. You can configure add-on NICs for thehypervisor node through vSphere.
– creates 1 VMkernel port group named Management Network.
– creates one VM port group called VM Network.
– enables DHCP for IPv4 addressing and tagged with management traffic.
The Network Summary page appears.

36 | Working with the Hypervisor
Configuring the hypervisor
2. Review the default settings and click Next, or click Back and then Advanced Network Settings tochange any settings.
For NFS traffic, the hypervisor must have access to the IP address listed on the Storage EdgeConfiguration page. For details on the Storage Edge Configuration page, see “Connecting an Edgeto a Core” on page 75.
3. Click Next. The installer validates the network settings, and the Review page appears.
If there is an error in the configuration, an error message appears and you must dismiss themessage, correct your network settings, and click Next again to proceed to the Review Changespage.
4. Click Next. The confirmation page displays the configuration settings for the hypervisor. The settingsinclude both the values you specified in the installer as well as default configuration settingsoptimized for the hypervisor with the Edge.
5. Click Install Hypervisor.
The system copies the settings to the hypervisor configuration. This is a one-time, one-waytransfer. The changes overwrite any changes that were made directly in the hypervisor outside ofthe installer. You can make future changes to the hypervisor configuration through vSphere andvCenter, but if you run the installer again, it overwrites all the changes in the hypervisor with thenew values from the installer.
The installer places a green check mark next to the message indicating a successful installation,which takes up to 30 minutes.
After a successful installation, if the system can determine the management IP address for thevSphere/vCenter client, it appears in the page.
The installer automatically imports the DNS and NTP settings from RiOS to the hypervisor.
6. Click Close to close the installer and return to the Dashboard.
The Dashboard displays the current resource allocations along with the hypervisor version anduptime.
7. If you have Edges in a high-availability configuration, repeat the Hypervisor Installer steps for the peerappliance.
Configuring advanced network settings
This section describes how to configure advanced network options. The advanced network settings
include adding vSwitches, configuring VMkernel adapters with IP and tag settings, adding uplinks,
teaming interfaces, or adding VMK Services such as vMotion.
To configure administration settings (advanced settings)
1. Choose Virtualization > Installer: Installer to launch the installer. You can also click HypervisorInstaller in the Dashboard if a hypervisor has not been installed.
The installer opens and displays the Welcome page. If the system detects a previously installedhypervisor, it provides options to reinstall or quit the installer.

Working with the Hypervisor | 37
Configuring the hypervisor
2. Step through the administration settings, licensing, and storage. The Network Settings or NetworkOverview page appears, depending on whether you have previously configured advanced networksettings.
3. Click Advanced Network Settings. The Create vSwitch page appears.
A virtual switch is a logical switching component built into your hypervisor so that the VirtualMachines (VMs) can communicate. It routes traffic internally between virtual machines and links toexternal networks.
To create a virtual switch (advanced settings)
1. Click Create a new vSwitch. The Configure vSwitch page appears, which updates dynamically as youconfigure the settings.
Figure 3-3. Configure vSwitch page
2. Specify the vSwitch label.
You can delete a vSwitch by clicking the x next to the vSwitch name. Click a vSwitch to change anysettings.
3. Click Next.
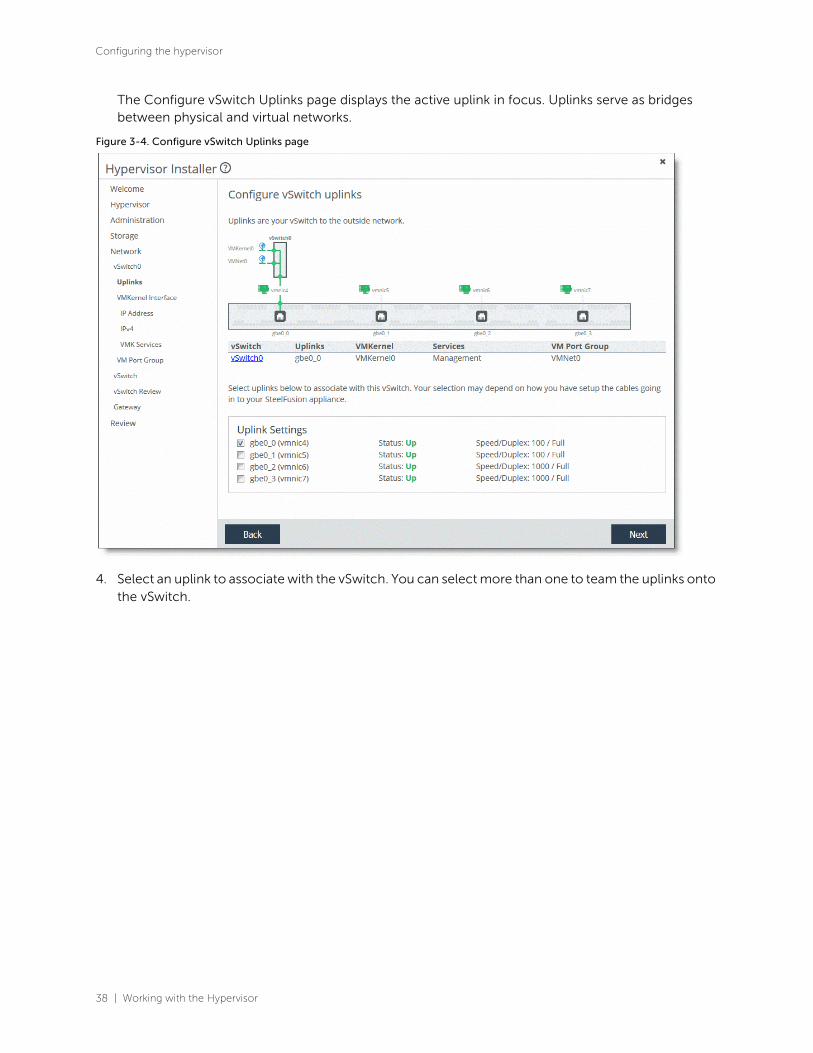
38 | Working with the Hypervisor
Configuring the hypervisor
The Configure vSwitch Uplinks page displays the active uplink in focus. Uplinks serve as bridges between physical and virtual networks.
Figure 3-4. Configure vSwitch Uplinks page
4. Select an uplink to associate with the vSwitch. You can select more than one to team the uplinks onto the vSwitch.
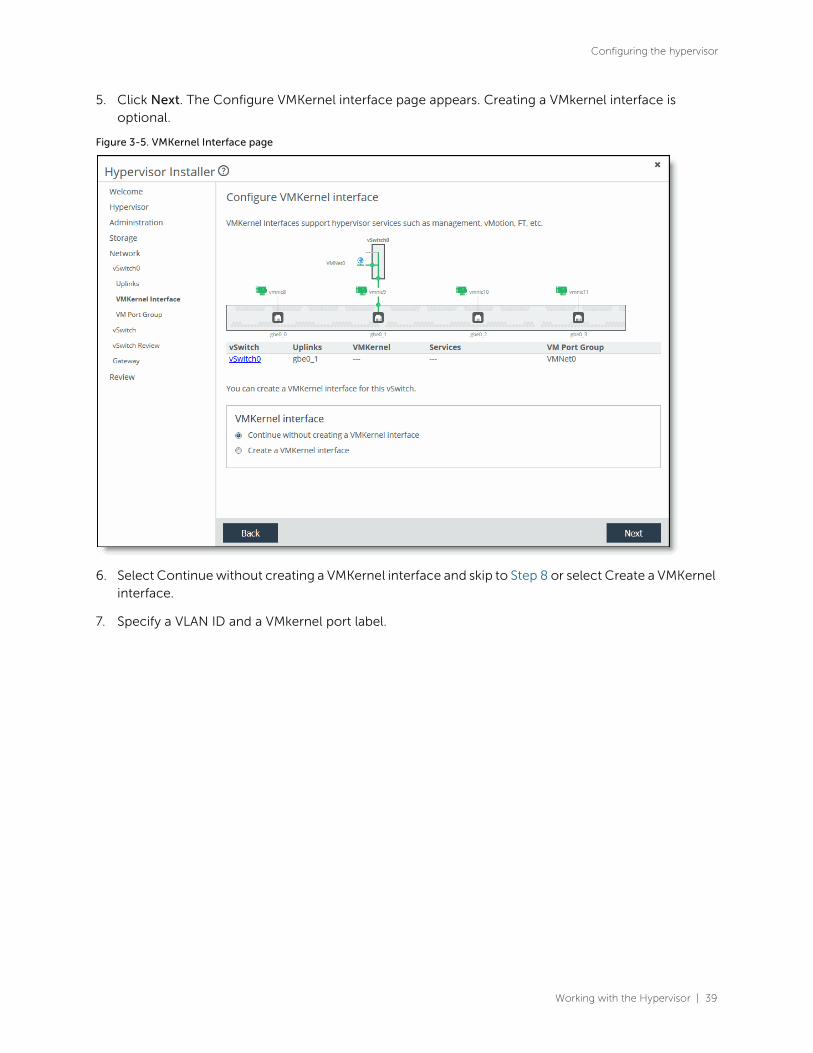
Working with the Hypervisor | 39
Configuring the hypervisor
5. Click Next. The Configure VMKernel interface page appears. Creating a VMkernel interface isoptional.
Figure 3-5. VMKernel Interface page
6. Select Continue without creating a VMKernel interface and skip to Step 8 or select Create a VMKernel interface.
7. Specify a VLAN ID and a VMkernel port label.

40 | Working with the Hypervisor
Configuring the hypervisor
8. Click Next. The Configure IP Address page appears. From this page, you can configure VMkerneladapters with IP settings.
Figure 3-6. Configure IP Address page
9. Select IPv4 (the default setting), IPv6, or both IPv4 and IPv6 from the drop-down list.

Working with the Hypervisor | 41
Configuring the hypervisor
10. Click Next. The Configure VMKernel IPvx page appears.
Figure 3-7. Configure VMKernel IPv4 page
You must specify IP address settings for the hypervisor management interface.
11. Select Obtain IPvx Address Automatically to automatically obtain the interface IPvx address from aDHCP server. A DHCP server must be available so that the system can request the IP address from it.
Select Enable IPvx DHCP DNS to enable IPvx dynamic DNS.
Select Specify IPvx Address Manually if you do not use a DHCP server to set the interface IP address.Specify these values:
– IPvx Address - Specify an interface IPvx address.
– IPvx Subnet Mask - Specify an IPvx subnet mask.
If you select both IPv4 and IPv6, you need to select settings for both types of addresses.

42 | Working with the Hypervisor
Configuring the hypervisor
12. Click Next. The Configure VMkernel Services page appears.
Figure 3-8. Configure VMkernel Services page
13. Select the vSphere services traffic to enable on this VMkernel interface. If you select vMotion, thereare specific VMware rules and requirements that you must follow. For details, see the VMwarewebsite.
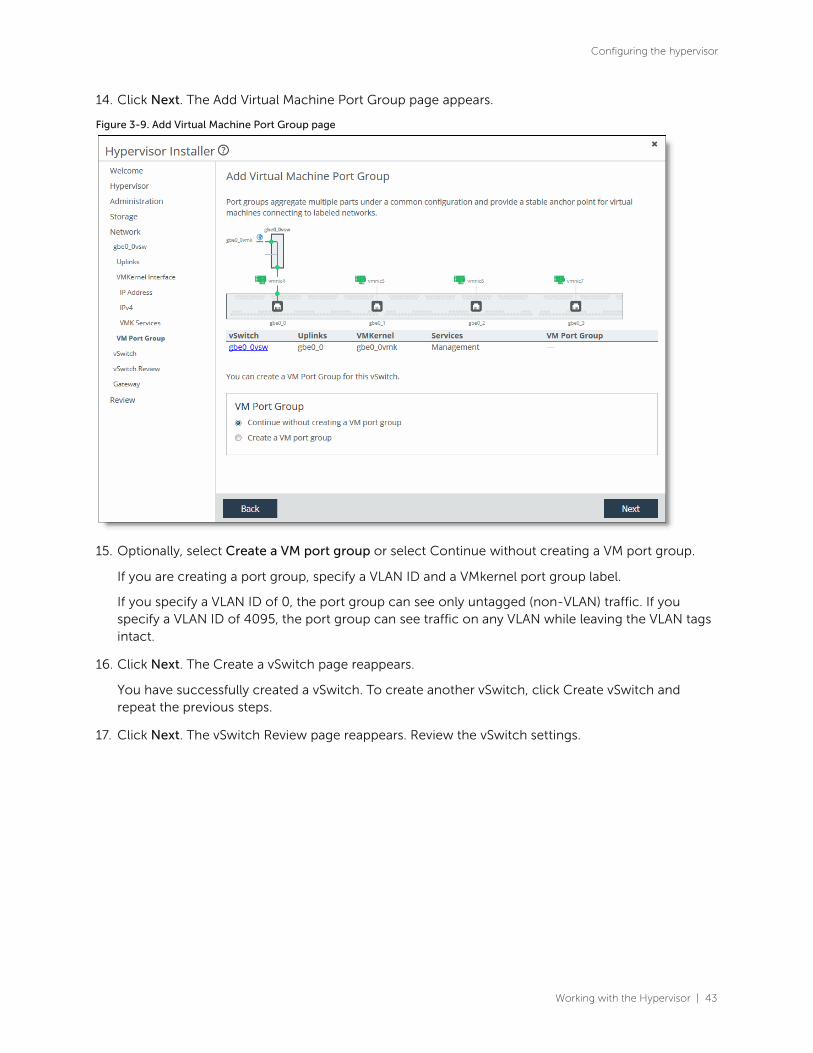
Working with the Hypervisor | 43
Configuring the hypervisor
14. Click Next. The Add Virtual Machine Port Group page appears.
Figure 3-9. Add Virtual Machine Port Group page
15. Optionally, select Create a VM port group or select Continue without creating a VM port group.
If you are creating a port group, specify a VLAN ID and a VMkernel port group label.
If you specify a VLAN ID of 0, the port group can see only untagged (non-VLAN) traffic. If youspecify a VLAN ID of 4095, the port group can see traffic on any VLAN while leaving the VLAN tagsintact.
16. Click Next. The Create a vSwitch page reappears.
You have successfully created a vSwitch. To create another vSwitch, click Create vSwitch andrepeat the previous steps.
17. Click Next. The vSwitch Review page reappears. Review the vSwitch settings.

44 | Working with the Hypervisor
Configuring the hypervisor
18. Click Next. The Configure Gateway page appears. The page displays IPv4, IPv6, or both, dependingon the IP address settings.
Figure 3-10. Configure Gateway page
To configure a gateway (advanced settings)
1. Select an IPv4 or IPv6 gateway, or both. The gateway field is available only for the interface that iscurrently selected as the hypervisor management interface. Select DHCP or specify a static IPgateway. If you select a static gateway, specify an IP address.
2. Click Next. The installer validates the network settings, and the Review page appears.
If there is an error in the configuration, an error message appears and you must dismiss themessage, correct your network settings, and click Next again to proceed to the Review Changespage.
The confirmation page displays the configuration settings for the hypervisor. The settings includeboth the values you specified in the installer as well as default configuration settings optimized forthe hypervisor with the Edge.
3. Review the changes. Click Show more to view details that do not appear. Click Next.
4. Click Install Hypervisor.
The system copies the settings to the hypervisor configuration. This is a one-time, one-waytransfer. The changes overwrite any changes that were made directly in the hypervisor outside ofthe installer. You can make future changes to the hypervisor configuration through vSphere andvCenter, but if you run the installer again, it overwrites all the changes in hypervisor with the newvalues from the installer.
Working with the Hypervisor | 45
Upgrading the hypervisor
The installer places a green check mark next to the message indicating a successful installation, which takes up to 30 minutes.
After a successful installation, if the system can determine the management IP address for the vSphere/vCenter client, it appears in the page.
The installer automatically:
– imports the DNS and NTP settings from RiOS to the hypervisor.
– mounts all your NFS exports.
5. Click Close to close the installer and return to the Dashboard.
The hypervisor restarts with the new values. The Dashboard displays the current resourceallocations along with the hypervisor version, status, and uptime.
Note: The Edge includes a host private network (HPN) virtual switch on vmnic0, called rvbd_vswitch. The switch has
a kernel port and a virtual machine port. This is an internal switch used for communication within the appliance. Do
not modify or delete this virtual switch.
6. If you have Edges in a high-availability configuration, repeat the Hypervisor Installer steps for the peerappliance.
Upgrading the hypervisorThis section describes how to upgrade your hypervisor software. It includes these topics:
• “Working with the vSphere hypervisor during an upgrade” on page 46
• “Adding a new image” on page 46
• “Upgrading the hypervisor version” on page 48
• “Reinstalling or downgrading the hypervisor version” on page 48
You can upgrade the hypervisor independently from the RiOS Edge software. ESXi is preloaded in the
software image and does not require a separate download. After upgrading the Edge software, the ESXi
version will not change and will continue to be supported. However, you can optionally upgrade to a
later version of ESXi (available for download from the Riverbed Support at https://support.riverbed.com).
Note: To avoid data corruption, shut down all VMs on the hypervisor and put the hypervisor in Maintenance Mode
before proceeding with an upgrade, reinstallation, or downgrade.
On the Virtualization > Hypervisor: Software Upgrade page, the Hypervisor Information section displays
the current hypervisor’s status, type, and version number. Under Hypervisor Images, you can perform
these tasks:
• Image management - Add or remove image files from the list.
• Upgrade - Upgrade the hypervisor version without having to run the Hypervisor Installer.
• Reinstall or downgrade - Choose a hypervisor image to reinstall or downgrade to.
Hypervisor Version History displays the vSphere version history and first boot date. Select a column
heading to sort the column in ascending or descending order.

46 | Working with the Hypervisor
Upgrading the hypervisor
Working with the vSphere hypervisor during an upgrade
You can verify the version number and the support status of the running vSphere installation on the Help
page of the Management Console.
Known issues
Upgrading the hypervisor includes these known issues or limitations:
• If you use vCenter to manage your Edge virtual machines, the vCenter version must be equal to orlater than the version of ESXi running on the Edge. For ESXi 6.5, you need vCenter 6.5 or later. If youwant to upgrade to a later version of ESXi, you must also upgrade vCenter before upgrading ESXi onthe Edge.
• VMware vSphere provides the account lockout feature to secure the hypervisor from unauthorizedaccess. By default, ESXi 6.5 and later allows a maximum of five incorrect login attempts before theaccount is locked. The account is unlocked after 15 minutes.
• ESXi 6.5 and later supports VM encryption. However, SteelFusion Edge 5.5 and later do not supportencrypted VMs for VM backup workflow . Encrypted VMs are excluded from the backup policy.
• The password complexity checker of ESXi can vary from version to version. The installer attempts toprevent you from using an invalid initial installation password. However, if installation fails, checkthe logs for messages indicating an invalid or weak password. If an error message displays,reattempt the installation with a password compatible with the version of ESXi you are installing.
Note: This issue only affects initial installations or reinstallations, and does not affect upgrades.
• Active Directory settings are not retained.
The Active Directory settings configured in the vSphere host before upgrade are not retained whenthe host is upgraded.
Workaround: Add the host to the Active Directory Domain after the upgrade if the pre-upgradevSphere version is 5.1 or later. Do not add the host to the Active Directory Domain after upgrade ifthe pre-upgrade vSphere version is vSphere 5.0.x.
• Hosts that were previously added to the domain are no longer joined to the domain.
When upgrading from vSphere 5.5 or later to 6.5 or later for the first time, the Active Directoryconfiguration is not retained. After the upgrade, rejoin the hosts to the vCenter Server domain.
• vCenter licenses need to be reinstalled. The upgrade to a later version of ESXi applies a newembedded license to the hypervisor. If ESXi is not managed by vCenter, there is no need to upgradethe default license. However, if you added a custom license in 6.0 that supported vCenter, you willlose that functionality. After the upgrade, you need to add a new license that supports vCenter. Youcan add a new custom license from vCenter or vSphere.
Adding a new imageHypervisor can be optionally installed with or upgraded to ESXi 7.0 Update 1b, ESXi 6.7 Update 3,
ESXi 6.7 P01, ESXi 6.5 EP20 , ESXi 6.5 P2 versions
• From the Riverbed Support site at https://support.riverbed.com/content/support/software/steelfusion/edge.html - Save the image to a local directory such as your desktop for laterinstallation.

Working with the Hypervisor | 47
Upgrading the hypervisor
• From the Virtualization > Hypervisor: Software Upgrade page - Specify a URL path to the imagedirectly.
• From the Virtualization > Hypervisor: Software Upgrade page - Select a version to download fromthe Riverbed Support site.
To add a new image
1. Choose Virtualization > Hypervisor: Software Upgrade to display the Software Upgrade page.
2. Under Hypervisor Images, click Add Image.
3. If you have downloaded the image, choose From Local File or use one of these other options toinstall the image from this page.
To remove one or several images, select it and click Remove Selected Images.
Hypervisor images list support status
The Riverbed Support site provides a hypervisor version support matrix that lists the supported
hypervisors between RiOS and ESXi.
The support status indicates the level of Riverbed support available for the appliance:
• Fully Supported - Indicates full Riverbed support for the hypervisor version. This status appears withthis version format:
<major>.<minor>.<maintenance-patch>.<build>
Control Description
From URL Select this option and specify the URL.
Use one of these formats:
http://host/path/to/filehttps://host/path/to/file
From Riverbed Support Site Select this option and select the target release number from the Version drop-down list. The system uploads the new image from the Riverbed Support site immediately after you click Add Image.
If you receive an “entitlement error” warning, you may not have the correct credentials for the Riverbed Support site. Contact Riverbed Support at https://support.riverbed.com.
From Local File Select this option and click Browse to go to the local file directory.
If you specify a file to upload in the Local File text box, the image is uploaded immediately; however, the image is installed and the system is rebooted at the time you specify.
Filename If you plan to add more than one image, we recommend that you specify a unique name for each added image so it does not get overwritten. The default name is hyp_image.img (the .iso file extension will be added automatically if you do not add it).
To rename an existing image, specify a new name for the added hypervisor image and click Rename.
Add Image Click to add the new image to the Hypervisor Images list.

48 | Working with the Hypervisor
Upgrading the hypervisor
• Limited Qualification - VSP Managed - Indicates a minor version difference between the version ofthe hypervisor image and the version supported on the appliance, resulting in limited Riverbedsupport. VSP services will run but may not function correctly. This status appears with this versionformat:
<major>.<minor>
• Limited Qualification - Not VSP Managed - Indicates that this hypervisor version is not supportedby RiOS. This occurs when there is a major difference between the version of the hypervisor imageand the version supported on the appliance. VSP services will not run and Riverbed support will belimited.
Upgrading the hypervisor version
On the Software Upgrade page, after you have added the hypervisor image you want to download, you
can upgrade the vSphere hypervisor version. The Hypervisor Images section displays the available
downloaded images and their version numbers, support status, and the date they were added. Select a
column heading to sort the column in ascending or descending order.
To upgrade the hypervisor version
1. To avoid data corruption, shut down all VMs on the hypervisor and put the hypervisor in MaintenanceMode through vSphere before proceeding.
2. Choose Virtualization > Hypervisor: Software Upgrade to display the Software Upgrade page.
All currently available hypervisor images are listed by filename. If the software image you want toinstall does not appear in the Hypervisor Images list, see “To add a new image” on page 47.
3. Under Hypervisor Images, click the right arrow next to the image you want to install.
4. Click Upgrade.
5. Click OK to confirm.
A status message appears, displaying the upgrade progress.
If the image upgrade is successful, once the upgrade is complete the image name appears as“Currently Installed” in the Hypervisor Images list.
If the image upgrade fails, an error message displays at the top of the page.
After the upgrade is complete, the Dashboard, Software Upgrade, and Support pages of the
Management Console display the new hypervisor version number.
Reinstalling or downgrading the hypervisor version
After a previous installation, you can reinstall the same hypervisor version or downgrade to an earlier
version. Before proceeding, keep in mind that reinstalling a hypervisor:
• does not remove the datastores from the hypervisor.
• cancels all previous hypervisor settings. Any changes made to the hypervisor configuration after thelatest installation are permanently lost.
Working with the Hypervisor | 49
Managing the hypervisor and virtual machines with vSphere
To reinstall or downgrade the existing hypervisor
1. To avoid data corruption, shut down all VMs on the hypervisor and put the hypervisor in MaintenanceMode through vSphere before proceeding.
2. After downloading the hypervisor image you will be reinstalling, log in to the Management Consoleusing the Administrator account (admin).
3. Choose Virtualization > Hypervisor: Software Upgrade to display the Software Upgrade page.
All currently available hypervisor images are listed by filename. If the software image you want toreinstall or downgrade to does not appear in the Hypervisor Images list, see “To add a new image”on page 47.
4. Under Hypervisor Images, select the image you want to reinstall or downgrade to and click the rightarrow.
A message appears under Install Hypervisor, informing you that the hypervisor is currently installedwith a newer version.
5. Click Installer.
If a warning appears informing you that vSphere cannot shut down properly, click Cancel and shutdown all VMs on the hypervisor. Put the hypervisor in Maintenance Mode through vSphere beforeproceeding.
The Hypervisor Installer launches.
6. Continue the reinstallation or downgrade in the Hypervisor Installer. See “To configure thehostname, password, and license” on page 33.
Managing the hypervisor and virtual machines with vSphereYou can install and use the VMware vSphere Client or use the vSphere Web Client for administering the
hypervisor and vCenter Server. You can download the vSphere applications from the VMware website,
or you can download the vSphere Client from the hypervisor host.
Note: VSP is not available in Edge-v.
The vSphere Client user interface changes, depending on the server:
• When the server is a hypervisor host, the vSphere Client displays only the options appropriate tosingle host management. SteelFusion Edge provides this capability without the need for a separatelicense.
• When the server is a vCenter Server system, the vSphere Client displays all the options available tothe vSphere environment, according to the licensing configuration and the user permissions. To usevCenter, you need a separate license from VMware.
To manage the host with the vSphere Client and vCenter Server, you must install the applications on a
computer with network access to the hypervisor host. The hypervisor host must be powered on and
available.
You can download the vSphere applications from the VMware website, or you can download the
vSphere Client from the hypervisor host.

50 | Working with the Hypervisor
Managing the hypervisor and virtual machines with vSphere
To download the vSphere Client from the hypervisor host
1. Connect to the hypervisor host using the IP address for the vSphere management interface.
This is the address used for hypervisor management. The IP address appears at the top of theVirtualization > Hypervisor: Hypervisor Configuration page of the SteelFusion Edge ManagementConsole.
The VMware welcome page appears.
2. Click the link to download the vSphere Client.
To log in to the VSP hypervisor host using vSphere
1. Start the vSphere Client.
2. In the IP Address / Name field, type the management IP address that appears at the top of theVirtualization > Hypervisor: Hypervisor Configuration page of the SteelFusion Edge ManagementConsole.
3. For the username, log in as root.
4. Enter the password you set up when you configured the hypervisor in the SteelHead ManagementConsole.
5. Click Login.
Security warning messages appear because the vSphere Client detects certificates signed by thehost or vCenter Server system (default setting).
6. To ignore the security warnings that appear, click Ignore.
The vSphere Client opens and displays information about the host.
To manage hypervisor using vCenter
1. Start the vSphere Client.
2. In the vSphere Client login window, type the vCenter Server IP address or hostname.
3. Type your username and password.
4. Click Login.
Security warning messages appear because the vSphere Client detects certificates signed by thehost or vCenter Server system (default setting).
5. To ignore the security warnings that appear, click Ignore.
6. Add the hypervisor host.
vCenter discovers any virtual machines running on the host, as well as the server details.
Consult the VMware vSphere documentation for complete details about working with vSphere.
Working with the Hypervisor | 51
Creating and configuring virtual machines
Creating and configuring virtual machinesAfter you have configured the hypervisor, you can add virtual machines using VMware tools. You can
add a virtual machine to the SteelFusion Edge host by creating a new virtual machine or by deploying a
virtual appliance (a virtual appliance is a prebuilt virtual machine with an operating system installed).
To learn how to add a virtual machine using VMware tools, go to the vSphere Documentation Center at
https://docs.vmware.com/en/VMware-vSphere/index.html.
Helpful topics include:
• Creating a Virtual Machine in the vSphere Clienthttps://docs.vmware.com/en/VMware-vSphere/6.5/com.vmware.vsphere.vm_admin.doc/GUID-AE8AFBF1-75D1-4172-988C-378C35C9FAF2.html
• Deploying OVF Templateshttps://docs.vmware.com/en/VMware-vSphere/6.5/com.vmware.vsphere.vm_admin.doc/GUID-17BEDA21-43F6-41F4-8FB2-E01D275FE9B4.html
• Configuring a Virtual Machinehttps://docs.vmware.com/en/VMware-vSphere/6.5/com.vmware.vsphere.vm_admin.doc/GUID-4AB8C63C-61EA-4202-8158-D9903E04A0ED.html
Understanding high availabilitySteelFusion Core projects storage from the data center to the Edge, and makes this storage available to
the hypervisor. Edge provides high availability (HA) for this storage. High availability uses a pair of Edges:
one as an active peer and the other as a standby peer. The active Edge in the pair connects to the Core
and serves storage data. The active peer contains the authoritative copy of the NFS file system and
configuration data. The standby Edge is passive and does not service client requests but is ready to take
over from the active peer immediately.
HA deployment considerations
Consider these restrictions when planning a high-availability deployment:
• High availability is supported only between Edges of the same model and series.
• High availability is supported between two Edges, and also between the hypervisors associated withthose Edges if VMware vSphere high availability is configured.
• The primary interface of the active Edge must be in the same subnet as the primary interface of thestandby Edge. In addition, the in-path interfaces on the active Edge must be in the same subnet asthe in-path interfaces on the stand-by Edge.
• Core must be added to the Edges.
• vSphere must be licensed at the Standard level or higher.
• In addition, to configure the hypervisors from the Edge HA pair in vSphere HA, a vCenter licensemust be installed on both hypervisors.
Note: A trial license can be used on the hypervisors for 60 days to connect to vCenter.
52 | Working with the Hypervisor
Understanding high availability
Deploying hypervisors in a high-availability configuration
This section describes how to deploy hypervisors in a high-availability configuration.
To deploy hypervisors in a high-availability configuration
1. Deploy an active Edge and a passive, failover Edge.
For detailed information on configuring Edge high availability, see “Configuring Edge highavailability” on page 78.
2. Ensure that the Edge is properly licensed on the active appliance and on the passive appliance.
3. Provision an NFS export (or multiple NFS exports) to host virtual machine datastores. The export(s)can be sourced from the active appliance’s local disk, or it can be sourced and mapped from a Core.
4. On both the active and the standby Edges, choose Virtualization > Installer: Installer to install thehypervisor using the Hypervisor Installer wizard. During the installation, create at least one vSwitchon each hypervisor with an uplink to a port that can reach the Virtual IP interface on the two Edges.This vSwitch must have a VMkernel port with an IP address capable of reaching the Virtual IP.
Configuring Edge high availability requires that you set up the Edge Virtual IP interface. For details,see “Configuring Edge high availability” on page 78.
Note: You must configure at least one IPv4 address. In addition, you must configure at least one IPv4 address on the
hypervisor that is capable of reaching the Virtual IP on the Edge.
5. On the Core, choose Configure > NFS: Exports. For each export you created in Step 3, expand theexport to modify its read/write access settings.
6. Select the “Give VSP service on the Edge read/write access” option. The exports must give access tothe Edge’s VSP.
7. Mount the exports on the hypervisors as needed, and create datastores on them.
Note: If you have hypervisors in a high-availability configuration, mount the same datastores on both hypervisors. If
you do not have them in an HA configuration, do not mount the same export on both hypervisors.
8. Ensure that the VMware vSphere licenses on each appliance are sufficient to enable native vSpherehigh availability. (Standard, Enterprise, and Enterprise Plus licenses enable high availability.)
9. Launch a vSphere Client and connect to your vCenter Server that manages the hypervisor on theEdges.
10. Using the vSphere client, place the active Edge’s hypervisor and the passive Edge’s hypervisor intothe same HA cluster.
11. Deploy your virtual machines to either hypervisor.

Modifying Host and Network Interface Settings | 53
4
Modifying Host and Network Interface
Settings
This chapter describes how to configure host and network interface settings. You initially set these
properties when you ran the installation wizard. This chapter describes how you can view and modify
these settings, if needed. It includes these sections:
• “Modifying general host settings” on page 53
• “Modifying base interfaces” on page 57
• “Modifying in-path interfaces” on page 66
• “Modifying RiOS data interfaces” on page 71
Modifying general host settingsYou view and modify general host settings in the Networking > Networking: Host Settings page.
When you initially ran the installation wizard, you set required network host settings for the appliance.
Use these groups of controls in this page only if you require modifications, additional configuration, or
want to verify the DNS configuration:
• Name - Modify the hostname only if your deployment requires it.
• DNS Settings - We recommend you use DNS resolution.
• Hosts - If you do not use DNS resolution, or if the host does not have a DNS entry, you can create ahost-IP address resolution map.
• Web/FTP Proxy - Configure proxy addresses for web or FTP proxy access to the SteelFusion Edge.
• DNS Test - We recommend verifying your DNS configuration using this tool.

54 | Modifying Host and Network Interface Settings
Modifying general host settings
To modify general host settings
• Choose Networking > Networking: Host Settings to display the Host Settings page.
Figure 4-1. Host Settings page
To change the hostname
1. Choose Networking > Networking: Host Settings to display the Host Settings page.
2. Under Name, change the Hostname field.
3. Click Apply to apply your changes to the running configuration.
4. Click Save to save your settings permanently.
To specify DNS settings
1. Choose Networking > Networking: Host Settings to display the Host Settings page.
Modifying Host and Network Interface Settings | 55
Modifying general host settings
2. Under DNS Settings, complete the configuration as described in this table.
3. Click Apply to apply your changes to the running configuration.
4. Click Save to save your settings permanently.
To add a new host
1. Choose Networking > Networking: Host Settings to display the Host Settings page.
2. Under Hosts, click +.
3. Complete the configuration as described in this table.
4. Click Apply to apply your changes to the running configuration.
5. Click Save to save your settings permanently.
To enable proxy settings
1. Choose Networking > Networking: Host Settings to display the Host Settings page.
Control Description
Primary DNS Server Specify the IP address for the primary name server.
Starting with RiOS 9.5, IPv6 addresses are allowed.
Secondary DNS Server Optionally, specify the IP address for the secondary name server.
Starting with RiOS 9.5, IPv6 addresses are allowed.
Tertiary DNS Server Optionally, specify the IP address for the tertiary name server.
Starting with RiOS 9.5, IPv6 addresses are allowed.
DNS Domain List Specify an ordered list of domain names.
If you specify domains, the system automatically finds the appropriate domain for each of the hosts that you specify in the system.
Control Description
IP Address Specify the IP address for the host.
Starting with RiOS 9.5, IPv6 addresses are allowed.
Hostname Specify a hostname.
Add Adds the host.
Remove Selected Select the check box next to the name and click Remove Selected.
56 | Modifying Host and Network Interface Settings
Modifying general host settings
2. Under Configure How This Appliance Connects to the Network, complete the configuration asdescribed in this table.
3. Click Apply to apply your changes to the running configuration.
4. Click Save to save your settings permanently.
To verify the DNS settings
1. Under Domain Health Check, select Test DNS.
An abbreviated test status appears for the most recent test run: Passed, Failed, or Undetermined.The test status is blank until the initial DNS settings test.
2. Specify the fully qualified Active Directory domain in which the Edge is a member. Typically, this isyour company domain name.
3. Click Test DNS to run the test. The Management Console dims this button until you specify thedomain name.
The time and date of the last test appears after Last Run.
Control Description
Enable Proxy Settings Provides proxy access to the appliance. Enables the appliance to use a proxy to contact the Riverbed licensing portal and fetch licenses in a secure environment. You can optionally require user credentials to communicate with the proxy, and you can specify the method used to authenticate and negotiate user credentials.
Proxy access is disabled by default.
RiOS supports these proxies: Squid, Blue Coat Proxy SG, Microsoft WebSense, and McAfee Web Gateway.
Web/FTP Proxy Specify the IP address for the web or FTP proxy.
Port Optionally, specify the port for the web or FTP proxy. The default port is 1080.
Enable Authentication Optionally, select to require user credentials for use with web or FTP proxy traffic. Specify these values to authenticate the users:
• User Name - Specify a username.
• Password - Specify a password.
• Authentication Type - Select an authentication method from the drop-down list:
– Basic - Authenticates user credentials by requesting a valid usernameand password. This is the default setting.
– NTLM - Authenticates user credentials based on an authenticationchallenge and response.
– Digest - Provides the same functionality as basic authentication;however, digest authentication improves security because the systemsends the user credentials across the network as a Message Digest 5(MD5) hash.

Modifying Host and Network Interface Settings | 57
Modifying base interfaces
When the test runs, the status In Progress appears. After the test completes, the test logs and test result
appear.
Viewing the test result
The test result can be one of these statuses:
• Passed
• Failed
• Undetermined - A test with an undetermined status indicates that the test could not accuratelydetermine a pass or fail test status.
To view diagnostic test logs
• Click Show logs. The number of lines in the log appear after Show logs or Hide logs.
The test logs are usually interesting only after a test fails.
An abbreviated form of the time stamp appears in the left margin of each line. To see the original, full
time stamp in the form of a tooltip, mouse over a time stamp. Not all log lines have time stamps, because
third-party applications generate some of the logging data.
The log lines highlight errors in red and warnings in yellow.
Modifying base interfaces You view and modify settings for the appliance primary and auxiliary interfaces in the Networking >
Networking: Base Interfaces page.
When you initially ran the Configuration wizard, you set required settings for the base interfaces for the
SteelHead. Only use the controls in this page if you require modifications or additional configuration:
• Primary Interface - On the appliance, the primary interface is the port you connect to the LANswitch. The primary interface is the appliance management interface. You connect to the primaryinterface to use the web UI or the CLI.
• Auxiliary Interface - On the appliance, the auxiliary interface is an optional port you can use toconnect the appliance to a non-Riverbed network management device. The IP address for theauxiliary interface must be on a subnet different from the primary interface subnet.
• Main Routing Table - Displays a summary of the main routing table for the appliance. If necessary,you can add static routes that might be required for out-of-path deployments or particular devicemanagement subnets.
Note: Before using an interface for the Edge Virtual IP address, ensure that it is enabled and configured. For details
on the Edge Virtual IP address, see “To connect the SteelFusion Edge to a SteelFusion Core appliance” on page 76.
Note: We recommend isolating your storage traffic on a separate network if possible. However, you may need to
add static routes if your Edge Virtual IP address is on the same subnet but a different network interface than your
standard route. For example, if primary is on the 10.5.128.0 network and eth0_0 is on the 10.5.128.0 network, you
need to configure a static route for storage traffic so that it also is on 10.5.128.0.
58 | Modifying Host and Network Interface Settings
Modifying base interfaces
IPv6 support
RiOS supports for IPv6 traffic with packet-mode optimization, and supports autodiscovery and fixed-
target rules. By using autodiscovery or fixed-target in-path rules, RiOS can apply transport and
application streamlining techniques (similarly as it does for TCP connections over IPv4) to improve the
user experience as the transition to IPv6 continues.
IPv6 is enabled by default. The support for IPv6 is twofold:
• Managing appliances - Support for management access using IPv6 IP addresses on primary and auxiliary interfaces.
• Optimizing IPv6 traffic - RiOS appliances can optimize IPv6 traffic.
For details on IPv6 deployments, see the SteelHead Deployment Guide. For details on in-path rules, see
“Configuring in-path rules” on page 90.
This table lists IPv6 support by feature and notes any limits and special considerations.
RiOS IPv6 support includes RiOS version Notes
Enhanced autodiscovery of SteelHeads. 9.5 and later for IPv6-only (single- stack) networks
8.5 and later for IPv4 only or dual-stack IPv4 and IPv6 networks
Starting with RiOS 9.5, enhanced autodiscovery is supported for SteelHeads in networks that run IPv6 only (IPv6 single-stack).
SteelHeads running RiOS 8.5 to 9.2 require IPv4 for the TCP inner connections between the peer SteelHeads.
IPv6 support for the SteelHead communication channel with the SteelCentral Controller for SteelHead, appliance manageability (for example, NTP servers, logging, hosts, DNS, Web/FTP proxy, email, and management interfaces) policy pages, and Interceptor Cluster pages (for example, in-path rules and load balancing).
9.5 and later
Encrypted Outlook Anywhere latency optimization.
8.6 and later
MAPI, eMAPI latency optimization. 8.6 and later Authentication is over IPv4.
Authentication over IPv6. 8.6 and later
Latency optimization of signed-SMB, CIFS/SMB1, SMB2, and SMB3 using IPv6 endpoint addressing.
8.5.2 and later The authentication stack continues to require IPv4 endpoint addressing.
Conformance with Request for Comments (RFCs) 1981, 2460, 2464, 2710, 3590, 4007, 4291, 4443, 4861, 4862, 4943, 5095, and 5156.
8.5 and later

Modifying Host and Network Interface Settings | 59
Modifying base interfaces
TCP IPv6 traffic interception between source and destination, bandwidth optimization.
8.5 and later
Ability to automatically discover fixed-target and pass-through in-path rules, along with ability to deny and reject IPv6 TCP traffic as configured in the in-path rules.
8.5 and later RiOS doesn’t support the neural framing modes Always, TCP Hints, and Dynamic.
RiOS doesn’t support the Oracle forms and Oracle forms over SSL pre-optimization policies.
HTTP and HTTPS latency optimization for IPv6 TCP traffic.
8.5 and later
Ability to configure serial clusters. 8.5 and later
Interception of IPv6 traffic for in-path, virtual in-path, and server-side out-of-path configurations.
8.5 and later WCCPv6 support is not available. Virtual in-path support is PBR. Interceptor deployments are supported in RiOS 9.5 and Interceptor 6.0.
Intercepting and passing through IPv4 and/or IPv6 traffic, depending on the in-path rules.
8.5 and later
Ability to detect asymmetric routes for IPv6 TCP traffic; enables connection forwarding of IPv6 TCP traffic in asymmetric conditions.
8.5 and later The connection-forwarding control channel between the neighbors is strictly IPv4. You must configure IPv4 addresses on the SteelHead appliances' in-path interfaces when using a connection-forwarding control channel.
Ability to configure IPv4 and IPv6 addresses on every in-path interface and intercepting and optimizing IPv4 and IPv6 traffic.
8.5 and later
Ability to configure one IPv6 address configuration for every in-path interface.
RiOS intercepts and optimizes traffic matching the scope of the IPv6 address configured on the in-path interface. Not applicable for a link-local address configured on the in-path interface.
8.5 and later RiOS passes through IPv6 TCP traffic not matching the scope of the IPv6 address configured on the in-path interface.
Ability to configure IPv6 addresses on any in-path interface.
8.5 and later RiOS 8.5 - RiOS 9.2: IPv6 TCP inner connections only in fixed target cases.
Enhanced autodiscovery of SteelHead appliances for IPv6 TCP traffic.
8.5 and later RiOS 8.5 - RiOS 9.2: TCP inner connections between the peer SteelHead appliances is IPv4 only. RiOS 9.5 allows for IPv6 TCP inner connections between peers.
Simplified routing for IPv6 TCP traffic. 8.5 and later
RiOS IPv6 support includes RiOS version Notes
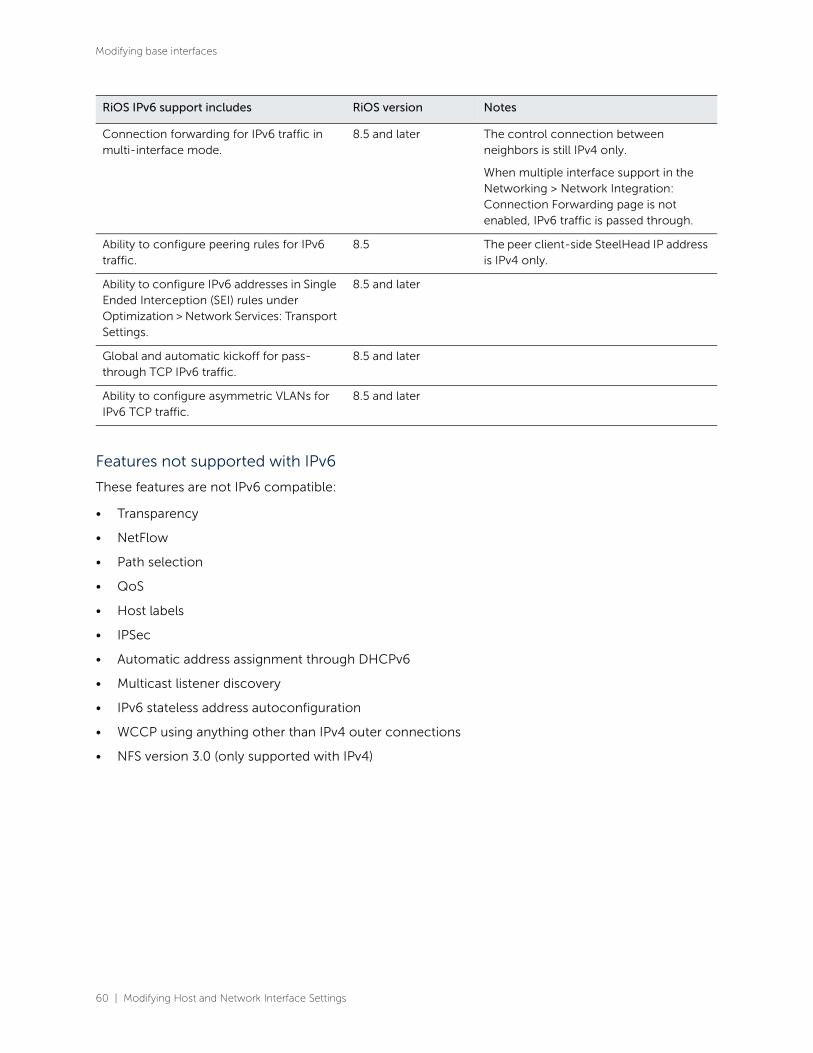
60 | Modifying Host and Network Interface Settings
Modifying base interfaces
Features not supported with IPv6
These features are not IPv6 compatible:
• Transparency
• NetFlow
• Path selection
• QoS
• Host labels
• IPSec
• Automatic address assignment through DHCPv6
• Multicast listener discovery
• IPv6 stateless address autoconfiguration
• WCCP using anything other than IPv4 outer connections
• NFS version 3.0 (only supported with IPv4)
Connection forwarding for IPv6 traffic in multi-interface mode.
8.5 and later The control connection between neighbors is still IPv4 only.
When multiple interface support in the Networking > Network Integration: Connection Forwarding page is not enabled, IPv6 traffic is passed through.
Ability to configure peering rules for IPv6 traffic.
8.5 The peer client-side SteelHead IP address is IPv4 only.
Ability to configure IPv6 addresses in Single Ended Interception (SEI) rules under Optimization > Network Services: Transport Settings.
8.5 and later
Global and automatic kickoff for pass-through TCP IPv6 traffic.
8.5 and later
Ability to configure asymmetric VLANs for IPv6 TCP traffic.
8.5 and later
RiOS IPv6 support includes RiOS version Notes
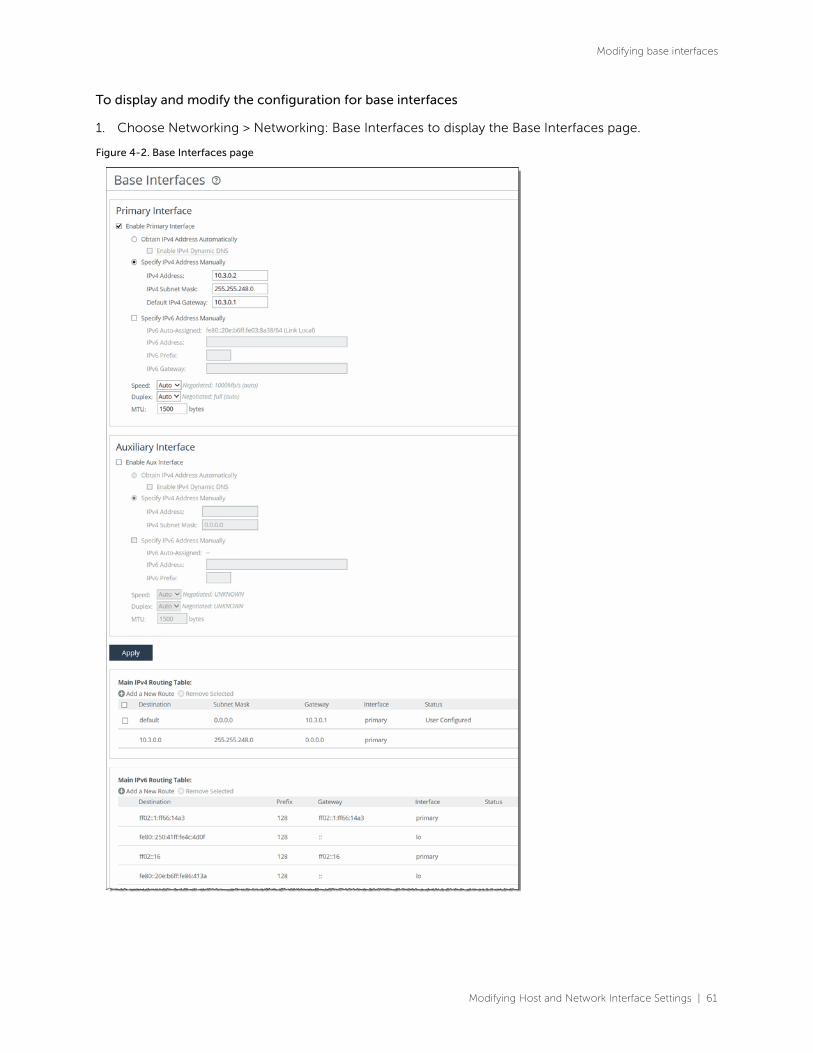
Modifying Host and Network Interface Settings | 61
Modifying base interfaces
To display and modify the configuration for base interfaces
1. Choose Networking > Networking: Base Interfaces to display the Base Interfaces page.
Figure 4-2. Base Interfaces page

62 | Modifying Host and Network Interface Settings
Modifying base interfaces
2. Under Primary Interface, complete the configuration as described in this table.
Control Description
IPv4 Address Specify an IP address. This IP address is the in-path main interface.
IPv4 Subnet Mask Specify the subnet mask.
In-Path Gateway IP Specify the IP address for the in-path gateway. If you have a router (or a Layer-3 switch) on the LAN side of your network, specify this device as the in-path gateway.
Note: If there’s a routed network on the LAN-side of the in-path appliance, the router that is the default gateway for the appliance must not have the ACL configured to drop packets from the remote hosts as its source. The in-path appliance uses IP masquerading to appear as the remote server.
NAT IPs and Ports In the case of UDP encapsulation with NAT, different SteelHeads could use the same public-facing destination addresses. To uniquely identify such SteelHeads, specify a NAT IPv4 address paired with a specific port opened on the NAT.
Specify multiple NAT IPs and ports on separate lines.
Enable IPv6 Select this check box to assign an IPv6 address. IPv6 addresses are disabled by default. You can only assign one IPv6 address per in-path interface.
Note: The primary and in-path interfaces can share the same subnet. The primary and auxiliary interfaces can’t share the same network subnet.
IPv6 Address Specify a global or site-local IPv6 address. This IP address is the in-path main interface. You can’t use a DHCP server to assign an IPv6 address automatically.
IPv6 Prefix Specify the prefix. The prefix length is 0 to 128 bits, separated from the address by a forward slash (/). In this example, 60 is the prefix:
2001:38dc:52::e9a4:c5:6282/60
IPv6 Gateway Specify the IPv6 address for the in-path gateway. You can use a link local address. If you have a router (or a Layer-3 switch) on the LAN side of your network, specify this device as the in-path gateway.
Note: If there’s a routed network on the LAN-side of the in-path appliance, the router that is the default gateway for the appliance must not have the ACL configured to drop packets from the remote hosts as its source. The in-path appliance uses IP masquerading to appear as the remote server.
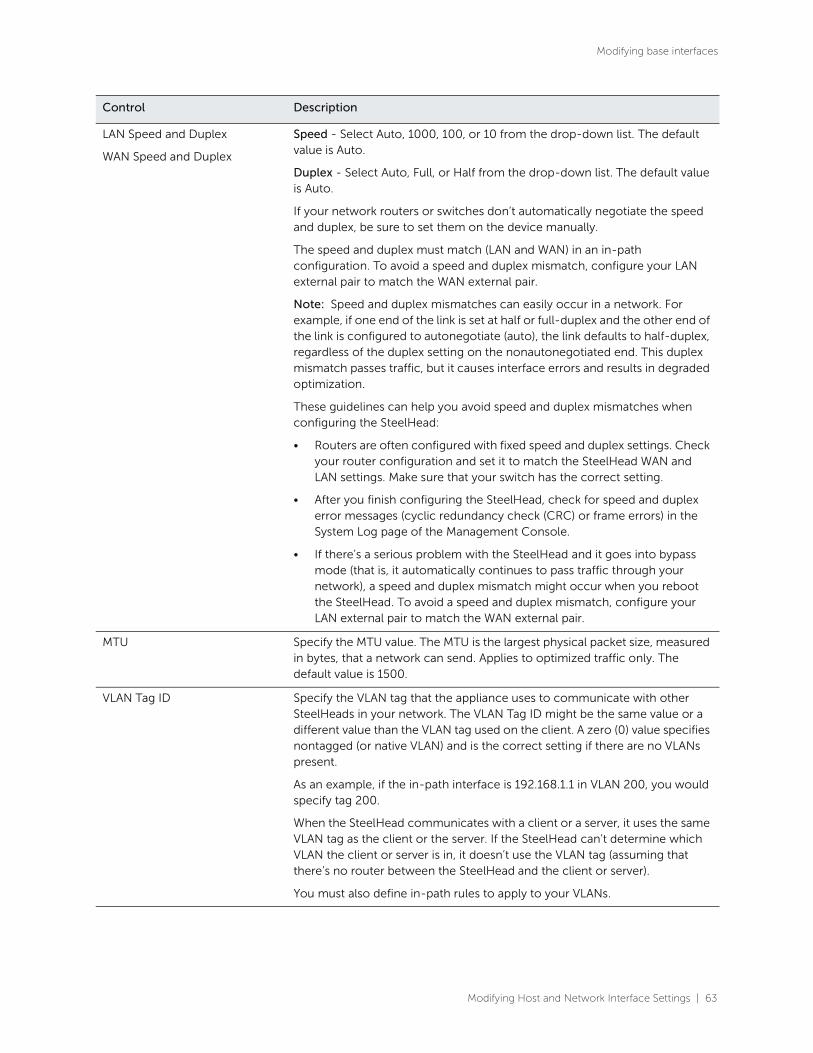
Modifying Host and Network Interface Settings | 63
Modifying base interfaces
LAN Speed and Duplex
WAN Speed and Duplex
Speed - Select Auto, 1000, 100, or 10 from the drop-down list. The default value is Auto.
Duplex - Select Auto, Full, or Half from the drop-down list. The default value is Auto.
If your network routers or switches don’t automatically negotiate the speed and duplex, be sure to set them on the device manually.
The speed and duplex must match (LAN and WAN) in an in-path configuration. To avoid a speed and duplex mismatch, configure your LAN external pair to match the WAN external pair.
Note: Speed and duplex mismatches can easily occur in a network. For example, if one end of the link is set at half or full-duplex and the other end of the link is configured to autonegotiate (auto), the link defaults to half-duplex, regardless of the duplex setting on the nonautonegotiated end. This duplex mismatch passes traffic, but it causes interface errors and results in degraded optimization.
These guidelines can help you avoid speed and duplex mismatches when configuring the SteelHead:
• Routers are often configured with fixed speed and duplex settings. Check your router configuration and set it to match the SteelHead WAN and LAN settings. Make sure that your switch has the correct setting.
• After you finish configuring the SteelHead, check for speed and duplex error messages (cyclic redundancy check (CRC) or frame errors) in the System Log page of the Management Console.
• If there’s a serious problem with the SteelHead and it goes into bypass mode (that is, it automatically continues to pass traffic through your network), a speed and duplex mismatch might occur when you reboot the SteelHead. To avoid a speed and duplex mismatch, configure your LAN external pair to match the WAN external pair.
MTU Specify the MTU value. The MTU is the largest physical packet size, measured in bytes, that a network can send. Applies to optimized traffic only. The default value is 1500.
VLAN Tag ID Specify the VLAN tag that the appliance uses to communicate with other SteelHeads in your network. The VLAN Tag ID might be the same value or a different value than the VLAN tag used on the client. A zero (0) value specifies nontagged (or native VLAN) and is the correct setting if there are no VLANs present.
As an example, if the in-path interface is 192.168.1.1 in VLAN 200, you would specify tag 200.
When the SteelHead communicates with a client or a server, it uses the same VLAN tag as the client or the server. If the SteelHead can’t determine which VLAN the client or server is in, it doesn’t use the VLAN tag (assuming that there’s no router between the SteelHead and the client or server).
You must also define in-path rules to apply to your VLANs.
Control Description

64 | Modifying Host and Network Interface Settings
Modifying base interfaces
3. Under Auxiliary Interface, complete the configuration as described in this table.
Control Description
Enable Aux Interface Enables an auxiliary interface, which can be used only for managing the SteelHead. It can’t be used for an out-of-path (OOP) SteelHead data service. Typically this is used for device-management networks.
Obtain IPv4 Address Automatically
Select this option to automatically obtain the IP address from a DHCP server. A DHCP server must be available so that the system can request the IP address from it.
Note: The primary and in-path interfaces can share the same subnet. The primary and auxiliary interfaces can’t share the same network subnet.
Enable IPv4 Dynamic DNS Select this option to send the hostname with the DHCP request for registration with Dynamic DNS. The hostname is specified in the Networking > Networking: Host Settings page.
Specify IPv4 Address Manually Select this option if you don’t use a DHCP server to set the IPv4 address. Specify these settings:
• IPv4 Address - Specify an IP address.
• IPv4 Subnet Mask - Specify a subnet mask.
(SteelHead EX only)
Do Not Assign An IPv4 Address
Enables the interface without assigning an IP address. Use this option if all traffic on this interface is for VSP.
Specify IPv6 Address Manually Select this option and specify these settings to set an IPv6 address.
• IPv6 Auto-Assigned - Displays the link-local address that is automatically generated when IPv6 is enabled on the base interfaces.
• IPv6 Address - Specify an IP address, using this format: eight 16-bit hexadecimal strings separated by colons, 128-bits. For example:
2001:38dc:0052:0000:0000:e9a4:00c5:6282
You don’t need to include leading zeros: for example
2001:38dc:52:0:0:e9a4:c5:6282
You can replace consecutive zero strings with double colons (::). For example,
2001:38dc:52::e9a4:c5:6282
• IPv6 Prefix - Specify a prefix. The prefix length is 0 to 128, separated from the address by a forward slash (/). In this example, 60 is the prefix:
2001:38dc:52::e9a4:c5:6282/60
Note: You can’t set an IPv6 address dynamically using a DHCP server.

Modifying Host and Network Interface Settings | 65
Modifying base interfaces
4. Click Apply to apply your changes to the running configuration.
5. Click Save to save your changes permanently.
To configure routes for IPv4
• Under Main IPv4 Routing Table, you can configure a static routing in the main routing table for out-of-path deployments or if your device-management network requires static routes.
You can add or remove routes from the table list as described in this table.
The Management Console writes your configuration changes to memory.
To configure routes for IPv6
• Under Main IPv6 Routing Table, you can configure static routing in the main routing table if your device-management network requires static routes.
Speed and Duplex Speed - Select the speed from the drop-down list. The default value is Auto.
Duplex - Select Auto, Full, or Half from the drop-down list. The default value is Auto.
If your network routers or switches don’t automatically negotiate the speed and duplex, be sure to set them on the device manually.
The speed and duplex must match (LAN and WAN) in an in-path configuration. To avoid a speed and duplex mismatch, configure your LAN external pair to match the WAN external pair.
MTU Specify the MTU value. The MTU is the largest physical packet size, measured in bytes, that a network can send. The default value is 1500.
Control Description
Add a New Route Displays the controls for adding a new route.
Destination IPv4 Address Specify the destination IP address for the out-of-path appliance or network management device.
IPv4 Subnet Mask Specify the subnet mask.
Gateway IPv4 Address Specify the IP address for the gateway. The gateway must be in the same network as the primary or auxiliary interface you are configuring.
Interface Select an interface for the IPv4 route from the drop-down list.
Add Adds the route to the table list.
Remove Selected Select the check box next to the name and click Remove Selected.
Control Description
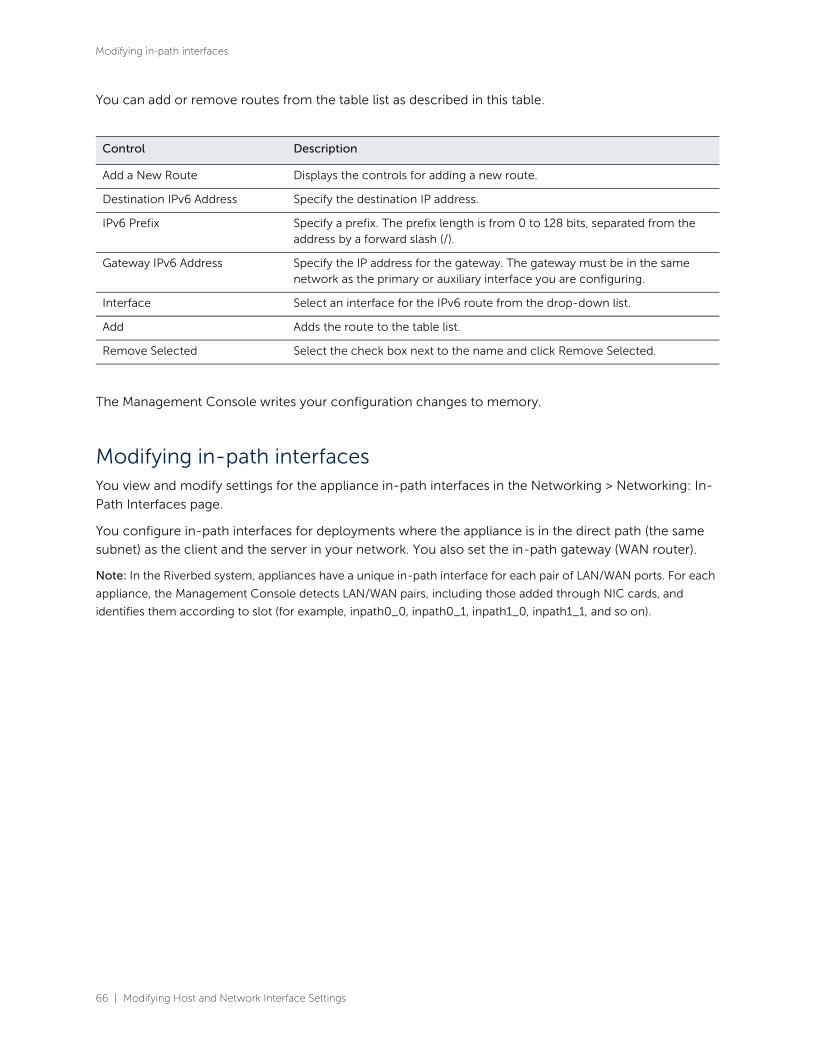
66 | Modifying Host and Network Interface Settings
Modifying in-path interfaces
You can add or remove routes from the table list as described in this table.
The Management Console writes your configuration changes to memory.
Modifying in-path interfacesYou view and modify settings for the appliance in-path interfaces in the Networking > Networking: In-
Path Interfaces page.
You configure in-path interfaces for deployments where the appliance is in the direct path (the same
subnet) as the client and the server in your network. You also set the in-path gateway (WAN router).
Note: In the Riverbed system, appliances have a unique in-path interface for each pair of LAN/WAN ports. For each
appliance, the Management Console detects LAN/WAN pairs, including those added through NIC cards, and
identifies them according to slot (for example, inpath0_0, inpath0_1, inpath1_0, inpath1_1, and so on).
Control Description
Add a New Route Displays the controls for adding a new route.
Destination IPv6 Address Specify the destination IP address.
IPv6 Prefix Specify a prefix. The prefix length is from 0 to 128 bits, separated from the address by a forward slash (/).
Gateway IPv6 Address Specify the IP address for the gateway. The gateway must be in the same network as the primary or auxiliary interface you are configuring.
Interface Select an interface for the IPv6 route from the drop-down list.
Add Adds the route to the table list.
Remove Selected Select the check box next to the name and click Remove Selected.

Modifying Host and Network Interface Settings | 67
Modifying in-path interfaces
To display and modify the configuration for in-path interfaces
1. Choose Networking > Networking: In-Path Interfaces to display the In-Path Interfaces page.
Figure 4-3. In-Path Interfaces page
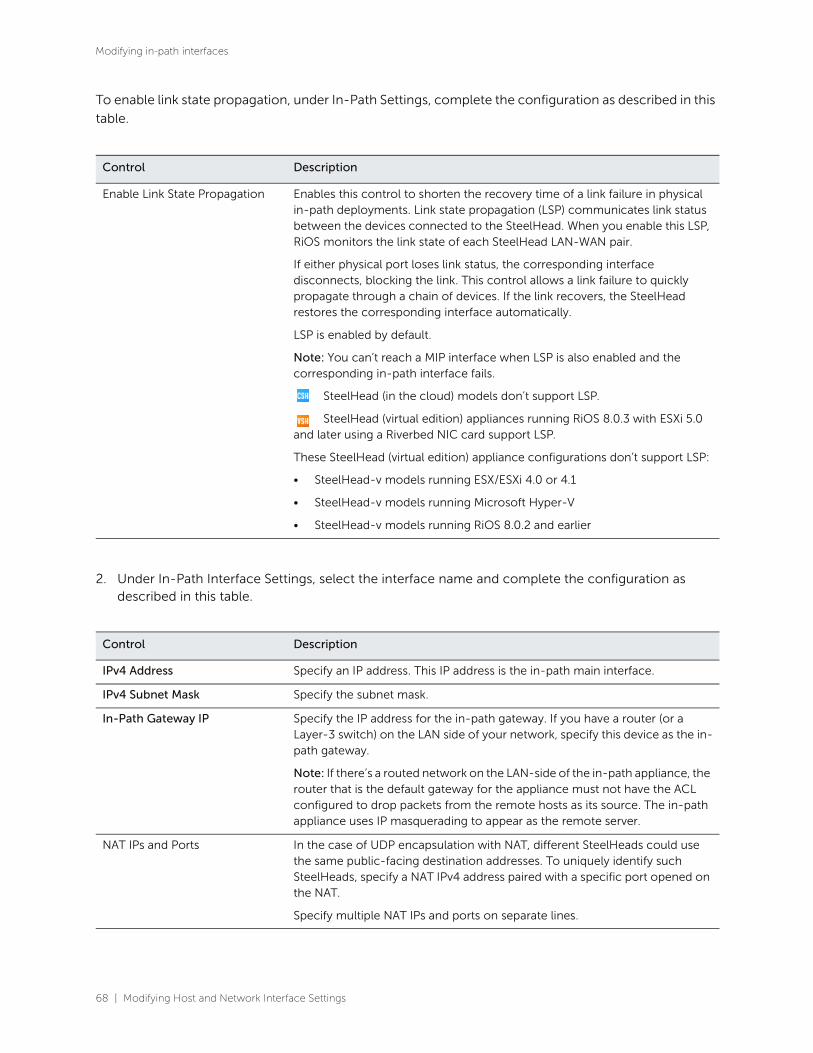
68 | Modifying Host and Network Interface Settings
Modifying in-path interfaces
To enable link state propagation, under In-Path Settings, complete the configuration as described in this
table.
2. Under In-Path Interface Settings, select the interface name and complete the configuration as described in this table.
Control Description
Enable Link State Propagation Enables this control to shorten the recovery time of a link failure in physical in-path deployments. Link state propagation (LSP) communicates link status between the devices connected to the SteelHead. When you enable this LSP, RiOS monitors the link state of each SteelHead LAN-WAN pair.
If either physical port loses link status, the corresponding interface disconnects, blocking the link. This control allows a link failure to quickly propagate through a chain of devices. If the link recovers, the SteelHead restores the corresponding interface automatically.
LSP is enabled by default.
Note: You can’t reach a MIP interface when LSP is also enabled and the corresponding in-path interface fails.
SteelHead (in the cloud) models don’t support LSP.
SteelHead (virtual edition) appliances running RiOS 8.0.3 with ESXi 5.0 and later using a Riverbed NIC card support LSP.
These SteelHead (virtual edition) appliance configurations don’t support LSP:
• SteelHead-v models running ESX/ESXi 4.0 or 4.1
• SteelHead-v models running Microsoft Hyper-V
• SteelHead-v models running RiOS 8.0.2 and earlier
Control Description
IPv4 Address Specify an IP address. This IP address is the in-path main interface.
IPv4 Subnet Mask Specify the subnet mask.
In-Path Gateway IP Specify the IP address for the in-path gateway. If you have a router (or a Layer-3 switch) on the LAN side of your network, specify this device as the in-path gateway.
Note: If there’s a routed network on the LAN-side of the in-path appliance, the router that is the default gateway for the appliance must not have the ACL configured to drop packets from the remote hosts as its source. The in-path appliance uses IP masquerading to appear as the remote server.
NAT IPs and Ports In the case of UDP encapsulation with NAT, different SteelHeads could use the same public-facing destination addresses. To uniquely identify such SteelHeads, specify a NAT IPv4 address paired with a specific port opened on the NAT.
Specify multiple NAT IPs and ports on separate lines.

Modifying Host and Network Interface Settings | 69
Modifying in-path interfaces
Enable IPv6 Select this check box to assign an IPv6 address. IPv6 addresses are disabled by default. You can only assign one IPv6 address per in-path interface.
Note: The primary and in-path interfaces can share the same subnet. The primary and auxiliary interfaces can’t share the same network subnet.
IPv6 Address Specify a global or site-local IPv6 address. This IP address is the in-path main interface. You can’t use a DHCP server to assign an IPv6 address automatically.
IPv6 Prefix Specify the prefix. The prefix length is 0 to 128 bits, separated from the address by a forward slash (/). In this example, 60 is the prefix:
2001:38dc:52::e9a4:c5:6282/60
IPv6 Gateway Specify the IPv6 address for the in-path gateway. You can use a link local address. If you have a router (or a Layer-3 switch) on the LAN side of your network, specify this device as the in-path gateway.
Note: If there’s a routed network on the LAN-side of the in-path appliance, the router that is the default gateway for the appliance must not have the ACL configured to drop packets from the remote hosts as its source. The in-path appliance uses IP masquerading to appear as the remote server.
LAN Speed and Duplex
WAN Speed and Duplex
Speed - Select Auto, 1000, 100, or 10 from the drop-down list. The default value is Auto.
Duplex - Select Auto, Full, or Half from the drop-down list. The default value is Auto.
If your network routers or switches don’t automatically negotiate the speed and duplex, be sure to set them on the device manually.
The speed and duplex must match (LAN and WAN) in an in-path configuration. To avoid a speed and duplex mismatch, configure your LAN external pair to match the WAN external pair.
Note: Speed and duplex mismatches can easily occur in a network. For example, if one end of the link is set at half or full-duplex and the other end of the link is configured to autonegotiate (auto), the link defaults to half-duplex, regardless of the duplex setting on the nonautonegotiated end. This duplex mismatch passes traffic, but it causes interface errors and results in degraded optimization.
These guidelines can help you avoid speed and duplex mismatches when configuring the SteelHead:
• Routers are often configured with fixed speed and duplex settings. Check your router configuration and set it to match the SteelHead WAN and LAN settings. Make sure that your switch has the correct setting.
• After you finish configuring the SteelHead, check for speed and duplex error messages (cyclic redundancy check (CRC) or frame errors) in the System Log page of the Management Console.
• If there’s a serious problem with the SteelHead and it goes into bypass mode (that is, it automatically continues to pass traffic through your network), a speed and duplex mismatch might occur when you reboot the SteelHead. To avoid a speed and duplex mismatch, configure your LAN external pair to match the WAN external pair.
Control Description
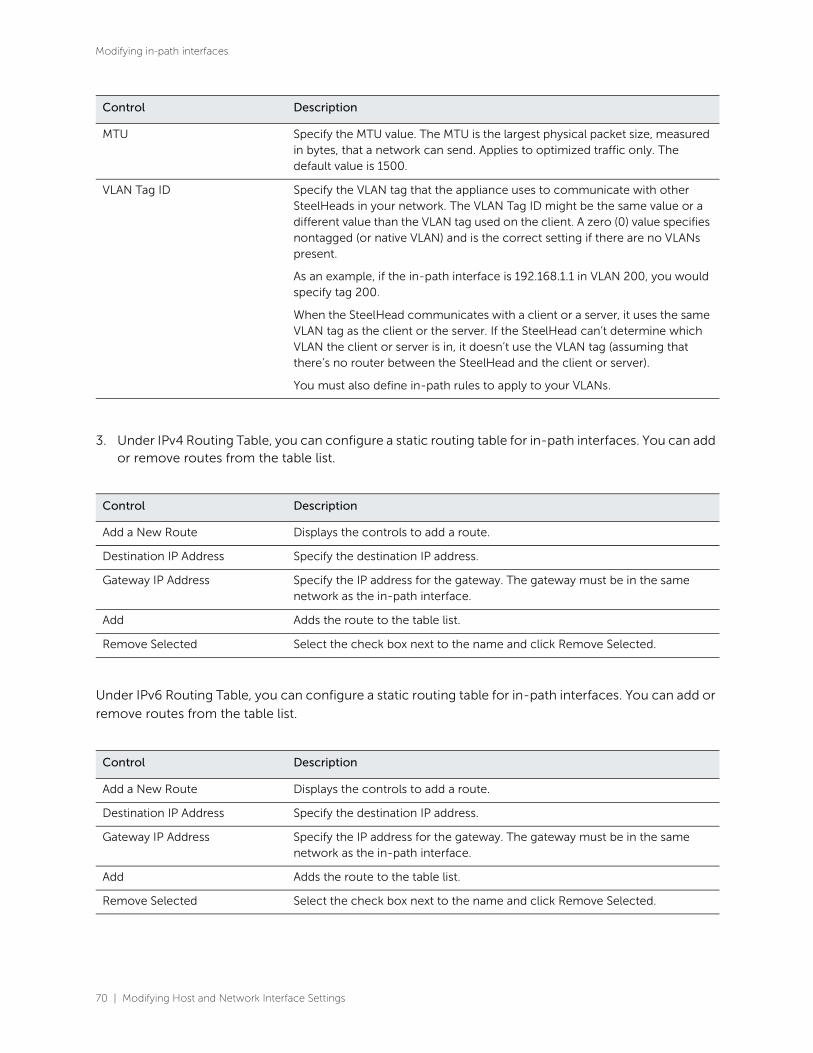
70 | Modifying Host and Network Interface Settings
Modifying in-path interfaces
3. Under IPv4 Routing Table, you can configure a static routing table for in-path interfaces. You can add or remove routes from the table list.
Under IPv6 Routing Table, you can configure a static routing table for in-path interfaces. You can add or
remove routes from the table list.
MTU Specify the MTU value. The MTU is the largest physical packet size, measured in bytes, that a network can send. Applies to optimized traffic only. The default value is 1500.
VLAN Tag ID Specify the VLAN tag that the appliance uses to communicate with other SteelHeads in your network. The VLAN Tag ID might be the same value or a different value than the VLAN tag used on the client. A zero (0) value specifies nontagged (or native VLAN) and is the correct setting if there are no VLANs present.
As an example, if the in-path interface is 192.168.1.1 in VLAN 200, you would specify tag 200.
When the SteelHead communicates with a client or a server, it uses the same VLAN tag as the client or the server. If the SteelHead can’t determine which VLAN the client or server is in, it doesn’t use the VLAN tag (assuming that there’s no router between the SteelHead and the client or server).
You must also define in-path rules to apply to your VLANs.
Control Description
Add a New Route Displays the controls to add a route.
Destination IP Address Specify the destination IP address.
Gateway IP Address Specify the IP address for the gateway. The gateway must be in the same network as the in-path interface.
Add Adds the route to the table list.
Remove Selected Select the check box next to the name and click Remove Selected.
Control Description
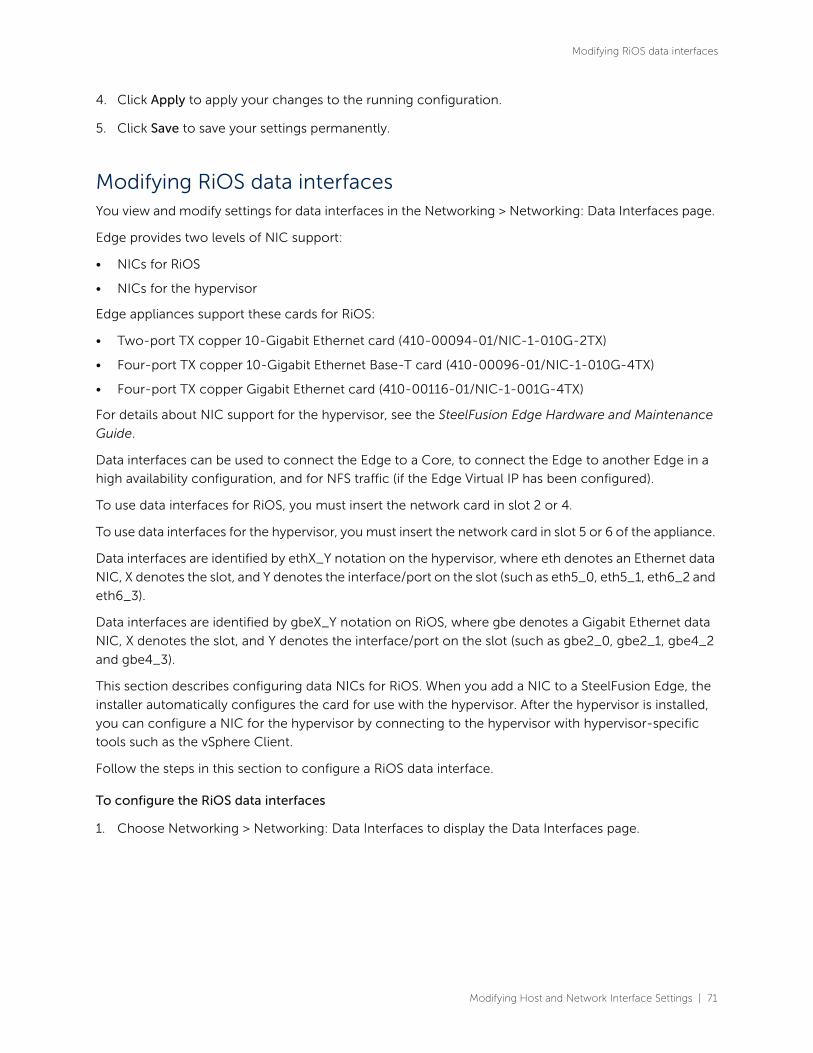
Modifying Host and Network Interface Settings | 71
Modifying RiOS data interfaces
4. Click Apply to apply your changes to the running configuration.
5. Click Save to save your settings permanently.
Modifying RiOS data interfacesYou view and modify settings for data interfaces in the Networking > Networking: Data Interfaces page.
Edge provides two levels of NIC support:
• NICs for RiOS
• NICs for the hypervisor
Edge appliances support these cards for RiOS:
• Two-port TX copper 10-Gigabit Ethernet card (410-00094-01/NIC-1-010G-2TX)
• Four-port TX copper 10-Gigabit Ethernet Base-T card (410-00096-01/NIC-1-010G-4TX)
• Four-port TX copper Gigabit Ethernet card (410-00116-01/NIC-1-001G-4TX)
For details about NIC support for the hypervisor, see the SteelFusion Edge Hardware and Maintenance
Guide.
Data interfaces can be used to connect the Edge to a Core, to connect the Edge to another Edge in a
high availability configuration, and for NFS traffic (if the Edge Virtual IP has been configured).
To use data interfaces for RiOS, you must insert the network card in slot 2 or 4.
To use data interfaces for the hypervisor, you must insert the network card in slot 5 or 6 of the appliance.
Data interfaces are identified by ethX_Y notation on the hypervisor, where eth denotes an Ethernet data
NIC, X denotes the slot, and Y denotes the interface/port on the slot (such as eth5_0, eth5_1, eth6_2 and
eth6_3).
Data interfaces are identified by gbeX_Y notation on RiOS, where gbe denotes a Gigabit Ethernet data
NIC, X denotes the slot, and Y denotes the interface/port on the slot (such as gbe2_0, gbe2_1, gbe4_2
and gbe4_3).
This section describes configuring data NICs for RiOS. When you add a NIC to a SteelFusion Edge, the
installer automatically configures the card for use with the hypervisor. After the hypervisor is installed,
you can configure a NIC for the hypervisor by connecting to the hypervisor with hypervisor-specific
tools such as the vSphere Client.
Follow the steps in this section to configure a RiOS data interface.
To configure the RiOS data interfaces
1. Choose Networking > Networking: Data Interfaces to display the Data Interfaces page.
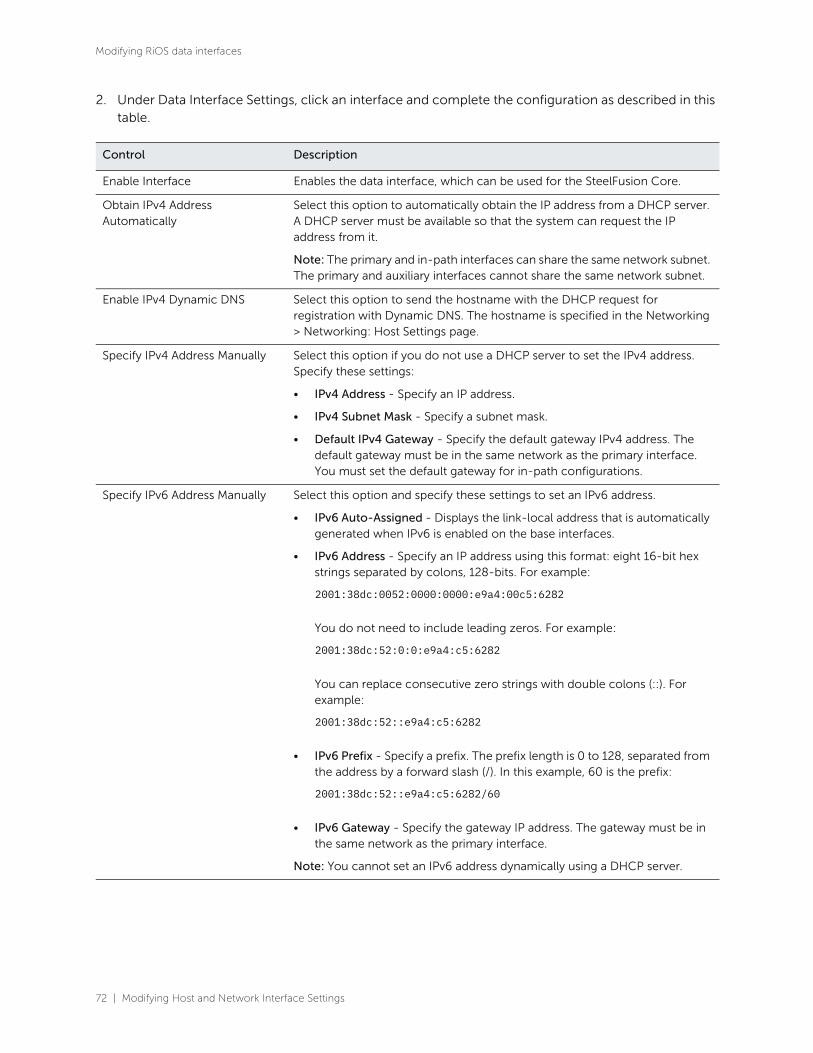
72 | Modifying Host and Network Interface Settings
Modifying RiOS data interfaces
2. Under Data Interface Settings, click an interface and complete the configuration as described in this table.
Control Description
Enable Interface Enables the data interface, which can be used for the SteelFusion Core.
Obtain IPv4 Address Automatically
Select this option to automatically obtain the IP address from a DHCP server. A DHCP server must be available so that the system can request the IP address from it.
Note: The primary and in-path interfaces can share the same network subnet. The primary and auxiliary interfaces cannot share the same network subnet.
Enable IPv4 Dynamic DNS Select this option to send the hostname with the DHCP request for registration with Dynamic DNS. The hostname is specified in the Networking > Networking: Host Settings page.
Specify IPv4 Address Manually Select this option if you do not use a DHCP server to set the IPv4 address. Specify these settings:
• IPv4 Address - Specify an IP address.
• IPv4 Subnet Mask - Specify a subnet mask.
• Default IPv4 Gateway - Specify the default gateway IPv4 address. The default gateway must be in the same network as the primary interface. You must set the default gateway for in-path configurations.
Specify IPv6 Address Manually Select this option and specify these settings to set an IPv6 address.
• IPv6 Auto-Assigned - Displays the link-local address that is automatically generated when IPv6 is enabled on the base interfaces.
• IPv6 Address - Specify an IP address using this format: eight 16-bit hex strings separated by colons, 128-bits. For example:
2001:38dc:0052:0000:0000:e9a4:00c5:6282
You do not need to include leading zeros. For example:
2001:38dc:52:0:0:e9a4:c5:6282
You can replace consecutive zero strings with double colons (::). For example:
2001:38dc:52::e9a4:c5:6282
• IPv6 Prefix - Specify a prefix. The prefix length is 0 to 128, separated from the address by a forward slash (/). In this example, 60 is the prefix:
2001:38dc:52::e9a4:c5:6282/60
• IPv6 Gateway - Specify the gateway IP address. The gateway must be in the same network as the primary interface.
Note: You cannot set an IPv6 address dynamically using a DHCP server.
Modifying Host and Network Interface Settings | 73
Modifying RiOS data interfaces
3. Click Apply to apply your changes to the running configuration.
4. Click Save to save your changes permanently.
To configure routes for IPv4
• Under Main IPv4 Routing Table, you can configure a static routing in the main routing table for out-of-path deployments or if your device-management network requires static routes.
You can add or remove routes from the table list as described in this table.
The Management Console writes your configuration changes to memory.
To configure routes for IPv6
• Under Main IPv6 Routing Table, you can configure static routing in the main routing table if your device-management network requires static routes.
You can add or remove routes from the table list as described in this table.
Speed and Duplex Speed - Select a speed from the drop-down list. The default value is Auto.
Duplex - Select Auto, Full, or Half from the drop-down list. The default value is Auto.
If your network routers or switches do not automatically negotiate the speed and duplex, be sure to set them manually.
The speed and duplex must match (LAN and WAN) in an in-path configuration. If they do not match, you might have a large number of errors on the interface when it is in bypass mode, because the switch and the router are not set with the same duplex settings.
MTU Specify the MTU value. The MTU is the largest physical packet size, measured in bytes, that a network can send. The default value is 1500.
Control Description
Add a New Route Displays the controls for adding a new route.
Destination IPv4 Address Specify the destination IP address for the out-of-path appliance or network management device.
IPv4 Subnet Mask Specify the subnet mask.
Gateway IPv4 Address Specify the IP address for the gateway. The gateway must be in the same network as the primary or auxiliary interface you are configuring.
Interface Select an interface for the IPv4 route from the drop-down list.
Add Adds the route to the table list.
Remove Selected Select the check box next to the name and click Remove Selected.
Control Description
Add a New Route Displays the controls for adding a new route.
Destination IPv6 Address Specify the destination IP address.
Control Description

74 | Modifying Host and Network Interface Settings
Modifying RiOS data interfaces
The Management Console writes your configuration changes to memory.
For more information about network card installation and configuration, see the SteelFusion Edge
Hardware and Maintenance Guide.
IPv6 Prefix Specify a prefix. The prefix length is from 0 to 128 bits, separated from the address by a forward slash (/).
Gateway IPv6 Address Specify the IP address for the gateway. The gateway must be in the same network as the primary or auxiliary interface you are configuring.
Interface Select an interface for the IPv6 route from the drop-down menu.
Add Adds the route to the table list.
Remove Selected Select the check box next to the name and click Remove Selected.
Control Description
Configuring Edge Connectivity and High Availability | 75
5
Configuring Edge Connectivity and High
Availability
This chapter describes how to configure Edge connectivity to the Core and how to configure Edge high
availability. It includes these sections:
• “Connecting an Edge to a Core” on page 75
• “Configuring Edge high availability” on page 78
Connecting an Edge to a CoreYou connect an Edge to a Core in the Storage > Storage Edge Configuration page. You can also
optionally connect the Edge as a standby peer for high availability.
SteelFusion is a dual-ended system with the Core at the data center and a SteelFusion Edge-enabled
appliance at the branch. The Edge virtually presents one or more NFS exports in the branch that can be
used by services and systems running both within the hypervisor as well as externally to the SteelFusion
Edge. SteelFusion Edge features an on-disk local cache that mirrors the complete persistent NFS export
of the Core-side backend NFS storage array.
The Core must be running version 5.0 or later. After pairing an Edge with a Core, you must make all
configuration changes on the Core.
To enable Edge high availability, you configure one Edge appliance to connect to the Core appliance.
The Edge appliance works as a single-edge configuration. You configure another Edge appliance as a
peer to the Edge appliance already connected to the Core. This results in the first Edge appliance
becoming the active Edge, and the second Edge appliance acts as the failover peer. For details, see
“Configuring Edge high availability” on page 78.
To configure connectivity to SteelFusion Core
• Choose Storage > Storage Edge Configuration to display the Storage Edge Configuration page.
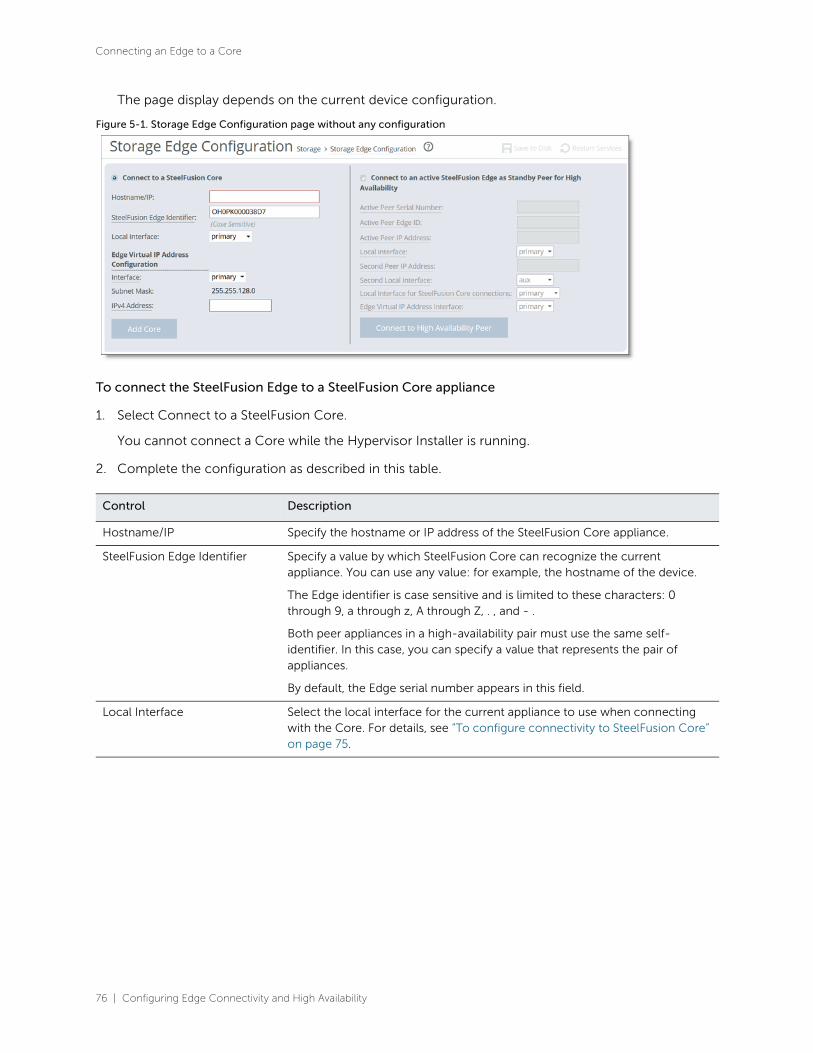
76 | Configuring Edge Connectivity and High Availability
Connecting an Edge to a Core
The page display depends on the current device configuration.
Figure 5-1. Storage Edge Configuration page without any configuration
To connect the SteelFusion Edge to a SteelFusion Core appliance
1. Select Connect to a SteelFusion Core.
You cannot connect a Core while the Hypervisor Installer is running.
2. Complete the configuration as described in this table.
Control Description
Hostname/IP Specify the hostname or IP address of the SteelFusion Core appliance.
SteelFusion Edge Identifier Specify a value by which SteelFusion Core can recognize the current appliance. You can use any value: for example, the hostname of the device.
The Edge identifier is case sensitive and is limited to these characters: 0 through 9, a through z, A through Z, . , and - .
Both peer appliances in a high-availability pair must use the same self-identifier. In this case, you can specify a value that represents the pair of appliances.
By default, the Edge serial number appears in this field.
Local Interface Select the local interface for the current appliance to use when connecting with the Core. For details, see “To configure connectivity to SteelFusion Core” on page 75.

Configuring Edge Connectivity and High Availability | 77
Connecting an Edge to a Core
Adding the Core when there are no local exports configured on the Edge takes a minute or so to complete and the storage service restarts. When the Edge has local exports configured, it takes longer to complete because the system synchronizes the local exports and any ACLs configured on Edge to the Core.
When the storage service restarts, the page displays the export information and confirms that the Core is connected to the Edge.
After the Core is connected to the Edge, all export configuration is managed using the Core.
To troubleshoot, see the system logs and the alarm status.
To disconnect the Core from the Edge
1. From the Core Management Console, choose Configure > NFS: Exports and disconnect and offline all remote exports associated with the Edge that require removal from the Core. Local exports can remain online and the local Edge will take them over (they can no longer be reformatted or resized, though, because the Edge can only create or reformat a single local export).
2. From the Edge Management Console, choose Storage > Storage Edge Configuration to display the Storage Edge Configuration page.
Edge Virtual IP Address Configuration
The Edge Virtual IP (VIP) address is an underlying IP address used by branch clients connected to the Edge to access the NFS exports mapped to the Edge. The Edge VIP must be associated with a physical interface on the Edge that is reachable by the clients requiring access to storage on that Edge.
Interface - Specify the interface the clients will use to connect to the Edge. There is no internal access to the Edge VIP; you can only use configured and activated data or base interface names. The aux interface is disabled by default. If you are using the aux interface, you must first configure an IP address on the same IP subnet you intend to use. If the interface you want to use does not appear in the drop-down list, verify whether it is enabled. New interfaces must be configured and activated on the Networking > Networking: Data Interfaces page. For details, see “Modifying RiOS data interfaces” on page 71 and “Modifying base interfaces” on page 57.
Subnet Mask - The subnet mask for the Virtual IP interface is associated with the interface you specify.
IPv4 Address - Specify the IPv4 address to use for the virtual interface.
To update the interface or IPv4 address on the active Edge, click edit next to Edge Virtual IP Address Configuration. Make the change and click Update to confirm. On the standby Edge, click edit to change the interface.
Note: Any changes to the Edge VIP address will cause a disruption in the storage service. If you change the Edge VIP address, you will need to unmount and mount the datastores being used by the hypervisor connected to this Edge to make them accessible. You will also need to ensure that at least one interface on the hypervisor(s) associated with the Edge is able to reach the Edge VIP address. To do this, you may need to manually add a network route on the Edge.
Add Core Click to complete the Core appliance configuration.
Control Description

78 | Configuring Edge Connectivity and High Availability
Configuring Edge high availability
3. Click Remove Core.
You cannot remove a Core while the Hypervisor Installer is running.
The system prompts you to confirm the Core disconnection and asks whether you want to preserve the local storage configuration.
4. Click Preserve local storage configuration to keep the local exports used by the hypervisor.
Otherwise, the local exports will be deleted.
5. From the Core Management Console, choose Configure > NFS: Exports. Delete any Edge Local Exports that were previously associated with the Edge where the Core was removed.
Note: Do not perform this step before the Core is removed from the Edge Management Console.
6. Remove the Edge from the Core. For details, see SteelFusion Core User Guide.
After configuring Core, the page displays useful information about your Core configuration. For details,
see “Viewing configuration information” on page 83. For details about the Core deployment
components, see the SteelFusion Core User Guide.
Configuring Edge high availabilityThis section describes how to configure high availability for SteelFusion Core-enabled Edges. Edge high
availability enables you to configure two Edge appliances so that either one can fail without disrupting
the service of any of the exports provided by the Core.
For more information regarding HA deployments and port configuration, see “HA deployment
considerations” on page 51.
To enable Edge high availability, you configure a pair of Edges: one as an active peer and the other as a
standby peer. The active Edge in the pair connects to the Core and serves storage data. The active peer
contains the authoritative copy of the NFS file system and configuration data. The standby Edge is
passive and does not service client requests but is ready to take over from the active peer immediately.
As the system writes new data to the active peer, it reflects the data to the standby peer, which stores a
copy of the data in its local blockstore. The two appliances maintain a heartbeat protocol between them,
so that if the active peer goes down, the standby peer can take over servicing the exports. If the standby
peer goes down, the active peer continues servicing the exports, after raising a high-availability alarm
indicating that the system is now in a degraded state.
After a failed peer resumes, it resynchronizes with the other peer in the HA pair to receive any data that
was written since the time of the failure. When the peer catches up by receiving all the written data, the
system resumes Edge high availability, reflects future writes to both peers, and clears the alarm.

Configuring Edge Connectivity and High Availability | 79
Configuring Edge high availability
Edge high availability with Core high availability
Edge high availability requires a Core; however, it is not a prerequisite to have Cores in a high-availability
configuration. If Core high availability is configured, the active Edge in an HA pair can be added to either
Core. The details for the Core you choose must be added to the Edge. After you configure Core high
availability on the Core, the system automatically relays and stores information about the peer Core to
the Edge. Go to the Storage > Storage Edge Configuration page to view information about configured
Core peers. For details about configuring Core high availability, see the SteelFusion Core User Guide and
the SteelFusion Design Guide.
To configure a SteelFusion Edge for high availability
1. On the Edge you want to use as the standby peer, choose Storage > Storage Edge Configuration to display the Storage Edge Configuration page.
The standby peer must be the same appliance model as the active peer. Both peer appliances must be running Edge 4.x/5.x and must be configured for NFS/file mode. The peer appliance cannot have any local exports configured.
2. Select Connect to an active SteelFusion Edge as Standby Peer for High Availability.
3. Complete the configuration as described in this table.
You can obtain the information required to complete this step by logging in to the Management Console of the Edge.
Control Description
Active Peer Serial Number Specify the serial number of the active peer. To find the serial number, choose Help on the active peer to display the Help page. The serial number appears under Appliance Details.
Active Peer Edge ID Specify the self-identifier for the active peer. To find the Edge ID, choose Storage > Storage Edge Configuration on the active peer. The Edge identifier appears under Settings.
This value is case sensitive and limited to these characters: 0 through 9, a through z, A through Z, . , and - .
Both peer appliances must use the same self-identifier. In this case, you can use a value that represents the group of appliances.
Active Peer IP Address Specify the IP address of the Edge active peer. The active peer must not already be in an HA configuration with another Edge.

80 | Configuring Edge Connectivity and High Availability
Configuring Edge high availability
After configuring SteelFusion, the page displays the current settings and status, and it provides access to additional settings and information. If you have configured Edge high availability, the page displays the peer self-identifier and whether it is assuming the standby or active role.
Local Interface Specify the local interface for the standby peer to connect to the active peer IP address. The Edge on-disk local cache synchronization happens through two local network interfaces for shared bandwidth and scalability.
The first local interface transfers data until it reaches maximum throughput, and then the second local interface transfers the remainder of the data. For example, if the local interfaces are 1 GB and 10 GB, and you expect the 10 GB interface to transfer the bulk of the data, specify the 10 GB link as your first local interface.
Both the local and second local interfaces participate in load-balancing. When more than one interface is transmitting data, the total bandwidth is increased or decreased dynamically (the links are not utilized evenly). When all preferred paths are transmitting data, the data is queued.
Second Peer IP Address Specify the IP address of the active peer, which is different from the first peer IP address.
Second Local Interface Select the local interface for the standby peer to connect to the second peer IP address.
Local Interface for SteelFusion Core Connections
Select the local interface for the current appliance to use when connecting with the Core appliance.
Edge Virtual IP Address Interface
Select the physical interface on which the Edge VIP of the active Edge can be reached.
Both the active and standby Edges require the Edge VIP address to have an underlying interface configured with an IP address on the same subnet.
Connect to High Availability Peer
Click to complete the configuration and connect to the active peer appliance.
Control Description

Configuring Edge Connectivity and High Availability | 81
Configuring Edge high availability
Figure 5-2. SteelFusion Edge configured for Edge high availability
To reconfigure SteelFusion Edge
• Modify the settings as described in this table.
Control Description
Primary SteelFusion Core Hostname/IP
To update the Core hostname or IP address, click edit next to Hostname, change the hostname or IP address, and click Update Hostname to confirm.
Local Interfaces Enables a local interface on the Edge to use for data and management connections. Click Add Interface, select a local interface from the drop-down menu, and click Add Interface to confirm.
82 | Configuring Edge Connectivity and High Availability
Configuring Edge high availability
Edge Virtual IP Address Configuration
The Edge Virtual IP (VIP) address is used by clients connected to the Edge to access the NFS exports mapped to the Edge. The Edge VIP address must be associated with a physical interface on the Edge that is reachable by the clients requiring access to storage on that Edge.
To modify the Virtual IP address
You can modify the IPv4 address on the active Edge of an HA configuration (or a single Edge connected to a Core). Click edit next to Edge Virtual IP Address Configuration. Make the change and click Update to confirm.
Note: Any changes to the VIP address will cause a disruption in the storage service. If you make a change, you must unmount and mount the datastores being used by the hypervisor connected to this Edge to make them accessible. You must also ensure that at least one interface on the hypervisor(s) associated with the Edge is able to reach the Edge VIP. To do this, you may need to manually add a network route on the Edge.
To modify the Virtual IP interface
You can modify the Edge VIP interface on the active or standby Edge of an HA configuration (or a single Edge connected to a Core). Click edit next to Edge Virtual IP Address Configuration. Make the change and click Update to confirm.
When the VIP interface is changed, you must ensure that the hypervisor and any other clients associated with the Edge can still reach the VIP address. You may have to modify the network routes added.
Note: You can only use configured and activated interface names. The aux interface is disabled by default. If you are using the aux interface, you must first configure an IP address on the subnet you intend to use. If the interface you want to use does not appear in the drop-down list, verify whether it is enabled. New interfaces must be configured and activated on the Networking > Networking: Data Interfaces page. For details, see “Modifying RiOS data interfaces” on page 71..
Remove Core Click to disconnect the Edge from the Core; then click Remove Core to confirm.
Clear High Availability Peer (Appears when a peer is configured for Edge high availability.) Disconnects the peer from its appliance buddy.
On the standby peer, click to remove the HA peer appliance; then click Clear Peer to confirm. The Management Console displays the Storage Edge Configuration page after removing the peer.
The standby peer must be in either the Standby Rebuild or Standby Sync state before you clear it.
When the system disconnects the standby peer, its configuration is reset and the active peer enters a degraded health state. To clear both peers, repeat this procedure on the active peer.
The active peer must be in the Active Degraded state before you clear it.
When the system disconnects the active peer, it remains connected to the Core and continues servicing exports.
Control Description

Configuring Edge Connectivity and High Availability | 83
Configuring Edge high availability
Viewing configuration information
The Storage > Storage Edge Configuration page contains useful information about your SteelFusion
Edge configuration.
Viewing high-availability status
The Edge high-availability status on the Storage Edge Configuration page displays status for active peers
serving NFS exports and standby peers accepting updates from the active peer. Each status is color
coded: green indicates a working state such as synchronized and current, red indicates a degraded or
critical state such as a peer down, and orange indicates an intermediate or transitory state such as
rebuilding the NFS file system.
• Active Sync - The Edge serves client requests; the standby peer is synchronized with the current state of the active peer.
• Active Degraded - The Edge serves client requests, but the peer appliance is down.
• Active Rebuild - The Edge is updating the standby peer with updates that were missed during an outage.
• Standby Rebuild - The Edge passively accepts updates from the active peer, but its blockstore is not yet current with the state of the active peer.
• Standby Sync - The Edge passively accepts updates from the active peer and is synchronized with the current state of the system.
• Base - The Edge is starting up. The node stays in Base state when no Core appliance is configured for it and it is not connected to an HA peer.
• Dead - The Edge experienced an error from which it could not recover. The node cannot serve configuration information and its heartbeat connections are shut down.
Note: After a persistent Edge failure, when the failed Edge rejoins the high-availability pair, its blockstore will not be
active until it is synchronized with its active Edge datastore. Synchronization can take a significant amount of time,
depending on the amount of data it has to synchronize. During synchronization, ESXi might mark the paths to the
Edge as dead. To clear the error, manually rescan the ESXi storage after the Edge blockstore becomes active. For
details, see https://supportkb.riverbed.com/support/index?page=content&id=S26446&actp=search.
Viewing Blockstore Allocation
Select the Blockstore Allocation tab to display information about the Edge blockstore. It includes
information about the exports: the amount of bytes currently free, the bytes cached in the blockstore,
and an estimate of the number of bytes that can be written to the cache before the cache is at maximum
capacity. This tab also shows the amount of space in the blockstore used for pinned exports.
Move the pointer over a section of the chart to display details. Click a category on the right to focus the
display for that type of data.
Note: Data classified as Unevictable is surrounded by uncommitted data but has been skipped over and does not
itself need to be committed. When Edge is writing new data, it may skip over some older data that might be read
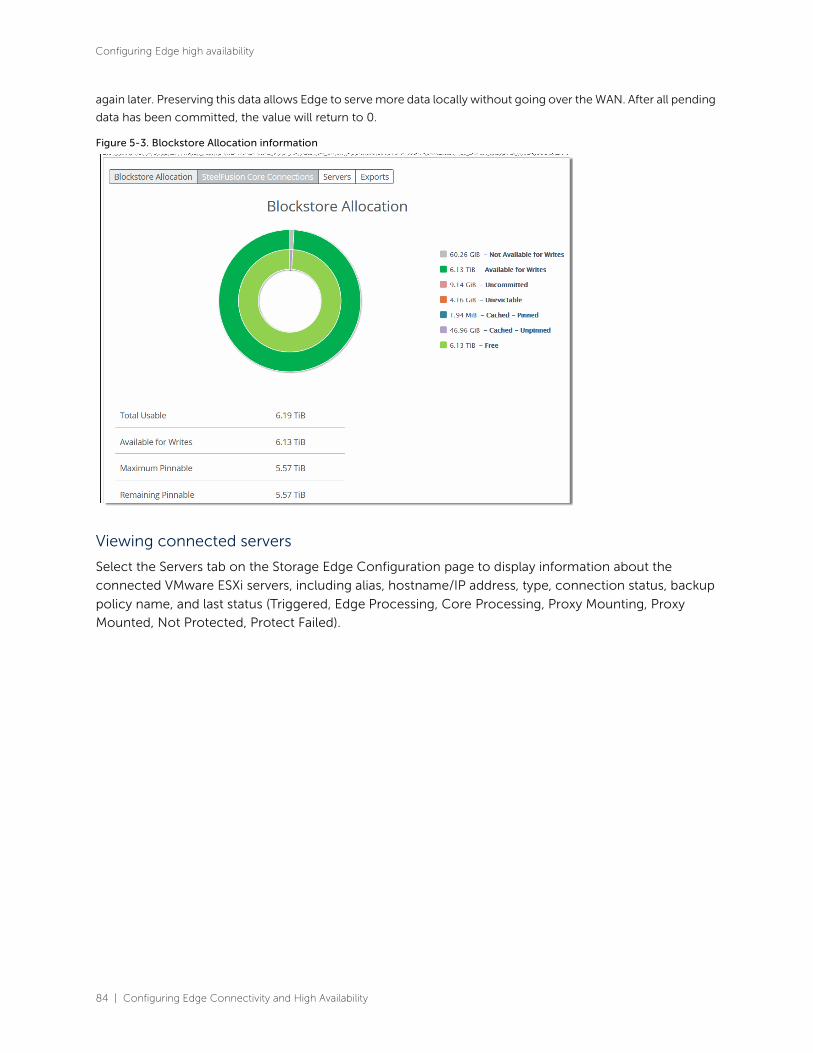
84 | Configuring Edge Connectivity and High Availability
Configuring Edge high availability
again later. Preserving this data allows Edge to serve more data locally without going over the WAN. After all pending
data has been committed, the value will return to 0.
Figure 5-3. Blockstore Allocation information
Viewing connected servers
Select the Servers tab on the Storage Edge Configuration page to display information about the
connected VMware ESXi servers, including alias, hostname/IP address, type, connection status, backup
policy name, and last status (Triggered, Edge Processing, Core Processing, Proxy Mounting, Proxy
Mounted, Not Protected, Protect Failed).
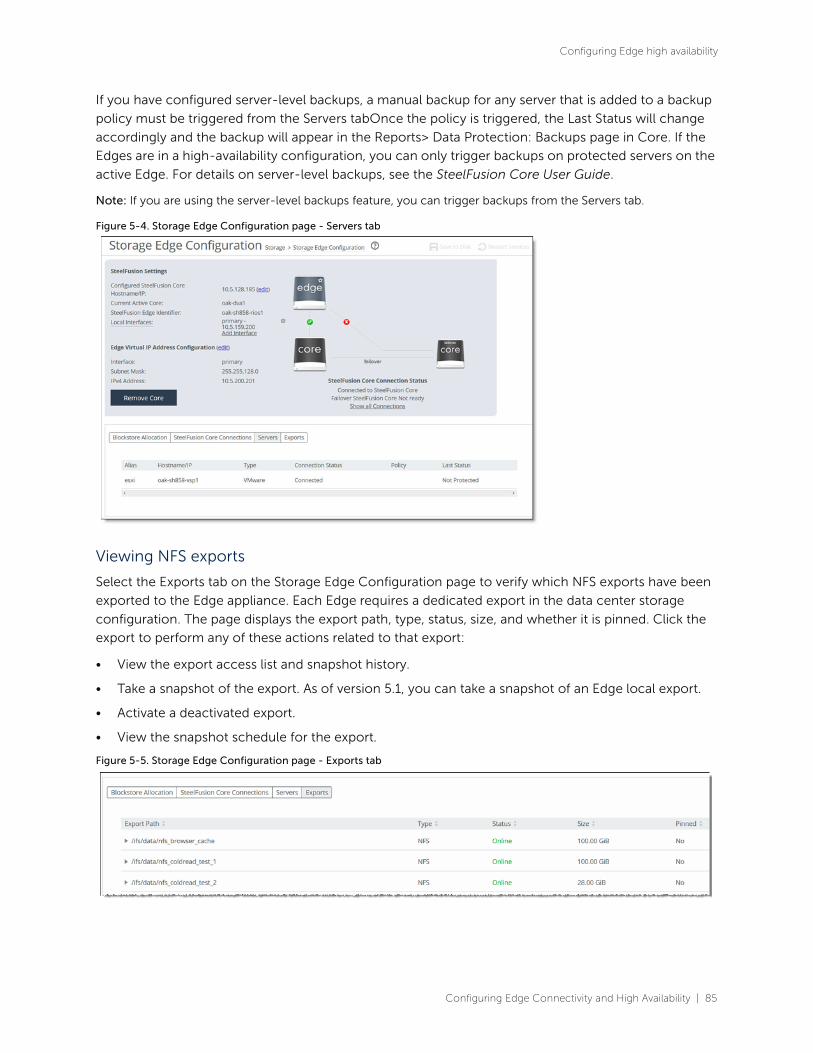
Configuring Edge Connectivity and High Availability | 85
Configuring Edge high availability
If you have configured server-level backups, a manual backup for any server that is added to a backup
policy must be triggered from the Servers tabOnce the policy is triggered, the Last Status will change
accordingly and the backup will appear in the Reports> Data Protection: Backups page in Core. If the
Edges are in a high-availability configuration, you can only trigger backups on protected servers on the
active Edge. For details on server-level backups, see the SteelFusion Core User Guide.
Note: If you are using the server-level backups feature, you can trigger backups from the Servers tab.
Figure 5-4. Storage Edge Configuration page - Servers tab
Viewing NFS exports
Select the Exports tab on the Storage Edge Configuration page to verify which NFS exports have been
exported to the Edge appliance. Each Edge requires a dedicated export in the data center storage
configuration. The page displays the export path, type, status, size, and whether it is pinned. Click the
export to perform any of these actions related to that export:
• View the export access list and snapshot history.
• Take a snapshot of the export. As of version 5.1, you can take a snapshot of an Edge local export.
• Activate a deactivated export.
• View the snapshot schedule for the export.
Figure 5-5. Storage Edge Configuration page - Exports tab

86 | Configuring Edge Connectivity and High Availability
Configuring Edge high availability
Configuring In-Path Rules | 87
6
Configuring In-Path Rules
This chapter describes how to configure in-path rules. It includes these sections:
• “In-path rules overview” on page 87
• “Default in-path rules” on page 90
• “Configuring in-path rules” on page 90
In-path rules overviewIn-path rules are used only when a connection is initiated. Because connections are usually initiated by
clients, in-path rules are configured for the initiating, or client-side, appliance. In-path rules determine
appliance behavior with SYN packets.
In-path rules are an ordered list of fields an appliance uses to match with SYN packet fields (for example,
source or destination subnet, IP address, VLAN, or TCP port). Each in-path rule has an action field. When
a SteelHead finds a matching in-path rule for a SYN packet, the appliance treats the packet according to
the action specified in the in-path rule.
In-path rules are used only in these scenarios:
• TCP SYN packet arrives on the LAN interface of physical in-path deployments.
• TCP SYN packet arrives on the WAN0_0 interface of virtual in-path deployments.
Both of these scenarios are associated with the first, or initiating, SYN packet of the connection. Because
most connections are initiated by the client, you configure your in-path rules on the client-side
appliance. In-path rules have no effect on connections that are already established, regardless of
whether the connections are being optimized.
In-path rule configurations differ depending on the action. For example, both the fixed-target and the
autodiscovery actions allow you to choose what type of optimization is applied, what type of data
reduction is used, what type of latency optimization is applied, and so on.
RiOS includes fixed-target, packet-mode optimization in-path rules. The appliance treats the packets for
packet-mode optimization rules differently from the in-path rules described in this overview. For details,
see “Creating in-path rules for packet-mode optimization” on page 88.
RiOS also includes TCPv4 and UDPv6 traffic optimization and connection or flow reporting for packet-
mode optimization.
For details on IPv6 deployment options, see the SteelHead Deployment Guide.
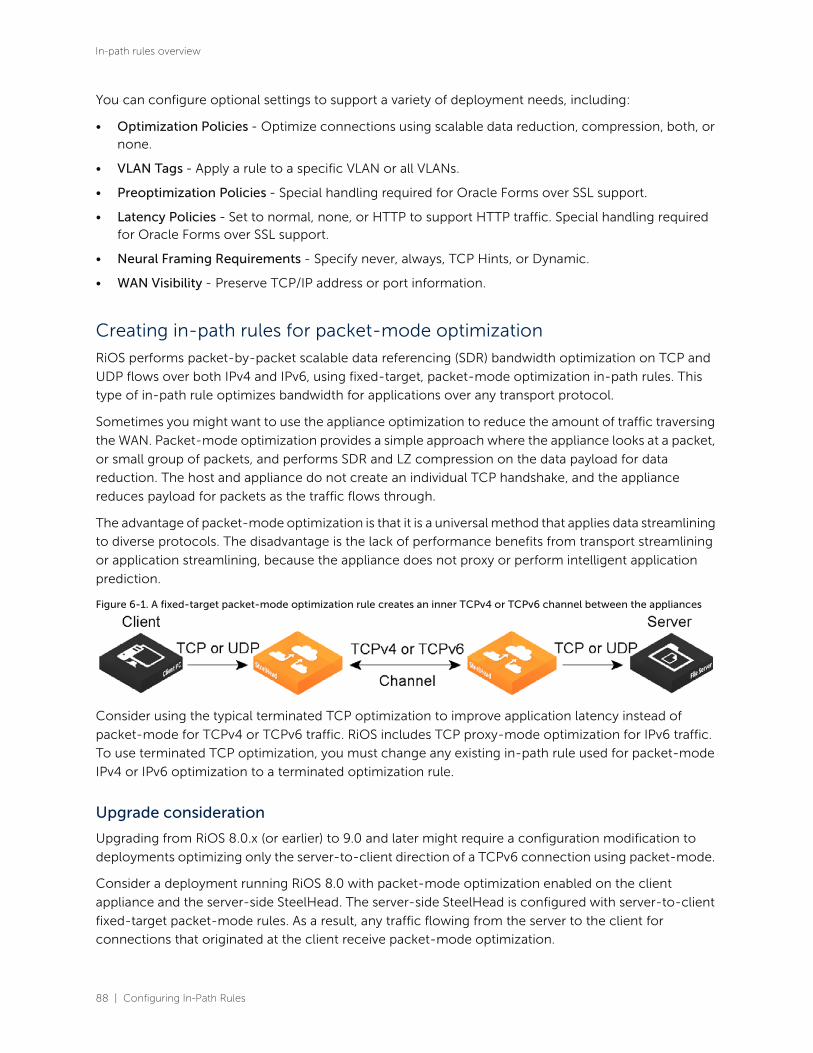
88 | Configuring In-Path Rules
In-path rules overview
You can configure optional settings to support a variety of deployment needs, including:
• Optimization Policies - Optimize connections using scalable data reduction, compression, both, or none.
• VLAN Tags - Apply a rule to a specific VLAN or all VLANs.
• Preoptimization Policies - Special handling required for Oracle Forms over SSL support.
• Latency Policies - Set to normal, none, or HTTP to support HTTP traffic. Special handling required for Oracle Forms over SSL support.
• Neural Framing Requirements - Specify never, always, TCP Hints, or Dynamic.
• WAN Visibility - Preserve TCP/IP address or port information.
Creating in-path rules for packet-mode optimization
RiOS performs packet-by-packet scalable data referencing (SDR) bandwidth optimization on TCP and
UDP flows over both IPv4 and IPv6, using fixed-target, packet-mode optimization in-path rules. This
type of in-path rule optimizes bandwidth for applications over any transport protocol.
Sometimes you might want to use the appliance optimization to reduce the amount of traffic traversing
the WAN. Packet-mode optimization provides a simple approach where the appliance looks at a packet,
or small group of packets, and performs SDR and LZ compression on the data payload for data
reduction. The host and appliance do not create an individual TCP handshake, and the appliance
reduces payload for packets as the traffic flows through.
The advantage of packet-mode optimization is that it is a universal method that applies data streamlining
to diverse protocols. The disadvantage is the lack of performance benefits from transport streamlining
or application streamlining, because the appliance does not proxy or perform intelligent application
prediction.
Figure 6-1. A fixed-target packet-mode optimization rule creates an inner TCPv4 or TCPv6 channel between the appliances
Consider using the typical terminated TCP optimization to improve application latency instead of
packet-mode for TCPv4 or TCPv6 traffic. RiOS includes TCP proxy-mode optimization for IPv6 traffic.
To use terminated TCP optimization, you must change any existing in-path rule used for packet-mode
IPv4 or IPv6 optimization to a terminated optimization rule.
Upgrade consideration
Upgrading from RiOS 8.0.x (or earlier) to 9.0 and later might require a configuration modification to
deployments optimizing only the server-to-client direction of a TCPv6 connection using packet-mode.
Consider a deployment running RiOS 8.0 with packet-mode optimization enabled on the client
appliance and the server-side SteelHead. The server-side SteelHead is configured with server-to-client
fixed-target packet-mode rules. As a result, any traffic flowing from the server to the client for
connections that originated at the client receive packet-mode optimization.
Configuring In-Path Rules | 89
In-path rules overview
The packet-mode rules exist only on the server-side SteelHead. No other rules are configured on the
client appliance or server-side SteelHeads.
Because the client-side appliance does not have fixed-target rules matching the client to server traffic,
it passes it through according to the default TCPv6 rule.
After upgrading the client-side appliance and server-side SteelHead to RiOS 9.0 or later in this
deployment scenario, connections originating from the client toward the server now receive terminated
TCP optimization. This happens because RiOS 9.0 and later supports terminated optimization for TCPv6
and the connections originating from the client now match the default optimization (terminated-mode)
rule on the client-side appliance. As a result, the server-to-client traffic of these connections also
receives terminated TCP optimization.
To continue passing through the client-to-server traffic and optimizing the server-to-client traffic using
packet mode, as before the upgrade, you need to configure a pass-through in-path rule on the client-
side appliance.
Packet-mode optimization rule characteristics
When you create a fixed-target packet-mode optimization rule, you define the inner channel
characteristics using these controls: source and destination subnet, source and destination port (or port
label), and DSCP marking.
Packet-mode optimization supports these topologies:
• Physical in-path
• Virtual in-path
– WCCP/PBR or TCPv4, UDPv4
– PBR for TCPv6, UDPv6
• Master and backup
Packet-mode optimization does not support these topologies:
• Out-of-path
• Serial cluster
• Interceptor integration
For details, see “Configuring in-path rules” on page 90. For design considerations and best practices, see
the SteelHead Deployment Guide.
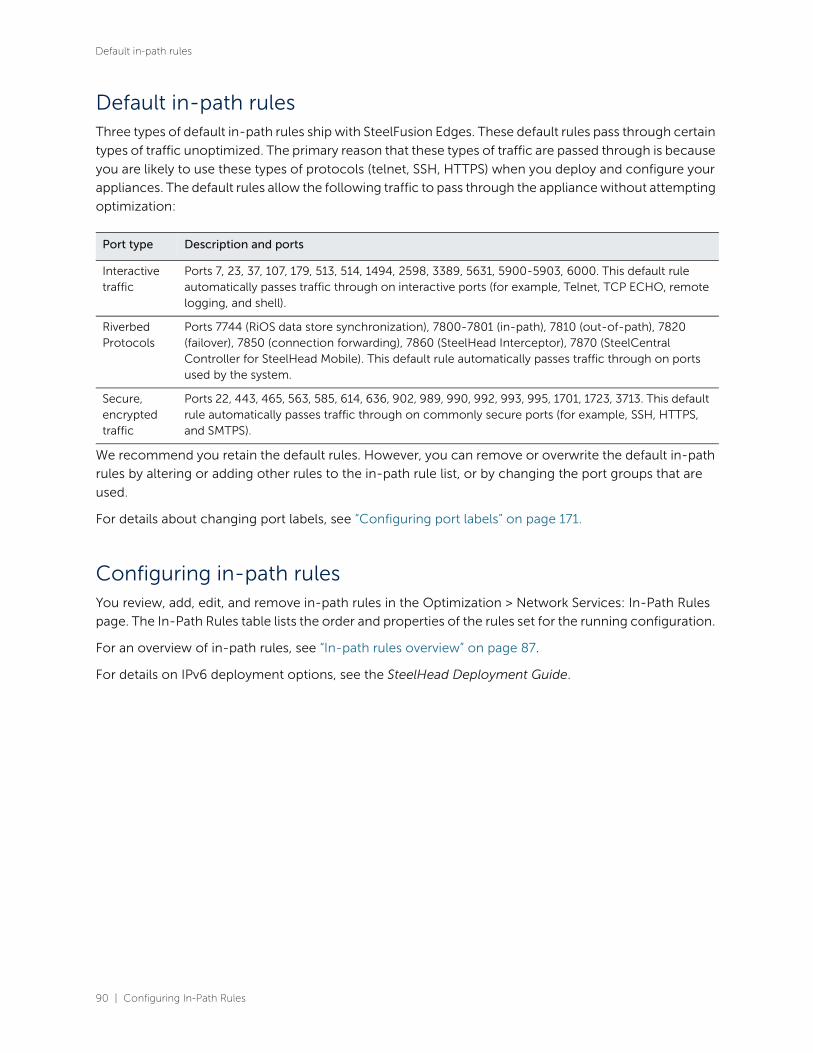
90 | Configuring In-Path Rules
Default in-path rules
Default in-path rulesThree types of default in-path rules ship with SteelFusion Edges. These default rules pass through certain
types of traffic unoptimized. The primary reason that these types of traffic are passed through is because
you are likely to use these types of protocols (telnet, SSH, HTTPS) when you deploy and configure your
appliances. The default rules allow the following traffic to pass through the appliance without attempting
optimization:
We recommend you retain the default rules. However, you can remove or overwrite the default in-path
rules by altering or adding other rules to the in-path rule list, or by changing the port groups that are
used.
For details about changing port labels, see “Configuring port labels” on page 171.
Configuring in-path rulesYou review, add, edit, and remove in-path rules in the Optimization > Network Services: In-Path Rules
page. The In-Path Rules table lists the order and properties of the rules set for the running configuration.
For an overview of in-path rules, see “In-path rules overview” on page 87.
For details on IPv6 deployment options, see the SteelHead Deployment Guide.
Port type Description and ports
Interactive traffic
Ports 7, 23, 37, 107, 179, 513, 514, 1494, 2598, 3389, 5631, 5900-5903, 6000. This default rule automatically passes traffic through on interactive ports (for example, Telnet, TCP ECHO, remote logging, and shell).
Riverbed Protocols
Ports 7744 (RiOS data store synchronization), 7800-7801 (in-path), 7810 (out-of-path), 7820 (failover), 7850 (connection forwarding), 7860 (SteelHead Interceptor), 7870 (SteelCentral Controller for SteelHead Mobile). This default rule automatically passes traffic through on ports used by the system.
Secure, encrypted traffic
Ports 22, 443, 465, 563, 585, 614, 636, 902, 989, 990, 992, 993, 995, 1701, 1723, 3713. This default rule automatically passes traffic through on commonly secure ports (for example, SSH, HTTPS, and SMTPS).
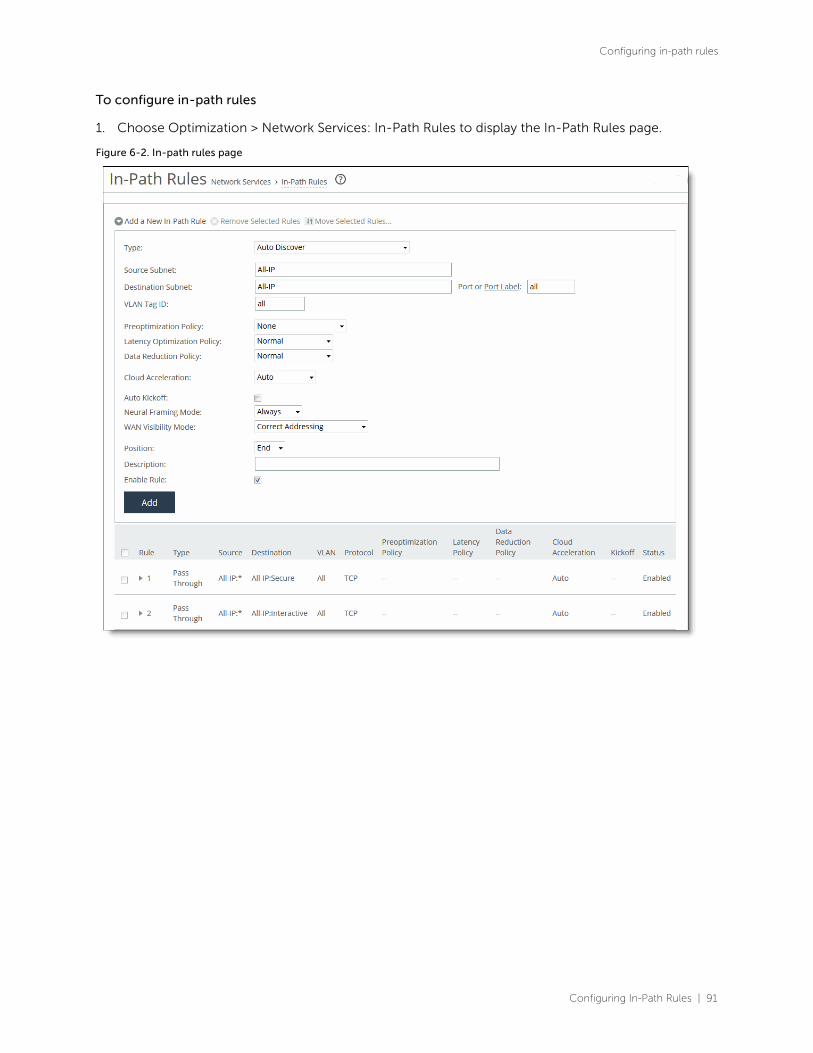
Configuring In-Path Rules | 91
Configuring in-path rules
To configure in-path rules
1. Choose Optimization > Network Services: In-Path Rules to display the In-Path Rules page.
Figure 6-2. In-path rules page

92 | Configuring In-Path Rules
Configuring in-path rules
2. Configure the rules as described in this table.

Configuring In-Path Rules | 93
Configuring in-path rules
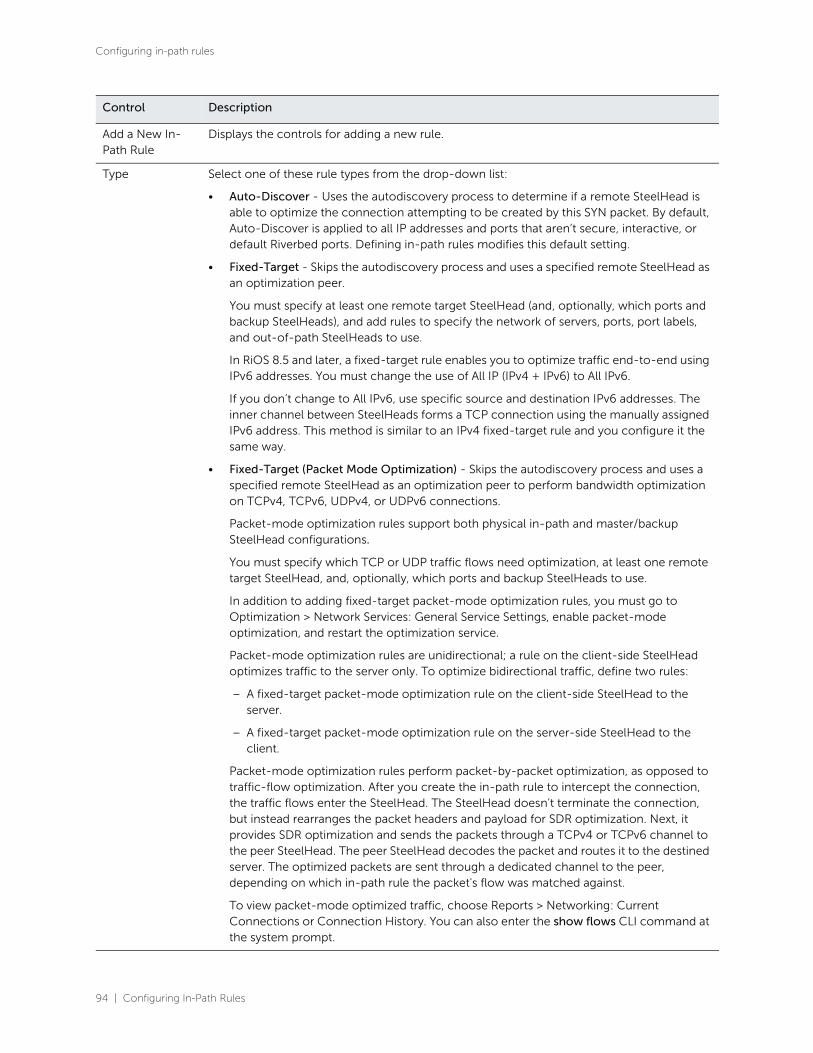
94 | Configuring In-Path Rules
Configuring in-path rules
Control Description
Add a New In-Path Rule
Displays the controls for adding a new rule.
Type Select one of these rule types from the drop-down list:
• Auto-Discover - Uses the autodiscovery process to determine if a remote SteelHead is able to optimize the connection attempting to be created by this SYN packet. By default, Auto-Discover is applied to all IP addresses and ports that aren’t secure, interactive, or default Riverbed ports. Defining in-path rules modifies this default setting.
• Fixed-Target - Skips the autodiscovery process and uses a specified remote SteelHead as an optimization peer.
You must specify at least one remote target SteelHead (and, optionally, which ports and backup SteelHeads), and add rules to specify the network of servers, ports, port labels, and out-of-path SteelHeads to use.
In RiOS 8.5 and later, a fixed-target rule enables you to optimize traffic end-to-end using IPv6 addresses. You must change the use of All IP (IPv4 + IPv6) to All IPv6.
If you don’t change to All IPv6, use specific source and destination IPv6 addresses. The inner channel between SteelHeads forms a TCP connection using the manually assigned IPv6 address. This method is similar to an IPv4 fixed-target rule and you configure it the same way.
• Fixed-Target (Packet Mode Optimization) - Skips the autodiscovery process and uses a specified remote SteelHead as an optimization peer to perform bandwidth optimization on TCPv4, TCPv6, UDPv4, or UDPv6 connections.
Packet-mode optimization rules support both physical in-path and master/backup SteelHead configurations.
You must specify which TCP or UDP traffic flows need optimization, at least one remote target SteelHead, and, optionally, which ports and backup SteelHeads to use.
In addition to adding fixed-target packet-mode optimization rules, you must go to Optimization > Network Services: General Service Settings, enable packet-mode optimization, and restart the optimization service.
Packet-mode optimization rules are unidirectional; a rule on the client-side SteelHead optimizes traffic to the server only. To optimize bidirectional traffic, define two rules:
– A fixed-target packet-mode optimization rule on the client-side SteelHead to the server.
– A fixed-target packet-mode optimization rule on the server-side SteelHead to the client.
Packet-mode optimization rules perform packet-by-packet optimization, as opposed to traffic-flow optimization. After you create the in-path rule to intercept the connection, the traffic flows enter the SteelHead. The SteelHead doesn’t terminate the connection, but instead rearranges the packet headers and payload for SDR optimization. Next, it provides SDR optimization and sends the packets through a TCPv4 or TCPv6 channel to the peer SteelHead. The peer SteelHead decodes the packet and routes it to the destined server. The optimized packets are sent through a dedicated channel to the peer, depending on which in-path rule the packet's flow was matched against.
To view packet-mode optimized traffic, choose Reports > Networking: Current Connections or Connection History. You can also enter the show flows CLI command at the system prompt.

Configuring In-Path Rules | 95
Configuring in-path rules
Requirements:
• Both the client-side SteelHead and the server-side SteelHead must be running RiOS 7.0 or later.
• IPv6 is enabled by default in RiOS 8.0.x and later.
• To view the packet-mode flows in the Current Connections and Connection History reports, the SteelHead must be running RiOS 8.5 or later.
Packet-mode optimization rules don’t support:
• Automatic reflection of DSCP markings.
• Latency optimization and preoptimization policies. Selecting this rule type automatically sets the preoptimization policy and latency optimization policies to none.
• Autodiscovery of the peer SteelHead. Because this is a fixed-target rule, the SteelHead determines the IP address of its peer from the rule configuration.
• Connection forwarding, simplified routing, or asymmetric routing.
• QoS, MIP interfaces, NetFlow, transparency, or the automatic kickoff feature.
• Automatically assigned IPv6 addresses.
• Pass-Through - Allows the SYN packet to pass through the SteelHead unoptimized. No optimization is performed on the TCP connection initiated by this SYN packet. You define pass-through rules to exclude subnets from optimization. Traffic is also passed through when the SteelHead is in bypass mode. (Pass through of traffic might occur because of in-path rules or because the connection was established before the SteelHead was put in place or before the optimization service was enabled.)
• Discard - Drops the SYN packets silently. The SteelHead filters out traffic that matches the discard rules. This process is similar to how routers and firewalls drop disallowed packets: the connection-initiating device has no knowledge that its packets were dropped until the connection times out.
• Deny - Drops the SYN packets, sends a message back to its source, and resets the TCP connection being attempted. Using an active reset process rather than a silent discard allows the connection initiator to know that its connection is disallowed.
Control Description

96 | Configuring In-Path Rules
Configuring in-path rules
Source Subnet - Specify the subnet IP address and netmask for the source network:
• All IP (IPv4 + IPv6) - Maps to all IPv4 and IPv6 networks.
• All IPv4 - Maps to 0.0.0.0/0.
• All IPv6 - Maps to ::/0.
• IPv4 - Prompts you for a specific IPv4 address. Use this format for an individual subnet IP address and netmask: xxx.xxx.xxx.xxx/xx (IPv4)
• IPv6 - Prompts you for a specific IPv6 address. Use this format for an individual subnet IP address and netmask: x:x:x::x/xxx (IPv6)
Note: In a virtual in-path configuration using packet-mode optimization, don’t use the wildcard All IP option for both the source and destination IP addresses on the server-side and client-side SteelHeads. Doing so can create a loop between the SteelHeads if the server-side SteelHead forms an inner connection with the client-side SteelHead before the client-side SteelHead forms an inner connection with the server-side SteelHead. Instead, configure the rule using the local subnet on the LAN side of the SteelHead.
When creating a fixed-target packet-mode rule, you must configure an IPv6 address and route for each interface, unless you are optimizing UDP traffic.
Control Description

Configuring In-Path Rules | 97
Configuring in-path rules
Destination Subnet- Specify the subnet IP address and netmask for the destination network:
• All IP (IPv4 + IPv6) - Maps to all IPv4 and IPv6 networks.
• All IPv4 - Maps to 0.0.0.0/0.
• All IPv6 - Maps to ::/0.
• IPv4 - Prompts you for a specific IPv4 address. Use this format for an individual subnet IP address and netmask: xxx.xxx.xxx.xxx/xx (IPv4)
• IPv6 - Prompts you for a specific IPv6 address. Use this format for an individual subnet IP address and netmask: x:x:x::x/xxx (IPv6)
• Host Label - Choose a destination host label to selectively optimize connections to specific services. A host label includes a fully qualified domain name (hostname) and/or a list of subnets.
Host labels replace the destination. When you select a host label, RiOS ignores any destination IP address specified within the in-path rule.
The Management Console dims the host label selection when there aren’t any host labels.
Notes:
– Host labels aren’t compatible with IPv6. When you add a host label to an in-path rule, you must change the source to All IPv4 or a specify an IPv4 subnet.
– You can use both host labels and domain labels within a single in-path rule.
– The rules table shows any host label, domain label, and/or port label name in use in the Destination column.
• SaaS Application - Defines an in-path rule for SaaS acceleration through SteelConnect Manager. When you choose SaaS Application, you also need to specify the application, such as SharePoint for Business. Only applications set up for SaaS acceleration on the associated SteelConnect Manager are available.
Note: In a virtual in-path configuration using packet-mode optimization, don’t use the wildcard All IP option for both the source and destination IP addresses on the server-side and client-side SteelHeads. Doing so can create a loop between the SteelHeads if the server-side SteelHead forms an inner connection with the client-side SteelHead before the client-side SteelHead forms an inner connection with the server-side SteelHead. Instead, configure the rule using the local subnet on the LAN side of the SteelHead.
Note: When creating a fixed-target packet mode optimization rule, you must configure an IPv6 address and route for each interface.
Port - Select All Ports, Specific Port, or Port Label. Select All to use all ports. For Specific Port, specify the destination port number. Valid port numbers are between 1 and 65535, inclusively. When you select Port Label, a list of port labels appears. Select a label from the drop-down list.
Choose Networking > App Definitions: Port Labels to create a port label.
The rules table shows the port label name in use under the Destination column.
See Appendix B, “SteelFusion Edge Ports,” for a description of the SteelHead default ports.
Control Description

98 | Configuring In-Path Rules
Configuring in-path rules
Domain Label - Select a domain label to optimize a specific service or application. Domain labels are names given to sets of hostnames to streamline configuration. For example, you can create domain labels and use them with an in-path rule to selectively optimize specific services. Because some SaaS providers and the O365 VNext architecture serve multiple O365 applications (for example, SharePoint, Lync, and Exchange) through the same dynamic virtual IP address, using domain labels allows flexible hostname-based interception.
The in-path rule still sets a destination IP address and subnet (or uses a host label or port). Any traffic that matches the destination first must also be going to a domain that matches the entries in the domain label. The rule must match both the destination and the domain label. When the entries in the domain label don’t match, the system moves to the next matching rule.
Choose Networking > App Definitions: Domain Labels to create a domain label.
You can use both host and domain labels within a single in-path rule.
The rules table shows the domain label name in use under the Destination column.
Domain labels have these dependencies:
• They’re compatible with auto-discover, passthrough, and fixed-target (not packet mode) in-path rules.
• Domain labels are only compatible with IPv4. Adding a domain label to an in-path rule automatically sets the source and destination to IPv4.
• When you add a domain label to an existing in-path rule that is using All IP, you must change the destination address to All IPv4.
• Both the server-side and the client-side SteelHeads must be running RiOS 9.2 or later.
• Place domain label rules below others. A fixed-target rule with a domain label match followed with an auto-discover rule will not use auto discovery but will instead pass through the traffic. This happens because the matching SYN packet isn’t followed with a probe.
• Domain labels and cloud acceleration are mutually exclusive. When you use a domain label with an in-path rule that has cloud acceleration enabled, the system automatically sets cloud acceleration to Pass Through and connections to the subscribed SaaS platform are no longer optimized by the SteelHead SaaS. Setting domain labels back to n/a doesn’t reset the cloud acceleration setting back to the original setting after it has been changed to Pass Through.
• When you add a domain label to an in-path rule with the ports set to All Ports, the system interprets the request as all ports that match the domain label, and uses ports 80 and 443 for optimization. A warning states that only the http and https ports are in use. When you specify a specific port number, the in-path rule honors the port.
• Domain labels and the web proxy are mutually exclusive.
• They aren’t compatible with SteelHead Interceptor. Host labels are compatible with Interceptor, so you can use them instead.
• They aren’t compatible with connection forwarding.
Target Appliance IP Address
Specify the target appliance address for a fixed-target rule. When the protocol is TCP and you don’t specify an IP address, the rule defaults to all IPv6 addresses.
Port - Specify the target port number for a fixed-target rule.
Control Description

Configuring In-Path Rules | 99
Configuring in-path rules
Backup Appliance IP Address
Specify the backup appliance address for a fixed-target rule.
Port - Specify the backup destination port number for a fixed-target rule.
VLAN Tag ID Specify a VLAN identification number from 0 to 4094, enter all to apply the rule to all VLANs, or enter untagged to apply the rule to nontagged connections.
RiOS supports VLAN v802.1Q. To configure VLAN tagging, configure in-path rules to apply to all VLANs or to a specific VLAN. By default, rules apply to all VLAN values unless you specify a particular VLAN ID. Pass-through traffic maintains any preexisting VLAN tagging between the LAN and WAN interfaces.
Protocol (Appears only for fixed-target packet-mode optimization rules.) Select a traffic protocol from the drop-down list:
• TCP - Specifies the TCP protocol. Supports TCP-over-IPv6 only.
• UDP - Specifies the UDP protocol. Supports UDP-over-IPv4 only.
• Any - Specifies all TCP-based and UDP-based protocols. This is the default setting.
Preoptimization Policy
Select a traffic type from the drop-down list:
• None - If the Oracle Forms, SSL, or Oracle Forms-over-SSL preoptimization policy is enabled and you want to disable it for a port, select None. This is the default setting.
Port 443 always uses a preoptimization policy of SSL even if an in-path rule on the client-side SteelHead sets the preoptimization policy to None. To disable the SSL preoptimization for traffic to port 443, you can either:
Disable the SSL optimization on the client-side or server-side SteelHead.
—or—
Modify the peering rule on the server-side SteelHead by setting the SSL Capability control to No Check.
• Oracle Forms - Enables preoptimization processing for Oracle Forms. This policy is not compatible with IPv6.
• Oracle Forms over SSL - Enables preoptimization processing for both the Oracle Forms and SSL encrypted traffic through SSL secure ports on the client-side SteelHead. You must also set the Latency Optimization Policy to HTTP. This policy is not compatible with IPv6.
If the server is running over a standard secure port—for example, port 443—the Oracle Forms over SSL in-path rule needs to be before the default secure port pass-through rule in the in-path rule list.
• SSL - Enables preoptimization processing for SSL encrypted traffic through SSL secure ports on the client-side SteelHead.
Control Description

100 | Configuring In-Path Rules
Configuring in-path rules
Latency Optimization Policy
Select one of these policies from the drop-down list:
• Normal - Performs all latency optimizations (HTTP is activated for ports 80 and 8080). This is the default setting.
• HTTP - Activates HTTP optimization on connections matching this rule.
• Outlook Anywhere - Activates RPC over HTTP(S) optimization for Outlook Anywhere on connections matching this rule. To automatically detect Outlook Anywhere or HTTP on a connection, select the Normal latency optimization policy and enable the Auto-Detect Outlook Anywhere Connections option in the Optimization > Protocols: MAPI page. The auto-detect option in the MAPI page is best for simple SteelHead configurations with only a single SteelHead at each site and when the Internet Information Services (IIS) server is also handling websites. If the IIS server is only used as RPC Proxy, and for configurations with asymmetric routing, connection forwarding, or Interceptor installations, add in-path rules that identify the RPC Proxy server IP addresses and select this latency optimization policy. After adding the in-path rule, disable the auto-detect option in the Optimization > Protocols: MAPI page.
• Citrix - Activates Citrix-over-SSL optimization on connections matching this rule. This policy is not compatible with IPv6. Add an in-path rule to the client-side SteelHead that specifies the Citrix Access Gateway IP address, select this latency optimization policy on both the client-side and server-side SteelHeads, and set the preoptimization policy to SSL. Both the client-side and the server-side SteelHeads must be running RiOS 7.0 or later. The preoptimization policy must be set to SSL.
SSL must be enabled on the Citrix Access Gateway. On the server-side SteelHead, enable SSL and install the SSL server certificate for the Citrix Access Gateway.
The client-side and server-side SteelHeads establish an SSL channel between themselves to secure the optimized ICA traffic. End users log in to the Access Gateway through a browser (HTTPS) and access applications through the web interface site. Clicking an application icon starts the Online Plug-in, which establishes an SSL connection to the Access Gateway. The ICA connection is tunneled through the SSL connection.
The SteelHead decrypts the SSL connection from the user device, applies ICA latency optimization, and reencrypts the traffic over the internet. The server-side SteelHead decrypts the optimized ICA traffic and reencrypts the ICA traffic into the original SSL connection destined to the Access Gateway.
• Exchange Autodetect - Automatically detects MAPI transport protocols (Autodiscover, Outlook Anywhere, and MAPI over HTTP) and HTTP traffic. For MAPI transport protocol optimization, enable SSL and install the SSL server certificate for the Exchange Server on the server-side SteelHead. To activate MAPI over HTTP bandwidth optimization, you must also choose Optimization > MAPI and select Enable MAPI over HTTP optimization on the client-side SteelHead. Both the client-side and server-side SteelHeads must be running RiOS 9.1 or later for MAPI over HTTP bandwidth optimization.
• None - Do not activate latency optimization on connections matching this rule. For Oracle Forms-over-SSL encrypted traffic, you must set the Latency Optimization Policy to HTTP.
Note: Setting the Latency Optimization Policy to None excludes all latency optimizations, such as HTTP, MAPI, and SMB.
Control Description

Configuring In-Path Rules | 101
Configuring in-path rules
Data Reduction Policy
Optionally, if the rule type is Auto-Discover or Fixed Target, you can configure these types of data reduction policies:
• Normal - Perform LZ compression and SDR.
• SDR-Only - Perform SDR; don’t perform LZ compression.
• SDR-M - Performs data reduction entirely in memory, which prevents the SteelHead from reading and writing to and from the disk. Enabling this option can yield high LAN-side throughput because it eliminates all disk latency. This data reduction policy is useful for
– a very small amount of data; for example, interactive traffic.
– point-to-point replication during off-peak hours when both the server-side and client-side SteelHeads are the same (or similar) size.
Both SteelHeads must be running RiOS 6.0.x or later.
• Compression-Only - Perform LZ compression; don’t perform SDR.
• None - Do not perform SDR or LZ compression.
To configure data reduction policies for the FTP data channel, define an in-path rule with the destination port 20 and set its data reduction policy. Setting QoS for port 20 on the client-side SteelHead affects passive FTP, while setting the QoS for port 20 on the server-side SteelHead affects active FTP.
To configure optimization policies for the MAPI data channel, define an in-path rule with the destination port 7830 and set its data reduction policy.
Cloud Acceleration
After you subscribe to a SaaS platform and enable it, ensure that cloud acceleration is ready and enabled. When cloud acceleration is enabled, connections to the subscribed SaaS platform are optimized by the SteelHead SaaS. You don’t need to add an in-path rule unless you want to optimize specific users and exclude others. Select one of these choices from the drop-down list:
• Auto - If the in-path rule matches, the connection is optimized by the SteelHead SaaS connection.
• Pass Through - If the in-path rule matches, the connection is not optimized by the SteelHead SaaS, but it follows the other rule parameters so that the connection might be optimized by this SteelHead with other SteelHeads in the network, or it might be passed through.
Domain labels and cloud acceleration are mutually exclusive.
Cloud acceleration doesn’t support host labels.
Control Description

102 | Configuring In-Path Rules
Configuring in-path rules
Auto Kickoff Enables kickoff, which resets pre-existing connections to force them to go through the connection creation process again. If you enable kickoff, connections that pre-exist when the optimization service is started are reestablished and optimized.
Generally, connections are short-lived and kickoff is not necessary. It is suitable for certain long-lived connections, such as data replication, and very challenging remote environments: for example, in a remote branch-office with a T1 and a 35 ms round-trip time, you would want connections to migrate to optimization gracefully, rather than risk interruption with kickoff.
RiOS provides three ways to enable kickoff:
• Globally for all existing connections in the Optimization > Network Services: General Service Settings page.
• For a single pass-through or optimized connection in the Current Connections report, one connection at a time.
• For all existing connections that match an in-path rule and the rule has kickoff enabled.
In most deployments, you don’t want to set automatic kickoff globally because it disrupts all existing connections. When you enable kick off using an in-path rule, once the SteelHead detects packet flow that matches the IP and port specified in the rule, it sends an RST packet to the client and server maintaining the connection to try to close it. Next, it sets an internal flag to prevent any further kickoffs until the optimization service is once again restarted.
Note: If no data is being transferred between the client and server, the connection is not reset immediately. It resets the next time the client or server tries to send a message. Therefore, when the application is idle, it might take a while for the connection to reset.
By default, automatic kickoff per in-path rule is disabled.
The service applies the first matching in-path rule for an existing connection that matches the source and destination IP and port; it doesn’t consider a VLAN tag ID when determining whether to kick off the connection. Consequently, the service automatically kicks off connections with matching source and destination addresses and ports on different VLANs.
The source and destination of a preexisting connection can’t be determined because the SteelHead did not see the initial TCP handshake whereas an in-path rule specifies the source and destination IP address to which the rule should be applied. Hence this connection for this IP address pair is matched twice, once as source to destination and the other as destination to source to find an in-path rule.
As an example, the following in-path rule will kick off connections from 10.11.10.10/24 to 10.12.10.10/24 and 10.12.10.10/24 to 10.11.10.10/24:
Src 10.11.10.10/24 Dst 10.12.10.10/24 Auto Kickoff enabled
The first matching in-path rule will be considered during the kickoff check for a preexisting connection. If the first matching in-path rule has kickoff enabled, then that preexisting connection will be reset.
Note: Specifying automatic kickoff per in-path rule enables kickoff even when you disable the global kickoff feature. When global kickoff is enabled, it overrides this setting. You set the global kickoff feature using the Reset Existing Client Connections on Start Up feature, which appears in the Optimization > Network Services: General Service Settings page.
Note: This feature pertains only to autodiscover and fixed-target rule types and is dimmed for the other rule types.
Control Description

Configuring In-Path Rules | 103
Configuring in-path rules
Neural Framing Mode
Optionally, if the rule type is Auto-Discover or Fixed Target, you can select a neural framing mode for the in-path rule. Neural framing enables the system to select the optimal packet framing boundaries for SDR. Neural framing creates a set of heuristics to intelligently determine the optimal moment to flush TCP buffers. The system continuously evaluates these heuristics and uses the optimal heuristic to maximize the amount of buffered data transmitted in each flush, while minimizing the amount of idle time that the data sits in the buffer.
Select a neural framing setting:
• Never - Do not use the Nagle algorithm. The Nagle algorithm is a means of improving the efficiency of TCP/IP networks by reducing the number of packets that need to be sent over the network. It works by combining a number of small outgoing messages and sending them all at once. All the data is immediately encoded without waiting for timers to fire or application buffers to fill past a specified threshold. Neural heuristics are computed in this mode but aren’t used. In general, this setting works well with time-sensitive and chatty or real-time traffic.
• Always - Use the Nagle algorithm. This is the default setting. All data is passed to the codec, which attempts to coalesce consume calls (if needed) to achieve better fingerprinting. A timer (6 ms) backs up the codec and causes leftover data to be consumed. Neural heuristics are computed in this mode but aren’t used. This mode is not compatible with IPv6.
• TCP Hints - If data is received from a partial frame packet or a packet with the TCP PUSH flag set, the encoder encodes the data instead of immediately coalescing it. Neural heuristics are computed in this mode but aren’t used. This mode is not compatible with IPv6.
• Dynamic - Dynamically adjust the Nagle parameters. In this option, the system discerns the optimum algorithm for a particular type of traffic and switches to the best algorithm based on traffic characteristic changes. This mode is not compatible with IPv6.
For different types of traffic, one algorithm might be better than others. The considerations include: latency added to the connection, compression, and SDR performance.
To configure neural framing for an FTP data channel, define an in-path rule with the destination port 20 and set its data reduction policy. To configure neural framing for a MAPI data channel, define an in-path rule with the destination port 7830 and set its data reduction policy.
Control Description

104 | Configuring In-Path Rules
Configuring in-path rules
WAN Visibility Mode
Enables WAN visibility, which pertains to how packets traversing the WAN are addressed. RiOS provides three types of WAN visibility: correct addressing, port transparency, and full address transparency.
You configure WAN visibility on the client-side SteelHead (where the connection is initiated).
Port and full transparency modes aren’t compatible with IPv6 or the in-path rule option web proxy force.
Select one of these modes from the drop-down list:
• Correct Addressing - Disables WAN visibility. Correct addressing uses SteelHead IP addresses and port numbers in the TCP/IP packet header fields for optimized traffic in both directions across the WAN. This is the default setting.
• Port Transparency - Port address transparency preserves your server port numbers in the TCP/IP header fields for optimized traffic in both directions across the WAN. Traffic is optimized while the server port number in the TCP/IP header field appears to be unchanged. Routers and network monitoring devices deployed in the WAN segment between the communicating SteelHeads can view these preserved fields.
Use port transparency if you want to manage and enforce QoS policies that are based on destination ports. If your WAN router is following traffic classification rules written in terms of client and network addresses, port transparency enables your routers to use existing rules to classify the traffic without any changes.
Port transparency enables network analyzers deployed within the WAN (between the SteelHeads) to monitor network activity and to capture statistics for reporting by inspecting traffic according to its original TCP port number.
Port transparency doesn’t require dedicated port configurations on your SteelHeads.
Note: Port transparency only provides server port visibility. It doesn’t provide client and server IP address visibility, nor does it provide client port visibility.
• Full Transparency - Full address transparency preserves your client and server IP addresses and port numbers in the TCP/IP header fields for optimized traffic in both directions across the WAN. It also preserves VLAN tags. Traffic is optimized while these TCP/IP header fields appear to be unchanged. Routers and network monitoring devices deployed in the WAN segment between the communicating SteelHeads can view these preserved fields.
If both port transparency and full address transparency are acceptable solutions, port transparency is preferable. Port transparency avoids potential networking risks that are inherent to enabling full address transparency. For details, see the SteelHead Deployment Guide.
However, if you must see your client or server IP addresses across the WAN, full transparency is your only configuration option.
Note: Enabling full address transparency requires symmetrical traffic flows between the client and server. If any asymmetry exists on the network, enabling full address transparency might yield unexpected results, up to and including loss of connectivity. For details, see the SteelHead Deployment Guide.
Control Description
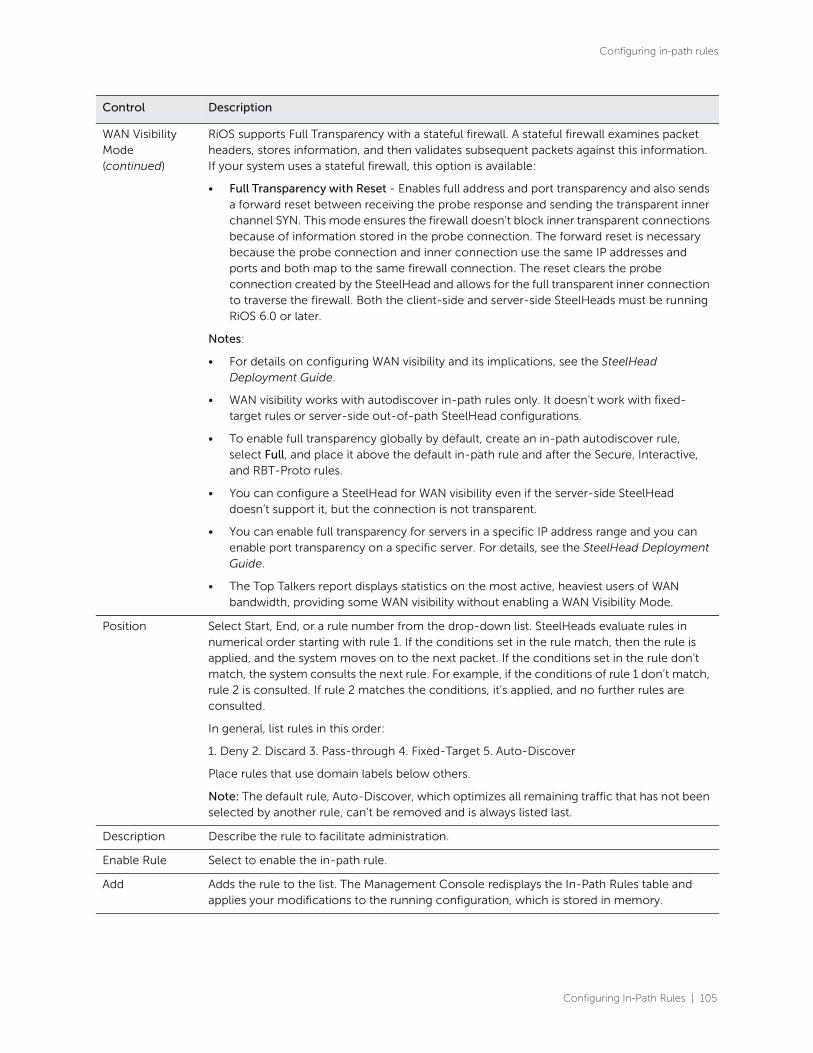
Configuring In-Path Rules | 105
Configuring in-path rules
WAN Visibility Mode (continued)
RiOS supports Full Transparency with a stateful firewall. A stateful firewall examines packet headers, stores information, and then validates subsequent packets against this information. If your system uses a stateful firewall, this option is available:
• Full Transparency with Reset - Enables full address and port transparency and also sends a forward reset between receiving the probe response and sending the transparent inner channel SYN. This mode ensures the firewall doesn’t block inner transparent connections because of information stored in the probe connection. The forward reset is necessary because the probe connection and inner connection use the same IP addresses and ports and both map to the same firewall connection. The reset clears the probe connection created by the SteelHead and allows for the full transparent inner connection to traverse the firewall. Both the client-side and server-side SteelHeads must be running RiOS 6.0 or later.
Notes:
• For details on configuring WAN visibility and its implications, see the SteelHead Deployment Guide.
• WAN visibility works with autodiscover in-path rules only. It doesn’t work with fixed-target rules or server-side out-of-path SteelHead configurations.
• To enable full transparency globally by default, create an in-path autodiscover rule, select Full, and place it above the default in-path rule and after the Secure, Interactive, and RBT-Proto rules.
• You can configure a SteelHead for WAN visibility even if the server-side SteelHead doesn’t support it, but the connection is not transparent.
• You can enable full transparency for servers in a specific IP address range and you can enable port transparency on a specific server. For details, see the SteelHead Deployment Guide.
• The Top Talkers report displays statistics on the most active, heaviest users of WAN bandwidth, providing some WAN visibility without enabling a WAN Visibility Mode.
Position Select Start, End, or a rule number from the drop-down list. SteelHeads evaluate rules in numerical order starting with rule 1. If the conditions set in the rule match, then the rule is applied, and the system moves on to the next packet. If the conditions set in the rule don’t match, the system consults the next rule. For example, if the conditions of rule 1 don’t match, rule 2 is consulted. If rule 2 matches the conditions, it’s applied, and no further rules are consulted.
In general, list rules in this order:
1. Deny 2. Discard 3. Pass-through 4. Fixed-Target 5. Auto-Discover
Place rules that use domain labels below others.
Note: The default rule, Auto-Discover, which optimizes all remaining traffic that has not been selected by another rule, can’t be removed and is always listed last.
Description Describe the rule to facilitate administration.
Enable Rule Select to enable the in-path rule.
Add Adds the rule to the list. The Management Console redisplays the In-Path Rules table and applies your modifications to the running configuration, which is stored in memory.
Control Description

106 | Configuring In-Path Rules
Configuring in-path rules
3. The default rule, Auto, which optimizes all remaining traffic that has not been selected by another rule, cannot be removed and is always listed last.
The default rule maps to all IPv4 and IPv6 addresses (All-IP:*).
The default rule for TCP traffic, either IPv4 or IPv6, attempts autodiscovery with correct addressing as
the WAN visibility mode.
For details on IPv6 deployment options, see the SteelHead Deployment Guide.
To edit an in-path rule
1. Choose Optimization > Network Services: In-Path Rules to display the In-Path Rules page.
2. Select the rule number in the rule list.
3. Edit the rule.
4. Click Save to save your settings permanently.
After the Management Console has applied your settings, you can verify whether changes have had the
desired effect by reviewing related reports. When you have verified appropriate changes, you can write
the active configuration that is stored in memory to the active configuration file (or you can save it as
any filename you choose). For details, see “Managing configuration files” on page 414.
Related topics
• “In-path rules overview” on page 87
• “Default in-path rules” on page 90
• “Configuring general service settings” on page 108
• “Enabling peering and configuring peering rules” on page 116
• “Configuring port labels” on page 171
• “Configuring HTTP optimization” on page 190
• “Secure inner channel overview” on page 340
• “Viewing current connection reports” on page 496
• “Viewing connection history reports” on page 520
Remove Selected Rules
Select the check box next to the name and click Remove Selected Rules.
Move Selected Rules
Moves the selected rules. Click the arrow next to the desired rule position; the rule moves to the new position.
Control Description

Configuring Optimization Features | 107
7
Configuring Optimization Features
This chapter describes how to enable and configure optimization features. It includes these sections:
• “Configuring general service settings” on page 108
• “Enabling peering and configuring peering rules” on page 116
• “Configuring the RiOS data store” on page 124
• “Improving performance” on page 131
• “Configuring the SaaS Accelerator” on page 135
• “Configuring the Legacy Cloud Accelerator” on page 138
• “Configuring CIFS prepopulation” on page 141
• “Configuring TCP, satellite optimization, and high-speed TCP” on page 148
• “Configuring service ports” on page 163
• “Configuring domain labels” on page 165
• “Configuring host labels” on page 169
• “Configuring port labels” on page 171
• “Configuring CIFS optimization” on page 174
• “Configuring HTTP optimization” on page 190
• “Configuring Oracle Forms optimization” on page 203
• “Configuring MAPI optimization” on page 206
• “Configuring NFS optimization” on page 214
• “Configuring Lotus Notes optimization” on page 218
• “Configuring Citrix optimization” on page 222
• “Configuring FCIP optimization” on page 228
• “Configuring SRDF optimization” on page 232
• “Configuring SnapMirror optimization” on page 238
• “Windows domain authentication” on page 242
108 | Configuring Optimization Features
Configuring general service settings
Configuring general service settings This section describes how to configure general optimization service settings in the Optimization >
Network Services: General Service Settings page. It includes these topics:
• “Enabling basic deployment options” on page 108
• “Enabling failover” on page 108
• “Configuring general service settings” on page 110
Enabling basic deployment options
General Service Settings include controls to enable or disable in-path, out-of-path, failover support, and
to set connection limits and the maximum connection pooling size.
If you have a SteelFusion Edge that contains multiple bypass cards, the Management Console displays
options to enable in-path support for these ports. The number of these interface options depends on
the number of pairs of LAN and WAN ports that you have enabled in your SteelFusion Edge.
The properties and values you set in this page depend on your deployment. For example, these
deployment types would require different choices:
• Physical In-Path - The SteelFusion Edge is physically in the direct path between the client and the server. The clients and servers continue to see client and server IP addresses. Physical in-path configurations are suitable for any location where the total bandwidth is within the limits of the installed SteelFusion Edge.
• Virtual In-Path - The SteelFusion Edge is virtually in the path between the client and the server. This deployment differs from a physical in-path in that a packet redirection mechanism is used to direct packets to SteelFusion Edges that are not in the physical path. Redirection mechanisms include WCCP, Layer-4 switches, and PBR. In this configuration, clients and servers continue to see client and server IP addresses.
• Out-of-Path - The SteelFusion Edge is not in the direct path between the client and the server. Servers see the IP address of the server-side SteelFusion Edge rather than the client IP address, which might impact security policies. An out-of-path configuration is suitable for data center locations where physical in-path or virtual in-path configurations are not possible.
For an overview of in-path and out-of-path deployment options, see the SteelHead Deployment Guide.
Enabling failover
In the event of appliance failure, the SteelFusion Edge enters bypass mode to avoid becoming a single
point of failure in your network. If you want optimization to continue in the event of appliance failure,
you can deploy redundant appliances as failover buddies.
For details about failover redundancy, see the SteelHead Deployment Guide.

Configuring Optimization Features | 109
Configuring general service settings
Physical in-path failover deployment
For a physical in-path failover deployment, you configure a pair of appliances: one as a master and the
other as a backup. The master appliance in the pair (usually the appliance closest to the LAN) is active
and the backup appliance is passive. The master appliance is active unless it fails for some reason. The
backup is passive while the master is active and becomes active if either the master fails or the master
reaches its connection limit and enters admission control status. A backup appliance does not intercept
traffic while the master appliance is active. It pings the master appliance to make sure that it is alive and
processing data. If the master appliance fails, the backup takes over and starts processing all of the
connections. When the master appliance comes back up, it sends a message to the backup that it has
recovered. The backup appliance stops processing new connections (but continues to serve old ones
until they end).
Out-of-path failover deployment
For an out-of-path failover deployment, you deploy two server-side appliances and add a fixed-target
rule to the client-side appliance to define the master and backup target appliances. When both the
master and backup appliances are functioning properly, the connections traverse the master appliance.
If the master appliance fails, subsequent connections traverse the backup appliance.
The master appliance uses an Out-of-Band (OOB) connection. The OOB connection is a single, unique
TCP connection that communicates internal information only; it does not contain optimized data. If the
master appliance becomes unavailable, it loses this OOB connection and the OOB connection times out
in approximately 40 to 45 seconds. After the OOB connection times out, the client-side appliance
declares the master appliance unavailable and connects to the backup appliance.
During the 40 to 45 second delay before the client-side appliance declares a peer unavailable, it passes
through any incoming new connections; they are not blackholed.
While the client-side appliance is using the backup appliance for optimization, it attempts to connect to
the master appliance every 30 seconds. If the connection succeeds, the client-side appliance
reconnects to the master appliance for any new connections. Existing connections remain on the
backup appliance for their duration. This is the only time (immediately after a recovery from a master
failure) that connections are optimized by both the master appliance and the backup.
If both the master and backup appliances become unreachable, the client-side appliance tries to
connect to both appliances every 30 seconds. Any new connections are passed through the network
unoptimized.
Synchronizing master and backup failover pairs
In addition to enabling failover and configuring buddy peering, you must synchronize the RiOS data
stores for the master-backup pairs to ensure optimal use of SDR for warm data transfer. With warm
transfers, only new or modified data is sent, dramatically increasing the rate of data transfer over the
WAN. For information on synchronizing RiOS data stores for master-backup pairs, see “Synchronizing
peer RiOS data stores” on page 127.

110 | Configuring Optimization Features
Configuring general service settings
Configuring general service settings
In the General Service Settings page, you can also modify default settings for the maximum half-opened
connections from a single source IP address and the connection pool size. For details, pay careful
attention to the configuration descriptions included in this procedure.
To configure general optimization service settings
1. Choose Optimization > Network Services: General Service Settings to display the General Service Settings page.
Figure 7-1. General Service Settings page

Configuring Optimization Features | 111
Configuring general service settings
2. Under In-Path Settings, complete the configuration as described in this table.
Control Description
Enable In-Path Support Enables optimization on traffic that is in the direct path of the client, server, and SteelHead.
Reset Existing Client Connections on Start Up
Enables kickoff globally. If you enable kickoff, connections that exist when the optimization service is started and restarted are disconnected. When the connections are retried they’re optimized.
Generally, connections are short-lived and kickoff is not necessary. It is suitable for very challenging remote environments. In a remote branch-office with a T1 and 35-ms round-trip time, you would want connections to migrate to optimization gracefully, rather than risk interruption with kickoff.
RiOS provides a way to reset preexisting connections that match an in-path rule and the rule has kickoff enabled. You can also reset a single pass-through or optimized connection in the Current Connections report, one connection at a time.
Do not enable kickoff for in-path SteelHeads that use autodiscover or if you don’t have a SteelHead on the remote side of the network. If you don’t set any in-path rules the default behavior is to autodiscover all connections. If kickoff is enabled, all connections that existed before the SteelHead started are reset.
Enable L4/PBR/WCCP Interceptor Support
Enables optional, virtual in-path support on all the interfaces for networks that use Layer-4 switches, PBR, WCCP, and SteelHead Interceptor. External traffic redirection is supported only on the first in-path interface. These redirection methods are available:
• Layer-4 Switch - You enable Layer-4 switch support when you have multiple SteelHeads in your network, so that you can manage large bandwidth requirements.
• Policy-Based Routing (PBR) - PBR allows you to define policies to route packets instead of relying on routing protocols. You enable PBR to redirect traffic that you want optimized by a SteelHead that is not in the direct physical path between the client and server.
• Web Cache Communication Protocol (WCCP) - If your network design requires you to use WCCP, a packet redirection mechanism directs packets to RiOS appliances that aren’t in the direct physical path to ensure that they’re optimized.
For details about configuring Layer-4 switch, PBR, and WCCP deployments, see the SteelHead Deployment Guide.
The AWS SteelHead-c doesn’t support L4/PBR/WCCP and Interceptor, but the ESX SteelHead-c supports it.
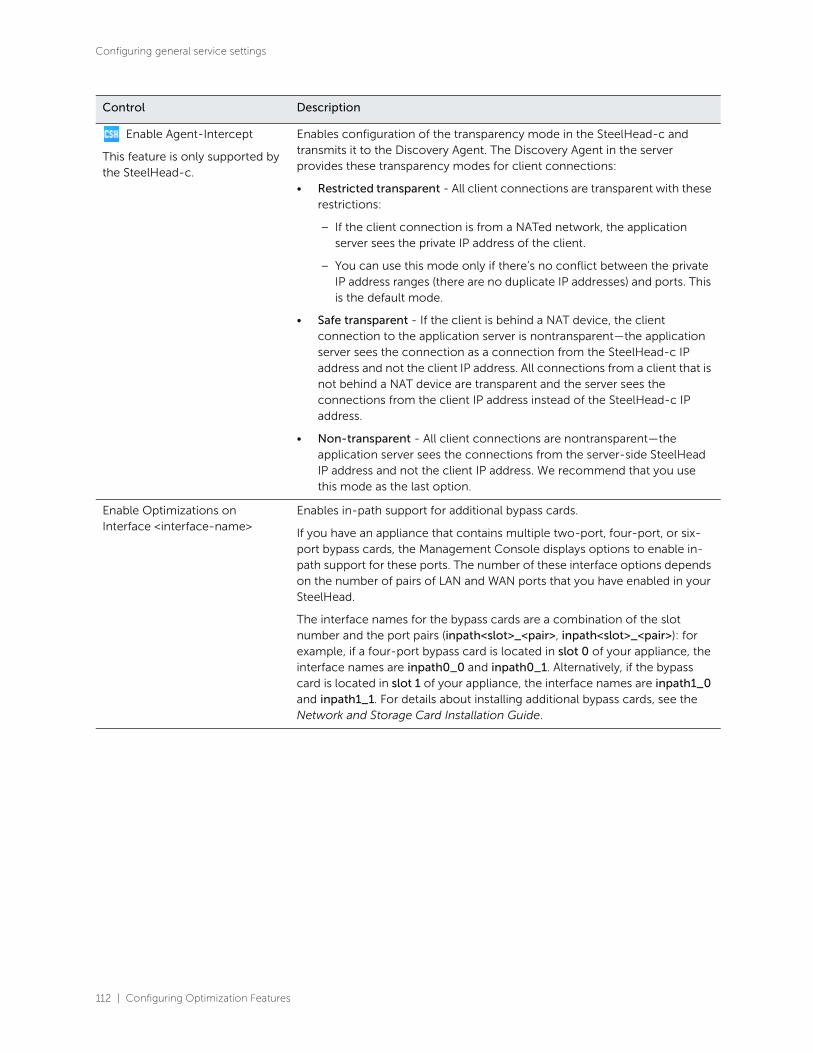
112 | Configuring Optimization Features
Configuring general service settings
Enable Agent-Intercept
This feature is only supported by the SteelHead-c.
Enables configuration of the transparency mode in the SteelHead-c and transmits it to the Discovery Agent. The Discovery Agent in the server provides these transparency modes for client connections:
• Restricted transparent - All client connections are transparent with these restrictions:
– If the client connection is from a NATed network, the application server sees the private IP address of the client.
– You can use this mode only if there’s no conflict between the private IP address ranges (there are no duplicate IP addresses) and ports. This is the default mode.
• Safe transparent - If the client is behind a NAT device, the client connection to the application server is nontransparent—the application server sees the connection as a connection from the SteelHead-c IP address and not the client IP address. All connections from a client that is not behind a NAT device are transparent and the server sees the connections from the client IP address instead of the SteelHead-c IP address.
• Non-transparent - All client connections are nontransparent—the application server sees the connections from the server-side SteelHead IP address and not the client IP address. We recommend that you use this mode as the last option.
Enable Optimizations on Interface <interface-name>
Enables in-path support for additional bypass cards.
If you have an appliance that contains multiple two-port, four-port, or six-port bypass cards, the Management Console displays options to enable in-path support for these ports. The number of these interface options depends on the number of pairs of LAN and WAN ports that you have enabled in your SteelHead.
The interface names for the bypass cards are a combination of the slot number and the port pairs (inpath<slot>_<pair>, inpath<slot>_<pair>): for example, if a four-port bypass card is located in slot 0 of your appliance, the interface names are inpath0_0 and inpath0_1. Alternatively, if the bypass card is located in slot 1 of your appliance, the interface names are inpath1_0 and inpath1_1. For details about installing additional bypass cards, see the Network and Storage Card Installation Guide.
Control Description
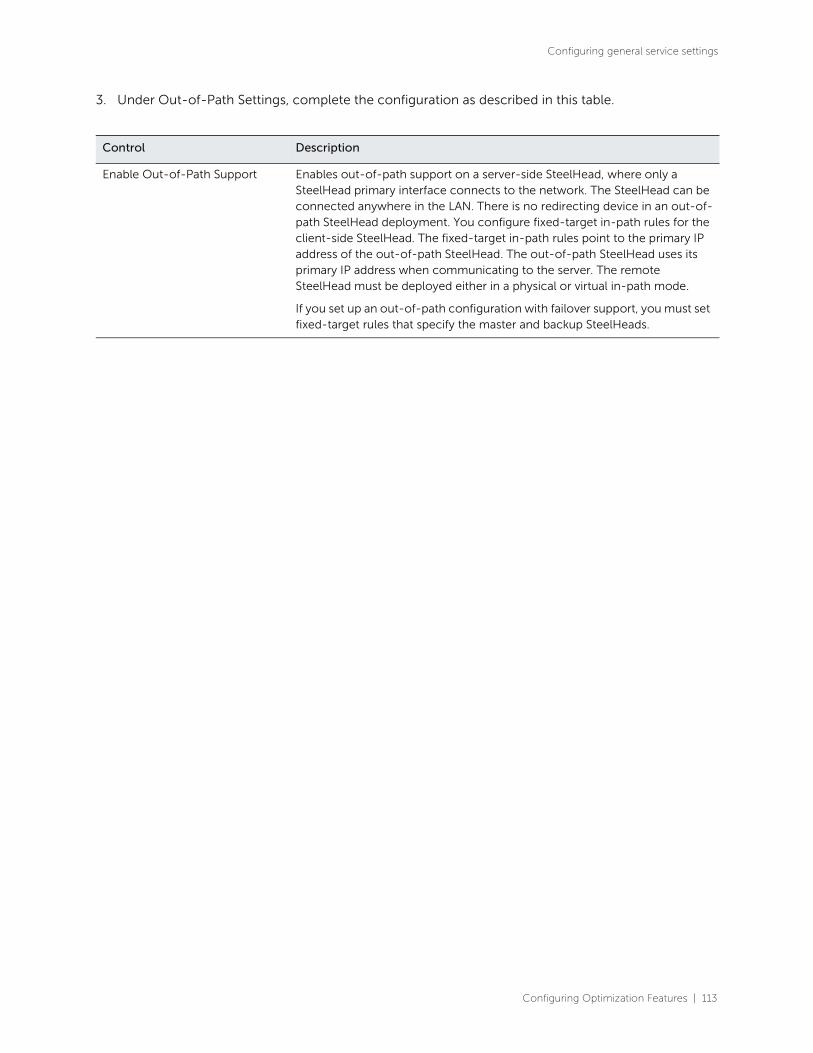
Configuring Optimization Features | 113
Configuring general service settings
3. Under Out-of-Path Settings, complete the configuration as described in this table.
Control Description
Enable Out-of-Path Support Enables out-of-path support on a server-side SteelHead, where only a SteelHead primary interface connects to the network. The SteelHead can be connected anywhere in the LAN. There is no redirecting device in an out-of-path SteelHead deployment. You configure fixed-target in-path rules for the client-side SteelHead. The fixed-target in-path rules point to the primary IP address of the out-of-path SteelHead. The out-of-path SteelHead uses its primary IP address when communicating to the server. The remote SteelHead must be deployed either in a physical or virtual in-path mode.
If you set up an out-of-path configuration with failover support, you must set fixed-target rules that specify the master and backup SteelHeads.

114 | Configuring Optimization Features
Configuring general service settings
4. Under Connection Settings, complete the configuration as described in this table.
Control Description
Half-Open Connection Limit per Source IP
Restricts half-opened connections on a source IP address initiating connections (that is, the client machine).
Set this feature to block a source IP address that is opening multiple connections to invalid hosts or ports simultaneously (for example, a virus or a port scanner).
This feature doesn’t prevent a source IP address from connecting to valid hosts at a normal rate. Thus, a source IP address could have more established connections than the limit.
The default value is 4096.
The appliance counts the number of half-opened connections for a source IP address (connections that check if a server connection can be established before accepting the client connection). If the count is above the limit, new connections from the source IP address are passed through unoptimized.
Note: If you have a client connecting to valid hosts or ports at a very high rate, some of its connections might be passed through even though all of the connections are valid.
Maximum Connection Pool Size Specify the maximum number of TCP connections in a connection pool.
Connection pooling enhances network performance by reusing active connections instead of creating a new connection for every request. Connection pooling is useful for protocols that create a large number of short-lived TCP connections, such as HTTP.
To optimize such protocols, a connection pool manager maintains a pool of idle TCP connections, up to the maximum pool size. When a client requests a new connection to a previously visited server, the pool manager checks the pool for unused connections and returns one if available. Thus, the client and the SteelHead don’t have to wait for a three-way TCP handshake to finish across the WAN. If all connections currently in the pool are busy and the maximum pool size has not been reached, the new connection is created and added to the pool. When the pool reaches its maximum size, all new connection requests are queued until a connection in the pool becomes available or the connection attempt times out.
The default value is 20. A value of 0 specifies no connection pool.
Note: You must restart the SteelHead after changing this setting.
Note: Viewing the Connection Pooling report can help determine whether to modify the default setting. If the report indicates an unacceptably low ratio of pool hits per total connection requests, increase the pool size.
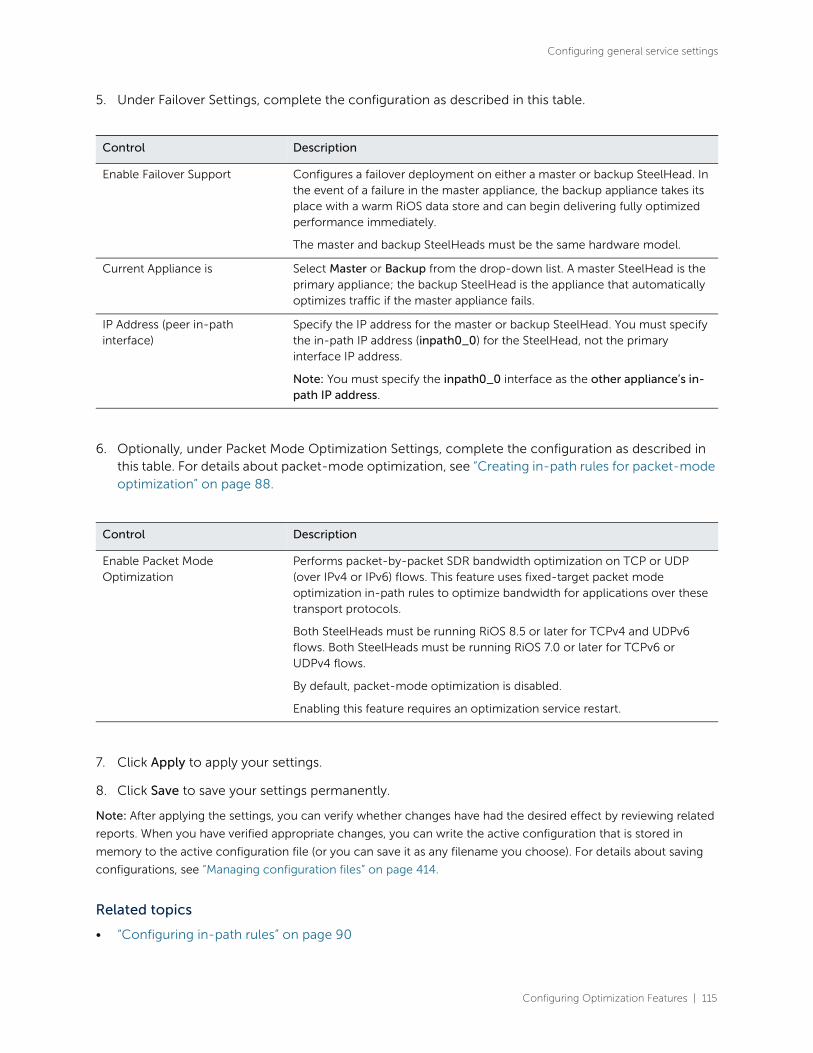
Configuring Optimization Features | 115
Configuring general service settings
5. Under Failover Settings, complete the configuration as described in this table.
6. Optionally, under Packet Mode Optimization Settings, complete the configuration as described in this table. For details about packet-mode optimization, see “Creating in-path rules for packet-mode optimization” on page 88.
7. Click Apply to apply your settings.
8. Click Save to save your settings permanently.
Note: After applying the settings, you can verify whether changes have had the desired effect by reviewing related
reports. When you have verified appropriate changes, you can write the active configuration that is stored in
memory to the active configuration file (or you can save it as any filename you choose). For details about saving
configurations, see “Managing configuration files” on page 414.
Related topics
• “Configuring in-path rules” on page 90
Control Description
Enable Failover Support Configures a failover deployment on either a master or backup SteelHead. In the event of a failure in the master appliance, the backup appliance takes its place with a warm RiOS data store and can begin delivering fully optimized performance immediately.
The master and backup SteelHeads must be the same hardware model.
Current Appliance is Select Master or Backup from the drop-down list. A master SteelHead is the primary appliance; the backup SteelHead is the appliance that automatically optimizes traffic if the master appliance fails.
IP Address (peer in-path interface)
Specify the IP address for the master or backup SteelHead. You must specify the in-path IP address (inpath0_0) for the SteelHead, not the primary interface IP address.
Note: You must specify the inpath0_0 interface as the other appliance’s in-path IP address.
Control Description
Enable Packet Mode Optimization
Performs packet-by-packet SDR bandwidth optimization on TCP or UDP (over IPv4 or IPv6) flows. This feature uses fixed-target packet mode optimization in-path rules to optimize bandwidth for applications over these transport protocols.
Both SteelHeads must be running RiOS 8.5 or later for TCPv4 and UDPv6 flows. Both SteelHeads must be running RiOS 7.0 or later for TCPv6 or UDPv4 flows.
By default, packet-mode optimization is disabled.
Enabling this feature requires an optimization service restart.

116 | Configuring Optimization Features
Enabling peering and configuring peering rules
• “Modifying general host settings” on page 53
• “Enabling peering and configuring peering rules” on page 116
• “Configuring the RiOS data store” on page 124
• “Configuring service ports” on page 163
• “Modifying in-path interfaces” on page 66
• “Configuring connection forwarding features” on page 366
• “Configuring subnet side rules” on page 373
Enabling peering and configuring peering rulesThis section describes how to enable peering and configure peering rules. It includes these topics:
• “About regular and enhanced automatic discovery” on page 116
• “Configuring peering” on page 118
About regular and enhanced automatic discovery
With enhanced automatic discovery, the Edge automatically finds the furthest appliance peer in a
network and optimization occurs there. By default, enhanced autodiscovery is enabled. When enhanced
autodiscovery is disabled, the Edge uses regular autodiscovery. With regular autodiscovery, the Edge
finds the next appliance in the group and optimization occurs there.
In some deployments, enhanced autodiscovery can simplify configuration and make your deployments
more scalable. When enhanced autodiscovery is enabled, the Edge automatically finds the furthest
appliance in a network and optimization occurs there. For example, if you had a deployment with four
appliances (A, B, C, D), where D represents the appliance that is furthest from A, the Edge automatically
finds D. This feature simplifies configuration and makes your deployment more scalable.
The SteelHead (in the cloud) (SteelHead-c) does not use automatic peering. When you run a server
in the cloud, you deploy the SteelHead-c to be the furthest SteelHead in the network because the
Discovery Client on the server is configured to use the SteelHead-c automatically. When you run a client
in the cloud, and there are multiple SteelHeads in the path to the server, the SteelHead-c is selected for
optimization first. You can enable automatic peering on the remote SteelHeads to make the SteelHead-
c peer with the furthest SteelHead in the network.

Configuring Optimization Features | 117
Enabling peering and configuring peering rules
We recommend enhanced autodiscovery for the deployments described in this table.
For details about these deployment types, see the SteelHead Deployment Guide.
Extending the number of peers
RiOS supports a large number of peers (up to 20,000) per appliance. We recommend enabling the
extended peer table if you have more than 4,000 peers. After enabling extended peer table support, you
must clear the RiOS data store and stop and restart the service. See “Configuring peering” on page 118.
Deployment type Description
Serial Cascade Deployments Cascade configurations enable optimal multisite deployments where connections between the client and the server might pass through intermediate appliances to reach their final destination.
Enhanced autodiscovery for cascading appliances detects when more than two appliances are present between the client and the server and automatically chooses the two outside appliances, optimizing all traffic in between.
Serial Cluster Deployments You can provide increased optimization by deploying two or more appliances back-to-back in an in-path configuration to create a serial cluster.
Appliances in a serial cluster process the peering rules you specify in a spill-over fashion. When the maximum number of TCP connections for a SteelFusion Edge is reached, that appliance stops intercepting new connections. This behavior allows the next appliance in the cluster the opportunity to intercept the new connection, if it has not reached its maximum number of connections. The in-path peering rules and in-path rules tell the appliance in a cluster not to intercept connections between themselves.
You configure peering rules that define what to do when a SteelFusion Edge receives an autodiscovery probe from another appliance.
You can deploy serial clusters on the client-side or server-side of the network.
Note: For environments that want to optimize MAPI or FTP traffic that require all connections from a client to be optimized by one appliance, we strongly recommend using the master and backup redundancy configuration instead of a serial cluster. For larger environments that require multiappliance scalability and high availability, we recommend using the Interceptor to build multiappliance clusters. For details, see the SteelHead Interceptor Deployment Guide and the SteelHead Interceptor User Guide.
Note: A serial cluster has the same bandwidth specification as the SteelFusion Edge model deployed in the cluster. The bandwidth capability does not increase because the cluster contains multiple appliances.
Note: If the active Edge in the cluster enters a degraded state because the CPU load is too high, it continues to accept new connections.

118 | Configuring Optimization Features
Enabling peering and configuring peering rules
Configuring peering
You display, add, and modify autodiscovery peering settings in the Optimization > Network Services:
Peering Rules page. You can also enable extended peer table support.
To enable enhanced autodiscovery
1. Choose Optimization > Network Services: Peering Rules to display the Peering Rules page.
Figure 7-2. Peering Rules page
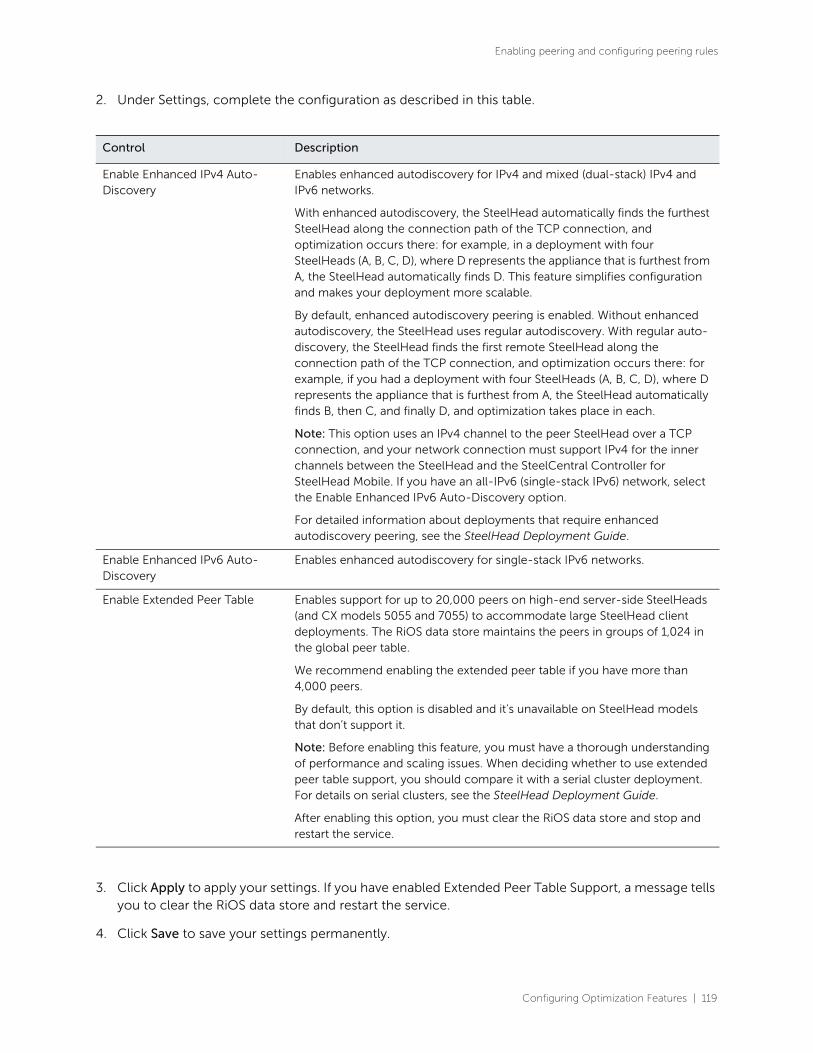
Configuring Optimization Features | 119
Enabling peering and configuring peering rules
2. Under Settings, complete the configuration as described in this table.
3. Click Apply to apply your settings. If you have enabled Extended Peer Table Support, a message tells you to clear the RiOS data store and restart the service.
4. Click Save to save your settings permanently.
Control Description
Enable Enhanced IPv4 Auto-Discovery
Enables enhanced autodiscovery for IPv4 and mixed (dual-stack) IPv4 and IPv6 networks.
With enhanced autodiscovery, the SteelHead automatically finds the furthest SteelHead along the connection path of the TCP connection, and optimization occurs there: for example, in a deployment with four SteelHeads (A, B, C, D), where D represents the appliance that is furthest from A, the SteelHead automatically finds D. This feature simplifies configuration and makes your deployment more scalable.
By default, enhanced autodiscovery peering is enabled. Without enhanced autodiscovery, the SteelHead uses regular autodiscovery. With regular auto-discovery, the SteelHead finds the first remote SteelHead along the connection path of the TCP connection, and optimization occurs there: for example, if you had a deployment with four SteelHeads (A, B, C, D), where D represents the appliance that is furthest from A, the SteelHead automatically finds B, then C, and finally D, and optimization takes place in each.
Note: This option uses an IPv4 channel to the peer SteelHead over a TCP connection, and your network connection must support IPv4 for the inner channels between the SteelHead and the SteelCentral Controller for SteelHead Mobile. If you have an all-IPv6 (single-stack IPv6) network, select the Enable Enhanced IPv6 Auto-Discovery option.
For detailed information about deployments that require enhanced autodiscovery peering, see the SteelHead Deployment Guide.
Enable Enhanced IPv6 Auto-Discovery
Enables enhanced autodiscovery for single-stack IPv6 networks.
Enable Extended Peer Table Enables support for up to 20,000 peers on high-end server-side SteelHeads (and CX models 5055 and 7055) to accommodate large SteelHead client deployments. The RiOS data store maintains the peers in groups of 1,024 in the global peer table.
We recommend enabling the extended peer table if you have more than 4,000 peers.
By default, this option is disabled and it’s unavailable on SteelHead models that don’t support it.
Note: Before enabling this feature, you must have a thorough understanding of performance and scaling issues. When deciding whether to use extended peer table support, you should compare it with a serial cluster deployment. For details on serial clusters, see the SteelHead Deployment Guide.
After enabling this option, you must clear the RiOS data store and stop and restart the service.

120 | Configuring Optimization Features
Enabling peering and configuring peering rules
Peering rules
Peering rules control SteelFusion Edge behavior when it sees probe queries.
Peering rules are an ordered list of fields a SteelFusion Edge uses to match with incoming SYN packet
fields (for example, source or destination subnet, IP address, VLAN, or TCP port) as well as the IP address
of the probing appliance. This feature is especially useful in complex networks.
Peering rules list
The Peering Rules page displays a list of peering rules. The list contains the default peering rules and any
peering rules you add.
The system evaluates the rules in numerical order starting with rule 1. If the conditions set in the rule
match, then the rule is applied. If the conditions set in the rule do not match, then the rule is not applied
and the system moves on to the next rule. For example, if the conditions of rule 1 do not match, rule 2
is consulted. If rule 2 matches the conditions, it is applied, and no further rules are consulted.
The Rule Type of a matching rule determines which action the SteelFusion Edge takes on the
connection.
Figure 7-3. Default peering rules
About the default peering rules
The default peering rules are adequate for typical network configurations, such as in-path
configurations. However, you might need to add peering rules for complex network configurations. For
details about deployment cases requiring peering rules, see the SteelHead Deployment Guide.
Note: We recommend using in-path rules to optimize SSL connections on destination ports other than the default
port 443. For details, see “Configuring in-path rules” on page 90.
• The default peering rule number 1 with the SSL incapable flag matches any SSL connection whose IP address and destination port appear in the list of bypassed clients and servers in the Networking > SSL: SSL Main Settings page. The bypassed list includes the IP addresses and port numbers of SSL servers that the Edge is bypassing because it could not match the common name of the server’s certificate with one in its certificate pool. The list also includes servers and clients whose IP address and port combination have experienced an SSL handshake failure. For example, a handshake failure occurs when the Edge cannot find the issuer of a server certificate on its list of trusted certificate authorities.
After a server or client appears in the bypassed servers list, follow-on connections to the same destination IP and port number always match rule number 1.
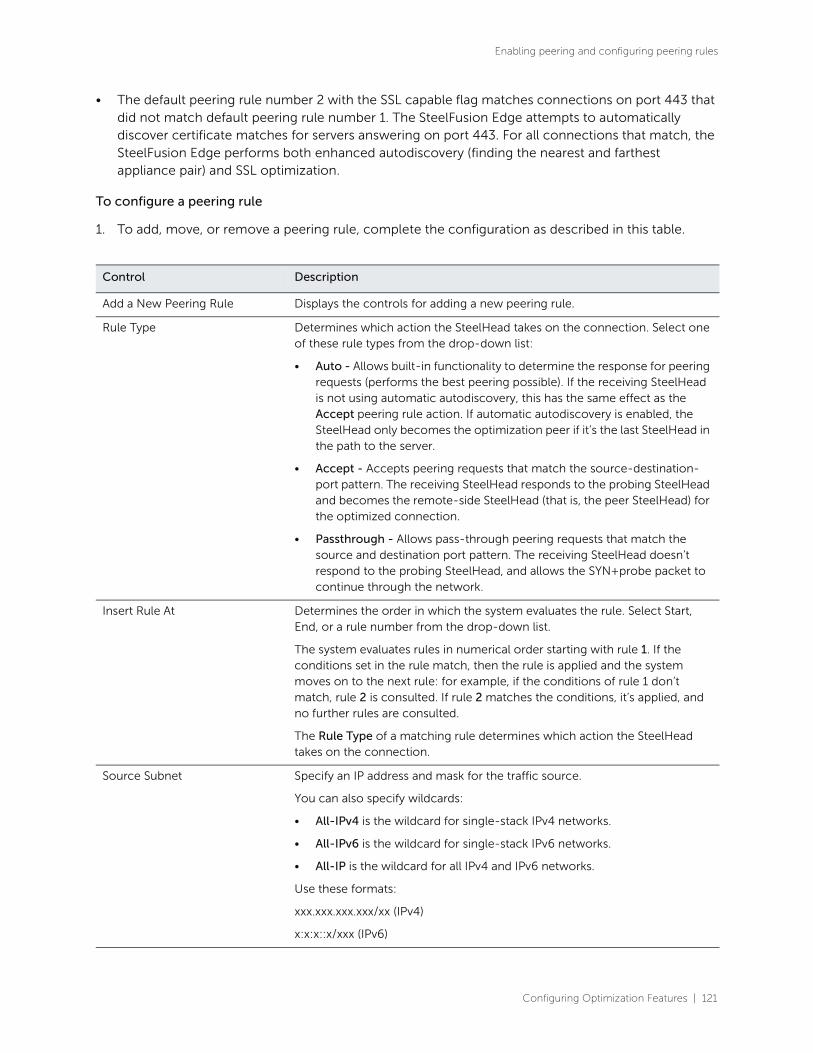
Configuring Optimization Features | 121
Enabling peering and configuring peering rules
• The default peering rule number 2 with the SSL capable flag matches connections on port 443 that did not match default peering rule number 1. The SteelFusion Edge attempts to automatically discover certificate matches for servers answering on port 443. For all connections that match, the SteelFusion Edge performs both enhanced autodiscovery (finding the nearest and farthest appliance pair) and SSL optimization.
To configure a peering rule
1. To add, move, or remove a peering rule, complete the configuration as described in this table.
Control Description
Add a New Peering Rule Displays the controls for adding a new peering rule.
Rule Type Determines which action the SteelHead takes on the connection. Select one of these rule types from the drop-down list:
• Auto - Allows built-in functionality to determine the response for peering requests (performs the best peering possible). If the receiving SteelHead is not using automatic autodiscovery, this has the same effect as the Accept peering rule action. If automatic autodiscovery is enabled, the SteelHead only becomes the optimization peer if it’s the last SteelHead in the path to the server.
• Accept - Accepts peering requests that match the source-destination-port pattern. The receiving SteelHead responds to the probing SteelHead and becomes the remote-side SteelHead (that is, the peer SteelHead) for the optimized connection.
• Passthrough - Allows pass-through peering requests that match the source and destination port pattern. The receiving SteelHead doesn’t respond to the probing SteelHead, and allows the SYN+probe packet to continue through the network.
Insert Rule At Determines the order in which the system evaluates the rule. Select Start, End, or a rule number from the drop-down list.
The system evaluates rules in numerical order starting with rule 1. If the conditions set in the rule match, then the rule is applied and the system moves on to the next rule: for example, if the conditions of rule 1 don’t match, rule 2 is consulted. If rule 2 matches the conditions, it’s applied, and no further rules are consulted.
The Rule Type of a matching rule determines which action the SteelHead takes on the connection.
Source Subnet Specify an IP address and mask for the traffic source.
You can also specify wildcards:
• All-IPv4 is the wildcard for single-stack IPv4 networks.
• All-IPv6 is the wildcard for single-stack IPv6 networks.
• All-IP is the wildcard for all IPv4 and IPv6 networks.
Use these formats:
xxx.xxx.xxx.xxx/xx (IPv4)
x:x:x::x/xxx (IPv6)

122 | Configuring Optimization Features
Enabling peering and configuring peering rules
Destination Subnet Specify an IP address and mask pattern for the traffic destination.
You can also specify wildcards:
• All-IPv4 is the wildcard for single-stack IPv4 networks.
• All-IPv6 is the wildcard for single-stack IPv6 networks.
• All-IP is the wildcard for all IPv4 and IPv6 networks.
Use these formats:
xxx.xxx.xxx.xxx/xx (IPv4)
x:x:x::x/xxx (IPv6)
Port - Specify the destination port number, port label, or all.
Peer IP Address Specify the in-path IP address of the probing SteelHead. If more than one in-path interface is present on the probing SteelHead, apply multiple peering rules, one for each in-path interface.
You can also specify wildcards:
• All-IPv4 is the wildcard for single-stack IPv4 networks.
• All-IPv6 is the wildcard for single-stack IPv6 networks.
• All-IP is the wildcard for all IPv4 and IPv6 networks.
SSL Capability Enables an SSL capability flag, which specifies criteria for matching an incoming connection with one of the rules in the peering rules table. This flag is typically set on a server-side SteelHead.
Select one of these options from the drop-down list to determine how to process attempts to create secure SSL connections:
• No Check - The peering rule doesn’t determine whether the server SteelHead is present for the particular destination IP address and port combination.
• Capable - The peering rule determines that the connection is SSL-capable if the destination port is 443 (irrespective of the destination port value on the rule), and the destination IP and port don’t appear on the bypassed servers list. The SteelHead accepts the condition and, assuming all other proper configurations and that the peering rule is the best match for the incoming connection, optimizes SSL.
• Incapable - The peering rule determines that the connection is SSL-incapable if the destination IP and port appear in the bypassed servers list. The service adds a server to the bypassed servers list when there’s no SSL certificate for the server or for any other SSL handshake failure. The SteelHead passes the connection through unoptimized without affecting connection counts.
We recommend that you use in-path rules to optimize SSL connections on non-443 destination port configurations.
Control Description
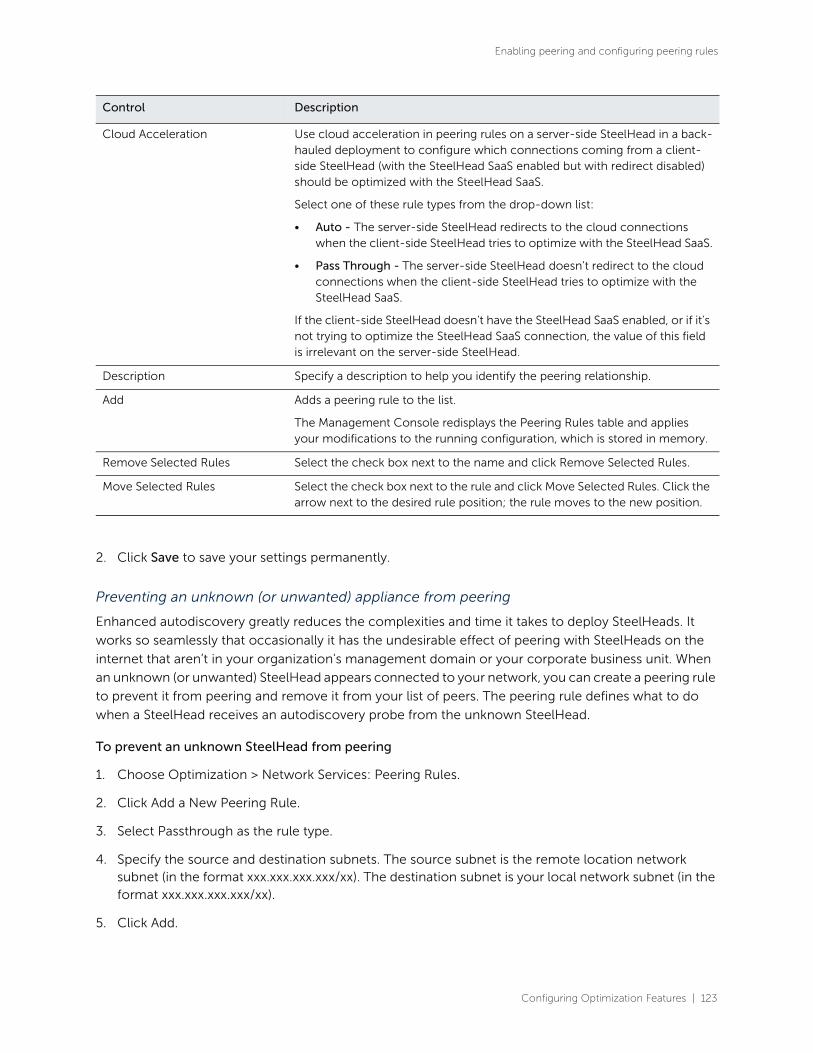
Configuring Optimization Features | 123
Enabling peering and configuring peering rules
2. Click Save to save your settings permanently.
Preventing an unknown (or unwanted) appliance from peering
Enhanced autodiscovery greatly reduces the complexities and time it takes to deploy SteelHeads. It
works so seamlessly that occasionally it has the undesirable effect of peering with SteelHeads on the
internet that aren’t in your organization's management domain or your corporate business unit. When
an unknown (or unwanted) SteelHead appears connected to your network, you can create a peering rule
to prevent it from peering and remove it from your list of peers. The peering rule defines what to do
when a SteelHead receives an autodiscovery probe from the unknown SteelHead.
To prevent an unknown SteelHead from peering
1. Choose Optimization > Network Services: Peering Rules.
2. Click Add a New Peering Rule.
3. Select Passthrough as the rule type.
4. Specify the source and destination subnets. The source subnet is the remote location network subnet (in the format xxx.xxx.xxx.xxx/xx). The destination subnet is your local network subnet (in the format xxx.xxx.xxx.xxx/xx).
5. Click Add.
Cloud Acceleration Use cloud acceleration in peering rules on a server-side SteelHead in a back-hauled deployment to configure which connections coming from a client-side SteelHead (with the SteelHead SaaS enabled but with redirect disabled) should be optimized with the SteelHead SaaS.
Select one of these rule types from the drop-down list:
• Auto - The server-side SteelHead redirects to the cloud connections when the client-side SteelHead tries to optimize with the SteelHead SaaS.
• Pass Through - The server-side SteelHead doesn’t redirect to the cloud connections when the client-side SteelHead tries to optimize with the SteelHead SaaS.
If the client-side SteelHead doesn’t have the SteelHead SaaS enabled, or if it’s not trying to optimize the SteelHead SaaS connection, the value of this field is irrelevant on the server-side SteelHead.
Description Specify a description to help you identify the peering relationship.
Add Adds a peering rule to the list.
The Management Console redisplays the Peering Rules table and applies your modifications to the running configuration, which is stored in memory.
Remove Selected Rules Select the check box next to the name and click Remove Selected Rules.
Move Selected Rules Select the check box next to the rule and click Move Selected Rules. Click the arrow next to the desired rule position; the rule moves to the new position.
Control Description

124 | Configuring Optimization Features
Configuring the RiOS data store
The peering rule passes through traffic from the unknown SteelHead in the remote location.
When you use this method and add a new remote location in the future, you must create a new peering rule that accepts traffic from the remote location. Place this new Accept rule before the Pass-through rule.
If you don’t know the network subnet for the remote location, there’s another option: you can create a peering rule that allows peering from your corporate network subnet and denies it otherwise. For example, create a peering rule that accepts peering from your corporate network subnet and place it as the first rule in the list.
6. Create a second peering rule to pass through all other traffic.
When the local SteelHead receives an autodiscovery probe, it checks the peering rules first (from top to bottom). If it matches the first Accept rule, the local SteelHead peers with the other SteelHead. If it doesn’t match the first Accept rule, the local SteelHead checks the next peering rule, which is the pass-through rule for all other traffic. In this case, the local SteelHead just passes through the traffic, but it doesn’t peer with the other SteelHead.
After you add the peering rule, the unknown SteelHead appears in the Current Connections report as a
Connected Appliance until the connection times out. After the connection becomes inactive, it appears
dimmed. To remove the unknown appliance completely, restart the optimization service.
Related topics
• “Configuring in-path rules” on page 90
• “Configuring general service settings” on page 108
• “Configuring port labels” on page 171
• “Secure inner channel overview” on page 340
• “Viewing current connection reports” on page 496
Configuring the RiOS data storeThis section describes how to configure RiOS data store settings. It includes these topics:
• “Encrypting the RiOS data store” on page 125
• “Synchronizing peer RiOS data stores” on page 127
• “Clearing the RiOS data store” on page 128
• “Improving SteelHead Mobile performance” on page 129
• “Receiving a notification when the RiOS data store wraps” on page 130
You display and modify RiOS data store settings in the Optimization > Data Replication: Data Store page.
This page is typically used to enable RiOS data store encryption and synchronization.

Configuring Optimization Features | 125
Configuring the RiOS data store
RiOS appliances transparently intercept and analyze all of your WAN traffic. TCP traffic is segmented,
indexed, and stored as segments of data, and the references representing that data are stored on the
RiOS data store within appliances on both sides of your WAN. After the data has been indexed, it is
compared to data already on the disk. Segments of data that have been seen before are not transferred
across the WAN again; instead a reference is sent in its place that can index arbitrarily large amounts of
data, thereby massively reducing the amount of data that needs to be transmitted. One small reference
can refer to megabytes of existing data that has been transferred over the WAN before.
Encrypting the RiOS data store
You enable RiOS data store encryption in the Optimization > Data Replication: Data Store page.
Encrypting the RiOS data store significantly limits the exposure of sensitive data in the event an appliance
is compromised by loss, theft, or a security violation. The secure data is difficult for a third party to
retrieve.
Before you encrypt the RiOS data store, you must unlock the secure vault. The secure vault stores the
encryption key. For details, see “Unlocking the secure vault” on page 434..
Note: Encrypting the RiOS data store and enabling SSL optimization provides maximum security. For details, see
“Configuring SSL server certificates and certificate authorities” on page 319.
Note: RiOS does not encrypt data store synchronization traffic.
Encryption strengths
Encrypting the RiOS data store can have performance implications; generally, higher security means less
performance. Several encryption strengths are available to provide the right amount of security while
maintaining the desired performance level. When selecting an encryption type, you must evaluate the
network structure, the type of data that travels over it, and how much of a performance trade-off is
worth the extra security.
Encrypted RiOS data store downgrade limitations
RiOS appliances cannot use an encrypted RiOS data store with an earlier RiOS version, unless the release
is an update (9.0.x). For example, an encrypted RiOS data store created in 9.0.1 would work with 9.0.3,
but not with 9.5.
Before downgrading to an earlier software version, you must select none as the encryption type, clear
the RiOS data store, and restart the service. After you clear the RiOS data store, the data is removed from
persistent storage and cannot be recovered. If you are using the server-based backups feature on
SteelFusion Core, you must delete all backup policies and clear snapshots on the storage array before
downgrading. For details, see the SteelFusion Core User Guide.
If you return to a previous software version and there is a mismatch with the encrypted RiOS data store,
the status bar indicates that the RiOS data store is corrupt. You can either:
• Use the backup software version after clearing the RiOS data store and rebooting the service.
—or—

126 | Configuring Optimization Features
Configuring the RiOS data store
• Return to the software version in use when the RiOS data store was encrypted, and continue using it.
To encrypt the RiOS data store
1. Choose Optimization > Data Replication: Data Store to display the Data Store page.
Figure 7-4. Data Store page
Under General Settings, complete the configuration as described in this table.
Click Apply to apply your settings.
2. Click Save to save your settings permanently.
3. Select Clear Data Store on Reboot and reboot the appliance as described in “Rebooting and shutting down” on page 408.
Note: You must clear the RiOS data store and reboot the optimization service on the appliance after enabling,
changing, or disabling the encryption type. After you clear the RiOS data store, the data cannot be recovered. If you
do not want to clear the RiOS data store, reselect your previous encryption type and reboot the service. The
appliance uses the previous encryption type and encrypted RiOS data store. For details, see “Rebooting and shutting
down” on page 408.
Control Description
Data Store Encryption Type Select one of these encryption types from the drop-down list. The encryption types are listed from the least to the most secure.
• None - Disables data encryption.
• AES_128 - Encrypts data using the AES cryptographic key length of 128 bits.
• AES_192 - Encrypts data using the AES cryptographic key length of 192 bits.
• AES_256 - Encrypts data using the AES cryptographic key length of 256 bits.

Configuring Optimization Features | 127
Configuring the RiOS data store
Synchronizing peer RiOS data stores
For deployments requiring the highest levels of redundancy and performance, RiOS supports warm
standby between designated master and backup devices. RiOS data store synchronization enables pairs
of local appliances to synchronize their data stores with each other, even while they are optimizing
connections. RiOS data store synchronization is typically used to ensure that if an appliance fails, no loss
of potential bandwidth savings occurs, because the data segments and references are on the other
appliances.
You can use RiOS data store synchronization for physical in-path, virtual in-path, or out-of-path
deployments. You enable synchronization on two appliances, one as the synchronization master, and
the other as the synchronization backup.
The traffic for RiOS data store synchronization is transferred through either the appliance primary or
auxiliary network interfaces, not the in-path interfaces.
RiOS data store synchronization is a bidirectional operation between two appliances, regardless of
which deployment model you use. The Edge master and backup designation is only relevant in the initial
configuration, when the master appliance RiOS data store essentially overwrites the backup appliance
RiOS data store.
RiOS data store synchronization requirements
The synchronization master and its backup:
• must have the same appliance model.
• must be running the same version of RiOS.
• do not have to be in the same physical location. If they are in different physical locations, they must be connected via a fast, reliable LAN connection with minimal latency.
When you have configured the master and backup appliances, you must restart the optimization service
on the backup appliance. The master restarts automatically.
After you have enabled and configured synchronization, the RiOS data stores are actively kept
synchronized. For details about how synchronized appliances replicate data and how RiOS data store
synchronization is commonly used in high-availability designs, see the SteelHead Deployment Guide.
Note: If one of the synchronized appliances is under high load, some data might not be copied. For details, see the
SteelHead Deployment Guide.
Note: If RiOS data store synchronization is interrupted for any reason (such as a network interruption or if one of the
appliances is taken out of service), the appliances continue other operations without disruption. When the
interruption is resolved, RiOS data store synchronization resumes without risk of data corruption.
To synchronize the RiOS data store
1. Choose one appliance to be the master and one to be the backup. The backup has its RiOS data store overwritten by the master RiOS data store.
2. Make sure there is a network connection between the two appliances.
3. Connect to the Management Console on the appliance you have chosen to be the master appliance.

128 | Configuring Optimization Features
Configuring the RiOS data store
4. Choose Optimization > Data Replication: Data Store to display the Data Store page.
5. Under General Settings, complete the configuration as described in this table.
6. Click Apply to apply your settings.
7. Click Save to save your settings permanently.
8. Choose Administration > Maintenance: Services to display the Services page.
9. Select Clear the Data Store and click Restart to restart the service on the Edge.
Note: When redeploying a synchronized pair, you must clear the RiOS data store. For details, see “Clearing the RiOS
data store” on page 128.
Clearing the RiOS data store
The appliance continues to write data references to the RiOS data store until it reaches capacity. In
certain situations, you must clear the RiOS data store. For example, you must clear the RiOS data store:
• after enabling or disabling encryption, or changing the encryption type.
• before downgrading to an earlier software version.
• to redeploy an active-active synchronization pair.
• after testing or evaluating the appliance.
• after receiving a “data store corruption” or “data store clean required” alarm message.
For details about clearing the RiOS data store, see “Rebooting and shutting down” on page 408.
Note: After clearing the RiOS data store and restarting the optimization service or rebooting the appliance, the data
transfers are cold. Performance improves with subsequent warm data transfers over the WAN.
Control Description
Enable Automated Data Store Synchronization
Enables automated RiOS data store synchronization. Data store synchronization ensures that each RiOS data store in your network has warm data for maximum optimization.
All operations occur in the background and don’t disrupt operations on any of the systems.
Current Appliance Select Master or Backup from the drop-down list.
Peer IP Address Specify the IP address for the peer appliance. You must specify either the IP address for the primary or auxiliary interface (if you use the auxiliary interface in place of the primary).
Synchronization Port Specify the destination TCP port number used when establishing a connection to synchronize data. The default value is 7744.
Reconnection Interval Specify the number of seconds to wait for reconnection attempts. The default value is 30.

Configuring Optimization Features | 129
Configuring the RiOS data store
Improving SteelHead Mobile performance
You enable branch warming for SteelHead Mobiles in the Optimization > Data Replication: Data Store
page. By default, branch warming is enabled.
Branch warming keeps track of data segments created while a SteelCentral Controller for SteelHead
Mobile user is in a SteelFusion Edge-enabled branch office and sends the new data back to the
SteelCentral Controller for SteelHead Mobile user’s laptop. When the user leaves the branch office, the
SteelCentral Controller for SteelHead Mobile client provides warm performance.
Branch warming cooperates with and optimizes transfers for a server-side appliance. New data transfers
between the client and server are populated in the SteelCentral Controller for SteelHead Mobile RiOS
data store, the branch appliance RiOS data store, and the server-side appliance RiOS data store.
When the server downloads data, the server-side appliance checks if either the SteelHead Mobile or the
branch appliance has the data in their RiOS data store. If either device already has the data segments, the
server-side appliance sends only references to the data. The SteelHead Mobile and the branch appliance
communicate with each other to resolve the references.
Other clients at a branch office benefit from branch warming as well, because data transferred by one
client at a branch also populates the branch appliance RiOS data store. Performance improves with all
clients at the branch because they receive warm performance for that data. For details, see the
SteelHead Deployment Guide.
Requirements
These requirements must be met for branch warming to work:
• Enable latency-based location awareness and branch warming on the SteelCentral Controller for SteelHead Mobile.
• Enable branch warming on both the client-side and server-side appliances.
• Both the client-side and server-side appliances must be deployed in-path.
• Enable enhanced autodiscovery on both the client-side and server-side appliances.
• The Mobile Controller appliance must be running RiOS 3.0 or later.
• The SteelHeads must be running RiOS 9.0 or later.
• The SteelHead Mobile must be running RiOS 3.0 or later.
Branch warming does not improve performance for configurations using:
• SSL connections
• Out-of-path with fixed-target rules
• SteelHead Mobiles that communicate with multiple server-side appliances in different scenarios. For example, if a SteelHead Mobile home user peers with one server-side appliance after logging in through a VPN network and peers with a different server-side appliance after logging in from the branch office, branch warming does not improve performance.

130 | Configuring Optimization Features
Configuring the RiOS data store
To enable branch warming
1. On both the client-side and the server-side appliances, choose Optimization > Data Replication: Data Store to display the Data Store page.
Figure 7-5. Data Store page
2. Under General Settings, select Enable Branch Warming for SteelHead Mobile Clients.
3. Click Apply to apply your settings.
4. Click Save to save your settings permanently.
5. You must restart the optimization service. For details, see “Starting and stopping the optimization service” on page 403.
Receiving a notification when the RiOS data store wraps
You enable RiOS data store wrap notifications in the Optimization > Data Replication: Data Store page.
By default, data store wrap notifications are enabled.
This feature triggers an SNMP trap and sends an email when data in the RiOS data store is replaced with
new data before the time period specified.
To receive a notification when the data store wraps
1. Choose Optimization > Data Replication: Data Store to display the Data Store page.
2. Under General Settings, select Enable Data Store Wrap Notifications. Optionally, specify the number of days before the data in the data store is replaced. The default value is 1.
3. Click Apply to apply your settings.
4. Click Save to save your settings permanently.
Related topics
• “Enabling failover” on page 108
• “Improving performance” on page 131
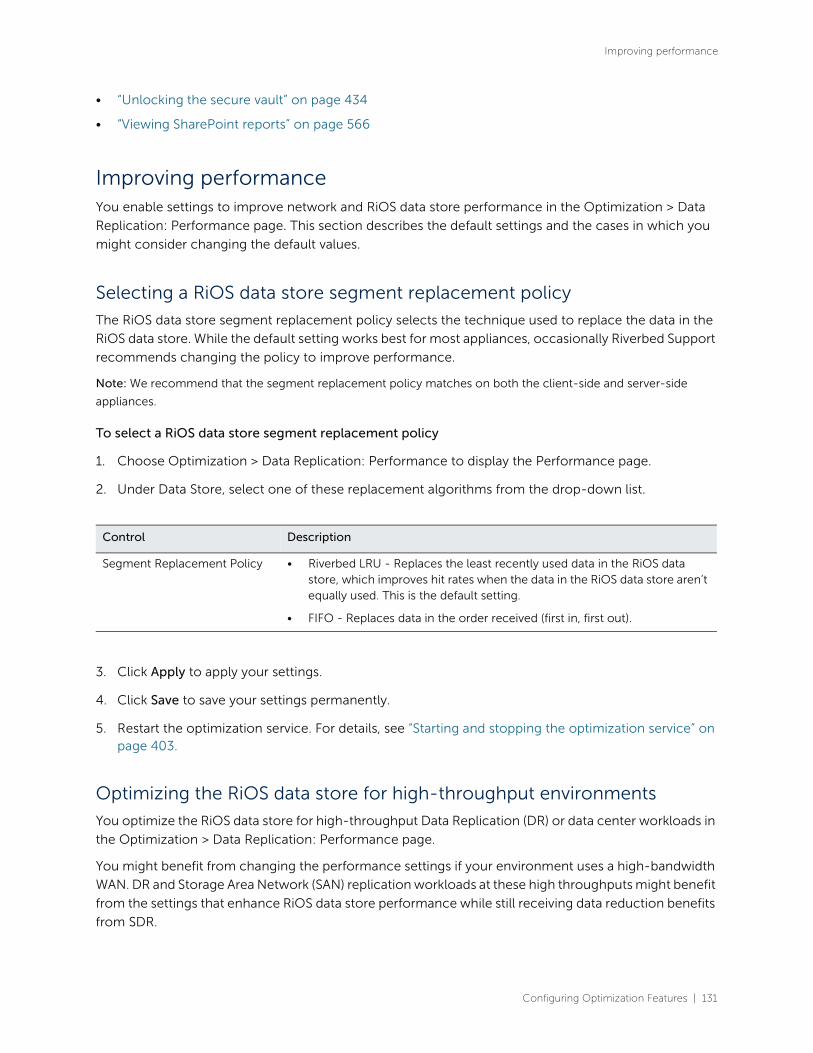
Configuring Optimization Features | 131
Improving performance
• “Unlocking the secure vault” on page 434
• “Viewing SharePoint reports” on page 566
Improving performanceYou enable settings to improve network and RiOS data store performance in the Optimization > Data
Replication: Performance page. This section describes the default settings and the cases in which you
might consider changing the default values.
Selecting a RiOS data store segment replacement policy
The RiOS data store segment replacement policy selects the technique used to replace the data in the
RiOS data store. While the default setting works best for most appliances, occasionally Riverbed Support
recommends changing the policy to improve performance.
Note: We recommend that the segment replacement policy matches on both the client-side and server-side
appliances.
To select a RiOS data store segment replacement policy
1. Choose Optimization > Data Replication: Performance to display the Performance page.
2. Under Data Store, select one of these replacement algorithms from the drop-down list.
3. Click Apply to apply your settings.
4. Click Save to save your settings permanently.
5. Restart the optimization service. For details, see “Starting and stopping the optimization service” on page 403.
Optimizing the RiOS data store for high-throughput environments
You optimize the RiOS data store for high-throughput Data Replication (DR) or data center workloads in
the Optimization > Data Replication: Performance page.
You might benefit from changing the performance settings if your environment uses a high-bandwidth
WAN. DR and Storage Area Network (SAN) replication workloads at these high throughputs might benefit
from the settings that enhance RiOS data store performance while still receiving data reduction benefits
from SDR.
Control Description
Segment Replacement Policy • Riverbed LRU - Replaces the least recently used data in the RiOS data store, which improves hit rates when the data in the RiOS data store aren’t equally used. This is the default setting.
• FIFO - Replaces data in the order received (first in, first out).

132 | Configuring Optimization Features
Improving performance
To maintain consistent levels of performance, we recommend using separate appliances for DR
workloads than for optimization of other application traffic.
Setting an adaptive streamlining mode
The adaptive data streamlining mode monitors and controls the different resources available on the
appliance and adapts the utilization of these system resources to optimize LAN throughput. Changing
the default setting is optional; we recommend you select another setting only with guidance from
Riverbed Support or the Riverbed Sales Team.
Generally, the default setting provides the most data reduction. When choosing an adaptive streamlining
mode for your network, contact Riverbed Support to help you evaluate the setting based on:
• the amount of data replication your appliance is processing.
• the type of data being processed and its effects on disk throughput on the appliances.
• your primary goal for the project, which could be maximum data reduction or maximum throughput. Even when your primary goal is maximum throughput you can still achieve high data reduction.
To select an adaptive data streamlining mode
1. Choose Optimization > Data Replication: Performance to display the Performance page.
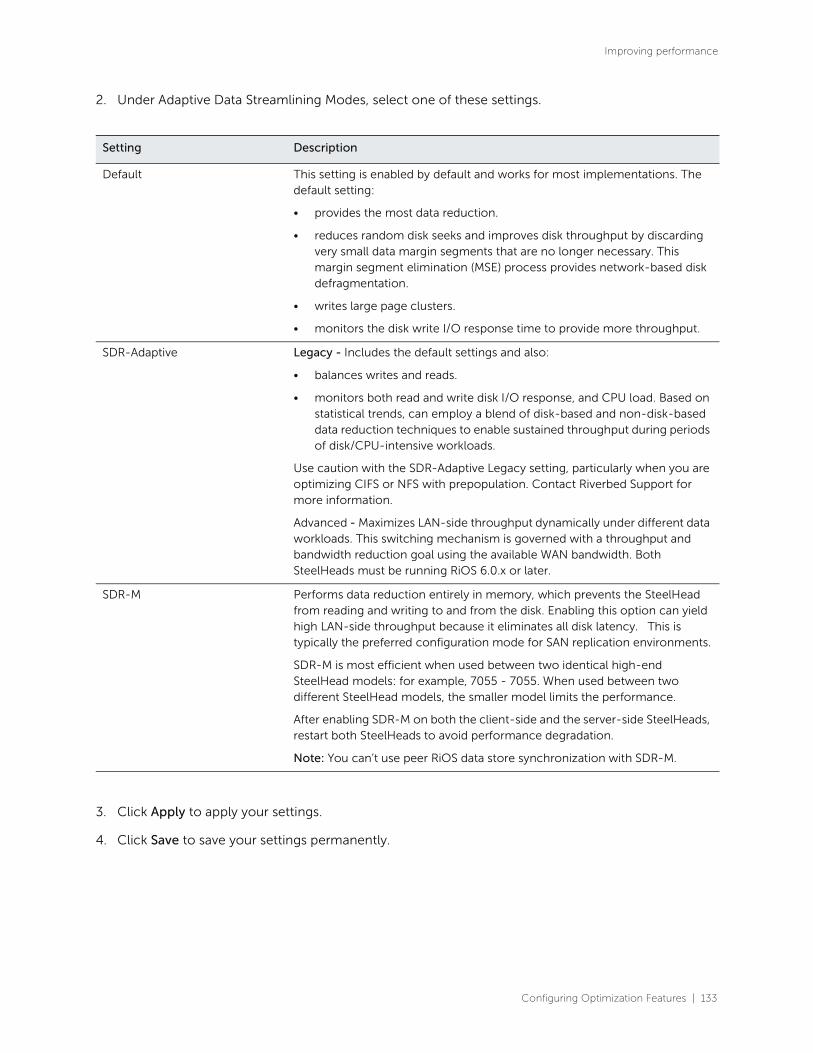
Configuring Optimization Features | 133
Improving performance
2. Under Adaptive Data Streamlining Modes, select one of these settings.
3. Click Apply to apply your settings.
4. Click Save to save your settings permanently.
Setting Description
Default This setting is enabled by default and works for most implementations. The default setting:
• provides the most data reduction.
• reduces random disk seeks and improves disk throughput by discarding very small data margin segments that are no longer necessary. This margin segment elimination (MSE) process provides network-based disk defragmentation.
• writes large page clusters.
• monitors the disk write I/O response time to provide more throughput.
SDR-Adaptive Legacy - Includes the default settings and also:
• balances writes and reads.
• monitors both read and write disk I/O response, and CPU load. Based on statistical trends, can employ a blend of disk-based and non-disk-based data reduction techniques to enable sustained throughput during periods of disk/CPU-intensive workloads.
Use caution with the SDR-Adaptive Legacy setting, particularly when you are optimizing CIFS or NFS with prepopulation. Contact Riverbed Support for more information.
Advanced - Maximizes LAN-side throughput dynamically under different data workloads. This switching mechanism is governed with a throughput and bandwidth reduction goal using the available WAN bandwidth. Both SteelHeads must be running RiOS 6.0.x or later.
SDR-M Performs data reduction entirely in memory, which prevents the SteelHead from reading and writing to and from the disk. Enabling this option can yield high LAN-side throughput because it eliminates all disk latency. This is typically the preferred configuration mode for SAN replication environments.
SDR-M is most efficient when used between two identical high-end SteelHead models: for example, 7055 - 7055. When used between two different SteelHead models, the smaller model limits the performance.
After enabling SDR-M on both the client-side and the server-side SteelHeads, restart both SteelHeads to avoid performance degradation.
Note: You can’t use peer RiOS data store synchronization with SDR-M.

134 | Configuring Optimization Features
Improving performance
5. If you have selected a new adaptive data streamlining mode, you must restart the optimization service on the client-side and server-side appliances. For details, see “Starting and stopping the optimization service” on page 403.
Note: If you select SDR-M as the adaptive data streamlining mode, the Clear the Data Store option is not available
when you restart the optimization service because the SDR-M mode has no effect on the RiOS data store disk.
Note: After changing the RiOS data store adaptive streamlining setting, you can verify whether changes have had
the desired effect by reviewing the Optimized Throughput report. From the menu bar, choose Reports >
Optimization: Optimized Throughput.
Configuring CPU settings
Use the CPU settings to balance throughput with the amount of data reduction and balance the
connection load. The CPU settings are useful with high-traffic loads to scale back compression, increase
throughput, and maximize Long Fat Network (LFN) utilization.
To configure the CPU settings
1. Choose Optimization > Data Replication: Performance to display the Performance page.
2. Under CPU Settings, complete the configuration as described in this table.
3. Click Apply to apply your settings.
4. Click Save to save your settings permanently.
Setting Description
Compression Level Specifies the relative trade-off of data compression for LAN throughput speed. Generally, a lower number provides faster throughput and slightly less data reduction.
Select a RiOS data store compression value of 1 (minimum compression, uses less CPU) through 9 (maximum compression, uses more CPU) from the drop-down list. The default value corresponds to level 6.
We recommend setting the compression level to 1 in high-throughput environments such as data center-to-data center replication.
Adaptive Compression Detects LZ data compression performance for a connection dynamically and disables it (sets the compression level to 0) momentarily if it’s not achieving optimal results. Improves end-to-end throughput over the LAN by maximizing the WAN throughput. By default, this setting is disabled.
Multi-Core Balancing Enables multicore balancing, which ensures better distribution of workload across all CPUs, thereby maximizing throughput by keeping all CPUs busy. Core balancing is useful when handling a small number of high-throughput connections (approximately 25 or fewer). By default, this setting is disabled and should be enabled only after careful consideration and consulting with Sales Engineering or Riverbed Support.

Configuring Optimization Features | 135
Configuring the SaaS Accelerator
Related Topics
• “Configuring in-path rules” on page 90
• “Synchronizing peer RiOS data stores” on page 127
Configuring the SaaS AcceleratorYou can accelerate SaaS application traffic by registering a SteelFusion Edge with a SteelConnect
Manager (SCM) that is set up for SaaS acceleration.
When you set up SaaS acceleration on SCM, SCM deploys and manages a SaaS service cluster in the
cloud. The SaaS Accelerator feature also includes proxy certificate management to simplify the
deployment process.
Note: SaaS Accelerator through SteelConnect is a Riverbed end-to-end solution and simplifies deployment and
certificate management. It is intended as a replacement for SteelHead Cloud Accelerator with Akamai, which has
been renamed to Legacy Cloud Accelerator.
Prerequisites
Before you can set up the SteelFusion Edge and accelerate SaaS traffic, you need to perform these steps
on SteelConnect Manager:
1. Ensure you have a license for SaaS Accelerator.
Note: SaaS Accelerator requires an additional license, but the license is not installed on the SteelFusion Edge; it is
installed on SteelConnect Manager. Without a license, SaaS traffic is passed through.
2. Enable automatic signing and certificate management capabilities. On SteelConnect Manager, choose Optimization > SSL Optimization.
3. Configure SaaS applications for acceleration. On SteelConnect Manager, choose Optimization > SaaS Accelerator.
See the SteelConnect Manager User Guide and the SaaS Accelerator User Guide for detailed
configuration information.
Configuring SaaS acceleration on a SteelFusion Edge
When you have configured SteelConnect Manager for SaaS acceleration, you can configure SteelFusion
Edge as a client.
To configure a SteelFusion Edge for SaaS acceleration
1. On SteelConnect Manager, choose Optimization > SaaS Client Appliances and copy the registration token.
2. On the SteelFusion Edge, choose Optimization > SaaS: SaaS Accelerator and add these values:
– SteelConnect Manager Hostname.

136 | Configuring Optimization Features
Configuring the SaaS Accelerator
– SteelConnect Manager Port. The client-side SteelFusion Edge uses port 3900 on the primary interface to communicate with SCM, and the port needs to be open on the firewall. The field for the port number is editable but we do not recommended changing the value.
– Registration Token. Paste the registration token you copied in Step 1 to this field.
Figure 7-6. SaaS Acceleration registration page
3. Click Register.
When the registration process completes, the registration details and a helpful list of remaining configuration tasks appear on the page. Completed tasks are prefaced by a check mark.
A new SaaS Acceleration section also appears on the page where you can view the current status and monitor acceleration status.
4. Enable SSL optimization on the SteelFusion Edge.
Choose Optimization > SSL: SSL Main Settings, and in the General SSL Settings area select Enable SSL Optimization and click Apply.
5. On SteelConnect Manager, move this SteelFusion Edge to the whitelist.
Newly added appliances always appear on the graylist in the Access List column. You need to change their status to the whitelist to allow acceleration.
Choose Optimization > SaaS Client Appliances and click the appliance serial number to display the details panel.
Under Access List and Notes, select Whitelist from the Access List drop-down menu and click Submit.
6. Enable SaaS acceleration on this appliance. Choose Optimization > SaaS: SaaS Accelerator, select Enable Acceleration, and click Apply.
When you click Apply, be patient. It can take several minutes to start acceleration.
7. Add an in-path rule to accelerate SaaS applications.
The in-path rule associates the IP address of the SaaS service cluster in the cloud (supplied by SteelConnect Manager) with the accelerated application.
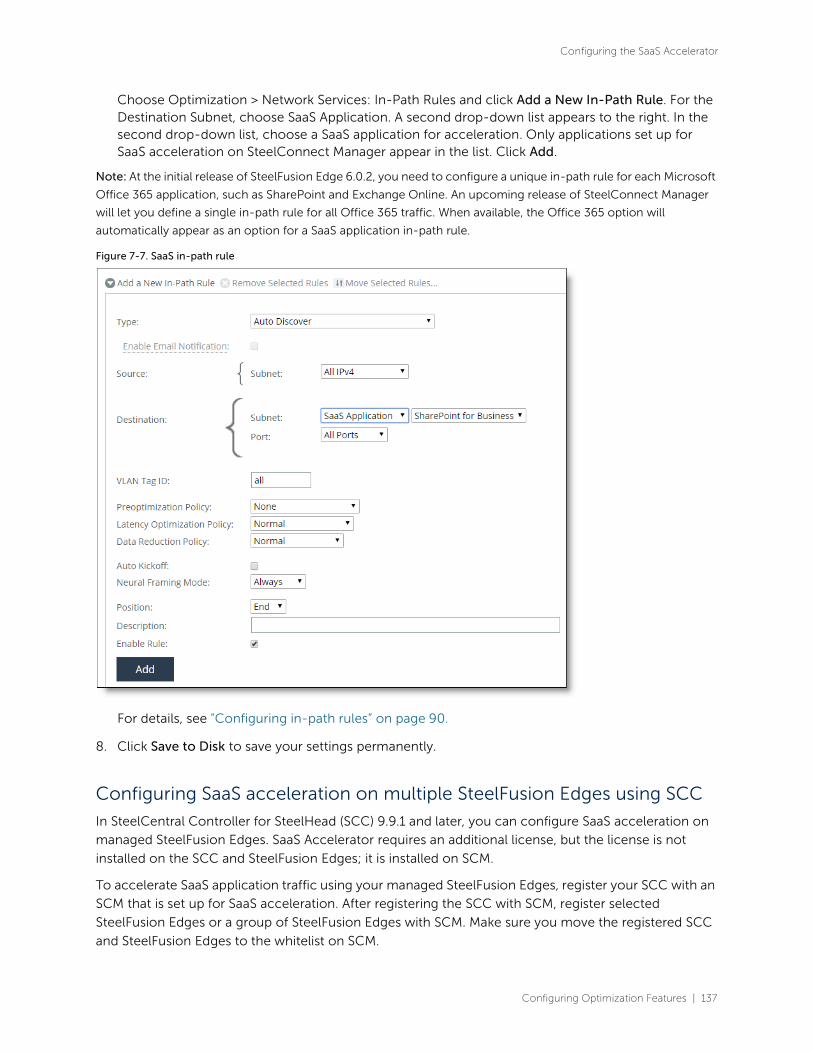
Configuring Optimization Features | 137
Configuring the SaaS Accelerator
Choose Optimization > Network Services: In-Path Rules and click Add a New In-Path Rule. For the Destination Subnet, choose SaaS Application. A second drop-down list appears to the right. In the second drop-down list, choose a SaaS application for acceleration. Only applications set up for SaaS acceleration on SteelConnect Manager appear in the list. Click Add.
Note: At the initial release of SteelFusion Edge 6.0.2, you need to configure a unique in-path rule for each Microsoft
Office 365 application, such as SharePoint and Exchange Online. An upcoming release of SteelConnect Manager
will let you define a single in-path rule for all Office 365 traffic. When available, the Office 365 option will
automatically appear as an option for a SaaS application in-path rule.
Figure 7-7. SaaS in-path rule
For details, see “Configuring in-path rules” on page 90.
8. Click Save to Disk to save your settings permanently.
Configuring SaaS acceleration on multiple SteelFusion Edges using SCC
In SteelCentral Controller for SteelHead (SCC) 9.9.1 and later, you can configure SaaS acceleration on
managed SteelFusion Edges. SaaS Accelerator requires an additional license, but the license is not
installed on the SCC and SteelFusion Edges; it is installed on SCM.
To accelerate SaaS application traffic using your managed SteelFusion Edges, register your SCC with an
SCM that is set up for SaaS acceleration. After registering the SCC with SCM, register selected
SteelFusion Edges or a group of SteelFusion Edges with SCM. Make sure you move the registered SCC
and SteelFusion Edges to the whitelist on SCM.

138 | Configuring Optimization Features
Configuring the Legacy Cloud Accelerator
On the SCC policies that include SaaS acceleration, make sure you perform these configurations:
• Enable SSL optimization.
• Enable SaaS acceleration.
• Add an in-path rule to accelerate traffic for a selected SaaS application.
For more details about configuring SaaS acceleration on managed SteelFusion Edges, see the
SteelCentral Controller for SteelHead User Guide.
Monitoring SaaS acceleration
Once configured, you can use the SaaS Acceleration Status panel on SteelFusion Edge to monitor
activity. This panel shows all SaaS applications configured for acceleration and shows the status of their
in-path rules.
Figure 7-8. SaaS Acceleration Status panel
The SteelFusion Edge gets data from SteelConnect Manager every five minutes and shows the time for
the displayed data. Click Refresh Data to get the latest information.
Canceling SaaS acceleration
To cancel the acceleration, click Deregister. This action also removes all related in-path rules.
Configuring the Legacy Cloud AcceleratorNote: The name for this feature has changed from SteelHead Cloud Accelerator to Legacy Cloud Accelerator. The
SaaS Accelerator through SteelConnect replaces the Legacy Cloud Accelerator and provides a Riverbed end-to-end
solution with simplified deployment and certificate management. For details, see “Configuring the SaaS Accelerator”
on page 135.
Configure the cloud acceleration service for Software as a Service (SaaS) applications such as Office365
and Salesforce.com in the Optimization > SaaS: Legacy Cloud Accelerator page. The Legacy Cloud
Accelerator combines the RiOS with the Akamai internet route optimization technology (SureRoute) for
accelerating SaaS application performance.

Configuring Optimization Features | 139
Configuring the Legacy Cloud Accelerator
Prerequisites
Before you configure the Legacy Cloud Accelerator on the SteelFusion Edge, ensure that you configure
these settings:
• Domain Name System (DNS)- Configure and enable DNS. Ensure that the SteelFusion Edge can access the configured name server(s).
• Network Time Protocol (NTP) - Configure and enable NTP and ensure that the NTP server(s) is accessible.
To register a SteelFusion Edge to the Legacy Cloud Accelerator
1. Log in to the Riverbed Cloud Portal. For more information about the Riverbed Cloud Portal, see the SteelHead SaaS User Guide (for Legacy Cloud Accelerator).
2. Select Cloud Accelerator.
3. Copy the Appliance Registration Key.
4. Log in to the SteelFusion Edge.
5. Choose Optimization > SaaS: Legacy Cloud Accelerator to display the Legacy Cloud Accelerator page.
Figure 7-9. Legacy Cloud Accelerator page
6. Paste the registration key into the Appliance Registration Key text field under Registration Control and click Register.
When a SteelFusion Edge is registered for the first time, you might see the text initialized. After you refresh the page by choosing Optimization > SaaS: Legacy Cloud Accelerator, this message appears:
This appliance is pending service.

140 | Configuring Optimization Features
Configuring the Legacy Cloud Accelerator
7. Grant the service for the SteelFusion Edge on the Riverbed Cloud Portal. For information about granting service, see the section about Enabling and Disabling Optimization Services on Registered Appliances in the SteelHead SaaS User Guide (for Legacy Cloud Accelerator).
Registration is successful when you see this message:
This appliance is currently registered with the Cloud Portal.
You can click Refresh Service to refresh the service status, or wait for the page to refresh.
8. Under Cloud Accelerator Control, select the Enable Cloud Acceleration check box to activate the cloud acceleration service on the SteelFusion Edge.
9. Select the Enable Cloud Accelerator Redirection check box to activate traffic redirection from the SteelFusion Edge to the Akamai network (direct mode). This control is enabled by default. There are two options for proxy redirection:
– Direct mode - The SteelFusion Edge redirects traffic to the Akamai network. Leave the Enable Cloud Accelerator Redirection check box selected to use the direct mode.
– Back-hauled mode - The SteelFusion Edge in the data center redirects traffic to the Akamai network for all the branch SteelFusion Edges. If you choose this option, you must disable proxy redirection in the SteelFusion Edge and leave it enabled on the data center appliance.
Clear the Enable Cloud Accelerator Redirection check box to use the back-hauled mode.
10. In the Redirection Tunnel Port text field, leave the default value (9545) of the port number for the configurable outbound port for UDP connections to the Akamai network as it is. The SteelFusion Edge connected to the Akamai network uses this configurable UDP port over a wide range of IP addresses.
It is necessary to configure the UDP port 9545 only for outbound connectivity from the in-path IP address of the SteelFusion Edge. If there are multiple in-path addresses, then the firewall must allow access for each in-path IP address.
11. Under Cloud Accelerator Status, click Refresh Service for the SteelFusion Edge to get the latest service details from the Riverbed Cloud Portal.
12. Click Apply to apply your configuration.
To deregister an appliance from the Legacy Cloud Accelerator
1. Log in to the Riverbed Cloud Portal and deregister the SteelFusion Edge. For more information, see “Registering and Unregistering Appliances on the Portal” in the SteelHead SaaS User Guide (for Legacy Cloud Accelerator).
2. Log in to the SteelFusion Edge.
3. Click De-register to deregister the SteelFusion Edge.
The system displays a confirmation dialog box.
4. Click De-register in the dialog box.
Configuring Optimization Features | 141
Configuring CIFS prepopulation
Activating SaaS applications
Enabling optimization for SaaS applications on SteelFusion Edge appliances requires configuration on
both the Riverbed Cloud Portal and the SteelFusion Edge. Enabling a SaaS application on the Riverbed
Cloud Portal makes that application available to all registered SteelFusion Edges, while enabling a SaaS
application on the SteelFusion Edge activates optimization for that application on that SteelFusion Edge.
After you enable optimization, you can run reports to view optimization statistics.
Prerequisites
• An SSL license is required.
• SSL optimization must be enabled on the server-side SteelFusion Edge. See “Configuring SSL main settings” on page 325 for details.
To activate SaaS applications
1. Ensure that your SteelFusion Edge is registered with the Riverbed Cloud Portal, that it is granted Cloud Accelerator service, and that the SaaS applications you want the SteelFusion Edge to optimize are enabled in the Riverbed Cloud Portal. See “Configuring the Legacy Cloud Accelerator” on page 138 and the SteelHead SaaS User Guide (for Legacy Cloud Accelerator) for details.
2. Enable the applications on the SteelFusion Edge by scrolling down in the Optimization > SaaS: Legacy Cloud Accelerator page and changing the value in the Local Optimization column from Disabled to Enabled.
You can also enable the application with the service cloud-accel application command. See the Riverbed Command-Line Interface Reference Manual for more information.
Configuring CIFS prepopulationYou enable prepopulation and add, modify, and delete prepopulation shares in the Optimization >
Protocols: CIFS Prepopulation page.
The prepopulation operation effectively performs the first appliance read of the data on the
prepopulation share. Later, the appliance handles read and write requests as effectively as with a warm
data store. With a warm data store, RiOS sends data references along with new or modified data,
dramatically increasing the rate of data transfer over the WAN.
The first synchronization, or the initial copy, retrieves data from the origin file server and copies it to the
RiOS data store on the appliance. Subsequent synchronizations are based on the synchronization
interval.
The Management Consoles include policies and rules to provide control over which files the system
transfers to warm the RiOS data store. A policy is a group of rules that select particular files to
prepopulate. For example, you can create a policy that selects all PDF files larger than 300 MB created
since January 1, 2013.
CIFS Prepopulation is disabled by default.
The AWS SteelHead-c does not support CIFS Prepopulation. The ESX SteelHead-c supports CIFS
Prepopulation if it is deployed with WCCP or PBR (not with the Discovery Agent).

142 | Configuring Optimization Features
Configuring CIFS prepopulation
To enable CIFS prepopulation and add, modify, or delete a prepopulation share
1. Choose Optimization > Protocols: CIFS Prepopulation to display the CIFS Prepopulation page.
Figure 7-10. CIFS Prepopulation page
2. Under Settings, complete the configuration as described in this table.
Control Description
Enable CIFS Prepopulation Prewarms the RiOS data store. In this setup, the primary interface of the SteelHead acts as a client and prerequests data from the share you want to use to warm the data store. This request goes through the LAN interface to the WAN interface out to the server-side SteelHead, causing the in-path interface to see the data as a normal client request.
When data is requested again by a client on the local LAN, RiOS sends only new or modified data over the WAN, dramatically increasing the rate of data transfers.
Enable Transparent Prepopulation Support using RCU
Opens port 8777 to allow manual warming of the RiOS data store using the Riverbed Copy Utility (RCU) to prepopulate your shares.
Most environments don’t need to enable RCU.

Configuring Optimization Features | 143
Configuring CIFS prepopulation
3. Click Apply to apply your settings.
4. When prepopulation is enabled, you can add shares and schedule automatic unattended synchronization as described in this table.
5. Click Save to save your settings permanently.
After you add a share, the CIFS prepopulation page includes the share in the Share table. The Share table
provides an editable list of shares along with each share’s remote pathname, the date and time the next
synchronizations will occur, the status, and any comments about the share.
When the status reports that the share has an error, mouse over the error to reveal details about the
error.
Editing a prepopulation share
After adding a CIFS prepopulation share, you can edit it from the Configuration tab. You can create a
policy (group of rules) to apply to the share, and you can schedule a date and time for share
synchronization.
To edit a CIFS prepopulation share
1. Choose Optimization > Protocols: CIFS Prepopulation to display the CIFS Prepopulation page.
Control Description
Remote Path Specifies the path to the data on the origin server or the UNC path of a share available for prepopulation. This control is not editable under the share Configuration tab.
Username Specify the username of the local administrator account used to access the origin server.
Change Password Select the check box and then specify the password for the local administrator account.
Comment Optionally, include a comment to help you administer the share in the future. Comments can’t contain an ampersand (&).
Sync Time Limit Specify a time limit that the synchronization job shouldn’t exceed.
Use this time format: H:M:S
Examples:
1 = 1 second
1:2 = 1 minute and 2 seconds
1:2:3 = 1 hour, 2 minutes, and 3 seconds
Sync Size Limit Specify a limit on the amount of data in the synchronization job.
Sync Using Select to synchronize the current files or select the latest share snapshot (if no snapshots are available, the system uses the current files).
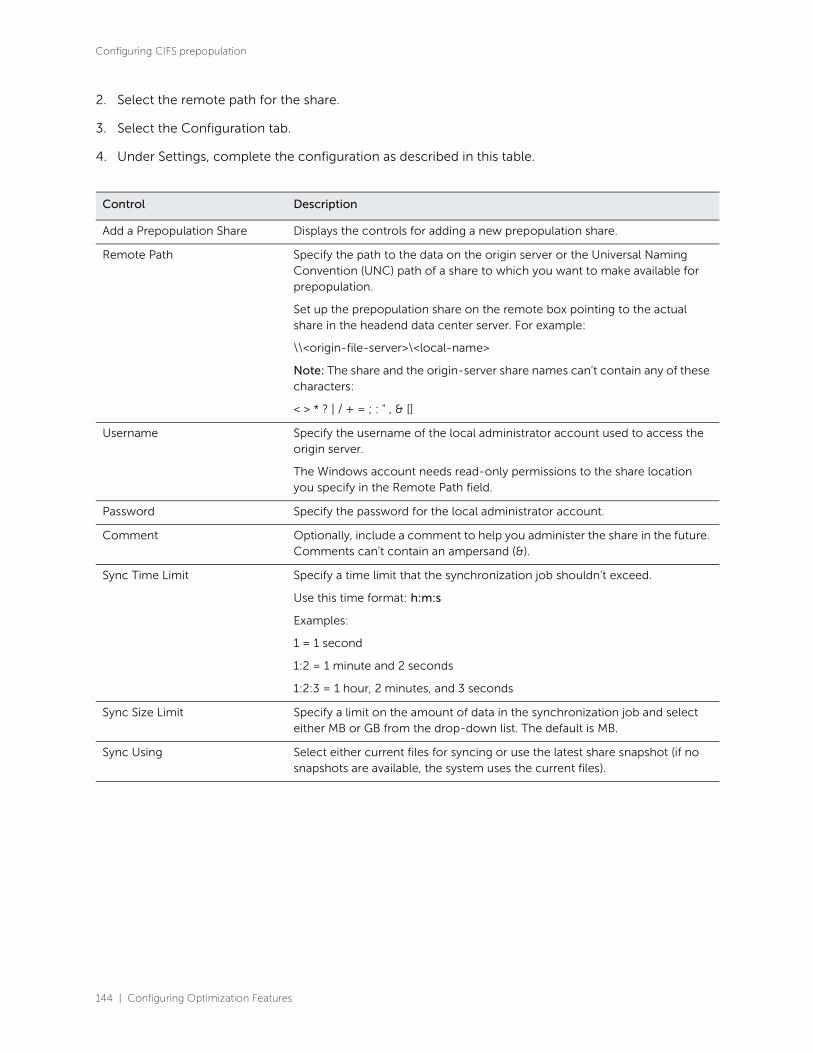
144 | Configuring Optimization Features
Configuring CIFS prepopulation
2. Select the remote path for the share.
3. Select the Configuration tab.
4. Under Settings, complete the configuration as described in this table.
Control Description
Add a Prepopulation Share Displays the controls for adding a new prepopulation share.
Remote Path Specify the path to the data on the origin server or the Universal Naming Convention (UNC) path of a share to which you want to make available for prepopulation.
Set up the prepopulation share on the remote box pointing to the actual share in the headend data center server. For example:
\\<origin-file-server>\<local-name>
Note: The share and the origin-server share names can’t contain any of these characters:
< > * ? | / + = ; : " , & []
Username Specify the username of the local administrator account used to access the origin server.
The Windows account needs read-only permissions to the share location you specify in the Remote Path field.
Password Specify the password for the local administrator account.
Comment Optionally, include a comment to help you administer the share in the future. Comments can’t contain an ampersand (&).
Sync Time Limit Specify a time limit that the synchronization job shouldn’t exceed.
Use this time format: h:m:s
Examples:
1 = 1 second
1:2 = 1 minute and 2 seconds
1:2:3 = 1 hour, 2 minutes, and 3 seconds
Sync Size Limit Specify a limit on the amount of data in the synchronization job and select either MB or GB from the drop-down list. The default is MB.
Sync Using Select either current files for syncing or use the latest share snapshot (if no snapshots are available, the system uses the current files).
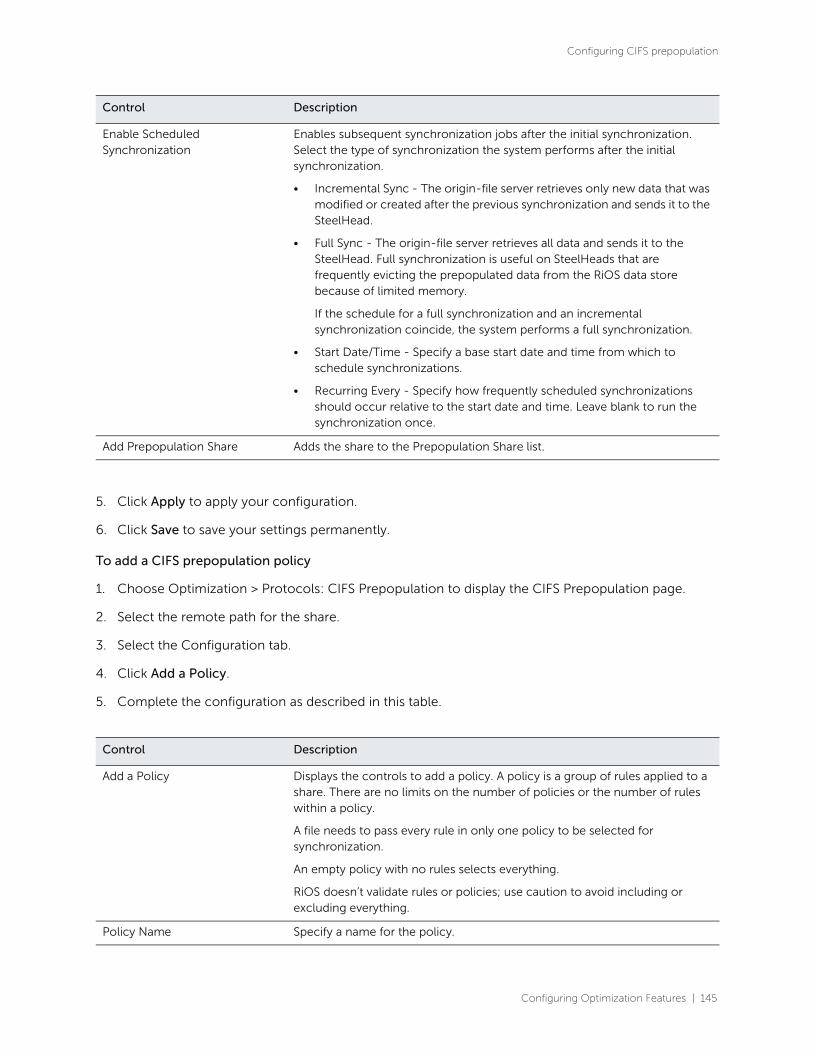
Configuring Optimization Features | 145
Configuring CIFS prepopulation
5. Click Apply to apply your configuration.
6. Click Save to save your settings permanently.
To add a CIFS prepopulation policy
1. Choose Optimization > Protocols: CIFS Prepopulation to display the CIFS Prepopulation page.
2. Select the remote path for the share.
3. Select the Configuration tab.
4. Click Add a Policy.
5. Complete the configuration as described in this table.
Enable Scheduled Synchronization
Enables subsequent synchronization jobs after the initial synchronization. Select the type of synchronization the system performs after the initial synchronization.
• Incremental Sync - The origin-file server retrieves only new data that was modified or created after the previous synchronization and sends it to the SteelHead.
• Full Sync - The origin-file server retrieves all data and sends it to the SteelHead. Full synchronization is useful on SteelHeads that are frequently evicting the prepopulated data from the RiOS data store because of limited memory.
If the schedule for a full synchronization and an incremental synchronization coincide, the system performs a full synchronization.
• Start Date/Time - Specify a base start date and time from which to schedule synchronizations.
• Recurring Every - Specify how frequently scheduled synchronizations should occur relative to the start date and time. Leave blank to run the synchronization once.
Add Prepopulation Share Adds the share to the Prepopulation Share list.
Control Description
Add a Policy Displays the controls to add a policy. A policy is a group of rules applied to a share. There are no limits on the number of policies or the number of rules within a policy.
A file needs to pass every rule in only one policy to be selected for synchronization.
An empty policy with no rules selects everything.
RiOS doesn’t validate rules or policies; use caution to avoid including or excluding everything.
Policy Name Specify a name for the policy.
Control Description

146 | Configuring Optimization Features
Configuring CIFS prepopulation
6. Click Apply to apply your configuration.
7. Click Save to save your settings permanently.
To schedule a synchronization
1. Choose Optimization > Protocols: CIFS Prepopulation to display the CIFS Prepopulation page.
2. Select the remote path for the share.
3. Select the Configuration tab.
Description Describe the policy.
Add Rule Click to add a new rule to a policy. You can add rules that prepopulate the RiOS data store according to filename, file size, or the time of the last file access, creation, or modification.
Synchronize files that match all of the following rules
Select a filter from the drop-down list and type or select a value for the rule from the drop-down list. The control changes dynamically according to the rule type.
Examples:
Select all TXT and PDF files:
• File extension or name matches *.txt; *.PDF
Select all files that have been modified within the last two hours:
• Modify time is within, when syncing 02:00:00
Select all TXT files larger than 300 MB and created since Jan 1st, 2013:
• File size is greater than 300 MB
• File extension/name matches *.txt
• Creation Time is newer than 2013/01/01 00:00:00
Use the mouse to hover over the information icon for a tool tip about the filter.
To delete a rule, click the red x.
Add Policy Adds the policy to the policy list.
Control Description

Configuring Optimization Features | 147
Configuring CIFS prepopulation
4. Complete the configuration as described in this table.
5. Click Apply to apply your configuration.
6. Click Save to save your settings permanently.
Performing CIFS prepopulation share operations
After adding a CIFS prepopulation share, you can synchronize the share or perform a dry run of what
would be synchronized.
To perform an operation on a CIFS prepopulation share
1. Choose Optimization > Protocols: CIFS Prepopulation to display the CIFS Prepopulation page.
2. Select the remote path for the share.
3. Select the Operations tab.
4. Click a button to perform an operation on a share as described in this table. You can perform only one operation at a time.
Control Description
Enable Scheduled Synchronization
Enables subsequent synchronization jobs after the initial synchronization. Select the type of synchronization the system performs after the initial synchronization.
• Incremental Sync - The origin file server retrieves only new data that was modified or created after the previous synchronization and sends it to the SteelHead.
• Full Sync - The origin file server retrieves all data and sends it to the SteelHead. Full synchronization is useful on SteelHeads that are frequently evicting the prepopulated data from the RiOS data store because of limited memory.
If the schedule for a full synchronization and an incremental synchronization coincide, the system performs a full synchronization.
• Start Date/Time - Specify a base start date and time from which to schedule synchronizations.
• Recurring Every - Specify how frequently scheduled synchronizations should occur relative to the start date and time. Leave blank to synchronize once.
Operation Description
Sync Now Synchronizes the share using the current settings.

148 | Configuring Optimization Features
Configuring TCP, satellite optimization, and high-speed TCP
Viewing CIFS prepopulation share logs
After adding a CIFS prepopulation share, you can view CIFS prepopulation share logs to see more detail
regarding recent synchronizations, the initial copy of the share, or the last share synchronization.
To view CIFS prepopulation share logs
1. Choose Optimization > Protocols: CIFS Prepopulation to display the CIFS Prepopulation page.
2. Select the remote path for the share.
3. Select the Operations tab.
4. Click one of these links to view a log file:
5. To print the report, choose File > Print in your web browser to open the Print dialog box.
Related topics
• “Configuring CIFS optimization” on page 174
• “Viewing CIFS prepopulation share logs” on page 550
Configuring TCP, satellite optimization, and high-speed TCP This section describes how to configure TCP, satellite optimization, and high-speed TCP settings. It
includes these topics:
• “Optimizing TCP and satellite WANs” on page 149
• “High-speed TCP optimization” on page 163
Perform Dry Run Creates a log of what would be synchronized using the current settings, without actually synchronizing anything.
Cancel Operation Cancels the operation.
Log file Description
Recent syncs Contains logs for the last few share synchronizations. The log includes how many directories, files, and bytes were received and how long it took to receive them. The log also lists any errors or deletions.
Initial sync Includes how many directories, files, and bytes were received initially and how long it took to receive them. The log also lists any errors or deletions.
Last dry run Includes a log of what would have been synchronized with the current share configuration, without actually synchronizing anything.
Operation Description

Configuring Optimization Features | 149
Configuring TCP, satellite optimization, and high-speed TCP
You configure TCP, high-speed TCP, and satellite optimization settings in the Optimization > Network
Services: Transport Settings page.
Optimizing TCP and satellite WANs
Riverbed provides satellite WAN optimization to overcome the common sources of performance loss
associated with space networking. Satellite optimization allows for more effective use of satellite
channels, while providing improved user experiences and increased productivity.
SkipWare, an exclusive technology in the Riverbed product family, senses increases and decreases in
bandwidth allocation and automatically adjusts its transmission window in response, without requiring
user intervention.
Optimizing SCPS with SkipWare
RiOS includes compatibility settings for the Space Communications Protocol Standards (SCPS) protocol
suite. SCPS is designed to allow communication over challenging environments. Originally, it was
developed jointly by NASA and DOD’s USSPACECOM to meet their various needs and requirements.
Through a collaborative, multiyear R&D effort, the partnership created the Space Communications
Protocol Standards-Transport Protocol (SCPS-TP, commonly referred to as “skips”). This protocol now
meets the needs of the satellite and wireless communities.
Unlike TCP, the SCPS protocol was designed to operate in an environment of high latency and limited
bandwidth. The first commercial implementation of the SCPS protocol was released under the brand
name SkipWare.
To use the SkipWare discovery mechanisms, you must install a SkipWare license. SkipWare is enabled
automatically when the license is installed, regardless of which transport optimization method is
selected (for example, standard TCP, high-speed TCP, or bandwidth estimation). After installing the
SkipWare license, you must restart the optimization service.
The basic RiOS license includes non-SkipWare options such as bandwidth estimation and standard TCP.
To change SkipWare settings, you must have role-based permission to use the Optimization Service role.
For details, see “Managing user permissions” on page 418.
For details and example satellite deployments, see the SteelHead Deployment Guide.
SCPS connection types
You configure satellite optimization settings depending on the connection type. This section describes
the connection types. For details about the SCPS discovery process used in various device scenarios, see
the SteelHead Deployment Guide.

150 | Configuring Optimization Features
Configuring TCP, satellite optimization, and high-speed TCP
RiOS and SCPS connection
A RiOS and SCPS connection is established between two appliances. Because both appliances are SCPS
compatible, this is a double-ended connection that benefits from traditional RiOS optimization (SDR and
LZ). A RiOS and SCPS connection works with all RiOS features.
Figure 7-11. RiOS and SCPS connection
Single-Ended Interception (SEI) connection
An SEI connection is established between a single appliance running RiOS paired with a third-party
device running TCP-PEP (Performance Enhancing Proxy). Both the appliance and the TCP-PEP device
are using the SCPS protocol to speed up the data transfer on a satellite link or other high-latency links.
In this figure, the appliance replaces a third-party device running TCP-PEP in the data center, but the
appliance can also reside in the branch office. Because there is only one appliance that intercepts the
connection, this is called a single-ended interception (SEI).
Figure 7-12. Single-Ended Interception connection
Because a single-ended interception connection communicates with only one appliance, it:
• performs only sender-side TCP optimization.
• supports virtual in-path deployments such as WCCP and PBR.
• cannot initiate an SCPS connection on a server-side out-of-path SteelHead.
• supports kickoff.
• supports autodiscovery failover (failover is compatible with IPv6).
• coexists with high-speed TCP.
• does not work with connection forwarding.
To configure satellite optimization for an SEI, you define SEI connection rules. The appliance uses SEI
connection rules to determine whether to enable or pass-through SCPS connections.

Configuring Optimization Features | 151
Configuring TCP, satellite optimization, and high-speed TCP
We recommend that for SEI configurations in which the appliance initiates the SCPS connection on the
WAN, you add an in-path pass-through rule from the client to the server. While the pass-through rule is
optional, without it the SteelFusion Edge probes for another appliance, and when it does not locate one,
will failover. Adding the in-path pass-through rule speeds up setup by eliminating the autodiscovery
probe and subsequent failover.
The in-path pass-through rule is not necessary on SEI configurations in which the SteelFusion Edge
terminates the SCPS connection on the WAN, because in this configuration the Edge evaluates only the
SEI connection rules table and ignores the in-path rules table.
SEI connections count toward the connection count limit on the SteelFusion Edge.
Note: When server-side network asymmetry occurs in an SEI configuration, the server-side appliance creates a bad
RST log entry in the asymmetric routing table. This log entry differs from other configurations (non-SCPS) in that the
client-side appliance typically detects asymmetry because of the bad RST and creates an entry in the asymmetric
routing table. In SEI configurations, the SteelFusion Edge detects asymmetry and creates asymmetric routing table
entries independent of other appliances. This results in a TCP proxy only connection between the client-side
appliance and the server when autodiscovery is disabled. For details about the asymmetric routing table, see
“Configuring asymmetric routing features” on page 363.
To configure TCP and SkipWare SCPS optimization
To properly configure transport settings for your environment, you must understand its characteristics.
For information on gathering performance characteristics for your environment, see the SteelHead
Deployment Guide.
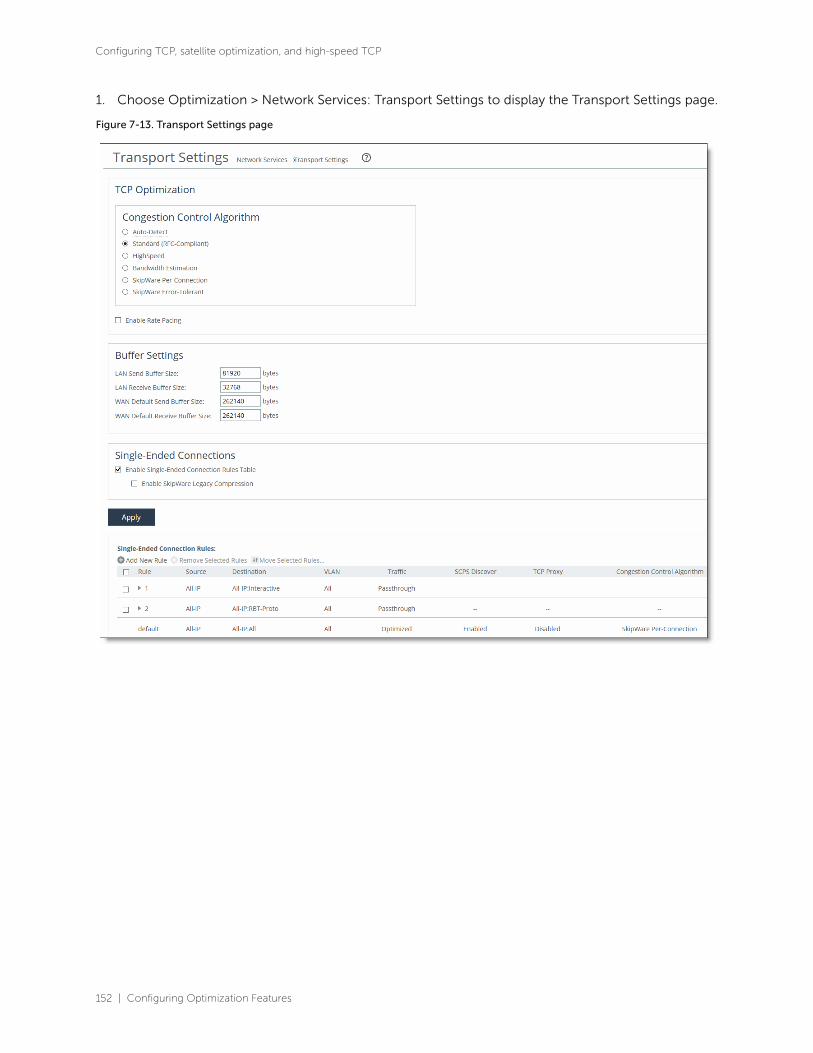
152 | Configuring Optimization Features
Configuring TCP, satellite optimization, and high-speed TCP
1. Choose Optimization > Network Services: Transport Settings to display the Transport Settings page.
Figure 7-13. Transport Settings page
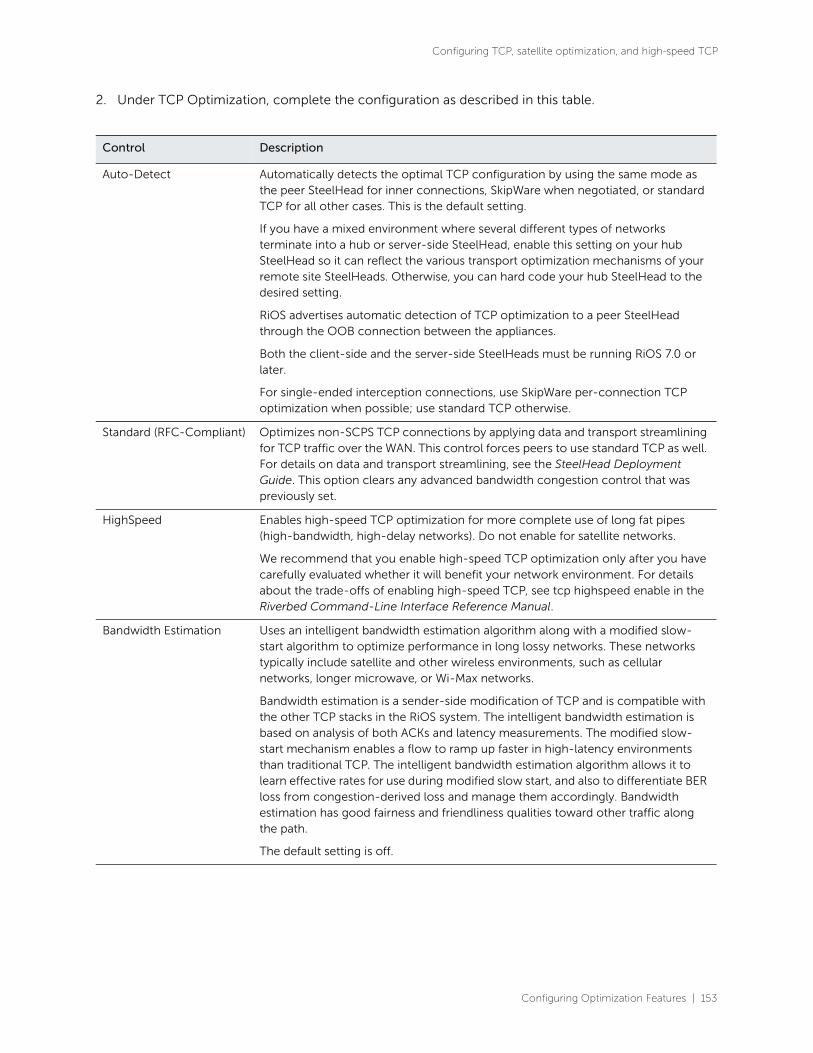
Configuring Optimization Features | 153
Configuring TCP, satellite optimization, and high-speed TCP
2. Under TCP Optimization, complete the configuration as described in this table.
Control Description
Auto-Detect Automatically detects the optimal TCP configuration by using the same mode as the peer SteelHead for inner connections, SkipWare when negotiated, or standard TCP for all other cases. This is the default setting.
If you have a mixed environment where several different types of networks terminate into a hub or server-side SteelHead, enable this setting on your hub SteelHead so it can reflect the various transport optimization mechanisms of your remote site SteelHeads. Otherwise, you can hard code your hub SteelHead to the desired setting.
RiOS advertises automatic detection of TCP optimization to a peer SteelHead through the OOB connection between the appliances.
Both the client-side and the server-side SteelHeads must be running RiOS 7.0 or later.
For single-ended interception connections, use SkipWare per-connection TCP optimization when possible; use standard TCP otherwise.
Standard (RFC-Compliant) Optimizes non-SCPS TCP connections by applying data and transport streamlining for TCP traffic over the WAN. This control forces peers to use standard TCP as well. For details on data and transport streamlining, see the SteelHead Deployment Guide. This option clears any advanced bandwidth congestion control that was previously set.
HighSpeed Enables high-speed TCP optimization for more complete use of long fat pipes (high-bandwidth, high-delay networks). Do not enable for satellite networks.
We recommend that you enable high-speed TCP optimization only after you have carefully evaluated whether it will benefit your network environment. For details about the trade-offs of enabling high-speed TCP, see tcp highspeed enable in the Riverbed Command-Line Interface Reference Manual.
Bandwidth Estimation Uses an intelligent bandwidth estimation algorithm along with a modified slow-start algorithm to optimize performance in long lossy networks. These networks typically include satellite and other wireless environments, such as cellular networks, longer microwave, or Wi-Max networks.
Bandwidth estimation is a sender-side modification of TCP and is compatible with the other TCP stacks in the RiOS system. The intelligent bandwidth estimation is based on analysis of both ACKs and latency measurements. The modified slow-start mechanism enables a flow to ramp up faster in high-latency environments than traditional TCP. The intelligent bandwidth estimation algorithm allows it to learn effective rates for use during modified slow start, and also to differentiate BER loss from congestion-derived loss and manage them accordingly. Bandwidth estimation has good fairness and friendliness qualities toward other traffic along the path.
The default setting is off.
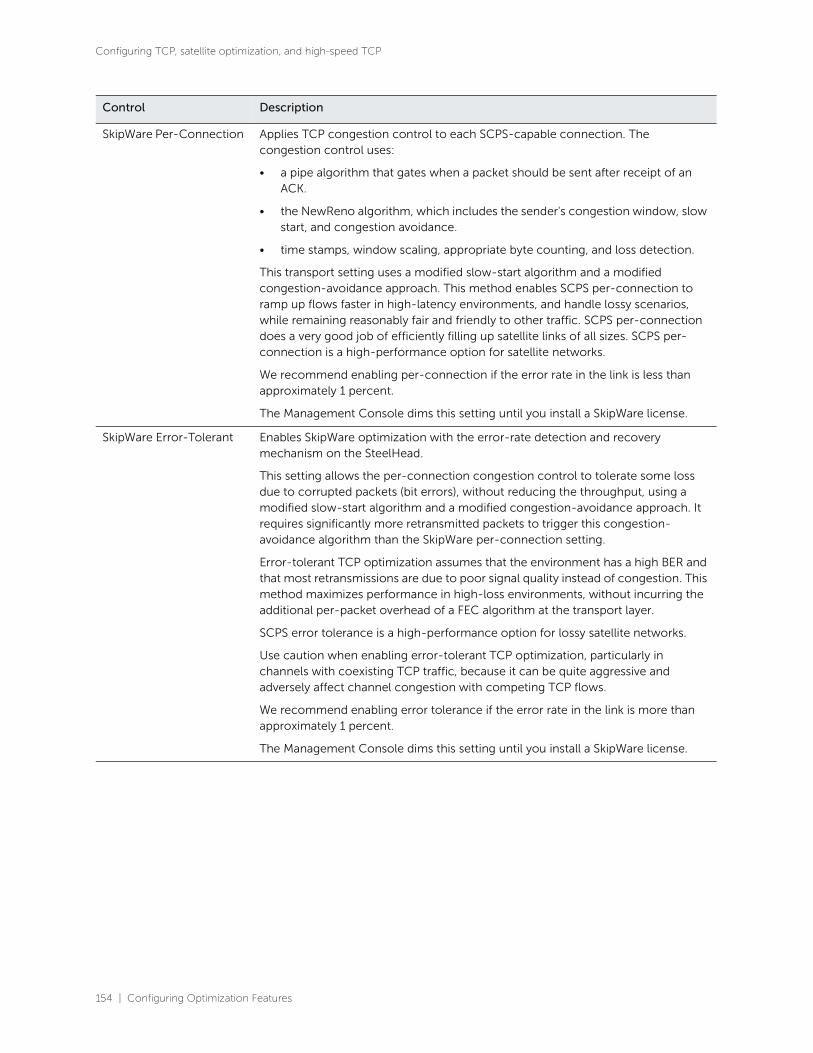
154 | Configuring Optimization Features
Configuring TCP, satellite optimization, and high-speed TCP
SkipWare Per-Connection Applies TCP congestion control to each SCPS-capable connection. The congestion control uses:
• a pipe algorithm that gates when a packet should be sent after receipt of an ACK.
• the NewReno algorithm, which includes the sender's congestion window, slow start, and congestion avoidance.
• time stamps, window scaling, appropriate byte counting, and loss detection.
This transport setting uses a modified slow-start algorithm and a modified congestion-avoidance approach. This method enables SCPS per-connection to ramp up flows faster in high-latency environments, and handle lossy scenarios, while remaining reasonably fair and friendly to other traffic. SCPS per-connection does a very good job of efficiently filling up satellite links of all sizes. SCPS per-connection is a high-performance option for satellite networks.
We recommend enabling per-connection if the error rate in the link is less than approximately 1 percent.
The Management Console dims this setting until you install a SkipWare license.
SkipWare Error-Tolerant Enables SkipWare optimization with the error-rate detection and recovery mechanism on the SteelHead.
This setting allows the per-connection congestion control to tolerate some loss due to corrupted packets (bit errors), without reducing the throughput, using a modified slow-start algorithm and a modified congestion-avoidance approach. It requires significantly more retransmitted packets to trigger this congestion-avoidance algorithm than the SkipWare per-connection setting.
Error-tolerant TCP optimization assumes that the environment has a high BER and that most retransmissions are due to poor signal quality instead of congestion. This method maximizes performance in high-loss environments, without incurring the additional per-packet overhead of a FEC algorithm at the transport layer.
SCPS error tolerance is a high-performance option for lossy satellite networks.
Use caution when enabling error-tolerant TCP optimization, particularly in channels with coexisting TCP traffic, because it can be quite aggressive and adversely affect channel congestion with competing TCP flows.
We recommend enabling error tolerance if the error rate in the link is more than approximately 1 percent.
The Management Console dims this setting until you install a SkipWare license.
Control Description
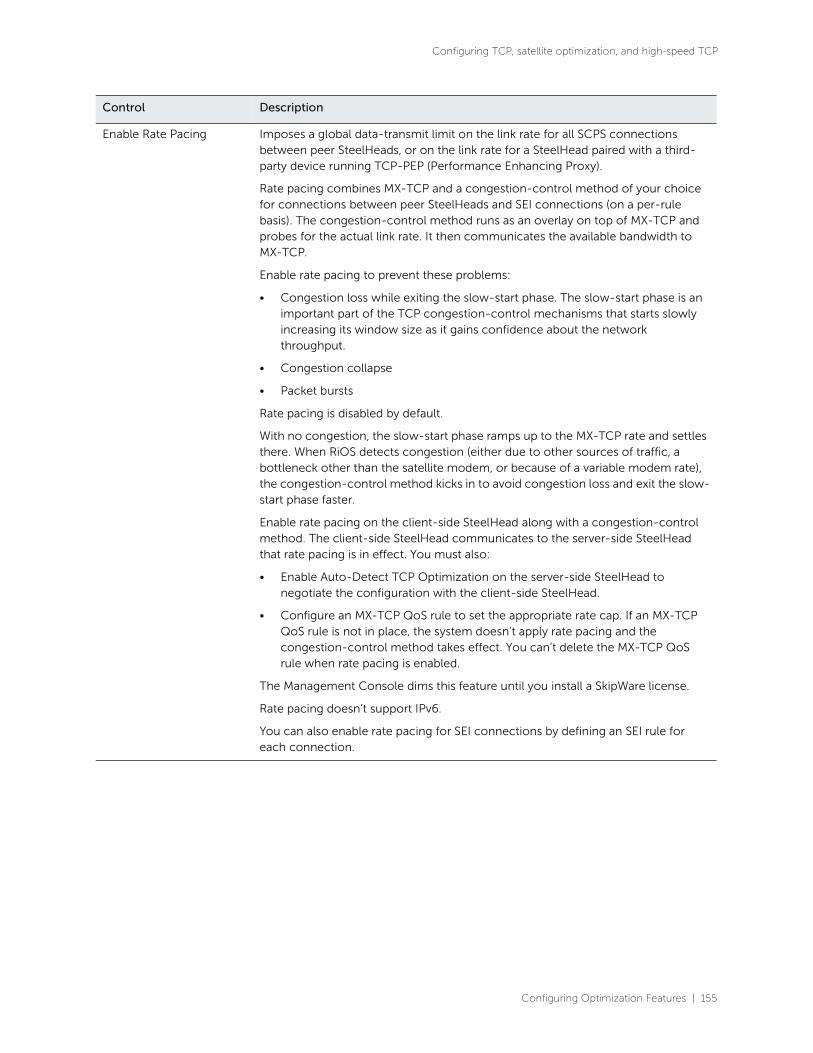
Configuring Optimization Features | 155
Configuring TCP, satellite optimization, and high-speed TCP
Enable Rate Pacing Imposes a global data-transmit limit on the link rate for all SCPS connections between peer SteelHeads, or on the link rate for a SteelHead paired with a third-party device running TCP-PEP (Performance Enhancing Proxy).
Rate pacing combines MX-TCP and a congestion-control method of your choice for connections between peer SteelHeads and SEI connections (on a per-rule basis). The congestion-control method runs as an overlay on top of MX-TCP and probes for the actual link rate. It then communicates the available bandwidth to MX-TCP.
Enable rate pacing to prevent these problems:
• Congestion loss while exiting the slow-start phase. The slow-start phase is an important part of the TCP congestion-control mechanisms that starts slowly increasing its window size as it gains confidence about the network throughput.
• Congestion collapse
• Packet bursts
Rate pacing is disabled by default.
With no congestion, the slow-start phase ramps up to the MX-TCP rate and settles there. When RiOS detects congestion (either due to other sources of traffic, a bottleneck other than the satellite modem, or because of a variable modem rate), the congestion-control method kicks in to avoid congestion loss and exit the slow-start phase faster.
Enable rate pacing on the client-side SteelHead along with a congestion-control method. The client-side SteelHead communicates to the server-side SteelHead that rate pacing is in effect. You must also:
• Enable Auto-Detect TCP Optimization on the server-side SteelHead to negotiate the configuration with the client-side SteelHead.
• Configure an MX-TCP QoS rule to set the appropriate rate cap. If an MX-TCP QoS rule is not in place, the system doesn’t apply rate pacing and the congestion-control method takes effect. You can’t delete the MX-TCP QoS rule when rate pacing is enabled.
The Management Console dims this feature until you install a SkipWare license.
Rate pacing doesn’t support IPv6.
You can also enable rate pacing for SEI connections by defining an SEI rule for each connection.
Control Description

156 | Configuring Optimization Features
Configuring TCP, satellite optimization, and high-speed TCP
Enable Single-Ended Connection Rules Table
Enables transport optimization for single-ended interception connections with no SteelHead peer. These connections appear in the rules table.
In RiOS 8.5 or later, you can impose rate pacing for single-ended interception connections with no peer SteelHead. By defining an SEI connection rule, you can enforce rate pacing even when the SteelHead is not peered with an SCPS device and SCPS is not negotiated.
To enforce rate pacing for a single-ended interception connection, create an SEI connection rule for use as a transport-optimization proxy, select a congestion method for the rule, and then configure a QoS rule (with the same client/server subnet) to use MX-TCP. RiOS 8.5 and later accelerate the WAN-originated or LAN-originated proxied connection using MX-TCP.
By default, the SEI connection rules table is disabled. When enabled, two default rules appear in the rules table. The first default rule matches all traffic with the destination port set to the interactive port label and bypasses the connection for SCPS optimization.
The second default rule matches all traffic with the destination port set to the RBT-Proto port label and bypasses the connection for SCPS optimization.
This option doesn’t affect the optimization of SCPS connections between SteelHeads.
When you disable the table, you can still add, move, or remove rules, but the changes don’t take effect until you reenable the table.
The Management Console dims the SEI rules table until you install a SkipWare license.
Enable SkipWare Legacy Compression - Enables negotiation of SCPS-TP TCP header and data compression with a remote SCPS-TP device. This feature enables interoperation with RSP SkipWare packages and TurboIP devices that have also been configured to negotiate TCP header and data compression.
Legacy compression is disabled by default.
After enabling or disabling legacy compression, you must restart the optimization service.
The Management Console dims legacy compression until you install a SkipWare license and enable the SEI rules table.
Legacy compression also works with non-SCPS TCP algorithms.
These limits apply to legacy compression:
• This feature is not compatible with IPv6.
• Packets with a compressed TCP header use IP protocol 105 in the encapsulating IP header; this might require changes to intervening firewalls to permit protocol 105 packets to pass.
• This feature supports a maximum of 255 connections between any pair of end-host IP addresses. The connection limit for legacy SkipWare connections is the same as the appliance-connection limit.
• QoS limits for the SteelHead apply to the legacy SkipWare connections.
To view SCPS connections, see “Viewing current connection reports” on page 496.
Control Description
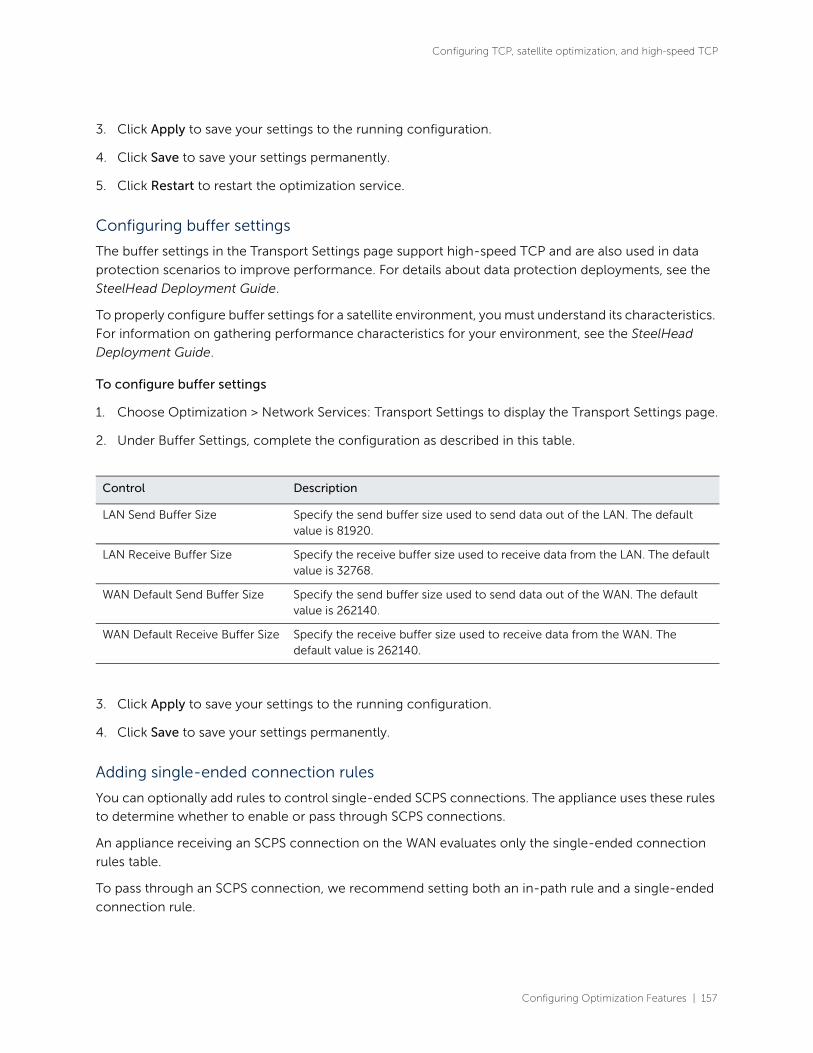
Configuring Optimization Features | 157
Configuring TCP, satellite optimization, and high-speed TCP
3. Click Apply to save your settings to the running configuration.
4. Click Save to save your settings permanently.
5. Click Restart to restart the optimization service.
Configuring buffer settings
The buffer settings in the Transport Settings page support high-speed TCP and are also used in data
protection scenarios to improve performance. For details about data protection deployments, see the
SteelHead Deployment Guide.
To properly configure buffer settings for a satellite environment, you must understand its characteristics.
For information on gathering performance characteristics for your environment, see the SteelHead
Deployment Guide.
To configure buffer settings
1. Choose Optimization > Network Services: Transport Settings to display the Transport Settings page.
2. Under Buffer Settings, complete the configuration as described in this table.
3. Click Apply to save your settings to the running configuration.
4. Click Save to save your settings permanently.
Adding single-ended connection rules
You can optionally add rules to control single-ended SCPS connections. The appliance uses these rules
to determine whether to enable or pass through SCPS connections.
An appliance receiving an SCPS connection on the WAN evaluates only the single-ended connection
rules table.
To pass through an SCPS connection, we recommend setting both an in-path rule and a single-ended
connection rule.
Control Description
LAN Send Buffer Size Specify the send buffer size used to send data out of the LAN. The default value is 81920.
LAN Receive Buffer Size Specify the receive buffer size used to receive data from the LAN. The default value is 32768.
WAN Default Send Buffer Size Specify the send buffer size used to send data out of the WAN. The default value is 262140.
WAN Default Receive Buffer Size Specify the receive buffer size used to receive data from the WAN. The default value is 262140.

158 | Configuring Optimization Features
Configuring TCP, satellite optimization, and high-speed TCP
To add a single-ended connection rule
1. Choose Optimization > Network Services: Transport Settings to display the Transport Settings page.
Figure 7-14. Single-Ended Connection Rules
2. Under Single-Ended Connection Rules, complete the configuration as described in this table.
Control Description
Add New Rule Displays the controls for adding a new rule.
Position Select Start, End, or a rule number from the drop-down list. SteelHeads evaluate rules in numerical order starting with rule 1. If the conditions set in the rule match, then the rule is applied, and the system moves on to the next packet. If the conditions set in the rule don’t match, the system consults the next rule. As an example, if the conditions of rule 1 don’t match, rule 2 is consulted. If rule 2 matches the conditions, it’s applied, and no further rules are consulted.
Source Subnet Specify an IPv4 or IPv6 address and mask for the traffic source.
You can also specify wildcards:
• All-IPv4 is the wildcard for single-stack IPv4 networks.
• All-IPv6 is the wildcard for single-stack IPv6 networks.
• All-IP is the wildcard for all IPv4 and IPv6 networks.
Use these formats:
xxx.xxx.xxx.xxx/xx (IPv4)
x:x:x::x/xxxx (IPv6)
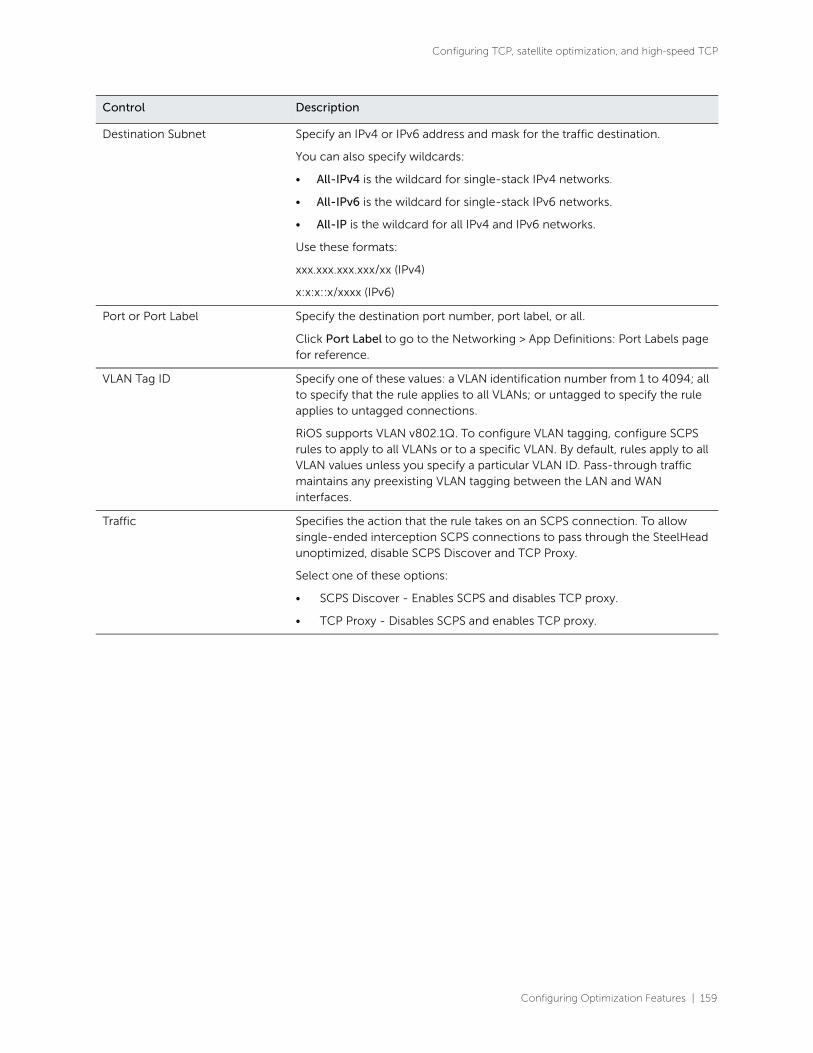
Configuring Optimization Features | 159
Configuring TCP, satellite optimization, and high-speed TCP
Destination Subnet Specify an IPv4 or IPv6 address and mask for the traffic destination.
You can also specify wildcards:
• All-IPv4 is the wildcard for single-stack IPv4 networks.
• All-IPv6 is the wildcard for single-stack IPv6 networks.
• All-IP is the wildcard for all IPv4 and IPv6 networks.
Use these formats:
xxx.xxx.xxx.xxx/xx (IPv4)
x:x:x::x/xxxx (IPv6)
Port or Port Label Specify the destination port number, port label, or all.
Click Port Label to go to the Networking > App Definitions: Port Labels page for reference.
VLAN Tag ID Specify one of these values: a VLAN identification number from 1 to 4094; all to specify that the rule applies to all VLANs; or untagged to specify the rule applies to untagged connections.
RiOS supports VLAN v802.1Q. To configure VLAN tagging, configure SCPS rules to apply to all VLANs or to a specific VLAN. By default, rules apply to all VLAN values unless you specify a particular VLAN ID. Pass-through traffic maintains any preexisting VLAN tagging between the LAN and WAN interfaces.
Traffic Specifies the action that the rule takes on an SCPS connection. To allow single-ended interception SCPS connections to pass through the SteelHead unoptimized, disable SCPS Discover and TCP Proxy.
Select one of these options:
• SCPS Discover - Enables SCPS and disables TCP proxy.
• TCP Proxy - Disables SCPS and enables TCP proxy.
Control Description

160 | Configuring Optimization Features
Configuring TCP, satellite optimization, and high-speed TCP
Congestion Control Algorithm Select a method for congestion control from the drop-down list.
• Standard (RFC-Compliant) - Optimizes non-SCPS TCP connections by applying data and transport streamlining for TCP traffic over the WAN. This control forces peers to use standard TCP as well. For details on data and transport streamlining, see the SteelHead Deployment Guide. This option clears any advanced bandwidth congestion control that was previously set.
• HighSpeed - Enables high-speed TCP optimization for more complete use of long fat pipes (high-bandwidth, high-delay networks). Do not enable for satellite networks.
We recommend that you enable high-speed TCP optimization only after you have carefully evaluated whether it will benefit your network environment. For details about the trade-offs of enabling high-speed TCP, see tcp highspeed enable in the Riverbed Command-Line Interface Reference Manual.
• Bandwidth Estimation - Uses an intelligent bandwidth estimation algorithm along with a modified slow-start algorithm to optimize performance in long lossy networks. These networks typically include satellite and other wireless environments, such as cellular networks, longer microwave, or Wi-Max networks.
Bandwidth estimation is a sender-side modification of TCP and is compatible with the other TCP stacks in the RiOS system. The intelligent bandwidth estimation is based on analysis of both ACKs and latency measurements. The modified slow-start mechanism enables a flow to ramp up faster in high latency environments than traditional TCP. The intelligent bandwidth estimation algorithm allows it to learn effective rates for use during modified slow start, and also to differentiate BER loss from congestion-derived loss and deal with them accordingly. Bandwidth estimation has good fairness and friendliness qualities toward other traffic along the path.
• SkipWare Per-Connection - Applies TCP congestion control to each SCPS-capable connection. This method is compatible with IPv6. The congestion control uses:
– a pipe algorithm that gates when a packet should be sent after receipt of an ACK.
– the NewReno algorithm, which includes the sender's congestion window, slow start, and congestion avoidance.
– time stamps, window scaling, appropriate byte counting, and loss detection.
This transport setting uses a modified slow-start algorithm and a modified congestion-avoidance approach. This method enables SCPS per connection to ramp up flows faster in high-latency environments, and handle lossy scenarios, while remaining reasonably fair and friendly to other traffic. SCPS per-connection does a very good job of efficiently filling up satellite links of all sizes. SkipWare per-connection is a high-performance option for satellite networks.
The Management Console dims this setting until you install a SkipWare license.
Control Description

Configuring Optimization Features | 161
Configuring TCP, satellite optimization, and high-speed TCP
• SkipWare Error-Tolerant - Enables SkipWare optimization with the error-rate detection and recovery mechanism on the SteelHead. This method is compatible with IPv6.
This method tolerates some loss due to corrupted packets (bit errors), without reducing the throughput, using a modified slow-start algorithm and a modified congestion avoidance approach. It requires significantly more retransmitted packets to trigger this congestion-avoidance algorithm than the SkipWare per-connection setting. Error-tolerant TCP optimization assumes that the environment has a high BER and most retransmissions are due to poor signal quality instead of congestion. This method maximizes performance in high-loss environments, without incurring the additional per-packet overhead of a FEC algorithm at the transport layer.
Use caution when enabling error-tolerant TCP optimization, particularly in channels with coexisting TCP traffic, because it can be quite aggressive and adversely affect channel congestion with competing TCP flows.
The Management Console dims this setting until you install a SkipWare license.
Control Description
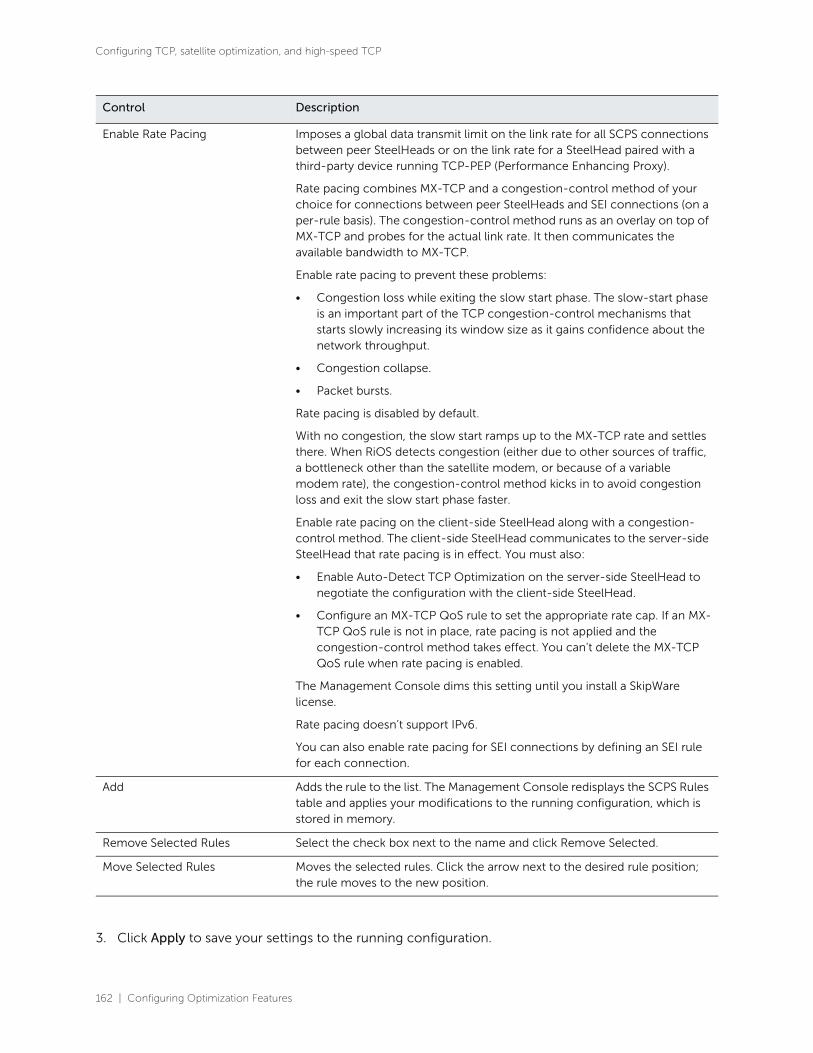
162 | Configuring Optimization Features
Configuring TCP, satellite optimization, and high-speed TCP
3. Click Apply to save your settings to the running configuration.
Enable Rate Pacing Imposes a global data transmit limit on the link rate for all SCPS connections between peer SteelHeads or on the link rate for a SteelHead paired with a third-party device running TCP-PEP (Performance Enhancing Proxy).
Rate pacing combines MX-TCP and a congestion-control method of your choice for connections between peer SteelHeads and SEI connections (on a per-rule basis). The congestion-control method runs as an overlay on top of MX-TCP and probes for the actual link rate. It then communicates the available bandwidth to MX-TCP.
Enable rate pacing to prevent these problems:
• Congestion loss while exiting the slow start phase. The slow-start phase is an important part of the TCP congestion-control mechanisms that starts slowly increasing its window size as it gains confidence about the network throughput.
• Congestion collapse.
• Packet bursts.
Rate pacing is disabled by default.
With no congestion, the slow start ramps up to the MX-TCP rate and settles there. When RiOS detects congestion (either due to other sources of traffic, a bottleneck other than the satellite modem, or because of a variable modem rate), the congestion-control method kicks in to avoid congestion loss and exit the slow start phase faster.
Enable rate pacing on the client-side SteelHead along with a congestion-control method. The client-side SteelHead communicates to the server-side SteelHead that rate pacing is in effect. You must also:
• Enable Auto-Detect TCP Optimization on the server-side SteelHead to negotiate the configuration with the client-side SteelHead.
• Configure an MX-TCP QoS rule to set the appropriate rate cap. If an MX-TCP QoS rule is not in place, rate pacing is not applied and the congestion-control method takes effect. You can’t delete the MX-TCP QoS rule when rate pacing is enabled.
The Management Console dims this setting until you install a SkipWare license.
Rate pacing doesn’t support IPv6.
You can also enable rate pacing for SEI connections by defining an SEI rule for each connection.
Add Adds the rule to the list. The Management Console redisplays the SCPS Rules table and applies your modifications to the running configuration, which is stored in memory.
Remove Selected Rules Select the check box next to the name and click Remove Selected.
Move Selected Rules Moves the selected rules. Click the arrow next to the desired rule position; the rule moves to the new position.
Control Description

Configuring Optimization Features | 163
Configuring service ports
4. Click Save to save your settings permanently.
Note: After you apply your settings, you can verify whether changes have had the desired effect by viewing the
Current Connections report. The report summarizes the optimized established connections for SCPS. SCPS
connections appear as typical established, optimized or established, or single-ended optimized connections. Click
the connection to view details. SCPS connection detail reports display SCPS Initiate or SCPS Terminate under
Connection Information. Under Congestion Control, the report displays the congestion control method that the
connection is using.
High-speed TCP optimization
The high-speed TCP feature provides acceleration and high throughput for high-bandwidth links (also
known as long fat networks, or LFNs) for which the WAN pipe is large but latency is high. High-speed
TCP is activated for all connections that have a BDP larger than 100 packets.
Note: For details about using HS-TCP in data protection scenarios, see the SteelHead Deployment Guide.
HS-TCP basic steps
This table describes the basic steps needed to configure high-speed TCP.
Configuring service portsYou configure service port settings in the Optimization > Network Services: Service Ports page.
Service ports are the ports used for inner connections between appliances.
Task Reference
1. Enable high-speed TCP support. “Optimizing TCP and satellite WANs” on page 149.
2. Increase the WAN buffers to 2 * Bandwidth Delay Product (BDP).
You can calculate the BDP WAN buffer size:
Buffer size in bytes = 2 * bandwidth (in bps) * delay (in sec) / 8 (bits per byte)
Example: For a link of 155 Mbps and 100 ms round-trip delay.
Bandwidth = 155 Mbps = 155000000 bps
Delay = 100 ms = 0.1 sec
BDP = 155 000 000 * 0.1 / 8 = 1937500 bytes Buffer size in bytes = 2 * BDP = 2 * 1937500 = 3 875 000 bytes.
If this number is greater than the default (256 KB), enable HS-TCP with the correct buffer size.
“To configure buffer settings” on page 157.
3. Increase the LAN buffers to 1 MB. “To configure buffer settings” on page 157.
4. Enable in-path support. “Configuring general service settings” on page 108.
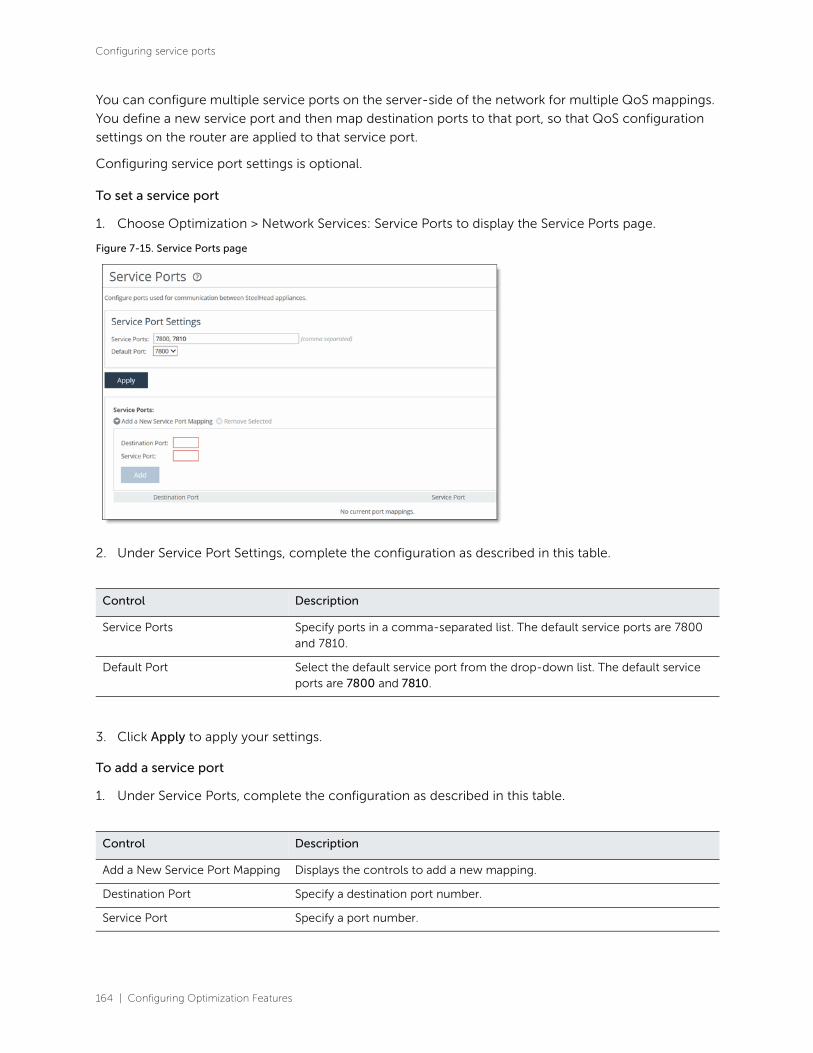
164 | Configuring Optimization Features
Configuring service ports
You can configure multiple service ports on the server-side of the network for multiple QoS mappings.
You define a new service port and then map destination ports to that port, so that QoS configuration
settings on the router are applied to that service port.
Configuring service port settings is optional.
To set a service port
1. Choose Optimization > Network Services: Service Ports to display the Service Ports page.
Figure 7-15. Service Ports page
2. Under Service Port Settings, complete the configuration as described in this table.
3. Click Apply to apply your settings.
To add a service port
1. Under Service Ports, complete the configuration as described in this table.
Control Description
Service Ports Specify ports in a comma-separated list. The default service ports are 7800 and 7810.
Default Port Select the default service port from the drop-down list. The default service ports are 7800 and 7810.
Control Description
Add a New Service Port Mapping Displays the controls to add a new mapping.
Destination Port Specify a destination port number.
Service Port Specify a port number.

Configuring Optimization Features | 165
Configuring domain labels
2. Click Save to save your settings permanently.
Related topic
• “Configuring general service settings” on page 108
Configuring domain labelsYou create domain labels in the Networking > App Definitions: Domain Labels page.
Domain labels are names given to a group of domains to streamline configuration. You can specify an
internet domain with wildcards to define a wider group. For example, you can create a domain label
called Office365 and add *.microsoftonline.com, *.office365.com, or *.office.com.
Domain labels provide flexible domain and hostname-based interception through a dynamic IP address
to accommodate network environments that are changing from static to dynamic IP addresses.
Domain labels are optional.
When to use
Use domain labels to:
• create a logical set of domain names—apply an in-path rule to the entire set instead of creating individual rules for each domain name. One rule replaces many rules. For example, you can define a set of services in a domain label, use that domain label in an in-path rule, and apply an optimization policy based on the application or service being accessed.
• match a specific set of services—domain labels can be especially useful when an IP address and subnet hosts many services and you don’t need your in-path rule to match them all.
• replace a fixed IP address for a server—Some SaaS providers and the O365 VNext architecture that serve multiple O365 applications such as Sharepoint, Lync, and Exchange no longer provide a fixed IP address for the server. With many IP addresses on the same server, a single address is no longer enough to match with an in-path rule. Let’s suppose you need to select and optimize a specific SaaS service. Create a domain label and then use it with a host label and an in-path rule to intercept and optimize the traffic.
Dependencies
Domain labels have these dependencies:
• They are compatible with autodiscover, passthrough, and fixed-target (not packet mode) in-path rules.
Add Adds the port numbers.
Remove Selected Select the check box next to the name and click Remove Selected.
Control Description

166 | Configuring Optimization Features
Configuring domain labels
• They don’t replace the destination IP address. The in-path rule still sets the destination using IP/subnet (or uses a host label or port). The in-path rule matches the IP address and port first, and then matches the domain label second. The rule must match both the destination and the domain label.
• They aren’t compatible with IPv6.
Because domain labels are compatible with IPv4 only, you must set the source and destination to All IPv4 or a specific IPv4 address when adding a domain label to an in-path rule.
• The client-side and server-side SteelHeads must be running RiOS 9.2 or later.
• A fixed-target rule with a domain label match followed by an auto-discover rule will not use autodiscovery but will instead pass through the traffic. This happens because the matching SYN packet for a fixed-target rule with a domain-label isn’t sent with a probe.
• Domain labels and cloud acceleration are mutually exclusive. When you add a domain label to an in-path rule that has cloud acceleration enabled, the system automatically sets cloud acceleration to Pass Through and connections to the subscribed SaaS platform are no longer optimized by the SteelHead SaaS. To use cloud acceleration with domain labels, place the domain label rules lower than cloud acceleration rules in your rule list so the cloud rules match before the domain label rules.
• We recommend adding domain label rules last in the list, so RiOS matches all previous rules before matching the domain label rule.
• When you add a domain label to an in-path rule with the ports set to All, the in-path rule defaults to ports HTTP (80) and HTTPS (443) for optimization. A warning states that only HTTP and HTTPS ports are in use. When you choose a specific port number or port range, the in-path rule matches those ports.
• They aren’t compatible with connection forwarding.
• You can’t use domain labels with QoS rules.

Configuring Optimization Features | 167
Configuring domain labels
Creating a domain label
To create a domain label
1. Choose Networking > App Definitions: Domain Labels.
Figure 7-16. Domain Labels page
2. To add a domain label, complete the configuration as described in this table.
Control Description
Add a New Domain Label Displays the controls to add a new domain label.
Name Specify the label name. These rules apply:
• A domain label name can be up to 64 characters long.
• Domain label names are case sensitive and can be any string consisting of letters, numbers, the underscore ( _ ), or the hyphen ( - ). There can’t be spaces in domain label names.
• We suggest starting the name with a letter or underscore, although the first character can be a number.
• To avoid confusion, don’t use a number for a domain label.

168 | Configuring Optimization Features
Configuring domain labels
Modifying domains in a domain label
You add or delete domains in the Domain Labels page.
To modify the domains in a domain label
1. Choose Networking > App Definitions: Domain Labels to display the Domain Labels page.
2. Select the domain label name in the Domain Label table.
3. Make changes to the list of domains in the Domains text box.
4. Click Apply to save your settings to the running configuration. RiOS immediately applies domain label changes to in-path rules, changing the traffic processing for all rules using the label.
Domains Specify a comma-separated list of domains. Keep in mind that the URL might use other domains. For example, www.box.com might also use srv1.box.net and other domains. Determine all of the domains whose traffic you want to optimize, and make an entry in the domain label for each one. Domain labels are most useful when they specify a narrow destination IP range, so use the smallest destination IP/range you can. Using a host label can help to narrow the destination IP range.
These rules apply to domain label entries:
• Matching is not case sensitive.
• You must include a top-level domain: for example, .com. You cannot include a wildcard in a top-level domain.
• You must specify second-level domains: for example, *.outlook.com, but not *.com.
• You can also separate domains with spaces or new lines.
• A domain name can be up to 64 characters long.
• Characters must be alphanumeric (0-9, a-z, A-Z), periods, underscores, wildcards, and hyphens.
• Do not use consecutive periods.
• Do not use consecutive wildcards.
• Do not use IP addresses.
A domain can appear in multiple domain labels. You can create up to 63 unique domain labels.
Remove Selected Select the check box next to the name and click Remove Selected. You can’t delete domain labels that an in-path rule is using.
Add New Domain Label Adds the domain label. The page updates the domain label table with the new domain label.
Control Description

Configuring Optimization Features | 169
Configuring host labels
Related topics
• “Configuring host labels” on page 169
Configuring host labelsYou create host labels in the Networking > App Definitions: Host Labels page.
Host labels are names given to sets of hostnames and subnets to streamline configuration. Host labels
provide flexibility because you can create a logical set of hostnames and then apply a rule, such as a QoS
rule, to the entire set instead of creating individual rules for each hostname. For example, you can define
a set of file servers in a host label, use that host label in a single QoS rule, and apply a policy limiting all
IP traffic to and from the servers (independent of what protocol or application is in use).
Other ways to use host labels:
• List multiple dedicated application servers by hostname in a single rule and apply a policy
• List multiple business websites and servers to protect
• List recreational websites to restrict
Host labels are optional.
Host labels are not compatible with IPv6.
Creating a host label
To create a host label
1. Choose Networking > App Definitions: Host Labels to display the Host Labels page.
Figure 7-17. Host Labels page
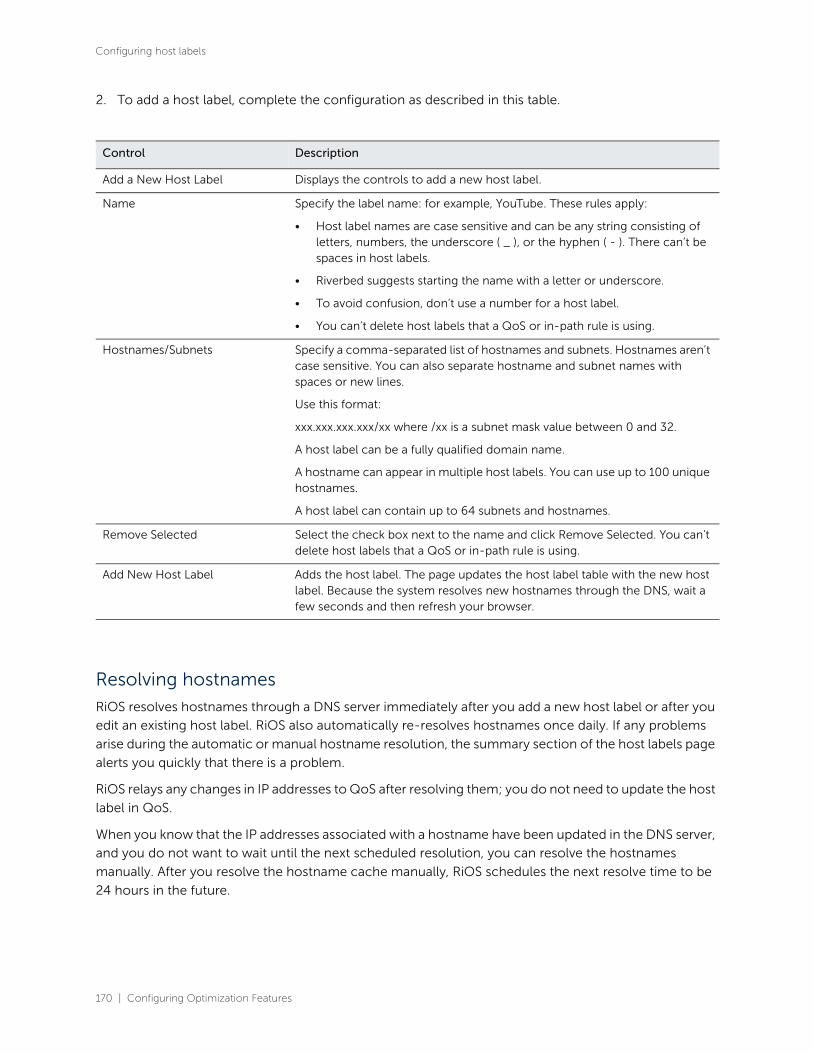
170 | Configuring Optimization Features
Configuring host labels
2. To add a host label, complete the configuration as described in this table.
Resolving hostnames
RiOS resolves hostnames through a DNS server immediately after you add a new host label or after you
edit an existing host label. RiOS also automatically re-resolves hostnames once daily. If any problems
arise during the automatic or manual hostname resolution, the summary section of the host labels page
alerts you quickly that there is a problem.
RiOS relays any changes in IP addresses to QoS after resolving them; you do not need to update the host
label in QoS.
When you know that the IP addresses associated with a hostname have been updated in the DNS server,
and you do not want to wait until the next scheduled resolution, you can resolve the hostnames
manually. After you resolve the hostname cache manually, RiOS schedules the next resolve time to be
24 hours in the future.
Control Description
Add a New Host Label Displays the controls to add a new host label.
Name Specify the label name: for example, YouTube. These rules apply:
• Host label names are case sensitive and can be any string consisting of letters, numbers, the underscore ( _ ), or the hyphen ( - ). There can’t be spaces in host labels.
• Riverbed suggests starting the name with a letter or underscore.
• To avoid confusion, don’t use a number for a host label.
• You can’t delete host labels that a QoS or in-path rule is using.
Hostnames/Subnets Specify a comma-separated list of hostnames and subnets. Hostnames aren’t case sensitive. You can also separate hostname and subnet names with spaces or new lines.
Use this format:
xxx.xxx.xxx.xxx/xx where /xx is a subnet mask value between 0 and 32.
A host label can be a fully qualified domain name.
A hostname can appear in multiple host labels. You can use up to 100 unique hostnames.
A host label can contain up to 64 subnets and hostnames.
Remove Selected Select the check box next to the name and click Remove Selected. You can’t delete host labels that a QoS or in-path rule is using.
Add New Host Label Adds the host label. The page updates the host label table with the new host label. Because the system resolves new hostnames through the DNS, wait a few seconds and then refresh your browser.

Configuring Optimization Features | 171
Configuring port labels
To resolve hostnames through the DNS immediately
• Click Resolve Hostnames.
To show or hide the resolved IP addresses of the hostnames
• Select or clear the Show resolved IPs for the hostnames in the table below check box.
When the system resolves a hostname, the elapsed time appears next to the Resolved label.
Viewing the hostname resolution summary
The summary section displays this information:
• Unique Hostnames - The total number of unique hostnames, because a hostname can appear in multiple host labels. You can configure a maximum of 100 unique hostnames.
• Checking DNS - The number of unique hostnames that are actively being resolved.
• Unresolvable - The number of unique hostnames that cannot be resolved through the DNS because the DNS server is not configured, the DNS server is not reachable due to network connectivity issues, there is a typo in the hostname, and so on.
On rare occasions, if the DNS server goes down after resolving a hostname once, the system keeps the information, even though it might be stale. When this occurs, this message appears:
Note: This hostname was resolved successfully at least once in the past but the last attempt failed.
Modifying hostnames or subnets in a host label
You add or delete hostnames or subnets associated with a host label in the Host Labels page.
To modify hostnames or subnets in a host label
1. Choose Networking > App Definitions: Host Labels to display the Host Labels page.
2. Select the host label name in the Host Label table.
3. Add or delete hostnames or subnets in the Hostnames/Subnets text box.
4. Click Apply to save your settings to the running configuration. RiOS immediately applies host label changes to QoS, changing the traffic processing for all rules using the label.
5. Verify that any new hostnames resolve successfully to the expected IP addresses.
Related topics
• “Modifying general host settings” on page 53
• “Adding QoS profiles” on page 302
Configuring port labelsYou create port labels in the Networking > App Definitions: Port Labels page.

172 | Configuring Optimization Features
Configuring port labels
Port labels are names given to sets of port numbers. You use port labels when configuring in-path rules.
For example, you can use port labels to define a set of ports for which the same in-path, peering, QoS
classification, and QoS marking rules apply.
This table summarizes the port labels that are provided by default.
If you do not want to automatically forward traffic on interactive, RBT-Proto, secure ports or FTP, you
must delete the Interactive, RBT-Proto, Secure, and FTP in-path rules. For details, see “In-path rules
overview” on page 87.
For information on common port assignments, see “SteelFusion Edge Ports” on page 693.
This feature is optional.
To create a port label
1. Choose Networking > App Definitions: Port Labels to display the Port Labels page.
Figure 7-18. Port Labels page
Port Type Description and Ports
SteelFusion Use this port label to automatically pass-through traffic on SteelFusion Core ports 7950 - 7954 (data transfers), and 7970 (management). SteelFusion Core delivers block-storage optimization that accelerates access to storage area networks (SANs) across the WAN, decoupling storage from servers and allowing data to reside in one location.
Interactive Use this port label to automatically pass-through traffic on interactive ports (for example, Telnet, TCP ECHO, remote logging, and shell).
RBT-Proto Use this port label to automatically pass-through traffic on ports used by the system: 7744 (RiOS data store synchronization), 7800-7801 (in-path), 7810 (out-of-path), 7820 (failover), 7850 (connection forwarding), 7860 (Interceptor appliance), 7870 (SteelCentral Controller for SteelHead Mobile).
Secure Use this port label to automatically pass-through traffic on commonly secure ports (for example, SSH, HTTPS, and SMTPS).
FTP Use this port label to automatically pass-through traffic on FTP ports 20 and 21.

Configuring Optimization Features | 173
Configuring port labels
2. Complete the configuration as described in this table.
3. Click Save to save your settings permanently.
Modifying ports in a port label
You add or delete ports associated with a port label in the Port Label: <port-label-name> page.
To modify ports in a port label
1. Choose Networking > App Definitions: Port Labels to display the Port Labels page.
Control Description
Add a New Port Label Displays the controls to add a new port label.
Name Specify the label name. These rules apply:
• Port labels aren’t case sensitive and can be any string consisting of letters, the underscore ( _ ), or the hyphen ( - ). There can’t be spaces in port labels.
• The fields in the various rule pages of the Management Console that take a physical port number also take a port label.
• To avoid confusion, don’t use a number for a port label.
• Port labels that are used in in-path and other rules, such as QoS and peering rules, can’t be deleted.
• Port label changes (that is, adding and removing ports inside a label) are applied immediately by the rules that use the port labels that you have modified.
Ports Specify a comma-separated list of ports.
Remove Selected Select the check box next to the name and click Remove Selected.
Add Adds the port label.
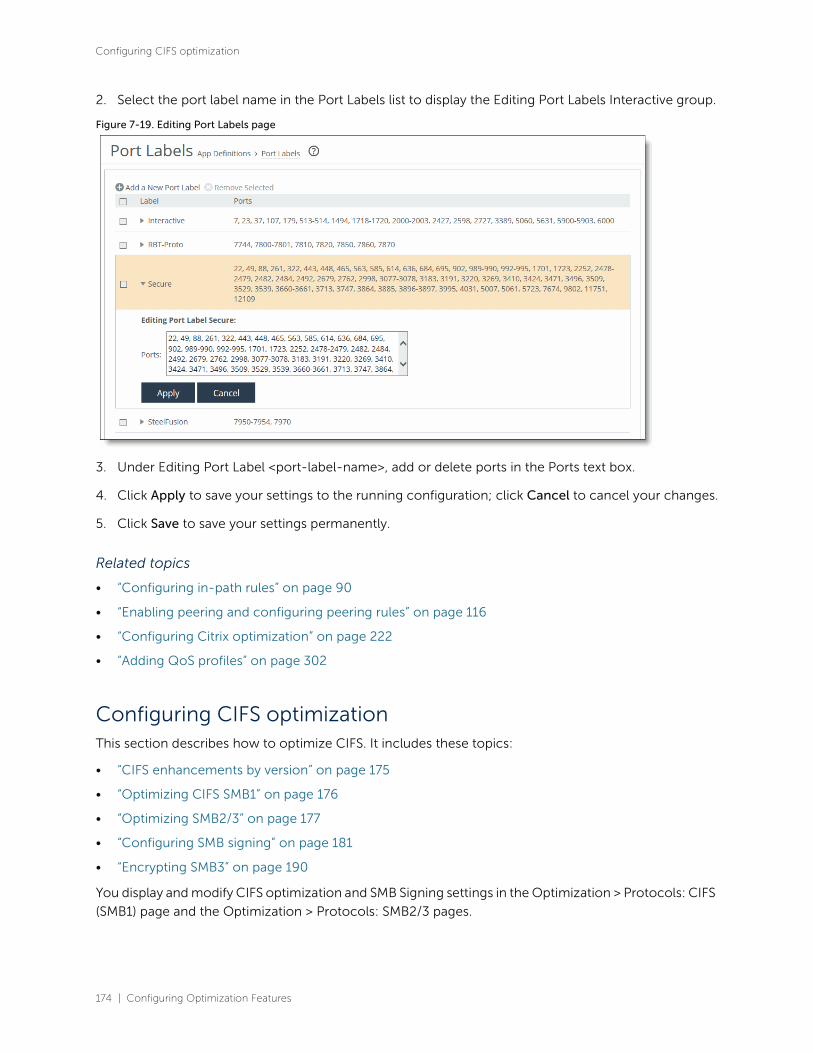
174 | Configuring Optimization Features
Configuring CIFS optimization
2. Select the port label name in the Port Labels list to display the Editing Port Labels Interactive group.
Figure 7-19. Editing Port Labels page
3. Under Editing Port Label <port-label-name>, add or delete ports in the Ports text box.
4. Click Apply to save your settings to the running configuration; click Cancel to cancel your changes.
5. Click Save to save your settings permanently.
Related topics
• “Configuring in-path rules” on page 90
• “Enabling peering and configuring peering rules” on page 116
• “Configuring Citrix optimization” on page 222
• “Adding QoS profiles” on page 302
Configuring CIFS optimizationThis section describes how to optimize CIFS. It includes these topics:
• “CIFS enhancements by version” on page 175
• “Optimizing CIFS SMB1” on page 176
• “Optimizing SMB2/3” on page 177
• “Configuring SMB signing” on page 181
• “Encrypting SMB3” on page 190
You display and modify CIFS optimization and SMB Signing settings in the Optimization > Protocols: CIFS
(SMB1) page and the Optimization > Protocols: SMB2/3 pages.

Configuring Optimization Features | 175
Configuring CIFS optimization
CIFS enhancements by version
This section lists and describes new CIFS and SMB features and enhancements by RiOS version.
• RiOS 9.5 added the following support:
– Ability to optimize Distributed File System (DFS) shares over SMB2/3.
– Ability to make SMB2 files, directories, and shares case insensitive by entering the protocol smb2 caseless enable command.
• RiOS 9.2 provides support for SMB 3.1.1 latency and bandwidth optimization. It also provides support for SMB file sharing as well as Windows domain integration for Windows 10 and Windows Server 2016 Technical Preview 2.
• RiOS 9.0 and later provide support for SMB 3.02 latency and bandwidth optimization.
• RiOS 8.5 and later support Active Directory integration with Windows 2012 domain function level.
• RiOS 8.5 and later provide support for SMB3 latency and bandwidth optimization.
• RiOS 8.0 and later provide support for SMB1 signing settings for macOS Lion (10.7) and Mountain Lion (10.8). RiOS 8.0 doesn’t support SMB2 signing settings for macOS Lion (10.7) and Mountain Lion (10.8).
CIFS latency optimization doesn’t require a separate license. SMB1 is enabled by default.
Typically, you disable CIFS optimizations only to troubleshoot the system.
SMB dialects by Windows version
* WS = Windows Server
OS Windows 10
WS* 2016
Technical
Preview 2
Windows 8.1
WS 2012 R2
Windows 8
WS 2012
Windows 7
WS 2008 R2
Windows
Vista
WS 2008
Previous
versions
Windows 10
WS 2016 TP2
SMB 3.1.1 SMB 3.0.2 SMB 3.0 SMB 2.1 SMB 2.0.2 SMB 1.x
Windows 8.1
WS 2012 R2
SMB 3.0.2 SMB 3.0.2 SMB 3.0 SMB 2.1 SMB 2.0.2 SMB 1.x
Window 8
WS 2012
SMB 3.0 SMB 3.0 SMB 3.0 SMB 2.1 SMB 2.0.2 SMB 1.x
Windows 7
WS 2008 R2
SMB 2.1 SMB 2.1 SMB 2.1 SMB 2.1 SMB 2.0.2 SMB 1.x
Windows Vista
WS 2008
SMB 2.0.2 SMB 2.0.2 SMB 2.0.2 SMB 2.0.2 SMB 2.0.2 SMB 1.x
Previous Versions
SMB 1.x SMB 1.x SMB 1.x SMB 1.x SMB 1.x SMB 1.x
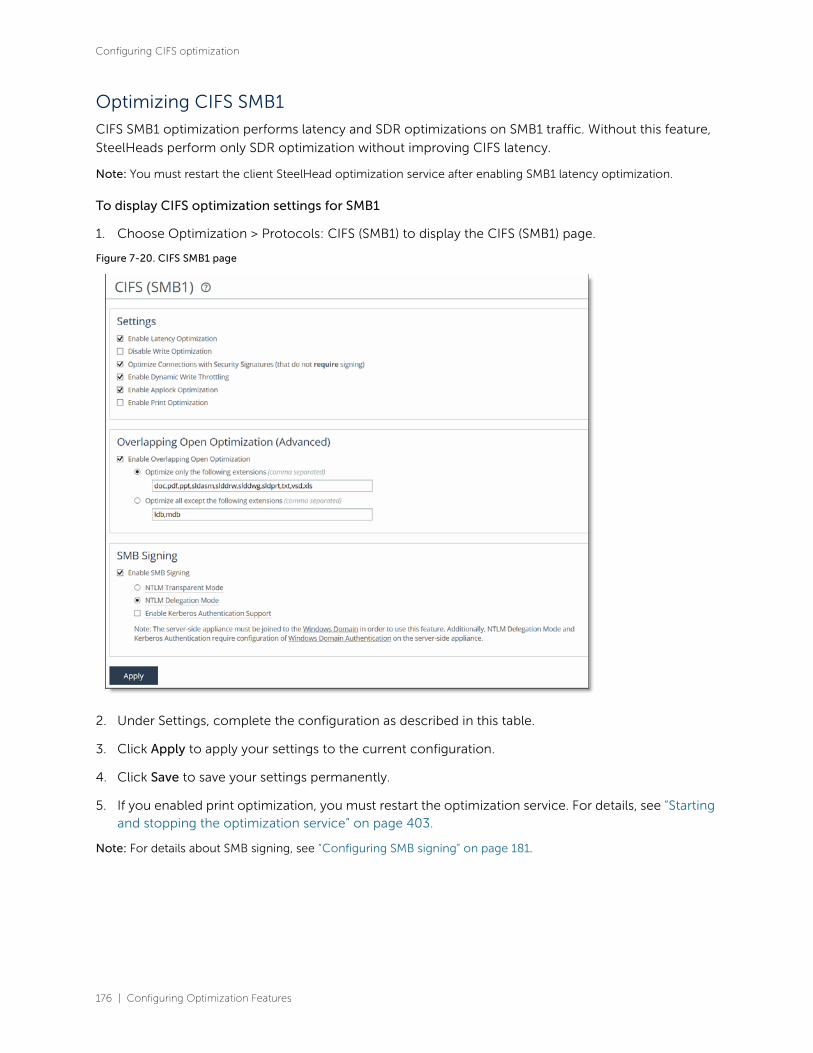
176 | Configuring Optimization Features
Configuring CIFS optimization
Optimizing CIFS SMB1
CIFS SMB1 optimization performs latency and SDR optimizations on SMB1 traffic. Without this feature,
SteelHeads perform only SDR optimization without improving CIFS latency.
Note: You must restart the client SteelHead optimization service after enabling SMB1 latency optimization.
To display CIFS optimization settings for SMB1
1. Choose Optimization > Protocols: CIFS (SMB1) to display the CIFS (SMB1) page.
Figure 7-20. CIFS SMB1 page
2. Under Settings, complete the configuration as described in this table.
3. Click Apply to apply your settings to the current configuration.
4. Click Save to save your settings permanently.
5. If you enabled print optimization, you must restart the optimization service. For details, see “Startingand stopping the optimization service” on page 403.
Note: For details about SMB signing, see “Configuring SMB signing” on page 181.
Configuring Optimization Features | 177
Configuring CIFS optimization
To enable Overlapping Open Optimization
1. On the client-side appliance, under Overlapping Open Optimization (Advanced), complete theconfiguration as described in this table.
2. Click Apply to apply your settings to the current configuration.
3. Click Save to save your settings permanently.
Note: After you apply your settings, you can verify whether changes have had the desired effect by reviewing related
reports. When you have verified appropriate changes, you can write the active configuration that is stored in
memory to the active configuration file (or you can save it as any filename you choose). For details about saving
configurations, see “Managing configuration files” on page 414.
Optimizing SMB2/3
This section describes the SMB support changes with recent releases of RiOS.
Note: Delegation mode signing is deprecated in SteelHead. Use NTLM Transparent Mode on the SteelHead for SMB optimization.
SMB3 support
Enabling SMB3 on an appliance also enables support for the SMB3.02 dialect introduced by Microsoft in
Windows 8.1 and Windows Server 2012 R2. SMB3.02 is only negotiated when systems of these
operating system versions are directly connected. SMB3.02 is qualified with SMB3.02 signed and
unsigned traffic over IPv4 and IPv6, and encrypted connections over IPv4 and IPv6. Authenticated
connections between a server-side appliance and a domain controller are only supported over IPv4.
Control Description
Enable Overlapping Open Optimization
Enables overlapping opens to obtain better performance with applications that perform multiple opens on the same file (for example, CAD applications). By default, this setting is disabled.
Enable this setting on the client-side SteelHead.
With overlapping opens enabled, the SteelHead optimizes data where exclusive access is available (in other words, when locks are granted). When an oplock is not available, the SteelHead doesn’t perform application-level latency optimizations but still performs SDR and compression on the data as well as TCP optimizations.
Note: If a remote user opens a file that is optimized using the overlapping opens feature and a second user opens the same file, they might receive an error if the file fails to go through a SteelHead (for example, certain applications that are sent over the LAN). If this occurs, disable overlapping opens for those applications.
Use the radio buttons to set either an include list or exclude list of file types subject to overlapping open optimization.
Optimize only the following extensions
Specify a list of extensions you want to include in overlapping open optimization.
Optimize all except the following extensions
Specify a list of extensions you don’t want to include. For example, specify any file extensions that Enable Applock Optimization is being used for.

178 | Configuring Optimization Features
Configuring CIFS optimization
RiOS includes support for SMB3 traffic latency and bandwidth optimization for native SMB3 clients and
servers.
Windows 8 clients and Windows 2012 servers feature SMB3, an upgrade to the CIFS communication
protocol. SMB3 adds features for greater resiliency, scalability, and improved security. SMB3 supports
these features:
• Encryption - If the SMB server and client negotiate SMB3 and the server is configured forencryption, all SMB packets are encrypted on the wire, except for when share-level encryption isconfigured. Share-level encryption marks a specific share on the server as being encrypted; if aclient opens a connection to the server and tries to access the share, the system encrypts the datathat goes to that share. The system does not encrypt the data that goes to other shares on the sameserver.
Encryption requires that you enable SMB signing.
• New Signing Algorithm - SMB3 uses the AES-CMAC algorithm instead of the HMAC-SHA256algorithm used by SMB2 and enables signing by default.
• Secure Dialect Negotiation - Detects man-in-the-middle attempts to downgrade the SMB 2/3protocol dialect or capabilities that the SMB client and server negotiate. Secure dialect negotiationis enabled by default in Windows 8 and Server 2012. You can use secure dialect negotiation withSMB2 when you are setting up a connection to a server running Server 2008-R2.
SMB 3.0 dialect introduces these enhancements:
– Allows an SMB client to retrieve hashes for a particular region of a file for use in branch cacheretrieval, as specified in [MS-PCCRC] section 2.4.
– Allows an SMB client to obtain a lease on a directory.
– Encrypts traffic between the SMB client and server on a per-share basis.
– Uses remote direct memory access (RDMA) transports, when the appropriate hardware andnetwork are available.
– Enhances failover between the SMB client and server, including optional handle persistence.
– Allows an SMB client to bind a session to multiple connections to the server. The system cansend a request through any channel associated with the session, and sends the correspondingresponse through the same channel previously used by the request.
To optimize signed SMB3 traffic, you must enable SMB3 optimization on the client-side and server-side
appliances.
For additional details on SMB 3.0 specifications, go to http://msdn.microsoft.com/en-us/library/
cc246482.aspx.
SMB2 support
RiOS supports for SMB2 traffic latency optimization for native SMB2 clients and servers. SMB2 allows
more efficient access across disparate networks. It is the default mode of communication between
Windows Vista and Windows Server 2008. Microsoft modified SMB2 again (to SMB2.1) for Windows 7 and
Windows Server 2008 R2.
SMB2 brought a number of improvements, including but not limited to:

Configuring Optimization Features | 179
Configuring CIFS optimization
• a vastly reduced set of opcodes (a total of only 18); in contrast, SMBv1 has over 70 separateopcodes. Note that use of SMB2 does not result in lost functionality (most of the SMB1 opcodeswere redundant).
• general mechanisms for data pipelining and lease-based flow control.
• request compounding, which allows multiple SMB requests to be sent as a single network request.
• larger reads and writes, which provide for more efficient use of networks with high latency.
• caching of folder and file properties, where clients keep local copies of folders and files.
• improved scalability for file sharing (number of users, shares, and open files per server greatlyincreased).
To display optimization settings for SMB2 and SMB3
1. Choose Optimization > Protocols: SMB2/3 to display the SMB2/3 page.
Figure 7-21. SMB2/3 page

180 | Configuring Optimization Features
Configuring CIFS optimization
2. Under Down-Negotiation, complete the configuration on the client-side appliance as described inthis table.
3. Under Optimization, complete the configuration on both the client-side and server-side appliancesas described in this table.
Control Description
None Don’t attempt to negotiate the CIFS session down to SMB1.
SMB2 and SMB3 to SMB1 Enable this control on the client-side SteelHead. Optimizes connections that are successfully negotiated down to SMB1 according to the settings on the Optimization > Protocols: CIFS (SMB1) page.
RiOS bypasses down-negotiation to SMB1 when the client or the server is configured to use only SMB2/3 or the client has already established an SMB2/3 connection with the server. If the client already has a connection with the server, you must restart the client.
Down-negotiation can fail if the client only supports SMB2 or if it bypasses negotiation because the system determines that the server supports SMB2. When down-negotiation fails, bandwidth optimization is not affected.
Control Description
None Disables SMB2 and SMB3 optimization.
Enable SMB2 Optimization Performs SMB2 latency optimization in addition to the existing bandwidth optimization features. These optimizations include cross-connection caching, read-ahead, write-behind, and batch prediction among several other techniques to ensure low-latency transfers. RiOS maintains the data integrity, and the client always receives data directly from the servers.
By default, SMB2 optimization is disabled.
You must enable (or disable) SMB2 latency optimization on both the client-side and server-side SteelHeads.
To enable SMB2, both SteelHeads must be running RiOS 6.5 or later. After enabling SMB2 optimization, you must restart the optimization service.
Configuring Optimization Features | 181
Configuring CIFS optimization
4. Click Apply to apply your settings to the current configuration.
5. If you have enabled or disabled SMB1, SMB2, or SMB3 optimization, you must restart the optimizationservice.
Related topic
• “Configuring CIFS prepopulation” on page 141
Configuring SMB signing
You display and modify SMB signing settings in the Optimization > Protocols: CIFS (SMB1) and (SMB2/3)
pages.
When sharing files, Windows provides the ability to sign CIFS messages to prevent man-in-the-middle
attacks. Each CIFS message has a unique signature that prevents the message from being tampered with.
This security feature is called SMB signing.
You can enable the RiOS SMB signing feature on a server-side SteelHead to alleviate latency in file access
with CIFS acceleration while maintaining message security signatures. With SMB signing on, the
SteelHead optimizes CIFS traffic by providing bandwidth optimizations (SDR and LZ), TCP optimizations,
and CIFS latency optimizations—even when the CIFS messages are signed.
RiOS includes support for optimizing SMB3-signed traffic for native SMB3 clients and servers. You must
enable SMB3 signing if the client or server uses any of these settings:
• SMB2/SMB3 signing set to required. SMB3 signing is enabled by default.
• SMB3 secure dialect negotiation (enabled by default on the Windows 8 client).
• SMB3 encryption.
Enable SMB3 Optimization Performs SMB3 latency optimization in addition to the existing bandwidth optimization features. This optimization includes cross-connection caching, read-ahead, write-behind, and batch prediction among several other techniques to ensure low-latency transfers. RiOS maintains the data integrity and the client always receives data directly from the servers.
By default, SMB3 optimization is disabled.
You must enable (or disable) SMB3 latency optimization on both the client-side and server-side SteelHeads.
You must enable SMB2 optimization to optimize SMB3.
To enable SMB3, both SteelHeads must be running RiOS 8.5 or later. After enabling SMB3 optimization, you must restart the optimization service.
Enable DFS Optimization Enables optimization for Distributed File System (DFS) file shares.
You must upgrade both your server-side and client-side SteelHeads to RiOS 9.5 or later to enable DFS optimization. However, this box only needs to be checked on the client-side SteelHead.
Control Description

182 | Configuring Optimization Features
Configuring CIFS optimization
RiOS includes support for optimizing SMB2-signed traffic for native SMB2 clients and servers. SMB2
signing support includes:
• Windows domain integration, including domain join and domain-level support.
• Authentication using transparent mode and delegation mode. Delegation mode is the default forSMB2. Transparent mode works out of the box with Windows Vista (but not Windows 7). To usetransparent mode with Windows 7, you must join the server-side SteelHead as an Active Directoryintegrated (Windows 2003) or an Active Directory integrated (Windows 2008 and later). For details,see “Authentication” on page 182.
• Secure inner-channel SSL support. For details, see “Configuring secure peers” on page 340.
Domain security
The RiOS SMB signing feature works with Windows domain security and is fully compliant with the
Microsoft SMB signing v1, v2, and v3 protocols. RiOS supports domain security in both native and mixed
modes for:
• Windows 2000
• Windows 2003 R2
• Windows 2008
• Windows 2008 R2
The server-side SteelHead in the path of the signed CIFS traffic becomes part of the Windows trust
domain. The Windows domain is either the same as the domain of the user or has a trust relationship
with the domain of the user. The trust relationship can be either a parent-child relationship or an
unrelated trust relationship.
RiOS optimizes signed CIFS traffic even when the logged-in user or client machine and the target server
belong to different domains, provided these domains have a trust relationship with the domain the
appliance has joined. RiOS supports delegation for users that are in domains trusted by the server's
domain. The trust relationships include:
• a basic parent and child domain relationship. Users from the child domain access CIFS/MAPI serversin the parent domain. For example, users in ENG.RVBD.COM accessing servers in RVBD.COM.
• a grandparent and child domain relationship. Users from the grandparent domain access resourcesfrom the child domain. For example, users from RVBD.COM accessing resources inDEV.ENG.RVBD.COM.
• a sibling domain relationship. For example, users from ENG.RVBD.COM access resources inMARKETING.RVBD.COM.
Authentication
The process RiOS uses to authenticate domain users depends upon the release version.
RiOS features these authentication modes:
Configuring Optimization Features | 183
Configuring CIFS optimization
• NTLM delegation mode - Uses Kerberos delegation architecture to authenticate signed packetsbetween the server-side SteelHead and any configured servers participating in the signed session.NTLM is used between the client-side appliance and server-side SteelHead. This is the default modefor SMB2. SMB2 delegation mode supports Windows 7 and Samba 4 clients. Delegation moderequires additional configuration of Windows domain authentication.
• NTLM transparent mode - Uses NTLM authentication end to end between the client-side andserver- side appliances and the server-side SteelHead and the server. This is the default mode forSMB1. Transparent mode supports all Windows servers, including Windows 2008 R2, that haveNTLM enabled. It is easier to configure.
• Kerberos authentication support - Uses Kerberos authentication end to end between the client-side appliance and the server-side SteelHead and the server-side SteelHead and the server.Kerberos authentication requires additional configuration of Windows domain authentication.
Transparent mode does not support:
• Windows 7 clients. RiOS supports transparent mode when you join the server-side SteelHead as anActive Directory integrated (Windows 2008) or an Active Directory integrated (Windows 2008).
• Windows 2008 R2 domains that have NTLM disabled.
• Windows servers that are in domains with NTLM disabled.
• Windows 7 clients that have NTLM disabled.
You can enable extra security using the secure inner channel. The peer appliances using the secure
channel encrypt signed CIFS traffic over the WAN. For details, see “Configuring secure peers” on
page 340..
SMB signing prerequisites
This section describes prerequisites and recommendations for using SMB signing:
• With RiOS SMB signing enabled, RiOS appliances sign the traffic between the client and the client-side appliance and between the server and the server-side SteelHead. The traffic is not signedbetween the appliances, but the appliances implement their own integrity mechanisms. WhetherRiOS appliances are used or not, SMB-signed traffic is only signed, not encrypted. For maximumsecurity, we recommend that you configure the appliances as SSL peers and use the secure innerchannel to secure the traffic between them. For details, see “Configuring secure peers” onpage 340.
• If you already have a delegate user and are joined to a domain, enabling SMB2 signing will workwhen enabled with no additional configuration.
• SMB signing requires joining a Windows domain. It is vital to set the correct time zone for joining adomain. The most common reason for failing to join a domain is a significant difference in thesystem time on the Windows domain controller and the RiOS appliance. When the time on thedomain controller and the RiOS appliance do not match, this error message appears:
lt-kinit: krb5_get_init_creds: Clock skew too great

184 | Configuring Optimization Features
Configuring CIFS optimization
We recommend using NTP time synchronization to synchronize the client and server clocks. It is critical that the RiOS appliance time is the same as on the Active Directory controller. Sometimes an NTP server is down or inaccessible, in which case there can be a time difference. You can also disable NTP if it is not being used and manually set the time. You must also verify that the time zone is correct. For details, see “Modifying general host settings” on page 53. For more troubleshooting, see “Troubleshooting a domain join failure” on page 389.
• Both the client and the server must support SMB2 and SMB3 to use RiOS SMB2 and SMB3 signing.
Verifying the domain functional level and host settings
This section describes how to verify the domain and DNS settings before joining the Windows domain
and enabling SMB signing.
To verify the domain functional level (delegation mode and replication users)
1. If you are using delegation mode or configuring replication users, verify that the Windows domainfunctionality is at the Windows 2003 level or higher. In Windows, open Active Directory Users andComputers on the domain controller, choose Domain Name, right-click, and select Raise Domainfunctionality level. If the domain is not already at the Windows 2003 level or higher, manually raisethe domain functionality.
If replication users are configured to use password replication policy (PRP), the domain functionallevel must be Windows 2008 or higher. For details about delegation mode, see “Enabling SMBsigning” on page 186. For details about replication users, see “Configuring replication users(Kerberos)” on page 265.
Note: After you raise the domain level, you cannot lower it.
Figure 7-22. Verifying the domain level before enabling SMB signing
For details, see the Microsoft Windows Server 2003 Active Directory documentation:
https://technet.microsoft.com/en-us/library/dd578336%28v=ws.10%29.aspx

Configuring Optimization Features | 185
Configuring CIFS optimization
2. Identify the full domain name, which must be the same as DNS. You must specify this name whenyou join the server-side SteelHead to the domain.
3. Identify the short (NetBIOS) domain name by pressing Ctrl+Alt+Del on any member server. You mustexplicitly specify the short domain name when the RiOS appliance joins the domain if it does notmatch the leftmost portion of the fully qualified domain name.
4. Make sure that the primary or auxiliary interface for the server-side SteelHead is routable to the DNSand the domain controller.
5. Verify the DNS settings.
You must be able to ping the server-side SteelHead, by name, from a CIFS server joined to the samedomain that the server-side SteelHead joins. If you cannot, you must manually create an entry in theDNS server for the server-side SteelHead and perform a DNS replication prior to joining theWindows domain. The appliance does not automatically register the required DNS entry with theWindows domain controller.
You must be able to ping the domain controller, by name, whose domain the server-side SteelHeadjoins. If you cannot, choose Networking > Networking: Host Settings to configure the DNS settings.
Figure 7-23. Verifying the DNS settings for SMB signing
For details, see “Modifying general host settings” on page 53.
The next step is to join a Windows domain.

186 | Configuring Optimization Features
Configuring CIFS optimization
To join a Windows domain
• Choose Optimization > Active Directory: Domain Join on the server-side SteelHead and join thedomain.
Figure 7-24. Domain Auth Auto Config page
For details, see “Easy domain authentication configuration” on page 244. After you have joined the domain, the next step is to enable SMB signing.
Enabling SMB signing
After you have joined a Windows domain, you can enable SMB signing.
Note: When SMB signing is set to Enabled for both the client and server-side SMB component (but not set to
Required), and the RiOS Optimize Connections with Security Signatures feature is enabled, it takes priority and
prevents SMB signing. You can resolve this by disabling the Optimize Connections with Security Signatures feature
and restarting the SteelHead before enabling this feature.
The RiOS Optimize Connections with Security Signatures feature can lead to unintended consequences
in the scenario when SMB signing is required on the client but set to Enabled on the server. With this
feature enabled, the client concludes that the server does not support signing and might terminate the
connection with the server as a result. You can resolve this by using one of these procedures before
enabling this feature:
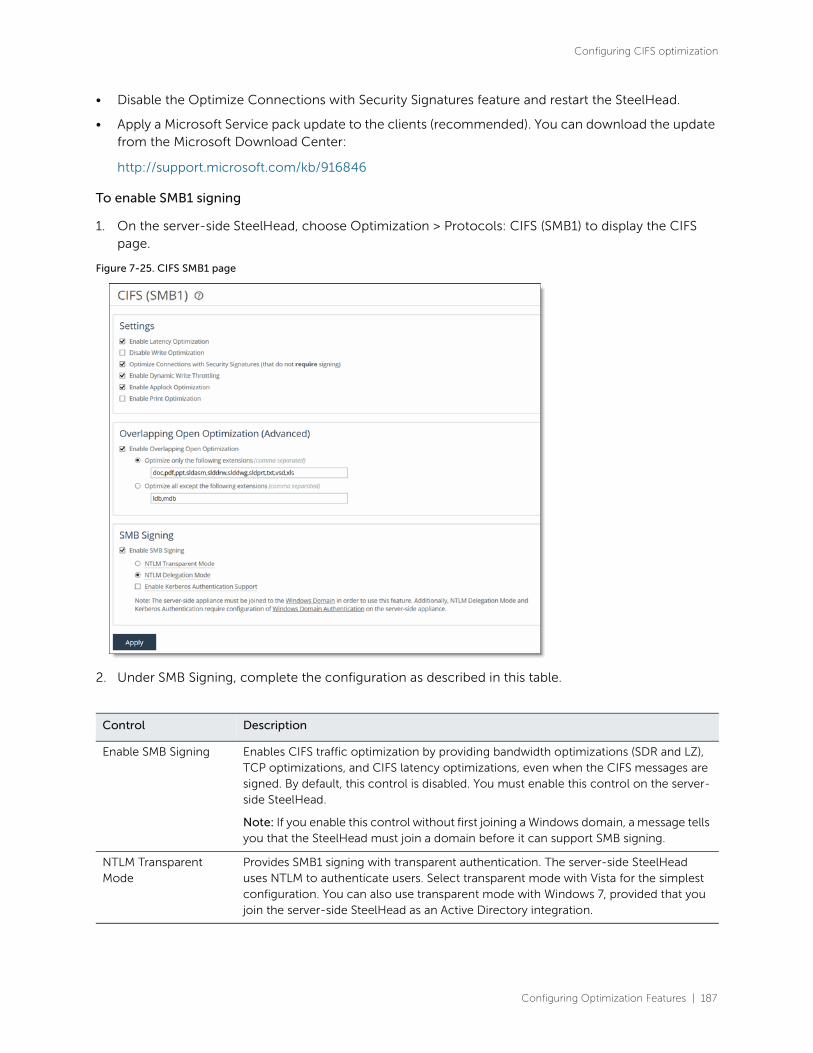
Configuring Optimization Features | 187
Configuring CIFS optimization
• Disable the Optimize Connections with Security Signatures feature and restart the SteelHead.
• Apply a Microsoft Service pack update to the clients (recommended). You can download the update from the Microsoft Download Center:
http://support.microsoft.com/kb/916846
To enable SMB1 signing
1. On the server-side SteelHead, choose Optimization > Protocols: CIFS (SMB1) to display the CIFS page.
Figure 7-25. CIFS SMB1 page
2. Under SMB Signing, complete the configuration as described in this table.
Control Description
Enable SMB Signing Enables CIFS traffic optimization by providing bandwidth optimizations (SDR and LZ), TCP optimizations, and CIFS latency optimizations, even when the CIFS messages are signed. By default, this control is disabled. You must enable this control on the server-side SteelHead.
Note: If you enable this control without first joining a Windows domain, a message tells you that the SteelHead must join a domain before it can support SMB signing.
NTLM Transparent Mode
Provides SMB1 signing with transparent authentication. The server-side SteelHead uses NTLM to authenticate users. Select transparent mode with Vista for the simplest configuration. You can also use transparent mode with Windows 7, provided that you join the server-side SteelHead as an Active Directory integration.
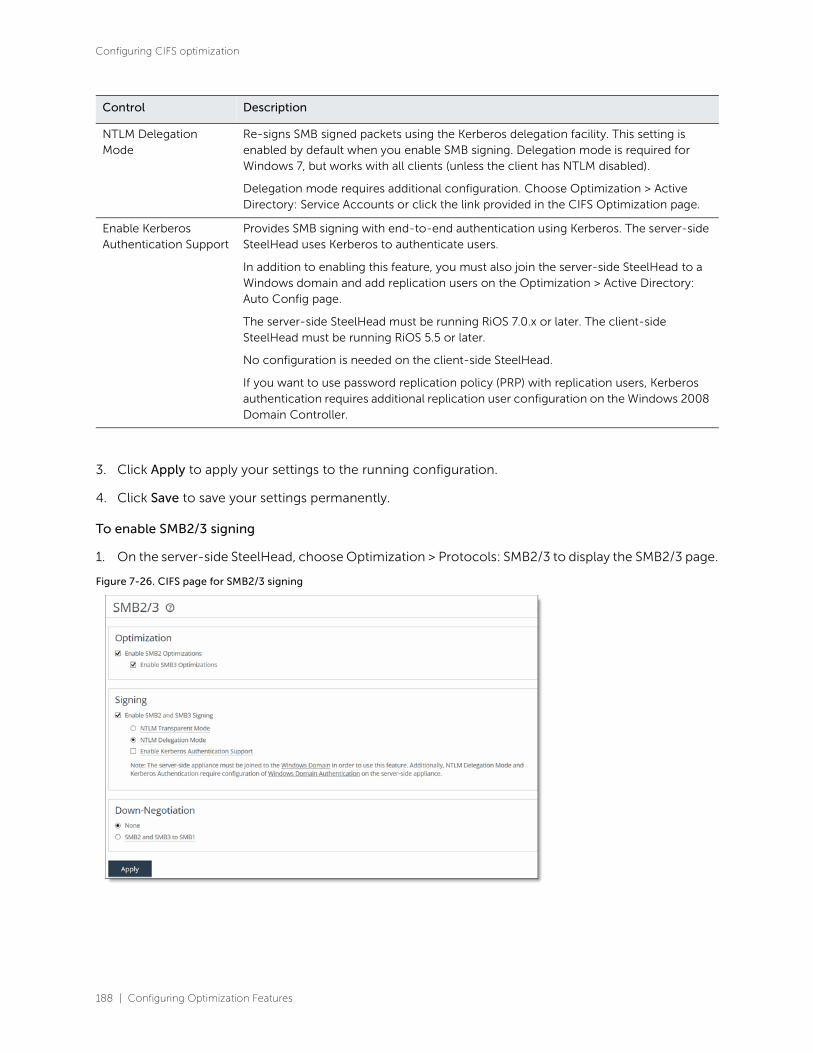
188 | Configuring Optimization Features
Configuring CIFS optimization
3. Click Apply to apply your settings to the running configuration.
4. Click Save to save your settings permanently.
To enable SMB2/3 signing
1. On the server-side SteelHead, choose Optimization > Protocols: SMB2/3 to display the SMB2/3 page.
Figure 7-26. CIFS page for SMB2/3 signing
NTLM Delegation Mode
Re-signs SMB signed packets using the Kerberos delegation facility. This setting is enabled by default when you enable SMB signing. Delegation mode is required for Windows 7, but works with all clients (unless the client has NTLM disabled).
Delegation mode requires additional configuration. Choose Optimization > Active Directory: Service Accounts or click the link provided in the CIFS Optimization page.
Enable Kerberos Authentication Support
Provides SMB signing with end-to-end authentication using Kerberos. The server-side SteelHead uses Kerberos to authenticate users.
In addition to enabling this feature, you must also join the server-side SteelHead to a Windows domain and add replication users on the Optimization > Active Directory: Auto Config page.
The server-side SteelHead must be running RiOS 7.0.x or later. The client-side SteelHead must be running RiOS 5.5 or later.
No configuration is needed on the client-side SteelHead.
If you want to use password replication policy (PRP) with replication users, Kerberos authentication requires additional replication user configuration on the Windows 2008 Domain Controller.
Control Description

Configuring Optimization Features | 189
Configuring CIFS optimization
2. Under Signing, complete the configuration as described in this table.
4. Click Apply to apply your settings to the running configuration.
5. Click Save to save your settings permanently.
Control Description
Enable SMB2 and SMB3 Signing
Enables SMB2/3 traffic optimization by providing bandwidth optimizations (SDR and LZ), TCP optimizations, and SMB2/3 latency optimizations, even when the SMB2/3 messages are signed. By default, this control is disabled. You must enable this control on the server-side SteelHead.
If you are upgrading and already have a delegate user, and the SteelHead is already joined to a domain, enabling SMB2/3 signing works when enabled with no additional configuration.
Note: If you enable this control without first joining a Windows domain, a message tells you that the SteelHead must join a domain before it can support SMB2/3 signing.
Note: You must enable SMB2/3 latency optimization before enabling SMB2/3 signing. To enable SMB2/3 latency optimization, choose Optimization > Protocols: SMB2/3.
NTLM Transparent Mode
Provides SMB2/3 signing with transparent authentication. The server-side SteelHead uses NTLM to authenticate users. Select transparent mode with Vista for the simplest configuration. You can also use transparent mode with Windows 7, provided that you join the server-side SteelHead using Active Directory integration with Windows 2003 or 2008.
NTLM Delegation Mode
Re-signs SMB2/3 signed packets using the delegation facility. This setting is enabled by default when you enable SMB2/3 signing. Delegation mode is required for Windows 7 but works with all clients (unless the client has NTLM disabled).
Delegation mode requires additional configuration. Choose Optimization > Active Directory: Service Accounts or click the link in the CIFS Optimization page.
Enable Kerberos Authentication Support
Provides SMB2/3 signing with end-to-end authentication using Kerberos. The server-side SteelHead uses Kerberos to authenticate users.
In addition to enabling this feature, you must also join the server-side SteelHead to a Windows domain and add replication users:
1. Choose Optimization > Active Directory: Domain Join to join the server-side SteelHead to a Windows domain.
2. Choose Optimization > Active Directory: Auto Config.
3. Choose Configure Replication Account to add the replication users.
For SMB3, the server-side SteelHead must be running RiOS 8.5 or later. The client-side SteelHead must be running RiOS 6.5 or later.
For SMB2, the server-side SteelHead must be running RiOS 7.0 or later. The client-side SteelHead must be running RiOS 6.5 or later.
No configuration is needed on the client-side SteelHead.
If you want to use password replication policy (PRP) with replication users, Kerberos authentication requires additional replication user configuration on the Windows 2008 domain controller.
190 | Configuring Optimization Features
Configuring HTTP optimization
6. If you enable or disable SMB2 or SMB3, you must restart the optimization service. For details, see “Starting and stopping the optimization service” on page 403.
Related topics
• “Configuring CIFS prepopulation” on page 141
• “Windows domain authentication” on page 242
• “Adding QoS profiles” on page 302
• “Viewing current connection reports” on page 496
Encrypting SMB3
If the SMB server and client negotiate SMB3 and the server is configured for encryption, you can
configure share-level encryption. Share-level encryption marks a specific share on the server as
encrypted so that if a client opens a connection to the server and tries to access the share, RiOS encrypts
the data that goes to that share. RiOS does not encrypt the data that goes to other shares on the same
server.
Enabling SMB3 also enables support for the SMB3.02 dialect.
To encrypt SMB3 traffic
1. Choose Optimization > Active Directory: Domain Join on the server-side SteelHead and join the domain.
2. Choose Optimization > Protocols: SMB2/3 and enable SMB3 optimization on the client-side appliance and server-side SteelHead.
3. Enable SMB3 signing.
4. Restart the optimization service.
An SMB3 encrypted connection shows as SMB3-ENC on the Current Connections report. When some
shares are marked for encryption and others are not, if a connection accesses both encrypted and
nonencrypted shares, the Current Connections report also shows the connection as SMB3-ENC.
Configuring HTTP optimizationThis section describes how to configure HTTP optimization features. HTTP optimization works for most
HTTP and HTTPS applications, including SAP, customer relationship management, enterprise resource
planning, financial, document management, and Intranet portals.
It includes these topics:
• “About HTTP optimization” on page 191
• “Configuring HTTP optimization feature settings” on page 192

Configuring Optimization Features | 191
Configuring HTTP optimization
About HTTP optimization
HTTP optimization has been tested on Internet Explorer 6.0 and later and Firefox 2 and later. HTTP
optimization has been tested on Apache 1.3, Apache 2.2, Microsoft IIS 5.0, 6.0, 7.5, and 8; Microsoft
SharePoint, ASP.net, and Microsoft Internet Security and Acceleration Server (ISA).
FPSE supports SharePoint Office clients 2007 and 2010, installed on Windows 7 (SP1) and Windows 8.
SharePoint 2013 does not support FPSE.
192 | Configuring Optimization Features
Configuring HTTP optimization
Basic Steps
This table summarizes the basic steps for configuring HTTP optimization, followed by detailed
procedures.
Note: For the appliance to optimize HTTPS traffic (HTTP over SSL), you must configure a specific in-path rule that
enables both SSL optimization and HTTP optimization.
Configuring HTTP optimization feature settings
You display and modify HTTP optimization feature settings in the Optimization > Protocols: HTTP
Configuration page. For an overview of the HTTP optimization features and basic deployment
considerations, see “Configuring HTTP optimization” on page 190.
Task Reference
1. Enable HTTP optimization for prefetching web objects. This is the default setting.
“Configuring HTTP optimization feature settings” on page 192
2. Enable Store All Allowable Objects or specify object prefetch extensions that represent prefetched objects for URL Learning. By default, the SteelHead prefetches .jpg, .gif, .js, .png, and .css objects when Store All Allowable Objects is disabled.
“Configuring HTTP optimization feature settings” on page 192
3. Enable per-host auto configuration to create an optimization scheme automatically based on HTTP traffic statistics gathered for a host.
“Configuring HTTP optimization feature settings” on page 192
4. Optionally, specify which HTML tags to prefetch for Parse and Prefetch. By default, the SteelHead prefetches base/href, body/background, img/src, link/href, and script/src HTML tags.
“To prefetch HTML tags” on page 197
5. Optionally, set a static HTTP optimization scheme for a host or server subnet. For example, an optimization scheme can include a combination of the URL Learning, Parse and Prefetch, or Object Prefetch features. The default options for subnets are URL Learning, Object Prefetch Table, and Strip Compression.
RiOS supports authorization optimizations and basic tuning for server subnets. we recommend that you enable:
– Strip compression - Removes the Accept-Encoding lines from the HTTP headers that contain gzip or deflate. These Accept-Encoding directives allow web browsers and servers to send and receive compressed content rather than raw HTML.
– Insert cookie - Tracks repeat requests from the client.
– Insert Keep Alive - Maintains persistent connections. Often this feature is disabled even though the web server can support it. This is especially true for Apache web servers that serve HTTPS to Microsoft Internet Explorer browsers.
“Configuring a server subnet or host” on page 197
6. If necessary, define in-path rules that specify when to apply HTTP optimization and whether to enable HTTP latency support for HTTPS.
“Configuring in-path rules” on page 90

Configuring Optimization Features | 193
Configuring HTTP optimization
Configuring HTTP optimization can be a complex task. There are many different options and it is not
always easy to determine what settings are required for a particular application without extensive testing.
HTTP automatic configuration creates an ideal HTTP optimization scheme based on a collection of
comprehensive statistics per host. The host statistics create an application profile, used to configure
HTTP automatically and assist with any troubleshooting.
You can easily change an automatically configured server subnet to override settings.
Note: All of the HTTP optimization features operate on the client-side appliance. You configure HTTP optimizations
only on the client-side appliance.
To display or modify HTTP optimization settings
1. Choose Optimization > Protocols: HTTP to display the HTTP Configuration page.
Figure 7-27. HTTP Configuration page
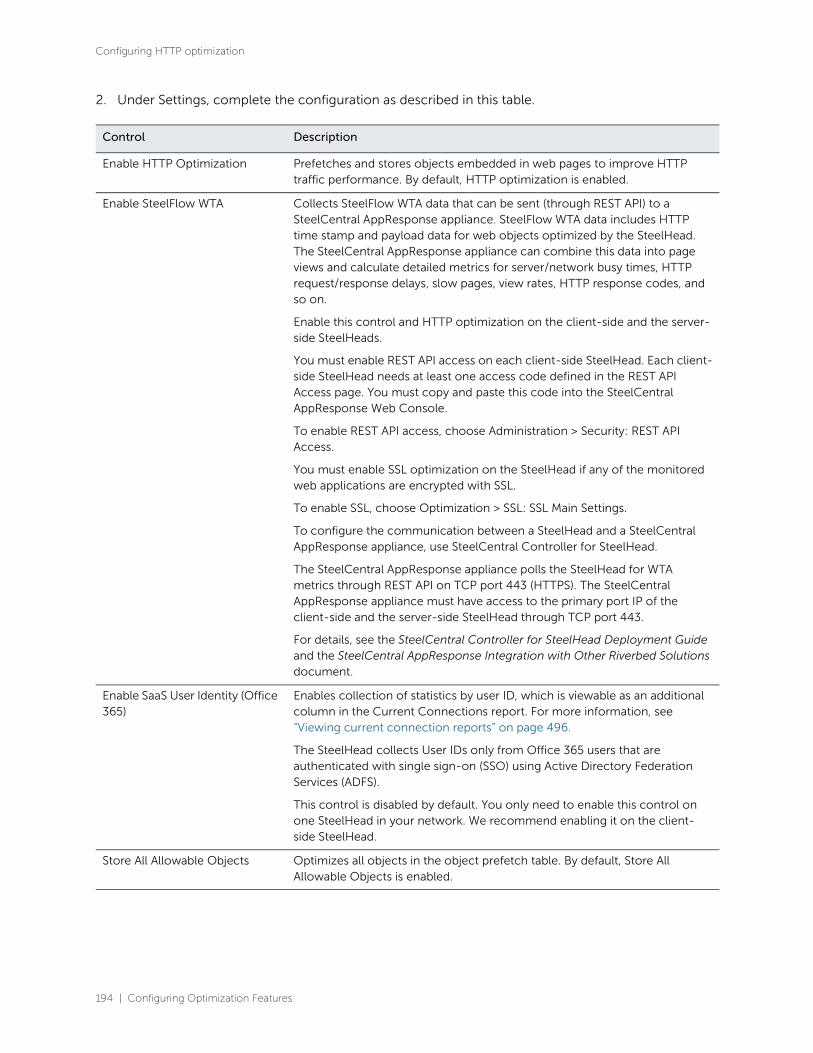
194 | Configuring Optimization Features
Configuring HTTP optimization
2. Under Settings, complete the configuration as described in this table.
Control Description
Enable HTTP Optimization Prefetches and stores objects embedded in web pages to improve HTTP traffic performance. By default, HTTP optimization is enabled.
Enable SteelFlow WTA Collects SteelFlow WTA data that can be sent (through REST API) to a SteelCentral AppResponse appliance. SteelFlow WTA data includes HTTP time stamp and payload data for web objects optimized by the SteelHead. The SteelCentral AppResponse appliance can combine this data into page views and calculate detailed metrics for server/network busy times, HTTP request/response delays, slow pages, view rates, HTTP response codes, and so on.
Enable this control and HTTP optimization on the client-side and the server-side SteelHeads.
You must enable REST API access on each client-side SteelHead. Each client-side SteelHead needs at least one access code defined in the REST API Access page. You must copy and paste this code into the SteelCentral AppResponse Web Console.
To enable REST API access, choose Administration > Security: REST API Access.
You must enable SSL optimization on the SteelHead if any of the monitored web applications are encrypted with SSL.
To enable SSL, choose Optimization > SSL: SSL Main Settings.
To configure the communication between a SteelHead and a SteelCentral AppResponse appliance, use SteelCentral Controller for SteelHead.
The SteelCentral AppResponse appliance polls the SteelHead for WTA metrics through REST API on TCP port 443 (HTTPS). The SteelCentral AppResponse appliance must have access to the primary port IP of the client-side and the server-side SteelHead through TCP port 443.
For details, see the SteelCentral Controller for SteelHead Deployment Guide and the SteelCentral AppResponse Integration with Other Riverbed Solutions document.
Enable SaaS User Identity (Office 365)
Enables collection of statistics by user ID, which is viewable as an additional column in the Current Connections report. For more information, see “Viewing current connection reports” on page 496.
The SteelHead collects User IDs only from Office 365 users that are authenticated with single sign-on (SSO) using Active Directory Federation Services (ADFS).
This control is disabled by default. You only need to enable this control on one SteelHead in your network. We recommend enabling it on the client-side SteelHead.
Store All Allowable Objects Optimizes all objects in the object prefetch table. By default, Store All Allowable Objects is enabled.
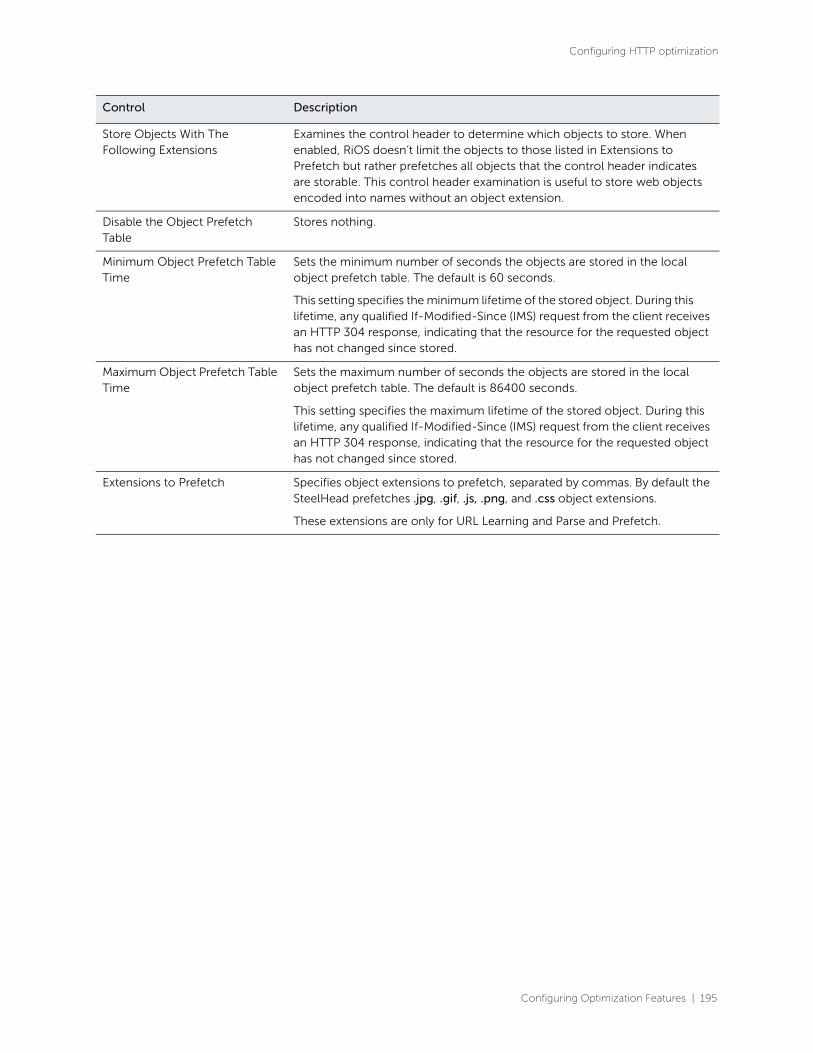
Configuring Optimization Features | 195
Configuring HTTP optimization
Store Objects With The Following Extensions
Examines the control header to determine which objects to store. When enabled, RiOS doesn’t limit the objects to those listed in Extensions to Prefetch but rather prefetches all objects that the control header indicates are storable. This control header examination is useful to store web objects encoded into names without an object extension.
Disable the Object Prefetch Table
Stores nothing.
Minimum Object Prefetch Table Time
Sets the minimum number of seconds the objects are stored in the local object prefetch table. The default is 60 seconds.
This setting specifies the minimum lifetime of the stored object. During this lifetime, any qualified If-Modified-Since (IMS) request from the client receives an HTTP 304 response, indicating that the resource for the requested object has not changed since stored.
Maximum Object Prefetch Table Time
Sets the maximum number of seconds the objects are stored in the local object prefetch table. The default is 86400 seconds.
This setting specifies the maximum lifetime of the stored object. During this lifetime, any qualified If-Modified-Since (IMS) request from the client receives an HTTP 304 response, indicating that the resource for the requested object has not changed since stored.
Extensions to Prefetch Specifies object extensions to prefetch, separated by commas. By default the SteelHead prefetches .jpg, .gif, .js, .png, and .css object extensions.
These extensions are only for URL Learning and Parse and Prefetch.
Control Description
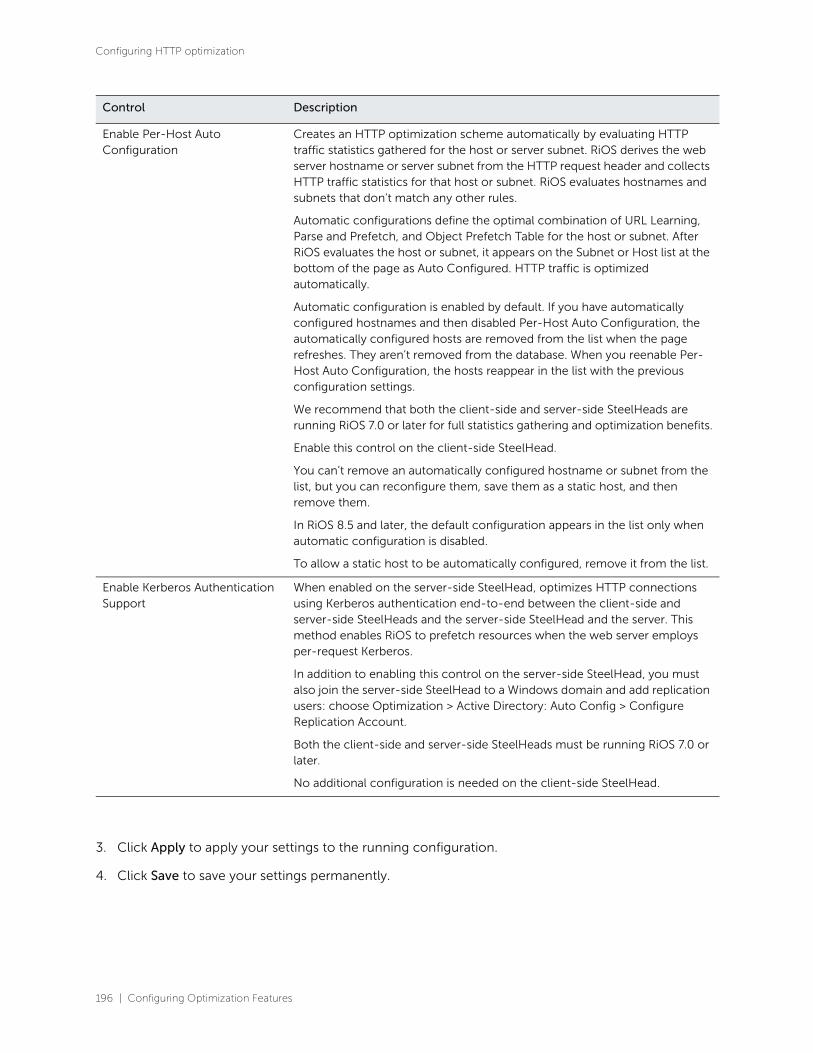
196 | Configuring Optimization Features
Configuring HTTP optimization
3. Click Apply to apply your settings to the running configuration.
4. Click Save to save your settings permanently.
Enable Per-Host Auto Configuration
Creates an HTTP optimization scheme automatically by evaluating HTTP traffic statistics gathered for the host or server subnet. RiOS derives the web server hostname or server subnet from the HTTP request header and collects HTTP traffic statistics for that host or subnet. RiOS evaluates hostnames and subnets that don’t match any other rules.
Automatic configurations define the optimal combination of URL Learning, Parse and Prefetch, and Object Prefetch Table for the host or subnet. After RiOS evaluates the host or subnet, it appears on the Subnet or Host list at the bottom of the page as Auto Configured. HTTP traffic is optimized automatically.
Automatic configuration is enabled by default. If you have automatically configured hostnames and then disabled Per-Host Auto Configuration, the automatically configured hosts are removed from the list when the page refreshes. They aren’t removed from the database. When you reenable Per- Host Auto Configuration, the hosts reappear in the list with the previous configuration settings.
We recommend that both the client-side and server-side SteelHeads are running RiOS 7.0 or later for full statistics gathering and optimization benefits.
Enable this control on the client-side SteelHead.
You can’t remove an automatically configured hostname or subnet from the list, but you can reconfigure them, save them as a static host, and then remove them.
In RiOS 8.5 and later, the default configuration appears in the list only when automatic configuration is disabled.
To allow a static host to be automatically configured, remove it from the list.
Enable Kerberos Authentication Support
When enabled on the server-side SteelHead, optimizes HTTP connections using Kerberos authentication end-to-end between the client-side and server-side SteelHeads and the server-side SteelHead and the server. This method enables RiOS to prefetch resources when the web server employs per-request Kerberos.
In addition to enabling this control on the server-side SteelHead, you must also join the server-side SteelHead to a Windows domain and add replication users: choose Optimization > Active Directory: Auto Config > Configure Replication Account.
Both the client-side and server-side SteelHeads must be running RiOS 7.0 or later.
No additional configuration is needed on the client-side SteelHead.
Control Description

Configuring Optimization Features | 197
Configuring HTTP optimization
To prefetch HTML tags
1. Under HTML Tags to Prefetch, select which HTML tags to prefetch. By default, these tags are prefetched: base/href, body/background, img/src, link/href, and script/src.
Note: These tags are for the Parse and Prefetch feature only and do not affect other prefetch types, such as object
extensions.
2. To add a new tag, complete the configuration as described in this table.
Configuring a server subnet or host
Under Settings, you can enable URL Learning, Parse and Prefetch, and Object Prefetch Table in any
combination for any host server or server subnet. You can also enable authorization optimization to tune
a particular subnet dynamically, with no service restart required.
The default settings are URL Learning, Object Prefetch Table, and Strip Compression for all traffic with
automatic configuration disabled. The default setting applies when HTTP optimization is enabled,
regardless of whether there is an entry in the Subnet or Host list. In the case of overlapping subnets,
specific list entries override any default settings.
The default rule is applied if any other rule (that is, the subnet rule or host-based rule) does not match.
Suppose the majority of your web servers have dynamic content applications but you also have several
static content application servers. You could configure your entire server subnet to disable URL Learning
and enable Parse and Prefetch and Object Prefetch Table, optimizing HTTP for the majority of your web
servers. Next, you could configure your static content servers to use URL Learning only, disabling Parse
and Prefetch and Object Prefetch Table.
Control Description
Add a Prefetch Tag Displays the controls to add an HTML tag.
Tag Name Specify the tag name.
Attribute Specify the tag attribute.
Add Adds the tag.

198 | Configuring Optimization Features
Configuring HTTP optimization
To configure an HTTP optimization scheme for a particular hostname or server subnet
1. Choose Optimization > Protocols: HTTP to display the HTTP Configuration page.
Figure 7-28. HTTP Configuration page
2. On the client-side appliance, under Server Subnet and Host Settings, complete the configuration as described in this table.
Control Description
Add a Subnet or Host Displays the controls for adding a server subnet or host. The server must support keepalive.
Server Subnet or Hostname Specify an IP address and mask pattern for the server subnet, or a hostname, on which to set up the HTTP optimization scheme.
Use this format for an individual subnet IP address and netmask:
xxx.xxx.xxx.xxx/xx (IPv4)
x:x:x::x/xxx (IPv6)
You can also specify 0.0.0.0/0 (all IPv4) or ::/0 (all IPv6) as the wildcard for either IPv4 or IPv6 traffic.

Configuring Optimization Features | 199
Configuring HTTP optimization
Row Filters • Static - Displays only the static subnet or hostname configurations in the subnet and hostname list. You create a static configuration manually to fine-tune HTTP optimization for a particular host or server subnet. By default, RiOS displays both automatic and static configurations.
• Auto - Displays only the automatic subnet or hostname configurations in the subnet and hostname list. RiOS creates automatic configurations when you select Enable Per-Host Auto Configuration, based on an application profile. Automatic configurations define the optimal combination of URL learning, Parse and Prefetch, and Object Prefetch Table for the host or subnet. By default, RiOS displays both automatic and static configurations.
• Auto (Eval) - Displays the automatic hostname configurations currently under evaluation. By default, the evaluation period is 1000 transactions.
Basic tuning
Strip Compression Marks the accept-encoding lines from the HTTP compression header so they’re not returned in calls. An accept-encoding directive compresses content rather than using raw HTML. Enabling this option improves the performance of the SteelHead data reduction algorithms. By default, strip compression is enabled.
Insert Cookie Adds a cookie to HTTP applications that don’t already have one. HTTP applications frequently use cookies to keep track of sessions. The SteelHead uses cookies to distinguish one user session from another. If an HTTP application doesn’t use cookies, the client SteelHead inserts one so that it can track requests from the same client. By default, this setting is disabled.
Insert Keep Alive Uses the same TCP connection to send and receive multiple HTTP requests and responses, as opposed to opening a new one for every single request and response. Specify this option when using the URL Learning or Parse and Prefetch features with HTTP 1.0 or HTTP 1.1 applications using the Connection Close method. By default, this setting is disabled.
Caching
Object Prefetch Table Enable this control on the client-side SteelHead to store HTTP object prefetches from HTTP GET requests for cascading style sheets, static images, and Java scripts in the Object Prefetch Table. When the browser performs If-Modified-Since (IMS) checks for stored content or sends regular HTTP requests, the client-side SteelHead responds to these IMS checks and HTTP requests, cutting back on round-trips across the WAN.
Control Description

200 | Configuring Optimization Features
Configuring HTTP optimization
Stream Splitting Enable this control on the client-side SteelHead to split Silverlight smooth streaming, Adobe Flash HTTP dynamic streams, and Apple HTTP Live Streaming (HLS).
This control includes support for Microsoft Silverlight video and Silverlight extensions support on Internet Information Server (IIS) version 7.5 installed on Windows Server 2008 R2.
To split Adobe Flash streams, you must set up the video origin server before enabling this control. For details, see the SteelHead Deployment Guide.
Apple HLS is an HTTP-based video delivery protocol for iOS and OSX that streams video to iPads, iPhones, and Macs. HLS is part of an upgrade to QuickTime. RiOS splits both live and on-demand video streams.
Use this control to support multiple branch office users from a single real-time TCP stream. The SteelHead identifies live streaming video URL fragment requests and delays any request that is already in progress. When the client receives the response, it returns the same response to all clients requesting that URL.
As an example, when employees in branch offices simultaneously start clients (through browser plugins) that all request the same video fragment, the client-side SteelHead delays requests for that fragment because it’s already outstanding. Since many identical requests typically are made before the first request is responded to, the result is many hits to the server and many bytes across the WAN. When you enable stream splitting on the client-side SteelHead, it identifies live streaming video URL fragment requests and holds subsequent requests for that fragment because the first request for that fragment is outstanding. When the response is received, it’s delivered to all clients that requested it. Thus, only one request and response pair for a video fragment transfers over the WAN. With stream splitting, the SteelHead replicates one TCP stream for each individual client.
RiOS 9.1 and later increase the cache size by up to five times, depending on the SteelHead model, and stores the video fragments for 30 seconds to keep clients watching the same live video in sync. For details, see the SteelHead Deployment Guide - Protocols.
Stream splitting optimization doesn’t change the number of sockets that are opened to the server, but it does reduce the number of requests made to the server. Without this optimization, each fragment is requested once per client. With this optimization, each fragment is requested once.
Stream splitting is disabled by default.
Enabling this control requires that HTTP optimization is enabled on the client-side and server-side SteelHeads. The client-side SteelHead doesn’t require an optimization service restart in RiOS 9.1 or later. No other changes are necessary on the server-side SteelHead.
In addition to splitting the video stream, you can prepopulate video at branch office locations during off-peak periods and then retrieve them for later viewing. For information, see the protocol http prepop list url command in the Riverbed Command-Line Interface Reference Manual.
To view a graph of the data reduction resulting from stream splitting, choose Reports > Optimization: Live Video Stream Splitting.
Control Description
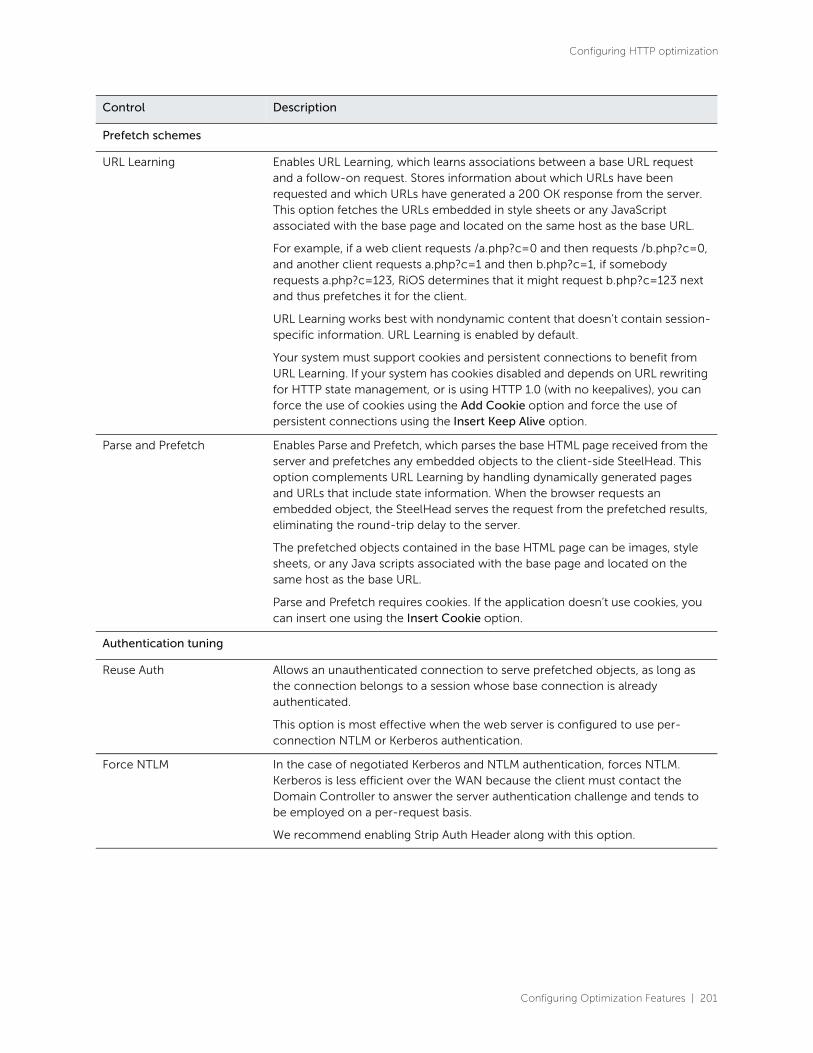
Configuring Optimization Features | 201
Configuring HTTP optimization
Prefetch schemes
URL Learning Enables URL Learning, which learns associations between a base URL request and a follow-on request. Stores information about which URLs have been requested and which URLs have generated a 200 OK response from the server. This option fetches the URLs embedded in style sheets or any JavaScript associated with the base page and located on the same host as the base URL.
For example, if a web client requests /a.php?c=0 and then requests /b.php?c=0, and another client requests a.php?c=1 and then b.php?c=1, if somebody requests a.php?c=123, RiOS determines that it might request b.php?c=123 next and thus prefetches it for the client.
URL Learning works best with nondynamic content that doesn’t contain session-specific information. URL Learning is enabled by default.
Your system must support cookies and persistent connections to benefit from URL Learning. If your system has cookies disabled and depends on URL rewriting for HTTP state management, or is using HTTP 1.0 (with no keepalives), you can force the use of cookies using the Add Cookie option and force the use of persistent connections using the Insert Keep Alive option.
Parse and Prefetch Enables Parse and Prefetch, which parses the base HTML page received from the server and prefetches any embedded objects to the client-side SteelHead. This option complements URL Learning by handling dynamically generated pages and URLs that include state information. When the browser requests an embedded object, the SteelHead serves the request from the prefetched results, eliminating the round-trip delay to the server.
The prefetched objects contained in the base HTML page can be images, style sheets, or any Java scripts associated with the base page and located on the same host as the base URL.
Parse and Prefetch requires cookies. If the application doesn’t use cookies, you can insert one using the Insert Cookie option.
Authentication tuning
Reuse Auth Allows an unauthenticated connection to serve prefetched objects, as long as the connection belongs to a session whose base connection is already authenticated.
This option is most effective when the web server is configured to use per-connection NTLM or Kerberos authentication.
Force NTLM In the case of negotiated Kerberos and NTLM authentication, forces NTLM. Kerberos is less efficient over the WAN because the client must contact the Domain Controller to answer the server authentication challenge and tends to be employed on a per-request basis.
We recommend enabling Strip Auth Header along with this option.
Control Description
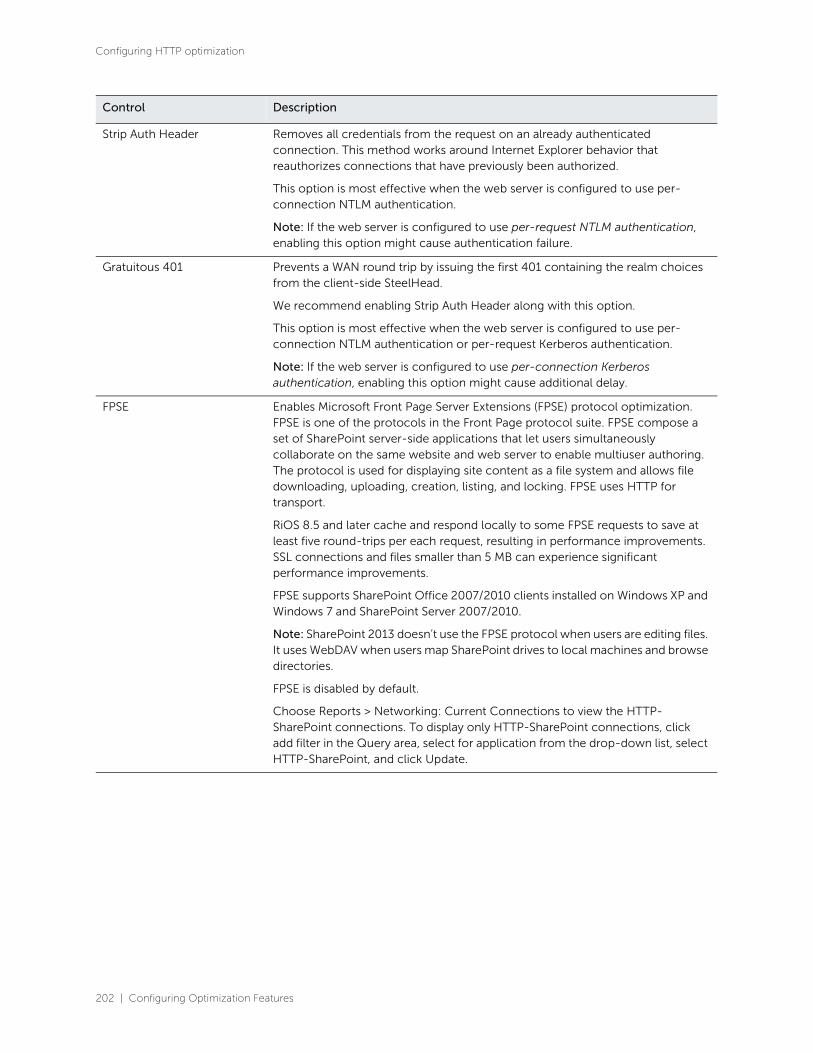
202 | Configuring Optimization Features
Configuring HTTP optimization
Strip Auth Header Removes all credentials from the request on an already authenticated connection. This method works around Internet Explorer behavior that reauthorizes connections that have previously been authorized.
This option is most effective when the web server is configured to use per-connection NTLM authentication.
Note: If the web server is configured to use per-request NTLM authentication, enabling this option might cause authentication failure.
Gratuitous 401 Prevents a WAN round trip by issuing the first 401 containing the realm choices from the client-side SteelHead.
We recommend enabling Strip Auth Header along with this option.
This option is most effective when the web server is configured to use per-connection NTLM authentication or per-request Kerberos authentication.
Note: If the web server is configured to use per-connection Kerberos authentication, enabling this option might cause additional delay.
FPSE Enables Microsoft Front Page Server Extensions (FPSE) protocol optimization. FPSE is one of the protocols in the Front Page protocol suite. FPSE compose a set of SharePoint server-side applications that let users simultaneously collaborate on the same website and web server to enable multiuser authoring. The protocol is used for displaying site content as a file system and allows file downloading, uploading, creation, listing, and locking. FPSE uses HTTP for transport.
RiOS 8.5 and later cache and respond locally to some FPSE requests to save at least five round-trips per each request, resulting in performance improvements. SSL connections and files smaller than 5 MB can experience significant performance improvements.
FPSE supports SharePoint Office 2007/2010 clients installed on Windows XP and Windows 7 and SharePoint Server 2007/2010.
Note: SharePoint 2013 doesn’t use the FPSE protocol when users are editing files. It uses WebDAV when users map SharePoint drives to local machines and browse directories.
FPSE is disabled by default.
Choose Reports > Networking: Current Connections to view the HTTP-SharePoint connections. To display only HTTP-SharePoint connections, click add filter in the Query area, select for application from the drop-down list, select HTTP-SharePoint, and click Update.
Control Description

Configuring Optimization Features | 203
Configuring Oracle Forms optimization
3. Click Apply to apply your settings to the running configuration.
4. Click Save to save your settings permanently.
To modify subnet configuration properties, use the drop-down lists in the table row for the
configuration.
To modify server properties, use the drop-down list in the table row for the server.
Related topic
• “Viewing CIFS prepopulation share logs” on page 550
Configuring Oracle Forms optimizationYou can display and modify Oracle Forms optimization settings in the Optimization > Protocols: Oracle
Forms page.
Oracle Forms is a platform for developing user interface applications to interact with an Oracle database.
It uses a Java applet to interact with the database in either native, HTTP, or HTTPS mode. The SteelHead
decrypts, optimizes, and then reencrypts the Oracle Forms traffic.
You can configure Oracle Forms optimization in these modes:
• Native - The Java applet communicates with the backend server, typically over port 9000. Native mode is also known as socket mode.
• HTTP - The Java applet tunnels the traffic to the Oracle Forms server over HTTP, typically over port 8000.
WebDAV Enables Microsoft Web Distributed Authoring and Versioning (WebDAV) protocol optimization. WebDAV is an open-standard extension to the HTTP 1.1 protocol that enables file management on remote web servers. Some of the many Microsoft components that use WebDAV include WebDAV redirector, Web Folders, and SMS/SCCM.
RiOS predicts and prefetches WebDAV responses, which saves multiple round-trips and makes browsing the SharePoint file repository more responsive.
WebDAV optimization is disabled by default.
Choose Reports > Networking: Current Connections to view the HTTP-SharePoint connections. To display only HTTP-SharePoint connections, click add filter in the Query area, select for application from the drop-down list, select HTTP-Sharepoint, and click Update.
Add Adds the subnet or hostname.
Apply/Apply and Make Static Click to save the configuration. Click Apply to save the configuration for static hostnames and subnets or Apply and Make Static to save an automatically configured host as a static host.
Control Description

204 | Configuring Optimization Features
Configuring Oracle Forms optimization
• HTTPS - The Java applet tunnels the traffic to the Oracle Forms server over HTTPS, typically over port 443. HTTPS mode is also known as SSL mode.
Use Oracle Forms optimization to improve Oracle Forms traffic performance. RiOS 5.5.x and later
support 6i, which comes with Oracle Applications 11i. RiOS 6.0 and later support 10gR2, which comes
with Oracle E-Business Suite R12.
This feature does not need a separate license and is enabled by default. However, you must also set an
in-path rule to enable this feature.
Note: Optionally, you can enable IPSec encryption to protect Oracle Forms traffic between two SteelHead
appliances over the WAN or use the Secure Inner Channel on all traffic.
Determining the deployment mode
Before enabling Oracle Forms optimization, you must know the mode in which Oracle Forms is running
at your organization.
To determine the Oracle Forms deployment mode
1. Start the Oracle application that uses Oracle Forms.
2. Click a link in the base HTML page to download the Java applet to your browser.
3. On the Windows taskbar, right-click the Java icon (a coffee cup) to access the Java console.
4. Choose Show Console (JInitiator) or Open <version> Console (Sun JRE).
5. Locate the “connectMode=” message in the Java Console window. This message indicates the Oracle Forms deployment mode at your organization. For example:
connectMode=HTTP, nativeconnectMode=SocketconnectMode=HTTPS, native
Enabling Oracle Forms optimization
This section describes how to enable Oracle Forms optimization for the deployment mode your
organization uses.
To enable the Oracle Forms optimization feature in native and HTTP modes
1. Choose Optimization > Protocols: Oracle Forms to display the Oracle Forms page.
Figure 7-29. Oracle Forms page

Configuring Optimization Features | 205
Configuring Oracle Forms optimization
2. On the client-side appliance and server-side SteelHead, under Settings, complete the configuration as described in this table.
3. Click Apply to apply your settings to the running configuration.
4. Click Save to save your settings permanently.
5. If you change the Oracle Forms setting, you must restart the optimization service. For details, see “Starting and stopping the optimization service” on page 403.
6. If you have not already done so, choose Optimization > Network Services: In-path Rules and click Add a New In-path Rule. Add an in-path rule with these properties.
To enable the Oracle Forms optimization feature in HTTPS mode
1. Configure and enable SSL optimization before enabling the Oracle Forms support. For details, see “Configuring SSL server certificates and certificate authorities” on page 319.
2. Choose Optimization > Protocols: Oracle Forms to display the Oracle Forms page.
Control Description
Enable Oracle Forms Optimization
Enables Oracle Forms optimization in native mode, also known as socket mode. Oracle Forms native-mode optimization is enabled by default. Disable this option only to disable Oracle Forms optimization: for example, if your network users don’t use Oracle applications.
Enable HTTP Mode Enables Oracle Forms optimization in HTTP mode. All internal messaging between the forms server and the Java client is encapsulated in HTTP packets. HTTP mode is enabled by default. You must also select the Enable Oracle Forms Optimization check box to enable HTTP mode.
Property Value
Type Auto Discover or Fixed-Target.
Destination Subnet/Port Specify the server IP address (for example, 10.11.41.14/32), and a port number:
• 9000 - Native mode, using the default forms server.
• 8000 - HTTP mode.
Preoptimization Policy Oracle Forms.
Data Reduction Policy Normal.
Latency Optimization Policy HTTP - Select this policy to separate any non-Oracle Forms HTTP traffic from the standard Oracle Forms traffic. This policy applies HTTP latency optimization to the HTTP traffic to improve performance.
Neural Framing Mode Always.
WAN Visibility Correct Addressing.
206 | Configuring Optimization Features
Configuring MAPI optimization
3. Under Settings, select both check boxes as described in this table.
4. Click Apply to apply your settings to the running configuration.
5. Click Save to save your settings permanently.
6. If you change the Oracle Forms setting, you must restart the optimization service. For details, see “Starting and stopping the optimization service” on page 403.
7. Choose Optimization > Network Services: In-path Rules and click Add a New In-path Rule. Use these in-path rule settings.
Related topics
• “Configuring in-path rules” on page 90
• “Configuring HTTP optimization feature settings” on page 192
• “Configuring SSL server certificates and certificate authorities” on page 319
Configuring MAPI optimizationYou display and modify MAPI optimization settings in the Optimization > Protocols: MAPI page.
Control Description
Enable Oracle Forms Optimization
Enables Oracle Forms optimization in native mode, also known as socket mode. Oracle Forms native-mode optimization is enabled by default. Disable this option only to disable Oracle Forms optimization: for example, if your network users don’t use Oracle applications.
Enable HTTP Mode Enables Oracle Forms optimization in HTTP mode. All internal messaging between the forms server and the Java client is encapsulated in HTTP packets. HTTP mode is enabled by default. You must also select the Enable Oracle Forms Optimization check box to enable HTTP mode.
Property Value
Type Auto Discover or Fixed-Target.
Destination Subnet/Port Specify the server IP address (for example, 10.11.41.14/32), and a port number (for example, 443).
Preoptimization Policy Oracle Forms over SSL.
Data Reduction Policy Normal.
Latency Optimization Policy HTTP - Select this policy to separate any non-Oracle Forms HTTP traffic from the standard Oracle Forms traffic. This policy applies HTTP latency optimization to the HTTP traffic to improve performance.
Neural Framing Mode Always.
WAN Visibility Correct Addressing.
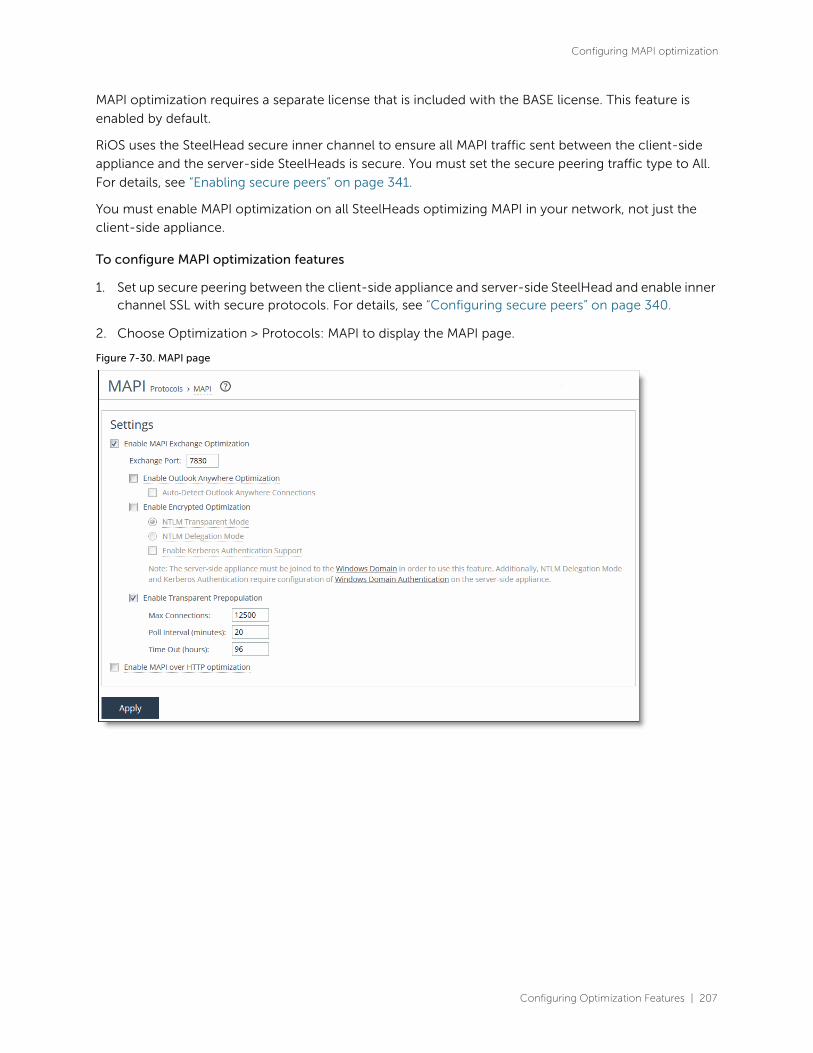
Configuring Optimization Features | 207
Configuring MAPI optimization
MAPI optimization requires a separate license that is included with the BASE license. This feature is
enabled by default.
RiOS uses the SteelHead secure inner channel to ensure all MAPI traffic sent between the client-side
appliance and the server-side SteelHeads is secure. You must set the secure peering traffic type to All.
For details, see “Enabling secure peers” on page 341.
You must enable MAPI optimization on all SteelHeads optimizing MAPI in your network, not just the
client-side appliance.
To configure MAPI optimization features
1. Set up secure peering between the client-side appliance and server-side SteelHead and enable inner channel SSL with secure protocols. For details, see “Configuring secure peers” on page 340.
2. Choose Optimization > Protocols: MAPI to display the MAPI page.
Figure 7-30. MAPI page

208 | Configuring Optimization Features
Configuring MAPI optimization
3. Under Settings, complete the configuration as described in this table.
Control Description
Enable MAPI Exchange Optimization
Enables the fundamental component of the MAPI optimization module, which includes optimization for read, write (receive, send), and sync operations.
By default, MAPI Exchange optimization is enabled.
Only clear this check box to disable MAPI optimization. Typically, you disable MAPI optimization to troubleshoot problems with the system. For example, if you are experiencing problems with Outlook clients connecting with Exchange, you can disable MAPI latency acceleration (while continuing to optimize with SDR for MAPI).
Exchange Port Specify the MAPI Exchange port for optimization. Typically, you do not need to modify the default value 7830.
Enable Outlook Anywhere Optimization
Enables Outlook Anywhere latency optimization. Outlook Anywhere is a feature of Microsoft Exchange Server 2003, 2007, and 2010 that allows Microsoft Office Outlook 2003, 2007, and 2010 clients to connect to their Exchange Servers over the internet using the Microsoft RPC tunneling protocol. Outlook Anywhere allows for a VPN-less connection as the MAPI RPC protocol is tunneled over HTTP or HTTPS. RPC over HTTP can transport regular or encrypted MAPI. If you use encrypted MAPI, the server-side SteelHead must be a member of the Windows domain.
Enable this feature on the client-side and server-side SteelHeads. Both SteelHeads must be running RiOS 6.5 or later.
By default, this feature is disabled.
To use this feature, you must also enable HTTP Optimization on the client-side and server-side SteelHeads (HTTP optimization is enabled by default).
If you are using Outlook Anywhere over HTTPS, you must enable SSL and the IIS certificate must be installed on the server-side SteelHead:
• When using HTTP, Outlook can only use NTLM proxy authentication.
• When using HTTPS, Outlook can use NTLM or Basic proxy authentication.
• When using encrypted MAPI with HTTP or HTTPS, you must enable and configure encrypted MAPI in addition to this feature.
Note: Outlook Anywhere optimized connections cannot start MAPI prepopulation.
After you apply your settings, you can verify that the connections appear in the Current Connections report as a MAPI-OA or an eMAPI-OA (encrypted MAPI) application. The Outlook Anywhere connection entries appear in the system log with an RPCH prefix.
Note: Outlook Anywhere creates twice as many connections on the SteelHead than regular MAPI. Enabling Outlook Anywhere latency optimization results in the SteelHead entering twice as fast than with regular MAPI. For details, see Appendix A, “SteelHead MIB.”
For details and troubleshooting information, see the SteelHead Deployment Guide - Protocols.
For details about enabling Outlook Anywhere, seehttp://technet.microsoft.com/en-us/library/bb123513(EXCHG.80).aspx.

Configuring Optimization Features | 209
Configuring MAPI optimization
Auto-Detect Outlook Anywhere Connections
Automatically detects the RPC over HTTPS protocol used by Outlook Anywhere. This feature is dimmed until you enable Outlook Anywhere optimization. By default, these options are enabled.
You can enable automatic detection of RPC over HTTPS using this option or you can set in-path rules. Autodetect is best for simple SteelHead configurations with only a single SteelHead at each site and when the IIS server is also handling websites.
If the IIS server is only used as RPC Proxy, and for configurations with asymmetric routing, connection forwarding or Interceptor installations, add in-path rules that identify the RPC Proxy server IP addresses and select the Outlook Anywhere latency optimization policy. After adding the in-path rule, disable the autodetect option.
On an Interceptor, add load-balancing rules to direct traffic for RPC Proxy to the same SteelHead.
In-path rules interact with autodetect as follows:
• When autodetect is enabled and the in-path rule does not match, RiOS optimizes Outlook Anywhere if it detects the RPC over HTTPS protocol.
• When autodetect is not enabled and the in-path rule does not match, RiOS does not optimize Outlook Anywhere.
• When autodetect is enabled and the in-path rule matches with HTTP only, RiOS does not optimize Outlook Anywhere (even if it detects the RPC over HTTPS protocol).
• When autodetect is not enabled and the in-path rule does not match with HTTP only, RiOS does not optimize Outlook Anywhere.
• When autodetect is enabled and the in-path rule matches with an Outlook Anywhere latency optimization policy, RiOS optimizes Outlook Anywhere (even if it does not detect the RPC over HTTPS protocol).
• When autodetect is not enabled and the in-path rule matches with Outlook Anywhere, RiOS optimizes Outlook Anywhere.
Control Description
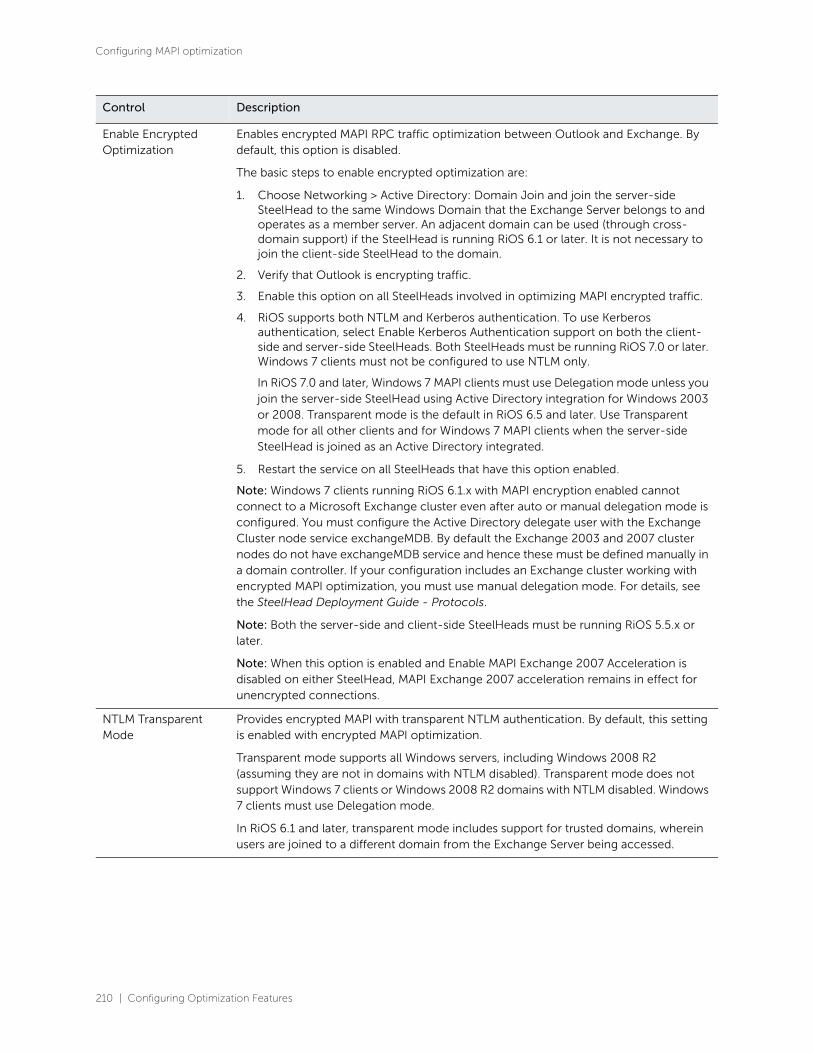
210 | Configuring Optimization Features
Configuring MAPI optimization
Enable Encrypted Optimization
Enables encrypted MAPI RPC traffic optimization between Outlook and Exchange. By default, this option is disabled.
The basic steps to enable encrypted optimization are:
1. Choose Networking > Active Directory: Domain Join and join the server-side SteelHead to the same Windows Domain that the Exchange Server belongs to and operates as a member server. An adjacent domain can be used (through cross-domain support) if the SteelHead is running RiOS 6.1 or later. It is not necessary to join the client-side SteelHead to the domain.
2. Verify that Outlook is encrypting traffic.
3. Enable this option on all SteelHeads involved in optimizing MAPI encrypted traffic.
4. RiOS supports both NTLM and Kerberos authentication. To use Kerberos authentication, select Enable Kerberos Authentication support on both the client-side and server-side SteelHeads. Both SteelHeads must be running RiOS 7.0 or later. Windows 7 clients must not be configured to use NTLM only.
In RiOS 7.0 and later, Windows 7 MAPI clients must use Delegation mode unless you join the server-side SteelHead using Active Directory integration for Windows 2003 or 2008. Transparent mode is the default in RiOS 6.5 and later. Use Transparent mode for all other clients and for Windows 7 MAPI clients when the server-side SteelHead is joined as an Active Directory integrated.
5. Restart the service on all SteelHeads that have this option enabled.
Note: Windows 7 clients running RiOS 6.1.x with MAPI encryption enabled cannot connect to a Microsoft Exchange cluster even after auto or manual delegation mode is configured. You must configure the Active Directory delegate user with the Exchange Cluster node service exchangeMDB. By default the Exchange 2003 and 2007 cluster nodes do not have exchangeMDB service and hence these must be defined manually in a domain controller. If your configuration includes an Exchange cluster working with encrypted MAPI optimization, you must use manual delegation mode. For details, see the SteelHead Deployment Guide - Protocols.
Note: Both the server-side and client-side SteelHeads must be running RiOS 5.5.x or later.
Note: When this option is enabled and Enable MAPI Exchange 2007 Acceleration is disabled on either SteelHead, MAPI Exchange 2007 acceleration remains in effect for unencrypted connections.
NTLM Transparent Mode
Provides encrypted MAPI with transparent NTLM authentication. By default, this setting is enabled with encrypted MAPI optimization.
Transparent mode supports all Windows servers, including Windows 2008 R2 (assuming they are not in domains with NTLM disabled). Transparent mode does not support Windows 7 clients or Windows 2008 R2 domains with NTLM disabled. Windows 7 clients must use Delegation mode.
In RiOS 6.1 and later, transparent mode includes support for trusted domains, wherein users are joined to a different domain from the Exchange Server being accessed.
Control Description

Configuring Optimization Features | 211
Configuring MAPI optimization
NTLM Delegation Mode
Provides encrypted MAPI optimization using the Kerberos delegation facility. Select this mode if you are encrypting MAPI traffic for Windows 7 or earlier client versions. The server-side SteelHead must be running RiOS 6.1 or later.
Note: CIFS SMB Signing and Encrypted MAPI optimization share the delegate user account. If you enable Delegation mode for both features, the delegate user account must have delegation privileges for both features as well. If you are upgrading from RiOS 6.0, a delegation account might already be in place for CIFS SMB Signing.
In RiOS 6.1 and later, Delegation mode includes support for trusted domains, wherein users are joined to a different domain from the storage system being accessed.
Delegation mode requires additional configuration. To configure Delegation mode, choose Optimization > Active Directory: Service Accounts.
Enable Kerberos Authentication Support
Provides encrypted MAPI optimization with end-to-end authentication using Kerberos. The server-side SteelHead uses Kerberos to authenticate users.
The server-side SteelHead must be running RiOS 7.0.x or later.
In addition to enabling this feature, you must also join the server-side SteelHead to a Windows Domain and add replication users in the Optimization > Active Directory: Service Accounts page.
The server-side SteelHead must be joined to the same Windows Domain that the Exchange Server belongs to and operates as a member server.
Control Description

212 | Configuring Optimization Features
Configuring MAPI optimization
Enable Transparent Prepopulation
Enables a mechanism for sustaining Microsoft Exchange MAPI connections between the client and server even after the Outlook client has shut down. This method allows email data to be delivered between the Exchange Server and the client-side SteelHead while the Outlook client is offline or inactive. When a user logs into their Outlook client, the mail data is already prepopulated on the client-side SteelHead. This accelerates the first access of the client’s email, which is retrieved with LAN-like performance.
Transparent prepopulation creates virtual MAPI connections to the Exchange Server for Outlook clients that are offline. When the remote SteelHead detects that an Outlook client has shut down, the virtual MAPI connections are triggered. The remote SteelHead uses these virtual connections to pull mail data from the Exchange Server over the WAN link.
You must enable this control on the server-side and client-side SteelHeads. By default, MAPI transparent prepopulation is enabled.
MAPI prepopulation does not use any additional Client Access Licenses (CALs). The SteelHead holds open an existing authenticated MAPI connection after Outlook is shut down. No user credentials are used or saved by the SteelHead when performing prepopulation.
The client-side SteelHead controls MAPI v2 prepopulation, which allows for a higher rate of prepopulated session, and enables the MAPI prepopulation to take advantage of the read-ahead feature in the MAPI optimization blade.
MAPI v2 prepopulation is supported in RiOS 6.0.4 or later, 6.1.2 or later, and 6.5 or later. The client-side and server-side SteelHead can be running any of these code train levels and provide v2 prepopulation capabilities. For example, a client-side SteelHead running RiOS 6.0.4 connecting to a server-side SteelHead running RiOS 6.5 provides v2 prepopulation capabilities. In contrast, a 6.0.1a client-side SteelHead connecting to a RiOS 6.5 server-side SteelHead supports v1 prepopulation, but does not provide v2 prepopulation.
If a user starts a new Outlook session, the MAPI prepopulation session terminates. If for some reason the MAPI prepopulation session does not terminate (for example, the user starts a new session in a location that is different than the SteelHead that has the MAPI prepopulation session active), the MAPI prepopulation session eventually times-out per the configuration setting.
Note: MAPI transparent prepopulation is not started with Outlook Anywhere connections.
Max Connections Specify the maximum number of virtual MAPI connections to the Exchange Server for Outlook clients that have shut down. Setting the maximum connections limits the aggregate load on all Exchange Servers through the configured SteelHead. The default value varies by model. For example, on a model 5520 the default is 3750.
You must configure the maximum connections on both the client-side and server-side of the network. In RiOS 7.0 and later, the maximum connections setting is only used by the client-side SteelHead.
Poll Interval (minutes) Sets the number of minutes you want the appliance to check the Exchange Server for newly arrived email for each of its virtual connections. The default value is 20.
Control Description

Configuring Optimization Features | 213
Configuring MAPI optimization
6. Click Apply to apply your settings to the running configuration.
7. Click Save to save your settings permanently.
Note: When you have verified appropriate changes, you can write the active configuration that is stored in memory
to the active configuration file (or you can save it as any filename you choose). For details about saving
configurations, see “Managing configuration files” on page 414.
Optimizing MAPI Exchange in out-of-path deployments
In out-of-path deployments, if you want to optimize MAPI Exchange by destination port, you must
define a fixed-target, in-path rule that specifies these ports on the client-side appliance:
• Port 135 - The Microsoft endpoint mapper port.
• Port 7830 - The SteelHead port used for Exchange traffic.
• Port 7840 - The SteelHead port used for Exchange Directory NSPI traffic.
For details about defining in-path rules, see “Configuring in-path rules” on page 90.
Deploying SteelHeads with Exchange Servers behind load balancers
You can configure SteelHeads to operate with Exchange Server clusters that use load balancers (such as
CAS) to provide dynamic MAPI port mappings for clients.
In these environments, you must configure one of these modes on the client-side SteelHead:
• Enable port transparency for MAPI traffic. For details, see “Configuring in-path rules” on page 90 and the SteelHead Deployment Guide - Protocols.
• Enable full transparency for MAPI traffic. For details, see “Configuring in-path rules” on page 90 and the SteelHead Deployment Guide - Protocols.
Time Out (hours) Specify the number of hours after which to time-out virtual MAPI connections. When this threshold is reached, the virtual MAPI connection is terminated. The time-out is enforced on a per-connection basis. Time-out prevents a buildup of stale or unused virtual connections over time. The default value is 96.
Enable MAPI over HTTP Optimization
Select on a client-side SteelHead to enable bandwidth optimization for the MAPI over HTTP transport protocol. You must also create an in-path rule using the Exchange Autodetect latency optimization policy to differentiate and optimize MAPI over HTTP traffic.
Microsoft implements the MAPI over HTTP transport protocol in Outlook 2010 update, Outlook 2013 SP1, and Exchange Server 2013 SP1.
You must enable SSL optimization and install the server SSL certificate on the server-side SteelHead.
Both the client-side and server-side SteelHeads must be running RiOS 9.1.
To view the MAPI over HTTP optimized connections, choose Reports > Networking: Current Connections. A successful connection appears as MAPI-HTTP in the Application column.
Control Description

214 | Configuring Optimization Features
Configuring NFS optimization
• Disable MAPI port remapping using the no protocol mapi port-remap enable command. After entering this command, restart the optimization service. For details, see the Riverbed Command-Line Interface Reference Manual.
Configuring NFS optimizationYou display and modify NFS optimization settings in the Optimization > Protocols: NFS page.
NFS optimization provides latency optimization improvements for NFS operations by prefetching data,
storing it on the client SteelHead for a short amount of time, and using it to respond to client requests.
You enable NFS optimization in high-latency environments.
You can configure NFS settings globally for all servers and volumes or you can configure NFS settings
that are specific to particular servers or volumes. When you configure NFS settings for a server, the
settings are applied to all volumes on that server unless you override settings for specific volumes.
Note: RiOS does not support NFS optimization in an out-of-path deployment.
Note: RiOS supports NFS optimization for NFSv3 only. When RiOS detects a transaction using NFSv2 or NFSv4, it
does not optimize the traffic. Bandwidth optimization, SDR, and LZ compression still apply to the NFSv2 or
NFSv4traffic.
To configure NFS optimization
1. Choose Optimization > Protocols: NFS to display the NFS page.
Figure 7-31. NFS page
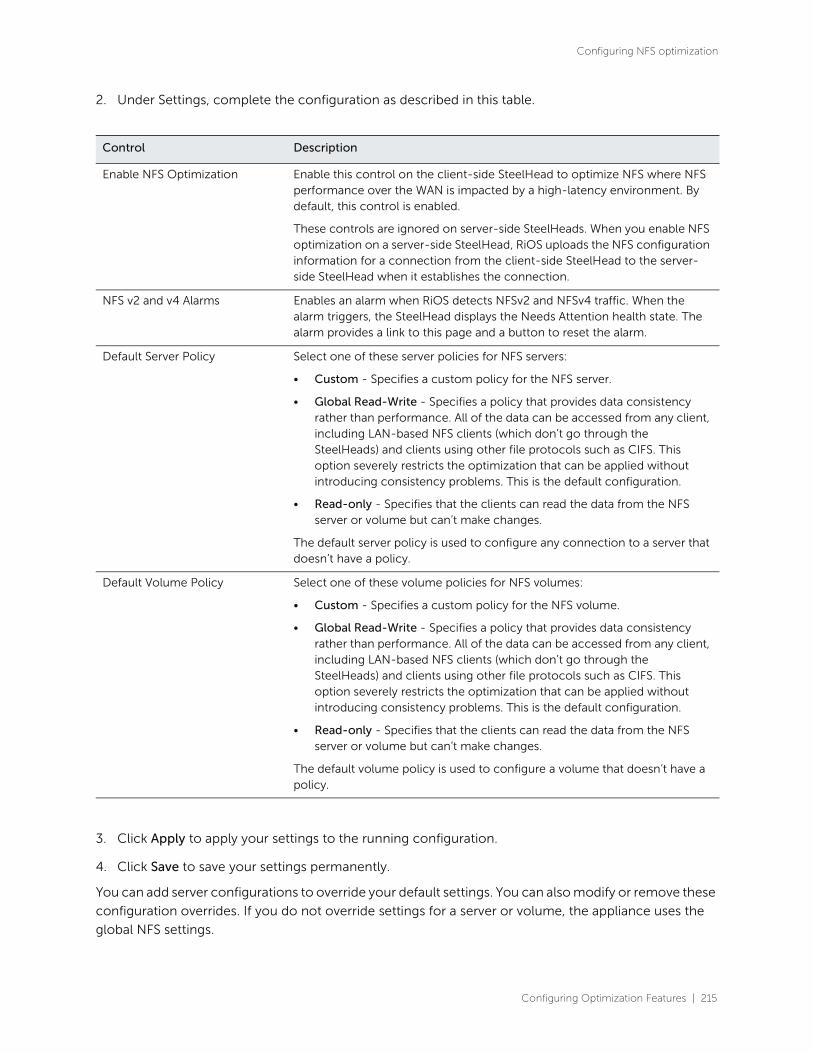
Configuring Optimization Features | 215
Configuring NFS optimization
2. Under Settings, complete the configuration as described in this table.
3. Click Apply to apply your settings to the running configuration.
4. Click Save to save your settings permanently.
You can add server configurations to override your default settings. You can also modify or remove these
configuration overrides. If you do not override settings for a server or volume, the appliance uses the
global NFS settings.
Control Description
Enable NFS Optimization Enable this control on the client-side SteelHead to optimize NFS where NFS performance over the WAN is impacted by a high-latency environment. By default, this control is enabled.
These controls are ignored on server-side SteelHeads. When you enable NFS optimization on a server-side SteelHead, RiOS uploads the NFS configuration information for a connection from the client-side SteelHead to the server-side SteelHead when it establishes the connection.
NFS v2 and v4 Alarms Enables an alarm when RiOS detects NFSv2 and NFSv4 traffic. When the alarm triggers, the SteelHead displays the Needs Attention health state. The alarm provides a link to this page and a button to reset the alarm.
Default Server Policy Select one of these server policies for NFS servers:
• Custom - Specifies a custom policy for the NFS server.
• Global Read-Write - Specifies a policy that provides data consistency rather than performance. All of the data can be accessed from any client, including LAN-based NFS clients (which don’t go through the SteelHeads) and clients using other file protocols such as CIFS. This option severely restricts the optimization that can be applied without introducing consistency problems. This is the default configuration.
• Read-only - Specifies that the clients can read the data from the NFS server or volume but can’t make changes.
The default server policy is used to configure any connection to a server that doesn’t have a policy.
Default Volume Policy Select one of these volume policies for NFS volumes:
• Custom - Specifies a custom policy for the NFS volume.
• Global Read-Write - Specifies a policy that provides data consistency rather than performance. All of the data can be accessed from any client, including LAN-based NFS clients (which don’t go through the SteelHeads) and clients using other file protocols such as CIFS. This option severely restricts the optimization that can be applied without introducing consistency problems. This is the default configuration.
• Read-only - Specifies that the clients can read the data from the NFS server or volume but can’t make changes.
The default volume policy is used to configure a volume that doesn’t have a policy.

216 | Configuring Optimization Features
Configuring NFS optimization
To override NFS settings for a server or volume
1. Choose Optimization > Protocols: NFS to display the NFS page.
2. Under Override NFS Protocol Settings, complete the configuration as described in this table.
To modify the properties for an NFS server
1. Choose Optimization > Protocols: NFS.
2. Select the NFS server name in the table and complete the configuration as described in this table.
Control Description
Add a New NFS Server Displays the controls to add an NFS server configuration.
Server Name Specify the name of the server.
Server IP Addresses Specify the IP addresses of the servers, separated by commas, and click Add.
If you have configured IP aliasing (multiple IP addresses) for an NFS server, you must specify all of the server IP addresses.
Add Adds the configuration to the NFS Servers list.
Remove Selected Select the check box next to the name and click Remove Selected.
Control Description
Server IP Addresses Specify the server IP addresses, separated by commas.
Server Policy Select one of these server policies for this NFS server configuration from the drop-down list:
• Custom - Create a custom policy for the NFS server.
• Global Read-Write - Choose this policy when the data on the NFS server can be accessed from any client, including LAN clients and clients using other file protocols. This policy ensures data consistency but doesn’t allow for the most aggressive data optimization. This is the default value.
• Read-only - Any client can read the data on the NFS server or volume but can’t make changes.
Default Volume Policy Select one of these default volume configurations for this server from the drop-down list:
• Custom - Create a custom policy for the NFS server.
• Global Read-Write - Choose this policy when the data on the NFS volume can be accessed from any client, including LAN clients and clients using other file protocols. This policy ensures data consistency but doesn’t allow for the most aggressive data optimization. This is the default value.
• Read-only - Any client can read the data on the NFS server or volume but can’t make changes.
Default Volume Enables the default volume configuration for this server.

Configuring Optimization Features | 217
Configuring NFS optimization
3. Click Save to save your settings permanently.
After you add a server, the NFS page includes options to configure volume policies. The Available
Volumes table provides an uneditable list of NFS volumes that are available for the current NFS server.
You can use the NFS volume information listed in this table to facilitate adding new NFS volumes.
To add an NFS volume configuration for a server
1. Choose Optimization > Protocols: NFS.
2. Select the NFS server name in the table and complete the configuration as described in this table.
Apply Applies the changes.
Remove Selected Select the check box next to the name and click Remove Selected.
Control Description
Add a New Volume Configuration
Displays the controls to add a new volume.
FSID Specify the volume File System ID. An FSID is a number NFS uses to distinguish mount points on the same physical file system. Because two mount points on the same physical file system have the same FSID, more than one volume can have the same FSID.
Policy Optionally, choose one of these default volume configurations for this server from the drop-down list:
• Custom - Create a custom policy for the NFS server.
• Global Read-Write - Choose this policy when the data on the NFS volume can be accessed from any client, including LAN clients and clients using other file protocols. This policy ensures data consistency but doesn’t allow for the most aggressive data optimization. This is the default value.
• Read-only - Any client can read the data on the NFS server or volume but can’t make changes.
Root Squash Enables the root squash feature for NFS volumes from this server, which turns off SteelHead optimizations for the root user on NFS clients. When the root user accesses an NFS share, its ID is squashed (mapped) to another user (most commonly “nobody”) on the server. Root squash improves security because it prevents clients from giving themselves access to the server file system.
Permission Cache Enables the permission cache, where the SteelHead stores file read data and uses it to respond to client requests. For example, if a user downloads data and another user tries to access that data, the SteelHead ensures that the second user has permission to read the data before releasing it.
Default Volume Enables the default volume configuration for this server.
Add Adds the volume.
Remove Selected Select the check box next to the volume FSID and click Remove Selected.
Control Description

218 | Configuring Optimization Features
Configuring Lotus Notes optimization
3. Click Save to save your settings permanently.
To reset the NFS alarm
1. Choose Optimization > Protocols: NFS to display the NFS page. The option to reset the NFS alarm appears only after the service triggers the NFSv2 and NFSv4 alarm. The alarm remains triggered until you manually reset it.
2. Under Reset NFS Alarm, click Reset NFS Alarm.
3. Click Save to save your settings permanently.
Related topic
• “Viewing NFS reports” on page 556
Configuring Lotus Notes optimizationYou can enable and modify Lotus Notes optimization settings in the Optimization > Protocols: Lotus
Notes page.
Lotus Notes is a client/server collaborative application that provides email, instant messaging, calendar,
resource, and file sharing. RiOS provides latency and bandwidth optimization for Lotus Notes 6.0 and
later traffic across the WAN, accelerating email attachment transfers and server-to-server or client-to-
server replications.
RiOS saves bandwidth by automatically disabling socket compression, which makes SDR more effective.
It also saves bandwidth by decompressing Huffman-compressed attachments and LZ-compressed
attachments when they’re sent or received and recompressing them on the other side. Lotus Notes
optimization allows SDR to recognize attachments that have previously been sent in other ways (such
as over CIFS, HTTP, or other protocols), and also allows SDR to optimize the sending and receiving of
attachments that are slightly changed from previous sends and receives.
To use this feature, both the client-side and server-side SteelHeads must be running RiOS 5.5.x or later.
To enable optimization of encrypted Lotus Notes connections, both the client-side and server-side
SteelHeads must be running RiOS 7.0 or later.
Enabling Lotus Notes provides latency optimization regardless of the compression type (Huffman, LZ, or
none).
Before enabling Lotus Notes optimization, be aware that it automatically disables socket-level
compression for connections going through SteelHeads that have this feature enabled.
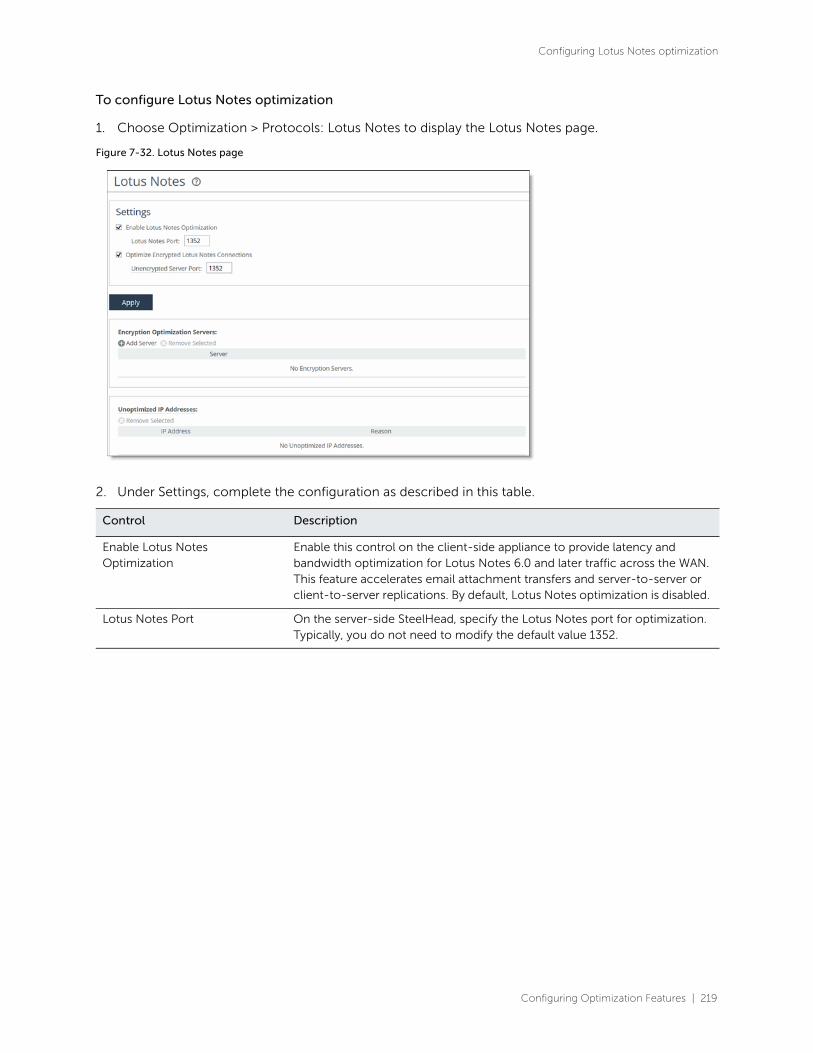
Configuring Optimization Features | 219
Configuring Lotus Notes optimization
To configure Lotus Notes optimization
1. Choose Optimization > Protocols: Lotus Notes to display the Lotus Notes page.
Figure 7-32. Lotus Notes page
2. Under Settings, complete the configuration as described in this table.
Control Description
Enable Lotus Notes Optimization
Enable this control on the client-side appliance to provide latency and bandwidth optimization for Lotus Notes 6.0 and later traffic across the WAN. This feature accelerates email attachment transfers and server-to-server or client-to-server replications. By default, Lotus Notes optimization is disabled.
Lotus Notes Port On the server-side SteelHead, specify the Lotus Notes port for optimization. Typically, you do not need to modify the default value 1352.

220 | Configuring Optimization Features
Configuring Lotus Notes optimization
9. Click Apply to apply your settings to the running configuration.
10. Click Save to save your settings permanently.
Optimize Encrypted Lotus Notes Connections
Enables Lotus Notes optimization for connections that are encrypted. By default, encrypted Lotus Notes optimization is disabled.
Perform these steps:
1. Configure an alternate unencrypted port on the Domino server to accept unencrypted connections in addition to accepting connections on the standard TCP port 1352. For details, see “Configuring an alternate port” on page 221. If the standard port is not configured to require encryption, you can use it instead of configuring an alternate port.
2. Select the Optimize Encrypted Lotus Notes Connections check box on both the client-side and server-side SteelHeads.
3. Specify the alternate unencrypted port number on the server-side SteelHead.
4. Click Apply on both the client-side appliance and server-side SteelHeads.
5. Import the ID files of the servers for which you want to optimize the connections on the server-side SteelHead:
Under Encryption Optimization Servers, choose Add Server. Either browse to a local file or specify the server ID filename to upload from a URL. Specify the password for the ID file in the password field. If the ID file has no password, leave this field blank. Click Add.
The server ID file is usually located in C:\Program Files\IBM\Lotus\Domino\data on Windows servers.
6. (Optional, but recommended unless another WAN encryption mechanism is in use.) Enable secure peering to create a secure inner channel between the client-side and server-side SteelHeads.
7. Click Save on both the client-side appliance and server-side SteelHeads.
8. Restart the optimization service on both the client-side appliance and server-side SteelHeads.
After the connection is authenticated, the server-side SteelHead resets the connection of the Notes client, but maintains the unencrypted connection with the Domino server on the auxiliary port. The Notes client now tries to establish a new encrypted connection, which the server-side SteelHead intercepts and handles as if it were the Domino server.
The server-side SteelHead (acting as the Domino server) generates the necessary information used to encrypt the connection to the Notes client. The result is an encrypted connection between the Notes client and server-side SteelHead. The connection is unencrypted between the server-side SteelHead and the Domino server.
Unencrypted Server Port Specify the alternate unencrypted port number on the server-side SteelHead. You must preconfigure this port on the Domino server. If the standard port (typically 1352) does not require encryption, you can enter the standard port number.
Control Description

Configuring Optimization Features | 221
Configuring Lotus Notes optimization
11. If you have enabled or disabled Lotus Notes, changed the port, or enabled encrypted Lotus Notes, you must restart the optimization service. For details, see “Starting and stopping the optimization service” on page 403.
Encryption Optimization Servers table
The Encryption Optimization Servers table displays all of the servers for which server ID files were
imported and optimization of encrypted connections is occurring.
If the secure vault is locked, this table does not appear. Instead, a dialog box asks you to unlock the
secure vault. After you type the password to unlock the secure vault, the Encrypted Optimization Server
table appears.
A successful connection appears as NOTES-ENCRYPT in the Current Connections report.
Unoptimized IP Address table
New connections to or from an IP address on this list do not receive Lotus Notes encryption
optimization.
If RiOS encounters a problem during client authentication that prevents the appliance from optimizing
the encrypted traffic, it must drop the connection, because in the partially authenticated session the
client expects encryption but the server does not. (Note that the client transparently tries to reconnect
with the server after the connection drops.) Whenever there is a risk that the problem might reoccur
when the client reconnects, the client IP address or server IP address or both appear on the unoptimized
IP address table on the server-side SteelHead. The system disables Lotus Notes encryption optimization
in future connections to or from these IP addresses, which in turn prevents the SteelHead from
repeatedly dropping connections, which could block the client from ever connecting to the server.
The Unoptimized IP Address table displays the reason that the client or server is not receiving Lotus
Notes encrypted optimization.
Configuring an alternate port
This section explains how to configure a Domino server to accept unencrypted connections on an
alternative TCP port in addition to accepting connections on the standard TCP port 1352.
To configure a Domino server to accept unencrypted connections on an alternative TCP port
1. Open Domino Administrator and connect to the Domino server that you want to configure.
2. Choose Configuration > Server > Setup Ports to display the Setup Ports dialog box.
3. Click New.
4. Type a port name: for example, TCPIP_RVBD. Then select TCP in the Driver drop-down box and click OK.
5. Select the new port in the Setup Ports dialog box.
6. Ensure that Port enabled is selected and that Encrypt network data is cleared, and click OK.
7. Locate and open the Domino server’s notes.ini file.
222 | Configuring Optimization Features
Configuring Citrix optimization
8. Add a line of the format port_name_TCPIPAddress=0, ip_address:port. Use the IP address 0.0.0.0 to have Domino listen on all server IP addresses.
9. To start the server listening on the new port, restart the port or restart the server.
Configuring Citrix optimizationYou enable and modify Citrix optimization settings in the Optimization > Protocols: Citrix page.
Citrix enhancements by RiOS version
RiOS 6.0 and later provide these optimizations:
• Classification and shaping of Citrix ICA traffic using Riverbed QoS to improve the end-user desktop experience
• Bandwidth reduction of compressed and encrypted Citrix ICA traffic using SteelHead Citrix optimization
RiOS 7.0 and later provide these optimizations:
• Latency optimization for client drive mapping in the Citrix ICA session
• Optimization of Citrix sessions over SSL using Citrix Access Gateway (CAG)
• SteelHead Citrix Optimization for multiport ICA traffic
RiOS 7.0.4 and later provide traffic optimization for enhanced data reduction for small Citrix packets.
RiOS 9.0.x has enhancements to QoS that classify Citrix ICA traffic based on its ICA priority group using
multistream with multiport.
RiOS 9.1.x and later include an autonegotiation of Multi-Stream ICA feature, which classifies Citrix ICA
traffic based on its ICA priority group.
Citrix version support
RiOS 6.0 and later provide support for these Citrix software components.
Citrix Receiver or ICA client versions:
• Online plug-in version 9.x
• Online plug-in version 10.x
• Online plug-in version 11.x
• Online plug-in version 12.x
• Online plug-in version13.x (Receiver version 3.x)
• Receiver for Windows version 4.x
Citrix XenDesktop:
• XenDesktop 4
• XenDesktop 5

Configuring Optimization Features | 223
Configuring Citrix optimization
• XenDesktop 5.5
• XenDesktop 5.6
• XenDesktop 7.6
Citrix XenApp:
• Presentation Server 4.5
• XenApp Server 5
• XenApp Server 6
• XenApp Server 6.5
• XenApp Server 7.6
In addition, RiOS supports encrypted and compressed Citrix ICA traffic optimization.
For information about configuring Citrix optimization, see the SteelHead Deployment Guide - Protocols,
the Riverbed Command-Line Interface Reference Manual, and the white paper Optimizing Citrix ICA
Traffic with RiOS 8.0 (June 2013).
To configure Citrix optimization
1. Choose Networking > App Definitions: Ports Labels to display the Ports Labels page.
2. Select the Interactive port label in the Port Labels list to display the Editing Port Labels Interactive group.
Figure 7-33. Editing Port Labels page
3. Under Editing Port Label Interactive, remove Citrix ICA ports 1494 and 2598 from the Ports text box.
4. Click Apply to save your settings to the running configuration.

224 | Configuring Optimization Features
Configuring Citrix optimization
5. Choose Optimization > Protocols: Citrix to display the Citrix page.
Figure 7-34. Citrix page
6. Under Settings, complete the configuration on the client-side appliance and server-side SteelHead as described in this table.
Control Description
Enable Citrix Optimization Optimizes the native Citrix traffic bandwidth. By default, Citrix optimization is disabled.
Enabling Citrix optimization requires an optimization service restart.
ICA Port Specify the port on the Presentation Server for inbound traffic. The default port is 1494.
Session Reliability (CGP) Port Specify the port number for Common Gateway Protocol (CGP) connections. CGP uses the session reliability port to keep the session window open even if there is an interruption on the network connection to the server. The default port is 2598.
Enable SecureICA Encryption Enables SDR and Citrix optimizations, while securing communication sent between a MetaFrame Presentation Server and a client.
RiOS supports optimization of Citrix ICA sessions with SecureICA set to RC5 40-bit, 56-bit, and 128-bit encryption. By default, RiOS can optimize Citrix ICA traffic with SecureICA set to basic ICA protocol encryption. You must enable SecureICA encryption to allow RiOS to optimize ICA sessions with SecureICA encryption set to RC5 on the client-side SteelHeads.

Configuring Optimization Features | 225
Configuring Citrix optimization
Enable Citrix CDM Optimization Enable this control on the client-side and server-side SteelHeads to provide latency optimization for file transfers that use client drive mapping (CDM) between the Citrix client and server. CDM allows a remote application running on the server to access disk drives attached to the local client machine. The applications and system resources appear to the user at the client machine as if they are running locally during the session. For example, in the remote session, C: is the C drive of the remote machine and the C drive of the local thin client appears as H:.
Bidirectional file transfers between the local and remote drives use one of many virtual channels within the ICA protocol. The individual data streams that form the communication in each virtual channel are all multiplexed onto a single ICA data stream. This feature provides latency optimization for file transfers in both directions.
You can use CDM optimization with or without Secure ICA encryption.
Both the client-side and server-side SteelHeads must be running RiOS 7.0 or later.
By default, CDM optimization is disabled.
Enabling CDM optimization requires an optimization service restart.
CDM optimization does not include support for CGP (port 2598).
Control Description
226 | Configuring Optimization Features
Configuring Citrix optimization
Enable Auto-Negotiation of Multi-Stream ICA
Enable this control on the client-side SteelHead to automatically negotiate ICA to use Multi-Stream ICA and carry the ICA traffic over four TCP connections instead of one.
The ICA traffic within a Citrix session comprises many categories of traffic called virtual channels. A virtual channel provides a specific function of Citrix ICA remote computing architecture, such as print, CDM, audio, video, and so on. The ICA traffic within a Citrix session is also categorized by priority, in which virtual channels carrying real-time traffic, such as audio and video, are flagged with higher priority than virtual channels carrying bulk transfer traffic such as print and CDM.
When enabled, the SteelHead splits traffic on virtual channels into a separate TCP stream (by ICA priorities) so that QoS can be applied to each individual stream. This feature is applicable for both CGP and ICA connections. This allows finer QoS shaping and marking of Citrix traffic. You can also use this feature with path selection to select and prioritize four separate TCP connections.
You can use this feature with both inbound and outbound QoS. Both SteelHeads must be running RiOS 9.1. To view the multistream connections, choose Reports > Networking: Current Connections. When the connection is classified by QoS on the SteelHead, the Application column lists the connection as Citrix-Multi-Stream-ICA along with its priority. You can also choose Reports > Networking: Inbound QoS and Outbound QoS to view the connection classifications.
Four applications are available by default under Networking > App Definitions: Applications > Business VDI for QoS classification:
Citrix-Multi-Stream-ICA-Priority-0
Citrix-Multi-Stream-ICA-Priority-1
Citrix-Multi-Stream-ICA-Priority-2
Citrix-Multi-Stream-ICA-Priority-3
No configuration is required on the server-side SteelHead.
The Citrix deployment must support Multi-Stream ICA: the clients must be running Citrix Receiver 3.0 or later. The servers must be running XenApp 6.5 or later or XenDesktop 5.5 or later.
Enabling this feature does not require an optimization service restart.
Control Description

Configuring Optimization Features | 227
Configuring Citrix optimization
Enable MultiPort ICA Enable this control on the client-side SteelHead to provide multiport ICA support. For thin-client applications, Citrix has a protocol that segregates the network traffic between a client and a server. Typically, all of the traffic is routed through the same port on the server. Enabling multiport ICA lets you group the traffic into multiple CGP ports using priorities based on data type (mouse clicks, window updates, print traffic, and so on).
After you enable multiport ICA, you can assign a port number to each of the configurable priorities. You cannot assign the same port number to more than one priority. You can also leave a priority port blank and route that traffic through some other means—which does not have to be a SteelHead.
Perform these steps:
1. From the Citrix server, enable and configure the multiport policy for the computer configuration policy in the Group Policy Editor or Citrix AppCenter. By default, port 2598 has high priority (value 1) and is not configurable. You can configure port values 0, 2, and 3. This table shows application priorities for multiport ICA.
2. Restart the Citrix server. You can then go to Reports > Networking: Current Connections to view the TCP connections in the ICA session.
3. On the client-side SteelHead, specify the same CGP ports configured on the Citrix server in the Priority Port fields. You can then return to Reports > Networking: Current Connections to view the four unique TCP connections in the ICA session.
If you have a port label to represent all ICA traffic over ports 1494 and 2598, you must add the new CGP ports to support multiport ICA.
4. Make sure that any ports you configure on the Citrix server do not conflict with the ports used on the preconfigured port labels on the SteelHead. The port labels use default pass-through rules to automatically forward traffic. To view the default port labels, choose Networking > App Definitions: Port Labels.
You can resolve a port conflict as follows:
• To configure a standard port that is associated with the RBT-Proto, Secure, or Interactive port labels and cannot be removed, use a different port number on the Citrix server configuration.
• Otherwise, remove the port from the port label.
Control Description
Value Priority Description
0 Very high Audio.
1 High Thin Wire/DX command remoting, seamless, MSFT TS licensing, SmartCard redirection, control virtual channel, mouse events, window updates end-user experience monitoring.
2 Medium MediaStream (Windows media and Flash), USB redirection, clipboard, and client drive mapping.
3 Low Printing, client COM port mapping, LPT port mapping, and legacy OEM virtual channels.
228 | Configuring Optimization Features
Configuring FCIP optimization
5. Click Apply to apply your settings to the running configuration.
6. Click Save to save your settings permanently.
7. If you have enabled or disabled Citrix optimization or Citrix CDM optimization or changed the port, you must restart the optimization service. For details, see “Starting and stopping the optimization service” on page 403..
Related topics
• “Configuring in-path rules” on page 90
• “Configuring port labels” on page 171
• “Adding QoS profiles” on page 302
• “Configuring secure peers” on page 340
Configuring FCIP optimizationYou can enable and modify Fibre Channel over TCP/IP (FCIP) storage optimization module settings in
the Optimization > Data Replication: FCIP page.
FCIP is a transparent Fibre Channel (FC) tunneling protocol that transmits FC information between FC
storage facilities over IP networks. FCIP is designed to overcome the distance limitations of FC.
FCIP storage optimization provides support for environments using storage technology that originates
traffic as FC and then uses either a Cisco Multilayer Director Switch (MDS) or a Brocade 7500 FCIP
gateway.
To increase the data reduction LAN-to-WAN ratio with either equal or greater data throughput in
environments with FCIP traffic, RiOS separates the FCIP headers from the application data workload
written to storage. The FCIP headers contain changing protocol state information, such as sequence
numbers. These headers interrupt the network stream and reduce the ability of SDR to match large,
contiguous data patterns. After isolating the header data, the SteelHead performs SDR network
deduplication on the larger, uninterrupted storage data workload and LZ compression on the headers.
RiOS then optimizes, reassembles, and delivers the data to the TCP consumer without compromising
data integrity.
Note: Environments with Symmetrix Remote Data Facility (SRDF) traffic originated through Symmetrix FC ports (RF
ports) only require configuration of the RiOS FCIP storage optimization module. Traffic originated through
Symmetrix GigE ports (RE ports) requires configuration of the RiOS SRDF storage optimization module. For details
on storage technologies that originate traffic through FC, see the SteelHead Deployment Guide.
You configure the RiOS FCIP storage optimization module on the SteelHead closest to the FCIP gateway
that opens the FCIP TCP connection by sending the initial SYN packet. The SteelHead location can vary
by environment. If you are unsure which gateway initiates the SYN, enable FCIP on both the client-side
and server-side SteelHeads.
By default, FCIP optimization is disabled.
For details about data replication deployments, see the SteelHead Deployment Guide.

Configuring Optimization Features | 229
Configuring FCIP optimization
To configure FCIP optimization
1. Choose Optimization > Data Replication: FCIP to display the FCIP page.
Figure 7-35. FCIP page
2. Under FCIP Settings, select Enable FCIP. By default, RiOS directs all traffic on the standard ports 3225, 3226, 3227, and 3228 through the FCIP optimization module. For most environments, the configuration is complete and you can skip to Step 4.
Environments with RF-originated SRDF traffic between VMAX arrays might need additional configuration to isolate and optimize the DIFs embedded within the headers of the FCIP data payload. For details, see “FCIP rules (VMAX-to-VMAX traffic only)” on page 230.
3. Optionally, you can add FCIP port numbers separated by commas or remove a port number. Do not specify a port range.
Note: The FCIP ports field must always contain at least one FCIP port.
4. Click Apply to save your settings to the running configuration.
5. Click Save to save your settings permanently.
6. If you have enabled or disabled FCIP optimization or changed a port, you must restart the optimization service. For details, see “Starting and stopping the optimization service” on page 403.
Viewing FCIP connections
After completing the FCIP configuration on both appliances and restarting the optimization service, you
can view the FCIP connections in the Current Connections report. Choose Reports > Networking:
Current Connections. In the list of optimized connections, look for the FCIP connection in the
Application column. Verify that the FCIP connection appears in the list without a red protocol error icon:
• If the report lists a connection as TCP instead of FCIP, the module is not optimizing the connection. You must verify the configuration.
230 | Configuring Optimization Features
Configuring FCIP optimization
• If the report lists a connection as FCIP but a red protocol error icon appears in the Notes column, click the connection to view the reason for the error.
For details, see “Viewing current connection reports” on page 496.
You can view combined throughput and reduction statistics for two or more FCIP tunnel ports by
entering this command from the command-line interface:
protocol fcip stat-port <port>
For details, see the Riverbed Command-Line Interface Reference Manual.
FCIP rules (VMAX-to-VMAX traffic only)
Environments with GigE-based (RF port) originated SRDF traffic between VMAX arrays must isolate DIF
headers within the data stream. These DIF headers interrupt the data stream. When the R1 Symmetrix
array is running Enginuity microcode version 5875 or newer, manual FCIP rules are not necessary. In
5875+ environments, RiOS automatically detects the presence of DIF headers and DIF blocksize for
GigE-based (RF port) SRDF traffic. To manually isolate the DIF headers when the R1 Symmetrix array is
running Enginuity microcode version 5874 or earlier, you add FCIP rules by defining a match for source
or destination IP traffic.
Automatically detected FCIP settings in Enginuity 5875 and later environments override any manually
configured FCIP rules.
FCIP default rule
The default rule optimizes all remaining traffic that has not been selected by another rule. It always
appears as the last in the list. You cannot remove the default rule; however, you can change its DIF
setting. The default rule uses 0.0.0.0 in the source and destination IP address fields, specifying all IP
addresses. You cannot specify 0.0.0.0 as the source or destination IP address for any other rule.
To add an FCIP rule
1. Choose Optimization > Data Replication: FCIP to display the FCIP page.
2. Under Rules, complete the configuration as described in this table.
Control Description
Add a New Rule Displays the controls for adding a new rule. Displays the controls for adding a manual rule. Use this control when the R1 Symmetrix array is running Enginuity microcode version 5874 or earlier.
Source IP Specify the connection source IP address of the FCIP gateway tunnel endpoints.
Note: The source IP address can’t be the same as the destination IP address.
Destination IP Specify the connection destination IP address of the FCIP gateway tunnel endpoints.
Enable DIF Isolates and optimizes the DIFs embedded within the FCIP data workload.
Configuring Optimization Features | 231
Configuring FCIP optimization
3. Click Apply to save your settings to the running configuration.
4. Click Save to save your settings permanently.
5. You must restart the optimization service after adding or removing a FCIP rule. For details, see “Starting and stopping the optimization service” on page 403.
To edit an FCIP rule
1. Choose Optimization > Data Replication: FCIP to display the FCIP page.
2. Select the rule number in the rule list.
3. Edit the rule.
4. Click Save to save your settings permanently.
Example—Adding an FCIP rule to isolate DIF headers on the FCIP tunnel carrying the VMAX-to-VMAX SRDF traffic.
Suppose your environment consists mostly of regular FCIP traffic without DIF headers that has some RF-
originated SRDF between a pair of VMAX arrays. A pair of FCIP gateways uses a tunnel to carry the traffic
between these VMAX arrays. The source IP address of the tunnel is 10.0.0.1 and the destination IP is
10.5.5.1. The preexisting default rule does not look for DIF headers on FCIP traffic. It handles all of the
non-VMAX FCIP traffic. To isolate the DIF headers on the FCIP tunnel carrying the VMAX-to-VMAX SRDF
traffic, add this rule.
1. Choose Optimization > Data Replication: FCIP to display the FCIP page.
2. Click Add a New Rule.
DIF Data Block Size Specify the size of a standard block of storage data, in bytes, after which a DIF header begins. The valid range is from 1 to 2048 bytes. The default value is 512, which is a standard block size for Open System environments. When you enable DIF, RiOS FCIP optimization looks for a DIF header after every 512 bytes of storage data unless you change the default setting.
Open System environments (such as Windows, UNIX, and Linux) inject the DIF header into the data stream after every 512 bytes of storage data.
IBM iSeries AS/400 host environments inject the DIF header into the data stream after every 520 bytes.
This field is required when you enable DIF.
Add Adds the manual rule to the list. The Management Console redisplays the Rules table and applies your modifications to the running configuration, which is stored in memory.
Remove Selected Select the check box next to the name and click Remove Selected.
Control Description
232 | Configuring Optimization Features
Configuring SRDF optimization
3. Specify these properties for the FCIP rule.
4. Click Add.
Related topic
• “Configuring SRDF optimization” on page 232
Configuring SRDF optimizationYou can enable and modify Symmetrix Remote Data Facility (SRDF) storage module optimization
settings in the Optimization > Data Replication: SRDF page.
EMC’s Symmetrix Remote Data Facility/Asynchronous (SRDF/A) is a SAN replication product. It performs
the data replication over GigE (instead of the Fibre Channel), using gateways that implement the SRDF
protocol.
SRDF storage optimization provides support for environments using storage technology that originates
traffic through Symmetrix GigE ports. For details on storage technologies that originate traffic through
GigE RE ports, see the SteelHead Deployment Guide.
To increase the data reduction LAN-to-WAN ratio with either equal or greater data throughput in
environments with SRDF traffic, RiOS separates the SRDF headers from the application data workload
written to storage. The SRDF headers contain changing protocol state information, such as sequence
numbers. These headers interrupt the network stream and reduce the ability of scalable data replication
(SDR) to match large, contiguous data patterns. After isolating the header data, the SteelHead performs
SDR network deduplication on the larger, uninterrupted storage data workload and LZ compression on
the headers. RiOS then optimizes, reassembles, and delivers the data to the TCP consumer as originally
presented to the SteelHead network.
Note: Traffic originated through Symmetrix GigE ports (RE ports) requires configuration of the RiOS SRDF storage
optimization module. Environments with SRDF traffic originated through Symmetrix FC ports (RF ports) require
configuration of the RiOS FCIP storage optimization module.
You configure the SRDF storage optimization module on the SteelHead closest to the Symmetrix array
that opens the SRDF TCP connection by sending the initial SYN packet. The SteelHead location can vary
by environment. If you are unsure which array initiates the SYN, configure SRDF on both the client-side
and server-side SteelHeads.
Control Setting
Source IP 10.0.0.1.
Destination IP 10.5.5.1
Enable DIF Select the check box.
DIF Data Block Size Leave the default setting 512.
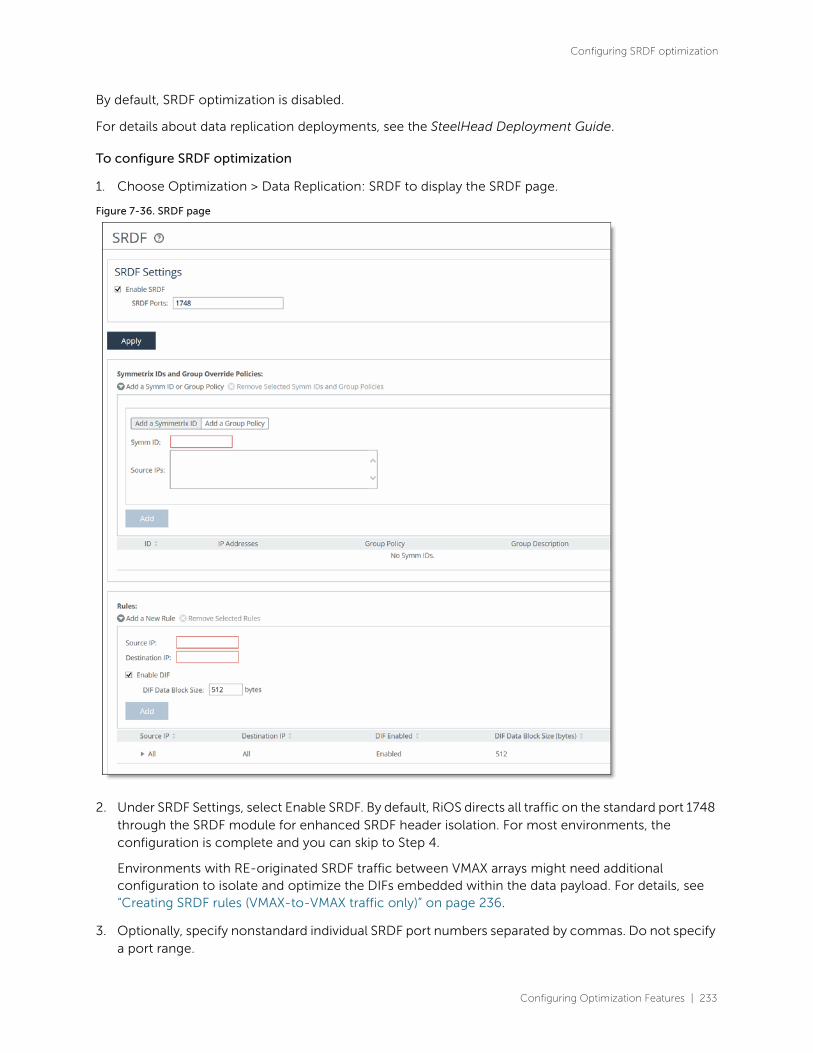
Configuring Optimization Features | 233
Configuring SRDF optimization
By default, SRDF optimization is disabled.
For details about data replication deployments, see the SteelHead Deployment Guide.
To configure SRDF optimization
1. Choose Optimization > Data Replication: SRDF to display the SRDF page.
Figure 7-36. SRDF page
2. Under SRDF Settings, select Enable SRDF. By default, RiOS directs all traffic on the standard port 1748 through the SRDF module for enhanced SRDF header isolation. For most environments, the configuration is complete and you can skip to Step 4.
Environments with RE-originated SRDF traffic between VMAX arrays might need additional configuration to isolate and optimize the DIFs embedded within the data payload. For details, see “Creating SRDF rules (VMAX-to-VMAX traffic only)” on page 236.
3. Optionally, specify nonstandard individual SRDF port numbers separated by commas. Do not specify a port range.

234 | Configuring Optimization Features
Configuring SRDF optimization
The SRDF ports field must always contain at least one port.
4. Click Apply to save your settings to the running configuration.
5. Click Save to save your settings permanently.
6. If you have enabled or disabled SRDF optimization or changed a port, you must restart the optimization service. For details, see “Starting and stopping the optimization service” on page 403.
Viewing SRDF connections
After completing the SRDF configuration on both appliances and restarting the optimization service, you
can view the SRDF connections in the Current Connections report.
• If the report lists a connection as TCP instead of SRDF, RiOS is not optimizing the connection. You must verify the configuration. For example, make sure that the peer SteelHeads are running RiOS 6.1 or later.
• If the report lists a connection as SRDF but a red protocol error icon appears in the Notes column, click the connection to view the reason for the error. A SRDF protocol error can occur when attempting to optimize traffic originating from the LAN side of the appliance. Check the LAN-side Symmetrix array for compatibility.
• If a protocol error does not appear next to the SRDF connection on the client-side appliance, RiOS is optimizing the connection normally.
For details, see “Viewing current connection reports” on page 496.
Setting a custom data reduction level for an RDF group
This section describes how to apply custom data reduction levels to remote data facility (RDF) groups.
You can base the data reduction level on the compression characteristics of the data associated with an
RDF group to provide SRDF selective optimization. Selective optimization enables you to find the best
optimization setting for each RDF group, maximizing the appliance use. Selective optimization depends
on an R1 Symmetrix array running VMAX Enginuity microcode levels newer than 5874.
For example, you can customize the data reduction level for applications associated with an RDF group
when excess WAN bandwidth is available and the application data associated with the group is not
reducible. For applications with reducible data, getting maximum reduction might be more important,
requiring a more aggressive data reduction level.
You can configure the optimization level from no compression to full scalable data replication (SDR).
SDR optimization is the default, and includes LZ compression on the cold, first-pass of the data. You can
also configure LZ-compression alone with no SDR.
Consider an example with these types of data:
• Oracle logs (RDF group 1)
• Encrypted check images (RDF group 2)
• Virtual machine images (RDF group 3)
Configuring Optimization Features | 235
Configuring SRDF optimization
In this example, you can assign LZ-only compression to the Oracle logs, no optimization to the
encrypted check images, and default SDR to the virtual machine images. To assign these levels of
optimization, you configure the appliance to associate specific RE port IP addresses with specific
Symmetrix arrays, and then assign a group policy to specific RDF groups to apply different optimization
policies.
The data reduction level within a group policy overrides the current default data reduction setting for the
storage resources an RDF group represents. This override is distinct per Symmetrix ID.
To configure a custom data reduction group policy for a Symmetrix ID
1. Choose Optimization > Data Replication: SRDF to display the SRDF page.
2. Under Symmetrix IDs and Group Override Policies, complete the configuration as described in this table.
Control Description
Add a Symm ID or Group Policy Displays the tabs for adding a Symmetrix ID or group policy.
Add a Symmetrix ID Select to display the controls for adding a Symmetrix ID.
Symm ID Specify the Symmetrix ID. The Symmetrix ID is an alphanumeric string that can contain hyphens and underscores (for example, a standard Symmetrix serial number is 000194900363). Do not use spaces or special characters.
Each Symmetrix ID can have 0 to 254 group override policies.
Source IPs Specify the connection source IP address of the Symmetrix DMX or VMAX GigE ports (RE ports) originating the replication.
Add a Group Policy Select to display the controls for adding a group policy.
RDF Group Specify the RDF group number. Symmetrix arrays that are serving Open Systems hosts and are using EMC Solutions Enabler report RDF group numbers in decimal, ranging from 1 to 255 (this is the RiOS default).
Mainframe-attached Symmetrix arrays report RDF group numbers in hexadecimal, ranging from 0 to 254.
You can’t add an RDF group until a Symmetrix ID exists.
Symmetrix ID Specify an IP address of the Symmetrix DMX or VMAX GigE ports (RE ports) originating the replication.
Data Reduction Policy By default, SDR uses the in-path rule data reduction policy. Select one of these data reduction policies from the drop-down list to override the in-path rule data reduction policy:
• Default - Performs LZ compression and SDR.
• LZ - Performs LZ compression; doesn’t perform SDR.
• None - Disables SDR and LZ compression.
Description Describe the policy to facilitate administration: for example, Oracle 1 DB.
Add Adds the ID or policy to the list. The Management Console redisplays the list and applies your modifications to the running configuration, which is stored in memory.
Remove Selected Select the check box next to the name and click Remove Selected.

236 | Configuring Optimization Features
Configuring SRDF optimization
Creating SRDF rules (VMAX-to-VMAX traffic only)
Environments with GigE-based (RE port) originated SRDF traffic between VMAX arrays must isolate DIF
headers within the data stream. These DIF headers interrupt the data stream. When the R1 Symmetrix
array is running Enginuity microcode version 5875 or newer, manual SRDF rules are not necessary. In
5875+ environments, RiOS automatically detects the presence of DIF headers and DIF blocksize for
GigE-based (RE port) SRDF traffic. To manually isolate the DIF headers when the R1 Symmetrix array is
running Enginuity microcode version 5874 or earlier, you add SRDF rules by defining a match for source
or destination IP traffic.
Automatically detected SRDF settings in Enginuity 5875 and later environments override any manually
configured SRDF rules.
SRDF default rule
The default rule optimizes all remaining traffic that has not been selected by another rule. It always
appears as the last in the list. You cannot remove the default rule; however, you can change the DIF
setting of the default rule. The default rule uses 0.0.0.0 in the source and destination IP address fields,
specifying all IP addresses. You cannot specify 0.0.0.0 as the source or destination IP address for any
other rule.
To add an SRDF rule
1. Choose Optimization > Data Replication: SRDF to display the SRDF page.
2. Under Rules, complete the configuration as described in this table.
Control Description
Add a New Rule Displays the controls for adding a manual rule. Use this control when the R1 Symmetrix array is running Enginuity microcode version 5874 or earlier.
Source IP Specify the connection source IP address of the Symmetrix DMX or VMAX GigE ports (RE ports) originating the replication.
Note: The source IP address can’t be the same as the destination IP address.
Destination IP Specify the connection destination IP address of the Symmetrix DMX or VMAX GigE ports (RE ports) receiving the replication.
Enable DIF Isolates and optimizes the Data Integrity Fields embedded within the SRDF data workload.
Configuring Optimization Features | 237
Configuring SRDF optimization
3. Click Apply to save your settings to the running configuration.
4. Click Save to save your settings permanently.
5. You must restart the optimization service after adding or removing a SRDF rule. For details, see “Starting and stopping the optimization service” on page 403.
To edit an SRDF rule
1. Choose Optimization > Data Replication: SRDF to display the SRDF page.
2. Select the rule number in the rule list.
3. Edit the rule.
4. Click Save to save your settings permanently.
Related topics
• “Configuring FCIP optimization” on page 228
• “Viewing SRDF reports” on page 558
DIF Data Block Size Specify the size of a standard block of storage data, in bytes, after which a DIF header begins. The valid range is from 1 to 2048 bytes. The default value is 512, which is a standard block size for Open System environments. When you enable DIF, RiOS SRDF optimization looks for a DIF header after every 512 bytes of storage data unless you change the default setting.
Open System environments (such as Windows, UNIX, and Linux) inject the DIF header into the data stream after every 512 bytes of storage data.
IBM iSeries (AS/400) host environments inject the DIF header into the data stream after every 520 bytes.
Do not add a manual rule isolating DIF headers in mainframe environments, as SRDF environments that replicate mainframe traffic don’t currently include DIF headers.
This field is required when you enable DIF.
Add Adds the manual rule to the list. The Management Console redisplays the Rules table and applies your modifications to the running configuration, which is stored in memory.
Remove Selected Select the check box next to the name and click Remove Selected.
Move Selected Moves the selected rules. Click the arrow next to the desired rule position; the rule moves to the new position.
Control Description

238 | Configuring Optimization Features
Configuring SnapMirror optimization
Configuring SnapMirror optimizationYou enable and modify SnapMirror storage optimization module settings in the Configure >
Optimization: SnapMirror page. SnapMirror optimization support is for environments using NetApp
ONTAP 7 or Data ONTAP 8 configured for 7-mode.
SnapMirror is used mainly for disaster recovery and replication. To provide maximum protection and
ease of management, many enterprises choose to perform SnapMirror operations across the wide-area
network. However, WAN links are often costly. Furthermore, the limited bandwidth and high-network
latency they provide often severely degrade SnapMirror operations.
The two types of SnapMirror are volume-based and qtree-based. SnapMirror replicates data from one
volume or qtree (the source) to another volume or qtree (the mirror). It then periodically updates the
mirror to reflect incremental changes to the source. The result of this process is an online, read-only
volume (the mirror) that contains the same data as the source volume at the time of the most recent
update.
You can use the information on the mirror to:
• provide quick access to data in the event of a disaster that makes the source volume or qtree unavailable. The secondary copy is nearly identical to the primary copy; every Snapshot copy on the primary copy also exists on the backup copy. You can schedule updates as frequently as every minute.
• update the source to recover from disaster, data corruption (mirror qtrees only), or user error.
• archive the data to tape.
• balance resource loads.
• back up or distribute the data to remote sites.
Due to the large amount of data transferred, a task such as mirror initialization can take days to complete
over a WAN. Some applications use a NetApp storage device called a filer. Filers touch large numbers of
storage blocks as they add, delete, and modify files during a typical workday. The filer marks each block
it touches, resulting in mirroring for many blocks on the filer. Incremental updates to remote mirror
copies might take hours to complete.
How a SteelHead optimizes SnapMirror traffic
The Edge improves the performance of the WAN for NetApp SnapMirror traffic by overcoming limited
bandwidth restrictions, high latency, and poor network quality commonly associated with wide-area
networks.
RiOS also improves WAN performance, visibility, and control of NetApp SnapMirror traffic with features
that allow you to:
• present performance statistics and apply optimization policies based on source and destination volume and host pairs.
• fine-tune network QoS policies for individual volumes, filers, or for SnapMirror as a whole.
• assign mappings by filer and volume name to one of five volume priorities. Using QoS, you can assign a service class and DSCP value to each volume priority when creating a rule for SnapMirror traffic.

Configuring Optimization Features | 239
Configuring SnapMirror optimization
• collect SnapMirror statistics, such as the total LAN/WAN bytes in and out and the active cycle time.
By default, SnapMirror optimization is disabled.
For details about data replication deployments, see the SteelHead Deployment Guide.
To configure SnapMirror optimization
1. On the source filer-side SteelHead, choose Optimization > Data Replication: SnapMirror to display the SnapMirror page.
Figure 7-37. SnapMirror page
2. Under SnapMirror Settings, select Enable SnapMirror.
3. By default, RiOS directs all traffic on the standard port 10566 through the SnapMirror module for optimization. Optionally, specify nonstandard individual SnapMirror port numbers, separated by commas.
Do not specify a port range.
The SnapMirror ports field must always contain at least one port.
SnapMirror optimization does not support port 10565 for multipath traffic.
4. Click Add a New Filer or Volume/QTree.
5. Select the Add a Filer tab.
240 | Configuring Optimization Features
Configuring SnapMirror optimization
6. Complete the configuration as described in this table.
7. Click Apply to save your settings to the running configuration.
8. Click Save to save your settings permanently.
9. If you have enabled or disabled SnapMirror optimization or changed a port, you must restart the optimization service. For details, see “Starting and stopping the optimization service” on page 403.
10. On the destination filer-side SteelHead, choose Optimization > Data Replication: SnapMirror, select Enable SnapMirror, and restart the optimization service.
Viewing SnapMirror connections
After completing the SnapMirror configuration on both SteelHeads and restarting the optimization
service, you can view the SnapMirror connections by choosing Reports > Optimization: SnapMirror. For
details, see “Viewing SnapMirror reports” on page 561.
Control Description
Filer Name Specify the name of the filer. RiOS automatically detects the volumes associated with the filer, or you can optionally add volumes to it later.
IP Addresses Specify source IPv4 addresses to associate with the filer, separated by a comma. You can’t specify IPv6 addresses.
Filer Default Optimization Policy You can configure the optimization level from no compression (none) to full Scalable Data Replication (SDR-Default).
SDR optimization includes LZ compression on the cold, first-pass of the data. You can also configure LZ-compression alone (LZ-only) with no SDR. For some applications, it might be more important to get maximum throughput with minimal latency, and without compression; for others, getting maximum reduction is more important.
Select an optimization policy for the default volumes and qtrees on this filer:
• SDR-Default - Performs SDR and LZ compression. This is the default policy.
• LZ-only - Performs LZ compression only. There is no SDR optimization with this policy.
• None - Disables SDR and LZ compression.
Filer Default SnapMirror Priority Select a priority for use later in a QoS service class: Highest, High, Medium, Low, Lowest, No Setting. The default priority is Medium. No setting means that there’s no priority and the QoS default rules apply.
Description Optionally, specify a volume description or provide additional comments.
Add Adds the filer to the list. The Management Console redisplays the Filer table and applies your modifications to the running configuration, which is stored in memory.
Remove Selected Select the check box next to the name and click Remove Selected.
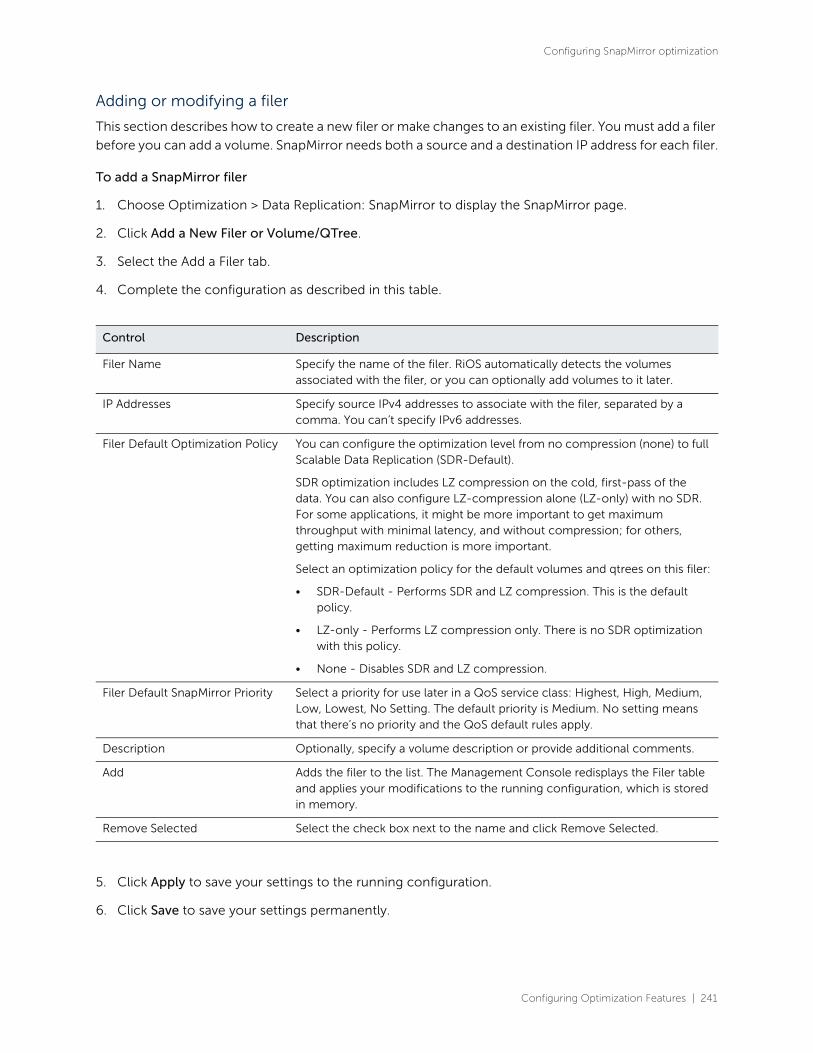
Configuring Optimization Features | 241
Configuring SnapMirror optimization
Adding or modifying a filer
This section describes how to create a new filer or make changes to an existing filer. You must add a filer
before you can add a volume. SnapMirror needs both a source and a destination IP address for each filer.
To add a SnapMirror filer
1. Choose Optimization > Data Replication: SnapMirror to display the SnapMirror page.
2. Click Add a New Filer or Volume/QTree.
3. Select the Add a Filer tab.
4. Complete the configuration as described in this table.
5. Click Apply to save your settings to the running configuration.
6. Click Save to save your settings permanently.
Control Description
Filer Name Specify the name of the filer. RiOS automatically detects the volumes associated with the filer, or you can optionally add volumes to it later.
IP Addresses Specify source IPv4 addresses to associate with the filer, separated by a comma. You can’t specify IPv6 addresses.
Filer Default Optimization Policy You can configure the optimization level from no compression (none) to full Scalable Data Replication (SDR-Default).
SDR optimization includes LZ compression on the cold, first-pass of the data. You can also configure LZ-compression alone (LZ-only) with no SDR. For some applications, it might be more important to get maximum throughput with minimal latency, and without compression; for others, getting maximum reduction is more important.
Select an optimization policy for the default volumes and qtrees on this filer:
• SDR-Default - Performs SDR and LZ compression. This is the default policy.
• LZ-only - Performs LZ compression only. There is no SDR optimization with this policy.
• None - Disables SDR and LZ compression.
Filer Default SnapMirror Priority Select a priority for use later in a QoS service class: Highest, High, Medium, Low, Lowest, No Setting. The default priority is Medium. No setting means that there’s no priority and the QoS default rules apply.
Description Optionally, specify a volume description or provide additional comments.
Add Adds the filer to the list. The Management Console redisplays the Filer table and applies your modifications to the running configuration, which is stored in memory.
Remove Selected Select the check box next to the name and click Remove Selected.
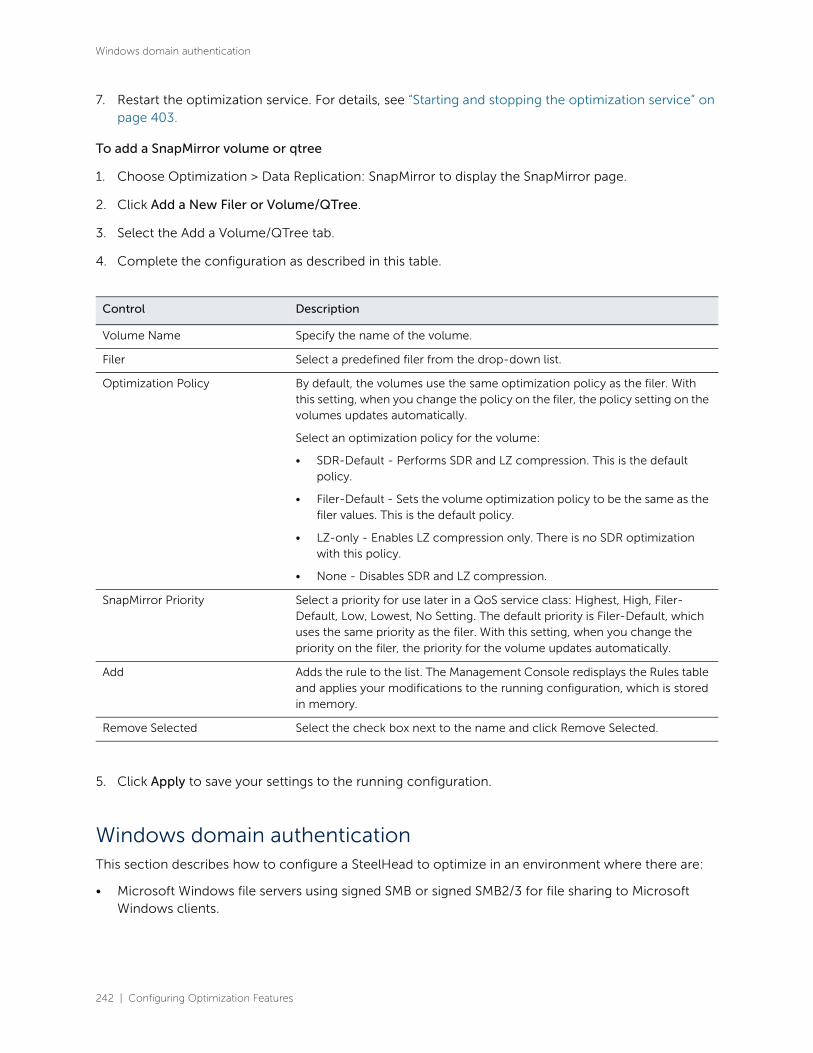
242 | Configuring Optimization Features
Windows domain authentication
7. Restart the optimization service. For details, see “Starting and stopping the optimization service” on page 403.
To add a SnapMirror volume or qtree
1. Choose Optimization > Data Replication: SnapMirror to display the SnapMirror page.
2. Click Add a New Filer or Volume/QTree.
3. Select the Add a Volume/QTree tab.
4. Complete the configuration as described in this table.
5. Click Apply to save your settings to the running configuration.
Windows domain authenticationThis section describes how to configure a SteelHead to optimize in an environment where there are:
• Microsoft Windows file servers using signed SMB or signed SMB2/3 for file sharing to Microsoft Windows clients.
Control Description
Volume Name Specify the name of the volume.
Filer Select a predefined filer from the drop-down list.
Optimization Policy By default, the volumes use the same optimization policy as the filer. With this setting, when you change the policy on the filer, the policy setting on the volumes updates automatically.
Select an optimization policy for the volume:
• SDR-Default - Performs SDR and LZ compression. This is the default policy.
• Filer-Default - Sets the volume optimization policy to be the same as the filer values. This is the default policy.
• LZ-only - Enables LZ compression only. There is no SDR optimization with this policy.
• None - Disables SDR and LZ compression.
SnapMirror Priority Select a priority for use later in a QoS service class: Highest, High, Filer-Default, Low, Lowest, No Setting. The default priority is Filer-Default, which uses the same priority as the filer. With this setting, when you change the priority on the filer, the priority for the volume updates automatically.
Add Adds the rule to the list. The Management Console redisplays the Rules table and applies your modifications to the running configuration, which is stored in memory.
Remove Selected Select the check box next to the name and click Remove Selected.

Configuring Optimization Features | 243
Windows domain authentication
• Microsoft Exchange Servers providing an encrypted MAPI communication to Microsoft Outlook clients.
• Microsoft Internet Information Services (IIS) web servers running HTTP or HTTP-based web applications such as SharePoint 2007.
For details, go to Optimizing in a Secure Windows Environment and the SteelHead Deployment Guide -
Protocols.
RiOS supports end-to-end Kerberos authentication for these secure protocols:
• SMB signing
• SMB2/3 signing
• Encrypted MAPI/Outlook Anywhere
• HTTP
Remember, if you configure the server-side SteelHead to support end-to-end Kerberos authentication,
you can join it to the domain in Active Directory integrated mode to support other clients that might be
using NTLM authentication. This configuration can provide flexible and broad support for multiple
combinations of Windows authentication types in use within the Active Directory environment.
RiOS protects authentication credentials for delegate and replication users by storing them in the secure
vault. The secure vault contains sensitive information about your appliance configuration.
You must unlock the secure vault to view, add, remove, or edit any replication or delegate user
configuration details that are stored on the SteelHeads. The system initially locks the secure vault on a
new appliance with a default password known only to RiOS. This lock allows the appliance to
automatically unlock the vault during system start up. You can change the password, but the secure vault
does not automatically unlock on start up. RiOS also locks the secure vault on a SteelHead that is
upgraded to RiOS 9.0 and later.
For details, see “Unlocking the secure vault” on page 434.
Windows 7 clients with RiOS 9.0 and later can use Kerberos authentication for maximum security.
Kerberos authentication does not require delegation mode configuration, but you must configure both
NTLM authentication (either transparent mode or delegation mode) along with Kerberos authentication
(if desired).
Configuring domain authentication automatically
You can configure domain authentication automatically to optimize traffic in an environment where
there are:
• Microsoft Windows file servers using signed SMB or signed SMB2/3 for file sharing to Microsoft Windows clients.
• Microsoft Exchange Servers providing an encrypted MAPI communication to Microsoft Outlook clients.
• Microsoft Internet Information Services (IIS) web servers running HTTP or HTTP-based web applications such as SharePoint 2007.
This section describes how to simplify configuration using these operations:

244 | Configuring Optimization Features
Windows domain authentication
• Easy Config - Configures the server-side SteelHead in Active Directory integrated mode for Windows 2003 or Windows 2008 to enable secure protocol optimization for CIFS SMB1, SMB2/3, and encrypted MAPI for all clients and servers.
• Auto Config - Configures these accounts and privileges:
– Configure Delegation Account - Configures the deployed delegation account with AD delegation privileges.
– Configure Replication Account - Configures the deployed replication account with AD replication privileges.
– Add Delegation Servers - Configures a list of the Exchange and CIFS servers that have permission to delegate AD access privileges.
– Remove Delegation Servers - Removes Exchange and CIFS servers from the list of delegation server accounts with permission to delegate AD access privileges.
Easy domain authentication configuration
Domain authentication automatic configuration simplifies the server-side SteelHead configuration for
enabling latency optimizations in a secure environment. Using this widget automates the majority of the
required configuration tasks, avoiding the need to perform step-by-step operations in different
configuration tools and using the command line on the Windows AD platforms.
Use this widget to configure the server-side SteelHead in integrated Active Directory mode for Windows
2003 or 2008 and later, and enable secure protocol optimization for CIFS SMB1, SMB2, and SMB3 for all
clients and servers. To enable secure protocol optimization for MAPI and encrypted MAPI, you need to
enable MAPI protocol optimization on all clients after running the widget.
Domain Authentication Automatic Configuration performs these tasks:
1. Tests the DNS configuration.
2. Joins the server-side SteelHead to the domain.
3. Enables secure protocol optimization, such as SMB signing.
4. Configures a deployed replication user in Active Directory, with the necessary privileges.
If any of the steps fail during the configuration, the system automatically rolls back to the previous
configuration.
You do not necessarily need to use the replication user or delegate user facility to optimize secure
Windows traffic if you deploy the server-side SteelHead so that it joins a domain in the Active Directory
environment. To integrate the server-side SteelHead into Active Directory, you must configure the role
when you join the SteelHead to the Windows domain.
When you integrate the server-side SteelHead in this way, it does not provide any Windows domain
controller functionality to any other machines in the domain and does not advertise itself as a domain
controller or register any SRV records (service records). In addition, the SteelHead does not perform any
replication nor hold any Active Directory objects. The server-side SteelHead has just enough privileges
so that it can have a legitimate conversation with the domain controller and then use transparent mode
for NTLM authentication.

Configuring Optimization Features | 245
Windows domain authentication
To configure domain authentication using Easy Config
1. On the server-side SteelHead, choose Networking > Networking: Host Settings.
2. Under Primary DNS server, specify the DNS server IP address to use as the DNS server for the domain.
3. Under DNS domain list, add the primary DNS server name to the list.
4. Click Apply to apply your settings to the running configuration.
5. Choose Optimization > Active Directory: Auto Config.
6. Under Easy Config, select Configure Domain Auth.
Figure 7-38. Easy Config widget
7. On the server-side SteelHead, complete the configuration as described in this table.
Control Description
Admin User Specify the name of the domain administrator. RiOS deletes domain administrator credentials after the join.
Password Specify the password for the domain administrator account. This control is case sensitive.

246 | Configuring Optimization Features
Windows domain authentication
Domain/Realm Specify the fully qualified domain name of the Active Directory domain in which to make the SteelHead a member. Typically, this is your company domain name. RiOS supports Windows 2000 or later domains.
Domain Controller Specify the hosts that provide user login service in the domain, separated by commas. (Typically, with Windows 2000 Active Directory Service domains, given a domain name, the system automatically retrieves the DC name.)
Short Domain Name Specify the short (NETBIOS) domain name.
You can identify the short domain name by pressing Ctrl+Alt+Delete on any member server. You must explicitly specify the short domain name if it doesn’t match the leftmost portion of the fully qualified domain name.
Enable Encrypted MAPI Select to enable encrypted MAPI optimization on the server-side SteelHead. After running this widget, you must also choose Optimization > Protocols: MAPI on the client-side SteelHead and select Enable MAPI Exchange Optimization and Enable Encrypted Optimization.
Enable SMB Signing Select to enable optimization on SMB-signed connections on the server-side and client-side SteelHeads.
Enable SMB2 Signing Select to enable optimization on SMB2-signed connections on the server-side and client-side SteelHeads.
Enable SMB3 Signing Select to enable optimization on SMB3-signed connections on the server-side and client-side SteelHeads.
Control Description
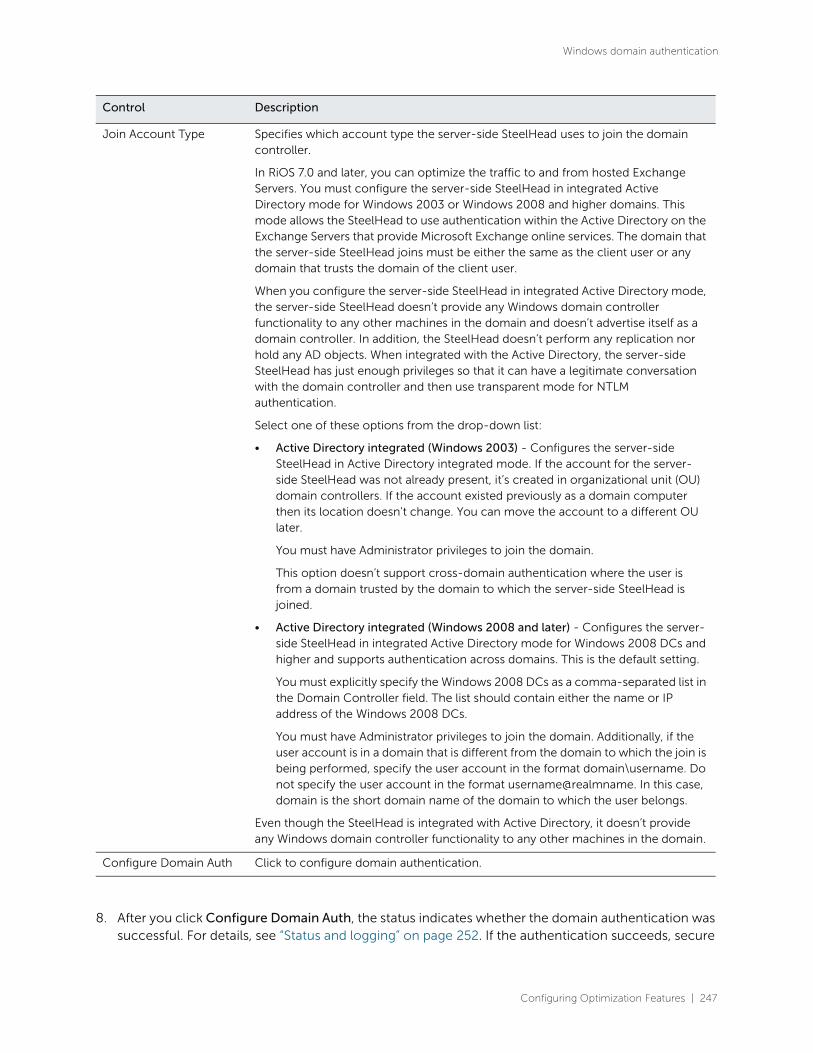
Configuring Optimization Features | 247
Windows domain authentication
8. After you click Configure Domain Auth, the status indicates whether the domain authentication was successful. For details, see “Status and logging” on page 252. If the authentication succeeds, secure
Join Account Type Specifies which account type the server-side SteelHead uses to join the domain controller.
In RiOS 7.0 and later, you can optimize the traffic to and from hosted Exchange Servers. You must configure the server-side SteelHead in integrated Active Directory mode for Windows 2003 or Windows 2008 and higher domains. This mode allows the SteelHead to use authentication within the Active Directory on the Exchange Servers that provide Microsoft Exchange online services. The domain that the server-side SteelHead joins must be either the same as the client user or any domain that trusts the domain of the client user.
When you configure the server-side SteelHead in integrated Active Directory mode, the server-side SteelHead doesn’t provide any Windows domain controller functionality to any other machines in the domain and doesn’t advertise itself as a domain controller. In addition, the SteelHead doesn’t perform any replication nor hold any AD objects. When integrated with the Active Directory, the server-side SteelHead has just enough privileges so that it can have a legitimate conversation with the domain controller and then use transparent mode for NTLM authentication.
Select one of these options from the drop-down list:
• Active Directory integrated (Windows 2003) - Configures the server-side SteelHead in Active Directory integrated mode. If the account for the server-side SteelHead was not already present, it’s created in organizational unit (OU) domain controllers. If the account existed previously as a domain computer then its location doesn’t change. You can move the account to a different OU later.
You must have Administrator privileges to join the domain.
This option doesn’t support cross-domain authentication where the user is from a domain trusted by the domain to which the server-side SteelHead is joined.
• Active Directory integrated (Windows 2008 and later) - Configures the server-side SteelHead in integrated Active Directory mode for Windows 2008 DCs and higher and supports authentication across domains. This is the default setting.
You must explicitly specify the Windows 2008 DCs as a comma-separated list in the Domain Controller field. The list should contain either the name or IP address of the Windows 2008 DCs.
You must have Administrator privileges to join the domain. Additionally, if the user account is in a domain that is different from the domain to which the join is being performed, specify the user account in the format domain\username. Do not specify the user account in the format username@realmname. In this case, domain is the short domain name of the domain to which the user belongs.
Even though the SteelHead is integrated with Active Directory, it doesn’t provide any Windows domain controller functionality to any other machines in the domain.
Configure Domain Auth Click to configure domain authentication.
Control Description
248 | Configuring Optimization Features
Windows domain authentication
protocol optimization for CIFS (SMB1), SMB2, and SMB33 is enabled for all clients and servers. Encrypted MAPI is enabled for all servers. To enable encrypted MAPI for all clients, you must enable encrypted optimization on the client-side appliance. For details, see “Configuring MAPI optimization” on page 206.
Configuring domain authentication for delegation
Although a user with generic domain administrator privileges meets the requirements for replication,
generic privileges could have some security implications.
Delegation
Using delegation mode to optimize SMB-signed or encrypted MAPI traffic requires additional
configuration (beyond joining the server-side SteelHead to a domain) because delegation mode uses the
Active Directory constrained delegation feature. You must configure both the server-side SteelHead and
the Windows domain that it joins.
Constrained delegation is an Active Directory feature that enables configured services to obtain security
related information for a user. Configuring constrained delegation requires the creation of a special
delegate user account in the Windows domain. The account allows the delegate user the privilege of
obtaining security information for use with specific applications (like CIFS and MAPI), and then
configuring the delegate user credentials on the server-side SteelHead.
Replication
You can assign a restricted set of privileges to a user, known as a replication user. You can configure the
replication user on a per-forest basis so that the user assigned to it can retrieve machine credentials from
any domain controller in any trusted domain within the forest. Remember that a forest can comprise
multiple domains with trusts between them.
Automatic configuration simplifies setting up your SteelHead for delegation or replication. Use these
widgets to:
• configure delegation or replication accounts.
• add or remove delegation servers.
Configuring the delegation account
The configure delegation account widget configures a user with trusted delegation rights for a domain.
To configure the delegation account with AD delegation privileges
1. Choose Optimization > Active Directory: Auto Config.

Configuring Optimization Features | 249
Windows domain authentication
2. Under Auto Config, select Configure Delegation Account.
Figure 7-39. Easy Config
3. On the server-side SteelHead, complete the configuration as described in this table.
After you click Configure Delegation Account, the status indicates whether the configuration was successful. For details, see “Status and logging” on page 252.
Configuring the replication account
The configure replication account widget adds a user with trusted replication rights to a domain.
Control Description
Admin User Specify the delegate username. The maximum length is 20 characters. The username can’t contain any of these characters:
/ \ [ ] : ; | = , + * ? < > @ "
Note: The system translates the username into uppercase to match the registered server realm information.
Note: You can only add one delegate user per domain. A delegate user is required in each of the domains where a server is going to be optimized.
Password Specify the user account password.
Delegation Domain/Realm
Select the delegation domain in which you want to make the delegate user a trusted member from the drop-down list.
Domain Controller Specify the hosts that provide user login service in the domain, separated by commas. (Typically, with Windows 2000 Active Directory Service domains, given a domain name, the system automatically retrieves the DC name.)
Configure Delegation Account
Click to configure the account.
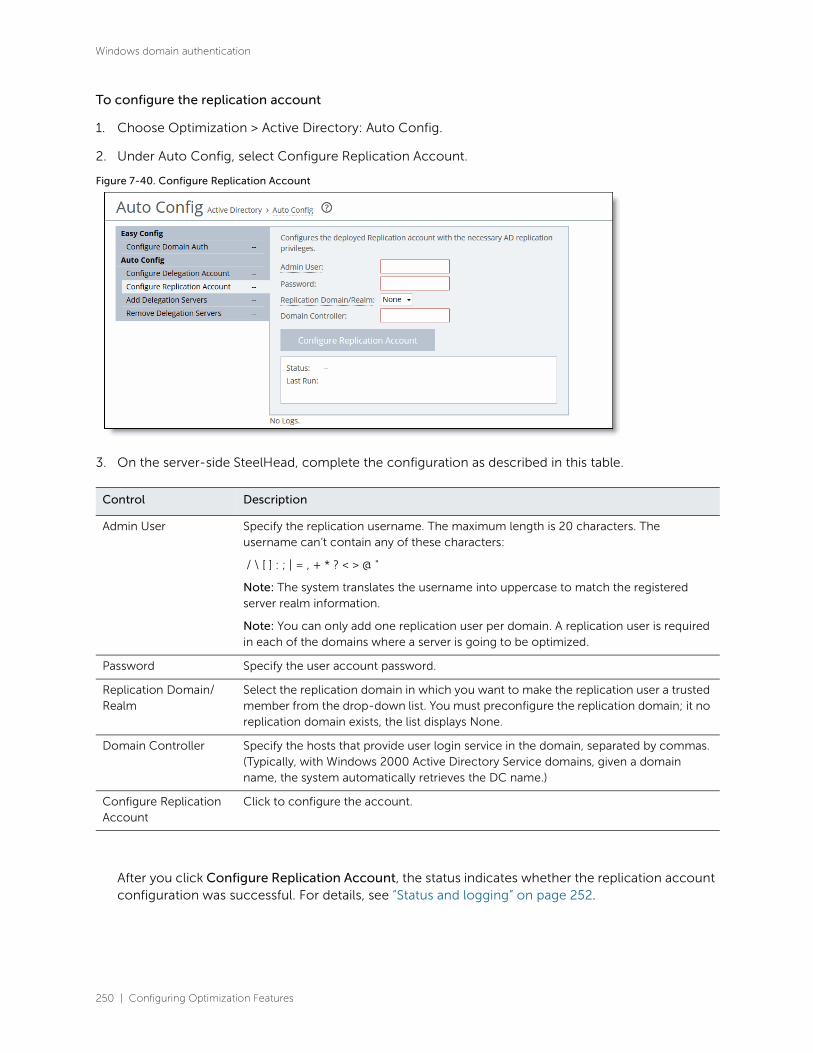
250 | Configuring Optimization Features
Windows domain authentication
To configure the replication account
1. Choose Optimization > Active Directory: Auto Config.
2. Under Auto Config, select Configure Replication Account.
Figure 7-40. Configure Replication Account
3. On the server-side SteelHead, complete the configuration as described in this table.
After you click Configure Replication Account, the status indicates whether the replication account configuration was successful. For details, see “Status and logging” on page 252.
Control Description
Admin User Specify the replication username. The maximum length is 20 characters. The username can’t contain any of these characters:
/ \ [ ] : ; | = , + * ? < > @ "
Note: The system translates the username into uppercase to match the registered server realm information.
Note: You can only add one replication user per domain. A replication user is required in each of the domains where a server is going to be optimized.
Password Specify the user account password.
Replication Domain/Realm
Select the replication domain in which you want to make the replication user a trusted member from the drop-down list. You must preconfigure the replication domain; it no replication domain exists, the list displays None.
Domain Controller Specify the hosts that provide user login service in the domain, separated by commas. (Typically, with Windows 2000 Active Directory Service domains, given a domain name, the system automatically retrieves the DC name.)
Configure Replication Account
Click to configure the account.

Configuring Optimization Features | 251
Windows domain authentication
Adding the delegation servers
The add delegation servers widget adds delegation servers from either the CIFS or Exchange MDB
service.
To add delegation servers
1. Choose Optimization > Active Directory: Auto Config.
2. Under Auto Config, select Add Delegation Servers.
Figure 7-41. Add Delegation Servers to a service
3. On the server-side SteelHead, complete the configuration as described in this table.
Control Description
Admin User Specify the delegate username. The maximum length is 20 characters. The username can’t contain any of these characters:
/ \ [ ] : ; | = , + * ? < > @ "
Note: The system translates the username into uppercase to match the registered server realm information.
Note: You can only add one delegate user per domain. A delegate user is required in each of the domains where a server is going to be optimized.
Password Specify the user account password.
Delegation Domain/Realm
Select the delegation domain in which you want to make the delegate user a trusted member from the drop-down list.
Domain Controller Specify the hosts that provide user login service in the domain, separated by commas. (Typically, with Windows 2000 Active Directory Service domains, given a domain name, the system automatically retrieves the DC name.)
Service Select a service type for delegation: CIFS or Exchange MDB service.
Server List Specify the CIFS or MAPI servers as the local hostname, separated by commas.
Add Delegation Servers Click to add the servers for delegation.
252 | Configuring Optimization Features
Windows domain authentication
After you click Add Delegation Servers, the status indicates whether the configuration was successful.
Removing the delegation servers
The remove delegation servers widget removes delegation servers from either the CIFS or Exchange
MDB service.
To remove delegation servers
1. Choose Optimization > Active Directory: Auto Config.
2. Under Auto Config, select Remove Delegation Servers.
3. On the server-side SteelHead, complete the configuration as described in this table.
After you click Remove Delegation Servers, the status indicates whether the servers were removed.
Status and logging
After you run a widget, the status indicates one of these states:
• Not Started - The operation has never executed on this SteelHead.
• Success - The last time the operation executed, it completed successfully with no errors.
Control Description
Admin User Specify the domain administrator name assigned to the delegation server. The maximum length is 20 characters. The administrator name can’t contain any of these characters:
/ \ [ ] : ; | = , + * ? < > @ "
Note: The system translates the administrator name into uppercase to match the registered server realm information.
Password Specify the user account password.
Delegation Domain/Realm
Select the delegation domain in which you want delegate user is a trusted member.
Domain Controller Specify the hosts that provide user login service in the domain, separated by commas. (Typically, with Windows 2000 Active Directory Service domains, given a domain name, the system automatically retrieves the DC name.)
Service Select the delegation service type: CIFS or Exchange MDB service.
Server List Specify the CIFS or MAPI servers as the local hostname, separated by commas.
Remove Delegation Servers
Click to remove the servers from delegation.
Configuring Optimization Features | 253
Windows domain authentication
• Failed - The last time the operation executed, the results were unsuccessful. The operation was not carried out because it ran into an error condition.
• In Progress - The operation is actively running. In this state, the browser constantly polls the back end to see if the operation has completed. Once the operation completes, the browser stops polling.
Last Run displays the amount of time elapsed since the last execution and then the time and date the
operation completed. The time is meaningful only if the status is success or failed.
Logging Data displays log output for the operation. You might want to view the log if the status indicates
an operation failure. Two log files follow an operation:
• The summary log contains the highlights of the full log.
• The full log contains a detailed record of the operation.
You can control the logging data display using the tabs.
Select Hide Log to remove the logs from the display.
Select the Summary and Full Log tabs to view the logging data. The system displays a line count for the
number of lines in the logging data. The system omits the tab if the log file is empty.
• For the summary and full log tabs, an abbreviated form of the time stamp appears in the left margin of each line. Mouse over a time stamp and view the entire time stamp in a tooltip.
Not all log lines have time stamps, because some of the logging data is generated by third-party (non-Riverbed) applications.
• The log highlights line errors in red and warnings in yellow.
Configuring domain authentication manually
These sections describe the manual configuration on the server-side SteelHead for enabling latency
optimizations in a secure environment. We recommend using the automatic configuration as described
in “Configuring domain authentication automatically” on page 243, because it performs these steps
automatically. Use this operation instead of the automatic configuration to set up delegate users in
Active Directory. After running this operation, you can enable secure protocol optimization for CIFS
SMB1, SMB2, SMB3, and encrypted MAPI for all clients and servers.
For an overview of Windows Domain Authentication, see “Windows domain authentication” on
page 242.
For details about configuring domain authentication manually, see the white paper Optimizing in a
Secure Windows Environment.
Delegation
Follow the procedures in this section after joining a Windows domain and enabling the SMB Signing,
HTTP, or MAPI optimization features. For details, see “Configuring SMB signing” on page 181,
“Configuring MAPI optimization” on page 206, or “Configuring HTTP optimization” on page 190.
Delegation mode requires that you manually grant the user access to delegate. A delegate user is
required in each of the domains where a server is going to be optimized.

254 | Configuring Optimization Features
Windows domain authentication
To set up the domain controller
• In Windows, create a user in the domain controller responsible for the domain of which the CIFS or MAPI server is a member. Choose Active Directory Users and Computers > Domain Name > Users and create the user (for example, with the name delegate_user). Alternatively, you can select an existing user.
The next step is to create a Service Principal Name for the delegate user.
To create the Service Principal Name (SPN)
• In Windows, create an SPN for the user using the setspn.exe command-line tool. The Windows Server 2003 SP1 Support Tools product CD includes this tool or you can download it from the Microsoft Download Center. With Windows Server 2008 or later, the setspn.exe tool is installed by default. The SPN:
– must be unique because the DC assigns the Kerberos ticket for it.
– can’t be used by another service.
– can’t be cifs/<hostname-of-domain-controller>, or mapi/<hostname-of-domain-controller>, which are used by the CIFS and MAPI services.
To access the setspn.exe tool, open a command window on the domain controller. Then enter the command to add an SPN for the delegate user. For example:
c:\> setspn.exe -A cifs/delegate delegate_user
where
-A
adds the specified SPN to the specified account
cifs/delegate
is the name of the SPN, and
delegate_user
is the name of the delegate user account.
Note: For details on SPN, go to http://msdn.microsoft.com/en-us/library/ms677949%28VS.85%29.aspx.
The next step is to grant the user access to delegate for the CIFS or MAPI service in Windows. You must
perform this procedure for every server on which you want to enable RiOS SMB signing or Encrypted
MAPI.
To grant the user access to delegate
1. Open Active Directory Users and Computers, and select the Delegate User > Properties > Delegation tab.
Note: If the Delegation tab does not appear, raise the Windows domain functionality to the Windows 2003 level or
higher and create a Service Principal Name for the delegate user.

Configuring Optimization Features | 255
Windows domain authentication
2. Select Trust this user for delegation to specified services only and Use any authentication protocol.
Figure 7-42. Granting user access to delegate
3. Click Add.
Figure 7-43. Adding the server to be delegated
4. Click Users or Computers.
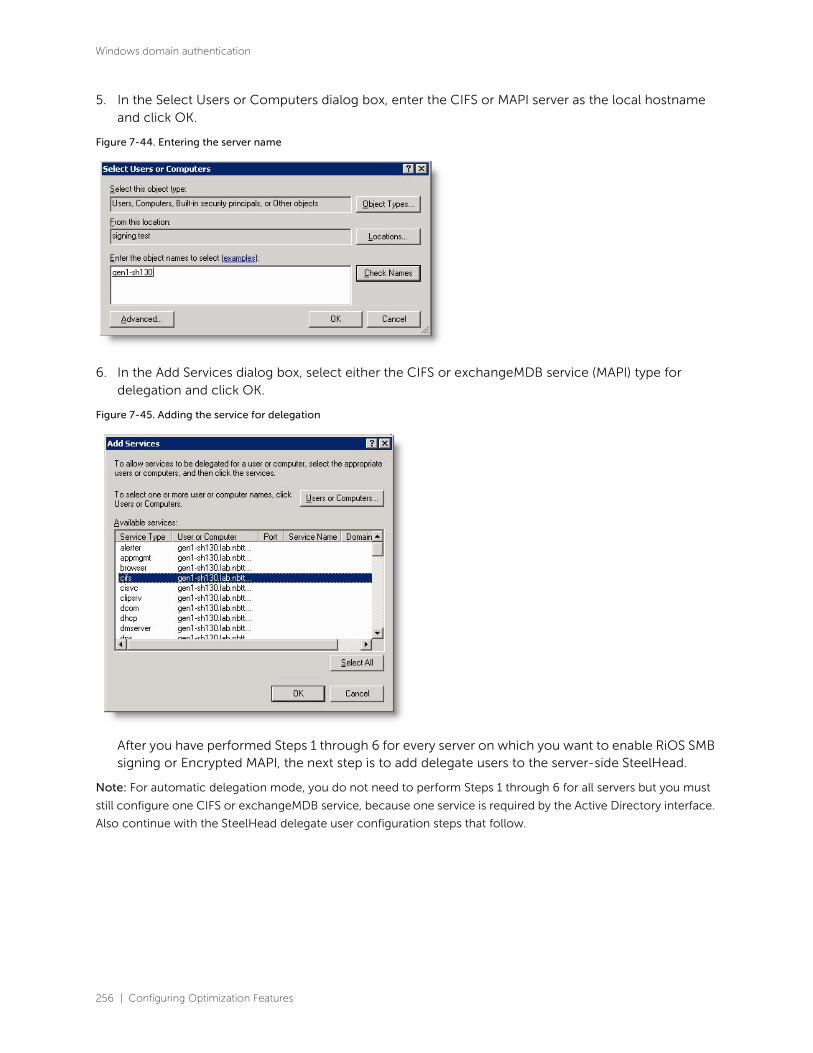
256 | Configuring Optimization Features
Windows domain authentication
5. In the Select Users or Computers dialog box, enter the CIFS or MAPI server as the local hostname and click OK.
Figure 7-44. Entering the server name
6. In the Add Services dialog box, select either the CIFS or exchangeMDB service (MAPI) type for delegation and click OK.
Figure 7-45. Adding the service for delegation
After you have performed Steps 1 through 6 for every server on which you want to enable RiOS SMB signing or Encrypted MAPI, the next step is to add delegate users to the server-side SteelHead.
Note: For automatic delegation mode, you do not need to perform Steps 1 through 6 for all servers but you must
still configure one CIFS or exchangeMDB service, because one service is required by the Active Directory interface.
Also continue with the SteelHead delegate user configuration steps that follow.
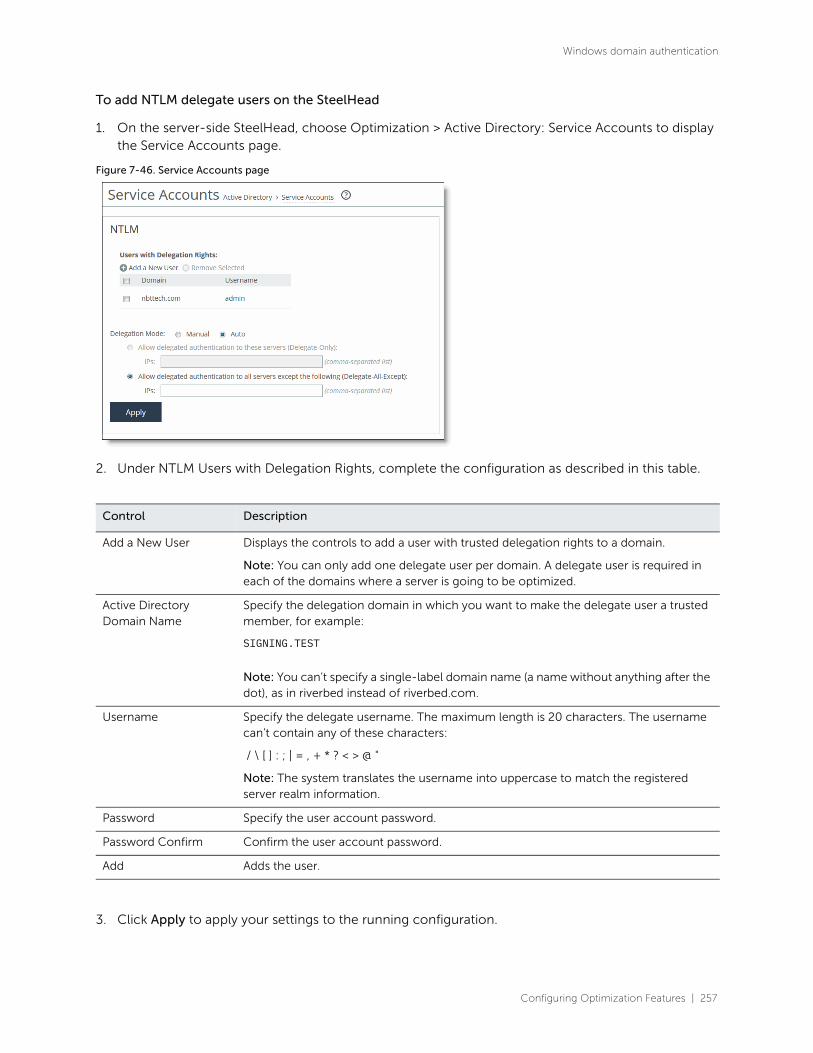
Configuring Optimization Features | 257
Windows domain authentication
To add NTLM delegate users on the SteelHead
1. On the server-side SteelHead, choose Optimization > Active Directory: Service Accounts to display the Service Accounts page.
Figure 7-46. Service Accounts page
2. Under NTLM Users with Delegation Rights, complete the configuration as described in this table.
3. Click Apply to apply your settings to the running configuration.
Control Description
Add a New User Displays the controls to add a user with trusted delegation rights to a domain.
Note: You can only add one delegate user per domain. A delegate user is required in each of the domains where a server is going to be optimized.
Active Directory Domain Name
Specify the delegation domain in which you want to make the delegate user a trusted member, for example:
SIGNING.TEST
Note: You can’t specify a single-label domain name (a name without anything after the dot), as in riverbed instead of riverbed.com.
Username Specify the delegate username. The maximum length is 20 characters. The username can’t contain any of these characters:
/ \ [ ] : ; | = , + * ? < > @ "
Note: The system translates the username into uppercase to match the registered server realm information.
Password Specify the user account password.
Password Confirm Confirm the user account password.
Add Adds the user.

258 | Configuring Optimization Features
Windows domain authentication
To set up manual delegation (specifying each server allowed to delegate), continue to the next
procedure.
To set up automatic server detection, see “Autodelegation mode” on page 259.
To specify manual delegation mode and allowed servers using NTLM
1. On the server-side SteelHead, choose Optimization > Windows Domain Auth to display the Windows Domain Auth page.
2. Under NTLM, complete the configuration as described in this table.
3. Click Apply to apply your settings to the running configuration.
4. Click Save to save your settings permanently.
5. If you change the delegation mode, you must restart the optimization service.
Note: A delegate user with access to the CIFS and exchangeMDB (MAPI) service does not have log on privileges.
Control Description
Delegation Mode: Manual
Select to enable transparent authentication using NTLM and provide more control to specify the exact servers to perform optimization for. When you select this mode, you must specify each server on which to delegate and sign for each domain using the Delegate-Only and Delegate-All-Except controls.
This is the default setting in RiOS 6.0 and later.
Delegation Mode: Auto Select to enable delegate user authentication and automatically discover the servers on which to delegate and sign. Automatic discovery eliminates the need to set up the servers on which to delegate and sign for each domain. This mode requires additional configuration. For details, see autodelegation mode.
A delegate user is required in each of the domains where a server is going to be optimized.
Allow delegated authentication to these servers (Delegate-Only)
Click to intercept the connections destined for the servers in this list. By default, this setting is enabled. Specify the file server IP addresses for SMB signed or MAPI encrypted traffic in the text box, separated by commas.
Note: You can switch between the Delegate-Only and Delegate-All-Except controls without losing the list of IP addresses for the control. Only one list is active at a time.
Allow delegated authentication to all servers except the following (Delegate-All-Except)
Click to intercept all of the connections except those destined for the servers in this list. Specify the file server IP addresses that don’t require SMB signing or MAPI encryption in the text box, separated by commas. By default, this setting is disabled. Only the file servers that don’t appear in the list are signed or encrypted.
Note: You must register any servers not on this list with the domain controller or be using autodelegation mode.

Configuring Optimization Features | 259
Windows domain authentication
Autodelegation mode
Delegation mode automatically updates the delegate user in Active Directory with delegation rights to
servers. The service updates the user in real-time, eliminating the need to grant the user access to
delegate on every server. Auto-delegation mode also updates the server IP address if it changes.
This section describes how to grant special privileges to the delegate user so they have automatic
delegation rights to servers. The first step is to create a Delegate User with a Service Principal Name
(SPN). The procedure to create a delegate user with an SPN is the same for both Windows DC R2 2003
and Windows DC R2 2008. Next, you must grant the delegate user the right to delegate on the domain
controller. Because the procedures to grant the delegate user rights on the domain controller (DC) is
different for Windows DC R2 2003 and Windows DC R2 2008, the procedures to do so are separate.
Next, you must grant the user access to delegate for the CIFS or MAPI service in Windows for at least
one server.
Note: A delegate user that is an Administrator already has the correct delegation rights for autodelegation mode.
Note: A delegate user is required in each of the domains where a server is going to be optimized.
Note: If you update the password for the delegate user in Active Directory, you must also update the account
information on the SteelHead. To do this, delete the old account and add a new one with the updated password.
To create a delegate user with an SPN
• In Windows, create an SPN for the user using the setspn.exe command-line tool. The Windows Server 2003 SP1 Support Tools product CD includes this tool or you can download it from the Microsoft Download Center. With Windows Server 2008 or later, the setspn.exe tool is installed by default. The SPN:
– must be unique because the domain controller (DC) assigns the Kerberos ticket for it.
– cannot be used by another service.
– cannot be cifs/<hostname-of-domain-controller>, or mapi/<hostname-of-domain-controller>, which are used by the CIFS and MAPI services.
To access the setspn.exe tool, open a command window on the domain controller. Then enter the command to add an SPN for the delegate user. For example:
c:\> setspn.exe -A cifs/delegate delegate_user
where
-A
adds the specified SPN to the specified account
cifs/delegate
is the name of the SPN, and
delegate_user
is the name of the delegate user account.
Note: For details on SPN, go to http://msdn.microsoft.com/en-us/library/ms677949%28VS.85%29.aspx.

260 | Configuring Optimization Features
Windows domain authentication
To grant the delegate user rights in the Controlling Security Group Policy Object (GPO) for Windows DC R2 2008
1. Choose Start > Administrative Tools > Group Policy Management to display the Group Policy Management viewer.
2. Locate the Default Domain Controllers Security Policy and choose Edit to display the Group Policy Management editor.
Figure 7-47. Editing the Domain Controller Security Policy
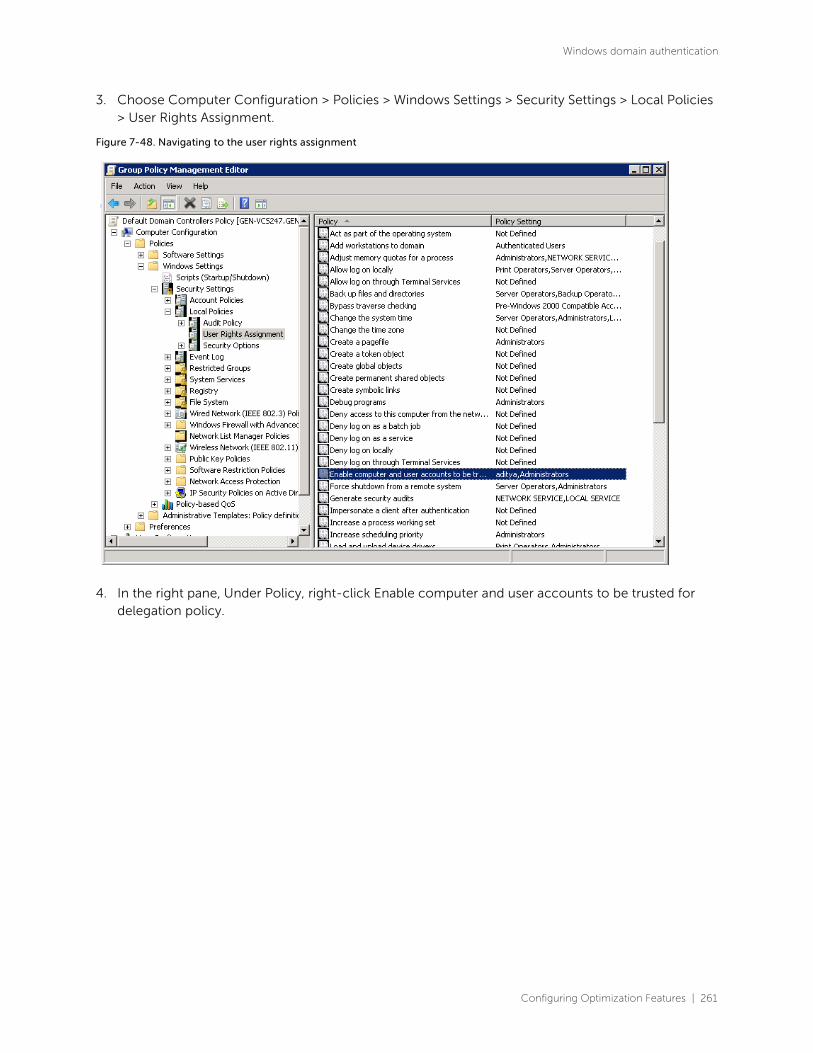
Configuring Optimization Features | 261
Windows domain authentication
3. Choose Computer Configuration > Policies > Windows Settings > Security Settings > Local Policies > User Rights Assignment.
Figure 7-48. Navigating to the user rights assignment
4. In the right pane, Under Policy, right-click Enable computer and user accounts to be trusted for delegation policy.

262 | Configuring Optimization Features
Windows domain authentication
5. Click Add to display the Add User or Group dialog box.
Figure 7-49. Adding a delegate user to the group policy management in Windows 2008
6. Specify the delegate username and click OK.
7. Click OK to close the Group Policy Management editor.
Now that the delegate user has rights in the Windows 2008 GPO, you must grant the delegate user more
privileges to use autodelegation mode. For details, see “To grant the delegate user rights to modify the
msDS-AllowedToDelegateTo Active Directory attribute on itself” on page 264.
To grant the delegate user rights in the Controlling Security Group Policy Object (GPO) in Windows 2003
1. Choose Start > Administrative Tools > Domain Controller Security Policy.
The GPO viewer appears.
2. Choose Security Settings > Local Policies > User Rights Assignment.

Configuring Optimization Features | 263
Windows domain authentication
3. Right-click Enable computer and user accounts to be trusted for delegation policy.
Figure 7-50. Adding a delegate user to the group policy management in Windows 2003
4. Click Properties.
5. Specify the delegate username.
6. Click OK to add the username.
7. Close the Group Policy Management editor.
8. Click OK to close the Group Policy Management viewer.
Now that the delegate user has rights in the Windows 2008 GPO, the next step is to grant the user access
to delegate for the CIFS or MAPI service in Windows. You must perform the procedure for at least one
server on which you want to enable RiOS SMB signing or Encrypted MAPI. For details, see “To grant the
user access to delegate” on page 254.
After granting the user access to delegate for at least one server, you must grant the delegate user more
privileges to use autodelegation mode. For details, see “To grant the delegate user rights to modify the
msDS-AllowedToDelegateTo Active Directory attribute on itself” on page 264.
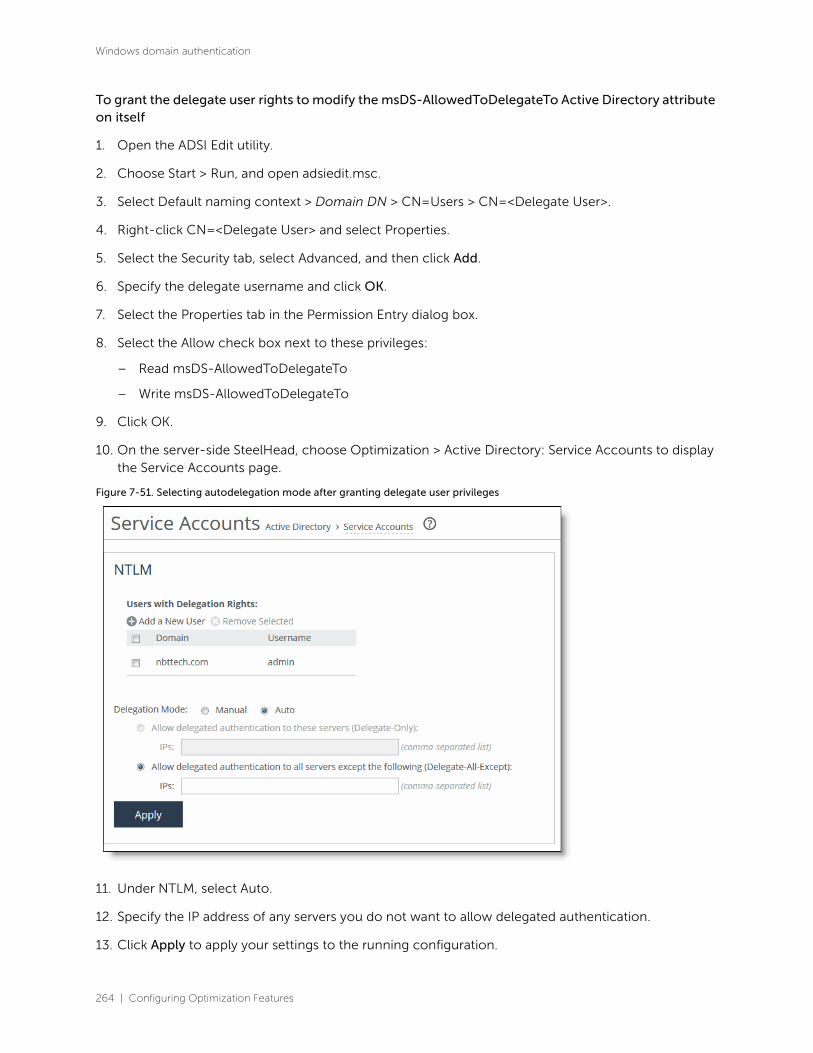
264 | Configuring Optimization Features
Windows domain authentication
To grant the delegate user rights to modify the msDS-AllowedToDelegateTo Active Directory attribute on itself
1. Open the ADSI Edit utility.
2. Choose Start > Run, and open adsiedit.msc.
3. Select Default naming context > Domain DN > CN=Users > CN=<Delegate User>.
4. Right-click CN=<Delegate User> and select Properties.
5. Select the Security tab, select Advanced, and then click Add.
6. Specify the delegate username and click OK.
7. Select the Properties tab in the Permission Entry dialog box.
8. Select the Allow check box next to these privileges:
– Read msDS-AllowedToDelegateTo
– Write msDS-AllowedToDelegateTo
9. Click OK.
10. On the server-side SteelHead, choose Optimization > Active Directory: Service Accounts to display the Service Accounts page.
Figure 7-51. Selecting autodelegation mode after granting delegate user privileges
11. Under NTLM, select Auto.
12. Specify the IP address of any servers you do not want to allow delegated authentication.
13. Click Apply to apply your settings to the running configuration.

Configuring Optimization Features | 265
Windows domain authentication
14. Click Save to save your settings permanently.
15. Click Restart to restart the optimization service.
Troubleshooting delegate users
This section provides information on troubleshooting the delegate user set up, if necessary.
• When the CIFS or exchangeMDB service (MAPI) cannot obtain a delegate user’s credentials, this message appears:
kinit: krb5_get_init_creds: Clients credentials have been revoked
This message indicates that Login Denied is set for the delegate user for the entire day. To verify when the delegate user has permission to log in, select the Account tab in the Delegate User Properties dialog box and click Logon Hours.
• When the CIFS or exchangeMDB service cannot obtain permissions to access certain required user account attributes, this message appears:
kgetcred: krb5_get_creds: Client ([email protected]) unknown
Add the delegate user to the Windows Authorization Access group. For details, seehttp://support.microsoft.com/kb/331951.
• For details about constrained delegation, seehttp://technet.microsoft.com/en-us/library/cc739587(WS.10).aspx.
Configuring replication users (Kerberos)
Kerberos end-to-end authentication relies on Active Directory replication to obtain machine credentials
for any servers that require secure protocol optimization. The RiOS replication mechanism requires a
domain user with AD replication privileges, and involves the same AD protocols used by Windows
domain controllers. These procedures explain how to configure replication to use Kerberos
authentication for these features:
• SMB signing
• SMB2 or SMB3 signing
• Encrypted MAPI and encrypted Outlook Anywhere
• HTTP or HTTP-based traffic
Kerberos one-way trust provides an alternative to creating and using a specific Kerberos replication user
for trust models with split resource and management Active Directory domains, such as Office 365 or
other managed service providers.
To enable Kerberos authentication for restricted trust environments, see “To enable one-way trust using
Kerberos” on page 269. To join the server-side SteelHead as an integrated Active Directory, see “Easy
domain authentication configuration” on page 244.
For details about restricted trust configurations, see the SteelHead Deployment Guide.

266 | Configuring Optimization Features
Windows domain authentication
To add Kerberos replication users on the SteelHead
1. On the server-side SteelHead, choose Optimization > Active Directory: Service Accounts to display the Service Accounts page.
Figure 7-52. Adding a replication user
RiOS stores authentication credentials for delegate and replication users in the secure vault. To unlock
the secure vault, choose Administration > Security: Secure Vault and click Unlock Secure Vault.
Configuring Optimization Features | 267
Windows domain authentication
2. Under Kerberos Replication Users, complete the configuration as described in this table.
Control Description
Add a New User Displays the controls to add a user with replication privileges to a domain.
You can add one replication user per forest.
Active Directory Domain Name
Specify the AD domain in which you want to make the replication user a trusted member. For example:
SIGNING.TEST
The SteelHead replicates accounts from this domain.
To facilitate configuration, you can use wildcards in the domain name: for example, *.nbttech.com.
You can’t specify a single-label domain name (a name without anything after the dot), as in riverbed instead of riverbed.com.
User Domain Specify the domain the user belongs to, if different from the Active Directory domain name. We recommend that you configure the user domain as close to the root as possible.
Username Specify the replication username. The user must have privileges to change the replicate directory. For details, see “Granting replication user privileges on the Domain Controller” on page 268.
The username can be an administrator. A replicate user that is an administrator already has the necessary replication privileges.
The maximum username length is 20 characters. The username can’t contain any of these characters:
/ \ [ ] : ; | = , + * ? < > @ "
Note: The system translates the username into uppercase to match the registered server realm information.
Password Specify the user account password.
Password Confirm Confirm the user account password.

268 | Configuring Optimization Features
Windows domain authentication
3. Click Apply to apply your settings to the running configuration.
sections describe additional procedures necessary to configure PRP support.
Granting replication user privileges on the Domain Controller
1. In Windows, open Active Directory Users and Computers and choose Start > Administrative Tools > Active Directory Users and Computers.
2. Select the domain name, right-click, and select Delegate Control.
3. Select one or more users to whom you want to delegate control, and click Add.
4. Click Next.
5. Select Create a custom task to delegate and click Next.
6. Select This folder, existing objects in this folder, and creation of new objects in this folder. Click Next.
7. Select General > Replicate Directory Changes.
8. Select Replicate Directory Changes All and click Next.
Enable Password Replication Policy Support
When you deploy the server-side SteelHead for optimizing traffic in a native Kerberos environment, and configure it in Active Directory integrated mode, you can optionally limit its scope when you configure a PRP in the Windows domain. In this way, the SteelHead can only replicate accounts as permitted by the PRP rules. However, this can create additional administrative overhead in managing the PRP.
You can’t configure PRP in Windows 2003 domains.
A Windows server using Active Directory integration caches user and computer accounts performing authentication locally. The PRP is essentially a set rules describing which accounts the server is allowed to replicate.
When PRP is enabled, the server-side SteelHead only replicates accounts that it’s allowed to as determined by PRP settings for the domain. When a user account is not cached locally, the server forwards the authentication to a writeable domain controller (DC) that does the authentication. If you allow the user’s password to be cached, then the server pulls that through a replication request. After the user is authenticated, the server caches the user password and handles any subsequent logins locally.
Enabling a password replication policy (PRP) requires additional configuration in Windows:
• Configure the replication user on the DC.
• Check the domain functional level.
• Configure PRP support on the DC.
DC Name Specify the Windows 2008 or later DC name, which is required when enabling PRP support.
Add Adds the user.
Control Description
Configuring Optimization Features | 269
Windows domain authentication
9. Click Finish if the correct groups and users appear with the permissions Replicating Directory Changes and Replicate Directory Changes All.
Verifying the domain functional level
Verify that the current domain functional level is Windows 2008 or later. See “Verifying the domain
functional level and host settings” on page 184. For details on functional level support, see the SteelHead
Deployment Guide - Protocols.
Configuring PRP on the Domain Controller
The final step in configuring replication users is to add users to either the allowed password replication
group or the denied password replication group.
1. Choose Start > Administrative Tools > Active Directory Users and Computers, select the domain name, right-click, and select Users.
2. Select either the Allowed RODC Password Replication Group or the Denied RODC Password Replication Group, select the members, and click Add.
3. Click OK.
Enabling Kerberos in a restricted trust environment
This section describes an alternative to creating and using a specific Kerberos replication user for
environments with restricted security. Kerberos restricted trust includes trust models with split resource
and management Active Directory domains such as Office 365 or other managed service providers.
For details about restricted trust configurations, see the SteelHead Deployment Guide - Protocols.
Windows XP clients must use TCP for Kerberos in a one-way trust configuration. By default, Kerberos
uses UDP. You must change UDP to TCP in a Registry setting.
To enable one-way trust using Kerberos
1. To verify that the Active Directory environment has a one-way trust configuration, open Active Directory Domains and Trusts, right-click Account/Resource Domain, select Properties, and then select Trusts. From the account domain perspective, you should see an incoming trust from the resource domain. From the resource domain perspective, you should see an outgoing trust to the account domain.
For details on one-way trust configurations, see SteelHead Deployment Guide - Protocols.
2. If you have not previously configured signing or eMAPI on the server-side SteelHead, choose Optimization > Active Directory: Config Domain Auth to walk through these configuration steps:
– Point DNS to the DNS server
– Join a domain
– Enable signing or eMAPI
– Configure transparent or delegation mode
– Configure replication

270 | Configuring Optimization Features
Windows domain authentication
– Enable end-to-end Kerberos for signing or eMAPI
3. On the server-side SteelHead, choose Optimization > Active Directory: Service Accounts.
4. Under Kerberos, select the Enable Kerberos support for restricted trust environments check box.
5. Click Apply to apply your settings to the running configuration.
6. On the client-side appliance, choose Networking > App Definitions: Port Labels.
7. Because the client-side appliance has a default in-path rule that bypasses all traffic classified in the secure port label, remove port 88 to allow the appliance to intercept Kerberos traffic instead of bypassing it.
8. Click Apply to apply your settings to the running configuration.
RiOS features a domain health tool to identify, diagnose, and report possible problems with a SteelHead
within a Windows domain environment. For details, see “Checking domain health” on page 632.
Related topics
• “Configuring CIFS optimization” on page 174
• “Optimizing SMB2/3” on page 177
• “Configuring MAPI optimization” on page 206
• “Adding QoS profiles” on page 302
• “Viewing current connection reports” on page 496
Configuring QoS, Path Selection, and Hybrid Networking | 271
8
Configuring QoS, Path Selection, and
Hybrid Networking
This chapter describes features that maximize performance of networks and hybrid networks across
branch offices. Hybrid network architecture typically combines private assets such as MPLS-based WAN
networks with public services such as the internet. RiOS provides application-level Quality of Service
(QoS) and WAN path selection to control network consumption and prioritize critical and latency
sensitive applications, while minimizing use by noncritical applications.
This chapter includes these sections:
• “Where do I start?” on page 271
• “Defining a hybrid network topology” on page 274
• “Defining applications” on page 281
• “Applying QoS policies” on page 286
• “Configuring QoS” on page 294
• “Inbound QoS” on page 309
• “Path selection” on page 312
For details about QoS and path selection, see the SteelHead Deployment Guide.
Where do I start?Network topology and application properties form the reusable building blocks that allow you to inspect
and direct network traffic using the QoS, path selection, and web proxy features. On an SCC, you can
protect network traffic by reusing these building blocks with the secure transport feature. In addition, the
application statistics collector in the SCC provides visibility into the throughput data for optimized and
pass-through traffic flowing in and out of the SteelHeads in your network. For details, see the
SteelCentral Controller for SteelHead User Guide.

272 | Configuring QoS, Path Selection, and Hybrid Networking
Where do I start?
Best practices for QoS configuration
This table provides the suggested workflow for configuring QoS.
Task Notes For detailed
instructions
1. Define applications
Choose Networking > App Definitions: Applications.
Attach a business relevancy to all traffic that goes through your network. Application definitions enable you to prioritize traffic with QoS and steer traffic down a particular path with path selection.
Use the preexisting default definitions to identify applications. If the application doesn’t appear in the preexisting application list, you can define a custom application.
“Defining applications” on page 281
2. View or modify the default QoS profile, or configure additional QoS profiles
Choose Networking > Network Services: Quality of Service to view the QoS classes that are used for the default profile.
Optionally, modify the default profile by editing the classes, creating additional classes, or adding rules.
The classes specify the traffic hierarchy, priority, and the minimum and maximum bandwidth the class uses for shaping.
The rules can use application definitions and application groups.
Optionally, create an entirely new QoS profile and attach rules to that profile.
“Viewing and editing the default QoS classes” on page 298
“Adding QoS profiles” on page 302
3. Define a view of all available networks
Choose Networking > Topology: Sites & Networks.
On a SteelHead, the network definition is simply a name: for example, MPLS.
“Defining a network” on page 275
4. Define sites Choose Networking > Topology: Sites & Networks.
Sites provide the SteelHead with the IP addresses of all existing subnets (including non-SteelHead sites). It’s important to define all remote subnets in the enterprise so they can be matched with the correct QoS profile.
You must define local and remote sites and local gateways.
You also define the default site as a catch-all for traffic that is not assigned to another site and for backhaul traffic.
“Defining a site” on page 277
5. Assign a QoS profile to sites
Choose Networking > Topology: Sites & Networks, click Edit Site, select an inbound and outbound QoS profile, and click Save. Select Default to use the default profile.
Assign one profile per site. You can’t assign a profile to a network.
6. Enable QoS Choose Networking > Network Services: Quality of Service. “To enable QoS” on page 295

Configuring QoS, Path Selection, and Hybrid Networking | 273
Where do I start?
Best practices for path selection configuration
This table provides the suggested workflow for configuring path selection.
Task Notes For detailed
instructions
1. Define applications
Choose Networking > App Definitions: Applications.
Attach a business relevancy to all traffic that goes through your network. Use the preexisting default definitions to identify applications. If the application doesn’t appear in the preexisting application list, you can define a custom application.
“Defining applications” on page 281
2. Define a view of all available networks
Choose Networking > Topology: Sites & Networks.
The network definition is simply a name: for example, MPLS.
“Topology properties” on page 274
“Defining a network” on page 275
3. Define sites Choose Networking > Topology: Sites & Networks.
Provides the SteelHead with the IP addresses of all subnets existing within a site (this applies to non-SteelHead sites as well). It’s important to define all remote subnets in the enterprise so they can be matched with the correct rules.
You must define local and remote sites. The site definitions include a list of IP subnets that path selection will use to identify the site. Every subnet must be globally unique, although they can overlap.
You also define the default site as a catch-all for traffic that is not assigned to another site.
Specify the SteelHead peers to use for path monitoring. SteelHead peers are select distinct IP addresses you choose to poll, in order, to verify path availability.
“Defining a site” on page 277
4. Define uplinks that join the sites to the networks
Choose Networking > Topology: Sites & Networks.
You must define the local site with the gateway IP address and the in-path interface the uplinks will use to connect to the network. On the SteelHead you are configuring, the local default gateway is the in-path interface.
When you configure path selection, if the default gateway is pointing to the LAN side of the SteelHead, we recommend changing the interface to point the gateway to the WAN side of the SteelHead to avoid packet ricochet.
The order of sites isn’t important because the longest prefix in the site subnet is matched first.
“Defining uplinks” on page 279
5. Enable path selection
Choose Network > Network Services: Path Selection and select Enable Path Selection.
6. Configure path selection rules
Path selection rules direct matching traffic onto specific uplinks. Traffic is matched by a combination of application and destination site.
“To configure path selection” on page 313

274 | Configuring QoS, Path Selection, and Hybrid Networking
Defining a hybrid network topology
Defining a hybrid network topologyYou define the network connectivity view in the Networking > Topology: Sites & Networks page.
RiOS 9.0 provides a way to define a static network topology to a configuration that is shareable between
appliances. The network topology definition becomes a building block that simplifies feature
configuration for path selection and QoS. You define a topology once and then reuse it as needed. The
topology provides the network point-of-view to all other possible sites, including each remote site’s
networks and a remotely ping-able IP address.
RiOS uses the topology definition to:
• share the remote site information between peers.
• determine possible remote paths for path selection.
• precompute the estimated end-to-end bandwidth for QoS, based on the remote uplinks.
We strongly recommend that you define topologies, push topology definitions, and distribute updates
to an existing topology from a SteelCentral Controller for SteelHead to the SteelHead appliances,
particularly with large scale deployments. For details, see the SteelCentral Controller for SteelHead
Deployment Guide.
Topology properties
A network topology includes these WAN topology properties:
• Networks - Define the carrier-provided WAN connections: for example, MPLS, VSAT, or internet.
• Sites - Define the discrete physical locations on the network: for example, a branch office or data center. A site can be a single floor of an office building, a manufacturing facility, or a data center. The sites can be linked to one or more networks. The local sites use the WAN in the network definition to connect to the other sites. The default site is a catch-all site that is the only site needed to backhaul traffic.
Use sites with path selection, QoS, and secure transport features.
If SteelHead peers connect to subnets within a network that don’t communicate with each other, you can define an area, as shown in “Site definition divided into areas” on page 275. To configure areas, use the Riverbed command-line interface.

Configuring QoS, Path Selection, and Hybrid Networking | 275
Defining a hybrid network topology
• Uplinks - define the last network segment connecting the local site to a network. You define carrier-assigned characteristics to an uplink: for example, the upload and download bandwidth and latency. An uplink must be directly (L2) reachable by at least one appliance or Interceptor in the local network. An uplink does not need to be a physical in-path. Path selection uses only local uplinks.
Figure 8-1. Topology overview
Figure 8-2. Site definition divided into areas
The Sites & Networks page is central to defining networks and sites, to viewing sites with which a
network is associated, changing or deleting sites, and assigning uplinks to a site.
Defining a network
Networks represent the WAN networks that sites use to communicate with each other, such as MLPS,
VSAT, or internet.

276 | Configuring QoS, Path Selection, and Hybrid Networking
Defining a hybrid network topology
To add a network
1. Choose Networking > Topology: Sites & Networks to display the Sites & Networks page.
Figure 8-3. Sites & Networks page
The networks appear. The default network is the network to which RiOS links the default uplinks. You cannot delete the default network.
If you are not using path selection, you can use the default network. To configure path selection, you can edit the network for the default uplinks: for example, Default0_0 uses MPLS, while Default0_1 uses internet.
2. Under Networks, click + Add a Network.
The New Network dialog box appears.
Figure 8-4. New Network dialog box
3. Specify the network name: for example, MPLS1.
4. Select Public Network if the network represents the internet.
You can also configure a secure network on the SCC. Secure transport uses UDP to encapsulate traffic on a public network. For details on secure transport, see the SteelCentral Controller for SteelHead User Guide and the Riverbed Command-Line Interface Reference Manual.

Configuring QoS, Path Selection, and Hybrid Networking | 277
Defining a hybrid network topology
5. Click Save.
Defining a site
You can optionally add sites to the network. A site is a logical grouping of subnets. Sites represent the
physical and logical topology of a site type. You can classify traffic for each site using network addresses.
Site types are typically data center, small, medium and large branch office, and so on. Sites provide the
SteelHead with the IP addresses of all subnets existing within a site (this applies to non-SteelHead sites
as well).
You must define local and remote sites. The site definitions include a list of IP subnets that path selection
or QoS will use to identify the site. Every subnet must be globally unique, although they can overlap.
You also need to define the default site that provides a catch all for traffic not assigned to another site.
SteelHeads running RiOS 9.0 and later determine the destination site using a longest-prefix match on
the site subnets. For example, if you define site 1 with 10.0.0.0/8 and site 2 with 10.1.0.0/16, then traffic
to 10.1.1.1 matches site 2, not site 1. Consequently, the default site defined as 0.0.0.0 only matches traffic
that doesn’t match any other site subnets. This is in contrast to RiOS 8.6 and earlier, where you
configured sites in an explicit order and the first-matching subnet indicated a match for that site.
You can associate an inbound or outbound QoS profile with a site to fine-tune the QoS behavior for
each site. For details, see “Viewing and editing the default QoS classes” on page 298 and “Adding QoS
profiles” on page 302.
Note: The maximum number of QoS sites is 200.
The default site is a catch-all for traffic not assigned to another site that has a subnet of 0.0.0.0/0. You
don’t need to add a remote site if you only have one remote site and the default site is suitable.
To add a site
1. Choose Networking > Topology: Sites & Networks to display the Sites & Networks page.
2. Under Sites, click + Add a Site.

278 | Configuring QoS, Path Selection, and Hybrid Networking
Defining a hybrid network topology
The Create a New Site dialog box appears.
Figure 8-5. Create a New Site dialog box
3. Specify the site name: for example, DCEurope.
4. Optionally, specify a subnet IP prefix for a set of IP addresses on the LAN-side, separating multiple subnets with commas.
5. Optionally, specify the SteelHead IP addresses of the peers. The site uses peers for path selection monitoring and GRE tunneling. Separate multiple peers with commas. SteelHead peers are select distinct IP addresses you choose to poll, in order, to monitor path availability or they’re the remote site at the end of a GRE tunnel. We strongly recommend that you use the remote SteelHead in-path IP address as a peer address when possible.
When you add a site in the SteelCentral Controller for SteelHead, you don’t have to specify the IP addresses of the SteelHeads at each given site, because the SCC dynamically adds them to the site configuration that it sends to the SteelHeads.
You can use the CLI to connect a peer to multiple areas through different interfaces. For details, see the Riverbed Command-Line Interface Reference Manual.
6. Optionally, select an inbound or outbound QoS profile to use with the site. For details, see “Adding QoS profiles” on page 302.
You don’t need to select a QoS profile for path selection.
7. Click Save.

Configuring QoS, Path Selection, and Hybrid Networking | 279
Defining a hybrid network topology
Defining uplinks
Configuring a network topology involves specifying uplinks. An uplink is the last network segment
connecting the local site to a network. At a high level, you can define multiple uplinks to a given network.
The appliance monitors the state of the uplink and, based on this, selects the appropriate uplink for a
packet. Selecting appropriate uplinks for packets provides more control over network link use.
Remote uplinks are also important for QoS because they define the available bandwidth for remote sites.
RiOS uses the specified bandwidth to compute the end-to-end bottleneck bandwidth for QoS.
You can define an uplink based on an egress interface and, optionally, the next-hop gateway IP address.
You can specify different DSCP marks per uplink for a given flow, allowing an upstream router to steer
packets based on the observed marking.
To monitor uplink availability; you configure the latency of the uplink (timeout) and the loss observed
(threshold). Path selection uses ICMP pings to monitor the uplink state dynamically, on a regular
schedule (the default is 2 seconds). If the ping responses do not make it back within the probe timeout
period, the probe is considered lost. If the system loses the number of packets defined by the probe
threshold, it considers the uplink to be down and triggers an alarm, indicating that the uplink is
unavailable.
If one uplink fails, the appliance directs traffic through another available uplink. When the original uplink
comes back up, the appliance redirects the traffic back to it.
You can configure up to 1024 direct uplinks.
Defining tunneled uplinks
RiOS 8.6 and later include a tunnel mode to provide IPv4 generic routing encapsulation (GRE) for direct
uplinks. Direct uplinks using GRE become direct tunneled uplinks. You must create direct tunneled
uplinks to steer traffic over any uplink that traverses a stateful firewall between the server-side SteelHead
and the client-side appliance.
Without GRE, traffic attempting to switch midstream to a uplink that traverses a stateful firewall might be
blocked. The firewall needs to track the TCP connection state and sequence numbers for security
reasons. Because the firewall has not logged the initial connection handshake, and has partial or no
packet sequence numbers, it blocks the attempt to switch to the secondary uplink and might drop these
packets. To traverse the firewall, path selection can encapsulate that traffic into a GRE tunnel. The most
common examples of midstream uplink switching occur when:
• a high-priority uplink fails over to a secondary uplink that traverses a firewall.
• a previously unavailable uplink recovers and resumes sending traffic to a firewalled uplink.
• path selection is using the Application File Engine (AFE) to identify the traffic and does not yet recognize the first packets of a connection before traversing a default uplink.
The GRE tunnel starts with a SteelHead and ends at the remote appliance. Both appliances must be
running RiOS 8.6.x or later. The tunnel configuration is local. The remote IP address must be a remote
appliance in-path interface and the remote appliance must have path selection enabled. ICMP
responses from the remote appliance use the same tunnel from which the ping is received. The remote
appliance must also have GRE tunnel mode enabled if the user wants return traffic to go through a GRE
as well.
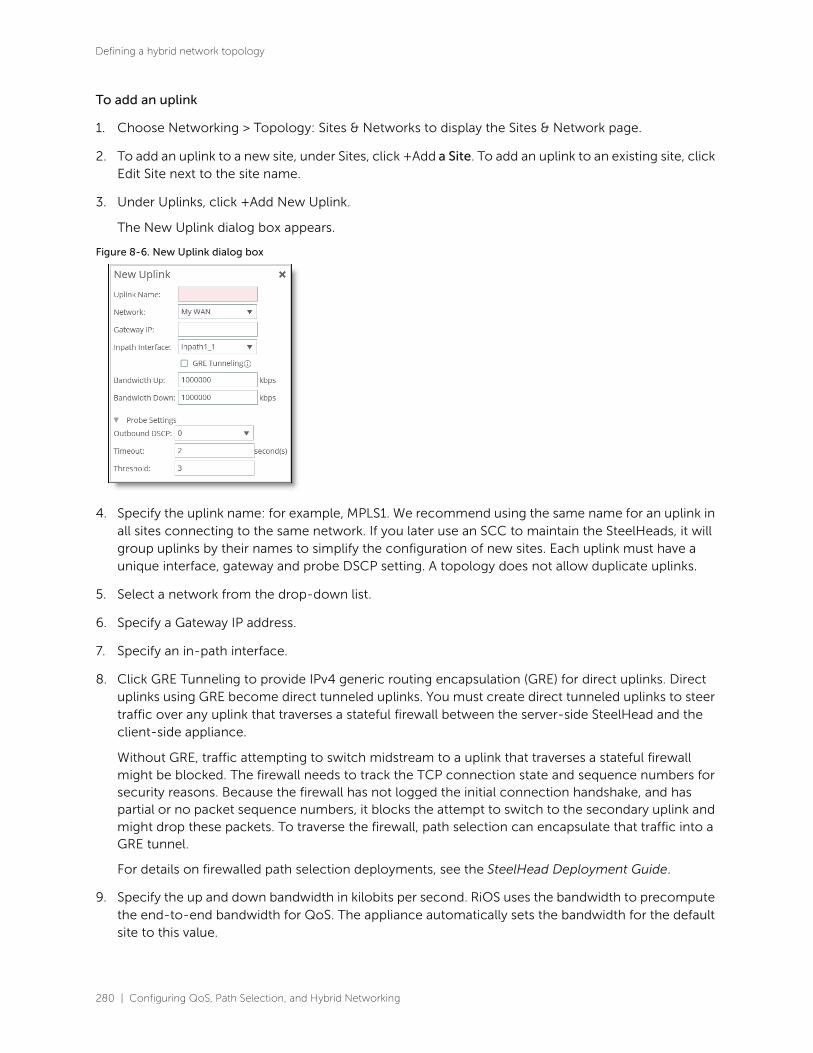
280 | Configuring QoS, Path Selection, and Hybrid Networking
Defining a hybrid network topology
To add an uplink
1. Choose Networking > Topology: Sites & Networks to display the Sites & Network page.
2. To add an uplink to a new site, under Sites, click +Add a Site. To add an uplink to an existing site, click Edit Site next to the site name.
3. Under Uplinks, click +Add New Uplink.
The New Uplink dialog box appears.
Figure 8-6. New Uplink dialog box
4. Specify the uplink name: for example, MPLS1. We recommend using the same name for an uplink in all sites connecting to the same network. If you later use an SCC to maintain the SteelHeads, it will group uplinks by their names to simplify the configuration of new sites. Each uplink must have a unique interface, gateway and probe DSCP setting. A topology does not allow duplicate uplinks.
5. Select a network from the drop-down list.
6. Specify a Gateway IP address.
7. Specify an in-path interface.
8. Click GRE Tunneling to provide IPv4 generic routing encapsulation (GRE) for direct uplinks. Direct uplinks using GRE become direct tunneled uplinks. You must create direct tunneled uplinks to steer traffic over any uplink that traverses a stateful firewall between the server-side SteelHead and the client-side appliance.
Without GRE, traffic attempting to switch midstream to a uplink that traverses a stateful firewall might be blocked. The firewall needs to track the TCP connection state and sequence numbers for security reasons. Because the firewall has not logged the initial connection handshake, and has partial or no packet sequence numbers, it blocks the attempt to switch to the secondary uplink and might drop these packets. To traverse the firewall, path selection can encapsulate that traffic into a GRE tunnel.
For details on firewalled path selection deployments, see the SteelHead Deployment Guide.
9. Specify the up and down bandwidth in kilobits per second. RiOS uses the bandwidth to precompute the end-to-end bandwidth for QoS. The appliance automatically sets the bandwidth for the default site to this value.
Configuring QoS, Path Selection, and Hybrid Networking | 281
Defining applications
The uplink rate is the bottleneck WAN bandwidth, not the interface speed out of the WAN interface into the router or switch. As an example, if your appliance connects to a router with a 100 Mbps link, do not specify this value—specify the actual WAN bandwidth (for example, T1, T3).
Different WAN interfaces can have different WAN bandwidths; you must enter the bandwidth link rate correctly for QoS to function properly.
10. Optionally, click the right-arrow and specify the probe settings for path selection monitoring as described in this table..
11. Click Save.
The sites appear in a table.
The default site matches all of the traffic that does not match another site.
To edit a site, click Edit Site next to a site name, modify the definition, and click Save.
Defining applications You define applications in the Networking > App Definitions: Applications page.
Control Description
Outbound DSCP Select the DSCP marking for the ping packet. You must select this option if the service providers are applying QoS metrics based on DSCP marking and each provider is using a different type of metric. Path selection-based DSCP marking can also be used in conjunction with PBR on an upstream router to support Path Selection in cases where the appliance is more than a single L3 hop away from the edge router.
The default marking is preserve. Preserve specifies that the DSCP level or IP ToS value found on pass-through and optimized traffic is unchanged when it passes through the appliance.
Timeout Specify how much time, in seconds, elapses before the system considers the uplink to be unavailable. The default value is 2 seconds.
RiOS uses ICMP pings to probe the uplinks. If the ping responses do not make it back within this timeout setting and the system loses the number of packets defined by the threshold value, it considers the uplink to be down and triggers the Path Selection Path Down alarm.
Threshold Specify how many timed-out probes to count before the system considers the uplink to be unavailable and triggers the Path Down alarm. The default is 3 failed successive packets.
This value also determines how many probes the system must receive to consider the uplink to be available.
RiOS uses ICMP pings to monitor uplink availability. If the ping responses do not make it back within the probe timeout and the system loses the number of packets defined by this threshold, it considers the uplink to be down and triggers the Path Selection Path Down alarm.
282 | Configuring QoS, Path Selection, and Hybrid Networking
Defining applications
Application definitions enable you to attach a business relevancy to all traffic that goes through your
network. To simplify configuration, the definition of an application is a separate task in RiOS 9.0 and later.
A separate application definition allows you to configure multiple rules using the same application
without having to repeat the application definition for each rule.
Application definitions also enable you to group applications, so that you can configure and reuse a
single rule for multiple applications. Using an application group in a rule can reduce the number of rules
significantly.
RiOS 9.0 and later separate application definition from the QoS rules. For more information about QoS
rules, see “Configuring QoS” on page 294.
We strongly recommend that you define applications and push application definitions from a
SteelCentral Controller for SteelHead to the appliances. For details, see the SteelCentral Controller for
SteelHead Deployment Guide.
To view a list of predefined applications, see Appendix C, “Application Signatures for AFE.”
Defining an application means that you group together a set of criteria to match certain traffic. After you
define the criteria, you can use an application to configure QoS and path selection rules.
To define custom applications
1. Choose Networking > App Definitions: Applications to display the Applications page.
The custom applications group is empty until you add application groups.
2. Select Custom Applications from the drop-down list.
3. Click + Add.
4. Complete the name and description.
5. Specify the application traffic characteristics.
For easier configuration, you can use host labels instead of local and remote subnets and port labels instead of TCP/UDP port numbers.
In addition to criteria matching on the IP-header based characteristics or the VLAN ID, you can use the AFE to let RiOS automatically detect the application. See the description of the Application Layer Protocol control in the table for details.

Configuring QoS, Path Selection, and Hybrid Networking | 283
Defining applications
6. Complete the configuration as described in this table.
Control Description
Traffic characteristics:
Local Subnet or Host Label Specify an IP address and mask for the traffic source, or you can specify all or 0.0.0.0/0 as the wildcard for all traffic.
Use this format: xxx.xxx.xxx.xxx/xx
—or—
Specify a host label. You predefine host labels on the Networking > App Definitions: Host Labels page.
Port or Port Label Optionally, specify all source ports, a single source port value or a port range of port1-port2, where port1 must be less than port2. The default setting is all ports.
—or—
Specify a port label. You predefine port labels on the Networking > App Definitions: Port Labels page.
Remote Subnet or Host Label Specify an IP address and mask pattern for the traffic destination, or you can specify all or 0.0.0.0/0 as the wildcard for all traffic.
Use this format: xxx.xxx.xxx.xxx/xx
—or—
Specify a host label. You predefine host labels on the Networking > App Definitions: Host Labels page.
Transport Layer Protocol Select a transport layer protocol from the drop-down list.
The default setting is All.
Application Layer Protocol Specify an application layer protocol or an application signature. To specify an application signature, type the first letters of the application. For example, if you want to create specific criteria to identify Facebook traffic, type the first three letters and select a Facebook application from the drop-down menu.
Port
or
Port Label (if port labels have been defined)
Optionally, specify all destination ports, a single source port value or a port range of port1-port2, where port1 must be less than port2. The default setting is all ports.
—or—
Specify a port label. You predefine port labels on the Networking > App Definitions: Port Labels page.

284 | Configuring QoS, Path Selection, and Hybrid Networking
Defining applications
VLAN Tag ID Optionally, specify a VLAN tag as follows:
• Specify a numeric VLAN tag identification number from 0 to 4094.
• Specify all to specify the rule applies to all VLANs.
• Specify none to specify the rule applies to untagged connections.
RiOS supports VLAN v802.1Q. To configure VLAN tagging, configure transport rules to apply to all VLANs or to a specific VLAN. By default, rules apply to all VLAN values unless you specify a particular VLAN ID. Pass-through traffic maintains any preexisting VLAN tagging between the LAN and WAN interfaces.
DSCP Optionally, specify a DSCP value from 0 to 63, or all to use all DSCP values.
Traffic Type Select Optimized, Passthrough, or All from the drop-down list. The default setting is All.
Control Description

Configuring QoS, Path Selection, and Hybrid Networking | 285
Defining applications
Application properties:
Application Group Select an application group for the application from the drop-down list (highest priority to lowest):
Business Bulk - Captures business-level file transfer applications and protocols, such as CIFS, SCCM, antivirus updates, and over-the-network backup protocols.
Business Critical - Captures business-level, low-latency transactional applications and protocols, such as SQL, SAP, Oracle and other database protocols, DHCP, LDAP, RADIUS, the Riverbed Control Channel (to identify and specify a DSCP value for out-of-band traffic), routing, and other network communication protocols.
Business Productivity - Captures general business-level productivity applications and protocols, such as email, messaging, streaming and broadcast audio/video, collaboration, intranet HTTP traffic, and business cloud services O365, Google apps, SFDC, and others through a white list.
Business Standard - Captures all intranetwork traffic going within local subnets as defined by the uplinks on the SteelHead. Use this class to define the default path for traffic not classified by other application groups.
Business VDI - Captures real-time interactive business-level virtual desktop interface (VDI) protocols, such as PC over IP (PCoIP), Citrix CGP and ICA, RDP, VNC, and Telnet protocols.
Business Video - Captures business-level video conferencing applications and protocols, such as Microsoft Lync and RTP video.
Business Voice - Captures business-level voice over IP (VoIP) applications and protocols (signaling and bearer), such as Microsoft Lync, RTP, H.323 and SIP.
Recreational - Captures all internet-bound traffic that has not already been classified and processed by other application groups.
Standard Bulk - Captures general file transfer protocols, such as FTP, torrents, NNTP/usenet, NFS, and online file hosting services Dropbox, Box.net, iCloud, MegaUpload, Rapidshare, and others.
Custom Applications - Captures user-defined applications that have not been classified into another application group.

286 | Configuring QoS, Path Selection, and Hybrid Networking
Applying QoS policies
7. Click Save to save your settings permanently.
Applying QoS policiesYou apply Riverbed QoS policies in the Networking > Network Services: Quality of Service page. This
section describes how SteelHeads use Riverbed QoS policies to allocate bandwidth and latency
priorities, and provides specific examples for setting policies for FTP and Citrix traffic.
Note: For details about QoS, including integrating SteelHeads into an existing QoS implementation, see the
SteelHead Deployment Guide. The SteelHead Deployment Guide also includes configuration examples and
Riverbed QoS best practices.
QoS overview
QoS is a reservation system for network traffic. In its most basic form, QoS allows organizations to
allocate scarce network resources across multiple traffic types of varying importance. QoS
implementations allow organizations to accurately control their applications by the amount of
bandwidth they have access to and by their sensitivity to delay.
QoS enhancements by version
This section lists and describes new QoS features and enhancements by RiOS version.
RiOS 9.5 introduced major changes to the Networking > Network Services: Quality of Service page:
Category Select a category for the application from the drop-down list.
Business Criticality Select a service class for the application from the drop-down list:
• Lowest Criticality - Specifies the lowest priority service class.
• Low Criticality - Specifies a low-priority service class: for example, FTP, backup, replication, other high-throughput data transfers, and recreational applications such as audio file sharing.
• Medium Criticality - Specifies a medium-priority service class.
• High Criticality - Specifies a high-priority service class.
• Highest Criticality - Specifies the highest priority service class.
These are minimum service class guarantees; if better service is available, it’s provided. For example, if an application is specified as low priority and the higher-priority classes aren’t active, then the low-priority class receives the highest possible available priority for the current traffic conditions. This parameter controls the priority of the application relative to the other applications.
Note: The service class describes only the delay sensitivity of a class, not how much bandwidth it’s allocated, nor how important the traffic is compared to other classes. Typically you configure low priority for high-throughput, non-packet delay sensitive applications like FTP, backup, and replication.

Configuring QoS, Path Selection, and Hybrid Networking | 287
Applying QoS policies
• The Manage QoS Per Interface and QoS Remote Site panes are collapsed. Click the triangle next to the panes to expand them.
• A Local Site Uplink Bandwidth pane is added to let you add uplinks and quickly change the inbound and outbound bandwidth of the local site based on available bandwidth.
You can still access and edit these bandwidth values in the Networking > Topology: Sites & Networks page by editing the local site.
• The Default QoS Classes pane has a graphic representation of the default QoS classes for the default QoS profile, with an Edit button that lets you change it.
RiOS 9.1 provides these enhancements:
• Differentiated Service Code Point (DSCP) Marking to Prioritize Out-of-Band (OOB) Control Channel Traffic - An OOB connection is a TCP connection that SteelHeads establish with each other when they begin optimizing traffic to exchange capabilities and feature information such as licensing information, hostname, RiOS version, and so on. The SteelHeads also use control channel information to detect failures. You can now mark OOB connections with a DSCP or ToS IP value to prioritize or classify the Riverbed control channel traffic, preventing dropped packets in a lossy or congested network to guarantee control packets will get through and not be subject to unexpected tear down.
• Increase in Applications Recognized by the AFE - The Application Flow Engine (AFE) recognizes over 1,300 application signatures, providing an efficient and accurate way to identify applications for advanced classification and shaping of network traffic. To view the predefined global application list, see “List of recognized applications” on page 699.
RiOS 9.0 provides these enhancements:
• Easy QoS Configuration - Simplifies configuration of application definitions and QoS classes. Now you can start with a basic QoS model and create per-site exceptions only as needed. Additionally, you no longer need to build individual rules to identify and classify traffic for QoS marking and shaping, because you can use application groups and business criticality definitions for faster and easier configuration. For details on application groups, see “Defining applications” on page 281.
• QoS Profiles - Create a fully customizable class shaping hierarchy containing a set of rules and classes. View the class layout and details at a glance and reuse the profiles with multiple sites in both inbound and outbound QoS. Profiles in RiOS 9.0 replace service policies in previous versions.
• Inbound QoS and Outbound QoS Feature Parity - Removes inbound QoS restrictions to achieve full feature parity with outbound QoS.
RiOS 8.6 provides these enhancements:
• SSL Common Name Matching - Classify SSL pass-through traffic using a common name in a QoS rule.
• Substantial Increase in Applications Recognized by the AFE - Application signatures classify QoS at an application level using the AFE. The AFE provides an efficient and accurate way to identify applications for advanced classification and shaping of network traffic. To view the predefined global application list, see “List of recognized applications” on page 699.
RiOS 8.5 provides these enhancements:

288 | Configuring QoS, Path Selection, and Hybrid Networking
Applying QoS policies
• SnapMirror Support - Use outbound QoS to prioritize SnapMirror replication jobs or shape optimized SnapMirror traffic that is sharing a WAN link with other enterprise protocols. QoS recognizes SnapMirror optimized flows and provisions five different service levels for each packet, based on priorities. You can also distinguish a job priority by filer and volume. You can create a QoS rule for the appropriate site and optionally specify a service class and DSCP marking per priority.
• Export QoS Configuration Statistics to a CascadeFlow Collector - CascadeFlow collectors can aggregate information about QoS configuration and other application statistics to send to a SteelCentral NetProfiler. The Enterprise NetProfiler summarizes and displays the QoS configuration statistics. For details, see “Configuring flow statistics” on page 375.
• LAN Bypass - Virtual in-path network topologies in which the LAN-bound traffic traverses the WAN interface might require that you configure the appliance to bypass LAN-bound traffic so it is not subject to the maximum root bandwidth limit. RiOS includes LAN bypass for outbound and inbound QoS shaping.
• Host Label Handling - Specify a range of hostnames and subnets within a single QoS rule.
• Global DSCP Marking - By default, the setup of optimized connections and the OOB control connections are not marked with a DSCP value. Existing traffic marked with a DSCP value is classified into the default class. If your existing network provides multiple classes of service based on DSCP values, and you are integrating a SteelFusion appliance into your environment, you can use the Global DCSP feature to prevent dropped packets and other undesired effects.
• QoS with IPv6 - RiOS does not support IPv6 traffic for QoS shaping or AFE-based classification. If you enable QoS shaping for a specific interface, all IPv6 packets for that interface are classified to the default class. You can mark IPv6 traffic with an IP TOS value. You can also configure the appliance to reflect an existing traffic class from the LAN-side to the WAN-side of the appliance.
• PC-over-IP (PCoIP) - RiOS 9.0 does not support PCoIP packet prioritization.
QoS classes are based on traffic importance, bandwidth needs, and delay-sensitivity. You allocate
network resources to each of the classes. Traffic flows according to the network resources allocated to
its class.
You configure QoS on client-side appliance and server-side SteelHead to control the prioritization of
different types of network traffic and to ensure that SteelHeads give certain network traffic (for example,
Voice over IP (VoIP) higher priority over other network traffic.
Traffic classification
QoS allows you to specify priorities for particular classes of traffic and properly distribute excess
bandwidth among classes. The QoS classification algorithm provides mechanisms for link sharing and
priority services while decoupling delay and bandwidth allocation.

Configuring QoS, Path Selection, and Hybrid Networking | 289
Applying QoS policies
Many QoS implementations use some form of Packet Fair Queueing (PFQ), such as Weighted Fair
Queueing or Class-Based Weighted Fair Queueing. As long as high-bandwidth traffic requires a high
priority (or vice-versa), PFQ systems perform adequately. However, problems arise for PFQ systems
when the traffic mix includes high-priority, low-bandwidth traffic, or high-bandwidth traffic that does
not require a high priority, particularly when both of these traffic types occur together. Features such as
low-latency queueing (LLQ) attempt to address these concerns by introducing a separate system of
strict priority queueing that is used for high-priority traffic. However, LLQ is not an effective way of
handling bandwidth and latency trade-offs. LLQ is a separate queueing mechanism meant as a
workaround for PFQ limitations.
The Riverbed QoS system is not based on PFQ, but rather on Hierarchical Fair Service Curve (HFSC).
HFSC delivers low latency to traffic without wasting bandwidth and delivers high bandwidth to delay-
insensitive traffic without disrupting delay-sensitive traffic. The Riverbed QoS system achieves the
benefits of LLQ without the complexity and potential configuration errors of a separate queueing
mechanism.
The SteelHead HFSC-based QoS enforcement system provides the flexibility needed to simultaneously
support varying degrees of delay requirements and bandwidth usage. For example, you can enforce a
mix of high-priority, low-bandwidth traffic patterns (for example, SSH, Telnet, Citrix, RDP, and CRM
systems) with lower priority, high-bandwidth traffic (for example, FTP, backup, and replication). RiOS
QoS allows you to protect delay-sensitive traffic such as VoIP, as well as other delay-sensitive traffic such
as RDP and Citrix. You can do this without having to reserve large amounts of bandwidth for their traffic
classes.
QoS classification occurs during connection setup for optimized traffic, before optimization and
compression. QoS shaping and enforcement occurs after optimization and compression.
By design, QoS is applied to both pass-through and optimized traffic; however, you can choose to
classify either pass-through or optimized traffic. QoS is implemented in the operating system; it is not a
part of the optimization service. When the optimization service is disabled, all the traffic is pass-through
and is still shaped by QoS.
Note: Flows can be incorrectly classified if there are asymmetric routes in the network when any of the QoS features
are enabled.
QoS SteelFusion Edge appliance limits
Riverbed limits the maximum bandwidth on the SteelFusion Edge appliances shown in this table. We
recommend the maximum classes, rules, and sites shown in this table for optimal performance and to
avoid delays while changing the QoS configuration.
The QoS bandwidth limits are global across all WAN interfaces and the primary interface.

290 | Configuring QoS, Path Selection, and Hybrid Networking
Applying QoS policies
Traffic that passes through an Edge but is not destined to the WAN is not subject to the QoS bandwidth
limit. Examples of traffic that is not subject to the bandwidth limits include routing updates, DHCP
requests, and default gateways on the WAN-side of the Edge that redirect traffic back to other LAN-side
subnets.
Bypassing LAN traffic
We recommend a maximum limit on the configurable root bandwidth for the WAN interface. The
hardware platform determines the recommended limit.
Certain virtual in-path network topologies where the LAN-bound traffic traverses the WAN interface
might require that the appliance bypass LAN-bound traffic so that it is not included in the rate limit
determined by the recommended maximum root bandwidth. Some deployment examples are WCCP or
a WAN-side default gateway.
SteelFusion Edge
appliance model
Maximum
configurable root
bandwidth (Mbps)
Recommended
maximum classes
Recommended
maximum rules
Recommended
maximum sites
2100 100 500 500 50
2200 100 500 500 50
3100 100 500 500 50
3200 100 500 500 50
5100 100 500 500 100

Configuring QoS, Path Selection, and Hybrid Networking | 291
Applying QoS policies
Figure 8-7 and Figure 8-8 illustrate topologies where the default LAN gateway or router is accessible
over the WAN interface of the appliance. If there are two clients in the local subnet, traffic between the
two clients is routable after reaching the LAN gateway. As a result, this traffic traverses the WAN interface
of the appliance.
Figure 8-7. In-path configuration where the default LAN gateway is accessible over the appliance WAN interface
Figure 8-8. WCCP configuration where the default LAN gateway is accessible over the appliance WAN interface
In a QoS configuration for these topologies, suppose you have several QoS classes created and the root
class is configured with the WAN interface rate. The remainder of the classes use a percentage of the
root class. In this scenario, the LAN traffic is rate limited because RiOS classifies it into one of the classes
under the root class.
You can use the LAN bypass feature to exempt certain subnets from QoS enforcement, bypassing the
rate limit. The LAN bypass feature is enabled by default and comes into effect when subnet side rules are
configured.
To filter the LAN traffic from the WAN traffic
1. If QoS isn’t running, choose Networking > Network Services: Quality of Service and enable inbound or outbound QoS Shaping.
2. Choose Networking > Network Services: Subnet Side Rules.
3. Click Add a Subnet Side Rule.
4. Select Start, End, or a rule number from the drop-down list.
5. Specify the client-side appliance subnet using the format <ip-address>/<subnet-mask>.
6. Select Subnet address is on the LAN side of the appliance.
7. Click Add.
292 | Configuring QoS, Path Selection, and Hybrid Networking
Applying QoS policies
To verify the traffic classification, choose Reports > Networking: Inbound QoS or Outbound QoS.
Note: The appliance processes the subnet side LAN rules before the QoS outbound rules.
Note: In virtual-in-path deployment, using subnet side rules is the same for QoS, VSP, and NetFlow. In an in-path
deployment VSP and NetFlow discard the subnet side rules.
QoS classification for the FTP data channel
When configuring QoS classification for FTP, the QoS rules differ depending on whether the FTP data
channel is using active or passive FTP. Active versus passive FTP determines whether the FTP client or
the FTP server select the port connection for use with the data channel, which has implications for QoS
classification.
The AFE doesn’t support passive FTP. Because passive FTP uses random high TCP port numbers to set
up its data channel from the FTP server to the FTP client, the FTP data traffic can’t be classified on the
TCP port numbers. To classify passive FTP traffic, you can add an application rule where the application
is FTP and matches the IP address of the FTP server.
Active FTP classification
With active FTP, the FTP client logs in and enters the PORT command, informing the server which port
it must use to connect to the client for the FTP data channel. Next, the FTP server initiates the connection
toward the client. From a TCP perspective, the server and the client swap roles. The FTP server becomes
the client because it sends the SYN packet, and the FTP client becomes the server because it receives
the SYN packet.
Although not defined in the RFC, most FTP servers use source port 20 for the active FTP data channel.
For active FTP, configure a QoS rule on the server-side SteelHead to match source port 20. On the
client-side SteelHead, configure a QoS rule to match destination port 20.
You can also use AFE to classify active FTP traffic.
Passive FTP classification
With passive FTP, the FTP client initiates both connections to the server. First, it requests passive mode
by entering the PASV command after logging in. Next, it requests a port number for use with the data
channel from the FTP server. The server agrees to this mode, selects a random port number, and returns
it to the client. Once the client has this information, it initiates a new TCP connection for the data
channel to the server-assigned port. Unlike active FTP, there’s no role swapping and the FTP client
initiates the SYN packet for the data channel.
The FTP client receives a random port number from the FTP server. Because the FTP server can’t return
a consistent port number to use with the FTP data channel, RiOS doesn’t support QoS Classification for
passive FTP in versions earlier than RiOS 4.1.8, 5.0.6, or 5.5.1. Later RiOS releases support passive FTP and
the QoS Classification configuration for passive FTP is the same as active FTP.
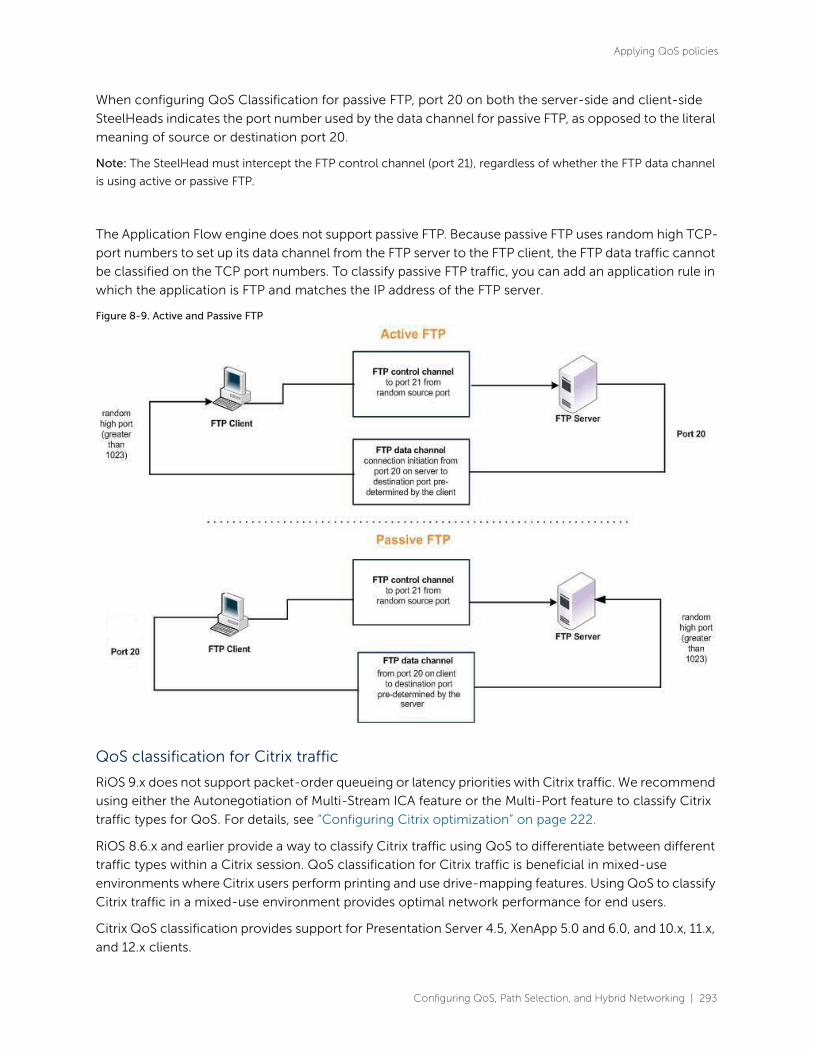
Configuring QoS, Path Selection, and Hybrid Networking | 293
Applying QoS policies
When configuring QoS Classification for passive FTP, port 20 on both the server-side and client-side
SteelHeads indicates the port number used by the data channel for passive FTP, as opposed to the literal
meaning of source or destination port 20.
Note: The SteelHead must intercept the FTP control channel (port 21), regardless of whether the FTP data channel
is using active or passive FTP.
The Application Flow engine does not support passive FTP. Because passive FTP uses random high TCP-
port numbers to set up its data channel from the FTP server to the FTP client, the FTP data traffic cannot
be classified on the TCP port numbers. To classify passive FTP traffic, you can add an application rule in
which the application is FTP and matches the IP address of the FTP server.
Figure 8-9. Active and Passive FTP
QoS classification for Citrix traffic
RiOS 9.x does not support packet-order queueing or latency priorities with Citrix traffic. We recommend
using either the Autonegotiation of Multi-Stream ICA feature or the Multi-Port feature to classify Citrix
traffic types for QoS. For details, see “Configuring Citrix optimization” on page 222.
RiOS 8.6.x and earlier provide a way to classify Citrix traffic using QoS to differentiate between different
traffic types within a Citrix session. QoS classification for Citrix traffic is beneficial in mixed-use
environments where Citrix users perform printing and use drive-mapping features. Using QoS to classify
Citrix traffic in a mixed-use environment provides optimal network performance for end users.
Citrix QoS classification provides support for Presentation Server 4.5, XenApp 5.0 and 6.0, and 10.x, 11.x,
and 12.x clients.

294 | Configuring QoS, Path Selection, and Hybrid Networking
Configuring QoS
The essential RiOS capabilities that ensure optimal delivery of Citrix traffic over the network are:
• Latency priority - The Citrix traffic application priority affects traffic latency, which allows you to assign interactive traffic a higher priority than print or drive-mapping traffic. A typical application priority for interactive Citrix sessions, such as screen updates, is real-time or interactive. Keep in mind that priority is relative to other classes in your QoS configuration.
• Bandwidth allocation (also known as traffic shaping) - When configuring QoS for Citrix traffic, it is important to allocate the correct amount of bandwidth for each QoS traffic class. The amount you specify reserves a predetermined amount of bandwidth for each traffic class. Bandwidth allocation is important for ensuring that a given class of traffic cannot consume more bandwidth than it is allowed. It is also important to ensure that a given class of traffic has a minimum amount of bandwidth available for delivery of data through the network.
The default ports for the Citrix service are 1494 (native ICA traffic) and 2598 (session reliability). To use
session reliability, you must enable Citrix optimization on the appliance in order to classify the traffic
correctly. You can enable and modify Citrix optimization settings in the Optimization > Protocols: Citrix
page. For details, see “Configuring Citrix optimization” on page 222.
You can use session reliability with optimized traffic only. Session reliability with RiOS QoS does not
support pass-through traffic. For details about disabling session reliability, go to
http://support.citrix.com/proddocs/index.jsp?topic=/xenapp5fp-w2k8/ps-sessions-sess-rel.html.
Note: If you upgrade from a previous RiOS version with an existing Citrix QoS configuration, the upgrade
automatically combines the five preexisting Citrix rules into one.
Note: For QoS configuration examples, see the SteelHead Deployment Guide.
Configuring QoSThis section describes how to configure QoS. It includes these topics:
• “Overview” on page 294
• “Viewing and editing the default QoS classes” on page 298
• “Adding QoS profiles” on page 302
• “Enabling MX-TCP queue policies” on page 307
• “Modifying QoS profiles” on page 308
• “Classifying and prioritizing OOB traffic using DSCP marking” on page 308
• “How an appliance identifies and shapes inbound traffic” on page 311
Overview
QoS configuration identifies business applications and classifies traffic according to priorities. The
appliance uses this information to control the amount of WAN resources that each application can use.
QoS ensures that your important applications are prioritized and removes the guesswork from
protecting performance of key applications. In addition, QoS can prevent recreational applications from
interfering with business applications.

Configuring QoS, Path Selection, and Hybrid Networking | 295
Configuring QoS
We strongly recommend that you configure QoS on and push QoS policies from a SteelCentral
Controller for SteelHead to other Riverbed appliances, particularly with large scale deployments. For
details, see the SteelCentral Controller for SteelHead Deployment Guide.
QoS comes with a predefined set of classes, a list of more than 1000 global applications, and a default
profile. By default, all in-path interfaces are enabled for inbound and outbound QoS with the same link
rate.
A useful way to configure QoS is to add a subclass or rule and use group applications and application
signatures that come predefined with RiOS. To view the predefined global application list, see “List of
recognized applications” on page 699.
Before configuring QoS, we recommend that you define any custom applications for use in QoS profiles.
For details, see “Defining applications” on page 281.
Note: If you are migrating from RiOS 8.6.x and earlier to RiOS 9.x, see the SteelHead Installation and Configuration
Guide for the migration process.
To enable QoS
1. Choose Networking > Network Services: Quality of Service to display the Quality of Service page.
Figure 8-10. Quality of Service page
2. Under Enable QoS, complete the following configuration.
• Enable Outbound QoS Shaping - Enables QoS classification to control the prioritization of different types of network traffic and to ensure that the SteelHead gives certain network traffic (for example, Voice over IP) higher priority than other network traffic. Traffic is not classified until at least one WAN interface is enabled. The system enables inbound and outbound QoS on all in-path interfaces by default.
To disable outbound QoS, clear this check box.

296 | Configuring QoS, Path Selection, and Hybrid Networking
Configuring QoS
• Enable Inbound QoS Shaping - Enables QoS classification to allocate bandwidth and prioritize traffic flowing into the LAN network behind the SteelHead. Inbound QoS provides the benefits of QoS for environments that can’t meet their QoS requirements with outbound QoS.
For details, see “Inbound QoS” on page 309.
To disable inbound QoS, clear this check box.
• Enable Outbound QoS Marking - Identifies outbound traffic using marking values. You can mark traffic using header parameters such as VLAN, DSCP, and protocols. You can also use Layer-7 protocol information through Application Flow Engine (AFE) inspection to apply DSCP marking values to traffic flows.
The DSCP or IP ToS marking only has local significance. You can set the DSCP or IP ToS values on the server-side SteelHead to values different to those set on the client-side SteelHead.
3. Click Save to apply your settings.
4. Click Save to Disk to save your settings permanently.
To manage QoS settings per interface
1. Choose Networking > Network Services: Quality of Service to display the Quality of Service page.
2. Click the arrow to the left of the Manage QoS settings per interface pane to expand it.
Figure 8-11. Quality of Service page—Manage QoS Per Interface pane
3. Click the right arrow next to the WAN interface name and then select Outbound or Inbound QoS.
By default, the system enables inbound and outbound QoS on all in-path interfaces except the primary
interface. You can only enable outbound QoS on the primary interface.
Inbound QoS supports in-path interfaces only; it doesn’t support primary or auxiliary interfaces.
4. Click Save to apply your settings.
5. Click Save to Disk to save your settings permanently.
To set the uplink bandwidth for local uplinks
1. Choose Networking > Network Services: Quality of Service to display the Quality of Service page.

Configuring QoS, Path Selection, and Hybrid Networking | 297
Configuring QoS
2. In the Local Site Uplink Bandwidth pane, click the arrow next to an uplink name to expand it.
Figure 8-12. Local Site Uplink Bandwidth pane
3. Specify the inbound (Bandwidth Down) and outbound (Bandwidth Up) bandwidth for the uplinks on the local site, in kilobits per second.
RiOS uses the bandwidth to precompute the end-to-end bandwidth for QoS. The SteelHead automatically sets the bandwidth for the default site to this value.
The rate is the bottleneck WAN bandwidth, not the interface speed out of the WAN interface into the router or switch. As an example, if your SteelHead connects to a router with a 100 Mbps link, don’t specify this value—specify the actual WAN bandwidth (for example, T1, T3).
Different WAN interfaces can have different WAN bandwidths; you must enter the bandwidth link rate correctly for QoS to function properly.
Note: You can also access and edit these bandwidth values, in addition to site-specific tasks such as adding an
uplink, in the Networking > Topology: Sites & Networks page. For more information, see “Defining a site” on
page 277.
4. Click Save to apply your settings.
5. Click Save to Disk to save your settings permanently.

298 | Configuring QoS, Path Selection, and Hybrid Networking
Configuring QoS
Viewing and editing the default QoS classes
Starting with RiOS 9.5, there is no default profile in the QoS Profiles pane. Instead, SteelHeads display a
set of default QoS classes in the Default QoS Classes pane. These classes take the place of the default
QoS profile. To view the classes, choose Networking > Network Services: Quality of Service.
Figure 8-13. Default QoS Classes pane
The default classes represent the following types of traffic:
RealTime - Specifies real-time traffic class. Give this value to the highest-priority traffic: for example,
VoIP or video conferencing.
Interactive - Specifies an interactive traffic class: for example, Citrix, RDP, telnet, and SSH.
BusinessCritical - Specifies the high-priority traffic class: for example, Thick Client Applications, ERPs,
and CRMs.
Normal - Specifies a normal- priority traffic class: for example, internet browsing, file sharing, and email.
LowPriority - Specifies a low-priority traffic class: for example, FTP, backup, replication, other high-
throughput data transfers, and recreational applications such as audio file sharing.
BestEffort - Specifies the lowest priority.
The QoS class indicates how delay-sensitive a traffic class is to the QoS scheduler. These are minimum
service class guarantees; if better service is available, it’s provided. For example, if a class is specified as
low priority and the higher-priority classes aren’t active, then the low-priority class receives the highest
possible available priority for the current traffic conditions. This parameter controls the priority of the
class relative to the other classes.
Note: The service class describes only the delay sensitivity of a class, not how important the traffic is compared to
other classes. Typically you configure low priority for high-throughput, non-packet delay sensitive applications like
FTP, backup, and replication.

Configuring QoS, Path Selection, and Hybrid Networking | 299
Configuring QoS
Classes are organized in a hierarchical tree structure. You can use the default classes in rules as part of
a profile by choosing Any (Default Rule) in the QoS Rules pane, which inherits the default classes.
To edit QoS classes
1. Choose Networking > Network Services: Quality of Service to display the Quality of Service page.
2. Under Default QoS Classes, click Edit.
3. Change the class values as shown in this table.
Control Description
Class Name Specify a name for the QoS class. For information about the default classes, see “Viewing and editing the default QoS classes” on page 298.
Minimum Bandwidth %
Specify the minimum amount of bandwidth (as a percentage) to guarantee to a traffic class when there’s bandwidth contention. All of the classes combined can’t exceed 100 percent. During contention for bandwidth, the class is guaranteed the amount of bandwidth specified. The class receives more bandwidth if there’s unused bandwidth remaining.
Excess bandwidth is allocated based on the relative ratios of minimum bandwidth. The total minimum guaranteed bandwidth of all QoS classes must be less than or equal to 100 percent of the parent class.
A default class is automatically created with minimum bandwidth of 10 percent. Traffic that doesn’t match any of the rules is put into the default class. We recommend that you change the minimum bandwidth of the default class to the appropriate value.
You can adjust the value as low as 0 percent.
Maximum Bandwidth %
Specify the maximum allowed bandwidth (as a percentage) a class receives as a percentage of the parent class minimum bandwidth. The limit’s applied even if there’s excess bandwidth available.
300 | Configuring QoS, Path Selection, and Hybrid Networking
Configuring QoS
Outbound Queue Type
Optionally, select one of these queue methods for the leaf class from the drop-down list (the queue doesn’t apply to the inner class):
• SFQ - Shared Fair Queueing (SFQ) is the default queue for all classes. Determines SteelHead behavior when the number of packets in a QoS class outbound queue exceeds the configured queue length. When SFQ is used, packets are dropped from within the queue in a round-robin fashion, among the present traffic flows. SFQ ensures that each flow within the QoS class receives a fair share of output bandwidth relative to each other, preventing bursty flows from starving other flows within the QoS class.
• FIFO - Transmits all flows in the order that they’re received (first in, first out). Bursty sources can cause long delays in delivering time-sensitive application traffic and potentially to network control and signaling messages.
• MX-TCP - Has very different use cases than the other queue parameters. MX-TCP also has secondary effects that you must understand before configuring:
– When optimized traffic is mapped into a QoS class with the MX-TCP queuing parameter, the TCP congestion-control mechanism for that traffic is altered on the SteelHead. The normal TCP behavior of reducing the outbound sending rate when detecting congestion or packet loss is disabled, and the outbound rate is made to match the guaranteed bandwidth configured on the QoS class.
– You can use MX-TCP to achieve high-throughput rates even when the physical medium carrying the traffic has high-loss rates. For example, MX-TCP is commonly used for ensuring high throughput on satellite connections where a lower-layer-loss recovery technique is not in use.
RiOS 8.5 and later introduce rate pacing for satellite deployments, which combines MX-TCP with a congestion-control method.
– Another use of MX-TCP is to achieve high throughput over high-bandwidth, high-latency links, especially when intermediate routers don’t have properly tuned interface buffers. Improperly tuned router buffers cause TCP to perceive congestion in the network, resulting in unnecessarily dropped packets, even when the network can support high-throughput rates.
You must ensure the following when you enable MX-TCP:
– The QoS rule for MX-TCP must be at the top of QoS rules list.
– Only use MX-TCP for optimized traffic. MX-TCP doesn’t work for unoptimized traffic.
– Do not classify a traffic flow as MX-TCP and then subsequently classify it in a different queue.
– There is a maximum bandwidth setting for MX-TCP that allows traffic in the MX class to burst to the maximum level if the bandwidth is available.
Control Description

Configuring QoS, Path Selection, and Hybrid Networking | 301
Configuring QoS
4. Optionally, add a new class and enter the values for the new class.
• To add an additional class as a peer with the existing classes, click add class at the bottom of the tree.
• To add an additional class as a subclass of an existing class, click add class to the right of the existing class.
Use a hierarchical tree structure to:
– divide traffic based on flow source or destination and apply different shaping rules and priorities to each leaf-class.
– effectively manage and support remote sites with different bandwidth characteristics.
The Management Console supports the configurations of three hierarchy levels. If you need more levels of hierarchy, you can configure them using the CLI. See the documentation for the qos profile class command in the Riverbed Command-Line Interface Reference Manual.
• To remove the class, click the x at the corner of the window. To remove a parent class, delete all rules for the corresponding child classes first. When a parent class has rules or children, the x for the parent class is unavailable.
5. Click Save to save the changes to the default class.
Outbound DSCP
Selects the default DSCP mark for the class. QoS rules can then specify Inherit from Class for outbound DSCP to use the class default.
Select Preserve or a DSCP value from the drop-down list. This value is required when you enable QoS marking. The default setting is Preserve, which specifies that the DSCP level or IP ToS value found on pass-through and optimized traffic is unchanged when it passes through the SteelHead.
The DSCP marking values fall into these classes:
• Expedited forwarding (EF) class - In this class, packets are forwarded regardless of link share of other traffic. The class is suitable for preferential services requiring low delay, low packet loss, low jitter, and high bandwidth.
• Assured forwarding (AF) class - This class is divided into four subclasses, each containing three drop priorities for more granular classification. The QoS level of the AF class is lower than that of the EF class.
• Class selector (CS) class - This class is derived from the IP ToS field.
Priority Select a latency priority from 1 through 6, where 1 is the highest and 6 is the lowest.
Control Description
Drop
priority
Class 1 Class 2 Class 3 Class 4
Low AF11 DSCP 10 AF21 DSCP 18 AF31 DSCP 26 AF41 DSCP 34
Medium AF12 DSCP 12 AF22 DSCP 20 AF32 DSCP 28 AF42 DSCP 36
High AF13 DSCP 14 AF23 DSCP22 AF33 DSCP 30 AF43 DSCP 38
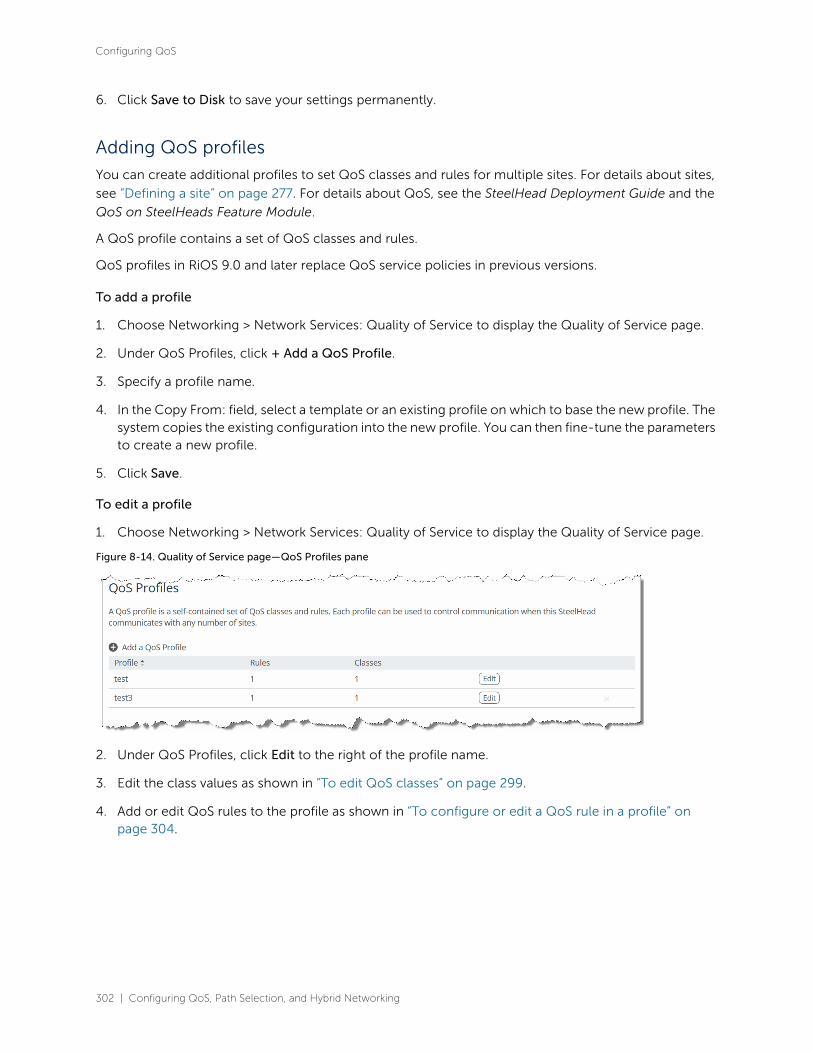
302 | Configuring QoS, Path Selection, and Hybrid Networking
Configuring QoS
6. Click Save to Disk to save your settings permanently.
Adding QoS profiles
You can create additional profiles to set QoS classes and rules for multiple sites. For details about sites,
see “Defining a site” on page 277. For details about QoS, see the SteelHead Deployment Guide and the
QoS on SteelHeads Feature Module.
A QoS profile contains a set of QoS classes and rules.
QoS profiles in RiOS 9.0 and later replace QoS service policies in previous versions.
To add a profile
1. Choose Networking > Network Services: Quality of Service to display the Quality of Service page.
2. Under QoS Profiles, click + Add a QoS Profile.
3. Specify a profile name.
4. In the Copy From: field, select a template or an existing profile on which to base the new profile. The system copies the existing configuration into the new profile. You can then fine-tune the parameters to create a new profile.
5. Click Save.
To edit a profile
1. Choose Networking > Network Services: Quality of Service to display the Quality of Service page.
Figure 8-14. Quality of Service page—QoS Profiles pane
2. Under QoS Profiles, click Edit to the right of the profile name.
3. Edit the class values as shown in “To edit QoS classes” on page 299.
4. Add or edit QoS rules to the profile as shown in “To configure or edit a QoS rule in a profile” on page 304.
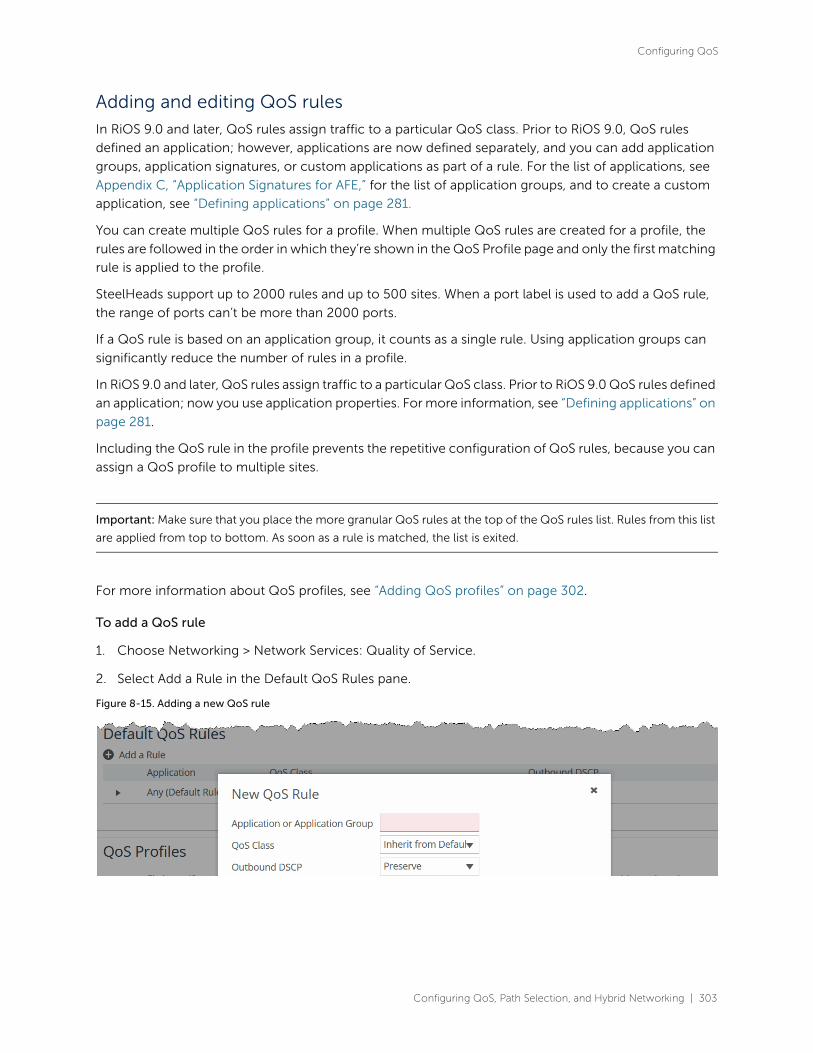
Configuring QoS, Path Selection, and Hybrid Networking | 303
Configuring QoS
Adding and editing QoS rules
In RiOS 9.0 and later, QoS rules assign traffic to a particular QoS class. Prior to RiOS 9.0, QoS rules
defined an application; however, applications are now defined separately, and you can add application
groups, application signatures, or custom applications as part of a rule. For the list of applications, see
Appendix C, “Application Signatures for AFE,” for the list of application groups, and to create a custom
application, see “Defining applications” on page 281.
You can create multiple QoS rules for a profile. When multiple QoS rules are created for a profile, the
rules are followed in the order in which they’re shown in the QoS Profile page and only the first matching
rule is applied to the profile.
SteelHeads support up to 2000 rules and up to 500 sites. When a port label is used to add a QoS rule,
the range of ports can’t be more than 2000 ports.
If a QoS rule is based on an application group, it counts as a single rule. Using application groups can
significantly reduce the number of rules in a profile.
In RiOS 9.0 and later, QoS rules assign traffic to a particular QoS class. Prior to RiOS 9.0 QoS rules defined
an application; now you use application properties. For more information, see “Defining applications” on
page 281.
Including the QoS rule in the profile prevents the repetitive configuration of QoS rules, because you can
assign a QoS profile to multiple sites.
Important: Make sure that you place the more granular QoS rules at the top of the QoS rules list. Rules from this list
are applied from top to bottom. As soon as a rule is matched, the list is exited.
For more information about QoS profiles, see “Adding QoS profiles” on page 302.
To add a QoS rule
1. Choose Networking > Network Services: Quality of Service.
2. Select Add a Rule in the Default QoS Rules pane.
Figure 8-15. Adding a new QoS rule
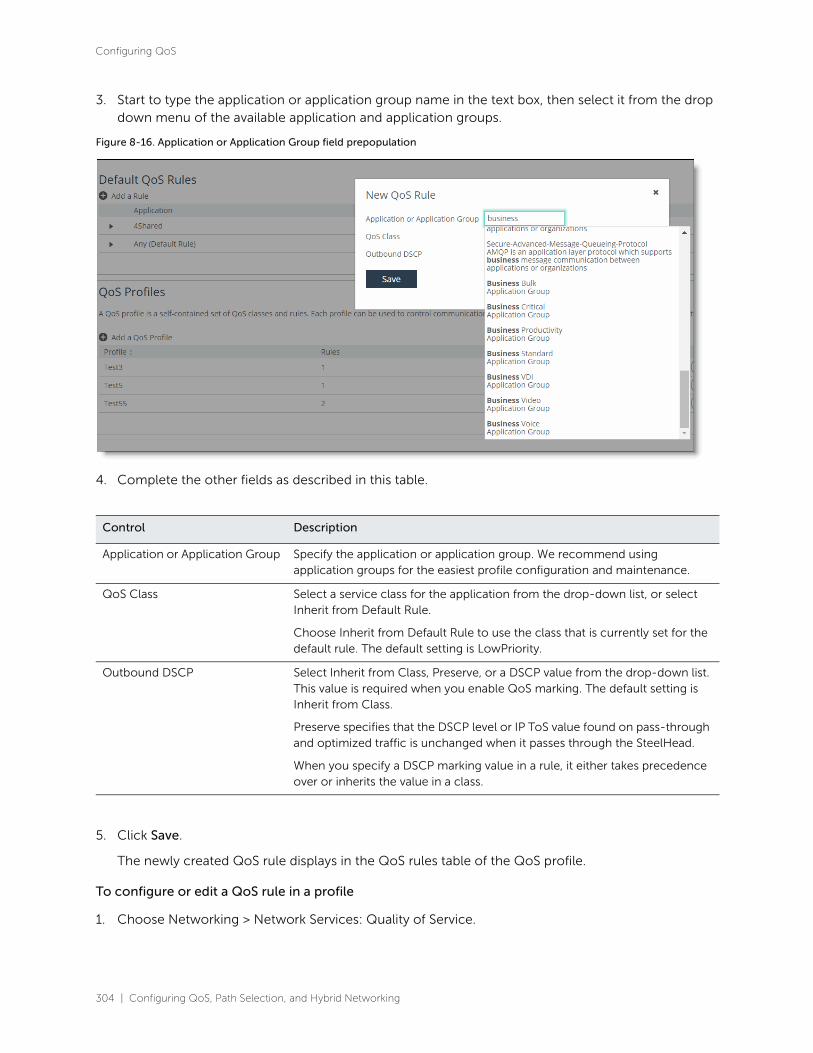
304 | Configuring QoS, Path Selection, and Hybrid Networking
Configuring QoS
3. Start to type the application or application group name in the text box, then select it from the drop down menu of the available application and application groups.
Figure 8-16. Application or Application Group field prepopulation
4. Complete the other fields as described in this table.
5. Click Save.
The newly created QoS rule displays in the QoS rules table of the QoS profile.
To configure or edit a QoS rule in a profile
1. Choose Networking > Network Services: Quality of Service.
Control Description
Application or Application Group Specify the application or application group. We recommend using application groups for the easiest profile configuration and maintenance.
QoS Class Select a service class for the application from the drop-down list, or select Inherit from Default Rule.
Choose Inherit from Default Rule to use the class that is currently set for the default rule. The default setting is LowPriority.
Outbound DSCP Select Inherit from Class, Preserve, or a DSCP value from the drop-down list. This value is required when you enable QoS marking. The default setting is Inherit from Class.
Preserve specifies that the DSCP level or IP ToS value found on pass-through and optimized traffic is unchanged when it passes through the SteelHead.
When you specify a DSCP marking value in a rule, it either takes precedence over or inherits the value in a class.

Configuring QoS, Path Selection, and Hybrid Networking | 305
Configuring QoS
2. In the Default QoS Rules pane, click the arrow next to the rule.
Figure 8-17. Editing a QoS rule for the default profile
Note: To edit a rule for a profile that was added, scroll down to the QoS Profiles area, click Edit to the right of the
QoS profile name, and then click the arrow next to the rule.
Figure 8-18. Editing a QoS rule for an added profile
3. Select Add a Rule at the bottom of the page.

306 | Configuring QoS, Path Selection, and Hybrid Networking
Configuring QoS
4. Specify the first three or four letters of the application or application group you want to create a rule for and select it from the drop down menu of the available application and application groups.
Figure 8-19. Configuring a QoS rule in a profile
5. Edit the application or application group name, the QoS class, or the DSCP value in the rule.
6. Click Save.
Verifying and Saving a QoS Configuration
After you apply your settings, you can verify whether the traffic is categorized in the correct class by
choosing Reports > Networking: Outbound QoS and viewing the report. For example, if you have
configured VoIP traffic as real-time, check the real-time class and verify that existing classes aren’t
receiving VoIP traffic.
You can verify whether the configuration is honoring the bandwidth allocations by reviewing the
Outbound QoS and Inbound QoS reports.
When you have verified appropriate changes, you can write the active configuration that is stored in
memory to the active configuration file (or you can save it as any filename you choose). For details about
saving configurations, see “Managing configuration files” on page 414.
Related topics
• “Configuring port labels” on page 171
• “Defining applications” on page 281
• “Managing configuration files” on page 414
• “Viewing outbound QoS reports” on page 523

Configuring QoS, Path Selection, and Hybrid Networking | 307
Configuring QoS
Enabling MX-TCP queue policies
When you define a QoS class, you can enable a maximum speed TCP (MX-TCP) queue policy, which
prioritizes TCP/IP traffic to provide more throughput for high loss links or links that have large bandwidth
and high latency LFNs. Some use case examples are:
• Data-Intensive Applications - Many large, data-intensive applications running across the WAN can negatively impact performance due to latency, packet loss, and jitter. MX-TCP enables you to maximize your TCP throughput for data intensive applications.
• High Loss Links - TCP doesn’t work well on misconfigured links (for example, an under-sized bottleneck queue) or links with even a small amount of loss, which leads to link under-utilization. If you have dedicated point-to-point links and want those links to function at predefined rates, configure the SteelHead to prioritize TCP traffic.
• Privately Owned Links - If your network includes privately owned links dedicated to rate-based TCP, configure the SteelHead to prioritize TCP traffic.
After enabling the MX-TCP queue to forward TCP traffic regardless of congestion or packet loss, you can
assign QoS rules that incorporate this policy only to links where TCP is of exclusive importance.
These exceptions to QoS classes apply to MX-TCP queues:
• In RiOS 7.x and later, the Link Share Weight parameter doesn’t apply to MX-TCP queues. When you select the MX-TCP queue, the Link Share Weight parameter doesn’t appear. In RiOS 8.x and later, there’s a maximum bandwidth setting for MX-TCP that allows traffic to burst to the maximum level if the bandwidth is available.
• MX-TCP queues apply only to optimized traffic (that is, no pass-through traffic).
• MX-TCP queues can’t be configured to contain more bandwidth than the license limit.
When enabling MX-TCP, ensure that the QoS rule is at the top of QoS rules list.
Basic steps for MX-TCP
This table describes the basic steps to configure MX-TCP. Enabling this feature is optional.
Task Reference
1. Select each WAN interface and define the bandwidth link rate for each interface.
“Configuring QoS” on page 294
2. Add an MX-TCP class for the traffic flow. Make sure you specify MX-TCP as your queue.
“Adding QoS profiles” on page 302
3. Define QoS rules to point to the MX-TCP class. “Adding and editing QoS rules” on page 303
4. Select the Enable Inbound or Outbound QoS Shaping check box and click Save. Your changes take effect immediately.
“Configuring QoS” on page 294
5. Optionally, to test a single connection, change the WAN socket buffer size (to at least the BDP). You must set this parameter on both the client-side and the server-side SteelHead.
“Optimizing TCP and satellite WANs” on page 149

308 | Configuring QoS, Path Selection, and Hybrid Networking
Configuring QoS
Modifying QoS profiles
You can modify the profile name, QoS class properties, and QoS rule properties in the Networking >
Network Services: QoS Profiles page. You can rename a profile name, class, or rule seamlessly without
the need to manually update the associated resources. For example, if you rename a profile associated
with a site, the system updates the profile name and the profile name within the site definition
automatically.
For details on creating a profile, see “Adding QoS profiles” on page 302.
To modify a QoS profile name, class, or rule
1. Choose Networking > Network Services: Quality of Service to display the Quality of Service page.
2. Click Edit next to the profile name in the QoS Profiles pane.
3. Perform any of these tasks (in any order):
– Rename the profile.
– Click Edit next to the class name and change its properties.
– Select a rule and change its properties.
4. Click Save to Disk to save your settings permanently.
Classifying and prioritizing OOB traffic using DSCP marking
When two SteelHeads see each other for the first time, either through autodiscovery or a fixed-target
rule, they set up an out-of-band (OOB) splice. This is a control TCP session between the two SteelHeads
that the system uses to test the connectivity between the two appliances.
After the setup of the OOB splice, the two SteelHeads exchange information about each other such as
the hostname, licensing information, RiOS versions, capabilities, and so on. This information is included
in the Riverbed control channel traffic.
By default, the control channel traffic isn’t marked with a DSCP value. By marking the control channel
traffic with a DSCP or ToS IP value, you can prevent dropped packets and other undesired effects on a
lossy or congested network link.
In RiOS 9.0 and earlier, the qos dscp-marking enable command enables global DSCP marking, which
tags inner channel setup packets and OOB packets with a DSCP value. RiOS 9.1 and later let you use the
management console to separate the inner channel setup packets from the OOB packets and mark the
OOB control channel traffic with a unique DSCP value.
6. Check and locate the inner connection. “Viewing alarm status reports” on page 596
7. Check the throughput. “Viewing connection history reports” on page 520
Task Reference

Configuring QoS, Path Selection, and Hybrid Networking | 309
Inbound QoS
Before marking OOB traffic with a DSCP value, ensure that the global DSCP setting isn’t in use. Global
DSCP marking includes both inner channel setup packets and OOB control channel traffic. This
procedure separates the OOB traffic from the inner channel setup traffic. For details on disabling global
DSCP marking, see the [no] qos dscp-marking enable command in the Riverbed Command-Line
Interface Reference Manual.
To classify OOB traffic with a DSCP marking
1. Choose Networking > Network Services: Quality of Service to display the Quality of Service page.
2. Under QoS Profiles, click Edit next to the profile name to display the QoS Profile Details page.
3. Under QoS Rules, select Add a Rule.
4. In the Application or Application Group text box, select Riverbed Control Traffic (Client) if the SteelHead being configured is a client-side SteelHead. Select Riverbed Control Traffic (Server) if the SteelHead being configured is a server-side SteelHead.
OOB packets are marked on the server-side SteelHead based on the value configured on the client-side SteelHead if a rule isn’t explicitly configured on the server-side SteelHead.
5. Under Outbound DSCP, select a DSCP marking value or a ToS IP value from the drop-down list.
6. Click Save to save your settings.
7. Click Save to Disk to save your settings permanently.
The new QoS rule appears in the QoS Rules table.
Inbound QoSYou configure inbound QoS in the Networking > Network Services: Quality of Service page. RiOS 9.0
provides feature parity between outbound and inbound QoS.
Inbound QoS allocates bandwidth and prioritizes traffic flowing into the LAN network behind the
appliance. Inbound QoS provides the benefits of QoS for environments that cannot meet their QoS
requirements with outbound QoS.
Some examples of environments that can benefit from inbound QoS are:
• A deployment that does not have an appliance located at the traffic source (for example, the traffic comes from the internet, or from servers at a site without a SteelFusion Edge or a SteelHead).
Figure 8-20. Guarantee bandwidth for incoming traffic

310 | Configuring QoS, Path Selection, and Hybrid Networking
Inbound QoS
• A deployment that has multiple appliances located at the traffic source (for example, behind an Interceptor cluster). The appliances do not share bandwidth information with each other. As a result, they can overwhelm the branch office site at the remote location.
Figure 8-21. Data center with multiple SteelHeads in a cluster
• A branch office receiving data from multiple data centers (either with or without SteelHeads). Because the two data centers do not coordinate the amount of bandwidth sent to the branch office, they can overwhelm the link at the branch office, causing degraded performance.
Figure 8-22. Branch office that receives data from multiple data centers
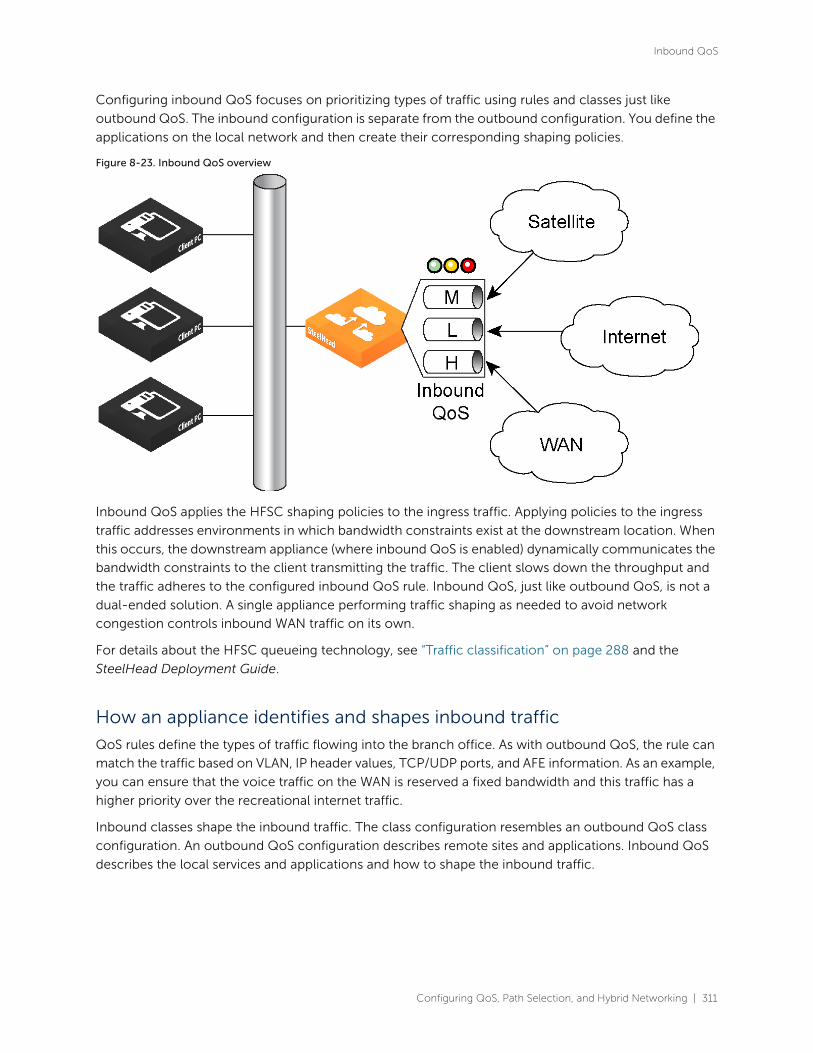
Configuring QoS, Path Selection, and Hybrid Networking | 311
Inbound QoS
Configuring inbound QoS focuses on prioritizing types of traffic using rules and classes just like
outbound QoS. The inbound configuration is separate from the outbound configuration. You define the
applications on the local network and then create their corresponding shaping policies.
Figure 8-23. Inbound QoS overview
Inbound QoS applies the HFSC shaping policies to the ingress traffic. Applying policies to the ingress
traffic addresses environments in which bandwidth constraints exist at the downstream location. When
this occurs, the downstream appliance (where inbound QoS is enabled) dynamically communicates the
bandwidth constraints to the client transmitting the traffic. The client slows down the throughput and
the traffic adheres to the configured inbound QoS rule. Inbound QoS, just like outbound QoS, is not a
dual-ended solution. A single appliance performing traffic shaping as needed to avoid network
congestion controls inbound WAN traffic on its own.
For details about the HFSC queueing technology, see “Traffic classification” on page 288 and the
SteelHead Deployment Guide.
How an appliance identifies and shapes inbound traffic
QoS rules define the types of traffic flowing into the branch office. As with outbound QoS, the rule can
match the traffic based on VLAN, IP header values, TCP/UDP ports, and AFE information. As an example,
you can ensure that the voice traffic on the WAN is reserved a fixed bandwidth and this traffic has a
higher priority over the recreational internet traffic.
Inbound classes shape the inbound traffic. The class configuration resembles an outbound QoS class
configuration. An outbound QoS configuration describes remote sites and applications. Inbound QoS
describes the local services and applications and how to shape the inbound traffic.

312 | Configuring QoS, Path Selection, and Hybrid Networking
Path selection
The inbound traffic shaping configuration includes a default shaping class. The QoS scheduler applies
the built-in inbound default class constraints and parameters on traffic not placed in any other class by
the configured QoS rules. The default shaping class has a 10 percent minimum bandwidth allocation and
a 100 percent maximum bandwidth allocation. You cannot delete the default class; however, you can
change its bandwidth allocations.
Inbound QoS limitations
These limitations apply to inbound QoS traffic shaping.
• When packet-mode optimization is enabled, the QoS scheduler places UDP4 traffic into the MX-TCP class. All other traffic goes into the proper class.
• You cannot configure inbound QoS in an out-of-path deployment over a primary or auxiliary interface.
• Inbound QoS does not throttle certain flows such as MX-TCP and UDP bulk traffic flows; however, it does provide bandwidth and latency reservation for them.
Related topics
• “Configuring port labels” on page 171
• “Managing configuration files” on page 414
• “Viewing inbound QoS reports” on page 525
Path selectionYou configure path selection in the Networking > Network Services: Path Selection page.
Path selection ensures the right traffic travels the right path, by choosing a predefined WAN gateway for
certain traffic flows in real time, based on availability. You define a path, called an uplink, by specifying a
WAN egress point and providing a direction for the egressing packets to take. This granular path
manipulation enables you to better use and more accurately control traffic flow across multiple WAN
circuits.
A common use of path selection is to route voice and video over an expensive, high-quality,
multiprotocol label switching (MPLS) link, while offloading less time-sensitive business traffic over a less
expensive internet VPN or direct internet link. Enabling internet paths makes efficient use of existing
resources by taking advantage of both private and public links. Using path selection provides the right
performance levels for your applications and saves on bandwidth costs by optimizing the use of available
bandwidth.
The path selection WAN egress control:
• is a transparent operation to the client, server, and any networking devices such as routers or switches.
• identifies and processes both optimized and pass-through traffic.
• supports single and multiple firewalled paths.
• is compatible with all transport modes, including fixed-target configuration.

Configuring QoS, Path Selection, and Hybrid Networking | 313
Path selection
• can be used to encrypt traffic using the secure transport service.
Note: The SteelCentral Controller for SteelHead is required to configure path selection with the secure transport
service. You cannot configure path selection with the secure transport service from the SteelFusion Edge. For
details, see the SteelCentral Controller for SteelHead User Guide and the SteelCentral Controller for SteelHead
Deployment Guide.
Using paths to steer packets
To configure path selection, you define path selection rules to direct any application to any site.
Path Selection rules direct matching traffic onto specific uplinks. Traffic is matched by a combination of
application and destination site.
You can create multiple rules for a site. When multiple rules are created for a site, the rules are followed
in the order in which they are shown in the Path Selection page and only the first matching rule is applied
to the site.
The network topology definition includes direct uplinks on a SteelFusion Edge. An Edge uses a direct
uplink to steer packets to a specific gateway. The Edge can reach the gateway over Layer 2, so it can
send packets directly to that gateway.
You configure a direct uplink using an Edge in-path IP address and a gateway IP address pair. For details,
see “Defining a hybrid network topology” on page 274. When you define path selection rules, you specify
the uplink preferences for certain traffic.
You must deploy two appliances using path solution to enforce the return uplink. To define the return
uplink for traffic and override the original traffic uplink, you must deploy an appliance near the return
traffic WAN junction point.
For more information, see “Path selection limits” on page 316 and “Path selection use cases” on
page 315.
For more details on path selection, see the SteelHead Deployment Guide.
To configure path selection
1. Define your remote sites, associated subnets, uplinks for the local site, the gateway IP address, and peer IP address in the Sites & Network page. For details, see “Defining a hybrid network topology” on page 274.
You don’t need to configure uplinks for the remote and default site.

314 | Configuring QoS, Path Selection, and Hybrid Networking
Path selection
2. Choose Networking > Network Services: Path Selection to display the Path Selection page.
Figure 8-24. Path Selection page
3. Select Enable Path Selection. Path Selection is disabled by default.
4. Under Path Selection Rules, click + Add a Rule.
5. Identify the traffic flow by selecting an application for the Riverbed Application Flow Engine (AFE). Type the first few letters of the application in the Application/Application Group field. As you type the name of an application, a menu appears and lists available applications that match your typing. Select an application from the list. The default setting is any application or application group.
6. Select a destination site from the drop-down list. The default setting is any destination site.
The Any setting combines identifications of all known configured sites, including the Default-Site. Rather than configuring a separate identical path selection rule for every known site, select the Any setting to match the destination address of every configured site. When you select Any, path selection steers the configured application and any matching configured site, or the default-site, onto the selected uplink. Using the Any setting reduces the configuration steps required, yet provides a common application steering design.
7. Select the preferred uplink for the application. You can associate up to three uplinks per traffic flow in order of priority: a primary, a secondary, and a tertiary uplink. The uplinks you select cascade from one to the next, based on availability.
For details on creating an uplink, see “Defining uplinks” on page 279.

Configuring QoS, Path Selection, and Hybrid Networking | 315
Path selection
8. Select an outbound DSCP marking from the drop-down list. You must select DSCP values if the service providers are applying QoS metrics based on DSCP marking and each provider is using a different type of metric.
9. Optionally, select the default action to take if all the uplinks specified in the rule are down. These settings are available even when no uplinks are selected.
– Relay - Sends the traffic unmodified out of the WAN side of whichever in-path it came in on. This is the default setting.
– Drop - Drops the packets in case of failure of all three (primary, secondary, tertiary) paths. Select this option when you do not want the traffic to pass on any of the uplinks specified in the rule, not just the primary.
You do not have to define default uplinks to drop specific traffic flows; however, you must enable path selection.
The default rule matches any application to any destination that does not match another rule.
10. Click Save to save your settings permanently.
In QoS, you can define up to three uplinks for a rule and three DSCP values for a site. The DSCP values
can steer traffic based on PBR in an upstream router.
You don’t need to restart the appliance to enable path selection. At this point, path selection is enabled.
Path selection processes new flows after you enable it, but it does not process preexisting flows.
If the primary uplink assigned to a connection becomes unavailable, the appliance directs traffic through
the next available uplink and triggers the Path Selection Path Down alarm. When the original uplink
comes back up, the appliance redirects the traffic back to it.
For details on the Path Selection Path Down alarm, see “Configuring alarm settings” on page 447 and
“SNMP traps” on page 660.
Validating the path selection design
Use these pages to validate your design:
• Choose Networking > Network Services: Path Selection to view the Uplink Status table. Click the uplink name for details such as number of bytes sent, peer availability, and uplink status.
• Reports > Networking: Current Connections shows details per connection.
• Reports > Networking: Interface Counters shows that the traffic in a multi-interface deployment is exiting the correct interface.
To troubleshoot, we recommend taking TCP dump traces on all WAN and LAN interfaces.
Path selection use cases
This section describes several different ways to configure path selection. For more use cases, see the
SteelHead Deployment Guide.

316 | Configuring QoS, Path Selection, and Hybrid Networking
Path selection
Using an interface and next hop IP address to select an uplink
In this configuration, you have multiple uplinks from the appliance to the remote data center. The
appliance selects which uplink to use. For each application, you define the primary uplink as a
combination of the outgoing interface (wan0_0 or wan0_1) and the next hop IP address. The system
must send the probe packets over the exact uplink that the data packets take.
Figure 8-25. Path selection by relay interface and next hop IP address
You can define this type of configuration in one of these ways:
Define the uplinks using only the relay interface
In this configuration, you define a primary uplink by specifying the wan0_0 interface and the secondary
uplink as the wan0_1 interface. Suppose that the appliance selects the primary uplink for the application.
In this case, it does not matter whether it sends the packet to path 1 or path 2. In both cases, the
appliance selects the MPLS uplink.
While probing for the remote IP address from wan0_0, the probe packets use either R1 or R2. The
appliance cannot monitor both uplinks because it does not know about them. Because it monitors only
one uplink, it ensures that all data packets are also sent over that uplink. Assuming that the probe packets
are being sent to the remote IP through R1, it cannot use uplink 2 to send data packets toward the server,
because this uplink might be down. The appliance does not route data packets, but simply uses the next
hop learnt by probing.
In the case of the secondary uplink, all packets are sent through uplink 2 so there is no confusion.
Define the uplinks using an interface and the next-hop IP address
In this configuration, you specify the next hop as well as the relay interface to use for a given uplink. This
is the simplest case, because the appliance does not need to learn anything during probing. The
appliance does not need to route data packets, because they use the next hop specified in the
configuration. The appliance sends the packets out of the configured relay.
Path selection limits
These limits apply to path selection:
• You can’t base a path selection on VLANs.
• You can’t use a wildcard for the relay interface in the path definition. For example, you have to specify a relay interface for a path if you are not using PBR.

Configuring QoS, Path Selection, and Hybrid Networking | 317
Path selection
• You can’t use VLAN transparency for connections rerouted by path selection.
• You can’t configure LAN-side path selection.
• Path selection does not handle ricochet of probe packets across relay interfaces.
• Path selection does not support L2 WANs.
• Fully transparent inner connections might require connection forwarding.
• Path selection does not support IPv6 connections or packet-mode flows.
• You must not install any downstream appliance that does source MAC learning a hop away from the WAN side of the appliance. Path selection updates a source MAC address of a packet to that of the relay being used to transmit it (IP addresses are unchanged). If source MAC learning is enabled on a downstream appliance that is present at next hop, the packets destined to the original source are updated with the MAC address of the appliance. When processing the packet, the appliance detects that the destination MAC address is that of itself and sends the packet up its stack instead of relaying it forward.
• Path selection does not support WCCP unless it is in DSCP-only mode.
• The appliance never takes on the router role or the role of a default gateway. Because path selection is transparent, you do not have to make network design changes to accommodate path selection design.
• Path selection does not react to path selection rule changes for long-lived, locally originated connections such as OOB or connection forwarding cluster and neighbor connections until you restart the optimization service.
• You cannot use path selection with single-ended SCPS connections.
Related topics
• “Applying QoS policies” on page 286
• “Configuring QoS” on page 294
• “Defining applications” on page 281
• “Defining a hybrid network topology” on page 274

318 | Configuring QoS, Path Selection, and Hybrid Networking
Path selection

Configuring SSL and a Secure Inner Channel | 319
9
Configuring SSL and a Secure Inner
Channel
This chapter describes how to configure SSL support. It includes these sections:
• “Configuring SSL server certificates and certificate authorities” on page 319
• “Configuring SSL main settings” on page 325
• “Configuring CRL management” on page 336
• “Configuring secure peers” on page 340
• “Configuring advanced and SSL cipher settings” on page 351
Configuring SSL server certificates and certificate authoritiesThis section provides an overview of SSL support and describes how to configure SSL server certificates
and certificate authorities. SSL is a cryptographic protocol that provides secure communications
between two parties over the internet.
Typically in a web-based application, it is the client that authenticates the server. To identify itself, an SSL
certificate is installed on a web server and the client checks the credentials of the certificate to make sure
it is valid and signed by a trusted third party. Trusted third parties that sign SSL certificates are called
certificate authorities (CA).
How does SSL work?
With Riverbed SSL, appliances are configured to have a trust relationship, so they can exchange
information securely over an SSL connection. SSL clients and servers communicate with each other
exactly as they do without Riverbed appliances; no changes are required for the client and server
application, nor are they required for the configuration of proxies. RiOS splits up the SSL handshake, the
sequence of message exchanges at the start of an SSL connection.

320 | Configuring SSL and a Secure Inner Channel
Configuring SSL server certificates and certificate authorities
In an ordinary SSL handshake, the client and server first establish identity using public-key cryptography,
and then negotiate a symmetric session key to be used for data transfer. With Riverbed SSL acceleration,
the initial SSL message exchanges take place between the client-side appliance and the server-side
SteelHead.
Figure 9-1. Riverbed SSL
RiOS provides an alternative handshake, called distributed termination, which terminates full handshakes
on the client-side appliance. The master secret containing information that allows the computation of
the session key for reusing the session is transported to the session cache of the client-side appliance.
The subsequent handshakes are reused and the client’s SSL connection is physically and logically
terminated on the client-side appliance.
Distributed termination improves performance by lessening the CPU load because it eliminates
expensive asymmetric key operations. It also shortens the key negotiation process by avoiding WAN
roundtrips to the server. You can find the setting to reuse a client-side session for distributed termination
in the Optimization > SSL: Advanced Settings page. See “Setting advanced SSL options” on page 351.
RiOS provides client-side authentication, used to optimize SSL connections where the SSL server
challenges the SSL client to present its own certificate, in addition to authenticating servers using SSL
certificates. See “Configuring advanced and SSL cipher settings” on page 351.
The appliance also contains a secure vault that stores all SSL server settings, other certificates (that is,
the CA, peering trusts, and peering certificates), and the peering private key. The secure vault protects
your SSL private keys and certificates when the appliance is not powered on. You set a password for the
secure vault that is used to unlock it when the appliance is powered on. After rebooting the appliance,
SSL traffic is not optimized until the secure vault is unlocked with the correct password. See “Unlocking
the secure vault” on page 434.
Prerequisite tasks
Complete these prerequisite tasks before you begin SSL configuration:
1. Connect to the Management Console using HTTPS to protect your SSL private keys and certificates.
2. On the client-side appliance and server-side SteelHead, make sure you have a valid Enhanced Cryptography License Key. To verify your license, see “Managing licenses and model upgrades” on

Configuring SSL and a Secure Inner Channel | 321
Configuring SSL server certificates and certificate authorities
page 409. If you do not have a valid Enhanced Cryptography License Key file, go to https://sslcert.riverbed.com and follow the procedures documented there.
Note: The SSL License is called the Enhanced Cryptographic License Key, because it also activates RiOS data store
encryption and creates secure channels while optimizing encrypted MAPI and SMB-signed traffic (even if the
appliances are not configured for optimizing SSL traffic).
3. Back up your private keys and the CA-signed certificates before you begin the SSL configuration process.
Basic steps
This section provides an overview of the basic steps to configure SSL, followed by detailed procedures.
Task Reference
1. Enable SSL support on the server-side SteelHead and client-side appliance.
“Configuring SSL main settings” on page 325
2. Set the SSL secure vault password on the client-side appliance and server-side SteelHead.
“Unlocking the secure vault” on page 434
3. Optionally, enable the appliance to reuse the client-side SSL session. This is a client-side setting that improves connection setup performance. Both the client-side appliance and the server-side SteelHead must be running RiOS 6.0 or later. Enabling this option requires an optimization service restart. Client-side session reuse is enabled by default.
“Setting advanced SSL options” on page 351
4. On the server-side SteelHead, configure a proxy certificate and private key for the SSL back-end server.
This step enables the server-side SteelHead to act as a proxy for the back-end server, which is necessary to intercept the SSL connection and to optimize it.
“Configuring SSL server certificates” on page 327
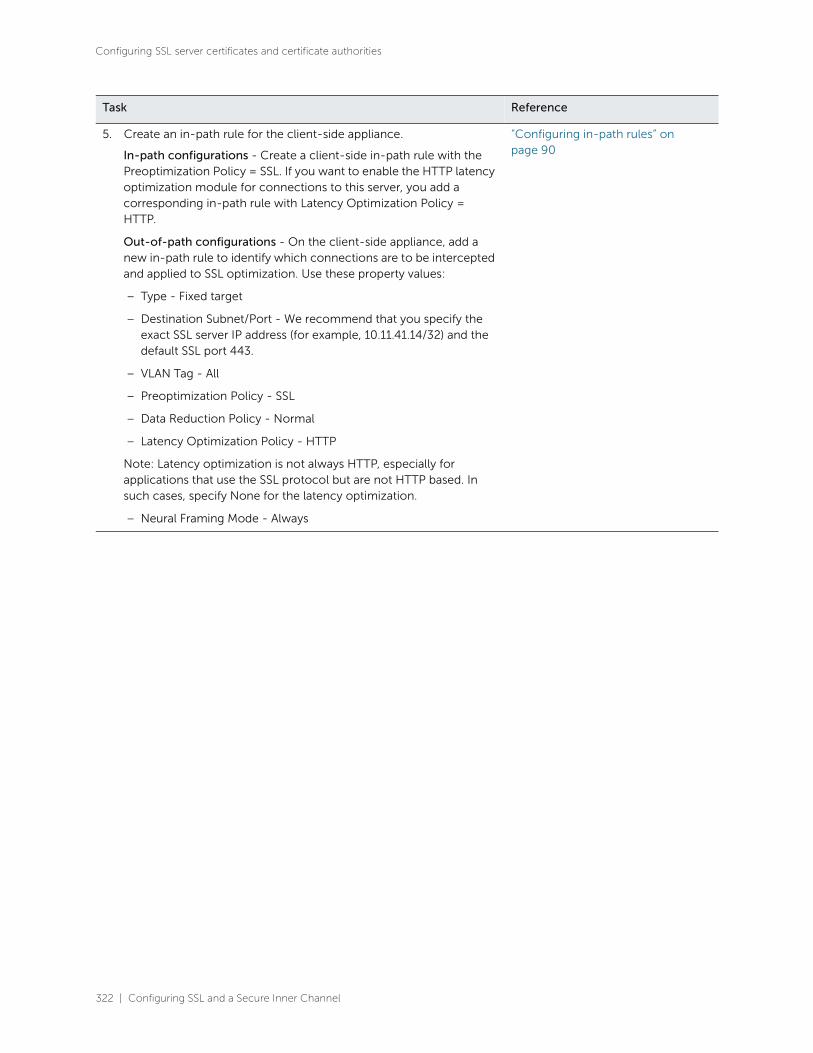
322 | Configuring SSL and a Secure Inner Channel
Configuring SSL server certificates and certificate authorities
5. Create an in-path rule for the client-side appliance.
In-path configurations - Create a client-side in-path rule with the Preoptimization Policy = SSL. If you want to enable the HTTP latency optimization module for connections to this server, you add a corresponding in-path rule with Latency Optimization Policy = HTTP.
Out-of-path configurations - On the client-side appliance, add a new in-path rule to identify which connections are to be intercepted and applied to SSL optimization. Use these property values:
– Type - Fixed target
– Destination Subnet/Port - We recommend that you specify the exact SSL server IP address (for example, 10.11.41.14/32) and the default SSL port 443.
– VLAN Tag - All
– Preoptimization Policy - SSL
– Data Reduction Policy - Normal
– Latency Optimization Policy - HTTP
Note: Latency optimization is not always HTTP, especially for applications that use the SSL protocol but are not HTTP based. In such cases, specify None for the latency optimization.
– Neural Framing Mode - Always
“Configuring in-path rules” on page 90
Task Reference

Configuring SSL and a Secure Inner Channel | 323
Configuring SSL server certificates and certificate authorities
Verifying SSL and secure inner channel optimization
Use these tools to verify that you have configured SSL support correctly:
6. Configure mutual peering trusts so the server-side SteelHead trusts the client-side appliance and vice versa. Use one of these approaches:
Use the secure inner channel and peering lists:
– Configure the inner channel SSL settings as described in “Configuring secure peers” on page 340.
– To automatically discover appliances using self-signed certificates, open your secure application to send some traffic through the appliances. The connection is passed through to the server without optimization, but the appliances will automatically discover the peers and place them in the self-signed peer gray list.
– Manually move the peers from the gray list to the trusted white list by simply marking them as trusted. The connections are not optimized until after you move the peers to the white list.
– Reopen your secure application.
—or—
Add CA-signed peer certificates:
– Add the PEM certificate of the designated CA as a new trusted entity to the peering trust list for each appliance.
– For production networks with multiple appliances, use the SCC or the bulk import and export feature to simplify configuring trusted peer relationships. For details, see the SteelCentral Controller for SteelHead User Guide or “Performing bulk imports and exports” on page 359.
Note: Your organization can choose to replace all of the default self-signed identity certificates and keys on their appliances with those certificates signed by another CA (either internal to your organization or an external well-known CA). In such cases, every appliance must simply have the certificate of the designated CA (that signed all those appliance identity certificates) added as a new trusted entity.
“Configuring secure peers” on page 340
7. If your organization uses internal CAs to sign their SSL server certificates you must import each of the certificates (in the chain) on to the server-side SteelHead.
You must perform this step if you use internal CAs because the SteelHead default list of well-known CAs (trusted by our server-side SteelHead) does not include your internal CA certificate. To identify the certificate of your internal CA (in some cases, the chain of certificate authorities) go to your web browser repository of trusted-root or intermediate CAs: for example, Internet Explorer > Tools > Internet Options > Certificates.
“Configuring SSL certificate authorities” on page 330
8. On the client-side appliance and server-side SteelHead, restart the optimization service.
“Starting and stopping the optimization service” on page 403
Task Reference

324 | Configuring SSL and a Secure Inner Channel
Configuring SSL server certificates and certificate authorities
• SSL Optimization - After completing the SSL configuration on both SteelHeads and restarting the optimization service, access the secure server from the web browser. These events take place in a successful optimization:
– If you specified a self-signed proxy certificate for the server on the server-side SteelHead, a pop-up window appears on the web browser. View the certificate details to ensure that it’s the same as the certificate on the server-side SteelHead.
– In the Management Console, the Current Connections report lists the new connection as optimized without a red protocol error.
– In the Management Console, the Traffic Summary report displays encrypted traffic (typically, HTTPS).
– Verify that the back-end server IP appears in the SSL Discovered Server Table (Optimizable) in the SSL Main Settings page.
Note: Because all the SSL handshake operations are processed by the server-side SteelHead, all the SSL statistics
are reported on the server-side SteelHead. No SSL statistics are reported on the client-side SteelHead.
• Monitoring SSL Connections - Use these tools to verify SSL optimization and to monitor SSL progress:
– On the client web browser, click the lock icon to obtain certificate details. The certificate must match the proxy certificate installed on server-side SteelHead.
– In the Current Connections report, verify the destination IP address, port 443, the Connection Count as Established (three yellow arrows on the left side of the table), SDR Enabled (three cascading yellow squares on the right side of the table), and that there’s no Protocol Error (a red triangle on the right side of the table).
– In the SSL Statistics report (on the server-side SteelHead only) look for connection requests (established and failed connections), connection establishment rate, and concurrent connections.
• Monitoring Secure Inner Channel Connections - Use these tools to verify that secure inner channels are in use for the selected application traffic types:
– In the Current Connections report, look for the lock icon and three yellow arrows, which indicate the connection is encrypted and optimized. If the lock icon is not visible or is dimmed, click the magnifying glass to view a failure reason that explains why the SteelHead is not using the secure inner channel to encrypt the connection. If there’s a red protocol error, click the magnifying glass to view the reason for the error.
– Search the client-side and server-side SteelHead logs for ERR and WARN.
– Check that both SteelHeads appear in the white peering trust list on the client-side and server-side SteelHeads, indicating that they trust each other.
For details about the secure inner channel, see “Secure inner channel overview” on page 340.

Configuring SSL and a Secure Inner Channel | 325
Configuring SSL main settings
• SSL Issues with Internet Explorer 6 and Oracle R12 - Previously, RiOS fixed a vulnerability found in CBC-based ciphers prior to versions 0.9.6e by inserting an empty frame on the wire to avoid a Chosen Plaintext Attack on cipher-block chaining (CBC) ciphers. Some versions of client and server applications do not understand the insertion of empty frames into the encrypted stream and close the connection when they detect these frames. Therefore, RiOS no longer inserts empty frames by default. Examples of applications that close the connection when they detect these empty frames are IE6 and Oracle R12. SharePoint under IIS has also exhibited this behavior.
The failure occurs when the SSL application fails to understand the data payload when either the client or server is using a block cipher using CBC mode as the chosen cipher. This failure can be with DES, AES, or 3DES using CBC. Note that when SteelHeads are deployed, the chosen cipher can be different than when the client is negotiating directly with the SSL server.
Note: Because current web browsers do not protect themselves from this vulnerability, SteelHeads are no less
secure than other vendor’s appliances. From a security perspective, fixing this vulnerability is the responsibility
of a server, not a patched client.
To determine whether the SteelHeads are inserting empty frames to avoid an attack, capture TCP dumps on the server-side SteelHead LAN interface and look at the Server Hello message that displays the selected cipher. Verify that DES, AES, or 3DES is the cipher. Also, check for the existence of 32-byte length SSL application data (this is the empty frame) on the LAN traces, followed by an SSL Alert.
To change the default and insert empty frames, enter the CLI command no protocol ssl bug-work-around dnt-insrt-empty.
Configuring SSL main settings You can configure SSL optimization in the Optimization > SSL: SSL Main Settings page. Enabling SSL
allows you to accelerate encrypted traffic (for example, HTTPS).
The appliance securely decrypts, optimizes, and then reencrypts SSL traffic. To configure SSL support,
you do not need to make configuration changes on the client and the server—clients continue
connecting to the same server name or IP address.

326 | Configuring SSL and a Secure Inner Channel
Configuring SSL main settings
To enable SSL
1. Choose Optimization > SSL: SSL Main Settings to display the SSL Main Settings page.
Figure 9-2. SSL Main Settings page
2. Under General SSL Settings, complete the configuration on both the client-side appliance and server-side SteelHead as described in this table.
3. Click Apply to apply your settings.
4. Click Save to save your settings permanently.
Control Description
Enable SSL Optimization
Enables SSL optimization, which accelerates applications that use SSL to encrypt traffic. By default, this option is disabled. You can choose to enable SSL optimization only on certain sessions (based on source and destination addresses, subnets, and ports), or on all SSL sessions, or on no SSL sessions at all. An SSL session that is not optimized simply passes through the SteelHead unmodified.
Configuring SSL and a Secure Inner Channel | 327
Configuring SSL main settings
5. You must restart the optimization service. For details, see “Starting and stopping the optimization service” on page 403.
Configuring SSL server certificates
You configure an SSL server certificate in the Optimization > SSL: SSL Main Settings page.
You do not need to add each server certificate individually. You need only add unique certificates to a
certificate pool on the server-side SteelHead. When a client initiates an SSL connection with a server, the
SteelHead matches the common name of the server’s certificate with one in its certificate pool. If it finds
a match, it adds the server name to the list of discovered servers that are optimizable and all subsequent
connections to that server are optimized.
If it does not find a match, it adds the server IP and port and client IP address (or wildcard) to the list of
bypassed servers and all subsequent connections to that client-server pair are not optimized. The
Discovered and Bypassed Server lists appear in the SSL Main Settings page.
The SteelHead supports RSA private keys for peers and SSL servers.
Note: Optimization does not occur for a particular server IP address and port unless a suitable proxy server
certificate is configured on the server-side SteelHead.
When you configure the back-end server proxy certificate and key on the server-side SteelHead, if you
choose not to use the actual certificate for the back-end server and key, you can use a self-signed
certificate and key or another CA-signed certificate and key. If you have a CA-signed certificate and key,
import it.
If you do not have a CA-signed certificate and key, you can add the proxy server configuration with a
self-signed certificate and key, back up the private key, generate a CSR, have it signed by a CA, and
import the newly CA-signed certificate and the backed up private key.
Note: To back up a single pair of certificate and key (that is, the peering certificate and key pair and a single certificate
and key for the server), use the Export (in PEM format only) option. Make sure you check Include Private Key and
enter the encryption password. Save the exported file that contains the certificate and the encrypted private key. For
details, see “Configuring secure peers” on page 340.
You can also simply use the generated self-signed certificate and key, but it might be undesirable
because the clients by default do not trust it, requiring action from the end users.

328 | Configuring SSL and a Secure Inner Channel
Configuring SSL main settings
To add an SSL server certificate
1. Choose Optimization > SSL: SSL Main Settings to display the SSL Main Settings page.
Figure 9-3. SSL Main Settings page
2. On the server-side SteelHead, under SSL Server Certificates, complete the configuration as described in this table.
Control Description
Add a New SSL Certificate Displays the controls to add a new server certificate.
Name Specify a name for the proxy certificate (required when generating a certificate, leave blank when importing a certificate).

Configuring SSL and a Secure Inner Channel | 329
Configuring SSL main settings
Import Certificate and Private Key
Imports the certificate and key.
The page displays controls for browsing to and uploading the certificate and key files. Or, you can use the text box to copy and paste a PEM file.
The private key is required regardless of whether you are adding or updating the certificate.
Certificate Upload - Browse to the local file in PKCS-12, PEM, or DER formats.
Paste it here (PEM) - Copy and then paste the contents of a PEM file.
Private Key Select the private key origin.
• The Private Key is in a separate file (see below) - You can either upload it or copy and paste it.
• This file includes the Certificate and Private Key
Separate Private Key Upload (PEM or DER formats) - Browse to the local file in PEM or DER formats.
Paste it here (PEM only) - Paste the contents of a PEM file.
Decryption Password - Specify the decryption password, if necessary. Passwords are required for PKCS-12 files, optional for PEM files, and never needed for DER files.
Exportable - (Appears only when global exporting of SSL server certificates is enabled.) Allows the certificate and server key to be exported. This is the default setting. Disable this setting to make sure the private key doesn’t leave the SteelHead.
Generate Self-Signed Certificate and New Private Key
Select this option to generate a new private key and self-signed public certificate.
The page displays controls to identify and generate the new certificate and key.
Common Name - Specify the common name of a certificate. To facilitate configuration, you can use wildcards in the name: for example, *.nbttech.com. If you have three origin servers using different certificates such as webmail.nbttech.com, internal.nbttech.com, and marketingweb.nbttech.com, on the server-side SteelHeads, all three server configurations can use the same certificate name *.nbttech.com.
Organization Name - Specify the organization name (for example, the company).
Organization Unit Name - Specify the organization unit name (for example, the section or department).
Locality - Specify the city.
State (no abbreviations) - Specify the state.
Country (2-letter code) - Specify the country (two-letter code only).
Email Address - Specify the email address of the contact person.
Validity Period (Days) - Specify how many days the certificate is valid.
Private Key Cipher Bits - Select the key length from the drop-down list. The default is 2048.
Control Description
330 | Configuring SSL and a Secure Inner Channel
Configuring SSL main settings
Preventing the export of SSL server certificates and private keys
The bulk export feature on the Optimization > SSL: Advanced Settings page allows you to export SSL
server certificates and private keys. You can also select SSL server certificates for export individually in
the Optimization > SSL: SSL Main Settings page. These features are useful to back up SSL configurations
or move them to another appliance; however, security-conscious organizations might want to make SSL
configurations nonexportable. You can ensure a secure SSL deployment by preventing your SSL server
certificates and private keys from leaving the appliance.
Consider making SSL server certificates and private keys nonexportable with your particular security
goals in mind. Before doing so, you must have a thorough understanding of its impact. Use caution and
consider these limitations before making SSL configurations nonexportable:
• After disabling export on an appliance, you cannot reenable it unless you perform a factory reset on the appliance (losing the configuration) or clear the secure vault.
• After disabling export, you cannot export any preexisting or newly added server certificates and private keys to another appliance.
• After disabling export, any newly added server certificates and keys are marked as nonexportable.
• After disabling export and then downgrading a SteelHead to a previous RiOS version, you cannot export any of the existing server certificates and private keys. You can export any newly added server certificates and private keys.
• Disabling export prevents the copy of the secure vault content.
To prevent exporting of SSL server certificates and private keys
1. Choose Optimization > SSL: SSL Main Settings to display the SSL Main Settings page.
2. Under SSL Server Certificate Export Settings, click Disable Exporting of SSL Server Certificates.
The system reminds you that disabling export cannot be undone.
3. Click Disable Export.
4. Click Apply to apply your settings.
5. Click Save to save your settings permanently.
Configuring SSL certificate authorities
You add SSL certificate authorities (CA) in the Optimization > SSL: Certificate Authorities page.
Add Paste it here (PEM) - Paste the contents of a PEM file.
Remove Selected Select the check box next to the name and click Remove Selected.
Control Description
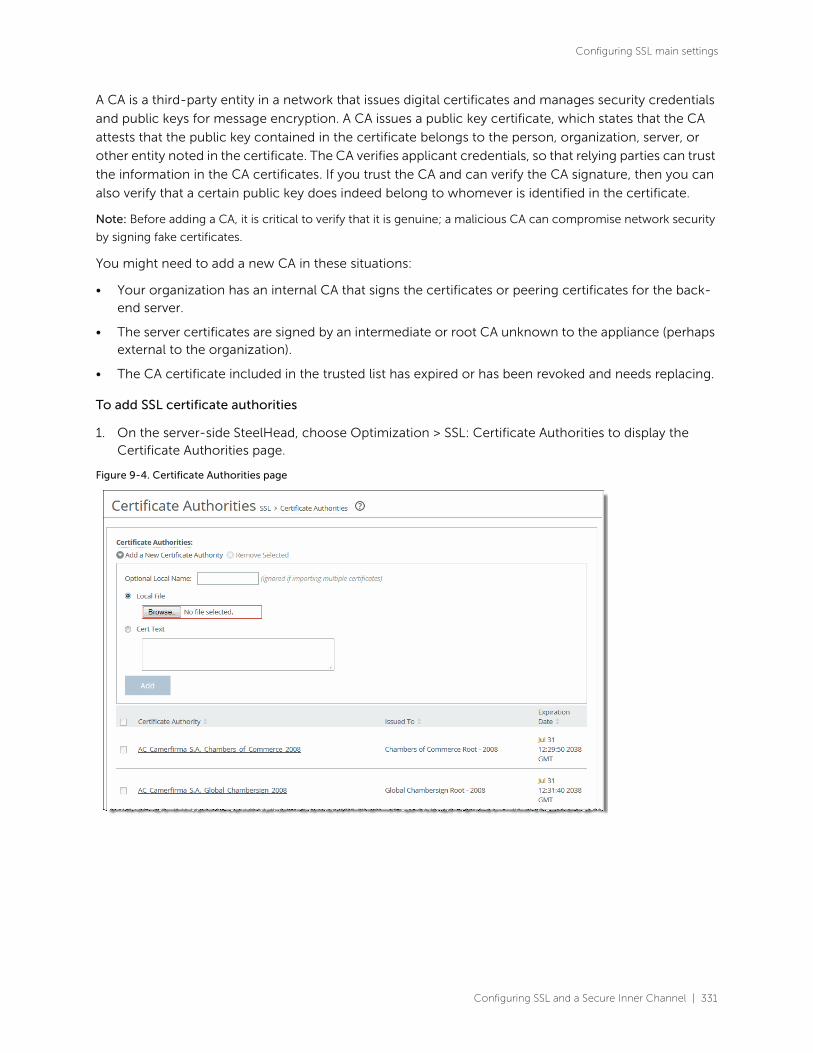
Configuring SSL and a Secure Inner Channel | 331
Configuring SSL main settings
A CA is a third-party entity in a network that issues digital certificates and manages security credentials
and public keys for message encryption. A CA issues a public key certificate, which states that the CA
attests that the public key contained in the certificate belongs to the person, organization, server, or
other entity noted in the certificate. The CA verifies applicant credentials, so that relying parties can trust
the information in the CA certificates. If you trust the CA and can verify the CA signature, then you can
also verify that a certain public key does indeed belong to whomever is identified in the certificate.
Note: Before adding a CA, it is critical to verify that it is genuine; a malicious CA can compromise network security
by signing fake certificates.
You might need to add a new CA in these situations:
• Your organization has an internal CA that signs the certificates or peering certificates for the back-end server.
• The server certificates are signed by an intermediate or root CA unknown to the appliance (perhaps external to the organization).
• The CA certificate included in the trusted list has expired or has been revoked and needs replacing.
To add SSL certificate authorities
1. On the server-side SteelHead, choose Optimization > SSL: Certificate Authorities to display the Certificate Authorities page.
Figure 9-4. Certificate Authorities page

332 | Configuring SSL and a Secure Inner Channel
Configuring SSL main settings
2. Under Certificate Authorities, complete the configuration as described in this table.
3. Select the Certificate Authority name to display details.
Modifying SSL server certificate settings
After initial SSL server configuration, you can modify server certificate settings in the Optimization > SSL
Main Settings page. You can remove a server certificate, view the server certificate details, change the
server certificate and private key, export a certificate, or generate a CSR.
For details about initial SSL server configuration, see “Configuring SSL main settings” on page 325.
Note: After initial configuration, you might need to generate a Certificate Signing Request and import a Certificate
Authority-signed certificate before activating the SSL server for optimization.
Removing or changing an SSL server certificate
This section describes how to remove or change an existing SSL server certificate.
To remove a server certificate
1. Choose Optimization > SSL: SSL Main Settings to display the SSL Main Settings page.
2. Under Bypassed SSL Servers, select the certificate name you want to remove and click Remove Selected.
To change an SSL server certificate
1. Choose Optimization > SSL: SSL Main Settings to display the SSL Main Settings page.
2. Under SSL Server Certificates, select the certificate name.
3. Click Modify.
Control Description
Add a New Certificate Authority Optional Local Name (ignored if importing multiple certificates) - Specify the local name.
Local File - Browse to the local certificate authority file.
Cert Text - Paste the certificate authority into the text box and click Add.
Add Adds the certificate authority.
Remove Selected Select the check box next to the name and click Remove Selected.

Configuring SSL and a Secure Inner Channel | 333
Configuring SSL main settings
4. Complete the configuration as described in this table.
Control Description
Rename Certificate Displays the controls to rename the certificate.
Name - Specify the new certificate name.
Change - Changes the certificate name.
Import Existing Private Key and CA-Signed Public Certificate (One File in PEM or PKCS12 formats)
Select this option if the existing private key and CA-signed certificate are located in one file. The page expands displaying Private Key and CA-Signed Public Certificate controls for browsing to the key and certificate files or a text box for copying and pasting the key and certificate.
The private key is required regardless of whether you are adding or updating.
Local File - Browse to the local file.
Text - Paste the content of the file.
Decryption Password - Specify the password used to decrypt, if necessary.
Change - Changes the settings.
Import Existing Private Keys and CA-Signed Public Certificate (Two Files in PEM or DER formats)
Select this option if the existing private key and CA-signed certificate are located in two files. The page expands displaying Private Key and CA-Signed Public Certificate controls for browsing to the key and certificate files or text boxes for copying and pasting the keys and certificates.
A private key is optional for existing server configurations.
Private Key Private Key Local File - Browse to the local file containing the private key.
Private Key Text - Paste the private key text.

334 | Configuring SSL and a Secure Inner Channel
Configuring SSL main settings
Exporting an SSL server certificate
This section describes how to export an existing certificate for an SSL server. For details about making
SSL server certificates nonexportable, see “To prevent exporting of SSL server certificates and private
keys” on page 330.
To export an SSL server certificate
1. Choose Optimization > SSL: SSL Main Settings to display the SSL Main Settings page.
2. Under SSL Server Certificates, select the certificate name.
3. To export an existing certificate, click Export and complete the configuration as described in this table. This option is unavailable if global exporting of SSL server certificates and private keys is disabled from the SSL Main Settings page.
CA-Signed Public Certificate Local File - Browse to the local file.
Cert Text - Paste the content of the certificate text file.
Decryption Password - Specify the password used to decrypt, if necessary.
Change - Changes the settings.
Generate New Private Key and Self-Signed Public Certificate
Select this option to generate a new private key and self-signed public certificate.
Cipher Bits - Select the key length from the drop-down list. The default value is 2048.
Common Name - Specify the domain name of the server.
Organization Name - Specify the organization name (for example, the company).
Organization Unit Name - Specify the organization unit name (for example, the section or department).
Locality - Specify the city.
State (no abbreviations) - Specify the state.
Country (2-letter code) - Specify the country (two-letter code only).
Email Address - Specify the email address of the contact person.
Validity Period (Days) - Specify how many days the certificate is valid.
Change - Changes the settings.
Control Description
Include Private Key Includes the private key in the export.
Control Description

Configuring SSL and a Secure Inner Channel | 335
Configuring SSL main settings
4. Click Apply to save your settings to the running configuration.
5. Click Save to save your settings permanently.
Generating a CSR
This section describes how to generate a Certificate Signing Request (CSR) for an existing SSL server off
the current private key.
To generate a CSR
1. Choose Optimization > SSL: SSL Main Settings to display the SSL Main Settings page.
2. Under SSL Server Certificates, select the certificate name.
3. Click Generate CSR and complete the configuration as described in this table.
4. Click Save to save the settings permanently.
Adding a chain certificate
This section describes how to add or remove a chain certificate for an existing SSL server.
To add a chain certificate
1. Choose Optimization > SSL: SSL Main Settings to display the SSL Main Settings page.
2. Under SSL Server Certificates, select the certificate name.
Password/Password Confirm Specify and confirm the encrypted password if you are including the private key (required if including the key). The password must be at least four characters.
Export Exports the SteelHead peering certificate and key.
Control Description
Common Name (required) Specify the common name (hostname) of the peer.
Organization Name Specify the organization name (for example, the company).
Organization Unit Name Specify the organization unit name (for example, the section or department).
Locality Specify the city.
State Specify the state. Do not abbreviate.
Country (2-letter code) Specify the country (two-letter code only).
Email Address Specify the email address of the contact person.
Generate CSR Generates the Certificate Signing Request.
Control Description
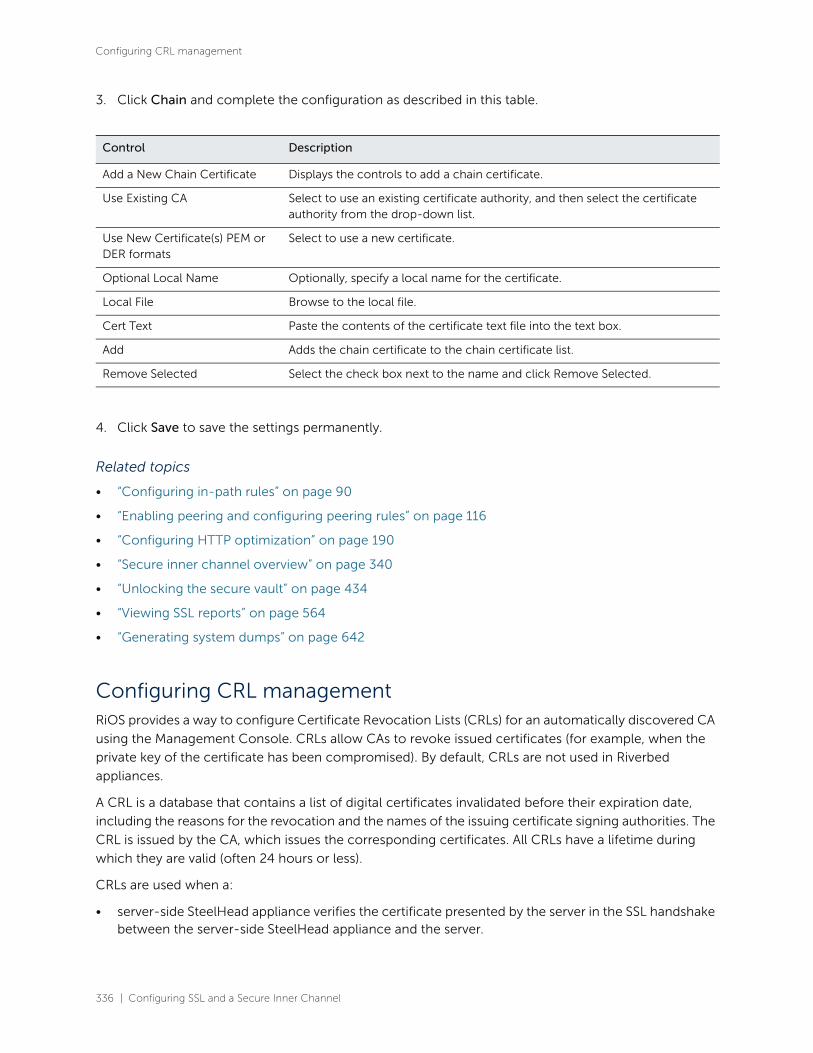
336 | Configuring SSL and a Secure Inner Channel
Configuring CRL management
3. Click Chain and complete the configuration as described in this table.
4. Click Save to save the settings permanently.
Related topics
• “Configuring in-path rules” on page 90
• “Enabling peering and configuring peering rules” on page 116
• “Configuring HTTP optimization” on page 190
• “Secure inner channel overview” on page 340
• “Unlocking the secure vault” on page 434
• “Viewing SSL reports” on page 564
• “Generating system dumps” on page 642
Configuring CRL management RiOS provides a way to configure Certificate Revocation Lists (CRLs) for an automatically discovered CA
using the Management Console. CRLs allow CAs to revoke issued certificates (for example, when the
private key of the certificate has been compromised). By default, CRLs are not used in Riverbed
appliances.
A CRL is a database that contains a list of digital certificates invalidated before their expiration date,
including the reasons for the revocation and the names of the issuing certificate signing authorities. The
CRL is issued by the CA, which issues the corresponding certificates. All CRLs have a lifetime during
which they are valid (often 24 hours or less).
CRLs are used when a:
• server-side SteelHead appliance verifies the certificate presented by the server in the SSL handshake between the server-side SteelHead appliance and the server.
Control Description
Add a New Chain Certificate Displays the controls to add a chain certificate.
Use Existing CA Select to use an existing certificate authority, and then select the certificate authority from the drop-down list.
Use New Certificate(s) PEM or DER formats
Select to use a new certificate.
Optional Local Name Optionally, specify a local name for the certificate.
Local File Browse to the local file.
Cert Text Paste the contents of the certificate text file into the text box.
Add Adds the chain certificate to the chain certificate list.
Remove Selected Select the check box next to the name and click Remove Selected.

Configuring SSL and a Secure Inner Channel | 337
Configuring CRL management
• server-side SteelHead appliance verifies the certificate presented by the client-side appliance in the handshake between the two SteelHead appliances for establishing a secure inner channel over the WAN.
• client-side appliance verifies the certificate presented by the server-side SteelHead appliance in the handshake between the two appliances for establishing a secure inner channel over the WAN.
The two types of CAs issuing CRLs are:
• conventional CAs, which are listed in the Certificate Authorities page.
• peering CAs, which are listed in the Trusted Entities list in the Secure Peering page.
You configure each type of CA separately.
Note: Currently, Riverbed appliances only support downloading CRLs from Lightweight Directory Access Protocol
(LDAP) servers.
To enable CRL management
1. On the server-side SteelHead, choose Optimization > SSL: CRL Management to display the CRL Management page.
Figure 9-5. CRL Management page

338 | Configuring SSL and a Secure Inner Channel
Configuring CRL management
2. Under CRL Settings, complete the configuration as described in this table.
3. Click Apply to save your settings to the running configuration.
4. Click Save to save your settings permanently.
Managing CRL distribution points
You can view, override, or remove CRL distribution points (CDPs) for CAs in the Optimization > CRL
Management page.
A CDP is a field within a certificate containing information that describes where to retrieve the CRL for
the certificate.
To view a list of CDPs for a CA
1. On the server-side SteelHead, choose Optimization > SSL: CRL Management to display the CRL Management page.
2. Select the CAs tab to view conventional CAs or the Peering CAs tab to view secure CAs.
Control Description
Enable Automatic CRL Polling for CAs
Enables CRL polling and use of a CRL in handshake verifications of CA certificates. Currently, the SteelHead only supports downloading CRLs from Lightweight Directory Access Protocol (LDAP) servers.
Enable Automatic CRL Polling for Peering CAs
Configures a CRL for an automatically discovered peering CA.
Fail Handshakes If A Relevant CRL Cannot Be Found
Configures handshake behavior for a CRL. Fails the handshake verification if a relevant CRL for either a peering or server certificate can’t be found.
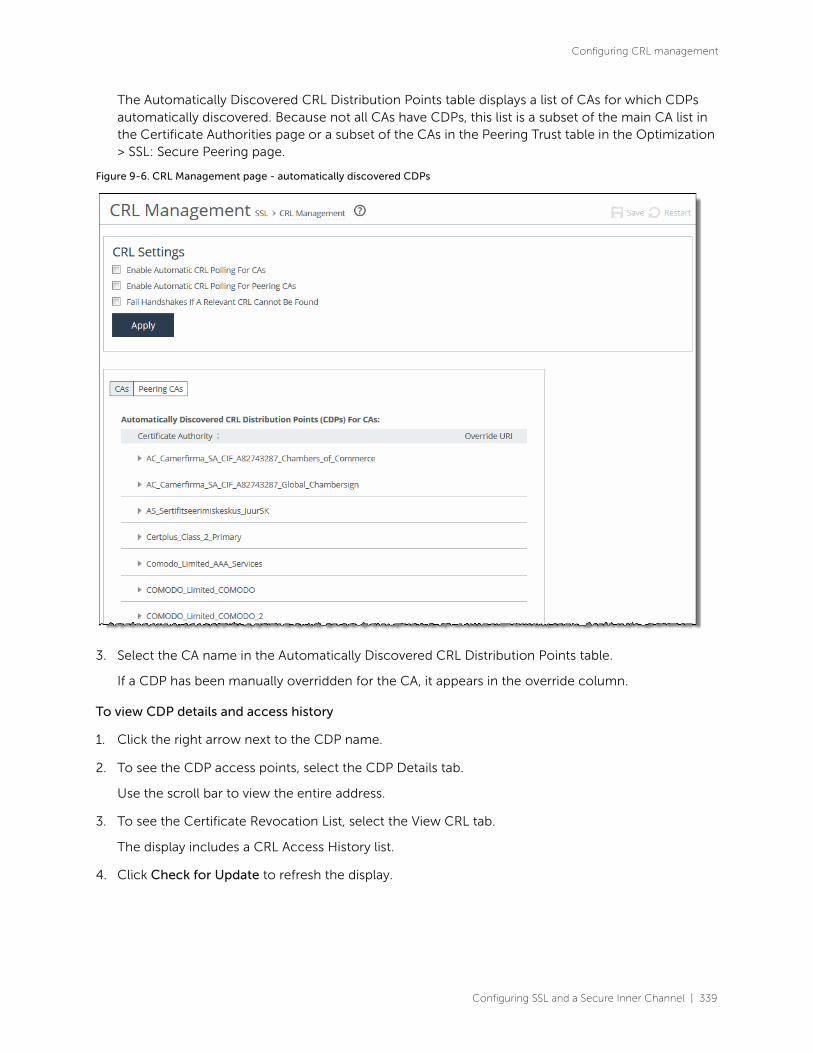
Configuring SSL and a Secure Inner Channel | 339
Configuring CRL management
The Automatically Discovered CRL Distribution Points table displays a list of CAs for which CDPs automatically discovered. Because not all CAs have CDPs, this list is a subset of the main CA list in the Certificate Authorities page or a subset of the CAs in the Peering Trust table in the Optimization > SSL: Secure Peering page.
Figure 9-6. CRL Management page - automatically discovered CDPs
3. Select the CA name in the Automatically Discovered CRL Distribution Points table.
If a CDP has been manually overridden for the CA, it appears in the override column.
To view CDP details and access history
1. Click the right arrow next to the CDP name.
2. To see the CDP access points, select the CDP Details tab.
Use the scroll bar to view the entire address.
3. To see the Certificate Revocation List, select the View CRL tab.
The display includes a CRL Access History list.
4. Click Check for Update to refresh the display.
340 | Configuring SSL and a Secure Inner Channel
Configuring secure peers
To override an existing CDP
Perform this task to manually override the existing CDP for a certificate with an LDAP server
specification.
1. Click Add Manual Override.
2. Select a CA name from the drop-down list.
3. Specify the CDP Uniform Resource Indicator (URI) for an LDAP server. For example:
http://ca.actalis.it/crl/root/getCRL
4. Click Add.
Configuring secure peers You configure secure peers in the Optimization > SSL: Secure Peering (SSL) page. Secure, encrypted
peering extends beyond traditional SSL traffic encryption. In addition to SSL-based traffic like HTTPS that
always needs a secure connection between the client-side appliance and the server-side SteelHead, you
can also secure other types of traffic such as:
• MAPI-encrypted, SMB1, and SMB2-signed traffic.
• Citrix traffic.
• all other traffic that inherently does not require a secure connection.
In RiOS 9.0, SSL secure peering and secure transport traffic can coexist.
Secure inner channel overview
Each appliance is manufactured with its own self-signed certificate and private key, which uniquely
identify that appliance. The secure inner channel setup process begins with the peer appliances
authenticating each other by exchanging certificates and negotiating a separate encryption key for each
intercepted connection. Next, the appliances create corresponding inner connections for all outer
connections between the client and the client-side appliance and between the server and the server-
side SteelHead.
Peers are detected the first time a client-side appliance attempts to connect to the server. The
optimization service bypasses this initial connection and does not perform data reduction, but rather
uses it to detect peers and populate the peer entry tables. On both appliances, an entry appears in a
peering list with the certificate of the other peer and identifying information such as IP address and
hostname. You can then accept or decline the trust relationship with each appliance requesting a secure
inner channel.
After the appliances trust each other, they send encrypted data between themselves over secure inner
connections matching the outer connections of the selected traffic types. The trust relationship
between the appliances is bidirectional; the client-side appliance trusts the server-side SteelHead, and
vice versa.
We recommend using the secure inner channel in place of IPSec encryption to secure traffic.

Configuring SSL and a Secure Inner Channel | 341
Configuring secure peers
Enabling secure peers
This section describes how to secure traffic between client-side appliances and server-side SteelHeads.
Note: You rarely need to replace a self-signed certificate on a SteelHead; however, if you do, add the CA’s certificate
to the peering trust section so each SteelHead can verify the peer certificate for its peers. For details, see
“Configuring peer trust” on page 344.
To enable secure peering
1. If you are securing encrypted MAPI traffic or Citrix traffic, enable one of these settings on both the server-side and client-side appliances:
– Choose Optimization > Protocols: MAPI and select Enable Encrypted Optimization.
—or—
– Choose Optimization > Protocols: Citrix and select Enable SecureICA Encryption. Both appliances must be running RiOS 7.0 or later.
If you are securing SMB-signed traffic, choose Optimization > Protocols: CIFS and select Enable SMB Signing on the server-side SteelHead.
2. We recommend using NTP time synchronization or manually synchronizing the clocks on both the server-side SteelHead and client-side appliances. It is critical that the peer appliance time is the same for the trust relationship to work.

342 | Configuring SSL and a Secure Inner Channel
Configuring secure peers
3. On both the server-side SteelHeads and client-side appliances, choose Optimization > SSL: Secure Peering (SSL) to display the Secure Peering (SSL) page.
Figure 9-7. Secure Peering (SSL) page
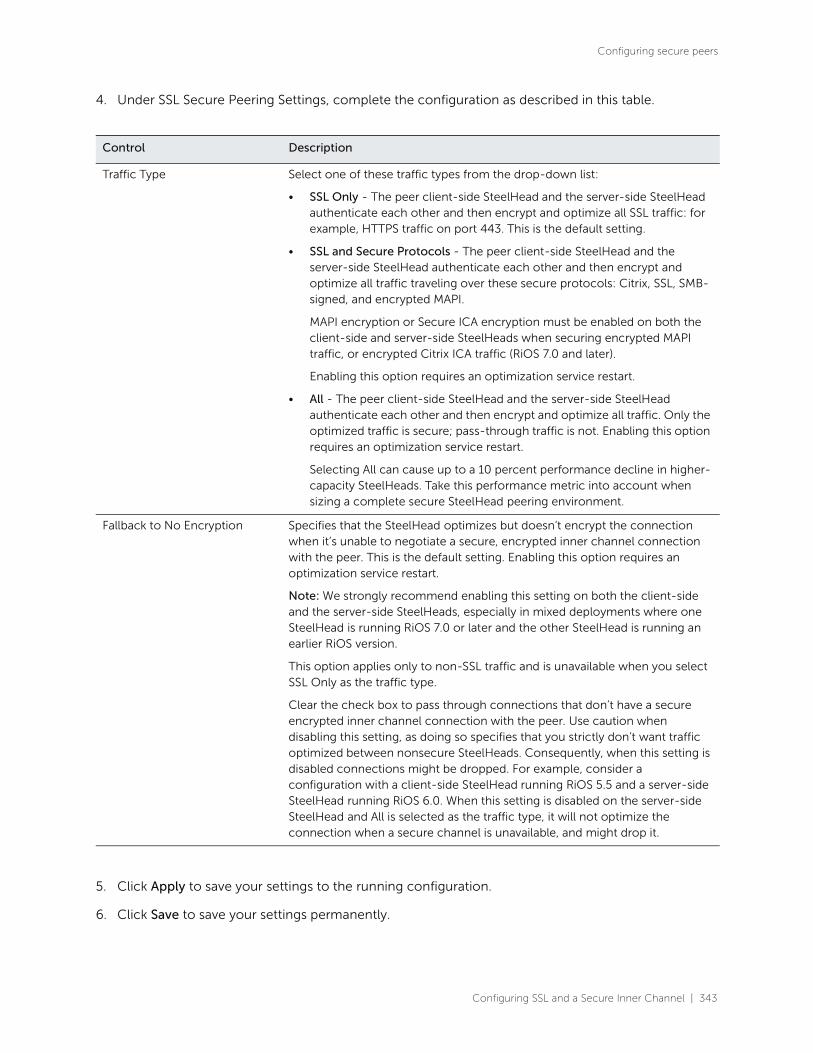
Configuring SSL and a Secure Inner Channel | 343
Configuring secure peers
4. Under SSL Secure Peering Settings, complete the configuration as described in this table.
5. Click Apply to save your settings to the running configuration.
6. Click Save to save your settings permanently.
Control Description
Traffic Type Select one of these traffic types from the drop-down list:
• SSL Only - The peer client-side SteelHead and the server-side SteelHead authenticate each other and then encrypt and optimize all SSL traffic: for example, HTTPS traffic on port 443. This is the default setting.
• SSL and Secure Protocols - The peer client-side SteelHead and the server-side SteelHead authenticate each other and then encrypt and optimize all traffic traveling over these secure protocols: Citrix, SSL, SMB-signed, and encrypted MAPI.
MAPI encryption or Secure ICA encryption must be enabled on both the client-side and server-side SteelHeads when securing encrypted MAPI traffic, or encrypted Citrix ICA traffic (RiOS 7.0 and later).
Enabling this option requires an optimization service restart.
• All - The peer client-side SteelHead and the server-side SteelHead authenticate each other and then encrypt and optimize all traffic. Only the optimized traffic is secure; pass-through traffic is not. Enabling this option requires an optimization service restart.
Selecting All can cause up to a 10 percent performance decline in higher-capacity SteelHeads. Take this performance metric into account when sizing a complete secure SteelHead peering environment.
Fallback to No Encryption Specifies that the SteelHead optimizes but doesn’t encrypt the connection when it’s unable to negotiate a secure, encrypted inner channel connection with the peer. This is the default setting. Enabling this option requires an optimization service restart.
Note: We strongly recommend enabling this setting on both the client-side and the server-side SteelHeads, especially in mixed deployments where one SteelHead is running RiOS 7.0 or later and the other SteelHead is running an earlier RiOS version.
This option applies only to non-SSL traffic and is unavailable when you select SSL Only as the traffic type.
Clear the check box to pass through connections that don’t have a secure encrypted inner channel connection with the peer. Use caution when disabling this setting, as doing so specifies that you strictly don’t want traffic optimized between nonsecure SteelHeads. Consequently, when this setting is disabled connections might be dropped. For example, consider a configuration with a client-side SteelHead running RiOS 5.5 and a server-side SteelHead running RiOS 6.0. When this setting is disabled on the server-side SteelHead and All is selected as the traffic type, it will not optimize the connection when a secure channel is unavailable, and might drop it.

344 | Configuring SSL and a Secure Inner Channel
Configuring secure peers
7. If you have changed an encryption setting, you need to restart the optimization service. For details, see “Starting and stopping the optimization service” on page 403.
Note: The SteelHead supports RSA private keys for peers and SSL servers.
Configuring peer trust
The first time a client-side appliance attempts to connect to the server, the optimization service detects
peers and populates the peer entry tables. On both appliances, an entry appears in a peering list with the
information and certificate of the other peer. A peer list provides you with the option of accepting or
declining the trust relationship with each appliance requesting a secure inner channel. The self-signed
peer lists are designated by these color categories:
• White - Lists all trusted appliances. When you select Trust for a peer in a black or gray list, the public key of the peer is copied into the white list of the local trusted host. The list includes the peer expiration date, IP address, and hostname.
• Black - Lists all untrusted appliances. When you select Do Not Trust for a peer in a white or gray list, the public key of the peer is copied into the black list of the local untrusted host. The list includes the peer expiration date, IP address, and hostname.
• Gray - Lists all appliances of unknown status. This list serves as a temporary holding place for all discovered peers that are attempting to establish a secure inner channel. The list includes the peer expiration date, IP address, and hostname. You can select one of these actions to change the status of the peer and move it to the white or black lists: Trust, Do Not Trust, or Remove.
Note: When a self-signed peer has already been added to a peering trust list manually, the SSL server recognizes it
upon the first connection from that peer and automatically places it in the white list (without action by the
administrator). The certificate that was previously copied and pasted (or imported) into the trusted list is not
removed.
The Optimization > SSL: Secure Peering (SSL) page also provides you with these options for configuring
peer certificates and Mobile Controller trust:
• Peering Trust - Add and view these types of entities:
– Certificates of trusted peers.
– Certificates of trusted Certificate Authorities (CAs) that may sign certificates for peers.
• SCEP Peering Trust - Add and view trusted Simple Certificate Enrollment Protocol (SCEP) entities.
This list is a subset of the Peering Trust list, and it is used to tag certificates that can be used by SCEP. The SCEP Peering Trust must contain these types of entities:
– SCEP CA certificates
– The CA that was used to sign the Web Certificate for SCEP over HTTPS
• Mobile Trust - Add and view trusted SteelCentral Controller for SteelHead Mobile entities that may sign certificates for SteelHead Mobiles.
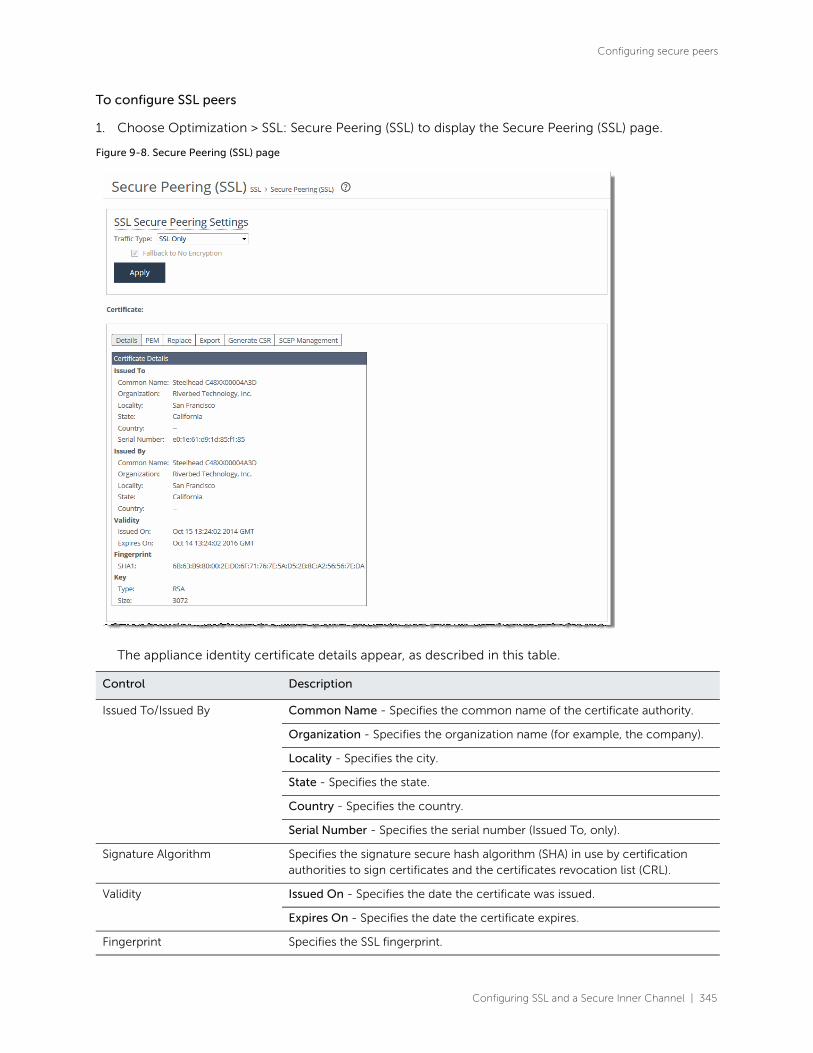
Configuring SSL and a Secure Inner Channel | 345
Configuring secure peers
To configure SSL peers
1. Choose Optimization > SSL: Secure Peering (SSL) to display the Secure Peering (SSL) page.
Figure 9-8. Secure Peering (SSL) page
The appliance identity certificate details appear, as described in this table.
Control Description
Issued To/Issued By Common Name - Specifies the common name of the certificate authority.
Organization - Specifies the organization name (for example, the company).
Locality - Specifies the city.
State - Specifies the state.
Country - Specifies the country.
Serial Number - Specifies the serial number (Issued To, only).
Signature Algorithm Specifies the signature secure hash algorithm (SHA) in use by certification authorities to sign certificates and the certificates revocation list (CRL).
Validity Issued On - Specifies the date the certificate was issued.
Expires On - Specifies the date the certificate expires.
Fingerprint Specifies the SSL fingerprint.

346 | Configuring SSL and a Secure Inner Channel
Configuring secure peers
2. To replace an existing certificate, under Certificate, select the Replace tab and complete the configuration as described in this table.
Key Type - Specifies the key type.
Size - Specifies the size in bytes.
Control Description
Import Certificate and Private Key
Imports the certificate and key.
The page displays controls for browsing to and uploading the certificate and key files. Or, you can use the text box to copy and paste a PEM file.
The private key is required regardless of whether you are adding or updating the certificate.
Certificate Upload - Browse to the local file in PKCS-12, PEM, or DER formats.
Paste it here (PEM) - Copy and then paste the contents of a PEM file.
Private Key Select the private key origin.
• The Private Key is in a separate file (see below) - you can either upload it or copy and paste it.
• This file includes the Certificate and Private Key
• The Private Key for this Certificate was created with a CSR generated on this appliance.
Separate Private Key Upload (PEM or DER formats) - Browse to the local file in PEM or DER formats.
Paste it here (PEM only) - Paste the contents of a PEM file.
Decryption Password - Specify the decryption password, if necessary. Passwords are required for PKCS-12 files, optional for PEM files, and never needed for DER files.
Generate Self-Signed Certificate and New Private Key
Select to generate a new private key and self-signed public certificate.
• Common Name (required) - Specify the hostname of the peer.
• Organization Name - Specify the organization name (for example, the company).
• Organization Unit Name - Specify the organization unit name (for example, the section or department).
• Locality - Specify the city.
• State (no abbreviations) - Specify the state.
• Country (2-letter code) - Specify the country (two-letter code only).
• Email Address - Specify the email address of the contact person.
• Validity Period (Days) - Specify how many days the certificate is valid. The default value is 730.
Control Description
Configuring SSL and a Secure Inner Channel | 347
Configuring secure peers
3. To export an existing certificate, under Certificate, select the Export tab and complete the configuration as described in this table.
4. To generate a CSR, under Certificate, select the Generate CSR tab and complete the configuration as described in this table.
Private Key Cipher Bits - Select the key length from the drop-down list. The default value is 2048.
Update Certificate Through SCEP Enrollment
Select to generate a private key and CSR using an SCEP responder. Select the SCEP Management tab to configure the SCEP responder.
Control Description
Include Private Key Includes the private key in the export.
Password/Password Confirm Specify and confirm the encrypted password if you are including the private key (required if including the key). The password must be at least four characters.
Export Exports the SteelHead peering certificate and key.
Control Description
Common Name (required) Specify the common name (hostname) of the peer.
Organization Name Specify the organization name (for example, the company).
Organization Unit Name Specify the organization unit name (for example, the section or department).
Locality Specify the city.
State Specify the state. Do not abbreviate.
Country (2-letter code) Specify the country (two-letter code only).
Email Address Specify the email address of the contact person.
Generate CSR Generates the Certificate Signing Request.
Control Description

348 | Configuring SSL and a Secure Inner Channel
Configuring secure peers
5. To use SCEP to manage the certificate, under Certificate, select the SCEP Management tab and complete the configuration as described in this table.
6. To add or remove a Trusted entity, under Peering Trust, complete the configuration as described in this table.
Control Description
URL Specify the URL of the SCEP responder. Use this format:
http://<host>/<path-to-service>
or
https://<host>/<path-to-service>
Example:
http://<ip-address>/certsrv/mscep/mscep.dll
RiOS 9.5 and later support HTTPS URLs for the SCEP responder. RiOS 8.5 and later support single-tier, two-tier, and three-tier hierarchies to validate the chain certificates it receives.
Maximum Number of Polls Specify the maximum number of polls before the SteelHead cancels the enrollment. The peering certificate is not modified. The default value is 5.
A poll is a request to the server for an enrolled certificate by the SteelHead. The SteelHead polls only if the server responds with pending. If the server responds with fail then the SteelHead doesn’t poll.
Poll Period Specify the poll frequency in minutes. The default value is 5.
Change Challenge Passphrase Specify the challenge password phrase.
Enable Auto Enrollment Enables automatic reenrollment of a certificate to be signed by a CA using SCEP.
• Expiration Threshold - Specify the amount of time (in days) to schedule reenrollment before the certificate expires. The range is from 1 to 60 days. The default value is 30 days.
Update SCEP Settings Updates the SCEP settings.
Control Description
Add a New Trusted Entity Displays the controls for adding trusted entities.
Trust Existing CA Select an existing CA from the drop-down list.
Trust New Certificate Adds a new CA or peer certificate. The SteelHead supports RSA and DSA for peering trust entities.
Optional Local Name Optionally, specify a local name for the entity (for example, the fully qualified domain name).
Local File Browse to the local file.
Cert Text Paste the content of the certificate text file into the text box.
Configuring SSL and a Secure Inner Channel | 349
Configuring secure peers
7. To add or remove an SCEP Trusted entity, under SCEP Peering Trust, complete the configuration as described in this table.
8. To add or remove a SteelCentral Controller for SteelHead Mobile trusted entity, under Mobile Trust, complete the configuration as described in this table.
9. To change the trust status of a self-signed peer and move it to another list, or to remove a peer from a list, click the down arrow in the Actions drop-down list and complete the configuration as described in this table.
Add Adds the trusted entity (or peer) to the trusted peers list.
Remove Selected Select the check box next to the name and click Remove Selected.
Control Description
Add a New SCEP Entity Displays the controls for adding a trusted SCEP entity.
Peering Trust Select a peering trust from the drop-down list.
Add Adds the trusted entity (or peer) to the trusted peers list.
Remove Selected Select the check box next to the name and click Remove Selected.
Control Description
Add a New Mobile Entity Displays the controls for adding a trusted SteelCentral Controller for SteelHead Mobile entity.
Optional Local Name Optionally, specify a local name for the entity (for example, the fully qualified domain name).
Local File Browse to the local file.
Cert Text Paste the content of the certificate text file into the text box.
Add Adds the trusted entity (or peer) to the trusted peers list.
Remove Selected Select the check box next to the name and click Remove Selected.
Control Description

350 | Configuring SSL and a Secure Inner Channel
Configuring secure peers
The white, gray, and black peering lists sort the peers by IP address.
Note: Before moving a peer from the gray list to the trusted peers white list, it is critical to verify that the certificate
fingerprint does indeed belong to a peer appliance, particularly to avoid the potential risk of a man-in-the-middle
attack.
Note: When the same certificate appears in both the trusted entity and a self-signed peer list, deleting the certificate
from one list automatically deletes it from the other.
10. Click Apply to save your settings to the running configuration.
11. Click Save to save your settings permanently.
12. Restart the optimization service. For details, see “Starting and stopping the optimization service” on page 403.
Verifying the secure inner channel connections
This section describes what happens when a secure inner channel cannot be established for traffic
between appliances and how to verify whether connections are using a secure inner channel.
When the appliances are configured to use secure inner channels for SSL traffic only or All optimized
traffic:
• The first connection that runs into a failure is passed through without optimization. This connection appears as established in the Current Connections report, but it is flagged with a red protocol error.
• For up to five minutes all follow-on or subsequent connections are passed through. These follow-on connections appear as pass-through in the Current Connections report. You can click the magnifying glass icon for details about the pass-through reason.
When the appliances are configured to use secure inner channels for SSL and Secure Protocols:
• The first secure protocol connection (either encrypted MAPI, SMB Signed, or Citrix) that runs into a failure is passed through without optimization if Fallback to No Encryption is disabled. See “Enabling secure peers” on page 341.
• The first SSL connection that runs into a failure is passed through without optimization. This connection appears as established in the Current Connections report, but it is flagged with a red protocol error.
• For up to five minutes all follow-on or subsequent connections are passed through.
Control Description
Trust Changes the peer SteelHead to a trusted entity. The SteelHead automatically finds all SteelHeads in your deployment and lists them in the gray list. When a self-signed peer becomes a trusted entity it moves to the white list.
Do Not Trust Changes the self-signed peer from a trusted entity to an untrusted entity. The SteelHead automatically finds all SteelHeads in your deployment and lists them by IP address in the gray list. When a self-signed peer becomes an untrusted entity it moves to the black list.
Remove Selected Select the check box next to the name and click Remove Selected.

Configuring SSL and a Secure Inner Channel | 351
Configuring advanced and SSL cipher settings
To verify that the secure inner channel is encrypting and optimizing traffic, choose Reports >
Networking: Current Connections. Look for the lock icon and three yellow arrows, which indicate the
connection is encrypted and optimized. If the lock icon is not visible, or is dimmed, click the connection
to view a failure reason that explains why the appliance is not encrypting the connection. If there is a red
protocol error, click the connection to view the reason for the error. For details, see “Viewing current
connection reports” on page 496 and “Verifying SSL and secure inner channel optimization” on
page 323.
Related topics
• “Configuring in-path rules” on page 90
• “Enabling peering and configuring peering rules” on page 116
• “Configuring CIFS optimization” on page 174
• “Configuring MAPI optimization” on page 206
• “Unlocking the secure vault” on page 434
• “Viewing SSL reports” on page 564
• “Generating system dumps” on page 642
Configuring advanced and SSL cipher settings This section describes the SSL advanced settings you can use to expedite SSL configurations, improve
performance for short-lived SSL connections, and configure SSL cipher settings. It includes these topics:
• “Setting advanced SSL options” on page 351
• “Configuring SSL cipher settings” on page 357
• “Performing bulk imports and exports” on page 359
Setting advanced SSL options
You can synchronize the SSL chain certificate configuration, configure SteelCentral Controller for
SteelHead Mobile for SSL, improve performance for SSL connection establishment, and enable client
certificate authentication in the Optimization > SSL: Advanced Settings page.

352 | Configuring SSL and a Secure Inner Channel
Configuring advanced and SSL cipher settings
To set advanced SSL options
1. Choose Optimization > SSL: Advanced Settings to display the Advanced Settings page.
Figure 9-9. Advanced Settings page

Configuring SSL and a Secure Inner Channel | 353
Configuring advanced and SSL cipher settings
2. Complete the configuration as described in this table.
Control Description
Enable SSL Server Certificate Chain Discovery
Synchronizes the chain certificate configuration on the server-side SteelHead with the chain certificate configuration on the back-end server. The synchronization occurs after a handshake fails between the client-side appliance and server-side SteelHead. By default, this option is disabled.
Enable this option when you replace an existing chain certificate on the back-end server with a new chain to ensure that the certificate chain remains in sync on both the server-side SteelHead and the back-end server.
Note: This option never replaces the server certificate. It updates the chain containing the intermediate certificates and the root certificate in the client context.
SteelHead Mobile Security Mode
On the server-side SteelHead, select one of these security modes:
• High Security Mode - Enforces the advanced SSL protocol on the SteelHead Mobile appliances for increased security.
• Mixed Security Mode - Allows SteelCentral Controller for SteelHead Mobile clients to run in any SSL mode. This mode is required to optimize with mobile clients running on VMware Fusion.
Note: This option does not affect SteelHead-to-SteelHead operation.
Enable Distributed SSL Termination
Enables reuse of the original session on a client-side appliance when the client reconnects to an SSL server. Reusing the session provides two benefits: it lessens the CPU load because it eliminates expensive asymmetric key operations and it shortens the key negotiation process by avoiding WAN roundtrips to the server. By default, this option is enabled. Both the client-side appliance and server-side SteelHead must be configured to optimize SSL traffic.
• Timeout - Specify the amount of time the client can reuse a session with an SSL server after the initial connection ends. The range is from 0.1 to 24 hours. The default value is 10 hours.
Enabling this option requires an optimization service restart.

354 | Configuring SSL and a Secure Inner Channel
Configuring advanced and SSL cipher settings
Enable Client Certificate Support
Enables acceleration of SSL traffic to those SSL servers that authenticate SSL clients. The SSL server verifies the SSL client certificate. In the client authentication SSL handshake, each client has a unique client certificate and the SSL server, in most cases, maintains the state that is specific to each client when answering the client's requests. The SSL server must receive exactly the same certificate that is originally issued for a client on all the connections between the client and the server. Typically the client's unique certificate and private key are stored on a smart card, such as a Common Access Card (CAC), or on a similar location that is inaccessible to other devices on the network.
By default, client authentication is disabled.
Enabling the client authentication feature allows appliances to compute the encryption key while the SSL server continues to authenticate the original SSL client exactly as it would without the appliances. The server-side SteelHead observes the SSL handshake messages as they go back and forth. With access to the SSL server's private key, the SteelHead computes the session key exactly as the SSL server does. The SSL server continues to perform the actual verification of the client, so any dependencies on the uniqueness of the client certificate for correct operation of the application are met. Because the SteelHead does not modify any of the certificates (or the handshake messages) exchanged between the client and the server, there is no change to their trust model. The client and server continue to trust the same set of certificate authorities as they did without the appliances accelerating their traffic.
Note: If the data center has a mixed environment with a few SSL servers that authenticate clients along with those that do not authenticate clients, we recommend enabling client authentication.
Requirements
• Both the client-side appliance and the server-side SteelHead must be running RiOS 6.5 or later.
• Enable client certificate support on the server-side SteelHead.
• The server-side SteelHead must have access to the exact private key used by the SSL server.
• The SSL server must be configured to ask for client certificates.
• The SteelHead must have a compatible cipher chosen by the server.
• SSL sessions that reuse previous secrets that are unknown to the SteelHead cannot be decrypted.
• Client-side certificates with renegotiation handshakes are not supported.
• Client certificate supports the RSA key exchange only. It does not support the Diffie-Hellman key exchange.
Basic Steps
The basic steps to enable client authentication are:
1. Perform the basic steps to enable SSL optimization (described in Configuring SSL Server Certificates and Certificate Authorities).
2. On the server-side SteelHead, choose Optimization > SSL: Advanced Settings, select Enable Client Certificate Support, and click Apply.
3. Choose Optimization > SSL: SSL Main Settings, import the private key and certificate used by the SSL server to the server-side SteelHead, and click Save to save the configuration. You do not need to restart the optimization service.
Control Description
Configuring SSL and a Secure Inner Channel | 355
Configuring advanced and SSL cipher settings
Verification
To verify client authentication, on the server-side SteelHead, check the Discovered Server (Optimizable) table in the Optimization > SSL: SSL Main Settings page. Optimizable servers that are using client authentication appear as optimizable. For servers that are not using client authentication, the server appears in the Discovered Server (bypassed, not optimizable) table with the reason No proxy certificate configured for the server.
Enable SSL Proxy Support
Enable this control on both the client-side appliance and server-side SteelHead when clients are communicating with SSL to a server through one or more proxies. Proxy support allows the appliance to optimize traffic to a proxy server.
SSL traffic communication with a proxy initiates with an HTTP CONNECT message. The appliance recognizes the HTTP CONNECT message in the connection, extracts the hostname, and then optimizes the SSL connection that follows into the proxy state machine (expecting an SSL handshake following the CONNECT message).
In addition to enabling this feature on both appliances, you must:
• create an in-path rule on the client-side appliance to identify the proxy server IP address and port number. Select the SSL preoptimization policy for the rule.
• enable SSL optimization on both the client-side appliance and server-side SteelHead.
• ensure the server-side SteelHead is running RiOS 7.0 or later.
• restart the optimization service on both appliances.
By default, SSL proxy support is disabled.
When the appliance connects, the proxy servers appear in the SSL Main Settings page on the server-side SteelHead in the Discovered SSL Server (Optimizable) list. The same IP address appears on multiple lines, followed by the word proxy. The hostname of the back-end server appears in the Server Common Name field. All subsequent connections to the proxy servers are optimized.
When an error occurs, the proxy servers appear in the SSL Main Settings page on the server-side SteelHead in the Discovered Servers (bypassed, not optimized) list. The same IP address appears on multiple lines, followed by the word proxy. The hostname of the back-end server appears in the Server Common Name field. All subsequent connections to the servers are not optimized.
If you disable proxy support, you must delete the corresponding in-path rule and restart the optimization service.
Control Description

356 | Configuring SSL and a Secure Inner Channel
Configuring advanced and SSL cipher settings
Enable Midsession SSL Enable this control on both the client-side appliance and server-side SteelHead when there is a delayed start to the Transport Layer Security (TLS) handshake because clients are transitioning into SSL after the initial handshake occurs. This feature optimizes connections that transition into SSL.
Client examples include SMTP/POP/IMAP-over-TLS and Microsoft .NET Windows Communication Foundation (WCF)-based TLS applications. This feature also enables SSL communication with protocols like Exchange-Hub to Exchange-Hub replications (for example, the SMTP-over-TLS protocol).
For details on SMTP over TLS Optimization, see the SteelHead Deployment Guide - Protocols.
The SteelHead looks for an SSL handshake for the life of the connection, and then optimizes the SSL connection that follows (except for an SSL handshake following the HTTP CONNECT message, in which case the SSL proxy support feature needs to be enabled).
After enabling this feature on both appliances you must restart the optimization service.
When the SteelHead connects, the servers appear in the SSL Main Settings page on the server-side SteelHead in the Discovered SSL Server (Optimizable) list. All subsequent connections to the servers are optimized.
By default, midsession SSL is disabled.
Requirements:
• The SSL client must be the same as the TCP client.
• SSL messages cannot be wrapped with any other non-SSL or non-TCP protocol headers or footers.
• SSL optimization must be enabled on both the client-side appliance and server-side SteelHead.
Control Description

Configuring SSL and a Secure Inner Channel | 357
Configuring advanced and SSL cipher settings
3. Click Apply to apply your settings.
4. Click Save to save your settings permanently.
5. If you have enabled Client Side Session Reuse, SSL Proxy Support, Midsession SSL, or SNI, you must restart the optimization service. For details, see “Starting and stopping the optimization service” on page 403.
Note: For details about SteelCentral Controller for SteelHead Mobile security mode and client-side session reuse,
see the SteelHead Deployment Guide - Protocols.
Configuring SSL cipher settings
You configure SSL cipher settings in the Optimization > SSL: Advanced Settings page.
Note: Unless you have specific organizational requirements, typically you do not need to change SSL cipher settings.
In cryptography, a cipher is an algorithm for performing encryption and decryption. In RiOS, the types
of ciphers are:
• Server ciphers - communicate with the server on the segment between the server-side SteelHead and the SSL server.
Enable SNI Enable this control on the server-side SteelHead while using name-based virtual hosts with SSL. Server name indication (SNI) is a transport layer security extension to the SSL protocol. With SNI, the first SSL client hello handshake message sent to the HTTPS server includes the requested virtual hostname to which the client is connecting. Because the server is aware of the hostname, it returns a host-specific security certificate.
Without SNI, an HTTPS server returns a default certificate that satisfies hostnames for all virtual hosts. The SSL connection setup uses the default virtual host configuration for the address where the connection was received. Browser messages warn that certificates have the wrong hostname.
With SNI enabled, RiOS provides the hostname. Knowing the hostname enables the server to determine the correct named virtual host for the request and set up the connection accordingly from the start.
The browser validates the certificate names against the requested URL, and the server-side SteelHead verifies that the selected proxy certificate is compatible with the client hostname. This verification ensures that the browser does not reject the proxy certificate for the server-side SteelHead.
If SNI provides a hostname that does not exactly match the common name or any of the subject alternate names for the certificate on the server-side SteelHead, the system determines that a valid certificate is not present and bypasses that hostname.
No configuration is necessary on the client-side appliance.
The client browser must also support SNI.
Control Description

358 | Configuring SSL and a Secure Inner Channel
Configuring advanced and SSL cipher settings
• Client ciphers - communicate with the client on the segment between the client-side appliance and the SSL client. Although this segment does not include the server-side SteelHead, you must configure the client ciphers on the server-side SteelHead, because the server-side SteelHead actually handles the SSL handshake with the SSL client.
• Peer ciphers - communicate between the two SteelHeads.
The default cipher setting is DEFAULT, which represents a variety of high-strength ciphers that allow for
compatibility with many browsers and servers.
Use the default cipher configuration to limit the possible ciphers that are negotiated on the three parts
of the secure inner channel connection (the client-to-SteelHead, the server-to-SteelHead, and
SteelHead-to-SteelHead).
To configure SSL ciphers
1. Choose Optimization > SSL: Advanced Settings to display the Advanced Settings page.
2. Under Peer Ciphers, complete the configuration on both the client-side appliance and server-side SteelHead, as described in this table.
3. On the server-side SteelHead, under Client Ciphers, you can add or remove a client or peer cipher by completing the configuration as described in these tables.
Control Description
Add a New Peer Cipher Displays the controls for adding a new peer cipher.
Cipher Select the cipher type for communicating with peers from the drop-down list. The Hint text box displays information about the cipher.
You must specify at least one cipher for peers, clients, and servers for SSL to function properly.
The default cipher setting is DEFAULT, which represents a variety of high-strength ciphers that allow for compatibility with many browsers and servers.
Insert Cipher At Select Start, End, or the cipher number from the drop-down list. The default cipher, if used, must be rule number 1.
Add Adds the cipher to the list.
Remove Selected Select the check box next to the name and click Remove Selected.
Control Description
Add a New Client Cipher Displays the controls for adding a new client cipher.
Cipher Select the cipher type for communicating with clients from the drop-down list. The Hint text box displays information about the cipher.
You must specify at least one cipher for peers, clients, and servers for SSL to function properly.
The default cipher setting is DEFAULT. which represents a variety of high- strength ciphers that allow for compatibility with many browsers and servers.

Configuring SSL and a Secure Inner Channel | 359
Configuring advanced and SSL cipher settings
4. On the server-side SteelHead, you can add or remove a server cipher by completing the configuration as described in this table.
5. Click Show Effective Overall Cipher List to display a list of ciphers.
Related topics
• “Configuring in-path rules” on page 90
• “Enabling peering and configuring peering rules” on page 116
• “Configuring HTTP optimization” on page 190
• “Viewing SSL reports” on page 564
• “Generating system dumps” on page 642
• “Unlocking the secure vault” on page 434
Performing bulk imports and exports
You can perform bulk import and export operations in the Optimization > SSL: Advanced Settings page.
These import and export features expedite configuring backup and peer trust relationships:
Insert Cipher At Select Start, End, or a cipher number from the drop-down list. The default cipher, if used, must be rule number 1.
Add Adds the cipher to the list.
Cancel Cancels your settings.
Removed Selected Select the check box next to the name and click Remove Selected.
Control Description
Add a New Server Cipher Displays the controls for adding a new server cipher.
Cipher Select the cipher type for communicating with servers from the drop-down list. The Hint text box displays information about the cipher.
You must specify at least one cipher for peers, clients, and servers for SSL to function properly.
The default cipher setting is DEFAULT, which represents a variety of high- strength ciphers that are compatible with many browsers and servers.
Insert Cipher At Select Start, End, or a cipher number from the drop-down list. The default cipher, if used, must be rule number 1.
Add Adds the cipher to the list.
Cancel Cancels your settings.
Removed Selected Select the check box next to the name and click Remove Selected.
Control Description
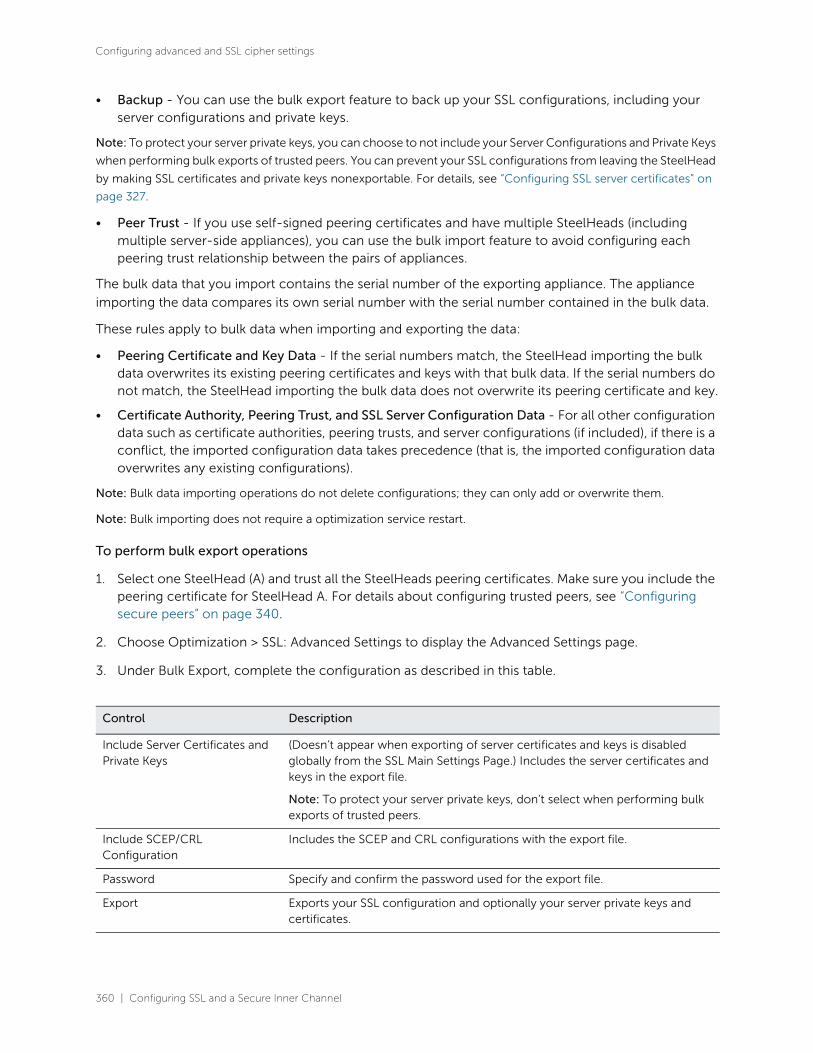
360 | Configuring SSL and a Secure Inner Channel
Configuring advanced and SSL cipher settings
• Backup - You can use the bulk export feature to back up your SSL configurations, including your server configurations and private keys.
Note: To protect your server private keys, you can choose to not include your Server Configurations and Private Keys
when performing bulk exports of trusted peers. You can prevent your SSL configurations from leaving the SteelHead
by making SSL certificates and private keys nonexportable. For details, see “Configuring SSL server certificates” on
page 327.
• Peer Trust - If you use self-signed peering certificates and have multiple SteelHeads (including multiple server-side appliances), you can use the bulk import feature to avoid configuring each peering trust relationship between the pairs of appliances.
The bulk data that you import contains the serial number of the exporting appliance. The appliance
importing the data compares its own serial number with the serial number contained in the bulk data.
These rules apply to bulk data when importing and exporting the data:
• Peering Certificate and Key Data - If the serial numbers match, the SteelHead importing the bulk data overwrites its existing peering certificates and keys with that bulk data. If the serial numbers do not match, the SteelHead importing the bulk data does not overwrite its peering certificate and key.
• Certificate Authority, Peering Trust, and SSL Server Configuration Data - For all other configuration data such as certificate authorities, peering trusts, and server configurations (if included), if there is a conflict, the imported configuration data takes precedence (that is, the imported configuration data overwrites any existing configurations).
Note: Bulk data importing operations do not delete configurations; they can only add or overwrite them.
Note: Bulk importing does not require a optimization service restart.
To perform bulk export operations
1. Select one SteelHead (A) and trust all the SteelHeads peering certificates. Make sure you include the peering certificate for SteelHead A. For details about configuring trusted peers, see “Configuring secure peers” on page 340.
2. Choose Optimization > SSL: Advanced Settings to display the Advanced Settings page.
3. Under Bulk Export, complete the configuration as described in this table.
Control Description
Include Server Certificates and Private Keys
(Doesn’t appear when exporting of server certificates and keys is disabled globally from the SSL Main Settings Page.) Includes the server certificates and keys in the export file.
Note: To protect your server private keys, don’t select when performing bulk exports of trusted peers.
Include SCEP/CRL Configuration
Includes the SCEP and CRL configurations with the export file.
Password Specify and confirm the password used for the export file.
Export Exports your SSL configuration and optionally your server private keys and certificates.

Configuring SSL and a Secure Inner Channel | 361
Configuring advanced and SSL cipher settings
4. Click Save to save your settings permanently.
To perform bulk import operations
1. Choose Optimization > SSL: Advanced Settings to display the Advanced Settings page.
Figure 9-10. Advanced Settings page
2. Under Bulk Import, complete the configuration as described in this table.
3. Click Save to save your settings permanently.
Related topics
• “Configuring in-path rules” on page 90
• “Enabling peering and configuring peering rules” on page 116
• “Configuring HTTP optimization” on page 190
• “Unlocking the secure vault” on page 434
• “Viewing SSL reports” on page 564
• “Generating system dumps” on page 642
Control Description
Upload File Browse to the previously exported bulk file that contains the certificates and keys.
Password to Decrypt Specify the password used to decrypt the file.
Import Imports your SSL configuration, keys, and certificates, so that all of the SteelHeads trust one another as peers.

362 | Configuring SSL and a Secure Inner Channel
Configuring advanced and SSL cipher settings

Configuring Network Integration Features | 363
10
Configuring Network Integration Features
This chapter describes how to configure advanced features such as asymmetric routing, connection
forwarding, encryption, flow export, joining a Windows domain, simplified routing, and WCCP.
This chapter includes these topics:
• “Configuring asymmetric routing features” on page 363
• “Configuring connection forwarding features” on page 366
• “Configuring IPSec encryption” on page 370
• “Configuring subnet side rules” on page 373
• “Configuring flow statistics” on page 375
• “Joining a Windows domain or workgroup” on page 382
• “Configuring simplified routing features” on page 390
• “Configuring WCCP” on page 392
• “Configuring hardware-assist rules” on page 399
For details about basic and advanced deployment types, see the SteelHead Deployment Guide.
Configuring asymmetric routing featuresYou enable asymmetric route detection in the Networking > Networking Integration: Asymmetric
Routing page.
Asymmetric route detection automatically detects and reports asymmetric routing conditions and
caches this information to avoid losing connectivity between a client and a server.
Asymmetric routing is when a packet takes one path to the destination and takes another path when
returning to the source. Asymmetric routing is common within most networks; the larger the network,
the more likely there is asymmetric routing in the network.
The asymmetric routing feature is compatible with IPv6.

364 | Configuring Network Integration Features
Configuring asymmetric routing features
Asymmetric routing is undesirable for many network devices including, firewalls, VPNs, and RiOS
appliances. These devices all rely on seeing every packet to function properly. When RiOS appliances are
deployed in a network, all TCP traffic must flow through the same appliances in the forward and reverse
directions. If traffic flows through a RiOS appliance in one direction and not the other, then TCP clients
are unable to make connections to TCP servers. When deploying RiOS appliances into redundant
networks, there is a possibility of traffic taking different forward and return paths so that traffic in one
direction goes through RiOS appliances but traffic in the reverse direction does not.
Asymmetric automatic detection enables RiOS appliances to detect the presence of asymmetry within
the network. Asymmetry is detected by the client-side appliances. Once detected, the appliance passes
through asymmetric traffic unoptimized allowing the TCP connections to continue to work. The first
TCP connection for a pair of addresses might be dropped because during the detection process the
appliances have no way of knowing that the connection is asymmetric.
If asymmetric routing is detected, an entry is placed in the asymmetric routing table and any subsequent
connections from that IP-address pair is passed through unoptimized. Further connections between
these hosts are not optimized until that particular asymmetric routing cache entry times out.
The Networking > Network Integration: Asymmetric Routing page displays the asymmetric routing table.
This table describes the different types of asymmetry.
Type Description Asymmetric routing table and log entries
Complete Asymmetry
Packets traverse both RiOS appliances going from the client to the server but bypass both appliances on the return path.
• Asymmetric Routing Table: bad RST
• Log: Sep 5 11:16:38 gen-sh102 kernel: [intercept.WARN] asymmetric routing between 10.11.111.19 and 10.11.25.23 detected (bad RST)
Server-Side Asymmetry
Packets traverse both RiOS appliances going from the client to the server but bypass the server-side SteelHead on the return path.
• Asymmetric Routing Table: bad SYN/ACK
• Log: Sep 7 16:17:25 gen-sh102 kernel: [intercept.WARN] asymmetric routing between 10.11.25.23:5001 and 10.11.111.19:33261 detected (bad SYN/ACK)
Client-Side Asymmetry
Packets traverse both RiOS appliances going from the client to the server but bypass the client-side appliance on the return path.
• Asymmetric Routing Table: no SYN/ACK
• Log: Sep 7 16:41:45 gen-sh102 kernel: [intercept.WARN] asymmetric routing between 10.11.111.19:33262 and 10.11.25.23:5001 detected (no SYN/ACK)
multiSYN Retransmit
The types of multi-SYN retransmits are:
• Probe-filtered occurs when the client-side appliance sends out multiple SYN+ frames and does not get a response.
• SYN-remit occurs when the client-side appliance receives multiple SYN retransmits from a client and does not see a SYN/ACK packet from the destination server.
• Asymmetric Routing Table: probe-filtered (not-AR)
• Log: Sep 13 20:59:16 gen-sh102 kernel: [intercept.WARN] it appears as though probes from 10.11.111.19 to 10.11.25.23 are being filtered. Passing through connections between these two hosts.
Configuring Network Integration Features | 365
Configuring asymmetric routing features
Detecting and caching asymmetric routes does not optimize these packets. If you want to optimize
asymmetric routed packets, you must make sure that packets going to the WAN always go through a
RiOS appliance either by using a multiport SteelHead, connection forwarding, or using external ways to
redirect packets, such as WCCP or PBR.
For details, see “Configuring connection forwarding features” on page 366 or the SteelHead Deployment
Guide.
Troubleshooting asymmetric routes
You can use these tools to detect and analyze asymmetric routes:
• TCP Dump - Run a TCP dump diagnostic report on the client-side appliance to verify the packet sequence that is causing the asymmetric route detection. You can take traces on the LAN and WAN ports of the appliance and, based on the packet maps, look for the packet sequence that is expected for the type of warning message that was in the log.
As an example, perform these steps to obtain information about all packets on the WAN interface sourced from or destined to 10.0.0.1, and with a source and destination TCP port of 80:
1. Choose Reports > Diagnostics: TCP Dumps to display the TCP Dumps page.
2. Click Add a New TCP Dump.
3. Select the WAN interface.
4. Specify 10.0.0.1 as the source and destination address.
5. Specify TCP port 80 as the source and destination port.
6. Select the Schedule Dump check box and specify the date and time to initiate the dump.
7. Specify any other options such as the capture filename or duration.
8. Click Add.
For details, see “Capturing and uploading TCP dump files” on page 646.
• Trace Route - From the CLI, run the traceroute command to discover what path a packet is taking from the client to the server and from the server to the client. You access the client and run the traceroute command with the IP address of the server, and then run the traceroute command from the server with the IP address of the client. For example, for a Cisco router with a client address of 10.1.0.2 and a server address of 10.0.0.4:
client# traceroute 10.0.0.4 Type escape sequence to abort.Tracing the route to 10.0.0.4 1 10.1.0.1 4 msec 0 msec 4 msec 2 10.0.0.2 4 msec 4 msec 0 msec 3 10.0.0.3 4 msec 4 msec 0 msec 4 10.0.0.4 4 msec 4 msec 0 msec server# traceroute 10.1.0.2 Type escape sequence to abort. Tracing the route to 10.1.0.21 10.0.0.6 4 msec 0 msec 4 msec 2 10.0.0.5 4 msec 4 msec 0 msec 3 10.1.0.1 4 msec 4 msec 0 msec 4 10.1.0.2 4 msec 4 msec 0 msec
For details, see the Riverbed Command-Line Interface Reference Manual or the SteelHead Deployment
Guide.
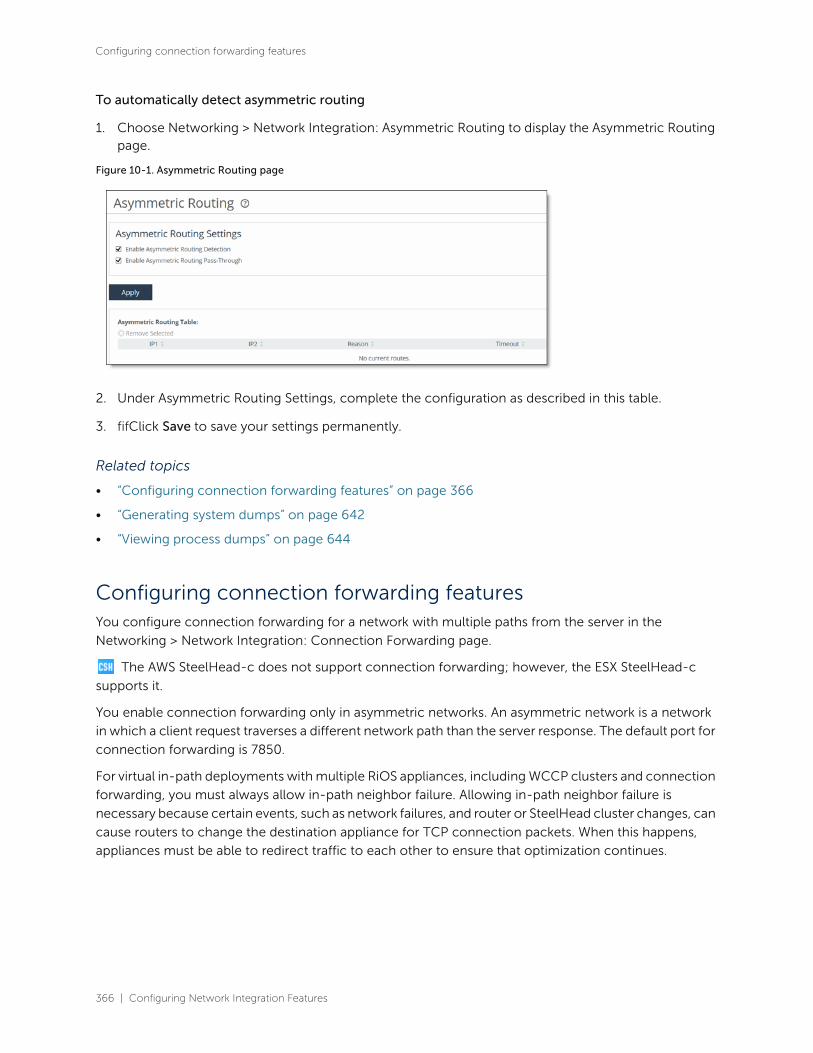
366 | Configuring Network Integration Features
Configuring connection forwarding features
To automatically detect asymmetric routing
1. Choose Networking > Network Integration: Asymmetric Routing to display the Asymmetric Routing page.
Figure 10-1. Asymmetric Routing page
2. Under Asymmetric Routing Settings, complete the configuration as described in this table.
3. fifClick Save to save your settings permanently.
Related topics
• “Configuring connection forwarding features” on page 366
• “Generating system dumps” on page 642
• “Viewing process dumps” on page 644
Configuring connection forwarding featuresYou configure connection forwarding for a network with multiple paths from the server in the
Networking > Network Integration: Connection Forwarding page.
The AWS SteelHead-c does not support connection forwarding; however, the ESX SteelHead-c
supports it.
You enable connection forwarding only in asymmetric networks. An asymmetric network is a network
in which a client request traverses a different network path than the server response. The default port for
connection forwarding is 7850.
For virtual in-path deployments with multiple RiOS appliances, including WCCP clusters and connection
forwarding, you must always allow in-path neighbor failure. Allowing in-path neighbor failure is
necessary because certain events, such as network failures, and router or SteelHead cluster changes, can
cause routers to change the destination appliance for TCP connection packets. When this happens,
appliances must be able to redirect traffic to each other to ensure that optimization continues.
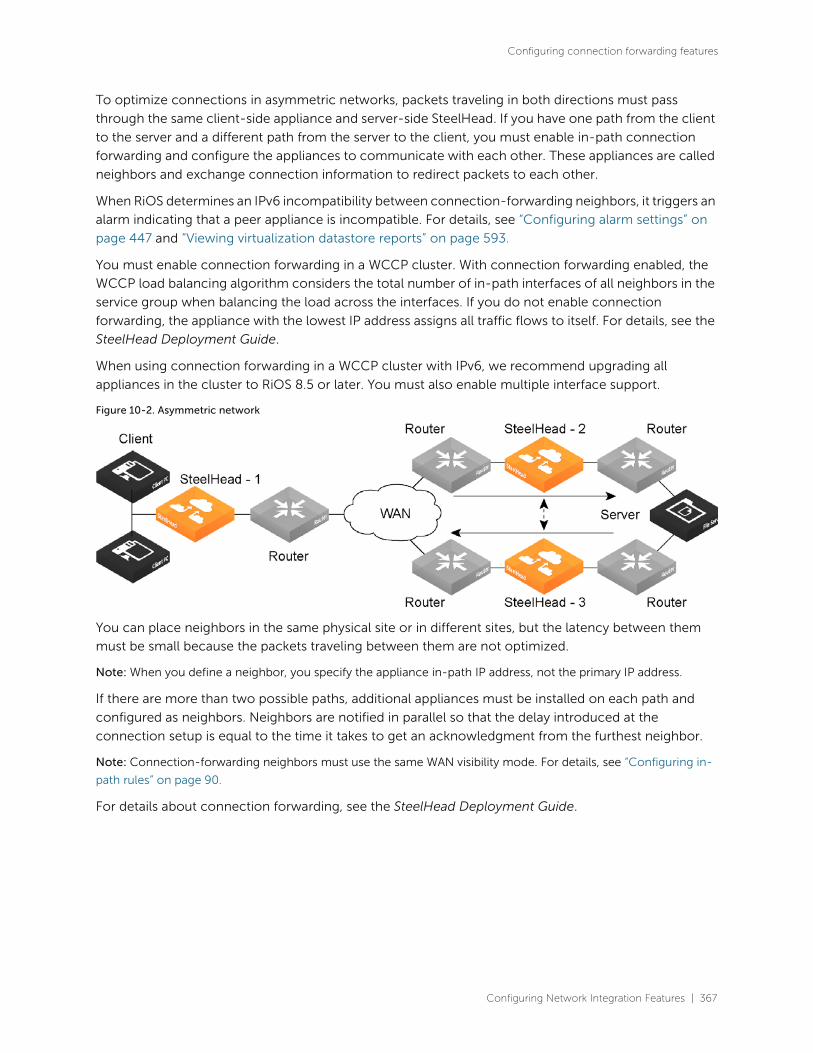
Configuring Network Integration Features | 367
Configuring connection forwarding features
To optimize connections in asymmetric networks, packets traveling in both directions must pass
through the same client-side appliance and server-side SteelHead. If you have one path from the client
to the server and a different path from the server to the client, you must enable in-path connection
forwarding and configure the appliances to communicate with each other. These appliances are called
neighbors and exchange connection information to redirect packets to each other.
When RiOS determines an IPv6 incompatibility between connection-forwarding neighbors, it triggers an
alarm indicating that a peer appliance is incompatible. For details, see “Configuring alarm settings” on
page 447 and “Viewing virtualization datastore reports” on page 593.
You must enable connection forwarding in a WCCP cluster. With connection forwarding enabled, the
WCCP load balancing algorithm considers the total number of in-path interfaces of all neighbors in the
service group when balancing the load across the interfaces. If you do not enable connection
forwarding, the appliance with the lowest IP address assigns all traffic flows to itself. For details, see the
SteelHead Deployment Guide.
When using connection forwarding in a WCCP cluster with IPv6, we recommend upgrading all
appliances in the cluster to RiOS 8.5 or later. You must also enable multiple interface support.
Figure 10-2. Asymmetric network
You can place neighbors in the same physical site or in different sites, but the latency between them
must be small because the packets traveling between them are not optimized.
Note: When you define a neighbor, you specify the appliance in-path IP address, not the primary IP address.
If there are more than two possible paths, additional appliances must be installed on each path and
configured as neighbors. Neighbors are notified in parallel so that the delay introduced at the
connection setup is equal to the time it takes to get an acknowledgment from the furthest neighbor.
Note: Connection-forwarding neighbors must use the same WAN visibility mode. For details, see “Configuring in-
path rules” on page 90.
For details about connection forwarding, see the SteelHead Deployment Guide.

368 | Configuring Network Integration Features
Configuring connection forwarding features
To enable connection forwarding
1. Choose Networking > Network Integration: Connection Forwarding to display the Connection Forwarding page.
Figure 10-3. Connection Forwarding page
2. Under Connection Forwarding Settings, complete the configuration as described in this table.
Control Description
Enable Connection Forwarding Enables connection forwarding by default on all neighbors added to the peer list. The default value is 7850.
Port Specify the port number to use as the default for the neighbor appliance in-path port. The default value is 7850.
Keep-Alive Interval Specify the number of seconds to use as the default interval for ping commands between neighbor appliances. The default value is 1.
Keep-Alive Count Specify the number of tries to use as the default number of failed ping attempts before an appliance terminates a connection with a neighbor. The default value is 3.

Configuring Network Integration Features | 369
Configuring connection forwarding features
3. Click Apply to apply your settings.
4. Click Save to save your settings permanently.
To add a new neighbor
1. Under Neighbor Table, complete the configuration as described in this table.
2. Click Apply to apply your settings.
In-Path Neighbor Failure Uses the neighbor appliance to optimize new connections if the appliance fails.
For in-path deployments that use connection forwarding with WCCP, enabling this option ensures that if one appliance fails, the neighbor appliance continues to optimize new connections.
For in-path deployments that use connection forwarding without WCCP, enabling this option ensures that an appliance attempts to optimize new connections that are symmetrically routed, even after all of the neighbor appliances on another network path failed. New asymmetrically routed connections are not optimized but passed through.
Multiple Interface Support Enables high availability on appliances configured with multiple in-path interfaces and using connection forwarding with another multiport SteelHead. This option makes all neighbor in-path interface IP addresses visible to each peer to ensure proper neighbor communication if the in-path0_0 interface fails.
RiOS 6.5 and later require connection forwarding in a WCCP cluster.
You must enable multiple interface support for a connection-forwarding neighbor to work with IPv6.
Control Description
Add a New Neighbor Displays the controls to add a new neighbor.
Hostname Specify a hostname.
In-Path IP Address Specify the in-path IP address for the neighbor appliance. When you define a neighbor, you must specify the appliance in-path IP address, not the primary IP address.
You can use connection forwarding with IPv6 addresses if the following conditions are met:
• Both appliances must be running RiOS 9.6 or later.
• Multiple interface support must be selected.
• The IPv6 Connection Forwarding check box must be selected in the Connection Forwarding Settings area of this page.
Port Specify the in-path port for the neighbor appliance. The default port is 7850.
Additional IP Addresses Adds a neighbor appliance to the neighbor list.
Add Adds a new neighbor.
Remove Selected Select the check box next to the name and click Remove Selected.
Control Description

370 | Configuring Network Integration Features
Configuring IPSec encryption
3. Click Save to save your settings permanently.
Note: To modify the neighbor properties, select the IP address of the neighbor and complete the configuration.
Related topics
• “Configuring general service settings” on page 108
• “Configuring asymmetric routing features” on page 363
Configuring IPSec encryptionYou configure IPSec encryption to allow data to be communicated securely between peer appliances in
the Optimization > SSL: Secure Peering (IPSEC) page.
Enabling IPSec encryption makes it difficult for a third party to view your data or pose as a computer you
expect to receive data from. To enable IPSec, you must specify at least one encryption and
authentication algorithm. Only optimized data is protected, pass-through traffic is not.
Enabling IPSec support is optional.
RiOS does not support IPSec over IPv6.
In RiOS 9.0, IPSec secure peering and the secure transport service are mutually exclusive. The secure
transport service is enabled by default. Before you enable IPSec secure peering, you must disable the
secure transport service.
RiOS provides support for SSL peering beyond traditional HTTPS traffic. For details, see “Configuring
secure peers” on page 340.
Note: You must set IPSec support on each peer appliance in your network for which you want to establish a secure
connection. You must also specify a shared secret on each peer appliance.
Note: If you NAT traffic between appliances, you cannot use the IPSec channel between the appliances because the
NAT changes the packet headers, causing IPSec to reject them.

Configuring Network Integration Features | 371
Configuring IPSec encryption
To enable IPSec encryption
1. Choose Optimization > SSL: Secure Peering IPsec to display the Secure Peering (IPSEC) page.
Figure 10-4. Secure Peering (IPSEC) page
2. Under General Settings, complete the configuration as described in this table.
Control Description
Enable Authentication and Encryption
Enables authentication between SteelHeads. By default, this option is disabled.
Enable Perfect Forward Secrecy Enables additional security by renegotiating keys at specified intervals. If one key is compromised, subsequent keys are secure because they’re not derived from previous keys. By default, this option is enabled.
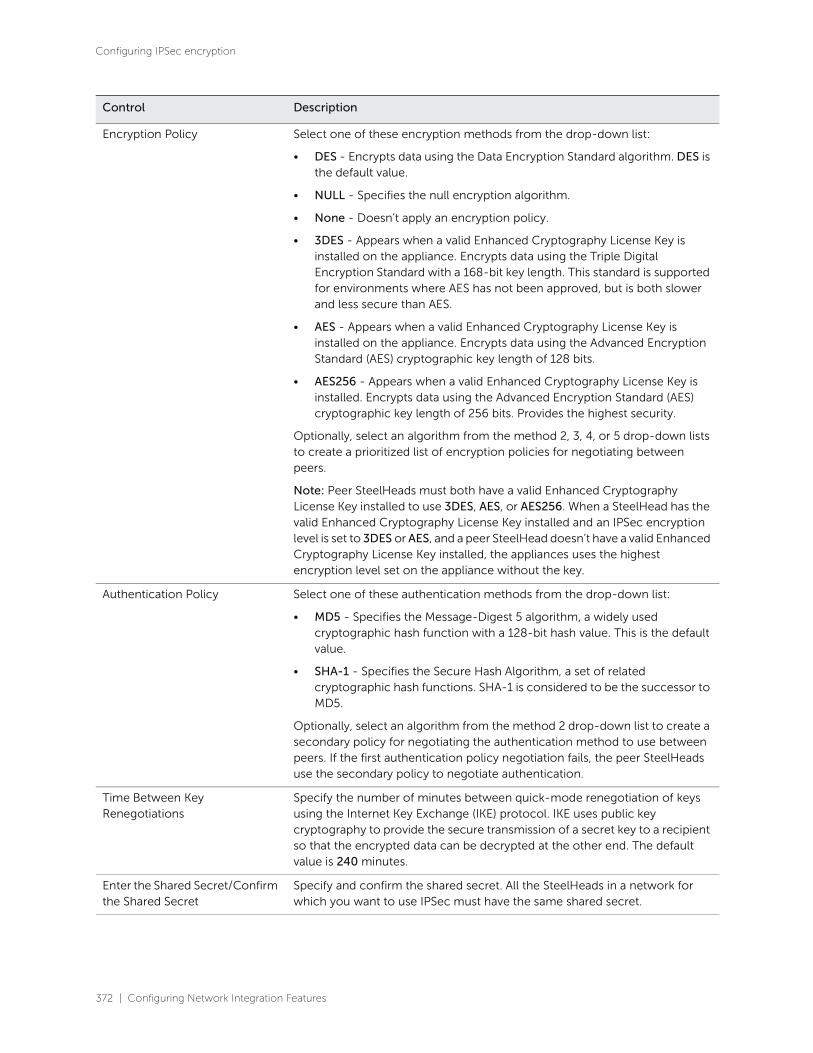
372 | Configuring Network Integration Features
Configuring IPSec encryption
Encryption Policy Select one of these encryption methods from the drop-down list:
• DES - Encrypts data using the Data Encryption Standard algorithm. DES is the default value.
• NULL - Specifies the null encryption algorithm.
• None - Doesn’t apply an encryption policy.
• 3DES - Appears when a valid Enhanced Cryptography License Key is installed on the appliance. Encrypts data using the Triple Digital Encryption Standard with a 168-bit key length. This standard is supported for environments where AES has not been approved, but is both slower and less secure than AES.
• AES - Appears when a valid Enhanced Cryptography License Key is installed on the appliance. Encrypts data using the Advanced Encryption Standard (AES) cryptographic key length of 128 bits.
• AES256 - Appears when a valid Enhanced Cryptography License Key is installed. Encrypts data using the Advanced Encryption Standard (AES) cryptographic key length of 256 bits. Provides the highest security.
Optionally, select an algorithm from the method 2, 3, 4, or 5 drop-down lists to create a prioritized list of encryption policies for negotiating between peers.
Note: Peer SteelHeads must both have a valid Enhanced Cryptography License Key installed to use 3DES, AES, or AES256. When a SteelHead has the valid Enhanced Cryptography License Key installed and an IPSec encryption level is set to 3DES or AES, and a peer SteelHead doesn’t have a valid Enhanced Cryptography License Key installed, the appliances uses the highest encryption level set on the appliance without the key.
Authentication Policy Select one of these authentication methods from the drop-down list:
• MD5 - Specifies the Message-Digest 5 algorithm, a widely used cryptographic hash function with a 128-bit hash value. This is the default value.
• SHA-1 - Specifies the Secure Hash Algorithm, a set of related cryptographic hash functions. SHA-1 is considered to be the successor to MD5.
Optionally, select an algorithm from the method 2 drop-down list to create a secondary policy for negotiating the authentication method to use between peers. If the first authentication policy negotiation fails, the peer SteelHeads use the secondary policy to negotiate authentication.
Time Between Key Renegotiations
Specify the number of minutes between quick-mode renegotiation of keys using the Internet Key Exchange (IKE) protocol. IKE uses public key cryptography to provide the secure transmission of a secret key to a recipient so that the encrypted data can be decrypted at the other end. The default value is 240 minutes.
Enter the Shared Secret/Confirm the Shared Secret
Specify and confirm the shared secret. All the SteelHeads in a network for which you want to use IPSec must have the same shared secret.
Control Description
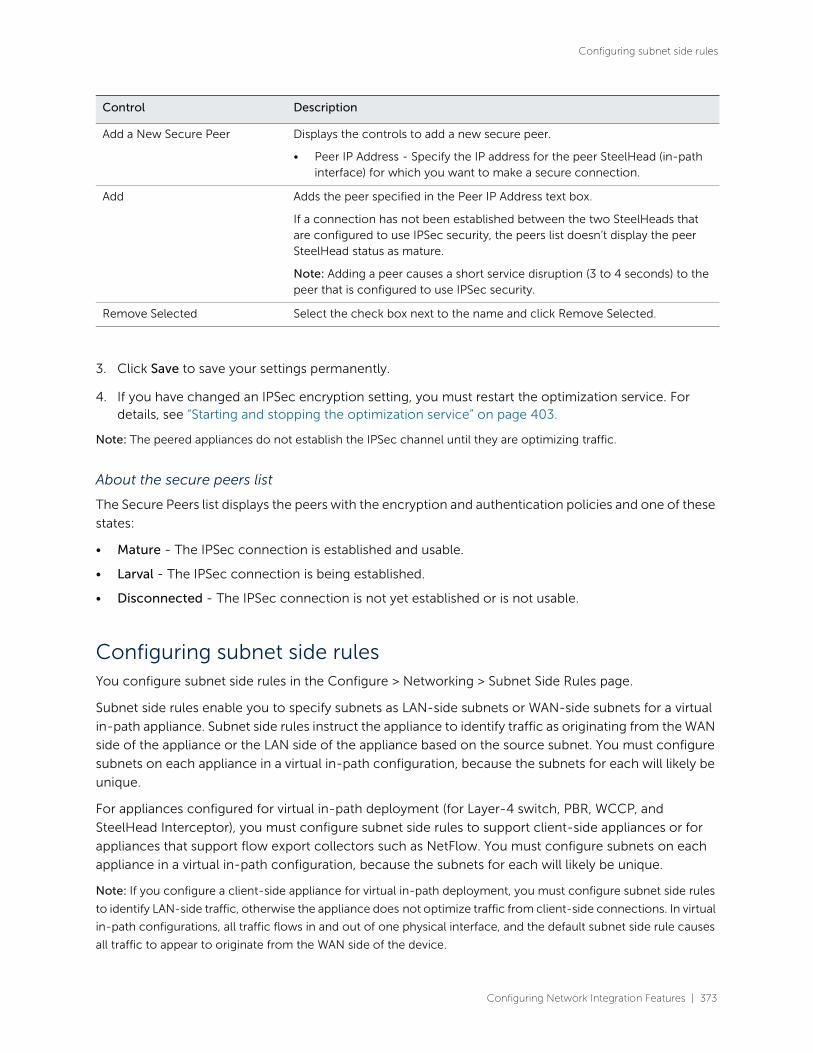
Configuring Network Integration Features | 373
Configuring subnet side rules
3. Click Save to save your settings permanently.
4. If you have changed an IPSec encryption setting, you must restart the optimization service. For details, see “Starting and stopping the optimization service” on page 403.
Note: The peered appliances do not establish the IPSec channel until they are optimizing traffic.
About the secure peers list
The Secure Peers list displays the peers with the encryption and authentication policies and one of these
states:
• Mature - The IPSec connection is established and usable.
• Larval - The IPSec connection is being established.
• Disconnected - The IPSec connection is not yet established or is not usable.
Configuring subnet side rules You configure subnet side rules in the Configure > Networking > Subnet Side Rules page.
Subnet side rules enable you to specify subnets as LAN-side subnets or WAN-side subnets for a virtual
in-path appliance. Subnet side rules instruct the appliance to identify traffic as originating from the WAN
side of the appliance or the LAN side of the appliance based on the source subnet. You must configure
subnets on each appliance in a virtual in-path configuration, because the subnets for each will likely be
unique.
For appliances configured for virtual in-path deployment (for Layer-4 switch, PBR, WCCP, and
SteelHead Interceptor), you must configure subnet side rules to support client-side appliances or for
appliances that support flow export collectors such as NetFlow. You must configure subnets on each
appliance in a virtual in-path configuration, because the subnets for each will likely be unique.
Note: If you configure a client-side appliance for virtual in-path deployment, you must configure subnet side rules
to identify LAN-side traffic, otherwise the appliance does not optimize traffic from client-side connections. In virtual
in-path configurations, all traffic flows in and out of one physical interface, and the default subnet side rule causes
all traffic to appear to originate from the WAN side of the device.
Add a New Secure Peer Displays the controls to add a new secure peer.
• Peer IP Address - Specify the IP address for the peer SteelHead (in-path interface) for which you want to make a secure connection.
Add Adds the peer specified in the Peer IP Address text box.
If a connection has not been established between the two SteelHeads that are configured to use IPSec security, the peers list doesn’t display the peer SteelHead status as mature.
Note: Adding a peer causes a short service disruption (3 to 4 seconds) to the peer that is configured to use IPSec security.
Remove Selected Select the check box next to the name and click Remove Selected.
Control Description

374 | Configuring Network Integration Features
Configuring subnet side rules
Because VSP is enabled by default on SteelFusion Edges, and the default subnet rule assumes that all traffic is coming from the WAN, the default rule prevents client-side connections from being optimized until you create a rule to identify traffic that should be treated as LAN-side traffic. The position of this rule must be at the start of the list of rules, above the default rule.
• If you configure a virtual in-path appliance to use flow export collectors such as NetFlow, you can analyze nonoptimized traffic or passed-through traffic correctly. If you do not configure subnet side rules, the appliance cannot discern whether the traffic is traveling from the LAN to the WAN or in the opposite direction. This can result in over-reporting traffic in a particular direction or for a particular interface.
FakeIndex is necessary for correct optimized traffic reporting. For details, see the SteelHead Deployment Guide.
To add subnet side rules
1. Choose Networking > Network Services: Subnet Side Rules to display the Subnet Side Rules page.
Figure 10-5. Subnet Side Rules page
2. Complete the configuration as described in this table.
Control Description
Add a Subnet Side Rule Displays the controls to create a subnet side rule.
Insert Rule At Select Start, End, or a rule number from the drop-down list.
SteelHeads evaluate rules in numerical order starting with rule 1. If the conditions set in the rule match, then the rule is applied, and the system moves on to the next packet. If the conditions set in the rule do not match, the system consults the next rule. For example, if the conditions of rule 1 do not match, rule 2 is consulted. If rule 2 matches the conditions, it is applied, and no further rules are consulted.
Subnet Specify the subnet. The subnet can be either an IPv4 or an IPv6 address. Use the following format:
<ip address>/<subnet mask>
xxx.xxx.xxx.xxx/xx (IPv4)
x:x:x:x/xxx (IPv6)
Subnet is on the LAN side of this appliance
In virtual in-path configurations, all traffic is flowing in and out of one physical interface. Select to specify that the subnet is on the LAN side of the device.

Configuring Network Integration Features | 375
Configuring flow statistics
You cannot delete the default rule that optimizes all remaining WAN-side traffic that has not been
selected by another rule. This rule is always listed last.
Related topics
• “Configuring flow statistics” on page 375
Configuring flow statistics You enable and configure flow statistic settings in the Networking > Network Services: Flow Statistics
page. You can also enable flow export to an external collector and to a CascadeFlow collector.
CascadeFlow collectors can aggregate information about QoS configuration and other application
statistics to send to a SteelCentral NetProfiler. The Enterprise NetProfiler summarizes and displays the
QoS configuration statistics.
By default, flow export is disabled.
Note: You cannot export data flowing through a secure transport tunnel to a flow collector. Secure transport
provides security by creating tunnels between the peers through which the traffic flows. IPSec is used to provide
authentication and encryption to the packets that flow through the tunnels. Specifically, secure transport uses the
ESP mode of IPSec. Flow statistic collectors cannot collect ESP packet data flow information.
External collectors use information about network data flows to report trends such as the top users, peak
usage times, traffic accounting, security, and traffic routing. You can export preoptimization and post-
optimization data to an external collector.
The Top Talkers feature enables a report that details the hosts, applications, and host and application
pairs that are either sending or receiving the most data on the network. The Top Talkers report does not
use a NetFlow Collector.
Enabling flow export
SteelFusion Edge supports NetFlow 5, NetFlow 9, and CascadeFlow and CascadeFlow-compatible
versions. Flow export requires these components:
• Exporter - When you enable flow export support, the appliance exports data about the individual flows that it sees as they traverse the network.
Subnet is on the WAN side of this appliance
In virtual in-path configurations, all traffic is flowing in and out of one physical interface. Select to specify that the subnet is on the WAN side of the device.
Add Adds the rule to the subnet map table. The Management Console redisplays the subnet map table and applies your changes to the running configuration, which is stored in memory.
Remove Subnet Rules Select the check box next to the name and click Remove Subnet Rules.
Move Subnet Rules Moves the selected rules. Click the arrow next to the desired rule position; the rule moves to the new position.
Control Description

376 | Configuring Network Integration Features
Configuring flow statistics
• Collector - A server or appliance designed to aggregate data sent to it by the appliance and other exporters.
• Analyzer - A collection of tools used to analyze the data and provide relevant data summaries and graphs. NetFlow analyzers are available for free or from commercial sources. Analyzers are often provided in conjunction with the collectors.
Before you enable flow export in your network, consider these points:
• Flow data typically consumes less than 1 percent of link bandwidth. With low-bandwidth links, ensure that flow export does not consume too much bandwidth, thereby impacting application performance.
• You can reduce the amount of bandwidth consumption by applying filters that only export the most critical information needed for your reports.
Flow export in virtual in-path deployments
In virtual in-path deployments, such as WCCP or PBR, traffic arrives and leaves from the same WAN
interface. When the Edge exports data to a flow export collector, all traffic has the WAN interface index.
This behavior is correct because the input interface is the same as the output interface.
For details about configuring flow export in a virtual in-path deployment, see “Configuring subnet side
rules” on page 373.
To distinguish between LAN-to-WAN and WAN-to-LAN traffic in virtual in-path deployments, see the
SteelHead Deployment Guide.
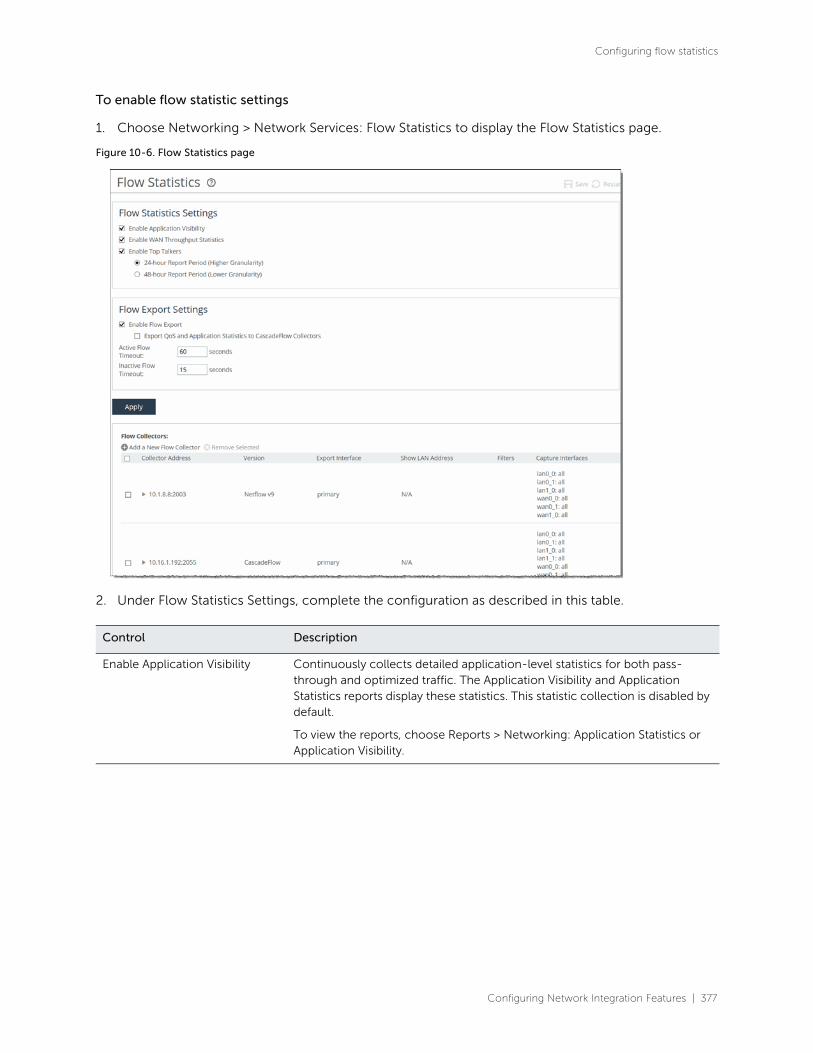
Configuring Network Integration Features | 377
Configuring flow statistics
To enable flow statistic settings
1. Choose Networking > Network Services: Flow Statistics to display the Flow Statistics page.
Figure 10-6. Flow Statistics page
2. Under Flow Statistics Settings, complete the configuration as described in this table.
Control Description
Enable Application Visibility Continuously collects detailed application-level statistics for both pass-through and optimized traffic. The Application Visibility and Application Statistics reports display these statistics. This statistic collection is disabled by default.
To view the reports, choose Reports > Networking: Application Statistics or Application Visibility.

378 | Configuring Network Integration Features
Configuring flow statistics
3. Click Apply to apply your settings.
Enable WAN Throughput Statistics
Continuously collects WAN throughput statistics, which the WAN Throughput report displays. This statistic collection is enabled by default; however, you can disable the collection to save processing power.
To view the WAN throughput statistics, choose Reports > Networking: WAN Throughput.
Enable Top Talkers Continuously collects statistics for the most active traffic flows. A traffic flow consists of data sent and received from a single source IP address and port number to a single destination IP address and port number over the same protocol.
The most active, heaviest users of WAN bandwidth are called the Top Talkers. A flow collector identifies the top consumers of the available WAN capacity (the top 50 by default) and displays them in the Top Talkers report. Collecting statistics on the Top Talkers provides visibility into WAN traffic without applying an in-path rule to enable a WAN visibility mode.
You can analyze the Top Talkers for accounting, security, troubleshooting, and capacity planning purposes. You can also export the complete list in CSV format.
The collector gathers statistics on the Top Talkers based on the proportion of WAN bandwidth consumed by the top hosts, applications, and host and application pair conversations. The statistics track pass-through or optimized traffic, or both. Data includes TCP or UDP traffic, or both (configurable in the Top Talkers report page).
A NetFlow collector is not required for this feature.
Optionally, select a time period to adjust the collection interval:
• 24-hour Report Period - For a five-minute granularity (the default setting).
• 48-hour Report Period - For a ten-minute granularity.
The system also uses the time period to collect SNMP Top Talker statistics. For top talkers displayed in the Top Talker report and SNMP Top Talker statistics, the system updates the Top Talker data ranks either every 300 seconds (for a 24- hour reporting period), or 600 seconds (for a 48-hour reporting period).
The system saves a maximum of 300 Top Talker data snapshots, and aggregates these to calculate the top talkers for the 24-hour or 48-hour reporting period.
The system never clears top talker data at the time of polling; however, every 300 or 600 seconds, it replaces the oldest Top Talker data snapshot of the 300 with the new data snapshot.
After you change the reporting period, it takes the system one day to update the Top Talker rankings to reflect the new reporting period. In the interim, the data used to calculate the Top Talkers still includes data snapshots from the original reporting period. This delay applies to Top Talker report queries and SNMP Top Talker statistics.
Control Description

Configuring Network Integration Features | 379
Configuring flow statistics
4. Click Save to save your settings permanently.
To enable flow export settings
1. Choose Networking > Network Services: Flow Statistics to display the Flow Statistics page.
2. Under Flow Export Settings, complete the configuration as described in this table.
3. Click Apply to apply your settings.
Control Description
Enable Flow Export Enables the Edge to export network statistics about the individual flows that it sees as they traverse the network. By default, this setting is disabled.
Export QoS and Application Statistics to CascadeFlow Collectors
Sends application-level statistics from all sites to a SteelCentral collector on a SteelCentral appliance. SteelCentral appliances provide central reporting capabilities. The collector aggregates QoS and application statistics to provide visibility using detailed records specific to flows traversing the SteelHead.
The appliance sends SteelCentral an enhanced version of NetFlow called CascadeFlow. CascadeFlow includes:
• NetFlow v9 extensions for round-trip time measurements that enable you to understand volumes of traffic across your WAN and end-to-end response time.
• extensions that enable a SteelCentral NetExpress to properly measure and report on the benefits of optimization.
After the statistics are aggregated on a Cascade appliance, you can use its central reporting capabilities to:
• analyze overall WAN use, such as traffic generated by application, most active sites, and so on.
• troubleshoot a particular application by viewing how much bandwidth it received, checking for any retransmissions, interference from other applications, and so on.
• compare actual application use against your outbound QoS policy configuration to analyze whether your policies are effective. For example, if your QoS policy determines that Citrix should get a minimum of 10 percent of the link, and the application statistics reveal that Citrix performance is unreliable and always stuck at 10 percent, you might want to increase that minimum guarantee.
You must enable outbound QoS on the appliance, add a CascadeFlow collector, and enable REST API access before sending QoS configuration statistics to a SteelCentral NetProfiler.
To enable QoS, choose Networking > Network Services: Outbound QoS. You cannot export statistics for inbound QoS.
The collectors appear in the Flow Collector list at the bottom of the Configure > Networking: Flow Statistics page.

380 | Configuring Network Integration Features
Configuring flow statistics
4. Click Save to save your settings permanently.
Related topics
• “Configuring subnet side rules” on page 373
• “Viewing top talkers reports” on page 527
• “Viewing application statistics reports” on page 534
To add a Flow collector
1. Under Flow Collectors, complete the configuration as described in this table.
To enable REST API access, choose Administration > Security: REST API Access.
The CascadeFlow collector collects read-only statistics on both pass-through and optimized traffic. When you use CascadeFlow, the appliance sends four flow records for each optimized TCP session: ingress and egress for the inner-channel connection, and ingress and egress for the outer-channel connection. A pass-through connection still sends four flow records, even though there are no separate inner- and outer-channel connections. In either case, the SteelCentral NetExpress merges these flow records together with flow data collected for the same flow from other devices.
For details, see the SteelCentral Network Performance Management Deployment Guide.
Enable IPv6 Enables support for IPv6 addresses for flow exports.
Active Flow Timeout Optionally, specify the amount of time, in seconds, the collector retains the list of active traffic flows. The default value is 1800.
You can set the time-out period even if the Top Talkers option is enabled.
Inactive Flow Timeout Optionally, specify the amount of time, in seconds, the collector retains the list of inactive traffic flows. The default value is 15.
Control Description
Add a New Flow Collector Displays the controls to add a Flow collector.
Collector IP Address Specify the IP address for the Flow collector.
Port Specify the UDP port the Flow collector is listening on. The default value is 2055.
Control Description

Configuring Network Integration Features | 381
Configuring flow statistics
Version Select one of these versions from the drop-down list:
• CascadeFlow - Use with Cascade Profiler 8.4 or later.
• CascadeFlow-compatible - Use with Cascade Profiler 8.3.2 or earlier, and select the LAN Address check box.
• NetFlow v9 - Enables both ingress and egress flow records.
• NetFlow v5 - Enables ingress flow records.
For details on using NetFlow records with Cascade, see the SteelCentral Network Performance Management Deployment Guide.
CascadeFlow and CascadeFlow-compatible are enhanced versions of flow export to the SteelCentral. These versions allow automatic discovery and interface grouping for SteelHeads in a Riverbed SteelCentral NetProfiler or a SteelCentral Flow Gateway and support WAN and optimization reports in SteelCentral. For details, see the SteelCentral NetProfiler and NetExpress User Guide and the SteelCentral Flow Gateway User Guide.
Packet Source Interface Select the interface to use as the source IP address of the flow packets (Primary, Aux, or MIP) from the drop-down list. NetFlow records sent from the SteelHead appear to be sent from the IP address of the selected interface.
LAN Address Causes the TCP/IP addresses and ports reported for optimized flows to contain the original client and server IP addresses and not those of the SteelHead. The default setting displays the IP addresses of the original client and server without the IP address of the SteelHeads.
This setting is unavailable with NetFlow v9, because the optimized flows are always sent out with both the original client server IP addresses and the IP addresses used by the SteelHead.
Capture Interface/Type Specify the traffic type to export to the flow collector. Select one of these types from the drop-down list:
• All - Exports both optimized and nonoptimized traffic.
• Optimized - Exports optimized traffic.
• Optimized - Exports optimized LAN or WAN traffic when WCCP is enabled.
• Passthrough - Exports pass-through traffic.
• None - Disables traffic flow export.
The default is All for LAN and WAN interfaces, for all four collectors. The default for the other interfaces (Primary, rios_lan, and rios_wan) is None. You can’t select a MIP interface.
Enable Filter (CascadeFlow and NetFlow v9 only) Filter flow reports by IP and subnets or IP:ports included in the Filter list. When disabled, reports include all IP addresses and subnets.
Filter (CascadeFlow and NetFlow v9 only) Specify the IP and subnet or IP:port to include in the report, one entry per line, up to 25 filters maximum. This field supports both IPv4 and IPv6 subnets.
Control Description

382 | Configuring Network Integration Features
Joining a Windows domain or workgroup
2. Click Apply to apply your settings.
3. Click Save to save your settings permanently.
Troubleshooting
To troubleshoot your flow export settings:
• Make sure the port configuration matches on the RiOS appliance and the listening port of the collector.
• Ensure that you can reach the collector from the appliance (for example, –i aux 1.1.1.1 where 1.1.1.1 is the NetFlow collector and aux is the Packet Source Interface).
• Verify that your capture settings are on the correct interface and that traffic is flowing through it.
Joining a Windows domain or workgroupA server-side SteelHead can join a Windows domain or workgroup in the Optimization > Active
Directory: Domain Join page. This page provides a central place for a SteelHead to join a Windows
domain or workgroup.
The SteelHead can join a single Windows domain to use these features:
• SMB signing trust for CIFS optimizations. For details, see “Configuring SMB signing” on page 181.
• MAPI 2007 encrypted traffic optimization authentication. For details, see “Configuring MAPI optimization” on page 206.
• MAPI Exchange as a hosted service using Active Directory integrated mode for Windows 2003 and 2008 or later.
RiOS includes an automatic way to join the domain and deploy the server-side SteelHead in Active
Directory integrated mode for Windows 2003 and 2008. For details, see “Configuring domain
authentication automatically” on page 243.
Domain and local workgroup settings
You can choose between two user authentication modes: domain or local workgroup. Creating a local
workgroup eliminates the need to join a Windows domain and simplifies the configuration process, but
a workgroup does not support SMB signing, MAPI 2007 encrypted traffic optimization authentication, or
MAPI Exchange as a hosted service.
Add Adds the collector to the Collector list.
Remove Selected Select the check box next to the name and click Remove Selected.
Control Description

Configuring Network Integration Features | 383
Joining a Windows domain or workgroup
You can join a SteelHead to a domain in Active Directory 2008 integrated mode without administrator
privileges. For details, see the Riverbed Knowledge Base article How to Join SteelHead to Domain as a
RODC or BDC without Administrator privileges at https://supportkb.riverbed.com/support/
index?page=content&id=S18097&actp.
Domain mode
In Domain mode, you configure the SteelHead to join a Windows domain (typically, the domain of your
company). When you configure the SteelHead to join a Windows domain, you do not have to manage
local accounts in the branch office, as you do in Local Workgroup mode.
Domain mode allows a domain controller (DC) to authenticate users accessing its file shares. The DC
can be located at the remote site or over the WAN at the main data center. The SteelHead must be
configured as a Member Server or Active Directory integrated in the Windows 2000 or later Active
Directory Services (ADS) domain. Domain users are allowed to use the Kerberos delegation trust facility
and NTLM environments for MAPI 2007 encryption or SMB signing based on the access permission
settings provided for each user.
In RiOS 9.0, the support for one-way trusts includes Windows 7 clients without requiring a registry
change on the Windows 7 client. You must join the server-side SteelHead to the domain using the Active
Directory integrated (Windows 2003/2008) mode. This mode allows the SteelHead to use
authentication within the Active Directory environment on the Exchange servers that provide Microsoft
Exchange online services. The domain that the server-side SteelHead joins must be either the same as
the client user or any domain that trusts the domain of the client user.
Before enabling domain mode make sure that you:
• configure the DNS server correctly. The configured DNS server must be the same DNS server to which all the Windows client computers point. To use SMB signing, the server-side SteelHead must be in DNS. For details, see “To specify DNS settings” on page 54.
• have a fully qualified domain name. This domain name must be the domain name for which all the Windows desktop computers are configured.
Local Workgroup mode
In Local Workgroup mode, you define a workgroup and add individual users that have access to the
SteelHead. The SteelHead does not join a Windows domain.
Use Local Workgroup mode in environments where you do not want the SteelHead to be a part of a
Windows domain. Creating a workgroup eliminates the need to join a Windows domain and simplifies
the configuration process.
Note: If you use Local Workgroup mode you must manage the accounts and permissions for the branch office on
the SteelHead. The Local Workgroup account permissions might not match the permissions on the origin-file
server.
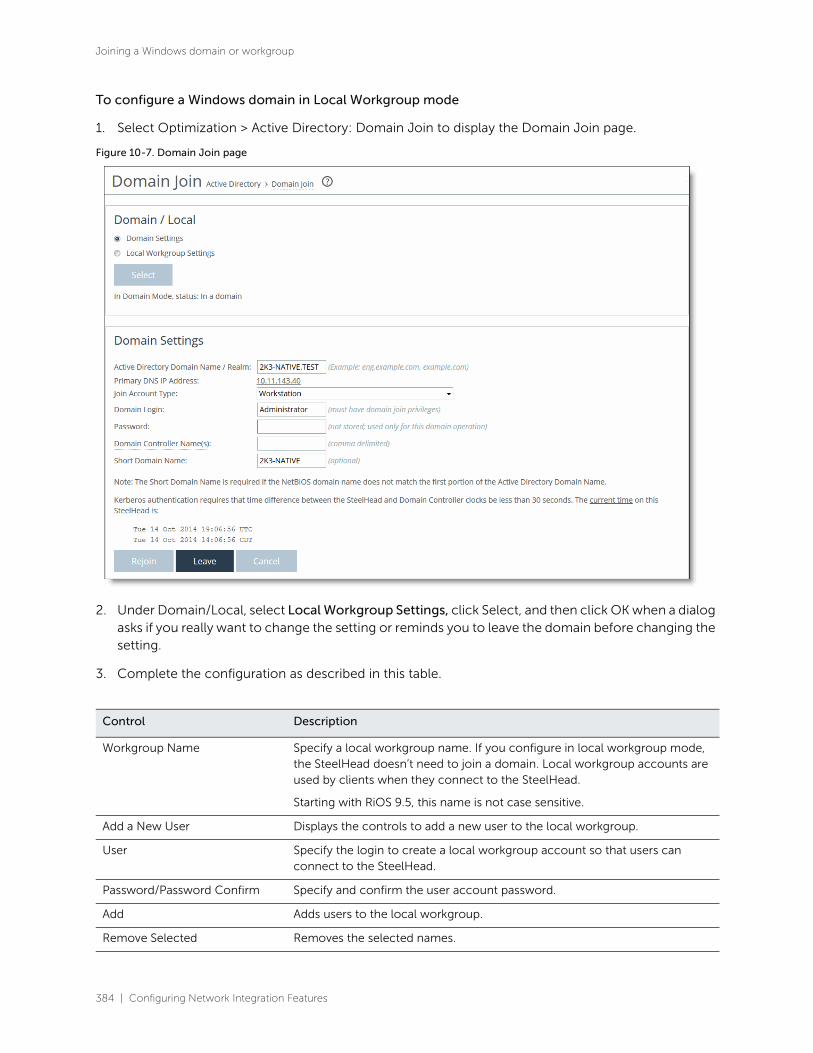
384 | Configuring Network Integration Features
Joining a Windows domain or workgroup
To configure a Windows domain in Local Workgroup mode
1. Select Optimization > Active Directory: Domain Join to display the Domain Join page.
Figure 10-7. Domain Join page
2. Under Domain/Local, select Local Workgroup Settings, click Select, and then click OK when a dialog asks if you really want to change the setting or reminds you to leave the domain before changing the setting.
3. Complete the configuration as described in this table.
Control Description
Workgroup Name Specify a local workgroup name. If you configure in local workgroup mode, the SteelHead doesn’t need to join a domain. Local workgroup accounts are used by clients when they connect to the SteelHead.
Starting with RiOS 9.5, this name is not case sensitive.
Add a New User Displays the controls to add a new user to the local workgroup.
User Specify the login to create a local workgroup account so that users can connect to the SteelHead.
Password/Password Confirm Specify and confirm the user account password.
Add Adds users to the local workgroup.
Remove Selected Removes the selected names.
Configuring Network Integration Features | 385
Joining a Windows domain or workgroup
4. Click Apply to apply your settings to the running configuration.
5. Click Save to save your settings permanently.
Preconfiguration checklist for joining a SteelHead to a Windows domain
Follow these guidelines when joining a Windows domain server to a SteelHead. For more information,
see the Riverbed Knowledge Base document “Optimization in a Secure Windows Environment” at https:/
/supportkb.riverbed.com/support/index?page=content&id=S25759.
• Make sure that the SteelHead time is synchronized with the domain time and is in the same time zone (for example, Americas/Denver). The time on the SteelHead should be within a few seconds of the domain time; synchronizing the time to an NTP server sets the time on the SteelHead to within a few milliseconds of the Windows domain time. The SteelHead time must be within 5 minutes of the Windows server’s time if using NTLM, and within 30 seconds for Kerberos. See “Configuring the date and time” on page 474 to configure an NTP server.
• Ensure that the Primary (management) interface of the SteelHead is connected to your LAN and has connectivity to DNS, NTP, and the Active Directory domain. All domain join and delegation features use the Primary interface.
In addition, check these DNS settings:
– Verify that there is an A record and reverse look-up record present on the DNS server for the primary interface of the SteelHead (which itself must be connected to the LAN).
– Make sure that an Active Directory DNS server is configured that allows the SteelHead to perform lookups. The DNS service must also be able to return domain controller names for each domain. Set or verify the DNS server in the DNS Settings area of the Networking > Networking: Host Settings page. See “Modifying general host settings” on page 53 for details.
– Verify that the Active Directory domain suffix (for example, domain.riverbed.com) is added to the DNS Settings area of the Networking > Networking: Host Settings page. See “Modifying general host settings” on page 53 for details.
– Make sure that all Windows client computers point to the DNS server that you configure on the SteelHead. To use SMB signing, the server-side SteelHead must be in the DNS.
Note: If you have issues with SteelHeads attempting to join domains that were not requested or authorized,
configure the server-side SteelHead to ignore all trusted domains, and then specify the domains to join. See the
Riverbed Knowledge Base article S27002 for details.
• Be sure that the SteelHead hostname is no more than 15 characters. Windows does not allow computer names that exceed 15 characters in Active Directory.
• Verify that the SteelHead hostname does not currently exist in the Computers container from the Active Directory Users and Computers snap-in (adsc.msc). If the SteelHead computer hostname has been retargeted from the default Computers container into an Organizational Unit (OU), verify that container for an existing SteelHead account.
• Be sure to specify a fully qualified domain name (FQDN). This FQDN must be the configured domain name for all Windows desktop computers.

386 | Configuring Network Integration Features
Joining a Windows domain or workgroup
• For RiOS release 9.5 and earlier, make sure that SMB1 (CIFS) is enabled on the domain controller. Starting with RiOS release 9.6, SMB2/3 is supported for the SteelHead domain join operation. See the Riverbed Knowledge Base article S30252 for more information.
• If you configure a SteelHead in Active Directory integrated (Windows 2003) or Active Directory integrated (Windows 2008 and later) mode, specify a Windows user with the ability to add a domain controller to the domain. Typically, any account belonging to the Domain Administrators group can be used.
Do not use an account that’s only able to join a workstation to a domain; these accounts can’t place the SteelHead’s account in the proper group or OU and can’t modify the userAccountControl account attribute in Active Directory for the SteelHead machine account. See the Riverbed Knowledge Base article S22468 for details.
Note: The SteelHead deletes the domain administrator credentials after the domain join is compete; no
Windows username or password is retained on the SteelHead.
Do not prepend the domain with the domain name; for example, for a domain of username, specify username not DOMAIN\username.
To use a Windows username without administrative privileges, first create a workstation (computer) account for the SteelHead and assign it additional privileges. See the Riverbed Knowledge Base article S18097 for details.
• If you use Kerberos to join a domain, use these guidelines:
– To verify or add a Kerberos replication user on the server-side SteelHead, display the Service Accounts page and check the field for the Kerberos replication user. See “To add Kerberos replication users on the SteelHead” on page 266 for details.
– To enable Kerberos authentication for restricted trust environments, use a one-way trust configuration. For details, see the “One-way trust configuration” chapter in the SteelHead Deployment Guide - Protocols. This configuration is typically required for environments with restricted security: for example, for a trust model that has split resource and management Active Directory domains such as Office 365 or other managed service providers.
• Be sure that the following ports are open to all domain controllers.
To configure a Windows domain in Domain mode
1. Select Optimization > Active Directory: Join Domain to display the Domain Join page.
Protocol Port
SMB1, SMB2/3 TCP 139 (legacy Windows implementations)445 (more recent Windows implementations)
LDAP TCP/UDP 389
Kerberos TCP/UDP 88
DNS UDP 53
SMB1-Named-Pipes, SMB2/3-Named-Pipes
TCP 445
EPM/RPC TCP 135

Configuring Network Integration Features | 387
Joining a Windows domain or workgroup
2. Under Domain/Local, click Domain Settings, click Select, and then click OK when a dialog asks if you really want to change the setting.
3. Complete the configuration as described in this table.
Control Description
Active Directory Domain Name/Realm
Specify the domain in which to make the SteelHead a member. Typically, this is your company domain name. RiOS supports Windows 2000 or later domains.
RiOS doesn’t support nondomain accounts other than administrator accounts. If you create Local mode shares on a nonadministrator account, your security permissions for the share aren’t preserved on the origin-file server.
Primary DNS IP Address By default, this field displays the primary DNS IP set in the DNS Settings page. To modify this entry, click the IP address.
388 | Configuring Network Integration Features
Joining a Windows domain or workgroup
Join Account Type Specifies which account type the server-side SteelHead uses to join the domain controller.
You can optimize the traffic to and from hosted Exchange servers. You must configure the server-side SteelHead in the Active Directory integrated mode for Windows 2003 or Windows 2008. This allows the SteelHead to use authentication on the Exchange servers that provide Microsoft Exchange online services. The domain that the server-side SteelHead joins must be either the same as the client user or any domain that trusts the domain of the client user.
Be aware that when you integrate the server-side SteelHead in the Active Directory, it doesn’t provide any Windows domain controller functionality to any other machines in the domain and doesn’t advertise itself as a domain controller or register any SRV records (service records). In addition, the SteelHead doesn’t perform any replication nor hold any Active Directory objects. The server-side SteelHead has just enough privileges so that it can have a legitimate conversation with the domain controller and then use transparent mode for NTLM authentication.
The Active Directory integration provides a way to optimize NTLM authentication from Windows 7/2008 R2 and newer clients when using transparent mode. This scenario is only successful for servers and clients that can make use of NTLM authentication. The server-side SteelHead joins a domain with DC privileges and then uses NTLM pass-through authentication to perform the authentication. Using transparent mode simplifies the configuration.
Select one of these options from the drop-down list:
• Workstation - Joins the server-side SteelHead to the domain with workstation privilege. You can join the domain to this account type using any ordinary user account that has the permission to join a machine to the domain. This is the default setting.
• Active Directory integrated (Windows 2003) - Configures the server-side SteelHead to integrate with the Active Directory domain. If the account for the server-side SteelHead was not already present, it’s created in organizational unit (OU) domain controllers. If the account existed previously as a domain computer then its location doesn’t change. You can move the account to a different OU later.
When you select Active Directory integrated (Windows 2003), you must specify one or more domain controller name(s), separated by commas.
You must have Administrator privileges to join the domain with active directory integration.
Active Directory integration doesn’t support cross-domain authentication where the user is from a domain trusted by the domain to which the server-side SteelHead is joined.
• Active Directory integrated (Windows 2008 and later) - Configures the server-side SteelHead to integrate with the Active Directory domain. This option supports Windows 2008 DCs and higher and supports authentication across domains.
If the network contains any domain controllers running Windows 2003 or older operating system versions, you must explicitly specify a list of Windows 2008 DCs in the Domain Controller Names field; see the instructions under “Domain Controller Name(s)” in this table for details.
Control Description
Configuring Network Integration Features | 389
Joining a Windows domain or workgroup
4. Click Apply to apply your settings to the running configuration.
5. Click Save to save your settings permanently.
When you have successfully joined the domain, the status updates to In a Domain.
The next step is to enable protocol optimization for CIFS (SMB) or encrypted MAPI. See “Configuring CIFS optimization” on page 174 and “Configuring MAPI optimization” on page 206.
Troubleshooting a domain join failure
This section describes common problems that can occur when joining a Windows domain.
RiOS features a domain health tool to identify, diagnose, and report possible problems with a SteelHead
within a Windows domain environment. For details, see “Checking domain health” on page 632.
You must have Administrator privileges. Additionally, if the user account is in a domain that is different from the domain to which the join is being performed, specify the user account in the format domain\username. Do not specify the user account in the format username@realmname. In this case, domain is the short domain name of the domain to which the user belongs.
Even though the SteelHead is integrated with Active Directory, it doesn’t provide any Windows domain controller functionality to any other machines in the domain.
Domain Login Specify the login name, which must have domain join privileges.
Domain administrator credentials aren’t strictly required, except when you join the domain as an Active Directory integration.
RiOS deletes domain administrator credentials after the join.
Password Specify the password. This control is case sensitive.
Domain Controller Name(s)
Specify the hosts that provide user login service in the domain, separated by commas. (Typically, with Windows 2000 Active Directory Service domains, given a domain name, the system automatically retrieves the DC name.)
Specifying domain controller names is required if you are joining the domain in Active Directory integrated mode 2008 and higher, and the network contains domain controllers running Windows 2003 or older operating system versions.
We recommend specifying the domain controller names in environments where there’s varying latency between the SteelHead and the domain controllers.
Short Domain Name Specify the short domain (NetBIOS) name if it doesn’t match the first portion of the Active Directory domain name. Case matters; NBTTECH is not the same as nbttech.
Join/Leave Joins the domain or leaves the domain.
Note: If you are in domain mode and have joined a domain, you can’t change to local workgroup mode until you leave the domain.
Rejoin Rejoins the domain.
Cancel Cancels any current domain action that is in progress, such as joining or leaving a domain.
Control Description
390 | Configuring Network Integration Features
Configuring simplified routing features
System time mismatch
The number one cause of failing to join a domain is a significant difference in the system time on the
Windows domain controller and the SteelHead. When the time on the domain controller and the
SteelHead do not match, this error message appears:
lt-kinit: krb5_get_init_creds: Clock skew too great
We recommend using NTP time synchronization to synchronize the client and server clocks. It is critical
that the SteelHead time is the same as on the Active Directory controller. Sometimes an NTP server is
down or inaccessible, in which case there can be a time difference. You can also disable NTP if it is not
being used and manually set the time. You must also verify that the time zone is correct. For details, see
“Modifying general host settings” on page 53.
Note: Select the primary DNS IP address to view the Networking: Host Settings page.
Invalid domain controller IP
A domain join can fail when the DNS server returns an invalid IP address for the domain controller. When
a DNS misconfiguration occurs during an attempt to join a domain, these error messages appear:
Failed to join domain: failed to find DC for domain <domain-name> Failed to join domain: No Logon Servers
Additionally, the Domain Join alarm triggers and messages similar to these appear in the logs:
Oct 13 14:47:06 bravo-sh81 rcud[10014]: [rcud/main/.ERR] - {- -} Lookup for bravo-sh81.GEN-VCS78DOM.COM FailedOct 13 14:47:06 bravo-sh81 rcud[10014]: [rcud/main/.ERR] - {- -} Failed to join domain: failed to find DC for domain GEN-VCS78DOM.COM
When you encounter this error, choose Networking > Networking > Host Settings and verify that the DNS
settings are correct.
Related topics
• “Configuring SMB signing” on page 181
• “Configuring NFS optimization” on page 214
• “Modifying general host settings” on page 53
Configuring simplified routing featuresYou can enable simplified routing in the Networking > Network Integration: Simplified Routing page.
Simplified routing collects the IP address for the next hop MAC address from each packet it receives to
address traffic. With simplified routing, you can use either the WAN or LAN side device as a default
gateway. The RiOS appliance learns the right gateway to use by watching where the switch or router
sends the traffic, and associating the next-hop Ethernet addresses with IP addresses. Enabling simplified
routing eliminates the need to add static routes when the appliance is in a different subnet from the
client and the server.

Configuring Network Integration Features | 391
Configuring simplified routing features
Without simplified routing, if an appliance is installed in a different subnet from the client or server, you
must define one router as the default gateway and static routes for the other routers so that traffic is not
redirected back through the appliance. In some cases, even with the static routes defined, the ACL on
the default gateway can still drop traffic that should have gone through the other router. Enabling
simplified routing eliminates this issue.
Simplified routing has these constraints:
• WCCP cannot be enabled.
• The default route must exist on each RiOS appliance in your network.
Note: For detailed configuration information, see the SteelHead Deployment Guide.
The SteelHead-c is not deployed in-path, but in its unique out-of-path method, using one interface.
Simplified routing does not apply.
The simplified routing feature is compatible with IPv6.
To enable simplified routing
1. Choose Networking > Network Integration: Simplified Routing to display the Simplified Routing page.
Figure 10-8. Simplified Routing page
2. Under Mapping Data Collection Setting, complete the configuration as described in this table.
3. Click Apply to save your settings to the running configuration.
4. Click Save to save your settings permanently.
Control Description
Collect Mappings From Select one of these options from the drop-down list:
• None - Does not collect mappings.
• Destination Only - Collects destination MAC data. Use this option in connection-forwarding deployments. This is the default setting.
• Destination and Source - Collects mappings from destination and source MAC data. Use this option in connection-forwarding deployments.
• All - Collects mappings for destination, source, and inner MAC data. Also collect data for connections that are un-NATed (that is, connections that aren’t translated using NAT).

392 | Configuring Network Integration Features
Configuring WCCP
Related topics
• “In-path rules overview” on page 87
• “Configuring connection forwarding features” on page 366
Configuring WCCP You can enable WCCP service groups in the Networking > Network Integration: WCCP page.
WCCP enables you to redirect traffic that is not in the direct physical path between the client and the
server. To enable WCCP, the RiOS appliance must join a service group at the router. A service group is a
group of routers and RiOS appliances that define the traffic to redirect, and the routers and RiOS
appliances the traffic goes through. You might use one or more service groups to redirect traffic to the
RiOS appliances for optimization.
RiOS allows each individual RiOS appliance in-path interface to be configured as a WCCP client. Each
configured in-path interface participates in WCCP service groups as an individual WCCP client, providing
flexibility to determine load balancing proportions and redundancy.
You must enable connection forwarding in a WCCP cluster. A WCCP cluster refers to two or more RiOS
appliances participating in the same service group. By default, RiOS provides load balancing across all
participating appliances in a WCCP cluster. With connection forwarding enabled, the WCCP load
balancing algorithm considers the total number of in-path interfaces of all neighbors in the service
group when balancing the traffic load across the interfaces. If you do not enable connection forwarding,
the RiOS appliance with the lowest IP address assigns all traffic flows to itself.
If you add the interface of a client-side appliance to a WCCP service group, you must also configure the
appliance with subnet side rules to identify LAN-side traffic. Otherwise, the appliance does not optimize
traffic from client-side connections. In virtual in-path configurations, all traffic flows in and out of one
physical interface, and the default subnet side rule causes all traffic to appear to originate from the WAN
side of the device. For more information, see “Configuring subnet side rules” on page 373.
Enabling WCCP is optional.
WCCP does not support IPv6.
Note: You can also use the CLI to configure WCCP service groups. For detailed configuration information (including
configuring the WCCP router), see the SteelHead Deployment Guide.
The AWS SteelHead-c does not support L4/PBR/WCCP configuration. The ESX SteelHead-c
supports it.
To enable a WCCP service group
Note: Before configuring your WCCP service group, you must enable L4/PBR/WCCP support in the General Service
Settings page. For details, see “Configuring general service settings” on page 108.

Configuring Network Integration Features | 393
Configuring WCCP
1. Choose Networking > Network Integration: WCCP to display the WCCP page.
Figure 10-9. WCCP page
2. Under WCCP Service Groups, complete the configuration as described in this table.
3. Click Apply to save your settings to the running configuration.
Control Description
Enable WCCP v2 Support Enables WCCPv2 support on all groups added to the Service Group list.
Multicast TTL Specify the TTL boundary for the WCCP protocol packets. The default value is 16.
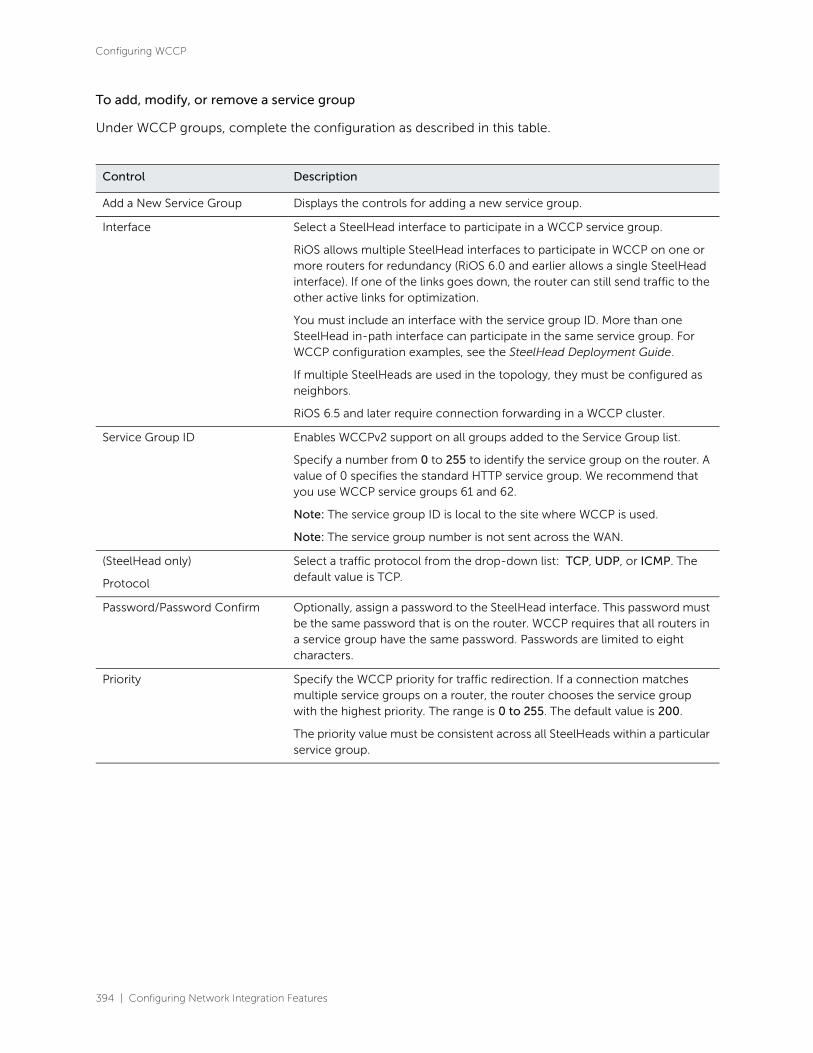
394 | Configuring Network Integration Features
Configuring WCCP
To add, modify, or remove a service group
Under WCCP groups, complete the configuration as described in this table.
Control Description
Add a New Service Group Displays the controls for adding a new service group.
Interface Select a SteelHead interface to participate in a WCCP service group.
RiOS allows multiple SteelHead interfaces to participate in WCCP on one or more routers for redundancy (RiOS 6.0 and earlier allows a single SteelHead interface). If one of the links goes down, the router can still send traffic to the other active links for optimization.
You must include an interface with the service group ID. More than one SteelHead in-path interface can participate in the same service group. For WCCP configuration examples, see the SteelHead Deployment Guide.
If multiple SteelHeads are used in the topology, they must be configured as neighbors.
RiOS 6.5 and later require connection forwarding in a WCCP cluster.
Service Group ID Enables WCCPv2 support on all groups added to the Service Group list.
Specify a number from 0 to 255 to identify the service group on the router. A value of 0 specifies the standard HTTP service group. We recommend that you use WCCP service groups 61 and 62.
Note: The service group ID is local to the site where WCCP is used.
Note: The service group number is not sent across the WAN.
(SteelHead only)
Protocol
Select a traffic protocol from the drop-down list: TCP, UDP, or ICMP. The default value is TCP.
Password/Password Confirm Optionally, assign a password to the SteelHead interface. This password must be the same password that is on the router. WCCP requires that all routers in a service group have the same password. Passwords are limited to eight characters.
Priority Specify the WCCP priority for traffic redirection. If a connection matches multiple service groups on a router, the router chooses the service group with the highest priority. The range is 0 to 255. The default value is 200.
The priority value must be consistent across all SteelHeads within a particular service group.

Configuring Network Integration Features | 395
Configuring WCCP
Weight Specify the percentage of connections that are redirected to a particular SteelHead interface, which is useful for traffic load balancing and failover support. The number of TCP, UDP, or ICMP connections a SteelHead supports determines its weight. The more connections a SteelHead model supports, the heavier the weight of that model. In RiOS 6.1 and later, you can modify the weight for each in-path interface to manually tune the proportion of traffic a SteelHead interface receives.
A higher weight redirects more traffic to that SteelHead interface. The ratio of traffic redirected to a SteelHead interface is equal to its weight divided by the sum of the weights of all the SteelHead interfaces in the same service group. For example, if there are two SteelHeads in a service group and one has a weight of 100 and the other has a weight of 200, the one with the weight 100 receives 1/3 of the traffic and the other receives 2/3 of the traffic.
However, since it’s generally undesirable for a SteelHead with two WCCP in-path interfaces to receive twice the proportion of traffic, for SteelHeads with multiple in-paths connected, each of the in-path weights is divided by the number of that SteelHead's interfaces participating in the service group.
As an example, if there are two SteelHeads in a service group and one has a single interface with weight 100 and the other has two interfaces each with weight 200, the total weight will still equal 300 (100 + 200/2 + 200/2). The one with the weight 100 receives 1/3 of the traffic and each of the other's in-path interfaces receives 1/3 of the traffic.
The range is 0 to 65535. The default value corresponds to the number of TCP connections your SteelHead supports.
Failover Support
To enable single in-path failover support with WCCP groups, define the service group weight to be 0 on the backup SteelHead. If one SteelHead has a weight 0, but another one has a nonzero weight, the SteelHead with weight 0 doesn’t receive any redirected traffic. If all the SteelHeads have a weight 0, the traffic is redirected equally among them.
The best way to achieve multiple in-path failover support with WCCP groups in RiOS 6.1 and later is to use the same weight on all interfaces from a given SteelHead for a given service group. For example, suppose you have SteelHead A and SteelHead B with two in-path interfaces each. When you configure SteelHead A with weight 100 from both inpath0_0 and inpath0_1 and SteelHead B with weight 200 from both inpath0_0 and inpath0_1, RiOS distributes traffic to SteelHead A and SteelHead B in the ratio of 1:2 as long as at least one interface is up on both SteelHeads.
In a service group, if an interface with a nonzero weight fails, its weight transfers over to the weight 0 interface of the same service group.
For details on using the weight parameter to balance traffic loads and provide failover support in WCCP, see the SteelHead Deployment Guide.
Control Description
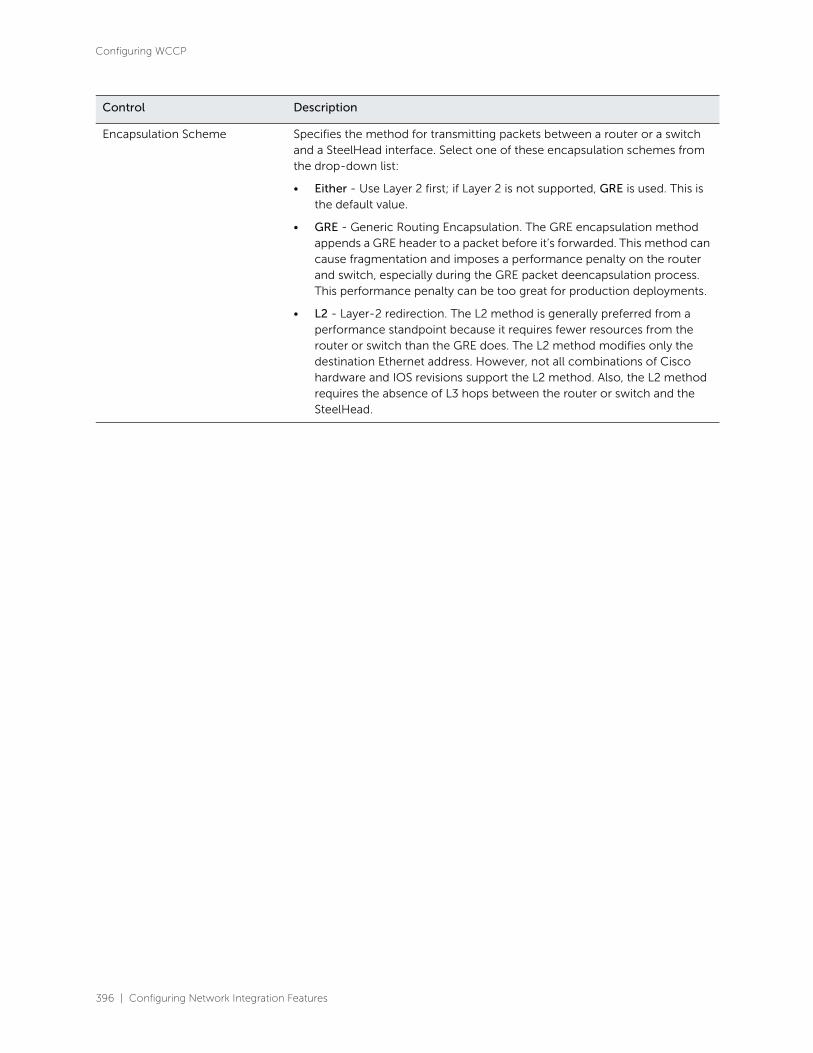
396 | Configuring Network Integration Features
Configuring WCCP
Encapsulation Scheme Specifies the method for transmitting packets between a router or a switch and a SteelHead interface. Select one of these encapsulation schemes from the drop-down list:
• Either - Use Layer 2 first; if Layer 2 is not supported, GRE is used. This is the default value.
• GRE - Generic Routing Encapsulation. The GRE encapsulation method appends a GRE header to a packet before it’s forwarded. This method can cause fragmentation and imposes a performance penalty on the router and switch, especially during the GRE packet deencapsulation process. This performance penalty can be too great for production deployments.
• L2 - Layer-2 redirection. The L2 method is generally preferred from a performance standpoint because it requires fewer resources from the router or switch than the GRE does. The L2 method modifies only the destination Ethernet address. However, not all combinations of Cisco hardware and IOS revisions support the L2 method. Also, the L2 method requires the absence of L3 hops between the router or switch and the SteelHead.
Control Description

Configuring Network Integration Features | 397
Configuring WCCP
Assignment Scheme Determines which SteelHead interface in a WCCP service group the router or switch selects to redirect traffic to for each connection. The assignment scheme also determines whether the SteelHead interface or the router processes the first traffic packet. The optimal assignment scheme achieves both load balancing and failover support. Select one of these schemes from the drop-down list:
• Either - Uses Hash assignment unless the router doesn’t support it. When the router doesn’t support Hash, it uses Mask. This is the default setting.
• Hash - Redirects traffic based on a hashing scheme and the Weight of the SteelHead interface, providing load balancing and failover support. This scheme uses the CPU to process the first packet of each connection, resulting in slightly lower performance. However, this method generally achieves better load distribution. We recommend Hash assignment for most SteelHeads if the router supports it. The Cisco switches that don’t support Hash assignment are the 3750, 4000, and 4500 series, among others.
Your hashing scheme can be a combination of the source IP address, destination IP address, source port, or destination port.
• Mask - Redirects traffic operations to the SteelHeads, significantly reducing the load on the redirecting router. Mask assignment processes the first packet in the router hardware, using less CPU cycles and resulting in better performance.
Mask assignment supports load-balancing across multiple active SteelHead interfaces in the same service group.
The default mask scheme uses an IP address mask of 0x1741, which is applicable in most situations. However, you can change the IP mask by clicking the service group ID and changing the service group settings and flags.
In multiple SteelHead environments, it’s often desirable to send all users in a subnet range to the same SteelHead. Using mask provides a basic ability to leverage a branch subnet and SteelHead to the same SteelHead in a WCCP cluster.
For details and best practices for using assignment schemes, see the SteelHead Deployment Guide.
Note: If you use mask assignment you must ensure that packets on every connection and in both directions (client-to-server and server-to-client), are redirected to the same SteelHead. For details, see the SteelHead Deployment Guide.
(SteelHead only)
Source
• IP Mask - Specify the service group source IP mask. The default value is 0x1741.
• Port Mask - Specify the service group source port mask.
• IP Hash - Specify that the router hash the source IP address to determine traffic to redirect.
• Port Hash - Specify that the router hash the source port to determine traffic to redirect.
Control Description

398 | Configuring Network Integration Features
Configuring WCCP
4. Click Save to save your settings permanently.
Verifying a multiple in-path interface configuration
This section describes how to verify that multiple appliances are participating in WCCP with one or more
routers using a multiple in-path interface configuration.
1. Because the appliances are configured as neighbors, messages appear in the log at INFO level when the neighbors connect to each other, and the log displays a list of in-path IP addresses.
2. When the weight computation is about to begin, a message appears in the log at INFO level that the appliance interface with the lowest IP address is taking over as the lead cache.
3. When the weight computation is complete, a REDIRECT_ASSIGN WCCP message appears from the appliance interface with the lowest IP address. This message includes the load balancing information from the hash or mask value table.
Note: For more WCCP troubleshooting, see the SteelHead Deployment Guide.
Modifying WCCP group settings
You modify WCCP service group settings, add additional routers to a service group, and set flags for
source and destination ports to redirect traffic (that is, the hash table settings) in the Networking > WCCP
Service Group: <group ID> page.
(SteelHead only)
Destination
• IP Mask - Specify the service group destination IP mask.
• Port Mask - Specify the service group destination port mask.
• IP Hash - Specify that the router hash the destination IP address to determine traffic to redirect.
• Port Hash - Specify that the router hash the destination port to determine traffic to redirect.
(SteelHead only)
Ports Mode
Select one of these modes from the drop-down list:
• Ports Disabled - Select to disable the ports.
• Use Source Ports - The router determines traffic to redirect based on source ports.
• Use Destination Ports - The router determines traffic to redirect based on destination ports.
(SteelHead only)
Ports
Specify a comma-separated list of up to seven ports that the router will redirect. Use this option only after selecting either the Use Source Ports or the Use Destination Ports mode.
Router IP Address(es) Specify a multicast group IP address or a unicast router IP address. You can specify up to 32 routers.
Add Adds the service group.
Remove Selected Groups Select the check box next to the name and click Remove Selected Groups.
Control Description

Configuring Network Integration Features | 399
Configuring hardware-assist rules
Before you can modify WCCP service group settings, you must create a WCCP service group. For details
about creating a WCCP service group, see “Configuring WCCP” on page 392.
When you are modifying service group settings, the service group description includes the interface.
To modify WCCP service group settings
1. Choose Networking > Network Integration: WCCP to display the WCCP page.
2. Select the service group ID in the Groups list to expand the page.
3. Under Editing Service Group <name><interface>, modify the settings.
4. Click Apply to save your settings to the running configuration.
5. Click Save to save your settings permanently.
Related topics
• “Configuring general service settings” on page 108
• “Verifying a multiple in-path interface configuration” on page 398
Configuring hardware-assist rulesYou configure hardware-assist rules in the Networking > Network Services > Hardware Assist Rules page.
This feature only appears on an appliance equipped with one or more Two-Port SR Multimode Fiber 10
Gigabit-Ethernet or Two-Port LR Single Mode Fiber 10 Gigabit-Ethernet PCI-E cards.
Hardware-assist rules can automatically bypass all User Datagram Protocol (UDP) connections. You can
also configure rules for bypassing specific Transmission Control Protocol (TCP) connections.
Automatically bypassing these connections decreases the work load on the local appliances because the
traffic is immediately sent to the kernel of the host machine or out of the other interface before the
appliance receives it.
The maximum number of hardware-assist rules is 50.
Note: For a hardware-assist rule to be applied to a specific 10G bypass card, the corresponding in-path interface
must be enabled and have an IP address.
To configure hardware-assist rules
1. Choose Networking > Network Services: Hardware Assist Rules to display the Hardware Assist Rules page.
2. Under 10G NIC Hardware Assist Rules Settings, enable pass-through as follows:
– To automatically pass through all UDP traffic, select the Enable Hardware Passthrough of All UDP Traffic check box.
– To pass through TCP traffic based on the configured rules, select the Enable Hardware Passthrough of TCP Traffic Defined in the Rules Below check box. TCP pass-through is controlled by rules. The next step describes how to step up hardware-assist rules.

400 | Configuring Network Integration Features
Configuring hardware-assist rules
RiOS ignores all hardware-assist rules unless you select this check box. No TCP traffic is passed through.
3. Under TCP Hardware Assist Rules, complete the configuration as described in this table.
Control Description
Add a New Rule Displays the controls for adding a new rule.
Type Select a rule type:
• Accept - Accepts rules matching the Subnet A or Subnet B IP address and mask pattern for the optimized connection.
• Pass-Through - Identifies traffic to be passed through the network unoptimized.
Insert Rule At Determines the order in which the system evaluates the rule. Select Start, End, or a rule number from the drop-down list.
The system evaluates rules in numerical order starting with rule 1. If the conditions set in the rule match, then the rule is applied and the system moves on to the next rule. For example, if the conditions of rule 1 do not match, rule 2 is consulted. If rule 2 matches the conditions, it is applied, and no further rules are consulted.
In general, filter traffic that is to be unoptimized, discarded, or denied before processing rules for traffic that is to be optimized.
Subnet A Specify an IP address and mask for the subnet that can be both source and destination together with Subnet B.
Use this format: xxx.xxx.xxx.xxx/xx
Note: You can specify all or 0.0.0.0/0 as the wildcard for all traffic.
Subnet B Specify an IP address and mask for the subnet that can be both source and destination together with Subnet A.
Use this format: xxx.xxx.xxx.xxx/xx
Note: You can specify all or 0.0.0.0/0 as the wildcard for all traffic.
VLAN Tag ID Optionally, specify a numeric VLAN tag identification number.
Select all to specify the rule applies to all VLANs.
Select untagged to specify the rule applies to nontagged connections.
Note: Pass-through traffic maintains any preexisting VLAN tagging between the LAN and WAN interfaces.
Note: To complete the implementation of VLAN tagging, you must set the VLAN tag IDs for the in-path interfaces that the appliance uses to communicate with other RiOS appliances. For details about configuring the in-path interface for the appliance, see “Configuring in-path rules” on page 90.
Description Optionally, include a description of the rule.

Configuring Network Integration Features | 401
Configuring hardware-assist rules
Add Adds the new hardware-assist rule to the list. You can add up to a maximum number of 50 rules.
• RiOS applies the same rule to both LAN and WAN interfaces.
• Every 10G card has the same rule set.
The appliance refreshes the hardware-assist rules table and applies your modifications to the running configuration, which is stored in memory.
Remove Selected Rules Select the check box next to the name and click Remove Selected Rules.
Move Selected Rules Moves the selected rules. Click the arrow next to the desired rule position; the rule moves to the new position.
Control Description

402 | Configuring Network Integration Features
Configuring hardware-assist rules
Managing SteelFusion Edges | 403
11
Managing SteelFusion Edges
This chapter describes tasks you perform for routine management of the SteelFusion Edge. It includes
these sections:
• “Starting and stopping the optimization service” on page 403
• “Configuring scheduled jobs” on page 404
• “Upgrading your software and verifying the image” on page 406
• “Rebooting and shutting down” on page 408
• “Managing licenses and model upgrades” on page 409
• “Viewing permissions” on page 413
• “Managing configuration files” on page 414
• “Configuring general security settings” on page 417
• “Managing user permissions” on page 418
• “Managing password policy” on page 423
• “Setting RADIUS servers” on page 427
• “Configuring SAML” on page 429
• “Configuring TACACS+ access” on page 433
• “Unlocking the secure vault” on page 434
• “Configuring a management ACL” on page 436
• “Configuring web settings” on page 440
• “Enabling REST API access” on page 443
Starting and stopping the optimization serviceYou can start, stop, and restart the optimization service in the Administration > Maintenance: Services
page. You can also use this page to reset the optimization service alarm after it has been triggered.
The optimization service is a daemon that executes in the background, performing operations when
required.
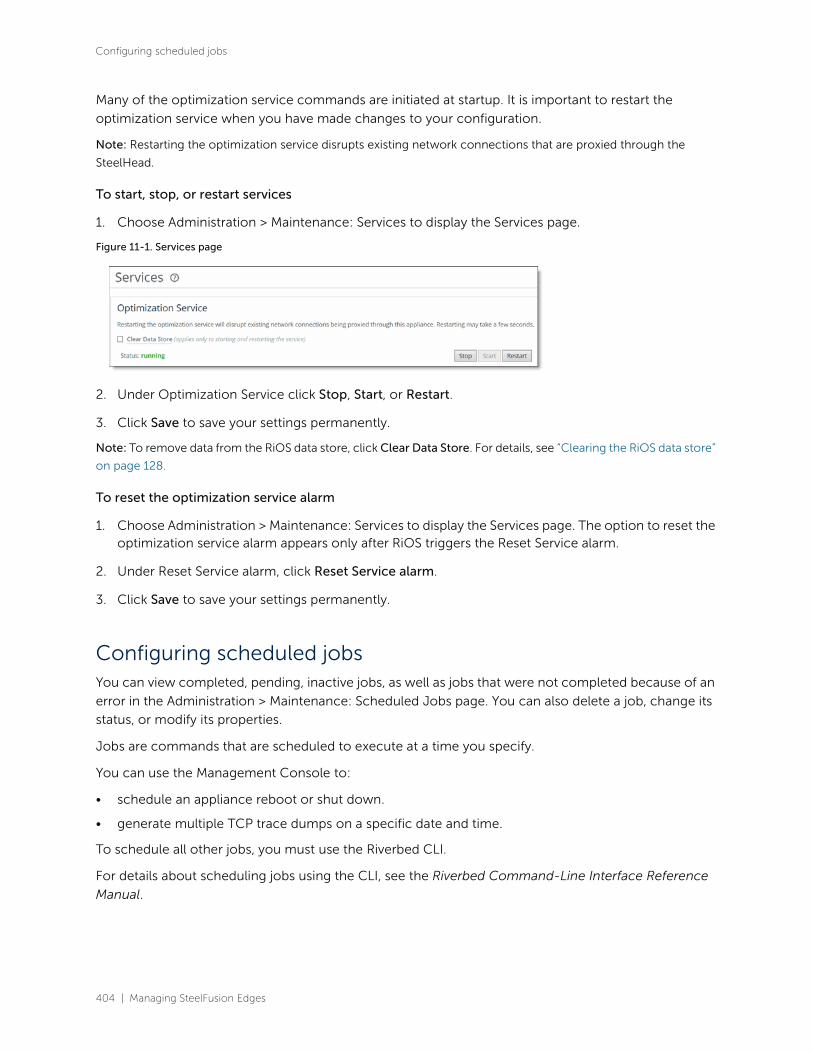
404 | Managing SteelFusion Edges
Configuring scheduled jobs
Many of the optimization service commands are initiated at startup. It is important to restart the
optimization service when you have made changes to your configuration.
Note: Restarting the optimization service disrupts existing network connections that are proxied through the
SteelHead.
To start, stop, or restart services
1. Choose Administration > Maintenance: Services to display the Services page.
Figure 11-1. Services page
2. Under Optimization Service click Stop, Start, or Restart.
3. Click Save to save your settings permanently.
Note: To remove data from the RiOS data store, click Clear Data Store. For details, see “Clearing the RiOS data store”
on page 128.
To reset the optimization service alarm
1. Choose Administration > Maintenance: Services to display the Services page. The option to reset the optimization service alarm appears only after RiOS triggers the Reset Service alarm.
2. Under Reset Service alarm, click Reset Service alarm.
3. Click Save to save your settings permanently.
Configuring scheduled jobs You can view completed, pending, inactive jobs, as well as jobs that were not completed because of an
error in the Administration > Maintenance: Scheduled Jobs page. You can also delete a job, change its
status, or modify its properties.
Jobs are commands that are scheduled to execute at a time you specify.
You can use the Management Console to:
• schedule an appliance reboot or shut down.
• generate multiple TCP trace dumps on a specific date and time.
To schedule all other jobs, you must use the Riverbed CLI.
For details about scheduling jobs using the CLI, see the Riverbed Command-Line Interface Reference
Manual.

Managing SteelFusion Edges | 405
Configuring scheduled jobs
To configure scheduled jobs
1. Choose Administration > Maintenance: Scheduled Jobs to display the Scheduled Jobs page.
Figure 11-2. Scheduled Jobs page
2. Select Enabled or Disabled from the drop-down list to enable or disable the job.
3. Select the Job ID number to display details about the job.
4. Under Details for Job <#>, complete the configuration as described in this table.
Control Description
Name Specify a name for the job.
Comment Specify a comment.
Interval (seconds) Specify the number of seconds between job recurrences. Specify 0 to run the job one-time only.
Executes on Specify the start time and end time using the format yyyy/mm/dd hh:mm:ss.
Enable/Disable Job Select the check box to enable the job, clear the check box to disable the job.
(SteelHead CX only)
Interval (seconds)
Specify how often the job runs. The default value is 0, which runs the job once.
(SteelHead CX only)
Executes On
Specify the date on which the job runs.

406 | Managing SteelFusion Edges
Upgrading your software and verifying the image
5. Click Save to save your settings permanently.
Upgrading your software and verifying the imageYou can upgrade, downgrade, or revert to a backup version of the SteelFusion Edge software in the
Administration > Maintenance: Software Upgrade page. This section includes:
• “Upgrading your software” on page 406
• “Downgrading your software” on page 407
• “Verifying your software image” on page 408
The top of the page displays the current version number and the backup version.
The SteelFusion version history appears at the bottom of the page. Select a column heading to sort the
column in ascending or descending order.
The RiOS software upgrade is separate from the hypervisor upgrade. Upgrading or changing the RiOS
version does not affect the ESXi version. For details on upgrading the hypervisor, see “Upgrading the
hypervisor” on page 45.
Upgrading your software
This section describes how to upgrade your software.
To upgrade your software
1. Download the software image from the Riverbed Support site to a location such as your desktop. Optionally, you can download a delta image directly from the Riverbed Support site to the SteelFusion Edge. The download image includes only the incremental changes. The smaller file size means a faster download and less load on the network. To download a delta image, skip to Step 2.
2. Log in to the Management Console using the Administrator account (admin).
3. Go to the Administration > Maintenance: Software Upgrade page and select the Add Image tab.
4. Select one of these options:
(SteelHead CX only)
Enable/Disable Job
Select to enable the job to run at the specified date or clear to prevent the job from running.
Apply Changes Applies the changes to the current configuration.
Cancel/Remove This Job
Cancels and removes the job.
Execute Now Runs the job.
Remove Selected Jobs Select the check box next to the name and click Remove Selected Jobs.
Control Description

Managing SteelFusion Edges | 407
Upgrading your software and verifying the image
– From URL - Type the URL that points to the software image in the text box. You can use HTTP, HTTPS, FTP, or SCP formats for the URL.
– From Riverbed Support Site - Click this option and select the target release number from the drop-down list.
– From Local File - Browse your file system and select the software image.
5. Specify a name for the image.
If you specify a name that already exists on the appliance, the new image overwrites the existing image.
6. Click Add Image.
When the image transfers to the appliance, the Install Image section is available.
7. Click Install.
The system installs the image in the backup partition and sets the option to load the backup partition version on reboot.
8. Reboot the Edge.
If you upgrade to a new software release, change the password, and then downgrade to the previous
release an invalid password message appears.
Downgrading your software
If you want to downgrade to a previous version of the Edge software, you must downgrade to a version
of the software that has previously run on your machine.
When you downgrade the software, Edge reverts the ESXi version to the version supported in the
installation image. If you upgraded the ESXi using vCenter, the system cannot restore the state and ESXi
starts with the initial configuration.
Edge appliances cannot use an encrypted RiOS data store with an earlier RiOS version, unless the release
is an update (9.0.x). For example, an encrypted RiOS data store created in 9.0.1 would work with 9.0.3,
but not with 9.1.
Before downgrading to an earlier software version, you must select None as the encryption type, clear
the RiOS data store, and restart the service in the Optimization > Data Replication: Data Store page. After
you clear the RiOS data store, the data is removed from persistent storage and cannot be recovered. If
you are using the server-based backups feature, you must delete all backup policies and clear snapshots
on the storage array before downgrading. For details, see the SteelFusion Core User Guide.
To switch to the backup version
1. Log in to the Management Console using the Administrator account (admin).
2. Go to the Administration > Maintenance: Software Upgrade page and click Switch to Backup Version.
3. Reboot the appliance or click Cancel Version Switch to cancel.
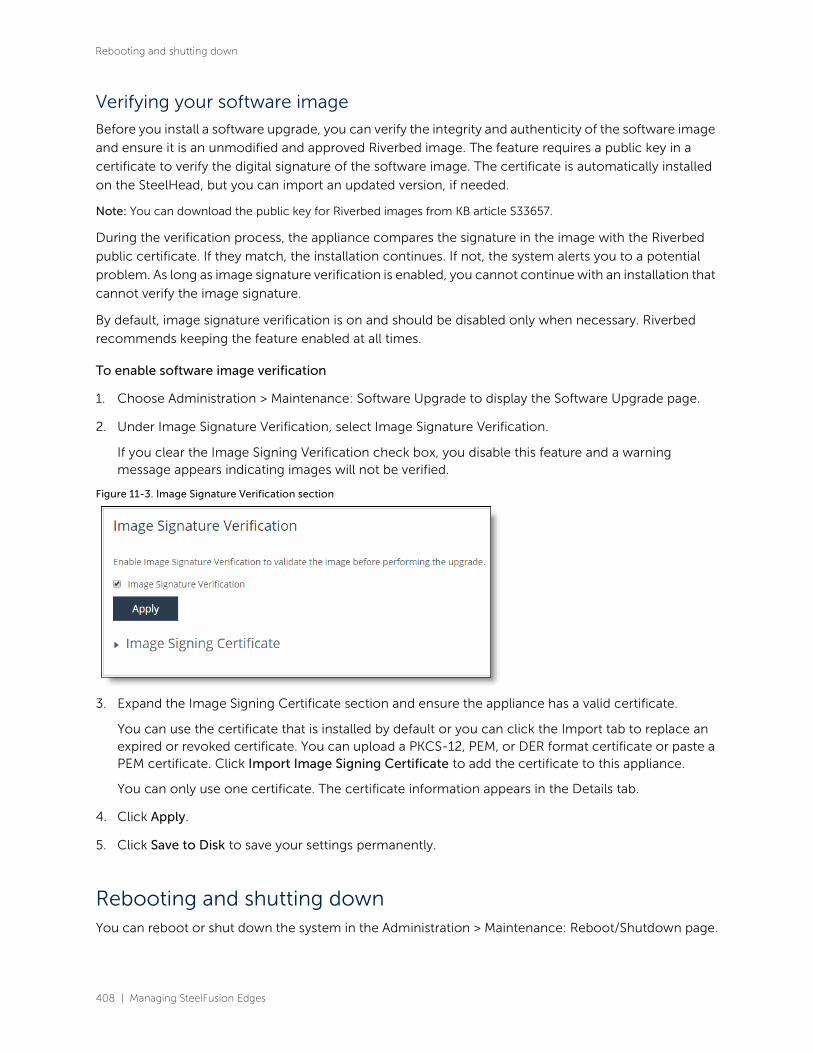
408 | Managing SteelFusion Edges
Rebooting and shutting down
Verifying your software image
Before you install a software upgrade, you can verify the integrity and authenticity of the software image
and ensure it is an unmodified and approved Riverbed image. The feature requires a public key in a
certificate to verify the digital signature of the software image. The certificate is automatically installed
on the SteelHead, but you can import an updated version, if needed.
Note: You can download the public key for Riverbed images from KB article S33657.
During the verification process, the appliance compares the signature in the image with the Riverbed
public certificate. If they match, the installation continues. If not, the system alerts you to a potential
problem. As long as image signature verification is enabled, you cannot continue with an installation that
cannot verify the image signature.
By default, image signature verification is on and should be disabled only when necessary. Riverbed
recommends keeping the feature enabled at all times.
To enable software image verification
1. Choose Administration > Maintenance: Software Upgrade to display the Software Upgrade page.
2. Under Image Signature Verification, select Image Signature Verification.
If you clear the Image Signing Verification check box, you disable this feature and a warning message appears indicating images will not be verified.
Figure 11-3. Image Signature Verification section
3. Expand the Image Signing Certificate section and ensure the appliance has a valid certificate.
You can use the certificate that is installed by default or you can click the Import tab to replace an expired or revoked certificate. You can upload a PKCS-12, PEM, or DER format certificate or paste a PEM certificate. Click Import Image Signing Certificate to add the certificate to this appliance.
You can only use one certificate. The certificate information appears in the Details tab.
4. Click Apply.
5. Click Save to Disk to save your settings permanently.
Rebooting and shutting downYou can reboot or shut down the system in the Administration > Maintenance: Reboot/Shutdown page.

Managing SteelFusion Edges | 409
Managing licenses and model upgrades
Rebooting the Edge disrupts existing network connections that are currently proxied through it. When
you reboot the Edge, RiOS tells the hypervisor to shut down as well. After the hypervisor shuts down
gracefully, RiOS reboots and the hypervisor reboots. Rebooting can take a few minutes.
When you shut down the system, connections are broken and optimization ceases. When you shut
down the Edge, RiOS tells the hypervisor to shut down as well. After the hypervisor shuts down
gracefully, RiOS shuts down. Shutting down the appliance can take a few minutes.
To restart the system after shutting down, you must manually enable the SteelFusion Edge. The
hypervisor will restart as well.
To reboot or shut down the system
1. Choose Administration > Maintenance: Reboot/Shutdown to display the Reboot/Shutdown page.
Figure 11-4. Reboot/Shutdown page
2. To clear the RiOS data store of data, select the Clear Data Store check box. Clearing the data store degrades performance until the system repopulates the data.
3. Click Reboot. After you click Reboot, you are logged out of the system and both RiOS and the hypervisor reboot.
4. Click Shut Down to shut down the system. After you click Shut Down, the system is powered down. To restart the system, you must manually power on the appliance.
A warning that you have unsaved changes indicates that the hypervisor is not in a safe state to shut down. For example, it could be creating a disk, pushing a configuration, initializing, or in lockdown mode. If you receive this warning, click Cancel and wait for the hypervisor to return to a state in which it is safe to shut down or ignore the warning to continue.
To schedule a reboot
1. Choose Administration > Maintenance: Reboot/Shutdown to display the Reboot/Shutdown page.
2. Select Schedule for Later and enter the date and time you would like the reboot to occur.
The reboot executes at the scheduled time.
Managing licenses and model upgradesThis section describes how to install, update, and remove a license. It also describes how to use flexible
licensing to manage model configurations and upgrades. It includes these topics:
410 | Managing SteelFusion Edges
Managing licenses and model upgrades
• “Licensing overview” on page 410
• “Installing a license” on page 410
• “Upgrading an appliance model” on page 412
• “Removing a license” on page 413
You perform all license management and SteelFusion Edge model upgrades in the Administration >
Maintenance: Licenses page.
Licenses can be permanent or temporary. Permanent licenses do not display an expiration date in their
Status column on the Licenses page; temporary licenses display an expiration date in their Status
column. For example, evaluation licenses typically expire in 60 days and display a date within that range.
The system warns you two weeks before a license expires with the Expiring License alarm. After a license
expires, the system warns with an Expired License alarm. You can add a license to extend the
functionality of an expiring licenses. If multiple licenses exist for a feature, the system uses the license
with the latest expiration date.
Licensing overview
These Riverbed licenses are mandatory for virtualization in the appliance:
• VSPBASE - The VSP base license to manage virtualization and VSP operations.
• VSP(ESXi) - The license to install the embedded ESXi software.
After installing and connecting the Edge appliance, the Riverbed Licensing Portal is automatically
contacted to retrieve and install the required license keys onto the Edge appliance. If either of the
licenses have expired or are about to expire, an alarm is triggered in the Management Console Alarms
page.
The Edge appliance ships with an embedded VMware ESXi vSphere Hypervisor license. This license is the
free bare-metal hypervisor that virtualizes servers so you can consolidate your applications on less
hardware. This license enables basic hypervisor functions without support for more advanced vSphere
features such as vCenter, vMotion, high availability, and so on. If you need additional features beyond
what the embedded vSphere Hypervisor license provides, you will need to purchase a license upgrade
through your VMware reseller.
The Edge includes a license for BlockStream by default. The SCPS and FIPS licenses are optional add-
ons.
For details on licensing requirements for virtualization, see the SteelFusion Edge Installation and
Configuration Guide.
For details on upgrade possibilities by appliance model, see the SteelFusion Edge Hardware and
Maintenance Guide.
Installing a license
This section describes how to request and fetch a license manually from the Riverbed license portal or
install a license manually after receiving it from Riverbed Support or Sales.

Managing SteelFusion Edges | 411
Managing licenses and model upgrades
RiOS simplifies license management by providing an automated way to fetch and activate licenses for
Riverbed products. You do not have to manually activate individual appliances and install the licenses.
Fetching a license is restricted for read-only users such as monitor and role-based management (RBM)
users with read-only access for General Settings (permissions are granted on the Administration >
Security: User Permissions page).
To install a license on a new Edge
• Connect a new Edge to the network.
The Edge automatically contacts the Riverbed license portal and downloads the licenses. The Licensing
page displays a success message or the Alarm Status page reports an actionable error message.
To replace expired licenses
• Purchase new downloadable licenses to replace the expired license.
At the time of the next scheduled automatic license fetch, the SteelFusion Edge automatically contacts
the Riverbed license portal and downloads the new licenses. The Licensing page displays a success
message or the alarm Status page reports an actionable error message.
To fetch a license on demand
1. Choose Administration > Maintenance: Licenses to display the Licenses page.
2. Click Fetch Updates Now.
The Licensing page displays a success message or the alarm Status page reports an actionable error
message.
To install a license
1. Choose Administration > Maintenance: Licenses to display the Licenses page.
Figure 11-5. Licenses page

412 | Managing SteelFusion Edges
Managing licenses and model upgrades
The Licenses page includes a table of licenses with a column showing the date and time the license was installed and the approximate relative time it was installed. The next column shows whether the installation was done manually or automatically.
Below the license table, next to the Fetch Updates Now button, a note displays the date and time of the last update. Normal update results appear in black and any errors appear in red.
2. Complete the configuration as described in this table.
3. Click Save to save your settings permanently.
Upgrading an appliance model
This section describes how to upgrade an appliance model.
To upgrade an appliance model
1. Install the upgrade license.
For details, see “Installing a license” on page 410.
2. Stop the optimization service.
For details, see “Starting and stopping the optimization service” on page 403.
3. Choose Administration > Maintenance: Licenses to display the Licenses page.
4. Select the model specification you want to activate.
If a model specification requires an appliance reboot after activation, the message activation reboots appliance appears.
5. Click Apply.
6. Click Restart Services to restart the optimization service.
For details, see “Starting and stopping the optimization service” on page 403.
When the upgrade is complete, the appliance is transformed into the new model. The model number
appears on the appliance banner in the upper-right corner of the page. The appliance retains its original
serial number.
For more details, see the Upgrade and Maintenance Guide.
Control Description
Add a New License Displays the controls to add a new license.
Licenses Text Box Copy and paste the license key provided by Riverbed Support or Sales into the text box.
Separate multiple license keys with a space, Tab, or Enter.
Add Adds the license.
Fetch Updates Now Contacts the Riverbed license portal and downloads all applicable licenses for the SteelHead.

Managing SteelFusion Edges | 413
Viewing permissions
Removing a license
We recommend that you keep old licenses in case you want to downgrade to an earlier software version;
however, in some situations you might want to remove a license.
To remove a license
1. Choose Administration > Maintenance: Licenses to display the Licenses page.
2. Select the license you want to delete.
3. Click Remove Selected.
4. Click Save to save your settings permanently.
Viewing permissionsYou can display your system permissions and add or change your login password in the My Account
page.
To display system permissions
1. Choose Administration > System Settings: My Account to display the My Account page.
Figure 11-6. My Account page
2. Under Password, complete the configuration as described in this table.
Control Description
Change Password Allows you to add or change your login password.

414 | Managing SteelFusion Edges
Managing configuration files
3. Click Apply to apply your changes to the running configuration.
The permissions list displays the roles and permissions assigned to your username.
Note: For details about setting user permissions, see “Managing user permissions” on page 418.
The My Account page includes a way to clear user preferences if any user settings result in an unsafe
state and the Management Console cannot display the page.
User preferences are set for individual users and do not affect the appliance configuration.
To restore the user preferences for the current user
1. Choose My Account to display the My Account page.
2. Under User Preferences, click Restore Defaults.
Managing configuration filesYou can save, activate, import, and revert configurations in the Administration > System Settings:
Configurations page.
Each SteelFusion Edge has an active, running configuration and a written, saved configuration.
When you Apply your settings in the Management Console, the values are applied to the active running
configuration, but the values are not written to disk and saved permanently.
When you Save your configuration settings, the values are written to disk and saved permanently. They
take effect after you restart the optimization service.
Each time you save your configuration settings, they are written to the current running configuration,
and a backup is created. For example, if the running configuration is myconfig and you save it, myconfig
is backed up to myconfig.bak and myconfig is overwritten with the current configuration settings.
The Configuration Manager is a utility that saves configurations as backups or active configuration
backups.
The Configuration Manager also includes an Import Configuration utility to support these common use
cases:
• Replacing a SteelFusion Edge appliance - If you are replacing one SteelFusion Edge for another, you can import all of the network information (although not the licenses) and disconnect the old SteelFusion Edge before you switch configurations on the new SteelFusion Edge.
New Password/Confirm New Password
Specify a password in the text box. Retype the password in the Confirm New Password text box.
Old Password (Appears when password policy is enabled and the Minimum Character Difference Between Passwords value is greater than 0). Non-administrators must specify the old password.
Administrators are never required to enter an old password when changing an account password.
Control Description

Managing SteelFusion Edges | 415
Managing configuration files
• Configuration template for a large deployment - You can avoid entering the complete SteelFusion Edge configuration for every appliance in a large deployment by setting up a template SteelFusion Edge and importing template settings to the configuration list.
Note: Some configuration settings require that you restart the optimization service for the settings to take effect.
For details about restarting the optimization service, see “Starting and stopping the optimization service” on
page 403.
To manage configurations
1. Choose Administration > System Settings: Configurations to display the Configurations page.
Figure 11-7. Configurations page
2. Under Current Configuration: <filename>, complete the configuration as described in this table.
Control Description
Current Configuration: <configuration-name>
View Running Config - Displays the running configuration settings in a new browser window.
Save - Saves settings that have been applied to the running configuration.

416 | Managing SteelFusion Edges
Managing configuration files
3. To import a configuration from another appliance, complete the configuration as described in this table.
4. Click Activate.
5. Restart the optimization service. For details, see “Starting and stopping the optimization service” on page 403.
Note: Select the configuration name to display the configuration settings in a new browser window.
Revert - Reverts your settings to the running configuration.
Save Current Configuration
Specify a new filename to save settings that have been applied to the running configuration as a new file, and then click Save.
Control Description
Import a New Configuration
Displays the controls to import a configuration from another appliance.
IP/Hostname Specify the IP address or hostname of the SteelHead from which you want to import the configuration.
Remote Admin Password
Specify the administrator password for the remote SteelHead.
Remote Config Name Specify the name of the configuration you want to import from the remote SteelHead.
New Config Name Specify a new, local configuration name.
Import Shared Data Only
Takes a subset of the configuration settings from the imported configuration and combines them with the current configuration to create a new configuration.
Import shared data is enabled by default.
Add When the Import Shared Data Only check box is selected, activates the imported configuration and makes it the current configuration. This is the default.
When the Import Shared Data Only check box is not selected, adds the imported configuration to the Configuration list. It doesn’t become the active configuration until you select it from the list and click Activate.
Remove Selected Select the check box next to the name and click Remove Selected.
Change Active Configuration
Select the configuration to activate from the drop-down list.
Control Description
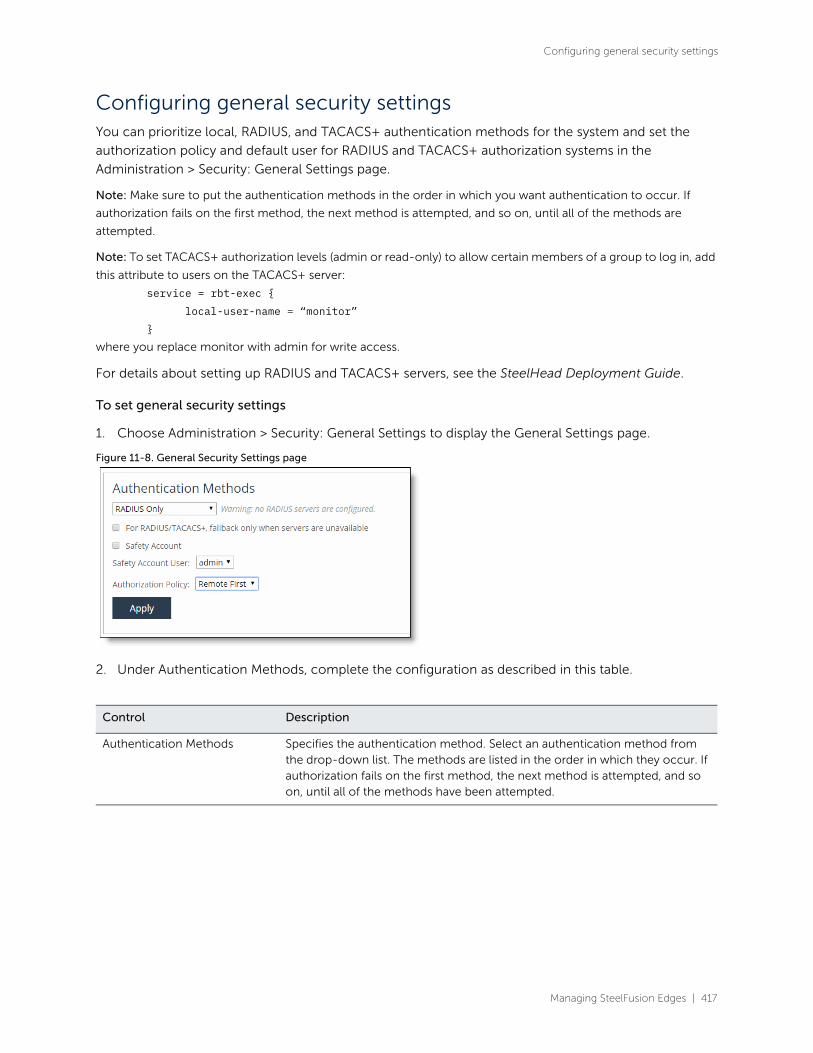
Managing SteelFusion Edges | 417
Configuring general security settings
Configuring general security settingsYou can prioritize local, RADIUS, and TACACS+ authentication methods for the system and set the
authorization policy and default user for RADIUS and TACACS+ authorization systems in the
Administration > Security: General Settings page.
Note: Make sure to put the authentication methods in the order in which you want authentication to occur. If
authorization fails on the first method, the next method is attempted, and so on, until all of the methods are
attempted.
Note: To set TACACS+ authorization levels (admin or read-only) to allow certain members of a group to log in, add
this attribute to users on the TACACS+ server:
service = rbt-exec { local-user-name = “monitor” }where you replace monitor with admin for write access.
For details about setting up RADIUS and TACACS+ servers, see the SteelHead Deployment Guide.
To set general security settings
1. Choose Administration > Security: General Settings to display the General Settings page.
Figure 11-8. General Security Settings page
2. Under Authentication Methods, complete the configuration as described in this table.
Control Description
Authentication Methods Specifies the authentication method. Select an authentication method from the drop-down list. The methods are listed in the order in which they occur. If authorization fails on the first method, the next method is attempted, and so on, until all of the methods have been attempted.
418 | Managing SteelFusion Edges
Managing user permissions
3. Click Apply to apply your changes to the running configuration.
4. Click Save to save your settings permanently.
Managing user permissions You can change the administrator, monitor, or Shark user passwords and define users in the
Administration > Security: User Permissions page.
Understanding account types
The system uses these accounts based on what actions the user can take:
• Admin - The system administrator user has full privileges. For example, as an administrator you may set and modify configuration settings, add and delete users, restart the optimization service, reboot the SteelHead, and create and view performance and system reports. The system administrator role allows you to add or remove a system administrator role for any other user, but not for yourself.
• Monitor - Monitor users may view reports, view user logs, and change their password. A monitor user cannot make configuration changes, modify private keys, view logs, or manage cryptographic modules in the system.
• Shark - A Shark user may use the Embedded SteelCentral NetShark function for detailed packet analysis through Packet Analyzer.
You can also create users, assign passwords to the user, and assign varying configuration roles to the
user.
An administrator role configures a system administrator role. Read-only permission is not allowed for
this role. This role allows permission for all other RBM roles, including creating, editing and removing
user accounts. The system administrator role allows you to add or remove a system administrator role
for any other user, but not for yourself.
A user role determines whether the user has permission to:
For RADIUS/TACACS+, fallback only when servers are unavailable
Select this check box to prevent local login if the RADIUS or TACACS+ server denies access, but allow local login if the RADIUS or TACACS+ server is not available.
Authorization Policy Appears only for some Authentication Methods. Optionally, select one of these policies from the drop-down list:
• Remote First - Checks the remote server first for an authentication policy, and only checks locally if the remote server doesn’t have one set. This is the default behavior.
• Remote Only - Only checks the remote server.
• Local Only - Only checks the local server. All remote users are mapped to the user specified. Any vendor attributes received by an authentication server are ignored.
Control Description

Managing SteelFusion Edges | 419
Managing user permissions
• Read-only - With read-only privileges you can view current configuration settings but you cannot change them.
• Read/Write - With read and write privileges you can view settings and make configuration changes for a feature.
• Deny - With deny privileges you cannot view settings or save configuration changes for a feature.
As an example, you might have user Jane who can make configuration changes to QoS and SSL, whereas
user John can only view these configuration settings; and finally, user Joe cannot view, change, or save
the settings for these features.
Available menu items reflect the privileges of the user. For example, any menu items that a user does not
have permission to use are unavailable. When a user selects an unavailable link, the User Permissions
page appears.
Combining permissions by feature
RiOS 9.0 requires additional user permissions for path selection and QoS. For example, to change a QoS
rule, a user needs read/write permission for the Network Settings role in addition to read/write
permission for QoS.
This table summarizes the user permission requirements for RiOS 9.0.
Management
Console page
To configure this
feature or change
this section
Required read permission Required read/write permission
Networking > Topology: Sites & Networks
Networks Network Settings Read-Only Network Settings Read/Write
Sites Network Settings Read-Only
QoS Read-Only
Path Selection Read-Only
Network Settings Read/Write
QoS Read/Write
Path Selection Read/Write
Networking > App Definitions: Applications
Applications Network Settings Read-Only Network Settings Read/Write
Networking > Network Services: Quality of Service
Enable QoS Network Settings Read-Only Network Settings Read/Write
Manage QoS Per Interface
Network Settings Read-Only Network Settings Read/Write
QoS Profile QoS Read-Only QoS Read/Write
QoS Remote Site Info
Network Settings Read-Only
QoS Read-Only
—
Networking > Network Services: QoS Profile Details
Profile Name QoS Read-Only QoS Read/Write
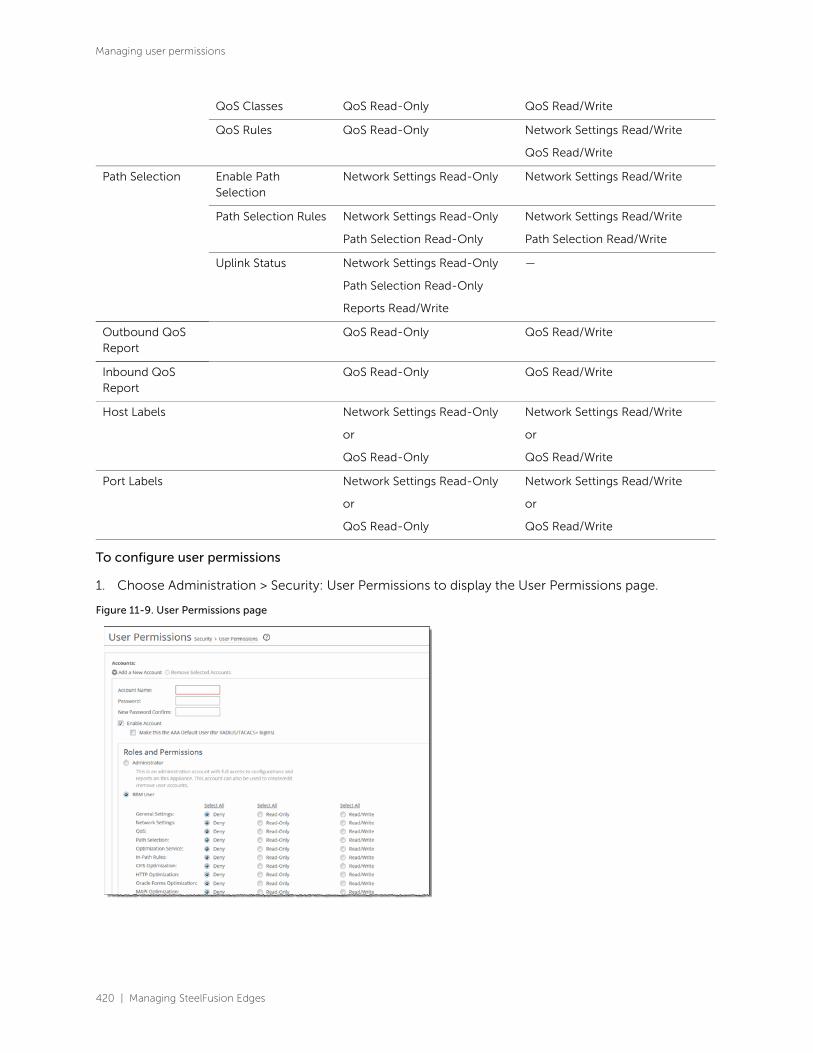
420 | Managing SteelFusion Edges
Managing user permissions
To configure user permissions
1. Choose Administration > Security: User Permissions to display the User Permissions page.
Figure 11-9. User Permissions page
QoS Classes QoS Read-Only QoS Read/Write
QoS Rules QoS Read-Only Network Settings Read/Write
QoS Read/Write
Path Selection Enable Path Selection
Network Settings Read-Only Network Settings Read/Write
Path Selection Rules Network Settings Read-Only
Path Selection Read-Only
Network Settings Read/Write
Path Selection Read/Write
Uplink Status Network Settings Read-Only
Path Selection Read-Only
Reports Read/Write
—
Outbound QoS Report
QoS Read-Only QoS Read/Write
Inbound QoS Report
QoS Read-Only QoS Read/Write
Host Labels Network Settings Read-Only
or
QoS Read-Only
Network Settings Read/Write
or
QoS Read/Write
Port Labels Network Settings Read-Only
or
QoS Read-Only
Network Settings Read/Write
or
QoS Read/Write

Managing SteelFusion Edges | 421
Managing user permissions
2. Under Accounts, complete the configuration as described in this table.
3. Under Accounts, complete the configuration as described in this table.
Control Description
admin/monitor Click the right arrow to change the password or to create a default user account.
Change Password - Enables password protection.
Password protection is an account control feature that allows you to select a password policy for more security. When you enable account control on the Administration > Security: Password Policy page, a user must use a password.
When a user has a null password to start with, the administrator can still set the user password with account control enabled. However, once the user or administrator changes the password, it can’t be reset to null as long as account control is enabled.
Password - Specify a password in the text box.
Password Confirm - Retype the new administrator password.
Enable Account - Select to enable or clear to disable the administrator or monitor account.
When enabled, you may make the account the default user for Radius and TACACS+ authorization. You may only designate one account as the default user. Once enabled, the default user account may not be disabled or removed. The Accounts table displays the account as permanent.
Control Description
Add a New Account Click to display the controls for creating a new account.
Account Name Specify a name for the account.
Password Specify a password in the text box, and then retype the password for confirmation.
Enable Account Select this check box to enable the new account.
Administrator Configures a system administrator role. This role allows permission for all other RBM roles, including creating, editing, and removing user accounts. The system administrator role allows you to add or remove a system administrator role for any other user, but not for yourself. Read-only permission is not allowed for this role.
User Configures a role that determines whether the user:
• has permission to view current configuration settings but not change them (Read-Only).
• has permission to view settings and make configuration changes for a feature (Read/Write).
• is prevented from viewing or saving settings or configuration changes for a feature (Deny).
General Settings Configures per-source IP connection limit and the maximum connection pooling size.
422 | Managing SteelFusion Edges
Managing user permissions
Network Settings Configures these features:
• Topology definitions
• Site and network definitions
• Application definitions
• Host interface settings
• Network interface settings
• DNS cache settings
• Hardware assist rules
• Host labels
• Port labels
You must include this role for users configuring path selection or enforcing QoS policies in addition to the QoS and Path Selection roles.
QoS Enforces QoS policies. You must also include the Network Settings role.
Path Selection Configures path selection. You must also include the Network Settings role.
Optimization Service Configures alarms, performance features, SkipWare, HS-TCP, and TCP optimization.
In-Path Rules Configures TCP traffic for optimization and how to optimize traffic by setting in-path rules. This role includes WAN visibility to preserve TCP/IP address or port information.
For details about WAN visibility, see the SteelHead Deployment Guide.
CIFS Optimization Configures CIFS optimization settings (including SMB signing) and overlapping open optimization.
HTTP Optimization Configures enhanced HTTP optimization settings: URL learning, Parse and Prefetch, Object Prefetch Table, keepalive, insert cookie, file extensions to prefetch, and the ability to set up HTTP optimization for a specific server subnet.
Oracle Forms Optimization
Optimizes Oracle E-business application content and forms applications.
MAPI Optimization Optimizes MAPI and sets Exchange and NSPI ports.
NFS Optimization Configures NFS optimization.
Notes Optimization Configures Lotus Notes optimization.
Citrix Optimization Configures Citrix optimization.
SSL Optimization Configures SSL support and the secure inner channel.
Replication Optimization
Configures the SRDF/A, FCIP, and SnapMirror storage optimization modules.
(SteelHead CX only) Proxy File Service (PFS)
Configures the PFS.
Storage Service Configures branch storage services on SteelFusion Edge appliances (the branch storage services are only available on a SteelHead EX or SteelFusion Edge).
Security Settings Configures security settings, including RADIUS and TACACS authentication settings and the secure vault password.
Control Description

Managing SteelFusion Edges | 423
Managing password policy
4. Click Save to save your settings permanently.
Note: RiOS ignores the RBM user roles for SteelHead SaaS features. RiOS allows RBM users with DENY permissions
in all roles access to SteelHead SaaS Management Console pages and GUI commands.
Managing password policyYou can change the password policy and strength in the Administration > Security: Password Policy
page.
Selecting a password policy
You can choose one of these password policy templates, depending on your security requirements:
• Strong - Sets the password policy to more stringent enforcement settings. Selecting this template automatically prepopulates the password policy with stricter settings commonly required by higher security standards such as for the Department of Defense.
• Basic - Reverts the password policy to its predefined settings so you can customize your policy.
Basic Diagnostics Customizes system diagnostic logs, including system and user log settings, but doesn’t include TCP dumps.
TCP Dumps Customizes TCP dump settings.
Reports Sets system report parameters.
Domain Authentication
Allows joining a Windows domain and configuring Windows domain authentication.
Citrix Acceleration Configures Citrix optimization.
Add Adds your settings to the system.
Remove Selected Accounts
Select the check box next to the name and click Remove Selected.
Control Description
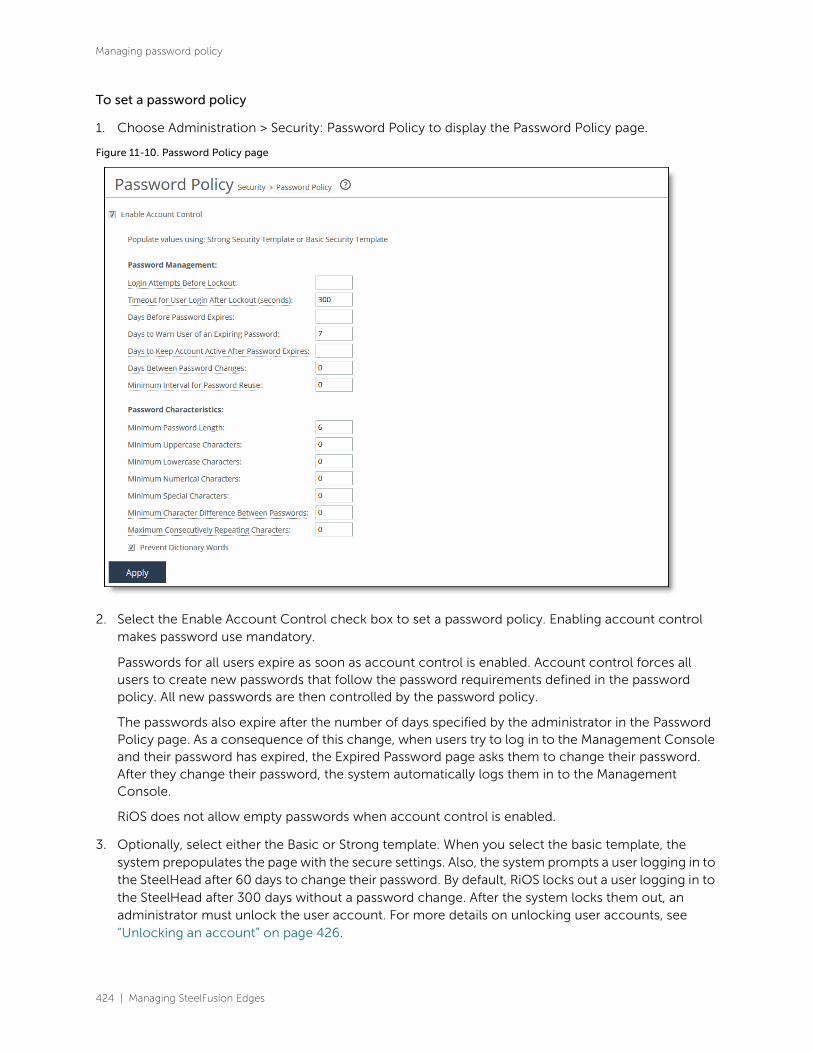
424 | Managing SteelFusion Edges
Managing password policy
To set a password policy
1. Choose Administration > Security: Password Policy to display the Password Policy page.
Figure 11-10. Password Policy page
2. Select the Enable Account Control check box to set a password policy. Enabling account control makes password use mandatory.
Passwords for all users expire as soon as account control is enabled. Account control forces all users to create new passwords that follow the password requirements defined in the password policy. All new passwords are then controlled by the password policy.
The passwords also expire after the number of days specified by the administrator in the Password Policy page. As a consequence of this change, when users try to log in to the Management Console and their password has expired, the Expired Password page asks them to change their password. After they change their password, the system automatically logs them in to the Management Console.
RiOS does not allow empty passwords when account control is enabled.
3. Optionally, select either the Basic or Strong template. When you select the basic template, the system prepopulates the page with the secure settings. Also, the system prompts a user logging in to the SteelHead after 60 days to change their password. By default, RiOS locks out a user logging in to the SteelHead after 300 days without a password change. After the system locks them out, an administrator must unlock the user account. For more details on unlocking user accounts, see “Unlocking an account” on page 426.
Managing SteelFusion Edges | 425
Managing password policy
4. Under Password Management, complete the configuration as described in this table.
5. Under Password Characteristics, complete the configuration as described in this table.
Control Description
Login Attempts Before Lockout
Specify the maximum number of unsuccessful login attempts before temporarily blocking user access to the SteelHead. The user is prevented from further login attempts when the number is exceeded.
The default for the strong security template is 3.
The lockout expires after the amount of time specified in Timeout for User Login After Lockout elapses.
Timeout for User Login After Lockout
Specify the amount of time, in seconds, that must elapse before a user can attempt to log in after an account lockout due to unsuccessful login attempts. The default for the strong security template is 300.
Days Before Password Expires
Specify the number of days the current password remains in effect. The default for the strong security template is 60. To set the password expiration to 24 hours, specify 0. To set the password expiration to 48 hours, specify 1. Leave blank to turn off password expiration.
Days to Warn User of an Expiring Password
Specify the number of days the user is warned before the password expires. The default for the strong security template is 7.
Days to Keep Account Active After Password Expires
Specify the number of days the account remains active after the password expires. The default for the strong security template is 305. When the time elapses, RiOS locks the account permanently, preventing any further logins.
Days Between Password Changes
Specify the minimum number of days before which passwords can’t be changed.
Minimum Interval for Password Reuse
Specify the number of password changes allowed before a password can be reused. The default for the strong security template is 5.
Control Description
Minimum Password Length
Specify the minimum password length. The default for the strong security template is 14 alphanumeric characters.
Minimum Uppercase Characters
Specify the minimum number of uppercase characters required in a password. The default for the strong security template is 1.
Minimum Lowercase Characters
Specify the minimum number of lowercase characters required in a password. The default for the strong security template is 1.
Minimum Numerical Characters
Specify the minimum number of numerical characters required in a password. The default for the strong security template is 1.
Minimum Special Characters
Specify the minimum number of special characters required in a password. The default for the strong security template is 1.
Minimum Character Differences Between Passwords
Specify the minimum number of characters that must be changed between the old and new password. The default for the strong security template is 4.

426 | Managing SteelFusion Edges
Managing password policy
6. Click Save to save your settings permanently.
Unlocking an account
RiOS temporarily locks out an account after a user exceeds the configured number of login attempts.
Account lockout information appears in the Administration > Security: User Permissions page.
When an account is locked out, the lockout ends after:
• The configured lockout time elapses.
—or—
• The administrator unlocks the account. RiOS never locks out administrator accounts.
To unlock an account
1. Log in as an administrator (admin).
2. Choose Administration > Security: User Permissions page and click Clear Login Failure Details.
When users log in to their account successfully, RiOS resets the login failure count.
Resetting an expired password
RiOS temporarily locks out an account when its password expires. Passwords expire for one of these
reasons:
• An administrator enables account control.
• The expiration time for a password elapses.
• An administrator disables a user account and then enables it.
• An administrator uses a CLI command to encrypt a password.
After a user password expires, users must update their password within the number of days specified in
Days to Keep Account Active After Password Expires. The default value is 305. After the time elapses,
RiOS locks the account permanently, preventing any further logins.
To reset the password and unlock the account
1. Log in as an administrator (admin).
2. Choose Administration > Security: User Permissions page and click Clear Login Failure Details.
3. Type and confirm the new password and click Change Password.
Note: The password reset feature is separate from the account lockout feature.
Maximum Consecutively Repeating Characters
Specify the maximum number of times a character can occur consecutively.
Prevent Dictionary Words Select to prevent the use of any word that is found in a dictionary as a password. By default, this control is enabled.
Control Description

Managing SteelFusion Edges | 427
Setting RADIUS servers
Setting RADIUS serversYou set up RADIUS server authentication in the Administration > Security: RADIUS page.
RADIUS is an access control protocol that uses a challenge and response method for authenticating
users. Setting up RADIUS server authentication is optional.
Enabling this feature is optional.
You can prioritize local, RADIUS, and TACACS+ authentication methods for the system and set the
authorization policy and default user for RADIUS and TACACS+ authorization systems in the
Administration > Security: General Settings page.
For details about setting up RADIUS and TACACS+ servers, see the SteelHead Deployment Guide.
To set RADIUS server authentication
1. Choose Administration > Security: RADIUS to display the RADIUS page.
Figure 11-11. RADIUS page
2. Under Default RADIUS Settings, complete the configuration as described in this table.
Control Description
Set a Global Default Key
Enables a global server key for the RADIUS server.
Global Key Specify the global server key.

428 | Managing SteelFusion Edges
Setting RADIUS servers
3. Click Apply to apply your changes to the running configuration.
4. To add a new RADIUS server, complete the configuration as described in this table.
5. If you add a new server to your network and you do not specify these fields at that time, RiOS applies the global settings.
Confirm Global Key Confirm the global server key.
Timeout Specify the time-out period in seconds (1 to 60). The default value is 3.
Retries Specify the number of times you want to allow the user to retry authentication. The default value is 1.
Control Description
Add a RADIUS Server Displays the controls for defining a new RADIUS server.
Hostname or IP Address
Specify the hostname or server IP address. RiOS doesn’t support IPv6 server IP addresses.
Authentication Port Specify the port for the server.
Authentication Type Select one of these authentication types:
• PAP - Password Authentication Protocol (PAP), which validates users before allowing them access to the RADIUS server resources. PAP is the most flexible protocol but is less secure than CHAP.
• CHAP - Challenge-Handshake Authentication Protocol (CHAP), which provides better security than PAP. CHAP validates the identity of remote clients by periodically verifying the identity of the client using a three-way handshake. This validation happens at the time of establishing the initial link and might happen again at any time. CHAP bases verification on a user password and transmits an MD5 sum of the password from the client to the server.
• MS-CHAPv2 - The Microsoft version of the Challenge-Handshake Authentication Protocol. MS-CHAPv2 is a more secure authentication protocol than PAP or CHAP.
Override the Global Default Key
Overrides the global server key for the server.
Server Key - Specify the override server key.
Confirm Server Key - Confirm the override server key.
Timeout Specify the time-out period in seconds (1 to 60). The default value is 3.
Retries Specify the number of times you want to allow the user to retry authentication. Valid values are from 0 to 5. The default value is 1.
Enabled Enables the new server.
Add Adds the RADIUS server to the list.
Remove Selected Select the check box next to the name and click Remove Selected.
Control Description
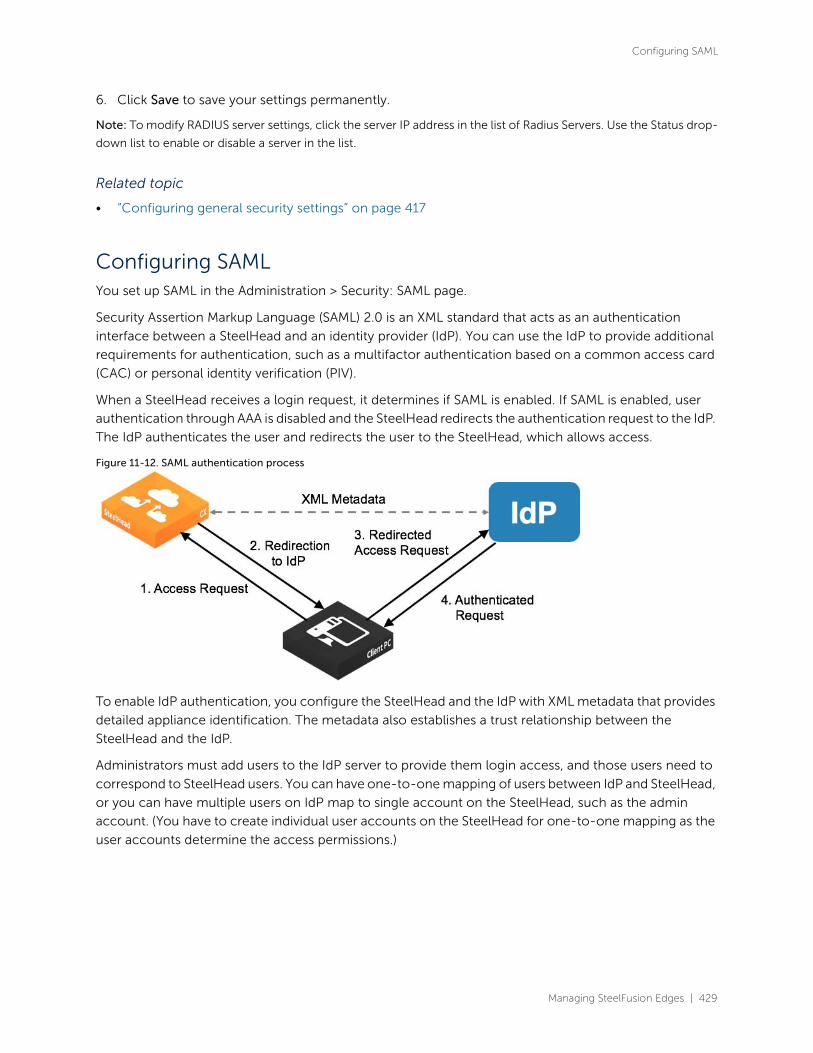
Managing SteelFusion Edges | 429
Configuring SAML
6. Click Save to save your settings permanently.
Note: To modify RADIUS server settings, click the server IP address in the list of Radius Servers. Use the Status drop-
down list to enable or disable a server in the list.
Related topic
• “Configuring general security settings” on page 417
Configuring SAMLYou set up SAML in the Administration > Security: SAML page.
Security Assertion Markup Language (SAML) 2.0 is an XML standard that acts as an authentication
interface between a SteelHead and an identity provider (IdP). You can use the IdP to provide additional
requirements for authentication, such as a multifactor authentication based on a common access card
(CAC) or personal identity verification (PIV).
When a SteelHead receives a login request, it determines if SAML is enabled. If SAML is enabled, user
authentication through AAA is disabled and the SteelHead redirects the authentication request to the IdP.
The IdP authenticates the user and redirects the user to the SteelHead, which allows access.
Figure 11-12. SAML authentication process
To enable IdP authentication, you configure the SteelHead and the IdP with XML metadata that provides
detailed appliance identification. The metadata also establishes a trust relationship between the
SteelHead and the IdP.
Administrators must add users to the IdP server to provide them login access, and those users need to
correspond to SteelHead users. You can have one-to-one mapping of users between IdP and SteelHead,
or you can have multiple users on IdP map to single account on the SteelHead, such as the admin
account. (You have to create individual user accounts on the SteelHead for one-to-one mapping as the
user accounts determine the access permissions.)

430 | Managing SteelFusion Edges
Configuring SAML
If a user who has not been set up in the IdP tries to log in to the SteelHead, the login fails on the IdP login
page. (This failed login is not tracked in the SteelHead logs.) If the user has been set up but their user
mapping has not been defined in the IdP, the login succeeds but the SteelHead displays an error page
(instead of the dashboard).
Note: SAML authentications are only available in the Management Console web interface; they are not available
through the CLI. Users can log in to a SAML-enabled SteelHead through the CLI but they are authenticated using
the local, RADIUS, or TACACS+ authentication methods.
If you cannot log in using SAML (for example, if the IdP server is unavailable), you can log in through the
CLI and disable SAML using the no aaa saml command. Once SAML is disabled, you revert to the
previously configured authentication method for the web interface. For command details, see the
Riverbed Command-Line Interface Reference Manual.
You must be logged in as the administrator to enable or disable SAML.

Managing SteelFusion Edges | 431
Configuring SAML
To enable SAML
1. Choose Administration > Security: SAML to display the SAML page.
Figure 11-13. IdP Configuration section of the SAML page
2. Under Appliance Metadata, click Download XML to download the SteelHead metadata in XML format.
The sp_metadata.xml file downloads to your local machine.
3. Configure the appliance in your IdP.
Refer to the documentation for your IdP for specific instructions. In general, you complete these steps:
– Log in to the IdP website.
– Upload the metadata from the sp_metadata.xml file and provide any other required details.

432 | Managing SteelFusion Edges
Configuring SAML
– When the configuration is complete, download the IdP metadata.
4. In the management console, under SAML > IdP Configuration, configure the SAML settings as described in this table.
5. Click Apply to save your configuration settings.
6. Under Validate the IdP Configuration, click Validate.
The IdP Validation window appears.
7. Click Go to IdP.
The IdP login page opens.
8. Log in to the IdP website.
The page indicates if your IdP configuration was successful.
9. After successful validation, return to the SAML page in the management console and select the Enable SAML check box and click Apply.
Tip: If the validation status on the SteelHead page does not update after a successful validation, reload the page to
refresh the status.
With SAML enabled, all web login requests are redirected to the IdP.
10. Click Save to Disk to save your settings permanently.
If you make changes to the SAML settings after you validate the IdP configuration, you need to validate
again with the new settings and enable SAML again.
Control Description
IdP Metadata Paste the IdP metadata you copied or received from the IdP website.
Security Settings
Note: These setting should match the IdP settings.
Sign Authentication Request - Select this option to have SteelHead sign the SAML authentication request sent to the identity provider. Signing the initial login request sent by SteelHead allows the identity provider to verify that all login requests originate from a trusted service provider.
Requires Signed Assertions - Select if the IdP signs the assertion response. Some SAML configurations require signed assertions to improve security.
Requires Encrypted Assertions - Select this option if the SAML identity provider encrypts the assertion section of the SAML responses. Even though all SAML traffic to and from SteelHead is already encrypted by the use of HTTPS, this option adds another layer of encryption.
Attribute Username Attribute - Enter the name of the IdP variable that carries the username. The Username attribute is mandatory and must be sent by your identity provider in the SAML response to align the login with a configured SteelHead account.
Member of Attribute - Enter the name of the IdP variable that carries the role of the user. The role must match with a local SteelHead user. This setting is mandatory.

Managing SteelFusion Edges | 433
Configuring TACACS+ access
Configuring TACACS+ accessYou set up TACACS+ server authentication in the Administration > Security: TACACS+ page.
TACACS+ is an authentication protocol that allows a remote access server to forward a login password
for a user to an authentication server to determine whether access is allowed to a given system.
Enabling this feature is optional.
You can prioritize local, RADIUS, and TACACS+ authentication methods for the system and set the
authorization policy and default user for RADIUS and TACACS+ authorization systems in the
Administration > Security: General Settings page.
For details about configuring RADIUS and TACACS+ servers to accept login requests from the
SteelFusion Edge, see the SteelHead Deployment Guide.
To set a TACACS+ server
1. Choose Administration > Security: TACACS+ to display the TACACS+ page.
Figure 11-14. TACACS+ page
2. Under Default TACACS+ Settings, complete the configuration as described in this table.
Control Description
Set a Global Default Key
Enables a global server key for the server.
Global Key Specify the global server key.

434 | Managing SteelFusion Edges
Unlocking the secure vault
3. Click Apply to apply your changes to the running configuration.
4. To add or remove a TACACS+ server, complete the configuration as described in this table.
5. If you add a new server to your network and you do not specify these fields, the system automatically applies the default settings.
6. Click Save to save your settings permanently.
Related topic
• “Configuring general security settings” on page 417
Unlocking the secure vaultYou can unlock and change the password for the secure vault in the Administration > Security: Secure
Vault page.
Confirm Global Key Confirms the global server key.
Timeout Specify the time-out period in seconds (1 to 60). The default value is 3.
Retries Specify the number of times you want to allow the user to retry authentication. Valid values are from 0 to 5. The default is 1.
Control Description
Add a TACACS+ Server Displays the controls for defining a new TACACS+ server.
Hostname or IP Address Specify the hostname or server IP address.
Authentication Port Specify the port for the server. The default value is 49.
Authentication Type Select either PAP or ASCII as the authentication type. The default value is PAP.
Override the Global Default Key
Specify this option to override the global server key for the server.
Server Key Specify the override server key.
Confirm Server Key Confirm the override server key.
Timeout Specify the time-out period in seconds (1 to 60). The default is 3.
Retries Specify the number of times you want to allow the user to retry authentication. Valid values are from 0 to 5. The default is 1.
Enabled Enables the new server.
Add Adds the TACACS+ server to the list.
Remove Selected Select the check box next to the name and click Remove Selected.
Control Description
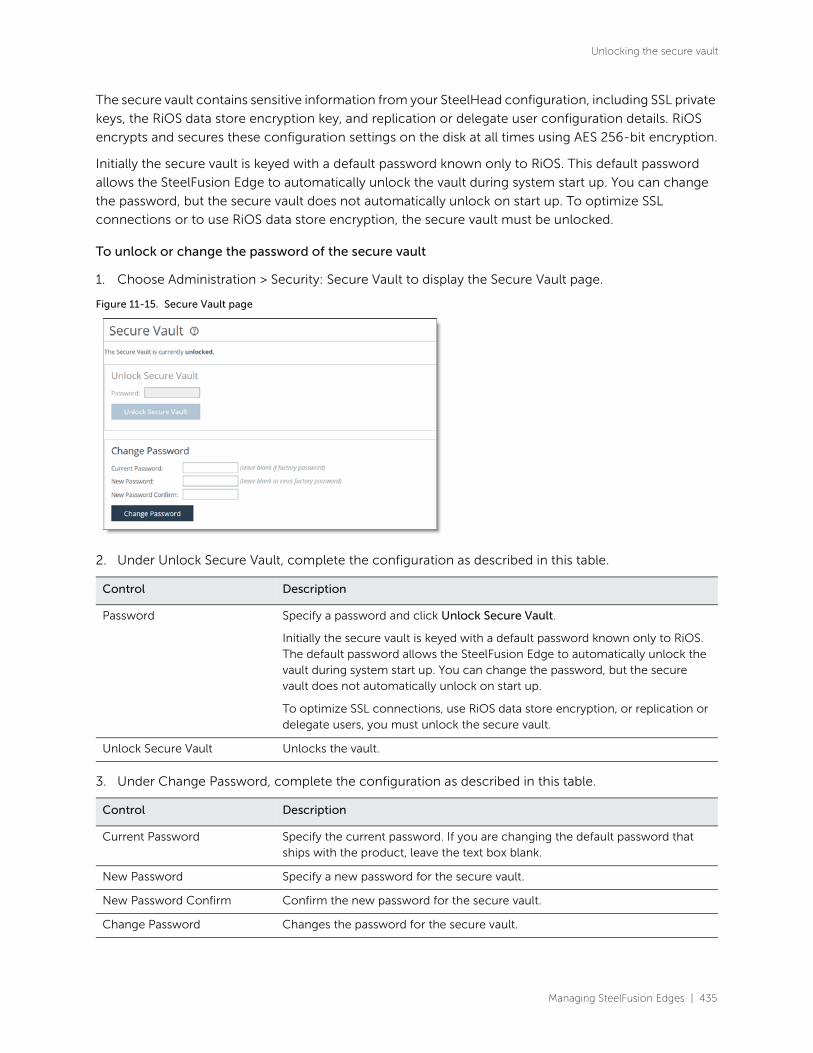
Managing SteelFusion Edges | 435
Unlocking the secure vault
The secure vault contains sensitive information from your SteelHead configuration, including SSL private
keys, the RiOS data store encryption key, and replication or delegate user configuration details. RiOS
encrypts and secures these configuration settings on the disk at all times using AES 256-bit encryption.
Initially the secure vault is keyed with a default password known only to RiOS. This default password
allows the SteelFusion Edge to automatically unlock the vault during system start up. You can change
the password, but the secure vault does not automatically unlock on start up. To optimize SSL
connections or to use RiOS data store encryption, the secure vault must be unlocked.
To unlock or change the password of the secure vault
1. Choose Administration > Security: Secure Vault to display the Secure Vault page.
Figure 11-15. Secure Vault page
2. Under Unlock Secure Vault, complete the configuration as described in this table.
3. Under Change Password, complete the configuration as described in this table.
Control Description
Password Specify a password and click Unlock Secure Vault.
Initially the secure vault is keyed with a default password known only to RiOS. The default password allows the SteelFusion Edge to automatically unlock the vault during system start up. You can change the password, but the secure vault does not automatically unlock on start up.
To optimize SSL connections, use RiOS data store encryption, or replication or delegate users, you must unlock the secure vault.
Unlock Secure Vault Unlocks the vault.
Control Description
Current Password Specify the current password. If you are changing the default password that ships with the product, leave the text box blank.
New Password Specify a new password for the secure vault.
New Password Confirm Confirm the new password for the secure vault.
Change Password Changes the password for the secure vault.
436 | Managing SteelFusion Edges
Configuring a management ACL
4. Click Save to save your settings permanently.
Related topic
• “Configuring general security settings” on page 417
Configuring a management ACLYou can secure access to an Edge using an internal management access control list (ACL) in the Security:
Management ACL page.
Edges are subject to the network policies defined by a corporate security policy, particularly in large
networks. Using an internal management ACL, you can:
• restrict access to certain interfaces or protocols of an Edge.
• restrict inbound IP access to an Edge, protecting it from access by hosts that do not have permission without using a separate device (such as a router or firewall).
• specify which hosts or groups of hosts can access and manage an Edge by IP address, simplifying the integration of SteelFusion Edges into your network.
The management ACL provides these safeguards to prevent accidental disconnection from the
SteelFusion Edge, the SCC, and the embedded Shark feature:
• It detects the IP address you are connecting from and displays a warning if you add a rule that denies connections to that address.
• It always allows the default ports 7800, 7801, 7810, 7820, and 7850.
• It always allows a previously connected SCC to connect and tracks any changes to the IP address of the SCC to prevent disconnection.
• It converts well-known port and protocol combinations such as SSH, Telnet, HTTP, HTTPS, SNMP, and SOAP into their default management service and protects these services from disconnection. For example, if you specify protocol 6 (TCP) and port 22, the management ACL converts this port and protocol combination into SSH and protects it from denial.
• It tracks changes to default service ports and automatically updates any references to changed ports in the access rules.

Managing SteelFusion Edges | 437
Configuring a management ACL
To set up a management ACL
1. Choose Administration > Security: Management ACL to display the Management ACL page.
Figure 11-16. Management ACL page
2. Under Management ACL Settings, complete the configuration as described in this table.
3. Click Apply to apply your changes to the running configuration.
4. Click Save to save your settings permanently.
Note: If you add, delete, edit, or move a rule that could disconnect connections to the SteelFusion Edge, a warning
message appears. Click Confirm to override the warning and allow the rule definition. Use caution when overriding
a disconnect warning.
Control Description
Enable Management ACL Secures access to a SteelHead using a management ACL.

438 | Managing SteelFusion Edges
Configuring a management ACL
ACL management rules
The management ACL contains rules that define a match condition for an inbound IP packet. You set a
rule to allow or deny access to a matching inbound IP packet. When you add a rule on a SteelFusion
Edge, the destination specifies the SteelFusion Edge itself, and the source specifies a remote host.
The ACL rules list contains default rules that allow you to use the management ACL with branch service
RiOS features, such as DNS caching. These default rules allow access to certain ports required by these
features. The list also includes default rules that allow access to the SCC and the embedded Shark
feature. If you delete a default ACL rule and need to restore it, see “Restoring default access rules” on
page 439.
To add an ACL management rule
1. Under Management ACL Settings, complete the configuration as described in this table.
Control Description
Add a New Rule Displays the controls for adding a new rule.
Action Select one of these rule types from the drop-down list:
• Allow - Allows a matching packet access to the SteelHead. This is the default action.
• Deny - Denies access to any matching packets.
Service Optionally, select Specify Protocol, or HTTP, HTTPS, SOAP, SNMP, SSH, Telnet. When specified, the Destination Port is dimmed.
Protocol (Appears only when Service is set to Specify Protocol.) Optionally, select All, TCP, UDP, or ICMP from the drop-down list. The default setting is All. When set to All or ICMP, the Service and Destination Ports are dimmed.
Source Network Optionally, specify the source subnet of the inbound packet: for example, 1.2.3.0/24.
Destination Port Optionally, specify the destination port of the inbound packet, either a single port value or a port range of port1-port2, where port1 must be less than port2. Leave it blank to specify all ports.
Interface Optionally, select an interface name from the drop-down list. Select All to specify all interfaces.
Description Optionally, describe the rule to facilitate administration.
Rule Number Optionally, select a rule number from the drop-down list. By default, the rule goes to the end of the table (just above the default rule).
SteelHeads evaluate rules in numerical order starting with rule 1. If the conditions set in the rule match, then the rule is applied, and the system moves on to the next packet. If the conditions set in the rule don’t match, the system consults the next rule. For example, if the conditions of rule 1 don’t match, rule 2 is consulted. If rule 2 matches the conditions, it’s applied, and no further rules are consulted.
Note: The default rule, Allow, which allows all remaining traffic from everywhere that has not been selected by another rule, can’t be removed and is always listed last.

Managing SteelFusion Edges | 439
Configuring a management ACL
2. Click Save to save your settings permanently.
Usage notes
• When you change the default port of services such as SSH, HTTP, HTTPS, on either the client-side appliance or server-side appliance and create a management ACL rule denying that service, the rule will not work as expected. The appliance on the other end (either server or client) of an in-path deployment does not know that the default service port has changed, and consequently optimizes the packets to that service port. To work around this problem, add a pass-through rule to the client-side SteelFusion Edge for the management interfaces. The pass-through rule prevents the traffic from coming from the local host when optimized.
• A management ACL rule that denies access from port 20 on the server-side appliance in an out-of-path deployment prevents data transfer using active FTP. In this deployment, the FTP server and client cannot establish a data connection because the FTP server initiates the SYN packet and the management rule on the server-side appliance blocks the SYN packet. To work around this problem:
– use passive FTP instead of active FTP. With passive FTP, the FTP client initiates both connections to the server. For details about active and passive FTP, see “QoS classification for the FTP data channel” on page 292.
—or—
– add a rule to either allow source port 20 on the server-side appliance or allow the IP address of the FTP server.
Restoring default access rules
This section describes how to restore the default ACL rule.
To restore the default ACL management rule for DNS caching
1. Under Management ACL Settings, add a DNS Caching ACL rule with these properties.
Log Packets Tracks denied packets in the log. By default, packet logging is enabled.
Add Adds the rule to the list. The Management Console redisplays the Rules table and applies your modifications to the running configuration, which is stored in memory.
Remove Selected Select the check box next to the name and click Remove Selected.
Move Selected Moves the selected rules. Click the arrow next to the desired rule position; the rule moves to the new position.
Property Value
Type Allow
Protocol UDP
Control Description

440 | Managing SteelFusion Edges
Configuring web settings
2. Click Add.
Configuring web settings You can modify Management Console web user interface and certificate settings in the Administration
> Security: Web Settings page.
To modify web settings
1. Choose Administration > Security: Web Settings to display the Web Settings page.
Figure 11-17. Web Settings page
Destination Port 53
Rule Number 1
Description DNS Caching
Property Value

Managing SteelFusion Edges | 441
Configuring web settings
2. Under Web Settings, complete the configuration as described in this table.
3. Click Apply to apply your changes to the running configuration.
4. Click Save to save your settings permanently.
Managing web SSL certificates
RiOS provides these security features to manage SSL certificates used by the Edge Management Console
through HTTPS:
• Generate the certificate and key pairs on the Edge. This method overwrites the existing certificate and key pair regardless of whether the previous certificate and key pair was self-signed or user added. The new self-signed certificate lasts for one year (365 days).
• Create certificate signing requests from the certificate and key pairs.
• Replace a signed certificate with one created by an administrator or generated by a third-party certificate authority.
To modify web certificates
1. Choose Administration > Security: Web Settings to display the Web Settings page.
2. Under Web Certificate, select the Details tab.
The Edge identity certificate details appear, as described in this table.
Control Description
Default Web Login ID Specify the username that appears in the authentication page. The default value is admin.
Web Inactivity Timeout Specify the number of idle minutes before time-out. The default value is 15. A value of 0 disables time-out.
Allow Session Timeouts When Viewing Auto-Refreshing Pages
By default, session time-out is enabled, which stops the automatic updating of the report pages when the session times out. Clear the Allow box to disable the session time-out, remain logged-in indefinitely, and automatically refresh the report pages.
Note: Disabling this feature poses a security risk.
Control Description
Issued To/Issued By Common Name - Specifies the common name of the certificate authority.
Email - Specifies the email address of the certificate administrator.
Organization - Specifies the organization name (for example, the company).
Locality - Specifies the city.
State - Specifies the state.
Country - Specifies the country.
Serial Number - Specifies the serial number (Issued To, only).
442 | Managing SteelFusion Edges
Configuring web settings
3. To replace an existing certificate, under Web Certificate, select the Replace tab and complete the configuration as described in this table.
4. To generate a CSR, under Web Certificate, select the Generate CSR tab and complete the configuration as described in this table.
Validity Issued On - Specifies the date the certificate was issued.
Expires On - Specifies the date the certificate expires.
Fingerprint Specifies the SSL fingerprint.
Key Type - Specifies the key type.
Size - Specifies the size in bytes.
Control Description
Import Certificate and Private Key
Imports the certificate and key.
The page displays controls for browsing to and uploading the certificate and key files. Or, you can use the text box to copy and paste a PEM file.
The private key is required regardless of whether you are adding or updating the certificate.
Certificate Upload - Browse to the local file in PKCS-12, PEM, or DER formats.
Paste it here (PEM) - Copy and then paste the contents of a PEM file.
Private Key Select the private key origin.
• The Private Key is in a separate file (see below) - You can either upload it or copy and paste it.
• This file includes the Certificate and Private Key
• The Private Key for this Certificate was created with a CSR generated on this appliance.
Separate Private Key Upload (PEM or DER formats) - Browse to the local file in PEM or DER formats.
Paste it here (PEM only) - Paste the contents of a PEM file.
Decryption Password - Specify the decryption password, if necessary. Passwords are required for PKCS-12 files, optional for PEM files, and never needed for DER files.
Control Description
Common Name Specify the common name (hostname).
Organization Name Specify the organization name (for example, the company).
Organization Unit Name Specify the organization unit name (for example, the section or department).
Locality Specify the city.
Control Description
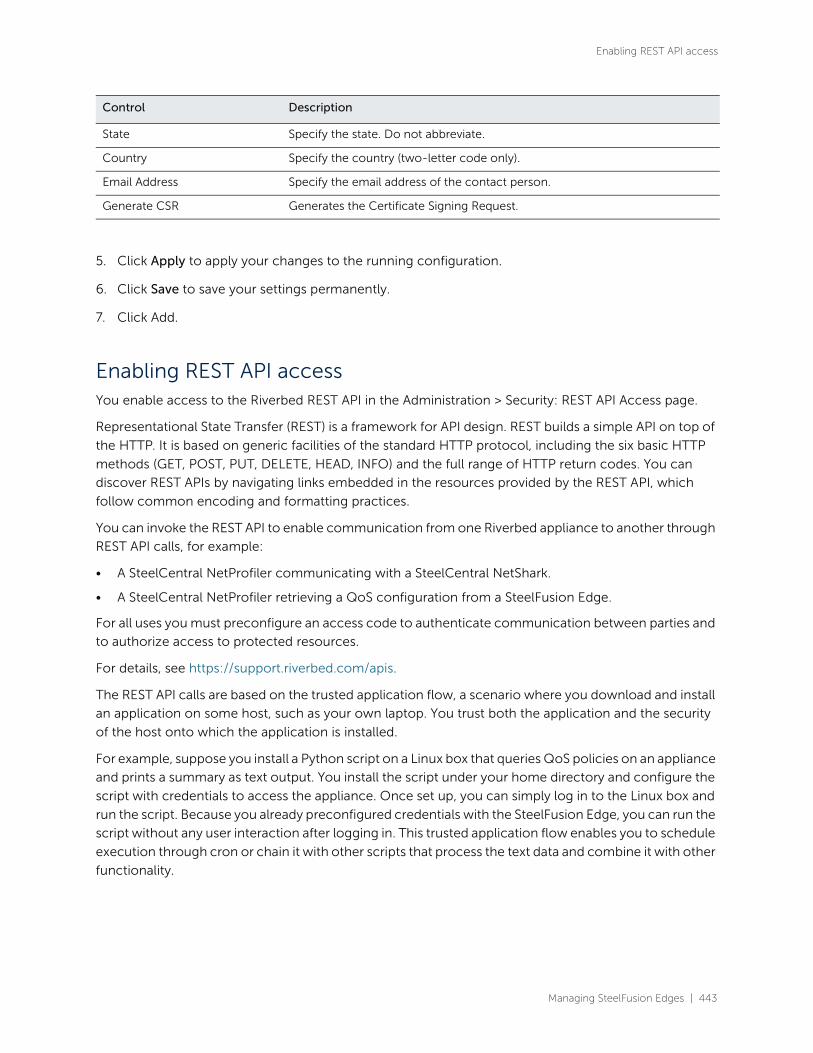
Managing SteelFusion Edges | 443
Enabling REST API access
5. Click Apply to apply your changes to the running configuration.
6. Click Save to save your settings permanently.
7. Click Add.
Enabling REST API access You enable access to the Riverbed REST API in the Administration > Security: REST API Access page.
Representational State Transfer (REST) is a framework for API design. REST builds a simple API on top of
the HTTP. It is based on generic facilities of the standard HTTP protocol, including the six basic HTTP
methods (GET, POST, PUT, DELETE, HEAD, INFO) and the full range of HTTP return codes. You can
discover REST APIs by navigating links embedded in the resources provided by the REST API, which
follow common encoding and formatting practices.
You can invoke the REST API to enable communication from one Riverbed appliance to another through
REST API calls, for example:
• A SteelCentral NetProfiler communicating with a SteelCentral NetShark.
• A SteelCentral NetProfiler retrieving a QoS configuration from a SteelFusion Edge.
For all uses you must preconfigure an access code to authenticate communication between parties and
to authorize access to protected resources.
For details, see https://support.riverbed.com/apis.
The REST API calls are based on the trusted application flow, a scenario where you download and install
an application on some host, such as your own laptop. You trust both the application and the security
of the host onto which the application is installed.
For example, suppose you install a Python script on a Linux box that queries QoS policies on an appliance
and prints a summary as text output. You install the script under your home directory and configure the
script with credentials to access the appliance. Once set up, you can simply log in to the Linux box and
run the script. Because you already preconfigured credentials with the SteelFusion Edge, you can run the
script without any user interaction after logging in. This trusted application flow enables you to schedule
execution through cron or chain it with other scripts that process the text data and combine it with other
functionality.
State Specify the state. Do not abbreviate.
Country Specify the country (two-letter code only).
Email Address Specify the email address of the contact person.
Generate CSR Generates the Certificate Signing Request.
Control Description
444 | Managing SteelFusion Edges
Enabling REST API access
This basic authentication sequence shown in Figure 11-18 assumes you have already downloaded the
Python script and installed it on a Linux box.
Figure 11-18. REST API access authentication sequence
To enable REST API access
1. Choose Administration > Security: REST API Access to display the REST API Access page.
Figure 11-19. REST API Access page
2. Under REST API Access Settings, select the Enable REST API Access check box.
3. Click Apply to apply your changes to the running configuration.
4. Click Save to save your settings permanently.

Managing SteelFusion Edges | 445
Enabling REST API access
Before an appliance can access the REST API, you must preconfigure an access code for the system to use to authenticate access.
To preconfigure the access code
1. Choose Administration > Security: REST API Access to display the REST API Access page.
2. Click Add Access Code.
3. Under Access Codes, type a description such as the hostname or IP address of the appliance you are using.
4. To create a code, select Generate New Access Code.
To use an existing code, select Import Existing Access Code.
5. Click Add.
The access code description appears in the access code table along with the name of the user who created it.
6. Click the access code description to display the access code.
7. Copy the access code from the text field into a text editor such as Notepad.
To use the access code in your external script
• Copy the access code copied from the Management Console REST API Access page into the configuration file of your external script. The script uses the access code to make a call to the appliance or system to request an access token. The appliance/system validates the access code and returns an access token for use by the script. Generally the access token is kept by the script for a session only (defined within your script), but note that the script can make many requests using the same access token. These access tokens have some lifetime—usually around an hour—in which they are valid. When they expire, the access code must fetch a new access token. The script uses the access token to make REST API calls with the appliance or system.

446 | Managing SteelFusion Edges
Enabling REST API access

Configuring System Administrator Settings | 447
12
Configuring System Administrator Settings
This chapter describes how to configure features to assist you in system administration. It includes these
sections:
• “Configuring alarm settings” on page 447
• “Setting announcements” on page 465
• “Configuring email settings” on page 466
• “Configuring log settings” on page 469
• “Configuring the date and time” on page 474
• “Configuring monitored ports” on page 479
• “Configuring SNMP settings” on page 481
Configuring alarm settingsYou can set alarms in the Administration > System Settings: Alarms page.
Enabling alarms is optional.
RiOS uses hierarchical alarms that group certain alarms into top-level categories, such as the SSL
Settings alarm. When an alarm triggers, its parent expands to provide more information. As an example,
the System Disk Full top-level parent alarm aggregates over multiple partitions. If a specific partition is
full, the System Disk Full parent alarm triggers and the Alarm Status report displays more information
regarding which partition caused the alarm to trigger.
Disabling a parent alarm disables its children. You can enable a parent alarm and disable any of its child
alarms. You cannot enable a child alarm without first enabling its parent.
The children alarms of a disabled parent appear on the Alarm Status report with a suppressed status.
Disabled children alarms of an enabled parent appear on the Alarm Status report with a disabled status.
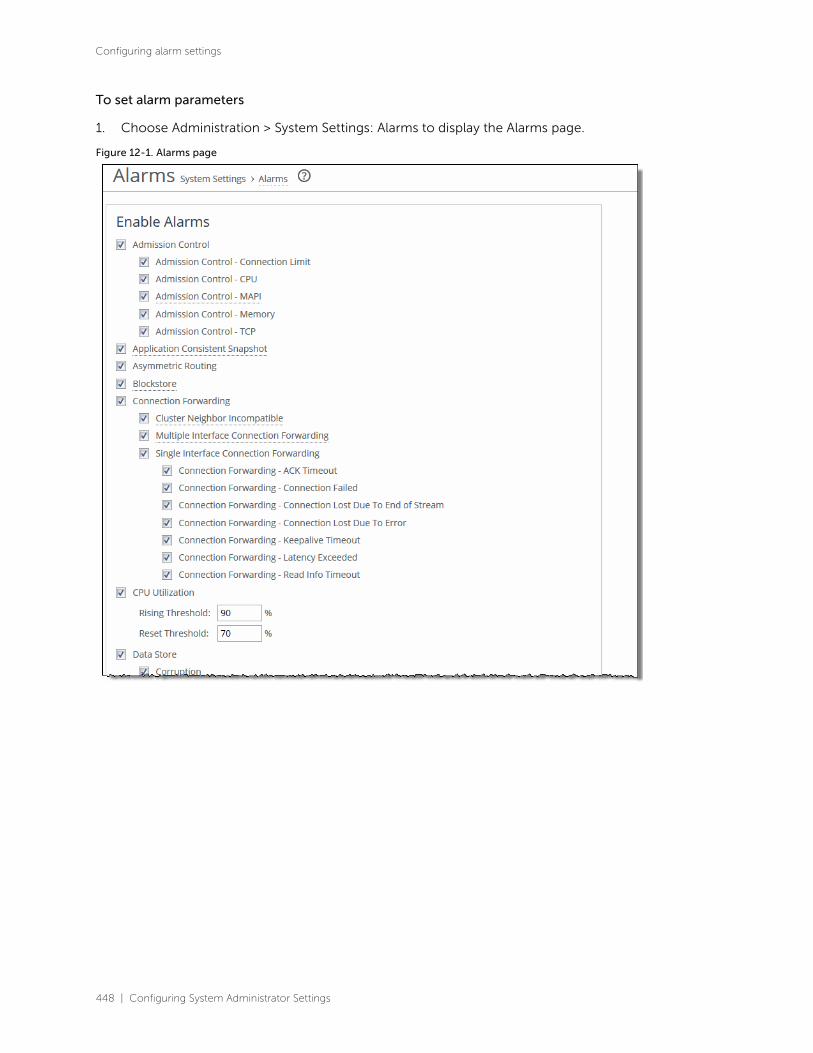
448 | Configuring System Administrator Settings
Configuring alarm settings
To set alarm parameters
1. Choose Administration > System Settings: Alarms to display the Alarms page.
Figure 12-1. Alarms page

Configuring System Administrator Settings | 449
Configuring alarm settings
2. Under Enable Alarms, complete the configuration as described in this table.

450 | Configuring System Administrator Settings
Configuring alarm settings
Control Description
Admission Control Enables an alarm and sends an email notification if the appliance enters admission control. When this occurs, the appliance optimizes traffic beyond its rated capability and is unable to handle the amount of traffic passing through the WAN link. During this event, the appliance continues to optimize existing connections, but new connections are passed through without optimization.
• Connection Limit - Indicates the system connection limit has been reached. Additional connections are passed through unoptimized. The alarm clears when the appliance moves out of this condition.
• CPU - The appliance has entered admission control due to high CPU use. During this event, the appliance continues to optimize existing connections, but new connections are passed through without optimization. The alarm clears automatically when the CPU usage has decreased.
• MAPI - The total number of MAPI optimized connections have exceeded the maximum admission control threshold. By default, the maximum admission control threshold is 85 percent of the total maximum optimized connection count for the client-side appliance. The appliance reserves the remaining 15 percent so that the MAPI admission control does not affect the other protocols. The 85 percent threshold is applied only to MAPI connections. RiOS is now passing through MAPI connections from new clients but continues to intercept and optimize MAPI connections from existing clients (including new MAPI connections from these clients). RiOS continues optimizing non-MAPI connections from all clients. The alarm clears automatically when the MAPI traffic has decreased; however, it can take one minute for the alarm to clear.
RiOS preemptively closes MAPI sessions to reduce the connection count in an attempt to bring the appliance out of admission control by bringing the connection count below the 85 percent threshold. RiOS closes the MAPI sessions in this order:
– MAPI prepopulation connections
– MAPI sessions with the largest number of connections
– MAPI sessions with most idle connections
– Most recently optimized MAPI sessions or oldest MAPI session
– MAPI sessions exceeding the memory threshold
• Memory - The appliance has entered admission control due to memory consumption. The appliance is optimizing traffic beyond its rated capability and is unable to handle the amount of traffic passing through the WAN link. During this event, the appliance continues to optimize existing connections, but new connections are passed through without optimization. No other action is necessary; the alarm clears automatically when the traffic has decreased.
• TCP - The appliance has entered admission control due to high TCP memory use. During this event, the appliance continues to optimize existing connections, but new connections are passed through without optimization. The alarm clears automatically when the TCP memory pressure has decreased.
By default, this alarm is enabled.
Asymmetric Routing Enables an alarm if asymmetric routing is detected on the network. Asymmetric routing is usually due to a failover event of an inner router or VPN.
By default, this alarm is enabled.

Configuring System Administrator Settings | 451
Configuring alarm settings
Blockstore Enables an alarm and sends an email notification if the system encounters any of these issues with the Edge blockstore:
• The blockstore is running out of space.
• The blockstore is out of space.
• The blockstore is running out of memory.
• The blockstore could not read data that was already replicated to the Core.
• The blockstore could not read data that is not yet replicated to the Core.
• The blockstore fails to start due to disk errors or an incorrect configuration.
• The Edge software version is incompatible with the blockstore version on disk.
• The standby Edge software version in a high-availability appliance pair is incompatible with the active Edge software version.
• On appliances with read cache solid state disks (SSDs), the read cache fails to start.
• The blockstore could not save data to disk due to a media error.
By default, this alarm is enabled.
Connection Forwarding
Enables an alarm if the system detects a problem with a connection-forwarding neighbor. The connection-forwarding alarms are inclusive of all connection-forwarding neighbors. For example, if an appliance has three neighbors, the alarm triggers if any one of the neighbors are in error. In the same way, the alarm clears only when all three neighbors are no longer in error.
• Cluster Neighbor Incompatible - Enables an alarm and sends an email notification if a connection-forwarding neighbor is running a RiOS version that is incompatible with IPv6, or if the IP address configuration between neighbors does not match. Neighbors must be running RiOS 8.5 or later.
• Multiple Interface - Enables an alarm and sends an email notification if the connection to a SteelHead in a connection forwarding cluster is lost.
• Single Interface - Enables an alarm and sends an email notification if the connection to a SteelHead connection-forwarding neighbor is lost.
By default, this alarm is enabled.
CPU Utilization Enables an alarm and sends an email notification if the average and peak threshold for the CPU utilization is exceeded. When an alarm reaches the rising threshold, it is activated; when it reaches the lowest or reset threshold, it is reset. After an alarm is triggered, it is not triggered again until it has fallen below the reset threshold.
By default, this alarm is enabled.
• Rising Threshold - Specify the rising threshold. When an alarm reaches the rising threshold, it is activated. The default value is 90 percent.
• Reset Threshold - Specify the reset threshold. When an alarm reaches the lowest or reset threshold, it is reset. After an alarm is triggered, it is not triggered again until it has fallen below the reset threshold. The default value is 70 percent.
Control Description
452 | Configuring System Administrator Settings
Configuring alarm settings
Data Store • Corruption - Enables an alarm and sends an email notification if the RiOS data store is corrupt or has become incompatible with the current configuration. To clear the RiOS data store of data, restart the optimization service and click Clear the Data Store.
If the alarm was caused by an unintended change to the configuration, the configuration can be changed to match the old data store settings again and then a service restart (without clearing) will clear the alarm. Typical configuration changes that require a restart clear are changes to the data store encryption (choose Optimization > Data Replication: Data Store) or enabling extended peer table (choose Optimization > Network Services: Peering Rules).
• Data Store Clean Required - Enables an alarm and sends an email notification if you need to clear the RiOS data store.
• Encryption Level Mismatch - Enables an alarm and sends an email notification if a data store error such as an encryption, header, or format error occurs.
• Synchronization Error - Enables an alarm if RiOS data store synchronization has failed. The RiOS data store synchronization between two appliances has been disrupted and the RiOS data stores are no longer synchronized.
By default, this alarm is enabled.
Disk Full Enables an alarm if the system partitions (not the RiOS data store) are full or almost full. For example, RiOS monitors the available space on /var, which is used to hold logs, statistics, system dumps, TCP dumps, and so on.
By default, this alarm is enabled.
Domain Authentication Alert
Enables an alarm when the system is either unable to communicate with the domain controller, or has detected an SMB signing error, or that delegation has failed. CIFS-signed and Encrypted-MAPI traffic is passed through without optimization.
By default, this alarm is enabled.
Domain Join Error Enables an alarm if an attempt to join a Windows domain has failed. The number one cause of failing to join a domain is a significant difference in the system time on the Windows domain controller and the appliance. A domain join can also fail when the DNS server returns an invalid IP address for the domain controller.
By default, this alarm is enabled.
Edge HA Service Enables an alarm and sends an email notification if only one of the appliances in a high availability (HA) SteelFusion Edge pair is actively serving storage data (the active peer).
The two appliances maintain a heartbeat protocol between them, so that if the active peer goes down, the standby peer can take over servicing the exports. If the standby peer goes down, the active peer continues servicing the exports after raising this alarm and sending an email that the appliance is degraded. The email contains the IP address of the peer appliance.
When the appliance is degraded, after a failed peer resumes, it resynchronizes with the other peer in the HA pair to receive any data that was written since the time of the failure. After the peer receives all the written data, the HA resumes and any future writes are reflected to both peers.
By default, this alarm is enabled.
Control Description

Configuring System Administrator Settings | 453
Configuring alarm settings
Hardware These alarms report issues with the SteelFusion Edge RiOS node hardware.
• Disk Error - Enables an alarm when one or more disks is offline. To see which disk is offline, enter the show raid diagram command from the system prompt.
By default, this alarm is enabled.
This alarm applies only to the SteelHead RAID Series 3000, 5000, and 6000.
• Fan Error - Enables an alarm and sends an email notification if a fan is failing or has failed and needs to be replaced. By default, this alarm is enabled.
• Flash Error - Enables an alarm when the system detects an error with the flash drive hardware. By default, this alarm is enabled.
• IPMI - Indicates an Intelligent Platform Management Interface (IPMI) event.
This alarm triggers when there has been a physical security intrusion. These events trigger this alarm:
– Chassis intrusion (physical opening and closing of the appliance case)
– Memory errors (correctable or uncorrectable ECC memory errors)
– Hard drive faults or predictive failures
– Power supply status or predictive failure
By default, this alarm is enabled.
• Management Disk Size Error - Enables an alarm if the size of the management disk is too small to support the virtual appliance model.
• Memory Error - Enables an alarm and sends an email notification if a memory error is detected: for example, when a system memory stick fails.
• Other Hardware Error - Enables an alarm if a hardware error is detected. These issues trigger the hardware error alarm:
– The appliance does not have enough disk, memory, CPU cores, or NICs to support the current configuration.
– The appliance is using a memory Dual In-line Memory Module (DIMM), a hard disk, or a NIC that is not qualified by Riverbed.
– DIMMs are plugged into the appliance but RiOS cannot recognize them because:
– a DIMM is in the wrong slot. You must plug DIMMs into the black slots first and then use the blue slots when all of the black slots are in use.
—or—
– a DIMM is broken and you must replace it.
Control Description

454 | Configuring System Administrator Settings
Configuring alarm settings
– Safety Valve: disk access exceeds response times - Enables an alarm when the appliance is experiencing increased disk access time and has started the safety valve disk bypass mechanism that switches connections into SDR-A. SDR-A performs data reduction in memory until the disk access latency falls below the safety valve activation threshold.
Disk access time can exceed the safety valve activation threshold for several reasons: the appliance might be undersized for the amount of traffic it is required to optimize, a larger than usual amount of traffic is being optimized temporarily, or a disk is experiencing hardware issues such as sector errors, failing mechanicals, or RAID disk rebuilding.
You configure the safety valve activation threshold and timeout using CLI commands:
datastore safety-valve thresholddatastore safety-value timeout
For details, see the Riverbed Command-Line Interface Reference Manual.
– Other hardware issues
By default, this alarm is enabled.
• Power Supply - Enables an alarm and sends an email notification if an inserted power supply cord does not have power, as opposed to a power supply slot with no power supply cord inserted. By default, this alarm is enabled.
• RAID - Indicates an error with the RAID array (for example, missing drives, pulled drives, drive failures, and drive rebuilds). An audible alarm might also sound. To see if a disk has failed, enter the show raid diagram CLI command from the system prompt.
For drive rebuilds, if a drive is removed and then reinserted, the alarm continues to be triggered until the rebuild is complete. Rebuilding a disk drive can take 4 to 6 hours. This alarm applies only to the RAID Series 3000, 5000, and 6000.
• SSD Write Cycle Level Exceeded - Enables an alarm if the accumulated SSD write cycles exceed a predefined write cycle 95 percent level on SteelHead models 7050L and 7050M. If the alarm is triggered, the administrator can swap out the disk before any problems arise.
By default, this alarm is enabled.
Control Description

Configuring System Administrator Settings | 455
Configuring alarm settings
Hypervisor Hardware Enables an alarm when a problem occurs with the SteelFusion Edge Hypervisor node hardware. The hypervisor hardware affects virtualization on the appliance. These issues trigger the hypervisor hardware alarm:
• Hardware Management Connection - Enables an alarm and sends an emailnotification when RiOS loses IP connectivity or cannot authenticate theconnection to the hypervisor motherboard controller.
• Hardware Management Controller Unauthenticated User - Enables an alarm andsends an email notification when RiOS does not recognize the password used toaccess the hardware management controller.
• Memory - Enables an alarm and sends an email notification if a memory error isdetected: for example, when a system memory stick fails.
• Other Hardware - Enables an alarm if a hardware error is detected. These issuestrigger the hardware error alarm:
– The hypervisor hardware is using a memory Dual In-line Memory Module(DIMM), a hard disk, or a NIC that is not qualified.
– The hypervisor hardware has detected a RiOS NIC. The hypervisor does notsupport RiOS NICs.
– DIMMs are plugged into the hypervisor hardware but the hypervisor cannotrecognize them because:
– a DIMM is in the wrong slot. You must plug DIMMs into the black slots first andthen use the blue slots when all of the black slots are in use.
—or—
– a DIMM is broken and you must replace it.
• Power - Enables an alarm and sends an email notification if the hypervisor losespower unexpectedly.
• Temperature - Enables an alarm and sends an email notification if a hypervisorCPU, board, or platform controller hub (PCH) temperature exceeds the risingthreshold. When the CPU, board, or PCH returns to the reset threshold, the criticalalarm clears (after polling for 30 seconds). If the appliance has more than one CPU,the alarm displays both CPUs. The default values are maintained by themotherboard.
Control Description

456 | Configuring System Administrator Settings
Configuring alarm settings
Inbound QoS WAN Bandwidth Configuration
Enables an alarm and sends an email notification if the inbound QoS WAN bandwidth for one or more of the interfaces is set incorrectly. You must configure the WAN bandwidth to be less than or equal to the interface bandwidth link rate.
This alarm triggers when the system encounters one of these conditions:
• An interface is connected and the WAN bandwidth is set higher than its bandwidthlink rate: for example, if the bandwidth link rate is 1536 kbps, and the WANbandwidth is set to 2000 kbps.
• A nonzero WAN bandwidth is set and QoS is enabled on an interface that isdisconnected; that is, the bandwidth link rate is 0.
• A previously disconnected interface is reconnected, and its previously configuredWAN bandwidth was set higher than the bandwidth link rate. The ManagementConsole refreshes the alarm message to inform you that the configured WANbandwidth is set higher than the interface bandwidth link rate.
While this alarm appears, the appliance puts existing connections into the default class.
The alarm clears when you configure the WAN bandwidth to be less than or equal to the bandwidth link rate or reconnect an interface configured with the correct WAN bandwidth.
By default, this alarm is enabled.
Control Description

Configuring System Administrator Settings | 457
Configuring alarm settings
Licensing Enables an alarm and sends an email notification if a license is removed, is about to expire, has expired, or is invalid. This alarm triggers if the appliance has no MSPEC license installed for its currently configured model.
• Appliance Unlicensed - This alarm triggers if the appliance has no BASE or MSPEClicense installed for its currently configured model. For details about updatinglicenses, see “Managing licenses and model upgrades” on page 409.
• Autolicense Critical Event - This alarm triggers on a SteelHead (virtual edition)appliance when the Riverbed Licensing Portal cannot respond to a license requestwith valid licenses. The Licensing Portal cannot issue a valid license for one ofthese reasons:
– A newer SteelHead (virtual edition) appliance is already using the token, so youcannot use it on the SteelHead (virtual edition) appliance displaying the criticalalarm. Every time the SteelHead (virtual edition) appliance attempts to refetch alicense token, the alarm retriggers.
– The token has been redeemed too many times. Every time the SteelHead(virtual edition) appliance attempts to refetch a license token, the alarmretriggers.
• Autolicense Informational Event - This alarm triggers if the Riverbed LicensingPortal has information regarding the licenses for a SteelHead (virtual edition)appliance. For example, the SteelHead (virtual edition) appliance displays this alarmwhen the portal returns licenses that are associated with a token that has beenused on a different SteelHead (virtual edition) appliance.
• Licenses Expired - This alarm triggers if one or more features has at least onelicense installed, but all of them are expired.
• Licenses Expiring - This alarm triggers if the license for one or more features isgoing to expire within two weeks.
Note: The licenses expiring and licenses expired alarms are triggered per feature. For example: if you install two license keys for a feature, LK1-FOO-xxx (expired) and LK1-FOO-yyy (not expired), the alarms do not trigger, because the feature has one valid license.
By default, this alarm is enabled.
Link Duplex Enables an alarm and sends an email notification when an interface was not configured for half-duplex negotiation but has negotiated half-duplex mode. Half-duplex significantly limits the optimization service results.
The alarm displays which interface is triggering the duplex alarm.
By default, this alarm is enabled.
You can enable or disable the alarm for a specific interface. To enable or disable an alarm, choose Administration > System Settings: Alarms and select or clear the check box next to the link name.
Control Description

458 | Configuring System Administrator Settings
Configuring alarm settings
Link I/O Errors Enables an alarm and sends an email notification when the link error rate exceeds 0.1 percent while either sending or receiving packets. This threshold is based on the observation that even a small link error rate reduces TCP throughput significantly. A properly configured LAN connection experiences very few errors.
The alarm clears when the rate drops below 0.05 percent.
You can change the default alarm thresholds by entering the alarm link_io_errors err-threshold <threshold-value> command at the system prompt. For details, see the Riverbed Command-Line Interface Reference Manual.
By default, this alarm is enabled.
You can enable or disable the alarm for a specific interface. For example, you can disable the alarm for a link after deciding to tolerate the errors. To enable or disable an alarm, choose Administration > System Settings: Alarms and select or clear the check box next to the link name.
Link State Enables an alarm and sends an email notification if an Ethernet link is lost due to an unplugged cable or dead switch port. Depending on which link is down, the system might no longer be optimizing and a network outage could occur.
This condition is often caused by surrounding devices, like routers or switches, interface transitioning. This alarm also accompanies service or system restarts on the appliance.
For WAN/LAN interfaces, the alarm triggers if in-path support is enabled for that WAN/LAN pair.
By default, this alarm is disabled.
You can enable or disable the alarm for a specific interface. To enable or disable an alarm, choose Administration > System Settings: Alarms and select or clear the check box next to the link name.
Memory Paging Enables an alarm and sends an email notification if memory paging is detected. If 100 pages are swapped every couple of hours, the system is functioning properly. If thousands of pages are swapped every few minutes, contact Riverbed Support athttps://support.riverbed.com.
By default, this alarm is enabled.
Neighbor Incompatibility
Enables an alarm if the system has encountered an error in reaching an appliance configured for connection forwarding.
By default, this alarm is enabled.
Network Bypass Enables an alarm and sends an email notification if the system is in bypass failover mode.
By default, this alarm is enabled.
NFS V2/V4 alarm Enables an alarm and sends an email notification if the appliance detects that either NFSv2 or NFSv4 is in use. The appliance only supports NFSv3 and passes through all other versions.
By default, this alarm is enabled.
Control Description

Configuring System Administrator Settings | 459
Configuring alarm settings
Optimization Service • Internal Error - Enables an alarm and sends an email notification if the RiOS optimization service encounters a condition that might degrade optimization performance. By default, this alarm is enabled. Go to the Administration > Maintenance: Services page and restart the optimization service.
• Service Status - Enables an alarm and sends an email notification if the RiOS optimization service encounters a service condition. By default, this alarm is enabled. The message indicates the reason for the condition. These conditions trigger this alarm:
– Configuration errors.
– An appliance reboot.
– A system crash.
– An optimization service restart.
– A user enters the no service enable command or shuts down the optimization service from the Management Console.
– A user restarts the optimization service from either the Management Console or CLI.
• Unexpected Halt - Enables an alarm and sends an email notification if the RiOS optimization service halts due to a serious software error. By default, this alarm is enabled.
Outbound QoS WAN Bandwidth Configuration
Enables an alarm and sends an email notification if the outbound QoS WAN bandwidth for one or more of the interfaces is set incorrectly. You must configure the WAN bandwidth to be less than or equal to the interface bandwidth link rate.
This alarm triggers when the system encounters one of these conditions:
• An interface is connected and the WAN bandwidth is set to higher than its bandwidth link rate: for example, if the bandwidth link rate is 100 Mbps, and the WAN bandwidth is set to 200 Mbps.
• A nonzero WAN bandwidth is set and QoS is enabled on an interface that is disconnected; that is, the bandwidth link rate is 0.
• A previously disconnected interface is reconnected, and its previously configured WAN bandwidth was set higher than the bandwidth link rate. The Management Console refreshes the alarm message to inform you that the configured WAN bandwidth is set greater than the interface bandwidth link rate.
While this alarm appears, the system puts existing connections into the default class.
The alarm clears when you configure the WAN bandwidth to be less than or equal to the bandwidth link rate or reconnect an interface configured with the correct WAN bandwidth.
By default, this alarm is enabled.
Path Selection Path Down
Enables an alarm and sends an email notification if the system detects that one of the predefined uplinks for a connection is unavailable. The uplink has exceeded either the timeout value for uplink latency or the threshold for observed packet loss.
When an uplink fails, the system directs traffic through another available uplink. When the original uplink comes back up, the system redirects the traffic back to it.
By default, this alarm is enabled.
Control Description
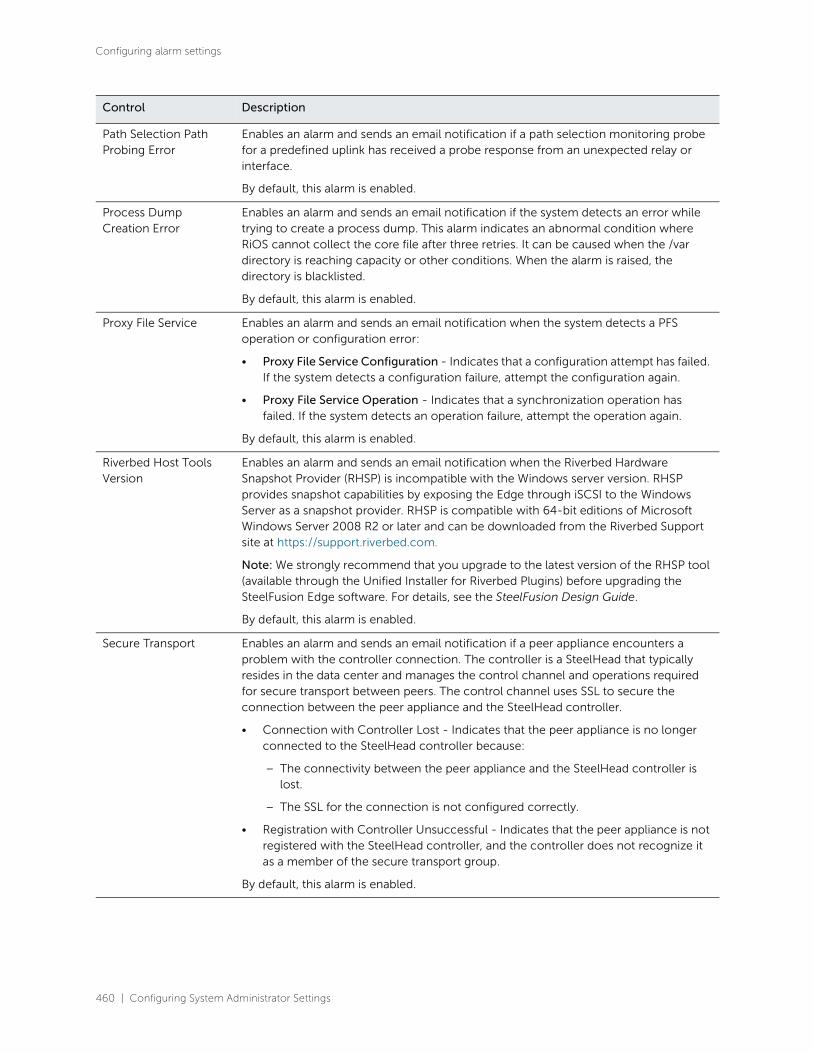
460 | Configuring System Administrator Settings
Configuring alarm settings
Path Selection Path Probing Error
Enables an alarm and sends an email notification if a path selection monitoring probe for a predefined uplink has received a probe response from an unexpected relay or interface.
By default, this alarm is enabled.
Process Dump Creation Error
Enables an alarm and sends an email notification if the system detects an error while trying to create a process dump. This alarm indicates an abnormal condition where RiOS cannot collect the core file after three retries. It can be caused when the /var directory is reaching capacity or other conditions. When the alarm is raised, the directory is blacklisted.
By default, this alarm is enabled.
Proxy File Service Enables an alarm and sends an email notification when the system detects a PFS operation or configuration error:
• Proxy File Service Configuration - Indicates that a configuration attempt has failed. If the system detects a configuration failure, attempt the configuration again.
• Proxy File Service Operation - Indicates that a synchronization operation has failed. If the system detects an operation failure, attempt the operation again.
By default, this alarm is enabled.
Riverbed Host Tools Version
Enables an alarm and sends an email notification when the Riverbed Hardware Snapshot Provider (RHSP) is incompatible with the Windows server version. RHSP provides snapshot capabilities by exposing the Edge through iSCSI to the Windows Server as a snapshot provider. RHSP is compatible with 64-bit editions of Microsoft Windows Server 2008 R2 or later and can be downloaded from the Riverbed Support site at https://support.riverbed.com.
Note: We strongly recommend that you upgrade to the latest version of the RHSP tool (available through the Unified Installer for Riverbed Plugins) before upgrading the SteelFusion Edge software. For details, see the SteelFusion Design Guide.
By default, this alarm is enabled.
Secure Transport Enables an alarm and sends an email notification if a peer appliance encounters a problem with the controller connection. The controller is a SteelHead that typically resides in the data center and manages the control channel and operations required for secure transport between peers. The control channel uses SSL to secure the connection between the peer appliance and the SteelHead controller.
• Connection with Controller Lost - Indicates that the peer appliance is no longer connected to the SteelHead controller because:
– The connectivity between the peer appliance and the SteelHead controller is lost.
– The SSL for the connection is not configured correctly.
• Registration with Controller Unsuccessful - Indicates that the peer appliance is not registered with the SteelHead controller, and the controller does not recognize it as a member of the secure transport group.
By default, this alarm is enabled.
Control Description

Configuring System Administrator Settings | 461
Configuring alarm settings
Secure Vault Enables an alarm and sends an email notification if the system encounters a problem with the secure vault:
• Secure Vault Locked - Indicates that the secure vault is locked. To optimize SSL connections or to use RiOS data store encryption, the secure vault must be unlocked. Go to Administration > Security: Secure Vault and unlock the secure vault.
• Secure Vault New Password Recommended - Indicates that the secure vault requires a new, nondefault password. Reenter the password.
• Secure Vault Not Initialized - Indicates that an error has occurred while initializing the secure vault. When the vault is locked, SSL traffic is not optimized and you cannot encrypt the RiOS data store. For details, see “Unlocking the secure vault” on page 434.
By default, this alarm is enabled.
Server Backup Enables an alarm and sends a notification if the system encounters one of these issues with server-based backups:
• Failed connection to the server - Indicates that the connection between the Edge and the ESXi server or vCenter is down, the server is not running, or there are incorrect credentials for the ESXi or vCenter server login.
• Backup failure on the Edge - Indicates that a backup has failed on the Edge. The alarm displays a message with the affected server.
• NFS export is shared among multiple ESXi servers - Indicates that a server is sharing an export with other servers.
• Server with a backup policy does not have an export - Indicates that a server with an associated backup policy does not have any VMs or exports to protect.
Snapshot Enables an alarm if a snapshot fails to be commit to the SAN, or a snapshot fails to complete due to Windows timing out.
By default, this alarm is enabled.
Software Compatibility Enables an alarm and sends an email notification if the system encounters a problem with software compatibility:
• Peer Mismatch - Needs Attention - Indicates that the appliance has encountered another appliance that is running an incompatible version of system software. Refer to the CLI, Management Console, or the SNMP peer table to determine which appliance is causing the conflict. Connections with that peer will not be optimized, connections with other peers running compatible RiOS versions are unaffected.
• Software Version Mismatch - Degraded - Indicates that the appliance is running an incompatible version of system software.
By default, this alarm is enabled.
Control Description

462 | Configuring System Administrator Settings
Configuring alarm settings
SSL Enables an alarm if an error is detected in your SSL configuration. For details about checking your settings, see “Configuring SSL main settings” on page 325.
• Non-443 SSL Servers - Indicates that during a RiOS upgrade (for example, from 8.5 to 9.0), the system has detected a preexisting SSL server certificate configuration on a port other than the default SSL port 443. SSL traffic might not be optimized. To restore SSL optimization, you can add an in-path rule to the client-side appliance to intercept the connection and optimize the SSL traffic on the nondefault SSL server port.
After adding an in-path rule, you must clear this alarm manually by entering this command:
stats alarm non_443_ssl_servers_detected_on_upgrade clear
• SSL Certificates Error (SSL CAs) - Indicates that an SSL peering certificate has failed to reenroll automatically within the Simple Certificate Enrollment Protocol (SCEP) polling interval.
• SSL Certificates Error (SSL Peering CAs) - Indicates that an SSL peering certificate has failed to reenroll automatically within the Simple Certificate Enrollment Protocol (SCEP) polling interval.
• SSL Certificates Expiring - Indicates that an SSL certificate is about to expire.
• SSL Certificates SCEP - Indicates that an SSL certificate has failed to reenroll automatically within the SCEP polling interval.
By default, this alarm is enabled.
SteelFusion Core Enables an alarm if the system encounters any of these issues with the SteelFusion Core:
• The Edge device has connected to a Core that does not recognize the Edge device.
• The Edge does not have an active connection with the Core.
• The data channel between Core and the Edge is down.
• The connection between the Core and the Edge has stalled.
By default, this alarm is enabled.
SteelFusion Protocol Service
Enables an alarm and sends an email notification if an NFS protocol error is preventing a volume from being mounted from the Edge to the clients (for example, ESXi).
Control Description

Configuring System Administrator Settings | 463
Configuring alarm settings
Storage Volume Status Enables an alarm and sends an email notification if the connection to the volume has failed or there is an issue with:
• Backend connectivity
• No read/write permissions
• Space threshold has been reached
• Export filesystem is corrupted or invalid.
• Export metadata is corrupted or invalid.
• Edge Virtual IP is not configured.
• Export filesystem resize has failed.
• Export could not be mounted to the client
• Connectivity issues between Edge and Core.
By default, this alarm is enabled.
System Detail Report Enables an alarm if a system component has encountered a problem.
By default, this alarm is disabled.
Temperature • Critical Temperature - Enables an alarm and sends an email notification if the CPU temperature exceeds the rising threshold. When the CPU returns to the reset threshold, the critical alarm is cleared. The default value for the rising threshold temperature is 70ºC; the default reset threshold temperature is 67ºC.
• Warning Temperature - Enables an alarm and sends an email notification if the CPU temperature approaches the rising threshold. When the CPU returns to the reset threshold, the warning alarm clears.
– Rising Threshold - Specifies the rising threshold. The alarm activates when the temperature exceeds the rising threshold. The default value is 70 percent.
– Reset Threshold - Specifies the reset threshold. The alarm clears when the temperature falls below the reset threshold. The default value is 67 percent.
After the alarm triggers, it cannot trigger again until after the temperature falls below the reset threshold and then exceeds the rising threshold again.
By default, this alarm is enabled.
Control Description

464 | Configuring System Administrator Settings
Configuring alarm settings
Uncommitted Edge Data
Enables an alarm when a large amount of data in the blockstore needs to be committed to SteelFusion Core. The difference between the contents of the blockstore and the SteelFusion Core-side NFS export is significant. This alarm checks for how much uncommitted data is in the Edge cache as a percentage of the total cache size.
This alarm triggers when the appliance writes a large amount of data very quickly, but the WAN pipe is not large enough to get the data back to the SteelFusion Core fast enough to keep the uncommitted data percentage below 5 percent. As long as data is being committed, the cache will flush eventually.
The threshold is 5 percent, which for a 4 TiB (1260-4) system is 200 GiB. To change the threshold, use this command:
[failover-peer] edge id <id> blockstore uncommitted [trigger-pct <percentage>] [repeat-pct <percentage>] [repeat-interval <minutes>]
For example:
Core3(config) # edge id Edge2 blockstore uncommitted trigger-pct 50 repeat-pct 25 repeat-interval 5
For details on the CLI command, see the SteelFusion Command-Line Interface Reference Manual.
To check that data is being committed, go to Storage > Reports: Blockstore Metrics on the Edge.
By default, this alarm is enabled.
Virtualization Hypervisor - Enables an alarm when a problem occurs with the hypervisor.
License - Enables an alarm when the hypervisor license has expired.
Operation - Enables an alarm when the hypervisor operation is degraded and is in lockdown mode.
Virtual Services Platform - Enables an alarm when a communication issue occurs between VSP and the hypervisor.
Connection - Enables an alarm when the hypervisor is not communicating for any of these issues:
• VSP is disconnected from the hypervisor.
• The hypervisor password is invalid.
• VSP was unable to gather some hardware information.
• VSP is disconnected.
Control Description

Configuring System Administrator Settings | 465
Setting announcements
3. Click Apply to apply your changes to the running configuration.
4. Click Save to save your settings permanently.
Related topics
• “Configuring email settings” on page 466
• “Configuring SNMP settings” on page 481
• “Viewing process dumps” on page 644
Setting announcementsYou can create or modify a login message or a message of the day. The login message appears in the
Management Console Login page. The message of the day appears in the Dashboard and when you first
log in to the CLI.
Installation - Enables an alarm when VSP is not installed properly and is powered off for any of these issues:
• A hypervisor upgrade has failed.
• A configuration set from the installer has failed to be applied to the hypervisor.
• VSP could not gather enough information to set up an interface.
• The hypervisor is not installed.
Web Proxy Web Proxy Service - Configuration - Enables an alarm when an error occurs with the web proxy configuration.
Web Proxy Service - Service Status - Enables an alarm when an error occurs with the web proxy service. By default, this alarm is enabled.
Control Description

466 | Configuring System Administrator Settings
Configuring email settings
To set an announcement
1. Choose Administration > System Settings: Announcements to display the Announcements page.
Figure 12-2. Announcements page
2. Use the controls to complete the configuration as described in this table.
3. Click Apply to view the message before saving.
4. Click Save to save your settings permanently.
Configuring email settings You can set email notification parameters for events and failures in the Administration > System Settings:
Email page.
By default, email addresses are not specified for event and failure notification.
Control Description
Login Message Specify a message in the text box to appear in the Login page.
MOTD Specify a message in the text box to appear in the Dashboard.
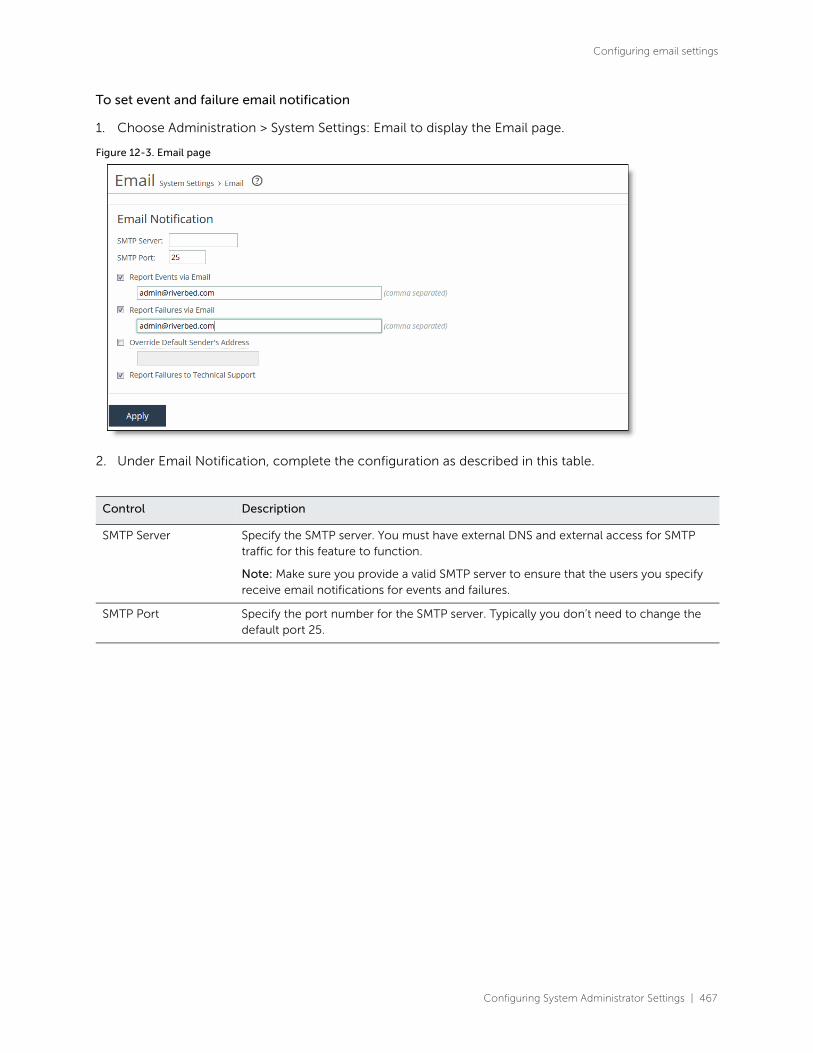
Configuring System Administrator Settings | 467
Configuring email settings
To set event and failure email notification
1. Choose Administration > System Settings: Email to display the Email page.
Figure 12-3. Email page
2. Under Email Notification, complete the configuration as described in this table.
Control Description
SMTP Server Specify the SMTP server. You must have external DNS and external access for SMTP traffic for this feature to function.
Note: Make sure you provide a valid SMTP server to ensure that the users you specify receive email notifications for events and failures.
SMTP Port Specify the port number for the SMTP server. Typically you don’t need to change the default port 25.

468 | Configuring System Administrator Settings
Configuring email settings
Report Events via Email Select this option to report alarm events through email. Specify a list of email addresses to receive the notification messages. Separate addresses by spaces, semicolons, commas, or vertical bars.
These alarms are events:
• Admission control
• CPU utilization (rising threshold, reset threshold)
• Temperature (rising threshold, reset threshold)
• Data store wrap frequency
• Domain authentication alert
• Network interface duplex errors
• Network interface link errors
• Fan error
• Flash error
• Hardware error
• IPMI
• Licensing
• Memory error
• Neighbor incompatibility
• Network bypass
• NFS V2/V4 alarm
• Non-SSL servers detected on upgrade
• Optimization service (general service status, optimization service)
• Extended memory paging activity
• Secure vault
• System disk full
• Software version mismatch
• Storage profile switch failed
• TCP Stop Trigger scan has started
• Asymmetric routes
• Expiring SSL certificates
• SSL peering certificate SCEP automatic re-enrollment
• Connection forwarding (ACK timeout, failure, lost EOS, lost ERR, keepalive timeout, latency exceeded, read info timeout)
• Prepopulation or Proxy File Service
Control Description
Configuring System Administrator Settings | 469
Configuring log settings
3. Click Apply to apply your changes to the running configuration.
4. Click Save to save your settings permanently.
Related topic
• “Configuring alarm settings” on page 447
Configuring log settings You set up local and remote logging in the Administration > System Settings: Logging page.
By default, the system rotates each log file every 24 hours or if the file size reaches one GB
uncompressed. You can change this to rotate every week or month and you can rotate the files based
on file size.
The automatic rotation of system logs deletes your oldest log file, labeled as Archived log #10, pushes
the current log to Archived log # 1, and starts a new current-day log file.
Report Failures via Email
Select this option to report alarm failures through email. Specify a list of email addresses to receive the notification messages. Separate addresses by spaces, semicolons, commas, or vertical bars.
These alarms are failures:
• Data store corruption
• System details report
• Domain join error
• RAID
• Optimization service - unexpected halt
• Critical temperature
• Disk error
• SSD wear warning
Override Default Sender’s Address
Select this option to configure the SMTP protocol for outgoing server messages for errors or events. Specify a list of email addresses to receive the notification messages. Separate addresses by commas.
You can also configure the outgoing email address sent to the client recipients. The default outgoing address is [email protected]. If you don’t specify a domain the default outgoing email is do-not-reply@hostname.
You can configure the host and domain settings in the Networking > Networking: Host Settings page.
Report Failures to Technical Support
Select this option to report serious failures such as system crashes to Riverbed Support.
We recommend that you activate this feature so that problems are promptly corrected.
Note: This option doesn’t automatically report a disk drive failure. In the event of a disk drive failure, please contact Riverbed Support at [email protected].
Control Description
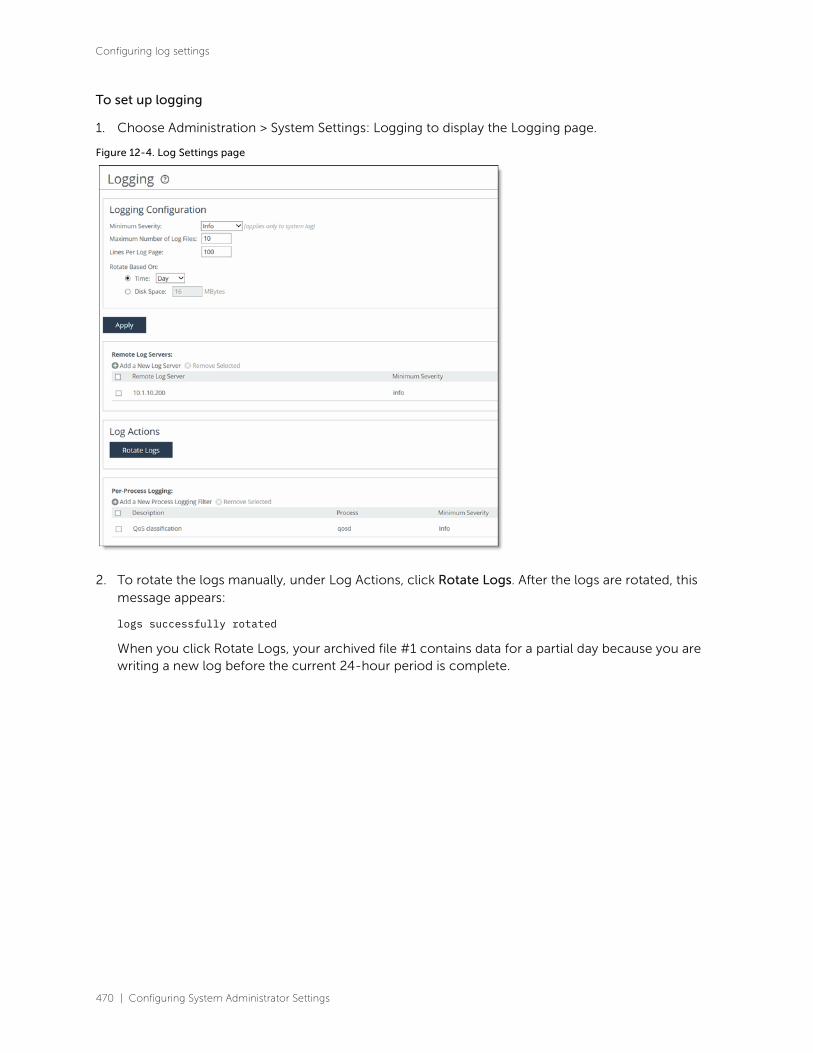
470 | Configuring System Administrator Settings
Configuring log settings
To set up logging
1. Choose Administration > System Settings: Logging to display the Logging page.
Figure 12-4. Log Settings page
2. To rotate the logs manually, under Log Actions, click Rotate Logs. After the logs are rotated, this message appears:
logs successfully rotated
When you click Rotate Logs, your archived file #1 contains data for a partial day because you are writing a new log before the current 24-hour period is complete.

Configuring System Administrator Settings | 471
Configuring log settings
3. Under Logging Configuration, complete the configuration as described in this table.
4. Click Apply to apply your changes to the running configuration.
5. Click Save to save your settings permanently.
To add or remove a log server
1. To add or remove a log server, complete the configuration as described in this table.
Control Description
Minimum Severity Select the minimum severity level for the system log messages. The log contains all messages with this severity level or higher. Select one of these levels from the drop-down list:
• Emergency - Emergency, the system is unusable.
• Alert - Action must be taken immediately.
• Critical - Conditions that affect the functionality of the SteelHead.
• Error - Conditions that probably affect the functionality of the SteelHead.
• Warning - Conditions that could affect the functionality of the SteelHead, such as authentication failures.
• Notice - Normal but significant conditions, such as a configuration change. This is the default setting.
• Info - Informational messages that provide general information about system operations.
Note: This control applies to the system log only. It doesn’t apply to the user log.
Maximum Number of Log Files
Specify the maximum number of logs to store. The default value is 10.
Lines Per Log Page Specify the number of lines per log page. The default value is 100.
Rotate Based On Specifies the rotation option:
• Time - Select Day, Week, or Month from the drop-down list. The default setting is Day.
• Disk Space - Specify how much disk space, in megabytes, the log uses before it rotates. The default value is 16 MB.
Note: The log file size is checked at 10-minute intervals. If there’s an unusually large amount of logging activity, it’s possible for a log file to grow larger than the set disk space limit in that period of time.
Control Description
Add a New Log Server Displays the controls for configuring new log servers.
Server IP Specify the server IP address.

472 | Configuring System Administrator Settings
Configuring log settings
2. Click Apply to apply your changes to the running configuration.
3. Click Save to save your settings permanently.
Filtering logs by application or process
You can filter a log by one or more applications or one or more processes. This is particularly useful
when capturing data at a lower severity level where an appliance might not be able to sustain the flow
of logging data the service is committing to disk.
To filter a log
1. Choose Administration > System Settings: Logging to display the Logging page.
Figure 12-5. Filtering a log
Minimum Severity Select the minimum severity level for the log messages. The log contains all messages with this severity level or higher. Select one of these levels from the drop-down list:
• Emergency - Emergency, the system is unusable.
• Alert - Action must be taken immediately.
• Critical - Conditions that affect the functionality of the SteelHead.
• Error - Conditions that probably affect the functionality of the SteelHead.
• Warning - Conditions that could affect the functionality of the SteelHead, such as authentication failures.
• Notice - Normal but significant conditions, such as a configuration change. This is the default setting.
• Info - Informational messages that provide general information about system operations.
Add Adds the server to the list.
Remove Selected Select the check box next to the name and click Remove Selected.
Control Description
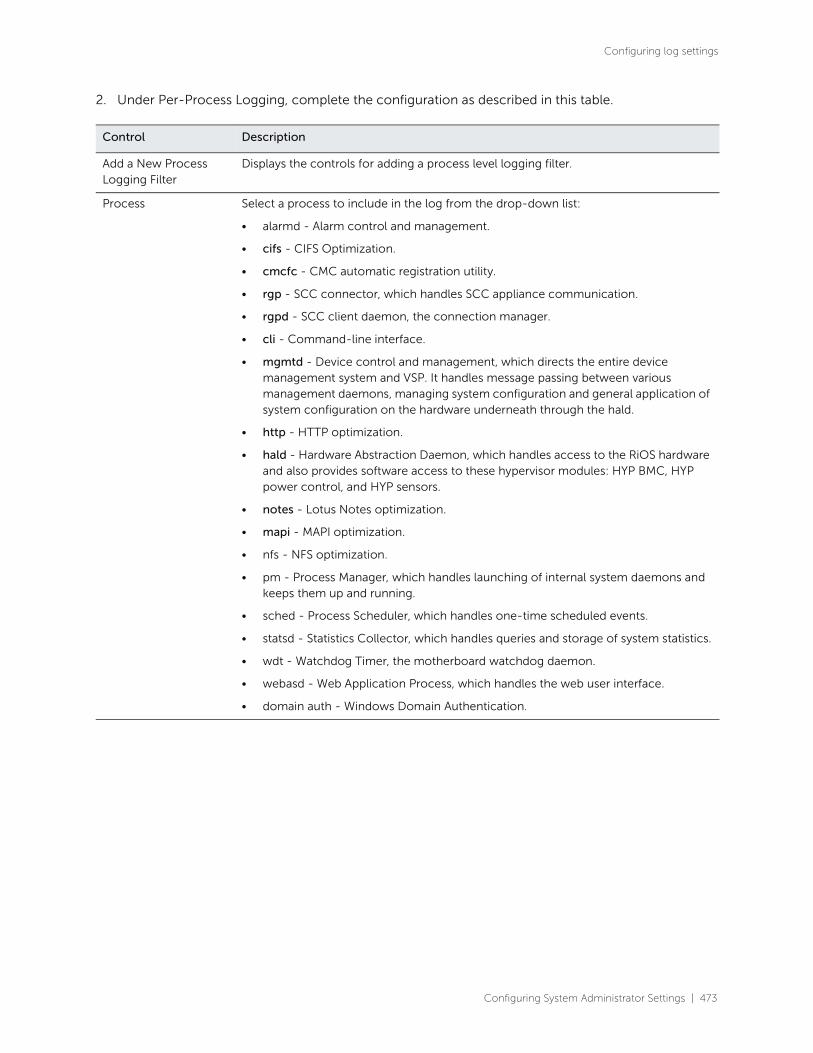
Configuring System Administrator Settings | 473
Configuring log settings
2. Under Per-Process Logging, complete the configuration as described in this table.
Control Description
Add a New Process Logging Filter
Displays the controls for adding a process level logging filter.
Process Select a process to include in the log from the drop-down list:
• alarmd - Alarm control and management.
• cifs - CIFS Optimization.
• cmcfc - CMC automatic registration utility.
• rgp - SCC connector, which handles SCC appliance communication.
• rgpd - SCC client daemon, the connection manager.
• cli - Command-line interface.
• mgmtd - Device control and management, which directs the entire device management system and VSP. It handles message passing between various management daemons, managing system configuration and general application of system configuration on the hardware underneath through the hald.
• http - HTTP optimization.
• hald - Hardware Abstraction Daemon, which handles access to the RiOS hardware and also provides software access to these hypervisor modules: HYP BMC, HYP power control, and HYP sensors.
• notes - Lotus Notes optimization.
• mapi - MAPI optimization.
• nfs - NFS optimization.
• pm - Process Manager, which handles launching of internal system daemons and keeps them up and running.
• sched - Process Scheduler, which handles one-time scheduled events.
• statsd - Statistics Collector, which handles queries and storage of system statistics.
• wdt - Watchdog Timer, the motherboard watchdog daemon.
• webasd - Web Application Process, which handles the web user interface.
• domain auth - Windows Domain Authentication.

474 | Configuring System Administrator Settings
Configuring the date and time
3. Click Apply to apply your changes to the running configuration.
4. Click Save to save your settings permanently.
Configuring the date and timeYou set the system date and time in the Administration > System Settings: Date/Time page.
You can either set the system date and time by entering it manually or assigning an NTP server to the
appliance. By default, the appliance uses the Riverbed-provided NTP server and these public NTP
servers:
• 0.riverbed.pool.ntp.org
• 1.riverbed.pool.ntp.org
• 2.riverbed.pool.ntp.org
• 3.riverbed.pool.ntp.org
Minimum Severity Select the minimum severity level for the log messages. The log contains all messages with this severity level or higher. Select one of these levels from the drop-down list:
• Emergency - Emergency, the system is unusable.
• Alert - Action must be taken immediately.
• Critical - Conditions that affect the functionality of the appliance.
• Error - Conditions that probably affect the functionality of the appliance.
• Warning - Conditions that could affect the functionality of the appliance, such authentication failures.
• Notice - Normal but significant conditions, such as a configuration change. This is the default setting.
• Info - Informational messages that provide general information about system operations.
Add Adds the filter to the list. The process now logs at the selected severity and higher level.
Remove Selected Select the check box next to the name and click Remove Selected to remove the filter.
Control Description

Configuring System Administrator Settings | 475
Configuring the date and time
To set the date and time manually
1. Choose Administration > System Settings: Date/Time to display the Date/Time page.
Figure 12-6. Date/Time page
2. Under Date and Time, click Set Time Manually.

476 | Configuring System Administrator Settings
Configuring the date and time
3. Complete the configuration as described in this table.
4. Click Apply to apply your changes to the running configuration.
5. Click Save to save your settings permanently.
To use Network Time Protocol (NTP) time synchronization
1. Choose Administration > System Settings: Date/Time to display the Date/Time page.
2. Under Date and Time, select Use NTP Time Synchronization.
As a best practice, configure your own internal NTP servers; however, you can use the Riverbed-
provided NTP server and public NTP servers. The hard-coded IP address that is preconfigured into every
Edge is 208.70.196.25. This IP address and the public NTP servers are enabled by default and appear in
the requested NTP server list.
Current NTP server status
NTP server state information appears in these server tables:
• Requested NTP server table - Displays all of the configured NTP server addresses.
• Connected NTP server table - Displays all of the servers to which the appliance is actually connected.
When you request a connection to an NTP server in a public NTP server pool, the server IP address does
not map to the actual NTP server to which the appliance connects. For example, if you request
*.riverbed.pool.ntp.org, querying the pool address does not return the IP address of the pool hostname,
but instead returns the IP address of an NTP server within its pool. For example, when resolving
0.riverbed.pool.ntp.org returns the first NTP server, the connected NTP server table displays the IP
address of this first NTP server.
This information appears after an NTP server name:
• Authentication information; unauthenticated appears after the server name when it is not using authentication.
• When RiOS has no NTP information about the current server, nothing appears.
Control Description
Time Zone Select a time zone from the drop-down list. The default value is GMT.
Note: If you change the time zone, log messages retain the previous time zone until you reboot.
Change Date Specify the date in this format: yyyy/mm/dd.
Change Time Specify military time in this format: hh:mm:ss.
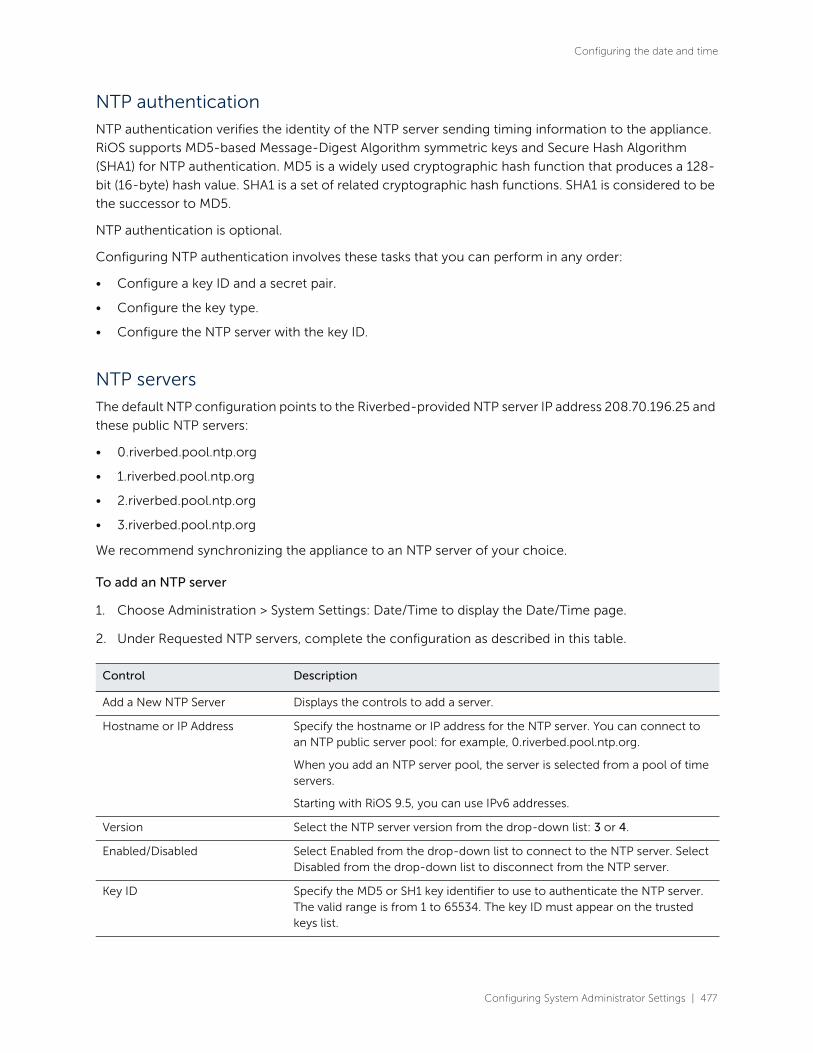
Configuring System Administrator Settings | 477
Configuring the date and time
NTP authentication
NTP authentication verifies the identity of the NTP server sending timing information to the appliance.
RiOS supports MD5-based Message-Digest Algorithm symmetric keys and Secure Hash Algorithm
(SHA1) for NTP authentication. MD5 is a widely used cryptographic hash function that produces a 128-
bit (16-byte) hash value. SHA1 is a set of related cryptographic hash functions. SHA1 is considered to be
the successor to MD5.
NTP authentication is optional.
Configuring NTP authentication involves these tasks that you can perform in any order:
• Configure a key ID and a secret pair.
• Configure the key type.
• Configure the NTP server with the key ID.
NTP servers
The default NTP configuration points to the Riverbed-provided NTP server IP address 208.70.196.25 and
these public NTP servers:
• 0.riverbed.pool.ntp.org
• 1.riverbed.pool.ntp.org
• 2.riverbed.pool.ntp.org
• 3.riverbed.pool.ntp.org
We recommend synchronizing the appliance to an NTP server of your choice.
To add an NTP server
1. Choose Administration > System Settings: Date/Time to display the Date/Time page.
2. Under Requested NTP servers, complete the configuration as described in this table.
Control Description
Add a New NTP Server Displays the controls to add a server.
Hostname or IP Address Specify the hostname or IP address for the NTP server. You can connect to an NTP public server pool: for example, 0.riverbed.pool.ntp.org.
When you add an NTP server pool, the server is selected from a pool of time servers.
Starting with RiOS 9.5, you can use IPv6 addresses.
Version Select the NTP server version from the drop-down list: 3 or 4.
Enabled/Disabled Select Enabled from the drop-down list to connect to the NTP server. Select Disabled from the drop-down list to disconnect from the NTP server.
Key ID Specify the MD5 or SH1 key identifier to use to authenticate the NTP server. The valid range is from 1 to 65534. The key ID must appear on the trusted keys list.
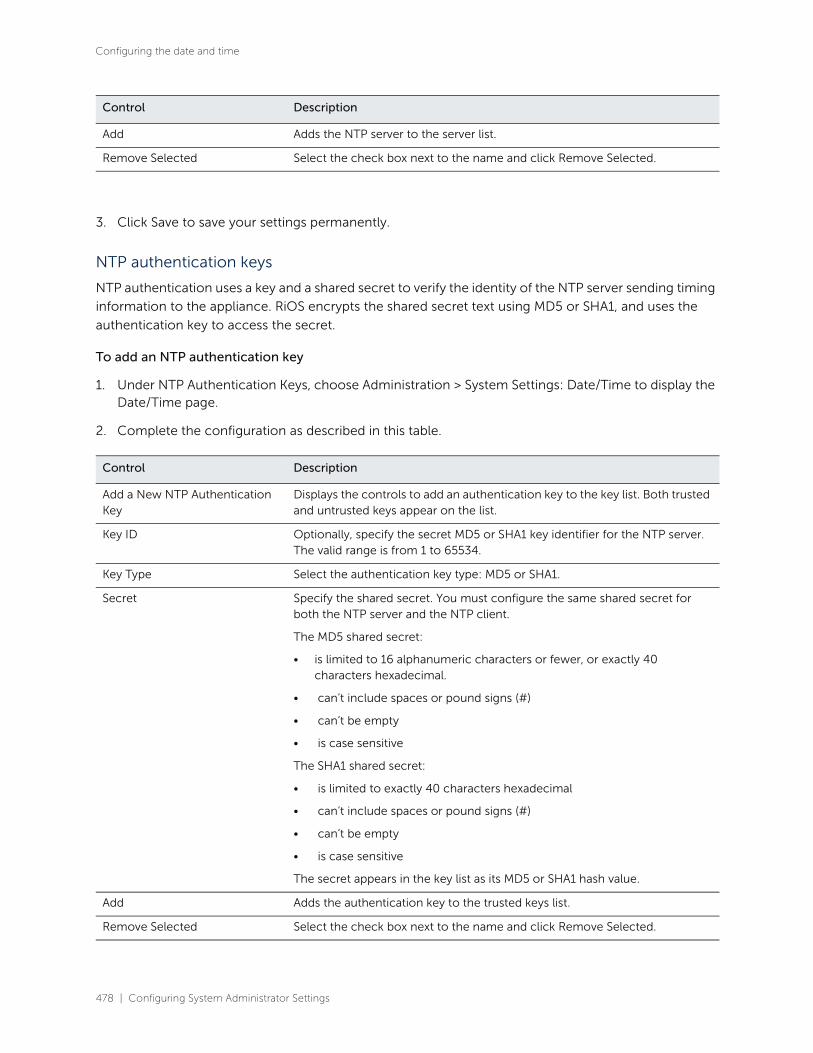
478 | Configuring System Administrator Settings
Configuring the date and time
3. Click Save to save your settings permanently.
NTP authentication keys
NTP authentication uses a key and a shared secret to verify the identity of the NTP server sending timing
information to the appliance. RiOS encrypts the shared secret text using MD5 or SHA1, and uses the
authentication key to access the secret.
To add an NTP authentication key
1. Under NTP Authentication Keys, choose Administration > System Settings: Date/Time to display the Date/Time page.
2. Complete the configuration as described in this table.
Add Adds the NTP server to the server list.
Remove Selected Select the check box next to the name and click Remove Selected.
Control Description
Add a New NTP Authentication Key
Displays the controls to add an authentication key to the key list. Both trusted and untrusted keys appear on the list.
Key ID Optionally, specify the secret MD5 or SHA1 key identifier for the NTP server. The valid range is from 1 to 65534.
Key Type Select the authentication key type: MD5 or SHA1.
Secret Specify the shared secret. You must configure the same shared secret for both the NTP server and the NTP client.
The MD5 shared secret:
• is limited to 16 alphanumeric characters or fewer, or exactly 40 characters hexadecimal.
• can’t include spaces or pound signs (#)
• can’t be empty
• is case sensitive
The SHA1 shared secret:
• is limited to exactly 40 characters hexadecimal
• can’t include spaces or pound signs (#)
• can’t be empty
• is case sensitive
The secret appears in the key list as its MD5 or SHA1 hash value.
Add Adds the authentication key to the trusted keys list.
Remove Selected Select the check box next to the name and click Remove Selected.
Control Description
Configuring System Administrator Settings | 479
Configuring monitored ports
3. Click Save to save your settings permanently.
NTP key information
NTP keys appear in a list that includes the key ID, type, secret (displays as the MD5 or SHA1 hash value),
and whether RiOS trusts the key for authentication.
You can only remove a key from the trust list using the ntp authentication trustedkeys command. For
details, see the Riverbed Command-Line Interface Reference Manual.
Configuring monitored ports You set the TCP ports to monitor in the Administration > System Settings: Monitored Ports page. The
ports you specify appear in the Traffic Summary report. Make sure the description you specify helps you
identify the type of traffic on the port.
The appliance automatically discovers all the ports in the system that have traffic. Discovered ports, with
a label (if one exists), are added to the Traffic Summary report. If a label does not exist, then an unknown
label is added to the discovered port. To change the unknown label to a name representing the port, you
must add the port with a new label. All statistics for this new port label are preserved from the time the
port was discovered.
For details, see “Viewing traffic summary reports” on page 528.
By default, traffic is monitored on ports 21 (FTP), 80 (HTTP), 135 (EPM), 139 (CIFS:NetBIOS), 443 (SSL),
445 (CIFS:TCP), 1352 (Lotus Notes), 1433 (SQL:TDS), 1748 (SRDF), 3225 (FCIP), 3226 (FCIP), 3227 (FCIP),
3228 (FCIP), 7830 (MAPI), 7919 (IP Blade), 8777 (RCU), 8778 (SMB Signed), 8779 (SMB2), 8780 (SMB2
Signed), 8781 (SMB3), 8782 (SMB3 Signed), 8783 (SMB3 Encrypted), and 10566 (SnapMirror).

480 | Configuring System Administrator Settings
Configuring monitored ports
To set monitored ports
1. Choose Administration > System Settings: Monitored Ports to display the Monitored Ports page.
Figure 12-7. Monitored Ports page
2. Complete the configuration as described in this table.
3. To modify a monitored port, click the right arrow next to the port and complete the configuration as described in this table.
Control Description
Add Port Displays the controls to add a new port.
Port Number Specify the port to be monitored.
Port Description Specify a description of the type of traffic on the port.
Add Displays the controls for adding a port.
Remove Selected Select the check box next to the name and click Remove Selected.
Control Description
Port Description Specify a description of the type of traffic on the port.
Apply Applies your settings to the running configuration.
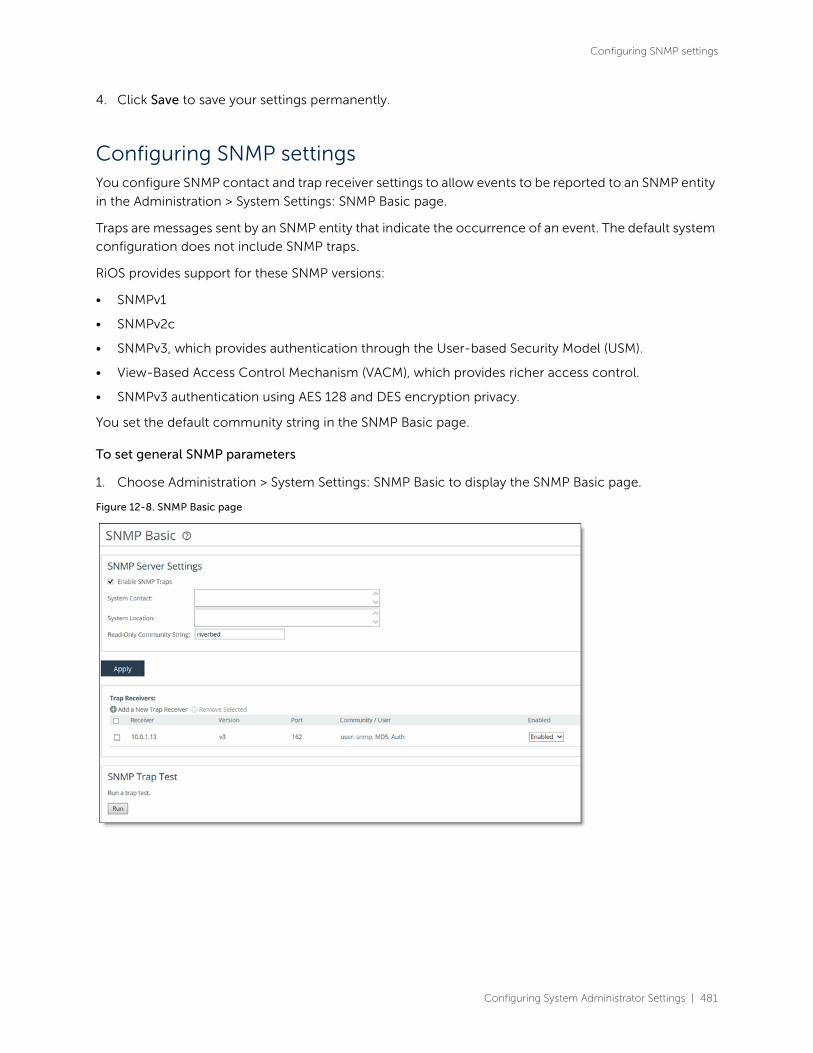
Configuring System Administrator Settings | 481
Configuring SNMP settings
4. Click Save to save your settings permanently.
Configuring SNMP settingsYou configure SNMP contact and trap receiver settings to allow events to be reported to an SNMP entity
in the Administration > System Settings: SNMP Basic page.
Traps are messages sent by an SNMP entity that indicate the occurrence of an event. The default system
configuration does not include SNMP traps.
RiOS provides support for these SNMP versions:
• SNMPv1
• SNMPv2c
• SNMPv3, which provides authentication through the User-based Security Model (USM).
• View-Based Access Control Mechanism (VACM), which provides richer access control.
• SNMPv3 authentication using AES 128 and DES encryption privacy.
You set the default community string in the SNMP Basic page.
To set general SNMP parameters
1. Choose Administration > System Settings: SNMP Basic to display the SNMP Basic page.
Figure 12-8. SNMP Basic page

482 | Configuring System Administrator Settings
Configuring SNMP settings
2. Under SNMP Server Settings, complete the configuration as described in this table.
3. Click Apply to apply your changes to the running configuration.
4. Click Save to save your settings permanently.
To add or remove a trap receiver
1. Under Trap Receivers, complete the configuration as described in this table.
Control Description
Enable SNMP Traps Enables event reporting to an SNMP entity.
System Contact Specify the username for the SNMP contact.
System Location Specify the physical location of the SNMP system.
Read-Only Community String
Specify a password-like string to identify the read-only community: for example, public. This community string overrides any VACM settings.
Community strings can’t contain the pound sign (#).
Control Description
Add a New Trap Receiver Displays the controls to add a new trap receiver.
Receiver Specify the destination IPv4 or IPv6 address or hostname for the SNMP trap.
Destination Port Specify the destination port.
Receiver Type Select SNMP v1, v2c, or v3 (user-based security model).
Remote User (Appears only when you select v3.) Specify a remote username.
Authentication (Appears only when you select v3). Optionally, select either Supply a Password or Supply a Key to use while authenticating users.
Authentication Protocol (Appears only when you select v3.) Select an authentication method from the drop-down list:
• MD5 - Specifies the Message-Digest 5 algorithm, a widely used cryptographic hash function with a 128-bit hash value. This is the default value.
• SHA - Specifies the Secure Hash Algorithm, a set of related cryptographic hash functions. SHA is considered to be the successor to MD5.
Password/Password Confirm (Appears only when you select v3 and Supply a Password.) Specify a password. The password must have a minimum of eight characters. Confirm the password in the Password Confirm text box.
Configuring System Administrator Settings | 483
Configuring SNMP settings
2. Click Save to save your settings permanently.
To test an SNMP trap
1. Choose Administration > System Settings: SNMP Basic to display the SNMP Basic page.
2. Under SNMP Trap Test, click Run.
Configuring SNMPv3
SNMPv3 provides additional authentication and access control for message security. For example, you
can verify the identity of the SNMP entity (manager or agent) sending the message.
RiOS supports SNMPv3 message encryption for increased security.
Security Level (Appears only when you select v3.) Determines whether a single atomic message exchange is authenticated. Select one of these levels from the drop-down list:
• No Auth - Doesn’t authenticate packets and doesn’t use privacy. This is the default setting.
• Auth - Authenticates packets but doesn’t use privacy.
• AuthPriv - Authenticates packets using AES 128 and DES to encrypt messages for privacy.
Note: A security level applies to a group, not to an individual user.
Privacy Protocol (Appears only when you select v3 and AuthPriv.) Select either the AES or DES protocol from the drop-down list. AES uses the AES128 algorithm.
Privacy (Appears only when you select v3 and AuthPriv.) Select Same as Authentication Key, Supply a Password, or Supply a Key to use while authenticating users. The default setting is Same as Authentication Key.
Privacy Password (Appears only when you select v3 and Supply a Password.) Specify a password. The password must have a minimum of eight characters. Confirm the password in the Privacy Password Confirm text box.
MD5/SHA Key (Appears only when you select v3 and Authentication as Supply a Key.) Specify a unique authentication key. The key is either a 32-hexadecimal digit MD5 or a 40-hexadecimal digit SHA digest created using md5sum or sha1sum.
Privacy MD5/SHA Key (Appears only when you select v3 and Privacy as Supply a Key.) Specify the privacy authentication key. The key is either a 32-hexadecimal digit MD5 or a 40-hexadecimal digit SHA digest created using md5sum or sha1sum.
Community For v1 or v2 trap receivers, specify the SNMP community name. For example, public or private v3 trap receivers need a remote user with an authentication protocol, a password, and a security level.
Enable Receiver Select to enable the new trap receiver. Clear to disable the receiver.
Add Adds a new trap receiver to the list.
Remove Selected Select the check box next to the name and click Remove Selected.
Control Description
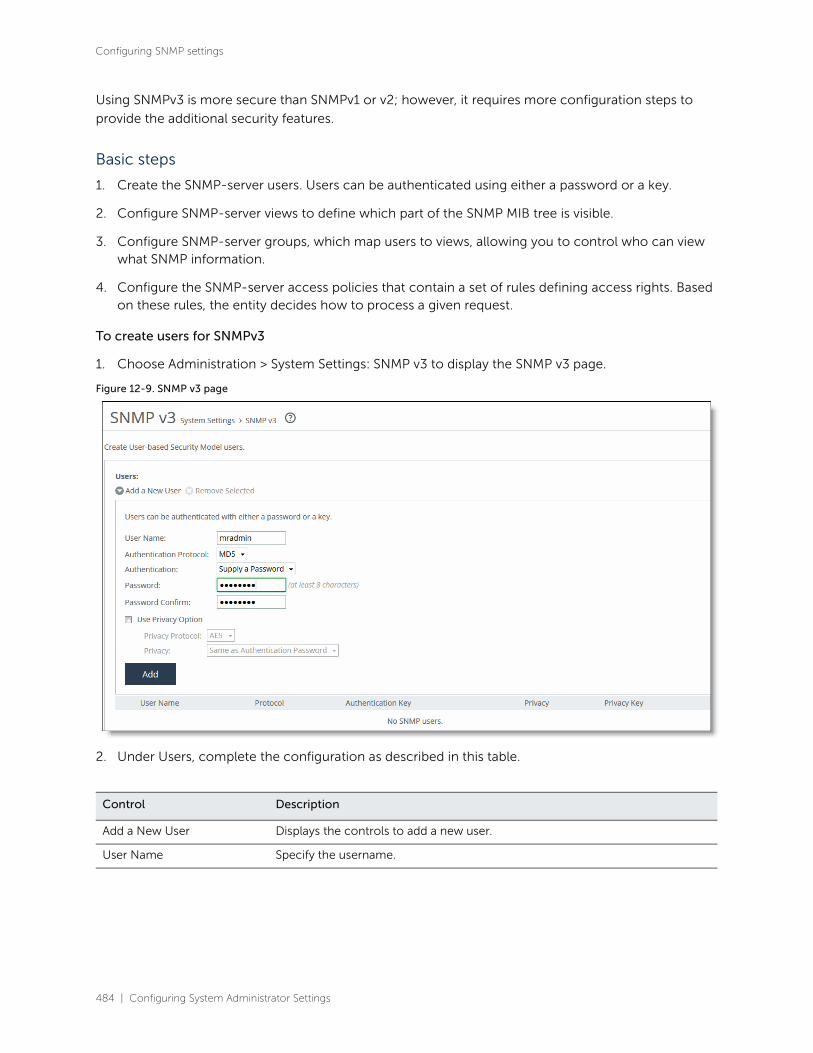
484 | Configuring System Administrator Settings
Configuring SNMP settings
Using SNMPv3 is more secure than SNMPv1 or v2; however, it requires more configuration steps to
provide the additional security features.
Basic steps
1. Create the SNMP-server users. Users can be authenticated using either a password or a key.
2. Configure SNMP-server views to define which part of the SNMP MIB tree is visible.
3. Configure SNMP-server groups, which map users to views, allowing you to control who can view what SNMP information.
4. Configure the SNMP-server access policies that contain a set of rules defining access rights. Based on these rules, the entity decides how to process a given request.
To create users for SNMPv3
1. Choose Administration > System Settings: SNMP v3 to display the SNMP v3 page.
Figure 12-9. SNMP v3 page
2. Under Users, complete the configuration as described in this table.
Control Description
Add a New User Displays the controls to add a new user.
User Name Specify the username.

Configuring System Administrator Settings | 485
Configuring SNMP settings
3. Click Save to save your settings permanently.
SNMP authentication and access control
The features in this page apply to SNMPv1, v2c, and v3 unless noted otherwise:
• Security Names - Identify an individual user (v1 or v2c only).
• Secure Groups - Identify a security name, security model by a group, and referred to by a group name.
• Secure Views - Create a custom view using the VACM that controls who can access which MIB objects under agent management by including or excluding specific OIDs. For example, some users have access to critical read-write control data, while some users have access only to read-only data.
• Security Models - A security model identifies the SNMP version associated with a user for the group in which the user resides.
Authentication Protocol Select an authentication method from the drop-down list:
• MD5 - Specifies the Message-Digest 5 algorithm, a widely used cryptographic hash function with a 128-bit hash value. This is the default value.
• SHA - Specifies the Secure Hash Algorithm, a set of related cryptographic hash functions. SHA is considered to be the successor to MD5.
Authentication Optionally, select either Supply a Password or Supply a Key to use while authenticating users.
Password/Password Confirm Specify a password. The password must have a minimum of eight characters. Confirm the password in the Password Confirm text box.
Use Privacy Option Select to use SNMPv3 encryption.
Privacy Protocol Select either the AES or DES protocol from the drop-down list. AES uses the AES128 algorithm.
Privacy Select Same as Authentication, Supply a Password, or Supply a Key to use while authenticating users. The default setting is Same as Authentication.
Privacy Password (Appears only when you select Supply a Password.) Specify a password. The password must have a minimum of eight characters. Confirm the password in the Privacy Password Confirm text box.
Key (Appears only when you select Supply a Key.) Specify a unique authentication key. The key is an MD5 or SHA-1 digest created using md5sum or sha1sum.
MD5/SHA Key (Appears only when you select Supply a Key.) Specify a unique authentication key. The key is either a 32-hexadecimal digit MD5 or a 40-hexadecimal digit SHA digest created using md5sum or sha1sum.
Add Adds the user.
Remove Selected Select the check box next to the name and click Remove Selected.
Control Description
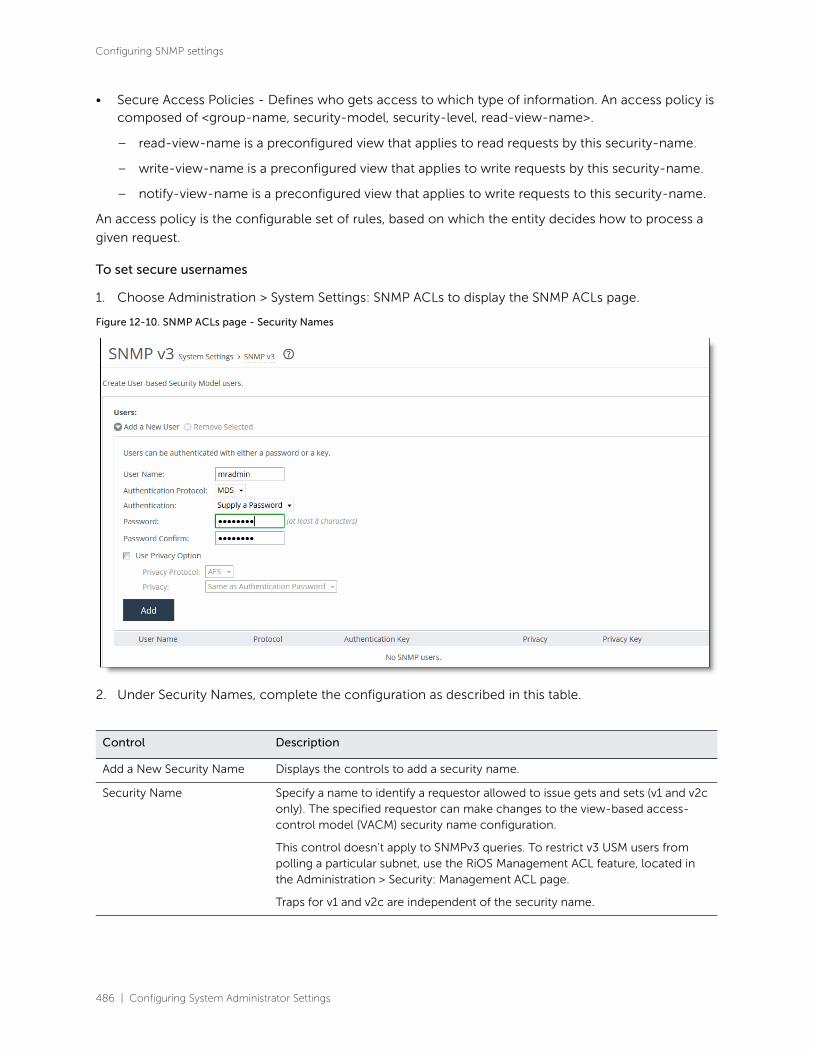
486 | Configuring System Administrator Settings
Configuring SNMP settings
• Secure Access Policies - Defines who gets access to which type of information. An access policy is composed of <group-name, security-model, security-level, read-view-name>.
– read-view-name is a preconfigured view that applies to read requests by this security-name.
– write-view-name is a preconfigured view that applies to write requests by this security-name.
– notify-view-name is a preconfigured view that applies to write requests to this security-name.
An access policy is the configurable set of rules, based on which the entity decides how to process a
given request.
To set secure usernames
1. Choose Administration > System Settings: SNMP ACLs to display the SNMP ACLs page.
Figure 12-10. SNMP ACLs page - Security Names
2. Under Security Names, complete the configuration as described in this table.
Control Description
Add a New Security Name Displays the controls to add a security name.
Security Name Specify a name to identify a requestor allowed to issue gets and sets (v1 and v2c only). The specified requestor can make changes to the view-based access-control model (VACM) security name configuration.
This control doesn’t apply to SNMPv3 queries. To restrict v3 USM users from polling a particular subnet, use the RiOS Management ACL feature, located in the Administration > Security: Management ACL page.
Traps for v1 and v2c are independent of the security name.

Configuring System Administrator Settings | 487
Configuring SNMP settings
3. Click Apply to apply your changes to the running configuration.
4. Click Save to save your settings permanently.
To set secure groups
1. Choose Administration > System Settings: SNMP ACLs to display the SNMP ACLs page.
Figure 12-11. SNMP ACLs page - Groups
Community String Specify the password-like community string to control access. Use a combination of uppercase, lowercase, and numerical characters to reduce the chance of unauthorized access to the SteelHead.
Community strings don’t allow printable 7-bit ASCII characters, except for white spaces. Also, the community strings can’t begin with a pound sign (#) or a hyphen (-).
If you specify a read-only community string (located in the SNMP Basic page under SNMP Server Settings), it takes precedence over this community name and allows users to access the entire MIB tree from any source host. If this is not desired, delete the read-only community string.
To create multiple SNMP community strings on a SteelHead, leave the default public community string and then create a second read-only community string with a different security name. Or, you can delete the default public string and create two new SNMP ACLs with unique names.
Source IP Address and Mask Bits
Specify the host IPv4 or IPv6 address and mask bits to which you permit access using the security name and community string.
Add Adds the security name.
Remove Selected Select the check box next to the name and click Remove Selected.
Control Description

488 | Configuring System Administrator Settings
Configuring SNMP settings
2. Under Groups, complete the configuration as described in this table.
3. Click Apply to apply your changes to the running configuration.
4. Click Save to save your settings permanently.
To set secure views
1. Choose Administration > System Settings: SNMP ACLs to display the SNMP ACLs page.
Figure 12-12. SNMP ACLs page - Views
2. Under Views, complete the configuration as described in this table.
Control Description
Add a New Group Displays the controls to add a new group.
Group Name Specify a group name.
Security Models and Name Pairs
Click the + button and select a security model from the drop-down list:
• v1 or v2c - Displays another drop-down list. Select a security name.
• v3 (usm) - Displays another drop-down list. Select a user.
To add another Security Model and Name pair, click the plus sign (+).
Add Adds the group name and security model and name pairs.
Remove Selected Select the check box next to the name and click Remove Selected.
Control Description
Add a New View Displays the controls to add a new view.
View Name Specify a descriptive view name to facilitate administration.

Configuring System Administrator Settings | 489
Configuring SNMP settings
3. Click Apply to apply your changes to the running configuration.
4. Click Save to save your settings permanently.
To add an access policy
1. Choose Administration > System Settings: SNMP ACLs to display the SNMP ACLs page.
Figure 12-13. SNMP ACLs page
2. Under Access Policies, complete the configuration as described in this table.
Includes Specify the Object Identifiers (OIDs) to include in the view, separated by commas. For example, .1.3.6.1.4.1. By default, the view excludes all OIDs.
You can specify .iso or any subtree or subtree branch.
You can specify an OID number or use its string form. For example, .iso.org.dod.internet.private.enterprises.rbt.products.steelhead.system.model
Excludes Specify the OIDs to exclude in the view, separated by commas. By default, the view excludes all OIDs.
Add Adds the view.
Remove Selected Select the check box next to the name and click Remove Selected.
Control Description
Add a New Access Policy Displays the controls to add a new access policy.
Group Name Select a group name from the drop-down list.
Control Description

490 | Configuring System Administrator Settings
Configuring SNMP settings
3. Click Apply to apply your changes to the running configuration.
4. Click Save to save your settings permanently.
Security Level Determines whether a single atomic message exchange is authenticated. Select one of these from the drop-down list:
• No Auth - Doesn’t authenticate packets and doesn’t use privacy. This is the default setting.
• Auth - Authenticates packets but doesn’t use privacy.
• AuthPriv - Authenticates packets using AES or DES to encrypt messages for privacy.
A security level applies to a group, not to an individual user.
Read View Select a view from the drop-down list.
Add Adds the policy to the policy list.
Remove Selected Select the check box next to the name and click Remove Selected.
Control Description
Viewing Reports and Logs | 491
13
Viewing Reports and Logs
This chapter describes how to display system reports and user and system logs to evaluate performance
or troubleshoot. It includes these sections:
• “Overview” on page 493
Networking Reports
• “Viewing current connection reports” on page 496
• “Viewing connection history reports” on page 520
• “Viewing connection forwarding reports” on page 522
• “Viewing outbound QoS reports” on page 523
• “Viewing inbound QoS reports” on page 525
• “Viewing secure transport reports” on page 526
• “Viewing top talkers reports” on page 527
• “Viewing traffic summary reports” on page 528
• “Viewing WAN throughput reports” on page 531
• “Viewing application statistics reports” on page 534
• “Viewing application visibility reports” on page 537
• “Viewing interface counter reports” on page 539
• “Viewing TCP statistics reports” on page 541
Optimization Reports
• “Viewing optimized throughput reports” on page 542
• “Viewing bandwidth optimization reports” on page 545
• “Viewing peer reports” on page 548
• “Viewing CIFS prepopulation share logs” on page 550
• “Viewing HTTP reports” on page 552
• “Viewing live video stream splitting reports” on page 554
• “Viewing NFS reports” on page 556
• “Viewing SRDF reports” on page 558
• “Viewing SnapMirror reports” on page 561
492 | Viewing Reports and Logs
• “Viewing SSL reports” on page 564
• “Viewing SharePoint reports” on page 566
• “Viewing data store status reports” on page 568
• “Viewing data store SDR-adaptive reports” on page 570
• “Viewing data store disk load reports” on page 572
Branch Services Reports
• “Viewing DNS cache hit reports” on page 573
• “Viewing DNS cache utilization reports” on page 574
• “Viewing NFS export I/O reports” on page 577
• “Viewing SteelFusion Core I/O reports” on page 579
• “Viewing blockstore metrics reports” on page 581
• “Viewing blockstore SSD read cache reports” on page 583
• “Viewing storage alarm reports” on page 586
• “Viewing hypervisor interface reports” on page 592
Diagnostic Reports
• “Viewing virtualization datastore reports” on page 593
• “Viewing virtualization alarm reports” on page 594
• “Viewing alarm status reports” on page 596
• “Viewing CPU utilization reports” on page 616
• “Viewing memory paging reports” on page 618
• “Viewing TCP memory reports” on page 620
• “Viewing system detail reports” on page 622
• “Viewing disk status reports” on page 626
• “Checking network health status” on page 628
• “Checking domain health” on page 632
• “Verifying hardware capabilities of a SteelHead-v” on page 636
• “Viewing logs” on page 637
• “Downloading log files” on page 640
• “Generating system dumps” on page 642
• “Viewing process dumps” on page 644
• “Capturing and uploading TCP dump files” on page 646
• “Exporting performance statistics” on page 654
• “Viewing in-path rule statistics” on page 655
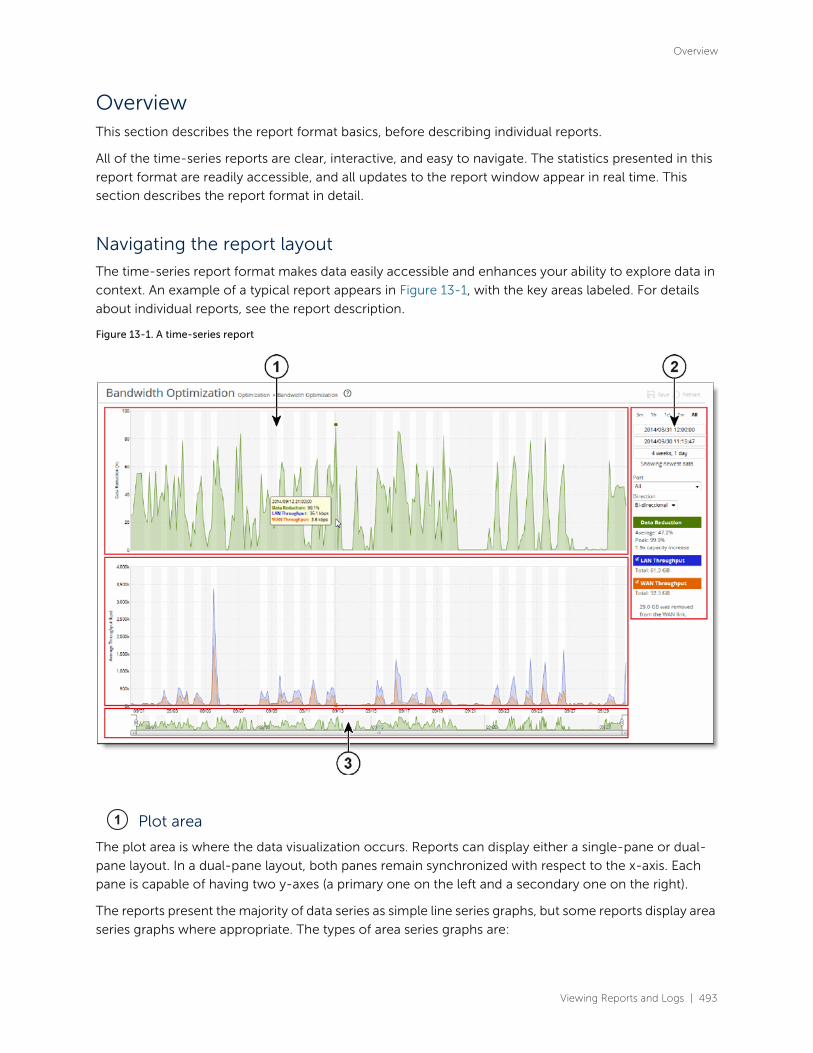
Viewing Reports and Logs | 493
Overview
OverviewThis section describes the report format basics, before describing individual reports.
All of the time-series reports are clear, interactive, and easy to navigate. The statistics presented in this
report format are readily accessible, and all updates to the report window appear in real time. This
section describes the report format in detail.
Navigating the report layout
The time-series report format makes data easily accessible and enhances your ability to explore data in
context. An example of a typical report appears in Figure 13-1, with the key areas labeled. For details
about individual reports, see the report description.
Figure 13-1. A time-series report
Plot area
The plot area is where the data visualization occurs. Reports can display either a single-pane or dual-
pane layout. In a dual-pane layout, both panes remain synchronized with respect to the x-axis. Each
pane is capable of having two y-axes (a primary one on the left and a secondary one on the right).
The reports present the majority of data series as simple line series graphs, but some reports display area
series graphs where appropriate. The types of area series graphs are:
1

494 | Viewing Reports and Logs
Overview
• Layered series, which appear on top of each other in the z-direction. These are identified bytransparent colors.
• Stacked area series, which appear on top of each other in the y-direction. RiOS uses stacked areagraphs to depict an aggregate broken down into its constituent parts. In this type of graph, eachseries is a mutually exclusive partition of some aggregate data set, identified by opaque colors. Astacked series is appropriate when the sum of all the series is meaningful.
To view the time stamp and value of each data series at that time
• Place the mouse pointer over the plot area.
A tool tip displays the time stamp and the value of each data series at that time. The plot area colors the
series names appropriately, and the data values have their associated units.
The plot area also displays subtle shading to denote work hours (white background) and nonwork hours
(gray background). RiOS defines work hours as 8:00 AM to 5:00 PM (0800 to 1700) on weekdays. You
cannot configure the work hours.
To zoom the plot area
1. Place the mouse pointer over the plot area, and then click and hold the left mouse button.
2. Move the mouse left or right and release the left mouse button to zoom in.
Control panel
Use the control panel to control how much data the chart displays, chart properties, and whether to view
or hide the summary statistics.
To change the chart interval
• Click a link: 5m (5 minutes), 1h (1 hour), 1d (1day), 1w (1 week), or All (all data). All data includesstatistics for the last 30 days.
If the current size of the chart window matches any of the links, that link appears in bold black text;the system ignores any clicks on that link. If the time duration represented by any of the links isgreater than the total data range of the chart, those links are dimmed.
• Chart window controls - More window-related controls appear below the chart window intervallinks. These controls offer more precise control of the window and also display various windowproperties. From top to bottom:
– Text field containing the left edge (starting time) of the chart window.
– Text field containing the right edge (ending time) of the chart window.
– Text field containing the chart window interval. The chart window interval in this text field is not alwaysexactly correct, but it is correct to two units (with the units being days, hours, minutes, and seconds). Forexample, if the chart window interval is exactly two days, three hours, four minutes, and five seconds, thistext field displays 2 days, 3 hours.
– Link or static text that represents the chart window state of attachment to the end of the chart. When thechart window is attached, the report replaces the link with the static text Showing newest data. When thechart is showing newest data, you can see new data points as the system adds them automatically to thechart every 10 seconds. This automatic data point refresh can be powerful when you launch a newconfiguration and need to analyze its impact quickly. You cannot change the 10-second default.
2
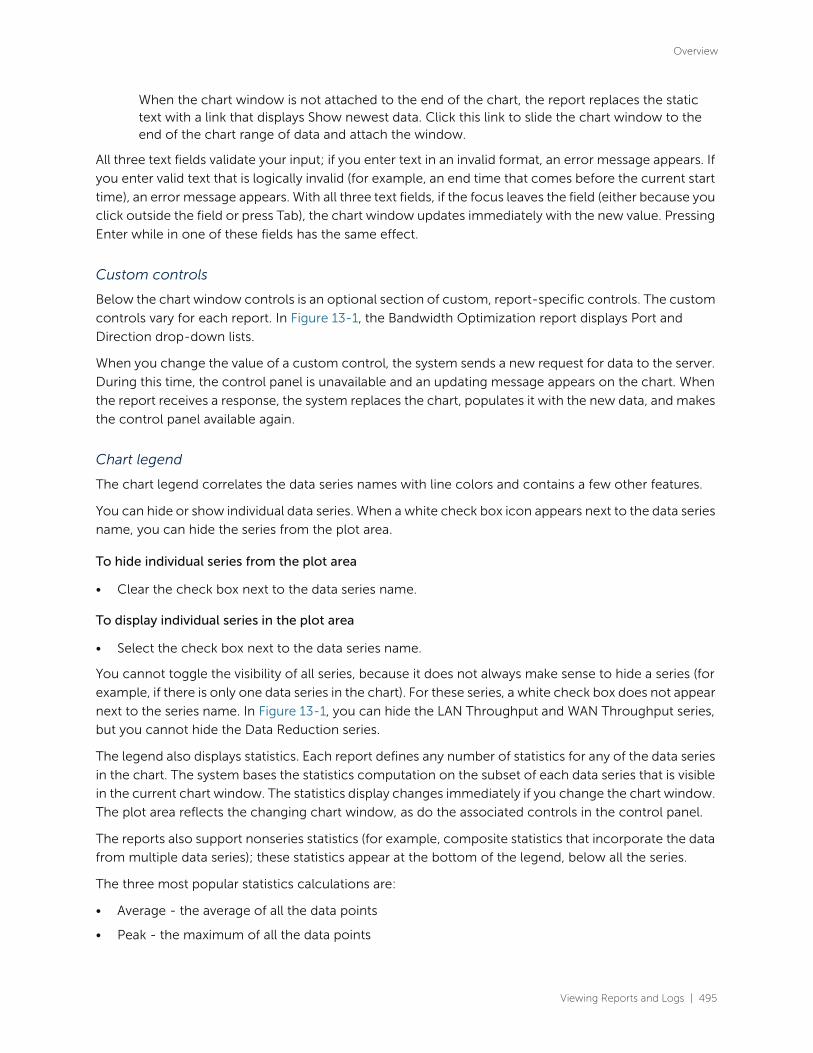
Viewing Reports and Logs | 495
Overview
When the chart window is not attached to the end of the chart, the report replaces the static text with a link that displays Show newest data. Click this link to slide the chart window to the end of the chart range of data and attach the window.
All three text fields validate your input; if you enter text in an invalid format, an error message appears. If
you enter valid text that is logically invalid (for example, an end time that comes before the current start
time), an error message appears. With all three text fields, if the focus leaves the field (either because you
click outside the field or press Tab), the chart window updates immediately with the new value. Pressing
Enter while in one of these fields has the same effect.
Custom controls
Below the chart window controls is an optional section of custom, report-specific controls. The custom
controls vary for each report. In Figure 13-1, the Bandwidth Optimization report displays Port and
Direction drop-down lists.
When you change the value of a custom control, the system sends a new request for data to the server.
During this time, the control panel is unavailable and an updating message appears on the chart. When
the report receives a response, the system replaces the chart, populates it with the new data, and makes
the control panel available again.
Chart legend
The chart legend correlates the data series names with line colors and contains a few other features.
You can hide or show individual data series. When a white check box icon appears next to the data series
name, you can hide the series from the plot area.
To hide individual series from the plot area
• Clear the check box next to the data series name.
To display individual series in the plot area
• Select the check box next to the data series name.
You cannot toggle the visibility of all series, because it does not always make sense to hide a series (for
example, if there is only one data series in the chart). For these series, a white check box does not appear
next to the series name. In Figure 13-1, you can hide the LAN Throughput and WAN Throughput series,
but you cannot hide the Data Reduction series.
The legend also displays statistics. Each report defines any number of statistics for any of the data series
in the chart. The system bases the statistics computation on the subset of each data series that is visible
in the current chart window. The statistics display changes immediately if you change the chart window.
The plot area reflects the changing chart window, as do the associated controls in the control panel.
The reports also support nonseries statistics (for example, composite statistics that incorporate the data
from multiple data series); these statistics appear at the bottom of the legend, below all the series.
The three most popular statistics calculations are:
• Average - the average of all the data points
• Peak - the maximum of all the data points

496 | Viewing Reports and Logs
Viewing current connection reports
• Total - the integral of the series (area under the curve). It is important to note that the total reported under each Throughput color in the chart legend displays the total amount of data transferred during the displayed time interval.
Navigator
Directly above the scroll bar is the navigator, which shows a much smaller and simpler display of the data
in the plot area. The navigator displays only one data series.
Use the navigator to navigate the entire range of chart data. The scroll bar at the bottom shows you
which portion of the total data range is displayed in the plot area.
The navigator display can appear very different from the plot area display when an interesting or eye-
catching series in the plot area is not the series in the navigator.
To resize the current chart window
• Move the handles on either side of the chart window in the navigator.
The charts have a minimum chart window size of five minutes, so if you resize the chart window to
something smaller, the chart window springs back to the minimum size.
You can also click the data display portion of the navigator (not the scroll bar) and the chart window
moves to wherever you clicked.
Setting user preferences
You can change report default settings to match your preferred style. When you customize any report-
specific settings, the system immediately writes them to disk on the appliance. The system saves all of
your custom settings, even after you log out, clear your browsing history, or close the browser. When
you view the report again, your custom settings are intact.
The system saves the chart window. Whenever you change the chart window, the next time you view
any report, the chart window is set to the last chart window used.
Browser recommendation
Internet Explorer 7.0 and 8.0 must refresh reports every four minutes due to performance issues.
Consider using a different browser to view reports.
Viewing current connection reportsThe Current Connections report displays the connections the appliance detects, including the
connections that are passing through unoptimized.
This report layout shows only relevant data in meaningful visual context. You can search and customize
the display using filters to list connections of interest. When you click Update, the report retrieves a listing
of up to 500 real-time current connections. Navigating to the report or refreshing the page
automatically updates the connections display.
3
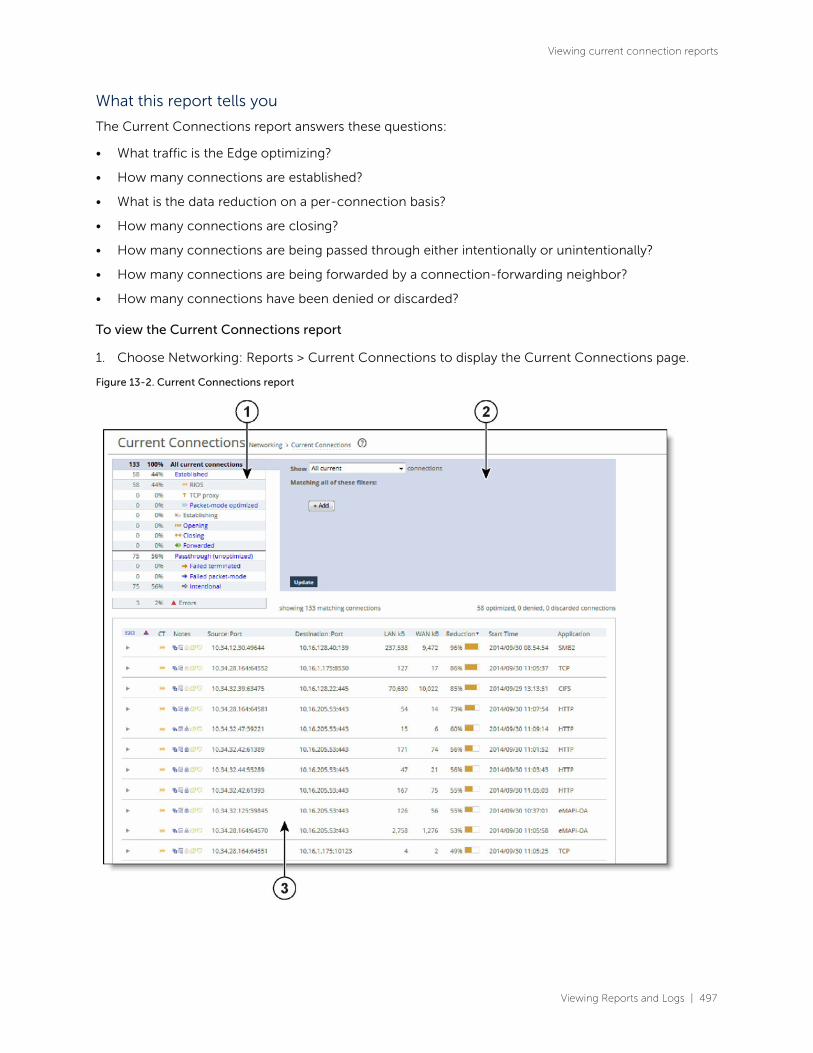
Viewing Reports and Logs | 497
Viewing current connection reports
What this report tells you
The Current Connections report answers these questions:
• What traffic is the Edge optimizing?
• How many connections are established?
• What is the data reduction on a per-connection basis?
• How many connections are closing?
• How many connections are being passed through either intentionally or unintentionally?
• How many connections are being forwarded by a connection-forwarding neighbor?
• How many connections have been denied or discarded?
To view the Current Connections report
1. Choose Networking: Reports > Current Connections to display the Current Connections page.
Figure 13-2. Current Connections report
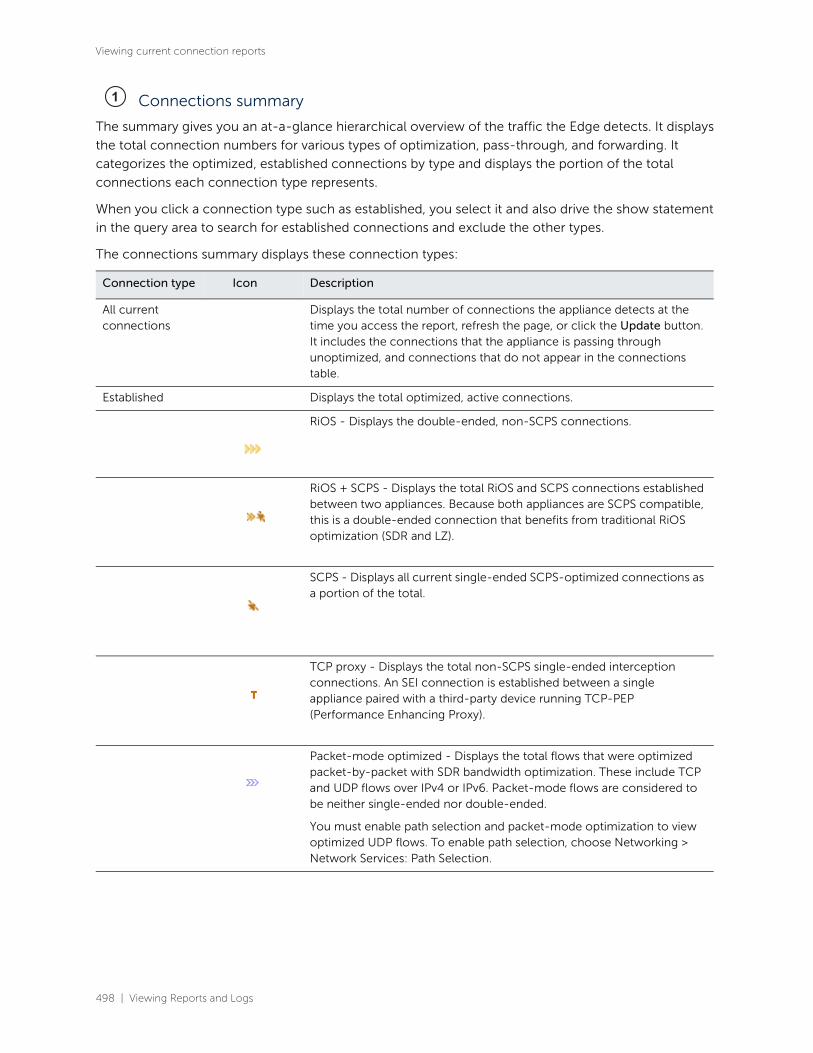
498 | Viewing Reports and Logs
Viewing current connection reports
Connections summary
The summary gives you an at-a-glance hierarchical overview of the traffic the Edge detects. It displays
the total connection numbers for various types of optimization, pass-through, and forwarding. It
categorizes the optimized, established connections by type and displays the portion of the total
connections each connection type represents.
When you click a connection type such as established, you select it and also drive the show statement
in the query area to search for established connections and exclude the other types.
The connections summary displays these connection types:
Connection type Icon Description
All current connections
Displays the total number of connections the appliance detects at the time you access the report, refresh the page, or click the Update button. It includes the connections that the appliance is passing through unoptimized, and connections that do not appear in the connections table.
Established Displays the total optimized, active connections.
RiOS - Displays the double-ended, non-SCPS connections.
RiOS + SCPS - Displays the total RiOS and SCPS connections established between two appliances. Because both appliances are SCPS compatible, this is a double-ended connection that benefits from traditional RiOS optimization (SDR and LZ).
SCPS - Displays all current single-ended SCPS-optimized connections as a portion of the total.
TCP proxy - Displays the total non-SCPS single-ended interception connections. An SEI connection is established between a single appliance paired with a third-party device running TCP-PEP (Performance Enhancing Proxy).
Packet-mode optimized - Displays the total flows that were optimized packet-by-packet with SDR bandwidth optimization. These include TCP and UDP flows over IPv4 or IPv6. Packet-mode flows are considered to be neither single-ended nor double-ended.
You must enable path selection and packet-mode optimization to view optimized UDP flows. To enable path selection, choose Networking > Network Services: Path Selection.
1
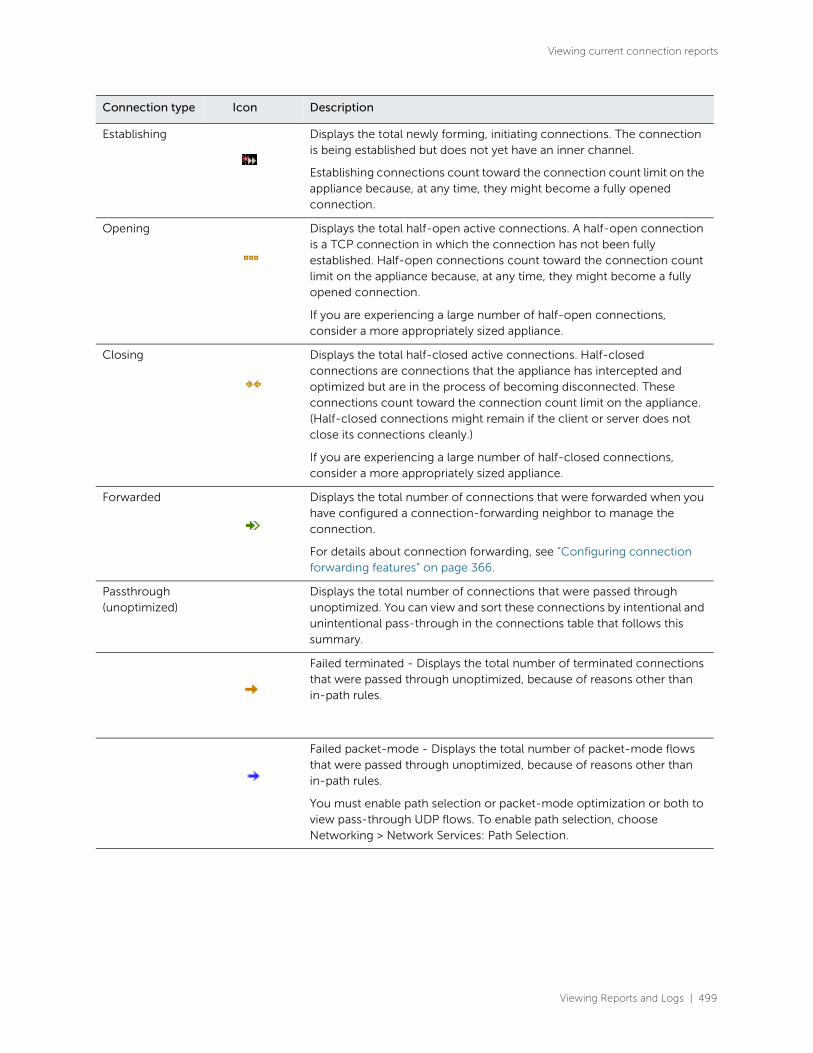
Viewing Reports and Logs | 499
Viewing current connection reports
Establishing Displays the total newly forming, initiating connections. The connection is being established but does not yet have an inner channel.
Establishing connections count toward the connection count limit on the appliance because, at any time, they might become a fully opened connection.
Opening Displays the total half-open active connections. A half-open connection is a TCP connection in which the connection has not been fully established. Half-open connections count toward the connection count limit on the appliance because, at any time, they might become a fully opened connection.
If you are experiencing a large number of half-open connections, consider a more appropriately sized appliance.
Closing Displays the total half-closed active connections. Half-closed connections are connections that the appliance has intercepted and optimized but are in the process of becoming disconnected. These connections count toward the connection count limit on the appliance. (Half-closed connections might remain if the client or server does not close its connections cleanly.)
If you are experiencing a large number of half-closed connections, consider a more appropriately sized appliance.
Forwarded Displays the total number of connections that were forwarded when you have configured a connection-forwarding neighbor to manage the connection.
For details about connection forwarding, see “Configuring connection forwarding features” on page 366.
Passthrough (unoptimized)
Displays the total number of connections that were passed through unoptimized. You can view and sort these connections by intentional and unintentional pass-through in the connections table that follows this summary.
Failed terminated - Displays the total number of terminated connections that were passed through unoptimized, because of reasons other than in-path rules.
Failed packet-mode - Displays the total number of packet-mode flows that were passed through unoptimized, because of reasons other than in-path rules.
You must enable path selection or packet-mode optimization or both to view pass-through UDP flows. To enable path selection, choose Networking > Network Services: Path Selection.
Connection type Icon Description

500 | Viewing Reports and Logs
Viewing current connection reports
Query area
The connections summary and the connections table convey a lot of information about connections the
appliance is detecting. The best way to narrow your search is to filter and sort the report. The query area
is where you select a simple or compound connection type for your search and optionally filter the
results. The Show search control defines the contents of the connection summary and the connections
table.
The simple connection search uses a match against a connection type to display only that type, and
excludes the others. If you want to use more advanced criteria, such as including all connections that
were started after a certain date, you can add one or more filters to achieve this.
To display a simple connection type
• After Show, select a connection type from the drop-down list.
Figure 13-3. Query selection
Intentional - Displays the total number of connections that were intentionally passed through unoptimized by in-path rules.
Errors Displays all connections that have application or transport protocol errors as a portion of the total connections.
Connection type Description
All current Displays the total number of connections the appliance detects, including the connections that are passed through unoptimized. This selection removes any previous selections or filters.
Established Displays the total optimized, active connections.
Connection type Icon Description
2

Viewing Reports and Logs | 501
Viewing current connection reports
2. Click Update.
Filtering the connections
Filters provide a powerful way to drill down into large numbers of connections by specifying either
simple or complex filter criteria. Each filter further restricts the display.
When you customize filters, the system immediately writes them to disk on the appliance. The system
saves all of your custom settings even after you log out, clear your browsing history, or close the
browser. When you view the report again, your custom settings are intact. The system saves report
settings on a per-user basis.
To filter the display (optional)
1. Click Add.
Packet-mode optimized
Displays the total connections that were optimized packet-by-packet with SDR bandwidth optimization. These connections include TCP IPv4, TCP IPv6, UDP IPv4, and UDP IPv6 connections.
You must enable path selection and packet-mode optimization to view optimized UDP flows. To enable path selection, choose Networking > Network Services: Path Selection.
Opening Displays the total half-open active connections. A half-open connection is a TCP connection in which the connection has not been fully established. Half-open connections count toward the connection count limit on the appliance because, at any time, they might become a fully opened connection.
If you are experiencing a large number of half-open connections, consider a more appropriately sized appliance.
Closing Displays the total half-closed active connections. Half-closed connections are connections that the appliance has intercepted and optimized but are in the process of becoming disconnected. These connections are counted toward the connection count limit on the appliance. (Half-closed connections might remain if the client or server does not close its connections cleanly.)
If you are experiencing a large number of half-closed connections, consider a more appropriately sized appliance.
Forwarded Displays the total number of connections forwarded by the connection-forwarding neighbor managing the connection.
Passthrough (unoptimized)
Displays the total number of connections that were passed through unoptimized. You can view and sort these connections by intentional and unintentional pass-through in the individual connections table that follows the connections summary.
Failed terminated Displays the total number of terminated connections that were passed through unoptimized.
Failed packet-mode
Displays the total number of packet-mode flows that were passed through unoptimized.
Intentional Displays the total number of connections that were intentionally passed through unoptimized.
Connection type Description
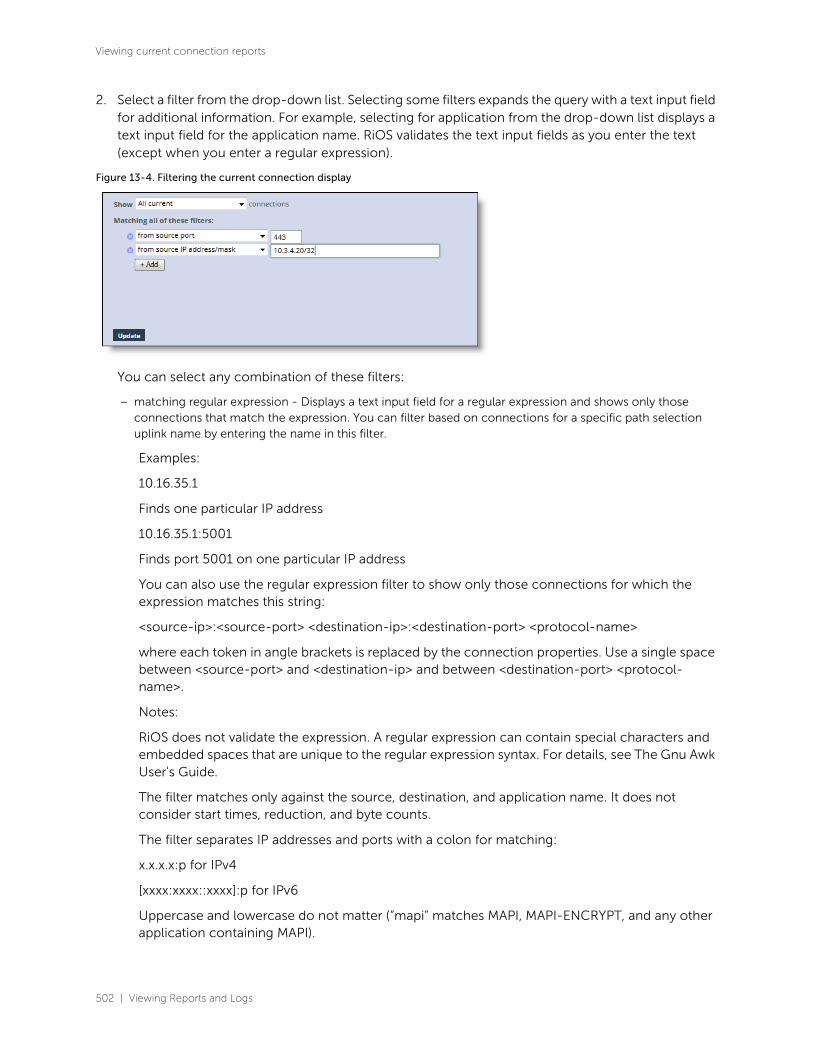
502 | Viewing Reports and Logs
Viewing current connection reports
2. Select a filter from the drop-down list. Selecting some filters expands the query with a text input field for additional information. For example, selecting for application from the drop-down list displays a text input field for the application name. RiOS validates the text input fields as you enter the text (except when you enter a regular expression).
Figure 13-4. Filtering the current connection display
You can select any combination of these filters:
– matching regular expression - Displays a text input field for a regular expression and shows only those connections that match the expression. You can filter based on connections for a specific path selection uplink name by entering the name in this filter.
Examples:
10.16.35.1
Finds one particular IP address
10.16.35.1:5001
Finds port 5001 on one particular IP address
You can also use the regular expression filter to show only those connections for which the expression matches this string:
<source-ip>:<source-port> <destination-ip>:<destination-port> <protocol-name>
where each token in angle brackets is replaced by the connection properties. Use a single space between <source-port> and <destination-ip> and between <destination-port> <protocol-name>.
Notes:
RiOS does not validate the expression. A regular expression can contain special characters and embedded spaces that are unique to the regular expression syntax. For details, see The Gnu Awk User's Guide.
The filter matches only against the source, destination, and application name. It does not consider start times, reduction, and byte counts.
The filter separates IP addresses and ports with a colon for matching:
x.x.x.x:p for IPv4
[xxxx:xxxx::xxxx]:p for IPv6
Uppercase and lowercase do not matter (“mapi” matches MAPI, MAPI-ENCRYPT, and any other application containing MAPI).

Viewing Reports and Logs | 503
Viewing current connection reports
A connection matches if the match string occurs anywhere within it (that is, a colon (:) matches all rows), unless overridden by special regular expression language such as a caret (^) or a dollar sign ($).
– from source IP address/mask - Displays a text input field for the IP address and subnet mask. You can specify an IPv4 or an IPv6 IP address.
– from source port - Displays a text input field for the source port.
– to destination IP address/mask - Displays a text input field for the IP address and subnet mask. You can specify an IPv4 or an IPv6 IP address.
– to destination port - Displays a text input field for the destination port.
– that have errors - Displays connections with either application protocol errors or transport protocol errors.
– for application - Select an application name from the drop-down list. The application filter is only relevant for optimized connections.
– that were started before - Displays a text input field for the date and time. Use this format: yyyy/mm/dd hh:mm:ss
– that were started after - Displays a text input field for the date and time. Use this format: yyyy/mm/dd hh:mm:ss
– that are single-ended only - Displays SCPS and TCP proxy connections. Applies only to established connections.
– that are double-ended only - Displays RiOS and RiOS + SCPS connections. Applies only to established connections.
3. To add another filter, click add filter again. You can add up to eight filters; they are logically ANDed together and are all active at any given time. Continue adding filters until your query is complete.
4. Click Update.
To delete a filter
• Click the delete filter icon.
Connections table
The connections table displays more information about each connection, filtered by the show statement
and any filters in the query area. The connections table can show up to 500 connections at a time; it lists
the total of all matching connections in the upper-right corner. From this table, you can view more
details about each connection and perform operations on it. For example, you can reset connections or
send a keep-alive message to the outer remote machine for an optimized connection (the machine that
is connected to the appliance).
For details about the query area, see “Query area” on page 500.
Connections with IPv6 addresses are split into two rows to accommodate the long address. The report
encloses IPv6 addresses in square brackets, and the source address, destination address, and other
information appears in different columns.
Icons in the CT and Notes columns indicate the connection type and attributes. Mouse over an icon and
reveal a tooltip identifying its meaning.
3

504 | Viewing Reports and Logs
Viewing current connection reports
The individual connections table displays additional information about each connection. Because this
report can list hundreds of transient connections, you can sort the table by column heading (except for
the Notes column). For example, you can sort the connections by source IP address.
To sort the table by row
• Click the table column heading.
The table contents reload, if necessary. Click the heading again to reverse the order. A small up or down triangle reflects the current bidirectional sort order.
To reset the connection sample
• Click the dice icon on the far left.
The table contents reappear in the original display. For example, if you sort the display by a particular type, and there are more than 500 connections of that type, click the dice icon to return to the original display.

Viewing Reports and Logs | 505
Viewing current connection reports
The connections table displays this information:
Column Icon Description
Connection Details
Click the connection to display the current connections details. See “Viewing the Current Connections report details” on page 507.
Because the details are a snapshot in time, by the time you click the connection, it could be gone or in a different state. If the connection is no longer available, a message tells you that the connection is closed. To refresh the display, click Update.
Protocol Error - Displays a protocol error for both transport and application conditions. This list contains some of the conditions that trigger errors; it is a small subset of possible error conditions:
• When the Optimize Connections with Security Signatures feature is enabled (which prevents SMB signing). This is an expected response. For details about preventing SMB signing, see “Configuring CIFS optimization” on page 174.
• If a problem occurs while optimizing encrypted MAPI traffic. For details about enabling optimization of encrypted MAPI traffic, see “Configuring MAPI optimization” on page 206.
• If a problem occurs with SSL optimization or the secure inner channel.
• If a SRDF protocol error occurs when attempting to optimize traffic originating from the LAN side of the appliance. Check the LAN-side Symmetrix array for compatibility.
Click the connection for more details about the error.
CT (Connection Type)
Established - Indicates that the connection is established and active.
Intentional Passthrough - Indicates that the connection was intentionally passed through unoptimized because of in-path rules.
Failed terminated - Indicates that the connection was passed through unoptimized.
Failed packet-mode - Indicates that the packet-mode flow was passed through unoptimized.
Establishing - Indicates that the connection is initiating and is not yet fully established. The source and destination ports appear as n/a.
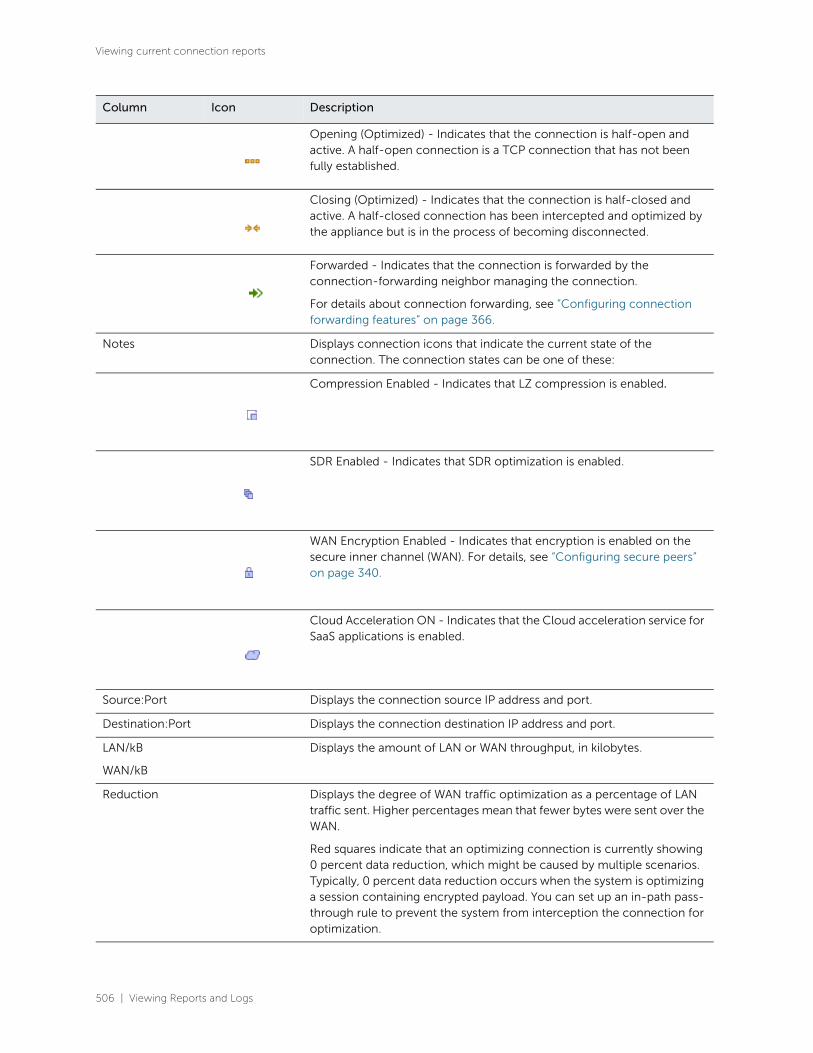
506 | Viewing Reports and Logs
Viewing current connection reports
Opening (Optimized) - Indicates that the connection is half-open and active. A half-open connection is a TCP connection that has not been fully established.
Closing (Optimized) - Indicates that the connection is half-closed and active. A half-closed connection has been intercepted and optimized by the appliance but is in the process of becoming disconnected.
Forwarded - Indicates that the connection is forwarded by the connection-forwarding neighbor managing the connection.
For details about connection forwarding, see “Configuring connection forwarding features” on page 366.
Notes Displays connection icons that indicate the current state of the connection. The connection states can be one of these:
Compression Enabled - Indicates that LZ compression is enabled.
SDR Enabled - Indicates that SDR optimization is enabled.
WAN Encryption Enabled - Indicates that encryption is enabled on the secure inner channel (WAN). For details, see “Configuring secure peers” on page 340.
Cloud Acceleration ON - Indicates that the Cloud acceleration service for SaaS applications is enabled.
Source:Port Displays the connection source IP address and port.
Destination:Port Displays the connection destination IP address and port.
LAN/kB
WAN/kB
Displays the amount of LAN or WAN throughput, in kilobytes.
Reduction Displays the degree of WAN traffic optimization as a percentage of LAN traffic sent. Higher percentages mean that fewer bytes were sent over the WAN.
Red squares indicate that an optimizing connection is currently showing 0 percent data reduction, which might be caused by multiple scenarios. Typically, 0 percent data reduction occurs when the system is optimizing a session containing encrypted payload. You can set up an in-path pass-through rule to prevent the system from interception the connection for optimization.
Column Icon Description

Viewing Reports and Logs | 507
Viewing current connection reports
Note: For information on removing an unknown appliance from the current connections list, see “Preventing an
unknown (or unwanted) appliance from peering” on page 123.
Viewing the Current Connections report details
The Current Connections report displays details about the connected appliances, such as the source and
destination IP address, the peer appliance, the inner local port, and so on. You can also perform these
operations:
• For optimized connections, send a keepalive message to the outer remote machine (the machine that is connected to this appliance)
• Reset any connection, optimized or pass-through
• Retrieve the most recent data for a connection
The report does not allow the connection details to refresh automatically, because doing so could slow
down the appliance; however, the connection age updates when you manually refresh the page.
To view current connection details
1. Choose Networking: Reports > Current Connections to display the Current Connections report.
2. Click the connection in the connections table to see more details about an individual connection and perform operations on it. Because this report is a snapshot in time, by the time you click, the connection could be gone or in a different state. Click Update to refresh the display.
Connection details
The expanded connection details vary, depending on the nature of the connection.
• Connection type - Displays the connection type icon and whether the connection is established, opening, or closing.
• Connection age - Displays the time since the connection was created.
• Transport - Displays the transport protocol name: for example, SSL inner.
Start Time Displays the time that the connection was started. This column does not apply to preexisting connections. Select the column heading to sort data start time in ascending or descending order.
Application Displays the application associated with the connection: for example: TCP, CIFS, MAPI, eMAPI-OA (encrypted MAPI Outlook Anywhere), or HTTP.
When Application Visibility is enabled (the default), the table displays the hierarchical, DPI-based application name (for example, HTTP > Facebook), instead of just the port-based name (for example, HTTP). When you expand a connection, a new Application row displays the hierarchical name, when available, or the port-based name if not. (For newly formed connections, the application name might have changed from what was reported in the table). Application visibility gives you a better sense of what applications are running instead of just seeing traffic through port numbers or web traffic classified as generic HTTP.
Column Icon Description

508 | Viewing Reports and Logs
Viewing current connection reports
• Application - Displays the application corresponding to the connection (for example, NFS). When Application Visibility is enabled, more detailed protocol information is shown for some applications. For example, HTTP-SharePoint is displayed as the WebDAV or FPSE protocols.
• Client side - Displays whether this appliance is on the client side.
• In-path - Indicates whether the connection is in-path.
• Protocol - Displays the low-level protocol that RiOS is using inside the packet-mode channel. The protocol can be UDP, TCP, or variants.
• Application error - Displays the application protocol error, if one exists.
• Transport error - Displays the transport protocol error, if one exists.
• SaaS application - Displays the SaaS application name, if one exists.
• Cloud acceleration state - Displays the SaaS connection state, if an SaaS application is running.
• GeoDNS IP result - Displays the GeoDNS IP address that the appliance is using to optimize Office 365. The connection summary displays the original destination IP address.
• SkipWare compression in - Indicates that the single-ended optimized connection is applying Skipware105 compression on incoming data.
• SkipWare compression out - Indicates that the single-ended optimized connection is applying Skipware105 compression on outgoing data.
• Pre-existing asymmetric - Indicates that the connection is traveling an asymmetric route and existed before the last restart of the optimization service.
• Pre-existing - Indicates that the connection existed before the last restart of the optimization service.
• Inbound QoS class - Indicates the QoS inbound class the connection is associated with when shaping is enabled. When the connection carries multiple classes, the report displays Variable.
• Outbound QoS class - Indicates the QoS outbound class the connection is associated with when shaping is enabled. When the connection carries multiple classes, the report displays Variable.
• Outbound QoS DSCP - Indicates the DSCP marking value for the connection when marking is enabled, even if it is zero. The report displays the value from the inner ToS. When the connection carries multiple values, the report displays Variable.
When relevant, the Notes section displays several details that are binary in nature.
All optimized connections might show any of these states:
Client side - Indicates that the appliance is on the client side of the connection.
SDR optimized - Indicates that SDR optimization is enabled.
LZ compressed - Indicates that LZ compression is enabled.
Packet-mode optimized connections might show:
• Incomplete parse - Indicates that the inner channel exists but the connection through the channel is not fully formed.
Optimized, nonpacket mode connections might show any of these states:
• In-path - Indicates an in-path connection.

Viewing Reports and Logs | 509
Viewing current connection reports
• Single-ended - Indicates that the connection involves only one appliance.
• WAN encrypted - Indicates that encryption is enabled on the secure inner channel (WAN).
• Cloud accelerated - Indicates that the Cloud acceleration service for SaaS applications is enabled
At least one of these items appear for SCPS connections:
• SCPS initiate WAN - Indicates that the appliance has initiated the SCPS connection on the WAN.
• SCPS initiate LAN - Indicates that the appliance has initiated the SCPS connection on the LAN.
• SCPS terminate WAN - Indicates that the appliance has terminated the SCPS connection on the WAN.
• SCPS terminate LAN - Indicates that the appliance has terminated the SCPS connection on the LAN.
WAN and LAN-Side Statistics
WAN and LAN-side statistics include these items:
• LAN Bytes - Displays the total LAN bytes transmitted.
• WAN Bytes - Displays the total WAN bytes transmitted.
• Retransmitted - Displays the total packets retransmitted.
• Fast Retransmitted - Displays the total packets fast retransmitted. Fast retransmit reduces the time a sender waits before retransmitting a lost segment. If an acknowledgment is not received for a particular segment with a specified time (a function of the estimated round-trip delay time), the sender assumes the segment was lost in the network, and retransmits the segment.
• Timeouts - Displays the number of packet transmissions that timed out because no ACK was received.
• Congestion Window - Displays number of unACKed packets permitted, adjusted automatically by the SteelHead, depending on WAN congestion.
Path selection connection details
This table summarizes details about optimized and pass-through TCP connections using path selection.
It displays the history of the three recent uplinks, in case the connection switches uplinks after an uplink
goes down. This summary includes only nonpacket-mode flows.
You can filter based on connections for a specific path selection uplink name by entering the name into
the matching regular expression filter.
Data Description (varies by connection)
Relayed Displays the number of bytes relayed if all uplinks are down.
Dropped Displays the number of bytes dropped if all uplinks are down.
Bypassed Displays the number of bytes bypassed if all uplinks are down.
Reflected Displays the number of bytes reflected.
Local uplink Displays the uplink name.
Remote uplink Displays the remote uplink name.
Status Displays whether the uplink is reachable (Up) or unreachable (Down).

510 | Viewing Reports and Logs
Viewing current connection reports
For details, see “Path selection” on page 312.
Individual pass-through or forwarded connection details
This table summarizes details about individual pass-through or forwarded connections.
Pass-through reasons
This table shows the connection pass-through reasons.
Last started Displays the time the connection started using the uplink.
Bytes Displays the total number of bytes transferred through the uplink.
Note: The LAN kB value and this number do not match. This value displays only the bytes using path selection on the WAN.
DSCP Displays the DSCP marking set for the uplink.
Data Description (varies by connection)
Connection Information Connection Type - Displays a connection type icon and whether the pass-through was intentional or unintentional. Displays the forwarded reduction percentage bar for forwarded connections.
Connection Age - Displays the time since the connection was created.
Transport - Displays the transport protocol name: for example, SSL inner.
Application - Displays the application corresponding to the connection: for example, NFS.
Client-Side - Displays whether the connection is on the client side.
Pre-Existing - Displays whether the connection existed before the last restart of the optimization service.
Passthrough Reason - Displays the reason for passing through or forwarding the connection.
Value Pass-through reason (varies by
connection)
Description Action
0 None None None
1 Preexisting connection Connection existed before SteelHead started.
Create a connection.
2 Connection paused SteelHead is not intercepting connections.
Check that the service is enabled, in-path is enabled, the neighbor configuration, and whether the appliance is in admission control.
Data Description (varies by connection)

Viewing Reports and Logs | 511
Viewing current connection reports
3 SYN on WAN side Client is on the SteelHead WAN side.
Either this is the server-side SteelHead and there is no client-side appliance, or the client-side appliance did not probe. Check the cabling if it is really the client-side SteelHead. Because VSP is enabled by default on an Edge, and the default subnet side rule assumes that all traffic is coming from the WAN, client-side connections are not being optimized. Configure a subnet side rule to identify traffic that should be treated as LAN-side traffic. Place the rule at the start of the subnet side rules list, before the default subnet side rule.
4 In-path rule In-path rule matched on the client-side SteelHead is pass-through.
Check the in-path rules.
5 Peering rule Peering rule matched on the server-side SteelHead is pass-through.
Check the peering rules.
6 Inner failed to establish Inner connection between SteelHeads failed.
Check the connectivity between the client-side appliance and the server-side SteelHead.
7 Peer in fixed-target rule down The target of a fixed-target rule is destined to a failed peer.
Check the connectivity between the client-side appliance and the server-side SteelHead.
8 No SteelHead on path to server No server-side SteelHead. Check that the server-side appliance is up and check that the connection goes through the server-side SteelHead.
9 No route for probe response No route to send back probe response.
Check in-path gateway on the server-side SteelHead.
10 Out of memory Memory problem while copying packet.
Check if the appliance is out of memory.
Value Pass-through reason (varies by
connection)
Description Action

512 | Viewing Reports and Logs
Viewing current connection reports
11 No room for more TCP options Not enough space in TCP header to add probe.
This condition occurs when another device added TCP options before the appliance. Take a TCP dump to check which TCP options are in the SYN packet. Search for those options to learn what device uses them.
12 No proxy port for probe response There is no service port configured on server-side SteelHead.
Configure a service port.
13 RX probe from failover buddy The connection is intercepted by failover buddy.
No action is necessary.
14 Asymmetric routing The connection is asymmetric. Check the asymmetric routing table for reason.
15 Middle SteelHead The SteelHead is not the first or last SteelHead.
Only happens when the Enhanced Auto-Discovery Protocol is enabled.
16 Error connecting to server The server-side SteelHead could not connect to the server.
Only happens when the Enhanced Auto-Discovery Protocol is enabled.
17 Half open connections above limit The client has too many half-opened connections.
Check if many connections open quickly from the same client.
18 Connection count above QOS limit There are too many connections for that QoS class.
Check the QoS class.
19 Reached maximum TTL The probe has an incorrect TTL.
Take a trace to check the probe.
20 Incompatible probe version The probe has an incompatible version number.
Check if the new probe format is enabled, it is disabled by default.
21 Too many retransmitted SYNs The client SYN has been retransmitted too many times.
Check if there is a firewall that does not like the probe TCP option.
22 Connection initiated by neighbor The connection is intercepted by a neighbor.
No action is necessary.
23 Connection for local host The connection is to the in-path interface.
No action is necessary.
24 Unknown reason The pass-through reason does not match any other description.
No action is necessary.
Value Pass-through reason (varies by
connection)
Description Action
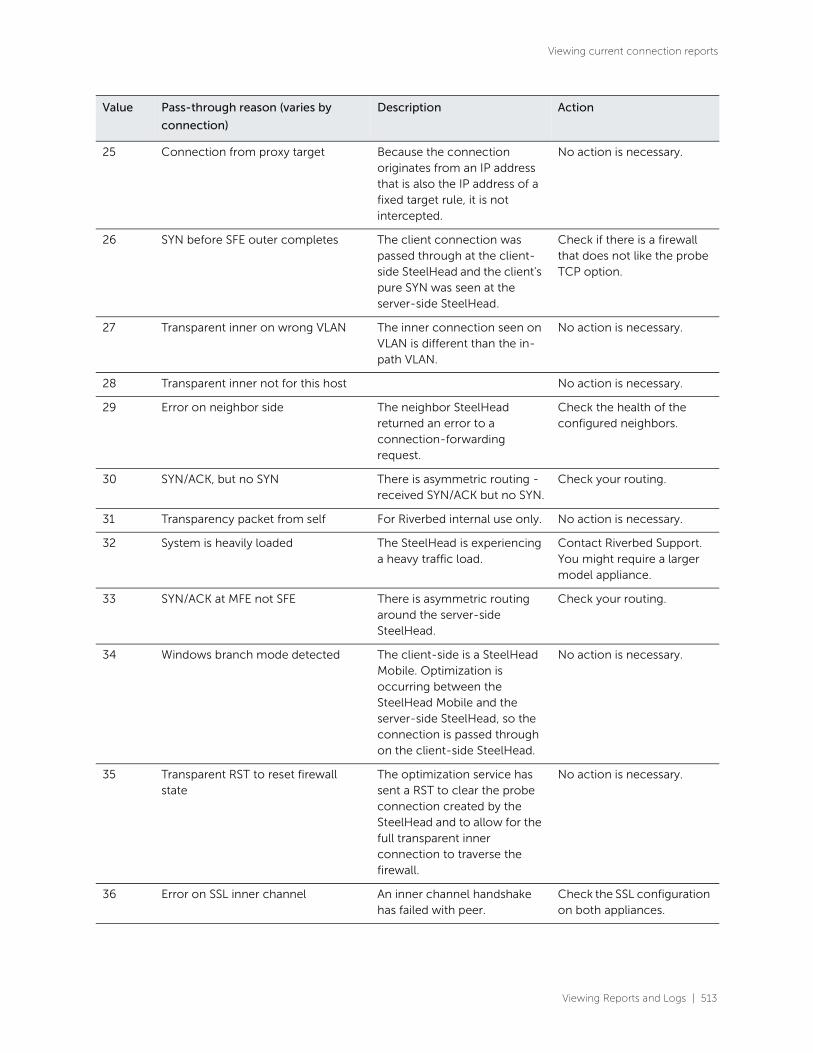
Viewing Reports and Logs | 513
Viewing current connection reports
25 Connection from proxy target Because the connection originates from an IP address that is also the IP address of a fixed target rule, it is not intercepted.
No action is necessary.
26 SYN before SFE outer completes The client connection was passed through at the client-side SteelHead and the client's pure SYN was seen at the server-side SteelHead.
Check if there is a firewall that does not like the probe TCP option.
27 Transparent inner on wrong VLAN The inner connection seen on VLAN is different than the in-path VLAN.
No action is necessary.
28 Transparent inner not for this host No action is necessary.
29 Error on neighbor side The neighbor SteelHead returned an error to a connection-forwarding request.
Check the health of the configured neighbors.
30 SYN/ACK, but no SYN There is asymmetric routing - received SYN/ACK but no SYN.
Check your routing.
31 Transparency packet from self For Riverbed internal use only. No action is necessary.
32 System is heavily loaded The SteelHead is experiencing a heavy traffic load.
Contact Riverbed Support. You might require a larger model appliance.
33 SYN/ACK at MFE not SFE There is asymmetric routing around the server-side SteelHead.
Check your routing.
34 Windows branch mode detected The client-side is a SteelHead Mobile. Optimization is occurring between the SteelHead Mobile and the server-side SteelHead, so the connection is passed through on the client-side SteelHead.
No action is necessary.
35 Transparent RST to reset firewall state
The optimization service has sent a RST to clear the probe connection created by the SteelHead and to allow for the full transparent inner connection to traverse the firewall.
No action is necessary.
36 Error on SSL inner channel An inner channel handshake has failed with peer.
Check the SSL configuration on both appliances.
Value Pass-through reason (varies by
connection)
Description Action

514 | Viewing Reports and Logs
Viewing current connection reports
37 Netflow only: Ricochet packet of optimized connection
This pass-through reason is attributed to a flow reported to a v9 NetFlow collector. A probe and packet have been sent by the SteelHead back through itself. For example, in an in-path setup, if a client-side SteelHead gateway is on its WAN side, all packets sent to the client will first go to the gateway and be sent back through the SteelHead on the way to the client.
Packet ricochet can be avoided in many environments by enabling simplified routing.
38 Passthrough due to MAPI admission control
New MAPI connections will be passed through due to high connection count.
New MAPI connections are optimized automatically when the MAPI traffic has decreased.
39 A SYN or RST packet contains data
40 Failed to discover SCPS device RiOS cannot find an SCPS device.
41 No matching client/server IPv6 scope
RiOS cannot set up the outer channel connection.
RiOS passes all packets through until it creates the outer channel.
42 Failed to create sport outer channel RiOS cannot set up the outer channel connection.
RiOS passes all packets through until it creates the outer channel.
43 Flows not matching in-path rule RiOS cannot match this traffic flow to any packet-mode optimization in-path rule. A packet-mode optimization rule defines the inner channel characteristics.
RiOS passes all packets through while the flow is in this state. Go to Optimization > In-Path rules to add a fixed-target packet-mode optimization in-path rule.
44 Packet mode channel setup pending RiOS is attempting to set up the inner IPv4 or IPv6 channel connection.
RiOS passes all packets through until it creates the inner IPv4 or IPv6 channel.
45 Peer does not support packet-mode optimization
The peer SteelHead to which RiOS needs to establish the inner IPv4 or IPv6 channel connection does not support packet-mode optimization or packet-mode optimization is not enabled.
RiOS stops trying to optimize connections using packet-mode optimization with the peer.
Value Pass-through reason (varies by
connection)
Description Action

Viewing Reports and Logs | 515
Viewing current connection reports
46 Generic Flow error A packet-mode optimization traffic flow transitions to this state when RiOS encounters one of these unrecoverable errors:
• There is not enough memory to set up the inner channel.
• The system has requested that RiOS kill the traffic flow.
When RiOS receives this error, the SteelHead abandons all attempts to optimize the flow.
RiOS passes the flow through for its lifetime.
47 Failed to cache sock pointer While configured for packet-mode optimization, RiOS cannot locate the socket pointer used to exchange packets through the inner channel. The system is attempting to write packets to the ring, but the socket is closed. This condition can occur when the optimization service shuts down unexpectedly.
Go to Administration > Maintenance: Services and restart the optimization service.
48 Packet mode optimization disabled The connection is being passed through because packet-mode optimization is disabled.
Go to Optimization: Network Services > In-path Rules and enable packet-mode optimization.
49 Optimizing local connections only On an Edge, the connection is being passed through because it did not originate locally.
50 Netflow only: probe packet of optimized connection
51 IPv6 connection forwarding requires multi-interface support
RiOS is passing the connection through because the client-side SteelHead is configured without multi-interface connection forwarding. This configuration does not support IPv6.
Go to Networking Network Integration > Connection Forwarding and enable multiple interface support.
Value Pass-through reason (varies by
connection)
Description Action

516 | Viewing Reports and Logs
Viewing current connection reports
SaaS connection details
This table shows the SaaS connection details.
Pass-through reasons for SaaS connections
This table lists the connection pass-through reasons for SaaS connections.
52 Neighbor does not support IPv6 RiOS is passing the connection through because a connection-forwarding neighbor does not support IPv6.
Upgrade the connection-forwarding neighbor to RiOS 8.0 or later.
53 Reached the hard limit for the number of entries
RiOS is passing the connection through because it hit the maximum allowed limit for nonreusable connection entries.
54 Connection or flow from GRE IPv4 tunnel
Value Reason Description Action
0 None None None
1 Optimized connection Connection is redirected through the SteelHead SaaS to a SaaS service.
No action is necessary.
Value Pass-through reason (varies by
connection)
Description Action
2 Inner Connection through Cloud Accelerator
An inner connection to a remote SteelHead is running in the cloud.
No action is necessary.
3 Not a supported SaaS destination Connection is through a SaaS service that is not supported, subscribed to, or enabled.
No action is necessary; however, if you want to optimize this destination IP address, contact Riverbed Support.
4 Due to configured In-path rule Connection is not redirected through the SteelHead SaaS due to an in-path rule to disable cloud acceleration.
Check that the Cloud Acceleration field in the relevant in-path rule is set to Auto.
5 Due to configured Peering rule Connection is not redirected through the SteelHead SaaS due to a peering rule to disable cloud acceleration.
Check that the Cloud Acceleration field in the relevant peering rule is set to Auto.
Value Pass-through reason (varies by
connection)
Description Action

Viewing Reports and Logs | 517
Viewing current connection reports
6 Cloud acceleration disabled Connection is not redirected through the SteelHead SaaS because it is disabled.
Check the cloud accelerator configuration. Go to Optimization: SAAS > Cloud Accelerator and select the Enable Cloud Acceleration check box in the Cloud Accelerator page.
7 Redirection disabled globally Connection is not redirected through the SteelHead SaaS because cloud acceleration redirection is disabled.
Go to Optimization: SAAS > Cloud Accelerator and select the Enable Cloud Acceleration Redirection check box in the Cloud Accelerator page.
8 Redirection disabled for relay Connection is not redirected through SteelHead SaaS because cloud acceleration redirection for this in-path interface is disabled.
Check the Cloud Accelerator redirection configuration for the relevant in-path interface on the command-line interface.
Enter this command on the command-line interface:
show service cloud-accel
For details, see the Riverbed Command-Line Interface Reference Manual.
9 Cloud proxy is down Connection is not redirected through SteelHead SaaS because the redirection service encountered an error.
Contact Riverbed Support.
10 No PQID added by first SteelHead Connection is not redirected through SteelHead SaaS because the SteelHead appliance closest to the client has SteelHead SaaS disabled or misconfigured.
Check the Cloud Accelerator configuration on the client-side appliance.
11 Failed to append CP code Connection is not redirected through SteelHead SaaS because of a packet processing error.
Contact Riverbed Support.
12 SYN retransmit (backhauled) Connection is not redirected through SteelHead SaaS because too many SYN retransmits were received from the client.
Check if there is a firewall that does not allow inbound or outbound UDP packets for the appliance.
Value Pass-through reason (varies by
connection)
Description Action
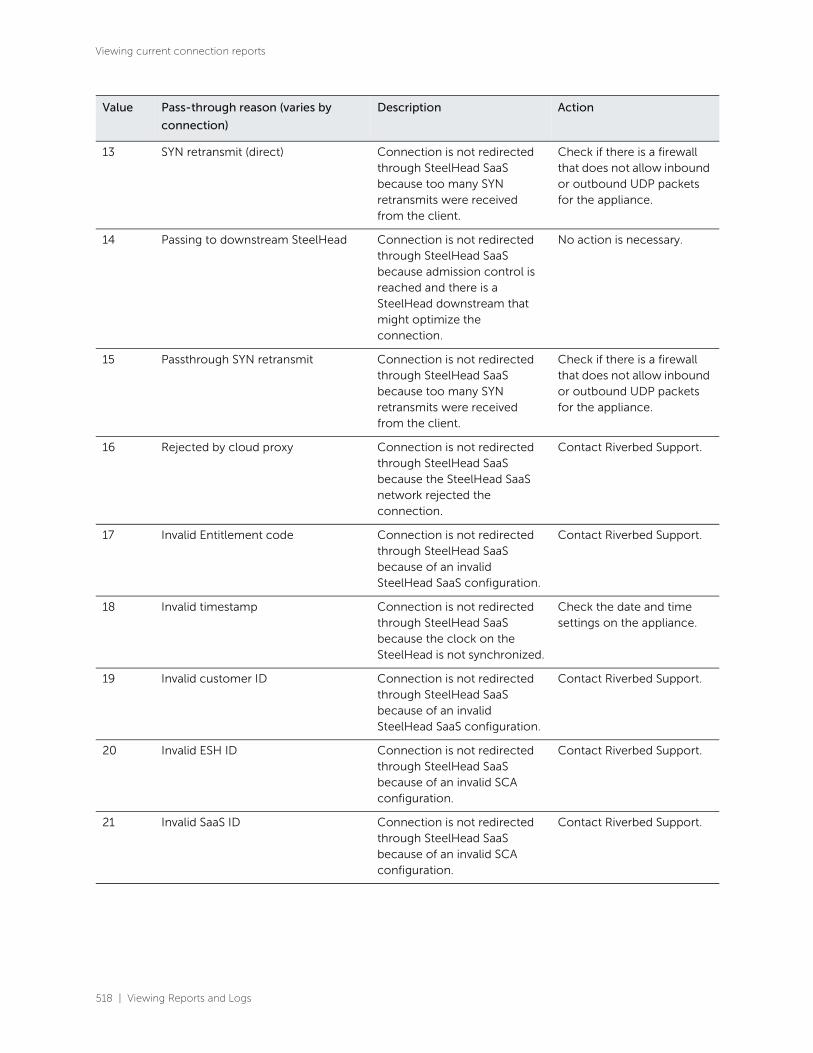
518 | Viewing Reports and Logs
Viewing current connection reports
13 SYN retransmit (direct) Connection is not redirected through SteelHead SaaS because too many SYN retransmits were received from the client.
Check if there is a firewall that does not allow inbound or outbound UDP packets for the appliance.
14 Passing to downstream SteelHead Connection is not redirected through SteelHead SaaS because admission control is reached and there is a SteelHead downstream that might optimize the connection.
No action is necessary.
15 Passthrough SYN retransmit Connection is not redirected through SteelHead SaaS because too many SYN retransmits were received from the client.
Check if there is a firewall that does not allow inbound or outbound UDP packets for the appliance.
16 Rejected by cloud proxy Connection is not redirected through SteelHead SaaS because the SteelHead SaaS network rejected the connection.
Contact Riverbed Support.
17 Invalid Entitlement code Connection is not redirected through SteelHead SaaS because of an invalid SteelHead SaaS configuration.
Contact Riverbed Support.
18 Invalid timestamp Connection is not redirected through SteelHead SaaS because the clock on the SteelHead is not synchronized.
Check the date and time settings on the appliance.
19 Invalid customer ID Connection is not redirected through SteelHead SaaS because of an invalid SteelHead SaaS configuration.
Contact Riverbed Support.
20 Invalid ESH ID Connection is not redirected through SteelHead SaaS because of an invalid SCA configuration.
Contact Riverbed Support.
21 Invalid SaaS ID Connection is not redirected through SteelHead SaaS because of an invalid SCA configuration.
Contact Riverbed Support.
Value Pass-through reason (varies by
connection)
Description Action
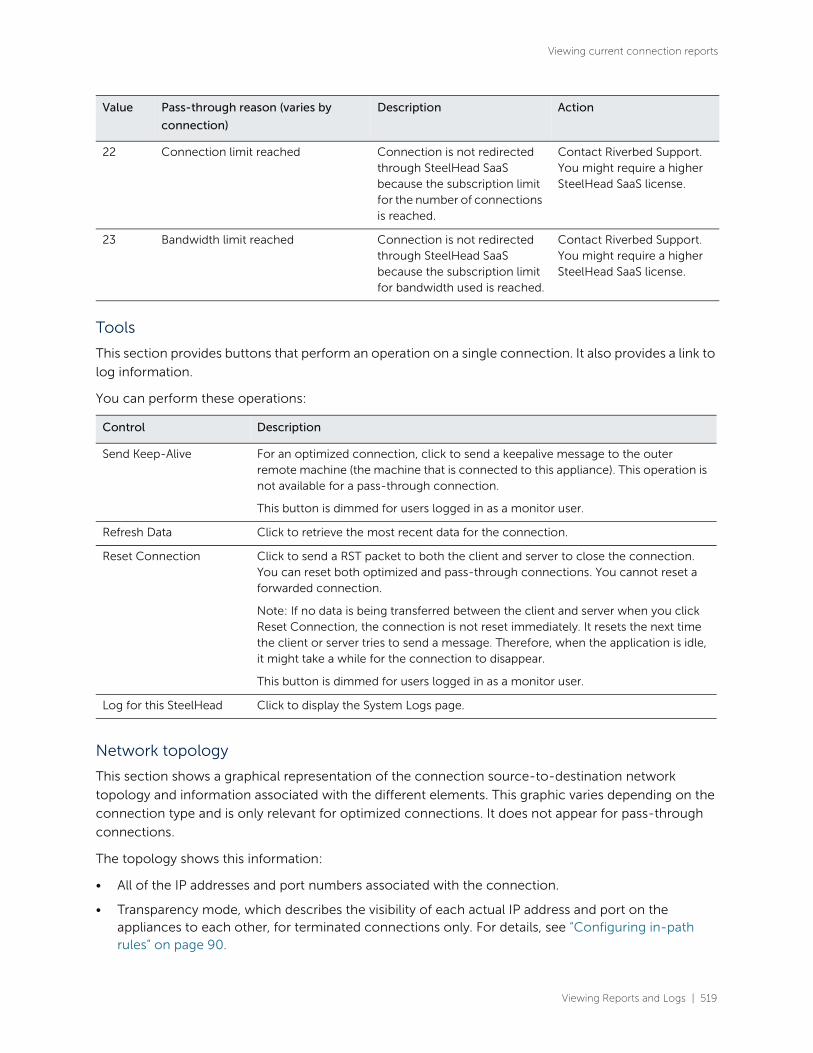
Viewing Reports and Logs | 519
Viewing current connection reports
Tools
This section provides buttons that perform an operation on a single connection. It also provides a link to
log information.
You can perform these operations:
Network topology
This section shows a graphical representation of the connection source-to-destination network
topology and information associated with the different elements. This graphic varies depending on the
connection type and is only relevant for optimized connections. It does not appear for pass-through
connections.
The topology shows this information:
• All of the IP addresses and port numbers associated with the connection.
• Transparency mode, which describes the visibility of each actual IP address and port on the appliances to each other, for terminated connections only. For details, see “Configuring in-path rules” on page 90.
22 Connection limit reached Connection is not redirected through SteelHead SaaS because the subscription limit for the number of connections is reached.
Contact Riverbed Support. You might require a higher SteelHead SaaS license.
23 Bandwidth limit reached Connection is not redirected through SteelHead SaaS because the subscription limit for bandwidth used is reached.
Contact Riverbed Support. You might require a higher SteelHead SaaS license.
Control Description
Send Keep-Alive For an optimized connection, click to send a keepalive message to the outer remote machine (the machine that is connected to this appliance). This operation is not available for a pass-through connection.
This button is dimmed for users logged in as a monitor user.
Refresh Data Click to retrieve the most recent data for the connection.
Reset Connection Click to send a RST packet to both the client and server to close the connection. You can reset both optimized and pass-through connections. You cannot reset a forwarded connection.
Note: If no data is being transferred between the client and server when you click Reset Connection, the connection is not reset immediately. It resets the next time the client or server tries to send a message. Therefore, when the application is idle, it might take a while for the connection to disappear.
This button is dimmed for users logged in as a monitor user.
Log for this SteelHead Click to display the System Logs page.
Value Pass-through reason (varies by
connection)
Description Action
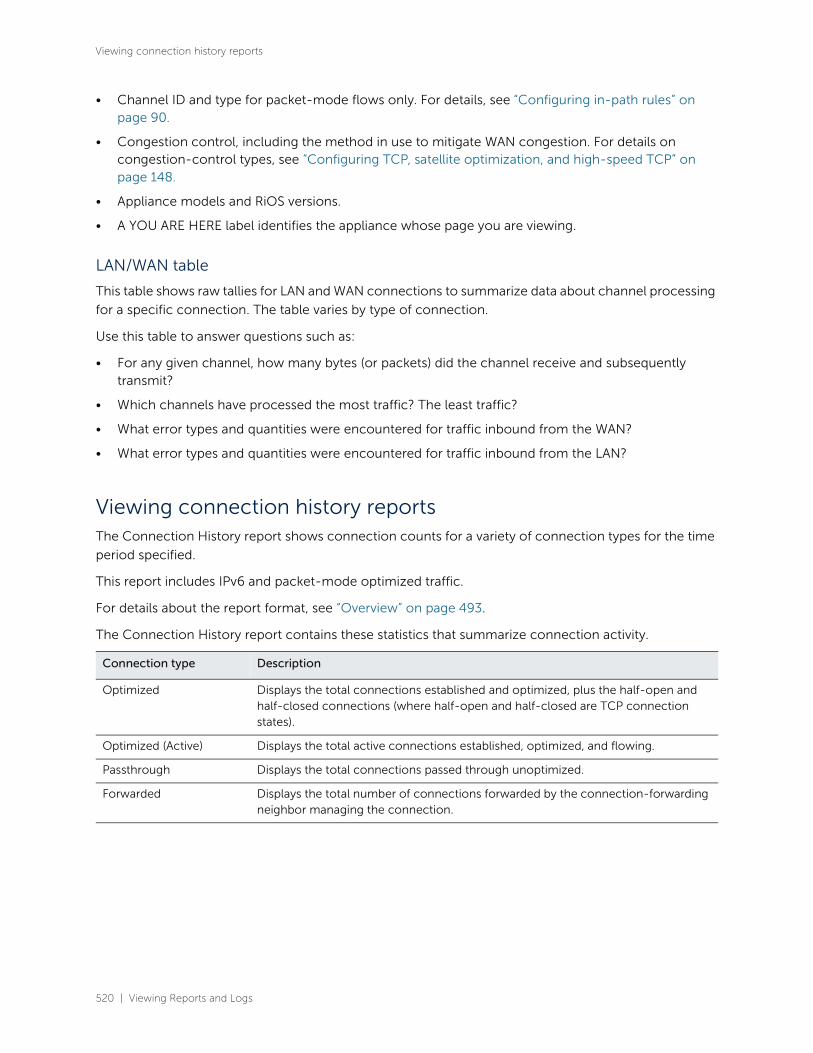
520 | Viewing Reports and Logs
Viewing connection history reports
• Channel ID and type for packet-mode flows only. For details, see “Configuring in-path rules” on page 90.
• Congestion control, including the method in use to mitigate WAN congestion. For details on congestion-control types, see “Configuring TCP, satellite optimization, and high-speed TCP” on page 148.
• Appliance models and RiOS versions.
• A YOU ARE HERE label identifies the appliance whose page you are viewing.
LAN/WAN table
This table shows raw tallies for LAN and WAN connections to summarize data about channel processing
for a specific connection. The table varies by type of connection.
Use this table to answer questions such as:
• For any given channel, how many bytes (or packets) did the channel receive and subsequently transmit?
• Which channels have processed the most traffic? The least traffic?
• What error types and quantities were encountered for traffic inbound from the WAN?
• What error types and quantities were encountered for traffic inbound from the LAN?
Viewing connection history reportsThe Connection History report shows connection counts for a variety of connection types for the time
period specified.
This report includes IPv6 and packet-mode optimized traffic.
For details about the report format, see “Overview” on page 493.
The Connection History report contains these statistics that summarize connection activity.
Connection type Description
Optimized Displays the total connections established and optimized, plus the half-open and half-closed connections (where half-open and half-closed are TCP connection states).
Optimized (Active) Displays the total active connections established, optimized, and flowing.
Passthrough Displays the total connections passed through unoptimized.
Forwarded Displays the total number of connections forwarded by the connection-forwarding neighbor managing the connection.

Viewing Reports and Logs | 521
Viewing connection history reports
The navigator shadows the optimized series.
What this report tells you
The Connection History report answers these questions:
• How many connections were optimized?
• How many connections were passed through, unoptimized?
• What is the percentage of half-opened connections represented in the total optimized connections?
• What is the percentage of half-closed connections represented in the total optimized connections?
About report graphs
Mouse over a specific data point to see the values and exact time stamp.
About report data
The Riverbed system reports on performance for periods up to one month. Due to performance and disk
space considerations, the display granularity decreases with time passed since the data was sampled.
The data is collected at a 5-minute granularity for the entire month.
To view the Connection History report
1. Choose Networking: Reports > Connection History to display the Connection History page.
Optimized (Half Open) Displays the percentage of half-opened connections represented in the optimized connection total. A half-open connection is a TCP connection that has not been fully established. Half-open connections count toward the connection count limit on the appliance because, at any time, they might become a fully open connection.
If you are experiencing a large number of half-opened connections, consider a more appropriately sized appliance.
Optimized (Half Closed) Displays the percentage of half-closed active connections represented in the optimized connection total. Half-closed connections are connections that the appliance has intercepted and optimized but are in the process of being disconnected. These connections are counted toward the connection count limit on the appliance. (Half-closed connections might remain if the client or server does not close its connections cleanly.)
If you are experiencing a large number of half-closed connections, consider a more appropriately sized appliance.
Connection type Description
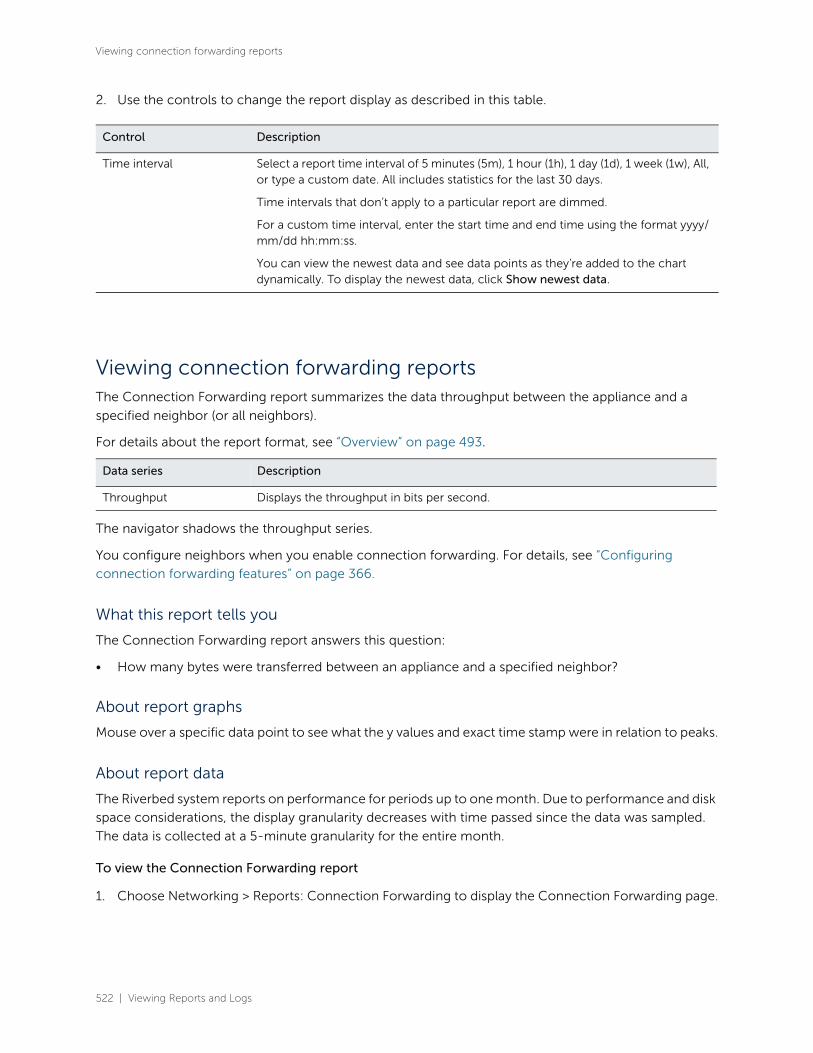
522 | Viewing Reports and Logs
Viewing connection forwarding reports
2. Use the controls to change the report display as described in this table.
Viewing connection forwarding reportsThe Connection Forwarding report summarizes the data throughput between the appliance and a
specified neighbor (or all neighbors).
For details about the report format, see “Overview” on page 493.
The navigator shadows the throughput series.
You configure neighbors when you enable connection forwarding. For details, see “Configuring
connection forwarding features” on page 366.
What this report tells you
The Connection Forwarding report answers this question:
• How many bytes were transferred between an appliance and a specified neighbor?
About report graphs
Mouse over a specific data point to see what the y values and exact time stamp were in relation to peaks.
About report data
The Riverbed system reports on performance for periods up to one month. Due to performance and disk
space considerations, the display granularity decreases with time passed since the data was sampled.
The data is collected at a 5-minute granularity for the entire month.
To view the Connection Forwarding report
1. Choose Networking > Reports: Connection Forwarding to display the Connection Forwarding page.
Control Description
Time interval
Select a report time interval of 5 minutes (5m), 1 hour (1h), 1 day (1d), 1 week (1w), All, or type a custom date. All includes statistics for the last 30 days.
Time intervals that don’t apply to a particular report are dimmed.
For a custom time interval, enter the start time and end time using the format yyyy/mm/dd hh:mm:ss.
You can view the newest data and see data points as they’re added to the chart dynamically. To display the newest data, click Show newest data.
Data series Description
Throughput Displays the throughput in bits per second.

Viewing Reports and Logs | 523
Viewing outbound QoS reports
2. Use the controls to customize the report as described in this table.
Viewing outbound QoS reportsThe Outbound QoS report summarizes the number of bits per second or packets per second transmitted
for either a set of QoS classes (up to seven) or an aggregate total of all classes for the time period
specified.
Note: Upgrading from RiOS 8.0.x (or earlier) to 9.0 changes the QoS statistics data. The Outbound QoS report will
not show any statistics from a previous configuration.
For details about the report format, see “Overview” on page 493.
What this report tells you
The Outbound QoS report answers these questions:
• Is outbound QoS working correctly?
• How many bits or packets per second were transmitted over the WAN for the QoS classes?
• How many bits or packets per second were sent and dropped for the QoS classes?
The Outbound QoS report might display this message for a traffic class even when QoS is shaping it.
This is because the report limits the data sample display to only the first 1000 classes. When a class falls
beyond the first 1000 lines of classes, the report displays no data.
About report graphs
Mouse over a specific data point to see what the y values and exact time stamp were in relation to peaks.
About report data
The Riverbed system reports on performance for periods up to one month. Due to performance and disk
space considerations, the display granularity decreases with time passed since the data was sampled
with a granularity of 5 minutes for the day, 1 hour for the last week, and 2 hours for the rest of the month.
Control Description
Time interval
Select a report time interval of 5 minutes (5m), 1 hour (1h), 1 day (1d), 1 week (1w), All, or type a custom date. All includes statistics for the last 30 days.
Time intervals that don’t apply to a particular report are dimmed.
For a custom time interval, enter the start time and end time using the format yyyy/mm/dd hh:mm:ss.
You can view the newest data and see data points as they’re added to the chart dynamically. To display the newest data, click Show newest data.
Neighbor Select a neighbor from the drop-down list or All to display all neighbors.

524 | Viewing Reports and Logs
Viewing outbound QoS reports
To view the Outbound QoS report
1. Choose Networking > Reports: Outbound QoS to display the Outbound QoS page.
Use the controls to change the report display as described in this table.
Control Description
Time interval
Select a report time interval of 5 minutes (5m), 1 hour (1h), 1 day (1d), 1 week (1w), All, or type a custom date. All includes statistics for the last 30 days.
Time intervals that don’t apply to a particular report are dimmed.
For a custom time interval, enter the start time and end time using the format yyyy/mm/dd hh:mm:ss.
Because the system aggregates data on the hour, request hourly time intervals. For example, setting a time interval to 08:30:00 to 09:30:00 from two days ago doesn’t create a data display, whereas setting a time interval to 08:00:00 to 09:00:00 from two days ago will display data.
When you request a custom time interval to view data beyond the aggregated granularity, the data is not visible because the system is no longer storing the data. For example, the following custom time intervals don’t return data because the system automatically aggregates data older than seven days into two-hour data points:
• Setting a one-hour time period that occurred two weeks ago.
• Setting a 75-minute time period that occurred more than 1 week ago.
You can view the newest data and see data points as they’re added to the chart dynamically. To display the newest data, click Show newest data.
Units Select either packets/sec or bps from the drop-down list.
Classes Select Total or Selected classes from the drop-down list. Selected classes lets you narrow the report by choosing from drop-down lists of classes and remote sites (up to seven). You can’t select a class or a class @ site more than once.
Click Update to change the QoS class selection without updating the chart.
When the report display includes the total classes, the data series appear as translucent; selected classes appear as opaque.
When the report display includes the total classes, the navigator shadows the total sent series. When the report display includes selected classes and remote sites, the navigator shadows the first nonempty sent series. A data series can be empty if you create a QoS class but it has not seen any traffic yet.
Selecting a parent class displays its child classes. For example, the report for an HTTP class with two child classes named WebApp1 and WebApp2 displays statistics for HTTP, WebApp1, and WebApp2.
When a selected class has descendant classes, the report aggregates the statistics for the entire tree of classes. It displays the aggregated tree statistics as belonging to the selected class.

Viewing Reports and Logs | 525
Viewing inbound QoS reports
Viewing inbound QoS reportsThe Inbound QoS report displays received and dropped throughputs for a variety of inbound QoS class
configurations (up to seven) or an aggregate total of all classes for the time period specified.
For details about the report format, see “Overview” on page 493.
What this report tells you
The Inbound QoS report answers these questions:
• How many bits or packets per second were transmitted over the WAN for the QoS classes?
• How many bits or packets per second were received and dropped for the QoS classes?
About report graphs
Mouse over a specific data point to see what the y values and exact time stamp were in relation to peaks.
About report data
The Riverbed system reports on performance for periods up to one month. Due to performance and disk
space considerations, the display granularity decreases with time passed since the data was sampled
with a granularity of 5 minutes for the day, 1 hour for the last week, and 2 hours for the rest of the month.
To view the Inbound QoS report
1. Choose Networking > Reports: Inbound QoS to display the Inbound QoS page.
2. Use the controls to customize the report as described in this table.
Control Description
Time interval Select a report time interval of 5 minutes (5m), 1 hour (1h), 1 day (1d), 1 week (1w), All, or type a custom date. All includes statistics for the last 30 days.
Time intervals that don’t apply to a particular report are dimmed.
For a custom time interval, enter the start time and end time using the format yyyy/mm/dd hh:mm:ss.
Because the system aggregates data on the hour, request hourly time intervals. For example, setting a time interval to 08:30:00 to 09:30:00 from two days ago doesn’t create a data display, whereas setting a time interval to 08:00:00 to 09:00:00 from two days ago will display data.
When you request a custom time interval to view data beyond the aggregated granularity, the data is not visible because the system is no longer storing the data. For example, these custom time intervals don’t return data because the system automatically aggregates data older than seven days into two-hour data points:
• Setting a one-hour time period that occurred two weeks ago.
• Setting a 75-minute time period that occurred more than one week ago.
You can view the newest data and see data points as they’re added to the chart dynamically. To display the newest data, click Show newest data.
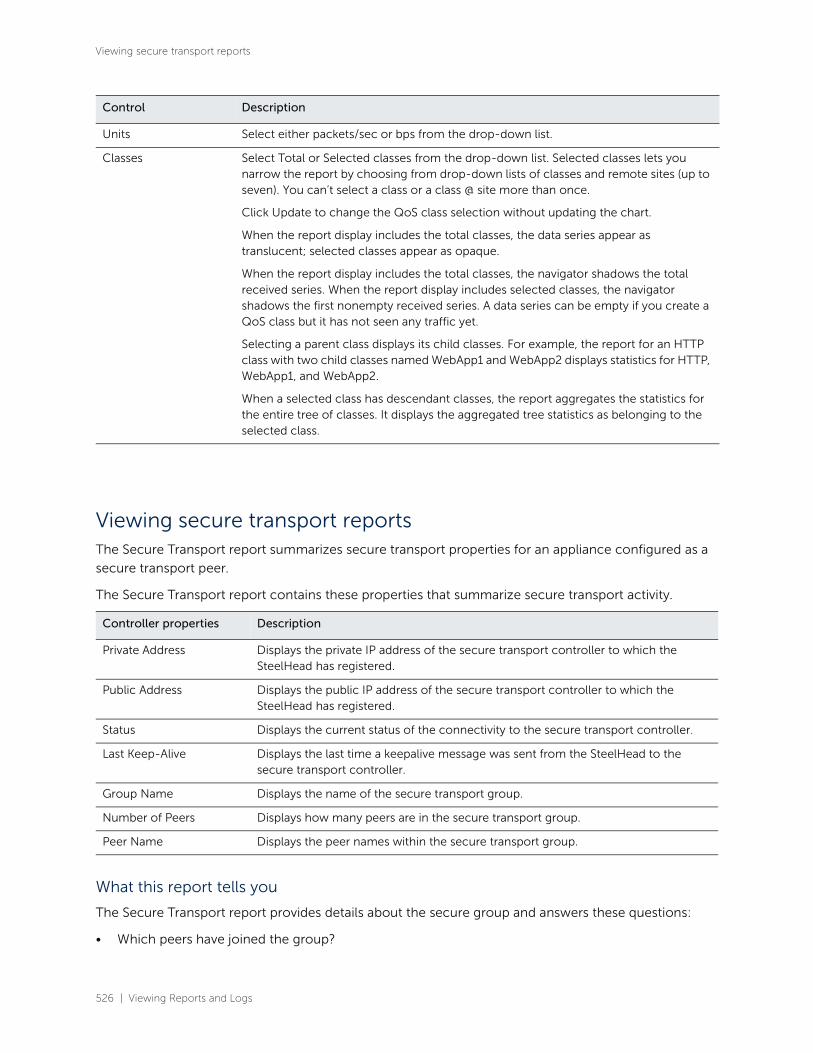
526 | Viewing Reports and Logs
Viewing secure transport reports
Viewing secure transport reportsThe Secure Transport report summarizes secure transport properties for an appliance configured as a
secure transport peer.
The Secure Transport report contains these properties that summarize secure transport activity.
What this report tells you
The Secure Transport report provides details about the secure group and answers these questions:
• Which peers have joined the group?
Units Select either packets/sec or bps from the drop-down list.
Classes Select Total or Selected classes from the drop-down list. Selected classes lets you narrow the report by choosing from drop-down lists of classes and remote sites (up to seven). You can’t select a class or a class @ site more than once.
Click Update to change the QoS class selection without updating the chart.
When the report display includes the total classes, the data series appear as translucent; selected classes appear as opaque.
When the report display includes the total classes, the navigator shadows the total received series. When the report display includes selected classes, the navigator shadows the first nonempty received series. A data series can be empty if you create a QoS class but it has not seen any traffic yet.
Selecting a parent class displays its child classes. For example, the report for an HTTP class with two child classes named WebApp1 and WebApp2 displays statistics for HTTP, WebApp1, and WebApp2.
When a selected class has descendant classes, the report aggregates the statistics for the entire tree of classes. It displays the aggregated tree statistics as belonging to the selected class.
Controller properties Description
Private Address Displays the private IP address of the secure transport controller to which the SteelHead has registered.
Public Address Displays the public IP address of the secure transport controller to which the SteelHead has registered.
Status Displays the current status of the connectivity to the secure transport controller.
Last Keep-Alive Displays the last time a keepalive message was sent from the SteelHead to the secure transport controller.
Group Name Displays the name of the secure transport group.
Number of Peers Displays how many peers are in the secure transport group.
Peer Name Displays the peer names within the secure transport group.
Control Description
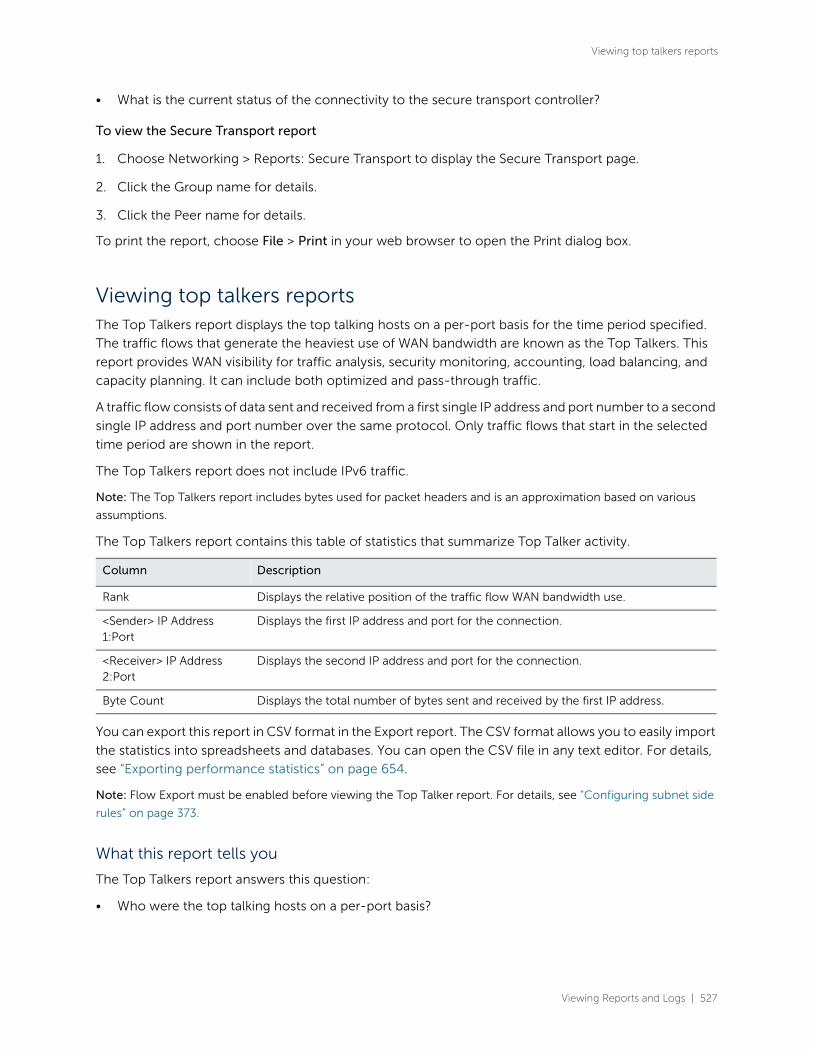
Viewing Reports and Logs | 527
Viewing top talkers reports
• What is the current status of the connectivity to the secure transport controller?
To view the Secure Transport report
1. Choose Networking > Reports: Secure Transport to display the Secure Transport page.
2. Click the Group name for details.
3. Click the Peer name for details.
To print the report, choose File > Print in your web browser to open the Print dialog box.
Viewing top talkers reportsThe Top Talkers report displays the top talking hosts on a per-port basis for the time period specified.
The traffic flows that generate the heaviest use of WAN bandwidth are known as the Top Talkers. This
report provides WAN visibility for traffic analysis, security monitoring, accounting, load balancing, and
capacity planning. It can include both optimized and pass-through traffic.
A traffic flow consists of data sent and received from a first single IP address and port number to a second
single IP address and port number over the same protocol. Only traffic flows that start in the selected
time period are shown in the report.
The Top Talkers report does not include IPv6 traffic.
Note: The Top Talkers report includes bytes used for packet headers and is an approximation based on various
assumptions.
The Top Talkers report contains this table of statistics that summarize Top Talker activity.
You can export this report in CSV format in the Export report. The CSV format allows you to easily import
the statistics into spreadsheets and databases. You can open the CSV file in any text editor. For details,
see “Exporting performance statistics” on page 654.
Note: Flow Export must be enabled before viewing the Top Talker report. For details, see “Configuring subnet side
rules” on page 373.
What this report tells you
The Top Talkers report answers this question:
• Who were the top talking hosts on a per-port basis?
Column Description
Rank Displays the relative position of the traffic flow WAN bandwidth use.
<Sender> IP Address 1:Port
Displays the first IP address and port for the connection.
<Receiver> IP Address 2:Port
Displays the second IP address and port for the connection.
Byte Count Displays the total number of bytes sent and received by the first IP address.

528 | Viewing Reports and Logs
Viewing traffic summary reports
About report data
The Riverbed system reports on performance for periods up to one month. Due to performance and disk
space considerations, the display granularity decreases with time passed since the data was sampled.
The data is collected at a 5-minute granularity for the entire month.
To view the Top Talkers report
1. Choose Networking > Reports: Top Talkers to display the Top Talkers page.
2. Use the controls to customize the report as described in this table.
3. The Top Talkers data does not exactly match the Traffic Summary data, the Bandwidth Optimization data, or specific connection data that appears when you select a particular connection in the Current Connections report. This variation is due to packet headers, packet retransmits, and other TCP/IP effects that flow export collectors see, but RiOS does not. Consequently, the reports are proportional but not equivalent.
Note: Select a Top Talkers report column heading to sort the column in ascending or descending order.
Viewing traffic summary reportsThe Traffic Summary report provides a percentage breakdown of the amount of TCP traffic going
through the system. For details about setting ports to be monitored, see “Configuring monitored ports”
on page 479.
Control Description
Chart Select the report display from the drop-down list: By Conversation, By Sender, By Receiver, By Host, or By Application Port. The default setting is By Conversation.
Period You can view the traffic statistics for the past hour, the past 24 hours, or all available hours. All is the default setting, which displays statistics for the entire duration the Edge has gathered statistics. This duration can be up to two days, depending on how long the service has been up and the traffic volume. Select All, Last Hour, or Last Day from the drop-down list. The default setting is All.
Note: Top Talker statistics aren’t persistent between service restarts.
Count Specify how many top pairs of IP addresses and ports with the highest total traffic (sent and received) appear in the report. Each pair shows the number of bytes and packets sent and received at IP address 1. The default value is 50.
Note: You can export the complete list of top talkers to a file in CSV format using the Export report.
Protocol Select Both, TCP, or UDP from the drop-down list. The default value is Both.
Traffic Type Select Both, Optimized, or Passthrough from the drop-down list. The default value is Both.
Go Displays the report.

Viewing Reports and Logs | 529
Viewing traffic summary reports
The appliance automatically discovers all the ports in the system that have traffic. The discovered port
and its label (if one exists) are added to the report. If a label does not exist, an unknown label is added to
the discovered port.
Starting with RiOS 9.5, you can view optimization statistics for SaaS applications. This report lists the
optimized traffic by SaaS application instead of by port number, and the ID for the SaaS application is
listed in the Port column. To configure SaaS applications for optimization by the SteelHead, see
“Configuring the Legacy Cloud Accelerator” on page 138.
SaaS application statistics are not included with the overall statistics for port 443 and port 80.
When using a role-based management (RBM) user, ensure that the RBM user has at least read-only
permissions for the Cloud Optimization role; otherwise, the user will not be able to view the SaaS
application names.
Note: To find the definition of the application ID that is listed in the Port column, open the Optimization > Cloud
Accelerator page. The ID (for example, SFDC) and application name (for example, Salesforce.com) are listed in the
Application ID and SaaS Application Control fields.
If you want to change the unknown label to a name representing the port, you must readd the port with
a new label. All statistics for this new port label are preserved from the time the port was discovered.
Note: The Traffic Summary report displays a maximum of 16 ports and pie slices for the traffic types comprising
more than 0.005 percent of the total traffic (by destination port). When there are more than 16 ports, the report
displays 15 individual ports and aggregates the remaining ports into the 16th slice. The 16th slice is always gray. Any
ports aggregated into the 16th slice are also gray. Any traffic that comprises less than 0.005 percent of the total is
not included in the Traffic Summary report, but is aggregated into the Bandwidth Optimization report.
The Traffic Summary report provides this table of statistics that describe data activity for the application
and the time period you specify.
What this report tells you
The Traffic Summary report answers these questions:
• How much data reduction has occurred?
• What was the percentage of the total traffic for each port?
Column Description
Port Displays the TCP/IP port number and application for each row of statistics.
Reduction Displays the amount of application data reduction.
LAN Data Displays the amount of application data on the LAN.
WAN Data Displays the amount of application data on the WAN.
Traffic % Calculates LAN-side data to indicate the percentage of the total traffic each port represents.
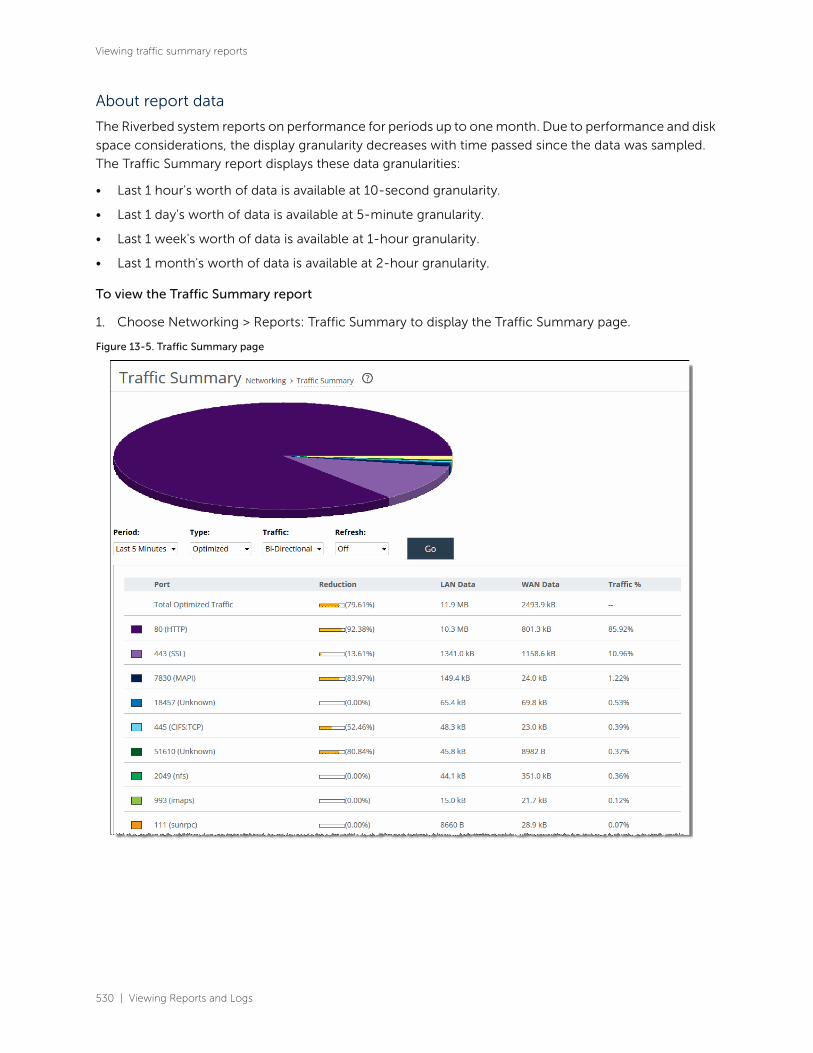
530 | Viewing Reports and Logs
Viewing traffic summary reports
About report data
The Riverbed system reports on performance for periods up to one month. Due to performance and disk
space considerations, the display granularity decreases with time passed since the data was sampled.
The Traffic Summary report displays these data granularities:
• Last 1 hour's worth of data is available at 10-second granularity.
• Last 1 day's worth of data is available at 5-minute granularity.
• Last 1 week's worth of data is available at 1-hour granularity.
• Last 1 month's worth of data is available at 2-hour granularity.
To view the Traffic Summary report
1. Choose Networking > Reports: Traffic Summary to display the Traffic Summary page.
Figure 13-5. Traffic Summary page

Viewing Reports and Logs | 531
Viewing WAN throughput reports
2. Use the controls to customize the report as described in this table.
Viewing WAN throughput reportsThe WAN Throughput report summarizes the WAN throughput for the time period specified. In standard
in-path and virtual in-path deployments, the throughput is an aggregation of all data the system
transmits out of all WAN interfaces. In a server-side out-of-path configuration, the report summarizes
all data the system transmits out of the primary interface.
For details about the report format, see “Overview” on page 493.
You must choose Networking > Network Services: Flow Statistics and enable WAN Throughput Statistics
to view data in this report. WAN throughput statistics are enabled by default.
The WAN Throughput report does not include any traffic that is hardware bypassed, either by an in-path
interface in hardware bypass, or the portion of traffic that is bypassed by hardware-assist rules on
supported Fiber 10 Gigabit-Ethernet in-path cards.
Control Description
Period Select a period of Last Minute, Last 5 Minutes, Last Hour, Last Day, Last Week, Last Month, or Custom from the drop-down list.
For Custom, enter the Start Time and End Time and click Go. Use this format: yyyy/mm/dd hh:mm:ss
Type Select a traffic type of Optimized, Pass Through, or Both from the drop-down list.
Traffic Select a traffic direction from the drop-down list:
• Bi-Directional - Traffic flowing in both directions.
• WAN-to-LAN - Inbound traffic flowing from the WAN to the LAN.
• LAN-to-WAN - Outbound traffic flowing from the LAN to the WAN.
Refresh Select a refresh rate from the drop-down list:
• To refresh the report every 10 seconds, select 10 seconds.
• To refresh the report every 30 seconds, select 30 seconds.
• To refresh the report every 60 seconds, select 60 seconds.
• To turn refresh off, click Off.
Go Displays the report.

532 | Viewing Reports and Logs
Viewing WAN throughput reports
The WAN Throughput report includes a WAN link throughput graph that provides these statistics
describing data activity for the time period you specify.
The navigator shadows the Peak throughput series.
In some configurations, RiOS transmits LAN traffic out of WAN interfaces: for example, virtual in-path
deployments and deployments using the default gateway on the WAN side without simplified routing. In
such deployments, you can configure subnet side rules to decide which channel traffic is not destined
for the WAN. For details, see “Configuring subnet side rules” on page 373.
What this report tells you
The WAN Throughput report answers these questions:
• What was the average WAN throughput?
• What was the peak WAN throughput?
About report graphs
Mouse over a specific data point to see what the y values and exact time stamp were in relation to peaks.
About report data
The Riverbed system reports on performance for periods up to one month. Due to performance and disk
space considerations, the display granularity decreases with time passed since the data was sampled
with a granularity of 5 minutes for the day, 1 hour for the last week, and 2 hours for the rest of the month.
Data series Description
Peak Throughput Displays the peak data activity.
Average Throughput Displays the average and total throughput.
RiOS calculates the WAN average at each data point by taking the number of bytes transferred, converting that to bits, and then dividing by the granularity.
For instance, if the system reports 100 bytes for a data point with a 10-second granularity, RiOS calculates:
100 bytes * 8 bits/byte / 10 seconds = 80 bps
This calculation means that 80 bps was the average throughput over that 10-second period.
The total throughput shows the data amount transferred during the displayed time interval.
The average that appears below the Average Throughput is an average of all displayed averages.
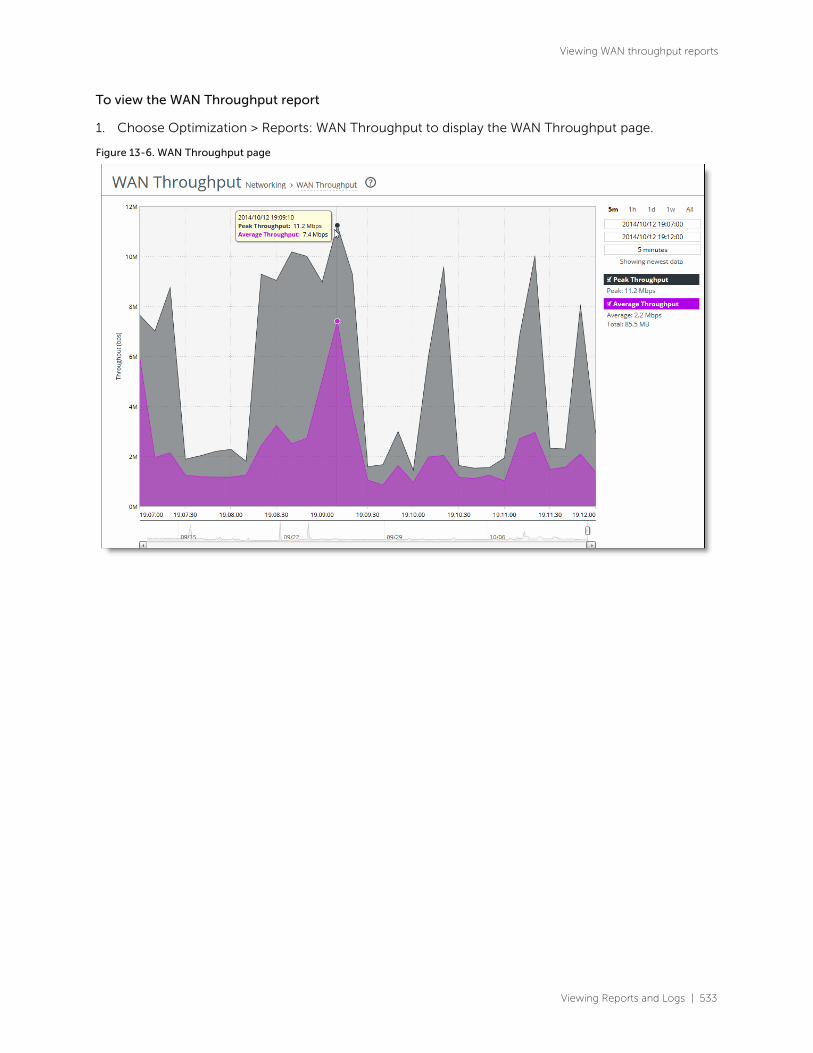
Viewing Reports and Logs | 533
Viewing WAN throughput reports
To view the WAN Throughput report
1. Choose Optimization > Reports: WAN Throughput to display the WAN Throughput page.
Figure 13-6. WAN Throughput page

534 | Viewing Reports and Logs
Viewing application statistics reports
2. Use the controls to change the display as described in this table.
Viewing application statistics reportsThe Application Statistics report provides a tabular summary or a graph of the traffic flowing through a
appliance for the time period specified. You can view up to seven applications in a stacked view.
You must enable application visibility on the Networking > Network Services: Flow Statistics page before
the Application Statistics report can gather and display statistics. For details, see “Configuring flow
statistics” on page 375.
RiOS collects application statistics for all data transmitted out of the WAN and primary interfaces and
commits samples every 5 minutes. Let the system collect statistics awhile to view the most meaningful
data display.
For details about the report format, see “Overview” on page 493.
Control Description
Time interval Select a report time interval of 5 minutes (5m), 1 hour (1h), 1 day (1d), 1 week (1w), All, or type a custom date. All includes statistics for the last 30 days.
Time intervals that don’t apply to a particular report are dimmed.
For a custom time interval, enter the start time and end time using the format yyyy/mm/dd hh:mm:ss
Because the system aggregates data on the hour, request hourly time intervals. For example, setting a time interval to 08:30:00 to 09:30:00 from two days ago doesn’t create a data display, whereas setting a time interval to 08:00:00 to 09:00:00 from two days ago will display data.
When you request a custom time interval to view data beyond the aggregated granularity, the data is not visible because the system is no longer storing the data. For example, these custom time intervals don’t return data because the system automatically aggregates data older than seven days into two-hour data points:
• Setting a one-hour time period that occurred two weeks ago.
• Setting a 75-minute time period that occurred more than one week ago.
You can view the newest data and see data points as they’re added to the chart dynamically. To display the newest data, click Show newest data.

Viewing Reports and Logs | 535
Viewing application statistics reports
The Application Statistics report includes these statistics for each listed application, traffic direction, and
the time period you specify.
This report displays applications within their protocol hierarchy. For example, Facebook appears as TCP
> HTTP > Facebook.
This report lists unrecognized applications by their server port. For example, TCP > Unknown (port 5001).
What this report tells you
The Application Statistics report answers this question:
• How much bandwidth is a particular application using?
About report graphs
While viewing the application statistics in a graph, mouse over a specific data point to see what the y
values and exact time stamp were in relation to peaks.
About report data
The Riverbed system reports on performance for periods up to one month. Due to performance and disk
space considerations, the display granularity decreases with time passed since the data was sampled.
The data is collected at a 5-minute granularity for the entire month.
To view the Application Statistics report
1. Choose Networking: Reports > Application Statistics to display the Application Statistics page.
Data series Description
Average bps Displays the average data activity in all flows of an application in bits per second. The minimum sample granularity is 5 minutes.
Per Flow Average bps Displays the average trended throughput in all traffic flows of an application in bits per second. This data series indicates how bandwidth intensive an application is per user or flow.
RiOS calculates the WAN average at each data point by taking the number of bytes transferred, converting that to bits, and then dividing by the granularity.
For instance, if the system reports 100 bytes for a data point with a 10-second granularity, RiOS calculates:
100 bytes * 8 bits/byte / 10 seconds = 80 bps
This calculation means that 80 bps was the average throughput over that 10-second period.
Peak bps Displays the peak data activity in bits per second. For larger granularity data points, this represents the largest 5 minute average within. For 5 minutes, this is the same as the average.
Per flow Peak bps Displays the peak trended data activity per traffic flow in bits per second. This peak is the largest per flow 5-minute bps within a larger sample.

536 | Viewing Reports and Logs
Viewing application statistics reports
2. Click View graphs of the applications selected below to switch from a tabular display to a graph.
Figure 13-7. Application Statistics page
Use the controls to change the report display as described in this table.
Control Description
Period Select a period of Last 5 Minutes, Last Hour, Last Day, Last Week, Last Month, or Custom from the drop-down list.
For Custom, enter the Start Time and End Time and click Go. Use the format yyyy/mm/dd hh:mm:ss.
App Name Filter Click a protocol or application name (for example, TCP, LDAP, SharePoint) to show only the selection.
You can select only one filter at a time. For example, if the report is filtering on UDP and you click TCP, the report displays all TCP entries and clears the UDP filter.
Direction Select the traffic direction from the drop-down list. The default is outbound LAN > WAN traffic.
Interface Select an interface from the drop-down list. The default is all WAN and primary interfaces.
Update Click to update the chart without updating the application selection.

Viewing Reports and Logs | 537
Viewing application visibility reports
Viewing application visibility reportsThe Application Visibility report summarizes the traffic flowing through an appliance classified by the
application for the time period specified. This report provides application level visibility into layer-7 and
shows the application dynamics for pass-through and optimized traffic.
You must enable application visibility on the Networking > Network Services: Flow Statistics page before
the Application Visibility report can gather and display statistics. Application Visibility is enabled by
default. For details, see “Configuring flow statistics” on page 375.
For details about the report format, see “Overview” on page 493.
This report does not include IPv6 traffic.
The Application Visibility report includes these statistics for each listed application, traffic direction, and
the time period you specify.
The navigator shadows the Per-flow throughput series.
What this report tells you
The Application Visibility report answers this question:
Data series Description
App Throughput Displays the throughput for all traffic flows in bits per second. The minimum sample granularity is 5 minutes.
Throughput Peak - Mouse over the data series to display the peak data activity in bits per second. For larger granularity data points, this represents the largest 5 minute average within. For 5 minutes, this is the same as the average.
Throughput Average - Mouse over the data series to display the average trended throughput for all traffic flows in kbps.
Per-Flow Throughput Displays the throughput per traffic flow in bits per second.
Per-Flow Peak - Mouse over the data series to display the peak trended data activity per traffic flow in bits per second. This peak is the largest per flow 5-minute bps within a larger sample.
Per-Flow Average - Mouse over the data series to display the average trended throughput in all traffic flows of an application in bits per second. This data series indicates how bandwidth-intensive an application is per user or flow.
RiOS calculates the WAN average at each data point by taking the number of bytes transferred, converting that to bits, and then dividing by the granularity.
For instance, if the system reports 100 bytes for a data point with a 10-second granularity, RiOS calculates:
100 bytes * 8 bits/byte / 10 seconds = 80 bps
This calculation means that 80 bps was the average throughput over that 10-second period.
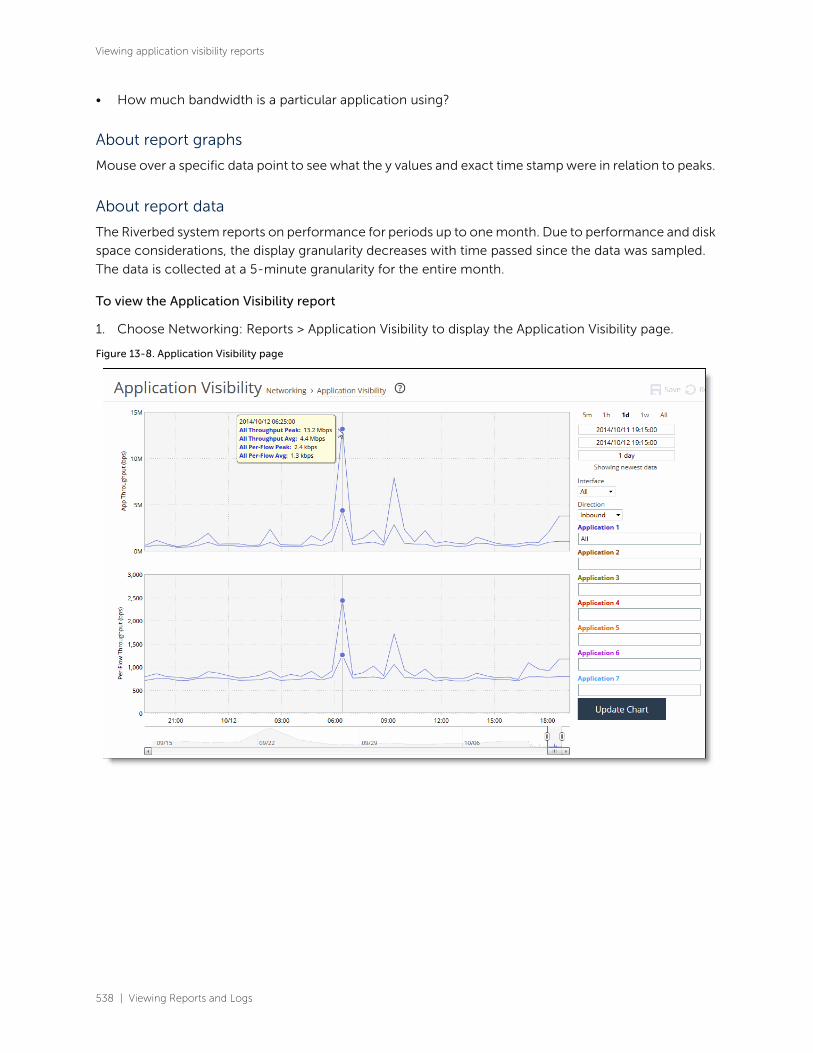
538 | Viewing Reports and Logs
Viewing application visibility reports
• How much bandwidth is a particular application using?
About report graphs
Mouse over a specific data point to see what the y values and exact time stamp were in relation to peaks.
About report data
The Riverbed system reports on performance for periods up to one month. Due to performance and disk
space considerations, the display granularity decreases with time passed since the data was sampled.
The data is collected at a 5-minute granularity for the entire month.
To view the Application Visibility report
1. Choose Networking: Reports > Application Visibility to display the Application Visibility page.
Figure 13-8. Application Visibility page
Viewing Reports and Logs | 539
Viewing interface counter reports
2. Use the controls to change the report display as described in this table.
Viewing interface counter reportsThe Interface Counters report summarizes the statistics for the interfaces. It also displays the IP address,
speed, duplex, MAC address, and current status of each interface.
This report includes interfaces configured with IPv6 addresses.
For automatically negotiated speed and duplex settings, the Interface Counters report displays the speed
at which they are negotiated.
Interface statistics display the data accumulated since the last reboot.
The Interface Counters report displays the statistics described in this table.
Control Description
Time interval Select a report time interval of 5 minutes (5m), 1 hour (1h), 1 day (1d), 1 week (1w), All, or type a custom date. All includes statistics for the last 30 days.
Time intervals that don’t apply to a particular report are dimmed.
For a custom time interval, enter the start time and end time using the format yyyy/mm/dd hh:mm:ss.
You can view the newest data and see data points as they’re added to the chart dynamically. To display the newest data, click Show newest data.
Interface Select an interface from the drop-down list. The default is all interfaces.
Direction Select the traffic direction from the drop-down list. The default is outbound LAN > WAN traffic.
Application Name Type the first characters in the application name. When the application name and definition appears, select it from the list.
You can select up to seven applications.
Click Update Chart to update the chart without changing the application selection.
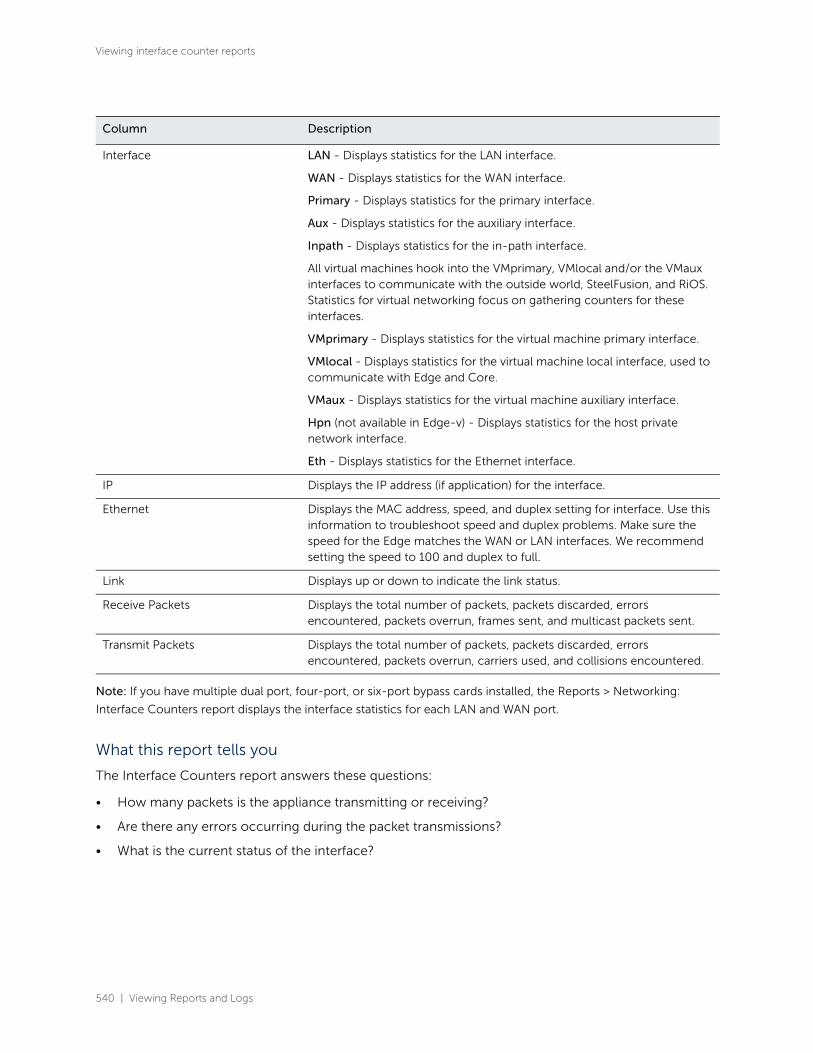
540 | Viewing Reports and Logs
Viewing interface counter reports
Note: If you have multiple dual port, four-port, or six-port bypass cards installed, the Reports > Networking:
Interface Counters report displays the interface statistics for each LAN and WAN port.
What this report tells you
The Interface Counters report answers these questions:
• How many packets is the appliance transmitting or receiving?
• Are there any errors occurring during the packet transmissions?
• What is the current status of the interface?
Column Description
Interface LAN - Displays statistics for the LAN interface.
WAN - Displays statistics for the WAN interface.
Primary - Displays statistics for the primary interface.
Aux - Displays statistics for the auxiliary interface.
Inpath - Displays statistics for the in-path interface.
All virtual machines hook into the VMprimary, VMlocal and/or the VMaux interfaces to communicate with the outside world, SteelFusion, and RiOS. Statistics for virtual networking focus on gathering counters for these interfaces.
VMprimary - Displays statistics for the virtual machine primary interface.
VMlocal - Displays statistics for the virtual machine local interface, used to communicate with Edge and Core.
VMaux - Displays statistics for the virtual machine auxiliary interface.
Hpn (not available in Edge-v) - Displays statistics for the host private network interface.
Eth - Displays statistics for the Ethernet interface.
IP Displays the IP address (if application) for the interface.
Ethernet Displays the MAC address, speed, and duplex setting for interface. Use this information to troubleshoot speed and duplex problems. Make sure the speed for the Edge matches the WAN or LAN interfaces. We recommend setting the speed to 100 and duplex to full.
Link Displays up or down to indicate the link status.
Receive Packets Displays the total number of packets, packets discarded, errors encountered, packets overrun, frames sent, and multicast packets sent.
Transmit Packets Displays the total number of packets, packets discarded, errors encountered, packets overrun, carriers used, and collisions encountered.

Viewing Reports and Logs | 541
Viewing TCP statistics reports
To view interface counters
• Choose Networking: Reports > Interface Counters to display the Interface Counters page.
Figure 13-9. Interface Counters page
To print the report, choose File > Print in your web browser to open the Print dialog box.
Viewing TCP statistics reportsThe TCP Statistics report summarizes TCP statistics for the appliance and also contains this table of
statistics that summarize TCP activity.
Packet type Description
Packets Received Displays the total packets received.
Packets Sent Displays the total TCP packets sent.
Packets Retransmitted Displays the total TCP packets retransmitted.
Packets Fast Retransmitted
Displays the total TCP packets fast retransmitted. Fast retransmit is an enhancement to TCP that reduces the time a sender waits before retransmitting a lost segment. If an acknowledgment is not received for a particular segment with a specified time (a function of the estimated round-trip delay time), the sender assumes the segment was lost in the network, and retransmits the segment.

542 | Viewing Reports and Logs
Viewing optimized throughput reports
What this report tells you
The TCP Statistics report answers these questions:
• How many TCP packets have been sent and received?
• How many TCP packets have been retransmitted?
• How many time-outs have occurred?
• How many loss events have occurred?
To view the TCP Statistics report
• Choose Networking: Reports > TCP Statistics to display the TCP Statistics page.
Figure 13-10. TCP Statistics page
To print the report, choose File > Print in your web browser to open the Print dialog box.
Viewing optimized throughput reportsThe Optimized Throughput report summarizes the throughput for the port, traffic direction, and time
period specified.
For details about the report format, see “Overview” on page 493.
Starting with RiOS 9.5, you can view optimization statistics for SaaS applications. This report lists the
optimized traffic by SaaS application instead of by port number, and the ID for the SaaS application is
listed in the Port column. To configure SaaS applications for optimization by the SteelHead, see
“Configuring the Legacy Cloud Accelerator” on page 138.
SaaS application statistics are not included with the overall statistics for port 443 and port 80.
Time-outs Displays the number of time-outs.
Loss Events Displays the total number of loss events.
Packet type Description
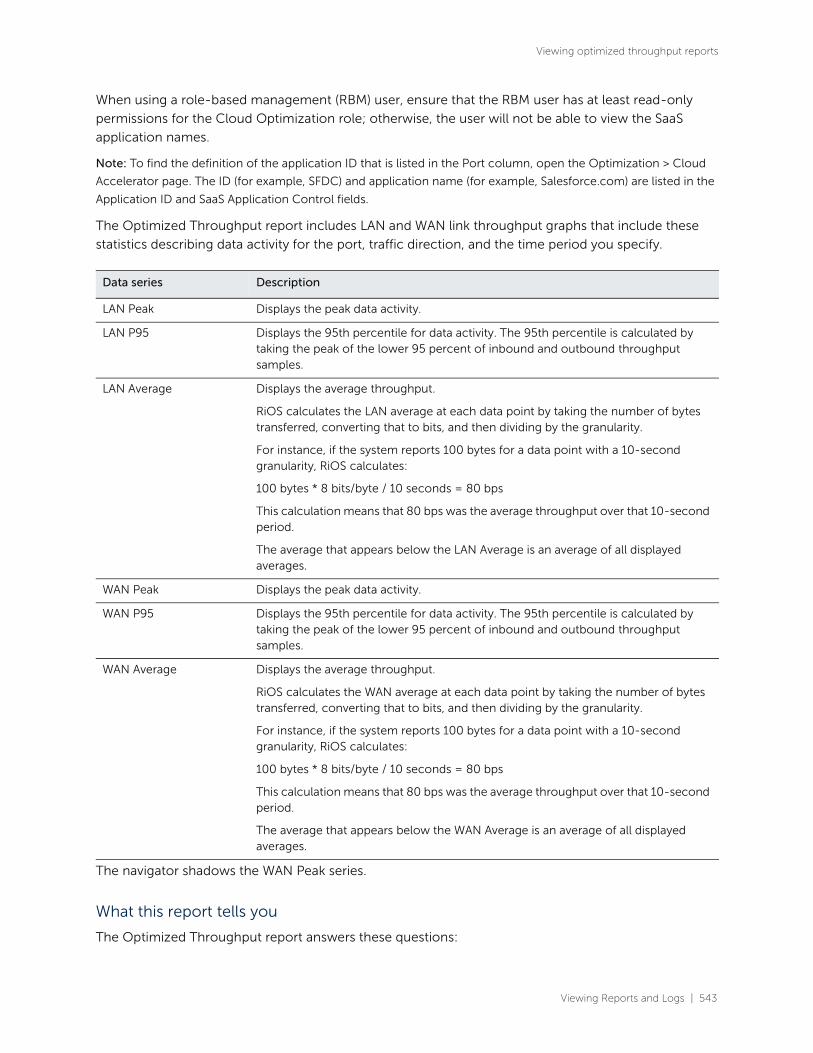
Viewing Reports and Logs | 543
Viewing optimized throughput reports
When using a role-based management (RBM) user, ensure that the RBM user has at least read-only
permissions for the Cloud Optimization role; otherwise, the user will not be able to view the SaaS
application names.
Note: To find the definition of the application ID that is listed in the Port column, open the Optimization > Cloud
Accelerator page. The ID (for example, SFDC) and application name (for example, Salesforce.com) are listed in the
Application ID and SaaS Application Control fields.
The Optimized Throughput report includes LAN and WAN link throughput graphs that include these
statistics describing data activity for the port, traffic direction, and the time period you specify.
The navigator shadows the WAN Peak series.
What this report tells you
The Optimized Throughput report answers these questions:
Data series Description
LAN Peak Displays the peak data activity.
LAN P95 Displays the 95th percentile for data activity. The 95th percentile is calculated by taking the peak of the lower 95 percent of inbound and outbound throughput samples.
LAN Average Displays the average throughput.
RiOS calculates the LAN average at each data point by taking the number of bytes transferred, converting that to bits, and then dividing by the granularity.
For instance, if the system reports 100 bytes for a data point with a 10-second granularity, RiOS calculates:
100 bytes * 8 bits/byte / 10 seconds = 80 bps
This calculation means that 80 bps was the average throughput over that 10-second period.
The average that appears below the LAN Average is an average of all displayed averages.
WAN Peak Displays the peak data activity.
WAN P95 Displays the 95th percentile for data activity. The 95th percentile is calculated by taking the peak of the lower 95 percent of inbound and outbound throughput samples.
WAN Average Displays the average throughput.
RiOS calculates the WAN average at each data point by taking the number of bytes transferred, converting that to bits, and then dividing by the granularity.
For instance, if the system reports 100 bytes for a data point with a 10-second granularity, RiOS calculates:
100 bytes * 8 bits/byte / 10 seconds = 80 bps
This calculation means that 80 bps was the average throughput over that 10-second period.
The average that appears below the WAN Average is an average of all displayed averages.

544 | Viewing Reports and Logs
Viewing optimized throughput reports
• What was the average WAN and LAN throughput?
• What was the peak WAN and LAN throughput?
About report graphs
Mouse over a specific data point to see what the y values and exact time stamp were in relation to peaks.
About report data
The Riverbed system reports on performance for periods up to one month. However, due to
performance and disk space considerations, data representation in reports for periods longer than the
last 5 minutes are interpolated from aggregate data points. The Optimized Throughput report displays
these data granularities:
• Last 1 hour's worth of data is available at 10-second granularity.
• Last 1 day's worth of data is available at 5-minute granularity.
• Last 1 week's worth of data is available at 1-hour granularity.
• Last 1 month's worth of data is available at 2-hour granularity.
To view the Optimized Throughput report
1. Choose Optimization: Reports > Optimized Throughput to display the Optimized Throughput page.
Figure 13-11. Optimized Throughput page
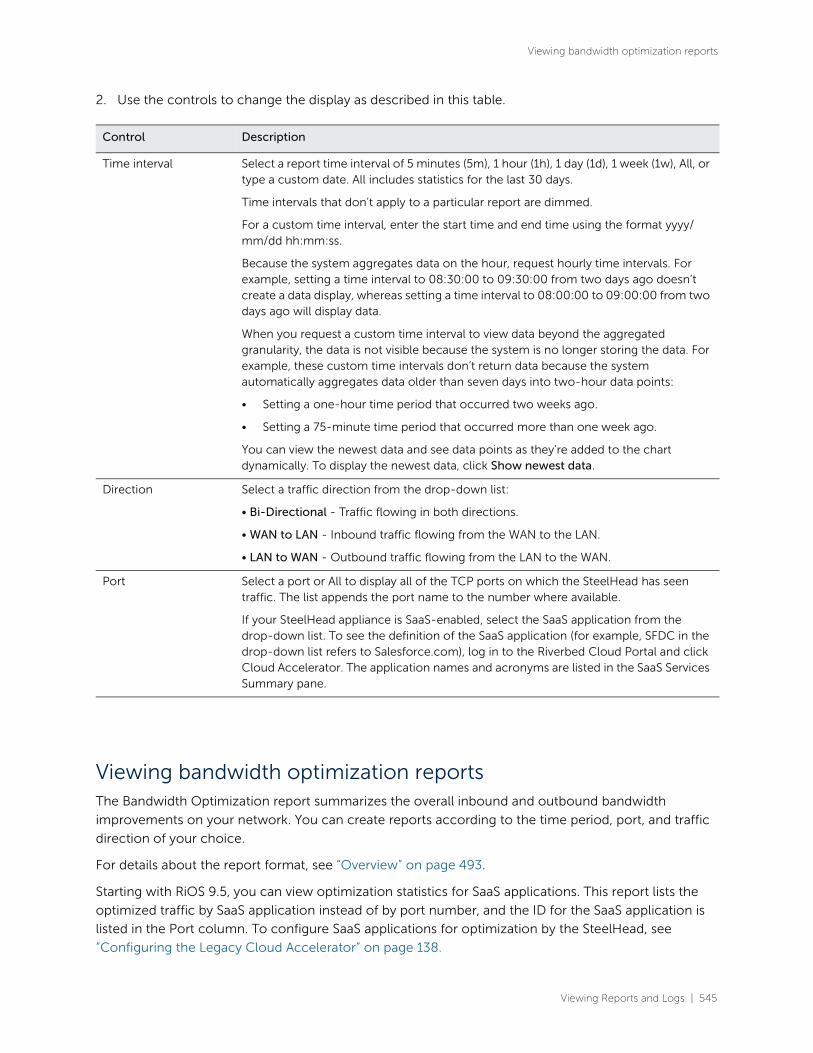
Viewing Reports and Logs | 545
Viewing bandwidth optimization reports
2. Use the controls to change the display as described in this table.
Viewing bandwidth optimization reportsThe Bandwidth Optimization report summarizes the overall inbound and outbound bandwidth
improvements on your network. You can create reports according to the time period, port, and traffic
direction of your choice.
For details about the report format, see “Overview” on page 493.
Starting with RiOS 9.5, you can view optimization statistics for SaaS applications. This report lists the
optimized traffic by SaaS application instead of by port number, and the ID for the SaaS application is
listed in the Port column. To configure SaaS applications for optimization by the SteelHead, see
“Configuring the Legacy Cloud Accelerator” on page 138.
Control Description
Time interval
Select a report time interval of 5 minutes (5m), 1 hour (1h), 1 day (1d), 1 week (1w), All, or type a custom date. All includes statistics for the last 30 days.
Time intervals that don’t apply to a particular report are dimmed.
For a custom time interval, enter the start time and end time using the format yyyy/mm/dd hh:mm:ss.
Because the system aggregates data on the hour, request hourly time intervals. For example, setting a time interval to 08:30:00 to 09:30:00 from two days ago doesn’t create a data display, whereas setting a time interval to 08:00:00 to 09:00:00 from two days ago will display data.
When you request a custom time interval to view data beyond the aggregated granularity, the data is not visible because the system is no longer storing the data. For example, these custom time intervals don’t return data because the system automatically aggregates data older than seven days into two-hour data points:
• Setting a one-hour time period that occurred two weeks ago.
• Setting a 75-minute time period that occurred more than one week ago.
You can view the newest data and see data points as they’re added to the chart dynamically. To display the newest data, click Show newest data.
Direction Select a traffic direction from the drop-down list:
• Bi-Directional - Traffic flowing in both directions.
• WAN to LAN - Inbound traffic flowing from the WAN to the LAN.
• LAN to WAN - Outbound traffic flowing from the LAN to the WAN.
Port Select a port or All to display all of the TCP ports on which the SteelHead has seen traffic. The list appends the port name to the number where available.
If your SteelHead appliance is SaaS-enabled, select the SaaS application from the drop-down list. To see the definition of the SaaS application (for example, SFDC in the drop-down list refers to Salesforce.com), log in to the Riverbed Cloud Portal and click Cloud Accelerator. The application names and acronyms are listed in the SaaS Services Summary pane.
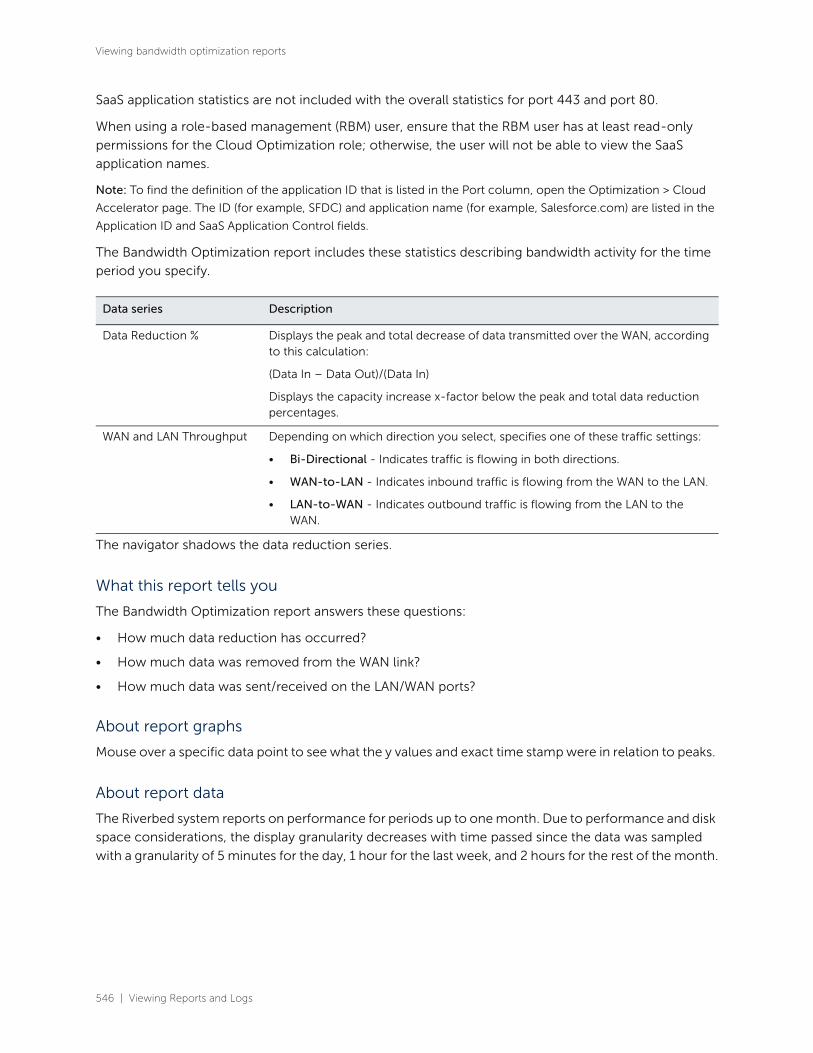
546 | Viewing Reports and Logs
Viewing bandwidth optimization reports
SaaS application statistics are not included with the overall statistics for port 443 and port 80.
When using a role-based management (RBM) user, ensure that the RBM user has at least read-only
permissions for the Cloud Optimization role; otherwise, the user will not be able to view the SaaS
application names.
Note: To find the definition of the application ID that is listed in the Port column, open the Optimization > Cloud
Accelerator page. The ID (for example, SFDC) and application name (for example, Salesforce.com) are listed in the
Application ID and SaaS Application Control fields.
The Bandwidth Optimization report includes these statistics describing bandwidth activity for the time
period you specify.
The navigator shadows the data reduction series.
What this report tells you
The Bandwidth Optimization report answers these questions:
• How much data reduction has occurred?
• How much data was removed from the WAN link?
• How much data was sent/received on the LAN/WAN ports?
About report graphs
Mouse over a specific data point to see what the y values and exact time stamp were in relation to peaks.
About report data
The Riverbed system reports on performance for periods up to one month. Due to performance and disk
space considerations, the display granularity decreases with time passed since the data was sampled
with a granularity of 5 minutes for the day, 1 hour for the last week, and 2 hours for the rest of the month.
Data series Description
Data Reduction % Displays the peak and total decrease of data transmitted over the WAN, according to this calculation:
(Data In – Data Out)/(Data In)
Displays the capacity increase x-factor below the peak and total data reduction percentages.
WAN and LAN Throughput Depending on which direction you select, specifies one of these traffic settings:
• Bi-Directional - Indicates traffic is flowing in both directions.
• WAN-to-LAN - Indicates inbound traffic is flowing from the WAN to the LAN.
• LAN-to-WAN - Indicates outbound traffic is flowing from the LAN to the WAN.

Viewing Reports and Logs | 547
Viewing bandwidth optimization reports
To view a Bandwidth Optimization report
1. Choose Optimization: Reports > Bandwidth Optimization to display the Bandwidth Optimization page.
Figure 13-12. Bandwidth Optimization page

548 | Viewing Reports and Logs
Viewing peer reports
2. Use the controls to customize the report as described in this table.
Viewing peer reportsThe Peers report summarizes the peer SteelHeads. You can view peer SteelHead Mobile appliances as
well. The Peers report contains this table of statistics that summarize connection peer activity.
Control Description
Time interval Select a report time interval of 5 minutes (5m), 1 hour (1h), 1 week (1w), All, or type a custom date. All includes statistics for the past 30 days.
Time intervals that don’t apply to a particular report are dimmed.
For a custom time interval, enter the start time and end time using the format yyyy/mm/dd hh:mm:ss.
Because the system aggregates data on the hour, request hourly time intervals. For example, setting a time interval to 08:30:00 to 09:30:00 from two days ago doesn’t create a data display, whereas setting a time interval to 08:00:00 to 09:00:00 from two days ago will display data.
When you request a custom time interval to view data beyond the aggregated granularity, the data is not visible because the system is no longer storing the data. For example, these custom time intervals don’t return data because the system automatically aggregates data older than seven days into two-hour data points:
• Setting a one-hour time period that occurred two weeks ago.
• Setting a 75-minute time period that occurred more than one week ago.
You can view the newest data and see data points as they’re added to the chart dynamically. To display the newest data, click Show newest data.
Port Select a port or All to select all ports from the drop-down list.
If your SteelHead appliance is SaaS-enabled, select the SaaS application from the drop-down list. To see the definition of the SaaS application (for example, SFDC in the drop-down list refers to Salesforce.com), log in to the Riverbed Cloud Portal and click Cloud Accelerator. The application names and acronyms are listed in the SaaS Services Summary pane.
Direction Select a traffic direction (Bi-Directional, WAN to LAN, or LAN to WAN) from the drop-down list.
Column Description
Name Specifies the name of the peer appliance.
IP Address Specifies the IP address of the peer appliance.
Model Specifies the appliance model.
Version Specifies the appliance version.
Licenses Specifies the current appliance licenses.

Viewing Reports and Logs | 549
Viewing peer reports
The report includes both connected and unconnected peers. The connected icon appears next to a
connected peer. A dimmed icon indicates that the peer is disconnected.
For details about configuring peering, see “Enabling peering and configuring peering rules” on page 116.
What this report tells you
The Peers report answers these questions:
• How many peers are connected to the appliance?
• How many peers are disconnected from the appliance?
To view the Peers report
1. Choose Optimization: Reports > Peers to display the Peers page.
2. To view only connected peers, select the Hide Disconnected Peers check box. To view only SteelHead and SteelFusion Edge peers and hide the SteelHead Mobile peers, select the Hide SteelCentral Controller for SteelHead Mobile Peers check box.
Select a report column heading to sort the column in ascending or descending order.
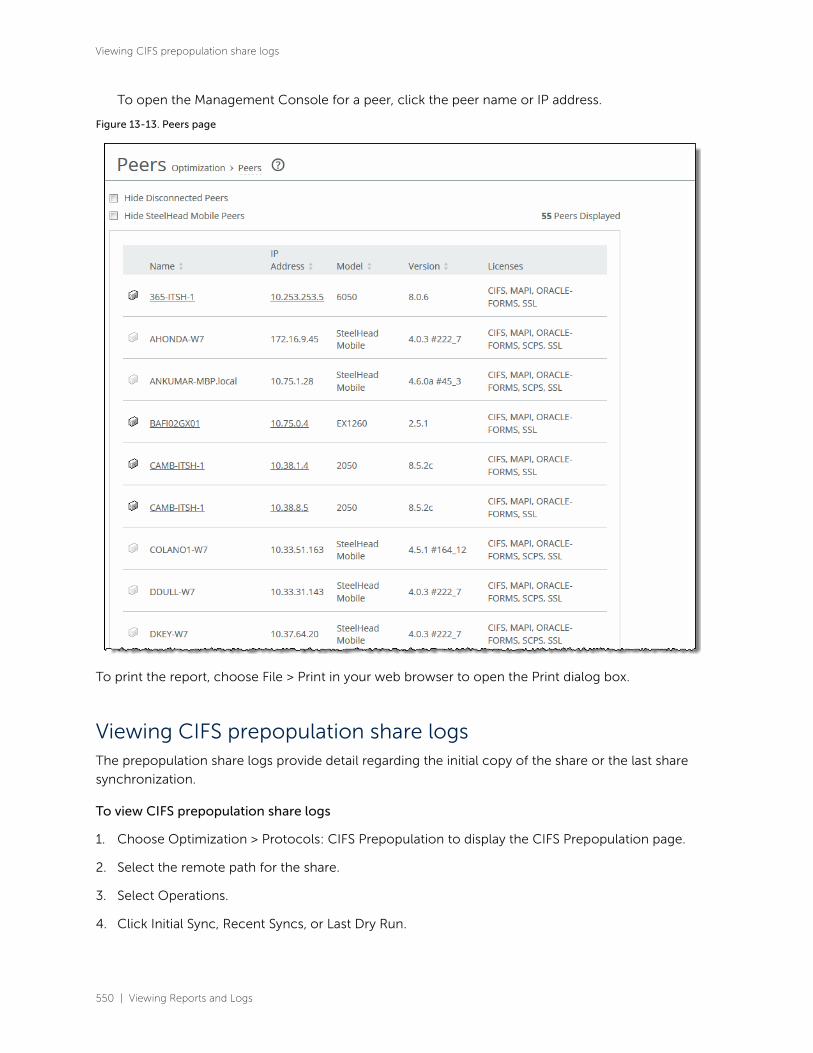
550 | Viewing Reports and Logs
Viewing CIFS prepopulation share logs
To open the Management Console for a peer, click the peer name or IP address.
Figure 13-13. Peers page
To print the report, choose File > Print in your web browser to open the Print dialog box.
Viewing CIFS prepopulation share logsThe prepopulation share logs provide detail regarding the initial copy of the share or the last share
synchronization.
To view CIFS prepopulation share logs
1. Choose Optimization > Protocols: CIFS Prepopulation to display the CIFS Prepopulation page.
2. Select the remote path for the share.
3. Select Operations.
4. Click Initial Sync, Recent Syncs, or Last Dry Run.

Viewing Reports and Logs | 551
Viewing CIFS prepopulation share logs
The initial copy, recent sync, or last dry run log appears.
Figure 13-14. CIFS Prepopulation share initial copy log

552 | Viewing Reports and Logs
Viewing HTTP reports
Figure 13-15. CIFS Prepopulation share sync log
The logs contain these statistics that summarize prepopulation share activity.
To print the log, choose File > Print in your web browser to open the Print dialog box.
Related topic
• “Configuring CIFS optimization” on page 174
Viewing HTTP reportsThe HTTP report displays the hit rates for HTTP optimization for the time period specified.
For details about the report format, see “Overview” on page 493.
Log file Description
Recent syncs Contains logs for the last few share synchronizations. The log includes how many directories, files, and bytes were received and how long it took to receive them. The log also lists any errors or deletions.
Initial sync Includes how many directories, files, and bytes were received initially and how long it took to receive them. The log also lists any errors or deletions.
Last dry run Includes a log of what would have been synchronized with the current share configuration, without actually synchronizing anything.

Viewing Reports and Logs | 553
Viewing HTTP reports
The HTTP report graph displays these statistics that summarize HTTP data activity.
The navigator shadows the object prefetch table hit rate series.
For details, see “Configuring HTTP optimization” on page 190.
What this report tells you
The HTTP report answers this question:
• How many HTTP objects were obtained and transmitted over the WAN?
About report graphs
Mouse over a specific data point to see what the y values and exact time stamp were in relation to peaks.
About report data
The Riverbed system reports on performance for periods up to one month. Due to performance and disk
space considerations, the display granularity decreases with time passed since the data was sampled.
The data is collected at a 5-minute granularity for the entire month.
Data series Description
Request Rate Select to display the rate of HTTP objects, URLs, and object prefetch requests.
Object Prefetch Table Hit Rate Select to display the hit rate of stored object prefetches per second. The appliance stores object prefetches from HTTP GET requests for cascading style sheets, static images, and Java scripts in the Object Prefetch Table.
URL Learning Hit Rate Select to display the hit rate of found base requests and follow-on requests per second. The appliance learns associations between a base request and a follow-on request. Instead of saving each object transaction, the appliance saves only the request URL of object transactions in a Knowledge Base and then generates related transactions from the list.
Parse and Prefetch Hit Rate Select to display the hit rate of found and prefetched embedded objects per second. The appliance determines which objects are going to be requested for a given web page and prefetches them so that they are readily available when the client makes its requests.

554 | Viewing Reports and Logs
Viewing live video stream splitting reports
To view the HTTP report
1. Choose Optimization: Reports > HTTP to display the HTTP Report page.
Figure 13-16. HTTP page
2. Use the control panel to customize the report, as described in this table.
Viewing live video stream splitting reportsVideo stream splitting reduces the bandwidth consumption for both live video and video on demand
(VoD). The Live Video Stream Splitting report lets you visually monitor the performance of the video
session data optimized for multiple clients accessing the same video stream concurrently.
The appliance stores video fragments from a live video stream into a cache and sends the first request
for a video fragment over the WAN, but stores the remaining fragments in the cache to serve locally.
Control panel Description
Time interval
Select a report time interval of 5 minutes (5m), 1 hour (1h), 1 day (1d), 1 week (1w), All, or type a custom date. All includes statistics for the last 30 days.
Time intervals that do not apply to a particular report are dimmed.
For a custom time interval, enter the start time and end time using the format yyyy/mm/dd hh:mm:ss.
You can view the newest data and see data points as they are added to the chart dynamically. To display the newest data, click Show newest data.
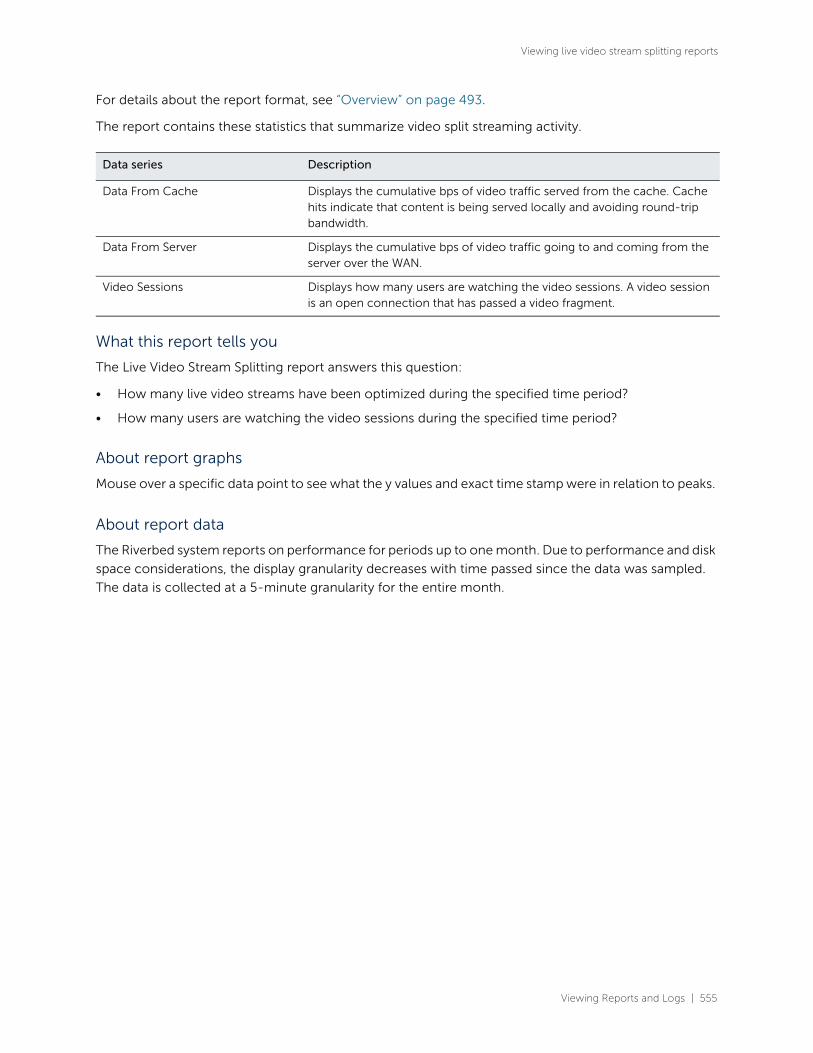
Viewing Reports and Logs | 555
Viewing live video stream splitting reports
For details about the report format, see “Overview” on page 493.
The report contains these statistics that summarize video split streaming activity.
What this report tells you
The Live Video Stream Splitting report answers this question:
• How many live video streams have been optimized during the specified time period?
• How many users are watching the video sessions during the specified time period?
About report graphs
Mouse over a specific data point to see what the y values and exact time stamp were in relation to peaks.
About report data
The Riverbed system reports on performance for periods up to one month. Due to performance and disk
space considerations, the display granularity decreases with time passed since the data was sampled.
The data is collected at a 5-minute granularity for the entire month.
Data series Description
Data From Cache Displays the cumulative bps of video traffic served from the cache. Cache hits indicate that content is being served locally and avoiding round-trip bandwidth.
Data From Server Displays the cumulative bps of video traffic going to and coming from the server over the WAN.
Video Sessions Displays how many users are watching the video sessions. A video session is an open connection that has passed a video fragment.
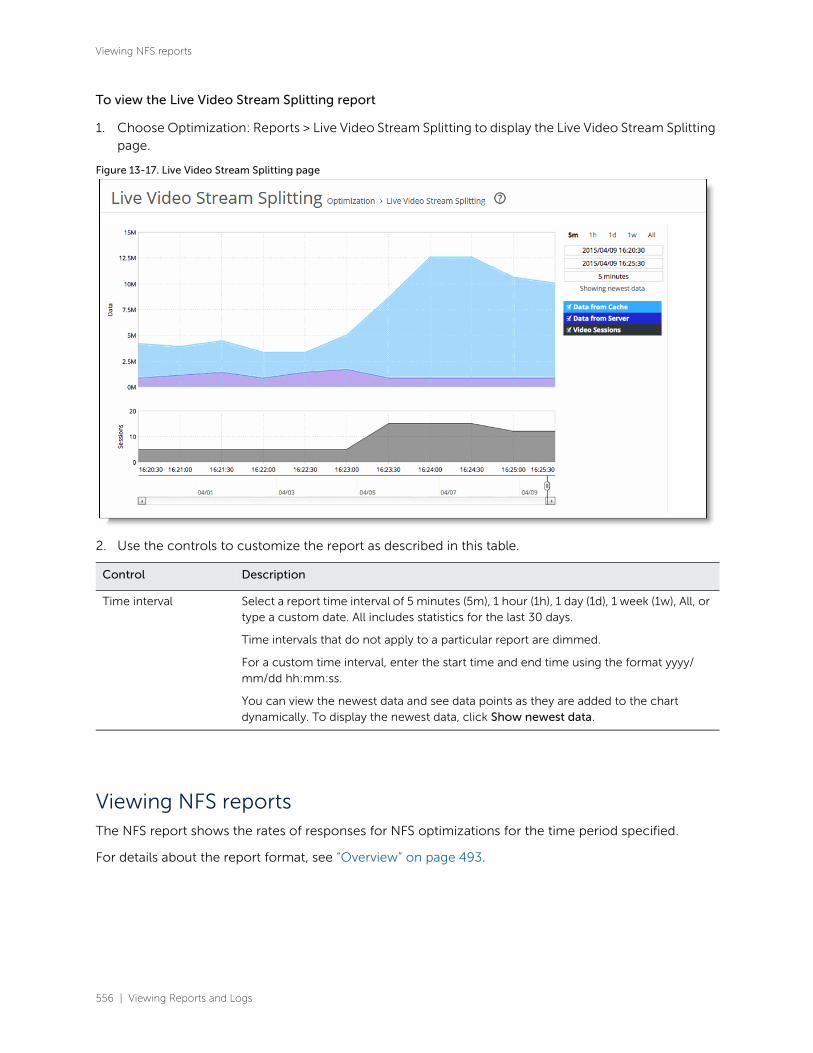
556 | Viewing Reports and Logs
Viewing NFS reports
To view the Live Video Stream Splitting report
1. Choose Optimization: Reports > Live Video Stream Splitting to display the Live Video Stream Splitting page.
Figure 13-17. Live Video Stream Splitting page
2. Use the controls to customize the report as described in this table.
Viewing NFS reportsThe NFS report shows the rates of responses for NFS optimizations for the time period specified.
For details about the report format, see “Overview” on page 493.
Control Description
Time interval
Select a report time interval of 5 minutes (5m), 1 hour (1h), 1 day (1d), 1 week (1w), All, or type a custom date. All includes statistics for the last 30 days.
Time intervals that do not apply to a particular report are dimmed.
For a custom time interval, enter the start time and end time using the format yyyy/mm/dd hh:mm:ss.
You can view the newest data and see data points as they are added to the chart dynamically. To display the newest data, click Show newest data.
Viewing Reports and Logs | 557
Viewing NFS reports
The NFS report contains these statistics that summarize NFS activity.
What this report tells you
The NFS report answers these questions:
• How many NFS calls were answered locally and remotely?
• How many delayed responses occurred for NFS activity?
About report graphs
Mouse over a specific data point to see what the y values and exact time stamp were in relation to peaks.
About report data
The Riverbed system reports on performance for periods up to one month. Due to performance and disk
space considerations, the display granularity decreases with time passed since the data was sampled.
The data is collected at a 5-minute granularity for the entire month.
Data series Description
Local Response Rate Displays the number of NFS calls that were responded to locally.
Remote Response Rate Displays the number of NFS calls that were responded to remotely (that is, calls that traversed the WAN to the NFS server).
Delayed Response Rate Displays the delayed calls that were responded to locally but not immediately (for example, reads that were delayed while a read ahead was occurring and that were responded to from the data in the read ahead).

558 | Viewing Reports and Logs
Viewing SRDF reports
To view the NFS report
1. Choose Reports > Optimization: NFS to display the NFS page.
Figure 13-18. NFS page
2. Use the controls to customize the report as described in this table.
Viewing SRDF reportsThe SRDF report presents information regarding optimized throughput and data reduction for EMC's
Symmetrix Remote Data Facility (SRDF) protocol. You can view a summary of performance statistics for
all optimized SRDF traffic, as well as drill into metrics for all remote data facility (RDF) groups for a specific
EMC Symmetrix array or an individual RDF group within an array.
Control Description
Time interval Select a report time interval of 5 minutes (5m), 1 hour (1h), 1 day (1d), 1 week (1w), All, or type a custom date. All includes statistics for the last 30 days.
Time intervals that don’t apply to a particular report are dimmed.
For a custom time interval, enter the start time and end time using the format yyyy/mm/dd hh:mm:ss.
You can view the newest data and see data points as they’re added to the chart dynamically. To display the newest data, click Show newest data.

Viewing Reports and Logs | 559
Viewing SRDF reports
For details about the report format, see “Overview” on page 493.
Note: You can also check the total optimized SRDF traffic throughput by viewing the Reports > Optimization:
Optimized Throughput report.
SRDF reports contain this information:
When the report display includes all Symmetrix RDF groups or a single RDF group for a single Symmetrix
ID, the navigator shadows the LAN/WAN throughput series. When the report display includes all RDF
groups for a single Symmetrix ID, the navigator shadows the group 1 LAN/WAN throughput series.
What this report tells you
The SRDF report answers these questions:
• How much total SRDF traffic is the appliance processing over time?
• How much data reduction is being delivered overall?
• How much data reduction is being delivered for individual RDF groups?
• Which Symmetrix array is generating the most SRDF traffic?
• How are SRDF traffic patterns changing over time?
About report graphs
Mouse over a specific data point to see what the y values and exact time stamp were in relation to peaks.
About report data
The Riverbed system reports for periods up to one month. Due to performance and disk space
considerations, data representation in reports for periods longer than the latest five minutes are
interpolated between data points obtained by aggregating multiple 10-second samples. The display
granularity decreases with time passed since data was sampled. The data is collected at a 5-minute
granularity for the entire month.
Data series Description
Data Reduction Specifies the percentage of total decrease in overall data transmitted (when viewing all Symmetrix RDF groups).
WAN/LAN Throughput Specifies the total throughput transmitted over the WAN and LAN.
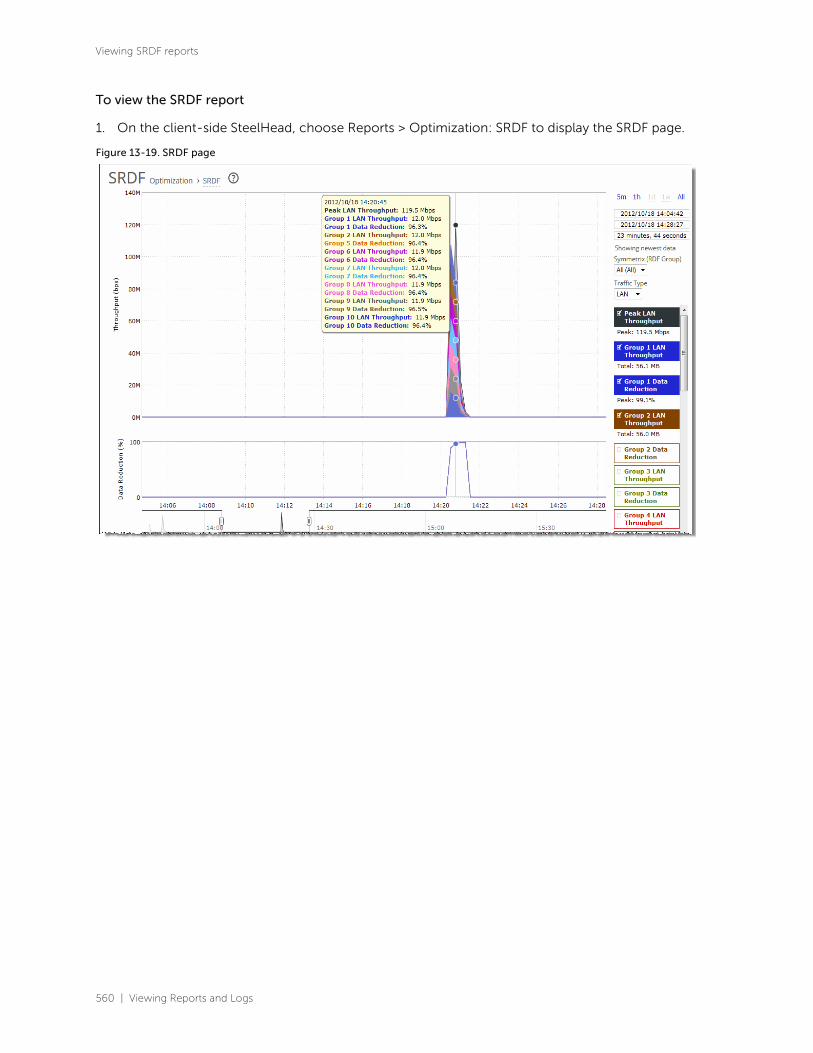
560 | Viewing Reports and Logs
Viewing SRDF reports
To view the SRDF report
1. On the client-side SteelHead, choose Reports > Optimization: SRDF to display the SRDF page.
Figure 13-19. SRDF page
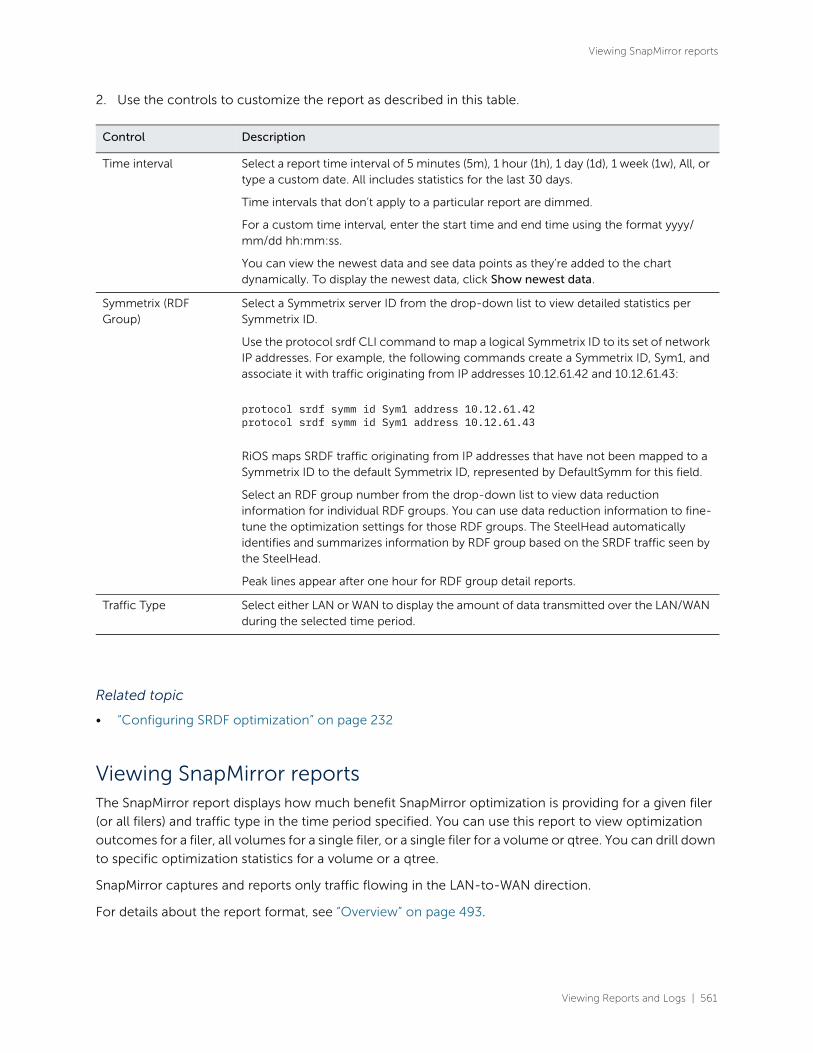
Viewing Reports and Logs | 561
Viewing SnapMirror reports
2. Use the controls to customize the report as described in this table.
Related topic
• “Configuring SRDF optimization” on page 232
Viewing SnapMirror reportsThe SnapMirror report displays how much benefit SnapMirror optimization is providing for a given filer
(or all filers) and traffic type in the time period specified. You can use this report to view optimization
outcomes for a filer, all volumes for a single filer, or a single filer for a volume or qtree. You can drill down
to specific optimization statistics for a volume or a qtree.
SnapMirror captures and reports only traffic flowing in the LAN-to-WAN direction.
For details about the report format, see “Overview” on page 493.
Control Description
Time interval
Select a report time interval of 5 minutes (5m), 1 hour (1h), 1 day (1d), 1 week (1w), All, or type a custom date. All includes statistics for the last 30 days.
Time intervals that don’t apply to a particular report are dimmed.
For a custom time interval, enter the start time and end time using the format yyyy/mm/dd hh:mm:ss.
You can view the newest data and see data points as they’re added to the chart dynamically. To display the newest data, click Show newest data.
Symmetrix (RDF Group)
Select a Symmetrix server ID from the drop-down list to view detailed statistics per Symmetrix ID.
Use the protocol srdf CLI command to map a logical Symmetrix ID to its set of network IP addresses. For example, the following commands create a Symmetrix ID, Sym1, and associate it with traffic originating from IP addresses 10.12.61.42 and 10.12.61.43:
protocol srdf symm id Sym1 address 10.12.61.42protocol srdf symm id Sym1 address 10.12.61.43
RiOS maps SRDF traffic originating from IP addresses that have not been mapped to a Symmetrix ID to the default Symmetrix ID, represented by DefaultSymm for this field.
Select an RDF group number from the drop-down list to view data reduction information for individual RDF groups. You can use data reduction information to fine-tune the optimization settings for those RDF groups. The SteelHead automatically identifies and summarizes information by RDF group based on the SRDF traffic seen by the SteelHead.
Peak lines appear after one hour for RDF group detail reports.
Traffic Type Select either LAN or WAN to display the amount of data transmitted over the LAN/WAN during the selected time period.

562 | Viewing Reports and Logs
Viewing SnapMirror reports
SnapMirror reports contain this information:
The navigator shadows the Throughput series.
What this report tells you
The SnapMirror report answers this question:
• How much total SnapMirror traffic is the appliance processing over time?
About report graphs
Mouse over a specific data point to see what the y values and exact time stamp were in relation to peaks.
About report data
The Riverbed system reports for periods up to one month. Due to performance and disk space
considerations, data representation in reports for periods longer than the latest five minutes are
interpolated between data points obtained by aggregating multiple 10-second samples. The display
granularity decreases with time passed since data was sampled. The data is collected at a 5-minute
granularity for the entire month.
Data series Description
Peak LAN/WAN Throughput Displays the peak LAN/WAN data activity. The system stores peak statistics as bytes transferred over the LAN, but calculates the normal throughput using a granularity of 10 seconds.
Average LAN/WAN Throughput Displays the average LAN/WAN data activity. The system stores non-peak statistics as the number of bytes transferred over the LAN/WAN, and calculates the throughput by converting bytes to bits and then dividing the result by the granularity.
For instance, if the system reports 100 bytes for a data point with a 10-second granularity, RiOS calculates:
100 bytes * 8 bits/byte / 10 seconds = 80 bps
This calculation means that 80 bps was the average throughput over that 10-second period.
The total throughput shows the data amount transferred during the displayed time interval.
Data Reduction Specifies the percentage of total decrease in overall data transmitted (when viewing all SnapMirror filers). The system calculates data reduction as (total LAN data - total WAN data) / total LAN data.
You can use data reduction information to fine-tune the optimization settings for a filer, a filer and a volume, or a filer, volume, and qtree.
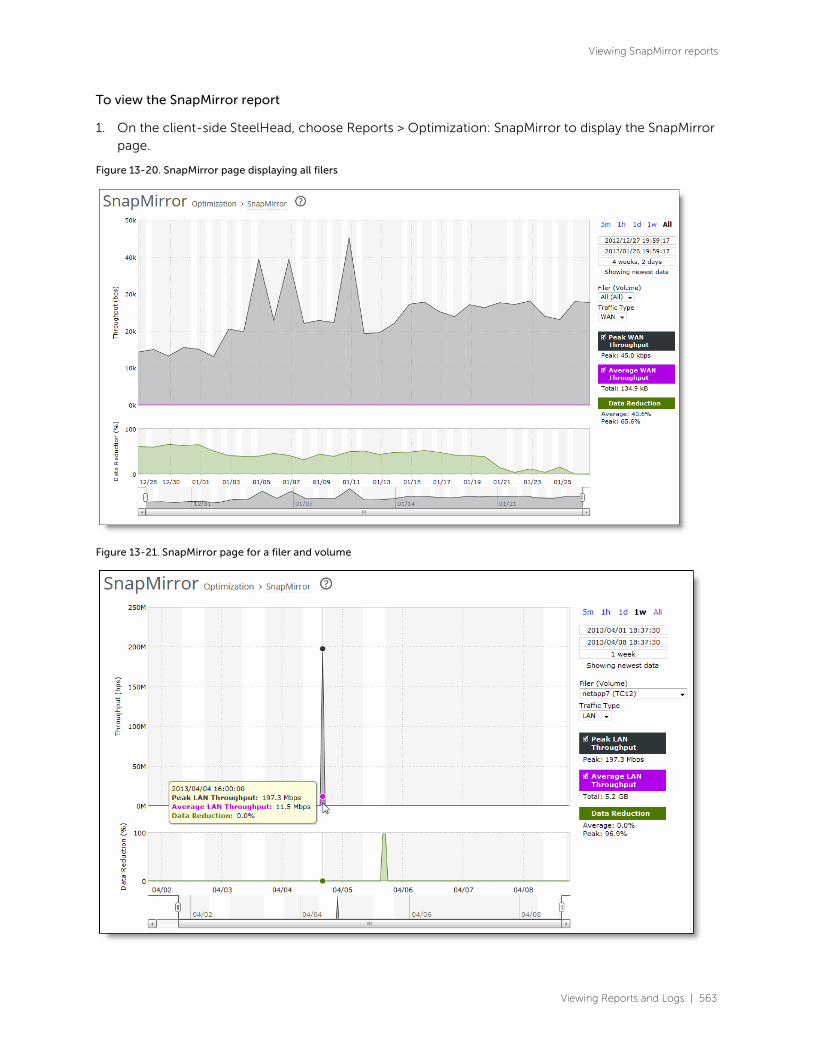
Viewing Reports and Logs | 563
Viewing SnapMirror reports
To view the SnapMirror report
1. On the client-side SteelHead, choose Reports > Optimization: SnapMirror to display the SnapMirror page.
Figure 13-20. SnapMirror page displaying all filers
Figure 13-21. SnapMirror page for a filer and volume
564 | Viewing Reports and Logs
Viewing SSL reports
2. Use the controls to customize the report as described in this table.
When viewing all volumes for a single filer, the report stacks the throughput averages because the sum
(total throughput of all volumes) is meaningful. It does not stack the total peak. When there are more
volumes than colors, the report reuses the colors, starting again from the beginning of the list.
Related topic
• “Configuring SnapMirror optimization” on page 238
Viewing SSL reportsThe SSL report displays the SSL requested and established connection rate for the time period specified.
For details about the report format, see “Overview” on page 493.
SSL reports contain this information.
The navigator shadows the requested connection rate series.
Control Description
Time interval Select a report time interval of 5 minutes (5m), 1 hour (1h), 1 day (1d), 1 week (1w), All, or type a custom date. All includes statistics for the last 30 days.
Time intervals that don’t apply to a particular report are dimmed.
For a custom time interval, enter the start time and end time using the format yyyy/mm/dd hh:mm:ss
You can view the newest data and see data points as they’re added to the chart dynamically. To display the newest data, click Show newest data.
Filer (Volume) Select a filer, a filer and a volume, or a filer, volume, and qtree to view detailed statistics on that filer, along with volume and qtree information when applicable. Select all to view statistics on all filers.
The Edge automatically identifies and summarizes information by filer, volume, and qtrees based on the SnapMirror traffic seen by the Edge.
Peak lines appear after one hour for filer detail reports.
Traffic Type Select either LAN or WAN to display the amount of data transmitted over the LAN/WAN during the selected time period.
Data series Description
Requested Connection Rate
Displays the rate of requested SSL connections.
Established Connection Rate
Displays the rate established SSL connections.

Viewing Reports and Logs | 565
Viewing SSL reports
What this report tells you
The SSL report answers these questions:
• What is the rate of established SSL connections?
• What is the rate of connection requested SSL connections?
About report graphs
Mouse over a specific data point to see what the y values and exact time stamp were in relation to peaks.
About report data
The Riverbed system reports on performance for periods up to one month. Due to performance and disk
space considerations, the display granularity decreases with time passed since the data was sampled.
The data is collected at a 5-minute granularity for the entire month.

566 | Viewing Reports and Logs
Viewing SharePoint reports
To view the SSL report
1. Choose Reports > Optimization: SSL to display the SSL page.
Figure 13-22. SSL page
Use the controls to customize the report as described in this table.
Viewing SharePoint reportsThe SharePoint report displays the FPSE and WebDAV performance improvements for the time period
specified.
Before you can view these statistics, on the client-side appliance, choose Optimization > Protocols:
HTTP, select Enable Per-Host Auto Configuration, select FPSE and WebDAV and click Apply.
Control Description
Time interval
Select a report time interval of 5 minutes (5m), 1 hour (1h), 1 day (1d), 1 week (1w), All, or type a custom date. All includes statistics for the last 30 days.
Time intervals that don’t apply to a particular report are dimmed.
For a custom time interval, enter the start time and end time using the format yyyy/mm/dd hh:mm:ss
You can view the newest data and see data points as they’re added to the chart dynamically. To display the newest data, click Show newest data.
Viewing Reports and Logs | 567
Viewing SharePoint reports
For details about the report format, see “Overview” on page 493.
SharePoint reports contain this information.
The navigator shadows the request rate series.
What this report tells you
The SharePoint report answers this question:
• How many FPSE and WebDAV responses were served locally?
About report graphs
Mouse over a specific data point to see what the y values and exact time stamp were in relation to peaks.
About report data
The Riverbed system reports on performance for periods up to one month. Due to performance and disk
space considerations, the display granularity decreases with time passed since the data was sampled.
The data is collected at a 5-minute granularity for the entire month.
Data series Description
Request Rate Select to display the total number of FPSE and WebDAV requests per second.
FPSE Metadata Cache Hits
Select to display the Microsoft Front Page Server Extensions (FPSE) metadata cache hits per second. Shows how many FPSE requests were served locally, resulting in performance improvements. SSL connections and files smaller than 5 MB can experience significant performance improvements.
Microsoft Office 2007/2010/2013 clients use FPSE when communicating with SharePoint 2007/2010 servers.
WebDAV Metadata Cache Hits
Select to display the Microsoft Web Distributed Authoring and Versioning (WebDAV) metadata cache hits per second. RiOS predicts and prefetches WebDAV responses, which saves multiple round-trips and makes browsing the SharePoint file repository more responsive.
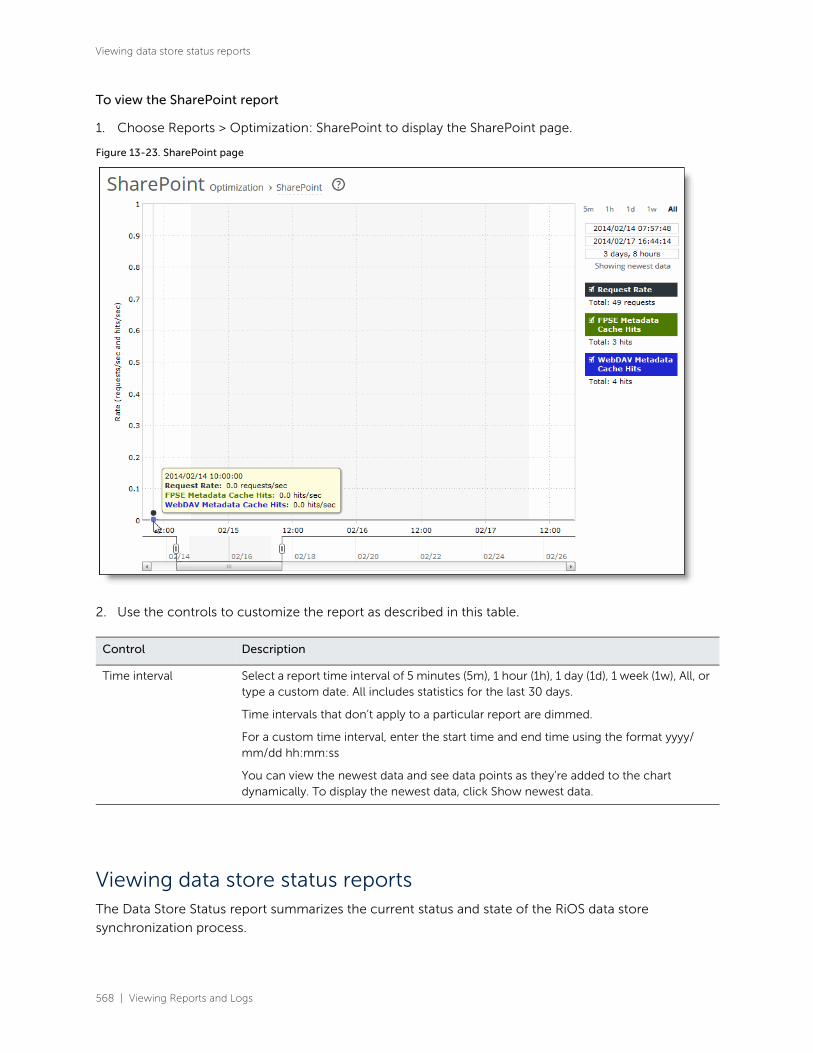
568 | Viewing Reports and Logs
Viewing data store status reports
To view the SharePoint report
1. Choose Reports > Optimization: SharePoint to display the SharePoint page.
Figure 13-23. SharePoint page
2. Use the controls to customize the report as described in this table.
Viewing data store status reportsThe Data Store Status report summarizes the current status and state of the RiOS data store
synchronization process.
Control Description
Time interval
Select a report time interval of 5 minutes (5m), 1 hour (1h), 1 day (1d), 1 week (1w), All, or type a custom date. All includes statistics for the last 30 days.
Time intervals that don’t apply to a particular report are dimmed.
For a custom time interval, enter the start time and end time using the format yyyy/mm/dd hh:mm:ss
You can view the newest data and see data points as they’re added to the chart dynamically. To display the newest data, click Show newest data.

Viewing Reports and Logs | 569
Viewing data store status reports
If you have enabled data store synchronization, this report summarizes the state of the replication
process. For details, see “Synchronizing peer RiOS data stores” on page 127.
The Data Store Status report contains these statistics that summarize data store activity.
What this report tells you
The Data Store Status report answers these questions:
• Is the synchronization connection active?
• Is the appliance in the catch-up or keep-up phase of RiOS data store synchronization?
• What percentage of the RiOS data store is unused?
To view the Data Store Status report
1. Choose Reports > Optimization: Data Store Status to display the Data Store Status page.
Figure 13-24. Data Store Status page
Data Description
Synchronization Connection Indicates the status of the connection between the synchronized appliances.
Synchronization Catch-Up Indicates the status of transferring data between the synchronized appliances. Catch-Up is used for synchronizing data that was not synchronized during the Keep-Up phase.
Synchronization Keep-Up Indicates the status of transferring new incoming data between the synchronized appliances.
Data Store Percentage Used (Since Last Clear)
Displays the percentage of the RiOS data store that is used.
570 | Viewing Reports and Logs
Viewing data store SDR-adaptive reports
2. Use the controls to customize the report as described in this table.
To print the report, choose File > Print in your web browser to open the Print dialog box.
Viewing data store SDR-adaptive reportsThe Data Store SDR-Adaptive report summarizes:
• how much adaptive compression is occurring in the RiOS data store using legacy mode. The report combines the percentages due to both local and remote adaptive compression (as signaled by the peers).
• the percentage of the traffic, in bytes, that is adapted to in-memory-only (or transient), compared to the total SDR traffic (SDR-adaptive mode).
For details about the report format, see “Overview” on page 493.
The report contains these statistics that summarize RiOS data store adaptive compression activity,
shown as a percent of total SDR data.
Note: You must enable the SDR-Adaptive setting before creating this report. For details, see “Setting an adaptive
streamlining mode” on page 132.
The navigator shadows the compression-only due to disk/CPU pressure series.
What this report tells you
The Data Store SDR-Adaptive report answers this question:
• What is the relative adaptive compression when SDR-Adaptive is enabled at various times of the day?
Control Description
Refresh Select a refresh rate from the drop-down list:
• To refresh the report every 10 seconds, select 10 seconds.
• To refresh the report every 30 seconds, select 30 seconds.
• To refresh the report every 60 seconds, select 60 seconds.
• To disable refresh, click Off.
Go Displays the report.
Data series Description
Compression-Only Due To Disk/CPU Pressure Displays the adaptive compression occurring due to disk/CPU pressure.
Compression-Only Due To In-Path Rule Displays the adaptive compression occurring due to the in-path rule.
In-Memory SDR Due To Disk/CPU Pressure Displays the in-memory SDR due to disk/CPU pressure.
In-Memory SDR Due To In-Path Rule Displays the maximum in-memory SDR due to the in-path rule.
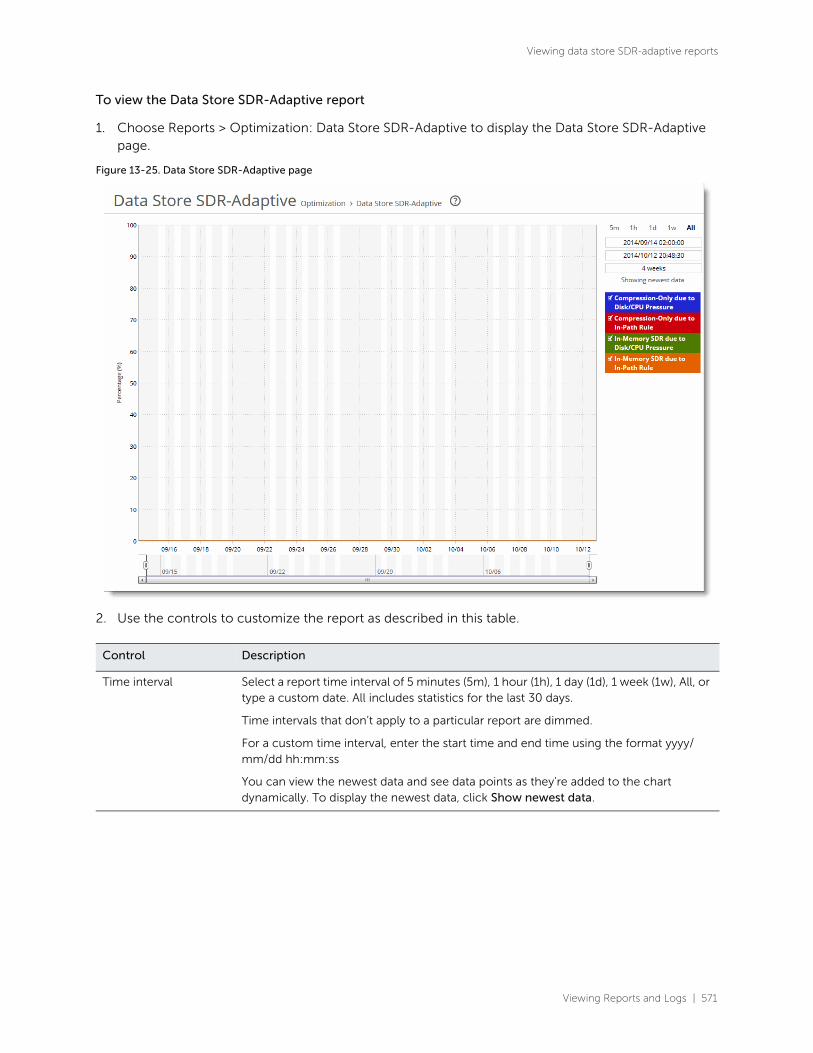
Viewing Reports and Logs | 571
Viewing data store SDR-adaptive reports
To view the Data Store SDR-Adaptive report
1. Choose Reports > Optimization: Data Store SDR-Adaptive to display the Data Store SDR-Adaptive page.
Figure 13-25. Data Store SDR-Adaptive page
2. Use the controls to customize the report as described in this table.
Control Description
Time interval
Select a report time interval of 5 minutes (5m), 1 hour (1h), 1 day (1d), 1 week (1w), All, or type a custom date. All includes statistics for the last 30 days.
Time intervals that don’t apply to a particular report are dimmed.
For a custom time interval, enter the start time and end time using the format yyyy/mm/dd hh:mm:ss
You can view the newest data and see data points as they’re added to the chart dynamically. To display the newest data, click Show newest data.

572 | Viewing Reports and Logs
Viewing data store disk load reports
Viewing data store disk load reportsThe Data Store Disk Load report summarizes the RiOS data store disk load due to SDR only as related to
the benchmarked capacity of the RiOS data store. Consider any value under 90 as healthy. Any value
higher than a sustained load over 90 is considered high and might indicate disk pressure. A red line with
shading appears at the top of the report to indicate the threshold of 90 and above. When a value is
consistently higher than 90, contact Riverbed Support for guidance on reconfiguring the RiOS data store
to alleviate disk pressure.
For details about the report format, see “Overview” on page 493.
The report contains this statistic that summarizes the RiOS data store disk load.
What this report tells you
The Data Store Disk Load report answers these questions:
• Is there any indication of disk pressure?
• What is the disk load at different times of the day?
To view the Data Store Disk Load report
1. Choose Reports > Optimization: Data Store Disk Load to display the Data Store Disk Load page.
Figure 13-26. Data Store Disk Load page
Viewing Reports and Logs | 573
Viewing DNS cache hit reports
2. Use the controls to customize the report as described in this table.
Viewing DNS cache hit reportsThe DNS Cache Hits report displays the rate of DNS cache hits and misses for the time period specified.
For details about the report format, see “Overview” on page 493.
It contains these statistics that summarize DNS activity.
The navigator shadows the hit rate series.
What this report tells you
The DNS Cache Hits report answers these questions:
• What was the rate of DNS requests that were cached?
• What was the rate of DNS requests that were not cached?
About report graphs
Mouse over a specific data point to see what the y values and exact time stamp were in relation to peaks.
About report data
The Riverbed system reports on performance for periods up to one month. Due to performance and disk
space considerations, the display granularity decreases with time passed since the data was sampled.
The data is collected at a 5-minute granularity for the entire month.
Control Description
Time Interval Select a report time interval of 5 minutes (5m), 1 hour (1h), 1 day (1d), 1 week (1w), All, or type a custom date. All includes statistics for the last 30 days.
Time intervals that don’t apply to a particular report are dimmed.
For a custom time interval, enter the start time and end time using the format yyyy/mm/dd hh:mm:ss
You can quickly see the newest data and see data points as they’re added to the chart dynamically. To display the newest data, click Show newest data.
Data series Description
Miss Rate Displays the rate of cache misses.
Hit Rate Displays the rate of cache hits.
574 | Viewing Reports and Logs
Viewing DNS cache utilization reports
To view the DNS Cache Hits report
1. Choose Reports > Branch Services: DNS Cache Hits to display the DNS Cache Hits page.
Figure 13-27. DNS Cache Hits page
2. Use the controls to customize the report as described in this table.
Viewing DNS cache utilization reports The DNS Cache Utilization report displays the size of the DNS cache as entries and bytes for the time
period specified.
For details about the report format, see “Overview” on page 493.
Control Description
Time interval Select a report time interval of 5 minutes (5m), 1 hour (1h), 1 day (1d), 1 week (1w), All, or type a custom date. All includes statistics for the last 30 days.
Time intervals that don’t apply to a particular report are dimmed.
For a custom time interval, enter the start time and end time using the format yyyy/mm/dd hh:mm:ss.
You can quickly see the newest data and see data points as they’re added to the chart dynamically. To display the newest data, click Show newest data.
Viewing Reports and Logs | 575
Viewing DNS cache utilization reports
The DNS Cache Utilization report contains these statistics that summarize DNS cache activity.
The navigator shadows the cache entries series.
What this report tells you
The DNS Cache Utilization report answers these questions:
• How much cache memory is used?
• How many DNS entries are in the cache?
About report graphs
Mouse over a specific data point to see what the y values and exact time stamp were in relation to peaks.
About report data
The Riverbed system reports on performance for periods up to one month. Due to performance and disk
space considerations, the display granularity decreases with time passed since the data was sampled.
The data is collected at a 5-minute granularity for the entire month.
Data series Description
Cache Entries Displays the number of DNS entries in the cache.
Memory Use Displays the cache memory used, in bytes.

576 | Viewing Reports and Logs
Viewing DNS cache utilization reports
To view the DNS Cache Utilization report
1. Choose Reports > Branch Services: DNS Cache Utilization to display the DNS Cache Utilization page.
Figure 13-28. DNS Cache Utilization page
2. Use the controls to customize the report as described in this table.
Control Description
Time Interval Select a report time interval of 5 minutes (5m), 1 hour (1h), 1 day (1d), 1 week (1w), All, or type a custom date. All includes statistics for the last 30 days.
Time intervals that don’t apply to a particular report are dimmed.
For a custom time interval, enter the start time and end time using the format yyyy/mm/dd hh:mm:ss
You can quickly see the newest data and see data points as they’re added to the chart dynamically. To display the newest data, click Show newest data.

Viewing Reports and Logs | 577
Viewing NFS export I/O reports
Viewing NFS export I/O reportsThe Export I/O report summarizes the standard I/O data traffic read from and written to the selected NFS
export for the specified period of time. Each Edge requires a dedicated NFS export in the data center
storage configuration. The Export report contains this table of statistics that summarize Export I/O
activity.
What this report tells you
The Export I/O report answers these questions:
• How many mebibytes (MiB) have been written to and read from the selected NFS export for the specified period?
• How many operations have been written to and read from the selected NFS export for the specified period?
• What are the average read and write latencies for the selected NFS export for the specified period?
About report data
The Riverbed system reports on performance for periods up to one month. Due to performance and disk
space considerations, the display granularity decreases with time passed since the data was sampled.
Data series Description
Read Throughput Displays the total data read latency from the Core-side NFS export(s).
Write Throughput Displays the total data write latency to the Core-side NFS export(s).
578 | Viewing Reports and Logs
Viewing NFS export I/O reports
To view the Export I/O report
1. Choose Storage > Reports: Export I/O to display the Export I/O page.
Figure 13-29. Export I/O page
2. Use the controls to customize the report as described in this table.
Control Description
Time Interval Select a report time interval of 5 minutes (5m), 1 hour (1h), 1 day (1d), 1 week (1w), All, or type a custom date. All includes statistics for the last 30 days.
Time intervals that do not apply to a particular report are dimmed and unavailable.
For a custom time interval, enter the start time and end time using the format yyyy/mm/dd hh:mm:ss.
Because the system aggregates data on the hour, request hourly time intervals. For example, setting a time interval to 08:30:00 to 09:30:00 from two days ago does not create a data display, whereas setting a time interval to 08:00:00 to 09:00:00 from two days ago will display data.
When you request a custom time interval to view data beyond the aggregated granularity, the data is not visible because the system is no longer storing the data. For example, the following custom time intervals do not return data because the system automatically aggregates data older than seven days into two-hour data points:
• Setting a one-hour time period that occurred two weeks ago.
• Setting a 75-minute time period that occurred more than one week ago.
You can quickly see the newest data and see data points as they are added to the chart dynamically. To display the newest data, click Show newest data.

Viewing Reports and Logs | 579
Viewing SteelFusion Core I/O reports
About report graphs
Mouse over a specific data point to see what the y values and exact time stamp were in relation to peaks.
Viewing SteelFusion Core I/O reportsThe SteelFusion Core I/O report summarizes the standard I/O data traffic read and write throughput for
a SteelFusion Edge appliance during the specified period of time.
What this report tells you
The SteelFusion Core I/O report answers this question:
• What amount of storage I/O went over the network for this SteelFusion Edge?
About report data
The Riverbed system reports on performance for periods up to one month. Due to performance and disk
space considerations, the display granularity decreases with time passed since the data was sampled.
About report graphs
Mouse over a specific data point to see what the y values and exact time stamp were in relation to peaks.
Export Select the export whose statistics you want to see from the drop-down list or select All to view all exports.
Report Select I/O, I/O Operations Per Second, or I/O latency from the drop-down list.
Control Description

580 | Viewing Reports and Logs
Viewing SteelFusion Core I/O reports
To view the SteelFusion Core I/O report
1. Choose Storage > Reports: SteelFusion Core I/O to display the SteelFusion Core I/O page.
Figure 13-30. SteelFusion Core I/O page
2. Use the controls to customize the report as described in this table.
Control Description
Time Interval Select a report time interval of 5 minutes (5m), 1 hour (1h), 1 day (1d), 1 week (1w), All, or type a custom date. All includes statistics for the last 30 days.
Time intervals that do not apply to a particular report are dimmed and unavailable.
For a custom time interval, enter the start time and end time using the format yyyy/mm/dd hh:mm:ss.
Because the system aggregates data on the hour, request hourly time intervals. For example, setting a time interval to 08:30:00 to 09:30:00 from two days ago does not create a data display, whereas setting a time interval to 08:00:00 to 09:00:00 from two days ago will display data.
When you request a custom time interval to view data beyond the aggregated granularity, the data is not visible because the system is no longer storing the data. For example, the following custom time intervals do not return data because the system automatically aggregates data older than seven days into two-hour data points:
• Setting a one-hour time period that occurred two weeks ago.
• Setting a 75-minute time period that occurred more than one week ago.
You can quickly see the newest data and see data points as they are added to the chart dynamically. To display the newest data, click Show newest data.

Viewing Reports and Logs | 581
Viewing blockstore metrics reports
Viewing blockstore metrics reportsThe SteelFusion blockstore is a feature of the SteelFusion Edge device installed at the branch-end of the
WAN connection (typically included inside a SteelFusion Core at the branch site). The blockstore is an
on-disk local cache that mirrors the complete persistent storage on the Core-side NFS exports. The
blockstore manages the block pages in the system. It reads block pages as needed, and writes block
pages as they are scheduled to flush back through the SteelFusion Core.
The blockstore metrics report provides information on how well the SteelFusion Edge keeps up with the
SteelFusion Core blockstore transfers, both in terms of time as well as the amount of uncommitted
bytes. blockstore metrics appear only on a SteelFusion Edge appliance.
What this report tells you
The Blockstore Metrics report answers these questions:
• How many read hits and misses were recorded for the blockstore for the selected NFS exports for the specified period?
• How many uncommitted bytes were recorded for the blockstore for the selected NFS exports for the specified period?
• How far behind is the storage in the data center compared to the Edge?
About report data
The Riverbed system reports on performance for periods up to one month. Due to performance and disk
space considerations, the display granularity decreases with time passed since the data was sampled.
About report graphs
Mouse over a specific data point to see what the y values and exact time stamp were in relation to peaks.

582 | Viewing Reports and Logs
Viewing blockstore metrics reports
To view the Blockstore Metrics report
1. Choose Storage > Reports: Blockstore Metrics to display the Blockstore Metrics page.
Figure 13-31. Blockstore Metrics page
2. Use the controls to customize the report as described in this table.
Control Description
Time Interval Select a report time interval of 5 minutes (5m), 1 hour (1h), 1 day (1d), 1 week (1w), All, or type a custom date. All includes statistics for the last 30 days.
Time intervals that do not apply to a particular report are dimmed and unavailable.
For a custom time interval, enter the start time and end time using the format yyyy/mm/dd hh:mm:ss.
Because the system aggregates data on the hour, request hourly time intervals. For example, setting a time interval to 08:30:00 to 09:30:00 from two days ago does not create a data display, whereas setting a time interval to 08:00:00 to 09:00:00 from two days ago will display data.
When you request a custom time interval to view data beyond the aggregated granularity, the data is not visible because the system is no longer storing the data. For example, the following custom time intervals do not return data because the system automatically aggregates data older than seven days into two-hour data points:
• Setting a one-hour time period that occurred 2 weeks ago.
• Setting a 75-minute time period that occurred more than one week ago.

Viewing Reports and Logs | 583
Viewing blockstore SSD read cache reports
Viewing blockstore SSD read cache reportsThe SteelFusion blockstore is a feature of the SteelFusion Edge device installed at the branch-end of the
WAN connection (typically included inside a SteelFusion Core at the branch site). The blockstore is an
on-disk local cache that mirrors the complete persistent storage on the Core-side NFS exports. The
blockstore manages the block pages in the system. It reads block pages as needed, and writes block
pages as they are scheduled to flush back through the SteelFusion Core.
The blockstore metrics report provides information on how well the SteelFusion Edge keeps up with the
SteelFusion Core blockstore transfers, both in terms of time as well as the amount of uncommitted
bytes. blockstore metrics appear only on a SteelFusion Edge appliance.
Note: The read cache and Blockstore SSD Read Cache report is only available on SteelFusion Edge 3100 and higher.
What this report tells you
The Blockstore SSD Read Cache report answers these questions:
• How many read hits and misses were recorded for the blockstore for the selected NFS export for the specified period?
Export Select the NFS exports whose statistics you want to see from the drop-down list or select All to view all NFS exports.
Blockstore Report Select one of these data series from the drop-down list:
• Read Hit/Miss - Select to view the total data read hits and average miss rate between the blockstore and the Core-side NFS export(s). If no I/O occurs during a time period, the report does not include the idle time when calculating the hit rate.
• Uncommitted Data - Select to view the amount of data committed, data written, and data uncommitted between the local Edge blockstore and the Core-side NFS export(s).
Data committed is new data written to Edge and then written through Core to the back-end SAN array. The system commits all writes to Core in the order they were received.
Data written is new data written to the Edge blockstore.
Uncommitted data is new data written to Edge but not written through Core to the backend storage array.
Because each Edge is linked to a dedicated NFS export at the data center, the blockstore is authoritative for both reads and writes, and can tolerate WAN outages without worrying about cache coherency.
• Commit Throughput - Select to view the amount of data throughput between the blockstore and the Core-side NFS export(s).
• Commit Delay - Select to view the average time delay between a request to commit data to the blockstore and the time the data is actually committed. For example, if the Commit Delay value is 1d 3h, and the Edge at the branch office is down, any data written at the Edge in the last 1d 3h will be lost.
Control Description

584 | Viewing Reports and Logs
Viewing blockstore SSD read cache reports
• What is the hit ratio percentage for the selected NFS export for the specified period?
About report data
The Riverbed system reports on performance for periods up to one month. Due to performance and disk
space considerations, the display granularity decreases with time passed since the data was sampled.
About report graphs
Mouse over a specific data point to see what the y values and exact time stamp were in relation to peaks.
To view the Blockstore SSD Read Cache report
1. Choose Storage > Reports: Blockstore SSD Read Cache to display the Blockstore SSD Read Cache page.
Figure 13-32. Blockstore SSD Read Cache page

Viewing Reports and Logs | 585
Viewing blockstore SSD read cache reports
2. Use the controls to customize the report as described in this table.
Control Description
Time Interval Select a report time interval of 5 minutes (5m), 1 hour (1h), 1 day (1d), 1 week (1w), All, or type a custom date. All includes statistics for the last 30 days.
Time intervals that do not apply to a particular report are dimmed and unavailable.
For a custom time interval, enter the start time and end time using the format yyyy/mm/dd hh:mm:ss.
Because the system aggregates data on the hour, request hourly time intervals. For example, setting a time interval to 08:30:00 to 09:30:00 from two days ago does not create a data display, whereas setting a time interval to 08:00:00 to 09:00:00 from two days ago will display data.
When you request a custom time interval to view data beyond the aggregated granularity, the data is not visible because the system is no longer storing the data. For example, the following custom time intervals do not return data because the system automatically aggregates data older than seven days into two-hour data points:
• Setting a one-hour time period that occurred two weeks ago.
• Setting a 75-minute time period that occurred more than one week ago.
Export Select the NFS export whose statistics you want to see from the drop-down list or select All to view all NFS exports.

586 | Viewing Reports and Logs
Viewing storage alarm reports
Viewing storage alarm reportsThe Storage Alarms report provides status for the appliance alarms relating to potential problems with

Viewing Reports and Logs | 587
Viewing storage alarm reports
the storage. It includes this alarm information:

588 | Viewing Reports and Logs
Viewing storage alarm reports
Alarm Appliance
state
Reason
Blockstore Degraded or Critical
Indicates that the system has encountered any of the following issues with the blockstore:
• Disk space Low - The blockstore is running out of space. Check your WAN connection as well as connectivity to the Core. This can also happen if clients write more data than can be sent over the WAN for a prolonged period of time.
• Disk space Full - The blockstore is out of space. Check your WAN connection as well as connectivity to the Core. This can also happen if clients write more data than can be sent over the WAN for a prolonged period of time or when the Core HA time does not match the Edge HA time. It is critical that the Core HA time is synchronized with the Edge HA time. We recommend using NTP time synchronization to synchronize the Core HA and the Edge HA. You must also verify that the time zone is correct.
• Memory Low - The blockstore is running out of memory. This indicates a temporary condition caused by too much IO. Limit the number of active prepopulation sessions. Check if IOPS is more than what is recommended for the appliance model.
• Read Error - The blockstore could not read data that was already replicated to the data center. Clients will not see any error because the Edge will fetch the data from the Core.
Check the system logs to determine the root cause. Replace any disks that have failed. The alarm clears when you restart the service.
• Read Cache Error - An appliance with read cache SSDs cannot start the read cache.
Replace any failed or missing SSDs, and restart the appliance. If no drives have failed or no drives are missing, check system logs for more detailed information, and contact Riverbed Support for assistance as needed.
• Critical Read Error - The blockstore could not read data that is not yet replicated to the Core. Check the system logs to determine the root cause. Replace any disks that have failed. The alarm clears when you restart the service.
• Startup Failed - The blockstore failed to start due to disk errors or an incorrect configuration. Check the system logs to determine the root cause.
• Startup Wrong Version - The Edge software version is incompatible with the blockstore version on disk. The alarm indicates that the software has been upgraded or downgraded with an incompatible version. Revert to the previous software version.
• Standby Wrong Version - The Edge software version running on the standby peer is incompatible with the version on the active peer appliance in a high-availability pair. The active peer has been upgraded or downgraded to an incompatible software version. This alarm typically triggers during the process of upgrading both Edges in a high-availability pair. When upgrading across versions with disk-format changes, this is a normal part of the upgrade process. To clear the alarm, update the software version running on the standby peer to match the software version running on the active peer.
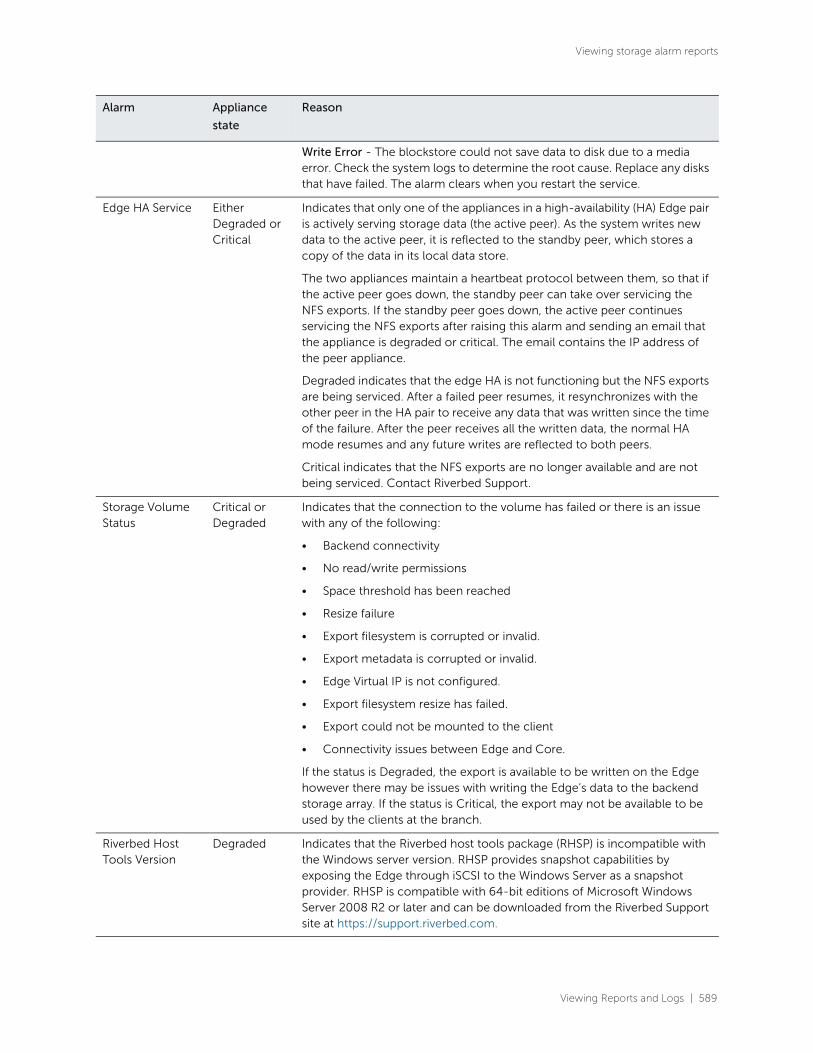
Viewing Reports and Logs | 589
Viewing storage alarm reports
Write Error - The blockstore could not save data to disk due to a media error. Check the system logs to determine the root cause. Replace any disks that have failed. The alarm clears when you restart the service.
Edge HA Service Either Degraded or Critical
Indicates that only one of the appliances in a high-availability (HA) Edge pair is actively serving storage data (the active peer). As the system writes new data to the active peer, it is reflected to the standby peer, which stores a copy of the data in its local data store.
The two appliances maintain a heartbeat protocol between them, so that if the active peer goes down, the standby peer can take over servicing the NFS exports. If the standby peer goes down, the active peer continues servicing the NFS exports after raising this alarm and sending an email that the appliance is degraded or critical. The email contains the IP address of the peer appliance.
Degraded indicates that the edge HA is not functioning but the NFS exports are being serviced. After a failed peer resumes, it resynchronizes with the other peer in the HA pair to receive any data that was written since the time of the failure. After the peer receives all the written data, the normal HA mode resumes and any future writes are reflected to both peers.
Critical indicates that the NFS exports are no longer available and are not being serviced. Contact Riverbed Support.
Storage Volume Status
Critical or Degraded
Indicates that the connection to the volume has failed or there is an issue with any of the following:
• Backend connectivity
• No read/write permissions
• Space threshold has been reached
• Resize failure
• Export filesystem is corrupted or invalid.
• Export metadata is corrupted or invalid.
• Edge Virtual IP is not configured.
• Export filesystem resize has failed.
• Export could not be mounted to the client
• Connectivity issues between Edge and Core.
If the status is Degraded, the export is available to be written on the Edge however there may be issues with writing the Edge’s data to the backend storage array. If the status is Critical, the export may not be available to be used by the clients at the branch.
Riverbed Host Tools Version
Degraded Indicates that the Riverbed host tools package (RHSP) is incompatible with the Windows server version. RHSP provides snapshot capabilities by exposing the Edge through iSCSI to the Windows Server as a snapshot provider. RHSP is compatible with 64-bit editions of Microsoft Windows Server 2008 R2 or later and can be downloaded from the Riverbed Support site at https://support.riverbed.com.
Alarm Appliance
state
Reason

590 | Viewing Reports and Logs
Viewing storage alarm reports
Snapshot Degraded A snapshot failed to be committed to the Core, or a snapshot has failed to complete at the Edge because the blockstore is full, needs credentials, or there is a misconfiguration at the Core.
Check the Core logs for details. Retry the Windows snapshot.
SteelFusion Core Degraded Indicates that the system has encountered any of the following issues with the SteelFusion Core:
• Unknown Edge - The Edge appliance has connected to a Core that does not recognize the appliance. Most likely the configuration present on the Core is missing an entry for the Edge. Check that the Edge is supplying the proper Edge ID. To find the Edge ID, choose Storage > Storage Edge Configuration on the Edge appliance. The edge identifier appears under SteelFusion Settings.
• SteelFusion Core Connectivity - The Edge does not have an active connection with the Core. Check the network between the Edge and the Core; recheck the Edge configuration on the Core.
• Inner Channel Down - The data channel between the Core and the Edge is down. The connection between the Core and the Edge has stalled. Check the network between the Edge and the Core.
• Keep-Alive Timeout - The connection between the Core and the Edge has stalled. Check the network between the Edge and the Core.
SteelFusion Edge Service
Needs Attention
Indicates that the Edge appliance connected to the Core is not servicing the Core. Check that Edge appliance is running.
Alarm Appliance
state
Reason

Viewing Reports and Logs | 591
Viewing storage alarm reports
What this report tells you
The Alarm Status report answers this question:
Uncommitted Edge Data
Degraded Indicates that a large amount of data in the blockstore needs to be committed to SteelFusion Core. The difference between the contents of the blockstore and the SteelFusion Core-side export is significant. This alarm checks for how much uncommitted data is in the Edge cache as a percentage of the total cache size.
This alarm triggers when the appliance writes a large amount of data very quickly, but the WAN pipe is not large enough to get the data back to the Core fast enough to keep the uncommitted data percentage below 5 percent. As long as data is being committed, the cache will flush eventually.
The threshold is 5 percent, which for a 4 TiB (1260-4) system is 200 GiB. To change the threshold, use this command:
[failover-peer] edge id <id> blockstore uncommitted [trigger-pct <percentage>] [repeat-pct <percentage>] [repeat-interval <minutes>]
For example:
Core3(config) # edge id Edge2 blockstore uncommitted trigger-pct 50 repeat-pct 25 repeat-interval 5
For details on the command, see the SteelFusion Command-Line Interface Reference Manual.
To check that data is being committed, go to Storage > Reports: Blockstore Metrics on the Edge.
Server Backup Indicates that one of the following backup failures have occurred:
• Failed connection to the server - The connection between the Edge and the ESXi server is down, the server is not running, or there are incorrect credentials for the ESXi or vCenter server login. To fix this issue, check if the server or vCenter is reachable from the Edge and vice-versa. Also ensure that the correct credentials are being used for the ESXi server or vCenter. This alarm is cleared when the connection is restored between the Edge and the ESXi server or vCenter.
• Backup failure on the Edge - A backup has failed on the Edge. The alarm displays a message with the affected server.
• NFS export is shared among multiple Windows servers - At least one export is shared among two or more Windows servers. To fix this issue, make sure that the export has access to only one host or IP address. The alarm is cleared when servers no longer share export(s) and the next protect operation succeeds.
• Server with a backup policy does not have an NFS export - A server with an associated backup policy does not have any VMs or exports to protect.
Alarm Appliance
state
Reason

592 | Viewing Reports and Logs
Viewing hypervisor interface reports
• What is the current status of the BlockStream and other storage components on the Edge?
To view the Storage Alarms report
• Choose Storage > Reports: Alarms to display the Storage Alarms page. Alternately, you can select the current system status that appears in the Alarms box on the Dashboard (Critical, Degraded, or Needs Attention) and then click the alarm notification to display the Storage Alarms page.
Figure 13-33. Storage Alarms page
To print the report, choose File > Print in your web browser to open the Print dialog box.
Viewing hypervisor interface reportsThe Interfaces report displays all hypervisor network interface cards (NICs) currently in use and their
information. The interface names that appear in this list are the names you specified in the Network
Configuration page of the Hypervisor Installer.
What this report tells you
The Interfaces report answers these questions:
• How many hypervisor NICs are in use?
• Which vSwitch is the NIC part of?
• What uplinks are associated with the MAC address?
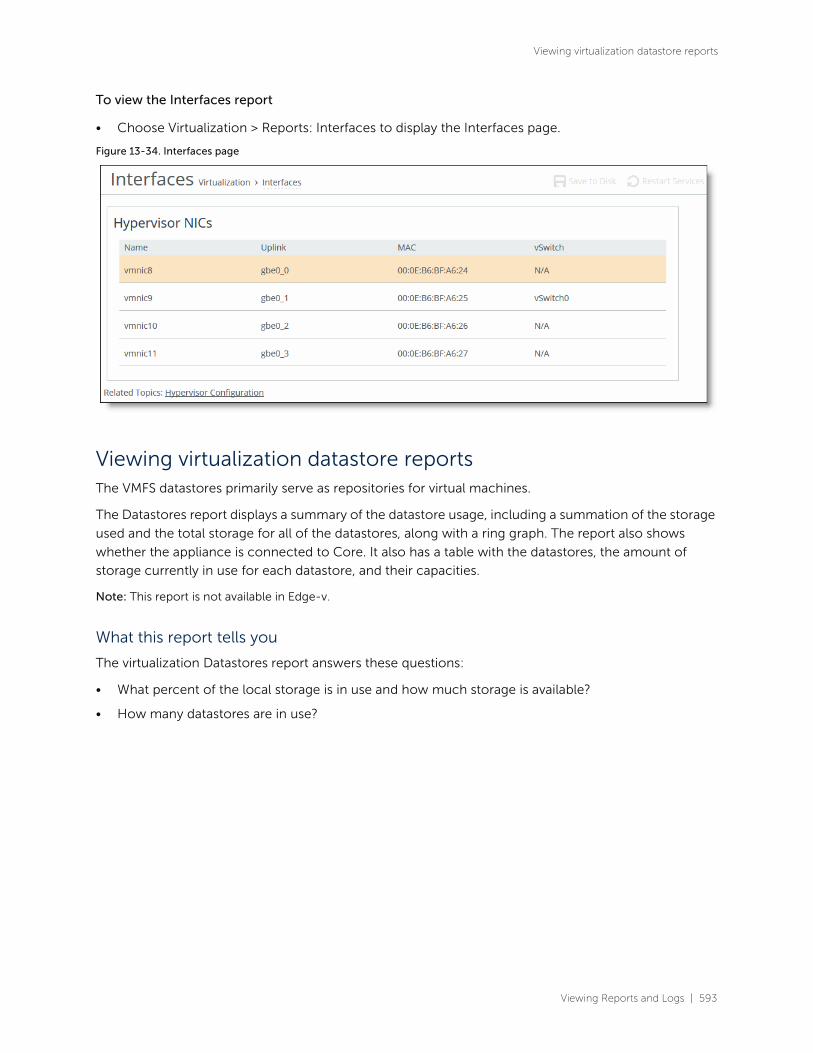
Viewing Reports and Logs | 593
Viewing virtualization datastore reports
To view the Interfaces report
• Choose Virtualization > Reports: Interfaces to display the Interfaces page.
Figure 13-34. Interfaces page
Viewing virtualization datastore reportsThe VMFS datastores primarily serve as repositories for virtual machines.
The Datastores report displays a summary of the datastore usage, including a summation of the storage
used and the total storage for all of the datastores, along with a ring graph. The report also shows
whether the appliance is connected to Core. It also has a table with the datastores, the amount of
storage currently in use for each datastore, and their capacities.
Note: This report is not available in Edge-v.
What this report tells you
The virtualization Datastores report answers these questions:
• What percent of the local storage is in use and how much storage is available?
• How many datastores are in use?

594 | Viewing Reports and Logs
Viewing virtualization alarm reports
To view the Datastores report
• Choose Virtualization > Reports: Datastores to display the Datastores page.
Figure 13-35. Datastores page
Viewing virtualization alarm reportsThe Virtualization Alarms report provides status for the appliance alarms relating to potential problems
with the virtualization platform, which is made up of the hypervisor and VSP.
Note: This report is not available in Edge-v.

Viewing Reports and Logs | 595
Viewing virtualization alarm reports
To view the Alarm Status report
• Choose Virtualization > Reports: Alarms to display the Virtualization Alarm Status page. Alternately, you can select the current system status that appears in the Alarms box on the Dashboard (Critical, Degraded, or Needs Attention) and then click the alarm notification to display the Virtualization Alarm Status page.
Figure 13-36. Virtualization Alarms status page
To print the report, choose File > Print in your web browser to open the Print dialog box.
The Virtualization Alarms page includes this alarm information:
Alarm Appliance
state
Reason
Hypervisor Degraded or Critical
License - Indicates that the hypervisor license has expired.
Operation - The hypervisor is in lockdown mode.
Virtual Services Platform Degraded Indicates a communication issue between VSP and the hypervisor.

596 | Viewing Reports and Logs
Viewing alarm status reports
What this report tells you
The Alarm Status report answers this question:
• What is the current status of the virtualization platform on the Edge?
Viewing alarm status reportsThe Alarm Status report provides status for the appliance alarms.
The appliance tracks key hardware and software metrics and alerts you of any potential problems so you
can quickly discover and diagnose issues.
RiOS groups certain alarms into top-level categories, such as the SSL Settings alarm. When an alarm
triggers, its parent expands to provide more information. For example, the System Disk Full top-level
alarm aggregates over multiple partitions. If a specific partition is full, the System Disk Full alarm triggers
and the Alarm Status report displays more information regarding which partition caused the alarm to
trigger.
The health of an appliance falls into one of these states:
• Needs Attention - Accompanies a healthy state to indicate management-related issues not affecting the ability of the appliance to optimize traffic or to retrieve and serve storage data.
• Degraded - The appliance is optimizing traffic and serving storage data but the system has detected an issue.
• Admission Control - The appliance is optimizing traffic but has reached its connection limit.
• Critical - The appliance might or might not be optimizing traffic, or retrieving and serving storage data; you must address a critical issue.
Connection - The hypervisor is not communicating for any of these issues:
• VSP is disconnected from the hypervisor.
• The hypervisor password is invalid.
• VSP was unable to gather some hardware information.
• VSP is disconnected.
Installation - VSP is not installed properly and is powered off for any of these issues:
• A hypervisor upgrade has failed.
• A configuration push from the Hypervisor Installer has failed.
• VSP could not gather enough information to set up an interface.
• The hypervisor is not installed.
License - The VSP license has expired.
Alarm Appliance
state
Reason

Viewing Reports and Logs | 597
Viewing alarm status reports
To view the Alarm Status report
• Choose Administration > Diagnostics: Alarm Status to display the Alarm Status page. Alternately, you can select the current system status that appears in the status box in the upper-left corner of each page (Healthy, Admission Control, Degraded, or Critical) to display the Alarm Status page.
Figure 13-37. Alarm Status page
To print the report, choose File > Print in your web browser to open the Print dialog box.
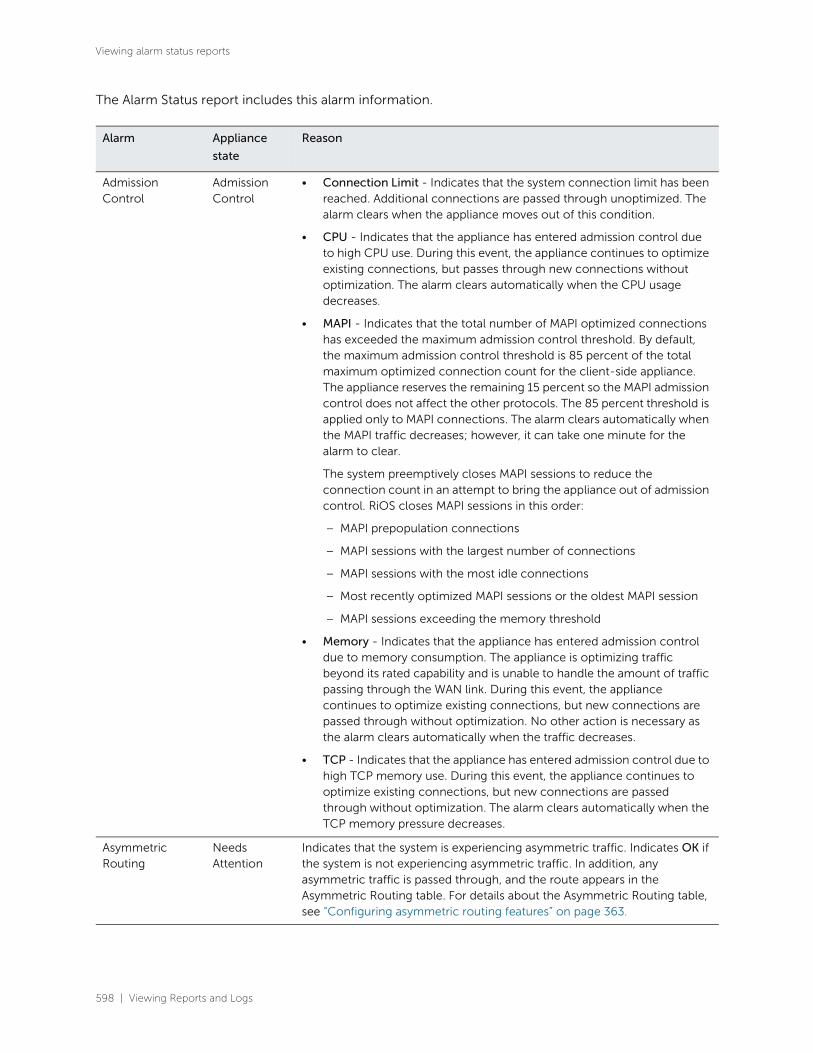
598 | Viewing Reports and Logs
Viewing alarm status reports
The Alarm Status report includes this alarm information.
Alarm Appliance
state
Reason
Admission Control
Admission Control
• Connection Limit - Indicates that the system connection limit has been reached. Additional connections are passed through unoptimized. The alarm clears when the appliance moves out of this condition.
• CPU - Indicates that the appliance has entered admission control due to high CPU use. During this event, the appliance continues to optimize existing connections, but passes through new connections without optimization. The alarm clears automatically when the CPU usage decreases.
• MAPI - Indicates that the total number of MAPI optimized connections has exceeded the maximum admission control threshold. By default, the maximum admission control threshold is 85 percent of the total maximum optimized connection count for the client-side appliance. The appliance reserves the remaining 15 percent so the MAPI admission control does not affect the other protocols. The 85 percent threshold is applied only to MAPI connections. The alarm clears automatically when the MAPI traffic decreases; however, it can take one minute for the alarm to clear.
The system preemptively closes MAPI sessions to reduce the connection count in an attempt to bring the appliance out of admission control. RiOS closes MAPI sessions in this order:
– MAPI prepopulation connections
– MAPI sessions with the largest number of connections
– MAPI sessions with the most idle connections
– Most recently optimized MAPI sessions or the oldest MAPI session
– MAPI sessions exceeding the memory threshold
• Memory - Indicates that the appliance has entered admission control due to memory consumption. The appliance is optimizing traffic beyond its rated capability and is unable to handle the amount of traffic passing through the WAN link. During this event, the appliance continues to optimize existing connections, but new connections are passed through without optimization. No other action is necessary as the alarm clears automatically when the traffic decreases.
• TCP - Indicates that the appliance has entered admission control due to high TCP memory use. During this event, the appliance continues to optimize existing connections, but new connections are passed through without optimization. The alarm clears automatically when the TCP memory pressure decreases.
Asymmetric Routing
Needs Attention
Indicates that the system is experiencing asymmetric traffic. Indicates OK if the system is not experiencing asymmetric traffic. In addition, any asymmetric traffic is passed through, and the route appears in the Asymmetric Routing table. For details about the Asymmetric Routing table, see “Configuring asymmetric routing features” on page 363.

Viewing Reports and Logs | 599
Viewing alarm status reports
Blockstore Degraded or Critical
Indicates that the system has encountered any of the following issues with the blockstore:
• Disk space Low - The blockstore is running out of space. Check your WAN connection as well as connectivity to the Core. This can also happen if clients write more data than can be sent over the WAN for a prolonged period of time.
• Disk space Critical - The blockstore on the Edge is falling and is critically low. Edge will deactivate NFS exports with high uncommitted data to improve availability on other exports.
• Disk space Full - The blockstore is out of space. Check your WAN connection as well as connectivity to the Core. This can also happen if clients write more data than can be sent over the WAN for a prolonged period of time or when the Core HA time does not match the Edge HA time. It is critical that the Core HA time is synchronized with the Edge HA time. We recommend using NTP time synchronization to synchronize the Core HA and the Edge HA. You must also verify that the time zone is correct.
• Memory Low - The blockstore is running out of RAM. This indicates a temporary condition caused by too much IO. Limit the number of active prepopulation sessions. Check if IOPS is more than what is recommended for the appliance model.
• Read Error - The blockstore could not read data that was already replicated to the data center. Clients will not see any error because the Edge will fetch the data from the Core.
Check the system logs to determine the root cause. Replace any disks that have failed. The alarm clears when you restart the service.
• Read Cache Error - An appliance with read cache SSDs cannot start the read cache.
Replace any failed or missing SSDs, and restart the appliance. If no drives have failed or no drives are missing, check system logs for more detailed information, and contact Riverbed Support for assistance as needed.
• Critical Read Error - The blockstore could not read data that is not yet replicated to the Core. This might include data loss. The Edge deactivates all NFS exports. Check the system logs to determine the root cause. Replace any disks that have failed. The alarm clears when you restart the service.
• Startup Failed - The blockstore failed to start due to disk errors or an incorrect configuration. Check the system logs to determine the root cause.
• Startup Wrong Version - The Edge software version is incompatible with the blockstore version on disk. The alarm indicates that the software has been upgraded or downgraded with an incompatible version. Revert to the previous software version.
Alarm Appliance
state
Reason

600 | Viewing Reports and Logs
Viewing alarm status reports
Blockstore Degraded or Critical
• Standby Wrong Version - The Edge software version running on the standby peer is incompatible with the version on the active peer appliance in a high-availability pair. The active peer has been upgraded or downgraded to an incompatible software version. This alarm typically triggers during the process of upgrading both Edges in a high-availability pair. When upgrading across versions with disk-format changes, this is a normal part of the upgrade process. To clear the alarm, update the software version running on the standby peer to match the software version running on the active peer.
• Write Error - The blockstore could not save data to disk due to a media error. The Edge deactivates all NFS exports. Check the system logs to determine the root cause. Replace any disks that have failed. The alarm clears when you restart the service.
Connection Forwarding
Degraded Indicates that the system has detected a problem with a connection-forwarding neighbor. The connection-forwarding alarms are inclusive of all connection-forwarding neighbors. For example, if an appliance has three neighbors, the alarm triggers if any one of the neighbors is in error. In the same way, the alarm clears only when all three neighbors are no longer in error.
• Cluster Neighbor Incompatible - Indicates that a connection-forwarding neighbor is running a RiOS version that is incompatible with IPv6. Neighbors must be running RiOS 8.5 or later. The appliance neighbors pass through IPv6 connections when this alarm triggers.
• Multiple Interface - Indicates that the connection to an appliance in a connection forwarding cluster is lost.
• Single Interface - Indicates that the connection to an appliance connection-forwarding neighbor is lost.
These issues trigger the single connection-forwarding alarm:
• The connection-forwarding neighbor has not sent a keepalive message within the time-out period to the neighbor appliance(s), indicating that the connection has been lost.
• The connection cannot be established with a connection-forwarding neighbor.
• The connection has been closed by the connection-forwarding neighbor.
• The connection has been lost with the connection-forwarding neighbor due to an error.
• The connection has been lost because requests have not been acknowledged by a connection-forwarding neighbor within the set threshold.
• The appliance has timed out while waiting for an initialization message from a connection-forwarding neighbor.
• The amount of latency between connection-forwarding appliances has exceeded the specified threshold.
Alarm Appliance
state
Reason

Viewing Reports and Logs | 601
Viewing alarm status reports
CPU Utilization Degraded Indicates that the system has reached the CPU threshold for any of the CPUs in the appliance. If the system has reached the CPU threshold, check your settings. For details, see “Configuring alarm settings” on page 447.
If your alarm thresholds are correct, reboot the appliance. For details, see “Rebooting and shutting down” on page 408.
Data Store Critical • Corruption - Indicates that the RiOS data store is corrupt or has become incompatible with the current configuration.
• Data Store Clean Required - Indicates that you must clear the RiOS data store. To clear the data store, choose Administration > Maintenance: Services and select the Clear Data Store check box before restarting the appliance. Clearing the data store degrades performance until the system repopulates the data.
• Encryption Level Mismatch - Indicates a RiOS data store error such as an encryption, header, or format error.
• Synchronization Error - Indicates that the RiOS data store synchronization between two appliances has been disrupted and the RiOS data stores are no longer synchronized. For details, see “Synchronizing peer RiOS data stores” on page 127.
Resetting the Data Store alarm
If a data store alarm was caused by an unintended change to the configuration, you can change the configuration to match the previous RiOS data store settings, and then restart the service without clearing the data store to reset the alarm.
Typical configuration changes that require a restart with a clear RiOS data store are enabling the extended peer table or changing the data store encryption type. For details, see “Configuring peering” on page 118 and “Encrypting the RiOS data store” on page 125.
To clear the RiOS data store of data, choose Administration > Maintenance: Services, select Clear Data Store and click Reboot to reboot the optimization service. For details, see “Starting and stopping the optimization service” on page 403.
Disk Full Indicates that the system partitions (not the RiOS data store) are full or almost full. For example, RiOS monitors the available space on /var, which is used to hold logs, statistics, system dumps, TCP dumps, and so on.
Examine the directory to see if it is storing an excessive amount of snapshots, system dumps, or TCP dumps that you could delete. You could also delete any RiOS images that you no longer use.
Domain Authentication Alert
Needs Attention
Indicates that the system is unable to communicate with the Core, has detected an SMB signing error, or delegation has failed. CIFS-signed and Encrypted-MAPI traffic is passed through without optimization. For details, see “Configuring CIFS optimization” on page 174.
Domain Join Error
Degraded Indicates an attempt to join a Windows domain has failed. For details, see “Troubleshooting a domain join failure” on page 389.
Alarm Appliance
state
Reason
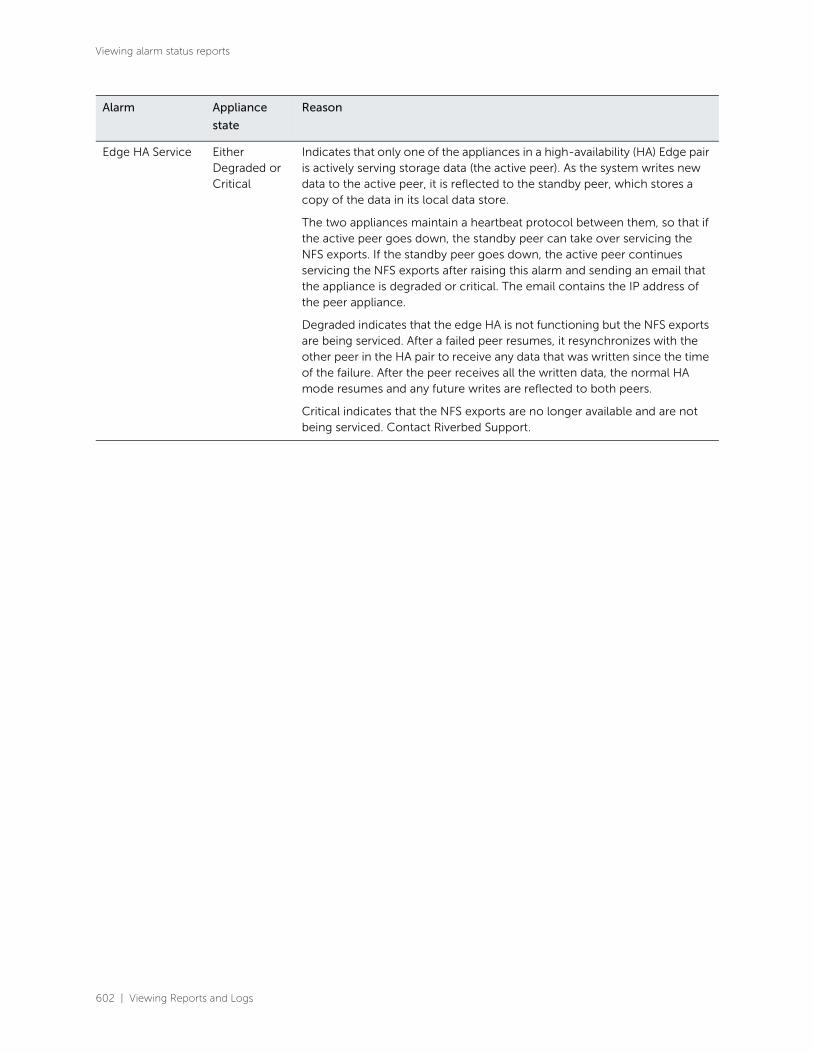
602 | Viewing Reports and Logs
Viewing alarm status reports
Edge HA Service Either Degraded or Critical
Indicates that only one of the appliances in a high-availability (HA) Edge pair is actively serving storage data (the active peer). As the system writes new data to the active peer, it is reflected to the standby peer, which stores a copy of the data in its local data store.
The two appliances maintain a heartbeat protocol between them, so that if the active peer goes down, the standby peer can take over servicing the NFS exports. If the standby peer goes down, the active peer continues servicing the NFS exports after raising this alarm and sending an email that the appliance is degraded or critical. The email contains the IP address of the peer appliance.
Degraded indicates that the edge HA is not functioning but the NFS exports are being serviced. After a failed peer resumes, it resynchronizes with the other peer in the HA pair to receive any data that was written since the time of the failure. After the peer receives all the written data, the normal HA mode resumes and any future writes are reflected to both peers.
Critical indicates that the NFS exports are no longer available and are not being serviced. Contact Riverbed Support.
Alarm Appliance
state
Reason
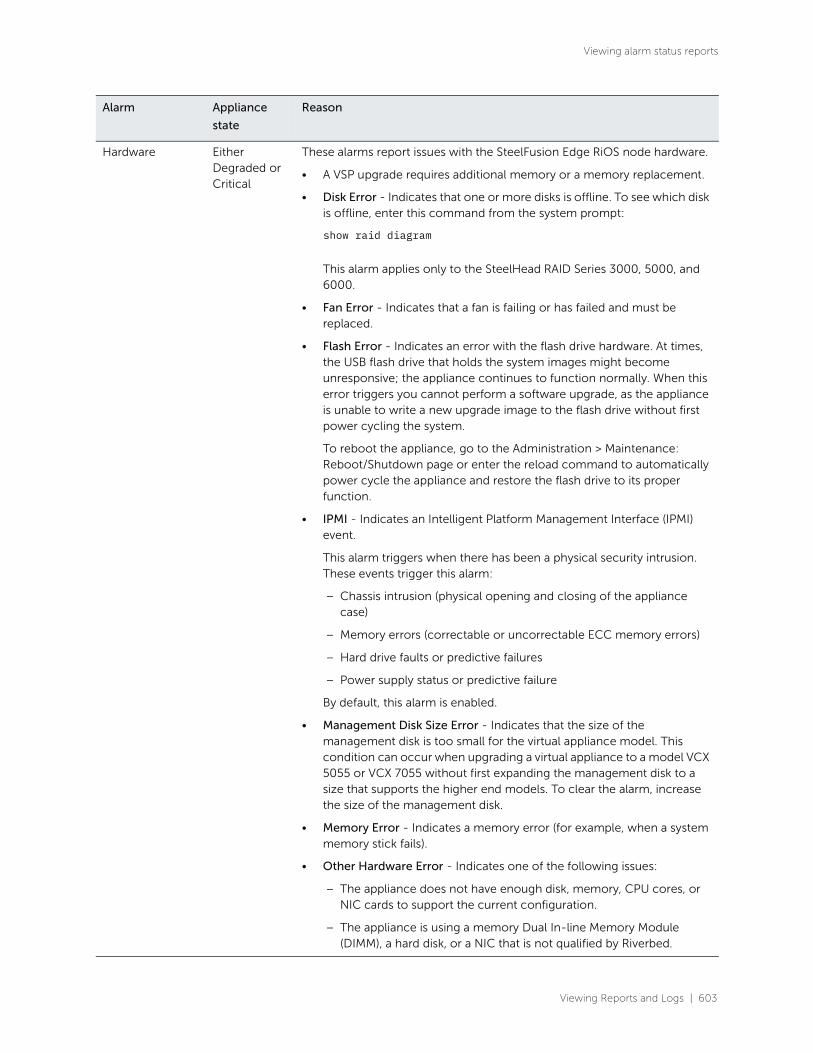
Viewing Reports and Logs | 603
Viewing alarm status reports
Hardware Either Degraded or Critical
These alarms report issues with the SteelFusion Edge RiOS node hardware.
• A VSP upgrade requires additional memory or a memory replacement.
• Disk Error - Indicates that one or more disks is offline. To see which disk is offline, enter this command from the system prompt:
show raid diagram
This alarm applies only to the SteelHead RAID Series 3000, 5000, and 6000.
• Fan Error - Indicates that a fan is failing or has failed and must be replaced.
• Flash Error - Indicates an error with the flash drive hardware. At times, the USB flash drive that holds the system images might become unresponsive; the appliance continues to function normally. When this error triggers you cannot perform a software upgrade, as the appliance is unable to write a new upgrade image to the flash drive without first power cycling the system.
To reboot the appliance, go to the Administration > Maintenance: Reboot/Shutdown page or enter the reload command to automatically power cycle the appliance and restore the flash drive to its proper function.
• IPMI - Indicates an Intelligent Platform Management Interface (IPMI) event.
This alarm triggers when there has been a physical security intrusion. These events trigger this alarm:
– Chassis intrusion (physical opening and closing of the appliance case)
– Memory errors (correctable or uncorrectable ECC memory errors)
– Hard drive faults or predictive failures
– Power supply status or predictive failure
By default, this alarm is enabled.
• Management Disk Size Error - Indicates that the size of the management disk is too small for the virtual appliance model. This condition can occur when upgrading a virtual appliance to a model VCX 5055 or VCX 7055 without first expanding the management disk to a size that supports the higher end models. To clear the alarm, increase the size of the management disk.
• Memory Error - Indicates a memory error (for example, when a system memory stick fails).
• Other Hardware Error - Indicates one of the following issues:
– The appliance does not have enough disk, memory, CPU cores, or NIC cards to support the current configuration.
– The appliance is using a memory Dual In-line Memory Module (DIMM), a hard disk, or a NIC that is not qualified by Riverbed.
Alarm Appliance
state
Reason
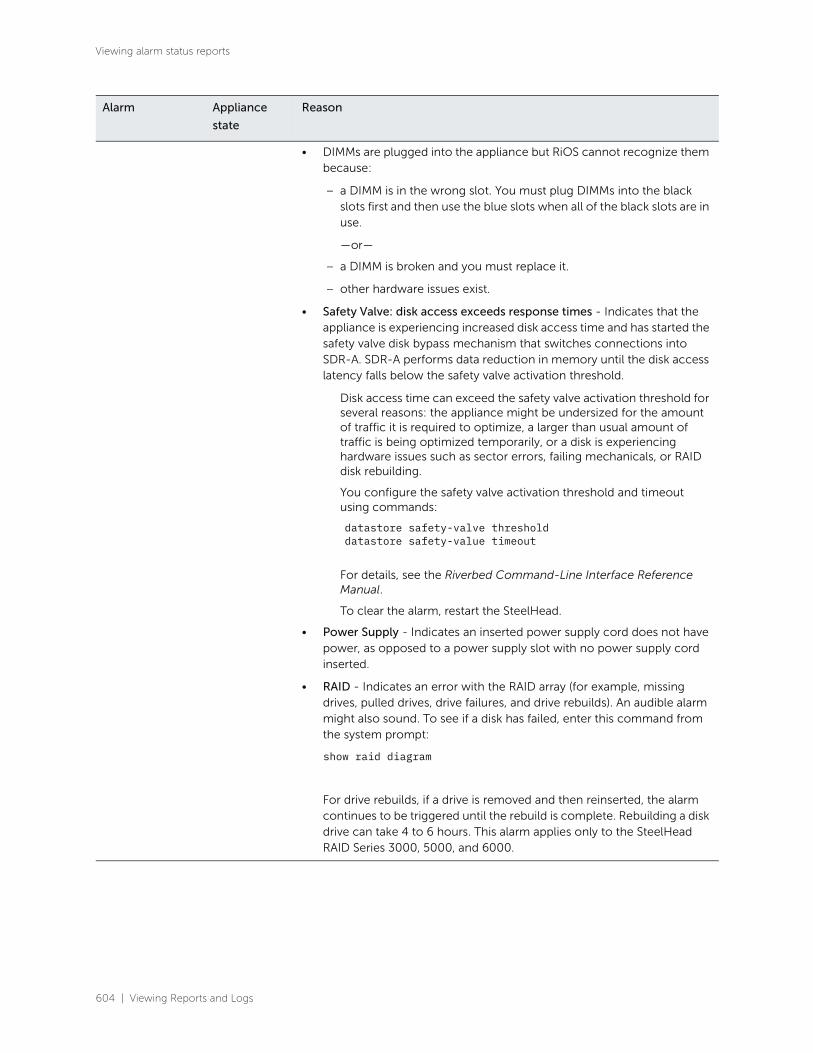
604 | Viewing Reports and Logs
Viewing alarm status reports
• DIMMs are plugged into the appliance but RiOS cannot recognize them because:
– a DIMM is in the wrong slot. You must plug DIMMs into the black slots first and then use the blue slots when all of the black slots are in use.
—or—
– a DIMM is broken and you must replace it.
– other hardware issues exist.
• Safety Valve: disk access exceeds response times - Indicates that the appliance is experiencing increased disk access time and has started the safety valve disk bypass mechanism that switches connections into SDR-A. SDR-A performs data reduction in memory until the disk access latency falls below the safety valve activation threshold.
Disk access time can exceed the safety valve activation threshold for several reasons: the appliance might be undersized for the amount of traffic it is required to optimize, a larger than usual amount of traffic is being optimized temporarily, or a disk is experiencing hardware issues such as sector errors, failing mechanicals, or RAID disk rebuilding.
You configure the safety valve activation threshold and timeout using commands:
datastore safety-valve thresholddatastore safety-value timeout
For details, see the Riverbed Command-Line Interface Reference Manual.
To clear the alarm, restart the SteelHead.
• Power Supply - Indicates an inserted power supply cord does not have power, as opposed to a power supply slot with no power supply cord inserted.
• RAID - Indicates an error with the RAID array (for example, missing drives, pulled drives, drive failures, and drive rebuilds). An audible alarm might also sound. To see if a disk has failed, enter this command from the system prompt:
show raid diagram
For drive rebuilds, if a drive is removed and then reinserted, the alarm continues to be triggered until the rebuild is complete. Rebuilding a disk drive can take 4 to 6 hours. This alarm applies only to the SteelHead RAID Series 3000, 5000, and 6000.
Alarm Appliance
state
Reason

Viewing Reports and Logs | 605
Viewing alarm status reports
Hypervisor Hardware
Either Degraded or Critical
Indicates that a problem has occurred with the Edge Hypervisor node hardware. The hypervisor hardware affects virtualization on the appliance. These issues trigger the hypervisor hardware alarm:
• Hardware Management Connection - Indicates that RiOS has lost IP connectivity or cannot authenticate the connection to the hypervisor motherboard controller.
• Hardware Management Controller Unauthenticated User - Indicates that RiOS does not recognize the password used to access the hardware management controller.
• Memory - Indicates that a memory error has occurred; for example, a system memory stick has failed.
• Other Hardware - Indicates that a hardware error has been detected. These issues trigger the hardware error alarm:
– The hypervisor hardware is using a memory Dual In-line Memory Module (DIMM), a hard disk, or a NIC that is not qualified.
– The hypervisor hardware has detected a RiOS NIC. The hypervisor does not support RiOS NICs.
– DIMMs are plugged into the hypervisor hardware but the hypervisor cannot recognize them because:
– a DIMM is in the wrong slot. You must plug DIMMs into the black slots first and then use the blue slots when all of the black slots are in use.
—or—
– a DIMM is broken and you must replace it.
• Power - Indicates that the hypervisor has lost power unexpectedly.
• Temperature - Indicates that a hypervisor CPU, board, or platform controller hub (PCH) temperature has exceeded the rising threshold. When the CPU, board, or PCH returns to the reset threshold, the critical alarm clears (after polling for 30 seconds). If the appliance has more than one CPU, the alarm displays both CPUs. The default temperature thresholds are set by the motherboard.
Alarm Appliance
state
Reason

606 | Viewing Reports and Logs
Viewing alarm status reports
Inbound QoS WAN Bandwidth Configuration
Degraded (Needs Attention)
Indicates that the inbound QoS WAN bandwidth for one or more of the interfaces is set incorrectly. You must configure the WAN bandwidth to be less than or equal to the interface bandwidth link rate.
This alarm triggers when the system encounters one of these conditions:
• An interface is connected and the WAN bandwidth is set higher than its bandwidth link rate: for example, if the bandwidth link rate is 1536 kbps, and the WAN bandwidth is set to 2000 kbps.
• A nonzero WAN bandwidth is set and QoS is enabled on an interface that is disconnected; that is, the bandwidth link rate is 0.
• A previously disconnected interface is reconnected, and its previously configured WAN bandwidth was set higher than the bandwidth link rate. The Management Console refreshes the alarm message to inform you that the configured WAN bandwidth is set higher than the interface bandwidth link rate.
While this alarm appears, the appliance puts existing connections into the default class.
The alarm clears when you configure the WAN bandwidth to be less than or equal to the bandwidth link rate or reconnect an interface configured with the correct WAN bandwidth.
Alarm Appliance
state
Reason

Viewing Reports and Logs | 607
Viewing alarm status reports
Licensing Needs Attention, Degraded, or Critical
Indicates whether your licenses are current.
• Appliance Unlicensed - This alarm triggers if the appliance has no BASE or MSPEC license installed for its currently configured model. For details about updating licenses, see “Managing licenses and model upgrades” on page 409.
• Autolicense Critical Event - This alarm triggers on a SteelHead (virtual edition) appliance when the Riverbed Licensing Portal cannot respond to a license request with valid licenses. The Licensing Portal cannot issue a valid license for one of these reasons:
– A newer SteelHead (virtual edition) appliance is already using the token, so you cannot use it on the SteelHead (virtual edition) appliance displaying the critical alarm. Every time the SteelHead (virtual edition) appliance attempts to refetch a license token, the alarm retriggers.
– The token has been redeemed too many times. Every time the SteelHead (virtual edition) appliance attempts to refetch a license token, the alarm retriggers.
Discontinue use of the other SteelHead (virtual edition) appliance or contact Riverbed Support.
• Autolicense Informational Event - This alarm triggers if the Riverbed Licensing Portal has information regarding the licenses for a SteelHead (virtual edition) appliance. For example, the SteelHead (virtual edition) appliance displays this alarm when the portal returns licenses that are associated with a token that has been used on a different SteelHead (virtual edition) appliance.
Make sure that any previous SteelHead (virtual edition) appliances that were licensed with that token are no longer running. The alarm clears automatically the next time the SteelHead (virtual edition) appliance fetches the licenses from the Licensing Portal.
• Licenses Expired - This alarm triggers if one or more features has at least one license installed, but all of them are expired.
• Licenses Expiring - This alarm triggers if the license for one or more features is going to expire within two weeks.
Note: The licenses expiring and licenses expired alarms are triggered per feature. For example, if you install two license keys for a feature, LK1-FOO-xxx (expired) and LK1-FOO-yyy (not expired), the alarms do not trigger, because the feature has one valid license.
If the Licenses Expiring alarm triggers, the system status changes to Needs Attention. The Licenses Expired alarm changes the system status to Degraded. Depending on the expiring license, other alarms might trigger simultaneously. For example, if the MSPEC or SH10BASE license expires, the Appliance Unlicensed alarm triggers and changes the health to Critical.
Alarm Appliance
state
Reason

608 | Viewing Reports and Logs
Viewing alarm status reports
Link Duplex Degraded Indicates that an interface was not configured for half-duplex negotiation but has negotiated half-duplex mode. Half-duplex significantly limits the optimization service results.
The alarm displays which interface is triggering the duplex error.
Choose Networking > Networking: Base Interfaces and examine the SteelHead link configuration. Next, examine the peer switch user interface to check its link configuration. If the configuration on one side is different from the other, traffic is sent at different rates on each side, causing many collisions.
To troubleshoot, change both interfaces to automatic duplex negotiation. If the interfaces do not support automatic duplex, configure both ends for full duplex.
You can enable or disable the alarm for a specific interface. To disable an alarm, choose Administration: System Settings > Alarms and select or clear the check box next to the link alarm.
Link I/O Errors Degraded Indicates that the error rate on an interface has exceeded 0.1 percent while either sending or receiving packets. This threshold is based on the observation that even a small link error rate reduces TCP throughput significantly. A properly configured LAN connection experiences few errors. The alarm clears when the error rate drops below 0.05 percent.
You can change the default alarm thresholds by entering the alarm link_io_errors err-threshold <threshold-value> command at the system prompt. For details, see the Riverbed Command-Line Interface Reference Manual.
To troubleshoot, try a new cable and a different switch port. Another possible cause is electromagnetic noise nearby.
You can enable or disable the alarm for a specific interface. For example, you can disable the alarm for a link after deciding to tolerate the errors. To enable or disable an alarm, choose Administration > System Settings: Alarms and select or clear the check box next to the link name.
Link State Degraded Indicates that the system has lost one of its Ethernet links due to an unplugged cable or dead switch port. Check the physical connectivity between the appliance and its neighbor device. Investigate this alarm as soon as possible. Depending on what link is down, the system might no longer be optimizing, and a network outage could occur.
You can enable or disable the alarm for a specific interface. To enable or disable the alarm, choose Administration > System Settings: Alarms and select or clear the check box next to the link name.
Memory Paging Degraded Indicates that the system has reached the memory paging threshold. If 100 pages are swapped approximately every two hours the appliance is functioning properly. If thousands of pages are swapped every few minutes, reboot the appliance. For details, see “Rebooting and shutting down” on page 408. If rebooting does not solve the problem, contact Riverbed Support at https://support.riverbed.com.
Alarm Appliance
state
Reason

Viewing Reports and Logs | 609
Viewing alarm status reports
Neighbor Incompatibility
Degraded Indicates that the system has encountered an error in reaching an appliance configured for connection forwarding. For details, see “Configuring connection forwarding features” on page 366.
Network Bypass Critical Indicates that the system is in bypass failover mode. If the appliance is in bypass failover mode, restart the optimization service.
If restarting the service does not resolve the problem, reboot the appliance.
If rebooting does not resolve the problem, shut down and restart the appliance. For details, see “Rebooting and shutting down” on page 408., and “Starting and stopping the optimization service” on page 403.
NFS V2/V4 Alarm Degraded Indicates that the system has detected either NFSv2 or NFSv4 is in use. The appliance supports only NFSv3 and passes through all other versions. For details, see “Configuring NFS optimization” on page 214.\
Optimization Service
Critical • Internal Error - The optimization service has encountered a condition that might degrade optimization performance. Go to the Administration > Maintenance: Services page and restart the optimization service.
• Unexpected Halt - The optimization service has halted due to a serious software error. See if a system dump was created. If so, retrieve the system dump and contact Riverbed Support immediately. For details, see “Viewing logs” on page 637.
• Service Status - The optimization service has encountered an optimization service condition. The message indicates the reason for the condition:
– optimization service is not running
This message appears after an optimization restart. For more information, review the appliance logs.
– in-path optimization is not enabled
This message appears if an in-path setting is disabled for an in-path SteelHead. For more information, review the SteelHead logs.
– optimization service is initializing
This message appears after a reboot. The alarm clears. For more information, review the SteelHead logs.
– optimization service is not optimizing
This message appears after a system crash. For more information, review the SteelHead logs.
– optimization service is disabled by user
This message appears after entering the no service enable command or shutting down the optimization service from the Management Console. For more information, review the SteelHead logs.
– optimization service is restarted by user
This message appears after the optimization service is restarted from either the CLI or Management Console. You might want to review the SteelHead logs for more information.
Alarm Appliance
state
Reason

610 | Viewing Reports and Logs
Viewing alarm status reports
Outbound QoS WAN Bandwidth Configuration
Degraded (Needs Attention)
Indicates that the outbound QoS WAN bandwidth for one or more of the interfaces is set incorrectly. You must configure the WAN bandwidth to be less than or equal to the interface bandwidth link rate.
This alarm triggers when the system encounters one of these conditions:
• An interface is connected and the WAN bandwidth is set higher than its bandwidth link rate: for example, if the bandwidth link rate is 1536 kbps, and the WAN bandwidth is set to 2000 kbps.
• A nonzero WAN bandwidth is set and QoS is enabled on an interface that is disconnected; that is, the bandwidth link rate is 0.
• A previously disconnected interface is reconnected, and its previously configured WAN bandwidth was set higher than the bandwidth link rate. The Management Console refreshes the alarm message to inform you that the configured WAN bandwidth is set higher than the interface bandwidth link rate.
While this alarm appears, the SteelHead puts existing connections into the default class.
The alarm clears when you configure the WAN bandwidth to be less than or equal to the bandwidth link rate or reconnect an interface configured with the correct WAN bandwidth.
Path Selection Path Down
Degraded Indicates that one of the predefined paths for a connection is unavailable because it has exceeded either the timeout value for path latency or the threshold for observed packet loss.
When a path fails, the SteelHead directs traffic through another available path. When the original path comes back up, the SteelHead redirects the traffic back to it.
Path Selection Path Probing Error
Degraded Indicates that a path selection monitoring probe for a predefined path has received a probe response from an unexpected relay or interface.
Process Dump Creation Error
Degraded Indicates that the system has detected an error while trying to create a process dump. This alarm indicates an abnormal condition in which RiOS cannot collect the core file after three retries. It can be caused when the /var directory, which is used to hold system dumps, is reaching capacity or other conditions. When this alarm is raised, the directory is blacklisted.
Contact Riverbed Support to correct the issue.
Riverbed Host Tools Version
Degraded Indicates that the Riverbed host tools package (RHSP) is incompatible with the Windows server version. RHSP provides snapshot capabilities by exposing the Edge through iSCSI to the Windows Server as a snapshot provider. RHSP is compatible with 64-bit editions of Microsoft Windows Server 2008 R2 or later and can be downloaded from the Riverbed Support site at https://support.riverbed.com.
Alarm Appliance
state
Reason

Viewing Reports and Logs | 611
Viewing alarm status reports
Secure Transport Critical Indicates that a peer appliance has encountered a problem with the controller connection. The controller is an appliance that typically resides in the data center and manages the control channel and operations required for secure transport between peers. The control channel between the peers uses SSL to secure the connection.
• Connection with Controller Lost - Indicates that the peer appliance is no longer connected to the controller for one of these reasons:
– The connectivity between the peer appliance and the SteelHead controller is lost.
– The SSL for the connection is not configured correctly.
• Registration with Controller Unsuccessful - Indicates that the peer appliance is not registered with the SteelHead controller, and the controller does not recognize it as a member of the secure transport group.
Secure Vault Degraded Indicates a problem with the secure vault.
• Secure Vault Locked - Needs Attention - Indicates that the secure vault is locked. To optimize SSL connections or to use RiOS data store encryption, the secure vault must be unlocked. Go to Administration > Security: Secure Vault and unlock the secure vault.
• Secure Vault New Password Recommended - Degraded - Indicates that the secure vault requires a new, nondefault password. Reenter the password.
• Secure Vault Not Initialized - Critical - Indicates that an error has occurred while initializing the secure vault. When the vault is locked, SSL traffic is not optimized and you cannot encrypt the RiOS data store. For details, see “Unlocking the secure vault” on page 434.
Server Backup Degraded Indicates that one of the following backup failures have occurred:
• Failed connection to the server - The connection between the Edge and the ESXi server is down, the server is not running, or there are incorrect credentials for the ESXi or vCenter server login. To fix this issue, check if the server is reachable from the Edge and vice-versa. Also ensure that the correct credentials are being used for the ESXi server. This alarm is cleared when the connection is restored between the Edge and the server.
• Backup failure on the Edge - A backup has failed on the Edge. The alarm displays a message with the affected server.
• NFS export is shared among multiple Windows servers - At least one export is shared among two or more Windows servers. To fix this issue, make sure that the export has access to only one IP address. The alarm is cleared when servers no longer share export(s) and the next protect operation succeeds.
• Server with a backup policy does not have an NFS export - A server with an associated backup policy does not have any VMs or exports to protect.
Alarm Appliance
state
Reason
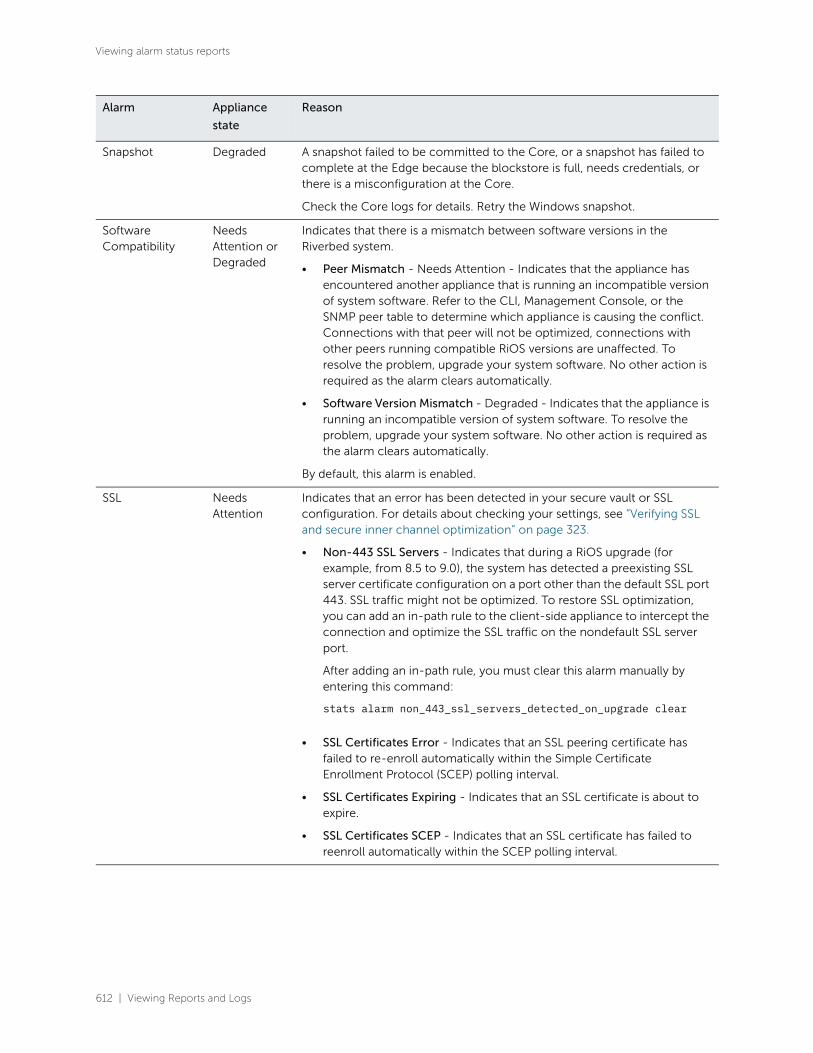
612 | Viewing Reports and Logs
Viewing alarm status reports
Snapshot Degraded A snapshot failed to be committed to the Core, or a snapshot has failed to complete at the Edge because the blockstore is full, needs credentials, or there is a misconfiguration at the Core.
Check the Core logs for details. Retry the Windows snapshot.
Software Compatibility
Needs Attention or Degraded
Indicates that there is a mismatch between software versions in the Riverbed system.
• Peer Mismatch - Needs Attention - Indicates that the appliance has encountered another appliance that is running an incompatible version of system software. Refer to the CLI, Management Console, or the SNMP peer table to determine which appliance is causing the conflict. Connections with that peer will not be optimized, connections with other peers running compatible RiOS versions are unaffected. To resolve the problem, upgrade your system software. No other action is required as the alarm clears automatically.
• Software Version Mismatch - Degraded - Indicates that the appliance is running an incompatible version of system software. To resolve the problem, upgrade your system software. No other action is required as the alarm clears automatically.
By default, this alarm is enabled.
SSL Needs Attention
Indicates that an error has been detected in your secure vault or SSL configuration. For details about checking your settings, see “Verifying SSL and secure inner channel optimization” on page 323.
• Non-443 SSL Servers - Indicates that during a RiOS upgrade (for example, from 8.5 to 9.0), the system has detected a preexisting SSL server certificate configuration on a port other than the default SSL port 443. SSL traffic might not be optimized. To restore SSL optimization, you can add an in-path rule to the client-side appliance to intercept the connection and optimize the SSL traffic on the nondefault SSL server port.
After adding an in-path rule, you must clear this alarm manually by entering this command:
stats alarm non_443_ssl_servers_detected_on_upgrade clear
• SSL Certificates Error - Indicates that an SSL peering certificate has failed to re-enroll automatically within the Simple Certificate Enrollment Protocol (SCEP) polling interval.
• SSL Certificates Expiring - Indicates that an SSL certificate is about to expire.
• SSL Certificates SCEP - Indicates that an SSL certificate has failed to reenroll automatically within the SCEP polling interval.
Alarm Appliance
state
Reason

Viewing Reports and Logs | 613
Viewing alarm status reports
SteelFusion Core Degraded Indicates that the system has encountered any of the following issues with the SteelFusion Core:
• Unknown Edge - The Edge appliance has connected to a Core that does not recognize the appliance. Most likely the configuration present on the Core is missing an entry for the Edge. Check that the Edge is supplying the proper Edge ID. To find the Edge ID, choose Storage > Storage Edge Configuration on the Edge appliance. The edge identifier appears under SteelFusion Settings.
• SteelFusion Core Connectivity - The Edge does not have an active connection with the Core. Check the network between the Edge and the Core; recheck the Edge configuration on the Core.
• Inner Channel Down - The data channel between the Core and the Edge is down. The connection between the Core and the Edge has stalled. Check the network between the Edge and the Core.
• Keep-Alive Timeout - The connection between the Core and the Edge has stalled. Check the network between the Edge and the Core.
SteelFusion Edge Service
Needs Attention
Indicates that the Edge appliance connected to the Core is not servicing the Core. Check that the Edge appliance is running.
SteelFusion Protocol Service
Indicates that an NFS protocol error is preventing a volume from being mounted from the Edge to the clients (for example, ESXi).
Alarm Appliance
state
Reason
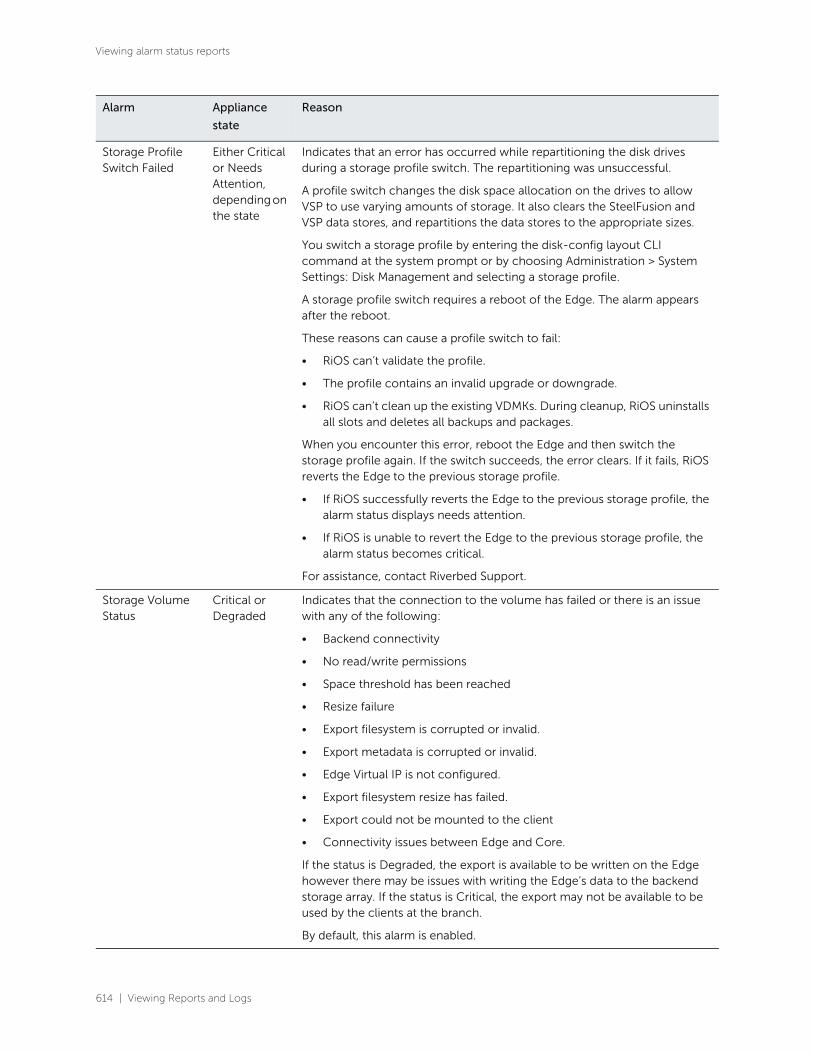
614 | Viewing Reports and Logs
Viewing alarm status reports
Storage Profile Switch Failed
Either Critical or Needs Attention, depending on the state
Indicates that an error has occurred while repartitioning the disk drives during a storage profile switch. The repartitioning was unsuccessful.
A profile switch changes the disk space allocation on the drives to allow VSP to use varying amounts of storage. It also clears the SteelFusion and VSP data stores, and repartitions the data stores to the appropriate sizes.
You switch a storage profile by entering the disk-config layout CLI command at the system prompt or by choosing Administration > System Settings: Disk Management and selecting a storage profile.
A storage profile switch requires a reboot of the Edge. The alarm appears after the reboot.
These reasons can cause a profile switch to fail:
• RiOS can’t validate the profile.
• The profile contains an invalid upgrade or downgrade.
• RiOS can’t clean up the existing VDMKs. During cleanup, RiOS uninstalls all slots and deletes all backups and packages.
When you encounter this error, reboot the Edge and then switch the storage profile again. If the switch succeeds, the error clears. If it fails, RiOS reverts the Edge to the previous storage profile.
• If RiOS successfully reverts the Edge to the previous storage profile, the alarm status displays needs attention.
• If RiOS is unable to revert the Edge to the previous storage profile, the alarm status becomes critical.
For assistance, contact Riverbed Support.
Storage Volume Status
Critical or Degraded
Indicates that the connection to the volume has failed or there is an issue with any of the following:
• Backend connectivity
• No read/write permissions
• Space threshold has been reached
• Resize failure
• Export filesystem is corrupted or invalid.
• Export metadata is corrupted or invalid.
• Edge Virtual IP is not configured.
• Export filesystem resize has failed.
• Export could not be mounted to the client
• Connectivity issues between Edge and Core.
If the status is Degraded, the export is available to be written on the Edge however there may be issues with writing the Edge’s data to the backend storage array. If the status is Critical, the export may not be available to be used by the clients at the branch.
By default, this alarm is enabled.
Alarm Appliance
state
Reason
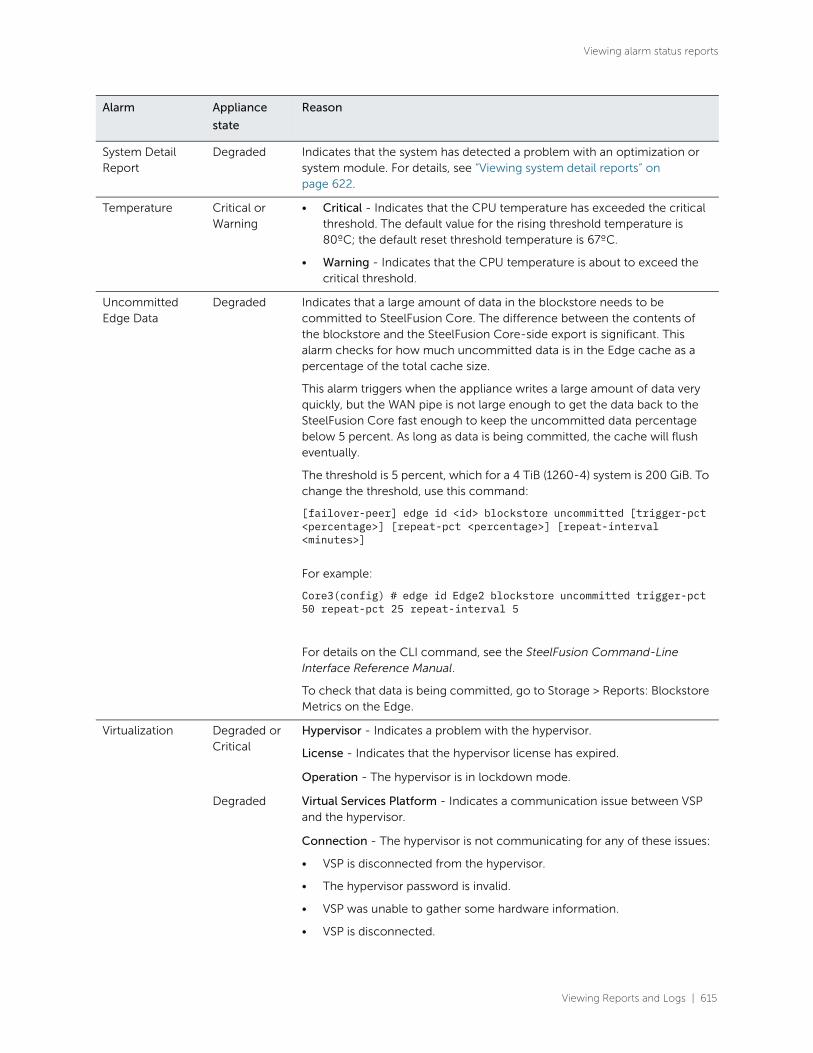
Viewing Reports and Logs | 615
Viewing alarm status reports
System Detail Report
Degraded Indicates that the system has detected a problem with an optimization or system module. For details, see “Viewing system detail reports” on page 622.
Temperature Critical or Warning
• Critical - Indicates that the CPU temperature has exceeded the critical threshold. The default value for the rising threshold temperature is 80ºC; the default reset threshold temperature is 67ºC.
• Warning - Indicates that the CPU temperature is about to exceed the critical threshold.
Uncommitted Edge Data
Degraded Indicates that a large amount of data in the blockstore needs to be committed to SteelFusion Core. The difference between the contents of the blockstore and the SteelFusion Core-side export is significant. This alarm checks for how much uncommitted data is in the Edge cache as a percentage of the total cache size.
This alarm triggers when the appliance writes a large amount of data very quickly, but the WAN pipe is not large enough to get the data back to the SteelFusion Core fast enough to keep the uncommitted data percentage below 5 percent. As long as data is being committed, the cache will flush eventually.
The threshold is 5 percent, which for a 4 TiB (1260-4) system is 200 GiB. To change the threshold, use this command:
[failover-peer] edge id <id> blockstore uncommitted [trigger-pct <percentage>] [repeat-pct <percentage>] [repeat-interval <minutes>]
For example:
Core3(config) # edge id Edge2 blockstore uncommitted trigger-pct 50 repeat-pct 25 repeat-interval 5
For details on the CLI command, see the SteelFusion Command-Line Interface Reference Manual.
To check that data is being committed, go to Storage > Reports: Blockstore Metrics on the Edge.
Virtualization Degraded or Critical
Hypervisor - Indicates a problem with the hypervisor.
License - Indicates that the hypervisor license has expired.
Operation - The hypervisor is in lockdown mode.
Degraded Virtual Services Platform - Indicates a communication issue between VSP and the hypervisor.
Connection - The hypervisor is not communicating for any of these issues:
• VSP is disconnected from the hypervisor.
• The hypervisor password is invalid.
• VSP was unable to gather some hardware information.
• VSP is disconnected.
Alarm Appliance
state
Reason

616 | Viewing Reports and Logs
Viewing CPU utilization reports
What this report tells you
The Alarm Status report answers this question:
• What is the current status of the SteelFusion Edge?
Viewing CPU utilization reportsThe CPU Utilization report summarizes the percentage of all of the CPU cores used in the system within
the time period specified. You can display individual cores or an overall average, or both.
For details about the report format, see “Overview” on page 493.
General usage guidelines
Typically, an appliance operates on approximately 30 to 40 percent CPU capacity during nonpeak hours
and approximately 60 to 70 percent capacity during peak hours. No single appliance CPU usage should
exceed 90 percent.
What this report tells you
The CPU Utilization report answers these questions:
• How much of the CPU is being used?
• What is the average and peak percentage of the CPU being used?
About report graphs
Mouse over a specific data point to see the values and exact time stamp.
Installation - VSP is not installed properly and is powered off for any of these issues:
• A hypervisor upgrade has failed.
• A configuration push from the Hypervisor Installer has failed.
• VSP could not gather enough information to set up an interface.
• The hypervisor is not installed.
Web Proxy Configuration - Indicates that an error has occurred with the web proxy configuration.
Service Status - Indicates that an error has occurred with the web proxy service.
Alarm Appliance
state
Reason
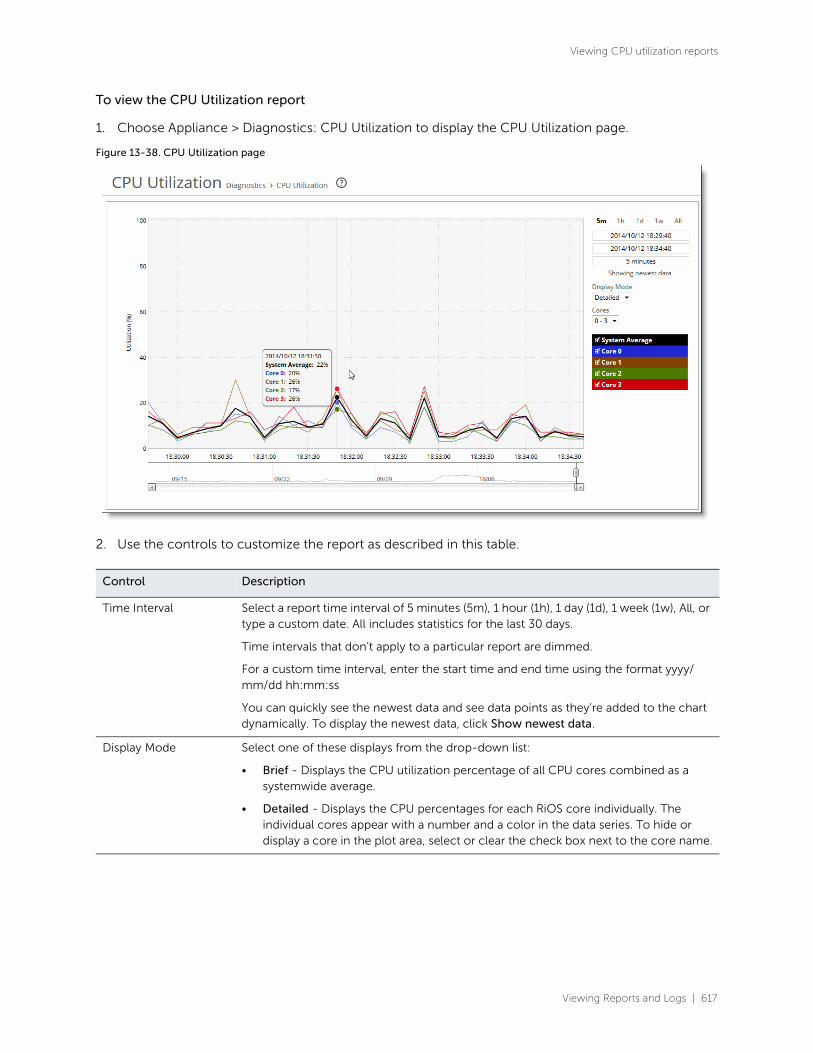
Viewing Reports and Logs | 617
Viewing CPU utilization reports
To view the CPU Utilization report
1. Choose Appliance > Diagnostics: CPU Utilization to display the CPU Utilization page.
Figure 13-38. CPU Utilization page
2. Use the controls to customize the report as described in this table.
Control Description
Time Interval Select a report time interval of 5 minutes (5m), 1 hour (1h), 1 day (1d), 1 week (1w), All, or type a custom date. All includes statistics for the last 30 days.
Time intervals that don’t apply to a particular report are dimmed.
For a custom time interval, enter the start time and end time using the format yyyy/mm/dd hh:mm:ss
You can quickly see the newest data and see data points as they’re added to the chart dynamically. To display the newest data, click Show newest data.
Display Mode Select one of these displays from the drop-down list:
• Brief - Displays the CPU utilization percentage of all CPU cores combined as a systemwide average.
• Detailed - Displays the CPU percentages for each RiOS core individually. The individual cores appear with a number and a color in the data series. To hide or display a core in the plot area, select or clear the check box next to the core name.

618 | Viewing Reports and Logs
Viewing memory paging reports
Viewing memory paging reportsThe Memory Paging report provides the rate at which memory pages are swapped out to disk.
For details about the report format, see “Overview” on page 493.
The Memory Paging report includes this statistic that describes memory paging activity for the time
period you specify.
What this report tells you
The Memory Paging report answers this question:
• How many memory pages are swapping out?
About report graphs
Mouse over a specific data point to see the values and exact time stamp.
Data series Description
Page Swap Out Rate Specifies the total number of pages swapped per second. If 100 pages are swapped approximately every two hours, the appliance is functioning properly. If thousands of pages are swapped every few minutes, contact Riverbed Support at https://support.riverbed.com.
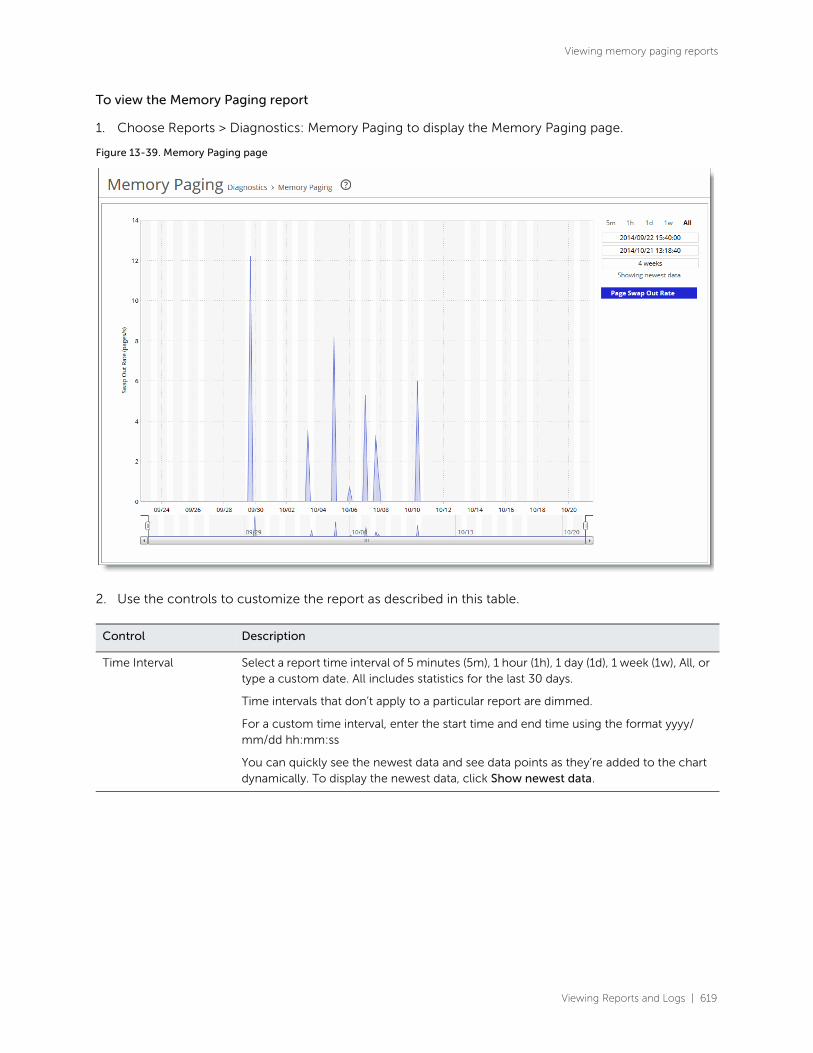
Viewing Reports and Logs | 619
Viewing memory paging reports
To view the Memory Paging report
1. Choose Reports > Diagnostics: Memory Paging to display the Memory Paging page.
Figure 13-39. Memory Paging page
2. Use the controls to customize the report as described in this table.
Control Description
Time Interval Select a report time interval of 5 minutes (5m), 1 hour (1h), 1 day (1d), 1 week (1w), All, or type a custom date. All includes statistics for the last 30 days.
Time intervals that don’t apply to a particular report are dimmed.
For a custom time interval, enter the start time and end time using the format yyyy/mm/dd hh:mm:ss
You can quickly see the newest data and see data points as they’re added to the chart dynamically. To display the newest data, click Show newest data.
620 | Viewing Reports and Logs
Viewing TCP memory reports
Viewing TCP memory reportsThe TCP Memory report simplifies the analysis of unexplainable throughput degradations, stalled and
timed-out connections, and other network-related problems by providing the history of the TCP
memory consumption and any TCP memory pressure events detected during network traffic
processing. Use this report to gather preliminary information before calling Riverbed Support to
troubleshoot an issue.
For details about the report format, see “Overview” on page 493.
The TCP Memory report includes two graphs. The TCP usage graph provides the absolute number of
memory bytes allocated by the TCP subsystem. This graph includes these statistics that describe TCP
memory activity for the time period you specify.
The navigator shadows the memory usage series.
In many cases, even an insignificant increase in network traffic can cause TCP memory pressure, leading
to negative consequences. There are many conditions that can cause TCP memory pressure events.
However, all of them can be sorted into these two categories to identify the bottleneck in the data
transfer chain:
• Slow client cases - Occur when the receiver (client) is not able to accept data at the rate the client-side SteelFusion Edge or the server-side SteelHead transfers data. This condition usually causes two TCP memory pressure points—one on the sender's side and another one on the receiver's (client's) side. The slow client on the sender's side (usually the client-side Edge) is characterized by a large amount of unsent data collected in the send socket buffers. Incorrect appliance settings, such as overly large send buffers, can trigger TCP memory pressure, even with relatively normal network traffic.
Data series Description
Max Threshold Displays the maximum amount of memory bytes that the TCP stack can allocate for its needs.
Cutoff Threshold Displays the number of memory bytes allocated until the TCP memory allocation subsystem does not apply memory-saving mechanisms and rules. As soon as the TCP memory consumption reaches the cutoff limit, the TCP stack enters a “memory pressure” state. This state applies several important limitations that restrict memory use by incoming and transmitted packets. In practice, this means that part of the incoming packets can be discarded, and user space code is limited in its abilities to send data.
Enable Threshold Displays the lower boundary of TCP memory consumption, when the memory pressure state is cleared and the TCP stack can use the regular memory allocation approach again.
Memory Usage Displays the average memory consumption by the TCP/IP stack.
Memory Pressure Displays the maximum percentage of time that the kernel has spent under TCP memory pressure.

Viewing Reports and Logs | 621
Viewing TCP memory reports
• Fast server cases - Occur when the sender is able to transfer data faster than the receiver can accept it. This condition can be triggered not only because of insufficient CPU resources, but also because of an insufficient disk transfer rate (especially with a cold and warm data pattern). The most common causes of this problem are a lack of processing power on the appliance and a large receive buffer setting.
What this report tells you
The TCP Memory report answers these questions:
• How much time is the kernel spending under TCP memory pressure?
• What is the average TCP memory consumption for the SteelFusion Edge?
About report graphs
Mouse over a specific data point to see the values and exact time stamp.
About report data
The Riverbed system reports on performance for periods up to one month. Due to performance and disk
space considerations, the display granularity decreases with time passed since the data was sampled
with a granularity of 5 minutes for the day, 1 hour for the last week, and 2 hours for the rest of the month.

622 | Viewing Reports and Logs
Viewing system detail reports
To view the TCP Memory report
1. Choose Administration > Diagnostics: TCP Memory to display the TCP Memory page.
Figure 13-40. TCP Memory page
Use the controls to customize the report as described in this table.
Viewing system detail reportsThe System Details report takes a current snapshot of the system to provide a one-stop report you can
use to check for any issues with the appliance. The report examines key system components. For
example, the CPU and memory. Use this report to gather preliminary system information before calling
Riverbed Support to troubleshoot an issue.
Control Description
Time Interval Select a report time interval of 5 minutes (5m), 1 hour (1h), 1 day (1d), 1 week (1w), All, or type a custom date. All includes statistics for the last 30 days.
Time intervals that don’t apply to a particular report are dimmed.
For a custom time interval, enter the start time and end time using the format yyyy/mm/dd hh:mm:ss
You can quickly see the newest data and see data points as they’re added to the chart dynamically. To display the newest data, click Show newest data.

Viewing Reports and Logs | 623
Viewing system detail reports

624 | Viewing Reports and Logs
Viewing system detail reports
Column Description
Module Displays the SteelFusion Edge module. Select a module name to view details. A right arrow to the left of a module indicates that the report includes detailed information about a submodule. Click the arrow to view submodule details.
This report examines these modules:
• CPU - Displays information about idle time, system time, and user time per CPU.
• Memory - Displays information about the total, used, and free memory by percentage and in kilobytes.
• CIFS - Click the right arrow and the submodule name to view details for unexpected shutdowns and round-trip statistics.
• HTTP - Click the right arrow and the submodule name to view details for the URL Learning, Parse and Prefetch, and Object Prefetch Table optimization schemes.
• Intercept - Click the right arrow to view statistics for message queue, GRE, and WCCP. Also includes table length and watchdog status.
• Lotus Notes - Displays whether Lotus Notes optimization is enabled.
• MAPI - Click the right arrow and the submodule name to view details for:
Accelerators - Displays how many accelerator objects have been created for read-ahead, write-behind, and cached-mode folder synchronization. One accelerator object corresponds to the optimization of one particular Outlook action.
– Read-ahead is for downloading an email attachment (in noncached Outlook mode or for public folders).
– Write-behind is for uploading an email attachment.
– Cache-sync is for downloading the new contents of a folder (in cached mode).
Requests and responses - Displays the number of MAPI round trips used and saved. Includes the number of responses and faults along with the fault reason: for example, access denied.
MAPI decryption and encryption (RPCCR) - Displays whether MAPI decryption and encryption is enabled. Includes the number of client-side and server-side appliance encrypted MAPI sessions, along with details about how many sessions were not encrypted, how many sessions were successfully decrypted and encrypted, how many sessions were passed through, and how many sessions experienced an authentication failure.
Connection sessions - Displays the number of client-side and server-side appliance MAPI sessions, counting the number of MAPI 2000, 2003, 2007, and pass-through sessions.

Viewing Reports and Logs | 625
Viewing system detail reports
What this report tells you
The System Details report answers this question:
• Is there a problem with one particular application module or does the issue affect multiple modules?
• Oracle Forms - Click the right arrow and submodule name to view details for native and HTTP mode key.
• Secure Peering - Click the right arrow and submodule name to view details for secure inner channels, including information about certificate and private key validity, peer SteelHead trust, and blacklisted servers.
• Splice Policy - Displays details about the splice policy in use.
• SSL - Displays whether SSL optimization is enabled and details about the SSL configuration, such as which advanced settings are in use. Click the right arrow and the submodule name to view details for the SSL outer and inner channels.
Status Displays one of these results:
• OK (Green)
• Warning (Yellow)
• Error (Red)
• Disabled (Gray). Appears when you manually disable the module.
Column Description
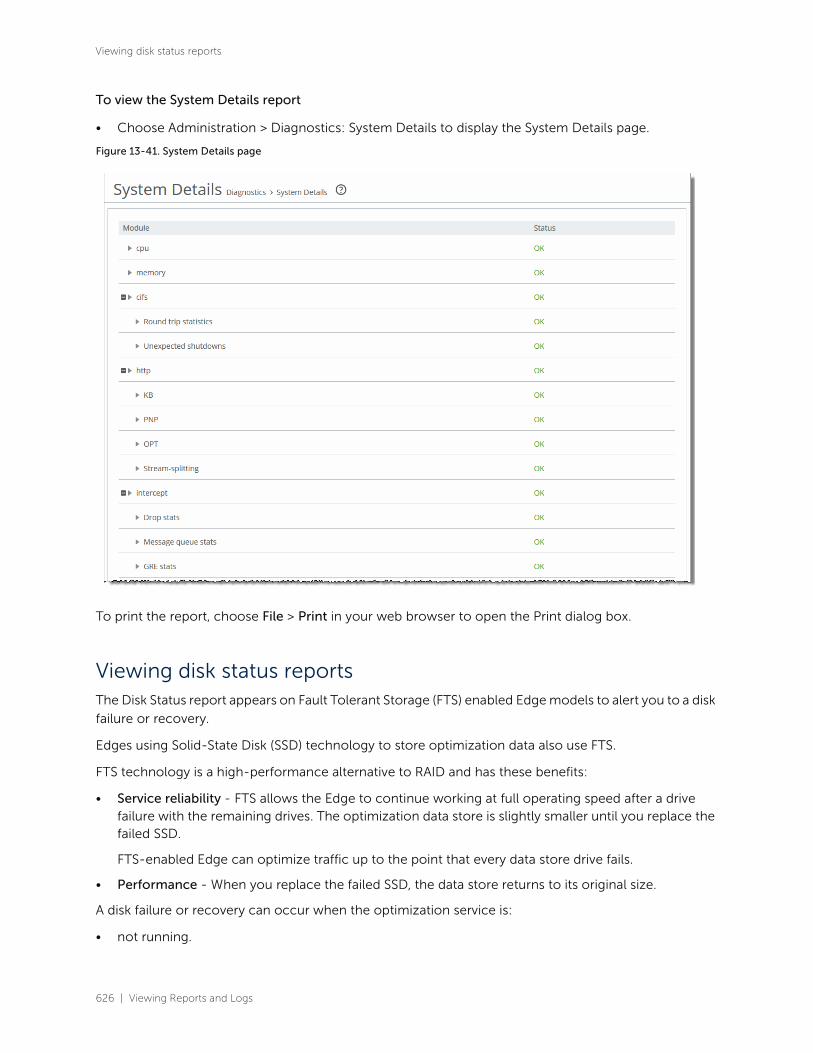
626 | Viewing Reports and Logs
Viewing disk status reports
To view the System Details report
• Choose Administration > Diagnostics: System Details to display the System Details page.
Figure 13-41. System Details page
To print the report, choose File > Print in your web browser to open the Print dialog box.
Viewing disk status reportsThe Disk Status report appears on Fault Tolerant Storage (FTS) enabled Edge models to alert you to a disk
failure or recovery.
Edges using Solid-State Disk (SSD) technology to store optimization data also use FTS.
FTS technology is a high-performance alternative to RAID and has these benefits:
• Service reliability - FTS allows the Edge to continue working at full operating speed after a drive failure with the remaining drives. The optimization data store is slightly smaller until you replace the failed SSD.
FTS-enabled Edge can optimize traffic up to the point that every data store drive fails.
• Performance - When you replace the failed SSD, the data store returns to its original size.
A disk failure or recovery can occur when the optimization service is:
• not running.

Viewing Reports and Logs | 627
Viewing disk status reports
• running, but idle because there is no traffic.
• handling optimized connections but not using the disk.
• writing to the disk.
• reading from the disk.
The Disk Status report includes this information.
What this report tells you
The Disk Status report answers these questions:
• How many disks are on the SteelFusion Edge?
• What is the current status of each disk?
• What function is the disk performing?
Column Description
Disk Displays the disk number.
Status Displays the disk status:
• Degraded - Indicates a failure of one or more of the RAID arrays. The disk itself has not failed.
• Failed - Indicates the disk has failed. The alarm email notification denotes whether the failure is on a management or data store disk. The optimization service continues to run normally without interruption or dropped connections when a single disk fails, albeit with reduced data store capacity and performance degradation.
This message can also indicate that a disk has been inserted into an incorrect slot or that the disk has already been used in another Edge.
If all disks fail, the optimization service halts.
Consult the system log for more information.
Riverbed replaces the failed component at Riverbed’s expense as long as the device is covered by a current support contract. Depending on the level of support contract, a trained engineer could be on site with the replacement part within four hours. If the report displays a failed disk status, go to Riverbed Support:
https://support.riverbed.com
• Missing - There is no disk in the slot.
• Rebuilding - The disk is rebuilding after it has been inserted into the slot. Rebuilding a data store disk takes approximately one hour or less to rebuild; a management disk that is part of a RAID mirror can take longer (4 to 6 hours). The status continues to be rebuilding until the drive is completely rebuilt.
• Online - Disk is up and working.
Task Displays the system component the disk is used for: either data store or management. If the disk is used for both, the task column does not appear.
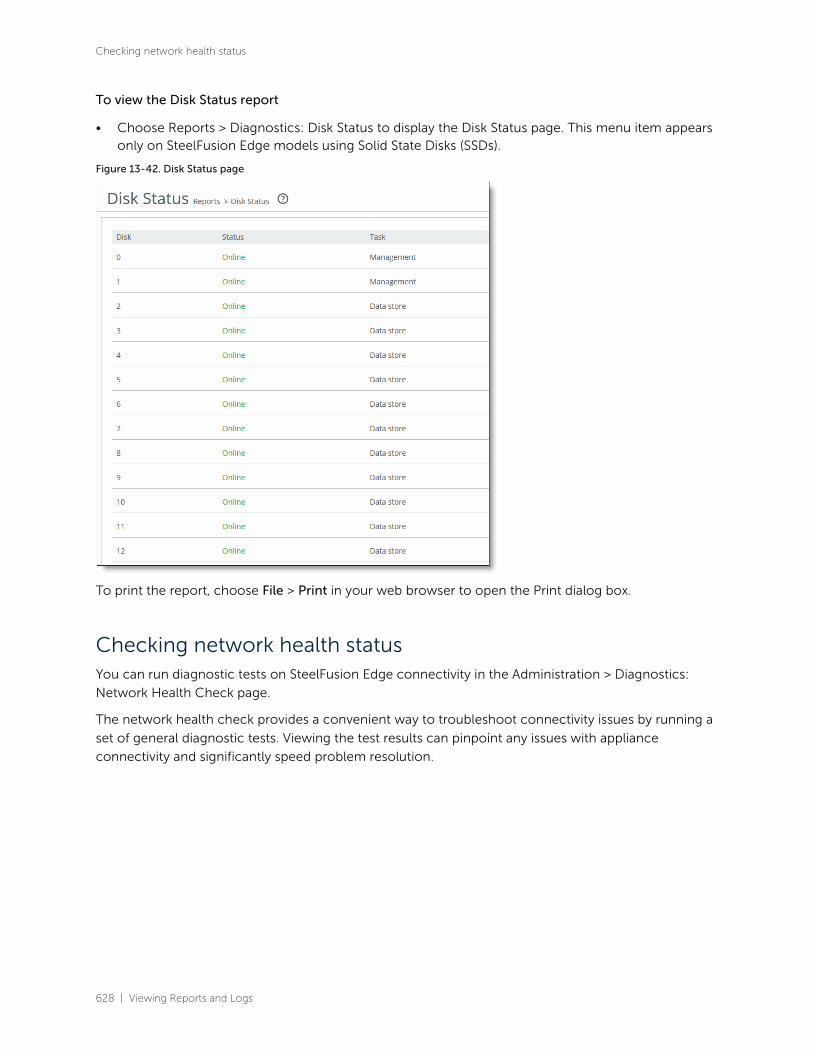
628 | Viewing Reports and Logs
Checking network health status
To view the Disk Status report
• Choose Reports > Diagnostics: Disk Status to display the Disk Status page. This menu item appears only on SteelFusion Edge models using Solid State Disks (SSDs).
Figure 13-42. Disk Status page
To print the report, choose File > Print in your web browser to open the Print dialog box.
Checking network health statusYou can run diagnostic tests on SteelFusion Edge connectivity in the Administration > Diagnostics:
Network Health Check page.
The network health check provides a convenient way to troubleshoot connectivity issues by running a
set of general diagnostic tests. Viewing the test results can pinpoint any issues with appliance
connectivity and significantly speed problem resolution.

Viewing Reports and Logs | 629
Checking network health status
To run diagnostic tests
1. Choose Administration > Diagnostics: Network Health Check to display the Network Health Check page.
Figure 13-43. Network Health Check page

630 | Viewing Reports and Logs
Checking network health status
Complete the configuration as described in this table.
Control Description
Gateway Test Determines if each configured gateway is connected correctly. Run this test to ping each configured gateway address with 4 packets and record the number of failed or successful replies. The test passes if all 4 packets are acknowledged. The default packet size is 64 bytes.
• Internet Protocol - Select IPv4 or IPv6 from the drop-down list.
• Run - Click to run the test.
If the test fails and all packets are lost, ensure the gateway IP address is correct and the SteelHead is on the correct network segment. If the gateway is reachable from another source, check the connections between the SteelHead and the gateway.
If the test fails and only some packets are lost, check your duplex settings and other network conditions that might cause dropped packets.
Cable Swap Test Ensures that the WAN and LAN cables on the SteelHead are connected to the LAN and WAN of the network. The test enumerates the results by interface (one row entry per pair of bypass interfaces).
By default, this test is disabled.
Note: Certain network topologies might cause an incorrect result for this test. For the following topologies, we recommend that you confirm the test result manually:
• SteelHeads deployed in virtual in-path mode.
• Server-side SteelHeads that receive significant amounts of traffic from nonoptimized sites.
• SteelHeads that sit in the path between other SteelHeads that are optimizing traffic.
If the test fails, ensure a straight-through cable is not in use between an appliance port and a router, or that a crossover cable is not in use between an appliance port and a switch.
Duplex Test Determines if the speed and duplex settings match on each side of the selected interface. If one side is different from the other, then traffic is sent at different rates on each side, causing a great deal of collision. This test runs the ping utility for 5 seconds with a packet size of 2500 bytes against the interface.
• Interface - Specify an interface to test.
• IP Address - Specify an IPv4 or IPv6 address that is on the testing interface side.
• Run - Click to run the test.
The test passes if the system acknowledges 100 percent of the packets and receives responses from all packets. If any packets are lost, the test fails.
If the test fails, ensure the speed and duplex settings of the appliance's Ethernet interface matches that of the switch ports to which it’s connected.
The test output records the percentage of any lost packets and number of collisions.
Note: For accurate test results, traffic must be running through the SteelHead.

Viewing Reports and Logs | 631
Checking network health status
Viewing the test status
The Last Run column displays the time and date the last test was run.
The Status column displays Initializing temporarily while the page loads. When the test starts, the Status
column displays Running, and then the test result appears in the Results column.
Viewing the test results
The Results column displays one of these test results:
• Passed
• Failed
• Undetermined - A test with an undetermined status indicates that the test could not accurately determine a pass or fail test status.
Peer Reachability Test Select to send a test probe to a specified peer and await the probe response. If a response is not received, the test fails.
To view the current peer appliances, choose Reports > Optimization: Peers.
• IP Address - Specify the IPv4 or IPv6 address of the peer appliance to test.
• Run - Click to run the test.
Notes:
• This test might not be accurate when the peer SteelHead is configured out-of-path.
• Do not specify the primary or auxiliary IP of the same SteelHead displayed in the Peers report (the primary or auxiliary IP to which the SteelHead is connected).
If the test fails, ensure that there are no firewalls, IDS/IPS, VPNs, or other security devices that might be stripping or dropping connection packets between SteelHeads.
IP Port Reachability Test
Select to determine whether a specified IP address and optional port is correctly connected. If you specify only an IP address, the test sends an ICMP message to the IP address. If you specify a port number, the test telnets to the port.
• Interface - Optionally, specify an interface to test.
• IP Address - Specify the IP4 or IPv6 address to test.
• Port - Optionally, specify a port to test.
• Run - Click to run the test.
If the test fails, ensure that dynamic or static routing on your network is correctly configured and that the remote network is reachable from hosts on the same local subnet as this appliance.
Run Selected Runs the selected tests.
View or Hide Test Output
Click to view or hide the test results.
Control Description
632 | Viewing Reports and Logs
Checking domain health
To view diagnostic test results
1. Choose Reports > Diagnostics: Network Health Check to display the Network Health Check page.
2. Under the test name, click View Test Output.
To print the test results, click View Test Output and choose File > Print in your web browser to open the
Print dialog box.
Checking domain healthYou run Windows domain diagnostic tests on a SteelHead in the Reports > Diagnostics: Domain Health
Check page.
The RiOS Windows domain health check executes a variety of tests that provide diagnostics about the
status of domain membership, end-to-end Kerberos replication, both manual and automatic
constrained delegation, and DNS resolution. This information enables you to resolve issues quickly.
Before running domain diagnostic delegation or replication tests, choose Optimization > Active
Directory: Auto Config or Optimization > Active Directory: Service Accounts to configure a Windows
user account that you can use for delegation or replication purposes. The Windows domain health check
on the appliance does not create the delegate or replication user; the Windows domain administrator
must create the account in advance. For details, see “Easy domain authentication configuration” on
page 244 or “Windows domain authentication” on page 242.

Viewing Reports and Logs | 633
Checking domain health
To run domain health tests
1. Choose Reports > Diagnostics: Domain Health Check to display the Domain Health Check page.
Figure 13-44. Domain health check page
Control Description
Test DNS Checks the DNS settings, which must be correct for Windows domain authentication, SMB signing, SMB2/3 signing, and encrypted MAPI optimization. A test status appears for the most recent test run: Passed, Failed, or Undetermined.
• Domain/Realm - Specify the fully qualified Active Directory domain in which the SteelHead is a member. Typically, this is your company domain name.
• Test DNS - Click to run the test. The Management Console dims this button until you specify the domain name.
Test Join Confirms that the appliance is correctly joined to the Windows domain by verifying that the domain join configuration of the appliance is valid on the backend domain controller in Active Directory. A test status appears for the most recent test run: Passed, Failed, or Undetermined.
• Test Join - Click to run the test.
634 | Viewing Reports and Logs
Checking domain health
Test Delegation Setup Checks whether an account has the necessary Active Directory privileges for delegation or automatic delegation. A test status appears for the most recent test run: Passed, Failed, or Undetermined.
• Delegation Domain/Realm - Select the fully qualified domain in which the SteelHead is a member. Typically, this is your company domain name.
• Domain Controller - Specify the host that provides user login service in the domain.
• Test Delegation Setup - Click to run the test. The Management Console dims this button until you specify all required information.
Test Delegation Privileges Confirms delegation privileges for a particular server by verifying that the correct privileges are set to perform constrained delegation. Within SMB signing, SMB2/3 signing, and encrypted MAPI in delegation mode, the appliance and the AD environment must have correct privileges to obtain Kerberos tickets for the CIFS or Exchange server and perform the subsequent authentication. A test status appears for the most recent test run: Passed, Failed, or Undetermined.
• Delegation Domain/Realm - Select the domain in which the SteelHead is a member. Typically, this is your company domain name.
• Server - Specify a delegate server hostname.
• Server IP - Specify the delegate server IP address.
• Service - Select either CIFS or Exchange MDB.
• Account to Delegate - Specify a domain username.
• Test Delegation Privileges - Click to run the test. The Management Console dims this button until you specify all required information.
Test NTLM Authentication Tests whether NTLM can successfully authenticate a user to the joined domain. A test status appears for the most recent test run: Passed, Failed, or Undetermined.
• Username - Specify an Active Directory domain username.
• Password - Specify a password.
• Domain/Realm - Specify the fully qualified domain of the Active Directory in which the SteelHead is a member. Typically, this is your company domain name.
• Short Domain Name - Specify the short domain (NetBIOS) name if it does not match the first portion of the Active Directory domain name. Case matters; NBTTECH is not the same as nbttech.
• Test NTLM Authentication - Click to run the test. The Management Console dims this button until you specify all required information.
Control Description

Viewing Reports and Logs | 635
Checking domain health
Viewing the test status
The time and date of the last test appears after Last Run.
When the test runs, the status In Progress appears. After the test completes, the test logs and test result
appear.
Viewing the test results
The test result can be one of these statuses:
• Passed
• Failed
• Undetermined - A test with an undetermined status indicates that the test could not accurately determine a pass or fail test status.
Test Replication Setup Tests the ability to replicate the server account by attempting to replicate a server account using the replication user for the domain. A test status appears for the most recent test run: Passed, Failed, or Undetermined.
• Delegation Domain/Realm - Select the fully qualified domain of the Active Directory in which the replication user is a trusted member. For example, REPLICATION.TEST.
• Short Domain Name - Specify the short domain (NetBIOS) name (or replication server) if it does not match the first portion of the Active Directory domain name. Case matters; NBTTECH is not the same as nbttech.
• Replication Server - Specify a CIFS or Exchange replication server hostname.
• Test Replication Setup - Click to run the test. The Management Console dims this button until you specify all required information.
Test Replication PRP Ensures that the server account can be replicated as per the password replication policy (PRP) on the domain controller. This test only works for Windows 2008 and later domains. A test status appears for the most recent test run: Passed, Failed, or Undetermined.
• Replication Domain/Realm - Select the fully qualified domain of the Active Directory in which the replication user is a trusted member: for example, REPLICATION.TEST.
• Domain Controller - Specify the host that provides user login service in the domain.
• Replication Server - Specify a CIFS or Exchange replication server hostname.
• Test Replication PRP - Click to run the test. The Management Console dims this button until you specify all required information.
Control Description
636 | Viewing Reports and Logs
Verifying hardware capabilities of a SteelHead-v
To view diagnostic test logs
• Click Show logs. The number of lines in the log appear after Show logs or Hide logs.
The test logs are usually interesting only after a test fails.
An abbreviated form of the time stamp appears in the left margin of each line. To see the original, full
time stamp in the form of a tooltip, mouse over a time stamp. Not all log lines have time stamps, because
third-party applications generate some of the logging data.
The log lines highlight errors in red and warnings in yellow.
Common domain health errors
This section describes common problems that can occur when joining a Windows domain.
System time mismatch
The number one cause of failing to join a domain is a significant difference in the system time on the
Windows domain controller and the SteelHead. When the time on the domain controller and the
SteelHead do not match, this error message appears:
lt-kinit: krb5_get_init_creds: Clock skew too great
We recommend using NTP time synchronization to synchronize the client and server clocks. It is critical
that the SteelHead time is the same as on the Active Directory controller. Sometimes an NTP server is
down or inaccessible, in which case there can be a time difference. You can also disable NTP if it is not
being used and manually set the time. You must also verify that the time zone is correct. For details, see
“Configuring the date and time” on page 474.
Note: Select the primary DNS IP address to display the Networking > Networking: Host Settings page.
Invalid domain controller IP
A domain join can fail when the DNS server returns an invalid IP address for the domain controller. When
a DNS misconfiguration occurs during an attempt to join a domain, these error messages appear:
Failed to join domain: failed to find DC for domain <domain-name>
Failed to join domain: No Logon Servers
Additionally, the Domain Join alarm triggers and messages similar to these appear in the logs:
Oct 13 14:47:06 bravo-sh81 rcud[10014]: [rcud/main/.ERR] - {- -} Lookup for bravo-sh81.GEN-VCS78DOM.COM Failed Oct 13 14:47:06 bravo-sh81 rcud[10014]: [rcud/main/.ERR] - {- -} Failed to join domain: failed to find DC for domain GEN-VCS78DOM.COM
When you encounter this error, choose Networking > Networking: Host Settings and verify that the DNS
settings are correct.
Verifying hardware capabilities of a SteelHead-vThis performance test verifies optimization and disk use performance for a SteelHead-v.
This performance test pertains only to SteelHead-v appliances.
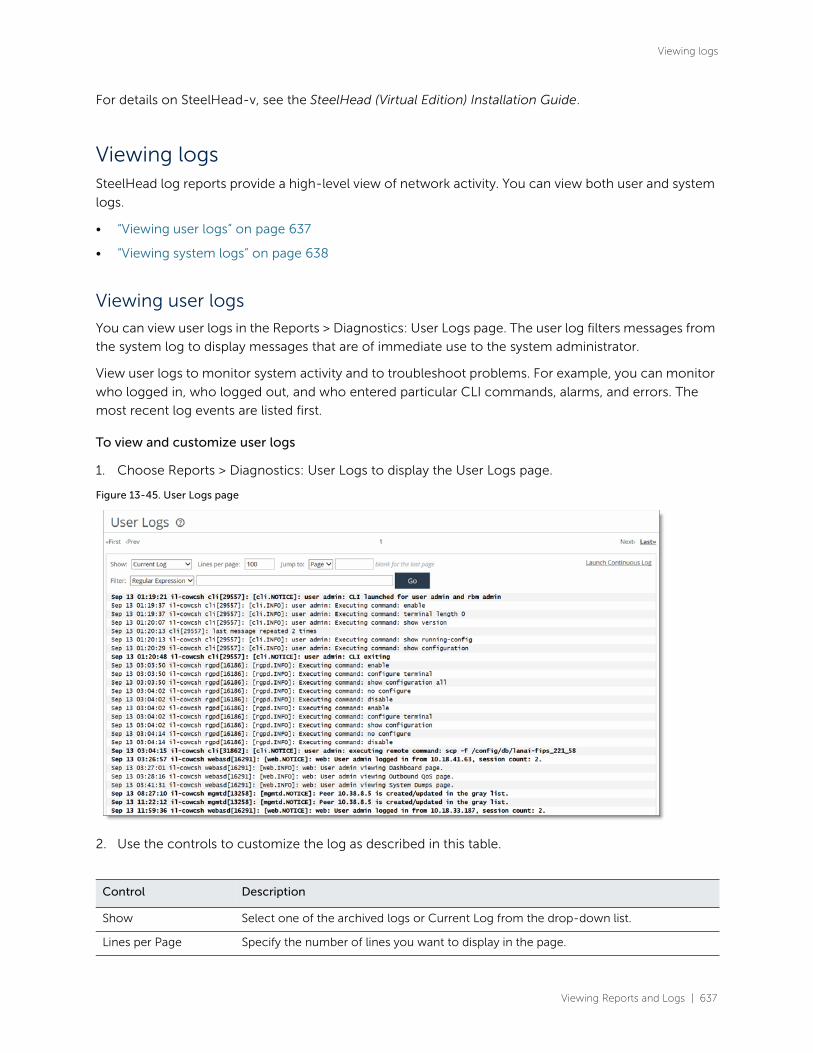
Viewing Reports and Logs | 637
Viewing logs
For details on SteelHead-v, see the SteelHead (Virtual Edition) Installation Guide.
Viewing logsSteelHead log reports provide a high-level view of network activity. You can view both user and system
logs.
• “Viewing user logs” on page 637
• “Viewing system logs” on page 638
Viewing user logs
You can view user logs in the Reports > Diagnostics: User Logs page. The user log filters messages from
the system log to display messages that are of immediate use to the system administrator.
View user logs to monitor system activity and to troubleshoot problems. For example, you can monitor
who logged in, who logged out, and who entered particular CLI commands, alarms, and errors. The
most recent log events are listed first.
To view and customize user logs
1. Choose Reports > Diagnostics: User Logs to display the User Logs page.
Figure 13-45. User Logs page
2. Use the controls to customize the log as described in this table.
Control Description
Show Select one of the archived logs or Current Log from the drop-down list.
Lines per Page Specify the number of lines you want to display in the page.

638 | Viewing Reports and Logs
Viewing logs
3. To print the report, choose File > Print in your web browser to open the Print dialog box.
You can continuously display new lines as the log grows and appends new data.
To view a continuous log
1. Choose Reports > Diagnostics: User Logs to display the User Logs page.
2. Customize the log as described in “To view and customize user logs” on page 637.
3. Click Launch Continuous Log in the upper-right corner of the page.
Note: If the continuous log does not appear after clicking Launch Continuous Log, a pair of appliances might be
optimizing HTTP traffic between the user's web browser and the primary or auxiliary interface of the appliance for
which the user is viewing the log, and they are buffering the HTTP response.
To display the continuous log, you can switch to HTTPS because the appliances will not optimize HTTPS traffic.
Alternatively, you can configure the other appliances to pass-through traffic on the primary or auxiliary interfaces
for port 80.
Viewing system logs
You can view system logs in the Reports: Diagnostics: System Logs page. View System logs to monitor
system activity and to troubleshoot problems. The most recent log events are listed first.
Jump to Select one of these options from the drop-down list:
• Page - Specify the number of pages you want to display.
• Time - Specify the time for the log you want to display.
Filter Select one of these filtering options from the drop-down list:
• Regular expression - Specify a regular expression on which to filter the log.
• Error or higher - Displays Error level logs or higher.
• Warning or higher - Displays Warning level logs or higher.
• Notice or higher - Displays Notice level logs or higher.
• Info or higher - Displays Info level logs or higher.
Go Displays the report.
Control Description

Viewing Reports and Logs | 639
Viewing logs
To customize system logs
1. Choose Reports > Diagnostics: System Logs to display the System Logs page.
Figure 13-46. System Logs page
Use the controls to customize the report as described in this table.
To print the report, choose File > Print in your web browser to open the Print dialog box.
To view a continuous log
1. Choose Reports > Diagnostics: System Logs to display the System Logs page.
2. Customize the log as described in “To customize system logs” on page 639.
Control Description
Show Select one of the archived logs or Current Log from the drop-down list.
Lines per page Specify the number of lines you want to display in the page.
Jump to Select one of these options from the drop-down list:
• Page - Specify the number of pages you want to display.
• Time - Specify the time for the log you want to display.
Regular Expression Filter
Select one of these filtering options from the drop-down list:
• Regular expression - Specify a regular expression on which to filter the log.
• Error or higher - Displays Error level logs or higher.
• Warning or higher - Displays Warning level logs or higher.
• Notice or higher - Displays Notice level logs or higher.
• Info or higher - Displays Info level logs or higher.
Go Displays the report.

640 | Viewing Reports and Logs
Downloading log files
3. Click Launch Continuous Log in the upper-right corner of the page.
Note: If the continuous log does not appear after clicking Launch Continuous Log, a pair of appliances might be
optimizing the HTTP traffic between the user's web browser and the primary or auxiliary interface of the appliance
for which the user is viewing the log, and they are buffering the HTTP response.
To display the continuous log, you can switch to HTTPS because the appliances will not optimize HTTPS traffic. You
might want to configure the other appliances to pass-through traffic on the primary or auxiliary interface
Downloading log filesThis section describes how to download user and system log files.
You can download both user and system logs.
• “Downloading user log files” on page 640
• “Downloading system log files” on page 641
Downloading user log files
You can download user logs in the User Logs Download page. Download user logs to monitor system
activity and to troubleshoot problems.
The User Logs Download page displays up to 10 archived log files plus the current day log file. By default,
the system rotates each file every 24 hours or if the file size reaches one Gigabyte uncompressed. You
can change this to rotate every week or month in the Administration: System Settings > Logging page.
Additionally, you can rotate the files based on file size.
The automatic rotation of system logs deletes your oldest log file, labeled as Archived log #10, pushes
the current log to Archived log # 1, and starts a new current-day log file.

Viewing Reports and Logs | 641
Downloading log files
To download user logs
1. Choose Reports > Diagnostics: User Logs Download to display the User Logs Download page.
Figure 13-47. User Logs Download page
2. Click the log name in the Download Plain Text column or the Download Compressed column.
3. Open or save the log (these procedures vary depending on which browser you are using).
4. Click Rotate Logs to manually archive the current log to a numbered archived log file and then clear the log so that it is empty again.
When you click Rotate Logs, your archived file #1 contains data for a partial day because you are writing a new log before the current 24-hour period is complete.
Downloading system log files
You can download system logs in the System Logs Download page. Download system logs to monitor
system activity and to troubleshoot problems.
The System Logs Download page displays up to 10 archived log files plus the current day log file. By
default, the system rotates each file every 24 hours or if the file size reaches one Gigabyte
uncompressed. You can change this to rotate every week or month in the Administration: System
Settings > Logging page. Additionally, you can rotate the files based on file size.
The automatic rotation of system logs deletes your oldest log file, labeled as Archived log #10, pushes
the current log to Archived log # 1, and starts a new current-day log file.

642 | Viewing Reports and Logs
Generating system dumps
To download system logs
1. Choose Reports > Diagnostics: System Logs Download to display the System Logs Download page.
Figure 13-48. System Logs Download page
2. Click the log name in the Download Plain Text column or the Download Compressed column.
3. Open or save the log (these procedures vary depending on which browser you are using).
4. Click Rotate Logs to manually archive the current log to a numbered archived log file and then clear the log so that it is empty again.
When you click Rotate Logs, your archived file #1 contains data for a partial day because you are writing a new log before the current 24-hour period is complete.
Generating system dumpsYou can generate, display, and download system dumps in the System Dumps page. A system dump
contains a copy of the kernel data on the system. System dump files can help you diagnose problems in
the system.
You can generate, display, and download system dumps for the hypervisor using the CLI. For details, see
the SteelFusion Command-Line Interface Reference Manual.
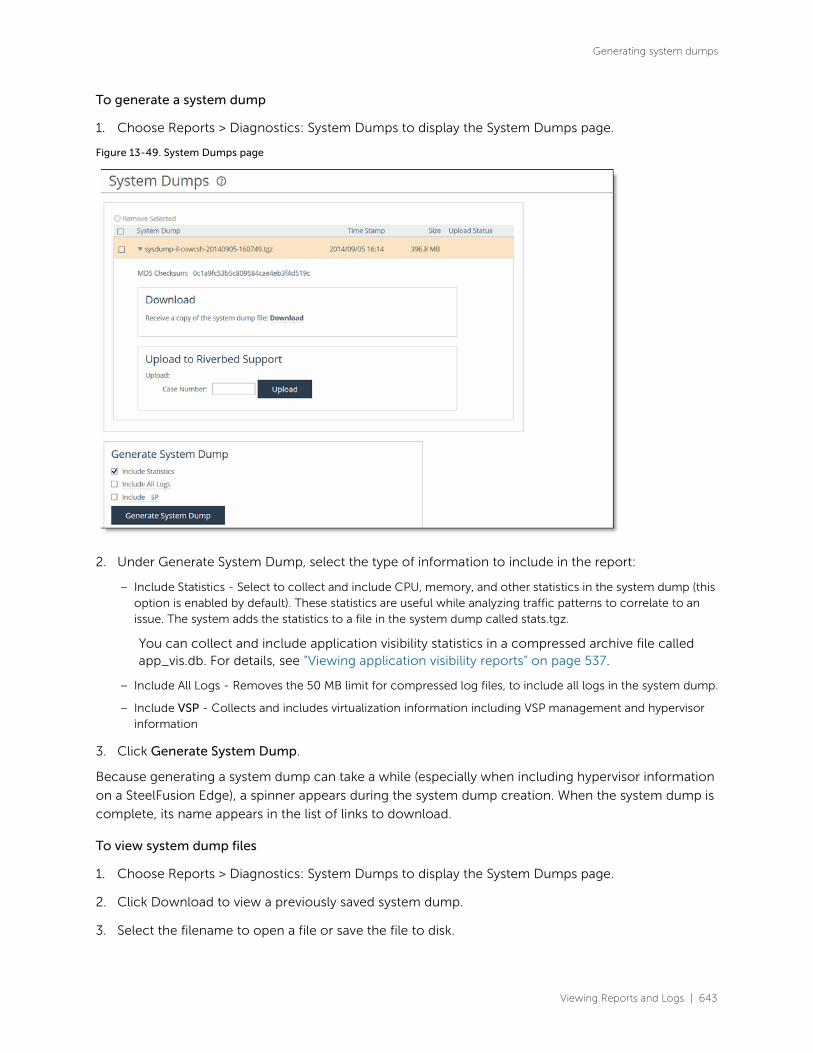
Viewing Reports and Logs | 643
Generating system dumps
To generate a system dump
1. Choose Reports > Diagnostics: System Dumps to display the System Dumps page.
Figure 13-49. System Dumps page
2. Under Generate System Dump, select the type of information to include in the report:
– Include Statistics - Select to collect and include CPU, memory, and other statistics in the system dump (this option is enabled by default). These statistics are useful while analyzing traffic patterns to correlate to an issue. The system adds the statistics to a file in the system dump called stats.tgz.
You can collect and include application visibility statistics in a compressed archive file called app_vis.db. For details, see “Viewing application visibility reports” on page 537.
– Include All Logs - Removes the 50 MB limit for compressed log files, to include all logs in the system dump.
– Include VSP - Collects and includes virtualization information including VSP management and hypervisor information
3. Click Generate System Dump.
Because generating a system dump can take a while (especially when including hypervisor information
on a SteelFusion Edge), a spinner appears during the system dump creation. When the system dump is
complete, its name appears in the list of links to download.
To view system dump files
1. Choose Reports > Diagnostics: System Dumps to display the System Dumps page.
2. Click Download to view a previously saved system dump.
3. Select the filename to open a file or save the file to disk.

644 | Viewing Reports and Logs
Viewing process dumps
4. To remove a log, select the check box next to the name and click Remove Selected.
To print the report, choose File > Print in your web browser to open the Print dialog box.
To upload a system dump file to Riverbed support
1. Choose Reports > Diagnostics: System Dumps to display the System Dumps page.
2. Select the filename.
3. Optionally, specify a case number that corresponds to the system dump. Riverbed Support recommends using a case number: for example, 194170.
You can also enter the file debug-dump upload <url> command to specify a URL instead of a case number. When you specify a URL, the dump file goes directly to the URL.
If the URL points to a directory on the upload server, it must have a trailing backslash (/).
For example:
ftp://ftp.riverbed.com/incoming/
(not ftp://ftp.riverbed.com/incoming)
The filename as it exists on the appliance will then match the filename on the upload server.
For details, see the Riverbed Command-Line Interface Reference Manual.
4. Click Upload.
Because uploading a system dump can take a while (especially when including ESXi information on a
SteelFusion Edge), the status appears during the upload. When the system dump finishes uploading, the
date, time, and a status of either uploaded (appears in green) or failed (appears in red). An explanation
appears for uploads that fail.
Viewing process dumpsYou can display and download process dumps in the Process Dumps page. A process dump is a saved
copy of memory including the contents of all memory, bytes, hardware registers, and status indicators.
It is periodically taken to restore the system in the event of failure. Process dump files can help you
diagnose problems in the system.

Viewing Reports and Logs | 645
Viewing process dumps
To view process dump files
1. Choose Reports > Diagnostics: Process Dumps to display the Process Dumps page.
Figure 13-50. Process Dumps page
2. Select the filename to open a file or save the file to disk.
To remove an entry, select the check box next to the name and click Remove Selected.
To print the report, choose File > Print in your web browser to open the Print dialog box.
To download a process dump file to Riverbed support
1. Choose Reports > Diagnostics: Process Dumps to display the Process Dumps page.
2. Click Download to receive a copy of the previously saved process dump.
3. Select the filename to open a file or save the file to disk.
4. To remove a log, select the check box next to the name and click Remove Selected.
To print the report, choose File > Print in your web browser to open the Print dialog box.
To upload a process dump file to Riverbed support
1. Choose Reports > Diagnostics: Process Dumps to display the Process Dumps page.
2. Optionally, specify a case number that corresponds to the process dump. Riverbed Support recommends using a case number: for example, 194170.
You can also enter the file process dump-upload <url> command to specify a URL instead of a case number. When you specify a URL, the dump file goes directly to the URL.
If the URL points to a directory on the upload server, it must have a trailing backslash (/).
For example:
ftp://ftp.riverbed.com/incoming/

646 | Viewing Reports and Logs
Capturing and uploading TCP dump files
(not ftp://ftp.riverbed.com/incoming)
The filename as it exists on the appliance will then match the filename on the upload server.
For details, see the Riverbed Command-Line Interface Reference Manual.
3. Click Upload.
Because uploading a process dump can take a while (especially when including ESXi information on a
SteelFusion Edge), a progress bar appears during the upload. When the process dump finishes uploading,
the date, time, and a status of either uploaded (appears in green) or failed (appears in red). An explanation
appears for uploads that fail.
Capturing and uploading TCP dump filesYou can create, download, and upload TCP capture files in the Reports > Diagnostics: TCP Dumps page.
Capture files contain summary information for every internet packet received or transmitted on the
interface to help diagnose problems in the system.
RiOS provides an easy way to create and retrieve multiple capture files from the Management Console.
You can create capture files from multiple interfaces at the same time, limit the size of the capture file,
and schedule a specific date and time to create a capture file. Scheduling and limiting a capture file by
time or size allows unattended captures.
RiOS supports remote capture analysis using the SteelCentral Packet Analyzer on capture files created
and stored on the appliance without transferring the entire packet capture across the network. The
appliance includes this functionality as Embedded SteelCentral NetShark. Embedded SteelCentral
NetShark software enables on-demand packet capture on appliances at remote sites, and control and
analysis of packet captures on remote appliances directly from Packet Analyzer. You can use Embedded
SteelCentral NetShark to drill down to deliver microlevel flow resolution for analysis using Riverbed's
XML-based protocol on top of an HTTPS connection for transferring data to Packet Analyzer. You do not
need to transfer full packets until you need them.
Note: You cannot upload a capture file to the appliance using Packet Analyzer.
The top of the TCP Dumps page displays a list of existing capture files and the bottom of the page
displays controls to create a capture file. The bottom of the page also includes the capture files that are
currently running, and controls to create a trigger that stops a capture when a specific event occurs. The
Running Capture Name list includes captures running at a particular time. It includes captures started
manually and also any captures that were scheduled previously and are now running.

Viewing Reports and Logs | 647
Capturing and uploading TCP dump files
To capture TCP dumps
1. Choose Reports > Diagnostics: TCP Dumps to display the TCP Dumps page.
Figure 13-51. TCP Dumps page

648 | Viewing Reports and Logs
Capturing and uploading TCP dump files
2. Complete the configuration as described in this table.
Control Description
Add a New TCP Dump Displays the controls for creating a TCP trace dump.
Capture Name Specify the name of the capture file. The default filename uses this format:
<hostname>_<interface>_<timestamp>.cap
Where <hostname> is the hostname of the Edge, <interface> is the name of the interface selected for the trace (for example, lan0_1, wan0_1), and <timestamp> is in the yyyy-mm-dd-hh-mm-ss format.
If this trace dump relates to an open Riverbed Support case, specify the capture filename case_<number> where <number> is your Riverbed Support case number. For example, case_12345.
Note: The .cap file extension is not included with the filename when it appears in the capture queue.
Endpoints Specify IP addresses and port numbers to capture packets between them:
IPs - Specify IP addresses of endpoints on one side. Separate multiple IP addresses using commas. You can enter IPv6 addresses separated by commas. The default setting is all IP addresses.
Ports - Specify ports on one side. Separate multiple ports using commas. The default setting is all ports.
—and—
IPs - Specify IP addresses of endpoints on the other side. Separate multiple IP addresses using commas. You can enter IPv6 addresses separated by commas. The default setting is all IP addresses.
Ports - Specify ports on the other side. Separate multiple ports using commas. The default setting is all ports.
To capture traffic flowing in only one direction or to enter a custom command, use the tcpdump command. For details, see the Riverbed Command-Line Interface Reference Manual.
Capture Interfaces Captures the TCP trace dump on the selected interface(s). You can select all interfaces or a base, in-path, data, or miscellaneous interface. The default setting is none. You must specify a capture interface.
If you select several interfaces at a time, the data is automatically placed into separate capture files.
Viewing Reports and Logs | 649
Capturing and uploading TCP dump files
Capture Parameters These parameters let you capture information about dot1q VLAN traffic. You can match traffic based on VLAN-tagged or untagged packets, or both. You can also filter by port number or host IP address and include or exclude ARP packets. Select one of these parameters for capturing VLAN packets:
• Capture Untagged Traffic Only - Select this option for the following captures:
– All untagged VLAN traffic.
– Untagged 7850 traffic and ARP packets. You must also specify or arp in the custom flags field in this page.
– Only untagged ARP packets. You must also specify and arp in the custom flags field in this page.
• Capture VLAN-Tagged Traffic Only - Select this option for the following captures:
– Only VLAN-tagged traffic.
– VLAN-tagged packets with host 10.11.0.6 traffic and ARP packets. You must also specify 10.11.0.6 in the IPs field, and specify or arp in the custom flags field in this page.
– VLAN-tagged ARP packets only. You must also specify and arp in the custom flags field in this page.
• Capture both VLAN and Untagged Traffic - Select this option for the following captures:
– All VLAN traffic.
– Both tagged and untagged 7850 traffic and ARP packets. You must also specify the following in the custom flags field in this page:
(port 7850 or arp) or (vlan and (port 7850 or arp))
– Both tagged and untagged 7850 traffic only. You must also specify 7850 in one of the port fields in this page. No custom flags are required.
– Both tagged and untagged ARP packets. You must also specify the following in the custom flags field in this page:
(arp) or (vlan and arp)
Capture Duration (Seconds)
Specify a positive integer to set how long the capture runs, in seconds. The default value is 30. Specify 0 or continuous to initiate a continuous trace. For continuous capture, we recommend specifying a maximum capture size and a nonzero rotate file number to limit the size of the TCP dump.
Maximum Capture Size (MB)
Specify the maximum capture file size in megabytes. The default value is 100. The recommended maximum capture file size is 1024 MB (1 GB).
Buffer Size Optionally, specify the maximum number of packets allowed to queue up while awaiting processing by the TCP trace dump. The default value is 154.
Control Description
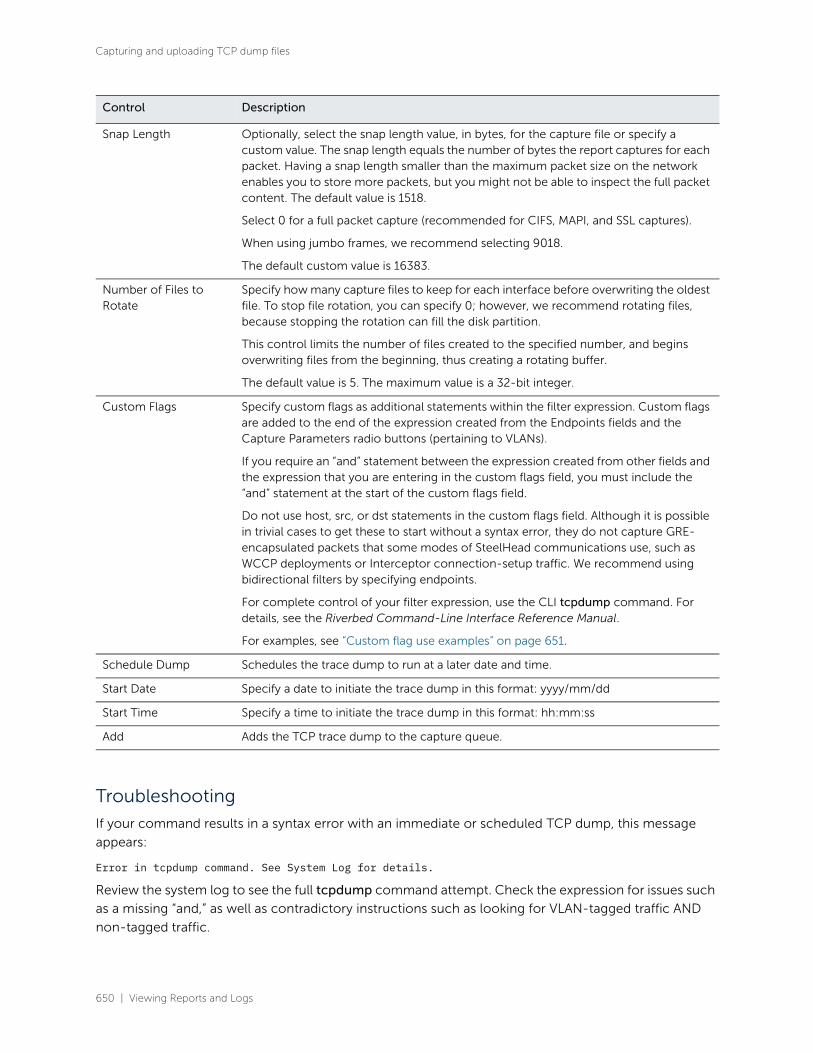
650 | Viewing Reports and Logs
Capturing and uploading TCP dump files
Troubleshooting
If your command results in a syntax error with an immediate or scheduled TCP dump, this message
appears:
Error in tcpdump command. See System Log for details.
Review the system log to see the full tcpdump command attempt. Check the expression for issues such
as a missing “and,” as well as contradictory instructions such as looking for VLAN-tagged traffic AND
non-tagged traffic.
Snap Length Optionally, select the snap length value, in bytes, for the capture file or specify a custom value. The snap length equals the number of bytes the report captures for each packet. Having a snap length smaller than the maximum packet size on the network enables you to store more packets, but you might not be able to inspect the full packet content. The default value is 1518.
Select 0 for a full packet capture (recommended for CIFS, MAPI, and SSL captures).
When using jumbo frames, we recommend selecting 9018.
The default custom value is 16383.
Number of Files to Rotate
Specify how many capture files to keep for each interface before overwriting the oldest file. To stop file rotation, you can specify 0; however, we recommend rotating files, because stopping the rotation can fill the disk partition.
This control limits the number of files created to the specified number, and begins overwriting files from the beginning, thus creating a rotating buffer.
The default value is 5. The maximum value is a 32-bit integer.
Custom Flags Specify custom flags as additional statements within the filter expression. Custom flags are added to the end of the expression created from the Endpoints fields and the Capture Parameters radio buttons (pertaining to VLANs).
If you require an “and” statement between the expression created from other fields and the expression that you are entering in the custom flags field, you must include the “and” statement at the start of the custom flags field.
Do not use host, src, or dst statements in the custom flags field. Although it is possible in trivial cases to get these to start without a syntax error, they do not capture GRE-encapsulated packets that some modes of SteelHead communications use, such as WCCP deployments or Interceptor connection-setup traffic. We recommend using bidirectional filters by specifying endpoints.
For complete control of your filter expression, use the CLI tcpdump command. For details, see the Riverbed Command-Line Interface Reference Manual.
For examples, see “Custom flag use examples” on page 651.
Schedule Dump Schedules the trace dump to run at a later date and time.
Start Date Specify a date to initiate the trace dump in this format: yyyy/mm/dd
Start Time Specify a time to initiate the trace dump in this format: hh:mm:ss
Add Adds the TCP trace dump to the capture queue.
Control Description

Viewing Reports and Logs | 651
Capturing and uploading TCP dump files
Custom flag use examples
The examples in this table focus on the custom flag entry but they rely on other fields to create a
complete filter.
IPv6 custom flag use examples
The examples in this table focus on the custom flag entry, but rely on other fields to create a complete
filter.
To build expressions for TCP dump, IPv6 filtering does not currently support the TCP, UDP, and other
upper-layer protocol types that IPv4 does. Also, these IPv6 examples are based on the assumption that
only a single IPv6 header is present.
Stopping a TCP dump after an event occurs
Capture files offer visibility into intermittent network issues, but the amount of traffic they capture can
be overwhelming. Also, because rotating logs is common, after a capture logs an event, the appliance
log rotation can overwrite debugging information specific to the event.
RiOS makes troubleshooting easier because it provides a trigger that can stop a continuous capture after
a specific log event occurs. The result is a smaller file to help pinpoint what makes the event happen.
The stop trigger continuously scans the system logs for a search pattern. When it finds a match, it stops
all running captures.
To stop a capture after a specific log event
1. Choose Administration > Diagnostics: TCP Dumps to display the TCP Dumps page.
Filter Purpose Custom Flag
To capture all traffic on VLAN 10 between two specified endpoints: 1.1.1.1 and 2.2.2.2
and vlan 10
To capture any packet with a SYN or an ACK tcp[tcpflags] & (tcp-syn|tcp-ack) != 0
To capture any packet with a SYN tcp[tcpflags] & (tcp-syn) != 0
—or—
tcp[13] & 2 == 2
To capture any SYN to or from host 1.1.1.1 and (tcp[tcpflags] & (tcp-syn) != 0)
—or—
and (tcp[13] & 2 == 2)
Filter Purpose Custom Flag
To capture all FIN packets to or from host 2001::2002 and (ip6[53] & 1!=0)
To capture all IPv6 SYN packets ip6 or proto ipv6 and (ip6[53] & 2 == 2)

652 | Viewing Reports and Logs
Capturing and uploading TCP dump files
2. Schedule a capture.
Figure 13-52. TCP Dumps page - TCP Dump Stop Trigger
3. In the Pattern text box, enter a Perl regular expression (regex) to find in a log. RiOS compares the Perl regex against each new line in the system logs and the trigger stops if it finds a match.
The simplest regex is a word or a string of characters. For example, if you set the pattern to “Limit,” the trigger matches the line “Connection Limit Reached.”
Notes:
– Perl regular expressions are case sensitive.
– Perl treats the space character like any other character in a regex.
– Perl reserves some characters, called metacharacters, for use in regex notation. The metacharacters are:
{ } [ ] ( ) ^ $ . | * + ? \
You can match a metacharacter by putting a backslash before it. For example, to search for a backslash in the logs, you must enter two backslashes (\\) as the pattern.
– The pattern follows Perl regular expression syntax. For details, go to:
http://perldoc.perl.org/perlre.html
– You cannot change the pattern while a scan is running. You must stop the scan before changing a pattern.
– You do not need to wrap the pattern with the metacharacters to match the beginning or end of a line (^ $) or with the wildcard character (*).
4. Specify the amount of time, in seconds, to pause before stopping all running captures when RiOS finds a match. The time delay gives the system some time to log more data without abruptly cutting off the capture. The default is 30. Specify 0 for no delay; the capture stops immediately.
After a trigger has fired, the capture can stop by itself before the delay expires. For example, the capture duration can expire.
5. Click Start Scan.
When the scan stops, RiOS sends an email to all email addresses on the Administration: System Settings > Email page appearing under Report Events via Email. The email notifies users that the trigger has fired.

Viewing Reports and Logs | 653
Capturing and uploading TCP dump files
The page indicates “Last Triggered: Never” if a TCP Dump stop trigger has never triggered on the
appliance. After the delay duration of the stop trigger, RiOS displays the last triggered time.
Before changing the Perl regular expression or amount of delay, you must first stop the process.
To stop a running scan
• Click Stop Scan to halt the background process that monitors the system logs. RiOS dims this button when the stop trigger is idling.
Stop trigger limitations
These limitations apply to the trigger:
• You cannot create a trigger to stop a specific capture; the trigger affects all running captures.
• If the search pattern contains a typo, the trigger might never find a match.
• Only one instance of a trigger can run at one time.
Viewing a TCP dump
The top of the TCP Dumps page displays a list of existing captures.
To view a capture file
1. Choose Reports > Diagnostics: TCP Dumps to display the TCP Dumps page.
2. Under Stored TCP Dumps, select the capture name to open the file.
3. Click Download to view a previously saved capture file.
4. To remove a capture file, select the check box next to the name and click Remove Selected.
To print a capture file
1. Choose Reports > Diagnostics: TCP Dumps to display the TCP Dumps page.
2. Under Download Link, select the capture filename to open the file.
3. When the file opens, choose File > Print in your web browser to open the Print dialog box.
To stop a running capture
1. Choose Reports > Diagnostics: TCP Dumps to display the TCP Dumps page.
2. Select the capture filename in the Running Capture Name list.
3. Click Stop Selected Captures.
Uploading a TCP dump
Riverbed offers a couple of ways to upload capture files to the support server for sharing with the support
team while diagnosing issues.
654 | Viewing Reports and Logs
Exporting performance statistics
To upload the capture file to Riverbed Support
1. In continuous mode, on the TCP Dumps page, select the running capture and click Stop Selected Captures.
For timed captures that are complete, skip to Step 2.
The capture appears as a download link in the list of Stored TCP Dumps.
2. Select the capture filename.
3. Optionally, specify a case number that corresponds to the capture. Riverbed Support recommends using a case number: for example, 194170.
To specify a URL instead of a case number, you must use the CLI. You can enter the file tcpdump upload <url> command. When you specify a URL, the capture file goes directly to the URL.
If the URL points to a directory on the upload server, it must have a trailing backslash (/).
For example:
ftp://ftp.riverbed.com/incoming/
(not ftp://ftp.riverbed.com/incoming)
The filename as it exists on the appliance will then match the filename on the upload server.
For details, see the Riverbed Command-Line Interface Reference Manual.
4. Click Upload.
Because uploading a capture file can take a while (especially when including ESXi information on an
Edge), a progress bar displays the percentage of the total upload completed, the case number (if
applicable), and the date and time the upload began. When the capture file finishes uploading, the date,
time, and a status of either uploaded (appears in green) or failed (appears in red).
Successful uploads show the status, the case number (if applicable), and the date and time the upload
finished.
For uploads that fail, an explanation, the case number (if applicable), and the upload starting date and
time appear.
Exporting performance statisticsYou export performance statistics in CSV format in the Reports > Report Data: Export page. The CSV
format allows you to easily import the statistics into spreadsheets and databases. You can open the CSV
file in any text editor.
The CSV file contains commented lines (comments beginning with the # character) at the beginning of
the file. These comments report what host generated the file, the report that was generated, time
boundaries, the time the export occurred, and the version of RiOS the file was exported from. The
statistical values are provided in columns: the first column is the date and time of the statistic sample,
and the columns that follow contain the data.

Viewing Reports and Logs | 655
Viewing in-path rule statistics
To export statistics
1. Choose Reports > Report Data: Export to display the Export page.
Figure 13-53. Export Report Data page
2. Use the controls to customize the report, as described in this table.
Viewing in-path rule statistics The In-Path Rule Statistics report displays statistics for in-path rules.
What this report tells you
The In-Path Rule Statistics report answers these questions:
• When was the rule created?
• What is the IP address of the host where the rule was created?
• Which user created the rule?
• How many hits are in-path rules getting?
• When was the last time the in-path rule was hit?
• When was the counter last cleared?
Control Description
Report Select the type of report you want to export from the drop-down list.
Period Select a report time interval of custom, last five minutes, last hour, last day, last week, or last month.
Email Delivery Sends the report to an email address.
Email Address Specify the email address of the recipient.
Export Exports the report data.

656 | Viewing Reports and Logs
Viewing in-path rule statistics
About report data
This report provides you with the following data:
• The number of hits each in-path rule is shown, which lets you see which in-path rules are being used, and which aren’t.
• All pass-through rules are listed in this report, which makes them easy to find. Pass-through rules are sometimes created as a workaround for a temporary network issue. When the issue is resolved, the rule can be forgotten, which results in traffic not being optimized.
• A field in this table shows you when email notifications are being sent, which is another way to track pass-through in-path rules. For more information, see “To configure in-path rules” on page 91 and “Configuring email settings” on page 466.
To view the In-Path Rule Statistics report
1. Choose Reports > Rules Statistics: In-Path Rule Statistics to display the In-Path Rule Statistics page.
Figure 13-54. In-Path Rule Statistics page
2. View these statistics that summarize in-path rule activity.
Data series Description
Rule ID The in-path rule ID. This ID corresponds to the Rule ID in the Optimization > Network Services: In-Path Rules page.
Rule Summary A summary of the rule's attributes.
Description The description, which corresponds to the optional Description field for the rule in the Optimization > Network Services: In-Path Rules page.
Hit Count The number of hits the rule has received.
Last Hit Time The last time the in-path rule was matched.
Counter Clear Time The last time the counter was cleared.
Creation time The time that the rule was created.
Hostname The hostname of the machine from where the user has logged in.

Viewing Reports and Logs | 657
Viewing in-path rule statistics
3. Optionally, select Clear Stats to clear statistics for a single in-path rule. To clear all in-path rule statistics, select the Clear All Statistics check box, and then click Submit.
Created by The SteelHead user ID of the user that created the rule (for example, admin).
Clear Stats Clears the statistics.
Email Notify This field applies only if you specify a pass-through in-path rule, and indicates whether emails are sent when one or more pass-through in-path rules are configured. Reminder emails are also sent every 15 days.
To enable email notifications, verify the following additional changes:
• Select the Enable Email Notification check box when creating the rule in the Optimization > Network Services: In-Path Rules page.
• Select the Send Reminder of Passthrough Rules via email check box in the Administration > System Settings: Email page.
• Select the Report Events via Email check box and specify an email address in the in the Administration > System Settings: Email page.
Data series Description

658 | Viewing Reports and Logs
Viewing in-path rule statistics

SteelFusion Edge MIB | 659
Accessing the SteelFusion Edge enterprise MIB
A
SteelFusion Edge MIB
This appendix provides a reference to the SteelFusion Edge Enterprise MIB and SNMP traps. These tools
allow for easy management of the SteelFusion Edges and straightforward integration into existing
network management systems.
This appendix includes these sections:
• “Accessing the SteelFusion Edge enterprise MIB” on page 659
• “SNMP traps” on page 660
Accessing the SteelFusion Edge enterprise MIBThe SteelFusion Edge enterprise MIB monitors device status and peers. It provides network statistics for
seamless integration into network management systems such as Hewlett-Packard OpenView Network
Node Manager, PRTG, and other SNMP browser tools.
For details on configuring and using these network monitoring tools, consult their product
documentation.
The following guidelines describe how to download and access the SteelHead enterprise MIB using
common MIB browsing utilities:
• You can download the SteelFusion Edge enterprise MIB file (STEELFUSION-MIB.txt) from the Support page of the Management Console or from the Riverbed Support site at https://support.riverbed.com and load it into any MIB browser utility.
• Some utilities might expect a file type other than a text file. If this occurs, change the file extension to the type required by the utility you have chosen.
• Some utilities assume that the root is mib-2 by default. If the utility sees a new node, such as enterprises, it might look under mib-2.enterprises. If this occurs, use .iso.org.dod.internet.private.enterprises.rbt as the root.
• Some command-line browsers might not load all MIB files by default. If this occurs, find the appropriate command option to load the STEELFUSION-MIB.txt file: for example, for NET-SNMP browsers, snmpwalk -m all.
660 | SteelFusion Edge MIB
SNMP traps
Retrieving optimized traffic statistics by port
When you perform an snmpwalk on the SteelFusion Edge MIB object bwPortTable to display a table of
statistics for optimized traffic by port, the command retrieves only the monitored ports. The monitored
ports include the default TCP ports and any ports you add. To view the monitored ports that this object
returns, choose Administration > System Settings: Monitored Ports or enter this command at the system
prompt:
show stats settings bandwidth ports
To retrieve statistics for an individual port, perform an smnpget for that port, as in this example:
.iso.org.dod.internet.private.enterprises.rbt.products.steelhead.statistics.bandwidth.bandwidthPerPort.bwPort Table.bwPortEntry.bwPortOutLan.port_number
SNMP trapsEvery appliance supports SNMP traps and email alerts for conditions that require attention or
intervention. An alarm triggers for most events, but not every event, and the related trap is sent. For most
events, when the condition clears, the system clears the alarm and also sends a clear trap. The clear traps
are useful in determining when an event has been resolved.
This section describes the SNMP traps. It does not list the corresponding clear traps.
RiOS includes support for SNMPv3.
You can view SteelFusion Edge appliance health at the top of each Management Console page, by
entering the show info command, and through SNMP (health, systemHealth).
The Edge tracks key hardware and software metrics and alerts you of any potential problems so that you
can quickly discover and diagnose issues. The health of an appliance falls into one of these states:
• Healthy - The SteelFusion Edge is functioning and optimizing traffic.
• Needs Attention - Accompanies a healthy state to indicate management-related issues not affecting the ability of the SteelFusion Edge to optimize traffic.
• Degraded - The SteelFusion Edge is optimizing traffic but the system has detected an issue.
• Admission Control - The SteelFusion Edge is optimizing traffic but has reached its connection limit.
• Critical - The SteelFusion Edge might or might not be optimizing traffic; you must address a critical issue.
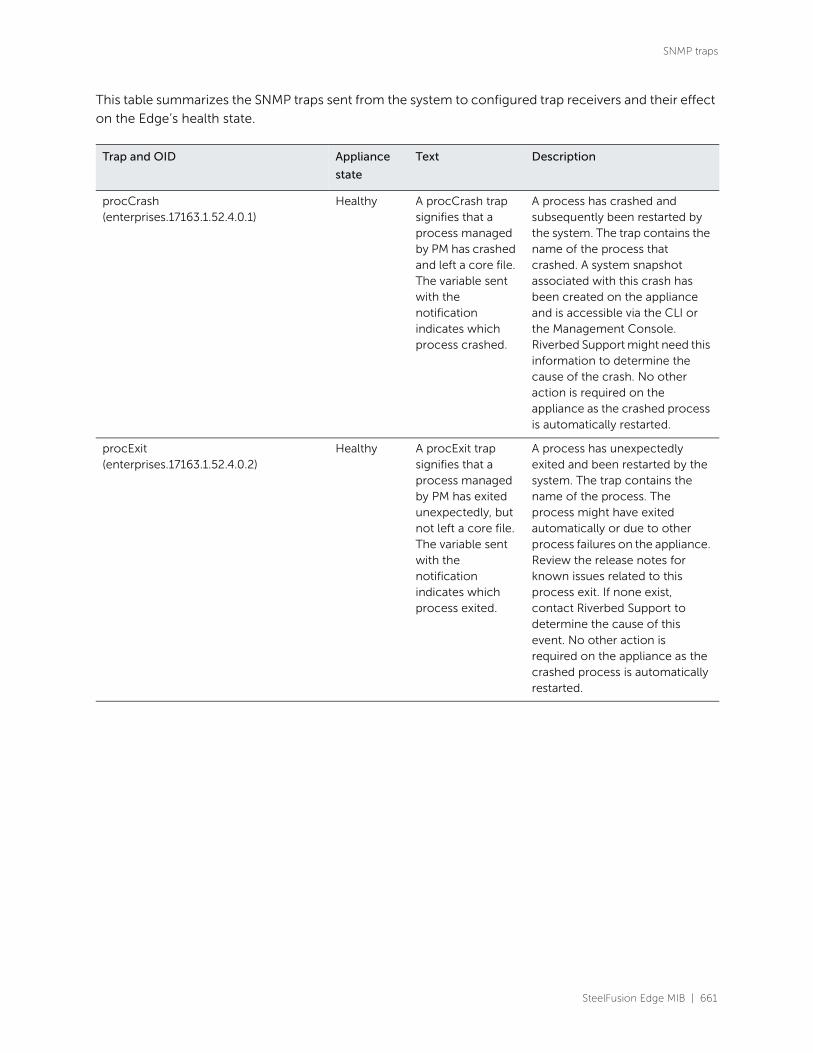
SteelFusion Edge MIB | 661
SNMP traps
This table summarizes the SNMP traps sent from the system to configured trap receivers and their effect
on the Edge’s health state.
Trap and OID Appliance
state
Text Description
procCrash(enterprises.17163.1.52.4.0.1)
Healthy A procCrash trap signifies that a process managed by PM has crashed and left a core file. The variable sent with the notification indicates which process crashed.
A process has crashed and subsequently been restarted by the system. The trap contains the name of the process that crashed. A system snapshot associated with this crash has been created on the appliance and is accessible via the CLI or the Management Console. Riverbed Support might need this information to determine the cause of the crash. No other action is required on the appliance as the crashed process is automatically restarted.
procExit(enterprises.17163.1.52.4.0.2)
Healthy A procExit trap signifies that a process managed by PM has exited unexpectedly, but not left a core file. The variable sent with the notification indicates which process exited.
A process has unexpectedly exited and been restarted by the system. The trap contains the name of the process. The process might have exited automatically or due to other process failures on the appliance. Review the release notes for known issues related to this process exit. If none exist, contact Riverbed Support to determine the cause of this event. No other action is required on the appliance as the crashed process is automatically restarted.

662 | SteelFusion Edge MIB
SNMP traps
cpuUtil(enterprises.17163.1.52.4.0.3)
Degraded The average CPU utilization in the past minute has gone above the acceptable threshold.
Average CPU utilization has exceeded an acceptable threshold. If CPU utilization spikes are frequent, it might be because the system is undersized. Sustained CPU load can be symptomatic of more serious issues. Consult the CPU Utilization report to gauge how long the system has been loaded and also monitor the amount of traffic currently going through the appliance. A one-time spike in CPU is normal but we recommend reporting extended high CPU utilization to Riverbed Support. No other action is necessary as the alarm clears automatically.
pagingActivity(enterprises.17163.1.52.4.0.4)
Degraded The system has been paging excessively (thrashing).
The system is running low on memory and has begun swapping memory pages to disk. This event can be triggered during a software upgrade while the optimization service is still running but there can be other causes. If this event triggers at any other time, generate a debug sysdump and send it to Riverbed Support. No other action is required as the alarm clears automatically.
smartError(enterprises.17163.1.51.4.0.5)
— This alarm is deprecated.
—
Trap and OID Appliance
state
Text Description

SteelFusion Edge MIB | 663
SNMP traps
peerVersionMismatch(enterprises.17163.1.52.4.0.6)
Degraded Detected a peer with a mismatched software version.
The appliance has encountered another appliance that is running an incompatible version of system software. Refer to the CLI, Management Console, or the SNMP peer table to determine which appliance is causing the conflict. Connections with that peer will not be optimized, connections with other peers running compatible RiOS versions are unaffected. To resolve the problem, upgrade your system software. No other action is required as the alarm clears automatically.
bypassMode(enterprises.17163.1.52.4.0.7)
Critical The appliance has entered bypass (failthru) mode.
The appliance has entered bypass mode and is now passing through all traffic unoptimized. This error is generated if the optimization service locks up or crashes. It can also be generated when the system is first powered on or powered off. If this trap is generated on a system that was previously optimizing and is still running, contact Riverbed Support.
raidError(enterprises.17163.1.52.4.0.8)
Deprecated An error has been generated by the RAID array.
A drive has failed in a RAID array. Consult the CLI or Management Console to determine the location of the failed drive. Contact Riverbed Support for assistance with installing a new drive, a RAID rebuild, or drive reseating. The appliance continues to optimize during this event. After the error is corrected, the alarm clears automatically.
Note: Applicable to models 3010, 3510, 3020, 3520, 5010, 5520, 6020, and 6120 only.
Trap and OID Appliance
state
Text Description

664 | SteelFusion Edge MIB
SNMP traps
storeCorruption(enterprises.17163.1.52.4.0.9)
Critical The data store is corrupted.
Indicates that the RiOS data store is corrupt or has become incompatible with the current configuration. To clear the RiOS data store of data, choose Administration > Maintenance: Services, select Clear Data Store, and click Restart to restart the optimization service.
If the alarm was triggered by an unintended change to the configuration, change the configuration to match the previous RiOS data store settings. Then restart the optimization service without clearing the data store to reset the alarm.
Typical configuration changes that require an optimization restart with a clear RiOS data store are enabling enhanced peering or changing the data store encryption.
admissionMemError(enterprises.17163.1.52.4.0.10)
Admission Control
Admission control memory alarm has been triggered.
The appliance has entered admission control due to memory consumption. The appliance is optimizing traffic beyond its rated capability and is unable to handle the amount of traffic passing through the WAN link. During this event, the appliance continues to optimize existing connections, but new connections are passed through without optimization. No other action is necessary as the alarm clears automatically when the traffic has decreased.
Trap and OID Appliance
state
Text Description

SteelFusion Edge MIB | 665
SNMP traps
admissionConnError(enterprises.17163.1.52.4.0.11)
Admission Control
Admission control connections alarm has been triggered.
The appliance has entered admission control due to the number of connections and is unable to handle the amount of connections going over the WAN link. During this event, the appliance continues to optimize existing connections, but new connections are passed through without optimization. No other action is necessary as the alarm clears automatically when the traffic has decreased.
haltError(enterprises.17163.1.52.4.0.12)
Critical The service is halted due to a software error.
The optimization service has halted due to a serious software error. See if a core dump or a system dump was created. If so, retrieve and contact Riverbed Support immediately.
serviceError(enterprises.17163.1.52.4.0.13)
Degraded There has been a service error. Please consult the log file.
The optimization service has encountered a condition that might degrade optimization performance. Consult the system log for more information. No other action is necessary.
scheduledJobError(enterprises.17163.1.52.4.0.14)
Healthy A scheduled job has failed during execution.
A scheduled job on the system (for example, a software upgrade) has failed. To determine which job failed, use the CLI or the Management Console.
confModeEnter(enterprises.17163.1.52.4.0.15)
Healthy A user has entered configuration mode.
A user on the system has entered a configuration mode from either the CLI or the Management Console. A log in to the Management Console by user admin sends this trap as well. This alarm is for notification purposes only; no other action is necessary.
Trap and OID Appliance
state
Text Description
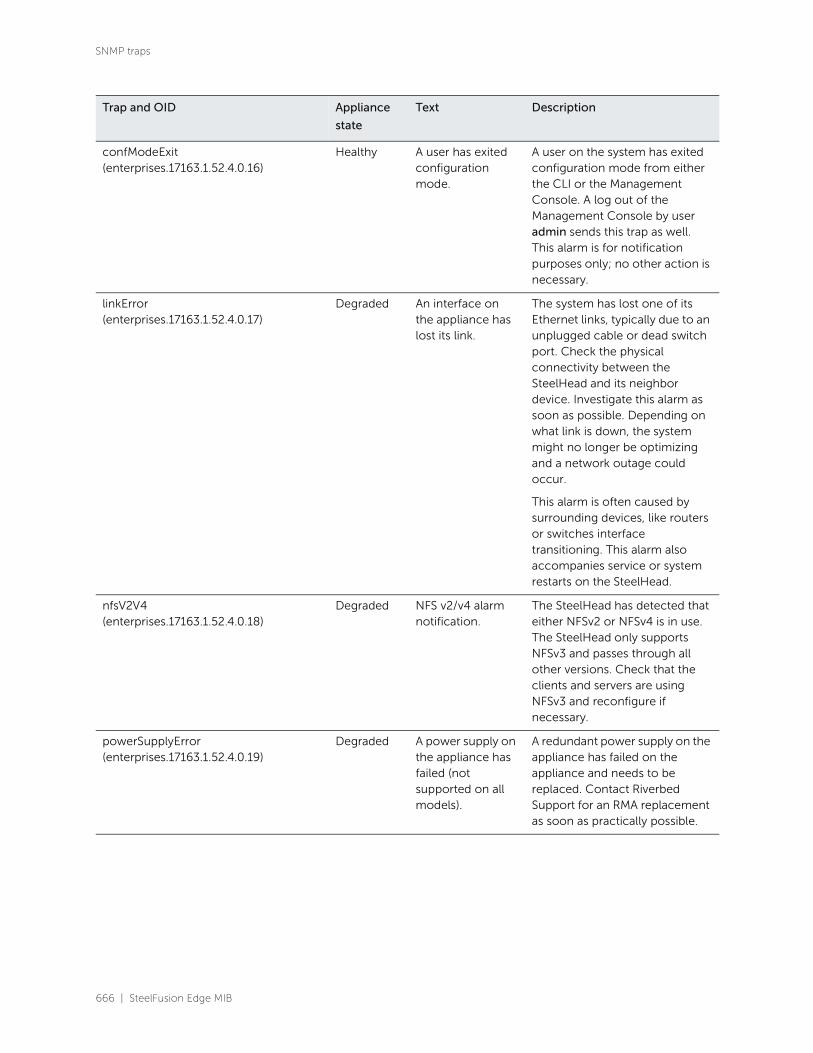
666 | SteelFusion Edge MIB
SNMP traps
confModeExit(enterprises.17163.1.52.4.0.16)
Healthy A user has exited configuration mode.
A user on the system has exited configuration mode from either the CLI or the Management Console. A log out of the Management Console by user admin sends this trap as well. This alarm is for notification purposes only; no other action is necessary.
linkError(enterprises.17163.1.52.4.0.17)
Degraded An interface on the appliance has lost its link.
The system has lost one of its Ethernet links, typically due to an unplugged cable or dead switch port. Check the physical connectivity between the SteelHead and its neighbor device. Investigate this alarm as soon as possible. Depending on what link is down, the system might no longer be optimizing and a network outage could occur.
This alarm is often caused by surrounding devices, like routers or switches interface transitioning. This alarm also accompanies service or system restarts on the SteelHead.
nfsV2V4(enterprises.17163.1.52.4.0.18)
Degraded NFS v2/v4 alarm notification.
The SteelHead has detected that either NFSv2 or NFSv4 is in use. The SteelHead only supports NFSv3 and passes through all other versions. Check that the clients and servers are using NFSv3 and reconfigure if necessary.
powerSupplyError(enterprises.17163.1.52.4.0.19)
Degraded A power supply on the appliance has failed (not supported on all models).
A redundant power supply on the appliance has failed on the appliance and needs to be replaced. Contact Riverbed Support for an RMA replacement as soon as practically possible.
Trap and OID Appliance
state
Text Description
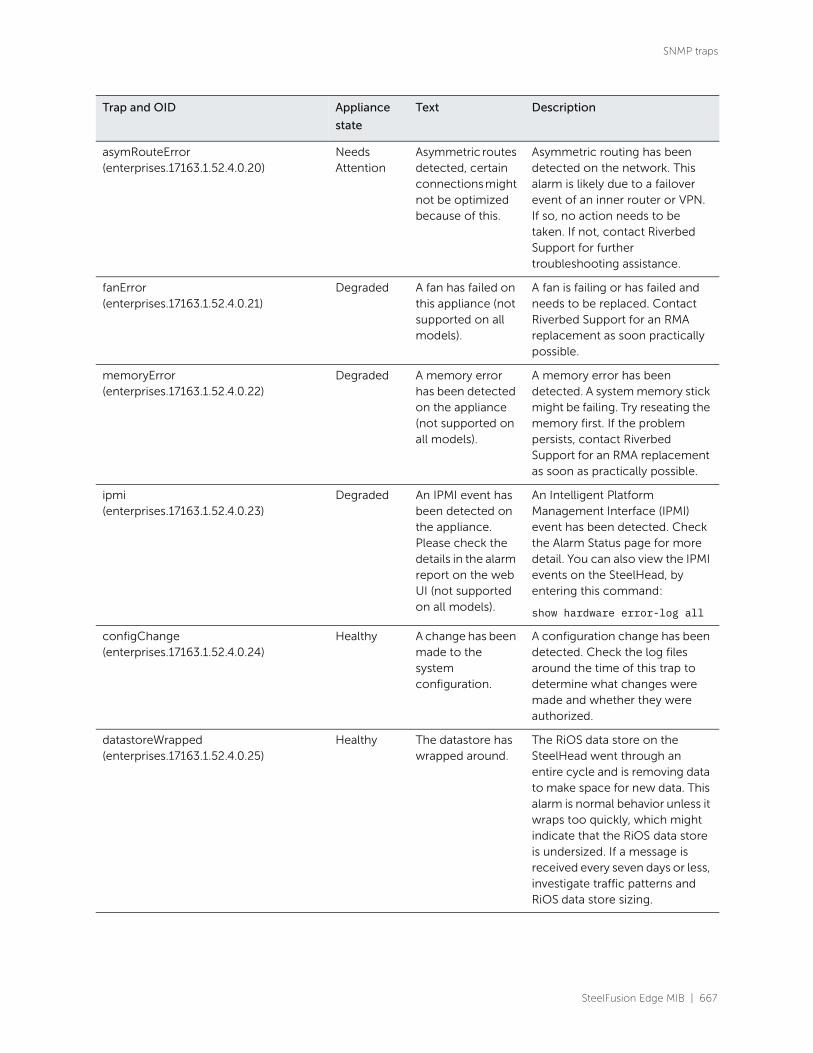
SteelFusion Edge MIB | 667
SNMP traps
asymRouteError(enterprises.17163.1.52.4.0.20)
Needs Attention
Asymmetric routes detected, certain connections might not be optimized because of this.
Asymmetric routing has been detected on the network. This alarm is likely due to a failover event of an inner router or VPN. If so, no action needs to be taken. If not, contact Riverbed Support for further troubleshooting assistance.
fanError(enterprises.17163.1.52.4.0.21)
Degraded A fan has failed on this appliance (not supported on all models).
A fan is failing or has failed and needs to be replaced. Contact Riverbed Support for an RMA replacement as soon practically possible.
memoryError(enterprises.17163.1.52.4.0.22)
Degraded A memory error has been detected on the appliance (not supported on all models).
A memory error has been detected. A system memory stick might be failing. Try reseating the memory first. If the problem persists, contact Riverbed Support for an RMA replacement as soon as practically possible.
ipmi(enterprises.17163.1.52.4.0.23)
Degraded An IPMI event has been detected on the appliance. Please check the details in the alarm report on the web UI (not supported on all models).
An Intelligent Platform Management Interface (IPMI) event has been detected. Check the Alarm Status page for more detail. You can also view the IPMI events on the SteelHead, by entering this command:
show hardware error-log all
configChange(enterprises.17163.1.52.4.0.24)
Healthy A change has been made to the system configuration.
A configuration change has been detected. Check the log files around the time of this trap to determine what changes were made and whether they were authorized.
datastoreWrapped(enterprises.17163.1.52.4.0.25)
Healthy The datastore has wrapped around.
The RiOS data store on the SteelHead went through an entire cycle and is removing data to make space for new data. This alarm is normal behavior unless it wraps too quickly, which might indicate that the RiOS data store is undersized. If a message is received every seven days or less, investigate traffic patterns and RiOS data store sizing.
Trap and OID Appliance
state
Text Description

668 | SteelFusion Edge MIB
SNMP traps
temperatureWarning(enterprises.17163.1.52.4.0.26)
Degraded The system temperature has exceeded the threshold.
The appliance temperature is a configurable notification. By default, this notification is set to trigger when the appliance reaches 70 degrees Celsius. Raise the alarm trigger temperature if it is normal for the Edge to get that hot, or reduce the temperature of the Edge.
temperatureCritical(enterprises.17163.1.52.4.0.27)
Critical The system temperature has reached a critical stage.
This trap/alarm triggers a critical state on the appliance. This alarm occurs when the appliance temperature reaches 90 degrees Celsius. The temperature value is not user-configurable. Reduce the appliance temperature.
cfConnFailure(enterprises.17163.1.52.4.0.28)
Degraded Unable to establish connection with the specified neighbor.
The connection cannot be established with a connection-forwarding neighbor. This alarm clears automatically the next time all neighbors connect successfully.
cfConnLostEos(enterprises.17163.1.52.4.0.29)
Degraded Connection lost since end of stream was received from the specified neighbor.
The connection has been closed by the connection-forwarding neighbor. This alarm clears automatically the next time all neighbors connect successfully.
cfConnLostErr(enterprises.17163.1.52.4.0.30)
Degraded Connection lost due to an error communicating with the specified neighbor.
The connection has been lost with the connection-forwarding neighbor due to an error. This alarm clears automatically the next time all neighbors connect successfully.
cfKeepaliveTimeout(enterprises.17163.1.52.4.0.31)
Degraded Connection lost due to lack of keep-alives from the specified neighbor.
The connection-forwarding neighbor has not responded to a keepalive message within the time-out period, indicating that the connection has been lost. This alarm clears automatically when all neighbors of the SteelHead are responding to keepalive messages within the time-out period.
Trap and OID Appliance
state
Text Description

SteelFusion Edge MIB | 669
SNMP traps
cfAckTimeout (enterprises.17163.1.52.4.0.32)
Degraded Connection lost due to lack of ACKs from the specified neighbor.
The connection has been lost because requests have not been acknowledged by a connection-forwarding neighbor within the set time-out threshold. This alarm clears automatically the next time all neighbors receive an ACK from this neighbor and the latency of that acknowledgment is less than the set time-out threshold.
cfReadInfoTimeout (enterprises.17163.1.52.4.0.33)
Degraded Timeout reading info from the specified neighbor.
The SteelHead has timed out while waiting for an initialization message from the connection-forwarding neighbor. This alarm clears automatically when the SteelHead is able to read the initialization message from all of its neighbors.
cfLatencyExceeded(enterprises.17163.1.52.4.0.34)
Degraded Connection forwarding latency with the specified neighbor has exceeded the threshold.
The amount of latency between connection-forwarding neighbors has exceeded the specified threshold. The alarm clears automatically when the latency falls below the specified threshold.
sslPeeringSCEPAutoReenrollError(enterprises.17163.1.51.4.0.35)
Needs Attention
There is an error in the automatic re-enrollment of the SSL peering certificate.
An SSL peering certificate has failed to reenroll with the Simple Certificate Enrollment Protocol (SCEP).
crlError(enterprises.17163.1.51.4.0.36)
Needs Attention
CRL polling fails. The polling for SSL peering CAs has failed to update the Certificate Revocation List (CRL) within the specified polling period. This alarm clears automatically when the CRL is updated.
datastoreSyncFailure(enterprises.17163.1.52.4.0.37)
Degraded Data store sync has failed.
The RiOS data store synchronization between two SteelHeads has been disrupted and the RiOS data stores are no longer synchronized.
Trap and OID Appliance
state
Text Description

670 | SteelFusion Edge MIB
SNMP traps
secureVaultNeedsUnlock(enterprises.17163.1.52.4.0.38)
Needs Attention
SSL acceleration and the secure data store cannot be used until the secure vault has been unlocked.
The secure vault is locked. SSL traffic is not being optimized and the RiOS data store cannot be encrypted. Check the Alarm Status page for more details. The alarm clears when the secure vault is unlocked.
secureVaultNeedsRekey(enterprises.17163.1.52.4.0.39)
Needs Attention
If you wish to use a nondefault password for the secure vault, the password must be rekeyed. Please see the Knowledge Base solution 5592 for more details.
The secure vault password needs to be verified or reset. Initially, the secure vault has a default password known only to the RiOS software so the SteelHead can automatically unlock the vault during system startup.
For details, check the Alarm Status page and see Knowledge Base solution 5592.
The alarm clears when you verify the default password or reset the password.
secureVaultInitError(enterprises.17163.1.52.4.0.40)
Critical An error was detected while initializing the secure vault. Please contact Riverbed Support.
An error occurred while initializing the secure vault after a RiOS software version upgrade. Contact Riverbed Support.
configSave(enterprises.17163.1.52.4.0.41)
Healthy The current appliance configuration has been saved.
A configuration has been saved either by entering the write memory command or by clicking Save in the Management Console. This message is for security notification purposes only; no other action is necessary.
tcpDumpStarted(enterprises.17163.1.52.4.0.42)
Healthy A TCP dump has been started.
A user has started a TCP dump on the SteelHead by entering the tcpdump or tcpdump-x command from the CLI. This message is for security notification purposes only; no other action is necessary.
Trap and OID Appliance
state
Text Description

SteelFusion Edge MIB | 671
SNMP traps
tcpDumpScheduled(enterprises.17163.1.52.4.0.43)
Healthy A TCP dump has been scheduled.
A user has started a TCP dump on the SteelHead by entering the tcpdump or tcpdump-x command with a scheduled start time from the CLI. This message is for security notification purposes only; no other action is necessary.
newUserCreated(enterprises.17163.1.52.4.0.44)
Healthy A new user has been created.
A new role-based management user has been created using the CLI or the Management Console. This message is for security notification purposes only; no other action is necessary.
diskError(enterprises.17163.1.52.4.0.45)
Degraded Disk error has been detected.
A disk error has been detected. A disk might be failing. Try reseating the memory first. If the problem persists, contact Riverbed Support.
wearWarning(enterprises.17163.1.52.4.0.46)
Degraded Accumulated SSD write cycles passed predefined level.
Triggers on SteelHead models using Solid State Disks (SSDs).
An SSD has reached 95 percent of its write cycle limit. Contact Riverbed Support.
cliUserLogin(enterprises.17163.1.52.4.0.47)
Healthy A user has just logged in via CLI.
A user has logged in to the SteelHead using the command-line interface. This message is for security notification purposes only; no other action is necessary.
cliUserLogout(enterprises.17163.1.52.4.0.48)
Healthy A CLI user has just logged out.
A user has logged out of the SteelHead using the command-line interface using the quit command or Ctrl+D. This message is for security notification purposes only; no other action is necessary.
webUserLogin(enterprises.17163.1.52.4.0.49)
Healthy A user has just logged in via the web UI.
A user has logged in to the SteelHead using the Management Console. This message is for security notification purposes only; no other action is necessary.
Trap and OID Appliance
state
Text Description
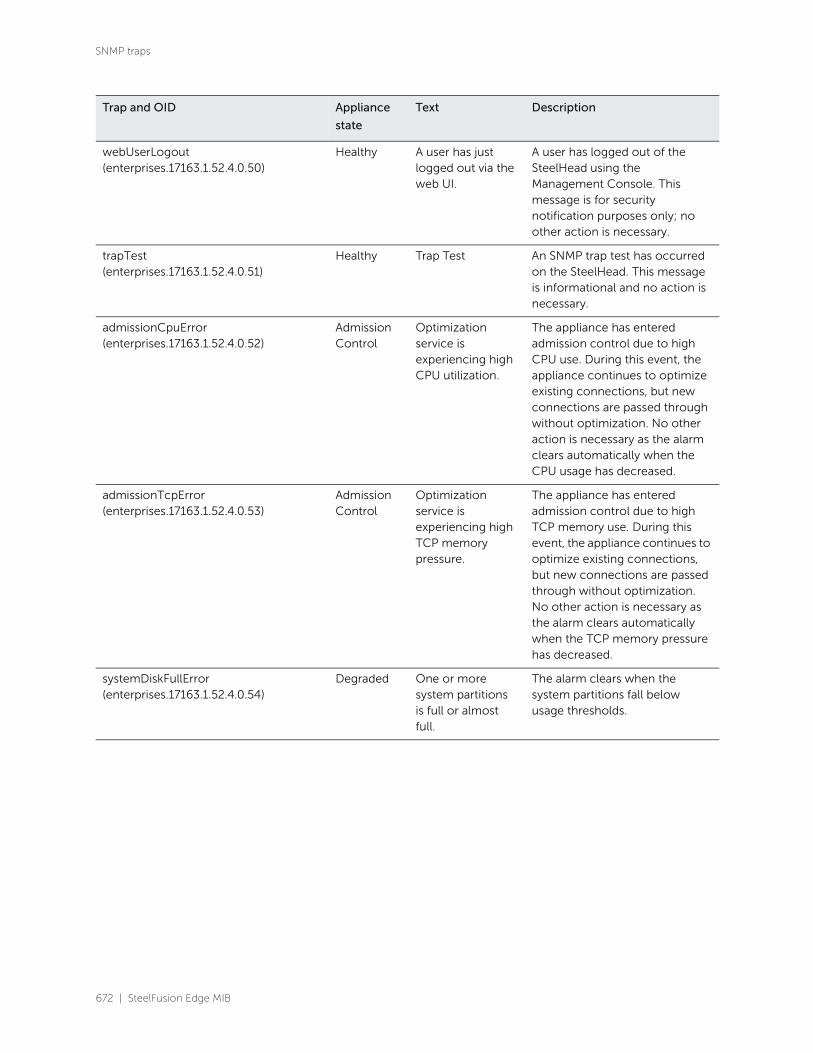
672 | SteelFusion Edge MIB
SNMP traps
webUserLogout(enterprises.17163.1.52.4.0.50)
Healthy A user has just logged out via the web UI.
A user has logged out of the SteelHead using the Management Console. This message is for security notification purposes only; no other action is necessary.
trapTest(enterprises.17163.1.52.4.0.51)
Healthy Trap Test An SNMP trap test has occurred on the SteelHead. This message is informational and no action is necessary.
admissionCpuError(enterprises.17163.1.52.4.0.52)
Admission Control
Optimization service is experiencing high CPU utilization.
The appliance has entered admission control due to high CPU use. During this event, the appliance continues to optimize existing connections, but new connections are passed through without optimization. No other action is necessary as the alarm clears automatically when the CPU usage has decreased.
admissionTcpError(enterprises.17163.1.52.4.0.53)
Admission Control
Optimization service is experiencing high TCP memory pressure.
The appliance has entered admission control due to high TCP memory use. During this event, the appliance continues to optimize existing connections, but new connections are passed through without optimization. No other action is necessary as the alarm clears automatically when the TCP memory pressure has decreased.
systemDiskFullError(enterprises.17163.1.52.4.0.54)
Degraded One or more system partitions is full or almost full.
The alarm clears when the system partitions fall below usage thresholds.
Trap and OID Appliance
state
Text Description

SteelFusion Edge MIB | 673
SNMP traps
domainJoinError(enterprises.17163.1.52.4.0.55)
Degraded An attempt to join a domain failed.
An attempt to join a Windows domain has failed. The number one cause of failing to join a domain is a significant difference in the system time on the Windows domain controller and the SteelHead. When the time on the domain controller and the SteelHead do not match, this error message appears:
lt-kinit: krb5_get_init_creds: Clock skew too great
We recommend using NTP time synchronization to synchronize the client and server clocks. It is critical that the SteelHead time is the same as the time on the Active Directory controller. Sometimes an NTP server is down or inaccessible, in which case there can be a time difference. You can also disable NTP if it is not being used and manually set the time. You must also verify that the time zone is correct.
A domain join can fail when the DNS server returns an invalid IP address for the domain controller. When a DNS misconfiguration occurs during an attempt to join a domain, these error messages appear:
Failed to join domain: failed to find DC for domain <domain-name> Failed to join domain : No Logon Servers
Additionally, the domain join alarm triggers and messages similar to the following appear in the logs:
Oct 13 14:47:06 bravo-sh81 rcud[10014]: [rcud/main/.ERR] - {- -} Failed to join domain: failed to find DC for domain GEN-VCS78DOM.COM
Trap and OID Appliance
state
Text Description

674 | SteelFusion Edge MIB
SNMP traps
When you encounter this error, go to the Networking > Networking: Host Settings page and verify that the DNS settings are correct. To verify the time settings, go to the Administration > System Settings: Date/Time page.
certsExpiringError(enterprises.17163.1.52.4.0.56)
Needs Attention
Some x509 certificates may be expiring.
The service has detected some x.509 certificates used for Network Administration Access to the appliance that are close to their expiration dates. The alarm clears when the x.509 certificates are updated.
licenseError(enterprises.17163.1.52.4.0.57)
Critical The main SteelHead license has expired, been removed, or become invalid.
A license on the appliance has been removed, has expired, or is invalid. The alarm clears when a valid license is added or updated.
hardwareError(enterprises.17163.1.52.4.0.58)
Critical or Degraded
Hardware error detected.
Indicates that the system has detected a problem with the appliance hardware. These issues trigger the hardware error alarm:
• the appliance does not have enough disk, memory, CPU cores, or NIC cards to support the current configuration
• the appliance is using a memory Dual In-line Memory Module (DIMM), a hard disk, or a NIC that is not qualified by Riverbed
• a VSP upgrade requires additional memory or a memory replacement
• other hardware issues
The alarm clears when you add the necessary hardware, remove the unqualified hardware, or resolve other hardware issues.
sysdetailError(enterprises.17163.1.52.4.0.59)
Needs Attention
Error is found in System Detail Report.
A top-level module on the system detail report is in error. For details, choose Reports > Diagnostics: System Details.
Trap and OID Appliance
state
Text Description

SteelFusion Edge MIB | 675
SNMP traps
admissionMapiError(enterprises.17163.1.52.4.0.60)
Degraded New MAPI connections will be passed through due to high connection count.
The total number of MAPI optimized connections have exceeded the maximum admission control threshold. By default, the maximum admission control threshold is 85 percent of the total maximum optimized connection count for the client-side appliance. The appliance reserves the remaining 15 percent so the MAPI admission control does not affect the other protocols. The 85 percent threshold is applied only to MAPI connections.
RiOS is now passing through MAPI connections from new clients but continues to intercept and optimize MAPI connections from existing clients (including new MAPI connections from these clients).
RiOS continues optimizing non-MAPI connections from all clients. This alarm is disabled by default.
The alarm clears automatically when the MAPI traffic has decreased; however, it can take one minute for the alarm to clear.
RiOS preemptively closes MAPI sessions to reduce the connection count in an attempt to bring the appliance out of admission control by bringing the connection count below the 85 percent threshold. RiOS closes the MAPI sessions in this order:
• MAPI prepopulation connections
• MAPI sessions with the largest number of connections
• MAPI sessions with most idle connections
• The oldest MAPI session
Trap and OID Appliance
state
Text Description

676 | SteelFusion Edge MIB
SNMP traps
• MAPI sessions exceeding the memory threshold.
Note: MAPI admission control cannot solve a general AdmissionControl Error (enterprises.17163.5.1.4.0.11); however, it can help to prevent it from occurring.
neighborIncompatibility(enterprises.17163.1.52.4.0.61)
Degraded Serial cascade misconfiguration has been detected.
Check your automatic peering configuration. Restart the optimization service to clear the alarm.
flashError(enterprises.17163.1.52.4.0.62)
Needs Attention
Flash hardware error detected.
At times, the USB flash drive that holds the system images might become unresponsive; the appliance continues to function normally. When this alarm triggers, you cannot perform a software upgrade, as the system is unable to write a new upgrade image to the flash drive without first power cycling the system.
To reboot the appliance, go to the Administration > Maintenance: Reboot/Shutdown page or enter the reload command to automatically power cycle the appliance and restore the flash drive to its proper function.
lanWanLoopError(enterprises.17163.1.52.4.0.63)
Critical LAN-WAN loop detected. System will not optimize new connections until this error is cleared.
A LAN-WAN network loop has been detected between the LAN and WAN interfaces on a virtual appliance. This can occur when you connect the LAN and WAN virtual NICs to the same vSwitch or physical NIC. This alarm triggers when an appliance starts up, and clears after you connect each LAN and WAN virtual interface to a distinct virtual switch and physical NIC (through the vSphere Networking tab) and then reboot the virtual appliance.
Trap and OID Appliance
state
Text Description

SteelFusion Edge MIB | 677
SNMP traps
optimizationServiceStatusError(enterprises.17163.1.52.4.0.64)
Critical Optimization service currently not optimizing any connections.
The optimization service has encountered an optimization service condition. The message indicates the reason for the condition:
• optimization service is not running
This message appears after a configuration file error. For more information, review the logs.
• in-path optimization is not enabled
This message appears if an in-path setting is disabled for an in-path appliance. For more information, review the logs.
• optimization service is initializing
This message appears after a reboot. The alarm clears on its own; no other action is necessary. For more information, review the logs.
• optimization service is not optimizing
This message appears after a system crash. For more information, review the logs.
• optimization service is disabled by user
This message appears after entering the no service enable command or shutting down the optimization service from the Management Console. For more information, review the logs.
• optimization service is restarted by user
This message appears after the optimization service is restarted from either the CLI or Management Console. You might want to review the logs for more information.
Trap and OID Appliance
state
Text Description
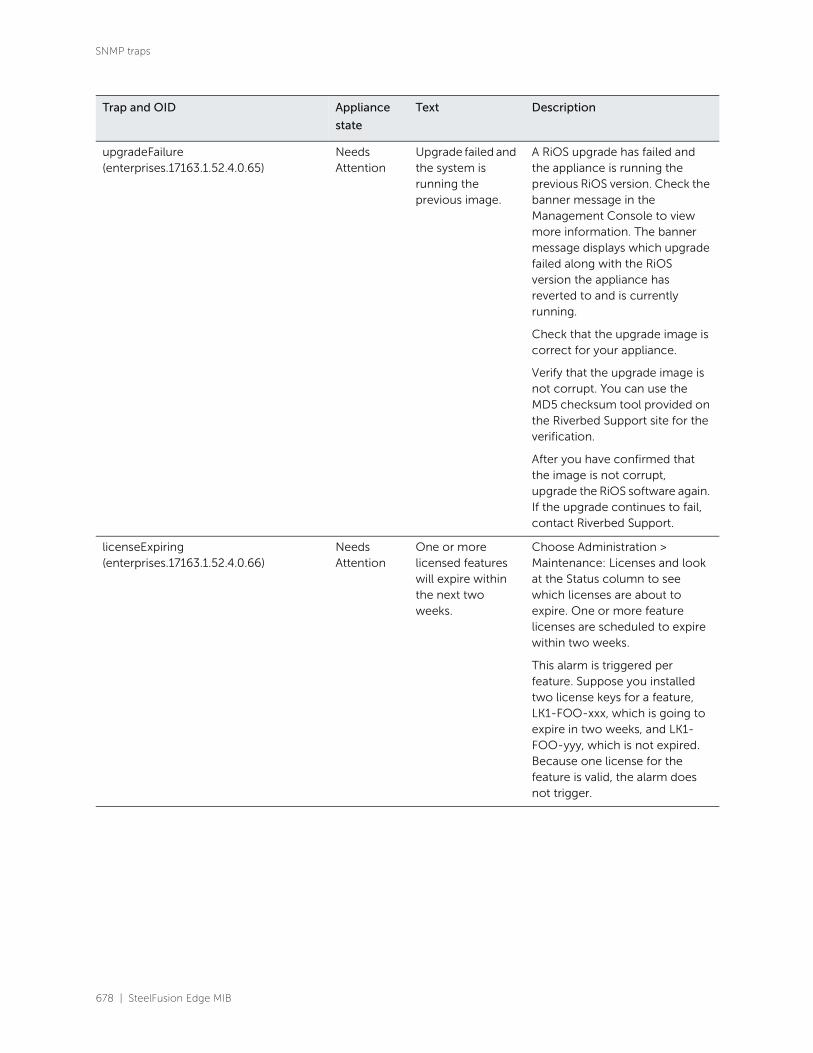
678 | SteelFusion Edge MIB
SNMP traps
upgradeFailure(enterprises.17163.1.52.4.0.65)
Needs Attention
Upgrade failed and the system is running the previous image.
A RiOS upgrade has failed and the appliance is running the previous RiOS version. Check the banner message in the Management Console to view more information. The banner message displays which upgrade failed along with the RiOS version the appliance has reverted to and is currently running.
Check that the upgrade image is correct for your appliance.
Verify that the upgrade image is not corrupt. You can use the MD5 checksum tool provided on the Riverbed Support site for the verification.
After you have confirmed that the image is not corrupt, upgrade the RiOS software again. If the upgrade continues to fail, contact Riverbed Support.
licenseExpiring(enterprises.17163.1.52.4.0.66)
Needs Attention
One or more licensed features will expire within the next two weeks.
Choose Administration > Maintenance: Licenses and look at the Status column to see which licenses are about to expire. One or more feature licenses are scheduled to expire within two weeks.
This alarm is triggered per feature. Suppose you installed two license keys for a feature, LK1-FOO-xxx, which is going to expire in two weeks, and LK1-FOO-yyy, which is not expired. Because one license for the feature is valid, the alarm does not trigger.
Trap and OID Appliance
state
Text Description

SteelFusion Edge MIB | 679
SNMP traps
licenseExpired(enterprises.17163.1.52.4.0.67)
Degraded One or more licensed features have expired.
Choose Administration > Maintenance: Licenses and look at the Status column to see which licenses have expired. One or more feature licenses have expired.
This alarm is triggered per feature. Suppose you installed two license keys for a feature, LK1-FOO-xxx (expired), and LK1-FOO-yyy (not expired). Because one license for the feature is valid, the alarm does not trigger.
clusterDisconnectedSHAlertError(enterprises.17163.1.52.4.0.68)
Degraded A cluster SteelHead has been reported as disconnected.
Choose Networking > Network Integration: Connection Forwarding and verify the configuration for both this appliance and the neighbor SteelHead. Verify that the neighbor is reachable from this appliance.
Next, check that the optimization service is running on both appliances.
This error clears when the configuration is valid.
smbAlert(enterprises.17163.1.52.4.0.69)
Needs Attention
Domain authentication alert.
The optimization service has detected a failure with domain controller communication or a delegate user.
Confirm that the SteelHead residing in the data center is properly joined to the domain by choosing Networking > Windows Domain.
To view useful debugging information enter the show protocol domain-auth test join and show alarm smb_alert commands.
Verify that a delegate user has been added to the appliance and is configured with the appropriate privileges.
Trap and OID Appliance
state
Text Description

680 | SteelFusion Edge MIB
SNMP traps
linkDuplex(enterprises.17163.1.52.4.0.70)
Degraded An interface on the appliance is in half-duplex mode.
Indicates that an interface was not configured for half-duplex negotiation but has negotiated half-duplex mode. Half-duplex significantly limits the optimization service results.
Choose Networking > Networking: Base Interfaces and examine the appliance link configuration. Next, examine the peer switch user interface to check its link configuration. If the configuration on one side is different from the other, traffic is sent at different rates on each side, causing many collisions.
To troubleshoot, change both interfaces to automatic duplex negotiation. If the interfaces do not support automatic duplex, configure both ends for full duplex.
linkIoErrors(enterprises.17163.1.52.4.0.71)
Degraded An interface on the appliance is suffering I/O errors.
Indicates that the error rate on an interface has exceeded 0.1 percent while either sending or receiving packets. This threshold is based on the observation that even a small link error rate reduces TCP throughput significantly. A properly configured LAN connection should experience few errors. The alarm clears when the error rate drops below 0.05 percent.
To troubleshoot, try a new cable and a different switch port. Another possible cause is electromagnetic noise nearby.
You can change the default alarm thresholds by entering the alarm link_io_errors err-threshold <threshold-value> command at the system prompt. For details, see the Riverbed Command-Line Interface Reference Manual.
Trap and OID Appliance
state
Text Description
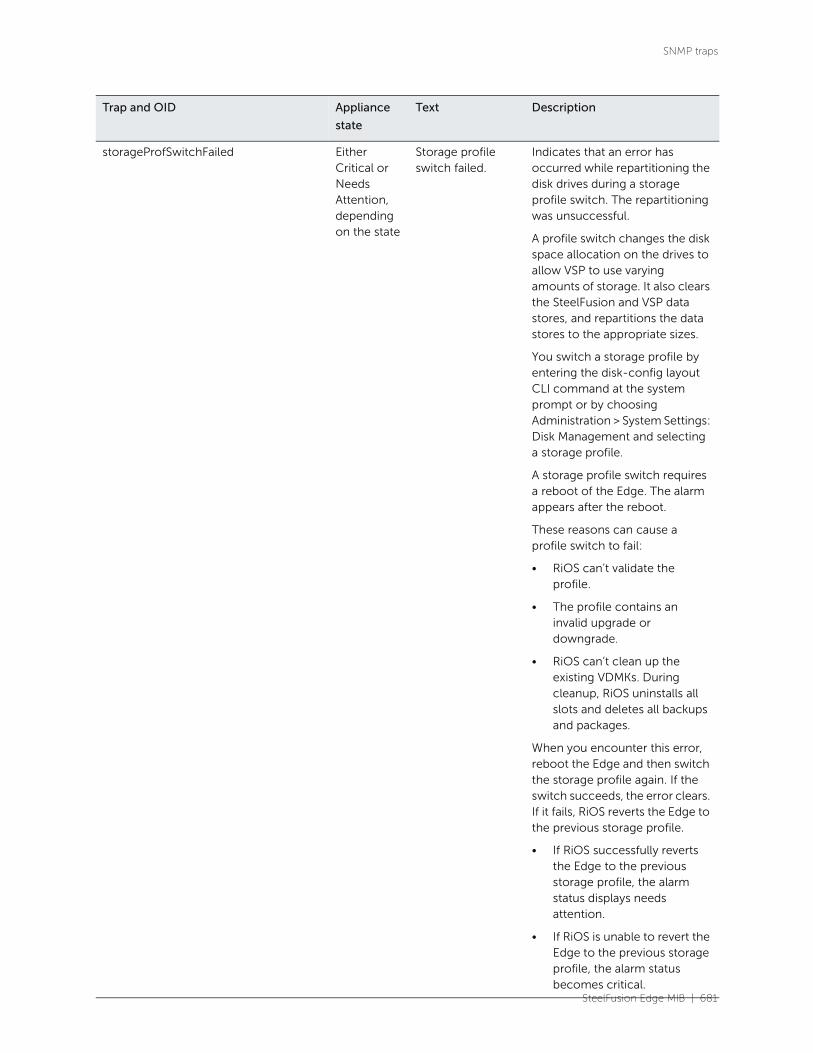
SteelFusion Edge MIB | 681
SNMP traps
storageProfSwitchFailed Either Critical or Needs Attention, depending on the state
Storage profile switch failed.
Indicates that an error has occurred while repartitioning the disk drives during a storage profile switch. The repartitioning was unsuccessful.
A profile switch changes the disk space allocation on the drives to allow VSP to use varying amounts of storage. It also clears the SteelFusion and VSP data stores, and repartitions the data stores to the appropriate sizes.
You switch a storage profile by entering the disk-config layout CLI command at the system prompt or by choosing Administration > System Settings: Disk Management and selecting a storage profile.
A storage profile switch requires a reboot of the Edge. The alarm appears after the reboot.
These reasons can cause a profile switch to fail:
• RiOS can’t validate the profile.
• The profile contains an invalid upgrade or downgrade.
• RiOS can’t clean up the existing VDMKs. During cleanup, RiOS uninstalls all slots and deletes all backups and packages.
When you encounter this error, reboot the Edge and then switch the storage profile again. If the switch succeeds, the error clears. If it fails, RiOS reverts the Edge to the previous storage profile.
• If RiOS successfully reverts the Edge to the previous storage profile, the alarm status displays needs attention.
• If RiOS is unable to revert the Edge to the previous storage profile, the alarm status becomes critical.
Trap and OID Appliance
state
Text Description
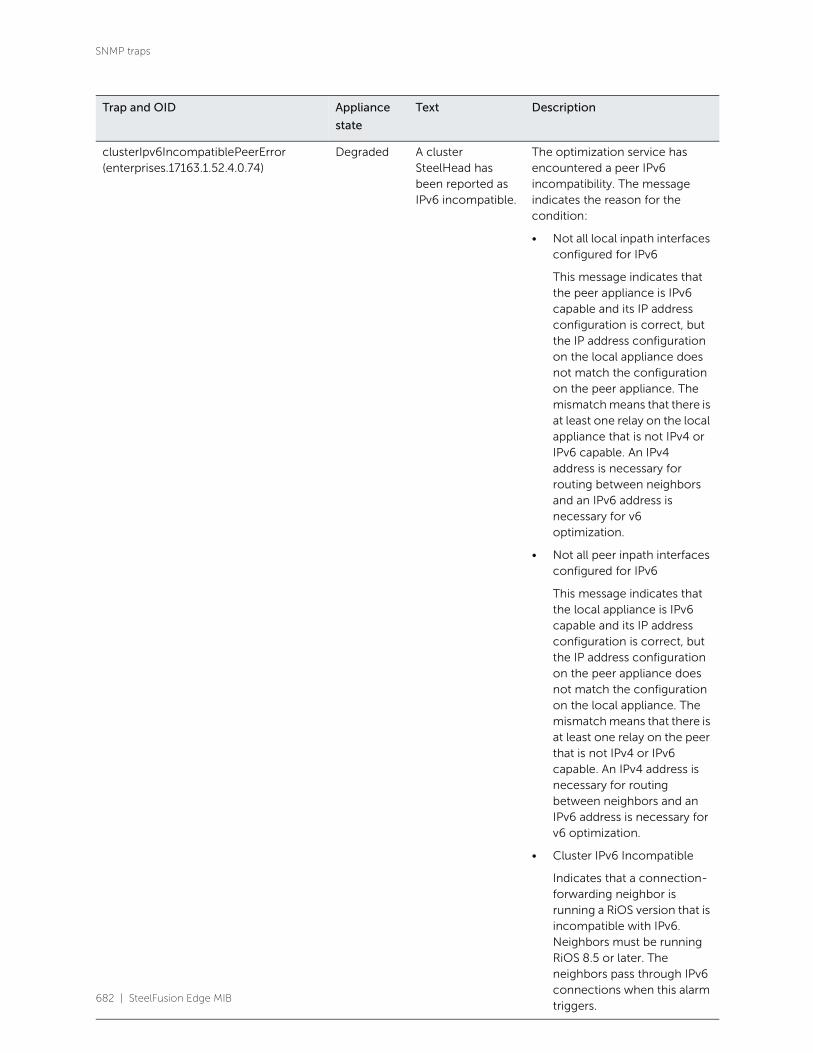
682 | SteelFusion Edge MIB
SNMP traps
clusterIpv6IncompatiblePeerError (enterprises.17163.1.52.4.0.74)
Degraded A cluster SteelHead has been reported as IPv6 incompatible.
The optimization service has encountered a peer IPv6 incompatibility. The message indicates the reason for the condition:
• Not all local inpath interfaces configured for IPv6
This message indicates that the peer appliance is IPv6 capable and its IP address configuration is correct, but the IP address configuration on the local appliance does not match the configuration on the peer appliance. The mismatch means that there is at least one relay on the local appliance that is not IPv4 or IPv6 capable. An IPv4 address is necessary for routing between neighbors and an IPv6 address is necessary for v6 optimization.
• Not all peer inpath interfaces configured for IPv6
This message indicates that the local appliance is IPv6 capable and its IP address configuration is correct, but the IP address configuration on the peer appliance does not match the configuration on the local appliance. The mismatch means that there is at least one relay on the peer that is not IPv4 or IPv6 capable. An IPv4 address is necessary for routing between neighbors and an IPv6 address is necessary for v6 optimization.
• Cluster IPv6 Incompatible
Indicates that a connection-forwarding neighbor is running a RiOS version that is incompatible with IPv6. Neighbors must be running RiOS 8.5 or later. The neighbors pass through IPv6 connections when this alarm triggers.
Trap and OID Appliance
state
Text Description
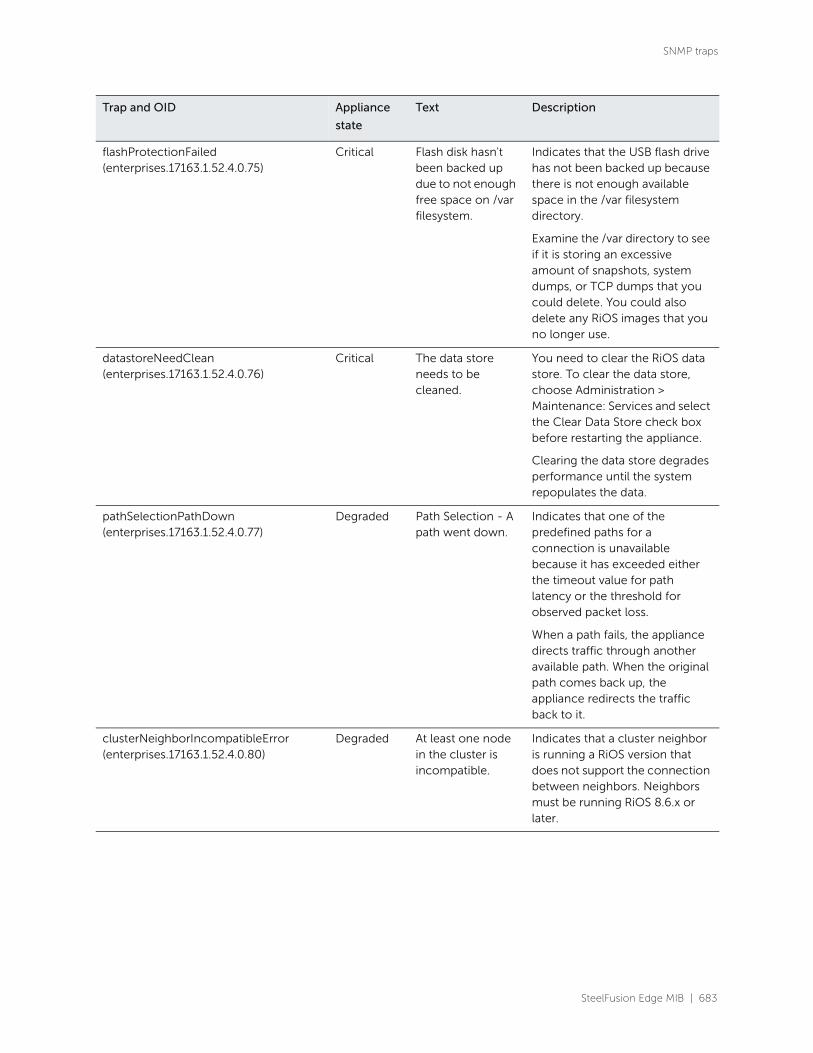
SteelFusion Edge MIB | 683
SNMP traps
flashProtectionFailed(enterprises.17163.1.52.4.0.75)
Critical Flash disk hasn't been backed up due to not enough free space on /var filesystem.
Indicates that the USB flash drive has not been backed up because there is not enough available space in the /var filesystem directory.
Examine the /var directory to see if it is storing an excessive amount of snapshots, system dumps, or TCP dumps that you could delete. You could also delete any RiOS images that you no longer use.
datastoreNeedClean(enterprises.17163.1.52.4.0.76)
Critical The data store needs to be cleaned.
You need to clear the RiOS data store. To clear the data store, choose Administration > Maintenance: Services and select the Clear Data Store check box before restarting the appliance.
Clearing the data store degrades performance until the system repopulates the data.
pathSelectionPathDown(enterprises.17163.1.52.4.0.77)
Degraded Path Selection - A path went down.
Indicates that one of the predefined paths for a connection is unavailable because it has exceeded either the timeout value for path latency or the threshold for observed packet loss.
When a path fails, the appliance directs traffic through another available path. When the original path comes back up, the appliance redirects the traffic back to it.
clusterNeighborIncompatibleError(enterprises.17163.1.52.4.0.80)
Degraded At least one node in the cluster is incompatible.
Indicates that a cluster neighbor is running a RiOS version that does not support the connection between neighbors. Neighbors must be running RiOS 8.6.x or later.
Trap and OID Appliance
state
Text Description
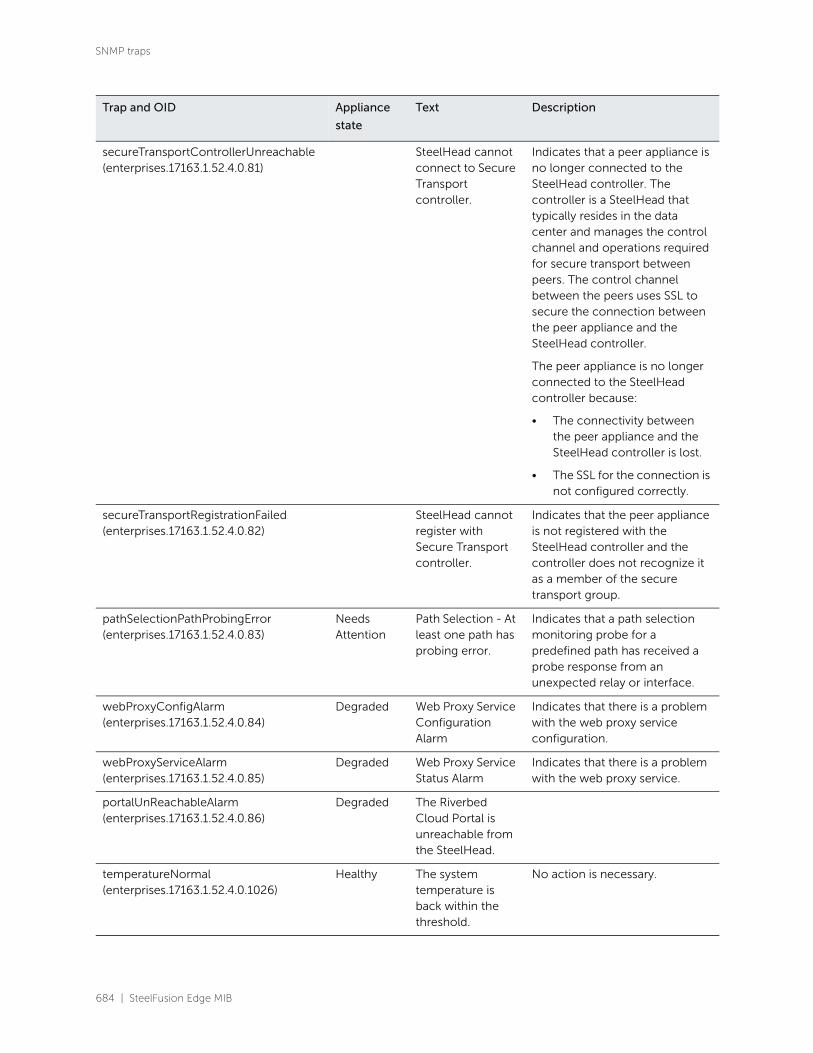
684 | SteelFusion Edge MIB
SNMP traps
secureTransportControllerUnreachable(enterprises.17163.1.52.4.0.81)
SteelHead cannot connect to Secure Transport controller.
Indicates that a peer appliance is no longer connected to the SteelHead controller. The controller is a SteelHead that typically resides in the data center and manages the control channel and operations required for secure transport between peers. The control channel between the peers uses SSL to secure the connection between the peer appliance and the SteelHead controller.
The peer appliance is no longer connected to the SteelHead controller because:
• The connectivity between the peer appliance and the SteelHead controller is lost.
• The SSL for the connection is not configured correctly.
secureTransportRegistrationFailed(enterprises.17163.1.52.4.0.82)
SteelHead cannot register with Secure Transport controller.
Indicates that the peer appliance is not registered with the SteelHead controller and the controller does not recognize it as a member of the secure transport group.
pathSelectionPathProbingError(enterprises.17163.1.52.4.0.83)
Needs Attention
Path Selection - At least one path has probing error.
Indicates that a path selection monitoring probe for a predefined path has received a probe response from an unexpected relay or interface.
webProxyConfigAlarm(enterprises.17163.1.52.4.0.84)
Degraded Web Proxy Service Configuration Alarm
Indicates that there is a problem with the web proxy service configuration.
webProxyServiceAlarm(enterprises.17163.1.52.4.0.85)
Degraded Web Proxy Service Status Alarm
Indicates that there is a problem with the web proxy service.
portalUnReachableAlarm(enterprises.17163.1.52.4.0.86)
Degraded The Riverbed Cloud Portal is unreachable from the SteelHead.
temperatureNormal(enterprises.17163.1.52.4.0.1026)
Healthy The system temperature is back within the threshold.
No action is necessary.
Trap and OID Appliance
state
Text Description

SteelFusion Edge MIB | 685
SNMP traps
temperatureNonCritical(enterprises.17163.1.52.4.0.1027)
Healthy The system temperature is no longer in a critical stage.
cfConnRestored(enterprises.17163.1.52.4.0.1028)
Connection reestablished with the specified neighbor.
secureTransportControllerConnected(enterprises.17163.1.52.4.0.1081)
SteelHead successfully connected to Secure Transport controller.
secureTransportRegistrationSucceeded(enterprises.17163.1.52.4.0.1082)
SteelHead successfully registered with Secure Transport controller.
graniteLunError(enterprises.17163.1.52.4.0.10000)
Critical or Degraded
Storage module encountered error.
• Metadata DB has been corrupted - Check the syslog. Unmap, unmount, and remount the export.
• Could not connect to the Core for export - Check the between the Edge and Core.
• File system super block is invalid - Check the Edge and Core versions. Offline, unmap, and unmount the export.
• Export could not be mounted - Check the config.
• Edge Virtual IP could not be configured - Configure the Edge Virtual IP and check the syslog.
• SteelFusion VLUN resize failed - Check the syslogs. Offline, unmap, and remap the export.
graniteISCSIError(enterprises.17163.1.52.4.0.10001)
Degraded Storage Protocol module encountered error.
The NFS server is not running. Check the system logs for crashes.
Trap and OID Appliance
state
Text Description

686 | SteelFusion Edge MIB
SNMP traps
graniteSnapshotError(enterprises.17163.1.52.4.0.10003)
Degraded Snapshot or timeout error.
A snapshot failed to be committed to the SAN, or a snapshot has failed to complete due to Windows timing out.
Check the Core logs for details. Retry the Windows snapshot.
graniteBlockstoreError(enterprises.17163.1.52.4.0.10004)
Degraded Disk space low The blockstore is running out of space. This triggers when only 5 percent of space is available in the blockstore.
Check your WAN connection as well as connectivity to the Core. The can also happen if clients write more data than can be sent over the WAN for a prolonged period of time.
Critical Disk space full The blockstore is out of space.
Check your WAN connection as well as connectivity to the Core. The can also happen if clients write more data than can be sent over the WAN for a prolonged period of time.
Degraded Memory Low The blockstore is running out of memory.
This alarm indicates a temporary condition caused by too much I/O. Limit the number of active prepop sessions. Check if the IOPS exceeds the model recommendation.
Degraded Read Error The blockstore could not read data that was already replicated to the Core. Clients will not see any error because the Edge will fetch the data from the Core.
Check the system logs to determine the root cause. Replace any disks that have failed. The alarm clears when you restart the optimization service.
Trap and OID Appliance
state
Text Description
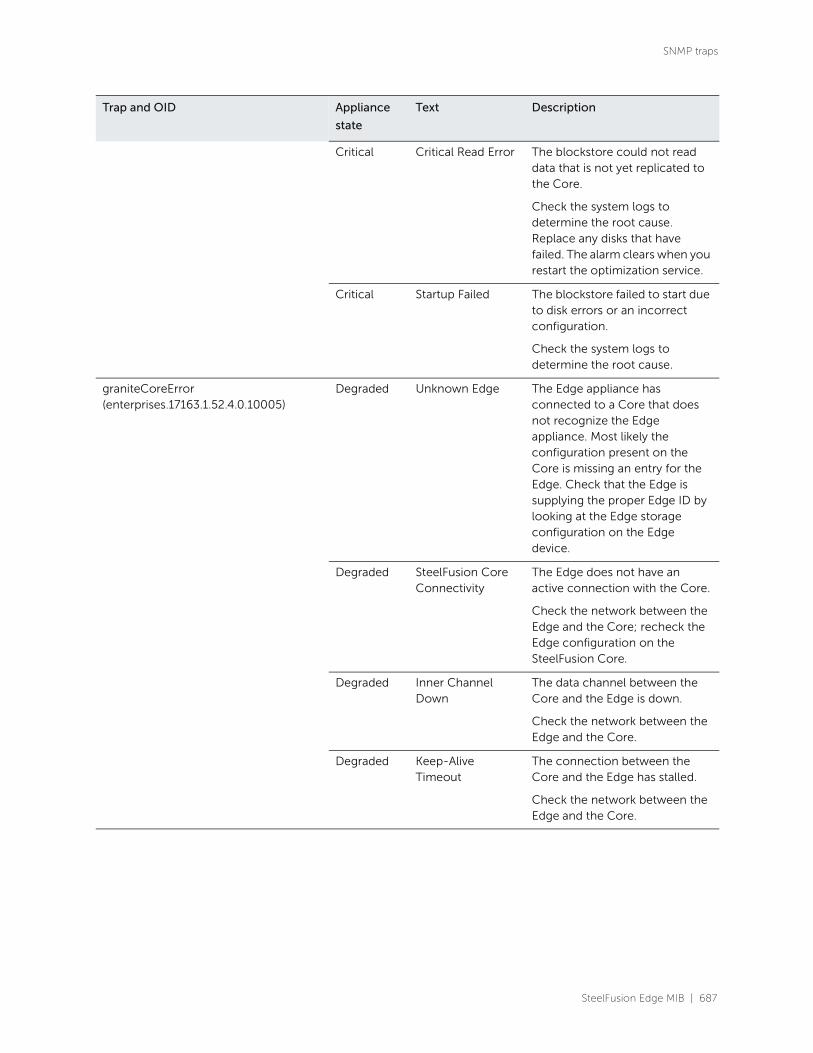
SteelFusion Edge MIB | 687
SNMP traps
Critical Critical Read Error The blockstore could not read data that is not yet replicated to the Core.
Check the system logs to determine the root cause. Replace any disks that have failed. The alarm clears when you restart the optimization service.
Critical Startup Failed The blockstore failed to start due to disk errors or an incorrect configuration.
Check the system logs to determine the root cause.
graniteCoreError(enterprises.17163.1.52.4.0.10005)
Degraded Unknown Edge The Edge appliance has connected to a Core that does not recognize the Edge appliance. Most likely the configuration present on the Core is missing an entry for the Edge. Check that the Edge is supplying the proper Edge ID by looking at the Edge storage configuration on the Edge device.
Degraded SteelFusion Core Connectivity
The Edge does not have an active connection with the Core.
Check the network between the Edge and the Core; recheck the Edge configuration on the SteelFusion Core.
Degraded Inner Channel Down
The data channel between the Core and the Edge is down.
Check the network between the Edge and the Core.
Degraded Keep-Alive Timeout
The connection between the Core and the Edge has stalled.
Check the network between the Edge and the Core.
Trap and OID Appliance
state
Text Description
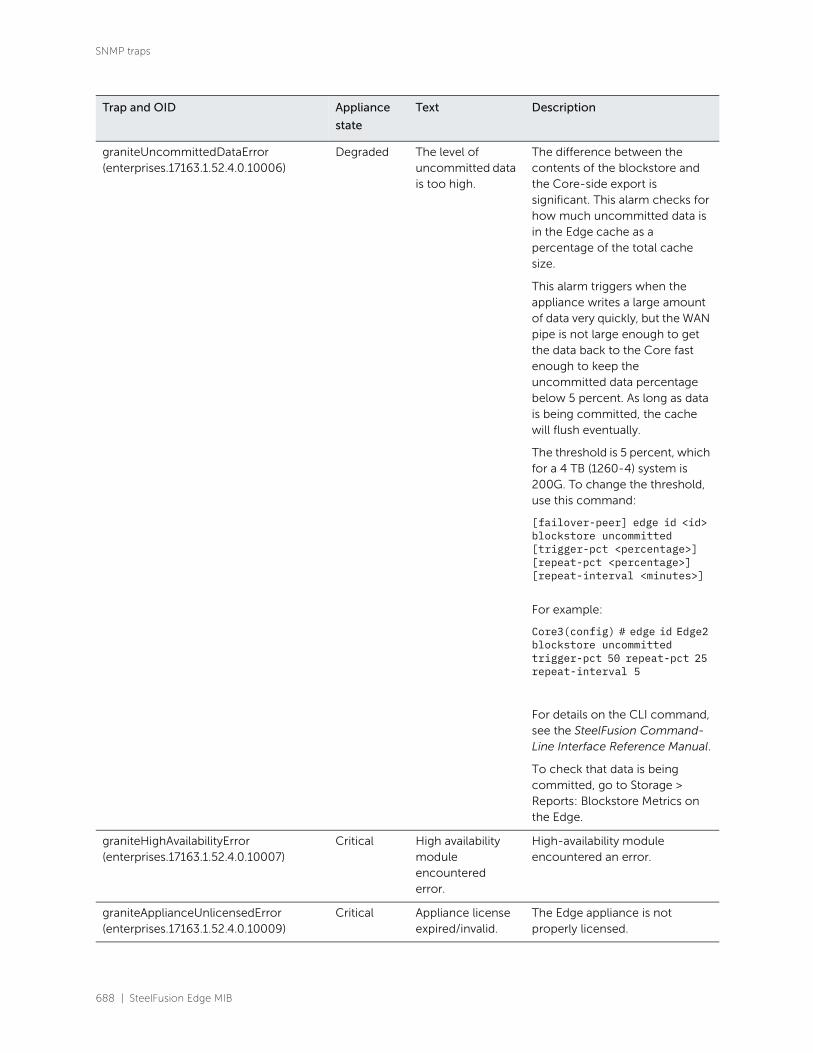
688 | SteelFusion Edge MIB
SNMP traps
graniteUncommittedDataError(enterprises.17163.1.52.4.0.10006)
Degraded The level of uncommitted data is too high.
The difference between the contents of the blockstore and the Core-side export is significant. This alarm checks for how much uncommitted data is in the Edge cache as a percentage of the total cache size.
This alarm triggers when the appliance writes a large amount of data very quickly, but the WAN pipe is not large enough to get the data back to the Core fast enough to keep the uncommitted data percentage below 5 percent. As long as data is being committed, the cache will flush eventually.
The threshold is 5 percent, which for a 4 TB (1260-4) system is 200G. To change the threshold, use this command:
[failover-peer] edge id <id> blockstore uncommitted [trigger-pct <percentage>] [repeat-pct <percentage>] [repeat-interval <minutes>]
For example:
Core3(config) # edge id Edge2 blockstore uncommitted trigger-pct 50 repeat-pct 25 repeat-interval 5
For details on the CLI command, see the SteelFusion Command-Line Interface Reference Manual.
To check that data is being committed, go to Storage > Reports: Blockstore Metrics on the Edge.
graniteHighAvailabilityError (enterprises.17163.1.52.4.0.10007)
Critical High availability module encountered error.
High-availability module encountered an error.
graniteApplianceUnlicensedError (enterprises.17163.1.52.4.0.10009)
Critical Appliance license expired/invalid.
The Edge appliance is not properly licensed.
Trap and OID Appliance
state
Text Description

SteelFusion Edge MIB | 689
SNMP traps
hypervisorHardwareMgmtConnectionError (enterprises.17163.1.52.4.0.30002)
Critical Hypervisor hardware management connection alarm is triggered.
RiOS has lost IP connectivity or cannot authenticate the connection to the hypervisor motherboard controller.
hypervisorHardwarePowerError (enterprises.17163.1.52.4.0.30003)
Critical Hypervisor hardware power alarm is triggered.
The hypervisor has lost power unexpectedly.
hypervisorHardwareMemoryError (enterprises.17163.1.52.4.0.30005)
Hypervisor hardware memory error alarm is triggered.
A memory error has occurred; for example, a system memory stick has failed.
hypervisorHardwareOtherHardwareError(enterprises.17163.1.52.4.0.30006)
Hypervisor other hardware error alarm is triggered.
A hardware error has been detected. These issues trigger the other hardware error alarm:
• The hypervisor hardware is using a memory Dual In-line Memory Module (DIMM), a hard disk, or a NIC that is not qualified.
• The hypervisor hardware has detected a RiOS NIC. The hypervisor does not support RiOS NICs.
• DIMMs are plugged into the hypervisor hardware but the hypervisor cannot recognize them because:
– a DIMM is in the wrong slot. You must plug DIMMs into the black slots first and then use the blue slots when all of the black slots are in use.
—or—
– a DIMM is broken and you must replace it.
Trap and OID Appliance
state
Text Description

690 | SteelFusion Edge MIB
SNMP traps
hypervisorHardwareTemperatureError (enterprises.17163.1.52.4.0.30007)
Hypervisor hardware temperature alarm is triggered.
A hypervisor CPU, board, or platform controller hub (PCH) temperature has exceeded the rising threshold. When the CPU, board, or PCH returns to the reset threshold, the critical alarm clears (after polling for 30 seconds). If the appliance has more than one CPU, both CPUs are reported. The default temperature thresholds are set by the motherboard.
hypervisorLicenseError(enterprises.17163.1.52.4.0.30008)
Hypervisor license alarm is triggered.
Indicates that one of these issues with the virtualization license has occurred:
• Hypervisor License Expiring - The license expiration time is within the alarm threshold and is about to expire. The default setting is two weeks.
• Hypervisor License Expired - The license has expired.
• Hypervisor Using Trial License - The hypervisor is using a trial license.
hypervisorOperationError (enterprises.17163.1.52.4.0.30009)
Degraded Hypervisor alarm is triggered.
The hypervisor is in lockdown mode.
vspConnectionError (enterprises.17163.1.52.4.0.30010)
VSP connection alarm is triggered.
A communication issue has occurred between VSP and the hypervisor.
This alarm triggers for any of these issues:
• VSP is disconnected from the hypervisor.
• The hypervisor password is invalid.
• VSP was unable to gather some hardware information.
• VSP is disconnected.
Trap and OID Appliance
state
Text Description

SteelFusion Edge MIB | 691
SNMP traps
vspInstallationError (enterprises.17163.1.52.4.0.30011)
VSP installation alarm is triggered.
VSP is not installed properly and is powered off.
This alarm triggers for any of these issues:
• A hypervisor upgrade has failed.
• A configuration push from the Hypervisor Installer has failed.
• VSP could not gather enough information to set up an interface.
• The hypervisor is not installed.
vspLicenseError(enterprises.17163.1.52.4.0.30012)
Degraded Riverbed VSP vSphere license alarm is triggered.
This alarm is triggered when the VSP license [VSP(ESXi)] is expired or missing.
vspBaseLicenseError(enterprises.17163.1.52.4.0.30013)
Critical Riverbed base license alarm is triggered.
This alarm is triggered when the VSP Base license (VSPBASE) is expired or missing.
Trap and OID Appliance
state
Text Description

692 | SteelFusion Edge MIB
SNMP traps

SteelFusion Edge Ports | 693
B
SteelFusion Edge Ports
This appendix provides a reference to ports used by the system. It includes these sections:
• “Core and Edge ports” on page 693
• “Default ports” on page 694
• “Commonly excluded ports” on page 694
• “Interactive ports forwarded by the SteelFusion Edge” on page 694
• “Secure ports forwarded by the SteelFusion Edge” on page 695
Core and Edge portsThis table lists and describes the SteelFusion default ports with the port label SteelFusion.
Default ports Description
7950 Data requests for data blocks absent in Edge appliance from the data center
7951 New data created at the Edge to the data center
7952 Prefetch data for which SteelFusion has highest confidence (for example, file read ahead)
7953 Prefetch data for which SteelFusion has medium confidence (for example, boot)
7954 Prefetch data for which SteelFusion has lowest confidence (for example, prepopulation)
7970 Management information exchange between Edge and Core appliances
7990 Date being replicated to the secondary data center

694 | SteelFusion Edge Ports
Default ports
Default portsThis table summarizes default ports with the port label: RBT-Proto.
Note: Because optimization between SteelFusion Edges typically takes place over a secure WAN, it is not necessary
to configure company firewalls to support SteelFusion Edge-specific ports. If there are one or more firewalls
between two SteelFusion Edges, ports 7800 and 7810, must be passed through firewall devices located between the
pair of SteelFusion Edges. Also, SYN and SYN/ACK packets with the TCP option 76 must be passed through firewalls
for automatic discovery to function properly. For the SCC, port 22 must be passed through for the firewall to
function properly.
Commonly excluded portsThis section summarizes the ports that are commonly excluded from optimization in the SteelFusion
Edge.
If you have multiple ports that you want to exclude, create a port label and list the ports.
Interactive ports forwarded by the SteelFusion EdgeA default in-path rule with the port label Interactive is automatically created in your system. This in-path
rule automatically passes through traffic on interactive ports (for example, Telnet, TCP ECHO, remote
logging, and shell).
If you do not want to automatically forward these ports, delete the Interactive rule in the Management
Console.
Default ports Description
7744 RiOS data store synchronization port
7800 In-path port for Edge-to-SteelHead or Edge-to-Core connections
7801 Network address translation (NAT) port
7810 Out-of-path server port for Edge-to-SteelHead or Edge-to-Core connections
7820 Failover port for redundant appliances
7850 Connection forwarding (neighbor) port
7860 SteelHead Interceptor
7870 SteelCentral Controller for SteelHead Mobile
Application Ports
PolyComm (video conferencing) 1503, 1720-1727, 3230-3253, 5060
Cisco IPTel 2000

SteelFusion Edge Ports | 695
Secure ports forwarded by the SteelFusion Edge
This table lists the interactive ports that are automatically forwarded by the SteelHead.
Secure ports forwarded by the SteelFusion EdgeA default in-path rule with the port label Secure is automatically created in your system. This in-path rule
automatically passes through traffic on commonly secure ports (for example, ssh, https, and smtps).
If you do not want to automatically forward these ports, delete the Secure rule in the Management
Console.
This table lists the common secure ports that are automatically forwarded by the SteelFusion Edge.
Port Description
7 TCP ECHO
23 Telnet
37 UDP/Time
107 Remote Telnet Service
179 Border Gateway Protocol
513 Remote Login
514 Shell
1494 Citrix
1718-1720 h323gatedisc
2000-2003 Cisco SCCP
2427 Media Gateway Control Protocol Gateway
2598 Citrix
2727 Media Gateway Control Protocol Call Agent
3389 MS WBT Server, TS/Remote Desktop
5060 SIP
5631 PC Anywhere
5900-5903 VNC
6000 X11
Type Port Description
ssh 22/tcp SSH Remote Login Protocol
tacacs 49/tcp TACACS+
kerberos 88 Kerberos
rtsps 322 Real Time Streaming Protocol over SSL (RTSPS)
https 443/tcp HTTP over TLS/SSL and for vSphere Client
smtps 465/tcp Simple Mail Transfer Protocol (SMTP) over SSL (TLS)
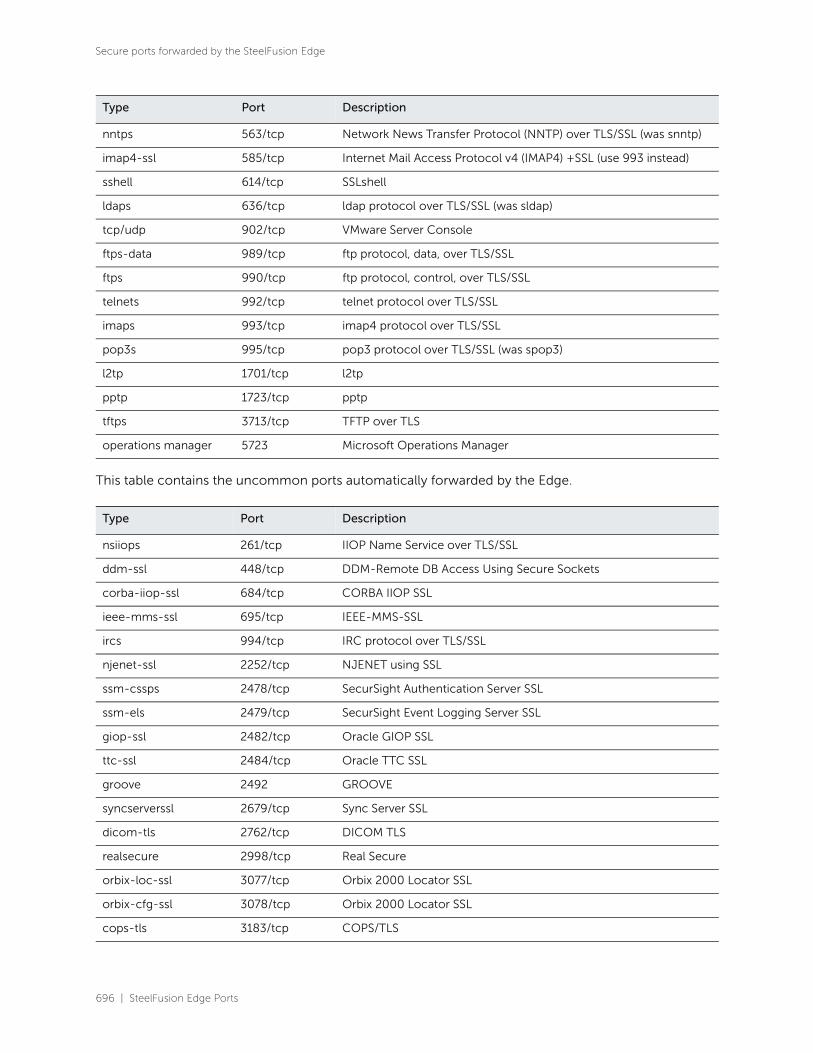
696 | SteelFusion Edge Ports
Secure ports forwarded by the SteelFusion Edge
This table contains the uncommon ports automatically forwarded by the Edge.
nntps 563/tcp Network News Transfer Protocol (NNTP) over TLS/SSL (was snntp)
imap4-ssl 585/tcp Internet Mail Access Protocol v4 (IMAP4) +SSL (use 993 instead)
sshell 614/tcp SSLshell
ldaps 636/tcp ldap protocol over TLS/SSL (was sldap)
tcp/udp 902/tcp VMware Server Console
ftps-data 989/tcp ftp protocol, data, over TLS/SSL
ftps 990/tcp ftp protocol, control, over TLS/SSL
telnets 992/tcp telnet protocol over TLS/SSL
imaps 993/tcp imap4 protocol over TLS/SSL
pop3s 995/tcp pop3 protocol over TLS/SSL (was spop3)
l2tp 1701/tcp l2tp
pptp 1723/tcp pptp
tftps 3713/tcp TFTP over TLS
operations manager 5723 Microsoft Operations Manager
Type Port Description
nsiiops 261/tcp IIOP Name Service over TLS/SSL
ddm-ssl 448/tcp DDM-Remote DB Access Using Secure Sockets
corba-iiop-ssl 684/tcp CORBA IIOP SSL
ieee-mms-ssl 695/tcp IEEE-MMS-SSL
ircs 994/tcp IRC protocol over TLS/SSL
njenet-ssl 2252/tcp NJENET using SSL
ssm-cssps 2478/tcp SecurSight Authentication Server SSL
ssm-els 2479/tcp SecurSight Event Logging Server SSL
giop-ssl 2482/tcp Oracle GIOP SSL
ttc-ssl 2484/tcp Oracle TTC SSL
groove 2492 GROOVE
syncserverssl 2679/tcp Sync Server SSL
dicom-tls 2762/tcp DICOM TLS
realsecure 2998/tcp Real Secure
orbix-loc-ssl 3077/tcp Orbix 2000 Locator SSL
orbix-cfg-ssl 3078/tcp Orbix 2000 Locator SSL
cops-tls 3183/tcp COPS/TLS
Type Port Description

SteelFusion Edge Ports | 697
Secure ports forwarded by the SteelFusion Edge
csvr-sslproxy 3191/tcp ConServR SSL Proxy
xnm-ssl 3220/tcp XML NM over SSL
msft-gc-ssl 3269/tcp Microsoft Global Catalog with LDAP/SSL
networklenss 3410/tcp NetworkLens SSL Event
xtrms 3424/tcp xTrade over TLS/SSL
jt400-ssl 3471/tcp jt400-ssl
seclayer-tls 3496/tcp Security Layer over TLS
vt-ssl 3509/tcp Virtual Token SSL port
jboss-iiop-ssl 3529/tcp JBoss IIOP/SSL
ibm-diradm-ssl 3539/tcp IBM Directory Server SSL
can-nds-ssl 3660/tcp Candle Directory Services using SSL
can-ferret-ssl 3661/tcp Candle Directory Services using SSL
linktest-s 3747/tcp LXPRO.COM LinkTest SSL
asap-tcp-tls 3864/tcp ASAP/TLS TCP port
topflow-ssl 3885/tcp TopFlow SSL
sdo-tls 3896/tcp Simple Distributed Objects over TLS
sdo-ssh 3897/tcp Simple Distributed Objects over SSH
iss-mgmt-ssl 3995/tcp ISS Management Services SSL
suucp 4031/tcp UUCP over SSL
wsm-server-ssl 5007/tcp WSM Server SSL
sip-tls 5061/tcp SIP-TLS
imqtunnels 7674/tcp iMQ SSL tunnel
davsrcs 9802/tcp WebDAV Source TLS/SSL
intrepid-ssl 11751/tcp Intrepid SSL
rets-ssl 12109/tcp RETS over SSL
Type Port Description

698 | SteelFusion Edge Ports
Secure ports forwarded by the SteelFusion Edge

Application Signatures for AFE | 699
C
Application Signatures for AFE
This appendix provides a reference to the application signatures recognized by the Application Flow
Engine (AFE). It includes this section:
• “List of recognized applications” on page 699
List of recognized applicationsThe AFE recognizes more than 1300 application signatures. These application signatures provide an
efficient and accurate way to identify applications for advanced classification of network traffic in QoS.
You can verify the application signatures available in your specific RiOS version from within the
Management Console. Type the first few letters of the application in the Application Protocol or
Application field for QoS configuration. As you type the name of an application, a menu appears and lists
available applications that match your typing.
These tables list and describe application signatures recognized by the Application Flow Engine. The
tables are organized by application type.
Collaboration
applications
Description First available in
RiOS version
Citrix Jedi An online streaming connection protocol for streaming real-time data.
8.0
Citrix Online An online service that includes GoToMyPC, GoToMeeting, GoToWebinar, and GoToTraining.
8.0
Clarizen A web-based collaborative work and project management solution.
8.6
GoToMeeting A remote meeting and desktop sharing software that enables the user to meet with other computer users, customers, clients, or colleagues via the internet in real-time.
6.5
GoToMyPC A remote control software service by Citrix that enables users to access another computer remotely, over the internet.
8.6
GoToTraining An online training program service by Citrix. Users can host their training sessions online and make tests and materials available for use.
8.6
GoToWebinar A webinar hosting service by Citrix. Users can plan, present, and record webinars over the internet.
8.6

700 | Application Signatures for AFE
List of recognized applications
Groupwise A messaging and collaborative software platform from Novell that supports email, calendaring, personal information management, instant messaging, and document management.
8.0
HL7 A medical information exchange standard for exchanging information between medical applications.
8.0
Livemeeting A Microsoft commercial web-conferencing service. 6.5
Lync A Microsoft voice, video, file transfer, and video sharing communications platform. For details on the types of traffic Lync generates and the classification the AFE provides for them, see the SteelHead Deployment Guide.
AFE classification of Lync traffic covers the majority of traffic generated between Lync clients and Lync servers but not all.
A Lync server uses the default SIP port of TCP 5061. You can use this port number to build a custom rule to classify Lync SIP traffic.
8.5.1
Lync Audio The voice calls between Lync clients if the control channel is unencrypted.
8.6
Lync Control The Lync client logins. 8.6
Lync Media The voice and video calls between Lync clients. 8.6
Lync Share The file transfers between Lync clients 8.6
Lync Video The video calls between Lync clients if the control channel is unencrypted.
8.6
Notes An IBM enterprise collaboration suite, Lotus Notes. 8.0
Meeting Maker A cross-platform personal calendar and group scheduling software application from PeopleCube.
8.0
Microsoft SharePoint Online
Business information collaboration software that allows collaboration and file sharing along with a web publishing tool.
8.6
NetMeeting A VoIP and multipoint video conferencing client included in many versions of Microsoft Windows.
8.0
SharePoint A Microsoft collaboration, file sharing, and web publishing system.
6.5
WebEx A Cisco online meeting and web-conferencing application. 6.5
Webex-Media The WebEx Meetings audio and video conferencing application. 9.1
Webex-Sharing The WebEx Meetings traffic generated from desktop sharing, text chat, file sharing, and whiteboard.
9.1
Collaboration
applications
Description First available in
RiOS version
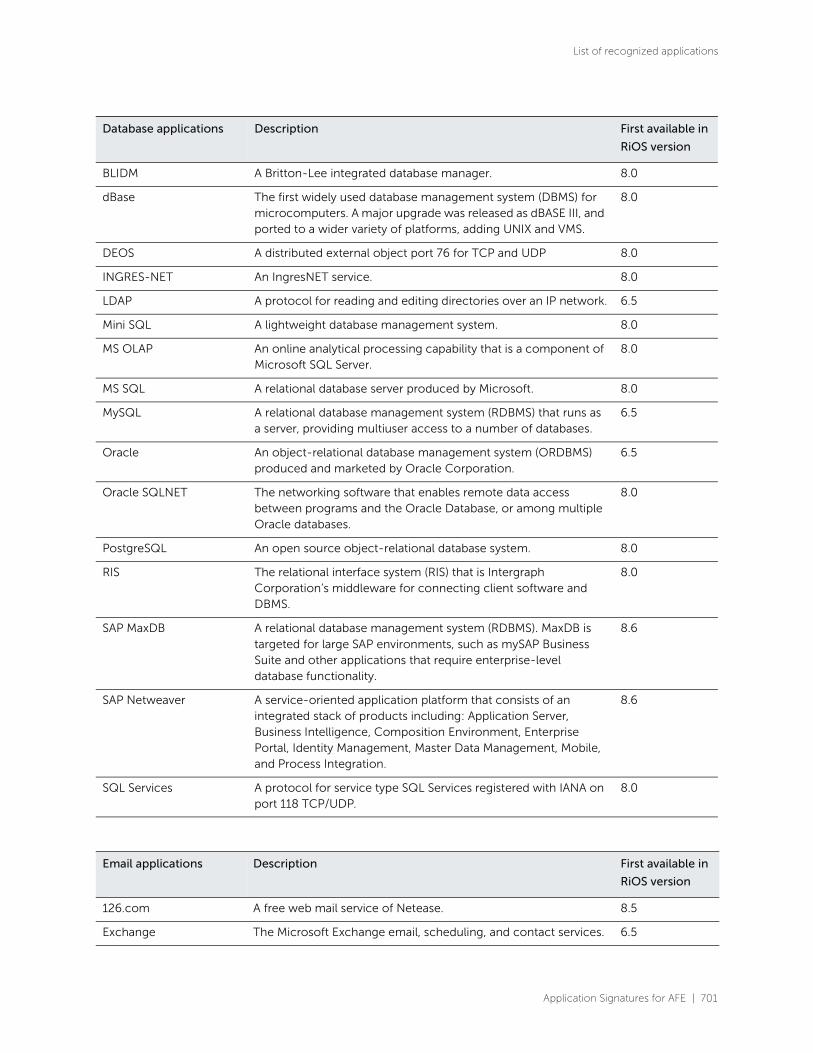
Application Signatures for AFE | 701
List of recognized applications
Database applications Description First available in
RiOS version
BLIDM A Britton-Lee integrated database manager. 8.0
dBase The first widely used database management system (DBMS) for microcomputers. A major upgrade was released as dBASE III, and ported to a wider variety of platforms, adding UNIX and VMS.
8.0
DEOS A distributed external object port 76 for TCP and UDP 8.0
INGRES-NET An IngresNET service. 8.0
LDAP A protocol for reading and editing directories over an IP network. 6.5
Mini SQL A lightweight database management system. 8.0
MS OLAP An online analytical processing capability that is a component of Microsoft SQL Server.
8.0
MS SQL A relational database server produced by Microsoft. 8.0
MySQL A relational database management system (RDBMS) that runs as a server, providing multiuser access to a number of databases.
6.5
Oracle An object-relational database management system (ORDBMS) produced and marketed by Oracle Corporation.
6.5
Oracle SQLNET The networking software that enables remote data access between programs and the Oracle Database, or among multiple Oracle databases.
8.0
PostgreSQL An open source object-relational database system. 8.0
RIS The relational interface system (RIS) that is Intergraph Corporation’s middleware for connecting client software and DBMS.
8.0
SAP MaxDB A relational database management system (RDBMS). MaxDB is targeted for large SAP environments, such as mySAP Business Suite and other applications that require enterprise-level database functionality.
8.6
SAP Netweaver A service-oriented application platform that consists of an integrated stack of products including: Application Server, Business Intelligence, Composition Environment, Enterprise Portal, Identity Management, Master Data Management, Mobile, and Process Integration.
8.6
SQL Services A protocol for service type SQL Services registered with IANA on port 118 TCP/UDP.
8.0
Email applications Description First available in
RiOS version
126.com A free web mail service of Netease. 8.5
Exchange The Microsoft Exchange email, scheduling, and contact services. 6.5

702 | Application Signatures for AFE
List of recognized applications
Facebook-Messages The Facebook email and instant messaging service. 8.5
Gmail The Google hosted web mail service that allows private access to email, file storage, and instant messaging.
6.5
IMAP An internet standard protocol for accessing email on a remote server.
8.0
Infostore A Microsoft Exchange information store. 8.0
MAILQ A protocol for service type MAILQ registered with IANA on port 174 TCP/UDP
8.0
MAPI The protocol that Microsoft Outlook uses to communicate with Microsoft Exchange.
6.5
Microsoft Exchange Online
A hosted enterprise email, scheduling, and contacts solution. It provides similar capabilities as Microsoft Exchange Server but is offered as a cloud-based service.
8.6
Microsoft Outlook A personal information manager that includes functionality such as email client, calendar, task manager, contact manager, and note taker.
8.0
MTA The Microsoft Exchange Mail Transfer Agent. 8.0
NI Mail A protocol for service type NI MAIL registered with IANA on port 61 TCP/UDP.
8.0
PCMAIL A protocol for service type pcmail-srv registered with IANA on port 158 TCP/UDP.
8.0
POP2 A protocol used by local email clients to retrieve email from a remote server.
8.0
POP3 A protocol used by local email clients to retrieve email from a remote server.
6.5
QMTP An email transmission protocol that is designed to have better performance than Simple Mail Transfer Protocol (SMTP), the de facto standard.
8.0
REMAIL A protocol for service type re-mail-ck registered with IANA on port 50 TCP/UDP.
8.0
RFRI The Microsoft Exchange referral interface. 8.0
SMTP An internet standard for email transmission across internet Protocol (IP) networks.
6.5
Store Admin An Exchange Store server administration tool. 8.0
Sysatt The Microsoft Exchange system attendant service. 8.0
XNS Mail The Xerox networking services mail. 8.0
Email applications Description First available in
RiOS version

Application Signatures for AFE | 703
List of recognized applications
File transfer applications Description First available in
RiOS version
4Shared A file-sharing service that provides search functions and enables users to upload and download files to their accounts and share links with other people.
8.0
ACR-NEMA A standard for handling, storing, printing, and transmitting information in medical imaging.
8.0
AFP A network protocol that offers file services for Mac OS X and original Mac OS. In Mac OS X, AFP is one of several file services supported including Server Message Block (SMB), Network File System (NFS), File Transfer Protocol (FTP), and WebDAV. AFP currently supports Unicode filenames, POSIX and access control list permissions, resource forks, named extended attributes, and advanced file locking.
8.0
Apple Update A software tool by Apple Computer that installs the latest version of Apple software.
8.0
AppleJuice A semi-centralized peer-to-peer file sharing network similar to the original eDonkey network.
8.0
AppleJuice GUI An AppleJuice host running a GUI that represents traffic between itself and a host running the AppleJuice Core.
8.0
Ares An open-source peer-to-peer file sharing application. 8.5
Astraweb A Usenet/newsgroup service provider. 6.5
Auditd The userspace daemon to the Linux auditing system, which is responsible for writing audit records to the disk.
8.0
AVG A free, downloadable antivirus software solution made by AVG Technologies.
8.0
Avira A free, downloadable antivirus program that is part of the Avira security product suite.
8.0
BackBlaze An online backup tool that allows Windows and Mac OS X users to back up their data to an offsite data center.
8.0
BFTP A protocol for service type background file transfer program registered with IANA on port 152 TCP/UDP.
8.0
BigUpload A secure uploading, transferring, and file sharing service. 8.5
BitDefender An antivirus software solution for varying levels of AV protection. 8.0
BITS A file transfer protocol used primarily for Microsoft updates. 6.5
BitTorrent A peer-to-peer file sharing protocol used for transferring large amounts of data.
6.5
BlazeFS A remote file sharing system designed specifically for the Mac OS. Once running, Blaze is transparent to the user and to the client application. It appears as if users are accessing files on a local hard drive.
8.0
Boxnet An online file sharing and storage website. 8.5
704 | Application Signatures for AFE
List of recognized applications
CFDPTKT A protocol for service type CFDPTKT registered with IANA on port 120 TCP/UDP.
8.0
CIFS The Common Internet File System used to provide shared access to directories, files, printers, serial ports, and miscellaneous communication devices between nodes on a network.
6.5
CNETdownload An internet download directory launched in 1996 as part of CNET.
8.5
Commvault A software solution for enterprise data backup and storage management.
8.0
Datei.to A general browsing and file transfer hosting service. 8.5
Deposit-Files An online file storage service. 8.5
DirectConnect An open-source Windows client for the DirectConnect protocol and Advanced DirectConnect protocol that allows users to connect to a central hub and download files directly from one another.
8.0
Divshare A media delivery, sharing, and publishing system. 8.5
Docstoc An electronic business document repository and online store. 8.0
Dropbox An online file hosting and sharing service. 8.0
eDonkey A peer sharing application for storage and distribution of large files.
8.0
Eset An Eset Antivirus/Security software solution. 8.0
Extratorrent A free download torrent system for movies, music, software, and so on.
8.5
F-Prot An antivirus software solution for varying levels of AV protection. 8.0
FASP A high-speed, secure file transfer protocol. 8.0
Filer.cx A file hosting service that provides free web space for documents, pictures, music, and movies.
8.0
FileServe A file hosting service. 8.5
Filesonic A general browsing and file transfer service from data storage website Filesonic.
8.5
FilesTube A file search engine that searches various file sharing and uploading sites like RapidShare, MegaUpload, MediaFire, Hotfile, Netload, Filesonic, and 4shared.
8.0
Freenet A peer-to-peer platform that allows for the bypassing of censored communications and allows for user anonymity.
8.6
FTP A protocol used to transfer files from a file server to a local machine.
6.5
FTP Control The File Transfer Protocol (FTP) control used to manage FTP data transfers from a file server to a local machine.
8.0
File transfer applications Description First available in
RiOS version

Application Signatures for AFE | 705
List of recognized applications
FTP Data The FTP data flow 8.0
FTPS The FTP control used over TLS/SSL. 8.0
FTPSDATA The FTP data over TLS/SSL 8.0
FXP A protocol that provides a method of data transfer that uses the FTP protocol to transfer data from one remote server to another (inter-server) without routing this data through the client's connection.
8.0
Giganews A popular Usenet/newsgroup service provider. 6.5
Gnutella A large peer-to-peer file-sharing network. 6.5
GPFS A high-performance shared-disk clustered file system. 8.0
GSIFTP An FTP enhancement that uses GSI security. 8.0
HiveStor An open source software program that integrates existing and new commodity hardware to provide a reliable storage network with no single point of failure.
8.0
Hotfile A free download/upload management tool that increases the speed and stability of your downloads/uploads.
8.0
iCloud The cloud data storage and computing service from Apple. 8.5
ifile.it An online backup service website. 8.5
iMesh A media and file-sharing client with online social network features.
8.0
ImageShack A general browsing and file transfer service from image hosting website ImageShack.
8.5
Kaspersky An antivirus software solution for varying levels of AV protection at home and at work.
8.0
Kat A torrent download site. 8.5
Kazaa A popular file-sharing client that provides unlimited streaming of free music files.
6.5
KFTP A file transfer protocol with Kerberos authentication and encryption.
8.0
KFTPDATA A protocol for service type Kerberos FTP Data registered with IANA on port 6620 TCP/UDP.
8.0
Letitbit A Russian file hosting website. 8.5
Manolito A free peer-to-peer file sharing network. Users can download music, create play lists, and use instant messaging to chat with friends.
8.0
MC-FTP An encrypted multicast file transfer program that transfers files to multiple receivers simultaneously.
8.0
McAfee A free, downloadable antivirus software solution, and premium AV software solutions for home and office.
8.0
File transfer applications Description First available in
RiOS version
706 | Application Signatures for AFE
List of recognized applications
McIDAS A protocol for service type McIDAS Data Transmission registered with IANA on port 112 TCP/UDP.
8.0
MediaFire An online file hosting service that enables users to upload, download, manage and share documents, presentations, videos, images and more.
8.0
Megashares A file sharing and storage site. 8.5
MSDN The group within Microsoft responsible for networking with developers and testers.
8.0
Multiupload A forwarding site for major upload sites such as Megaupload, Upload King, DepositFiles, Hotfile, Uploadhere, Zshare, Filesonic, Fileserve, and Wupload.
8.5
MUTE-net A peer-to-peer file sharing network that uses a routing algorithm inspired by ant colonies. MUTE-net has not been maintained since April 2007, although software compatibility with the MUTE network has been updated since then.
8.0
NFA A network file system that acts as a client for a remote file access protocol, providing access to files on a server.
8.0
NFS A network file system protocol that enables a user on a client computer to access files over a network.
6.5
NI FTP The network independent file transfer program. 8.0
NNTP An internet application protocol used for transporting Usenet news articles (netnews) between news servers and for reading and posting articles by end-user client applications.
6.5
NovaBACKUP A data protection and availability software solution that offers support for multi-OS environments and is capable of handling thousands of servers and petabytes of information.
8.0
OFTP A protocol used for electronic data interchange (EDI) between two communications business partners.
8.0
OFTPS An FTP protocol used over SSL/TLS primarily for electronic data interchange between two communications business partners.
8.0
Online-File-Folder A storage service provided by godaddy.com. 8.5
Paltalk File Transfer A software file transfer application that allows users to communicate through instant messaging, voice, and video chat.
8.0
Panda An antivirus software solution for varying levels of AV protection. 8.0
Pando A free file-sharing application that uses both peer-to-peer and client-server architectures. Users are able to send files that might be too large to send through email.
8.0
PDbox A file sharing website that allows transfers of videos (often Korean television programs), photos, and music. The site provides a forum for information and opinion exchange as well as free personal storage space for media exchange.
8.6
File transfer applications Description First available in
RiOS version
Application Signatures for AFE | 707
List of recognized applications
PFTP A file transfer protocol that transfers files, directories, and data to other hosts running pftp.
8.0
PutLocker An online file hosting site. 8.5
QFT The queued file transport protocol. 8.0
RapidShare An online file hosting and sharing service. 8.0
SBNTBCST A file transfer protocol. 8.0
SFTP A secure file transfer protocol typically used with the SSH protocol.
8.0
Share P2P A closed-source p2p application developed in Japan. 8.0
Skype File Transfer A peer-to-peer file transfer service that is part of the Skype messaging application.
6.5
SuperNews A Usenet/newsgroup service provider. 6.5
Swift RVFP A protocol for service type swift-rvf registered with IANA on port 97 TCP/UDP.
8.0
TFTP A lightweight file transfer protocol. 8.0
TFTPS A lightweight file transfer protocol over SSL/TLS. 8.0
Torrentz A Finland-based metasearch engine for BitTorrent. 8.5
Uploading An online paid cloud storage service. 8.5
Usenet A worldwide distributed internet discussion system. Users read and post messages (called articles or posts, and collectively termed news) to one or more categories, known as newsgroups.
6.5
UUCP A protocol for service type UUCP Path Service registered with IANA on port 117 TCP/UDP.
8.0
Vagaa A peer-to-peer program originating from mainland China. The software is compatible with eDonkey network and BitTorrent and can be used for downloading large files.
8.6
WebDAV A web-based distributed authoring and versioning system that enables users to collaboratively edit and manage files on a remote web server.
8.0
Windows Update A service provided by Microsoft that enables users to get software patches and updates for MS Windows and other programs, including Internet Explorer, over the internet.
8.0
WinMX WinMX is a free peer-to-peer file sharing program. It runs on the Windows operating system; however, the official WinMX website and WinMX servers offline since 2005 as a result of an increased presence of dummy files on the site, which led to a lawsuit. The application now operates through third-party modifications.
8.0
Winny A Japanese peer-to-peer (P2P) file-sharing program. 8.0
File transfer applications Description First available in
RiOS version

708 | Application Signatures for AFE
List of recognized applications
XMPP-File-Transfer An XMPP protocol extension for establishing an Out-of-Band (OOB) byte stream between any two XMPP users, mainly for the purpose of file transfer. The byte stream can be either direct (peer-to-peer) or mediated (though a special-purpose proxy server). The typical transport protocol used is TCP, although UDP can optionally be supported as well.
9.1
Xunlei A download manager that supports file transfers using HTTP, FTP, eDonkey, and BitTorrent protocols
8.0
Yahoo Msg File Transfer A file transfer protocol for traffic within the Yahoo Messenger client.
8.0
YouSendIt A web-based secure digital file delivery company that lets users securely send, receive, and track files on demand.
8.0
ZanNet A combination Windows 95 network client and UNIX server that provides Windows 95 network drive access to your server files. Intended to replace both File Transfer Protocol (FTP) and Telnet programs, ZanNet accesses web pages and remote files over your current internet connection.
8.0
Game applications Description First available in
RiOS version
4399COM A general browsing and game play on a Chinese casual gaming website.
8.5
Battle.net A premium gaming service provided by Blizzard Entertainment. 8.0
Battle.net desktop app The traffic generated by the Battle.net desktop application. 9.1
Battle.net game protocol The traffic generated by the Battle.net game protocol. 9.1
Battle.net website The traffic generated by the Battle.net website. 9.1
Bet365 An online gaming and betting website. 8.5
Blizzard The Blizzard game client download traffic. 9.1
Blizzard downloader A tool used to download Blizzard game clients. 9.1
Blizzard.com The Blizzard gaming website traffic. 9.1
Blizzard game data files The traffic generated when downloading game data files from Blizzard servers during installation or updating a game.
9.1
Blokus A website for playing the online version of the strategy board game Blokus against human or computer opponents.
8.6
Doof A free online gaming website. 8.5
Evony An Adobe Flash-based multiplayer online game, set in medieval times.
8.5
File transfer applications Description First available in
RiOS version

Application Signatures for AFE | 709
List of recognized applications
Farmville A real-time farm simulation game developed by Zynga, available as an application on Facebook and as an app on the Apple iPhone.
8.0
GungHo A Japanese online entertainment video game corporation. 9.1
IMGames A protocol for service-type IMGames registered with IANA on port 1077 TCP/UDP.
8.0
LINE games A gaming and mobile application website. 9.1
Mafiawars A multiplayer browser game created by Zynga. It is on several social networking sites and on the iPhone.
8.0
Mobaga-Town A Japanese online gaming site. 9.1
PS3 Game The games played on the series of video game consoles developed by Sony.
9.1
PS3 Match The process of connecting players together for online play sessions in multiplayer video games.
9.1
PS Network The Playstation 3 or 4 traffic that is accessing the Playstation network.
9.1
PS Site The Playstation website. 9.1
Steam An online gaming social networking website. Users can purchase, download, and play games, as they connect with friends and groups with similar interests.
8.0
Steam Client A client for digital-based distribution used with HTTP traffic for Steam store browsing and news updates.
8.0
Steam DLC The downloadable content from Steam (games, updates, and so on).
8.0
Steam Game The Steam online gaming traffic. 8.0
Steam Social The Steam social traffic (friends network, peer-to-peer voice chat).
8.0
World-Of-Warcraft The traffic generated by the World of Warcraft game, that handles interactions between players and the online world.
9.1
Xbox Live An online multiplayer gaming and digital media delivery service created and operated by Microsoft Corporation.
8.0
Y8 A general browsing, game play, and streaming media website. 8.5
Zynga A social network game developer of browser-based games that work both stand-alone and as application widgets on social networking websites such as Facebook and MySpace.
8.0
Zynga-Poker An online poker game. 9.1
Game applications Description First available in
RiOS version

710 | Application Signatures for AFE
List of recognized applications
Messaging applications Description First available in
RiOS version
050PLUS A Japanese application for making and receiving VoIP calls to other 050Plus users and PSTN telephone numbers.
8.6
AIM An instant messaging and presence application that enables users to conduct person-to-person instant messaging, chat room messaging, peer-to-peer file sharing, and Facebook support, among other features.
6.5
Aliwangwang An instant messaging application provided by the Alibaba network. Aliwangwang is used for personal communications as well as communications with people selling or buying products online.
8.6
APNS An Apple push notification service that opens a constant IP connection to forward notifications from its servers to Apple devices.
8.5
C2DM A service that helps developers send data from servers to their applications on Android devices. The service provides a simple, lightweight mechanism that servers can use to tell mobile applications to contact the server directly, to fetch updated application or user data. The C2DM service handles all aspects of message queueing and delivery to the target application running on the target device.
8.0
CISCOUC A software application that allows users to chat, make voice and video calls, and share screens over the internet.
9.1
CISUCAUD Cisco Jabber audio conferencing. 9.1
CISUCVID Cisco Jabber video conferencing. 9.1
eBuddy Mobile messaging applications that allow users to send text, pictures, and videos through internet connections.
8.6
eBuddy XMS A Single sign-on application for connecting to popular instant messaging services.
8.6
Fring A mobile messaging application to control messaging flow traffic.
8.5
Gadu Gadu The traffic that includes instant text messaging and browsing the Gadu Gadu product website.
9.1
Google Hangouts The traffic generated by voice and video streams from Google Hangouts, text chats, photo sharing, and some parts of the product web page.
9.1
Google Helpouts The traffic generated by voice and video streams from Google Helpouts.
9.1
Google Talk The VoIP application used with Google IM/chat. 6.5
Google Talk Audio Allows you to make an audio call using Google Talk IM service. 8.6
Google Talk File Transfer Allows you to send a file using Google Talk IM service. 8.6
Application Signatures for AFE | 711
List of recognized applications
Google Talk Gadget The Flash-based Google Talk IM client. 8.0
Google Talk Video Allows you to send make a video call using Google Talk IM service or Google Mobile service.
8.6
Hushmail A web-based email service offering PGP-encrypted email, file storage, and a vanity domain service.
8.5
iCall A messaging application that sends messages, voice, and video conference across multiple platforms. It also allows for calls between iCall devices and mobile phones.
8.6
ICQ An instant messaging computer program. 8.0
IMO.im An instant messenger service that allows for third-party authentication.
8.5
IRC A popular form of real-time internet text messaging. 6.5
ISCHAT An integrated set of live voice, chat, and email response services that enable online businesses to deliver just-in-time, personalized, interactive assistance to each visitor (now known as ATG Live Help).
8.0
Kakao Talk
Kakao Audio
An instant messaging application capable of sharing images, video, and voice clips.
8.6
Koolim A web messaging site that combines all of the most popular instant messaging services together.
8.5
LINE A Japanese mobile application that provides IM and voice and video chat capability on multiple platforms.
8.6
LINE-Media The video calls between LINE users. 9.1
Line2 A mobile VoIP application that allows the user to add a second line to their iPhone or Android device, or to give a phone number to an iPad. Data is transferred over Wi-Fi, cellular data, or cellular voice connections. Text messaging is supported for US-based customers only.
8.0
Meebo An instant messaging (IM) web platform that can connect with numerous IM networks.
8.0
Multimedia Messaging Service
A standard way to send messages that include multimedia content to and from mobile phones.
8.6
MPM An Internet Message Protocol - RFC 753 8.0
MSMQ A messaging protocol that enables applications running on separate servers/processes to communicate in a failsafe manner.
8.0
MSN2Go A third-party service for Windows Live Messenger. 8.5
MSNP An instant messaging protocol developed by Microsoft for use by the .NET Messenger Service and the instant messaging clients that connect to it, such as Windows Live Messenger.
8.0
Messaging applications Description First available in
RiOS version

712 | Application Signatures for AFE
List of recognized applications
MSP An application layer protocol used to send a short message between nodes on a network.
8.0
NateOn An instant messaging application provided by SK Communications available for Windows, Mac, Linux, and mobile platforms.
8.6
Net2Phone A software package that allows you to make phone calls and send faxes anywhere in the world.
9.1
Net2Phone Media The media traffic associated with Net2Phone calling services. 9.1
Nimbuzz An instant messaging application that supports VoIP and Video communications.
8.6
Nimbuzz Messaging An instant messaging application that supports VoIP and Video communications.
8.6
Nimbuzz World An instant messaging application that supports VoIP and Video communications.
8.6
Open-Webmail A simple web mail service.
OSCAR Open System for Communication in Realtime is AOL’s flagship instant messaging and presence information protocol. Currently, OSCAR is in use for two main AOL instant messaging systems: ICQ and AIM.
8.0
Paltalk Chat The Paltalk instant messaging text messaging traffic. 8.0
Paltalk Messenger An internet and downloadable chat service that enables users to communicate through instant messaging, voice, and video chat
8.0
Pinger A software application that enables you to send and receive free texts (real SMS) with your own free texting number.
8.0
QOTD An internet protocol defined in RFC 865. It is intended for testing and measurement purposes.
8.0
QQ A free instant messaging computer program in mainland China. 8.0
Skype A proprietary service that enables users to chat, make voice and video calls, and transfer files over the internet.
6.5
Skype Auth The Skype IP authentication and registration. 8.0
Skype Out The service that allows Skype users to call phone numbers, including landline and mobile phones, for a fee.
8.0
Skype p2p The Skype peer-to-peer traffic, chat, file-transfer, voice, and video.
8.0
Skype Probe The Skype discovery probe, used to locate open ports and automatically detect a local web proxy.
8.0
SLI Systems A service that focuses on site-search enhancement and ad generation.
8.6
Smart AdServer A platform for generating ads. 8.6
Softonic A software download portal. 8.6
Messaging applications Description First available in
RiOS version

Application Signatures for AFE | 713
List of recognized applications
Softpedia A software news, reviews, and download directory website. 8.6
Sogou A Chinese search engine that can search text, images, music, and maps.
8.6
Sohu A Chinese website that offers advertising, a search engine, on-line multiplayer gaming, and other services.
8.6
Tango A free mobile video communications service that works on the PC, iPhone, iPod touch, Windows Phone 7, hundreds of Android phones and tablets, and 3G, 4G, and Wi-Fi.
8.5
Vchat An internet conferencing protocol. 8.0
Viber A mobile application for iPhone and Android that enables users to make free phone calls and send text messages to anyone else using the installed application.
8.5
WeChat An instant messaging application for mobile devices. It also provides a web interface for messaging on non-mobile devices.
8.6
WhatsApp WhatsApp Messenger is a cross-platform mobile messaging application that enables message exchanges without paying for SMS.
8.0
Windows Live A collection of Microsoft online services. 8.0
XMPP The extensible messaging and presence protocol, an open technology for real-time communication.
6.5
Yahoo Messenger The Yahoo instant messaging client. 6.5
Networking applications Description First available in
RiOS version
3COM-TSMUX A queueing protocol for service type 3COM-tsmux, registered with IANA on port 106 TCP/UDP.
8.0
8021Q A protocol that enables nodes on different VLANs to communicate with one another through a network switch with Network Layer (Layer-3) capabilities, or through a router.
8.0
914CG A Texas Instruments 914C/G terminal protocol for service type 914c-g (alias: 914c/g) registered with IANA on port 211 TCP/UDP.
8.0
ACA Services A DEC Application Control Architecture Services protocol for service type ACAS registered with IANA on Port 62 TCP/UDP.
8.0
ACI The application communication interface registered with IANA on Port 187 TCP/UDP.
8.0
Active Directory The Microsoft Active Directory protocol. 6.5
ActiveSync The Microsoft Exchange ActiveSync notifications, on IANA port 1034/TCP and 1034/UDP.
6.5
AD Backup The Microsoft Active Directory backup service. 8.0
Messaging applications Description First available in
RiOS version

714 | Application Signatures for AFE
List of recognized applications
AD DRS The Microsoft Active directory replication services. 8.0
AD DSAOP The Microsoft Active Directory DSAOP services. 8.0
AD DSROL The Microsoft Active Directory domain services that help administrators securely manage users, computers, and other devices on the network and facilitates resource sharing and collaboration between users.
8.0
AD FRS The Microsoft Active Directory file replication service. 8.5
AD NSP The Microsoft Active Directory name service provider. 8.0
AD The Microsoft Active Directory service. 8.0
AD XDS The Microsoft Active Directory Extended Directory Service that enables AD to be extended to store custom data that is of interest to the enterprise.
8.0
AED512 AED 512 Emulation Service 8.0
Alias port 1187/TCP and 1187/UDP 8.0
ANET ATEXSSTR 8.0
ANSA Notify ANSA REX Notify 8.0
ANSA REX Trader ANSA REX Trader 8.0
Apple ARP The Apple Computer system that enables AppleTalk protocol to work over networks other than LocalTalk, such as Ethernet or Token Ring.
8.0
AppleShare AppleShare IP WebAdmin 8.0
AppleTalk A proprietary suite of protocols developed by Apple Inc. for networking computers.
8.0
ARCISDMS Protocol for service type Arcisdms registered with IANA on port 262 TCP/UDP.
8.0
Ariel Ariel hardware and software scans articles, photos, and other documents and transmits the electronic images to other Ariel workstations anywhere in the world using either FTP or email. Also converts them to PDF for easy delivery.
8.0
ARNS port 384/TCP and 384/UDP 8.0
ARP A computer networking protocol for determining a network host's link layer or hardware address when only its internet layer (IP) or network layer address is known.
8.0
ASA port 386/TCP and 386/UDP 8.0
ATM FATE Frame-based ATM Transport over Ethernet 8.0
ATM MPOA Multiprotocol over ATM 8.0
AUDIT Unisys Audit SITP 8.0
Networking applications Description First available in
RiOS version

Application Signatures for AFE | 715
List of recognized applications
Aurora A link layer communications protocol for use on point-to-point serial links. Developed by Xilinx, it is intended for use in high-speed (tens of gigabits/second or more) connections internally in a computer.
8.0
BGMP Border Gateway Multicast Protocol 8.0
BGP Border Gateway Protocol (BGP) is the protocol backing the core routing decisions on the internet.
6.5
BH611 Protocol for service type bh611 registered with IANA on port 354 TCP/UDP.
8.0
BHEVENT Protocol for service type bhevent registered with IANA on port 357 TCP/UDP.
8.0
BHFHS Protocol for service type bhfhs registered with IANA on port 248 TCP/UDP.
8.0
BHMDS Protocol for service type bhmds registered with IANA on port 310 TCP/UDP.
8.0
BJNP The proprietary printer protocol used by CANON printers. 8.6
Blackjack port 1025/TCP and 1025/UDP 8.0
Bonjour A multicast domain name system (mDNS). 9.1
Bnet port 415/TCP and 415/UDP 8.0
Certification Authority (CA)
Issues digital certificates that certify the ownership of a public key for message encryption.
8.6
Cableport AX Protocol for service type Cable port A/X registered with IANA on port 282 TCP/UDP
8.0
CAIlic Computer Associates Int'l License Server 8.0
CAP port 1026/TCP and 1026/UDP 8.0
CCP The traffic generated by the compression control protocol (CCO) when configuring, enabling, and disabling data compression algorithms on both ends of a point-to-point (PPP) link.
9.1
CDC Certificate Distribution Center 8.0
CHAP An authentication protocol within PPP that uses an encrypted challenge.
9.1
Cisco DRP Director Response Protocol (DRP) enables the Cisco DistributedDirector product to query routers (DRP Server Agents) in the field for Border Gateway Protocol (BGP) and Interior Gateway Protocol (IGP) routing table metrics between distributed servers and clients.
8.0
Cisco FNATIVE Used for Cisco Proprietary Protocols on Cisco Catalyst Network Analysis Modules.
8.0
Networking applications Description First available in
RiOS version
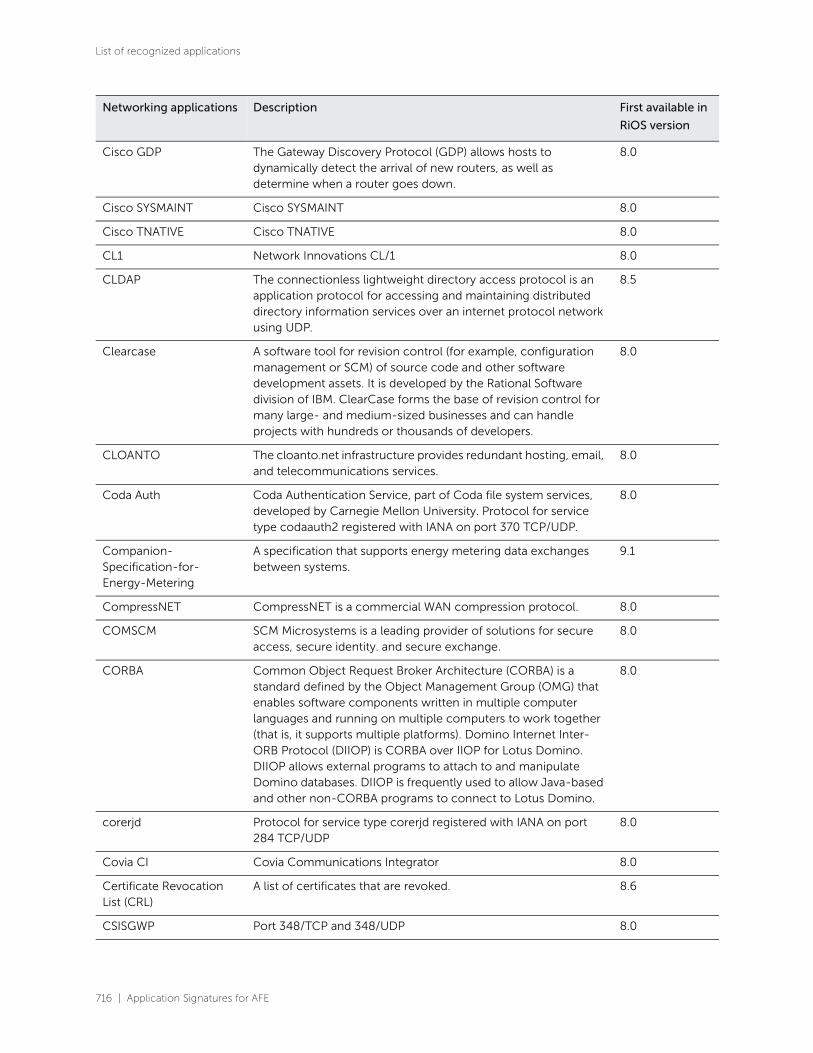
716 | Application Signatures for AFE
List of recognized applications
Cisco GDP The Gateway Discovery Protocol (GDP) allows hosts to dynamically detect the arrival of new routers, as well as determine when a router goes down.
8.0
Cisco SYSMAINT Cisco SYSMAINT 8.0
Cisco TNATIVE Cisco TNATIVE 8.0
CL1 Network Innovations CL/1 8.0
CLDAP The connectionless lightweight directory access protocol is an application protocol for accessing and maintaining distributed directory information services over an internet protocol network using UDP.
8.5
Clearcase A software tool for revision control (for example, configuration management or SCM) of source code and other software development assets. It is developed by the Rational Software division of IBM. ClearCase forms the base of revision control for many large- and medium-sized businesses and can handle projects with hundreds or thousands of developers.
8.0
CLOANTO The cloanto.net infrastructure provides redundant hosting, email, and telecommunications services.
8.0
Coda Auth Coda Authentication Service, part of Coda file system services, developed by Carnegie Mellon University. Protocol for service type codaauth2 registered with IANA on port 370 TCP/UDP.
8.0
Companion-Specification-for-Energy-Metering
A specification that supports energy metering data exchanges between systems.
9.1
CompressNET CompressNET is a commercial WAN compression protocol. 8.0
COMSCM SCM Microsystems is a leading provider of solutions for secure access, secure identity. and secure exchange.
8.0
CORBA Common Object Request Broker Architecture (CORBA) is a standard defined by the Object Management Group (OMG) that enables software components written in multiple computer languages and running on multiple computers to work together (that is, it supports multiple platforms). Domino Internet Inter-ORB Protocol (DIIOP) is CORBA over IIOP for Lotus Domino. DIIOP allows external programs to attach to and manipulate Domino databases. DIIOP is frequently used to allow Java-based and other non-CORBA programs to connect to Lotus Domino.
8.0
corerjd Protocol for service type corerjd registered with IANA on port 284 TCP/UDP
8.0
Covia CI Covia Communications Integrator 8.0
Certificate Revocation List (CRL)
A list of certificates that are revoked. 8.6
CSISGWP Port 348/TCP and 348/UDP 8.0
Networking applications Description First available in
RiOS version

Application Signatures for AFE | 717
List of recognized applications
CSNET-NS CSNET Mailbox Nameserver 8.0
CVCHOSTD Port 442/TCP and 442/UDP 8.0
DASP This protocol is designed to provide an unordered, reliable, secure session for full-duplex datagram exchange that can be implemented for low-power wireless networks and low-cost devices.
8.0
DATEX-ASN An application profile specification that uses protocols to address the Application Layer (Layer 7 of the OSI Reference Model), the Presentation Layer (Layer 6 of the OSI Reference Model), and that defines the Session Layer (Layer 5 of the OSI Reference Model) as null.
8.0
DCAP An application layer protocol used between workstations and routers to transport SNA/NetBIOS traffic over TCP sessions.
8.0
DCCP Datagram Congestion Control Protocol (DCCP) is a transport protocol used for congestion control. Applications include internet telephony and video/audio streaming.
8.0
DCE/RPC Distributed Computing Environment/Remote Procedure Calls is the remote procedure call system developed for the Distributed Computing Environment (DCE).
8.0
DEC Auth DEC Auth 8.0
DEC Debug Decladebug is a source code debugger targeted at debugging software on the local machine or a remote Digital UNIX box.
8.0
DECVMS port 441/TCP and 441/UDP 8.0
DHCP Dynamic Host Configuration Protocol (DHCP) is an automatic configuration protocol used for assigning IP addresses.
6.5
DHCPv6 Dynamic Host Configuration Protocol (DHCP) for IPv6. 8.0
Diameter An authentication, authorization, and accounting protocol for computer networks.
Direct A protocol for service type Direct registered with IANA on port 242 TCP/UDP.
8.0
Distributed Network Protocol
The DNP3 protocol used to communicate between process automation system components.
9.1
DIXIE A lightweight Directory Assistance protocol. 8.0
DLS A directory location service that provides information on the location (addresses) and protocols needed to access white pages name servers.
8.0
DNA-CML A protocol for service type DNA-CML registered with IANA on port 436 TCP/UDP.
8.0
DNS A domain name system that provides hostname resolution for finding hosts on a network.
6.5
Networking applications Description First available in
RiOS version

718 | Application Signatures for AFE
List of recognized applications
DNSIX The Department of Defense Intelligence Information System Network Security for Information Exchange (DNSIX) is a collection of security requirements for networking defined by the U.S. Defense Intelligence Agency.
8.0
DPSI A protocol for service type Desktop Paging Software, Inc registered with IANA on port 315 TCP/UDP.
8.0
DSFGW A protocol for service type dsfgw registered with IANA on port 438 TCP/UDP.
8.0
DSP The display support protocol. 8.0
DSP3270 The display systems protocol for service type dsp3270 registered with IANA on port 246 TCP/UDP
8.0
DSSETUP The Microsoft Active Directory's Directory Services Setup. 8.0
DTAG A telecommunications company headquartered in Bonn, Germany. Deutsche Telekom AG is the largest telecommunications company in Europe.
8.0
DTK A deception toolkit designed to make it appear to attackers as if the system running it has a large number of widely known vulnerabilities.
8.0
EGP The exterior gateway protocol, an obsolete routing protocol for the internet.
8.0
EMBLNDT port 394/TCP and 394/UDP 8.0
EMFIS The EMFIS Service 8.0
EntrustTime The EntrustTime protocol. 8.0
Epmap The Microsoft End Point Mapper (EPMAP), also known as DCE/RPC locator service, is used to remotely manage services.
6.5
ESRO The Efficient Short Remote Operations service is a Remote Procedure Call service.
8.0
ETH A framing protocol that carries data to and from LANs (Local Area Networks).
8.0
ETOS A protocol for service type NEC Corporation registered with IANA on port 377/378 TCP/UDP.
8.0
Fatmen A protocol for service type Fatmen Server registered with IANA on port 347 TCP/UDP.
8.0
FileMaker A computer software company formed in 1998 from Claris as a wholly owned subsidiary of Apple Inc. FileMaker develops, supports and markets two relational database programs; FileMaker and Bento. FileMaker is available for both Mac OS X and Microsoft Windows operating systems and is aimed toward business use, or home users with high-end needs. Bento, aimed at the home user or basic small business user, is a Mac OS X application with additional versions available for the iPhone and iPad.
8.0
Networking applications Description First available in
RiOS version

Application Signatures for AFE | 719
List of recognized applications
FIX Financial Information eXchange
A messaging standard developed specifically for the real-time electronic exchange of securities transactions.
8.6
GACP A protocol for service type Gateway Access Control Protocol registered with IANA on port 190 TCP/UDP.
8.0
Genesis PPP A protocol for service type Genesis Point-to-Point Trans Net registered with IANA on port 103 TCP/UDP.
8.0
Genie An old network management and diagnostic protocol. 8.0
GENRAD A protocol for service type GENRAD-MUX registered with IANA on port 176 TCP/UDP.
8.0
GIST A protocol for service type Q-most encapsulation for general internet signaling transport messages registered with IANA on port 270 UDP.
8.0
Gss License A protocol for service type GSS X License Verification registered with IANA on port 128 TCP/UDP.
8.0
General Packet Radio Service Tunneling Protocol - C
A group of IP-based communications protocols used to carry general packet radio service within GSM, UMTS, and LTE networks.
8.6
General Packet Radio Service Tunneling Protocol - P
A group of IP-based communications protocols used to carry general packet radio service within GSM, UMTS, and LTE networks.
8.6
General Packet Radio Service Tunneling Protocol - U
A group of IP-based communications protocols used to carry general packet radio service within GSM, UMTS, and LTE networks.
8.6
GOOSE The Generic Object Oriented Substation Events (GOOSE) protocol that distributes event data over substation networks.
9.1
GSE The Generic Substation Event (GSE) protocol that transmits data over substation networks.
9.1
Hassle A protocol for service type Hassle registered with IANA on port 375 TCP/UDP. Hassle is a networking application that enables users to execute remote jobs that have a transfer component built in. Hassle is flexible as it only transfers the data and the parameters. The execution at the remote site is automatically accomplished through a code generator.
8.0
HBCI A bank-independent protocol for online banking developed and used by German banks.
HDAP A Microsoft HDA protocol for service type hdap registered with IANA on port 263 TCP/UDP.
8.0
HEMS A protocol for service type hems registered with IANA on port 151 TCP/UDP.
8.0
Hostname A protocol for service type hostname registered with IANA on port 101 TCP/UDP.
8.0
Networking applications Description First available in
RiOS version
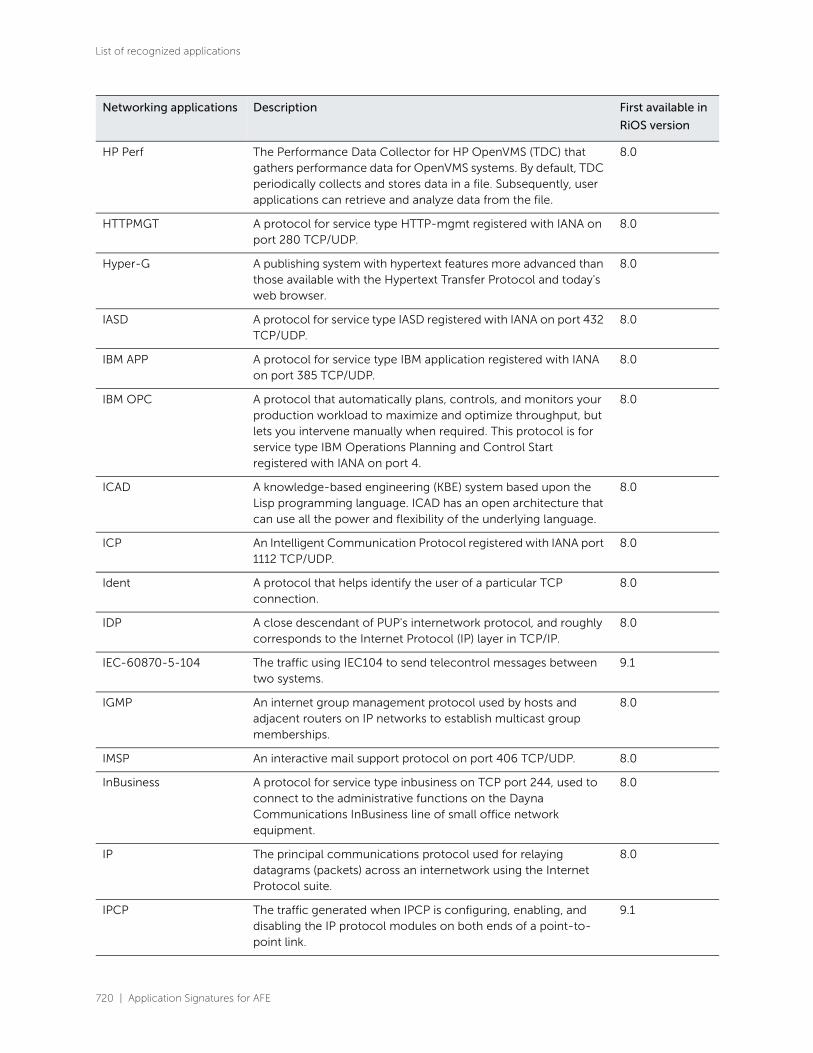
720 | Application Signatures for AFE
List of recognized applications
HP Perf The Performance Data Collector for HP OpenVMS (TDC) that gathers performance data for OpenVMS systems. By default, TDC periodically collects and stores data in a file. Subsequently, user applications can retrieve and analyze data from the file.
8.0
HTTPMGT A protocol for service type HTTP-mgmt registered with IANA on port 280 TCP/UDP.
8.0
Hyper-G A publishing system with hypertext features more advanced than those available with the Hypertext Transfer Protocol and today's web browser.
8.0
IASD A protocol for service type IASD registered with IANA on port 432 TCP/UDP.
8.0
IBM APP A protocol for service type IBM application registered with IANA on port 385 TCP/UDP.
8.0
IBM OPC A protocol that automatically plans, controls, and monitors your production workload to maximize and optimize throughput, but lets you intervene manually when required. This protocol is for service type IBM Operations Planning and Control Start registered with IANA on port 4.
8.0
ICAD A knowledge-based engineering (KBE) system based upon the Lisp programming language. ICAD has an open architecture that can use all the power and flexibility of the underlying language.
8.0
ICP An Intelligent Communication Protocol registered with IANA port 1112 TCP/UDP.
8.0
Ident A protocol that helps identify the user of a particular TCP connection.
8.0
IDP A close descendant of PUP's internetwork protocol, and roughly corresponds to the Internet Protocol (IP) layer in TCP/IP.
8.0
IEC-60870-5-104 The traffic using IEC104 to send telecontrol messages between two systems.
9.1
IGMP An internet group management protocol used by hosts and adjacent routers on IP networks to establish multicast group memberships.
8.0
IMSP An interactive mail support protocol on port 406 TCP/UDP. 8.0
InBusiness A protocol for service type inbusiness on TCP port 244, used to connect to the administrative functions on the Dayna Communications InBusiness line of small office network equipment.
8.0
IP The principal communications protocol used for relaying datagrams (packets) across an internetwork using the Internet Protocol suite.
8.0
IPCP The traffic generated when IPCP is configuring, enabling, and disabling the IP protocol modules on both ends of a point-to-point link.
9.1
Networking applications Description First available in
RiOS version

Application Signatures for AFE | 721
List of recognized applications
IPfix The Internet Protocol Flow Information export protocol that transmits IP traffic flow information over a network.
9.1
IPv6 The Internet Protocol (IP) version 6. 8.0
IPv6CP The traffic generated when IPV6CP is configuring, enabling, and disabling the IPv6 protocol modules on both ends of a point-to-point link.
9.1
IPX The IPX/SPX protocol stack, supported by the Novell NetWare network operating system.
8.0
IS-99 A data services option standard for wideband spread spectrum cellular systems that provides asynchronous data transmission capability on TIA/EIA/IS-95-using ports 379 and 380 TCP/UDP.
8.0
ISAKMP A protocol defined by RFC 2408 for establishing Security Associations (SA) and cryptographic keys in an internet environment. ISAKMP only provides a framework for authentication and key exchange and is designed to be key exchange independent.
8.0
ISI Graphics An ISI graphics language protocol for service type isi-gl registered with IANA on port 55 TCP/UDP.
8.0
ISO-TSAP An ISO transport service access point class protocol for service type iso-tsap registered with IANA on port 102 TCP/UDP.
8.0
ISOIP An ISO internetworking protocol for service type iso-ip registered with IANA on port 147 TCP/UDP.
8.0
JARGON A protocol for service type jargon registered with IANA on port 148 TCP/UDP.
8.0
Java RMI A Java application programming interface that performs the object-oriented equivalent of remote procedure calls (RPC).
8.0
Java Update A method to update the Java Runtime Environment. 8.6
Kblock A protocol for service type K-BLOCK registered with IANA on Port 287 TCP/UDP. K-Block protects unattended logged-in terminals from unauthorized access in OpenVMS environments.
8.0
Kerberos A network authentication protocol designed to provide strong authentication for client/server applications by using secret-key cryptography.
6.5
KIS A protocol for service type KIS Protocol registered with IANA on port 186 TCP/UDP
8.0
KNETCMP KNET/VM Command/Message Protocol 8.0
Kryptolan port 398/TCP and 398/UDP 8.0
LA-Maint IMP Logical Address maintenance 8.0
LCP The traffic generated when setting up PPP communications to determine the standards of the data transmission.
9.1
Networking applications Description First available in
RiOS version

722 | Application Signatures for AFE
List of recognized applications
Legent The protocols for service type legent-1 (Legent Corporation) registered on IANA on port 373 TCP/UDP and service type legent-2 (Legent Corporation) registered on IANA port 374 TCP/UDP.
8.0
Level3 The applications using the Level3 content delivery network. 9.1
LINK A protocol for service type LINK registered with IANA on port 245 TCP/UDP.
8.0
LLMNR A link-local multicast name resolution protocol used by Windows for local name resolution.
6.5
Locus Conn A protocol for service type Locus PC-Interface Conn Server registered with IANA on port 127 TCP/UDP.
8.0
Locus Map A protocol for service type Locus PC-Interface Net Map Service registered with IANA on port 125 TCP/UDP.
8.0
LSARPC The Microsoft Active Directory Local Security Authority Subsystem Service.
8.0
Magenta Logic A protocol for service type Magenta Logic registered with IANA on port 313 TCP/UDP.
8.0
Manufacturing-Message-Specification
The MMS used to send real-time process data. 9.1
MANET The mobile Ad-hoc networks protocol. 8.0
Masqdialer A system that allows authorized LAN users to manipulate the network interface, usually a modem, that gives internet access on a Linux box without having to use Telnet.
8.0
MATIP An application protocol for airline reservation, ticketing, and messaging systems to use over a TCP/IP network.
8.0
MDNS A multicast DNS protocol that uses familiar DNS programming interfaces to a smaller network without the conventional DNS server.
6.5
Meta5 A business intelligence tool that allows users to visually create reports that can access multiple corporate data source. Registered with IANA on port 393 TCP/UDP
8.0
Metagram A protocol for service type Metagram Relay registered with IANA on port 99 TCP/UDP.
8.0
MF Cobol A micro focus Cobol directory service protocol for service type mfcobol, registered with IANA on port 86 TCP/UDP.
8.0
MFTP A communication protocol designed for file sharing. This protocol is used by clients such as eMule and eDonkey and, in its extended implementation, by the Overnet network.
8.0
Microsoft Spooler Subsystem
A service that manages spooled print or fax jobs. 8.6
Networking applications Description First available in
RiOS version

Application Signatures for AFE | 723
List of recognized applications
MIT Spooler A protocol for service type MIT Dover Spooler, registered with IANA on port 91 TCP/UDP.
8.0
mit-ml-dev A protocol for the MIT ML device, registered with IANA on port 83 TCP/UDP.
8.0
MobileIP An Internet Engineering Task Force (IETF) standard communications protocol that is designed to allow mobile device users to move from one network to another while maintaining a permanent IP address.
8.0
Modbus A industrial communications protocol that allows the exchange of data between PLCs and computers.
9.1
MortgageWare A product developed by Interlinq Software Corp that automates all components of the loan originating process.
8.0
MPLS Multicast Multiprotocol Label Switching (MPLS) multicast traffic 8.0
MPLS Unicast Multiprotocol Label Switching (MPLS) unicast traffic 8.0
MPP Netix Message Posting Protocol is a network protocol that is used for posting messages from a computer to a mail service host.
8.0
MPTN port 397/TCP and 397/UDP 8.0
MS CRS A Microsoft Content Replication System protocol used on ports 507/TCP and 507/UDP.
8.0
MSG port 29/TCP and 29/UDP; port 31/TCP and 31/UDP 8.0
Multiplex Network Innovations Multiplex 8.0
MUMPS Plus Five's MUMPS 8.0
NAMP Neighbor Aware Multicast Routing Protocol 8.0
NCED port 404/TCP and 404/UDP 8.0
NCLD port 405/TCP and 405/UDP 8.0
NDS Auth A software module from Symantec Corporation 8.0
NetBIOS The Network Basic Input/Output System protocol suite. 6.5
NetBIOS Datagram Distribution Service
The connectionless datagram mode; the application is responsible for error detection and recovery.
8.6
NetBIOS Name Service The service that starts sessions or distributes datagrams. 8.6
NetBIOS Session Service The service that lets two computers establish a connection. 8.6
Netflow The Cisco NetFlow protocol. 9.1
Netinfo port 1033/TCP and 1033/UDP 8.0
Netlogon The Microsoft Net Logon service verifies logon requests, and it registers, authenticates, and locates domain controllers.
8.0
Networking applications Description First available in
RiOS version

724 | Application Signatures for AFE
List of recognized applications
NETSC Protocols for service type netsc-prod registered with IANA on port 154 TCP/UDP and service type netsc-dev registered with IANA on port 155 TCP/UDP
8.0
NetScout port 395/TCP and 395/UDP 8.0
Netware A network operating system developed by Novell, Inc. It initially used cooperative multitasking to run various services on a personal computer, with network protocols based on the archetypal Xerox Network Systems stack.
8.0
NIP port 376/TCP and 376/UDP 8.0
NNSP An internet application protocol used for transporting Usenet news articles (netnews) between news servers and for reading and posting articles by end-user client applications.
8.0
NPP Network Printing enables users in locations geographically separate from each other and from their print devices to produce documents for themselves and others.
8.0
NSIIOPS IIOP Name Service 8.0
NSRMP port 359/TCP and 359/UDP 8.0
NSS NSS Routing 8.0
NSSTP Nebula Secure Segment Transfer Protocol, IANA port 1036/TCP and 1036/UDP
8.0
NTP Network Time Protocol (NTP) is used for synchronizing the clocks of computer systems over a network.
6.5
NXEdit Protocol for service type NXEdit registered with IANA on port 126 TCP/UDP
8.0
NXTSTEP NextStep Window Server 8.0
OCBinder OCBinder 8.0
OCS Microsoft Office Communications Server 2007 R2 delivers streamlined communications to users, so everyone in an organization can communicate with the right person, right away, from the applications they use most.
8.0
OCServer OCServer 8.0
OCSP An internet protocol used for obtaining the revocation status of an X.509 digital certificate.
8.6
ODMR An SMTP extension standardized in RFC 2645 that relays email to after the authenticating the sender. It uses the extended SMTP command ATRN. It is similar to the ETRN command but works with dynamically assigned IP addresses.
8.0
Onmux Protocol for service type Onmux registered with IANA on port 417 TCP/UDP
8.0
OPC-Unified-Architecture
An industrial M2M communication protocol that sends real-time plant data between control devices.
9.1
Networking applications Description First available in
RiOS version

Application Signatures for AFE | 725
List of recognized applications
Openport Protocol for service type Openport registered with IANA on port 260 TCP/UDP
8.0
OSUNMS OSU Network Monitoring System 8.0
PAP An authentication protocol within PPP that uses a plain text password exchange.
9.1
PAWSERV Allows you to analyze transaction performance and behavioral problems by providing a platform for investigating logs and other historical data
8.0
PDAP port 344/TCP and 344/UDP 8.0
PersonalLink Personal Link 8.0
PIM Protocol Independent Multicast (PIM) is a family of multicast routing protocols for Internet Protocol (IP) networks that provide one-to-many and many-to-many distribution of data over a LAN, WAN or the internet.
8.0
PIP PIP 8.0
PKIX Timestamp The PKIX TS specifies the format of packets, along with some possible transport protocols and some verifications to be done by the server and the client.
8.0
PPP The traffic generated when using the PPP protocol to make a connection between two nodes.
9.1
PPPCOMP The compressed PPP traffic generated within a PPP connection after compression parameters have been established by CCP.
9.1
PPP Discovery The point-to-point protocol over Ethernet (PPPoE) discovery messages.
8.0
PPP Session PPPoE (Point-to-point Protocol over Ethernet) session messages.
8.0
Printer A standard network protocol for remote printing as well as for managing print jobs, media size, resolution, and so forth. Like all IP-based protocols, IPP can run locally or over the internet to printers hundreds or thousands of miles away. Unlike other printing protocols, IPP also supports access control, authentication, and encryption, making it a much more capable and secure printing solution than older ones.
8.0
Printer Job Language A method for switching printer languages at the job level and for status readback between the printer and the host computer. Developed by Hewlett-Packard.
9.1
PRINTSRV Network PostScript 8.0
PROFILE PROFILE Naming System 8.0
PROSPERO Prospero Directory Service is a name server based on the virtual system model.
8.0
Networking applications Description First available in
RiOS version

726 | Application Signatures for AFE
List of recognized applications
PTP A high-precision time protocol for synchronization used in measurement and control systems residing on a local area network. Accuracy in the sub-microsecond range might be achieved with low-cost implementations.
8.0
PUP One of the two earliest internetwork protocol suites. The entire suite provided routing and packet delivery, as well as higher level functions such as a reliable byte stream, along with numerous applications.
8.0
PWDGEN Password Generator Protocol, rfc 972. 8.0
Qbik Qbik has developed sophisticated and user friendly software specializing in internet connectivity and security. Our products allow users to manage their internet connections (WinGate), connect remote offices together (WinGate VPN), and combat network security issues (NetPatrol).
8.0
Radius Provides centralized Authentication, Authorization, and Accounting (AAA) management for computers to connect and use a network service.
6.5
RADIUS-ACCT A client component of Remote Access, Virtual Private Network, and Network Access servers that authenticates users or devices before granting network access and accounts for service use by communicating with the RADIUS server.
8.5
RAP Route Access Protocol, a general protocol for distributing routing information at all levels of the internet.
8.0
RARP An obsolete computer networking protocol used by a host computer to request its Internet Protocol (IPv4) address from an administrative host, when it has available its Link Layer or hardware address, such as a MAC address.
8.0
ResCap ResCap Resolution Protocol 8.0
RIP Routing Information Protocol (RIP) is a dynamic routing protocol. 6.5
RIPNG The RIP next generation, defined in RFC 2080, is an extension of RIPv2 for support of IPv6.
9.1
RLP Resource Location Protocol (RLP) is used to help find network services.
8.0
RMT port 411/TCP and 411/UDP 8.0
RPC2PMAP An ONC RPC service that runs on network nodes that provide other ONC RPC services.
8.0
RRP port 648/TCP and 648/UDP 8.0
RSVD RSVD 8.0
RSVP Resource Reservation Protocol, a control protocol designed to reserve resources across a network.
8.0
Networking applications Description First available in
RiOS version
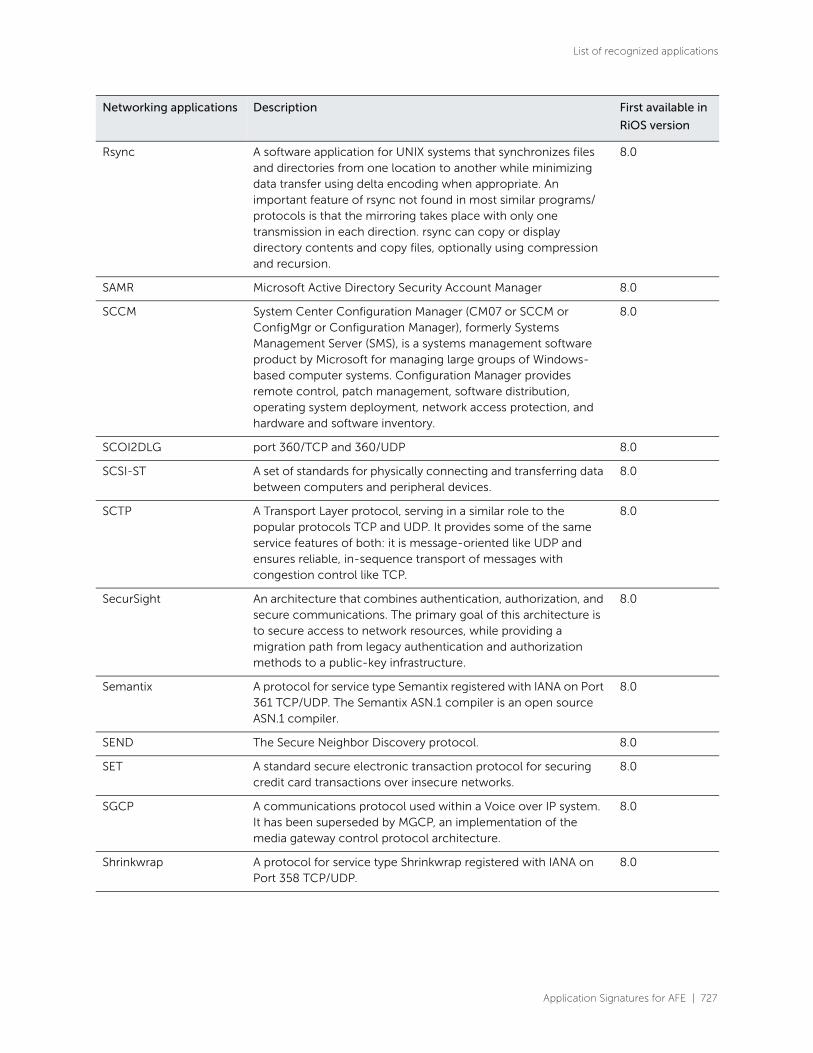
Application Signatures for AFE | 727
List of recognized applications
Rsync A software application for UNIX systems that synchronizes files and directories from one location to another while minimizing data transfer using delta encoding when appropriate. An important feature of rsync not found in most similar programs/protocols is that the mirroring takes place with only one transmission in each direction. rsync can copy or display directory contents and copy files, optionally using compression and recursion.
8.0
SAMR Microsoft Active Directory Security Account Manager 8.0
SCCM System Center Configuration Manager (CM07 or SCCM or ConfigMgr or Configuration Manager), formerly Systems Management Server (SMS), is a systems management software product by Microsoft for managing large groups of Windows-based computer systems. Configuration Manager provides remote control, patch management, software distribution, operating system deployment, network access protection, and hardware and software inventory.
8.0
SCOI2DLG port 360/TCP and 360/UDP 8.0
SCSI-ST A set of standards for physically connecting and transferring data between computers and peripheral devices.
8.0
SCTP A Transport Layer protocol, serving in a similar role to the popular protocols TCP and UDP. It provides some of the same service features of both: it is message-oriented like UDP and ensures reliable, in-sequence transport of messages with congestion control like TCP.
8.0
SecurSight An architecture that combines authentication, authorization, and secure communications. The primary goal of this architecture is to secure access to network resources, while providing a migration path from legacy authentication and authorization methods to a public-key infrastructure.
8.0
Semantix A protocol for service type Semantix registered with IANA on Port 361 TCP/UDP. The Semantix ASN.1 compiler is an open source ASN.1 compiler.
8.0
SEND The Secure Neighbor Discovery protocol. 8.0
SET A standard secure electronic transaction protocol for securing credit card transactions over insecure networks.
8.0
SGCP A communications protocol used within a Voice over IP system. It has been superseded by MGCP, an implementation of the media gateway control protocol architecture.
8.0
Shrinkwrap A protocol for service type Shrinkwrap registered with IANA on Port 358 TCP/UDP.
8.0
Networking applications Description First available in
RiOS version
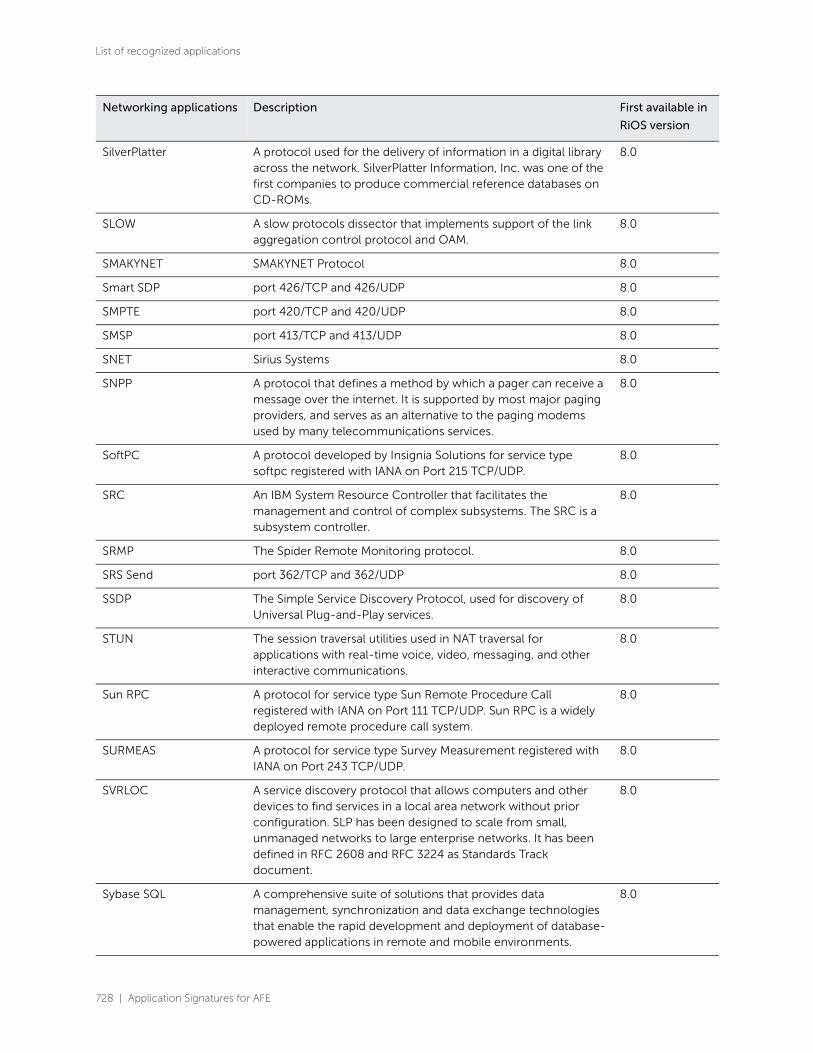
728 | Application Signatures for AFE
List of recognized applications
SilverPlatter A protocol used for the delivery of information in a digital library across the network. SilverPlatter Information, Inc. was one of the first companies to produce commercial reference databases on CD-ROMs.
8.0
SLOW A slow protocols dissector that implements support of the link aggregation control protocol and OAM.
8.0
SMAKYNET SMAKYNET Protocol 8.0
Smart SDP port 426/TCP and 426/UDP 8.0
SMPTE port 420/TCP and 420/UDP 8.0
SMSP port 413/TCP and 413/UDP 8.0
SNET Sirius Systems 8.0
SNPP A protocol that defines a method by which a pager can receive a message over the internet. It is supported by most major paging providers, and serves as an alternative to the paging modems used by many telecommunications services.
8.0
SoftPC A protocol developed by Insignia Solutions for service type softpc registered with IANA on Port 215 TCP/UDP.
8.0
SRC An IBM System Resource Controller that facilitates the management and control of complex subsystems. The SRC is a subsystem controller.
8.0
SRMP The Spider Remote Monitoring protocol. 8.0
SRS Send port 362/TCP and 362/UDP 8.0
SSDP The Simple Service Discovery Protocol, used for discovery of Universal Plug-and-Play services.
8.0
STUN The session traversal utilities used in NAT traversal for applications with real-time voice, video, messaging, and other interactive communications.
8.0
Sun RPC A protocol for service type Sun Remote Procedure Call registered with IANA on Port 111 TCP/UDP. Sun RPC is a widely deployed remote procedure call system.
8.0
SURMEAS A protocol for service type Survey Measurement registered with IANA on Port 243 TCP/UDP.
8.0
SVRLOC A service discovery protocol that allows computers and other devices to find services in a local area network without prior configuration. SLP has been designed to scale from small, unmanaged networks to large enterprise networks. It has been defined in RFC 2608 and RFC 3224 as Standards Track document.
8.0
Sybase SQL A comprehensive suite of solutions that provides data management, synchronization and data exchange technologies that enable the rapid development and deployment of database-powered applications in remote and mobile environments.
8.0
Networking applications Description First available in
RiOS version
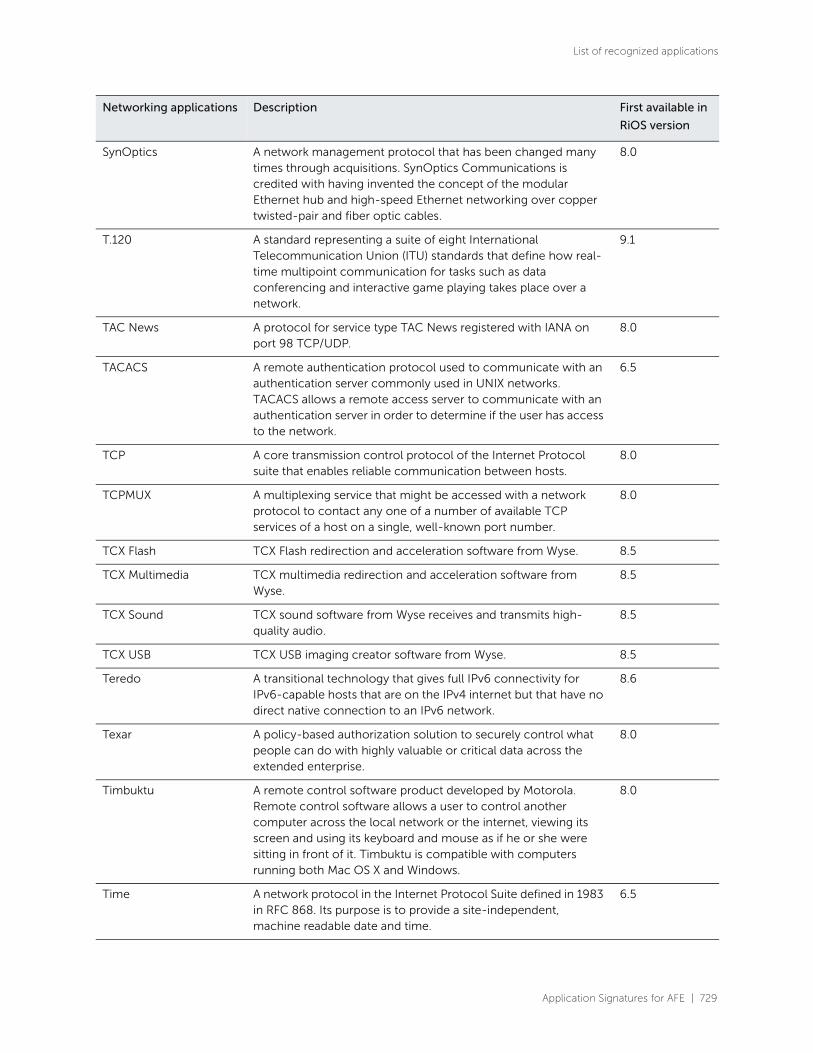
Application Signatures for AFE | 729
List of recognized applications
SynOptics A network management protocol that has been changed many times through acquisitions. SynOptics Communications is credited with having invented the concept of the modular Ethernet hub and high-speed Ethernet networking over copper twisted-pair and fiber optic cables.
8.0
T.120 A standard representing a suite of eight International Telecommunication Union (ITU) standards that define how real-time multipoint communication for tasks such as data conferencing and interactive game playing takes place over a network.
9.1
TAC News A protocol for service type TAC News registered with IANA on port 98 TCP/UDP.
8.0
TACACS A remote authentication protocol used to communicate with an authentication server commonly used in UNIX networks. TACACS allows a remote access server to communicate with an authentication server in order to determine if the user has access to the network.
6.5
TCP A core transmission control protocol of the Internet Protocol suite that enables reliable communication between hosts.
8.0
TCPMUX A multiplexing service that might be accessed with a network protocol to contact any one of a number of available TCP services of a host on a single, well-known port number.
8.0
TCX Flash TCX Flash redirection and acceleration software from Wyse. 8.5
TCX Multimedia TCX multimedia redirection and acceleration software from Wyse.
8.5
TCX Sound TCX sound software from Wyse receives and transmits high-quality audio.
8.5
TCX USB TCX USB imaging creator software from Wyse. 8.5
Teredo A transitional technology that gives full IPv6 connectivity for IPv6-capable hosts that are on the IPv4 internet but that have no direct native connection to an IPv6 network.
8.6
Texar A policy-based authorization solution to securely control what people can do with highly valuable or critical data across the extended enterprise.
8.0
Timbuktu A remote control software product developed by Motorola. Remote control software allows a user to control another computer across the local network or the internet, viewing its screen and using its keyboard and mouse as if he or she were sitting in front of it. Timbuktu is compatible with computers running both Mac OS X and Windows.
8.0
Time A network protocol in the Internet Protocol Suite defined in 1983 in RFC 868. Its purpose is to provide a site-independent, machine readable date and time.
6.5
Networking applications Description First available in
RiOS version

730 | Application Signatures for AFE
List of recognized applications
Tobit A client/server software solution for NetWare or Windows NT Server that enables users on a LAN to send and receive faxes directly from their network-connected PC.
8.0
UAAC A protocol for service type uaac registered with IANA on Port 145 TCP/UDP.
8.0
UARPS A protocol for service type Unisys ARPs registered with IANA on Port 219 TCP/UDP.
8.0
UDP A core user datagram protocol of the Internet Protocol suite that enables low overhead and unreliable communication between hosts, often for real-time data transfer.
8.0
UIS A protocol for service type UIS registered with IANA on Port 390 TCP/UDP.
8.0
ULSTPROC A ListProcessor, ListProc for short, used as a powerful mailing list agent to track thousands of people subscribed to any number of mailing lists.
8.0
Unidata LDM A collection of cooperating programs that select, capture, manage, and distribute arbitrary data products. The system is designed for event-driven data distribution and is currently used in the Unidata Internet Data Distribution (IDD) project. The LDM system includes network client and server programs and their shared protocols.
8.0
UNIFY A protocol for service type Unify registered with IANA on port 181 TCP/UDP
8.0
UPS An electrical apparatus that provides emergency power to a load when the input power source, typically the utility mains, fails. A UPS differs from an auxiliary or emergency power system or standby generator in that it will provide instantaneous or near-instantaneous protection from input power interruptions by means of one or more attached batteries and associated electronic circuitry for low power users, and or by means of diesel generators and flywheels for high power users.
8.0
UTMP A file on UNIX-like systems that keeps track of all system log in and log out activity. It was never a part of any official UNIX standard, such as Single UNIX Specification, and was obsoleted with introduction of utmpx and corresponding APIs
8.0
vetTCP A protocol for service type vetTCP registered with IANA on port 78 TCP/UDP
8.0
VMNET A protocol for service type VMNET registered with IANA on port 175 TCP/UDP
8.0
VMPWSCS A protocol for service type VM PWSCS registered with IANA on port 214 TCP/UDP
8.0
VSLMP A protocol for service type vslmp registered with IANA on port 312 TCP/UDP
8.0
Networking applications Description First available in
RiOS version

Application Signatures for AFE | 731
List of recognized applications
WCCP A Cisco-developed content-routing protocol that provides a mechanism to redirect traffic flows in real-time to web caches.
8.0
WebFilter A WebFilter Remote Monitor, IANA port 1046/TCP and 1046/UDP.
8.0
WebSocket An independent TCP-based protocol that facilitates live content and the creation of multiplayer games.
8.6
Whois A query and response protocol that is widely used for querying databases that store the registered users or assignees of an internet resource, such as a domain name, an IP address block, or an autonomous system, but is also used for a wider range of other information.
8.0
WINS The Microsoft implementation of NetBIOS Name Service (NBNS), a name server and service for NetBIOS computer names.
6.5
WSP (WAP Wireless Session Protocol)
An open standard for maintaining a high-level session based on HTTP 1.1 with a few enhancements for performance over a wireless environment. It provides the upper-level application layer of WAP with a consistent interface for connection-oriented and connectionless services.
8.6
Wyse TCX A suite of TCX collaborative processing virtualization solutions from Wyse.
8.5
X.224 A protocol component used in establishing RDP connections. 8.0
X.25 An ITU-T standard protocol suite for packet switched wide area network (WAN) communication.
8.0
Xbone A system for the automated deployment, management, coordination, and monitoring of IP overlay networks.
8.0
XDMCP The X Display Manager Control protocol. 8.0
Xfer A utility used for DNS zone transfers. 8.0
XNS Xerox Network Services. 8.0
XNS Authentication Xerox networking services authentication 8.0
XNS Clearinghouse The Xerox networking services Clearinghouse protocol. 8.0
XNS Time XNS Time Protocol 8.0
Xyplex Networking products from Xyplex Networks. 8.0
Z3950 ANSI Z39.50 is a client-server protocol for searching and retrieving information from remote computer databases.
8.0
Zebra A high-performance, general-purpose structured text indexing and retrieval engine. It reads structured records in a variety of input formats (email, XML, MARC) and allows access to them through exact Boolean search expressions and relevance-ranked free-text queries.
8.0
Networking applications Description First available in
RiOS version

732 | Application Signatures for AFE
List of recognized applications
Network monitoring
applications
Description First available in
RiOS version
AppNeta A network performance monitoring solution. 9.1
Chargen A device or software that produces static or animated text (such as crawls and rolls) for keying into a video stream. Modern character generators are computer-based, and can generate graphics as well as text.
8.0
Cisco SLA A control protocol that enables delivery of time-based network and services performance data used in monitoring Service Level Agreements (SLAs).
8.0
CMIP The common management information protocol for service type CMIP/TCP Manager registered with IANA on port 163 TCP/UDP.
8.0
Crittercism A mobile application monitoring service. 9.1
CTF The DECnet-Plus Common Trace Facility, used to collect and display information about specific protocol exchanges between systems.
8.0
Daytime A service in the Internet Protocol Suite, defined in 1983 in RFC 867. It is intended for testing and measurement purposes in computer networks.
8.0
DCP An application level protocol optimized for the integration, monitoring and control of devices on a network.
8.0
Discard A service in the Internet Protocol Suite defined in RFC 863. It is intended for testing, debugging, and measurement purposes.
8.0
Echo A service in the Internet Protocol Suite defined in RFC 862. It was originally proposed for testing and measurement of round-trip times in IP networks.
8.0
Finger A simple network protocol for the exchange of human-oriented status and user information.
8.0
ICMP A core protocol of the Internet Protocol Suite, chiefly used by the operating systems of networked computers to send error messages indicating, for instance, that a requested service is not available or that a host or router could not be reached. ICMP can also be used to relay query messages.
6.5
ICMPv6 The implementation of the Internet Control Message Protocol (ICMP) for Internet Protocol version 6 (IPv6).
8.0
Iperf The traffic generated using Iperf, a network testing tool, between two computers by enabling TCP and UDP connections.
Naverisk An all-in-one solution for network management. It includes features that allow network administrators to troubleshoot and remotely administer their networks.
8.6

Application Signatures for AFE | 733
List of recognized applications
Opalis Robot A comprehensive system management and automation solution. It provides real-time monitoring, notification, corrective action and event driven job scheduling to proactively manage your Windows NT/W2K environment.
8.0
PathTest A free IP-based network capacity testing tool from AppNeta. 9.1
PathView A free IP-based network monitoring tool from AppNeta. 9.1
SAP HostControl An SAP Host Control Agent protocol used for viewing logs and traces of a remote host.
6.5
SGMP A protocol to manage and monitor gateways from a controlling entity. SGMP preceded SNMP.
6.5
SMUX A computer networking protocol used in implementing the Simple Network Management Protocol. It defines communications between the SNMP Agent and other processes.
8.0
SNMP An internet-standard protocol for managing devices on IP networks.
6.5
STATSRV A statistics service for collecting STAT data from hosts. 8.0
Syslog A standard for logging program messages. 8.0
Systat An internet protocol for system diagnostic information in the form of a list of users currently logged into the system.
8.0
Tivoli The central driving mechanism for operations in the IBM Tivoli (Integrated Service Management software) environment.
8.0
Tripwire A free software security and data integrity tool useful for monitoring and alerting on specific file change(s) on a range of systems.
8.0
UMA A protocol for service type universal management architecture registered with IANA on port 144 TCP/UDP.
8.0
Proxy applications Description First available in
RiOS version
Avocent A protocol for service type Avocent Proxy Protocol registered with IANA on port 1078 TCP/UDP.
8.0
Freegate A software application that enables internet users to browse the web while avoiding censorship as well as allowing anonymity while browsing.
8.6
GlypeProxy A free web-based proxy script written in PHP. 8.5
Hopster An application that tunnels other applications to bypass firewalls. 8.0
Privax A web anonymity network, aimed at providing people the freedom to surf anonymously online. Privax offers free web proxy services (The Privax Network), which allows anyone in the world to surf anonymously under their IP address.
8.0
Network monitoring
applications
Description First available in
RiOS version

734 | Application Signatures for AFE
List of recognized applications
SOCKS An internet protocol that facilitates the routing of network packets between client-server applications through a proxy server.
8.0
SureSome A web proxy that encrypts and tunnels web traffic. 8.5
Surrogafier A web proxy that tunnels web traffic. 8.5
Tor A free software implementation of second-generation onion routing. A system that claims to enable its users to communicate more anonymously on the internet.
TorBrowser is a software product designed to make it extremely difficult to determine where the user is located and the websites visited. TorBrowser also lets you access sites that are lost.
8.0
Ultrasurf Software that bypasses censorship and firewalls using an HTTP proxy, and employs encryption protocols for privacy.
8.6
Remote access
applications
Description First available in
RiOS version
Citrix CGP The Citrix common gateway protocol. 8.0
Citrix ICA A proprietary protocol for an application server system, designed by Citrix Systems.
8.0
Citrix IMA The Citrix Independent Management Architecture (IMA) protocol is used for server-to-server communication in performing functions such as licensing and server load updates, all of which occur behind the scenes.
8.0
Citrix Licensing A protocol for service type Citrix Licensing registered with IANA on port 7279 TCP/UDP.
8.0
Citrix RTMP A protocol for service time Citrix RTMP registered with IANA on port 2897 TCP/UDP.
8.0
Citrix SLG A storage link gateway that enables automated discovery and one-click access to native storage services using any of the leading storage architectures and protocols, including DAS, NAS, SAN, iSCSI, and Fibre Channel.
8.0
Citrix WANScaler A WAN accelerator that improves application performance for branch office users.
8.0
ERPC A protocol for service type ERPC registered with IANA on port 121 TCP/UDP.
8.0
GOM Remote An application that connects mobile devices to a PC and remotely control GOM Media Player and GOM Audio.
8.6
HP VMM A protocol for service type HP VMM Control/Agent registered with IANA on port 1124/1125 TCP/UDP.
8.0
Proxy applications Description First available in
RiOS version
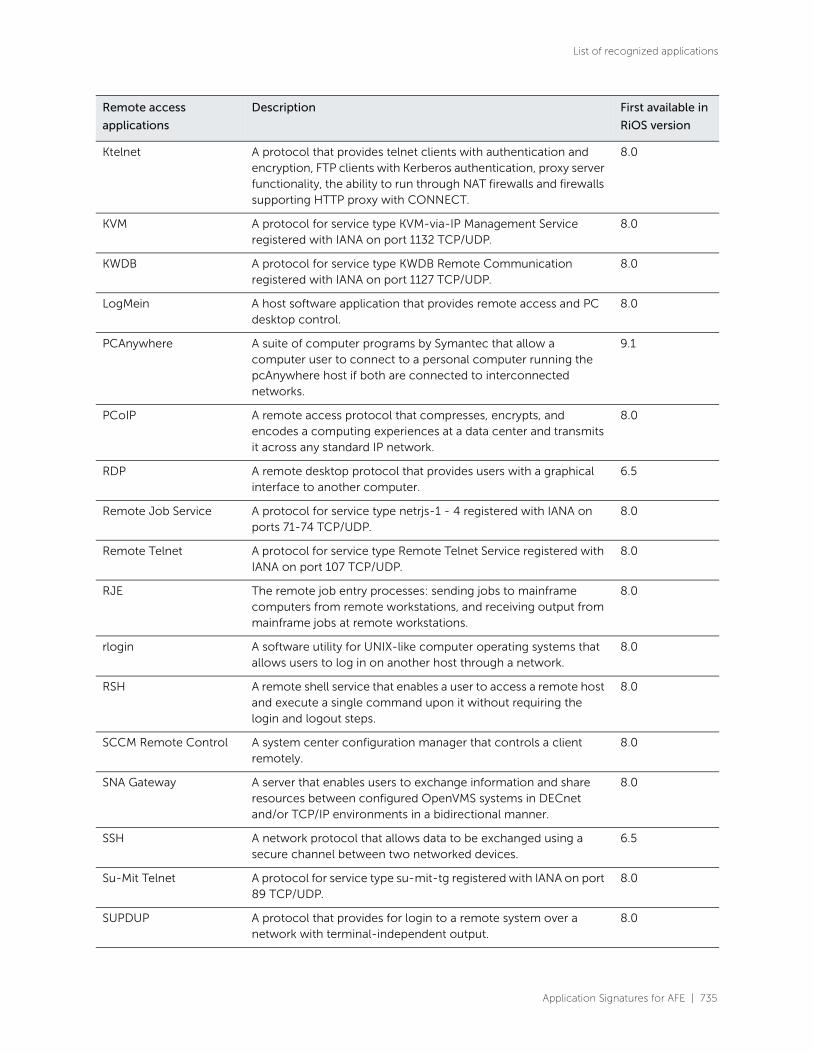
Application Signatures for AFE | 735
List of recognized applications
Ktelnet A protocol that provides telnet clients with authentication and encryption, FTP clients with Kerberos authentication, proxy server functionality, the ability to run through NAT firewalls and firewalls supporting HTTP proxy with CONNECT.
8.0
KVM A protocol for service type KVM-via-IP Management Service registered with IANA on port 1132 TCP/UDP.
8.0
KWDB A protocol for service type KWDB Remote Communication registered with IANA on port 1127 TCP/UDP.
8.0
LogMein A host software application that provides remote access and PC desktop control.
8.0
PCAnywhere A suite of computer programs by Symantec that allow a computer user to connect to a personal computer running the pcAnywhere host if both are connected to interconnected networks.
9.1
PCoIP A remote access protocol that compresses, encrypts, and encodes a computing experiences at a data center and transmits it across any standard IP network.
8.0
RDP A remote desktop protocol that provides users with a graphical interface to another computer.
6.5
Remote Job Service A protocol for service type netrjs-1 - 4 registered with IANA on ports 71-74 TCP/UDP.
8.0
Remote Telnet A protocol for service type Remote Telnet Service registered with IANA on port 107 TCP/UDP.
8.0
RJE The remote job entry processes: sending jobs to mainframe computers from remote workstations, and receiving output from mainframe jobs at remote workstations.
8.0
rlogin A software utility for UNIX-like computer operating systems that allows users to log in on another host through a network.
8.0
RSH A remote shell service that enables a user to access a remote host and execute a single command upon it without requiring the login and logout steps.
8.0
SCCM Remote Control A system center configuration manager that controls a client remotely.
8.0
SNA Gateway A server that enables users to exchange information and share resources between configured OpenVMS systems in DECnet and/or TCP/IP environments in a bidirectional manner.
8.0
SSH A network protocol that allows data to be exchanged using a secure channel between two networked devices.
6.5
Su-Mit Telnet A protocol for service type su-mit-tg registered with IANA on port 89 TCP/UDP.
8.0
SUPDUP A protocol that provides for login to a remote system over a network with terminal-independent output.
8.0
Remote access
applications
Description First available in
RiOS version

736 | Application Signatures for AFE
List of recognized applications
TeamViewer A remote access application that controls any computer on the internet. TeamViewer needs to be running on both machines in order to connect. While the main focus is remote control, it also includes desktop sharing, file transfer, and presentation features.
8.0
Telnet A network protocol used on the internet or local area networks to provide a bidirectional, interactive, text-oriented communications facility using a virtual terminal connection.
8.0
Virtual Network Computing (VNC)
A graphical desktop sharing system that uses the remote frame buffer protocol (RFB) to remotely control another computer.
8.6
Social networking
applications
Description First available in
RiOS version
17173 A Chinese online gaming social network with image boards, blogs, and game zones.
8.6
Badoo A social networking site that lets people meet new people nearby and find out what their existing friends actually think about them.
8.6
Bebo A social networking site where users can post blogs, photographs, music, videos and questionnaires to which other users can answer.
8.0
Chinacom A Chinese social media site. 8.5
Chinaren A social networking site for alumni groups. 8.6
Classmates A social networking site based on high school yearbooks. 8.5
Cyworld A Korean website that lets users create virtual avatars and homes to express themselves and share their daily lives and interests.
8.6
Delicious A social bookmarking service for sharing, storing, and discovering bookmarks.
8.5
Facebook A social networking service. 6.5
Facebook-Apps Any add-ons developed for Facebook; generally games, puzzles, gifts, classifieds and so on.
8.0
Facebook-Event An application for creating and editing Facebook events. 8.5
Facebook-Post An application that provides interactions with Facebook walls. 8.5
Flixster A social movie site allowing users to share movie ratings, discover new movies and meet others with similar movie taste. The site has expanded to include a Facebook app, a MySpace app, and an app for Bebo and Orkut.
8.0
Foursquare A location-based social networking website for mobile devices where users check in their locations and can find out where their friends are located.
8.5
FriendFeed A real-time feed aggregator from social media sites. 8.0
Remote access
applications
Description First available in
RiOS version

Application Signatures for AFE | 737
List of recognized applications
Friendster A social networking service. 6.5
Google + A social networking service provided by Google Inc. that incorporates existing and new Google services
8.0
Gree Games A Japanese social network and mobile gaming service. 9.1
Hi5 A social gaming website that allow for third-party authentication through Facebook.
8.5
HootSuite A social media managing website. 8.6
Hyves A Dutch social media website. 8.6
Instagram An online photo-sharing and social networking service that enables users to take pictures and share them on a variety of social media websites.
8.6
Instagram Images A way to view images with the Instagram service. 8.6
Instagram Video A way to view video with the Instagram service. 8.6
Kaixin A Chinese social networking website. 8.6
LinkedIn A business-oriented social networking site. 6.5
Match An online dating website. 8.5
Meetup An online social networking portal that facilities offline group meetings in various locations around the world.
8.5
Mixi A Japanese social networking service. 9.1
Multiply A social shopping site that connects merchants with shoppers, offering both products and services.
8.5
MySpace A social networking service. 6.5
Orkut A social networking application. 8.0
Odnoklassniki.ru A Russian social networking service. 9.1
Pinterest An online pinboard to collect and share interests. 8.5
Plaxo An online address book and social networking service that provides automatic updating of contact information.
8.0
Reddit A social news website. 8.0
Sourceforge A web-based source code repository. 8.5
Tagged A social networking site that allows members to browse the profiles of other members, play games, and share tags and virtual gifts.
8.5
TweetDeck A desktop application for Twitter, Facebook, MySpace, LinkedIn, and many social networking sites. It interfaces with the Twitter API to enable users to send and receive tweets and view others profiles.
8.6
TwitPic A picture posting and delivery service. 8.0
Twitter A social networking and microblogging service. 6.5
Social networking
applications
Description First available in
RiOS version
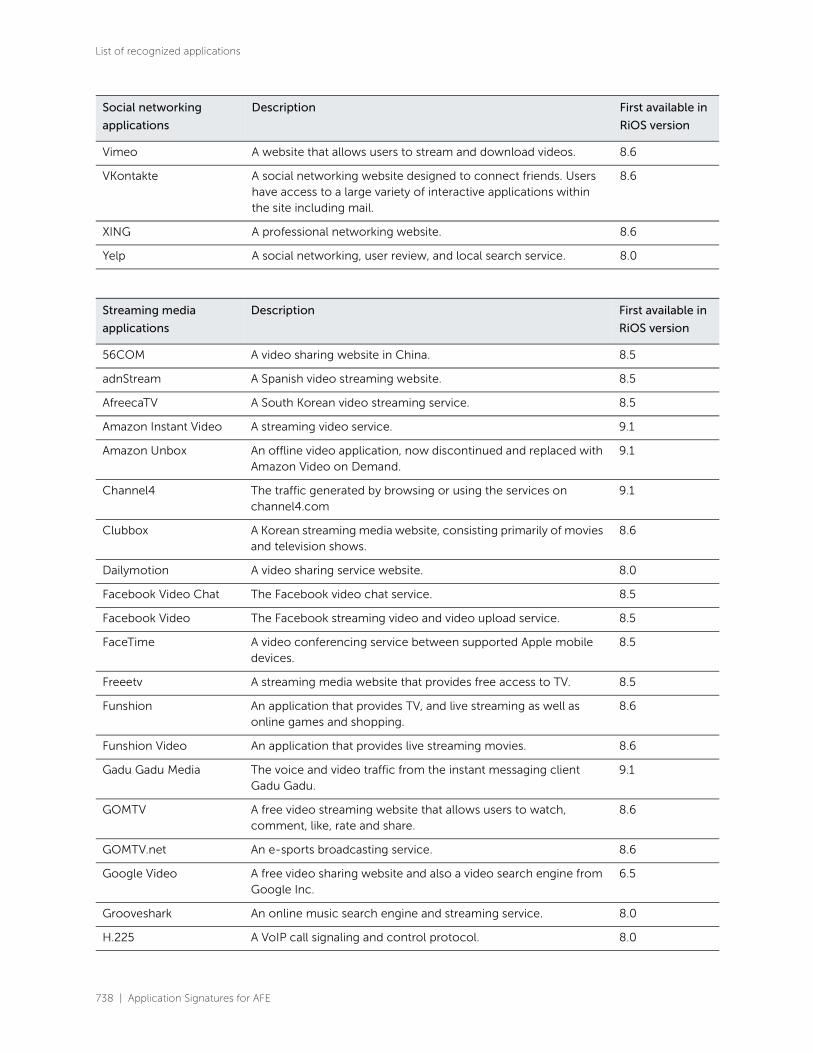
738 | Application Signatures for AFE
List of recognized applications
Vimeo A website that allows users to stream and download videos. 8.6
VKontakte A social networking website designed to connect friends. Users have access to a large variety of interactive applications within the site including mail.
8.6
XING A professional networking website. 8.6
Yelp A social networking, user review, and local search service. 8.0
Streaming media
applications
Description First available in
RiOS version
56COM A video sharing website in China. 8.5
adnStream A Spanish video streaming website. 8.5
AfreecaTV A South Korean video streaming service. 8.5
Amazon Instant Video A streaming video service. 9.1
Amazon Unbox An offline video application, now discontinued and replaced with Amazon Video on Demand.
9.1
Channel4 The traffic generated by browsing or using the services on channel4.com
9.1
Clubbox A Korean streaming media website, consisting primarily of movies and television shows.
8.6
Dailymotion A video sharing service website. 8.0
Facebook Video Chat The Facebook video chat service. 8.5
Facebook Video The Facebook streaming video and video upload service. 8.5
FaceTime A video conferencing service between supported Apple mobile devices.
8.5
Freeetv A streaming media website that provides free access to TV. 8.5
Funshion An application that provides TV, and live streaming as well as online games and shopping.
8.6
Funshion Video An application that provides live streaming movies. 8.6
Gadu Gadu Media The voice and video traffic from the instant messaging client Gadu Gadu.
9.1
GOMTV A free video streaming website that allows users to watch, comment, like, rate and share.
8.6
GOMTV.net An e-sports broadcasting service. 8.6
Google Video A free video sharing website and also a video search engine from Google Inc.
6.5
Grooveshark An online music search engine and streaming service. 8.0
H.225 A VoIP call signaling and control protocol. 8.0
Social networking
applications
Description First available in
RiOS version

Application Signatures for AFE | 739
List of recognized applications
H.245 A control channel protocol used with H.323 and H.324 communication sessions.
8.0
H.248 An implementation of the Media Gateway Control Protocol architecture for controlling VoIP gateways.
8.0
H.323 An H.323 VoIP call signaling and control protocol. 6.5
HTTP Tunnel HTTP traffic that has been tunneled using the CONNECT method.
8.6
Hulu The Hulu online video streaming. 8.0
iTunes The Apple Computer, Inc. media player and online store. 6.5
iTV The streaming content from ITV.com. 9.1
Jango A website that allows users to stream music and share custom radio stations.
8.6
Kugou An ad-supported Chinese digital music peer-to-peer distribution site. It features a streaming media web application, games, mobile app, and a downloadable client.
8.6
Last.fm A social networking music streaming site. 8.0
Live365 An internet radio network that allows members to create their own online radio station or listen to others.
8.5
MagicJack A USB device that enables any phone to make free calls within the US and Canada.
6.5
mck-ivpip A VoIP extender ipvip protocol. 8.0
Metacafe A community-based video-sharing site that specializes in short-form original entertainment, where users upload, view, and share video clips.
6.5
Movie2k A website that allows visitors to stream files without requiring registration.
8.5
MUZU.TV An Irish-owned interactive music video site. 8.5
Netflix site A subscription-based video streaming service. 8.0
Netflix video stream A video streaming service. 8.0
Niconico A Japanese website for sharing and streaming live videos. 8.6
Niconico Live The streaming live video from the Niconico website. 8.6
Nokia Music A music streaming and downloading service for Nokia mobile devices.
8.6
Paltalk Video An instant messaging video chat traffic service. 8.0
Paltalk Voice An instant messaging audio chat traffic service. 8.0
Pandora A free internet music site. 8.5
Pandora-Audio An internet radio and audio streaming music site. 8.5
Streaming media
applications
Description First available in
RiOS version

740 | Application Signatures for AFE
List of recognized applications
Pandora.tv A South Korean website that specializes in user-generated video sharing.
8.5
PPStream A Chinese peer-to-peer streaming video software. The software is available through web, mobile, and Windows client application.
8.5
PPTV An online TV service offering both live streaming and video on demand (VoD) of TV programs and shows, movies, and sports.
8.5
PPTV-p2p PPTV peer-to-peer traffic. 8.5
Quicktime An extensible proprietary multimedia framework developed by Apple Computer Inc., capable of handling various formats of digital video, picture, sound, panoramic images, and interactivity. It is available for Mac OS classic (System 7 and later), Mac OS X and Microsoft Windows operating systems.
8.0
RDT The data from RealNetworks Real Player streaming media. 9.1
Real Player Cloud The traffic generated from uploading, downloading, and streaming videos from the Real Player cloud.
9.1
Roku The traffic generated by browsing channels using the Roku streaming player device.
9.1
RTCP A sister protocol of the Real-time Transport Protocol (RTP). RTCP provides Out-of-Band (OOB) control information for an RTP flow.
6.5
RTMP A protocol commonly used for streaming flash video. 6.5
RTP A protocol primarily used to deliver real-time audio and video. 6.5
RTP Audio Real-time audio delivered over the RTP. 8.6
RTP Video Real-time video delivered over the RTP. 8.6
RTSP A protocol used for establishing and controlling media sessions between end points.
6.5
RTSPS A secure network control protocol designed for use in entertainment and communications systems to control streaming media servers. The protocol is used for establishing and controlling media sessions between end points.
8.0
Scopia The Avaya-Scopia platform over RTP, H.323, and SIP that interoperates with other video conferencing systems.
9.1
Shockwave A multimedia platform used to add animation and interactivity to web pages.
6.5
SHOUTcast A cross-platform proprietary protocol for streaming media over the internet.
6.5
SIP A common control protocol for setting up and controlling voice and video calls.
6.5
SkyGo A TV on the move service from Google.
SoundCloud An online audio distribution platform. 8.5
Streaming media
applications
Description First available in
RiOS version

Application Signatures for AFE | 741
List of recognized applications
Slingmedia A TV streaming media device made by Sling Media that encodes local video for transmission over the internet to a remote device.
9.1
SopCast A free peer-to-peer audio and video broadcasting or streaming service.
8.6
Spotify A music streaming service that allows users to stream their favorite songs, build playlists, and listen to recommended music based on their listening history.
8.6
T-Mobile A carrier of VoIP services. 8.0
Telly A website for sharing and watching videos. 8.6
Tudou A Chinese website for sharing and watching videos. 9.1
UStream A live, interactive broadcast platform that enables anyone with an internet connection and a camera to create webcasts.
8.0
UULA Softbank Mobile's subscription video-on-demand service. 9.1
Videobb A video sharing website. 8.5
Vonage A VoIP company that provides telephone service over a broadband connection.
6.5
Windows Media A multimedia player and library application by Microsoft. Users can play audio and video, view images, burn recordable discs with music or data, and purchase music from a number of online music stores.
6.5
Yahoo-video The Yahoo online video services. 9.1
YouTube A video-sharing website on which users can upload, share, and view videos.
6.5
VPN and tunneling
applications
Description First available in
RiOS version
AH A member of the IPSec protocol suite that guarantees connectionless integrity and data origin authentication of IP packets.
8.0
BEETPH A mode for IPSec ESP that augments the existing ESP tunnel and transport modes. For end-to-end tunnels, the mode provides limited tunnel mode semantics without the regular tunnel mode overhead. The mode is intended to support new uses of ESP, including mobility and multiaddress multihoming.
8.0
Cloudnymous A cloud VPN service that provides secure and anonymous access to the web on a pay-per-use basis, without subscriptions plans.
9.1
CyberGhost The traffic generated while browsing the internet through a CyberGhost VPN server connection. Also traffic generated while browsing the CyberGhost home page.
9.1
Streaming media
applications
Description First available in
RiOS version

742 | Application Signatures for AFE
List of recognized applications
DynGate A firewall router that allows TeamViewer to route a TCP/IP connection over an HTTP tunnel.
8.0
ESP A member of the IPSec protocol suite that provides origin authenticity, integrity, and confidentiality protection of packets.
8.0
GRE A tunneling protocol developed by Cisco Systems that can encapsulate a wide variety of network layer protocol packet types inside IP tunnels, creating a virtual point-to-point link to various brands of routers at remote points over an Internet Protocol (IP) internetwork.
8.0
Hamachi A hosted VPN service that lets you securely extend LAN-like networks to distributed teams.
8.0
Hotspot Shield A VPN service for PC, Android, and iPhone. It also provides some malware protection, as well as data compression for mobile users.
8.6
IPComp A low-level compression protocol for IP datagrams defined in RFC 3173.
8.0
IPIP An IP tunneling protocol that encapsulates one IP packet in another IP packet.
8.0
IPSec An end-to-end security scheme commonly used for VPNs. 6.5
L2TP A tunneling protocol used to support virtual private networks (VPNs). It does not provide any encryption or confidentiality by itself; it relies on an encryption protocol that it passes within the tunnel to provide privacy.
8.0
OpenVPN A free and open-source software application that implements virtual private network (VPN) techniques for creating secure point-to-point or site-to-site connections.
6.5
PPTP A method for implementing virtual private networks. PPTP uses a control channel over TCP and a GRE tunnel operating to encapsulate PPP packets.
8.0
RSVP Tunnel A new RSVP-based tunnel protocol establishes packet tunnels between a tunnel source point (TSP) and a tunnel destination point (TDP) in such a way that guaranteed services to aggregated packet flows is provided.
8.0
SecurityKISS The traffic using VPN servers, also the traffic generated while browsing the securityKISS home page.
9.1
SoftEther The traffic generated by connecting client to server using the SoftEther VPN application and browsing SoftEther official websites.
9.1
Spotflux The traffic generated by using Spotflux VPN application on a mobile device or PC.
9.1
TunnelBear A VPN service that allows private access to the global internet. 9.1
VPN and tunneling
applications
Description First available in
RiOS version
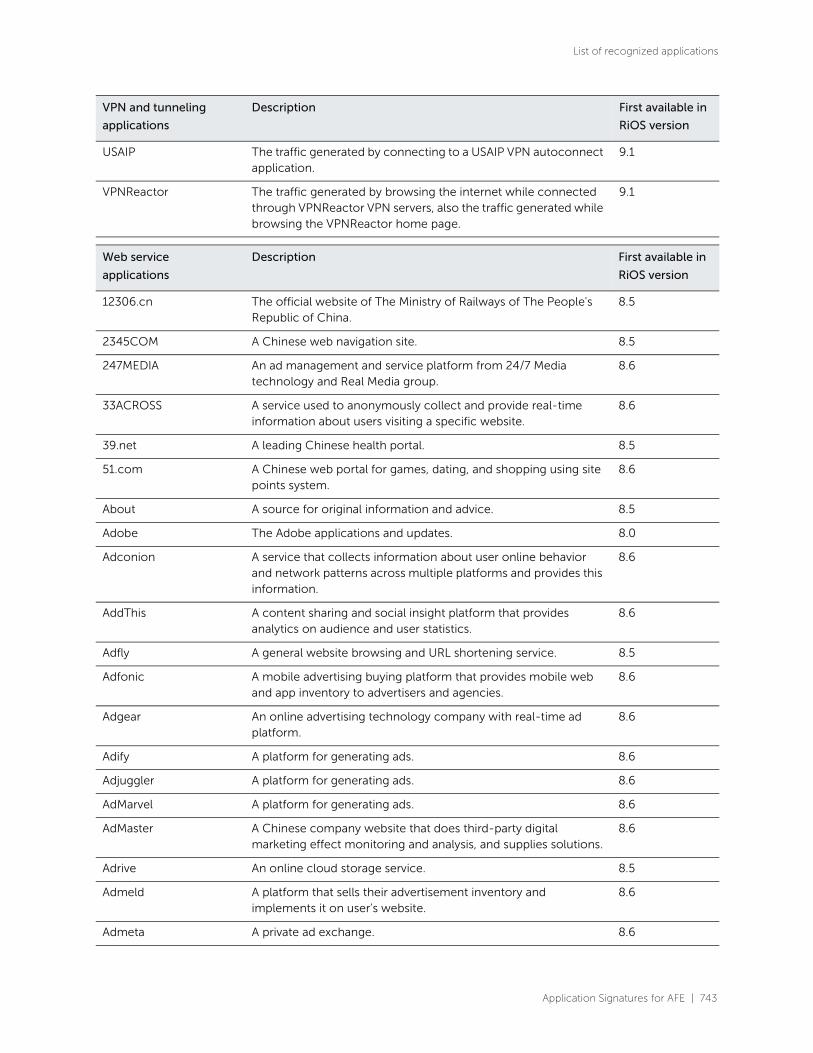
Application Signatures for AFE | 743
List of recognized applications
USAIP The traffic generated by connecting to a USAIP VPN autoconnect application.
9.1
VPNReactor The traffic generated by browsing the internet while connected through VPNReactor VPN servers, also the traffic generated while browsing the VPNReactor home page.
9.1
Web service
applications
Description First available in
RiOS version
12306.cn The official website of The Ministry of Railways of The People's Republic of China.
8.5
2345COM A Chinese web navigation site. 8.5
247MEDIA An ad management and service platform from 24/7 Media technology and Real Media group.
8.6
33ACROSS A service used to anonymously collect and provide real-time information about users visiting a specific website.
8.6
39.net A leading Chinese health portal. 8.5
51.com A Chinese web portal for games, dating, and shopping using site points system.
8.6
About A source for original information and advice. 8.5
Adobe The Adobe applications and updates. 8.0
Adconion A service that collects information about user online behavior and network patterns across multiple platforms and provides this information.
8.6
AddThis A content sharing and social insight platform that provides analytics on audience and user statistics.
8.6
Adfly A general website browsing and URL shortening service. 8.5
Adfonic A mobile advertising buying platform that provides mobile web and app inventory to advertisers and agencies.
8.6
Adgear An online advertising technology company with real-time ad platform.
8.6
Adify A platform for generating ads. 8.6
Adjuggler A platform for generating ads. 8.6
AdMarvel A platform for generating ads. 8.6
AdMaster A Chinese company website that does third-party digital marketing effect monitoring and analysis, and supplies solutions.
8.6
Adrive An online cloud storage service. 8.5
Admeld A platform that sells their advertisement inventory and implements it on user’s website.
8.6
Admeta A private ad exchange. 8.6
VPN and tunneling
applications
Description First available in
RiOS version

744 | Application Signatures for AFE
List of recognized applications
Admin5 A general website browsing of Chinese webmaster information. 8.5
AdMob A mobile advertising company that provides solutions for discovery, branding, and monetization on the mobile web.
8.6
Adometry A service that provides ad verification and cross-channel attribution intelligence.
8.6
Adready A service that provides a software for digital display advertising. 8.6
Adsage A service that develops products for search, social, mobile, and display advertising.
8.6
Adtech A service that provides ad serving solutions. v.6
Adtegrity An online advertising network. 8.6
Advertise.com An online platform for hosting ads. 8.6
AdXpose A digital advertising analytics solution. 8.6
Aggregate Knowledge A data management solution that combines both media and audience data.
8.6
Aizhan A Chinese website that assists webmasters. 8.5
Akamai A platform for hosting content online. 8.6
Alibaba A business-to-business trading platform for large and small business.
8.6
Aliyun A Chinese cloud computing service site with a mobile operating system, part of the Alibaba Group.
8.6
Amazon An online retail service. 6.5
Accuweather A worldwide weather forecasting service. 9.1
Achetezfacile A French online shop. 9.1
Ad4mat An ad traffic generator. 9.1
Adcash A worldwide advertising platform based in Estonia. 9.1
Alipay An online payment service. 8.0
Amazon Web Services A collection of remote computing services that make up the Amazon cloud computing platform.
8.6
Ameba A Japanese blog virtual community in which users can customize their avatar and socialize with people around the world using virtual places included in the game.
8.6
Amobee A mobile advertising technology company providing solutions and services for large advertisers, publishers and operators.
8.6
Android A Linux-based operating system used primarily in smart phones and tablets.
8.6
Answers An internet-based knowledge exchange. 8.5
Web service
applications
Description First available in
RiOS version

Application Signatures for AFE | 745
List of recognized applications
AOL Ads An advertising service that provides advertisers, agencies, and publishers with comprehensive and efficient online advertising tools.
8.6
Apple The Apple website. 8.5
Apple Maps A web and mobile mapping service application and technology provided by Apple.
8.6
AppNexus A platform that provides real-time online advertising. 8.6
Aptean A corporation that offers professional services, including software implementation, customer education, and training services.
8.6
Archive A non-profit digital library. 8.5
Ask.com A question answering focused web search engine. 8.6
Atlas Solutions A platform for delivering media-based ads. 8.6
Atom A web content syndication system similar to RSS. 8.0
AudienceScience A platform for online advertising technology. 8.6
Avast A antivirus download website. 9.1
Avoidr An application that uses foursquare to check where people are in order to avoid them.
8.6
Babylon A site that offers a translation and language learning services for a fee. It also offers real-time translations and an application for download.
8.6
Baidu An ad-supported search engine that also has video, maps, and social media functions.
8.6
Barnes&Noble A website that offers books, ebooks, DVDs, music, and so on. 8.5
BBC The British Broadcasting Corporation website offering news, sports, radio, and more.
9.1
Betclic An online gambling service. 9.1
Beweb An ad traffic generator and analytics gathering platform. 9.1
Bildde A German tabloid website. 8.5
Bing A search engine by Microsoft. Bing can be integrated with Hotmail or Facebook to message friends Bing search results, or with Facebook to have the option to send messages to friends in the search results.
6.5
Bingbot A Microsoft web crawler for the Bing search engine. 8.0
Bizo An online marketing solution that provides advertisement services to companies around the globe.
8.6
Blogger A blog publishing service owned by Google, formerly known as BlogSpot.
8.0
Bloomberg A general business news and financial information website. 8.5
Web service
applications
Description First available in
RiOS version
746 | Application Signatures for AFE
List of recognized applications
Bluekai A platform for hosting ads as well as analyzing the data they generate.
8.6
Booking An online worldwide accommodation reservation service. 8.6
BRCDN A content delivery network used by web hosting companies. 8.6
BrightRoll An online video advertising services provider that executes video ad campaigns on household name media and broadcast properties for brand advertisers and agencies.
8.6
Brighttalk An online webinar and video provider. 8.5
Brilig An online advertising service. 8.6
Brothersoft A free software download website. 8.5
BRSRVR A content delivery network used to generate ads. 8.6
BV! Media An advertising service provided by Rogers Media Inc. 8.6
C3 Metrics An advertising delivery service. 9.1
Caraytech An online advertising solution provider. 8.6
Casale Media A Canadian online media and technology company that builds online advertising technology for web publishers and advertisers.
8.6
CBS The website for the American commercial broadcasting service. 8.5
CBSinteractive An online content network for news, sports, entertainment, technology and business.
8.5
Cedexis An ad traffic generator and analytics gathering platform. 9.1
Chango A real-time marketing technology company with a range of full-service solutions for brands and agencies.
8.6
Chartbeat An online advertising and analytics solution for businesses. 8.6
China News A Chinese news service. 8.6
Chinauma An online Chinese advertisement and analytics solution. 8.6
Clickbooth An online advertising solution for businesses. 8.6
ClickTale A web analytics web service. 8.6
CloudFlare A free and commercial cloud-based service to secure and accelerate websites.
8.6
CNET An online forum for technology news, reviews, teaching videos, product pricing, free downloads, and newsletters.
8.5
CNN An American online news site. 8.5
CNZZ A Chinese advertising and analytics website. 8.6
Cognitive Match An analytics website that uses artificial intelligence, psychology, and machine learning mathematics to match individuals with content.
8.6
Commission Junction A platform for generating ads. 8.6
Web service
applications
Description First available in
RiOS version

Application Signatures for AFE | 747
List of recognized applications
Compete A web traffic analysis service that specializes in site and search analytics.
8.6
Compuware A company that provides products, services, and solutions that help IT professionals develop, integrate, customize, test, and maintain business-critical applications.
8.6
comScore A service that collects and provides marketing data and analytics to its customers.
8.6
Concur A company that provides of on-demand travel and expense management, invoice processing, and T&E business intelligence reporting.
8.6
Conduit An online platform that allows web publishers to create free custom toolbars, web applications, and mobile applications.
8.5
Connexity A digital advertising company. 8.6
Connextra An online marketing software company that helps advertisers run more effective online promotions.
8.6
Constant Contact A do-it-yourself email marketing solution for small businesses and associations.
8.6
Contextweb Now known as Pulsepoint. Pulsepoint does integrated advertising solutions for better digital marketing.
8.6
Contnet A German mobile content and technical solutions provider. Its services include messaging and billing delivery services, design and hosting mobile application, and mobile marketing and video platform services.
8.6
Core Audience An ad generating site. 8.6
CPX interactive A digital advertising company. 8.6
Craigslist A website providing local classifieds and forums, moderated by the community and largely for free.
6.5
Criteo A performance display advertising company. 8.6
Crowd science A digital brand advertising software and services provider. 8.6
cXense An IT company that provides online advertising, web analytics, and search on a subscription basis through the cloud.
8.6
Datalogix A company that collects and processes transactional-data to optimize performance targeting and drive online and offline sales.
8.6
Daum A Korean website and search engine that also provides streaming media services.
8.6
dcinside A Korean website dedicated to digital cameras and photography. 8.6
DC Storm An online technology marketing solution. 8.6
Dell The website for Dell Inc. 8.5
Delta Search A search engine and toolbar. 9.1
Web service
applications
Description First available in
RiOS version

748 | Application Signatures for AFE
List of recognized applications
deviantART An online community artwork showcasing site. 8.6
Digg A social news website. 8.6
Disney The web traffic associated with globalregsession.go.com, a Disney Enterprises website.
9.1
Domaintools.com An internet domain name intelligence service. 8.5
Doubleclick A Google subsidiary that develops and provides ad services. 8.6
Dotomi A company that provides personalized online marketing display advertising.
8.6
Drawbridge A company that does mobile advertising by bridging audience across devices.
8.6
DynamicIntranet An on-demand website for intranet applications. 8.5
Dynamic Logic An online research company that measures the effectiveness of online communications.
8.6
EarthCam A company that provides access to images from web cams around the world.
8.6
Eastmoney A Chinese financial portal. 8.6
eBay An online auction and shopping website. 6.5
EdgeCast Networks The traffic generated by accessing the advertising website edgecastcdn.net.
9.1
EditGrid An online spreadsheet service. 8.6
Effective Measure Collects audience data and does analysis. 8.6
eHow A company that provides how-to articles written by professionals and users covering a broad range of topics.
8.6
Enet.com.cn A Chinese IT information portal. 8.5
Engage BDR A media advertising company. 8.6
eNovance A cloud and managed services provider. 8.6
Envato An Australian-based company that provides digital marketplaces for images, templates, project files, and education tutorials.
8.5
EQ Ads A company that provides services to target consumers through content matching, search queries, and behavioral segments.
8.6
Etao A Chinese online shopping search engine provided by the Alibaba group.
8.6
Etsy An e-commerce site focused on handmade or vintage items as well as art and craft supplies.
8.6
Evernote An application that allows you to take notes, voice messages, and pictures, and synchronize them online and across multiple devices.
8.6
Evidon An online marketing firm that collects data about visitor patterns. 8.6
Web service
applications
Description First available in
RiOS version
Application Signatures for AFE | 749
List of recognized applications
eXelate Media A platform for online ad generation. 8.6
Exponential Interactive A platform for generating ads. 8.6
eyeReturn A real-time analytics collection and online marketing service. 8.6
Facebook Search The Facebook website search. 8.5
Federated Media A platform for generating ads. 8.6
Flickr An image-hosting and video-hosting site, including a web services suite, and online community.
8.0
Fluent The traffic associated with fluentmobile.com. 9.1
Fogbugz A hosted bug tracking software and project management system by Fog Creek. Users can manage, filter, sort, and navigate tasks related to a particular issue.
6.5
Forbes A national American online business magazine. 8.5
Fox News An American cable news network. 8.6
FOX Sports A FOX sports and affiliates providing sports news, images, blogs, and videos.
8.5
Free A French internet service provider for general browsing on the website free.fr.
8.5
Freelancer A global marketplace for freelance jobs. 8.6
Freewheel Media A platform for ad generation. 8.6
Goal A soccer news website. 8.6
GoGoBox A Chinese online gaming and shopping website. 8.6
Google The traffic generated by the Google search engine or one of the other internet services provided by Google, Inc.
6.5
Google Ads Google's platform for generating ad traffic tailored for each individual user.
8.6
Google Analytics A Google service that tracks and generates detailed web statistics.
8.0
Google APIs The application programming interfaces that support the development of web applications that leverage Google services.
8.0
Google App Engine An application that enables users to build and host web applications that run on Google's application infrastructure, eliminating the need for additional hardware, patches, and back-ups.
8.0
Google Calendar A free time-management web application offered by Google. 6.5
Google Desktop A desktop search and desktop gadget software.
Google Docs A free, web-based word processor, spreadsheet, presentation, form, and data storage service offered by Google.
6.5
Web service
applications
Description First available in
RiOS version

750 | Application Signatures for AFE
List of recognized applications
Google Earth A Google virtual globe, map, and geographical information program.
6.5
Google Maps A Google web mapping services application and technology. 8.0
Google Play Application store for Android phones. Can be used to download apps, music, magazines, books, TV shows and movies.
8.6
Google Safe Browsing A Google service that protects users from known phishing and malware sites.
8.0
Google Translate A Google web service that provides language translation for web pages and text for any selected language.
8.0
Googlebot A Googlebot searches websites for new pages and updated content and adds it to the Google index.
8.0
Goo.ne.jp A Japanese web portal. 8.5
Gopher A TCP/IP application layer protocol designed for distributing, searching, and retrieving documents over the internet.
8.0
Groupon A dial-of-the-day website that features discounted gift certificates.
8.5
HowardForums A discussion board dedicated to mobile phones. 8.6
HP Website The Hewlett-Packard website, which provides company news and information.
8.5
HT Facile An advertising traffic and analytics application 9.1
HTTP The HyperText Transfer Protocol, the principal transport protocol for the World Wide Web.
6.5
HTTP Audio Any audio files or streams delivered over HTTP that were not detected as being part of a more specific application.
8.0
HTTP Video Any video files or streams delivered over HTTP that were not detected as being part of a more specific application.
8.0
HubPages A social content community for writers. 8.6
Huffington Post An American online news aggregator and blog. 9.1
Hupu A Chinese sports news website. 8.5
HWCDN Traffic generated while visiting websites that use HWCDN to host media or ads.
9.1
IBM The International Business Machines corporate website. 8.5
IGN An American entertainment website that focuses on video games, films, music, and other media.
8.6
Ikea A Scandinavian furniture and accessories online store. 8.5
Image-Venue A free image hosting and uploading website for bloggers, message board users, and eBay sellers.
8.5
IMDb An online database of information related to films, TV, and video games.
8.6
Web service
applications
Description First available in
RiOS version
Application Signatures for AFE | 751
List of recognized applications
Imgur A free image-sharing application that is a hosted service. 8.0
Improve Digital A platform for developing and distributing ad services. 8.6
In.com An Indian web portal where users have access to news, blogs, feeds, streaming music and video, and mail and classified service.
8.5
Infonline A provider of internet audience measurement. 8.6
InfoSeek A popular search engine originally operated by the Infoseek Corporation. Infoseek was bought by The Walt Disney Company in 1998, and the technology was merged with that of the Disney-acquired Starwave to form the Go.com network. It has been replaced with Yahoo! search and is no longer in use.
8.0
Integral Ad Science A platform to generate ad traffic and gather user metrics. 8.6
Innovation Interactive A digital marketing agency that generates ads and collects real-time user metrics.
8.6
Inskin Media A platform for generating ads and user metrics. 8.6
InterClick (now Genome)
A subsidiary of Yahoo! used as a visualization platform for advertisers.
8.6
IPerceptions A provider of web-based analytics to gather feedback from website users.
8.6
IT168 A Chinese social media site. 8.5
Itsfogo An ad traffic generator and analytics gathering platform. 9.1
Komli A platform for creating and distributing ads online. 8.6
Krux A service that uses personal information to generate user-specific ads.
8.6
LA Times An American online news website based in Los Angeles. 8.6
LeadBolt An advertising platform for mobile and web-based services. 8.6
LeadLander A service to track website customers. 9.1
Lebncoin An online sales site, that allows the publication of advertisements for sale of any items, accessible by everyone.
8.5
L'equipe.fr A French website that features sports news and articles. 9.1
Ligatus An advertising traffic generator and analytics collector. 9.1
Limelight Networks A content delivery network used by web hosting companies. 8.6
LiveJournal A virtual community where internet users can keep a blog, journal, or diary.
8.0
LivePerson A publicly held online marketing and web analytics platform. 8.6
LiveRail A platform for providing online video advertisements. 8.6
Lokalisten A German social networking website. 8.6
Web service
applications
Description First available in
RiOS version

752 | Application Signatures for AFE
List of recognized applications
Lotame A platform that collects information about website visitors allowing websites to customize the ad content that is sent to specific users.
8.6
Luminate A platform for generating interactive images. 8.6
Marca A Spanish website that primarily features sports news. 8.6
MaxPoint Interactive A platform for providing digital ads. 8.6
MdotM A platform for generating ads. 8.6
Media6Degrees A service that generates ads based on information it collects about individual users.
8.6
Media Innovation Group A platform for generating digital advertisements. 8.6
Mediamind A platform for creating customized ads for individual users. 8.6
Media Math A platform for generating ad traffic. 8.6
Mediaplex A data platform that collects user data and provides user-specific analytics for marketing purposes.
8.6
MediaV A Chinese internet marketing company that provides a platform for ad generation.
8.6
Melon A Korean online music store. 9.1
Mercis An ad traffic generator and analyzer. 9.1
Microsoft The Microsoft corporate website that includes shopping for Microsoft products, product lists and specs, software downloads and support.
8.6
Microsoft FrontPage Server Extensions
The traffic generated via FrontPage Server Extensions communication.
9.1
Millennial Media An independent mobile advertising company. 8.6
Mixpanel A platform that provides analytics for mobile devices. 8.6
Mobile Theory A platform for generating mobile advertisements. 8.6
Mojiva A platform for generating ads on mobile devices. 8.6
Monetate A cloud-based platform for online marketing and ads. 8.6
Motrixi A platform for generating mobile ads. 8.6
Mozilla The Mozilla corporation website that includes downloads and updates to Mozilla Firefox.
8.5
MS-CDN Traffic relating to Microsoft Azure's Content Delivery Network. Traffic going to and from msecnd.net.
8.6
MS Online A hosted software suite that includes Exchange Online, SharePoint Online, Office Communications Online, Microsoft Forefront, and Microsoft Office Live Meeting.
8.0
Web service
applications
Description First available in
RiOS version

Application Signatures for AFE | 753
List of recognized applications
MSN A collection of internet site and services by Microsoft. The MSN portal provides access to Windows Live services such as Messenger, Hotmail, and SkyDrive, as well as News, Sports, Financial and Entertainment Services.
8.0
MyBuys A platform for generating personalized ads. 8.6
Mywebsearch A search engine site powered by Google. 8.5
Nate A Korean website that provides many services such as a news portal, emailing solution, instant messaging, video and movie streaming, maps and many other services.
8.6
Nate On File The file transfer traffic generated by the Nate On service. 8.6
Nate On Phone The voice traffic generated by the Nate On IM service. 8.6
Nate On Remote The remote control traffic generated by the Nate On IM application that allows a user to control the computer of another user.
8.6
Naver A Korean website with features such as a search engine, news, sports, video, and music streaming.
8.6
NBA - National Basketball Association
A website that provides news, highlights, and the ability to stream live games.
8.6
Netease A popular Chinese portal. 8.5
NetSeer A platform for generating targeted media and matching ads to specific users.
8.6
Neustar Services (formerly TARGUSinfo)
A real-time information services and marketing analytics provider.
8.6
Nexage A mobile advertising platform. 8.6
Newegg An online hardware and software retailer. 8.5
news.com.au An Australian news website. 9.1
NFL The national football league website. 8.5
Nielsen An analytics company that collects user data as they browse the web.
8.6
Nokia A website for cellphones, smartphones, and cameras. 8.6
Nokia Maps A maps application for Nokia mobile devices. 8.6
Nokia Message A messaging service for Nokia mobile devices. 8.6
Nokia Store A store for Browsing and downloading apps for Nokia mobile devices.
8.6
Nokia Sync A service that synchronizes contacts, calendar, notes, to-do items, and bookmarks.
8.6
nPario An online data-driven advertising solution. 8.6
Nugg A predictive ad generation service. 8.6
Web service
applications
Description First available in
RiOS version

754 | Application Signatures for AFE
List of recognized applications
NYtimes A New York City news website. 9.1
Office Communications Online
The Microsoft Office web applications that let you create, view, and collaborate from a hosted service through the browser.
8.6
Ohana An online advertising network. 8.6
Olive Media A platform for ad generation across a variety of platforms. 8.6
Ooyala An online video technology product and services company. 9.1
OpenCandy A dynamic advertisement generator. 9.1
OpenX An ad generation service. 8.6
Optimax A platform for generating ads. 8.6
Optimizely A platform for gathering user metrics and generating ads. 8.6
Oracle-CRMOD Oracle CRM On Demand is a customer relationship management solution that is accessible to authorized users over a web browser.
9.1
Outbrain A content recommendation platform whose content marketing module offers to help internet publishers increase web traffic.
9.1
OwnerIQ An ad generation service that uses behavioral targeting. 8.6
PayPal An American worldwide online payments system. 9.1
pchome A Chinese IT information website. 8.5
Photobucket An image-hosting, video-hosting, slideshow-creation, and photo-sharing website.
8.0
Picasa A Google image organizer and image viewer for organizing and editing digital photos, plus an integrated photo-sharing website.
8.0
Piksel A cloud-based, modular video platform. 9.1
Polldaddy An online survey tool. 8.6
Proclivity A platform for online ad generation. 8.6
Proxistore A location-based online advertising service. 9.1
PubMatic A platform for ad generation across multiple devices. 8.6
Quote A financial market information and trading resource site. 8.5
Quantcast A platform for gathering user analytics as well as ad generation. 8.6
Raging-Bull A financial message board hosted by Quote.com. 8.5
RadiumOne A service that gathers user data and uses that information to generate ads on a per-user basis.
8.6
Rambler A Russian search engine and one of the biggest Russian web portals.
8.6
Rapleaf A platform for collecting and distributing marketing data. 8.6
Rediff An Indian news, information, entertainment, and shopping portal. 8.6
Web service
applications
Description First available in
RiOS version
Application Signatures for AFE | 755
List of recognized applications
Redux media A platform for generating ads. 8.6
Resonate Networks An ad networking website. 8.6
Rich Relevance A platform for personalized ad distribution. 8.6
Rocket Fuel An online ad network. 8.6
RSS A Really Simple Syndication feed format for web feeds. 8.0
Rubicon Project A platform for the automation of online advertising. 8.6
Salesforce An online CRM and cloud computing service. 6.5
Samsung The websites associated with South Korean multinational conglomerate company Samsung.
8.5
SASCDN The websites that use SASCDN to host media or ads. 9.1
Schmedley An online desktop start page that provides widgets for browsing around the web.
8.5
Scorecard Research A service that collects users browsing data for market research. 8.6
Sears An American online department store. 8.6
Sendspace An online service that allows you to send, receive, track, and share your files using either the website, Windows, Mac, Linux, or mobile platforms.
8.6
Sina A Chinese infotainment web portal. 8.5
Share This A platform for collecting user data and using it to customize ads. 8.6
ShowMyPC An application that allows users to remotely control and view computers across networks and the internet.
8.6
Shutterfly An online photo storage service. 8.6
Silverpop A marketing automation platform for social networks, email, and mobile traffic.
8.6
Six Apart A Japanese blog and ad generation platform. 8.6
Skimlinks A product advertisement website. 8.6
Slideshare A slide hosting service. 8.5
Slingbox The Slingbox.com website. 9.1
Smartfox The traffic from online games using Flash-based massively multiplayer online (MMO) middleware from Smartfox.
9.1
SOSO The traffic generating by searching and browsing websites, news, images videos, and so on using soso.com
9.1
Soku A Chinese search engine from Youku. 8.5
SPC Media A website development company that generates ads. 8.6
Speed Test The traffic generated by speedtest.net to measure maximum upload and download speed.
9.1
Web service
applications
Description First available in
RiOS version

756 | Application Signatures for AFE
List of recognized applications
Spoke (formerly Telecom Express)
A platform for marketing tools and ad generation. 8.6
SpotXchange A video advertising marketplace. 8.6
SSL A Secure Sockets Layer cryptographic protocol that provides security over the internet.
6.5
Stackoverflow The traffic generated while browsing the Stackoverflow.com website and forum.
9.1
StatCounter A web traffic analysis tool. 8.6
StumbleUpon A web browser plugin that allows users to discover and rate web pages, photos, videos, and news articles.
8.0
Squidoo A community website that allows users to create pages, called lenses, about subjects of interest.
8.5
Surikate The traffic generated by visiting mobile sites that use Surikate to generate ad traffic and gather analytics.
9.1
SurveyMonkey A private American company that enables users to create their own survey.
8.5
Taobao An online consumer to consumer auction and shopping marketplace operated by the Alibaba Group.
8.6
Target An American online retail store. 8.5
TeacherTube A video sharing website. 8.6
TechCrunch A web publication that provides technology news and analysis. 8.6
TechInline A web-based service for remote support, remote control, desktop sharing, remote training, and file transfer between two computers.
8.5
Telegraph An online newspaper based in the UK. 8.6
Telemetry Verification A digital forensics platform that provides user data. 8.6
Teracent A platform for ad generation. 8.6
Theme Forest An Envato marketplace where users can buy and sell site templates and themes to skin CMS products like WordPress, Drupal, and Joomia.
8.5
The Guardian A British news website. 8.6
TLV Media A service that specializes in optimization of online display campaigns.
8.6
Tmall (Formerly Taobao Mall)
A Chinese-language business to consumer website operated by the Alibaba Group.
8.6
Tribal Fusion A platform for providing customized ads. 8.6
Triggit A Facebook Exchange platform that generates ads when users browse Facebook as well as other websites that use the Triggit platform.
8.6
Web service
applications
Description First available in
RiOS version

Application Signatures for AFE | 757
List of recognized applications
Tritone A service that collects ads from different sources and combines them in a central database.
8.6
TubeMogul A platform that generates video advertisements and real-time user analytics.
8.6
Turn A platform for generating ads as well as gathering information about users for marketing analytics.
8.6
Tumblr A microblogging platform that allows users to post text, images, videos, links, quotes, and audio to their tumblelog, a short-form blog.
8.0
Undertone A platform that provides digital ad generation. 8.6
USA Today An American online daily newspaper website. 8.5
ValueClick Media A platform for generating multimedia ads. 8.5
Vibrant A platform for video advertising. 8.6
Voice Five A service that provides studies and reports on internet trends and behavior.
8.6
Videoplaza The traffic generated by visiting websites that use Videoplaza for video advertisements.
9.1
ViewOnTV The traffic generated by visiting websites that use ViewOnTV for video advertisements.
9.1
Viewsurf A French webcam video streaming services. 9.1
W3Schools A website developer’s portal. 8.5
Weather Channel A national and local weather website that provides forecasts for cities, as well as weather radar, report, and hurricane coverage.
8.6
Webs.com A space for individuals, groups, or small businesses to share photos and videos, open a store, and build a community.
8.5
Webtrends A service that provides web, social, mobile analytics, and other software solutions related to marketing intelligence.
8.6
Weborama The traffic generated by visiting websites that use Weborama to generate ad traffic and gather analytics.
9.1
Weebly A free website creator that uses a widget-style format, enabling users to create a site by dragging-and-dropping the page elements.
8.5
Weibo.com The traffic generated from microblogging, chatting, sharing media and such using the microblogging site weibo.com.
9.1
Wetpaint A social publishing and distribution company that focuses on coverage of TV shows, stars, and fashion.
8.5
Wikia A free web hosting service for wikis. 8.6
Wikidot A free and paid Wiki hosting site. 8.5
Wikipedia An online editable encyclopedia. 6.5
Web service
applications
Description First available in
RiOS version
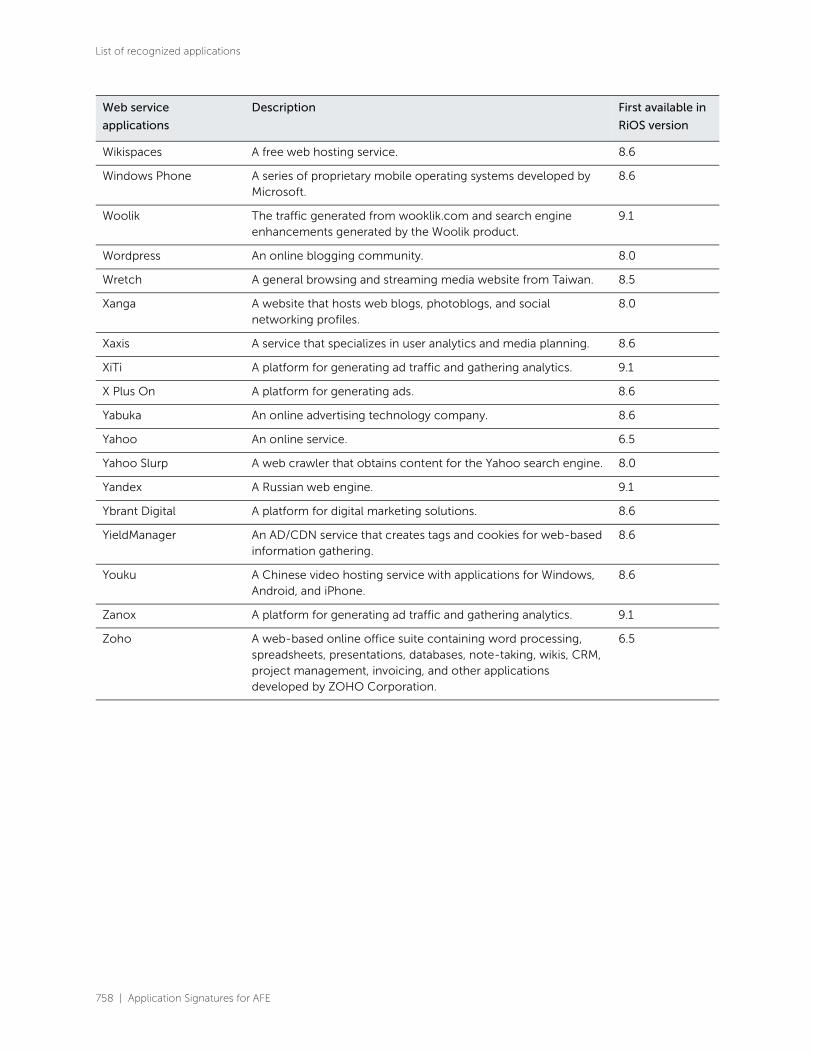
758 | Application Signatures for AFE
List of recognized applications
Wikispaces A free web hosting service. 8.6
Windows Phone A series of proprietary mobile operating systems developed by Microsoft.
8.6
Woolik The traffic generated from wooklik.com and search engine enhancements generated by the Woolik product.
9.1
Wordpress An online blogging community. 8.0
Wretch A general browsing and streaming media website from Taiwan. 8.5
Xanga A website that hosts web blogs, photoblogs, and social networking profiles.
8.0
Xaxis A service that specializes in user analytics and media planning. 8.6
XiTi A platform for generating ad traffic and gathering analytics. 9.1
X Plus On A platform for generating ads. 8.6
Yabuka An online advertising technology company. 8.6
Yahoo An online service. 6.5
Yahoo Slurp A web crawler that obtains content for the Yahoo search engine. 8.0
Yandex A Russian web engine. 9.1
Ybrant Digital A platform for digital marketing solutions. 8.6
YieldManager An AD/CDN service that creates tags and cookies for web-based information gathering.
8.6
Youku A Chinese video hosting service with applications for Windows, Android, and iPhone.
8.6
Zanox A platform for generating ad traffic and gathering analytics. 9.1
Zoho A web-based online office suite containing word processing, spreadsheets, presentations, databases, note-taking, wikis, CRM, project management, invoicing, and other applications developed by ZOHO Corporation.
6.5
Web service
applications
Description First available in
RiOS version