SPIE Group
85
Consolidated financial statements as at December 31, 2016 SPIE Group Deutsche Postbank building – Lightning by SPIE GmbH
-
Upload
khangminh22 -
Category
Documents
-
view
2 -
download
0
Transcript of SPIE Group

Consolidated financial statements as at December 31, 2016
SPIE Group
Deutsche Postbank building – Lightning by SPIE GmbH

CONTENTS
1. CONSOLIDATED INCOME STATEMENT ...................................................................................................... 4 2. CONSOLIDATED STATEMENT OF COMPREHENSIVE INCOME................................................................ 5 3. CONSOLIDATED STATEMENT OF FINANCIAL POSITION ......................................................................... 6 4. CONSOLIDATED CASH FLOW STATEMENT .............................................................................................. 7 5. CONSOLIDATED STATEMENT OF CHANGES IN EQUITY ......................................................................... 8 6. NOTES TO THE CONSOLIDATED FINANCIAL STATEMENTS ................................................................... 9
NOTE 1. GENERAL INFORMATION ................................................................................................. 9
Accounting policies and measurement methods ....................................................................................... 9
NOTE 2. BASIS OF PREPARATION ..................................................................................... 9 2.1. STATEMENT OF COMPLIANCE........................................................................................................................ 9 2.2. ACCOUNTING POLICIES .................................................................................................................................. 9 2.3. CRITICAL JUDGMENT AND ESTIMATES ....................................................................................................... 10
NOTE 3. SUMMARY OF SIGNIFICANT ACCOUNTING POLICIES .........................................10 3.1. CONSOLIDATION ............................................................................................................................................ 10 3.2. SEGMENT REPORTING .................................................................................................................................. 12 3.3. BUSINESS COMBINATIONS AND GOODWILL .............................................................................................. 12 3.4. REVENUE RECOGNITION ............................................................................................................................... 13 3.5. OTHER OPERATING INCOME AND EXPENSES ............................................................................................ 14 3.6. ASSETS HELD FOR SALE AND DISCONTINUED OPERATIONS .................................................................. 14 3.7. LEASE CONTRACTS ....................................................................................................................................... 15 3.8. INTANGIBLE ASSETS ..................................................................................................................................... 15 3.9. PROPERTY, PLANT AND EQUIPMENT .......................................................................................................... 16 3.10. IMPAIRMENT OF GOODWILL, PROPERTY, PLANT AND EQUIPMENT AND INTANGIBLE ASSETS .......... 16 3.11. FINANCIAL ASSETS ....................................................................................................................................... 17 3.12. FINANCIAL LIABILITIES ................................................................................................................................. 19 3.13. DERIVATIVE FINANCIAL INSTRUMENTS ...................................................................................................... 19 3.14. INVENTORIES .................................................................................................................................................. 20 3.15. CASH AND CASH EQUIVALENTS .................................................................................................................. 20 3.16. INCOME TAXES ............................................................................................................................................... 20 3.17. PROVISIONS.................................................................................................................................................... 21 3.18. EMPLOYEE BENEFITS.................................................................................................................................... 21
NOTE 4. ADJUSTEMENTS ON PREVIOUS PERIODS : IFRS 5 STANDARD APPLICATION ....24
Significant events of the period .............................................................................................................. 25
NOTE 5. SIGNIFICANT EVENTS .........................................................................................25 5.1. EXTERNAL GROWTH...................................................................................................................................... 25 5.2. LEGAL INTEGRATION PROCESS IN SWITZERLAND ................................................................................... 25
NOTE 6. ACQUISITIONS AND DISPOSALS .........................................................................26 6.1 CHANGES IN SCOPE ........................................................................................................................................... 26 6.2 CHANGES IN METHOD ........................................................................................................................................ 30 6.3 IMPACT OF NEWLY CONSOLIDATED COMPANIES .......................................................................................... 31
Segment information .............................................................................................................................. 32
NOTE 7. SEGMENT INFORMATION ....................................................................................32 7.1. INFORMATION BY OPERATING SEGMENT ................................................................................................... 32
SPIE CONSOLIDATED FINANCIAL STATEMENTS– FY 2016 – 1

7.2. PRO-FORMA INDICATORS ............................................................................................................................. 33 7.3. NON-CURRENT ASSETS BY ACTIVITY ......................................................................................................... 34 7.4. PERFORMANCE BY GEOGRAPHIC AREA .................................................................................................... 34 7.5. INFORMATION ABOUT MAJOR CUSTOMERS .............................................................................................. 34
Notes to the consolidated income statement .......................................................................................... 35
NOTE 8. OTHER OPERATING INCOME AND EXPENSES ....................................................35 8.1. OPERATING EXPENSES ................................................................................................................................. 35 8.2. EMPLOYEE COST ........................................................................................................................................... 35 8.3. OTHER OPERATING INCOME (LOSS) ........................................................................................................... 37
NOTE 9. NET FINANCIAL COST AND FINANCIAL INCOME AND EXPENSES .......................38 NOTE 10. INCOME TAX .......................................................................................................38
10.1. TAX RATE ........................................................................................................................................................ 38 10.2. CONSOLIDATED INCOME TAX EXPENSE ..................................................................................................... 39 10.3. DEFERRED TAX ASSETS AND LIABILITIES ................................................................................................. 39 10.4. TAX LOSS CARRIED FORWARD .................................................................................................................... 41 10.5. RECONCILIATION BETWEEN PROVISION FOR INCOME TAXES AND PRE-TAX INCOME ........................ 41
NOTE 11. ASSETS HELD FOR SALE AND DISCONTINUED OPERATIONS ............................42 NOTE 12. EARNINGS PER SHARE .......................................................................................43
12.1. DISTRIBUTABLE EARNINGS .......................................................................................................................... 43 12.2. NUMBER OF SHARES..................................................................................................................................... 43 12.3. EARNINGS PER SHARE ................................................................................................................................. 44
NOTE 13. DIVIDENDS ..........................................................................................................44 Notes to the statement of financial position ............................................................................................ 45
NOTE 14. GOODWILL ..........................................................................................................45 14.1. CHANGES IN GOODWILL ............................................................................................................................... 45 14.2. IMPAIRMENT TEST FOR GOODWILL............................................................................................................. 46
NOTE 15. INTANGIBLE ASSETS ..........................................................................................48 15.1. INTANGIBLE ASSETS – GROSS VALUES ..................................................................................................... 48 15.2. INTANGIBLE ASSETS –AMORTIZATION AND NET VALUES ....................................................................... 49
NOTE 16. PROPERTY, PLANT AND EQUIPMENT .................................................................50 16.1. PROPERTY, PLANT AND EQUIPMENT – GROSS VALUES .......................................................................... 50 16.2. PROPERTY, PLANT AND EQUIPMENT – DEPRECIATION & NET VALUES ................................................. 50
NOTE 17. EQUITY ...............................................................................................................51 17.1. SHARE CAPITAL ............................................................................................................................................. 51 17.2. FREE PERFORMANCE SHARES .................................................................................................................... 51
NOTE 18. PROVISIONS .......................................................................................................52 18.1. PROVISIONS FOR EMPLOYEE BENEFIT OBLIGATIONS ............................................................................. 52 18.2. OTHER PROVISIONS ...................................................................................................................................... 55
NOTE 19. WORKING CAPITAL REQUIREMENT ....................................................................57 19.1. CHANGE IN WORKING CAPITAL: RECONCILIATION BETWEEN BALANCE SHEET AND CASH FLOW STATEMENT ................................................................................................................................................................... 58 19.2. FRENCH TAX CREDIT FOR COMPETITIVENESS AND EMPLOYMENT (CICE) ............................................ 58 19.3. TRADE AND OTHER RECEIVABLES ............................................................................................................. 59 19.4. ACCOUNTS PAYABLE .................................................................................................................................... 59
NOTE 20. FINANCIAL ASSETS AND LIABILITIES .................................................................59
2 – SPIE CONSOLIDATED FINANCIAL STATEMENTS – FY 2016

20.1. NON-CONSOLIDATED SHARES ..................................................................................................................... 59 20.2. NET CASH AND CASH EQUIVALENTS .......................................................................................................... 60 20.3. BREAKDOWN OF DEBT ................................................................................................................................. 60 20.4. NET DEBT ........................................................................................................................................................ 62 20.5. RECONCILIATION WITH THE CASH FLOW STATEMENT POSITIONS......................................................... 62 20.6. SCHEDULED PAYMENTS FOR FINANCIAL LIABILITIES .............................................................................. 63 20.7. OTHER FINANCIAL ASSETS .......................................................................................................................... 64 20.8. FINANCIAL DISCLOSURES FROM COMPANIES ACCOUNTED FOR UNDER THE EQUITY METHOD ....... 64 20.9. CARRYING AND FAIR VALUE OF FINANCIAL INSTRUMENTS BY ACCOUNTING CATEGORY................. 65
NOTE 21. FINANCIAL RISK MANAGEMENT .........................................................................66 21.1. DERIVATIVE FINANCIAL INSTRUMENTS ...................................................................................................... 66 21.2. INTEREST RATE RISK .................................................................................................................................... 67 21.3. FOREIGN EXCHANGE RISK ........................................................................................................................... 67 21.4. COUNTERPARTY RISK ................................................................................................................................... 68 21.5. LIQUIDITY RISK ............................................................................................................................................... 68 21.6. CREDIT RISK ................................................................................................................................................... 68
Notes regarding cash flow statement ...................................................................................................... 70
NOTE 22. NOTES TO THE CASH FLOW STATEMENT ...........................................................70 22.1. RECONCILIATION WITH CASH ITEMS OF THE STATEMENT OF FINANCIAL POSITION ........................... 70 22.2. IMPACT OF CHANGES IN THE SCOPE OF CONSOLIDATION...................................................................... 70 22.3. IMPACT OF OPERATIONS HELD FOR SALE ................................................................................................. 70
Other notes .......................................................................................................................................................... 71
NOTE 23. RELATED PARTY TRANSACTIONS ......................................................................71 23.1. DEFINITIONS ................................................................................................................................................... 71 23.2. REMUNERATIONS AND BENEFITS TO MEMBERS OF THE GOVERNING BODIES .................................... 71 23.3. ATTENDANCE FEES ....................................................................................................................................... 71 23.4. INVESTMENTS IN ASSOCIATES .................................................................................................................... 72 23.5. TAX GROUP AGREEMENTS ........................................................................................................................... 72
NOTE 24. CONTRACTUAL OBLIGATIONS AND OFF BALANCE SHEET COMMITMENTS .......72 24.1. OPERATING LEASE COMMITMENTS ............................................................................................................ 72 24.2. OPERATIONAL GUARANTEES ...................................................................................................................... 73 24.3. OTHER COMMITMENTS GIVEN AND RECEIVED .......................................................................................... 73
NOTE 25. STATUTORY AUDITORS’ FEES ............................................................................74 NOTE 26. SUBSEQUENT EVENTS .......................................................................................74
26.1 SPIE’s STRATEGIC DEVELOPMENT IN GERMANY ...................................................................................... 74 26.2 EXTERNAL GROWTH...................................................................................................................................... 75 26.3 “AMBITION 2020” PROJECT .......................................................................................................................... 76
NOTE 27. SCOPE OF CONSOLIDATION ...............................................................................77
SPIE CONSOLIDATED FINANCIAL STATEMENTS– FY 2016 – 3

1. CONSOLIDATED INCOME STATEMENT
In thousands of euros Notes 2015 Restated* 2016
Revenue 7 5,399,249 5,155,699 Other income 31,403 33,211 Operating expenses (5,113,758) (4,870,546) Recurring operating income 316,894 318,364 Other operating expenses (61,582) (28,982) Other operating income 13,958 12,927 Total other operating income (expenses) 8 (47,624) (16,055) Operating income 269,270 302,309 Net income (loss) from companies accounted for under the equity method 379 426
Operating income including companies accounted for under the equity method 269,649 302,735
Interests charges and losses from cash equivalents (76,309) (39,386) Gains from cash equivalents 1,339 187
Costs of net financial debt 9 (74,970) (39,199) Other financial expenses (127,422) (34,559) Other financial incomes 34,536 21,451
Other financial income (expenses) 9 (92,886) (13,108) Other financial incomes and expenses 101,793 250,428 Income tax expenses 10 (57,452) (47,914) Net income from continuing operations 44,341 202,514 Net income from discontinued operations 11 (6,037) (18,482) NET INCOME 38,304 184,032 Net income from continuing operations attributable to: . Owners of the parent 51,318 202,502 . Non-controlling interests (6,977) 12 44,341 202,514 Net income attributable to: . Owners of the parent 45,281 184,020 . Non-controlling interests (6,977) 12 38,304 184,032
Net income Share of the Group – earning per share 12 0.36 1.19 Net income Share of the Group – diluted earnings per share 0.36 1.19 Dividend per share (proposal for 2016) 0.50 0.53
* Comparative data for 2015 have been restated, See Note 4
4 – SPIE CONSOLIDATED FINANCIAL STATEMENTS – FY 2016

2. CONSOLIDATED STATEMENT OF COMPREHENSIVE INCOME
In thousands of euros 2015 Restated* 2016
Net income recognized in income statement 38,304 184,032 Actuarial losses on post-employment benefits (2,447) (14,757) Tax effect (40) 4,275 Items that will not be reclassified to income (2,487) (10,482) Currency translation adjustments 522 (912) Fair value adjustments on future cash flows 14,857 325 Other Tax effect (5,197) (112) Items that may be reclassified to income 10,182 (699) TOTAL COMPREHENSIVE INCOME 45,999 172,851 Attributable to: . Owners of the parent 52,681 172,865 . Non-controlling interests (6,682) (14)
* Comparative data for 2015 have been restated, See Note 4
SPIE CONSOLIDATED FINANCIAL STATEMENTS– FY 2016 – 5

3. CONSOLIDATED STATEMENT OF FINANCIAL POSITION
In thousands of euros Notes Dec 31, 2015 Dec 31, 2016
Non-current assets Intangible assets 15 791,992 777,366 Goodwill 14 2,148,937 2,207,341 Property, plant and equipment 16 110,095 99,923 Investments in companies accounted for under the equity method 20 2,837 2,913 Non-consolidated shares and long-term loans 20 44,925 58,421 Other non-current financial assets 8,713 4,633 Deferred tax assets 10 244,613 235,364 Total non-current assets 3,352,112 3,385,961 Current assets Inventories 19 24,935 24,554 Trade receivables 19 1,463,885 1,370,872 Current tax receivables 24,904 26,960 Other current assets 19 227,112 226,361 Other current financial assets 8,540 7,629 Cash management financial assets 20 245,777 5,500 Cash and cash equivalents 20 358,013 560,157 Total current assets from continuing operations 2,353,166 2,222,033 Assets classified as held for sale 11 14,480 15,238 Total current assets 2,367,646 2,237,271 TOTAL ASSETS 5,719,758 5,623,232
In thousands of euros Notes Dec 31, 2015 Dec 31, 2016
Equity Share capital 17 72,416 72,416 Share premium 1,170,496 1,170,496 Consolidated reserves 29,919 (11,844) Net income attributable to the owners of the parent 45,281 184,020 Equity attributable to owners of the parent 1,318,112 1,415,088 Non-controlling interests (1,277) 2,160 Total equity 1,316,835 1,417,248 Non-current liabilities Interest-bearing loans and borrowings 20 1,121,803 1,126,947 Non-current provisions 18 73,054 49,226 Accrued pension and other employee benefits 18 272,353 291,974 Other non-current liabilities 8,110 6,066 Deferred tax liabilities 10 310,375 267,845 Total non-current liabilities 1,785,695 1,742,058 Current liabilities Trade payables 19 901,535 780,008 Interest-bearing loans and borrowings (current portion) 20 395,734 332,293 Current provisions 18 98,788 93,225 Income tax payable 19 28,340 30,425 Other current operating liabilities 19 1,181,416 1,211,062 Total current liabilities from continuing operations 2,605,813 2,447,013 Liabilities associated with assets classified as held for sale 11 11,415 16,913 Total current liabilities 2,617,228 2,463,926 TOTAL EQUITY AND LIABILITIES 5,719,758 5,623,232
6 – SPIE CONSOLIDATED FINANCIAL STATEMENTS – FY 2016

4. CONSOLIDATED CASH FLOW STATEMENT In thousands of euros Notes 2015
Restated 2016
CASH AND CASH EQUIVALENTS AT BEGINNING OF THE PERIOD 493,598 551,800 Operating activities Net income 38,304 184,032 Loss from companies accounted for under the equity method (379) (426) Depreciation, amortization, and provisions 48,315 47,914 Proceeds on disposals of assets 4,623 2,473 Dividend income - (0) Income tax expense 53,748 44,065 Elimination of costs of net financial debt 74,967 39,217 Elimination of non-recurring costs related to refinancing (a) 72,572 - Other non-cash items (4,049) (229) Internally generated funds from (used in) operations 288,101 317,046 Income tax paid (68,339) (58,057) Changes in operating working capital requirements 52,706 99,006 Dividends received from companies accounted for under the equity method 400 350
Net cash flow from (used in) operating activities 272,866 358,345 Investing activities Effect of changes in the scope of consolidation 22.2 (33,388) (170,803) Acquisition of property, plant and equipment and intangible assets (34,521) (36,449) Net investment in financial assets (138) (80) Changes in loans and advances granted 2,351 1,164 Proceeds from disposals of property, plant and equipment and intangible assets 2,754 8,348
Proceeds from disposals of financial assets 161 282 Dividends received (0) (0) Net cash flow from (used in) investing activities (62,781) (197,538) Financing activities Issue of share capital 733,116 (53) Proceeds from loans and borrowings 2,043,490 931 Repayment of loans and borrowings (2,830,784) (63,874) Net interest paid (101,237) (35,755) Dividends paid to owners of the parent - (77,038) Dividends paid to non-controlling interests (1,152) (544) Other cash flows from (used in) financing activities - - Net cash flow from (used in) financing activities (156,567) (176,333) Impact of changes in exchange rates 4,824 (17,741) Impact of changes in accounting policies (144) - Net change in cash and cash equivalents 58,201 (33,267) CASH AND CASH EQUIVALENTS AT END OF THE PERIOD 22 551,800 518,534
* Comparative data for 2015 have been restated, See Note 4
Notes to the cash flow statement
The cash flow statement presented above includes discontinued operations or operations held for sale whose
impact is described in Note 22.
(a) See Note 9
SPIE CONSOLIDATED FINANCIAL STATEMENTS– FY 2016 – 7

5. CONSOLIDATED STATEMENT OF CHANGES IN EQUITY
In thousands of euros except for the number of shares
Number of outstanding
shares
Share capital
Additional paid-in capital
Retained earnings
Foreign currency
translation reserves
Cash flow hedge
reserves Other and
OCI
Equity attribu-table to
owners of the parent
Non-controlling interests
Total equity
AT DECEMBER 31, 2014 Restated* 39,634,070 39,634 356,708 25,152 473 (9,848) (55,950) 356,169 7,042 363,211
Net income 45,281 45,281 (6,977) 38,304 Other comprehensive income (OCI) 228 9,660 (2,487) 7,400 295 7,695
Total comprehensive income - - 45,281 228 9,660 (2,487) 52,681 (6,682) 45,999
Distribution of dividends - (278) (278) Share issue - - -
- Issuing of primary shares 42,424,242 19,673 665,152 684,825 - 684,825
- Capitalization of the shareholder loan 10,672,387 4,949 171,146 176,095 - 176,095
- Increase of nominal value 942 (942) - - -
Change in the scope of consolidation and other - -
- Legal reorganisation* 18,416,100 5,302 (72,593) 58,018 (9,273) - (9,273) - Employees
Shareholders plan 4,076,156 1,916 51,025 4,861 57,802 - 57,802
- Split of the nominal value of the ordinary shares
38,853,201 - -
- Other scope impacts 17 (204) (187) (1,358) (1,545) Other movements - -
AT DECEMBER 31, 2015 154,076,156 72,416 1,170,496 133,329 497 (188) (58,437) 1,318,112 (1,277) 1,316,835
Net income 184,020 184,020 12 184,032 Other comprehensive income (OCI) (885) 213 (10,482) (11,154) (27) (11,181)
Total comprehensive income 184,020 (885) 213 (10,481) 172,865 (14) 172,851
Distribution of dividends (77,038) (77,038) (316) (77,354) Share issue - - Change in the scope of consolidation and other (603) (603) 3,767 3,164
Other movements 1,752 1,752 1,752
AT DECEMBER 31, 2016 154,076,156 72,416 1,170,496 242,062 (991) 25 (68,919) 1,415,088 2,160 1,417,248
* Legal reorganization as part of the IPO (Initial Public Offering) process, see SPIE Financial Statements for December 2015. Notes to the consolidated statement of changes in equity
See Note 17.
8 – SPIE CONSOLIDATED FINANCIAL STATEMENTS – FY 2016

6. NOTES TO THE CONSOLIDATED FINANCIAL STATEMENTS
NOTE 1. GENERAL INFORMATION
The SPIE Group, operating under the brand name SPIE, is the independent European leader in electrical and
mechanical engineering and HVAC services, energy and communication systems.
SPIE SA is a joint-stock company (société anonyme) incorporated in Cergy (France), listed on the Euronext Paris
regulated market since June 10, 2015.
Its main shareholder is Clayax Acquisition Luxembourg 5 SCA, a partnership limited by shares (société en
commandite par actions) incorporated under Luxembourg law, which holds as at December 31, 2016, 25.5% of
the capital and voting rights.
The SPIE Group consolidated financial statements were authorized for issue by the Board of Directors on
March 09, 2017.
Accounting policies and measurement methods
NOTE 2. BASIS OF PREPARATION
2.1. STATEMENT OF COMPLIANCE
In accordance with European regulation 1606/2002 dated July 19, 2002 on international accounting standards,
the consolidated financial statements of SPIE Group have been prepared in accordance with International
Financial Reporting Standards (IFRS) as adopted by the European Union at December 31, 2016.
The accounting principles used to prepare the consolidated financial statements result from the application of:
- All the standards and interpretations published by the IASB and adopted by the European Union, the
application of which is mandatory at December 31, 2016;
- Standards that the Group has early-adopted;
- Accounting positions adopted in the absence of specific guidance in IFRS.
International Financial Reporting Standards include International Accounting Standards (IAS) and interpretations
issued by the Standards Interpretations Committee (SIC) and the International Financial Reporting Standards
Interpretations Committee (IFRS-IC).
2.2. ACCOUNTING POLICIES
The accounting policies applied in the preparation of the Group’s consolidated financial statements are set out in
Note 3. These policies have been consistently applied to all the years presented.
New standards and interpretations applicable from January 1, 2016
- Amendment to IAS 1 “Presentation of financial statement - Disclosure initiative”.
- Amendments to IAS 16 and IAS 38 “Clarification of acceptable methods of depreciation and amortization;
- Amendments to IFRS 11 “Joint arrangements”: Acquisition of an interest in joint operations;
SPIE CONSOLIDATED FINANCIAL STATEMENTS– FY 2016 – 9

- Amendments to IFRS 10, IFRS 12 and IAS 28 «Sale or Contribution of Assets between an Investor and its
Associate or Joint Venture»;
The application of these amendments has no significant impact at the Group level.
Published new standards and interpretations for which application is not mandatory as of January 1, 2016
Standards, interpretations and amendments already published by the International Accounting Standards Board
(IASB) which are not yet endorsed by the European Union are as follows:
- Amendment to IAS 7”Statement of Cash Flow”: information to provide;
- Amendment to IAS 12 “Income Tax”: recovery of underlying assets.
- Clarifications on IFRS 2 “Share-based payments”;
- IFRS 9 “Financial instruments”;
- IFRS 15 “Revenue from contracts with customers”;
- IFRS 16 “Lease contracts”.
-
An analysis of the application of the IFRS 15 standard shows that the rules of recognition for the revenue in the
Group’ accounts are compliant with the principles prescribed by IFRS 15.
Besides, the Group is currently assessing the impact and practical implications from the application of the other
standards and interpretations published by the IASB, but whose application is not yet compulsory.
2.3. CRITICAL JUDGMENT AND ESTIMATES
The preparation of the consolidated financial statements in accordance with IFRS is based on management’s
estimates and assumptions used to estimate the value of assets and liabilities at the date of the statement of
financial position as well as income and expenses for the period. Actual results could be different from those
estimates.
The main sources of uncertainty relating to critical judgment and estimates concern the impairment of goodwill,
employee benefits, the recognition of revenue and profit margin on long-term service agreements, provisions for
contingencies and expenses and the recognition of deferred tax assets.
Management continually reviews its estimates and assumptions on the basis of its past experience and various
factors deemed reasonable, which form a basis for its evaluation of the carrying value of assets and liabilities.
These estimates and assumptions may be amended in subsequent periods and require adjustments that may
affect future revenue and provisions.
NOTE 3. SUMMARY OF SIGNIFICANT ACCOUNTING POLICIES
3.1. CONSOLIDATION
The Group’s consolidated financial statements include all subsidiaries and associates of SPIE SA.
10 – SPIE CONSOLIDATED FINANCIAL STATEMENTS – FY 2016

The scope of consolidation comprises 171 companies; the percentages of interest are presented in the table in
Note 27 of the present document.
The main amendments to the scope of consolidation that took place during the year are presented in Note 6.
Consolidation methods
According to IFRS 10, “Consolidated Financial Statements”, entities controlled directly or indirectly by the Group
are consolidated under the full consolidation method. Control is established if the Group has all the following
conditions:
- substantive rights enabling it to direct the activities that significantly affect the investee’s returns;
- exposure to variable returns from its involvement with the investee; and
- the ability to use its power over the investee to affect the amount of the variable returns.
For each company held directly or indirectly, it was assessed whether or not the Group controls the investee in
light of all relevant facts and circumstances.
IFRS 11, “Joint Arrangements”, sets out the accounting treatment to be applied when two or more parties have
joint control of an investee. Joint control is established if decisions relating to relevant activities require the
shareholders’ unanimous agreement.
A joint arrangement falls into one of two categories, generally dependent on the legal form of investee:
- joint ventures: parties that have joint control of the arrangement have rights to its net assets, and are
consolidated using the equity method; or
- joint operations: parties that have joint control of the arrangement have direct rights to the assets and direct
obligations for the liabilities of the arrangement, the joint operator recognizing its share of the assets,
liabilities, revenue and expenses of the joint operation.
Most of the joint arrangements relating to public works are through joint-venture companies (Société En
Participation - SEP) that, given their characteristics, fall into the category of joint operations.
As required by IAS 28 (revised), entities over which SPIE exercises significant influence are consolidated using
the equity method.
The results of enterprises acquired or sold during the year are included in the consolidated financial statements,
as from the date of acquisition in the first case or until the date of disposal in the second.
Translation of the financial statements of foreign entities
The Group's consolidated accounts are presented in euros.
In most cases, the functional currency of foreign subsidiaries corresponds to the local currency. The subsidiaries'
financial statements are translated at closing rates for statement of financial position items and at average rates
for income statement items. Exchange gains or losses resulting from the translation are recognized in equity as
currency translation adjustments.
The currency translation rates used by the Group for its main currencies are as follows:
SPIE CONSOLIDATED FINANCIAL STATEMENTS– FY 2016 – 11

2015 2016
Closing
Rate Average
Rate Closing
Rate Average
Rate Euros - EUR 1 1 1 1 United Kingdom Pound - GBP 0.7260 0.7319 0.8396 0.8124 Swiss Franc - CHF 1.0771 1.0736 1.0747 1.0887 US Dollar - USD 1.0983 1.1222 1.0644 1.1065
3.2. SEGMENT REPORTING
Operating segments are reported consistently with the internal reporting provided to the Group’s Management.
The Group’s Chairman and Chief Executive Officer regularly examine segments’ operating income to assess their
performance and to make resources allocation decisions. He has therefore been identified as the chief operating
decision maker of the Group.
The Group's activity is divided into four Operating Segments for analysis and decision-making purposes. The
segments are characterized by a standardized economic model, especially in terms of products and offered
services, operational organization, customer typology, key success factors and performance evaluation criteria.
The Operating Segments are the following:
- France
- Germany and Central Europe
- North Western Europe
- Oil & Gas and Nuclear.
Quantitative information is presented in Note 7.
3.3. BUSINESS COMBINATIONS AND GOODWILL
The Group applies the “acquisition method” to account for business combinations, as defined in IFRS 3R. The
acquisition price, also called “consideration transferred”, for the acquisition of a subsidiary is the sum of fair values
of the assets transferred and the liabilities incurred by the acquirer at the acquisition date and the equity interests
issued by the acquirer. The consideration transferred includes contingent consideration, measured and
recognized at fair value, at the acquisition date.
In addition:
- Non-controlling interests in the acquired company may be valued at either the share in the acquired
company’s net identifiable assets or at fair value. This option is applied on a case-by-case basis for each
acquisition.
- Acquisition-related costs are recognized as expenses of the period. These expenses are recognized as
“Other operating income and expenses” of the income statement.
Goodwill
Goodwill represents the difference between:
(i) the acquisition price of the shares of the acquired company plus any contingent price adjustments; and
(ii) the Group's share in the fair value of their identifiable net assets on the date of the control being taken.
12 – SPIE CONSOLIDATED FINANCIAL STATEMENTS – FY 2016

The fair value of assets and liabilities acquired may be adjusted within a maximum twelve-month period following
the date of acquisition (the “allocation period”), in order to reflect facts and circumstances existing at the
acquisition date. This may result in adjustments to the goodwill determined on a provisional basis. After the end of
the one-year allocation period, any further change in these fair values is recognized in income.
Post-acquisition
Further acquisitions or transfers of non-controlling interests, without any change in control, are considered as
transactions with the Group's shareholders. According to this approach, the difference between the price paid to
increase the percentage of interest in entities already controlled and the additional proportionate equity interest
thus acquired is accounted for in the Group's equity.
Similarly, a reduction in the Group's percentage of interest in an entity that remains controlled by the Group is
accounted for as an equity transaction with no impact in income.
For share transfers with a further loss of control, the change in fair value, calculated based on the entire interest
at the transaction date, is recognized in gains or losses on disposal of consolidated investments. The remaining
equity interest retained, where applicable, is then accounted for at fair value at the date of the loss of control.
For business combination achieved in stages, non-controlling interest previously held in the acquiree is
remeasured at fair value at its acquisition-date. Any resulting profit and loss is recognized in income.
Treatment of outstanding representations and warranties
In the context of its business combinations, the Group usually obtains representations and warranties from the
sellers.
The outstanding representations and warranties that can be valued based on identified risks result in the
recognition of an indemnification asset in the accounts of the acquirer. Subsequent changes to these
representations and warranties are recorded symmetrically with the liability recorded for the indemnified items. On
the contrary, representations and warranties that are not identifiable based on identified risks (general
guarantees) are to be recognized through the income statement when they become exercisable.
The outstanding representations and warranties are recorded in “Other non-current assets”.
Impairment test of goodwill
Goodwill is not amortized. Goodwill is tested for impairment at least once a year and whenever there is an
indication of impairment. For this test, goodwill is allocated to Cash Generating Units (CGU) or groups of CGUs
corresponding to homogeneous groups which together generate identifiable cash flows (see Note 3.10).
3.4. REVENUE RECOGNITION
The Group recognizes services contract income and expenses using the percentage of completion method at the
end of each monthly reporting period.
The stage of completion is measured with reference to the progress in terms of costs incurred. In the case of
maintenance contracts, the progress is measured in terms of invoicing performed. The measurement of the
percentage-of-completion method relies on the contracts follow-up and the consideration of hazards assessed
SPIE CONSOLIDATED FINANCIAL STATEMENTS– FY 2016 – 13

based on acquired experience, in order to value the best estimate of future benefits and obligations expected for
these contracts.
No profit margin is recorded if the level of completion is insufficient to provide a reliable outcome at the end of the
contract.
In the event that the expected outcome at completion of the project is a loss, a provision for loss on completion is
recorded irrespective of the stage of completion of the project. This provision is based on the best estimate of the
outcome at completion of the project, measured in a reasonable manner. Provisions for losses on completion are
presented as a liability in the statement of financial position.
Revenue relating to Public-Private Partnership (PPP) contracts
Annual revenue under PPP contracts is determined based on the fair value of the services rendered in the
financial year measured by applying the estimated margin rates of construction (initial and renewal), servicing and
maintenance respectively to building costs (initial and renewal) and servicing and maintenance costs.
3.5. OTHER OPERATING INCOME AND EXPENSES
To ensure better understanding of business performance, the Group presents separately "recurring operating
income" within operating income which excludes items that have little predictive value because of their nature,
their frequency and / or their relative importance. These items, recorded in "other operating income" and "other
operating expenses" especially include:
- Gains and losses on disposals of assets or operations;
- Expenses resulting from restructuring plans or operations disposal plans approved by the Group
management;
- Expenses relating to non-recurring impairment of assets;
- Expenses of acquiring and integrating companies acquired by the Group;
- Any other separately identifiable income/expense, which is of an unusual and material nature.
3.6. ASSETS HELD FOR SALE AND DISCONTINUED OPERATIONS
Whenever discontinued operations (disposed or sold) or operations classified as held for sale are:
- either a separate major line of business or geographical area of operations that is material for the Group or
that forms part of a single coordinated plan to dispose of a separate major line of business or geographical
area of operations,
- or a subsidiary acquired exclusively with a view to resale,
They are shown in a separate line in the consolidated financial statements at the reporting date.
When initially classified as held for sale, non-current assets and disposal groups are recorded at the lower of their
carrying amount and fair value less costs to sell.
Details of discontinued operations or operations held for sale are set out in Note 11.
14 – SPIE CONSOLIDATED FINANCIAL STATEMENTS – FY 2016

3.7. LEASE CONTRACTS
Operating leases
Lease contracts which do not transfer substantially all risks and rewards inherent to the ownership to the Group
are qualified as “operating lease”. These leases give rise to payments recorded as charges in the income
statement during all lease duration.
Finance leases
Leases contracts under which the Group assumes substantially all the risks and rewards inherent to the
ownership are qualified as “finance leases”. They are capitalized at the lower of the fair value of the asset leased
and the discounted value of the minimum rentals due at the beginning of the leasing contract. The corresponding
debt is recognized in liabilities. Payments received under the lease contract are broken down between the
financial expense and the amortization of debt so as to obtain a constant periodic interest rate over the remaining
balance of the liability. The financial expenses are recognized directly in the income statement.
The asset is amortized over its useful life for the Group, the debt is amortized over the finance lease period, and
eventually deferred taxes are recognized.
3.8. INTANGIBLE ASSETS
Intangible assets (mainly brands, customer relationships and order books) acquired separately or in the context of
business combinations are initially measured at their fair value in the statement of financial position. The value of
intangible assets is subject to regular monitoring in order to ensure that no impairment should be accounted for.
Brands and customer related assets
The value of customer relationships is measured taking into account a renewal rate of contracts and amortized
over the renewal period.
The amortization period of the backlog is defined on a case-by-case basis for each acquisition, after a detailed
review.
Brands acquired are amortized over the estimated duration of use of the brand, depending on the Group's brand
integration strategy. By exception, SPIE brand has an indefinite useful life and therefore is not amortized.
Internally generated intangible assets
Research costs are recognized in the income statement as expenses of the period.
Development costs are recognized as intangible assets when the following criteria are fulfilled:
- the Group’s intention and financial and technical capacity to complete the development project;
- the probability that the Group will enjoy future economic benefits attributable to development expenditure;
- the reliable measure of the cost of this asset.
Capitalized expenditure includes personnel costs and the cost of materials and services used that are directly
allocated to the given projects. Capitalized expenditure is amortized over the estimated useful life of the relevant
processes, once they have been put into use.
SPIE CONSOLIDATED FINANCIAL STATEMENTS– FY 2016 – 15

Other intangible assets
Other intangible assets are recognized at cost, net of accumulated amortization and impairment losses, if any.
They relate mainly to software and are amortized over a period of three years on a straight-line basis.
3.9. PROPERTY, PLANT AND EQUIPMENT
Property, plant and equipment are recognized at cost, net of accumulated depreciation and impairment losses, if
any.
Depreciation is calculated for each significant part of an item of property, plant and equipment using either the
straight-line method or any other method that best represents the economic use of the components over their
estimated useful life. The estimated residual values at the end of the depreciation period are zero.
The main average useful lives applied are as follows:
- Buildings 20 to 30 years
- Site machinery and equipment 4 to 15 years
- Fixed machinery and equipment 8 to 15 years
- Transport vehicles 4 to 10 years
- Office equipment – IT 3 to 10 years
Land is not depreciated.
The depreciation periods are reviewed annually and may be modified if the expectations are different from the
previous estimations.
3.10. IMPAIRMENT OF GOODWILL, PROPERTY, PLANT AND EQUIPMENT AND INTANGIBLE ASSETS
The recoverable value of property, plant and equipment and intangible assets is tested whenever there is an
indication of impairment; this is examined at each closing date.
With regard to goodwill and intangible assets with an indefinite useful life (a category which in the case of the
Group is limited to the SPIE brand), this impairment test must be conducted as soon as there is any indication of
impairment and at least annually.
Goodwill does not generate any cash inflows on its own and is therefore allocated to the corresponding Cash
Generating Units (CGU) (see Note 14).
The recoverable value of these units is the higher of the value in use, determined on the basis of discounted
future net cash flow projections, and the fair value less costs to sell. If this value is lower than the net carrying
amount of these units, an impairment loss is recorded for the difference, which is allocated in priority to goodwill.
Contrary to potential impairment losses on depreciable property, plant and equipment and amortizable intangible
assets, those allocated to goodwill are definitive and cannot be reversed in subsequent financial years.
The Cash Generating Units’ (CGU) future cash flows used in the calculation of value in use (note 14.2.
“Impairment test for goodwill”) are derived from annual budget and multiannual forecasts prepared by the Group.
The construction of these forecasts is an exercise involving the various players within the CGUs and the
16 – SPIE CONSOLIDATED FINANCIAL STATEMENTS – FY 2016

projections are validated by the Group’s Chief-executive officer. This process requires the use of critical judgment
and estimates, especially in the determination of market trends, material costs and pricing policies. Therefore, the
actual future cash flows may differ from the estimates used in the calculation of value in use.
Quantitative information is provided in Note 14.
.
3.11. FINANCIAL ASSETS
The Group classifies its financial assets within the following categories: assets available for sale, assets
measured at their fair value through equity and income, loans and receivables.
The breakdown of financial assets into current and non-current assets is determined at the closing date based on
their maturity date being under or over one year.
All regular way purchases/sales of financial assets are recorded at the transaction date.
Assets available for sale
These assets represent the Group's interests in the capital of non-consolidated entities. They are recorded in the
statement of financial position at their fair value. Changes in value are recognized in equity. However, if there is a
significant or sustained decrease in the fair value of assets available for sale, the unrealized capital loss is
reclassified from equity to net income or loss for the year. As far as equity instruments are concerned, if, during a
subsequent period, the fair value of a security available for sale increases, the increase in value is again recorded
in equity.
When these financial assets are derecognized, the accumulated gains and losses previously recorded in equity
are reclassified to income for the period.
Loans and receivables
These include receivables related to investments, “1% building” loans and other loans and receivables. These
loans and receivables are initially recorded at their fair value plus directly attributable transaction costs. On
subsequent closing dates, they are accounted for at the amortized cost calculated using the effective rate of
return. The value on the face of the statement of financial position includes the outstanding capital and the
unamortized share of transaction costs directly attributable to the acquisition. An impairment test is carried out
whenever there is an indication of impairment. An impairment loss is recorded if the carrying amount of an asset
is greater than its recoverable value. Impairment losses are recognized in the income statement.
The recoverable value of loans and receivables is equal to the value of estimated future cash flows, discounted at
the financial assets' original effective interest rate (in other words, at the effective interest rate calculated at the
date of initial recognition).
Receivables with a short maturity date are not discounted.
Previously recognized impairment losses may be reversed in the income statement in the event of an
improvement in the recoverable value of loans and receivables.
SPIE CONSOLIDATED FINANCIAL STATEMENTS– FY 2016 – 17

Receivables relating to Public-Private Partnership (PPP) contracts
The Group, as a private operator, has signed Public-Private Partnership contracts. This type of contract is one of
a number of public-private contract schemes being used in France.
The “PPP” Contracts are accounted for in accordance with IFRIC 12 “Concessions”, when they meet the three
following conditions:
- First, the public authority determines the nature of the services that the private operator is required to
provide, by means of the infrastructure as well as who is likely to benefit from these services;
- Second, the contract stipulates that at the end of the contract, the infrastructure retains a significant residual
value which is returned back to the public authority;
- Finally, the contract provides for the construction of the infrastructure to be made by the private operator.
In exchange for the construction services provided, the Group is granted rights to receive a financial asset and
therefore a receivable is recognized.
Receivables are measured, for each signed contract, using the amortized cost method at an effective interest rate
corresponding to the project's internal rate of return.
In subsequent periods, the financial asset is amortized and interest income is recognized using the effective
interest rate.
Receivables securitization program
In the course of its operations, some entities of the Group have developed a securitization program for its trade
receivables which will end in June 11, 2020.
Under this securitization program, participating companies can transfer full ownership of their trade receivables to
the “SPIE Titrisation” Mutual Fund in order to obtain funding amounting up to a maximum of € 300 million, with the
possibility to increase the amount to €450 million.
The financed amount of the transaction is defined as equal to the amount of transferred receivables eligible for
the securitization program less, by way of security, the subordinate deposit amount and the additional senior
deposit amount applied by the “SPIE Titrisation” Mutual Fund.
In the consolidated accounts, the securitized receivables have been kept as assets in the statement of financial
position, the security deposits paid into the funds have been cancelled and in return the value of financing
obtained has been recorded in borrowings.
Moreover, SPIE GmbH – entity created during the business combination carried out in Germany in September
2013 – uses a non-recourse securitization program of discount on notes receivable for an unlimited duration. The
assigned receivables amount is of € 57,048 thousands as of December 31, 2016 and is no longer recognized as
assets in the consolidated financial statements.
“Prêts construction”
In France, employers standing in an industrial or commercial activity and hiring at least 20 employees must invest
in housing construction for their employees at least 0.45% of the total payroll. This investment can be realized
either directly or by a contribution to the “Comité Interprofessionnel du Logement” (Inter-Professional Housing
Committee) or to a Chamber of Commerce and Industry.
18 – SPIE CONSOLIDATED FINANCIAL STATEMENTS – FY 2016

The contribution can be booked as granted loan in the assets of the statement of financial position, or as a grant
recognized as an expense in the income statement.
The “Prêts construction” do not bear interest and are granted for a period of 20 years.
The “Prêts construction” are loans granted to employee at low interest rate. In accordance with IAS 39, these
loans are discounted at their initial recognition date and the difference between the nominal value of the loan and
its discounted value is recorded as an expense which is granted representing an economic benefit granted to
employees.
Subsequently, the loans are accounted for using the amortized cost method which consists in reconstituting the
redemption value of the loan, at the end of the 20 year period, by recognizing interest income over the period.
Assets at fair value through income statement
This valuation method is applied to financial assets held by the Group for the purpose of generating a short-term
disposal gain. These assets are measured at their fair value and any changes in fair value are recognized in the
income statement. These financial instruments notably include marketable securities and are classified as “Cash
management financial assets”.
3.12. FINANCIAL LIABILITIES
The breakdown of financial liabilities into current and non-current liabilities is determined at the closing date by
their maturity date. Thus, financial liabilities maturing less than one year are recognized in current liabilities.
Financial liabilities consist of accounts payable, medium and long-term loans and derivative financial instruments.
At the date of their initial recognition, medium and long-term loans are measured at their fair value less directly
attributable transaction costs. They are subsequently accounted for at amortized cost using the effective interest
rate method. The amortized cost is calculated taking into account all the issuing costs and any discount or
redemption premiums directly linked to the financial liability. The difference between the amortized cost and the
redemption value is reversed through the income statement using the effective interest rate method over the term
of the loans.
When accounts payable have maturity dates of less than one year, their nominal value may be considered to be
close to their amortized cost.
3.13. DERIVATIVE FINANCIAL INSTRUMENTS
The Group uses derivative financial instruments (interest rate swaps and foreign exchange forward contracts) to
hedge its exposure to interest rate and foreign exchange risks.
Derivative instruments are recorded in the statement of financial position as current or non-current financial
assets and liabilities depending on their maturity dates and accounting designation. They are measured initially at
their fair value on the transaction date and re-measured accordingly at each reporting date.
In the case of cash flow hedging, the hedging instrument is recorded in the statement of financial position at its
fair value. The effective portion of the unrealized gain or loss on the derivative financial instrument is immediately
recognized in equity and the ineffective portion of the gain or loss is immediately recognized in the income
statement. The amounts recorded in equity are reversed in the income statement in accordance with the
SPIE CONSOLIDATED FINANCIAL STATEMENTS– FY 2016 – 19

accounting policy applied to hedged items. If the Group no longer expects the hedged transaction to occur, the
accumulated unrealized gain or loss, which was recorded in equity (for the effective portion), is immediately
recognized in the income statement.
In the case of fair value hedging, the hedging instrument is recorded in the statement of financial position at its fair
value. Changes in the fair value of the hedging instrument are recorded in the income statement alongside the
changes in the fair value of the hedged item attributable to the identified risk.
3.14. INVENTORIES
Inventories, which essentially consist in on-site supplies, are measured at the lower of the cost or net realizable
value according to the "first in - first out" method.
The inventories are impaired, where applicable, in order to reflect their probable net realizable value.
3.15. CASH AND CASH EQUIVALENTS
In the consolidated statement of financial position, cash and cash equivalents includes liquid assets in current
bank accounts, shares in money market funds and negotiable debt securities which can be mobilized or
transferred in the very short term with a known cash value and do not have a significant risk in terms of changes
in value. All components are measured at their fair value.
In the consolidated cash flow statement, cash and cash equivalents of the operations held for sale are added to
and bank overdrafts are deducted from cash and cash equivalents presented in the statement of financial
position.
3.16. INCOME TAXES
The Group calculates income taxes in accordance with prevailing tax legislation in the countries where income is
taxable.
Current taxes
The current income tax charge is calculated on the basis of the tax laws enacted or substantively enacted at the
reporting date in the countries where the Group’s subsidiaries and associates operate and generate taxable
income.
Deferred taxes
Deferred taxes are recorded on temporary differences between the carrying amount of assets and liabilities and
their tax bases as well as on tax losses according to the liability method. Deferred tax assets are recognized only
when it is probable that they will be recovered. In particular, deferred tax assets are recognized on tax loss carry-
forwards of the Group, to the extent that it is probable that they can be utilized against future tax profits in the
foreseeable future. Deferred taxes are not discounted.
Management’s judgment is required to determine the extent to which deferred tax assets can be recognized.
Future sources of taxable income and the effects of the Group’s global income tax strategies are taken into
account in making this determination. This assessment is conducted through a detailed review of deferred tax
20 – SPIE CONSOLIDATED FINANCIAL STATEMENTS – FY 2016

assets by jurisdiction and takes into account past, current and future operating performance deriving from the
existing contracts in the order book, the budget and multiannual forecasts, and the length of carry back, carry
forwards and expiration dates of net operating loss carry forwards, over a five year horizon.
The expected reversal of tax losses is based on the forecast of future results previsions validated by local
management and reviewed by the Group’s Accounting and Tax Department.
Distributable earnings
The timeline for receiving of undistributed earnings from foreign subsidiaries is controlled by the Group.
With regard to the Group’s French subsidiaries, the distribution of earnings is subject to a taxation of 1%for the
subsidiaries in which the Company owns 95% or more of the outstanding shares (i.e. the majority of those).
No deferred tax liability is to be recognized for undistributed earnings from French and foreign subsidiaries.
3.17. PROVISIONS
The Group identifies and analyses on a regular basis legal claims, faults and warranties, onerous contracts and
other commitments. A provision is recorded when, at the closing date, the Group has an obligation towards a third
party arising from a past event, the settlement of which is likely to require an outflow of resources embodying
economic benefits. Provisions are recognized on the basis of the best estimate of the expenditure required to
settle the obligation at the reporting date. These estimates take into account information available and different
possible outcomes.
In the case of restructuring, an obligation is recorded once the restructuring process has been announced and a
detailed plan prepared or once the entity has started to implement the plan, prior to the reporting date.
Provisions are discounted when the effect is material.
Depending on the nature of the risk, estimates of the probable expenditure are made with operational staff in
charge of the contracts, internal and external lawyers and independent experts whenever necessary.
Quantitative information is set out in Note 18.2.
Contingent liabilities
Contingent liabilities are potential obligations stemming from past events which existence will only be confirmed
by the occurrence of uncertain future events which are not within the control of the entity, or current obligations for
which an outflow of resources is unlikely. Apart from those resulting from a business combination, they are not
recorded in the accounts but are disclosed, when appropriate, in the notes to the financial statements.
3.18. EMPLOYEE BENEFITS
Employee benefits deal with retirement indemnities (including defined contribution plans and defined benefit
plans), pension liabilities and other long-term benefits, mainly length-of-service awards. The other long term
benefits mainly relate to jubilees.
SPIE CONSOLIDATED FINANCIAL STATEMENTS– FY 2016 – 21

Defined contribution plans refer to post-employment benefits under which the Group pays defined contributions to
various employee funds. Contributions are paid in exchange for the services rendered by employees during the
financial year. They are expensed as incurred and the Group has no legal or constructive obligation to pay
additional contributions in the event of insufficient assets.
Defined benefit plans refer to post-employment benefit plans other than defined contribution plans. These plans
constitute a future obligation for the Group for which a commitment is calculated. A provision is calculated by
estimating the value of benefits accumulated by employees in exchange for services rendered during the financial
year and in previous financial years.
Within the Group, post-employment benefits and other long-term benefits correspond to defined benefit plans.
Post-employment benefits
Post-employment benefits mainly correspond to retirement indemnities applicable in France and to internally held
pension plans in force in other European countries.
The Group’s plans are defined contribution plans and defined benefit plans which generally require, in addition to
the part financed by the Company, a contribution from each employee defined as a percentage of his or her
compensation.
The valuation of these benefits is carried out annually by independent actuaries. The actuarial method used is the
Projected Unit Credit Method.
Assumptions mainly include the discount rate, the long-term salary increase rate and the expected rate of the
retirement age. Statistical information is mainly related to demographic assumptions such as fatality, employee
turnover and disability.
Since January 1st, 2013, the Group applies the dispositions of IAS 19 amended “Employee Benefits”, which
introduces several modifications on the accounting of post-employment benefits, including:
- The recognition in the consolidated statement of financial position of all post-employment benefits granted to
employees of the Group. The “corridor” option and the possibility to amortize through the income statement
the cost of past services over the average vesting period have been cancelled;
- The undiscounted amount of the benefits expected to be paid in respect of service rendered by employees in
an accounting period is recognized in that period through the income statement;
- The net interest on the net defined benefit liability or asset has to be determined using the same discount rate
as of the defined benefit obligation, at the beginning of the period;
- The remeasurements of the net defined benefit liability or asset, comprising: actuarial gains and losses,
return on plan assets and some changes in the effect of the asset ceiling must be booked as Other
Comprehensive Items (OCI). These impacts are presented in the consolidated statement of comprehensive
income.
These plans are characterized as follows:
22 – SPIE CONSOLIDATED FINANCIAL STATEMENTS – FY 2016

- In France, employee benefits correspond to retirement indemnities established in accordance with collective
bargaining agreements (estimated based on a percentage of the last salary, according to the seniority and to
the applicable collective agreements);
- In Germany, employee benefits correspond to internally held pension plans, settled in the entities of the SPIE
GmbH sub-group;
- In Switzerland, employee benefits correspond to internally held pension plans, settled in the Swiss
companies;
- In the United Kingdom, pension plans are financed through independent pension funds and as such, do not
lead to any post-employment obligation recognition.
The value recorded in the statement of financial position for employee benefits and other long-term benefits
corresponds to the difference between the discounted value of future obligations and the fair value of plan assets
intended to cover them. The obligation corresponding to the net commitment thus established is recorded as a
liability.
The net financial cost of retirement indemnities, including the financial cost and the expected return on plan
assets, is recognized under "Net financial expenses". The operating expense is recorded in personnel expenses
and includes the cost of services provided during the year as well as the impacts of any plan changes, reductions
or liquidations.
Actuarial assumptions (economic and demographic) have been determined locally according to each concerned
country.
Quantitative information is detailed in Note 18.1.
Other long-term benefits
Other long-term benefits essentially include length-of-service bonuses in the form of "length-of-service awards".
The Group recognizes a liability in respect of awards acquired by employees as of December 31. This provision is
calculated according to methods, assumptions and frequency that are identical to those used for provisions for
retirement indemnities described above.
Actuarial gains and losses arising from the valuation of length-of-service awards are recognized immediately in
the income statement of the financial year of their occurrence.
Group profit sharing agreement
Sub-group optional profit sharing agreements were signed in 2013 within French entities and define the
calculation formula and terms for the profit sharing among beneficiaries. A liability is accrued for in personal
expenses in respect of the amount of profit to be shared at year-end, payable the year after.
Legal profit sharing agreement
SPIE Operations and all subsidiaries whose registered office is in France, directly or indirectly owned by more
than 50% and irrespective of the number of employees, have entered into a Group legal profit sharing agreement
dated June 6, 2005 in accordance with Articles L442-1 and seq. of the French Employment Code (Code du
travail).
Free Performance Shares
SPIE CONSOLIDATED FINANCIAL STATEMENTS– FY 2016 – 23

The shareholders’ general meeting of SPIE SA on 25 May 2016, in its 20th extraordinary resolution, authorized,
under certain conditions, the grant of free existing or future shares, in favor of corporate officers or employees of
the Company or of companies related to the Company in the conditions set forth under article L. 225-197-2 of the
French Commercial Code.
The list of the beneficiaries of the Plan, as well as the number of free performance shares granted to each of them
were decided by the board of directors, upon proposal of the Compensation Committee, at its meeting of 28 July
2016.
The valuation and accounting principles applicable are defined in accordance with IFRS 2 "Share-based
payments". Performance shares represent employees benefits granted to their beneficiaries and, as such,
constitute additional remuneration paid by SPIE (see Note 8.2 Employee Cost).
As a non-cash transaction, benefits granted are recognized as an expense over the vesting period in return for an
increase in equity (see Note 17). They are valued by an external actuary on the basis of the fair value of the
performance shares, at the grant date.
NOTE 4. ADJUSTEMENTS ON PREVIOUS PERIODS: IFRS 5 STANDARD APPLICATION
The accounts for 2015 have been restated pursuant to IFRS 5 “Non-current assets held for sale and discontinued
operations” (see Note 11).
These restatements refer specifically to:
- the power transmission and distribution activities with ONEE (National Office of Electricity and drinking
water) client of SPIE Maroc (in Morocco) which discontinuity process was initiated in March 2016;
- the French entity Sono Technic, subsidiary of SPIE Sud-Ouest. The disposal process was initiated in
November 2016 and was still in progress as at December 31, 2016;
- the entity SPIE IFS AG (previously SPIE Schweiz AG) located in Switzerland was acquired on
September 6, 2013, together with the Services Solutions activity of the Hochtief Group. The disposal
process was initiated in November 2016 and was still in progress as at December 31, 2016;
- activities in "Housing market Projects” of the French company SPIE Ile-de-France Nord-Ouest. The
discontinued process was initiated in the second half of the year 2016 and is planned to be finalized
within 2017;
- the activity "logistics and integration of communications equipment and systems" of SPIE Infoservices,
the French subsidiary of SPIE ICS Sas, planned to be sold since the second half of 2016.
The financial statements of December 31, 2015 presented in comparison to December 31, 2016 are restated in
accordance to the present Note 4.
24 – SPIE CONSOLIDATED FINANCIAL STATEMENTS – FY 2016

Significant events of the period
NOTE 5. SIGNIFICANT EVENTS
5.1. EXTERNAL GROWTH
On September 12, 2016, SPIE announced the Group completed its 100th bolt-on acquisition in ten years.
Since 2006, SPIE has spent a portion of its available cash flow each year on a regular stream of small and
medium-sized acquisitions, helping it to broaden the range of services it offers, densify its presence across its
network, and reinforce its close relationship with its clients. These “quasi-organic” acquisitions, representing a
total revenue of more than €1.5 billion, have made a significant contribution to the Group's growth and results.
During the financial year ended December 31, 2016 in particular, the Group carried out 10 acquisitions,
representing an acquired revenue of approximately € 263 million (see Note 6).
5.2. LEGAL INTEGRATION PROCESS IN SWITZERLAND
In order to have a dedicated management for the Swiss Market, the decision was taken to add a country
management to the structure being responsible for the total of the Swiss entities.
To accompany the management structure and simplify the administrative process the final aim is to create one
legal entity in Switzerland with three divisions which will combine activities of the following existing Swiss entities:
- SPIE ICS AG, held on January 1st, 2016 by the French company SPIE Operations;
- SPIE MTS SA (previously SPIE SUISSE SA) and its 5 subsidiaries held on January 1st, 2016 by the
French company SPIE Sud-Est.
To achieve this aim, two phases have been defined:
Phase I
A new Swiss entity, SPIE Schweiz AG as a Holding company, has been incorporated by SPIE Operations on
August 2016.
Separation of the companies SPIE ICS AG and SPIE MTS SA from their former shareholders was realized on
December 20, 2016. This means the transfer of the full ownership from respectively SPIE Operations and SPIE
Sud-Est to the new created Swiss entity SPIE Schweiz AG.
Phase II
An upstream merger of all Swiss entities into SPIE Schweiz AG is planned during 2017, based on audited
statutory financials statements as per 31 December 2016 with retroactive effect as from 1 January 2017.
SPIE CONSOLIDATED FINANCIAL STATEMENTS– FY 2016 – 25

NOTE 6. ACQUISITIONS AND DISPOSALS
Changes in scope of consolidation include:
- companies acquired during the period;
- companies acquired during previous periods, which do not have the operational resources necessary to
prepare financial statements in line with Group standards within the time allocated. These companies are
included in the Group's scope of consolidation once the financial information is available;
- newly created entities.
6.1 CHANGES IN SCOPE
6.1.1. COMPANIES ACQUIRED DURING PREVIOUS PERIOD
SPIE Sud-Est acquired on December 18th, 2015 a French company Thermat, specialized in heating, plumbing
and ventilation for a global amount € 1.21 million. Located in Haute-Savoie (France) Thermat, which employs 14
people, achieved sales revenues amounting approximately to € 2 million in 2015.
SPIE Sud-Est also acquired on December 22nd, 2015 a French company Entreprise Villanova for a global
amount of € 1.17 million. Specialized in high and low voltage electrical installations, it operates in the sector of the
new collective housing. Located in Puy de Dôme (France), Entreprise Villanova, which employs 20 people,
achieved sales revenues amounting approximately to € 2 million in 2015.
These two companies have been consolidated since January 1st, 2016.
26 – SPIE CONSOLIDATED FINANCIAL STATEMENTS – FY 2016

6.1.2. ACQUISITIONS OF THE PERIOD
Country Type of inclusion
Date of inclusion
Consolidation Method
% of interest
% of control
New entities / activities of the Group Sub-group Jansen Venneboer :
Jansen Venneboer Advies B.V Netherlands Acquisition 2016-01-01 F.C. 100 100 Jansen Venneboer
Beheermaatschappij B.V Netherlands Acquisition 2016-01-01 F.C. 100 100
Jansen Venneboer B.V Netherlands Acquisition 2016-01-01 F.C. 100 100 Jansen Venneboer Beheer &
Onderhoud B.V Netherlands Acquisition 2016-01-01 F.C. 100 100
Sub-group Hartmann : Hartmann Elektrotechnik GMBH
(renamed SPIE Hartmann GmbH)
Germany Acquisition 2016-01-08 F.C. 100 100
AM Allied Maintenance GmbH Germany Acquisition 2016-01-08 E.M. 25 25 HE Hanse Projektmanagement
GmbH Germany Acquisition 2016-01-08 F.C. 100 100
CRIC Belgium Acquisition 2016-01-29 F.C. 100 100
GPE Technical Services B.V Netherlands Acquisition 2016-02-16 F.C. 100 100 Sub-group RDI :
Société Financière du Languedoc - Sofilan
France Acquisition 2016-05-17 F.C. 100 100
Repro Diffusion Informatique (RDI) France Acquisition 2016-05-17 F.C. 100 100 Application Développement
Informatique (ADI) France Acquisition 2016-05-17 F.C. 100 100
SPIE ICS GmbH Germany Acquisition 2016-06-24 F.C. 100 100 Sub-group Agis :
Agis Fire & Security of Finland Finland Acquisition 2016-08-31 F.C. 100 100 Agis Fire & Security of Hungary Hungary Acquisition 2016-08-31 F.C. 100 100 Agis Fire & Security SP Z.O.O.
Poland Poland Acquisition 2016-08-31 F.C. 100 100
Sub-group Comnet : Comnet Berlin GmbH Germany Acquisition 2016-09-01 F.C. 100 100 Comnet Hanse GmbH Germany Acquisition 2016-09-01 F.C. 100 100 Comnet Isernhagen GmbH Germany Acquisition 2016-09-01 F.C. 100 100 Comnet Region Mitte Kassel
GmbH Germany Acquisition 2016-09-01 F.C. 100 100
Comnet Rhein Neckar Mannheim GmbH Germany Acquisition 2016-09-01 F.C. 100 100
Comnet West GmbH Germany Acquisition 2016-09-01 F.C. 100 100 GfT - Gesellschaft für Elektro- und Sicherheitstechnik Germany Acquisition 2016-09-30 F.C. 100 100
Sub-group TRIOS :
Triosgroup Limited United Kingdom Acquisition 2016-11-04 F.C. 100 100
Trios Property Limited United Kingdom Acquisition 2016-11-04 F.C. 100 100
Trios Compliance Limited United Kingdom Acquisition 2016-11-04 F.C. 100 100
Trios Skilz Limited United Kingdom Acquisition 2016-11-04 F.C. 100 100
Trios Secure Limited United Kingdom Acquisition 2016-11-04 F.C. 100 100
Trios Facilities Limited United Kingdom Acquisition 2016-11-04 F.C. 100 100
Sub-Group Alewijnse: Alewijnse Zwolle BV Netherlands Acquisition 2016-11-21 F.C. 100 100 Alewijnse Utrecht BV Netherlands Acquisition 2016-11-21 F.C. 100 100 Alewijnse Delft BV Netherlands Acquisition 2016-11-21 F.C. 100 100
* F.C.: Full Consolidation, E.M: Equity Method.
SPIE CONSOLIDATED FINANCIAL STATEMENTS– FY 2016 – 27

- On January 1st, 2016 SPIE Nederland acquired the Deutsch group Jansen Venneboer in engineering,
inspection and maintenance management, Jansen Venneboer manufactures, renovates and maintains
electromechanical facilities, bridges, flood defenses and sluice gates. The company has 96 employees and
has generated annual revenues of approximately € 18 million in 2015. The transferred counterpart stands at
€ 3 million.
- On January 8, 2016 SPIE GmbH fulfilled the acquisition of Hartmann Elektrotechnik GmbH, in Germany.
Created in 1945 in Hamburg, Hartmann Elektrotechnik, which employs more than 300 employees operating
from 6 locations across Germany, provides a wide range of ICT and Mechanical & Electrical services, which
allowed it to achieve revenues of approximately € 38 million in 2015. The transferred counterpart stands at €
16.7 million.
- On January 29, 2016, SPIE Belgium acquired the Belgium company CRIC (Climatisation Réfrigération
Industrielle & Commerciale, Air conditioning Industrial and commercial refrigeration) specialized in installation
and maintenance of HVAC (heating, ventilation and air conditioning). Founded in 1997, this company based
near Charleroi (Belgium) employs a staff of approximately thirty employees and generated revenues of
approximately € 4 million in 2015. The transferred counterpart stands at € 3.9 million.
- On February 16, 2016, SPIE Nederland acquired the Deutsch company GPE Technical Services.
Specialized in steam and condensate systems, GPE Technical Services employs 7 employees and
generated revenues of approximately € 1 million in 2015. GPE is thus working on the controlling of 6.000
condensation traps for a petrochemical plant in the Europoort area in Rotterdam. The experts of GPE
perform measurements and carry out the maintenance of condensation traps and are able to detect sources
of potential energy loss. The transferred counterpart stands at € 0.4 million.
- On May 17, 2016 SPIE ICS (France) acquired the French group RDI. Founded in 1986, the RDI group has
expanded from its historic site in Nîmes, to reach in 2015 revenues of circa 36 million euros. The company
employs around 180 employees, on three sites: Nîmes, Nice, and Gemenos (Marseille). The transferred
counterpart stands at € 8.9 million.
- On June 24, 2016, SPIE GmbH acquired the Germany company SPIE ICS GmbH (formerly named Rheinsee 518. V V GmbH), which has no activity yet. The transferred counterpart stands at € 25 thousand.
- On August 31, 2016, SPIE acquired, through its German subsidiary SPIE GmbH, the AGIS Fire & Security
Group (hereafter “AGIS”). Headquartered in Warsaw, AGIS has been active in its markets for about 40 years
and provides all services from consultancy, conception and design, through to installation and servicing of fire
protection, security and building technology solutions mainly in Poland and Hungary. With about 200
employees, AGIS generated total revenues of 28 million Euros in fiscal year 2015. The transferred
counterpart stands at € 10 million.
- On September 1st, 2016, SPIE GmbH, a fully-owned subsidiary of SPIE group, acquired several companies
of the COMNET group ("COMNET"). COMNET was founded in 1991 and provides solutions and services in
the areas of IT, telecommunications and security. With close to 160 highly qualified employees at eight
locations in Germany, COMNET generated revenues of circa 30 million euros in 2015. The transferred
counterpart stands at € 11.9 million.
28 – SPIE CONSOLIDATED FINANCIAL STATEMENTS – FY 2016

- On September 30, 2016, SPIE GmbH, a fully-owned subsidiary of SPIE group, acquired Gesellschaft für Elektro- und Sicherheitstechnik GmbH ("GfT"). GfT, established in Essen in 1997, provides services in
the areas of safety engineering, fiber optics, data technology and electrical engineering. With 60 highly
qualified employees, GfT generated revenues of approximately 17 million euros in 2015. The transferred
counterpart stands at € 16.7 million.
- On November 4, 2016, SPIE UK acquired the TRIOS group in the United Kingdom. Originating from a family-
owned business established in 1919, Trios Group has grown into a UK national provider of technical facilities
maintenance services operating in a broad range of sectors, including commercial, health, leisure and retail.
With approximately 690 employees across five regional offices, Trios Group generated revenues of circa 60
million sterling in 2015 (i.e. around 82 millions of euros). The transferred counterpart stands at £ 21.4 million,
i.e. € 26.4 million.
- On November 21, 2016, SPIE Nederland acquired Alewijnse Technisch Beheer ("Alewijnse TB").
Alewijnse TB, a division of the Alewijnse Group, is a technical services provider focusing on the technical
management of building-related installations, with a particular expertise in installation and maintenance of
electrical equipments. With more than 200 employees and branches in Delft, Utrecht and Zwolle, Alewijnse
TB generates annual revenues of approximately €33 million. The transferred counterpart stands at € 6.5
million.
6.1.3. COMPANIES TEMPORARILY HELD AS FINANCIAL ASSETS IN 2016
- On November 30, 2016, SPIE acquired the Environmental Engineering Ltd ("EE") group in the United
Kingdom. EE specializes in HVAC, mechanical and electrical engineering services within the food and
beverage industry. Its expertise ranges from small single-component works to holistic turnkey solutions. The
EE group achieved a full-year March 2016 revenue of approximately £ 19 million sterling (i.e. around € 24
million). The transferred counterpart stands at £ 6.7 million, i.e. € 7.9 million.
- On December 8, 2016 SPIE acquired the Belgium company Tevean. Established in 1950 and located in
Zelzate (East Flanders), Tevean designs, builds and maintains electrical, security and fire protection systems
for buildings. Tevean's clients operate in the non-residential, healthcare and industrial sectors. The company
employs 50 people and generated sales of circa 9 million euros in 2015. The transferred counterpart stands
at € 7.5 million.
- On December 9, 2016, SPIE acquired the Aaftink group of companies in the Netherlands. The Aaftink group
of companies ("Aaftink") is located in Abcoude and specializes in the design, installation, maintenance and
repair of building-related systems for retail clients. With 80 employees, Aaftink generates annual revenue of
approximately €12 million. The transferred counterpart stands at € 2.2 million.
SPIE CONSOLIDATED FINANCIAL STATEMENTS– FY 2016 – 29

6.1.4. NEWLY CONSOLIDATED COMPANIES
The Group consolidated for the first time the SPIE Facilities (formerly named SPIE 911) and SPIE Citynetworks
(formerly ST4) entities during the second half of 2016. These entities with no activity in 2016 were created
respectively on December 19, 2011 and on November 30, 2000 (see Note 26.3).
The Group created on November 10, 2015 the company SPIE OGS JBL Ltd in Dubai (United Arab Emirates).
This dormant company since 2015 was consolidated in the Group’s financial statements for 2016.
6.1.5. NEWLY CREATED COMPANIES
The Group created on September 20, 2016, the SPIE Schweiz A.G. company in Switzerland. This entity has
been consolidated for the publication of the Group’s financial statements as of December 31, 2016.
6.1.6. COMPANIES LIQUIDATED OR DIVESTED IN 2016
On June 13, 2016, SPIE Group has signed a disposal agreement for TecnoSPIE SA located in Portugal. The sale
was completed on July 6, 2016, once the condition precedents have been released.
On August 22, 2016 SPIE OGS liquidated the Ipedex Snd Bhd (Brunei). The liquidation was effective and
without significant incidence in the Group’s 2016 accounts.
On August 25, 2016 the Group disposed the SPIE Czech S.R.O. company. This entity had no activity since 2014.
The disposal was effective and without significant incidence in the Group’s 2016 accounts.
6.2 CHANGES IN METHOD
After applying IFRS 11, Sonaid located in Angola, which were previously consolidated under the full consolidation
method is now consolidated under the equity method since the Group lost the decision-making control during the
first half of 2016 (see Note 20.8).
30 – SPIE CONSOLIDATED FINANCIAL STATEMENTS – FY 2016

6.3 IMPACT OF NEWLY CONSOLIDATED COMPANIES
The impact of the new consolidated companies in the Group’s financial statement is presented hereafter:
In thousands of euros Ja
nsen
Ven
nebo
er
Gro
up
Har
tman
n G
roup
RD
I Gro
up
AG
IS G
roup
CO
MN
ET G
roup
TRIO
S G
roup
Ale
wijn
se G
roup
Oth
er
acqu
isiti
ons
Tota
l A
cqui
sitio
ns
2016
PPA
Adj
ustm
ents
(IF
RS
3R)
Tota
l af
ter a
djus
men
ts
Intangible assets 327 6,709 4,035 153 30 - 3 1,866 13,123 0 13,123 Property, plant and equipment 356 527 608 296 677 2,248 200 213 5,126 78 5,204
Investments in companies accounted for under equity method
- (0) - - - - - - (0) - (0)
Financial assets - 9 354 43 76 - - 12 494 1 495 Deferred tax assets 6 430 420 510 257 41 - 80 1,744 262 2,006 Other non-current assets - - - - - - - - - - -
Current assets 4,413 11,294 7,242 10,250 5,721 24,463 7,277 9,018 79,678 (1,549) 78,129 Cash and cash equivalents 68 5,086 5,943 2,178 893 1,088 26 8,507 23,790 1,573 25,363
Total assets acquired at fair value
5,170 24,055 18,602 13,431 7,654 27,840 7,506 19,696 123,955 365 124,320
Equity attributable to non-controlling interests
- 0 - (1) - 0 - - (0) (2,460) (2,460)
Long-term borrowings - - (910) - - (878) - (250) (2,038) 841 (1,197) Other non-current liabilities (26) (68) (853) (104) (66) - - (13) (1,130) (61) (1,191)
Deferred tax liabilities (92) (2,154) (1,374) (44) - (48) - (606) (4,317) - (4,317) Short-term borrowings - - (1,199) (1,108) (1,779) (553) (1,068) (100) (5,807) (846) (6,652)
Other current liabilities (4,917) (10,313) (9,555) (6,797) (9,777) (14,281) (5,818) (9,317) (70,775) (1,566) (72,341)
Total liabilities assumed at fair value
(5,035) (12,535) (13,891) (8,052) (11,622) (15,760) (6,886) (10,286) (84,066) (4,092) (88,158)
Transferred counterpart 2,902 16,676 8,902 9,985 11,964 23,827 6,500 21,450 102,206 (1,643) 100,562
Recognized goodwills 2,767 5,156 4,191 4,605 15,932 11,747 5,880 12,040 62,317 2,084 64,401
The column “PPA Adjustments (IFRS 3R)” includes the goodwill adjustments related to the purchase price
allocation of Thermat and Villanova, acquired in December 2015, to the price addition of Cromm and to the earn
out of Leven paid in 2016 (see Note 14.1)
SPIE CONSOLIDATED FINANCIAL STATEMENTS– FY 2016 – 31

Segment information
NOTE 7. SEGMENT INFORMATION
Summarized information intended for strategic analysis by general management of the Group for decision-making
purposes (the concept of chief operating decision-maker in accordance with IFRS 8) is based on revenue (as per
management accounts) and EBITA indicators broken down by operating segment.
7.1. INFORMATION BY OPERATING SEGMENT
Revenue (as per management accounts) represents the operational activities conducted by the Group's
companies, while consolidating subsidiaries that have minority shareholders on a proportionate basis or using the
equity method.
EBITA, as per management accounts, is the Group operating result. It is calculated before amortization of
allocated goodwill (brands, backlogs and customers). The margin is expressed as a percentage of revenue (as
per management accounts).
In millions of euros France Germany
and Central Europe
North-Western Europe
Oil & Gas and Nuclear Holdings TOTAL
2016 Revenue (as per management accounts) 2,253.5 927.0 1,374.3 589.6 - 5,144.5 EBITA 157.3 45.2 67.4 62.6 19.9 352.4 EBITA as a % of revenue (as per management accounts) 7.0% 4.9% 4.9% 10.6% n/a 6.8%
2015 Restated * Revenue (as per management accounts) 2,274.4 892.4 1,303.3 793.9 - 5,264.0 EBITA 158.8 35.8 60.4 77.0 20.6 352.7 EBITA as a % of revenue (as per management accounts) 7.0% 4.0% 4.6% 9.7% n/a 6.7%
* Comparative data for 2015 have been restated, See Note 4
Reconciliation between revenue (as per management accounts) and revenue under IFRS
In millions of euros 2015 Restated 2016
Revenue (as per management accounts) 5,264.0 5,144.5 Sonaid (a) 105.5 (14.3) Holding activities (b) 30.9 23.0 Others (c) (1.2) 2.5 Revenue under IFRS 5,399.2 5,155.7
(a) Sonaid is consolidated on a proportionate basis in the management accounts since the loss of control by the
Group during the first half of 2016.
(b) Non-Group revenue from the SPIE Operations Group and other non-operational entities.
(c) Re-invoicing of services provided by Group entities to non-managed joint ventures; re-invoicing to non-Group
entities that do not correspond to operational activity (essentially re-invoicing of expenses on account);
revenue from entities consolidated under the equity method, or pending consolidation companies.
32 – SPIE CONSOLIDATED FINANCIAL STATEMENTS – FY 2016

Reconciliation between EBITA and consolidated operating income
In millions of euros 2015 Restated 2016
EBITA 352.7 352.4 Amortization of intangible assets (allocated goodwill) (36.1) (33.5) Discontinued activities and restructuring costs (a) (17.7) (16.7) Financial commissions (1.8) (1.8) Non-controlling interests (b) 3.6 0.1 IPO / ESP (c) (29.6) - Others (d) (1.4) 2.4 Consolidated Operating Income 269.6 302.7
(a) Costs relating to reorganizations in France, in the United Kingdom and in Switzerland.
(b) Non-controlling interests correspond to Group’s Share of SONAID’s operating income (55%) in 2016 and non-
group share (45%) in 2015. In the Group’s IFRS consolidated accounts, SONAID is equity-accounted since
January 1st, 2016 and was fully consolidated before, whereas it is accounted proportionally in the Group’s EBITA
in both periods.
(c) Costs relating to the Initial Public Offering and to the employees shareholders plan.
(d) The « Others » items mainly correspond to the technical capital gain recognized when changing the
consolidation method of Sonaid, according to the IFRS 11 application; it also relates to release of a non-used
earn-out provision, and the recognition of a loss for the free share plan allocation, in compliancy with the IFRS 2
standard. Finally, it also includes costs related to external growth projects.
7.2. PRO-FORMA INDICATORS
Pro-forma indicators are intended to provide a more comprehensive economic vision which incorporates the
income statement over 12 months of companies acquired during the financial year irrespective of the initial
consolidation date.
In millions of euros 2015 Restated 2016 Revenue (as per management accounts) 5,264.0 5,144.5 Pro-forma adjustments (12 months effect of acquisitions) 53.5 195.9 Pro-forma revenue (as per management accounts) 5,317.5 5,340.4 EBITA 352.7 352.4 Pro-forma adjustments (12 months effect of acquisitions) 0.8 6.7 EBITA pro-forma 353.5 359.0 As a % of pro-forma revenue 6.6% 6.7%
SPIE CONSOLIDATED FINANCIAL STATEMENTS– FY 2016 – 33

7.3. NON-CURRENT ASSETS BY ACTIVITY
Non-current assets include intangible assets, property, plant and equipment, and goodwill allocated to Cash
Generating Units.
In thousands of euros France Germany & CE North-Western
Europe Oil & Gas -
Nuclear Holdings TOTAL
December 31, 2016 275,179 301,026 153,894 37,735 2,316,797 3,084,630
December 31, 2015 271,582 264,455 143,938 43,971 2,327,078 3,051,024
7.4. PERFORMANCE BY GEOGRAPHIC AREA
Revenue under IFRS is broken down by geographical location of customers.
In thousands of euros France Germany Others TOTAL
2016
Revenue under IFRS 2,613,528 737,442 1,804,729 5,155,699 2015 Restated Revenue under IFRS 2,649,834 695,515 2,053,900 5,399,249
7.5. INFORMATION ABOUT MAJOR CUSTOMERS
No customer individually represents 10% or more of the Group’s consolidated revenue.
34 – SPIE CONSOLIDATED FINANCIAL STATEMENTS – FY 2016

Notes to the consolidated income statement
NOTE 8. OTHER OPERATING INCOME AND EXPENSES
8.1. OPERATING EXPENSES
In thousands of euros Note 2015 Restated 2016
Purchases consumed (1,028,476) (830,014) External services (2,059,818) (2,066,745) Employee cost 8.2 (2,014,836) (1,956,412) Taxes (48,460) (41,140) Net amortization and depreciation expenses and provisions (21,429) (32,852) Other operating income and expenses 59,262 56,616 Operating expenses (5,113,758) (4,870,546)
8.2. EMPLOYEE COST
Breakdown of employee cost
In thousands of euros Note 2015 Restated 2016
Wages and salaries (a) (1,428,335) (1,382,499) Social security costs (565,890) (554,718) Employee benefits (b) (10,087) (8,337) Employee profit-sharing (10,524) (10,858) Employee costs (2,014,836) (1,956,412)
(a) The CICE (French State’s credit for competitiveness and employment) total benefit accounted for in the
income statement in 2016, booked as a deduction from personnel costs, amounts to € 26,566 thousand
(against € 27,105 thousand in 2015). These amounts were calculated including the payments and liabilities
accounted for during the period and relating to eligible compensations.
(b) Employee benefits include the share of long-term post-employment benefit reserved for retirement benefit.
Free Performance Shares
The information relating to the features of the free performance shares are presented here below:
2015 2016
Number of beneficiaries 420 Acquisition date 2019-07-28 Number of granted shares under performance conditions 1,098,155 Number of granted shares cancelled - Number of granted shares under performance conditions at year end - 1,098,155
The vesting of performance shares is under condition of presence of the beneficiary throughout the three-year
duration of the acquisition period.
Thus, the fair value valuation of the performance shares takes into consideration a turnover rate of the
beneficiaries as read per country in the employers companies.
SPIE CONSOLIDATED FINANCIAL STATEMENTS– FY 2016 – 35

The number of performance shares, to which the fair value applied for the calculation of the IFRS 2 expense, is
adjusted by taking into consideration the estimation of the probabilities of achieving financial performance
conditions.
The acquisition of the allocated shares is subject to three financial performance conditions:
- two internal conditions (non-market)
• a condition on Average Annual Growth Rate (AAGR) of EBITA over the period 2016-2018
• a condition on Cash Conversion Rate (CCR) of EBITA over the period 2016-2018
- one external condition, linked to a Total Shareholder Return (TSR) target for the SPIE shares over the period
2016 -2018 compared to the median TSR of the companies included in the SBF 120 index.
The 420 beneficiaries are divided into two groups, each with a specific plan:
- the first group corresponding to the Executive Committee of SPIE Group and CEO of the French subsidiaries;
- the second group corresponding to others beneficiaries bound with any of the Group companies by an
employment contract.
The weights to be applied to internal and external allocation rates are as follows:
Internal Criteria
External Criteria
Executive Committee of SPIE Group and CEO of French subsidiaries 65.0% 35.0% Others 80.0% 20.0%
The fair value of the performance shares, valued to € 12,360 thousand at the grant date of September 19th, 2016,
is amortized over the three-year vesting period.
Thus, a charge for an amount of 1,751 thousand euros was booked in 2016.
Applicable taxes and employers contributions, due by employer companies in their own countries, have been
accrued as expenses for an amount of € 296 thousand in 2016.
Breakdown of average number of Group employees
2015 2016
Engineers and executive management 6,989 7,097 Lower and middle management 17,510 17,989 Other employees 13,584 13,780 Average number of Group employees 38,083 38,866
Headcount does not include any temporary workers.
36 – SPIE CONSOLIDATED FINANCIAL STATEMENTS – FY 2016

8.3. OTHER OPERATING INCOME (LOSS)
Other operating income and expenses break down as follows:
In thousands of euros Notes 2015 Restated 2016
Business combination acquisition costs (a) (1,158) (2,369) Net book value of financial assets and security disposals (b) (4,643) 4,922 Net book value of assets (3,234) (8,293) Other operating expenses (c) (52,547) (23,243)
Total other operating expenses (61,582) (28,982) Gain on security disposals (d) 1,061 282 Gains on asset disposals 2,713 8,314 Other operating income (e) 10,184 4,331
Total other operating income 13,958 12,927 Other operating income and expenses (47,624) (16,055)
(a) In 2016 “Business combination acquisition costs” relate to the acquisitions of Hartmann by SPIE GmbH, of
Leven and Trios by SPIE UK, to the acquisition of Jansen Venneboer by SPIE Nederland and to the
acquisitions of the RDI group by SPIE ICS (formerly SPIE Communications).
(b) In 2016, the net book value of financial assets and security disposals corresponds mainly to the IFRS impact
of the loss of control of Sonaid entity and to the recognition of these shares under the equity method, for an
amount of € 5,260 thousands. The 2015 amount corresponded to the liquidation of shares held by S.B T.P.
in Chile (for € 2,918 thousand) and to the disposal of the Stadion Nürnberg Betriebs GmbH entity.
(c) In 2016, the “other operating expenses” mainly correspond to the reorganization costs in France, in
Switzerland and in the UK.
In 2015, they corresponded to:
(i) the June 2015 IPO related costs for € 2 124 thousand;
(ii) the employer matching contribution paid by the Group in connection with employees
subscription to the shareholders plan for a total amount of € 23,787 thousand (including
roadshow costs) ;
(iii) the booking of a provision amounting to € 13,663 thousand for an onerous contract at the date
control was obtained in the United Kingdom and relating to an arbitrary procedure initiated by
the Secretary of State for Defense;
(iv) Costs related to uncompleted external growth projects, to restructuring or penalty costs.
(d) The gains on security disposals corresponded in 2015 to the disposal of Stadion Nürnberg Betriebs GmbH.
In 2016, they relate to the disposal of Concept ERP shares held by Sofilan (RDI Group acquired by SPIE
ICS in 2016).
(e) The « other operating income » mainly corresponds to penalties received and to write backs on provisions.
In 2015, the other non-current income included a write back of provisions on the shares of the Chilean entity
of S.B.T.P. disposed for an amount of € 2,917 thousand, and the write back of provision on the disposed
SAEIV activity for an amount of € 4,000 thousand. In 2016, the non-current income mainly include the earn
out of the ENS entity which has not been paid, for an amount of € 2,563 thousands.
SPIE CONSOLIDATED FINANCIAL STATEMENTS– FY 2016 – 37

NOTE 9. NET FINANCIAL COST AND FINANCIAL INCOME AND EXPENSES
Cost of net debt and other financial income and expenses are broken down in the table below:
In thousands of euros Notes 2015 Restated 2016
Interest expenses (75,469) (38,745) Interest expenses on financial leases (675) (560) Interest expenses on cash equivalents (164) (80)
Interest expenses and losses on cash equivalents (76,309) (39,385) Interest income on cash equivalents 1,260 91 Net proceeds on sale of marketable securities 79 95
Gains on cash and cash equivalents 1,339 186 Costs of net financial debt (a) (74,970) (39,199)
Loss on exchange rates (b) (44,790) (28,513) Allowance for financial provisions for pensions (4,837) (4,688) Other financial expenses (77,795) (1,359)
Total other financial expenses (127,422) (34,559) Gain on exchange rates 27,969 20,337 Reversal of financial provisions for pensions 20 - Gains on financial assets excl. cash and cash equivalents 140 43 Allowance / Reversal on financial assets 2,786 127 Other financial income 3,621 945
Total other financial income 34,536 21,451 Other financial income and expenses (92,886) (13,108)
(a) The variation between 2015 and 2016 (€ 35.7 million) is due to interest charges related to the loans fully
repaid during the Group IPO in June 2015, and to the fact that the 2015 financial result includes the costs
arising from the repayments of the period.
(b) The variation of the exchange rate between pound sterling and euro during 2016 contributed to losses on
exchange rates up to a net amount of approximately € 16 million, without any significant cash impact.
NOTE 10. INCOME TAX
10.1. TAX RATE
Tax rate
In France, an additional contribution tax of 5%, applicable to profits for 2011 and 2012, then prorogued to 10.7%
on profits for 2013, 2014 and 2015, increases the ordinary tax rate in force to 38.0% (from € 250 million revenue
and above) for the 2013, 2014 and 2015 periods. This rate is not extended to fiscal years ending on December
31, 2016.
The non-extension of the additional contribution has no impact on the tax rate used by the Group for calculating
deferred taxes of French entities, as the Group already applies an ordinary tax rate at 34.43%.
38 – SPIE CONSOLIDATED FINANCIAL STATEMENTS – FY 2016

Furthermore, prevailing tax rates in the main European countries in Group businesses are the followings:
Income tax rate used by the Group 2015 2016
France 34.43% 34.43% Germany 31.50% 31.50% United Kingdom 20.00% 20.00% Belgium 33.99% 33.99% Netherlands 25.00% 25.00% Switzerland 21.00% 21.00%
10.2. CONSOLIDATED INCOME TAX EXPENSE
Income taxes are detailed as follows:
In thousands of euros 2015 Restated 2016
Income tax expense reported in the income statement Current income tax (74,002) (76,369) Deferred income tax (a) 16,550 28,455 Total income tax reported in the income statement (57,452) (47,914) Income tax expense reported in the statement of comprehensive income
Net (loss)/gain on cash flow hedge derivatives (5,197) (112) Net (loss)/gain on post-employment benefits (40) 4,275 Total income tax reported in the statement of comprehensive income (5,237) 4,163
(a) The Group’s deferred tax at 31 December 2016 has been revalued mainly following the adoption of the
2017 Finance Act in France, which provides for a reduction in the corporate income tax rate from 33.33%
to 28% for all companies from 2020. The impact for the Group relates to the deferred taxes scheduled
from 2020 on, and in particular from one hand to the deferred tax based on the intangible assets, limited
to the SPIE brand (which generates a positive impact on the net income of € 43.8 million) and on the
other hand, to the deferred taxes based on pension provisions (which generates a negative impact on
the net income of € 8.0 million).
10.3. DEFERRED TAX ASSETS AND LIABILITIES
Before offsetting deferred tax assets and liabilities by fiscal entity, the components of deferred tax are as follows:
In thousands of euros Assets Liabilities Dec 31, 2016
Derivatives (13) (13) Employee benefits 79,194 79,194 Provisions for contingencies and expenses non-deductible for tax purpose 30,790 30,790
Tax loss carry forward 67,760 67,760 Revaluation of long-term assets 26,440 (245,542) (219,102) Deferred tax liabilities on finance leases 55 (980) (925) Other temporary differences 31,126 (21,310) 9,815 Total deferred tax -net 235,364 (267,845) (32,482)
SPIE CONSOLIDATED FINANCIAL STATEMENTS– FY 2016 – 39

Deferred tax assets and liabilities by nature for 2015 are detailed below:
In thousands of euros Assets Liabilities Dec 31, 2015 Restated
Derivatives 99 99 Employee benefits 81,586 81,586 Provisions for contingencies and expenses non-deductible for tax purpose 33,447 33,447
Tax loss carry forward 76,002 76,002 Revaluation of long-term assets 24,577 (291,321) (266,744) Deferred tax liabilities on finance leases 216 (1,015) (799) Other temporary differences 28,685 (18,039) 10,646 Total deferred tax -net 244,613 (310,375) (65,762)
The breakdown of deferred tax variations for the period according to their impact on the income statement or on
the statement of financial position is the following:
Variations 2016
In thousands of euros 31 Dec.
2015 Restated
Income statement
Equity & OCI
Translation differences
Reclassifications
Other/ Changes in
scope (a)
31 Dec. 2016
Derivatives 99 (112) (13) Employee benefits (b) 81,586 (6,926) 4,276 31 227 79,194 Provisions for contingencies and expenses non-deductible for tax purpose
33,447 (2,732) (117) 191 30,790
Tax loss carry forward (c) 76,002 (6,488) (1,902) 148 67,760 Revaluation of long-term assets (d) (266,744) 44,602 5,200 (65) (2,095) (219,102)
Deferred tax liabilities on finance leases
(799) (118) (8) (925)
Other temporary differences (e) 10,646 117 0 197 65 (1,210) 9,815
Total deferred tax -net (65,762) 28,455 4,164 3,400 - (2,739) (32,482)
(a) The « others / changes in scope » mainly correspond to the deferred taxes provided by the incoming
entities of the Group during the year, and to the ongoing process of purchase price allocation;
(b) The € (6,926) thousand accounted for in the income statement include the impact of the change on
Income Tax applicable from 2020 on (2017 Finance Act in France – see footnote of Consolidated
Income Statement) for an amount of € (8,016) thousand;
(c) The tax loss carry-forward impacting the income statement mostly derive from the Group’s deferred
losses used during the year (and in particular in the SPIE SA holding, which carries the tax grouping, see
Note 10.4), and to the recognition as asset of the whole tax loss carry-forwards of the United-Kingdom
companies;
(d) The € 44,602 thousand accounted for in the income statement include the impact of the change on
Income Tax applicable from 2020 on (2017 Finance Act in France) for an amount of € 43,855 thousand,
mainly on the Group ‘s intangible assets;
(e) The “Other temporary differences” include the other differences such as restatements related to the
IFRIC 21 application, or restatements on currency translations.
40 – SPIE CONSOLIDATED FINANCIAL STATEMENTS – FY 2016

10.4. TAX LOSS CARRIED FORWARD
Tax losses carried forward within the tax group in France amount to € 113,989 thousand. They have been
recognized as deferred tax assets for € 37,396 thousand. The timeline for the relief of carry forward tax deficits,
by allocation to predictable profits of the SPIE SA tax group, has been estimated at 3 years.
As at December 31, 2016, unrecognized tax losses in France amount to € 75,052 thousand and concern mainly
pre-integration losses in the Group’s French subsidiaries.
All tax losses carried forward in the United-Kingdom amount to £ 82,067. The timeline for the relief of carry
forward tax deficits, by allocation to predictable profits of the SPIE SA tax group, has been estimated at less than
5 years. The amount of deferred tax assets finally recognized is of £ 16,413 thousand (i.e. € 19,548 thousand).
The deferred tax assets corresponding to the tax losses carried forward in Germany were fully accounted for
€ 8,052 thousand, on a basis of a 5 years plan relief.
All tax losses carried forward relating to the SPIE ICS in Switzerland, amount in basis as at December 31, 2016 to
10,532 thousands of Swiss Francs (CHF) (i.e. € 9,800 thousand). They have been subject to the recognition of
deferred tax assets fully accounted for an amount of CHF 2,212 thousand (i.e. € 2,058 thousand).
10.5. RECONCILIATION BETWEEN PROVISION FOR INCOME TAXES AND PRE-TAX INCOME
In thousands of euros 2015 Restated 2016
Consolidated net income 38,304 184,032 (-) Net income from discontinued operations 6,037 18,482 Provision for income taxes 57,452 47,914 Pre-tax income 101,793 250,428 (-) Net income (loss) from companies accounted for under the equity method
(379) (426) Pre-tax income excl. companies accounted for under the equity method
101,414 250,001 Theoretical French statutory tax rate 34,43% 34,43% Theoretical tax charge (34,917) (86,076) Permanent differences and other differences (2,441) (1,043) French CVAE (a) (13,808) (13,171) Tax loss carry-forward (10,630) 13,081 Difference between French and foreign income tax rates 7,790 4,156 Difference on French income tax rate (2017 Finance Act) - 35,839 Tax provisions (b) (3,446) (701) Net provision for income taxes (57,452) (47,914) Effective tax rate 56.44% 19.13% Effective tax rate excluding French CVAE (c) 35.75% 11.11%
(a) In France, the Company value-added contribution ("Cotisation sur la Valeur Ajoutée des Entreprises” -
CVAE) is due based on added value stemming from individual financial statements. The Group opted for the
option of booking CVAE in income tax in order to ensure consistency with the accounting treatment of similar
taxes in other countries. Accordingly, CVAE is presented as a component of the income tax expense. As
CVAE is tax deductible, its amount has been restated net of income tax for reconciliation purposes.
SPIE CONSOLIDATED FINANCIAL STATEMENTS– FY 2016 – 41

(b) Tax provisions relate to tax audits in progress where notices of judgments have been received and are
subject to discussions with the relevant tax authorities. The portion of this process relating to additional
income tax is recognized as a component of the income tax expense.
(c) In 2016, if the impact following the adoption of the 2017 Finance Act in France (see Note 10.2) was restated
then the effective tax rate of the Group would be of 25,42% excluding French CVAE and of 33.44% including
French CVAE.
NOTE 11. ASSETS HELD FOR SALE AND DISCONTINUED OPERATIONS
The Group’s assets held for sale and discontinued operations requiring the application of IFRS 5 are outlined
below:
2015 Restated 2016
In thousands of euros Revenue Contribution to net income Revenue Contribution to
net income S.G.T.E. INGENIERIE - (19) - (25) FORAID ALGERIE EURL 4,191 (183) 2,562 (207) TECNOSPIE SA (formerly OELE) 17,337 (3,279) 9,248 (4,249) SPIE HELLAS S.A. (Greece) 2,608 (893) - - ADVAGO S.A. - (13) - (15) SONO TECHNIC 2,423 2 2,010 (1,105) SPIE IFS AG 8,632 (359) 6,461 (1,232) SPIE MAROC – ONEE Business 6,435 (756) 2,483 (4,612) SPIE Ile de France Nord-Ouest – Real estate business 15,114 (685) 7,520 (4,635)
SPIE Infoservices – Logistics business - 148 - (2,403) TOTAL 56,740 (6,037) 30,284 (18,482)
- The liquidation process of SGTE Ingénierie, started in 2007, was still in progress as at December 31,
2016;
- The disposal process of Foraid Algérie Eurl, initiated in 2011, was still in progress as at December 31,
2016;
- The disposal of TecnoSPIE SA in Portugal which was initiated in December 2015. On June 13, 2016,
SPIE Group signed a disposal agreement and the sale was completed on July 6, 2016;
- The entities Advago SA and SPIE Hellas SA (previously Hochtief Facility Management Hellas SA) in
Greece were acquired on September 6, 2013, together with the Services Solutions activity of the
Hochtief Group. The disposal process was initiated in 2014 and was still in progress as at
December 31, 2016 for Advago SA. However, SPIE Hellas SA has been disposed on August 19, 2015;
- The French entity Sono Technic, operating on low voltage electricity activities in the Toulouse region.
The disposal process was initiated in November 2016 and was still in progress as at
December 31, 2016;
- The entity SPIE IFS AG (previously SPIE Schweiz AG) located in Switzerland was acquired on
September 6, 2013, together with the Services Solutions activity of the Hochtief Group. The disposal
process was initiated in November 2016 and was still in progress as at December 31, 2016;
42 – SPIE CONSOLIDATED FINANCIAL STATEMENTS – FY 2016

- the lines and substations activities with ONEE (National Office of Electricity and drinking water) client of
SPIE Maroc (in Morocco) whose discontinuity process was initiated in March 2016 and was still in
progress as at December 31, 2016;
- activities in "Housing market Projects” of the French company SPIE Ile-de-France Nord-Ouest. The
discontinued process was initiated in the second half of the year 2016 and is planned to be finalized
within 2017;
- The activity "logistics and integration of communications equipment and systems" of SPIE Infoservices,
the French subsidiary of SPIE ICS Sas, planned to be sold.
As a result, as at December 31, 2016, the financial statements of SGTE Ingénierie, Foraid Algérie Eurl, Advago
SA, Sono Technic, SPIE IFS AG, as well as the discontinued activities regarding the lines and substations with
ONEE in Morocco, the "Housing market Projects” of SPIE Ile-de-France Nord-Ouest and the logistics of SPIE
Infoservices, have been reclassified in a separate line on the income statement, representing the contribution to
net income of these operations.
The assets and liabilities of these operations have been respectively reclassified as “Assets classified as held for
sale” and “Liabilities associated with assets classified as held for sale” in the consolidated statement of financial
position as at December 31, 2016. Assets and liabilities of these activities have been valued at their fair value less
potential costs of sale of the assets.
NOTE 12. EARNINGS PER SHARE
12.1. DISTRIBUTABLE EARNINGS
In thousands of euros Dec 31, 2015 Restated Dec 31, 2016
Continuing operations Basic earnings from continuing operations attributable to owners of the parent (excluding minority shareholders) 51,318 202,502
(-) Basic earnings attributable to preferential owners Earnings from continuing operations distributable to shareholders of the Company, used for the calculation of the earnings per share 51,318 202,502
Earnings from discontinued operations distributable to shareholders of the Company, used for the calculation of the earnings per share (6,037) (18,482)
Total operations Basic earnings from continuing operations attributable to owners of the parent (excluding minority shareholders) 45,281 184,020
(-) Basic earnings attributable to preferential owners Earnings distributable to shareholders of the Company, used for the calculation of the earnings per share 45,281 184,020
12.2. NUMBER OF SHARES
Dec 31, 2015 Restated Dec 31, 2016
Average number of shares used for the calculation of earnings per share 127,544,489 154,076,156 Effect of the diluting instruments - 312,899 Average number of diluted shares used for the calculation of earnings per share 127,544,489 154,389,054
In compliance with “IAS 33- Earnings per share”, the weighted average number of ordinary shares in the first half
of 2016 (and for all presently shown periods) has been adjusted to take into account events that impacted the
number of outstanding shares without having a corresponding impact on the entity’s resources.
SPIE CONSOLIDATED FINANCIAL STATEMENTS– FY 2016 – 43

During the period, SPIE has issued a new Free Performance Shares plan which consequently dilutes the average
number of shares (see Note 8.2).
12.3. EARNINGS PER SHARE
In thousands of euros Dec 31, 2015 Restated Dec 31, 2016
Continuing operations . Basic earnings per share 0.40 1.31 . Diluted earnings per share 0.40 1.31 Discontinued operations . Basic earnings per share (0.05) (0.12) . Diluted earnings per share (0.05) (0.12) Total operations . Basic earnings per share 0.36 1.19 . Diluted earnings per share 0.36 1.19
In 2016, the lowering of the income tax rate from 2020 on, as provided for by the French Finance Act of 2017 (see
Note 10.2) generates a positive amount of € 35.8 million on the Group net income (i.e. 0.23 € per share).
NOTE 13. DIVIDENDS
During the current period, the Group paid the dividends entitled for the 2015 period, representing a total amount
of € 77,038 thousand, which corresponds to a dividend of 50 cents per share.
Based on 2016 year’s results, the Board of Directors will propose to the General Shareholders’ Meeting to pay in
2017 a dividend of € 0.53 per share.
44 – SPIE CONSOLIDATED FINANCIAL STATEMENTS – FY 2016

Notes to the statement of financial position
The following notes relate to the assets and liabilities of continuing operations as at December 31, 2016.
Assets and liabilities of operations held for sale are presented in a separate line “Activities held for sale” in the
statement of financial position.
NOTE 14. GOODWILL
14.1. CHANGES IN GOODWILL
The following table shows the changes in carrying amount of goodwill by cash generating unit:
In thousands of euros Dec 31, 2015
Acquisitions and adjustments of
preliminary goodwill
Disposals Change in scope of
consolidation and other
Translation adjustments
Dec 31, 2016
CGU - SPIE Ile de France Nord-Ouest 275,688 275,688
CGU - SPIE Est 91,943 91,943 CGU - SPIE Sud Est 196,725 1,250 8 197,983 CGU - SPIE Sud Ouest 230,647 (1,414) 229,233 CGU - SPIE Ouest Centre 218,735 218,735 CGU - SPIE Communications 158,201 4,191 162,392 CGU - SPIE Holding GmbH 125,853 36,567 (41) 162,379 CGU - SPIE ICS 46,891 105 46,996 CGU - SPIE UK 198,191 12,480 (4,655) 206,016 CGU - SPIE Nederland 147,274 9,376 156,650 CGU - SPIE Belgium 77,762 537 78,299 UGT - SPIE Nucléaire 127,801 127,801 CGU - SPIE OGS 253,226 253,226 Total goodwill 2,148,937 64,401 - (1,414) (4,583) 2,207,341
Acquisitions and goodwill adjustments which occurred between January and December 2016 mainly relate to:
- The ongoing process of purchase price allocation for SPIE Sud Est related to the acquisition of Thermat
and Villanova in December 2015 for an amount of € 1,250 thousand;
- The temporary determination of goodwill related to the acquisition of the RDI Group by SPIE ICS
(formerly SPIE Communications) in May 2016, for an amount of € 4,191 thousand;
- The ongoing process of purchase price allocation for SPIE Holding GmbH related to:
o the acquisition of Comnet in September 2016 for a global amount of € 15,932 thousand;
o the acquisition of GfT in September 2016 for an amount of € 10,774 thousand;
o the acquisition of Hartmann in January 2016 for an amount of € 5,156 thousand;
o the acquisition of Agis in August 2016, for an amount of € 4,605 thousand.
- The ongoing process of purchase price allocation for SPIE UK related to the acquisition of Trios in
November 2016, for an amount of € 11,747 thousand, and to the addition price of Leven for € 733
thousand;
- The purchase price allocation for SPIE Nederland regarding the acquisition of:
o Alewijnse acquired in November 2016 for an amount of € 5,880 thousand ;
o Jansen Venneboer acquired in January 2016, for an amount of € 2,767 thousand;
SPIE CONSOLIDATED FINANCIAL STATEMENTS– FY 2016 – 45

o GPE Technical Services acquired in February 2016, for an amount of €729 thousand;
- The purchase price allocation for SPIE Belgium relating to the acquisition of CRIC, in June 2016, for a
global amount of €537 thousand.
The “Change in scope of consolidation” column includes the company Sono Technic held by SPIE Sud-Ouest and
which is now accounted for as a discontinued entity (see Note 11).
Currency translation adjustments mainly relate to:
- € 8 thousand for all Swiss entities within the SPIE Sud Est CGU;
- € 105 thousand for the Swiss company SPIE ICS;
- € (41) thousand for the Polish and Hungarian companies held by SPIE GmbH;
- And to € (4,655) thousands of currency translation impacts covering all entities of the SPIE UK CGU;
For comparative purpose, the carrying amounts of the Group goodwill as of December 31, 2015 were the
following:
In thousands of euros Dec 31,
2014
Acquisitions and
adjustments of preliminary
goodwill
Disposals Change in scope of
consolidation and other
Translation adjustments
Dec 31, 2015
CGU - SPIE Ile de France Nord-Ouest 275,688 275,688
CGU - SPIE Est 91,943 91,943 CGU - SPIE Sud Est 195,360 1,105 260 196,725 CGU - SPIE Sud-Ouest 230,647 230,647 CGU - SPIE Ouest Centre 218,735 218,735 CGU - SPIE Communications 158,201 158,201
CGU - SPIE GmbH 124,992 861 125,853 CGU – SPIE ICS 38,716 3,002 5,173 46,891 CGU - SPIE UK 187,947 8,137 2,107 198,191 CGU - SPIE Nederland 142,135 5,139 147,274 CGU - SPIE Belgium 77,762 77,762 CGU - SPIE Nucléaire 127,801 127,801 CGU - SPIE OGS 253,226 253,226 Total goodwill 2,123,153 18,244 - - 7,540 2,148,937
14.2. IMPAIRMENT TEST FOR GOODWILL
To carry out annual impairment tests, goodwill was allocated to the relevant Cash Generating Units (CGU); see
Note 3.10 “Impairment of goodwill”.
These tests are carried out in October of each year on the basis of the most recent budgets available. In 2016,
they were developed based on the Business Plan’s forecasts taking into account cash flows comprising a budget
Y+1, forecasts for the years Y+2 to Y+4 and projections for Y+5 and Y+6 (these additional years are extrapolated
from forecasts) in which is added a terminal value, calculated with a growth rate of 1.60% (in 2015: 1.50 %.)
As the SPIE UK CGU operates outside the Eurozone, the future cash flows are estimated in GBP and then
discounted using the Group’s discount rate. All other CGUs estimate their future cash flows in euros.
The discount rates after tax for all CGUs amount to 7.50 % (2015: 7.6%) for all CGUs.
46 – SPIE CONSOLIDATED FINANCIAL STATEMENTS – FY 2016

Sensitivity Test
The value in use is mainly driven by the terminal value which is sensitive to changes in the assumptions regarding
discount rates and the cash flows generated.
Critical assumptions of the business plan and multiannual forecasts correspond to any reasonably possible
changes.
The value of all operating segments subject to impairment testing is higher than the book value. The sensitivity to
indicators used are the followings: a decrease by 0.1% of the long term growth rate, a decrease by 0.5% of the
margin level expected for the terminal year, and an increase by 0.5% of the discount rate (WACC). These tests
show:
- For the Swiss businesses of the Group which have been reorganized during the year 2016 in order to be
gathered under a unique CGU, value losses which could arise to € (5.6) million in case the EBIT margin
would decrease by 50 bps in 2021 and terminal year.
- For the Morocco CGU, a loss in value in case the EBIT margin would decrease by 50 bps in 2021 and
terminal year, yet the loss is less significant: € (1.5) million.
Pending the achievement of the reasonably expected forecasts, it has been decided not to impair the related
goodwills, but to keep these CGUs under surveillance for 2017.
SPIE CONSOLIDATED FINANCIAL STATEMENTS– FY 2016 – 47

NOTE 15. INTANGIBLE ASSETS
15.1. INTANGIBLE ASSETS – GROSS VALUES
In thousands of euros Concessions,
patents, licenses
Brands Backlog and
customer relationship
Others Total
Gross value At Dec 31, 2014 7,161 755,010 147,434 74,401 984,006 Business combination effect (1,589) 15,241 115 13,767 Other acquisitions in the period 448 7,831 8,279 Disposals in the period (1) (11) (12) Exchange difference (15) 1,329 1,141 425 2,880 Other movements (821) 240 (580) Assets held for sale (106) (106) At Dec 31, 2015 6,772 754,750 163,816 82,895 1,008,233 Business combination effect 8 1,595 11,243 279 13,125 Other acquisitions in the period 562 19,336 19,898 Disposals in the period (538) (4,728) (5,266) Exchange difference 7 (1,331) (2,477) (472) (4,273) Other movements 635 (463) 172 Assets held for sale - At Dec 31, 2016 7,446 755,013 172,582 96,847 1,031,888
Period ended December 31, 2016
Brands mainly correspond to the value of the SPIE brand for € 731 million, which has an indefinite useful life and
is tested for impairment at least once a year or whenever there is an indication of impairment.
The SPIE brand is allocated to each of the cash generating units and is valued on the basis of an implied average
royalty rate, as a percentage of each CGU’s contribution to Group revenues.
The line “Business combination effect”, which concerns the brands, and backlog and customer relationships,
corresponds to the impacts of the ongoing purchase price allocation processes which led to:
- The temporary allocation of Hartmann GmbH’ goodwill for an amount of € 1,595 thousand in brand,
€ 532 thousand in backlog and € 4,546 in customer relationship asset;
- The temporary allocation of CRIC’s Goodwill for an amount of € 72 thousand in backlog and €1,535
thousand in customer relationship asset;
- The temporary allocation of RDI’s goodwill for an amount of € 62 thousand in backlogs and € 3,928
thousand in customer relationship asset;
- The temporary allocation of Jansen Venneboer’s goodwill for an amount of € 327 thousand in backlogs;
- The temporary allocation of GPE Technical Services’ goodwill for an amount of € 241 thousand in
customer relationship asset;
The “Other acquisitions in the period”, representing € 19,336 thousand, correspond to € 7,994 thousand of
intangible assets acquired in Germany for the SAP project, to € 2,789 thousand euros of other intangible assets
under development spread all over the Group and to € 8,553 thousand of other intangible assets across several
entities of the Group.
48 – SPIE CONSOLIDATED FINANCIAL STATEMENTS – FY 2016

15.2. INTANGIBLE ASSETS –AMORTIZATION AND NET VALUES
In thousands of euros Concessions
patents, licenses
Brands Backlog and
customer relationship
Others Total
(a) (b) Amortization At Dec. 31, 2014 (6,095) (41,890) (69,116) (53,774) (170,875) Amortization for the period (449) (17,662) (20,331) (7,972) (46,414) Reversal of impairment losses 1,799 90 1,889 Disposals in the period 1 11 12 Exchange difference 11 (1,519) (278) (76) (1,861) Other movements 905 (2) 903 Assets held for sale 106 106 At Dec. 31, 2015 (5,627) (59,273) (89,634) (61,707) (216,241) Amortization for the period (582) (13,786) (19,799) (7,333) (41,500) Reversal of impairment losses - Disposals in the period 531 369 900 Exchange difference (5) 1,331 812 144 2,283 Other movements 169 (133) 36 Assets held for sale - At Dec 31, 2016 (5,514) (71,727) (108,621) (68,660) (254,521) Net value At Dec. 31, 2014 1,066 713,120 78,319 20,626 813,131 At Dec. 31, 2015 1,145 695,477 74,182 21,188 791,992 At Dec. 31, 2016 1,932 683,286 63,961 28,188 777,366
Period ended December 31, 2016
In 2016, the amortizations of intangible assets relating to the purchase price allocation (PPA) amount to € 33,585
thousand. The detail is presented hereafter:
(a) The amortization of the brands SPIE Matthew Hall for € 10,882 thousands consequently to the 3 year
amortization plan initiated in September 1, 2013, Juret for € 1,719 thousand (amortization ended in
2016), Hartmann for € 558 thousand (amortization over 3 years), Fleischhauer for € 431 thousand
(amortization over 4 years) and Veepee for € 196 thousand (amortization over 6 years.
(b) The amortization of the CRA (customer relationship asset) mainly corresponds to SPIE GmbH for
€ 6,223 thousand, to Leven Energy Services for € 2,565 thousand, to SPIE ICS (formerly Connectis) for
€ 1,874 thousand, to Infrastructure Services & Projects for € 1,633 thousand, to Fleischhauer for € 903
thousand, to Hartmann for € 750 thousand, to RDI for € 731 thousand, to Scotshield for € 540 thousand,
to Numac for € 540 thousand, to GVDD for € 513 thousand, to CRIC for € 216 thousand, to ENS Limited
for € 247 thousand, to Devis for € 165 thousand, and to GPE Technical Services for € 66 thousand;
The amortization of backlogs for the current period mainly corresponds to the backlogs of SPIE GmbH
for an amount of € 1,763 thousand, of Hartmann for an amount of €532 thousand and for Jansen
Venneboer for an amount of € 327 thousand. Finally, the remaining € 213 thousand relate to SPIE ICS
(formerly Connectis), CRIC, RDI and Scotshield altogether.
SPIE CONSOLIDATED FINANCIAL STATEMENTS– FY 2016 – 49

NOTE 16. PROPERTY, PLANT AND EQUIPMENT
16.1. PROPERTY, PLANT AND EQUIPMENT – GROSS VALUES
In thousands of euros Land Buildings Plant and machinery Others Total
Gross value At Dec 31, 2014 6,589 48,202 127,337 144,312 326,440 Business combination effect 229 5,432 5,661 Other acquisitions of the period 30 4,227 9,281 15,224 28,762 Disposals of the period (17) (3,066) (4,310) (7,239) (14,633) Exchange differences 327 204 333 618 1,481 Other movements (2,401) (3,178) (2,333) (7,913) Assets held for sale (3) (30) (411) (444) At Dec 31, 2015 6,929 47,390 129,432 155,604 339,356 Business combination effect 58 1,063 4,083 5,204 Other acquisitions of the period 3,141 7,814 12,924 23,879 Disposals of the period (663) (8,930) (23,989) (33,582) Exchange differences 14 (559) 348 (1,071) (1,267) Other movements (2,508) (2,900) 142 (4,252) (9,519) Assets held for sale (12) (12) At Dec 31, 2016 4,435 46,467 129,868 143,288 324,059
Other property, plant and equipment mainly correspond to office and computer equipment and transport
equipment.
16.2. PROPERTY, PLANT AND EQUIPMENT – DEPRECIATION & NET VALUES
In thousands of euros Land Buildings Plant and machinery Others Total
Depreciation At Dec 31, 2014 - (25,493) (86,552) (106,085) (218,129) Depreciation of the period (3,504) (10,984) (14,327) (28,815) Reversal of impairment losses 181 107 216 504 Disposals of the period 2,589 3,675 5,127 11,391 Exchange differences 83 (86) (528) (532) Other movements 1,917 3,099 956 5,972 Assets held for sale 1 12 334 347 At Dec 31, 2015 (24,224) (90,730) (114,307) (229,261) Depreciation of the period (1) (2,995) (11,010) (14,334) (28,341) Reversal of impairment losses 205 47 8 259 Disposals of the period 325 8,648 20,687 29,660 Exchange differences 50 (347) 652 355 Other movements 1,779 791 610 3,180 Assets held for sale 12 12 At Dec 31, 2016 (1) (24,861) (92,602) (106,672) (224,136) Net value At Dec 31, 2014 6,589 22,709 40,785 38,228 108,311 At Dec 31, 2015 6,929 23,166 38,702 41,297 110,095 At Dec 31, 2016 4,434 21,607 37,266 36,616 99,923
50 – SPIE CONSOLIDATED FINANCIAL STATEMENTS – FY 2016

Finance leases
Fixed assets include assets financed by the Group through finance leases. These properties have net values of:
In thousands of euros Dec 31, 2015 Dec 31, 2016 Land 1,636 1,662 Buildings 4,084 3,832 Plants and machinery 5,685 5,288 Others 4,284 7,064 Net amount of assets financed through finance lease 15,689 17,845
NOTE 17. EQUITY
17.1. SHARE CAPITAL
As at December 31, 2016 the share capital of SPIE SA stands at 72,415,793.32 euros divided into 154,076,156
ordinary shares, all of the same class, with a nominal value of 0.47 euro.
No operation took place on the SPIE SA share capital since January 1, 2016.
The allocation of SPIE SA capital’s ownership is as follows:
Holding percentage
Total Consortium (1) 25.5%
Caisse de dépôt et placement du Québec 13.2%
Managers (2 7.8%
Employee shareholding (3) 3.9%
Public (4) 49.6%
Treasury shares 0.0%
Total 100.0% (1) Clayax Acquisition Luxembourg 5 SCA is held at 78.8 % by funds controlled, managed or advised by Clayton, Dubilier & Rice and at 21.2 % by funds controlled, managed or advised by Ardian. (2) Managers and senior executives, current and former, of the Group (as at December 31, 2016). (3) Stake held by the Group employees, directly or through the FCPE SPIE Actionnariat 2011/2016 (as at December 31, 2016).
(4) Based on the information disclosed on December 31, 2016 for the shares held by managers and employees.
17.2. FREE PERFORMANCE SHARES
The current Performance Shares Plan grants, under certain conditions, free shares in favor of corporate officers
or employees of the Group (refer Note 3.18 and Note 8.2).
As a non-cash transaction, benefits granted are recognized as an expense over the vesting period in return for an
increase in equity for an amount of €1,752 thousands relating to the year 2016.
SPIE CONSOLIDATED FINANCIAL STATEMENTS– FY 2016 – 51

NOTE 18. PROVISIONS
18.1. PROVISIONS FOR EMPLOYEE BENEFIT OBLIGATIONS
Employee benefits relate to retirement benefits, pension obligations and other long-term benefits mainly relate to
length-of-service awards.
In thousands of euros Dec 31, 2015 Dec 31, 2016
Retirement benefits 256,541 275,008 Other long-term employee benefits 15,812 16,966 Employee benefits 272,353 291,974
2015 Restated 2016
Expense recognized through income in the period Retirement benefits 14,963 13,025 Other long-term employee benefits 1,112 2,618 Total 16,076 15,643
The obligations of the French entities account for approximately 47% of the total commitment. The remaining 53%
mainly comprises commitments in the German (35%), Swiss (18%), Dutch, and Belgian subsidiaries and relates
to the local obligations for employee retirement benefits.
Actuarial assumptions
The actuarial assumptions used to estimate the retirement benefits of the French entities are as follows:
Dec 31, 2015 Dec 31, 2016
Discount rate 2.00% 1.50% Type of retirement Voluntary departure Voluntary departure
Age of retirement
Upon acquiring the necessary entitlements to retire on full benefits
(in accordance with the 2013 law reform)
+ later retirement scheme
Upon acquiring the necessary entitlements to retire on full benefits (in accordance with the 2013 law reform)
+ later retirement scheme
Future salary increase 3.25 % for executive staff 2.75 % for executive staff 2.75 % for non-executive staff 2.00 % for non-executive staff Generated average rate of turnover Tables identical to 2012 Tables identical to 2012 Executive staff: 3.9% Executive staff: 3.8% Non-executive staff: 3.3 % Non-executive staff: 3.3 % Rate of employer's social charges 50% 50% Mortality table TM / TW 00-02 TM / TW 00-02 Age at start of career (in years) Executive staff: 23 years old Executive staff: 23 years old
Non-executive staff: 20 years old Non-executive staff: 20 years old
The actuarial assumptions used to estimate the retirement benefits of the German entities are as follows:
Dec 31, 2015 Dec 31, 2016
Discount rate 2.60% 1.95% Type of retirement Voluntary departure Voluntary departure
Age of retirement 62 years old (63 under exception)
62 years old (63 under exception)
Future salary increase 3.25 % for all staff 2.75 % for all staff Generated average rate of turnover Average rate: 5% Average rate: 5% For all categories of staff For all categories of staff Mortality table RT Heubeck 2005G RT Heubeck 2005G
52 – SPIE CONSOLIDATED FINANCIAL STATEMENTS – FY 2016

The actuarial assumptions used to estimate the retirement benefits of the Swiss entities are as follows:
Dec 31, 2015 Dec 31, 2016
Discount rate 0.70% 0.40% Type of retirement Voluntary departure Voluntary departure
Age of retirement Males : 65 years old Females : 64 years old
Males : 65 years old Females : 64 years old
Future salary increase 1.50% for all staff 1.50% for all staff Generated average rate of turnover Official charts BVG 2010 Official charts BVG 2010 Choice of lump-sum payments at departure date
Males : 25% Females : 25%
Males : 25% Females : 25%
Mortality table BVG 2010 GEN BVG 2015 GEN Age at start of career (in years) 25 years olds for all staff 25 years olds for all staff
Post-employment benefits
Changes in the provision are as follows:
In thousands of euros 2015 2016 Of which France
Of which Germany
Of which Switzerland
Of which others
Benefit liability as of January 1st 244,278 256,542 131,789 75,459 48,718 576 Impacts of IAS 19 Amended Effect of changes in the scope of consolidation 1,013 350 338 12
Operations discontinued or held for sale Expense for the period 14,963 13,025 5,120 6,075 1,718 111 Actuarial gain or loss to be recognized in OCI 2,447 14,760 (3,502) 15,289 2,401 572
Benefits paid (10,143) (5,822) (4,867) (953) Contributions paid to the fund (256) (3,956) 250 (4,000) (206) Currency translation differences 4,239 109 (1) 110 Other changes - Benefit obligation as of December 31 256,541 275,008 129,128 95,881 48,947 1,053
The expense in the financial year is analyzed as follows:
In thousands of euros 2015 Restated 2016 Of which
France Of which
Germany Of which
Switzerland Of which
others Service Cost during the year Current service cost 13,873 19,281 9,062 4,146 5,973 100 Past service costs (plan, changes and reductions) (263) (4,565) (4,565)
Plan curtailments/settlements (3,493) (6,380) (6,380) Net interest Expense Interest expense 7,666 6,934 2,650 3,361 825 97 Expected return on assets (2,820) (2,244) (212) (1,432) (514) (86) Expense in the period 14,963 13,025 5,120 6,075 1,719 111 of which: . Personal costs 10,380 8,335 2,682 4,146 1,408 100 . Financial costs 4,846 4,689 2,438 1,929 311 11
The reconciliation with the financial statements is provided below:
In thousands of euros 2015 2016 Of which France
Of which Germany
Of which Switzerland
Of which others
Projected Benefit Obligation liability 403,307 426,419 138,838 154,330 126,613 6,638 Plan assets 146,766 151,410 9,710 58,449 77,666 5,585 Benefit obligation 256,541 275,009 129,128 95,881 48,946 1,053
SPIE CONSOLIDATED FINANCIAL STATEMENTS– FY 2016 – 53

Sensitivity to changes in discount rates
The table below shows the sensitivity of the obligation with discount rates of +/-0.25% and +/-0.50% for the
French entities:
Rate 1.00% 1.25% 1.50% 1.75% 2.00% Present benefit obligation - Dec 31, 2016 127,697 123,414 119,336 115,449 111,745
Difference - In thousands of euros 8,361 4,078 -3,887 -7,591 Difference - % 7.01% 3.42% -3.26% -6.36%
Numbers given in thousands of euros
The table below shows the sensitivity of the obligation with discount rates of +/-0.25% and +/-0.50% for the German entities:
Rate 1.45% 1.70% 1.95% 2.20% 2.45% Present benefit obligation - Dec 31, 2016 172,889 163,229 154,297 146,035 138,384
Difference - In thousands of euros 18,592 8,932 -8,262 -15,913 Difference - % 12,05% 5,79% -5,35% -10,31%
Numbers given in thousands of euros
The table below shows the sensitivity of the obligation with discount rates of +/-0.25% and +/-0.50% for the Swiss
entities:
Rate -0.10% 0.15% 0.40% 0.65% 0.90% Present benefit obligation - Dec 31, 2016 139,079 132,698 126,612 120,964 115,570
Difference - In thousands of euros 12,467 6,086 -5,647 -11,042 Difference - % 9.85% 4.81% -4.46% -8.72%
Numbers given in thousands of euros
Other long-term employee benefits (length-of-service awards)
Changes in the provision are as follows:
In thousands of euros Dec 31, 2015 Dec 31, 2016
Benefit liability as of January 1st 15,099 15,812 Business combination 306 26 Disposals of companies and other assets Expense of the period 1,112 2,618 Benefits paid to beneficiaries (705) (1,491) Contributions paid to funds Benefit obligation as of December 31 15,812 16,965
There are no plan assets for other long-term employee benefits.
54 – SPIE CONSOLIDATED FINANCIAL STATEMENTS – FY 2016
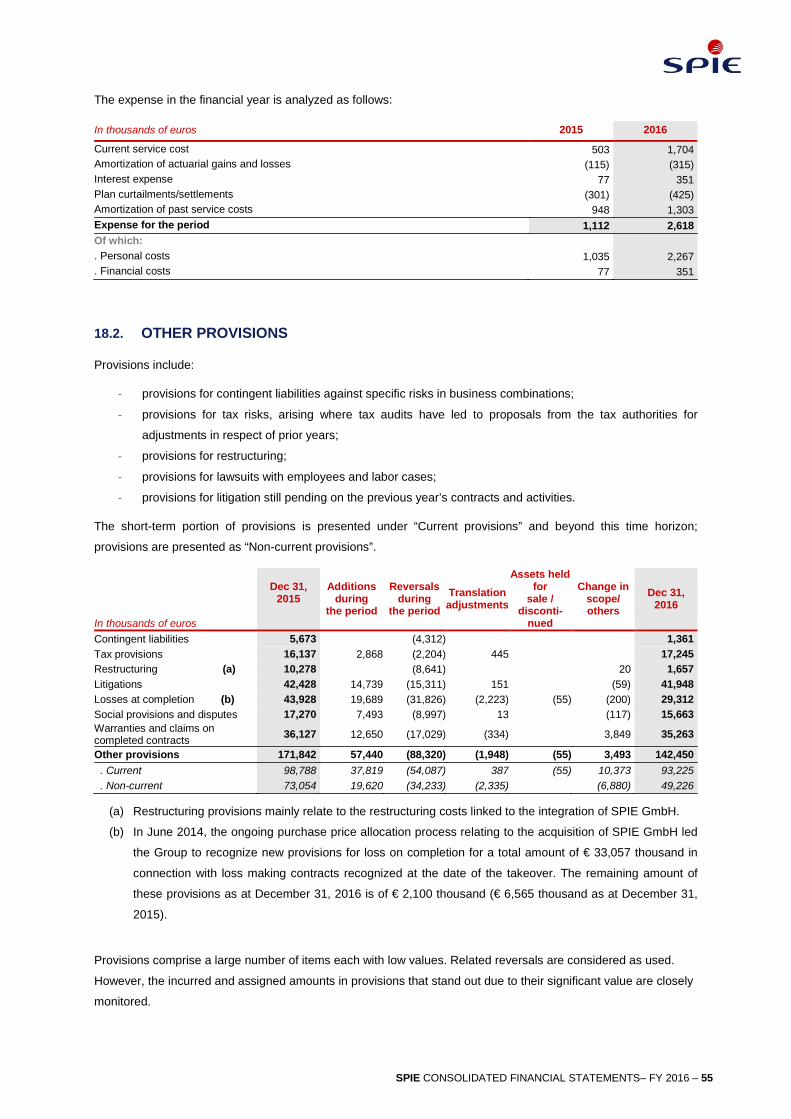
The expense in the financial year is analyzed as follows:
In thousands of euros 2015 2016
Current service cost 503 1,704 Amortization of actuarial gains and losses (115) (315) Interest expense 77 351 Plan curtailments/settlements (301) (425) Amortization of past service costs 948 1,303 Expense for the period 1,112 2,618 Of which: . Personal costs 1,035 2,267 . Financial costs 77 351
18.2. OTHER PROVISIONS
Provisions include:
- provisions for contingent liabilities against specific risks in business combinations;
- provisions for tax risks, arising where tax audits have led to proposals from the tax authorities for
adjustments in respect of prior years;
- provisions for restructuring;
- provisions for lawsuits with employees and labor cases;
- provisions for litigation still pending on the previous year’s contracts and activities.
The short-term portion of provisions is presented under “Current provisions” and beyond this time horizon;
provisions are presented as “Non-current provisions”.
In thousands of euros
Dec 31, 2015
Additions during
the period
Reversals during
the period Translation adjustments
Assets held for
sale / disconti-
nued
Change in scope/ others
Dec 31, 2016
Contingent liabilities 5,673 (4,312) 1,361 Tax provisions 16,137 2,868 (2,204) 445 17,245 Restructuring (a) 10,278 (8,641) 20 1,657 Litigations 42,428 14,739 (15,311) 151 (59) 41,948 Losses at completion (b) 43,928 19,689 (31,826) (2,223) (55) (200) 29,312 Social provisions and disputes 17,270 7,493 (8,997) 13 (117) 15,663 Warranties and claims on completed contracts 36,127 12,650 (17,029) (334) 3,849 35,263
Other provisions 171,842 57,440 (88,320) (1,948) (55) 3,493 142,450 . Current 98,788 37,819 (54,087) 387 (55) 10,373 93,225 . Non-current 73,054 19,620 (34,233) (2,335) (6,880) 49,226
(a) Restructuring provisions mainly relate to the restructuring costs linked to the integration of SPIE GmbH.
(b) In June 2014, the ongoing purchase price allocation process relating to the acquisition of SPIE GmbH led
the Group to recognize new provisions for loss on completion for a total amount of € 33,057 thousand in
connection with loss making contracts recognized at the date of the takeover. The remaining amount of
these provisions as at December 31, 2016 is of € 2,100 thousand (€ 6,565 thousand as at December 31,
2015).
Provisions comprise a large number of items each with low values. Related reversals are considered as used.
However, the incurred and assigned amounts in provisions that stand out due to their significant value are closely
monitored.
SPIE CONSOLIDATED FINANCIAL STATEMENTS– FY 2016 – 55

On 2016, reversals of unused provisions amounted to € 4,786 thousand.
The breakdown into current and non-current by category of provisions for the current period is as follows:
In thousands of euros Dec 31, 2016 Non-current Current
Contingent liabilities 1,361 1,361 Tax provisions 17,245 5,106 12,139 Restructuring 1,657 1,657 Litigations 41,948 11,345 30,603 Losses at completion 29,312 19,029 10,283 Social provisions and disputes 15,663 6,939 8,724 Warranties and claims on completed contracts 35,263 5,445 29,818 Other provisions 142,450 49,226 93,225
For purposes of comparison, provisions accounted for as at December 31, 2015 were as follows:
In thousands of euros
Dec. 31, 2014
Additions during
the period
Reversals during
the period Translation adjustments
Assets held for
sale / disconti-
nued
Change in scope/ others
Dec. 31, 2015
Contingent liabilities 6,856 (1,183) 5,673 Tax provisions 14,387 5,628 (2,576) 4 (1,305) 16,137 Restructuring 20,409 3,000 (13,299) (8) 176 10,278 Litigations 52,398 12,872 (23,044) 162 39 42,428 Losses at completion 46,823 30,886 (35,224) 582 862 43,928 Social provisions and disputes 20,971 7,170 (10,900) 77 (47) 17,270 Warranties and claims on completed contracts 33,577 16,685 (15,873) 99 (163) 1,802 36,127
Other provisions 195,422 76,240 (102,099) 916 (163) 1,526 171,842 . Current 117,604 41,786 (63,238) 293 (163) 2,506 98,788 . Non-current 77,818 34,454 (38,861) 623 (980) 73,054
The breakdown into current and non-current by category of provisions for 2015 is as follows:
In thousands of euros Dec 31, 2015 Non-current Current
Contingent liabilities 5,673 5,673 Tax provisions 16,137 4,442 11,695 Restructuring 10,278 10,278 Litigations 42,428 10,563 31,866 Losses at completion 43,928 36,418 7,510 Social provisions and disputes 17,270 7,455 9,815 Warranties and claims on completed contracts 36,127 8,503 27,624 Other provisions 171,842 73,054 98,788
56 – SPIE CONSOLIDATED FINANCIAL STATEMENTS – FY 2016

NOTE 19. WORKING CAPITAL REQUIREMENT
Other changes of the period
In thousands of euros Notes Dec 31, 2015
Change in
Working capital related
to activity
Change in scope
Currency transla-tions &
fair values
Change in method
Dec 31, 2016
Inventories and receivables Inventories and work in progress (net) 24,935 (3,257) 3,970 (284) (811) 24,554 Trade receivables (a) 1,463,885 (79,202) 68,182 (14,528) (67,465) 1,370,872 Current tax receivables 24,904 1,224 1,677 (727) (118) 26,960 Other current assets (b) 227,112 (3,628) 6,755 (2,698) (1,180) 226,361 Other non-current assets (c) 8,552 (481) (3,600) 4,471 Liabilities Trade payables (d) (901,535) (8,839) (26,226) 11,307 145,285 (780,008) Income tax payable (28,340) (5,263) (2,921) 2,346 3,753 (30,425) Other long-term employee benefits (e) (15,812) (2,956) (26) 1,828 (16,966) Other current liabilities (f) (1,181,186) (2,806) (41,311) 7,944 6,236 (1,211,123) Other non-current liabilities (8,110) 1,367 0 317 359 (6,066) Working capital requirement (385,593) (103,841) 10,099 3,677 84,287 (391,371)
(a) Receivables include accrued income.
(b) The other current assets mainly include tax receivables and accrued expenses recognized on contracts
accounted according to the percentage of completion method.
(c) Other non-current assets mainly correspond to exercisable vendor warranties. They represent the
amount identified in business combinations that can be contractually claimed from vendors. The “other
non-current assets” as per working capital requirements do not include the uncalled subscribed capital
included in the consolidated balance sheet.
(d) Trade and other payables include accrued invoices.
(e) Other long-term employee benefits correspond to length-of-service awards.
(f) The detail of the other current liabilities is presented below:
In thousands of euros Dec 31, 2015 Dec 31, 2016
Deferred revenue and advance payments (349,151) (364,043) Social and tax liabilities (571,753) (561,924) Others (260,281) (285,156) Other current liabilities* (1,181,186) (1,211,123) * The “other current liabilities” as per working capital requirements do not include the dividends to be paid included in the consolidated balance
sheet.
SPIE CONSOLIDATED FINANCIAL STATEMENTS– FY 2016 – 57

19.1. CHANGE IN WORKING CAPITAL: RECONCILIATION BETWEEN BALANCE SHEET AND CASH FLOW STATEMENT
The reconciliation between the working capital accounts presented in the balance sheet and the change in
working capital presented in the cash flow statement is detailed hereafter:
Other movements of the period
In thousands of euros Dec 31, 2015
Change in W.C.
related to activity
Change in scope
Currency transla-
tion & fair values
Change in method
Dec 31, 2016
Working Capital (385,593) (103,841) 10,099 3,677 84,287 (391,371) (-) Accounts payables on purchased assets
8,991 (717) 1,461 (751) (591) 8,394
(-) Tax receivables (24,919) (1,234) (1,677) 727 118 (26,985)
(-) Tax payables 28,340 5,302 2,921 (2,346) (3,644) 30,573 Working capital excl. acc. payables on purchased assets, excl. tax receivables and payables
(373,182) (100,489) 12,804 1,307 80,170 (379,388)
(-) Assets held for sale 4,127 (-)other non-cash operations which impact the working capital as per balance sheet (*)
(2,644)
Changes in Working Capital as presented in C.F.S (99,006)
(*) The “other non-cash operations which impact the working capital as per balance sheet” relate to the
neutralization of the non-cash impacts following the change in consolidation method of Sonaid, after the loss of
control.
19.2. FRENCH TAX CREDIT FOR COMPETITIVENESS AND EMPLOYMENT (CICE)
The French Government’s new tax credit for competitiveness and employment (Crédit d’Impôt pour la
Compétitivité et l’Emploi - CICE) entered into force on January 1, 2013 for all French companies submitted to tax
payment. The CICE tax credit amounts to 6% of gross payroll for compensation equal to or below 2.5 times the
minimum legal wage of € 1,466 per month since January 1st, 2016.
The CICE receivable from the State recognized as a current asset is based on payments and on liabilities
recognized related to eligible remunerations in 2016. The CICE is directly charged to the Corporate Tax of the
year and of the three following years. At the end of the period, the unused balance will be paid back by the State.
The tax loss carry forwards generated by the French holdings do not allow considering the recovery of the CICE
claim prior to three years of imputation. Thus, on December 8, 2016 the board of directors of SPIE SA authorized
the discounted non-recourse sale of the CICE receivable to Natixis, according to the applicable French Dailly Law
(loi Dailly).
On December 23, 2016, the Group has made a partial divesture of its CICE receivable of € 26,566 thousand for
the 2016 CICE and of € 542 thousand remaining from the 2015 CICE not divested in 2015.
58 – SPIE CONSOLIDATED FINANCIAL STATEMENTS – FY 2016

19.3. TRADE AND OTHER RECEIVABLES
Current trade and other receivables break down as follows:
Dec 31, 2016
In thousands of euros Dec 31,
2015 Gross Impairment Net
Trade receivables (a) 1,019,083 927,354 (33,156) 894,198 Notes receivables 5,699 4,690 4,690 Accrued income (b) 439,103 471,984 471,984 Trade and other receivables 1,463,885 1,404,028 (33,156) 1,370,872
(a) As at December 31, the ageing analysis of net trade receivables is as follows :
Past due per maturity
In thousands of euros Dec 31 Not past due < 6 months 6 to 12 months > 12 months
2016 894,198 723,130 142,046 22,628 6,394 2015 1,019,083 770,869 191,951 41,370 14,893
(b) Accrued income stems mainly from contracts being recorded using the percentage of completion method.
Trade receivables past due but not impaired mainly correspond to public sector receivables.
19.4. ACCOUNTS PAYABLE
Current trade and other payables break down as follows:
In thousands of euros Dec 31, 2015 Dec 31, 2016
Accounts payables 573,727 467,033 Notes payables 30,718 40,847 Accrued invoices 297,091 272,128 Accounts payable 901,535 780,008
NOTE 20. FINANCIAL ASSETS AND LIABILITIES
20.1. NON-CONSOLIDATED SHARES
As at December 31, 2016 non-consolidated shares stand as follows:
In thousands of euros 31 déc. 2015 31 déc. 2016
Equity securities 4,374 19,712 Depreciation of securities (1,073) (1,074) Net value of securities 3,300 18,638
As at December 31, 2016, securities include the shares of following companies: Environmental Engineering
Limited acquired on November 30, 2016 in the United Kingdom for an amount of € 7,943 thousand, Tevean
SPIE CONSOLIDATED FINANCIAL STATEMENTS– FY 2016 – 59

acquired on December 6, 2016in the Netherlands for an amount of € 7,500 thousand, and Aaftink acquired on
December 8, for an amount of € 2,200 thousand. These companies will be consolidated in 2017 (see Note 6.1).
Furthermore, the amounts of December 2016 include the shares of Serec, held by SPIE Enertrans, which were
full depreciated for an amount of € 676 thousand. During 2016, there were no significant change on the Group’s
other equity securities.
20.2. NET CASH AND CASH EQUIVALENTS
As at December 31, 2016 net cash and cash equivalents break down as follows:
In thousands of euros Notes Dec 31, 2015 Dec 31, 2016
Marketable securities – Cash equivalents 245,777 5,500 Fixed investments (current) - - Cash management financial assets 245,777 5,500 Cash and cash equivalents 358,013 560,157 Total cash and cash equivalents 603,789 565,657 (-) Bank overdrafts and accrued interests (53,197) (40,129) Net cash and short term deposits of the Balance Sheet 550,592 525,528 Cash and cash equivalents from discontinued operations (a) 1,418 (6,972) Accrued interests not yet disbursed (210) (23) Cash and cash equivalents from the CFS at the end of the period 551,800 518,533
(a) Cash and cash equivalents exclude the cash and cash equivalents relating to assets classified as held
for sale which are mainly composed of cash and cash equivalents from SPIE Maroc for an amount of
€ (8,344) thousand, from Foraid Algérie for an amount of € 899 thousand, from SPIE IFS SA for an
amount of € 529 thousand, from Sono Technic for an amount of € (65) thousand and Advago for an
amount of € 9 thousand, hence a total amount of € (6,972) thousand.
20.3. BREAKDOWN OF DEBT
Interest-bearing loans and borrowings break down as follows:
In thousands of euros Notes Dec 31, 2015 Dec 31, 2016
Loans and borrowings from banking institutions Facility A (a) 1,125,000 1,125,000 Revolving (maturity May 11, 2020) (a) 50,000 - Others 386 2,524 Capitalization of loans and borrowing costs (b) (14,525) (11,353) Securitization (c) 286,917 287,783 Total bank overdrafts (cash liabilities) Bank overdrafts (cash liabilities) 53,083 39,986 Interests on bank overdrafts (cash liabilities) 114 143 Other loans, borrowings and financial liabilities Finance leases 12,136 14,006 Accrued interest on loans 3 77 Other loans, borrowings and financial liabilities 4,114 940 Derivatives 309 134 Interest-bearing loans and borrowings 1,517,537 1,459,240 Of which
. Current 395,734 332,293
. Non-current 1,121,803 1,126,947
60 – SPIE CONSOLIDATED FINANCIAL STATEMENTS – FY 2016
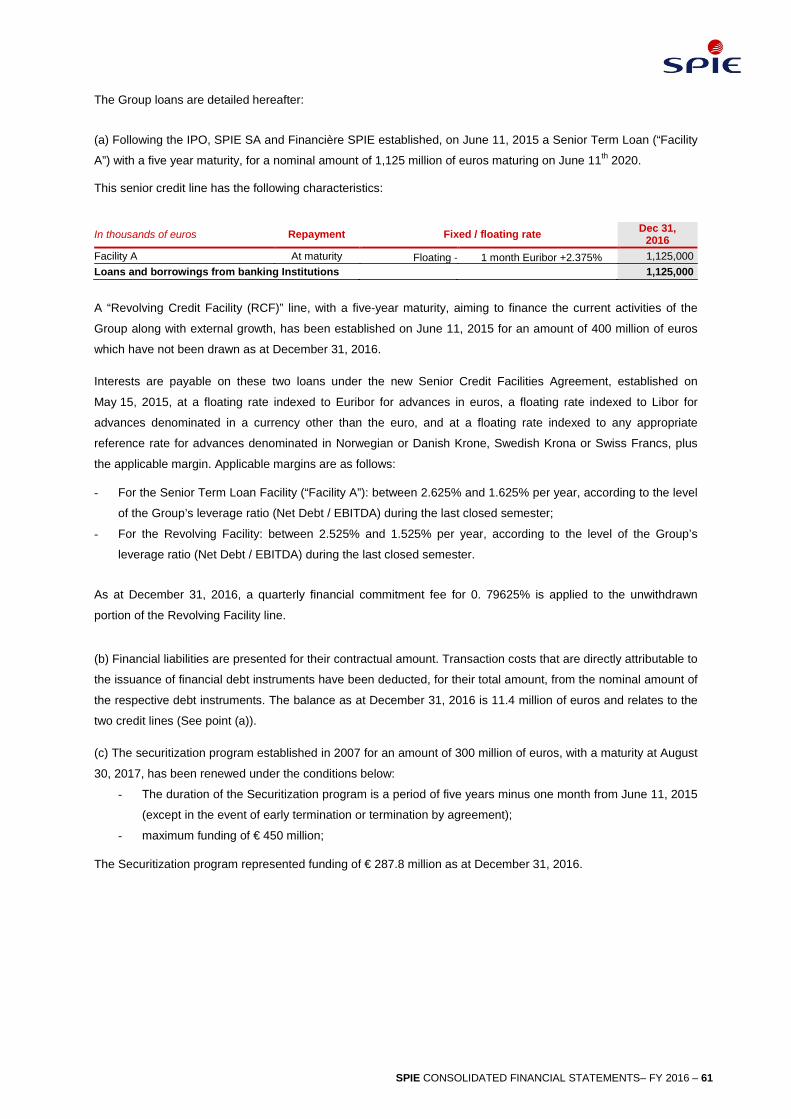
The Group loans are detailed hereafter:
(a) Following the IPO, SPIE SA and Financière SPIE established, on June 11, 2015 a Senior Term Loan (“Facility
A”) with a five year maturity, for a nominal amount of 1,125 million of euros maturing on June 11th 2020.
This senior credit line has the following characteristics:
In thousands of euros Repayment Fixed / floating rate Dec 31, 2016
Facility A At maturity Floating - 1 month Euribor +2.375% 1,125,000 Loans and borrowings from banking Institutions 1,125,000
A “Revolving Credit Facility (RCF)” line, with a five-year maturity, aiming to finance the current activities of the
Group along with external growth, has been established on June 11, 2015 for an amount of 400 million of euros
which have not been drawn as at December 31, 2016.
Interests are payable on these two loans under the new Senior Credit Facilities Agreement, established on
May 15, 2015, at a floating rate indexed to Euribor for advances in euros, a floating rate indexed to Libor for
advances denominated in a currency other than the euro, and at a floating rate indexed to any appropriate
reference rate for advances denominated in Norwegian or Danish Krone, Swedish Krona or Swiss Francs, plus
the applicable margin. Applicable margins are as follows:
- For the Senior Term Loan Facility (“Facility A”): between 2.625% and 1.625% per year, according to the level
of the Group’s leverage ratio (Net Debt / EBITDA) during the last closed semester;
- For the Revolving Facility: between 2.525% and 1.525% per year, according to the level of the Group’s
leverage ratio (Net Debt / EBITDA) during the last closed semester.
As at December 31, 2016, a quarterly financial commitment fee for 0. 79625% is applied to the unwithdrawn
portion of the Revolving Facility line.
(b) Financial liabilities are presented for their contractual amount. Transaction costs that are directly attributable to
the issuance of financial debt instruments have been deducted, for their total amount, from the nominal amount of
the respective debt instruments. The balance as at December 31, 2016 is 11.4 million of euros and relates to the
two credit lines (See point (a)).
(c) The securitization program established in 2007 for an amount of 300 million of euros, with a maturity at August
30, 2017, has been renewed under the conditions below:
- The duration of the Securitization program is a period of five years minus one month from June 11, 2015
(except in the event of early termination or termination by agreement);
- maximum funding of € 450 million;
The Securitization program represented funding of € 287.8 million as at December 31, 2016.
SPIE CONSOLIDATED FINANCIAL STATEMENTS– FY 2016 – 61

20.4. NET DEBT
The financial reconciliation between consolidated financial indebtedness and net debt as reported is as follows: In millions of euros Dec 31, 2015 Dec 31, 2016
Loans and borrowings as per balance sheet 1,517.5 1,459.2 Capitalized borrowing costs 14.5 11.4 Others (1.0) (0.7) Gross financial debt (a) 1,531.0 1,469.9 Cash management financial assets as per balance sheet 245.8 5.5 Cash and cash equivalents as per balance sheet 358.0 560.2 Accrued interests (0.3) 0.1 Cash held in discontinued activities 1.4 (7.0) Gross cash (b) 604.9 558.8 Consolidated net debt (a) - (b) 926.1 911.1 Net cash in non-consolidated entities (1.6) (1.7) Net debt 924.5 909.4
20.5. RECONCILIATION WITH THE CASH FLOW STATEMENT POSITIONS
The reconciliation between the financial debt of the Group (see Note 20.3) and the cash flows presented in the
cash flow statement (see Chart 4) is detailed hereafter:
Cash flows (corresponding to the CFS)
Non-cash flows
In thousands of euros
Dec 31, 2015
Loan issue
Loan repay-ments
Changes Changes in scope
Others (*)
Currency and fair
values changes
Changes in
methods Dec 31,
2016
Bank loans 1,447,778 918 (51,690) 3,796 3,172 (19) 1,403,954 Other debts and liabilities 4,113 13 (3,625) 474 (35) 940
Finance Leases 12,136 (8,559) 1,433 9,088 (92) 14,006 Financial instruments 309 4 (179) 134
Financial indebtedness as per C.F.S
1,464,337 931 (63,874) 5,701 12,264 (325) 1,419,034
(-) Financial interests 3 74 77
(+) Bank overdrafts 53,197 (12,470) 2,147 5 (2,750) 40,129 Consolidated financial indebtedness
1,517,537 1,005 (63,874) (12,470) 7,848 12,264 (320) (2,750) 1,459,240
(*) the « Others » non-cash movements relate to the restatement of borrowing costs on one hand, and on the
other hand to the new finance lease contracts.
62 – SPIE CONSOLIDATED FINANCIAL STATEMENTS – FY 2016

20.6. SCHEDULED PAYMENTS FOR FINANCIAL LIABILITIES
The scheduled payments for financial liabilities based on the capital redemption table are as follows:
In thousands of euros Less than 1 year From 2 to 5 years Over 5 years Dec 31, 2016
Loans and borrowings from banking institutions
Facility A 1,125,000 1,125,000 Revolving - Others 1,824 700 2,524 Capitalization of loans and borrowing costs (3,230) (8,123) (11,353) Securitization 287,783 287,783 Total Bank overdrafts (cash liabilities) Bank overdrafts (cash liabilities) 39,986 39,986 Interests on bank overdrafts (cash liabilities) 143 143 Other loans, borrowings and financial liabilities Finance leases 4,911 9,031 64 14,006 Accrued interest on loans 77 77 Other loans, borrowings and financial liabilities 665 241 34 940 Derivatives 134 134 Interest-bearing loans and borrowings 332,293 1,126,849 98 1,459,240 Of which: . Fixed rate 38,967 7,912 98 46,977 . Variable rate 293,326 1,118,937 - 1,412,263
Future debt interest is broken down as follows:
In thousands of euros Dec 31,
2015 Dec 31,
2016 Less than 1
year From 2 to 5
years Over
5 years Expected interest on bank borrowings 120,641 105,503 29,160 76,343 Expected interest on finance lease borrowings 907 705 374 331 Total 121,548 106,208 29,534 76,674 -
The discounted value of future finance lease rental payments is as follows for each maturity date:
In thousands of euros Dec 31, 2015 Dec 31, 2016
2016 8,867 2016 3,459 5,985 2017 2,250 4,293 2018 1,767 3,944 2019 36 1,048 2020 0 51 Subsequent years 0 Total 16,378 15,322
The reconciliation between the minimum payments to be made in accordance with finance lease contracts and
the value of the corresponding financial debt is presented as follows:
In thousands of euros Dec 31, 2015 Dec 31, 2016
Minimum payments due on finance leases 16,378 15,322 Finance lease liabilities 12,136 14,006 Difference: Future Finance Lease Expenses 4,242 1,316
SPIE CONSOLIDATED FINANCIAL STATEMENTS– FY 2016 – 63

20.7. OTHER FINANCIAL ASSETS
In thousands of euros Dec 31, 2015 Dec 31, 2016
Non-consolidated shares and associated receivables (a) 3,334 18,672 Long-term borrowings 28,179 30,004 Derivatives 25 168 Long-term receivables from service concession arrangement ("PPP") 17,693 13,097 Long-term deposits and guarantees 4,222 4,099 Other 12 10 Other financial assets 53,466 66,050 Of which: . Current 8,540 7,629 . Non-current 44,925 58,421
(a) See Note 20.1 for further details.
20.8. FINANCIAL DISCLOSURES FROM COMPANIES ACCOUNTED FOR UNDER THE EQUITY METHOD
The companies of the Group accounted for under the equity method, following the IFRS 11 standard
requirements, are the following:
- Gietwalsonderhoudcombinatie (GWOC) BV held at 50% by SPIE Nederland
- Cinergy SAS held at 50% by SPIE Ile de France Nord-Ouest
- « Host GmbH (Hospital Service + Technik) » held at 25.1% by SPIE Holding GmbH
- AM Allied Maintenance GmbH held at 25% by SPIE Hartmann GmbH, which was acquired altogether
with the Hartmann group by SPIE GmbH in January 2016.
- Moreover, during the first half of 2016, the Group lost the decision-making control of the Sonaid
company held at 55%. Consequently, the integration method went from full consolidation to equity
method.
The carrying amount of the Group’s equity securities is as follows:
In thousands of euros Dec 31, 2015
Dec 31, 2016*
Value of shares at the beginning of the period 2,858 2,837 Business combinations - - Net income attributable to the Group 379 426 Dividends paid (400) (350) Value of shares at the end of the period 2,837 2,913 * Based on available 2015 information for Host GmbH and Allied Maintenance
Financial information relating to Group companies consolidated under the equity method is as follows:
In thousands of euros Dec 31, 2015
Dec 31, 2016*
Non-current assets 24,406 20,151 Current assets 184,900 122,220 Non-current liabilities (29,095) (35,728) Current liabilities (182,053) (113,431) Net asset (1,842) (6,788) Income statement Revenue 305,009 91,876 Net income (14,169) (2,591)
* Based on available 2015 information for Host GmbH and Allied Maintenance
64 – SPIE CONSOLIDATED FINANCIAL STATEMENTS – FY 2016

20.9. CARRYING AND FAIR VALUE OF FINANCIAL INSTRUMENTS BY ACCOUNTING CATEGORY
Reconciliation between accounting categories and IAS 39 categories
Assets FV P/L FV E AFS Receivables and loans
Amortized costs
Dec 31, 2016
Non-consolidated shares and long-term borrowings Other non-current financial assets 18,648 39,773 58,421 Other current financial assets (excl. derivatives) 4,633 4,633 Derivatives 7,461 7,461 Trade receivables 168 168 Other current assets 1,370,872 1,370,872 Cash and short-term deposits 226,361 226,361 Total - Financial assets 5,500 560,157 565,657 Liabilities 5,500 168 18,648 2,209,312 2,233,574 Borrowings and loans (excl. derivatives) Derivatives 1,126,813 1,126,813 Other long-term liabilities 134 134 Current interest-bearing loans and borrowings 6,066 6,066 Trade payables 332,293 332,293 Other current liabilities 780,008 780,008 Total - Financial liabilities 1,211,062 1,211,062 Assets 134 3,456,243 3,456,377
FV P/L: fair value through Profit and Loss, FV E: fair value through Equity, AFS: available-for-sale assets.
Carrying value and fair value of financial instruments
Book value Fair value
In thousands of euros Dec 31, 2015 Dec 31, 2016 Dec 31, 2015 Dec 31, 2016
Assets Non-consolidated shares and long-term borrowings 44,925 58,421 50,681 65,130 Other non-current financial assets 8,713 4,633 8,713 4,633 Other current financial assets (excl. derivatives) 8,513 7,461 8,513 7,461 Derivatives 25 168 25 168 Trade receivables 1,463,885 1,370,872 1,463,885 1,370,872 Other current assets 227,112 226,361 227,205 226,425 Cash and short-term deposits 603,790 565,657 603,790 565,657 Total - Financial assets 2,356,964 2,233,574 2,362,813 2,240,347 Liabilities Borrowings and loans (excl. derivatives) 1,121,495 1,126,813 1,121,495 1,126,813 Derivatives 309 134 309 134 Other long-term liabilities 8,110 6,066 8,110 6,066 Current interest-bearing loans and borrowings 395,734 332,293 395,734 332,293 Trade payables 901,535 780,008 901,535 780,008 Other current liabilities 1,181,416 1,211,062 1,181,416 1,211,062 Total - Financial liabilities 3,608,599 3,456,377 3,608,599 3,456,377
SPIE CONSOLIDATED FINANCIAL STATEMENTS– FY 2016 – 65

Classification by asset or liability level at fair value:
In thousands of euros Dec 31, 2016
Fair value Level 1 Level 2 Level 3
Assets Cash and short-term deposits 5,500 5,500 Derivatives 168 168 Total - Financial assets 5,668 5,500 168 0 Liabilities Derivatives 134 134 Total - Financial liabilities 134 134 0
- Level 1 corresponding to listed prices.
- Level 2 corresponding to internal model based on external observable factors.
- Level 3 corresponding to internal model not based external on observable factors.
NOTE 21. FINANCIAL RISK MANAGEMENT
21.1. DERIVATIVE FINANCIAL INSTRUMENTS
The Group is mainly exposed to interest rate, foreign exchange and credit risks within the framework of its export
activities. In the context of its risk management policy, the Group uses derivative financial instruments to hedge
risks related to fluctuations in interest rates and foreign exchange rates.
Forward rate agreement in foreign currency
Fair value (In
thousands of euros)
Under 1 year 1-2 years 2-3 years 3-4 years 4-5 years
Over 5 years Total
Asset derivatives qualified for designation as cash flow hedges (a) Forward purchases - USD 149 2,270 711 2,981 Forward sales - USD 8 8,534 8,534 Forward purchases - CHF 1 30 30 Forward sales - CHF 10 211 2,475 2,686 168 Liability derivatives qualified for designation as cash flow hedges (b) Forward purchase - USD (3) 373 373 Forward sales - USD (111) 4,000 4,000 Forward sales - CHF (16) 1,918 1,918 (130) Total net derivative qualified for designation as cash flow hedges (a) + (b)
39
Liability derivatives not qualified for designation as cash flow hedges Forward purchases - GBP (4) 112 112 (4) Total fair value of qualified and not qualified derivatives 34
Main derivatives deal with forward purchases and sales to cover operations in US Dollars and Swiss francs.
66 – SPIE CONSOLIDATED FINANCIAL STATEMENTS – FY 2016

These derivative hedging instruments are accounted for at their fair value. Their valuation stands at level 2
according to IFRS 13, as they are not listed on a regulated market, but based on a generic model and on
observable market data for similar transactions.
21.2. INTEREST RATE RISK
Financial assets or liabilities with a fixed rate are not subject to transactions intended to convert them into floating
rates. Interest rate risks on underlying items with floating rates are considered on a case-by-case basis. When the
decision is made to hedge these risks, they are hedged by SPIE Operations by means of an Internal Interest Rate
Shortfall Guarantee according to market conditions.
According to IFRS 13 relating to the credit risk to be taken into account when valuing the financial assets and
liabilities, the estimation made for derivatives is based on default probabilities from secondary market data (mainly
required credit spread) for which a recovery rate is applied.
As at December 31, 2016, given the evolution of variable rates (negative Euribor), no interest rate swap has been
established for the hedging of the existing loans. The Group examines the possibility to establish new swaps
during the first quarter of 2017.
21.3. FOREIGN EXCHANGE RISK
Foreign exchange risks associated with French subsidiaries’ transactions are managed centrally by the
intermediate holding, SPIE Operations:
- Through an Internal Exchange Shortfall Guarantee Agreement for currency flows corresponding to 100% of
SPIE Group’s operations
- By intermediation for currency flows corresponding to equity operations.
In both cases SPIE Operations hedges itself through forward contracts. Foreign exchange risks on calls for tender
are also hedged wherever possible by means of COFACE policies.
The Group’s exposition to the exchange risk relating to the US dollar, to the Swiss Franc and to the Sterling
pound is presented hereafter:
In thousands of euros December 31, 2016
Currencies USD (American Dollar)
CHF (Swiss Franc)
GBP (Sterling Pound)
Closing rate 1.0644 1.0747 0.8396 Risks 8,628 ,9,685 132,966 Hedges (8,605) (4,255) 149 Net positions excluding options 23 5,430 133,115
Sensitivity to the currency rate -10% vs Euro P&L Impact 957 1,076 14,728 Equity Impact 958 473 n/a
Sensitivity to the currency rate +10% vs Euro
P&L Impact (783) (880) (12,050) Equity Impact (784) (387) n/a
Impact on the Group reserves of the cash flow hedge 310 16 n/a
SPIE CONSOLIDATED FINANCIAL STATEMENTS– FY 2016 – 67

The estimated amount of credit risk on currency hedging as at December 31, 2016 is not significant (the risk of
fluctuation during 2016 is also not significant).
21.4. COUNTERPARTY RISK
The Group is not exposed to any significant counterparty risk. Counterparty risks are primarily related to:
- Cash investments;
- Trade receivables;
- Loans granted;
- Derivative instruments.
The Group makes most of its cash investments in money market funds invested in European government
securities with banks and financial institutions.
Existing derivatives in the Group (forward purchases and forward sales in USD and GBP) are distributed as
follows at December 12, 2016:
- BNP : 38 %
- Crédit du Nord : 17 %
- Natixis : 30 %
- CA CIB : 15 %
21.5. LIQUIDITY RISK
As at December 31, 2016, the unused amount of the revolving credit facility (RCF) line stands at € 400 million.
The Group introduced a securitization program on its trade receivables which has the following characteristics:
- Twelve of the Group's subsidiaries act as assignors in the securitization program in which assets are
transferred to a securitization mutual fund named SPIE Titrisation.
- SPIE Operations is involved in this securitization program as a centralizing entity on behalf of the Group in
relation to the depository bank.
This receivables securitization program allows participating companies to transfer full ownership of their trade
receivables to the SPIE Titrisation mutual fund allowing them to obtain funding for a total amount of € 300 million,
with the possibility to increase the amount to € 450 million.
The use of this program is accompanied by early repayment clauses for certain bank loans.
As at December 31, 2016 transferred receivables represented a total amount of € 529.4 million with financing
obtained amounting to € 287.8 million.
21.6. CREDIT RISK
The main credit policies and procedures are defined at Group level. They are coordinated by the Group's
Financial Division and monitored both by the latter and by the various Financial Divisions within each of its
subsidiaries.
68 – SPIE CONSOLIDATED FINANCIAL STATEMENTS – FY 2016

Credit risk management remains decentralized at Group level. Within each entity, credit risk is coordinated by the
Credit Management function which is underpinned by the "Group Credit Management" policy and a shared Best
Practices Manual. Payment terms are defined by the general terms of business applied within the Group.
Consequently, the Credit Management Department manages and monitors credit activity, risks and results and is
in charge of collecting trade receivables regardless of whether or not they have been transferred.
Monthly management charts are used to monitor, among other things, customer financing at operational level.
These provide the means to assess customer credit taking into account pre-tax invoicing and production data as
well as customer data (overdue debts and advances) calculated in terms of the number of billing days.
The policy to improve working capital requirements implemented by General Management plays an important role
in improving cash flow, serving more particularly to reduce overdue payments. Other actions have focused
primarily on improving the invoicing process, introducing the securitization program and improving the information
systems used to manage the trade item.
SPIE CONSOLIDATED FINANCIAL STATEMENTS– FY 2016 – 69

Notes regarding cash flow statement
NOTE 22. NOTES TO THE CASH FLOW STATEMENT
22.1. RECONCILIATION WITH CASH ITEMS OF THE STATEMENT OF FINANCIAL POSITION
The following table reconciles the cash position from the cash flow statement (a) and the cash position from the
statement of financial position (b) of the Group:
In thousands of euros Notes Dec 31, 2015 Dec 31, 2016
Marketable securities and other investments 245,777 5,500 Cash 359,107 555,262 Bank overdraft (53,083) (42,229) Cash and cash equivalents at year-end including assets held for sale (a) 551,800 518,534
(-) Cash and cash equivalents of assets held for sale (c) (1,418) 6,972 (-) Accrued interests not yet due 211 23 (+) Trading securities (short-term) - - Cash and cash equivalents at year-end excluding assets held for sale (b) 550,593 525,528
(c) See Note 20.2.
22.2. IMPACT OF CHANGES IN THE SCOPE OF CONSOLIDATION
The impact of changes in the scope of consolidation can be summarized as follows:
In thousands of euros Dec 31, 2015 Dec 31, 2016
Consideration paid (36,212) (118,087) Cash and cash equivalents provided 3,475 23,216 Cash and cash equivalents transferred (984) (1,089) Impact of merger operations (572) - Impact of change in consolidation methods - (74,843) Transfer price of consolidated investments 905 - Effect of change in scope of consolidation on cash & cash equivalents (33,388) (170,803)
22.3. IMPACT OF OPERATIONS HELD FOR SALE
The impact on the cash flow statement of operations classified as discontinued is summarized as follows:
In thousands of euros Dec 31, 2015 Dec 31, 2016
Net cash flow from operating activities (2,070) (13,522) Net cash flow used in investing activities 75 (1,303) Net cash flow from financing activities 106 (79) Effect of change in exchange rates (111) (148) Effect of change in accounting principles - 6,662 Change in cash and cash equivalents (2,000) (8,390) Reconciliation . Cash and cash equivalents at beginning of the period 3,418 1,418 . Cash and cash equivalents at end of the period 1,418 ,(6,972)
70 – SPIE CONSOLIDATED FINANCIAL STATEMENTS – FY 2016

Other notes
NOTE 23. RELATED PARTY TRANSACTIONS
23.1. DEFINITIONS
Are considered as transactions with related parties the five following categories:
- The transactions between SPIE Operations and its indirect parent entity SPIE SA (formerly Clayax
Acquisition);
- The transactions between a fully consolidated company and its influential minority shareholders;
- The outstanding transactions non eliminated in the consolidated accounts with companies accounted for
under equity method;
- The transactions with key management personnel and with companies held by these key persons and
companies on which they exercise any control.
23.2. REMUNERATIONS AND BENEFITS TO MEMBERS OF THE GOVERNING BODIES
In thousands of euros Dec 31, 2015 Dec 31, 2016
Salaries, social charges and short-term benefits 1,448 1,744 Long-term benefits (awards) 1 - Post-employment benefits - - Executive compensation 1,449 1,744
23.3. ATTENDANCE FEES
In 2016, the Board of Directors was composed of four independent Administrators, according to the “Afep-Medef”
Code. One of them has been nominated as a Senior Independent Director on December, 8th, 2016. These
independent Administrators are each member of at least one of the Committees set up by the Board of Directors,
i.e.: audit committee, remuneration committee, nomination committee, strategic and acquisition committee.
In accordance with their mandates and their functions within the Group, the independent Administrators receive
attendance fees.
In thousands of euros Dec 31, 2015 Dec 31, 2016
Attendance fees 104 271 Other remunerations and fringe benefits Directors remunerations 104 271
The amount of attendance fees correspond to a gross amount before tax deduction withheld at source by the
company.
SPIE CONSOLIDATED FINANCIAL STATEMENTS– FY 2016 – 71

23.4. INVESTMENTS IN ASSOCIATES
The Group has investments in proportionally recognized joint ventures. The table below sets out the Group's
proportionate interest in the assets, liabilities and net income of these entities:
In thousands of euros Dec 31, 2015 Dec 31, 2016
Non-current assets - - Current assets 89,918 97,623 Non-current liabilities (268) (2) Current liabilities (87,087) (92,029) Net assets 2,563 5,592 Income statement Income 73,364 74,798 Expenses (70,461) (69,206)
23.5. TAX GROUP AGREEMENTS
SPIE SA (formerly Clayax Acquisition) set up a tax consolidation group on July 1, 2011, including, in addition to
itself, the French companies (directly or indirectly) held at 95% or more.
According to the terms of the agreements signed between SPIE SA and each of the companies included in the
tax consolidation group, SPIE SA can use the carry-forward deficits of the various individual companies. If one of
the subsidiaries leaves the tax consolidation group, the parties to the agreement concerned reserve their
negotiation rights to decide whether the former subsidiary should be indemnified.
The Group also has a tax group in Germany, consisting of SPIE Holding GmbH and its German subsidiaries, in
the UK consisting of SPIE UK Ltd and its UK subsidiaries, and in the Netherlands consisting of SPIE Nederland
BV and its Dutch subsidiaries.
There has been no significant transaction between related parties between January 1, and December 31, 2016,
or significant modifications between related parties described in the notes to the consolidated financial statements
ended December 31, 2016.
NOTE 24. CONTRACTUAL OBLIGATIONS AND OFF BALANCE SHEET COMMITMENTS
24.1. OPERATING LEASE COMMITMENTS
Commitments relating to operating lease stand at € 367.1 million and breakdown per categories of equipment as
follows:
In thousands of euros Dec 31, 2015 Dec 31, 2016 < 1 year 2 to 5 years > 5 years
Buildings 277,982 216,216 56,834 116,412 42,970 Cars & trucks 89,130 150,890 49,518 90,144 11,228 Total operating leases 367,112 367,106 106,352 206,556 54,198
72 – SPIE CONSOLIDATED FINANCIAL STATEMENTS – FY 2016

24.2. OPERATIONAL GUARANTEES
In the course of its operations, the Group SPIE is required to provide a certain number of commitments in terms of
guarantees for the completion of work, the redemption of advances or the repayment of retention money or parent
company guarantees.
In thousands of euros Dec 31, 2015 Dec 31, 2016
Commitments given Bank guarantees 409,866 361,602 Insurance guarantees 212,212 196,220 Parent company guarantees 365,071 606,646 Total commitments given 987,149 1,164,468 Commitments received Surety, guarantees and warranties received 13,272 22,317 Total commitments received 13,272 22,317
The increase of the parent company guarantees is mainly related to two guarantees totalling € 205 million. These
guarantees were issued by SPIE Limited as part of 2 PFI contracts (private finance initiative projects) for
maintenance services in Scottish high schools. These contracts being concluded for a duration of 30 years, SPIE
Operations will be released from its commitments in August 2040 and December 2040. The remaining increase of
the parent company guarantees is spread over all subsidiaries of the Group, all activities included.
24.3. OTHER COMMITMENTS GIVEN AND RECEIVED
Individual Employee Training Rights for the Group's French Companies
Act no. 2004-391 of May 4, 2004 relating to life-long professional training and social dialogue amending Articles
L933-1 to L933-6 of the French Employment Code entitles employees with open-ended employment contracts
under private law to a right to individual training (acronym: DIF) for a minimum of 20 hours per year, which can be
accumulated over a period of six years (capped at 120 hours).
As of January 1, 2015, the Personnel Training Account (acronym: CPF) replaces the DIF and allows each
employee throughout his career have an individual right to training which will aggregate to its maximum, 120 to
150 hours of training over 9 years (20 hours per year the first 6 years and 10 hours per year for the following three
years).
Employees’ rights to DIF are retained and continue to exist alongside the CPF: the rights to DIF can be used to
exhaustion and up to 2020 at the most.
Tracking the number of hours of training accumulated corresponding to rights acquired under the DIF and the
CPF and the monitoring of the volume of training hours which has not been used are now decentralized and
available through an internet portal accessible only by employees as holders of a CPF account.
Consequently, no measurement can be performed regarding this commitment due to the difficulty in obtaining a
reliable estimate.
SPIE CONSOLIDATED FINANCIAL STATEMENTS– FY 2016 – 73

Pledging of shares
As part of the IPO and the implementation of the new refinancing plan, all investment securities pledged by direct
and indirect subsidiaries of SPIE SA were subject to release as at June 11, 2015. As at December 31, 2016, no
shares were pledged.
NOTE 25. STATUTORY AUDITORS’ FEES
Auditors' fees are presented as follows in the income statement of December 31, 2016:
In thousands of euros EY PwC
Statutory audit 1,987 1,335 Audit-related services 522 157 TOTAL 2,509 1,492
NOTE 26. SUBSEQUENT EVENTS
26.1 SPIE’s STRATEGIC DEVELOPMENT IN GERMANY
On 23 December 2016, SPIE entered into a sale and purchase agreement in relation to the acquisition of the
SAG Group (“SAG”). The completion of the acquisition is contemplated by end March 2017, subject to usual
condition precedents and antitrust approval by the European Commission.
Headquartered in Langen, Germany, SAG is owned by private equity firm EQT since 2008.
The SAG group is a major player in services and systems supply for electrical power, gas, water and
telecommunications networks. Its activities are primarily focused on servicing power transmission and distribution
grids. SAG offers a comprehensive range of services to new facilities (such as consultancy and design,
engineering and procurement, installation) and asset support services (such as maintenance services, upgrades
and modifications, replacement).
SAG employs approximately 8,000 highly qualified people across more than 170 locations, including 120 in
Germany.
It is the market leader in Germany, where it generates close to 75% of its revenue, and has an established
footprint in Slovakia, the Czech Republic, Poland, Hungary and France.
For the financial year ended December 31, 2016 SAG has generated consolidated revenue of € 1,325 million.
Purpose of the acquisition
The combination of SPIE and SAG will create a German leader in multi-technical services, sharing the key
success factors of the SPIE model: a wide range of complementary technical capabilities, a highly diversified
client base and a densified geographical footprint. It will also provide a gateway for further expansion into Central
Europe.
74 – SPIE CONSOLIDATED FINANCIAL STATEMENTS – FY 2016

With strong exposure to long-term growth drivers, potential for further targeted bolt-on acquisitions, and significant
cost synergies planned, this new platform will be well poised to deliver long-term revenue growth and margin
expansion.
Synergies
SPIE expects the acquisition to create significant cost synergies in procurements, since the acquisition will lead to
the purchase of higher volumes and therefore to larger rebates, and the centralization of buying functions. SPIE
also expects cost synergies as a result of the optimization and integration of corporate functions, as well as the
integration of real estate and non-payroll general & administrative expenses. Finally, the acquisition will increase
the Group network density and enable the Group to make efficiency gains.
In this context, SPIE expects to deliver pre-tax synergies of approximately € 20 million in procurement,
administrative and other operating expenses over two years.
Integration of SAG into the Group
The Group expects to implement its integration policy to the SAG acquisition in order to ensure a smooth and
rapid integration within the Group. Well-matched, deeply ingrained corporate cultures, strong similarities in
business model, and full commitment from SAG management will ensure a smooth integration process.
Details of the transaction
The transaction is valued at approximately € 850 million, including the cash consideration of € 460 million and a
post-tax net pension liability of € 390 million (Including a € 455 million IFRS net provision and € (65) million of
deferred tax assets). The implied transaction multiples are 11.0x 2016E EBITA pre synergies, and 8.8x post run-
rate synergies.
Financing of the acquisition
SPIE has entered into a bridge loan facility for a total principal amount of 600,000,000 euros, which purpose is to
finance directly or indirectly, the acquisition, including fees, costs and expenses associated with the transaction
and refinance the existing financial indebtedness of SAG.
The Bridge Loan Facility has a 12 month maturity from the withdrawal date, with an extension option at the sole
discretion of the Company, and bears an interest rate of EURIBOR (with a 0% floor) plus the relevant margin.
SPIE intends to refinance the Bridge Loan Facility through a Bonds issuance for the same amount.
26.2 EXTERNAL GROWTH
The SPIE Group made the following acquisitions:
SPIE CONSOLIDATED FINANCIAL STATEMENTS– FY 2016 – 75

- On January 2nd, 2017, the Ad Bouman BV company located in the Netherlands was acquired by SPIE
Nederland for an amount of € 3.5 million, subject to usual antitrust approval by the European Commission.
The completion of the acquisition is contemplated by end of first quarter 2017 or beginning of second quarter
2017. Ad Bouman BV, established in 1980, focuses on non-food retail spaces, where it provides a broad
range of installation services, including electro-technical work, heating systems, air conditioning, climate
control and security. The company provides turnkey installation to a high quality and diverse customer base
of national and international retailers. Ad Bouman BV employs 22 people and generates annual revenue of
approximately 5 million euros.
-
- On January 25th, 2017, the Maintenance Mesure Contrôle (« MMC ») company located in France was
acquired by SPIE Nucléaire for an amount of € 3.6 million. Founded in 1989 and based in Lorraine, MMC
specializes in acoustic control, air leakage tests and infrared thermography on the French electronuclear
sites. MMC employs 15 people and recorded revenues of 3 million euros in the year ended March 31st, 2016.
26.3 “AMBITION 2020” PROJECT
As part of its “Ambition 2020” project, SPIE announced the creation, since January 1, 2017, of two new French
subsidiaries to cover the national territory, each in its own specialty.
SPIE Citynetworks is dedicated to the telecoms and outdoor networks market, and SPIE Facilities which is
dedicated to the building maintenance market. These two companies combine corresponding activities of the five
French regional multi-technical subsidiaries that previously operated. SPIE Citynetworks is dedicated to the
market of external networks and telecoms. It has 2,600 employees spread over more than 130 locations.
Addressing public and private customers, the entity focuses on issues related to electric mobility, urban video
surveillance or intelligent public lighting. It proposes supports to national or regional contracts for the digital
development of the territories, from the phases of studies / design up to the maintenance, until completion. SPIE
Citynetworks is involved in the deployment of 4G and 5G telephony networks, the deployment of fiber and the
installation of charging infrastructures for electric vehicles.
SPIE Facilities, for its part, is dedicated to the market of the maintenance of the buildings and the "facility
management". It has the same number of employees but only 65 locations in France. It offers to its customers in
the residential / tertiary and industrial sectors (real estate assets) solutions that meet the latest technological,
energy and environmental challenges. With a growth market, its mission will be to propose and manage services
to enhance the performance of buildings and the comfort of their occupants. The entity intends to position itself on
predictive services.
As of January 1, 2017, the SPIE Group in France is based on a two main structures, with five regional
subsidiaries (SPIE Île-de-France Nord-Ouest, SPIE Est, SPIE Sud-Est, SPIE Sud-Ouest, SPIE Ouest-Centre) but
also three national subsidiaries of specialty (SPIE ICS, SPIE Facilities and SPIE Citynetworks). This sub-group
has 16,200 employees.
76 – SPIE CONSOLIDATED FINANCIAL STATEMENTS – FY 2016

NOTE 27. SCOPE OF CONSOLIDATION
Company Address Consolidation
currency Consolidation method 2015*
% of interest 2015/12/31
Consolidation method 2016*
% of interest 2016/12/31
SUB-GROUP SPIE SA (HQ)
SPIE SA 10, Av de l'entreprise 95863 CERGY-PONTOISE CEDEX
EUR Mother 100.00 Mother 100.00
FINANCIERE SPIE 10, Av de l'entreprise 95863 CERGY-PONTOISE CEDEX
EUR F.C. 100.00 F.C. 100.00
SPIE Operations 10, Av de l'entreprise 95863 CERGY-PONTOISE CEDEX
EUR F.C. 100.00 F.C. 100.00
SOREMEP 10, Av de l'entreprise 95863 CERGY-PONTOISE CEDEX
EUR F.C. 100.00 Merged -
PARC SAINT CHRISTOPHE SNC 10, Av de l'entreprise 95863 CERGY-PONTOISE CEDEX
EUR F.C. 100.00 F.C. 100.00
SPIE INTERNATIONAL 10, Av de l'entreprise 95863 CERGY-PONTOISE CEDEX
EUR F.C. 100.00 F.C. 100.00
SPIE CITYNETWORKS (ex ST4) 1/3 place de la Berline 93287 SAINT DENIS Cedex
EUR F.C. 100.00
S.G.T.E. INGENIERIE 10, Av de l'entreprise 95863 CERGY-PONTOISE CEDEX
EUR F.C. 100.00 F.C. 100.00
SPIE BATIGNOLLES T.P. 10, Av de l'entreprise 95863 CERGY-PONTOISE CEDEX
EUR F.C. 100.00 F.C. 100.00
SPIE FACILITIES (ex SPIE 911) 1/3 place de la Berline 93287 SAINT DENIS Cedex
EUR F.C. 100.00
SPIE TELECOM SERVICES GEIE 10, Av de l'entreprise 95863 CERGY-PONTOISE CEDEX
EUR F.C. 100.00 F.C. 100.00
SPIE BATIGNOLLES TP HOCH UND TIEFBAU GMBH Unter den linden 21 10117 BERLIN - GERMANY
EUR F.C. 100.00 F.C. 100.00
SPIE INFRASTRUKTUR GMBH (ex SB GMBH) Rudolfstrasse 9 10245 BERLIN - GERMANY
EUR F.C. 100.00 F.C. 100.00
SPIE RAIL (DE) GMBH Unter den linden 21 10117 BERLIN - GERMANY
EUR F.C. 100.00 F.C. 100.00
SPIE SPEZIALTIEFBAU GMBH Unter den linden 21 10117 BERLIN - GERMANY
EUR F.C. 100.00 F.C. 100.00
SPIE ENERTRANS 10, Av de l'entreprise 95863 CERGY-PONTOISE CEDEX
EUR F.C. 100.00 F.C. 100.00
SUB-GROUP SPIE IDF NO SPIE IDF NORD OUEST 1/3 place de la Berline
93287 SAINT DENIS Cedex EUR F.C. 100.00 F.C. 100.00
TECHNIQUE DE GESTION IMMOBILIERE 1/3 place de la Berline 93287 SAINT DENIS Cedex
EUR F.C. 100.00 Merged -
SPIE POSTES HTB Parc Scientifique de la Haute Borne 10, avenue de l'Harmonie CS 20292
59 665 VILLENEUVE-D'ASCQ CEDEX
EUR F.C. 100.00 F.C. 100.00
CINERGY SAS 27 Avenue du Gros Chêne 95614 ERAGNY SUR OISE
EUR Equity Method 50.00 Equity Method 50.00
SUB-GROUP SPIE EST SPIE EST 2, route de Lingolsheim
BP 70330 - GEISPOLSHEIM GARE EUR F.C. 100.00 F.C. 100.00
SPIE CONSOLIDATED FINANCIAL STATEMENTS– FY 2016 – 77

ANQUETIL CLIMATICIENS 2, route de Lingolsheim 67118 GEISPOLSHEIM GARE
EUR F.C. 100.00 F.C. 100.00
SOCIETE NOUVELLE HENRI CONRAUX 2, route de Lingolsheim 67118 GEISPOLSHEIM GARE
EUR F.C. 100.00 F.C. 100.00
SUB-GROUP SPIE SUD EST SPIE SUD EST 4, avenue Jean-Jaurès - B.P. 19
69320 FEYZIN EUR F.C. 100.00 F.C. 100.00
C-TRAM SERVICES 497, Rue Nicéphore Niepce 69 800 SAINT-PRIEST
EUR F.C. 100.00 F.C. 100.00
SOMELEC ZA La Garrigue du Rameyron 84830 SERIGNAN DU COMTAT
EUR F.C. 100.00 Merged -
ENTREPRISE TRENTO Route de Camaret 84 100 ORANGE
EUR F.C. 100.00 F.C. 100.00
LIONS Chemin du Badaffier - ZAC Ste Anne Est 84 700 SORGUES
EUR F.C. 100.00 F.C. 100.00
THERMAT 2, rue de l'Euro 74 960 MEYTHET
EUR F.C. 100.00
VILLANOVA ZAC de Chazaleix - Rue Emmanuel Chabrier 63 730 LES MARTRES DE VEYRE
EUR F.C. 100.00
ACEM Avenue Albert Einstein 63200 RIOM
EUR F.C. 100.00 F.C. 100.00
ELECTROTECH Chemin des Léchères 3 1217 MEYRIN - SWITZERLAND
CHF F.C. 100.00 F.C. 100.00
HAMARD SA Chemin des Léchères 3 1217 MEYRIN - SWITZERLAND
CHF F.C. 100.00 F.C. 100.00
SPIE MTS SA (Ex Spie Suisse SA) Chemin des Léchères 3 1217 MEYRIN - SWITZERLAND
CHF F.C. 100.00 F.C. 100.00
FANAC & ROBAS SA 107, Rue de Lyon 1203 GENEVE - SWITZERLAND
CHF F.C. 100.00 F.C. 100.00
VISTA CONCEPT SA En reutet B 1868 COLLOMBEY MURAZ - SWITZERLAND
CHF F.C. 100.00 F.C. 100.00
VISCOM SYSTEM SA Avenue des Alpes 29 MONTREUX - SWITZERLAND
CHF F.C. 100.00 F.C. 100.00
SUB-GROUP SPIE OUEST CENTRE SPIE OUEST CENTRE 7, Rue Julius et Ethel Rosenberg
BP 90263 44818 SAINT HERBLAIN CEDEX
EUR F.C. 100.00 F.C. 100.00
SIPECT 229, Rue du Docteur Guichard - BP 91004 49010 ANGERS Cedex 1
EUR F.C. 100.00 F.C. 100.00
VAL DE LUM Parc d'activités de la Fringale - Voie de l'institut 27100 VAL DE REUIL
EUR F.C. 85.00 F.C. 85.00
ENELAT OUEST ZAC de la Lorie, Immeuble Berlioz, 31 rue Bonny Sands
44 800 SAINT HERBLAIN
EUR F.C. 100.00 F.C. 100.00
PROJELEC 25 ,Allée Evariste Gallois 18000 BOURGES
EUR F.C. 100.00 F.C. 100.00
JURET 229, Rue du Docteur Guichard 49000 ANGERS
EUR F.C. 100.00 Merged -
ELCARE Avenue du Maine 72 190 SAINT PAVACE
EUR F.C. 100.00 F.C. 100.00
78 – SPIE CONSOLIDATED FINANCIAL STATEMENTS – FY 2016

SUB-GROUP SPIE SUD OUEST
SPIE SUD OUEST 70, Chemin de Payssat - B.P. 4056 ZI Montaudran 31400 TOULOUSE
EUR F.C. 100.00 F.C. 100.00
THERMI 115, rue Olof Palm - ZAC de Tournezy 34 000 MONTPELLIER
EUR F.C. 100.00 F.C. 100.00
ENELAT 70 Chemin de Payssat - Zone Industrielle de Montaudran
31 400 TOULOUSE
EUR F.C. 100.00 F.C. 100.00
SONO TECHNIC Impasse Maniou 31 140 LAUNAGUET
EUR F.C. 100.00 F.C. 100.00
BOISSON Zone Artisanale 34 130 MUDAISON
EUR F.C. 100.00 F.C. 100.00
STE NARBONNAISE D'ELECTRIFICATION (SNE) 2 Rue de l'artisanat - Zone Industrielle de Plaisance
11 100 NARBONNE
EUR F.C. 100.00 Merged -
MADAULE ET FILS 2 Rue de l'artisanat - Zone Industrielle de Plaisance
11 100 NARBONNE
EUR F.C. 100.00 Merged -
MADAULE AUTOMATION 2 Rue de l'artisanat - Zone Industrielle de Plaisance
11 100 NARBONNE
EUR F.C. 100.00 Merged -
SPIE MAROC PK 374, 815 Route d'el Jadida (par Lissasfa) Km 1.5 C.R. Ouled Azzouz
Province de Nouaceur CASABLANCA - Morocco
MAD F.C. 100.00 F.C. 100.00
COMAFIPAR S.A. PK 374, 815 Route d'el Jadida (par Lissasfa) Km 1.5 C.R. Ouled Azzouz
Province de Nouaceur CASABLANCA - Morocco
MAD F.C. 100.00 F.C. 100.00
TECNO SPIE SA Parque Oriente Rua D. Nuno Alvares PEREIRA n°4, 3°
2695-445 BOBADELA - Portugal
EUR F.C. 100.00 Disposed -
SUB-GROUP SPIE NUCLEAIRE
SPIE DEN 10, Av de l'entreprise - Pôle Edison 95 863 CERGY PONTOISE CEDEX
EUR F.C. 100.00 F.C. 100.00
SPIE NUCLEAIRE 10, Av de l'entreprise - Pôle Edison 95 863 CERGY PONTOISE CEDEX
EUR F.C. 100.00 F.C. 100.00
ATMN Le Marais - Route Insudtrielle EST 76 430 SAINT VIGOR D'YMONVILLE
EUR F.C. 100.00 F.C. 100.00
SUB-GROUP SPIE ICS
SPIE ICS (formerly SPIE Communications) 53, Boulevard de Stalingrad 92247 MALAKOFF
EUR F.C. 100.00 F.C. 100.00
SPIE Cloud SERVICES (formerly VeePee) 53, Boulevard de Stalingrad 92247 MALAKOFF
EUR F.C. 100.00 F.C. 100.00
SPIE INFOSERVICES (formerly SPIE Infogérance et Services)
53, Boulevard de Stalingrad 92247 MALAKOFF
EUR F.C. 100.00 F.C. 100.00
SOCIETE FINANCIERE DU LANGUEDOC - SOFILAN Rue Guy Arnaud - ZAC de Valdegour 30900 NIMES
EUR F.C. 100.00
APPLICATION DEVELOPPEMENT INFORMATIQUE - ADI Rue Guy Arnaud - ZAC de Valdegour 30900 NIMES
EUR F.C. 100.00
REPRO DIFFUSION INFORMATIQUE - RDI Rue Guy Arnaud 30900 NIMES
EUR F.C. 100.00
SPIE CONSOLIDATED FINANCIAL STATEMENTS– FY 2016 – 79

Company Address Consolidation
currency Consolidation method 2015*
% of interest 2015/12/31
Consolidation method 2016*
% of interest 2016/12/31
SUB-GROUP SPIE BELGIUM SPIE BELGIUM Rue des deux gares 150
1070 BRUXELLES - Belgium EUR F.C. 100.00 F.C. 100.00
DEVIS NV Herentalseweg 48 2440 GEEL - Belgium
EUR F.C. 100.00 F.C. 100.00
DEVINOXS NV Lammerdries3 2440 GEEL - Belgium
EUR F.C. 100.00 F.C. 100.00
DESERVIS NV Lammerdries3 2440 GEEL - Belgium
EUR F.C. 100.00 F.C. 100.00
ELEREP NV Lammerdries3 2440 GEEL - Belgium
EUR F.C. 100.00 F.C. 100.00
UNI-D NV Lammerdries3 2440 GEEL - Belgium
EUR F.C. 100.00 F.C. 100.00
THERMOFOX NV Spieveldstraat 7 9160 LOKEREN - Belgium
EUR F.C. 100.00 Merged -
CRIC (CLIMATISATION, REFRIGERATION INDUSTRIELLE ET COMMERCIALE SPRL)
Rue des Berces 7 5650 CHASTRES - Belgium
EUR F.C. 100.00
SUB-GROUP SPIE NEDERLAND
SPIE NEDERLAND B.V. Huifakkerstraat, 15 4800 CG BREDA - PAYS BAS
EUR F.C. 100.00 F.C. 100.00
SPIE CONTROLEC ENGINEERING BV De Brauwweg, 74-82 NL 3125 AE Schiedam - Netherlands
EUR F.C. 100.00 F.C. 100.00
SPIE CZECH S.R.O. Pod Hradbami 2004/5 PSC 59401 VELKE MEZIRICI
CZK F.C. 100.00 Disposed -
GIETWALSONDERHOUDCOMBINATIE BV Staalstraat, 150 4815 PN BREDA - PAYS BAS
1951 JP Velsen-Nord
EUR Equity Method 50.00 Equity Method 50.00
ELECTRIC ENGINEERING INSTALLATION BV Kromme Schaft 3 NL 3991 AR HOUTEN - Netherlands
EUR F.C. 100.00 Merged -
GEBR. VAN DER DONK CIVIEL BV Menhirweg 6 NL 5342LS Oss - PAYS BAS
EUR F.C. 100.00 F.C. 100.00
ALEWIJNSE ZWOLLE BV Curieweg 11 NL 8013 RA ZWOLLE - Netherlands
EUR F.C. 100.00
ALEWIJNSE ULTRECHT BV Detmoldstraat 17 NL 3523 GA UTRECHT - Netherlands
EUR F.C. 100.00
ALEWIJNSE DELFT BV Westlandseweg 13 NL 2624 AA DELFT - Netherlands
EUR F.C. 100.00
GPE TECHNICAL SERVICES BV De Weegschaal 5 5215 MN'S - HERTOGENBOSCH - Netherlands
EUR F.C. 100.00
JANSEN VENNEBOER BEHEERMAATSCHAPPIJ Industrieweg 4 NL 8131VZ WIJHE - Netherlands
EUR F.C. 100.00
JANSEN VENNEBOER BEHEER & ONDERHOUD Industrieweg 4 NL 8131VZ WIJHE - Netherlands
EUR F.C. 100.00
JANSEN VENNEBOER ADVIES B.V. Industrieweg 4 NL 8131VZ WIJHE - Netherlands
EUR F.C. 100.00
JANSEN VENNEBOER B.V. Industrieweg 4 NL 8131VZ WIJHE - Netherlands
EUR F.C. 100.00
INFRASTRUCTURES SERVICES & PROJECTS BVINDIANA Kromme Schaft 3 NL 3991 AR HOUTEN - Netherlands
EUR F.C. 100.00 F.C. 100.00
80 – SPIE CONSOLIDATED FINANCIAL STATEMENTS – FY 2016

SUB-GROUP SPIE UK
SPIE LIMITED 33 Gracechurch Street, 2nd Floor EC3V OBT LONDON - England
GBP F.C. 100.00 F.C. 100.00
SPIE UK 33 Gracechurch Street, 2nd Floor EC3V OBT LONDON- England
GBP F.C. 100.00 F.C. 100.00
SPIE WHS LIMITED 33 Gracechurch Street, 2nd Floor EC3V OBT LONDON- England
GBP F.C. 100.00 F.C. 100.00
GARSIDE AND LAYCOCK (ST ANNES) LIMITED 33 Gracechurch Street, 2nd Floor EC3V OBT LONDON- England
GBP F.C. 100.00 F.C. 100.00
GARSIDE AND LAYCOCK LIMITED 33 Gracechurch Street, 2nd Floor EC3V OBT LONDON- England
GBP F.C. 100.00 F.C. 100.00
GARSIDE AND LAYCOCK GROUP LIMITED 33 Gracechurch Street, 2nd Floor EC3V OBT LONDON- England
GBP F.C. 100.00 F.C. 100.00
ALARD ELECTRICAL LTD 33 Gracechurch Street, 2nd Floor EC3V OBT LONDON- England
GBP F.C. 100.00 F.C. 100.00
SPIE FS NORTHEN (UK) LIMITED Centre Park - WA1 1RL WARRINGTON Cheshire - England
GBP F.C. 100.00 F.C. 100.00
SPIE ENS Limited 33 Gracechurch Street, 2nd Floor EC3V OBT LONDON- England
GBP F.C. 100.00 F.C. 100.00
VEHICLE RENTAL IRELAND LIMITED 1 CairnView, Swatragh Maghera
BT46 5QG COUNTY LONDONDERRY- Ireland
GBP F.C. 100.00 F.C. 100.00
SCOTSHIELD MCCAFFERTY HOUSE 99 Firhill road
G20 7BE GLASGOW – Scotland
GBP F.C. 100.00 F.C. 100.00
SPIE LEVEN ENERGY SERVICES LTD CNA House Sanfold Lane - Levenchulme M19 3BJ MANCHESTER- England
GBP F.C. 100.00 F.C. 100.00
TRIOS COMPLIANCE LIMITED 33 Gracechurch Street, 2nd Floor EC3V OBT LONDON- England
GBP F.C. 100.00
TRIOS GROUP LIMITED 33 Gracechurch Street, 2nd Floor EC3V OBT LONDON- England
GBP F.C. 100.00
TRIOS PROPERTY LIMITED 33 Gracechurch Street, 2nd Floor EC3V OBT LONDON- England
GBP F.C. 100.00
TRIOS SECURE LIMITED 33 Gracechurch Street, 2nd Floor EC3V OBT LONDON- England
GBP F.C. 100.00
TRIOS SKILZ LIMITED 33 Gracechurch Street, 2nd Floor EC3V OBT LONDON- England
GBP F.C. 100.00
TRIOS FACILITIES LIMITED 33 Gracechurch Street, 2nd Floor EC3V OBT LONDON- England
GBP F.C. 100.00
SUB-GROUP SPIE HOLDING GMBH
SPIE HOLDING GMBH Alfredstrasse 236 45133 ESSEN – Germany
EUR F.C. 100.00 F.C. 100.00
SPIE GMBH Alfredstrasse 236 45133 ESSEN - Germany
EUR F.C. 100.00 F.C. 100.00
SPIE DEUTSCHLAND SYSTEM INTEGRATION GMBH Ruschgraben 135 76139 KARLSRUHE - Germany
EUR F.C. 100.00 Merged -
ADVAGO S.A. 4 Zalogou Str & Mesogeion Ave AGIA PARASKEVI - Grece
EUR F.C. 51.00 F.C. 51.00
CAR.E FACILITY MANAGEMENT GMBH Fuhlsbüttler Strasse 399 22309 HAMBOURG - Germany
EUR F.C. 100.00 Merged -
CAR.E FACILITY MANAGEMENT KFT VACI UT 76 1133 BUDAPEST – Hungary
HUF F.C. 100.00 F.C. 100.00
SPIE CONSOLIDATED FINANCIAL STATEMENTS– FY 2016 – 81

FMGO! GMBH Gedonstrasse 8 80802 MUNICH – Germany
EUR I.G. 74.90 I.G. 74.90
HOST GMBH HOSPITAL SERVICE + TECHNIK Theodor - Stern - Kai 7 60596 FRANCFORT SUR LE MAIN –
Germany
EUR I.G. 25.10 Equity Method 25.10
SCHLOSS HERRENHAUSEN GMBH Herrenhäuser Strasse 3 30419 HANOVRE – Germany
EUR I.G. 100.00 I.G. 100.00
SPIE ENERGY SOLUTIONS GMBH Alfredstrasse 236 45133 ESSEN – Germany
EUR I.G. 100.00 I.G. 100.00
SPIE ENERGY SOLUTIONS HARBURG GMBH Fuhlsbüttler Strasse 399 22309 HAMBOURG – Germany
EUR I.G. 65.00 I.G. 65.00
SPIE POLSKA SP Z.O.O. ul. Powsinska 64A PL-02-903 WARSZAWA - Poland
PLN I.G. 100.00 I.G. 100.00
SPIE IFS SA (Ex SPIE SCHWEIZ AG) Untere rebgasse 7 4058 BASEL – Switzerland
CHF I.G. 100.00 I.G. 100.00
SPIE FLEISCHHAUER GMBH Oldenburger Allee 36 30659 HANNOVER – Germany
EUR I.G. 100.00 I.G. 100.00
G. FLEISCHHAUER GmbH Kreuzbergstrasse 31 06849 DESSAU – ROSSLAU – Germany
EUR I.G. 100.00 Merged -
CROMM UND CO. GMBH Siemensallee 75 76187 KARLSRUHE – Germany
EUR I.G. 100.00 Merged -
AM ALLIED MAINTENANCE GMBH König-Georg-Stieg 8-10 21107 HAMBURG- Germany
EUR Equity Method 25.00
SPIE HARTMANN GMBH (ex HARTMANN ELEKTROTECHNIK GMBH)
König-Georg-Stieg 8-10 21107 HAMBURG- Germany
EUR I.G. 100.00
HE HANSE PROJEKTMANAGEMENT GMBH König-Georg-Stieg 8-10 21107 HAMBURG- Germany
EUR I.G. 100.00
SPIE COMNET GmbH (ex SPIE ICS Gmbh) Burgewedeler Strasse 27a 30916 ISERNHAGEN- Germany
EUR I.G. 100.00
COMNET COMMUNICATIONSSYSTEME & NETZWERKSERVICE BERLIN GMBH
Am Borsigturm 58 13507 BERLIN – Germany
EUR I.G. 100.00
COMNET HANSE GMBH Friedrich-Ebert-Damm 245 22159 HAMBURG – Germany
EUR I.G. 100.00
COMNET COMMUNICATIONSSYSTEME & NETZWERKSERVICE GMBH
Burgewedeler Strasse 27a 30916 ISERNHAGEN – Germany
EUR I.G. 100.00
COMNET COMMUNICATIONSSYSTEME & NETZWERKSERVICE REGION MITTE GMBH
Friedrich-Ebert Strasse 25 34117 KASSEL – Germany
EUR I.G. 100.00
COMNET Rhein-Neckar GmbH Mundenheimer Strasse 55 68219 MANNHEIM – Germany
EUR I.G. 100.00
COMNET West GmbH Leyboldstrasse 10 50354 HÜRTH – Germany
EUR I.G. 100.00
AGIS FIRE & SECURITY OY FINLAND Valuraudantie 19 700 - Helsinki – Finland
EUR I.G. 100.00
AGIS FIRE & SECURITY KFT HUNGARY Montevideo u. 3a 1037 Budapest – Hungary
HUF I.G. 100.00
AGIS FIRE & SECURITY SP.Z.O.O. POLAND UI. Palisadowa 20/22 01-940 Warsaw Poland
PLN I.G. 100.00
GFT GESELLSCHAFT FÜR ELEKTRO MBH Am Lichtbogen 40 45141 ESSEN - Germany
EUR I.G. 100.00
SUB-GROUP SPIE ICS AG
SPIE SCHWEIZ AG Industriestrasse 50a 8304 Wallisellen - Switzerland
CHF I.G. 100.00
SPIE ICS AG (ex CONNECTIS) Sonnenplatz 6 6020 EMMENBRÜCKE - Switzerland
CHF I.G. 100.00 I.G. 100.00
82 – SPIE CONSOLIDATED FINANCIAL STATEMENTS – FY 2016

Company Address Consolidation
currency Consolidation method 2015*
% of interest 2015/12/31
Consolidation method 2016*
% of interest 2016/12/31
SUB-GROUP SPIE OIL GAS & SERVICES GEMCO 5, Avenue des frères Wright
ZI du Pont Long - 64140 LONS EUR F.C. 100.00 F.C. 100.00
FORAID 10, Av de l'entreprise - Pôle Edison 95863 CERGY PONTOISE CEDEX
EUR F.C. 100.00 F.C. 100.00
ALMAZ SPIE OGS P.O. Box 18123 SANA' A Republic Of Yemen
USD F.C. 80.00 F.C. 80.00
FORAID ALGERIE EURL RN 49 OUARGLA – Algeria
DZD F.C. 100.00 F.C. 100.00
SPIE OGS CONGO B.P. 316 POINTE NOIRE – Congo
CFA F.C. 100.00 F.C. 100.00
SPIE OGS GABON B.P. 579 PORT GENTIL – Gabon
CFA F.C. 99.00 F.C. 99.00
IPEDEX Sdn Bhd (Brunei) Lot 4187, N°12, Jalan Panden Lima A KUALA BELAIT
BND F.C. 100.00 Liquidated -
IPEDEX GABON B.P. 1564 PORT GENTIL - Gabon
EUR F.C. 90.00 F.C. 90.00
IPEDEX INDONESIA ANZ Tower - 12th floor Jalan Jenderal Sudirman, KAV 33A
10220 JAKARTA - Indonesia
USD F.C. 90.00 F.C. 90.00
SPIE OGS (MALAYSIA) SDN BHD Level 8, Symphony House, Block D13 Pusat Dagangan Dana 1
47301 PETALING JAYA, SELANGOR DARUL EHSAN - Malaysia
MYR F.C. 49.00 F.C. 49.00
SPIE OGS KISH LLC (Iran) P.O. Box 79415 - 1316 1316 KISH ISLAND I.R. - IRAN
USD F.C. 100.00 F.C. 100.00
SPIE OGS MIDDLE EAST LLC (Abu Dhabi) P.O. Box 4899 ABU DHABI – United Arab Emirates
AED F.C. 100.00 F.C. 100.00
SPIE OIL & GAS SERVICES 10, Av de l'entreprise - Pôle Edison 95863 CERGY PONTOISE CEDEX
EUR F.C. 100.00 F.C. 100.00
SPIE OGS ASP SDN BHD (Malaisie) Level 8, Symphony House, Block D13 Pusat Dagangan Dana 1
47301 PETALING JAYA, SELANGOR DARUL EHSAN - Malaysia
MYR F.C. 100.00 F.C. 100.00
SPIE OGS THAILAND Ltd 1010, Shinawatra tower III 27th Floor, Unit 2702
Viphavadi Rangsit Road, Chatuchak 10900 BANGKOK – Thailand
THB F.C. 100.00 F.C. 100.00
Sonaid (a) Rua Amilcar Cabral n°211 Edificio IRCA - 9° et 10° Andar
LUANDA Angola
USD F.C. 55.00 Equity Method 55.00
SPIE NIGERIA Ltd 55 Trans Amadi Industrial Layaout PORT HARCOURT - Nigeria
NGN F.C. 100.00 F.C. 100.00
SPIE OIL & GAS SERVICES VENEZUELA Esquina Puente Victoria Edificio Centro Villasmil, piso 6, oficina 617
La Candelaria - CARACAS – Venezuela
VEF F.C. 100.00 F.C. 100.00
ENERFOR 10, Av de l'entreprise - Pôle Edison 95863 CERGY PONTOISE CEDEX
EUR F.C. 100.00 F.C. 100.00
YCOMAZ 10, Av de l'entreprise - Pôle Edison 95863 CERGY PONTOISE CEDEX
EUR F.C. 100.00 F.C. 100.00
GTMH NIGERIA Plot 107 trans Amadi indus. Layout PORT - HARCOURT – Nigeria
NGN F.C. 100.00 F.C. 100.00
ASB PROJECTS & RESSOURCES PTE LTD 80 Raffles place - 26.01 UOB Plazza 1 Singapore 048624
USD F.C. 100.00 F.C. 100.00
SPIE CONSOLIDATED FINANCIAL STATEMENTS– FY 2016 – 83

SPIE OIL & GAS SERVICES SAUDI Al Mafleh Buildin,g, 2nd Floor Labor City, King Abdulaziz Road - Cross 7, Building
7263 - Unit 1 PO Box 4695 - 34442 AL KHOBAR Saudi Arabia
SAR F.C. 100.00 F.C. 100.00
SPIE LYBIA Tourist City Gargaresh TRIPOLI - Lybia
USD F.C. 65.00 F.C. 65.00
SPIE OGS BELGIUM Rue des deux gares 150 1070 BRUXELLES - Belgium
EUR F.C. 100.00 F.C. 100.00
SPIE TECNICOS DE ANGOLA LIMITADA Avenida Commante Kima Kyenda n°309 no bairro da Boa Vista
LUANDA Angola
USD F.C. 75.00 F.C. 75.00
SPIE OGS VIETNAM LTD Saigon Tower, 29, Le Duan Boulevard District 1 - HO CHI MINH CITY - Vietnam
VND F.C. 100.00 F.C. 100.00
SPIE EDGO ENERGY VENTURES LIMITED PO Box 74980, Emaar Square, Building 4, Level 7 Unit 702
74980 DUBAI - United Arab Emirates
AED F.C. 100.00 F.C. 100.00
SPIE PLEXAL (Thailand) Ltd N°555, Rasa Tower 1 - 14th Floor - Units 1401-1404 - Paholyothin Road Chatuchak Sub-district
Chatuchak District - Bangkok - Thailand
THB F.C. 100.00 F.C. 100.00
SPIE OIL AND GAS SERVICES PTY LTD 18th Floor, 140 St George's Terrace PERTH WA 6000 - Australia
AUD F.C. 100.00 F.C. 100.00
SERVICES PETROLEUM & INDUSTRIAL EMPLOYEMENT (SPIEM)
PO BOX 15 ABU DHABI - United Arab Emirates
AED F.C. 100.00 F.C. 100.00
SPIE OGS LIMITED (UK) 33 Gracechurch Street EC3V OBT LONDON - England
GBP F.C. 100.00 F.C. 100.00
SPIE OGS JBL Limited P.O. Box 74980 Emaar Square Building Level 7 Unit 702 Downtown DUBAI – United Arab Emirates
AED I.G. 100.00
SPIE SERVICES NIGERIA LTD 55 Trans Amadi Industrial Layout PORT HARCOURT - Nigeria
NGN F.C. 100.00 F.C. 100.00
(a) Sonaid was consolidated under the equity method in the 2016 Group’s accounts (see Note 6.2).
* F.C.: Full Consolidation
84 – SPIE CONSOLIDATED FINANCIAL STATEMENTS – FY 2016