WORKING GROUP 2 / GROUP DE TRAVAIL 2
136
“Quaderni di Ricerca in Didattica (Mathematics)”, n. 25, Supplemento n.2, 2015 G.R.I.M. (Departimento di Matematica e Informatica, University of Palermo, Italy) 201 WORKING GROUP 2 / GROUP DE TRAVAIL 2 Teacher education / La formation des enseignants
-
Upload
khangminh22 -
Category
Documents
-
view
1 -
download
0
Transcript of WORKING GROUP 2 / GROUP DE TRAVAIL 2

“Quaderni di Ricerca in Didattica (Mathematics)”, n. 25, Supplemento n.2, 2015 G.R.I.M. (Departimento di Matematica e Informatica, University of Palermo, Italy)
201
WORKING GROUP 2 / GROUP DE TRAVAIL 2
Teacher education / La formation des enseignants

“Quaderni di Ricerca in Didattica (Mathematics)”, n. 25, Supplemento n.2, 2015 G.R.I.M. (Departimento di Matematica e Informatica, University of Palermo, Italy)
202

“Quaderni di Ricerca in Didattica (Mathematics)”, n. 25, Supplemento n.2, 2015 G.R.I.M. (Departimento di Matematica e Informatica, University of Palermo, Italy)
203
Working Group 2 / Group de Travail 2
Teacher education / La formation des enseignants
Animators: Daniela Ferrarello, Ruhal Floris and Joaquin Gimenez Rodriguez
It is impossible to talk about obstacles in mathematics learning and possible resources to overall them, without talking also about obstacles and resources in mathematics teaching. Different aspects of mathematics teacher education are studied by researcher: affective problems, lived not only by students who dislike mathematics, but also by teachers (think about primary teachers who sometimes have not personal disposition towards mathematics), problems about an effective inclusion of technology in mathematics teaching, links between teachers’ beliefs and their teaching styles, and many others. Our group worked on teachers’ education problems, reflecting on the following questions: • How is it possible to support teachers to develop suitable knowledge and competences in digital technologies, so that they are effective in their mathematics teaching? • What are the main obstacles for mathematics teacher development? • How can the social dimension become a resource for teacher education? What are the challenges of programs strongly based on social interaction in communities of practice/enquiry? • How can the affective dimension become a resource for teacher education? The discussion started with papers on teachers’ beliefs and word problems and the following papers were presented: “Investigating future primary teachers' grasping of situations related to unequal partition word problems” (Samková Ticha), “L’orientation des enseignants de mathématiques et sciences sur les modèles constructivistes et transmissivistes d'enseignement. Les résultats de la recherche Prisma sur les enseignants valdôtains des niveaux primaire et secondair” (Zanetti et al.) and “Do teacher's beliefs regarding the pupil's mistake influence willingness of pupils to solve difficult word problems?” (Bruna). The second session was especially on mathematical knowledge requested to teachers, with the contribution of “Is this a proof? Future teachers’ conceptions of proof” (Gomes et al.), “Study about the knowledge required from teachers to teach probability notions in early school years” (Pietropaolo et al.) and “A Pedagogical Coaching Design Focused on The Pedagogy of Questioning in Teaching Mathematics” (Mulat, Berman). In the third session we focused on problems of pre-service teachers by discussing on the following themes: “Additive conceptual knowledge for admission to the degree in primary education: an ongoing research” (Castro et al.), “Collaborative study groups in teacher development: a university - school project” (Galvão), “Pre-service teacher conceptualisation of mathematics” (Cooke), “Math trails a rich context for problem posing - an experience with pre-service teachers” (Vale et al.), “Pre-service Teachers’ Informal Inferential Reasoning” (Orta Amaro et al.) and “Sociocultural contexts as difficult resources being incorporated by prospective mathematics teachers” (Vanegas et al.). The last day the discussion was about technology and its appropriate integration in the teaching/learning process. Papers also dealt with experiments in school, especially in secondary level, and were focused on “Pedagogical use of tablet in Mathematics Teachers Continued Education” (Prado et al.), on the integration of digital environments in the teaching of mathematics, “Un dispositif de formation initiale pour l’integration d’environnements numeriques dans l’enseignement des mathematiques au secondaire” (Floris), on “Instrumentation didactique des futurs enseignants de mathématiques. Exemple de la co-variation” (Venant), on “Mathematics

“Quaderni di Ricerca in Didattica (Mathematics)”, n. 25, Supplemento n.2, 2015 G.R.I.M. (Departimento di Matematica e Informatica, University of Palermo, Italy)
204
Teaching and Digital Technologies: a challenge to the teacher's everyday school life” (Lobo de Costa et al.), on the possibility to take into account learning styles to raise up low-performed students “Rescuing casualties of mathematics” (Ferrarello). As a final discussion, taking into account all the themes, we reflected on obstacles and resources in teaching/learning mathematics, finding out that everything could be an obstacle, if it is unsuitably handled or a resource if it is suitably handled. We analyzed some components of the teaching/learning process and identified them as obstacles or resources, depending on their unfitting or fitting handling: An a-priori analysis or other didactical tools can be obstacles in case of a mismatch between teacher and students paces, or resources in case of a match of the paces. The delay in the answers, after a question posed by the teacher, can be an obstacle if the teacher does not give space to questioning and argumentation, or a resource if he/she stimulates questions, making students think. Collaboration with colleagues and researchers and recourse to books and other teaching material can be obstacles if done in the classical “theory/practice”-model, or resources if collaboration is open and if there is space for special activities based on game-problems rather than on pure technique and on concrete models. Real-world problems also have a double-face: they are good resources if they are well linked with mathematical topics, but sometimes they rise problems not solvable by students. Students learning styles can be an obstacle, because teachers often have one teaching style, which does not fit with students’ learning styles. Instead, when they are considered, they can help the whole class to get different perspectives. Technology, in the end, is not a panacea to solve every problem and can be an obstacle or a resource if it seen as “instrumentalisation” or “instrumentation”, respectively. And finally we concluded that a good tool for a teacher to pass from an unfitting handling of a component of teaching/learning process to an effective handling of it, is awareness. To be aware of their teaching processes teachers have to be supported by research and researchers in their pre-service and continuous education.

“Quaderni di Ricerca in Didattica (Mathematics)”, n. 25, Supplemento n.2, 2015 G.R.I.M. (Departimento di Matematica e Informatica, University of Palermo, Italy)
205
Math trails a rich context for problem posing - an experience with pre-service teachers
Isabel Vale1, Ana Barbosa2, Teresa Pimentel3
School of Education of the Polytechnic Institute of Viana do Castelo, Portugal [email protected]; [email protected]; [email protected]
Abstract: This paper presents a study about the potential of the construction of creative math trails as a non-formal context in the teaching and learning of mathematics. This research is of qualitative nature and was developed with future teachers of basic education. Preliminary results suggest that despite the construction of the trail not being easy, including the process of designing the tasks, it was possible to identify traces of originality and involvement on the part of future teachers.
Résumé: Cet article présente une étude sur le potentiel de la construction d’un sentier mathématique créatif en tant que contexte non formel dans l'enseignement et l'apprentissage des mathématiques. Cette étude qualitative a été développée avec des futurs enseignants en éducation primaire. Les résultats préliminaires suggèrent que, quoique la construction du sentier ne soit pas facile, comprenant le processus de création des tâches, il a été possible d'identifier des traces d'originalité et d’engagement de la part des futurs enseignants.
Introduction There are many students who dislike mathematics, or don’t understand the purpose of studying it, because they never had the chance to enjoy it or maybe they didn’t have the opportunity to be exposed to an adequate teaching. This can lead to demotivation and poor results on the assessment of this subject. In this sense, as teachers have a key role on what is going on in the classroom, teacher education should promote a new vision about mathematics knowledge and teaching, allowing future teachers to experience the same tasks that it’s expected they will use with their own students. In recent decades, problem solving has played an important role a bit around the world, as an organizing axis of the mathematics curriculum. Students’ mathematics learning should include more than routine tasks, it should be enriched with challenging tasks, such as problem solving and posing. This is of great importance, not only for students but also for teachers, especially if these tasks lead to structural understanding of mathematical concepts and encourage fluency, flexibility and originality as essential components of creative thinking. If the teacher does not provide moments in which students are creative it will deny them any opportunity to develop their skills in mathematics, but also to appreciate this subject. Teachers have a determinant role in the teaching process, so, according to that perspective, teacher education should promote a new vision about mathematics knowledge and its teaching, experiencing the same tasks that we expected they will use with their own pupils.
To overcome some of the referred shortcomings, we developed a project named Mathematical Trails outside the classroom. With this project, we intended to promote the contact with a contextualized mathematics, starting from the daily life features, walking through and analyzing the city where we live in, connecting some of its details with exploration and investigation tasks in school mathematics. Our aim is to study the impact of mathematical trails in the teaching and learning of mathematics, as non-formal contexts outside of the classroom. In order to do this, the following questions were considered: (1) In what way the construction of the trails can contribute to the promotion of creativity in mathematics?; (2) Which mathematical contents may emerge from the formulation of the tasks based on the local environment?; (3) Which difficulties are experienced by the participants in the construction of the trails?; (4) How do future teachers relate with non-formal contexts in the learning of mathematics?

“Quaderni di Ricerca in Didattica (Mathematics)”, n. 25, Supplemento n.2, 2015 G.R.I.M. (Departimento di Matematica e Informatica, University of Palermo, Italy)
206
Theoretical Framework Problem solving, problem posing and creativity It is essential to invest in innovative educational initiatives aimed at student motivation for learning mathematics and at the development of higher order cognitive skills, such as problem solving, communication and reasoning. Creativity is also a transversal ability that should be highlighted in these experiences, since it involves curiosity and raises imagination and originality, being directly related to problem posing and solving. In fact, research findings show that mathematical problem solving and posing are closely related to creativity (e.g. Leikin, 2009; Silver, 1997). Environments where students have the opportunity to solve problems with multiple resolutions and create their own problems, allow them to be engaged and motivated, to think divergently, hence to be creative. Analyzing this relation with more depth we can say that, in order to trigger creativity, the tasks used must be open-ended and ill structured, allowing students to exhibit the previously mentioned dimensions of creative thinking, fluency (ability to generate a great number of ideas and refers to the continuity of those ideas, flow of associations, and use of basic knowledge), flexibility (ability to produce different categories or perceptions whereby there is a variety of different ideas about the same problem or thing) and originality (ability to create fresh, unique, unusual, totally new, or extremely different ideas or products. It refers to a unique way of thinking) (e.g. Leikin, 2009; Silver, 1997). As we said before, creativity has strong connections with problems and the process of creating problems has been defined in various ways and with different terms like invent, create, pose, formulate. Silver (1997) considers problem posing either being the generation (creation) of new problems or the reformulation of a given problem. Stoyanova (1998) considers problem posing as the process by which, on the basis of mathematical experience, students construct personal interpretations of concrete situations and formulate them as meaningful mathematical problems. The problem posing activity involves for the student to problematize situations using his/her own language, experiences and knowledge. Brown and Walter (2005) discuss two problem posing strategies. The first strategy is Accepting the given, which starts with a static situation that can be an expression, a table, a condition, a picture, a diagram, a phrase, a calculation or simply a set of data, from which the student poses questions to have a problem, without changing the given. The second consists of extending the task by changing the given using the What-If-Not strategy. From the information of a particular problem, we identify what is the problem, what is known, what is in demand and the constraints that the answer to the problem involves. Modifying one or more of these issues and questions that are formulated in turn, may generate more questions.
So, in the frame of problem solving we are talking about tasks that enable different approaches to find a solution, hence promoting divergent thinking. As for problem posing, either by reformulating a given situation or creating something new, the creativity relies on the relational nature of the mathematical knowledge used. It’s important to state that these tasks shouldn’t be considered separately, since the creative activity results from the interplay of reformulating, attempting to solve, and eventually solving a problem.
Teachers have a critical role since they have the power to unlock students’ creative potential. So it’s fundamental to offer pre-service teachers diverse experiences, in order for them to develop a new vision about mathematical knowledge and teaching, allowing them to experience the same tasks that we expect them to use with their pupils.
Math Trail Bolden, Harries and Newton (2010) consider important to discuss with (future) teachers their beliefs about creativity in mathematics, trying to perceive how these ideas impact their teaching strategies and translate into classroom practice. In this sense, it is not enough that teachers know the general

“Quaderni di Ricerca in Didattica (Mathematics)”, n. 25, Supplemento n.2, 2015 G.R.I.M. (Departimento di Matematica e Informatica, University of Palermo, Italy)
207
meaning of creativity, but understand that the dimensions or characteristics of creativity can vary with the subject and the context they are dealing with. It’s crucial that professional development promotes reflection about these issues (Vale, Barbosa & Pimentel, 2014).
However, very often students don’t develop such abilities, aren’t able to make connections among different topics and use diversified tools to approach the same problem, since curriculum features and extension leads teachers to avoid this type of exploration. In this context we must stress the importance of complementing learning in other environments, like non-formal contexts. Normally completion-like environments, clubs, journals, lectures, projects, can give students the chance to enjoy mathematics, that, due to several factors, could never experience its beauty (Kenderov et al., 2009). For some students, the simple fact of participation is a great success (Pimentel & Vale, 2014).
The classroom is just one of the "homes" where education takes place (Kenderov et al., 2009). The process of acquiring information and the development of knowledge by students can occur in many ways and in many places. Whereas the stimulus for an affective environment can influence the initial expectations and motivations of students, the use of the surroundings as an educational context can promote positive attitudes and additional motivation for the study of mathematics, allowing them to understand its applicability. The math trails arise in this context. They are considered as a sequence of stops along a pre-planned route by which students can learn mathematics in the environment (Cross, 1997) and offer concrete learning experiences for any of the mathematics concepts taught in the school curriculum. It also offers huge potential for learning experiences at all ages. This type of activity facilitates the creation of a non-formal meeting space, focused on learning, and also the approach to problem posing and solving, the establishment of connections and the encouragement of communication, applying these skills in a meaningful context. A bounty of opportunities exist to utilize the outdoors in orchestrating learning experiences, not only in mathematics, but also through the integration of knowledge with outcomes stated in other learning areas. Because it takes place outside the classroom, a math trail creates an atmosphere of adventure and exploration, giving students the opportunity to solve problems (in real life context) and pose problems. By learning to solve problems and by learning through problem solving, students are given numerous opportunities to connect mathematical ideas and to develop conceptual understanding, having also opportunities to develop their creative thinking. In this sense, students are effectively motivated to learn mathematics, discovering its role in the environment, and simultaneously mobilize fundamental abilities and attitudes. Encouraging teachers to propose problems to their students and supervising their work can increase their professionalism and confidence in these activities, developing their competence and enthusiasm in future teaching/learning actions in contexts outside of the classroom. Teachers have a key role here, being highly relevant to study their knowledge and perceptions, particularly in innovative initiatives.
Methodology Based on the goals of this study we adopted a qualitative methodology of exploratory nature. The participants were 70 future teachers of basic education (3-12 years old) that attended a unit course of Didactics of Mathematics.
Throughout the classes of this subject they were provided with diversified experiences, distributed in curricular modules, focusing on: problem posing and solving (Silver, 1997); creativity in mathematics (e.g. Leikin, 2009); the establishment of connections, particularly those involving mathematics and daily life; and other mathematical processes (e.g. communication, reasoning, representations). In addition to these aspects, some examples of math trails were explored in this unit course in order to clarify its structure and allow these future teachers to perceive the presence
“Quaderni di Ricerca in Didattica (Mathematics)”, n. 25, Supplemento n.2, 2015 G.R.I.M. (Departimento di Matematica e Informatica, University of Palermo, Italy)
208
of the previously analysed abilities (problem posing and solving, creativity, connections). After these teaching modules, the participants had to build a math trail in small groups, based in the city of Viana do Castelo, posing tasks centred on elements of the local environment, aimed at basic education students (3-12 years old) school. First they had to choose an artery of the city that would constitute the route to be explored in the math trail. Then, along that route, the future teachers took photographs of elements that had potential for mathematical exploration. These photographs would be the basis to design the tasks in the trail. During the lessons of this unit course, the participants shared and discussed the photographs taken along the trail they selected, and they also presented some hypothesis of tasks formulated, based on those elements. Mostly they used as problem posing strategy accepting the data (Brown & Walter, 2005), since they started with static situations, the photographs (e.g. windows, buildings, monuments, gardens, doors, wrought iron, tiles), on which they formulated problems without changing what was given.
Data was collected in a holistic, descriptive and interpretative way and included classroom observations and document analysis, mainly focusing on written records of the math trails and on a questionnaire centred in the opinion of the participants about this type of work (e.g. difficulties, potential, impact). In the data analysis the criteria used were: creativity, diversity and rigor of the mathematical contents.
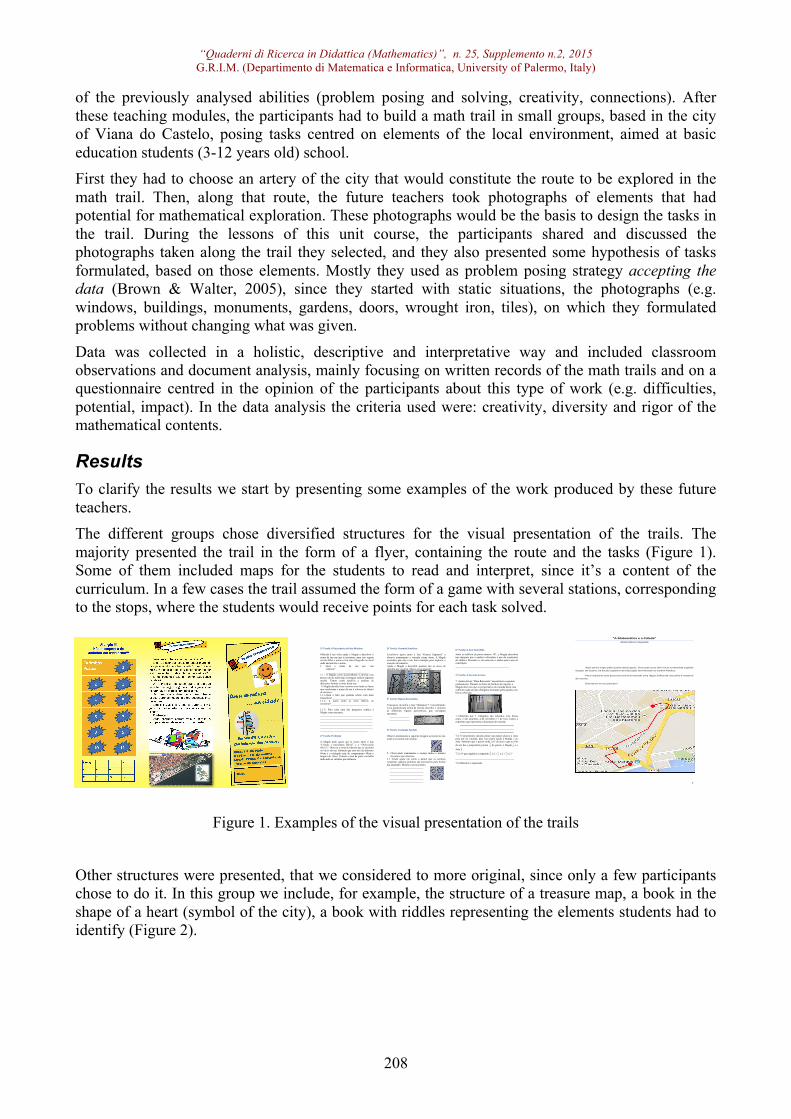
Results To clarify the results we start by presenting some examples of the work produced by these future teachers. The different groups chose diversified structures for the visual presentation of the trails. The majority presented the trail in the form of a flyer, containing the route and the tasks (Figure 1). Some of them included maps for the students to read and interpret, since it’s a content of the curriculum. In a few cases the trail assumed the form of a game with several stations, corresponding to the stops, where the students would receive points for each task solved.
Figure 1. Examples of the visual presentation of the trails
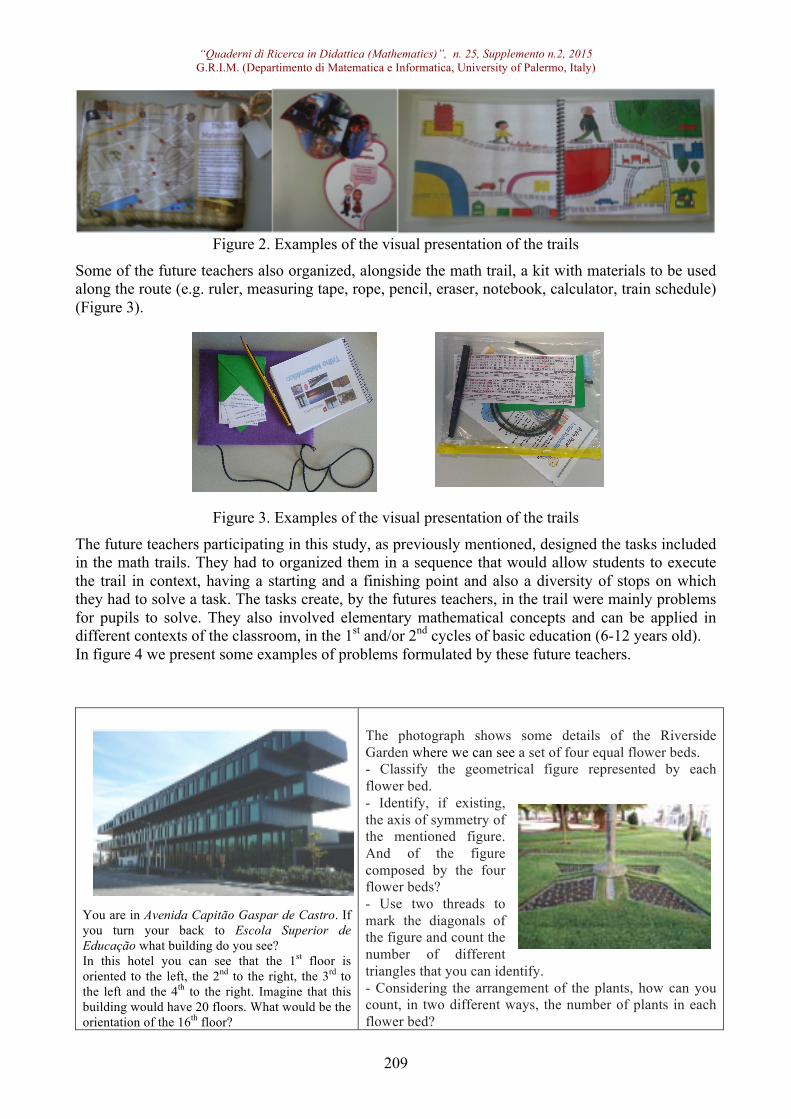
Other structures were presented, that we considered to more original, since only a few participants chose to do it. In this group we include, for example, the structure of a treasure map, a book in the shape of a heart (symbol of the city), a book with riddles representing the elements students had to identify (Figure 2).
1º Tarefa: À Descoberta da Rua Mistério Olhando à tua volta ajuda a Magda a descobrir o nome da rua em que te encontras, para isso regista na tua folha o nome e tira uma fotografia ao local onde encontraste o nome. 1. Qual o nome da rua que vais
explorar?________________________________________________________________
1.1 - A Magda, como já percebeste, é curiosa, mas precisa da tua ajuda para conseguir realizar algumas tarefas. Vamos então ajudá-la a analisar de diferentes formas o nome desta rua: A Magda decidiu fazer recortes com todas as letras que constituem o nome da rua e colocou-os dentro de um saco: 1.1.1-Qual a letra que poderás retirar com mais frequência?____________________________ 1.1.2- E quais serão as mais difíceis de encontrar?_____________________________ 1.1.3- Para cada uma das perguntas explica à Magda como pensaste. __________________________________________________________________________________________________________________________________________________________________________________________________________________________________________________ 2ª Tarefa: Proibição A Magda pede agora que te situes entre a loja “Cristais e porcelanas David” e a “Ourivesaria Silva’s”. Observa o sinal de trânsito que se encontra no início da rua. Sabendo que este tem de diâmetro 60cm e o retângulo tem de comprimento 40cm e largura de 10cm. Calcula a área da parte vermelha indicando os cálculos que efetuaste.
3ª Tarefa: Varanda Simétrica Localiza-te agora junto à loja “Kourus Sapataria” e observa atentamente a varanda acima desta. A Magda considera que este é um bom exemplo para explorar o conceito de simetria. Ajuda a Magda a descobrir quantos são os eixos de simetria que existem. Marca-os na imagem:
4ª Tarefa: Figuras Escondidas Consegues encontrar a loja “Opipapua”? Concentrando-te no gradeamento acima da mesma descobre e enumera as diferentes figuras geométricas que consegues encontrar.
5ª Tarefa: O Azulejo Perdido Observa atentamente a seguinte imagem e procura na rua onde se encontra este azulejo :
5. Observando atentamente o azulejo indica o número
de pontos que observas. 5.1 Tendo agora em conta o painel que os azulejos compõem, quantos potinhos são necessários para formar um quadrado. Mostra o teu raciocínio.
6ª Tarefa: O Ano Escondido
Junto ao edifício da porta número 187, a Magda descobriu um elemento que a ajudou a descobrir o ano de construção do edifício. Descobre-o, tira uma foto e indica qual o ano de construção. __________________________________________ 7ª Tarefa: A Varanda Festiva 7. Acima da loja “Dina Retrosaria” encontrarás o seguinte gradeamento. Durante as festas da Senhora da Agonia, a Magda observou que os proprietários da varanda desta casa cobriram cada um dos retângulos formados pelas grades com faixas coloridas.
7.1-Sabendo que 3 retângulos são coloridos com faixas azuis, 2 são amarelos, 4 de vermelho e 1 de roxo. Indica a expressão que representa a decoração da varanda.
__________________________________________________________________________________________________________________
7.2- O proprietário decidiu pintar um painel alusivo à festa para por na varanda, para isso pediu ajuda à Magda e ao João. Sabendo que o painel tinha 2m2 de área e que ao fim de um dia o proprietário pintou do painel, a Magda e o
João . 7.2.1-O que significa a expressão x 2 + x 2 + x 2 ?
______________________________________________
7.2.2-Resolve a expressão.
Para obter informações sobre vagas ou para enviar o seu currículo, visite o nosso Web site em: www.lucernepublishing.com
______________________________________________________________________________________________________________
_______________________________________
“A Matemática e a Cidade”
Matemática Integrada
3
Aqui está o mapa pelo qual te deves guiar. O teu percurso tem início na Avenida Capitão Gaspar de Castro, na Escola Superior de Educação terminando no Jardim Público.
Para realizares este percurso será te fornecido uma régua, folhas de rascunho e material de escrita.
Diverte-te no teu passeio!
“Quaderni di Ricerca in Didattica (Mathematics)”, n. 25, Supplemento n.2, 2015 G.R.I.M. (Departimento di Matematica e Informatica, University of Palermo, Italy)
209
Figure 2. Examples of the visual presentation of the trails
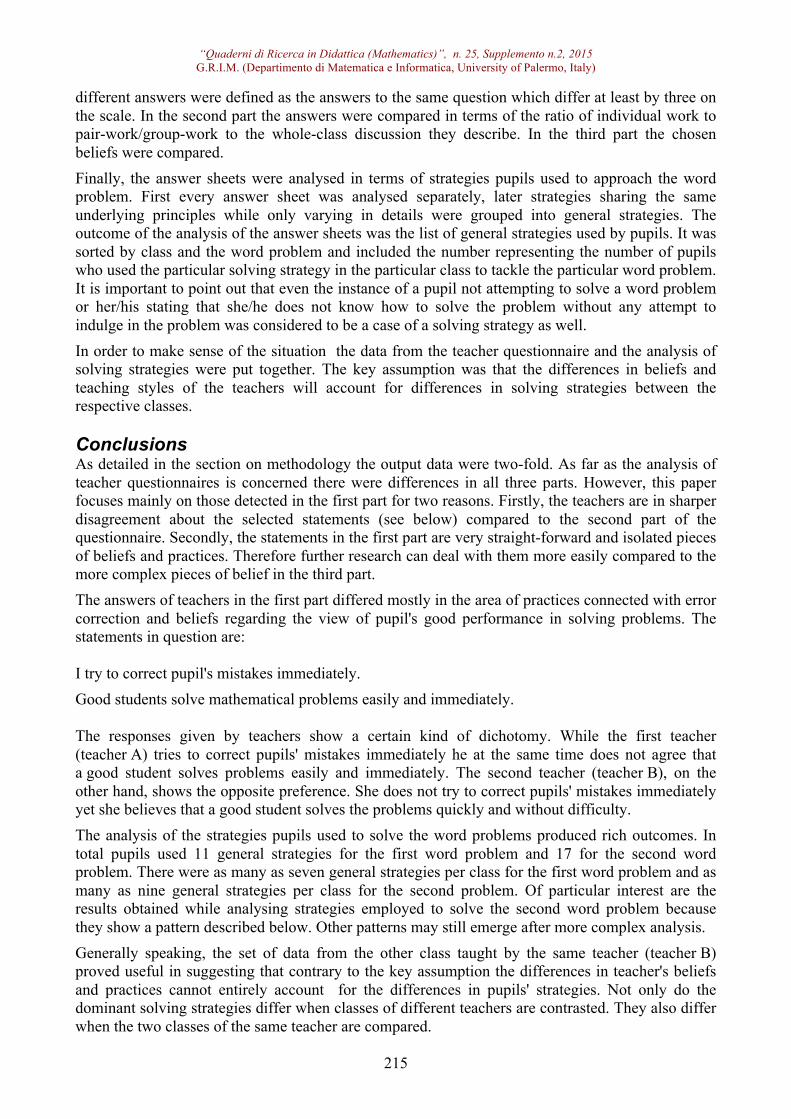
Some of the future teachers also organized, alongside the math trail, a kit with materials to be used along the route (e.g. ruler, measuring tape, rope, pencil, eraser, notebook, calculator, train schedule) (Figure 3).
Figure 3. Examples of the visual presentation of the trails
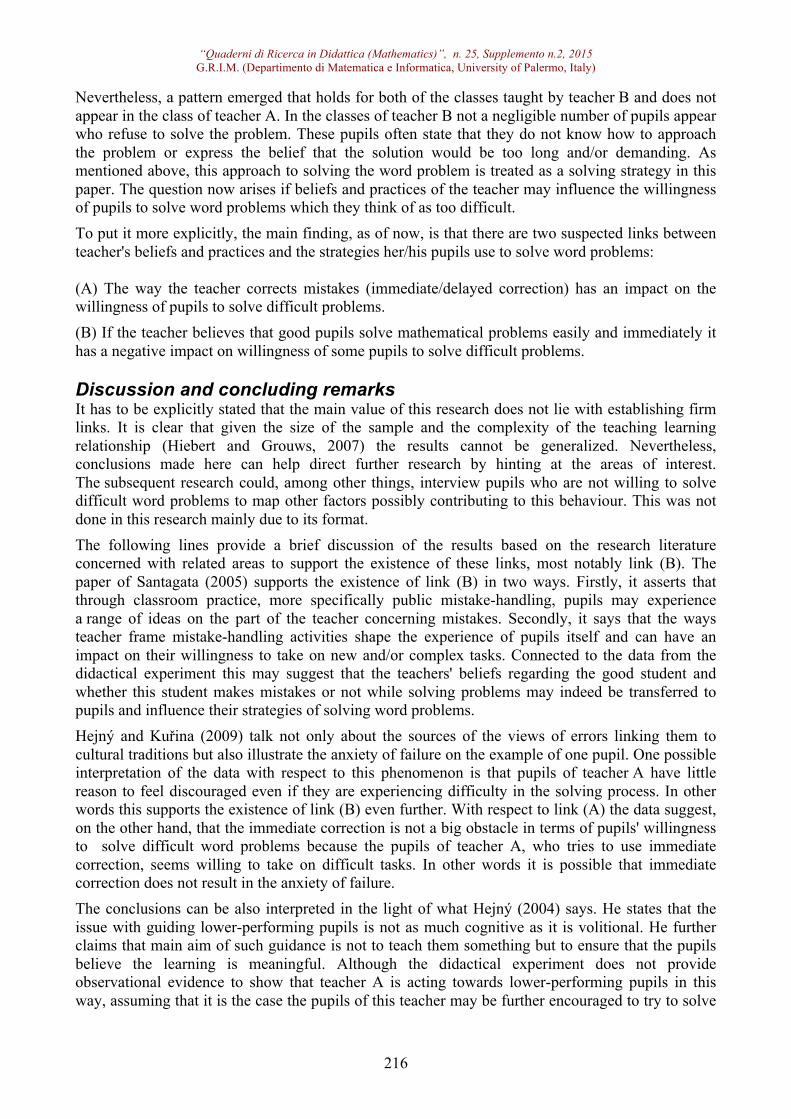
The future teachers participating in this study, as previously mentioned, designed the tasks included in the math trails. They had to organized them in a sequence that would allow students to execute the trail in context, having a starting and a finishing point and also a diversity of stops on which they had to solve a task. The tasks create, by the futures teachers, in the trail were mainly problems for pupils to solve. They also involved elementary mathematical concepts and can be applied in different contexts of the classroom, in the 1st and/or 2nd cycles of basic education (6-12 years old). In figure 4 we present some examples of problems formulated by these future teachers.
You are in Avenida Capitão Gaspar de Castro. If you turn your back to Escola Superior de Educação what building do you see? In this hotel you can see that the 1st floor is oriented to the left, the 2nd to the right, the 3rd to the left and the 4th to the right. Imagine that this building would have 20 floors. What would be the orientation of the 16th floor?
The photograph shows some details of the Riverside Garden where we can see a set of four equal flower beds. - Classify the geometrical figure represented by each flower bed. - Identify, if existing, the axis of symmetry of the mentioned figure. And of the figure composed by the four flower beds? - Use two threads to mark the diagonals of the figure and count the number of different triangles that you can identify. - Considering the arrangement of the plants, how can you count, in two different ways, the number of plants in each flower bed?

“Quaderni di Ricerca in Didattica (Mathematics)”, n. 25, Supplemento n.2, 2015 G.R.I.M. (Departimento di Matematica e Informatica, University of Palermo, Italy)
210
Can you find a pattern? Walk down the Manuel Espregueira street till you find Olivenza street. Continue down this street and on the right stop at the door with the number 37. Observe the wrought iron door and its structure.
Count all the triangles that can you see.
In the Marginal Garden you can find many plants and flower beds. Look at the one in the picture. How do you think the gardener constructed it? Explain the process.
Figure 4. Some examples of problem posing tasks
After finishing this project the participants were given a questionnaire in order for us to get to know their main difficulties, the positive aspects of this work and overall the impact it had on their perspective about mathematics teaching and learning. The design of the tasks was not always an easy process for the participants, which can be understood because it was a new experience and also because of the fact that problem posing is a higher order ability, which implies a regular work. Overall they showed a clear tendency to involve concepts of elementary geometry, since the elements involved in the trail were of a more visual nature. We will present the content of some of the problems posed in the context of the photos that were taken in town, and which were later analysed with detail in order to construct rich problems. As we can see, in Figure 4, the second, the third and the fourth problems deal with geometric figures while the first is based on numerical features. However, in most of them we can observe connections among several topics, namely patterns, visual countings and functions. Geometry (e.g. figures, area, perimeter, volume) and Patterns were the easiest contents to approach. The most difficult was Statistics. Perhaps this relates with the former mathematical experiences of these students in the topic of Patterns and also with the geometrical nature of most of the observations, while it is not so natural a connection with statistics.
Another weakness which was reflected in the final work concerns the ignorance of the measures of the buildings/monuments, and the difficulty in making estimations. Overall we noted that for the great majority of the students it was not easy to pose problems based on the local environment. We as teachers wanted students to use diverse elements of the environment, as well as diversify the questions posed and this is not easy because this competence also relates with previous knowledge and mathematical experiences of the students. The discussions generated in the classes provided clarification on some confusing aspects of tasks, allowing students to do some refinement. In the words of these future teachers this project had a positive impact on their perspective about mathematics, allowing them to perceive things like: This project changed my perspective about Mathematics because I always explored it in the classroom; I started to look to everything around me with math eyes; I knew we could connect math to daily life but this project showed me that there is much more than I imagined and we can do spectacular things in math; I loved to walk through the city trying to discover situations that could lead to questions, measuring, testing, …; Students often ask “what is math for?” and this project helps find the answer; The formal work in the classroom can be related to these experiences exploring the contents in a more practical way. We observe math in the real world; This project helps with creativity and allows us to know better our city; With this type of work we can motivate the interest and taste for mathematics contributing to students learning.

“Quaderni di Ricerca in Didattica (Mathematics)”, n. 25, Supplemento n.2, 2015 G.R.I.M. (Departimento di Matematica e Informatica, University of Palermo, Italy)
211
Discussion With this study it was possible to conclude that the future teachers showed a more positive attitude and appreciation towards mathematics and can be a natural extension of the classroom and the work developed in extending their perspective about the possible connections that can be established outside the classroom, in particular with the local environment. The trails, provided a better knowledge of the environment where it was built using a mathematical eye, but also focusing on the culture and heritage of the city. By organizing a math trail (future) teachers improve their problem posing skills and their critical sense, having the opportunity to: be creative (in particular, be original); choose the contents to be approached; show a contextualized and engaging mathematics to their students. Being challenging, based on collaborative work, a math trail can be a way of reaching students of all levels of achievement and also of different grade levels.
It was possible to identify traces of creativity in the tasks, particularly regarding the originality dimension. In general, it can be said that these future teachers showed will and motivation to overcome the obstacles they encountered and the tasks presented in the various trails indicated that this type of work has the potential to promote creativity in mathematics.
REFERENCES Bolden, D., Harries, & Newton, D. (2010). Preservice primary teachers’ conceptions of creativity in mathematics. Educational Studies in Mathematics, 73(2), 143-157.
Brown, S. & Walter, M. (2005). The art of problem posing. Mahwah, NJ: Erlbaum. Cross, R. (1997). Developing Math Trails. Mathematics Teaching, 158, 38–39.
Kenderov, P., Rejali, A., Bartolini Bussi, M., Pandelieva, V., Richter, K., Maschietto, M., Kadijevich, D., & Taylor, P. (2009). Challenges Beyond the Classroom—Sources and Organizational Issues. In E. Barbeau & P. Taylor (Eds.), Challenging Mathematics In and Beyond the Classroom – New ICMI Study Series 12 (pp. 53-96). Springer.
Leikin, R. (2009). Exploring mathematical creativity using multiple solution tasks. In R. Leikin, A., Berman & B. Koichu (Eds.), Creativity in mathematics and the education of gifted students (pp. 129-145). Rotterdam, Netherlands: Sense Publishers. Pimentel, T. & Vale, I. (2014). A Mathematical congress: a window to affect in problem solving. In S., Carreira, N., Amado, K., Jones, & H., Jacinto (Eds.), Proceedings of the Problem@Web International Conference: Technology, creativity and affect in mathematical problem solving, pp. 308-320. Faro, Portugal: Universidade do Algarve. Silver, E. (1997). Fostering creativity through instruction rich in mathematical problem solving and problem posing. ZDM, 3, 75-80. Stoyanova, E. (1998). Problem posing in mathematics classrooms. In A. McIntosh & N. Ellerton (Eds.), Research in Mathematics Education: a contemporary perspective (pp. 164-185). Edith Cowan University: MASTEC
Vale, I., Barbosa, A. & Pimentel, T. (2014). Teaching and learning mathematics for creativity through challenging tasks. In S., Carreira, N., Amado, K., Jones, & H., Jacinto (Eds.), Proceedings of the Problem@Web International Conference: Technology, creativity and affect in mathematical problem solving, p. 335. Faro, Portugal: Universidade do Algarve.

“Quaderni di Ricerca in Didattica (Mathematics)”, n. 25, Supplemento n.2, 2015 G.R.I.M. (Departimento di Matematica e Informatica, University of Palermo, Italy)
212

“Quaderni di Ricerca in Didattica (Mathematics)”, n. 25, Supplemento n.2, 2015 G.R.I.M. (Departimento di Matematica e Informatica, University of Palermo, Italy)
213
Do teacher's beliefs regarding the pupil's mistake influence willingness of pupils to solve difficult word problems?
Jiří Bruna
Department of Mathematics and Mathematical Education Faculty of Education, Charles University in Prague
Magdalény Rettigové 4, 116 39 Praha 1, The Czech Republic [email protected]
Abstract : This paper presents a didactic experiment which focuses on finding possible links between teacher's beliefs and teaching style on the one hand and strategies pupils use to solve complex word problems on the other hand. In this experiment two Czech mathematics teachers and three of their classes of seven graders – one for the first and two for the second teacher – were included. The data were collected from questionnaires for teachers and sheets with pupils' solutions of selected word problems. The outcomes of the experiment suggest that there may be a link between teacher's beliefs regarding the performance in mathematics of a good pupil and willingness of pupils to solve complex, unfamiliar and non-standard (CUN) word problems. Although the results cannot be generalised they show areas of interest for further research into classroom practices and may in the future inform teacher-training as well. Résumé : Cet article présente une expérience didactique qui a pour but d'observer comment le style d'enseignement et la conviction de l'enseignant influencent les stratégies utilisées par les élèves cherchant la solution d'un problème complexe. Cette expérience analyse deux enseignants de mathématiques tchèques et leurs trois classes du niveau du collège (7e année). Les données ont été recueillies à partir des questionnaires pour des enseignants et aussi à partir des fiches de travail remplies par les élèves. À la lumière des données, la conviction de l'enseignant peut etre en rapport avec la bonne capacité de résoudre les problèmes complexes, inconnus et non standards. Les résultats ne peuvent pas être généralisés mais ils signalent des domaines qui peuvent être encore plus examinés dans les recherches futures et qui pourraient être utilisés dans la formation des enseignants. General Introduction This paper aims to introduce a didactical experiment which focuses on linking teacher's beliefs and teaching style to the strategies pupils utilise in order to solve complex word problems. It was conducted as a part of a Ph.D. programme course at the Charles University in Prague. The didactical experiment was conducted at two Czech basic schools, specifically in three classes of seven-graders (approximately twelve years of age) taught by two different teachers. Any research that attempts to establish connections between teaching and learning is necessarily faced with severe obstacles both theoretical and methodological (Hiebert, Grouws, 2007). Because the university course may be considered introductory and the resources, most notably the suitable teachers available, were limited, the main aim of the didactical experiment was not to arrive at conclusive and well-established links. Much rather the main aim was to find potentially significant aspects of teacher's beliefs and teaching practices which may have an impact on solving strategies on the part of their pupils, in the sense that collected data are suggestive of such a link. These findings may be relevant to other researchers covering related areas as well as inform teacher training. As will be shown below the overall framework of the didactical experiment was not so much grounded in theoretical background apart form the article mentioned above. However, there was an attempt to provide links for the findings to other mathematics education research in related areas.

“Quaderni di Ricerca in Didattica (Mathematics)”, n. 25, Supplemento n.2, 2015 G.R.I.M. (Departimento di Matematica e Informatica, University of Palermo, Italy)
214
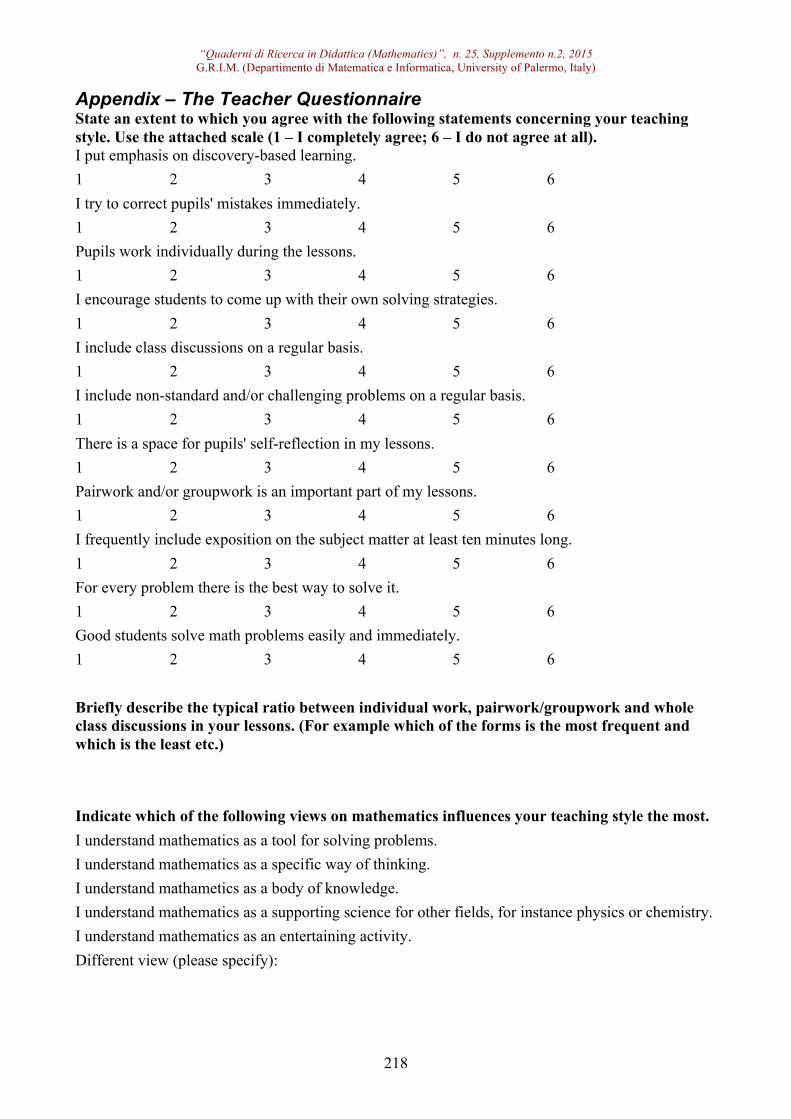
Methodology The didactical experiment in question relies on qualitative approach and was conducted in several stages. In the first stage two word problems were chosen. The criterion for selection was the richness of possible solving strategies. This was necessary for individual differences between students to manifest. This approach was inspired by the article on promoting creativity (Hershkovitz, Peled, Littler, 2009). Furthermore, the word problems were modified in terms of language and clarity so that undesired misunderstandings on the part of pupils were minimised. Both word problems could be classified as complex, unfamiliar, non-routine problems (CUN) (Mevarech, Kramarski, 2014). The following lines present English translations of the two word problems. Word problem 1 The typist was asked to write down numbers from 1 to 500 one by one. How many times does he have to type the digit “1”, provided that he does not make a mistake? Word problem 2 How many times a day is the sum of the digits on the display of a digital alarm clock, which shows time values from 00:00 to 23:59, equal to seven? (For example, the sum of the digits in the time value 02:45 is 0 + 2 + 4 + 5 = 11.) In the second stage the questionnaire for teachers was created and was distributed to two selected teachers. For the English version of the questionnaire see the Appendix at the end of the paper. The only requirement for including the teacher was that she/he teaches seven-graders at a basic school. Teachers of pupils from grammar schools were excluded due to a concern that given the pupils' selection after the fifth-grade this would render the samples of pupils from both kinds of school mutually incomparable. In agreement with the aim of the didactical experiment the questionnaire attempted to cover various areas of teaching practice, most notably interaction patterns and organizing work in the classroom, teacher error correction and pupil's autonomy in the problem solving process, as well as teacher's beliefs on the nature of mathematics, criteria of good pupil's performance and the nature of the solution to the mathematical problem. As far as the structure of the questionnaire is concerned there were three parts. In the first one the scale from one to six was utilised. The second part included one open question regarding the organization of the work in the classroom. In the third part the teacher's task was to select the view of mathematics that influences her/his teaching practice the most. After the questionnaires were collected the didactical experiment continued in the classrooms. In their mathematics lessons the teachers distributed the word problems to their pupils to solve them on pre-prepared sheets of paper with the printed word problem (answer sheets). The teachers were instructed to let pupils solve the first word problem first then conduct a whole-class discussion of the solution, then let the pupils solve the second problem and have a discussion again. The pupils were asked to work individually, although this was not followed in every case. The pupils were not allowed to modify their solution during the discussion. The answer sheets were then collected. The lessons were also video-recorded, however, the main sources of data were the questionnaires for the teachers and the answer sheets. Although the original intention was to include one class per teacher in the didactical experiment, one of the teachers volunteered to let another of her classes solve the word problems as well. The data obtained from this class helped refine the conclusions. In particular it ruled out the differences between solving strategies which would be otherwise attributed to the difference of the teachers although they appear in between the classes of the same teacher as well. In the next stage the questionnaires were analysed and the instances of substantially different answers were found. In order to do this the scale was utilised in the first part. The substantially
“Quaderni di Ricerca in Didattica (Mathematics)”, n. 25, Supplemento n.2, 2015 G.R.I.M. (Departimento di Matematica e Informatica, University of Palermo, Italy)
215
different answers were defined as the answers to the same question which differ at least by three on the scale. In the second part the answers were compared in terms of the ratio of individual work to pair-work/group-work to the whole-class discussion they describe. In the third part the chosen beliefs were compared. Finally, the answer sheets were analysed in terms of strategies pupils used to approach the word problem. First every answer sheet was analysed separately, later strategies sharing the same underlying principles while only varying in details were grouped into general strategies. The outcome of the analysis of the answer sheets was the list of general strategies used by pupils. It was sorted by class and the word problem and included the number representing the number of pupils who used the particular solving strategy in the particular class to tackle the particular word problem. It is important to point out that even the instance of a pupil not attempting to solve a word problem or her/his stating that she/he does not know how to solve the problem without any attempt to indulge in the problem was considered to be a case of a solving strategy as well. In order to make sense of the situation the data from the teacher questionnaire and the analysis of solving strategies were put together. The key assumption was that the differences in beliefs and teaching styles of the teachers will account for differences in solving strategies between the respective classes. Conclusions As detailed in the section on methodology the output data were two-fold. As far as the analysis of teacher questionnaires is concerned there were differences in all three parts. However, this paper focuses mainly on those detected in the first part for two reasons. Firstly, the teachers are in sharper disagreement about the selected statements (see below) compared to the second part of the questionnaire. Secondly, the statements in the first part are very straight-forward and isolated pieces of beliefs and practices. Therefore further research can deal with them more easily compared to the more complex pieces of belief in the third part. The answers of teachers in the first part differed mostly in the area of practices connected with error correction and beliefs regarding the view of pupil's good performance in solving problems. The statements in question are: I try to correct pupil's mistakes immediately. Good students solve mathematical problems easily and immediately. The responses given by teachers show a certain kind of dichotomy. While the first teacher (teacher A) tries to correct pupils' mistakes immediately he at the same time does not agree that a good student solves problems easily and immediately. The second teacher (teacher B), on the other hand, shows the opposite preference. She does not try to correct pupils' mistakes immediately yet she believes that a good student solves the problems quickly and without difficulty. The analysis of the strategies pupils used to solve the word problems produced rich outcomes. In total pupils used 11 general strategies for the first word problem and 17 for the second word problem. There were as many as seven general strategies per class for the first word problem and as many as nine general strategies per class for the second problem. Of particular interest are the results obtained while analysing strategies employed to solve the second word problem because they show a pattern described below. Other patterns may still emerge after more complex analysis. Generally speaking, the set of data from the other class taught by the same teacher (teacher B) proved useful in suggesting that contrary to the key assumption the differences in teacher's beliefs and practices cannot entirely account for the differences in pupils' strategies. Not only do the dominant solving strategies differ when classes of different teachers are contrasted. They also differ when the two classes of the same teacher are compared.
“Quaderni di Ricerca in Didattica (Mathematics)”, n. 25, Supplemento n.2, 2015 G.R.I.M. (Departimento di Matematica e Informatica, University of Palermo, Italy)
216
Nevertheless, a pattern emerged that holds for both of the classes taught by teacher B and does not appear in the class of teacher A. In the classes of teacher B not a negligible number of pupils appear who refuse to solve the problem. These pupils often state that they do not know how to approach the problem or express the belief that the solution would be too long and/or demanding. As mentioned above, this approach to solving the word problem is treated as a solving strategy in this paper. The question now arises if beliefs and practices of the teacher may influence the willingness of pupils to solve word problems which they think of as too difficult. To put it more explicitly, the main finding, as of now, is that there are two suspected links between teacher's beliefs and practices and the strategies her/his pupils use to solve word problems: (A) The way the teacher corrects mistakes (immediate/delayed correction) has an impact on the willingness of pupils to solve difficult problems. (B) If the teacher believes that good pupils solve mathematical problems easily and immediately it has a negative impact on willingness of some pupils to solve difficult problems. Discussion and concluding remarks It has to be explicitly stated that the main value of this research does not lie with establishing firm links. It is clear that given the size of the sample and the complexity of the teaching learning relationship (Hiebert and Grouws, 2007) the results cannot be generalized. Nevertheless, conclusions made here can help direct further research by hinting at the areas of interest. The subsequent research could, among other things, interview pupils who are not willing to solve difficult word problems to map other factors possibly contributing to this behaviour. This was not done in this research mainly due to its format. The following lines provide a brief discussion of the results based on the research literature concerned with related areas to support the existence of these links, most notably link (B). The paper of Santagata (2005) supports the existence of link (B) in two ways. Firstly, it asserts that through classroom practice, more specifically public mistake-handling, pupils may experience a range of ideas on the part of the teacher concerning mistakes. Secondly, it says that the ways teacher frame mistake-handling activities shape the experience of pupils itself and can have an impact on their willingness to take on new and/or complex tasks. Connected to the data from the didactical experiment this may suggest that the teachers' beliefs regarding the good student and whether this student makes mistakes or not while solving problems may indeed be transferred to pupils and influence their strategies of solving word problems. Hejný and Kuřina (2009) talk not only about the sources of the views of errors linking them to cultural traditions but also illustrate the anxiety of failure on the example of one pupil. One possible interpretation of the data with respect to this phenomenon is that pupils of teacher A have little reason to feel discouraged even if they are experiencing difficulty in the solving process. In other words this supports the existence of link (B) even further. With respect to link (A) the data suggest, on the other hand, that the immediate correction is not a big obstacle in terms of pupils' willingness to solve difficult word problems because the pupils of teacher A, who tries to use immediate correction, seems willing to take on difficult tasks. In other words it is possible that immediate correction does not result in the anxiety of failure. The conclusions can be also interpreted in the light of what Hejný (2004) says. He states that the issue with guiding lower-performing pupils is not as much cognitive as it is volitional. He further claims that main aim of such guidance is not to teach them something but to ensure that the pupils believe the learning is meaningful. Although the didactical experiment does not provide observational evidence to show that teacher A is acting towards lower-performing pupils in this way, assuming that it is the case the pupils of this teacher may be further encouraged to try to solve

“Quaderni di Ricerca in Didattica (Mathematics)”, n. 25, Supplemento n.2, 2015 G.R.I.M. (Departimento di Matematica e Informatica, University of Palermo, Italy)
217
difficult word problems through their belief that such a behaviour is meaningful, in agreement with link (B). Furthermore the collected data may serve as particular example of teacher beliefs that influence error-handling practices of teachers in the classroom. The connection between beliefs and error-handling practices is established for example in Bray (2011). As such the findings of this experiment may be of interest to researchers interested in teacher development and teacher trainers.
REFERENCES
Bray, W. S. (2011). A Collective Case Study of the Influence of Teachers' Beliefs and Knowledge on Error-Handling Practices During Class Discussion of Mathematics. Journal for Research in Mathematics Education, 42(1), 2-38.
Hejný, M. (2004). Chyba Jako Prvek Edukační Strategie Učitele. Dvacet Pět Kapitol Z Didaktiky Matematiky. Praha: Univerzita Karlova v Praze - Pedagogická Fakulta, 2004. 63-80. Hejný, M., & Kuřina, F. (2009). Dítě, škola a matematika: Konstruktivistické přístupy k vyučování. Praha: Portál. Hershkovitz, S., Peled, I., & Littler, G. (2009). Mathematical creativity and giftedness in elementary school: Task and teacher promoting creativity for all. Creativity in mathematics and the education of gifted students, 255-269.
Hiebert, J., & Grouws, D. A. (2007). The Effects of Classroom Mathematics Teaching on Students' Learning. Second Handbook of Research on Mathematics Teaching and Learning a Project of the National Council of Teachers of Mathematics. Charlotte, NC: Information Age Pub., 371-404.
Mevarech, Z., & Kramarski, B. (2014). Critical Maths for Innovative Societies: The Role of Metacognitive Pedagogies. Paris, France: OECD.
Santagata, R. (2005). Practices and Beliefs in Mistake-handling Activities: A Video Study of Italian and US Mathematics Lessons. Teaching and Teacher Education, 21, 491-508.
“Quaderni di Ricerca in Didattica (Mathematics)”, n. 25, Supplemento n.2, 2015 G.R.I.M. (Departimento di Matematica e Informatica, University of Palermo, Italy)
218
Appendix – The Teacher Questionnaire State an extent to which you agree with the following statements concerning your teaching style. Use the attached scale (1 – I completely agree; 6 – I do not agree at all). I put emphasis on discovery-based learning. 1 2 3 4 5 6 I try to correct pupils' mistakes immediately. 1 2 3 4 5 6 Pupils work individually during the lessons. 1 2 3 4 5 6 I encourage students to come up with their own solving strategies. 1 2 3 4 5 6 I include class discussions on a regular basis. 1 2 3 4 5 6 I include non-standard and/or challenging problems on a regular basis. 1 2 3 4 5 6 There is a space for pupils' self-reflection in my lessons. 1 2 3 4 5 6 Pairwork and/or groupwork is an important part of my lessons. 1 2 3 4 5 6 I frequently include exposition on the subject matter at least ten minutes long. 1 2 3 4 5 6 For every problem there is the best way to solve it. 1 2 3 4 5 6 Good students solve math problems easily and immediately. 1 2 3 4 5 6 Briefly describe the typical ratio between individual work, pairwork/groupwork and whole class discussions in your lessons. (For example which of the forms is the most frequent and which is the least etc.) Indicate which of the following views on mathematics influences your teaching style the most. I understand mathematics as a tool for solving problems. I understand mathematics as a specific way of thinking. I understand mathametics as a body of knowledge. I understand mathematics as a supporting science for other fields, for instance physics or chemistry. I understand mathematics as an entertaining activity. Different view (please specify):

“Quaderni di Ricerca in Didattica (Mathematics)”, n. 25, Supplemento n.2, 2015 G.R.I.M. (Departimento di Matematica e Informatica, University of Palermo, Italy)
219
Additive conceptual knowledge for admission to the degree in primary education: an ongoing research1
Angela Castro, Núria Gorgorió y Montserrat Prat2.
Departamento de Didáctica de la Matemática y las Ciencias Experimentales, Universidad Autónoma de Barcelona, G5-142, Campus UAB Bellaterra 08193, Barcelona, España.
[email protected]; [email protected]; [email protected]
Abstract: It is desirable for students starting their Degree in Primary Education to possess some preliminary disciplinary knowledge. The results presented herein are part of an ongoing study that aims to establish and evaluate the extent of Basic Mathematical Knowledge, in its conceptual sense, required to initiate didactics of addition and subtraction (from now on referred to as CBMK-A). For this purpose, it is invaluable to identify additive knowledge profiles in students of the Degree in Primary Education, being of great assistance when planning the class module “didactics of arithmetic”. Specifically, we present the 4 components which make up this CBMK-A, including some of the tools for their evaluation. Résumé : Il y a savoirs disciplinaires en mathématiques qu’ils sont souhaitable que les étudiants de la Maîtrise en Éducation Primaire (MEP) doivent avoir aux commencer leur formation. Nous présentons le cadre d'une étude en cours, dont l’objectif est établir et évaluer la connaissance mathématique fondamentale (dans son aspect conceptuel) nécessaire pour commencer à enseigner addition et la soustraction (CMFC-A). L'identification des profils de connaissances additifs d'étudiants de la MEP, est une information précieuse pour guider la planification des cours à la didactique de l'arithmétique. Plus précisément, nous présentons les 4 éléments qui composent cette CMFC-A, avec une partie de l'instrument pour les évaluer.
Introduction Disciplinary knowledge in mathematics is a necessary and even fundamental element in the development of teacher students. We consider that a certain extent of mathematical knowledge – both conceptual and procedural – is a necessary requirement for students at the start of their Degree in Primary Education (DPE). The first stage of the study presented herein reviews the different theories of teacher’s knowledge in relation to the teaching of mathematics. Based on this review and considering the requirements of professional practice and mathematical competences in Primary School, we establish the concept of Basic Mathematical Knowledge (BMK) (Castro, Mengual, Prat, Albarracín and Gorgorió, 2014). Arithmetic is a key component of the Primary School Mathematics; therefore it has to be also a key component in the mathematical teacher training of future teachers' education. Our study aims to determine the fundamental mathematical knowledge that will allow future teachers to successfully construct the pedagogical knowledge of content related to the “numeration system and arithmetic operations”. We seek to establish: (i) BMK from its conceptual point of view the students should have of the DPE when starting didactics of addition and subtraction (CBMK-A); and (ii) additive conceptual knowledge profiles in students of the DPE. After the literature review on conceptual and procedural knowledge in mathematics, we centred our attention on previous research done on the addition principles, conducted on children as well as adults. By focussing on conceptual aspects we established CBMK-A around 4 components. We herein present part of the instrument to evaluate the conceptual aspects.
1 This research is under the project Caracterización del conocimiento disciplinar en matemáticas para el grado de educación primaria: matemáticas para maestros, I+D, RETOS, Dirección General de Investigación (ref. EDU2013-4683-R). 2 The authors are members of the Research Group Educació Matemàtica i Context: Competència Matemàtica
(EMiC:CoM) , ref. 2014SGR 00723.
“Quaderni di Ricerca in Didattica (Mathematics)”, n. 25, Supplemento n.2, 2015 G.R.I.M. (Departimento di Matematica e Informatica, University of Palermo, Italy)
220
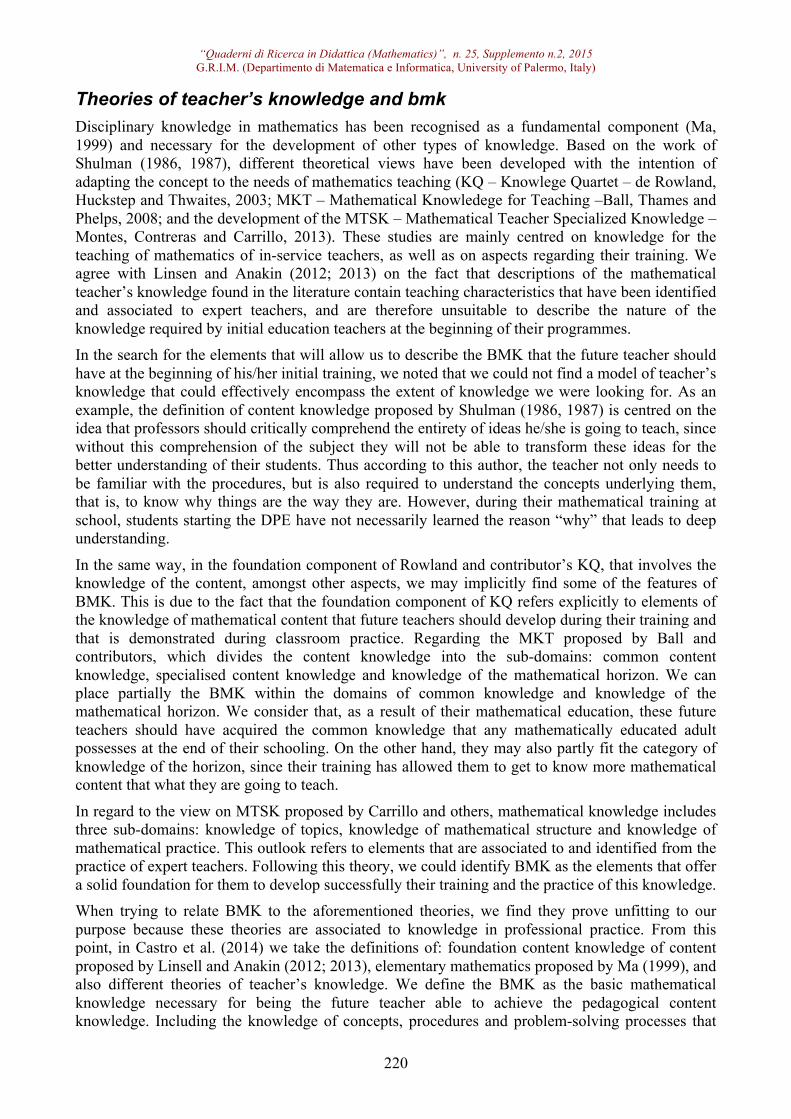
Theories of teacher’s knowledge and bmk Disciplinary knowledge in mathematics has been recognised as a fundamental component (Ma, 1999) and necessary for the development of other types of knowledge. Based on the work of Shulman (1986, 1987), different theoretical views have been developed with the intention of adapting the concept to the needs of mathematics teaching (KQ – Knowlege Quartet – de Rowland, Huckstep and Thwaites, 2003; MKT – Mathematical Knowledege for Teaching –Ball, Thames and Phelps, 2008; and the development of the MTSK – Mathematical Teacher Specialized Knowledge – Montes, Contreras and Carrillo, 2013). These studies are mainly centred on knowledge for the teaching of mathematics of in-service teachers, as well as on aspects regarding their training. We agree with Linsen and Anakin (2012; 2013) on the fact that descriptions of the mathematical teacher’s knowledge found in the literature contain teaching characteristics that have been identified and associated to expert teachers, and are therefore unsuitable to describe the nature of the knowledge required by initial education teachers at the beginning of their programmes. In the search for the elements that will allow us to describe the BMK that the future teacher should have at the beginning of his/her initial training, we noted that we could not find a model of teacher’s knowledge that could effectively encompass the extent of knowledge we were looking for. As an example, the definition of content knowledge proposed by Shulman (1986, 1987) is centred on the idea that professors should critically comprehend the entirety of ideas he/she is going to teach, since without this comprehension of the subject they will not be able to transform these ideas for the better understanding of their students. Thus according to this author, the teacher not only needs to be familiar with the procedures, but is also required to understand the concepts underlying them, that is, to know why things are the way they are. However, during their mathematical training at school, students starting the DPE have not necessarily learned the reason “why” that leads to deep understanding.
In the same way, in the foundation component of Rowland and contributor’s KQ, that involves the knowledge of the content, amongst other aspects, we may implicitly find some of the features of BMK. This is due to the fact that the foundation component of KQ refers explicitly to elements of the knowledge of mathematical content that future teachers should develop during their training and that is demonstrated during classroom practice. Regarding the MKT proposed by Ball and contributors, which divides the content knowledge into the sub-domains: common content knowledge, specialised content knowledge and knowledge of the mathematical horizon. We can place partially the BMK within the domains of common knowledge and knowledge of the mathematical horizon. We consider that, as a result of their mathematical education, these future teachers should have acquired the common knowledge that any mathematically educated adult possesses at the end of their schooling. On the other hand, they may also partly fit the category of knowledge of the horizon, since their training has allowed them to get to know more mathematical content that what they are going to teach.
In regard to the view on MTSK proposed by Carrillo and others, mathematical knowledge includes three sub-domains: knowledge of topics, knowledge of mathematical structure and knowledge of mathematical practice. This outlook refers to elements that are associated to and identified from the practice of expert teachers. Following this theory, we could identify BMK as the elements that offer a solid foundation for them to develop successfully their training and the practice of this knowledge. When trying to relate BMK to the aforementioned theories, we find they prove unfitting to our purpose because these theories are associated to knowledge in professional practice. From this point, in Castro et al. (2014) we take the definitions of: foundation content knowledge of content proposed by Linsell and Anakin (2012; 2013), elementary mathematics proposed by Ma (1999), and also different theories of teacher’s knowledge. We define the BMK as the basic mathematical knowledge necessary for being the future teacher able to achieve the pedagogical content knowledge. Including the knowledge of concepts, procedures and problem-solving processes that

“Quaderni di Ricerca in Didattica (Mathematics)”, n. 25, Supplemento n.2, 2015 G.R.I.M. (Departimento di Matematica e Informatica, University of Palermo, Italy)
221
students of the DPE have learned during their school years and need to carry with them to start their training.
Conceptual knowledge and cbmk-a Several research studies have highlighted the important role played by conceptual knowledge in learning mathematics. However, after decades of research there does not seem to be a consensus on the notion of conceptual knowledge, nor on what the best way of measuring it is (Baroody, Feil & Johnson, 2007; Crooks & Alibali, 2014). The wide variety of existing characterisations and the nature of the tasks used to measure this type of knowledge are not always in tune with their definition and they may represent an obstacle to the understanding of the main findings in this field (Crooks & Alibali, 2014). The different characterisations of the conceptual knowledge in mathematics suggest that this knowledge can be equate with a deep knowledge, well connected, flexible and associated to significant knowledge. Along these lines, possibly one of the most renowned and employed characterisations is that suggested by Hiebert and Lefevre (1986). These authors define conceptual knowledge as a complex network of relationships between pieces of information that allow for flexibility in the access and use of information –knowing how and why. This characterisation has been widely reproduced and interpreted over the years. For instance, conceptual knowledge has been defined in terms of the interrelations between different items of knowledge, of the comprehension of basic concepts or regarding the principles that govern a domain, being explicit or not (Rittle-Johnson & Alibali, 1999; Rittle- Johnson, Siegler & Alibali, 2001), being generalised and expressed verbally or not.
Conceptual additive knowledge has been widely studied over the years. After reviewing the literature on conceptual and procedural knowledge in mathematics, we focussed on those studies that dealt with addition and its principles, being centred upon those aspects of a predominantly conceptual nature. We established CBMK-A around 4 components that represented 4 types of conceptual mathematical knowledge that we consider fundamental. The first of these is the knowledge of the decimal numeration system and the positional value. It should be noted that the understanding of the decimal numeration system and of the concept of positional value is essential to the development of a numerical sense. In addition, it is the basis of the comprehension of fundamental operations involving numbers, fractions and decimals. In the context of teacher training, studies by Montes, Liñan, Contreras, Climent & Carrillo (2015) and Salinas (2007), amongst others, have revealed that future teachers lack a solid understanding of the numeration system. According to these authors, future teachers have a merely technical and limited command of the numeration system and with conceptual gaps in the understanding of significant concepts at the start of their training. Moreover, these studies have highlighted how important it is for future teachers to have a sound knowledge of certain concepts at the beginning of their training. These concepts are often assumed as known in the DPE but, without reassuring their acknowledgement, teacher students may face difficulties when teaching related subjects, leading to negative consequences for the education of their students.
The second component of the CMF-A is centred on the knowledge of the meanings of addition and subtraction. A key conceptual advance in conceptual additive knowledge is to understand that addition and subtraction may be defined as unitary or binary operations (Baroody and Ginsbung, 1986; Cañadas and Castro, 2011). In addition, the subjects’ view on this type of operations may be reflected in the formulation of verbal elementary arithmetic problems, the verbal explanations of addition and subtraction, and in the use and perception of keywords found in the formulation of these problems. For instance, Castro, Gorgorió & Prat (2014) suggest that teacher students have a limited view on addition and subtraction. They observe that future teachers essentially pose additive problems with keywords that coincide with the operation needed, largely involving change

“Quaderni di Ricerca in Didattica (Mathematics)”, n. 25, Supplemento n.2, 2015 G.R.I.M. (Departimento di Matematica e Informatica, University of Palermo, Italy)
222
structures with increases and decreases. It reflects a unitary view on addition (Baroody & Ginsbung, 1986).
Thirdly, we consider the comprehension of part-whole relationships. Most of the research done in this field has focussed, to a large extent, on the study of additive principles such as additive composition, commutativity, associativity, complementary addition and subtraction, and inversion (Canobi, 2005; 2009; Gilmore and Bryant, 2006; 2008; amongst others). Conceptual change is vital in the sense of acknowledging how a set is made up of different additive parts. This involves the ability to perform a calculation and to use the principles underlying mathematical relations (Gilmore & Bryant, 2006).
Finally, we regard domain and the use of addition and subtraction algorithms to be essential features of the additive structure (Cañadas & Castro, 2011; Dickson, Brown & Gibson, 1991). In order to understand the formal algorithms of addition and subtraction to a symbolic level, knowledge of the structure of the decimal numeration system is required, as well as an idea of how objects are counted. With regard to the comprehension of addition, the knowledge of basic sums, of addition tables and of the commutative and associative properties is also required. However, in the case of subtraction, the command of descendant counting as well as of double-simultaneous counting, ascendant and descendant needs to be added to the skills required for addition.
After establishing the 4 components of CBMK-A: (1) the knowledge of the decimal numeration system and positional value; (2) the meaning of addition and subtraction; (3) part-whole relationships; and (4) algorithms, we consider Crooks and Alibali’s (2014) suggestion to organise conceptual knowledge. These authors arrange conceptual knowledge into: (i) knowledge of general principles, and (ii) knowledge of principles underlying procedures.
Given that it is unclear how to measure conceptual knowledge independently from methodological knowledge effectively, we follow the proposal of Crooks and Alibali (2014) to establish evaluation indicators for this purpose. These tasks include the usage of conceptual knowledge indicators, both that of explicit and that of implicit nature. We specifically use tasks that measure explicit knowledge as indicators of the knowledge of general principles. An example of the latter is the explanation of concepts (definitions, elements of the structure of a domain and norms or rules) and the evaluation of example tasks that deal with implicit knowledge (recognise examples, definitions or statements of principle). In order to evaluate the second dimension of conceptual knowledge, the knowledge of principles underlying methods, we consider the use and justification of procedural tasks. In addition to this, we also include the evaluation of these tasks as correct or incorrect and why, reasoning whether the methods used are adequate to certain situations.
Instrument and data collection
Two questionnaires were elaborated for the data collection, in order to evaluate the 4 components of CBMK-A defined above. The following themes are included as sections in the first questionnaire: (1) knowledge of the decimal numeration system and positional value; and (2) the meanings of addition and subtraction. The second questionnaire features the sections involving: (3) part-whole relations; and (4) algorithms. We elaborated 4 types of questions for each section considering the following three conditions: (i) the content to be evaluated; (ii) the type of conceptual knowledge that involves; and (iii) indicators of conceptual knowledge. Once both questionnaires were elaborated, a group of experts validated each group of questions. The latter were strategically distributed within the questionnaire before determining its final version. Each questionnaire has questions of different sections. The aim of this is to triangulate the students' answers, with the intention of avoid a wrong interpretation of the

“Quaderni di Ricerca in Didattica (Mathematics)”, n. 25, Supplemento n.2, 2015 G.R.I.M. (Departimento di Matematica e Informatica, University of Palermo, Italy)
223
results. Question sheets were handed out in two different sessions of 1 hour each, in which students answered the questions individually without calculator. Given the length of both questionnaires, as an example we have only presented 2 of the 4 sections of questions that evaluate CBMK-A. We particularly present the group of questions used to evaluate CBMK-A in relation to (i) the decimal numeration system and positional value, and (ii) the knowledge of part-whole relationships.
Section: CBMK-A of the decimal numeration system and positional value As evaluation content for this section, we chose some conceptual features instrumental to the comprehension of the decimal numeration system and the concept of positional value. The following table displays the questions that include the knowledge of general principles or the knowledge of principles underlying procedures, with their respective indicators (see Table 1).
Element to be evaluated
Type of knowledge and indicator
Question
Comprehension of the multiplicative recursive
structure of base-10 of the decimal numeration system.
Principles underlying procedures
(Type )
Use and justification of procedural tasks
(Indicator)
1) Complete and explain why. Version 1: a) 5 hundred is units = thousand. b) 7 thousand is tens = units. Form 2: a) 50 hundred is units= thousand. b)70 thousand is tens = units.
Rounding for the part concerning closest value. Forward and backward counting for positional
value. Relative and positional value.
Read and write a number with letters and figures.
2) Express your answer in tens. What is the group of ten that is closest to the following amounts and explain why: a)43 b)36 c)68 d)65 3) How many hundreds are there in the number 130,025? How would the number 130,025 be expressed verbally?
Comparison of structured amounts.
Acknowledgement and use of equivalent
representations of the same number.
Compose, decompose, combine and transform
structured amounts.
General principles
(Type )
Evaluation of example tasks
(Indicator)
4) Which of the following decompositions correspond to number 342? Enclose them in a circle. a)3C + 4D + 2U b)30D + 42U c)2C + 14D + 2U d)1C + 2D + 42U e)34D + 2U
Table 1. Questions to evaluate the CBMK-A of the decimal numeration system and positional value
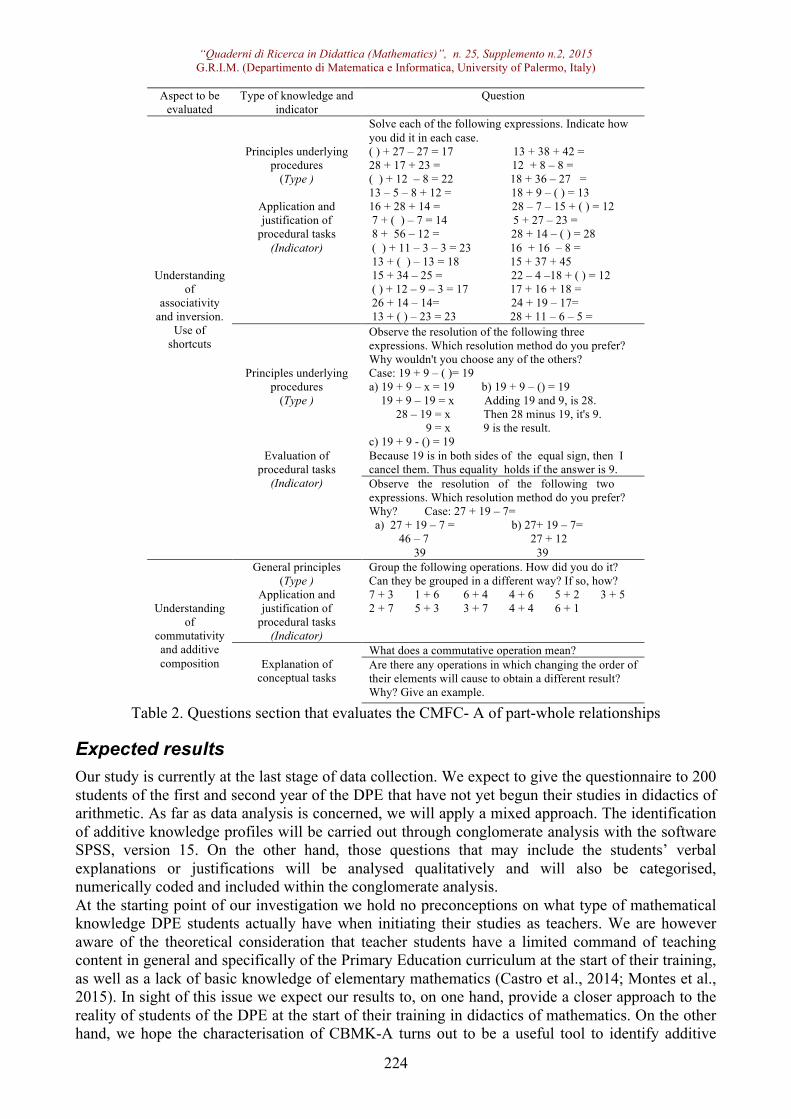
Section: CMFC- A of part-whole relationships In this case, we considered additive composition, commutativity, associativity and inversion as content to be evaluated. This choice was based on the fact that they are fundamental principles and properties of addition and reflect different elements of part-whole relationships as understood by the subjects. Secondly, we elaborated the questions about knowledge of general principles, that include verbal explanations of concepts; and those concerning knowledge of the principles underlying procedures, involving the use of direct access strategies on a conceptual basis (see Table 2).
“Quaderni di Ricerca in Didattica (Mathematics)”, n. 25, Supplemento n.2, 2015 G.R.I.M. (Departimento di Matematica e Informatica, University of Palermo, Italy)
224
Aspect to be evaluated
Type of knowledge and indicator
Question
Understanding of
associativity and inversion.
Use of shortcuts
Principles underlying procedures
(Type )
Application and justification of
procedural tasks (Indicator)
Solve each of the following expressions. Indicate how you did it in each case. ( ) + 27 – 27 = 17 13 + 38 + 42 = 28 + 17 + 23 = 12 + 8 – 8 = ( ) + 12 – 8 = 22 18 + 36 – 27 = 13 – 5 – 8 + 12 = 18 + 9 – ( ) = 13 16 + 28 + 14 = 28 – 7 – 15 + ( ) = 12 7 + ( ) – 7 = 14 5 + 27 – 23 = 8 + 56 – 12 = 28 + 14 – ( ) = 28 ( ) + 11 – 3 – 3 = 23 16 + 16 – 8 = 13 + ( ) – 13 = 18 15 + 37 + 45 15 + 34 – 25 = 22 – 4 –18 + ( ) = 12 ( ) + 12 – 9 – 3 = 17 17 + 16 + 18 = 26 + 14 – 14= 24 + 19 – 17= 13 + ( ) – 23 = 23 28 + 11 – 6 – 5 =
Principles underlying procedures
(Type )
Evaluation of procedural tasks
(Indicator)
Observe the resolution of the following three expressions. Which resolution method do you prefer? Why wouldn't you choose any of the others? Case: 19 + 9 – ( )= 19 a) 19 + 9 – x = 19 b) 19 + 9 – () = 19 19 + 9 – 19 = x Adding 19 and 9, is 28. 28 – 19 = x Then 28 minus 19, it's 9. 9 = x 9 is the result. c) 19 + 9 - () = 19 Because 19 is in both sides of the equal sign, then I cancel them. Thus equality holds if the answer is 9. Observe the resolution of the following two expressions. Which resolution method do you prefer? Why? Case: 27 + 19 – 7= a) 27 + 19 – 7 = b) 27+ 19 – 7= 46 – 7 27 + 12 39 39
Understanding of
commutativity and additive composition
General principles (Type )
Application and justification of
procedural tasks (Indicator)
Group the following operations. How did you do it? Can they be grouped in a different way? If so, how? 7 + 3 1 + 6 6 + 4 4 + 6 5 + 2 3 + 5 2 + 7 5 + 3 3 + 7 4 + 4 6 + 1
Explanation of
conceptual tasks
What does a commutative operation mean? Are there any operations in which changing the order of their elements will cause to obtain a different result? Why? Give an example.
Table 2. Questions section that evaluates the CMFC- A of part-whole relationships
Expected results Our study is currently at the last stage of data collection. We expect to give the questionnaire to 200 students of the first and second year of the DPE that have not yet begun their studies in didactics of arithmetic. As far as data analysis is concerned, we will apply a mixed approach. The identification of additive knowledge profiles will be carried out through conglomerate analysis with the software SPSS, version 15. On the other hand, those questions that may include the students’ verbal explanations or justifications will be analysed qualitatively and will also be categorised, numerically coded and included within the conglomerate analysis. At the starting point of our investigation we hold no preconceptions on what type of mathematical knowledge DPE students actually have when initiating their studies as teachers. We are however aware of the theoretical consideration that teacher students have a limited command of teaching content in general and specifically of the Primary Education curriculum at the start of their training, as well as a lack of basic knowledge of elementary mathematics (Castro et al., 2014; Montes et al., 2015). In sight of this issue we expect our results to, on one hand, provide a closer approach to the reality of students of the DPE at the start of their training in didactics of mathematics. On the other hand, we hope the characterisation of CBMK-A turns out to be a useful tool to identify additive
“Quaderni di Ricerca in Didattica (Mathematics)”, n. 25, Supplemento n.2, 2015 G.R.I.M. (Departimento di Matematica e Informatica, University of Palermo, Italy)
225
knowledge profiles in DPE students, in order to guide the planning of subjects on arithmetic didactics.
REFERENCES Ball, D.L., Thames, M.H. y Phelps, G. (2008). Content knowledge for teaching: What makes it special? Journal of Teacher Education, 59(5), 389-407.
Baroody, A., Feil, Y., & Johnson, A. (2007). An alternative reconceptualization of procedural and conceptual knowledge. Journal for Research in Mathematics Education, 38, 115–131.
Baroody, A., & Ginsburg, P. (1986): The relationship between initial meaningful and mechanical knowledge of arithmetic. In J. Hiebert (Ed.), Conceptual and procedural knowledge: the case of mathematics (pp.75-112). Hillsdale, NJ: Lawrence Associate. Cañadas, M.C., y Castro E. (2011). Aritmética de los números naturales. Estructura aditiva. En Segovia y Rico (coord.). Matemáticas para maestros de Educación Primaria (pp. 75-78). Madrid: Pirámide.
Canobi, K. (2005). Children's profiles of addition and subtraction understanding. Journal of Experimental Child Psychology, 92, 220-246.
Canobi, K. (2009). Concept–procedure interactions in children’s addition and subtraction. Journal of Experimental Child Psychology, 102, 131–149.
Castro, A., Gorgorió, N., & Prat, M. (2014). Indicios verbales en los PAEV aditivos planteados por estudiantes para maestro. En M. T. González, M. Codes, D. Arnau y T. Ortega (Eds.), Investigación en Educación Matemática XVIII (pp. 217-226). Salamanca: SEIEM. Castro, A., Mengual, E., Prat, M., Albarracín, L., y Gorgorió, N. (2014). Conocimiento matemático fundamental para el grado de educación primaria: inicio de una línea de investigación. En M. T. González, M. Codes, D. Arnau y T. Ortega (Eds.), Investigación en Educación Matemática XVIII (pp. 227-236). Salamanca: SEIEM. Crooks, N., Alibali, M. W. (2014) Defining and measuring conceptual knowledge in mathematics. Developmental Review. 34(4), 344-377. Dickson, L., Brown, M. & Gibson, O. (1991). El aprendizaje de las matemáticas. Barcelona: Labor. Gilmore, C., & Bryant, P. (2006). Individual differences in children's understanding of inversion and arithmetical skill. British Journal of Educational Psychology, 76, 309-331. Gilmore, C., & Bryant, P. (2008). Can children construct inverse relations in arithmetic? Evidence for individual differences in the development of conceptual understanding and computational skill. British Journal of Developmental Psychology, 26(3), 301-316. Hiebert, J., & Lefevre, P. (1986): Conceptual and procedural knowledge in mathematics: An introductory analysis. In J. Hiebert (Ed.), Conceptual and procedural knowledge: the case of mathematics (pp.1-27). Hillsdale. NJ:Lawrence Associates.
Linsell, C., y Anakin, M. (2012). Diagnostic Assessment of Pre-Service Teachers’ Mathematical Content Knowledge. Mathematics Teacher Education and Development, 14(2), 4–27. Linsell, C., y Anakin, M. (2013). Foundation Content Knowledge: What do pre-service teachers need to know? En V. Steinle, L. Ball y C. Bardini (Eds.), Mathematics Eduction: Yesterday, today and tomorrow (Proceedings f the 36th annual conference of MERGA) (pp. 442-449). Melbourne, VIC: MERGA.

“Quaderni di Ricerca in Didattica (Mathematics)”, n. 25, Supplemento n.2, 2015 G.R.I.M. (Departimento di Matematica e Informatica, University of Palermo, Italy)
226
Ma, L. (1999). Knowing and teaching elementary mathematics: teachers’ understanding of fundamental mathematics in China and the United States. Hillsdale, NJ: Erlbaum. Montes, M. A., Contreras, L. C. y Carrillo., J. (2013). Conocimiento del profesor de matemáticas: Enfoques del MKT y del MTSK. En A. Berciano, G. Gutiérrez, A. Estepa y N. Climent (Eds.), Investigación en Educación Matemática XVII (pp. 403-410). Bilbao: SEIEM.
Montes, M., Contreras, L., Liñán, M., Muñoz-Catalán, M., Climent, N., y Carrillo, J. (2015). Conocimiento de aritmética de futuros maestros: debilidades y fortalezas. Revista de Educación, 367, 36-62. Rittle-Johnson, B., & Alibali, M. (1999). Conceptual and procedural knowledge of mathematics: Does one lead to the other? Journal of educational psychology, 91(1), 175. Rittle-Johnson, B., Siegler, R., & Alibali, M. (2001). Developing conceptual understanding and procedural skill in mathematics: An iterative process. Journal of educational psychology, 93(2), 346.
Rowland, T., Huckstep, P., & Thwaites, A. (2003). The Knowledge Quartet. Proceedings of the British Society for Research into Learning Mathematics, 23(3), 97-102. Salinas M. (2007). Errores sobre el sistema de numeración decimal en estudiantes de Magisterio. En M. Camacho, P. Flores y P. Bolea (Eds.), Investigación en Educación Matemática XI (pp. 381- 390). La Laguna: SEIEM.
Shulman, L.S. (1986). Those who understand: Knowledge growth in teaching. Educational Researcher, 15 (2), 4-14.
Shulman, L.S. (1987). Knowledge and teaching: Foundations of the new reform. Harvard Educational Review, 57(1), 1-22.
“Quaderni di Ricerca in Didattica (Mathematics)”, n. 25, Supplemento n.2, 2015 G.R.I.M. (Departimento di Matematica e Informatica, University of Palermo, Italy)
227
Pre-service teacher conceptualisation of mathematics
Audrey Cooke [email protected]
Curtin University GPO Box U1987 Perth Western Australia 6845
Abstract: Mathematics can be seen in a variety of ways which can impact how individuals interact with mathematics. Pre-service teacher conceptions about mathematics could potentially influence how they engage with mathematical activities during their degree, their development and understanding of mathematical ideas, and their interpretation of mathematical activities. These conceptions can then influence the mathematical experiences they create for their students. As a result, it is important that pre-service teacher education programs identify pre-service teacher conceptions of mathematics and provide experiences that can challenge and change these conceptions.
Résumé : Mathématiques peuvent être vues dans une variété de façons qui peuvent avoir une incidence sur la façon dont les individus interagissent avec les mathématiques. Les conceptions sur les mathématiques des enseignants en pré-service pourraient potentiellement influencer la façon dont ils s'engagent à des activités mathématiques au cours de leur diplôme, leur développement et leur compréhension des concepts mathématiques, et leur interprétation des activités mathématiques. Ces conceptions peuvent ensuite influencer les expériences en mathématiques qu'ils créent pour leurs élèves. En conséquence, il est important que les programmes de formation des enseignants en pré-service identifient les conceptions sur les mathématiques des enseignants en pré-service et fournissent des expériences qui peuvent mettre en cause et changer ces conceptions.
Introduction Investigations of teacher beliefs have been conducted for more than two decades. Pajares (1992) considered research investigating teacher beliefs as necessary as teacher beliefs have the potential impact on teacher behaviour in their classrooms. Ernest (1989) connects teacher behaviours in the mathematics classroom to teacher knowledge, teacher beliefs and teacher attitudes towards mathematics. He considers teacher knowledge related to mathematics, teaching and learning starts with the teacher’s views of what mathematics is, how it can be taught, and how children will learn. If teacher beliefs, attitude, and knowledge can have such an impact, it would indicate that investigations into these should be considered for teachers. Likewise, it would indicate that there is a need to include consideration of pre-service teachers’ beliefs, attitudes, and knowledge. These components can also be included as elements of disposition towards mathematics. Disposition towards mathematics has been considered within a similar time frame as teacher beliefs. Anku (1996) explored pre-service teacher disposition towards mathematics, using the phrase to indicate the level of positivity towards and interest in learning mathematics. The year after, the Australian Association of Mathematics Teachers’ [AAMT] (1997) considered the importance of disposition when discussing numeracy. Cooke (in press) described disposition towards mathematics as incorporating the components of attitudes towards mathematics, mathematics anxiety, confidence with mathematics, and conceptualisation of mathematics. Justifications for why these components should be included were provided and discussed in detail. In addition, the measurement of the elements of these components were examined and deliberated. Attitudes towards mathematics were considered in terms everyday life, the classroom, and teacher education (Beswick, Ashman, Callingham, & McBain, 2011). Mathematics anxiety was considered in response to thinking about working with others on a

“Quaderni di Ricerca in Didattica (Mathematics)”, n. 25, Supplemento n.2, 2015 G.R.I.M. (Departimento di Matematica e Informatica, University of Palermo, Italy)
228
mathematical task, taking a mathematics test, and teaching mathematics (Cooke, Cavanagh, Hurst, & Sparrow, 2011). Confidence with specific mathematics considered mathematical content in terms of the Australian Curriculum: Mathematics (Australian Curriculum, Assessment and Reporting and Authority [ACARA], 2010) to determine pre-service teacher confidence (Beswick et al., 2011). The final component, conceptualisation of mathematics, was described in detail in the paper, a summary of which is provided below. The instrument to measure conceptualisation of mathematics comprised 20 statements. These statements addressed how mathematics could be perceived in terms of its use and its usefulness. Some statements addressed whether mathematics was useable beyond a mathematics classroom, such as in other subjects, with games, in conversations, and in everyday life. Several statements explored whether mathematics was concerned with just numbers, rules and procedures, or connected ideas, and whether it was possible to have more than one correct answer. The consideration of whether mathematics could be used to describe nature or whether mathematics was creative was included in statements. Other statements referred to whether attempts were made to understand how rules and procedures worked or if enjoyment was found when engaging with mathematical activities.
As the statements from the instrument were designed to investigate how mathematics is conceptualised, consideration of the work by Ernest (1989) enable the statements to be categorised in terms of the three philosophies of mathematics he outlined. As a result, the statements were grouped in terms of the three philosophies of mathematics – mathematics as a revisable problem solving field; mathematics as a static interconnecting set of truths; or mathematics as a collection of unrelated facts and skills – outlined by Ernest (1989). As shown in Figure 1, four statements are relevant to only one philosophical perspective, that is, mathematics as a revisable problem solving field. Half of the statements are relevant to two philosophical perspectives, that is, mathematics as a revisable problem solving field and mathematics as a static interconnecting set of truths. The final six statements are applicable to all three philosophical perspectives.
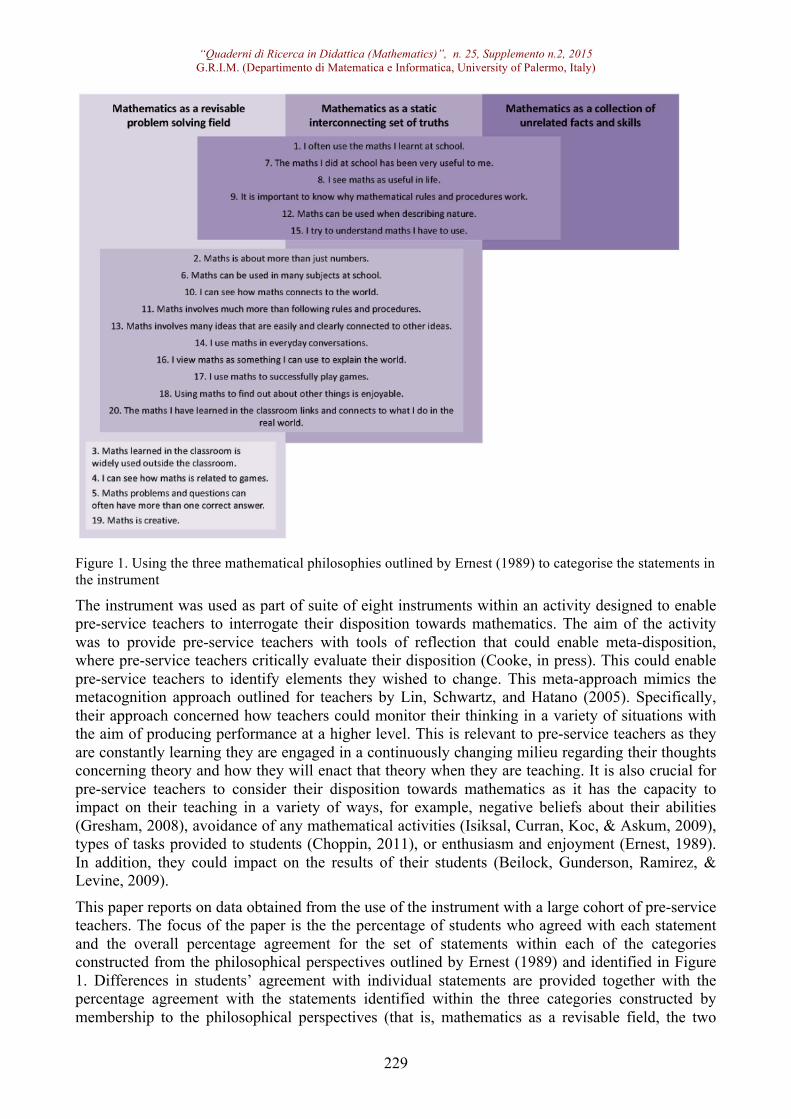
“Quaderni di Ricerca in Didattica (Mathematics)”, n. 25, Supplemento n.2, 2015 G.R.I.M. (Departimento di Matematica e Informatica, University of Palermo, Italy)
229
Figure 1. Using the three mathematical philosophies outlined by Ernest (1989) to categorise the statements in the instrument
The instrument was used as part of suite of eight instruments within an activity designed to enable pre-service teachers to interrogate their disposition towards mathematics. The aim of the activity was to provide pre-service teachers with tools of reflection that could enable meta-disposition, where pre-service teachers critically evaluate their disposition (Cooke, in press). This could enable pre-service teachers to identify elements they wished to change. This meta-approach mimics the metacognition approach outlined for teachers by Lin, Schwartz, and Hatano (2005). Specifically, their approach concerned how teachers could monitor their thinking in a variety of situations with the aim of producing performance at a higher level. This is relevant to pre-service teachers as they are constantly learning they are engaged in a continuously changing milieu regarding their thoughts concerning theory and how they will enact that theory when they are teaching. It is also crucial for pre-service teachers to consider their disposition towards mathematics as it has the capacity to impact on their teaching in a variety of ways, for example, negative beliefs about their abilities (Gresham, 2008), avoidance of any mathematical activities (Isiksal, Curran, Koc, & Askum, 2009), types of tasks provided to students (Choppin, 2011), or enthusiasm and enjoyment (Ernest, 1989). In addition, they could impact on the results of their students (Beilock, Gunderson, Ramirez, & Levine, 2009).
This paper reports on data obtained from the use of the instrument with a large cohort of pre-service teachers. The focus of the paper is the the percentage of students who agreed with each statement and the overall percentage agreement for the set of statements within each of the categories constructed from the philosophical perspectives outlined by Ernest (1989) and identified in Figure 1. Differences in students’ agreement with individual statements are provided together with the percentage agreement with the statements identified within the three categories constructed by membership to the philosophical perspectives (that is, mathematics as a revisable field, the two
“Quaderni di Ricerca in Didattica (Mathematics)”, n. 25, Supplemento n.2, 2015 G.R.I.M. (Departimento di Matematica e Informatica, University of Palermo, Italy)
230
philosophical perspectives of mathematics as a revisable field and as a static interconnected set of rules, and all three philosophical perspectives). Potential implications of the results for teacher education programs are outlined and discussed.
Methodology This study is concerned with pre-service teacher perceptions about mathematics. These perceptions may have developed over time and through their experiences with the world. Their experiences, in turn, are impacted by their perceptions. This interrelationship of perceptions and experiences situates this research within the constructivism ontology and the social constructionist epistemology (Crotty, 1998).
Data collection Data was collected from a compulsory first-year mathematics education unit is provided to students enrolled in either a Bachelor of Education (Primary) or a Bachelor of Education (Early Childhood) at an Australian metropolitan university. The unit was conducted fully on-line using a learning management system (LMS).
Participants
As part of the first assessment in their compulsory first-year mathematics education unit, students completed eight instruments addressing disposition towards mathematics. These eight instruments addressed attitudes towards mathematics (one instrument each to consider attitudes towards mathematics in everyday life, attitudes towards mathematics in the classroom, and attitudes towards mathematics in teacher education), mathematics anxiety (one instrument each to consider mathematics anxiety when thinking about working with others on a mathematical task, mathematics anxiety when thinking about taking a mathematics test, and mathematics anxiety when thinking about teaching mathematics), confidence to complete specific mathematics, and conceptualisation of mathematics. The last instrument, conceptualisation of mathematics, is the focus of this research. Of the total 851 students who accessed the LMS during the study period, 673 completed the instrument on the conceptualisation of mathematics (79%).
Questionnaires
The instrument addressing conceptualisation of mathematics contained 20 statements regarding how maths was viewed. Responses were provided using a 4-point Likert-style scale, where students could strongly disagree with the statement, disagree with the statement, agree with the statement, or strongly agree with the statement. All statements were worded positively, which negated the need to recode responses.
Procedure
The instruments were administered through the LMS via a link provided to students. All eight instruments were initially available for seven days during the first week of the study period, but due to technical issues, it made available for another seven days during the second week of the study period. During the second timeframe when the instruments were available, only students who had not completed the instruments were able to access the link. The data file was downloaded and the text responses were converted into numerical responses in a spreadsheet program. Strongly disagree responses were allocated a value of 1, disagree a value of 2, agree a value of 3, and strongly agree a value of 4. The final file was imported into SPSS for analysis.
Two forms of analysis were conducted. Mean values were calculated for each statement based on the numerical value allocated for the response to the statement. The calculation for the mean ignored missing cells, that is, the number of responses was the divisor for the summated responses.

“Quaderni di Ricerca in Didattica (Mathematics)”, n. 25, Supplemento n.2, 2015 G.R.I.M. (Departimento di Matematica e Informatica, University of Palermo, Italy)
231
The percentage of agreement for each statement was calculated to provide an indication of the proportion of students in agreement with each statement. This was achieved by creating a new variable with a value of 1 for responses of 1 or 2 to indicate disagreement and a value of 2 for responses of 3 or 4 to indicate agreement. Frequencies were then calculated for disagreement and agreement for each statement.
Results The percentage of pre-service teachers who agreed with each statement and the mean response for each statement are provided in Table 1. Statements are ordered from those with lowest percentage agreement to those with highest percentage agreement.
Statement N % Agreement Mean
5. Maths problems and questions can often have more than one correct answer. 671 45.5 2.45
16. I view maths as something I can use to explain the world. 672 52.8 2.58
18. Using maths to find out about other things is enjoyable. 672 64.1 2.72
14. I use maths in everyday conversations. 672 65.2 2.75
19. Maths is creative. 672 71.3 2.85
12. Maths can be used when describing nature. 672 77.5 2.94
1. I often use the maths I learnt at school. 673 79.0 2.97
7. The maths I did at school has been very useful to me. 672 79.3 3.00
17. I use maths to successfully play games. 672 79.6 2.99
11. Maths involves much more than following rules and procedures. 672 86.2 3.11
20. The maths I have learned in the classroom links and connects to what I do in the real world. 672 86.5 3.11
3. Maths learned in the classroom is widely used outside the classroom. 671 86.6 3.16
13. Maths involves many ideas that are easily and clearly connected to other ideas. 672 89.3 3.11
4. I can see how maths is related to games. 671 92.5 3.28
15. I try to understand maths I have to use. 672 95.7 3.32
9. It is important to know why mathematical rules and procedures work. 672 96.3 3.35
10. I can see how maths connects to the world. 672 96.7 3.37
2. Maths is about more than just numbers. 672 97.9 3.52
8. I see maths as useful in life. 672 97.9 3.48
6. Maths can be used in many subjects at school. 672 98.2 3.34
Table 1. Statements ranked by the percentage of student agreement.

“Quaderni di Ricerca in Didattica (Mathematics)”, n. 25, Supplemento n.2, 2015 G.R.I.M. (Departimento di Matematica e Informatica, University of Palermo, Italy)
232
Responses to statements within each of the three categories were grouped and the percentage of agreement and mean were calculated and provided in Table 2.
Category of statements N %
Agreement Mean
Relates to Mathematics as a revisable problem solving field 2685 73.97 2.94
Relates to both Mathematics as a revisable problem solving field and Mathematics as a static interconnecting set of truths 6720 81.70 3.06
Relates to Mathematics as a revisable problem solving field, Mathematics as a static interconnecting set of truths, and Mathematics as a collection of unrelated facts and skills 4033 87.63 3.19
Table 2. Percentage agreement for categories based on mathematical philosophies (Ernest, 1989).
Discussion and Conclusion It is worthy noting that more than 75% of students agreed with 15 of the 20 statements and only one statement had less than half the cohort agreeing, Maths problems and questions can often have more than one correct answer (45.5% agreement). The low agreement may be due to pre-service teachers focusing on past mathematical experiences with closed maths problems with only one answer possible (Sullivan, Mousley, & Zevenbergen, 2006). Mathematical experiences may have focused on one “correct” answer, concentrating on the product and not the process, which would contrast with Ernest’s (1989) philosophical description of mathematics as revisable problem solving. The statement with the next lowest percentage agreement was I view maths as something I can use to explain the world. This may reflect a perceived lack of skill in using maths to explain the world or a lack of recognition of mathematics in the world (Cooke, in press). Of the five statements with less than 75% of student agreement, two were in the first category and three were in the second category outlined in Table 2. A lower percentage of students agreed overall with the set of statements that correspond only to the mathematics philosophy that considers maths as a revisable problem solving field (Ernest, 1989). This could be due to past experiences that presented mathematics as a set of procedures that were reinforced through the completion of exercises. The percentage of agreement for the second category overall (81.7%) may reflect experiences that present mathematics as more than a series of steps or procedures (Beswick, 2012). The final category incorporates statements that correspond to all philosophical approaches, making it difficult to determine experiences and reasons why pre-service teachers responded as they did. Future research to investigate the thinking behind the responses to these statements could illuminate why pre-service teachers agreed or disagreed with the statements. If past experiences impact on beliefs (Sullivan et al., 2006) and these beliefs determine the responses to this instrument, teacher educators need to provide experiences that challenge past experiences. In doing this, it may be possible to enact points made by Beswick (2012) and Wilkins and Brand (2004), that education courses and mathematics education units should challenge and influence pre-service teachers’ beliefs and attitudes about mathematics. However, the focus needs to be on new mathematical experiences that enable pre-service teachers to see mathematics differently than they did in the past. This could result in pre-service teachers moving more towards a consideration of mathematics as a revisable problem solving field (Beswick, 2012; Ernest, 1989). Changes in how mathematics is conceived could be beneficial beyond the individual pre-service

“Quaderni di Ricerca in Didattica (Mathematics)”, n. 25, Supplemento n.2, 2015 G.R.I.M. (Departimento di Matematica e Informatica, University of Palermo, Italy)
233
teachers. The future students of these pre-service teachers may benefit as research over the last quarter of a century has shown that how the teacher conceives mathematics may determine what is experienced in their mathematics classrooms. Behaviours engaged in within the mathematics classroom (Ernest, 1989), how mathematics is taught and learnt (Ernest, 1989), what activities and experiences teachers use (Pajares, 1992), and how they reflect on their teaching experiences (Beswick, 2012) are all impacted by the teacher’s conceptualisation of mathematics.
REFERENCES
Anku, S. E. (1996). Fostering students’ disposition towards mathematics: A case from a Canadian university. Education, 116(4), 536-542. Retrieved from http://search.proquest.com.dbgw.lis.curtin.edu.au/docview/196420710/fulltextPDF?accountid=10382
Australian Association of Mathematics Teachers [AAMT]. (1997). Numeracy=everyone’s business. Report of the Numeracy Education Strategy Development Conference. Adelaide, SA: Australian Association of Mathematics Teachers. Retrieved from http://www.aamt.edu.au/Professional-reading/Numeracy
Australian Curriculum, Assessment and Reporting and Authority [ACARA]. (2010). Foundation – year 10 curriculum. Retrieved from http://www.australiancurriculum.edu.au/Mathematics/Curriculum/F-10 Beilock, S. L., Gunderson, E. A., Ramirez, G., & Levine, S. C. (2009). Female teachers’ math anxiety affects girls’ math achievement. Proceedings of the National Academy of Sciences of the United States of America [PNAS], 107(5), 1860-1863. Retrieved from http://www.jstor.org.dbgw.lis.curtin.edu.au/stable/40536499 Beswick, K. (2012). Teachers' beliefs about school mathematics and mathematicians' mathematics and their relationship to practice. Educational Studies in Mathematics, 79(1), 127-147. doi: 10.1007/s10649-011-9333-2
Beswick, K., Ashman, D., Callingham, R., & McBain, D. (2011). Teachers’ and pre-service teachers’ confidence to teach primary school mathematics. Paper presented at the 2011 AARE international Research Conference, Hobart, Australia, 27 November-1 December, 2011. Retrieved January 20, 2014, from http://www.aare.edu.au/data/publications/2011/aarefinal00535.pdf Choppin, J. (2011). The role of local theories: Teacher knowledge and its impact on engaging students with challenging tasks. Mathematics Education research Journal, 23(5), 5-25. doi: 10.1007/s13394-011-0001-8
Cooke, A. (in press). Considering Pre-service Teacher Disposition Towards Mathematics. Manuscript submitted for publication. Retrieved from http://www.merga.net.au/ojs/index.php/mted/article/view/188/210 Cooke, A., Cavanagh, R., Hurst, C. & Sparrow, L. (2011, November-December). Situational effects of mathematics anxiety in pre-service teacher education. Paper presented at the 2011 AARE international Research Conference, Hobart, Australia, 27 November-1 December, 2011. Retrieved from http://www.aare.edu.au/data/publications/2011/aarefinal00501.pdf Crotty, M. (1998). The foundations of social Research: Meaning and perspective in the research process. Crows Nest, Australia: Allen & Unwin.

“Quaderni di Ricerca in Didattica (Mathematics)”, n. 25, Supplemento n.2, 2015 G.R.I.M. (Departimento di Matematica e Informatica, University of Palermo, Italy)
234
Ernest, P. (1989). The knowledge, beliefs and attitudes of the mathematics teacher: a model. Journal of Education for Teaching: International research and pedagogy, 15(1), 13-33. doi: 10.1080/0260747890150102
Gresham, G. (2008). Mathematics anxiety and mathematics teacher efficacy in elementary pre-service teachers. Teaching Education, 19(3), 171-184. doi:10.1080/10476210802250133
Isiksal, M., Curran, J. M., Koc, Y, & Askun, C. S. (2009). Mathematics anxiety and mathematical self-concept: Considerations in preparing elementary-school teachers. Social Behavior and Personality, 37(5), 631-644. DOI:10.2224/sbp.209.37.5.631 Lin, X., Schwartz, D. L., & Hatano, G. (2005). Toward teachers' adaptive metacognition. Educational Psychologist, 40(4), 245-255. doi: 10.1207/s15326985ep4004_6 McLeod, D. B. (1994). Research on affect and mathematics learning in the JRME: 1970 to the present. Journal for research in Mathematics Education, 25(6), 637-647. Retrieved from http://www.jstor.org/stable/749576
Pajares, M. F. (1992). Teachers’ beliefs and educational research: Cleaning up a messy construct. Review of Educational Research, 62(3), 307-332. doi: 10.3102/00346543062003307
Sullivan, P., Mousley, J., & Zevenbergen, R. (2006). Teacher actions to maximize mathematics learning opportunities in heterogeneous classrooms. International Journal of Science and Mathematics Education, 4(1), 117-143. doi: 10.1007/s10763-005-9002-y Wilkins, J. L., & Brand, B. R. (2004). Change in preservice teachers' beliefs: An evaluation of a mathematics methods course. School Science and Mathematics, 104(5), 226-232. Retrieved from http://search.proquest.com

“Quaderni di Ricerca in Didattica (Mathematics)”, n. 25, Supplemento n.2, 2015 G.R.I.M. (Departimento di Matematica e Informatica, University of Palermo, Italy)
235
Rescuing casualties of mathematics Daniela Ferrarello
Department of Mathematics and Computer Science
Viale Doria, 6. Catania (Italy) Abstract: In this paper we present an activity carried out inside a remedial course for 15 years-old students of a science high school, to recover their mathematical competencies. A Kolb test was given to the students to recognize their learning styles, in order to set the whole work in the respect of their own attitudes. Results of the activity are presented. Résumé: Dans cet article nous présentons une activité réalisée dans un cours de rattrapage pour les élèves de 15 ans d’un lycée, de récupérer leurs compétences en mathématique. Les étudiants ont eu un test de Kolb à reconnaître leurs styles d’apprentissage, afin de mettre l’ensemble des travaux en fonction de leur aptitude. Nous présentons le résultats de l’activité.
Introduction National and international studies highlight a strong difficulty of Italian students in mathematics, in particular in southern Italy. Their problems are both in mathematical knowledge and in using mathematical artefacts to interpret reality. A branch of research studies psychoanalytic approaches to discuss mathematics as an object through which and with which the self is constructed. At the beginning, in pre-school children, mathematics is inside the self, (Vygotskij, 1986) rather than a foreign disclipline, like the one children are forced to learn at school. In that period of life their relationship with mathematics is not as problematic as it will become in their future. We usually keep on forgetting about that « primitive » relationship with mathematics, ignoring it in the typical pedagogical interaction with the classroom (Appelbaum, 1998).
What is worst, after a few years many students fall into a vicious circle, resulting in a hate against mathematics, that turns students into casualties of mathematics. Roughly we can divide the circle on Fig.1 in two main parts: the right part (referred to as « the heart » in the following) is related to affective problems with the discipline (Zan 2006), (Di Martino 2007), the left part, (« the brain » in the following) is related to study and diligence. It is very difficult to understand where the circle starts because “affect, far from being the « other » of thinking, is a part of it. Affect influences thinking, just as thinking influences affect. The two interact” (Brown, 2012). But at the end it is not so important to undertsand how the circle started. What is important is to break it.
Most of the teachers try to act on « the brain », by working on the “I don’t care” and just asking their students to spend more time in studying. Nowadays, with the spread of technology, some teachers work also on the “I’m not able”, because many students are good in using technologies, so they can learn by using technology as a language, in the sense of horizontal teaching (Ferrarello, Mammana, Pennisi 2014a, p.4) : Students, trought the ability in technology feel able to handle mathematics concepts, sometimes they feel this « technological mathematics » as another mathematics.
We believe that one should also act inside « the heart », on the “I don’t like” and the “I’m not
Fig. 1
“Quaderni di Ricerca in Didattica (Mathematics)”, n. 25, Supplemento n.2, 2015 G.R.I.M. (Departimento di Matematica e Informatica, University of Palermo, Italy)
236
motivated”. In this paper we discuss how we worked also on « the heart » part during an activity carried out in a 50 hours remedial course (in almost weekly meetings in the afternoon) in a science high school, with second class students, aged 15-16, studying algebra (equations and inequalities) and geometry (special point of triangles, Euclid’s theorems, Pytagora’s theorem, angles at the center and at the circumference, geometric transformations).
The first step was to understand which kind of students we had, in order to realize how we could support them. We strongly believe that affective problems with mathematics of a single student are related both with his/her proper learning attitude and with the usual style of teaching mathematics. When the two aspects (teaching and learning styles) do not coincide, students get a vision of mathematics that is different from their own idea of mathematics. So, in the first meeting with students, we proposed a learning test, the Kolb test, whose theory we discuss in the following paragraph, to study what vision of mathematics was appropriate to present to the students. According to the results of the Kolb test, we organized the whole work with students according to their own learning attitude, i.e. based on practice and experience: we gave great importance to “learning by doing” (Dewey 1916), especially in geometry, that was conducted only in the lab with the use of both new and old artefacts (Maschietto, Trouche 2008), in particular DGS with guided worksheets, and mathematical machines, that we used for geometric transformations. We briefly discuss the results arised from the analysis of initial and final competencies of students and from the satisfaction questionnaire, that students filled anonymously at the end of the course.
Theoretical background: Kolb learning styles and maths lab David Kolb (Kolb, Fry 1975) adopted as learning styles two thought types and two cognitive processes, namely the two thought types introduced by Hudson (Hudson, 1968): converging and diverging; and the two cognitive processes introduced by Piaget: assimilating and accomodating. In such a way Kolb distinguishes learning styles, described in the following, taking into account the four capabilities: Concrete Experience (feeling), Reflective Observation (watching), Abstract Conceptualisation (thinking) and Active Experimentation (doing). Briefly: A converging character is strongly talented to practical applications of ideas, he/she uses a lot of deductive reasoning, he/she is good in applying Abstract conceptualization in Active experimentation, so he/she is between thinking and doing. A diverging person, on the contrary, lives in ideas’ world, he/she has a strong imaginative ability, he is gifted to pose problems, rather than to solve them, to produce new ideas and see things from different perspective, so he/she is suitable to pass from Concrete experience to Reflective observation, between feeling and watching. A student who uses mainly the assimilating process is very able to see theoretical models and abstract concepts, he/she uses inductive reasoning, so he/she performs well when an Abstract conceptualization is required by a Reflective observation, passing from watching to thinking. Who uses accomodating thinking solves problem intuitively by practice; he/she does not care so much about theory, but he/she is a good reactor when the context changes suddenly. If the theory does not work anymore on a new circumstance, he/she is able to find new examples that afterwards can develop a new uploaded theory. His/her learning is between Active experimentation and Concrete experience, from doing to feeling. At the end of the Kolb test, every student has four scores: for the capabilities CE (Concrete Experience), RO (Reflective Observation), AC (Abstract Conceptulization) and AE (Active Experimentation). It is very rare that a student has a pure attitude toward just one of the four capabilities, so the Kolb test provides combined profiles, by subtracting RO from AE and by subtracting CE from AC, namely comparing feeling vs thinking and watching vs doing. The result of the two subtractions gives the learning-style profiles: converging, diverging, assimilating and accommodating.
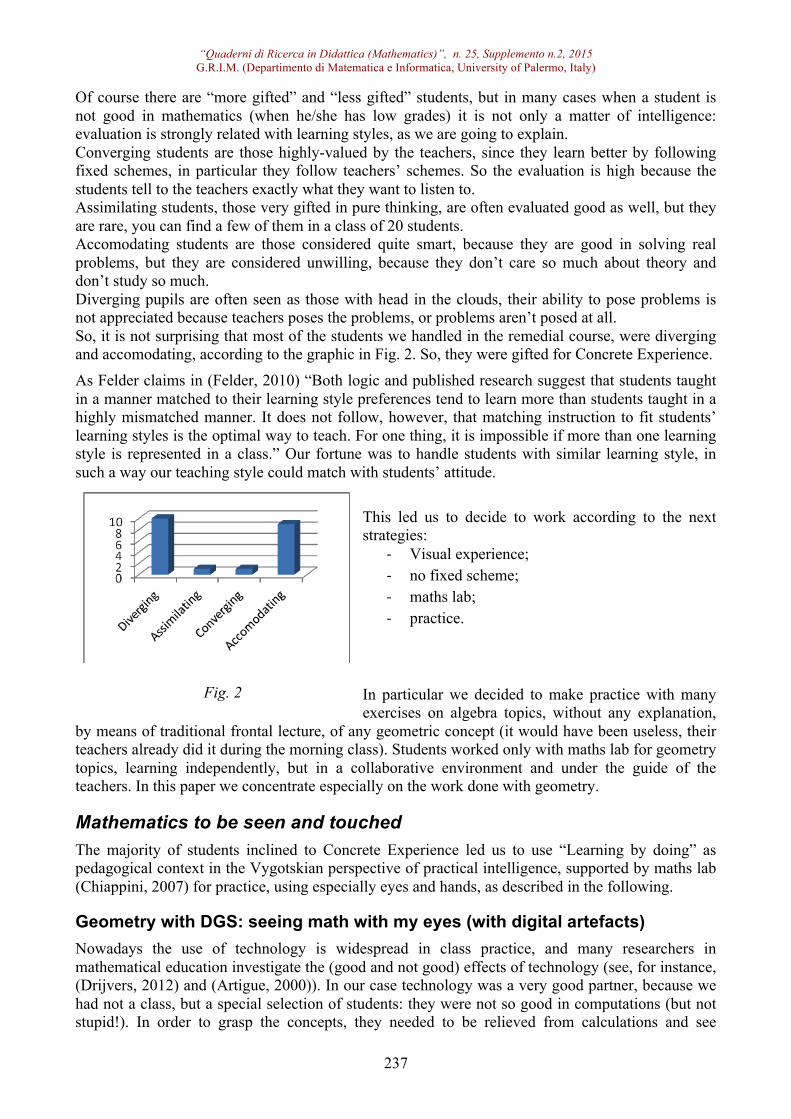
“Quaderni di Ricerca in Didattica (Mathematics)”, n. 25, Supplemento n.2, 2015 G.R.I.M. (Departimento di Matematica e Informatica, University of Palermo, Italy)
237
Of course there are “more gifted” and “less gifted” students, but in many cases when a student is not good in mathematics (when he/she has low grades) it is not only a matter of intelligence: evaluation is strongly related with learning styles, as we are going to explain. Converging students are those highly-valued by the teachers, since they learn better by following fixed schemes, in particular they follow teachers’ schemes. So the evaluation is high because the students tell to the teachers exactly what they want to listen to. Assimilating students, those very gifted in pure thinking, are often evaluated good as well, but they are rare, you can find a few of them in a class of 20 students. Accomodating students are those considered quite smart, because they are good in solving real problems, but they are considered unwilling, because they don’t care so much about theory and don’t study so much. Diverging pupils are often seen as those with head in the clouds, their ability to pose problems is not appreciated because teachers poses the problems, or problems aren’t posed at all. So, it is not surprising that most of the students we handled in the remedial course, were diverging and accomodating, according to the graphic in Fig. 2. So, they were gifted for Concrete Experience. As Felder claims in (Felder, 2010) “Both logic and published research suggest that students taught in a manner matched to their learning style preferences tend to learn more than students taught in a highly mismatched manner. It does not follow, however, that matching instruction to fit students’ learning styles is the optimal way to teach. For one thing, it is impossible if more than one learning style is represented in a class.” Our fortune was to handle students with similar learning style, in such a way our teaching style could match with students’ attitude.
This led us to decide to work according to the next strategies:
- Visual experience; - no fixed scheme; - maths lab; - practice.
In particular we decided to make practice with many exercises on algebra topics, without any explanation,
by means of traditional frontal lecture, of any geometric concept (it would have been useless, their teachers already did it during the morning class). Students worked only with maths lab for geometry topics, learning independently, but in a collaborative environment and under the guide of the teachers. In this paper we concentrate especially on the work done with geometry.
Mathematics to be seen and touched The majority of students inclined to Concrete Experience led us to use “Learning by doing” as pedagogical context in the Vygotskian perspective of practical intelligence, supported by maths lab (Chiappini, 2007) for practice, using especially eyes and hands, as described in the following.
Geometry with DGS: seeing math with my eyes (with digital artefacts) Nowadays the use of technology is widespread in class practice, and many researchers in mathematical education investigate the (good and not good) effects of technology (see, for instance, (Drijvers, 2012) and (Artigue, 2000)). In our case technology was a very good partner, because we had not a class, but a special selection of students: they were not so good in computations (but not stupid!). In order to grasp the concepts, they needed to be relieved from calculations and see
Fig. 2

“Quaderni di Ricerca in Didattica (Mathematics)”, n. 25, Supplemento n.2, 2015 G.R.I.M. (Departimento di Matematica e Informatica, University of Palermo, Italy)
238
directly the core of a mathematical object, undressed by all formulas and symbols. Formulas come later. To do so we used a DGS (Geogebra above all) to easily represent properties: not only geometric ones as in (Ferrarello, Mammana, Pennisi 2014b), but also algebraic ones, as in (Ferrarello, Mammana, Pennisi 2013). Geometric properties investigated with a DGS were: special point of triangles, angles at the center and at the circumference, Euclid’s theorems. Algebraic properties visualized by means of a DGS were some special products and inequalities. Not a single geometric property was explained by the teachers, but they were discovered and verified by students. Most of activities were carried out in the lab and students were guided by worksheets; those worksheets contained some special tag (different font or pictures) for the name of the DGS tools involved on the construction or exploration requested. In such a way, students could complete the task without asking every single step to the teacher. They have a time and space to think alone. The teachers went around the lab, helping students, if necessary, taking advantage also of gestures and glances. They took care of every student, interacting with each one personally, instead of talking to all. Every student had his/her own computer, but they often interacted with each other in a peer to peer relationship. Students who completed the task helped their mates, in a collaborative learning framework. At the end of the meeting the teachers asked students what they discovered, summarizing the results, in such a way to clarify the concepts for everyone.
Mathematical machines: touching math with my hands (with manual artefacts)
The best appreciated activity: handling maths. No one could think to teach dance only in theory, without practicing steps, but too many times it happens that mathematics is taught just in theory, as a set of preexistent rules, and rarely teachers gave the possibility to handle real object, like some artifacts. What happened with mathematical machines was something magic: some students of the remedial course got a higher score of their classmates in the written assignment concerning geometric transformations! Moreover, they enjoyed a lot those machines, and they also presented them to their classmates during a annual school event named “Mathematics’party”; usually the main character of this “party” are the best students; this time the “remedial students” were protagonist as well. That year they had an “Inclusive Mathematics’ party”. So this activity had effect both on “the brain” and on “the heart”. The machines we used, constructed by hand, are: Kempe’s machine for
translation, Sylvester’s pantograph for rotation, machine for axial symmetry, machine for central symmetry, Scheiner’s machine for homothety, Cavalieri’s machine for parabola, plus a self-produced machine for composition of two axial symmetries. First the students guessed the transformation simply by trying, and then the teacher guided them, by reasoning about “why” that machine provides that transformation.
For instance, we discuss a bit about the use of the central symmetry
machine. We refer to the picture of the machine we really used in class (Fig 3.). It is realized by a parallelogram, ABDC. Both of two parallel edges AB and CD in the picture, are extended in such a way BB’ = C’D. The middle point O of BD is signed and it is a fixed point (it is fixed to a wooden board).
Fig. 3

“Quaderni di Ricerca in Didattica (Mathematics)”, n. 25, Supplemento n.2, 2015 G.R.I.M. (Departimento di Matematica e Informatica, University of Palermo, Italy)
239
As mentioned above, first of all students handled the object and discovered what happens by fixing the middle point O, following a picture with B’ and putting a pen in C’. The picture is isometric, and it is symmetric with respect to O.
Then we recall the definition of central symmetry: points B’ and C’ have to be on the same line with O, and O has to be the middle point of B’C’. Is O the middle point of B’C’? … We have to think a little and see which mathematics is hidden inside the machine. We reasoned in terms of the mathematical objects involved and we drew step by step, with the pencil, the dotted segments in the picture (Fig 4.)
We noticed (by measuring) that, by construction, BB’= C’D. Moreover, they are parallel, so we can draw another parallelogram BB’DC’(whose real fixed edges are BB’ and C’D, while BC’ and B’D can vary). BD is a diagonal of this new semi-unreal parallelogram, and O is the middle point of BD.
So, by the properties of parallelograms, we argue that the other diagonal B’C’ (that now we can draw) is bisected by O, i.e. C’ is the symmetric point of B’, with respect to O.
We proceeded with similar strategies to discover and explain how the other machines work. We obtained two important goals: first, pupils remembered better the definition of central symmetry (since they remembered the construction), and, by using visual intelligence, they remembered the whole figure; second, students perceived mathematics as a whole, and not separated in chapters. Many times, at least in Italian schools, geometric transformations are taught as a stand-alone topic, every concept dies after the teacher finishes that chapter, and they are not used anymore. Moreover, they use only concepts inside the chapter, so there are links neither with the “previous” mathematics nor with the “following” one.
We showed that there are, for instance, quadrilateral properties hidden in the geometric transformation chapter.
A similar work of “merging separated chapters” was done with Cavalieri’s machine for parabola, that uses second Euclid theorem to draw a curve (while triangles and conics are definitively in different chapters of the book).
Conclusions As for “the brain”, students who duly attended the course improved their performance in mathematics, as briefly summarized in Fig. 53. It is worth to point out that the initial and final tests were on different topics. The final test was directed to verify the validity of the teaching style on the topics faced in the course. A test on those topics would have been meaningless at the beginning, before treating the tasks, so the initial test was a sort of entrance exam, aiming to take a picture of the starting situation, and the questions were on topics of the previous scholastic year. For this reason we cannot give quantitative results, 3 The graph refers to the 14 on 20 students participating both to the initial and to the final test.
Fig. 4

“Quaderni di Ricerca in Didattica (Mathematics)”, n. 25, Supplemento n.2, 2015 G.R.I.M. (Departimento di Matematica e Informatica, University of Palermo, Italy)
240
but only qualitative considerations can be made. In Italy assessment is expressed as a number from 1 to 10. Being a remedial course, all the students had low grades: 5 or less. And in the initial test they reached no more than 5, as shown by the red polyline in Fig. 5. The final test consisted in 8 multiple choice questions, 4 open exercises and a geometry problem to be solved by using a DGS. In the geometry problem a property was asked to be verified and proved. The students could/should use the software both to verify the property and to prove it, as an help for reasoning. In the final test, only one student had a lower grade (student 11) and another student had the same grade (student
10). All the other students improved of 1.75 as average. .
As for “the heart”, the anonymous satisfaction test, administered by an external evaluator tutor, highlights the result shown in the graphic on Fig. 6 with respect to the overall evaluation of the course. The 81.90% judged the course excellent or good, and only the 1.70% judged it lousy or insufficient. We report some crucial questions and the relative graphics, with 1 = Definitively no, 5 = Definitively yes
1) Do you think that the use of a new methodology, based also on new technologies, was effective? (Fig. 7)
2) How much did the topics and the teacher’s
strategy rise your interest? (Fig. 8)
Fig. 5
Fig. 6
Fig. 7
Fig. 8

“Quaderni di Ricerca in Didattica (Mathematics)”, n. 25, Supplemento n.2, 2015 G.R.I.M. (Departimento di Matematica e Informatica, University of Palermo, Italy)
241
3) Had practical drills a suitable space? (Fig. 9)
4) Did the course fulfill your expectations
and needs? (Fig. 10)
5) Do you think the course allowed you to
recover your competencies and skills? (Fig. 11)
6) Do you think the course helped to improve
your attitude towards mathematics ? (Fig. 12)
Answers to question 1) and 2) highlight the effectiveness of the strategy based on practical activities (in suitable number for 94% of students as pointed by question 3)) and technology (above all the use of DGS), since 88% of students answered with a Yes or Definitively yes. The 70% of pupils found the course useful to recover their competencies, as they need, and 76% of them thought the course fulfilled their expectations. As for a positive attitude towards mathematics, 59% of students answered with a full Yes, but, as you can see by comparing graphic from Fig. 12 to the previous graphics, it is the only one with a scale of less than 40% on a Definitively yes, and positive (low, but positive) percentage on Definitively no. We are perfectly aware that is not immediate to change a well rooted attitude, and
Fig. 9
Fig. 10
Fig. 11
Fig. 12
“Quaderni di Ricerca in Didattica (Mathematics)”, n. 25, Supplemento n.2, 2015 G.R.I.M. (Departimento di Matematica e Informatica, University of Palermo, Italy)
242
there needs years of hard and everyday work of good teachers to reach a success. We met only once a week and only for a few months. But we firmly think that if teachers will continue in such a direction, students could change their mind (and hearth!) towards mathematics. Open questions about the positive and negative aspects of the activity highlight what follows: the main positive elements were the helpfulness of the teachers, the use of new technologies and the use of mathematical machines. The only negative element was the too heavy scheduling. Of course the activity worked because we had a homogeneous class and we could use Concrete Experience, a thing you cannot do in a regular class, otherwise you would disadvantage convergent and assimilating students. Kolb himself suggests how to reach all learning styles by “teaching around the cycle”: teachers should work by using all the four capabilities, in a spiral. So, every topic should be divided into four phases. For instance you can start from Concrete Experience by introducing a real example of life, then you pass to Reflective Observation by posing questions on why those experience holds. Then you lead students to Abstract Conceptualization by answering to those questions posed in the previous phase and setting the theory. Finally, you act with Active Experimentation by putting theory into practical exercises. At the end of the cycle you should restart a new cycle for the next topic, with a new experience that does not work if one just uses the practical skills acquired in the previous phase, in a learning spiral. By using such a teaching/learning practice the teacher brings:
• divergent students from Concrete Experience to Reflective Observation; • assimilating students from Reflective Observation to Abstract Conceptualization; • convergent students from Abstract Conceptualization to Active Experimentation; • accommodating students from Active Experimentation to Concrete Experience.
All the students participate to the lectures by using their best abilities, all the learning styles are respected. More, all students are taught sometimes in their preferred mode, and they take advantage in the learning activity, and sometimes in their less preferred mode, so they can develop those skills they might never develop if the teaching style was perfectly matched to their preferences. (Felder, 2010)
Acknowledgements The author is very grateful to Salvatore Pluchino for constructing by hand the mathematical machines we used. Special thanks also to the class tutor, Maria Catena Ferrarello, for being a good and passionate teacher, loving both mathematics and students. Finally, a thanks to Nielce Meneguelo Lobo da Costa for useful comments during the presentation of the paper. REFERENCES
Appelbaum, P. (1998). An Other Mathematics: Object Relations and the Clinical Interview. Journal of Curriculum Theorizing 14, 2: 35-42. Artigue, M. (2000). Instrumentation issues and the integration of computer technologies into secondary mathematics teaching. Proceedings of the Annual Meeting of GDM. Potsdam (Germany).
Brown,T. (2012). Affective productions of mathematical experience. Educational Studies in Mathematics, May 2012, Volume 80, Issue 1-2, pp 185-199 Chiappini, G. (2007). Il laboratorio didattico di matematica: riferimenti teorici per la costruzione. Innovazione educativa, Inserto allegato al numero 8, 9-12.

“Quaderni di Ricerca in Didattica (Mathematics)”, n. 25, Supplemento n.2, 2015 G.R.I.M. (Departimento di Matematica e Informatica, University of Palermo, Italy)
243
Di Martino, P. (2007), L’atteggiamento verso la matematica: alcune riflessioni sul tema. L’insegnamento della matematica e delle scienze integrate, Vol. 30A-B, n.6 Dewey, J. (1916). Democracy and education: an introduction to the philosophy of education. Free Press; Reprint edition (February 1, 1997) Drijvers, P. (2012). Digital technology in mathematics education: Why it works (or doesn't). In Proceedings of ICME 12. Seoul, Korea. 9-12 July 2012 Felder, R.M. (2010) Are Learning Styles Invalid? (Hint: No!). On-Course Newsletter, September 27, retrieved at http://www4.ncsu.edu/unity/lockers/users/f/felder/public/Papers/LS_Validity(On-Course).pdf
Ferrarello, D., Mammana, M.F., & Pennisi, M. (2014a). Teaching by doing. QUADERNI DI RICERCA IN DIDATTICA / Mathematics (QRDM) Quaderno N.23 Supplemento n.1 - PALERMO 2013, pp.429-433 http://math.unipa.it/~grim/quaderno23_suppl_1.htm Ferrarello, D., Mammana, M.F., & Pennisi, M. (2014b). Teaching/learning geometric transformations in high-school with DGS. IJTME vol 21 n1 p11-17 Ferrarello, D., Mammana, M.F., Pennisi, M. (2013) Using DGS to introduce algebra properties. ICTMT 11 Conference Proceedings. http://www.dm.uniba.it/ictmt11/download/ICTMT11_Proceedings.pdf Hudson, L. (1968). Contrary imaginations: A psychological study of the English schoolboy. Harmondsworth: Penguin. Kolb, D.A., & Fry, R. (1975) Toward an applied theory of experiential learning. C. Cooper (ed.), Theories of Group Process, London: John Wiley. Kolb, D.A. (1984). Experiential Learning: Experience as the Source of Learning and Development. Englewood Cliffs, NJ: Prentice-Hall. Maschietto, M., & Trouche, L. (2008). ICT, new insights on old problems. In Menghini M, Furighetti F, Giacardi L, Arzarello F. The first century of the International Commission on Mathematical Instruction (1908-2008). Reflecting and shaping the world of mathematics education, Roma: Istituto della Enciclopedia Italiana. http://www.unige.ch/math/EnsMath/Rome2008/WG4/Papers/TROUMAS.pdf
Radford, L. (2013). On the role of representations and artefacts in knowing and learning. Educ Stud Math. DOI 10.1007/s10649-013-9527-x
Vygotsky, L. (1986) Thought and Language. Cambridge, MA: MIT Press. Zan, R. (2006). Difficoltà in matematica. Osservare, interpretare, intervenire. Springer, Milano.

“Quaderni di Ricerca in Didattica (Mathematics)”, n. 25, Supplemento n.2, 2015 G.R.I.M. (Departimento di Matematica e Informatica, University of Palermo, Italy)
244

“Quaderni di Ricerca in Didattica (Mathematics)”, n. 25, Supplemento n.2, 2015 G.R.I.M. (Departimento di Matematica e Informatica, University of Palermo, Italy)
245
Un dispositif de formation initiale pour l’integration d’environnements numeriques dans l’enseignement des
mathematiques au secondaire
Ruhal Floris Institut Universitaire de Formation des Enseignants
Université de Genève, Avenue du Pont d’Arve, Genève [email protected]
Abstract : In this paper we present an preservice training workshop in Information Technologies and their use in the mathematics classroom. The theoretical framework is mainly that of the Theory of Situations of Brousseau (1986) in particular the concepts of milieu and adidacticity (learning feedback). We describe how this framework has structured the workshop and we analyze how students have integrated it in their projects. The workshop proposed to compare a question and answers software from the french group Sesamath with the feedbacks systems of Geogebra and Aplusix (dynamic algebra). Résumé : Dans cette communication nous présentons un dispositif de formation initiale aux technologies de l’information et à leur usage en classe de mathématiques. Le cadre théorique est principalement celui de la Théorie des Situations de Brousseau, en particulier le concept de milieu (1986). Nous décrivons la façon dont ce cadre a structuré le dispositif et analysons la façon dont les étudiants l’ont intégré dans leurs projets. L'atelier a proposer la comparaison d’un exerciseur proposé par le groupe Sesamath avec les systèmes de rétroactions de Geogebra et Aplusix (algèbre dynamique). Introduction A l’Institut Universitaire de Formation des Enseignants (Université de Genève), lors de leur seconde et dernière année, les étudiants sont stagiaires à mi-temps dans une école secondaire. C’est dans ce cadre, qu’ils pour tâche de réaliser une séquence d’environ trois leçons intégrant l’utilisation de l’ordinateur. Les trois ateliers préalables leur permettent de prendre en main quelques logiciels en analysant le type de rétroaction fourni, plus particulièrement le milieu. Entre les ateliers mensuels, les stagiaires effectuent quelques expérimentations ou analyses consignées dans un tableau de bord. Par groupe de 2-3 étudiants, ils mettent en place et observe une séquence en se centrant sur le rôle du milieu spécifique (environnement numérique). Ils présentent et analyse ensuite leur travail lors d’un colloque réunissant tous les participants.
Questionnement Quelles raisons peuvent conduire un enseignant à utiliser un environnement informatique dans l’enseignement des mathématiques ? Aujourd’hui encore la réponse n’est pas immédiate. Pour des enseignants en formation initiale, il est nécessaire d’y réfléchir et de construire une réponse. A première vue, certaines ressources (Labomep de Sesamath, par exemple) fournissent une aide utile à l’enseignant en prenant en charge sa tâche pour la gestion d’exercices répétitifs et en améliorant l’efficacité par rapport au cycle habituel : exercices individuels-correction collective. De nombreux logiciels sont également disponibles, dans le domaine de la géométrie dynamique par exemple. La recherche dans ce domaine a montré que l’intégration efficace de ces outils est soumise à des conditions parfois complexes à mettre en place (Floris & al. 2007). Une partie importante de ces recherches mettant en exergue le rôle des rétroactions pour l’utilisateur, nous en avons fait un des points essentiels du dispositif, en lien avec le concept de milieu adidactique, comme nous le développons ci-dessous

“Quaderni di Ricerca in Didattica (Mathematics)”, n. 25, Supplemento n.2, 2015 G.R.I.M. (Departimento di Matematica e Informatica, University of Palermo, Italy)
246
Cadre théorique Concernant le concept de milieu, nous nous référons aux travaux de Guy Brousseau.
« En situation scolaire l'enseignant organise et constitue un milieu, par exemple un problème, qui révèle plus ou moins clairement son intention d'enseigner un certain savoir à l'élève mais qui dissimule suffisamment ce savoir et la réponse attendue pour que l'élève ne puisse les obtenir que par une adaptation personnelle au problème proposé » (Brousseau, 1989, p.325).
« Nous pouvons définir le milieu adidactique comme étant l'image dans la relation didactique du milieu "extérieur" à l'enseignement lui-même. En fait, cette image joue le rôle de lien avec des pratiques de référence dans lesquelles le système enseigné est supposé pouvoir fonctionner de manière non-didactique »
« Le milieu adidactique concerne également l'ensemble des savoirs (acquis à l'école ou ailleurs) supposés connus par l'élève, dont la mobilisation peut l'aider à réaliser la tâche demandée par l'enseignant. » « On appelle rétroaction une réponse fournie par le milieu qui est reçue par l'élève comme une sanction, positive ou négative, relative à son action et qui lui permet d'ajuster cette action, d'accepter ou de rejeter une hypothèse, de choisir entre plusieurs solutions. (Brousseau, 1986).
On distingue deux types de rétroactions: Une rétroaction de type didactique, pour laquelle l’intention d’enseigner est explicite, la réponse en juste ou faux et la procédure correcte est explicitée. Une rétroaction de type adidactique, lors de laquelle l’intention d’enseigner est cachée. Avec ce type de réponse, il y a maintien du milieu dans lequel travaille l’élève. Comme exemple de rétroaction adidactique, on peut se référer à la situation de l’agrandissement d’un puzzle, dans laquelle chaque élève d’un groupe élabore l’agrandissement d’une pièce. La rétroaction est fournie par l’assemblage final du puzzle : si ce dernier n’est pas possible, la procédure d’agrandissement, par exemple par addition d’une mesure, est invalidée. L’invalidation ne provient pas de l’enseignant, mais de la réussite dans le milieu mis en place. On remarquera que le milieu ne se limite pas à la situation extérieure, mais qu’il est également constitué par la consigne qui définit le but à atteindre. Ce point est à noter, car les étudiants se limitent souvent à analyser la rétroaction, sans tenir compte des contraintes de la situation didactique, en particulier des consignes données.
Exemples Rétroaction didactique Ce que nous appelons exerciseur, tels les ressources proposées par labomep (labomep.net), on propose souvent une tâche précise, pour laquelle la connaissance d’une formule est nécessaire. La rétroaction est « juste ou faux » et les aides fournies récapitulent la formule à utiliser :

“Quaderni di Ricerca in Didattica (Mathematics)”, n. 25, Supplemento n.2, 2015 G.R.I.M. (Departimento di Matematica e Informatica, University of Palermo, Italy)
247
La réponse donnée et l’aide sont externes à la situation d’action de l’élève, c'est-à-dire aux gestes qu’il doit effectuer pour fournir cette réponse. Les informations fournies sont des énoncés (type déclaratif).
Retroaction adidactique Les connaissances de l’élève lui permettent d’obtenir un résultat à analyser. Ce résultat est une rétroaction fournie dans le milieu dans lequel se situe l’action de l’élève. C’est ce dernier qui est responsable de l’interprétation, de l’évaluation en juste/faux. En guise d’exemple, choisissons le logiciel Green Globs (Dugdale, S & Kibbey, 2008) qui propose entre autres des graphiques de fonctions linéaires ou quadratiques dont il faut déterminer l’équation. La rétroaction consiste simplement en un tracé de l’équation entrée par l’utilisateur. L’examen de cet exemple permet d’introduire différents type de rétroaction adidactique. Ce logiciel donne en effet la possibilité de voir la réponse, mais on peut imaginer qu’un paramétrage ne fournisse cette possibilité qu’après un certain nombre d’essais. De plus, les rétroactions fournies permettent à l’élève de trouver la solution simplement par essais et erreurs (phénomène de pêche, Artigue, 1997) de sorte que l’on n’a pas de garanties sur les potentialités d’apprentissage. Suivant Bloch (2005) on dira que le milieu ici n’est guère antagoniste. Ceci permet alors de travailler le rôle de la situation didactique, celle que propose l’enseignant, qui peut par exemple introduire des phases de formulation (Brousseau, 1986) conduisant les élèves à expliciter leurs méthodes et à les justifier.
Deux ressources essentielles La question du milieu est travaillée avec l’étude des potentialités de deux types de ressources. La géométrie dynamique, tout d’abord, qui offre une rétroaction spécifique, le déplacement qui permet de valider le caractère mathématique des constructions effectuées. Il s’agit là de rétroactions ne permettant pas la pêche (essais et erreurs). Le milieu proposé est antagoniste en ce sens que des connaissances mathématiques sont nécessaires pour réussir. La géométrie dynamique fait presque officiellement partie du programme scolaire en Suisse Romande. L’accès facile à la ressource Geogebra facilite aussi son utilisation. Une autre ressource intéressante pour l’étude du milieu est le logiciel Aplusix qui offre un milieu qui permet de contrôler l’équivalence des formules ou des expressions littérale. La rétroaction est là aussi à caractère adidactique, mais les essais-erreurs sont possibles. A charge de l’enseigner de paramétrer logiciel et consignes afin de favoriser l’antagonicité.
Ces deux ressources, sont prioritairement choisies par les enseignants pour leurs séquences.
Evolution des projets Le dispositif de formation a évolué au cours des années. A l’origine, de nombreux projets de

“Quaderni di Ricerca in Didattica (Mathematics)”, n. 25, Supplemento n.2, 2015 G.R.I.M. (Departimento di Matematica e Informatica, University of Palermo, Italy)
248
séquences consistent en un enseignement balisé par des fiches de travail permettant un contrôle accru. Rares sont les exploitations des rétroactions fournies par les environnements informatiques. Les formateurs ont alors décidé de mettre l’accent sur la question du milieu et des retroactions en invitant les étudiants à étudier différentes situations d’utilisation de l’ordinateur et à consigner leurs commentaires dans un tableau de bord : Exercise
ur Geométrie /fonctions
Algèbre En classe à tous les élèves
Analyse Scénario
Séquence principale avec partie en labo
Calculatrice
Quoi (lien ou nom précis)
Date(s) Type (description/analyse ou passation avec élèves)
Passation analyse Passation ou observation
Milieu et rétroactions
Milieu déclaratif (juste/faux)
Peu de rétroactions adidactiques
Hypothèses
Annexes Lien : extrait de réponses d’élève
Lien : détail de l’analyse
Projet de scénario
Les surlignés jaunes sont des exemples Un exemple de tableau de bord partiellement rempli
Conclusion L’expérimentation décrite est actuellement en cours. Les observations d’ores et déjà effectuées mettent en évidence un questionnement autour de la notion de milieu adidactique. Pour certains étudiants, l’intégration en classe reste difficile, alors que d’autres élaborent des consignes et énoncés favorisant les rétroactions. Le colloque final a permis des discussions approfondies sur le concept d’adidacticité, mettant en évidence l’appropriation de ce concept par les étudiants (figure)
Lors de la conférence ces résultats seront ajournés par l’étude des séquences proposées par leurs étudiants ainsi que leur texte final de synthèse.

“Quaderni di Ricerca in Didattica (Mathematics)”, n. 25, Supplemento n.2, 2015 G.R.I.M. (Departimento di Matematica e Informatica, University of Palermo, Italy)
249
REFERENCES Artigue M. (1997), Le logiciel DERIVE comme révélateur de phénomènes didactiques liés à l’utilisation d’environnements informatiques pour l’apprentissage, Educational Studies in Mathematics, 33, 2.
Bloch, I (2005) Quelques apports de la théorie des situations… , habilitation, Université Paris-Diderot - Paris VII. https://tel.archives-ouvertes.fr/tel-00012153
Brousseau, G. (1986). Fondements et méthodes de la didactique de mathématiques. Recherches en didactique des mathématiques, 7.2.
Dugdale, S & Kibbey, D (2008, 2013) Green Globs & Graphing Equations, www.greenglobs.net
Floris R. et Conne, F. (2007) Environnements informatiques, enjeux pour l’enseignement des mathématiques, De Boeck.
Rabardel, P. (1995). Les hommes et les technologies, approche cognitive des instruments contemporains. Paris : Armand Colin.

“Quaderni di Ricerca in Didattica (Mathematics)”, n. 25, Supplemento n.2, 2015 G.R.I.M. (Departimento di Matematica e Informatica, University of Palermo, Italy)
250

“Quaderni di Ricerca in Didattica (Mathematics)”, n. 25, Supplemento n.2, 2015 G.R.I.M. (Departimento di Matematica e Informatica, University of Palermo, Italy)
251
Collaborative study groups in teacher development: a university - school project
Maria Elisa Esteves Lopes Galvão, Rua Carajuá, 60 apto 12, Moema, São Paulo, SP. Brazil
([email protected]). Angélica da Fontoura Garcia Silva, Rua Antonio Celeguim, 180, Vila Zanela, Franco da Rocha, S.
P., Brazil. Ruy Cesar Pietropaolo, Alameda Santos, 721, apto 71,Jardim Paulista, São Paulo, SP, Brazil.
Anhanguera University of São Paulo (UNIAN), Brazil.
Abstract : This paper aims to present the results of an investigation of a continuing education process conducted with school teachers organized into study groups to work collaboratively, based on participating schools. The participating teachers work at the early years of elementary education of São Paulo schools and had previously taken part of a continuing education process under the Brazilian Program "Observatório da Educação". This is a qualitative study in which data was collected through direct observations, recordings and testimonials collected in interviews and reflective reports. Initially, we present the research setting, references and methodological procedures, especially those relating to collaborative work. Llinares (1999) and Jaworski (2009) studies support our data analysis and discussions of issues related to teacher development and collaborative study groups. At the end, we present the analysis of information collected during and after the formative process. Key Words: continuing education process, collaborative groups
Résumé : Cet article vise à présenter les résultats d'une enquête d'un processus de formation continue menée avec les enseignants de l'école, organisés en groupes d'étude pour travailler en collaboration, qui se déroule dans les écoles participantes. Les enseignants participants travaillent sur les premières années de l'enseignement primaire des écoles de São Paulo et avaient déjà pris partie d'un processus de formation continue dans le cadre du programme brésilien "Observatório da Educação". Ceci est une étude qualitative dans laquelle les données ont été recueillies par des observations directes, des enregistrements et des témoignages recueillis dans les entrevues et les rapports de réflexion. Initialement, nous présentons les cadre de la recherche, des références et des procédures méthodologiques, en particulier ceux concernant le travail collaboratif. Les études Llinares (1999) et Jaworski (2009) confirment notre analyse des données et des discussions sur les questions liées à la formation des enseignants et des groupes d'étude de collaboration. A la fin, nous présentons l'analyse des informations recueillies pendant et après le processus de formation.
Introduction This research was developed by a Brazilian Post-graduate Program in Mathematical Education in the scope of the Education Observatory Program whose purpose was to establish groups in which researchers and mathematics teachers at the early years of elementary school work in collaboration. We sought to develop researches to analyze the changes in teaching practices and the professional development of teachers when they are deeply convinced to promote curricular innovations in their classes. This project was developed between 2011 and 2014 and is one of some other projects that occurred since 2008. The establishment of study groups at the schools on a permanent basis was led by the teachers participating in the continuing education process with the university professors during the formative period. Teacher development took place, as described in the original project, in alternate actions happening on-site and online. The project indicated that study groups would be "one alternative to be tested". Researchers interact with teachers and trainers, as managers, partakers or observers of the formation process or of the activities in the classroom. The researchers conduct the activities and subjects are chosen, usually from the group demand, the analysis of diagnostic activities and research results information. The researcher responsible for the activity seeks to motivate discussions and reflections on matters relating to educational processes and group

“Quaderni di Ricerca in Didattica (Mathematics)”, n. 25, Supplemento n.2, 2015 G.R.I.M. (Departimento di Matematica e Informatica, University of Palermo, Italy)
252
interest in bringing mathematics learning situations related to teaching practice. For example, the elements and classifications of the Conceptual Fields Theory Additives emerged from the analysis made by the group of problem situations drawn up by the participating teachers regarding their work in the classroom. After the discussion of the problems brought to the group, teachers have developed activities that returned to their classroom. The group in the light of the knowledge of the theory acquired in the training process subsequently evaluated students’ protocols. One of the groups analyzed here has already been the research object of one master thesis produced within the project scope. Miranda (2014) presented results concerning the process of (re)construction of knowledge required to teach the Additive Conceptual Field. Theory Regarding teacher development and study group formation, we based our support on Llinares (1999) and Jaworski (2009), among others. Such studies have pointed out that the development performed through the establishment of teacher study groups promotes a favorable environment for professional teacher development. We also supported our analysis in Murphy and Lik (1998) studies, which highlight two possible ways to organize study groups: the one involving the entire school and the one defined as independent. The first type usually consists of the administrative school team (principal, coordinator) and they tend to solve school problems, which have already been identified by the group. The independent ones are, according to the authors, those who do not depend on the participants' organizational structure, "have common interests and consider themselves as a group" (Murphy and Lick, 1998, p.10). In Jaworski's studies (2009), we looked for references to our belief that joint work between elementary schools teachers and university researchers is an important stance to promote reciprocal learning and the establishment of what the author calls investigative communities. Like the author, when she quotes Wells (1999), we believe that the teacher in such communities places himself in the role of investigator of his own practice. Therefore, we deem relevant to investigate the convergences noted in the establishment of study groups during the project development. Methodology This research has a qualitative nature, in the sense defined by Bogdan and Biklen (1999). We will present the analysis of collected information about the establishment of the four study groups that took place throughout the four years of the institutional project. Information was collected during the sessions, in the transcript of interviews recorded during and after the continuing education process, and in the analysis of the reflective logs handed to us. We will name the groups as follows: G1; G2; G3 and G4. Group G1 was established at the school of one teacher participating in three development modules of the project. During her participation, this teacher enrolled in the post-graduate program and decided to analyze the (re)construction of knowledge by the participating teachers of the study group established at the same school where she taught. The group's creation was the result of a need observed by the teachers when they received a document from the state education agency (SEE, in Portuguese) presenting recommendations for a diagnostic test involving problem-situations in the Additive Conceptual Field. At that moment, the author states that
(...) I noticed how close the proposal was to the one worked in the development process. In face of the difficulties reported by the group to apply such diagnostic activities, the teachers reinforced the idea of how important the studies about this theme were for them to be able to perform what the document proposed. (Miranda, 2014, p. 37).
Group G1 was established by the enrollment of 15 teachers and allocated at the school created by the SEE called Collective Pedagogical Work Activities (ATPC, in Portuguese). Data presented here were collected in video recordings of the 24 sessions and interviews that were conducted by

“Quaderni di Ricerca in Didattica (Mathematics)”, n. 25, Supplemento n.2, 2015 G.R.I.M. (Departimento di Matematica e Informatica, University of Palermo, Italy)
253
Miranda. Group G2 was established at the school where teacher Santiago works. Studies took place during the ATPC and this teacher was invited by the school management to be the facilitator at the sessions. According to him, the time assigned to studies during the ATPC, up to that moment, did not work as
(...) the theory in question is posed by the study tables at SEE and reaches the teachers who need to sit down once a week and study on their own, because the middle people (pedagogical coordinators) don't always have the conditions to supervise them (Santiago, teacher)
This group consisted of 9 teachers and Santiago and numbers and geometry themes were discussed. Data analysis presented here refer to this group's meetings and also to interviews and testimonials given by Santiago to the authors. Study group G3 already carried its studies during the ATPC time, but the focus on mathematics themes happened in the second and third modules of the development process when the school's principal, who has a degree in mathematics, the school coordinator and 12 more teachers started to participate. According to this school principal
(...) when I'm at the school I don't have that much time to follow the meetings, here, out of my working hours I manage to discuss issues related to the teaching of maths with the teachers (... ) (School Principal)
Information analyzed here was collected in interviews given to the authors of this article and during 16 sessions of development in which themes on plane and spatial figures and decimal numbers were discussed. Study group G4 had also been developing their studies during the ATPC time, but like group G3, it prioritized mathematics themes being discussed in the development process. The school coordinator stated that his participation in the development sessions was due to his need to broaden his development: “our participation here helps us understand what is written in the SEE's document “(School Coordinator). This group consisted of the coordinator and 14 teachers. Among them, there were 7 who participated in the development that discussed aspects related to area and perimeter, and to the multiplicative conceptual field. Information analyzed here was collected during the 20 sessions of development and in interviews given to the authors of this article.
Data Analysis and Discussion Convergences Synthesis We will consider, according to Murphy and Lick (1998), G1 as an 'independent' group and the remaining ones were classified as "entire school group" type, since they were established with the school administration participation. Analyzing the collected information we noticed a few convergences: the participating teachers, of the four groups, had the opportunity to discuss theories and research results which were not part of their knowledge basis. The group participants reported this fact in a recurrent manner:
Participating in the Observatory made us discuss a little more about area and perimeter and about the children's difficulties. I never thought that children would have trouble to understand that the 10 little squares organized in a different way would have the same area. I thought it would be obvious for them and it is not, the same way we saw in that text (Participant 1 of G4)
In group G1, while analyzing the testimonials and practices of the participating teachers in the group which studied at the school premises, Miranda (2014) comes to the conclusion that:
During the study sessions it became clear how much the experience exchange among peers and managers was helpful to rethink how they were developing their teaching practices and how essential it is to organize some time assigned to ATPC aiming to value the exchanging of experiences, to promote studies that meet the development needs of teachers and the knowledge about the curriculum. We noticed that the participation of these teachers in the study groups, besides helping the (re) construction of knowledge about the Additive Conceptual Field Theory, also strengthened the group's investigative spirit, and the feeling of belonging to the school group as a person who learns and develops continuously, triggering changes. (MIRANDA, 2014, p.197)
The awareness about the need to understand the new curriculum, learn about research results and change their practice were also observed in the four groups: "looking at everything we learned here

“Quaderni di Ricerca in Didattica (Mathematics)”, n. 25, Supplemento n.2, 2015 G.R.I.M. (Departimento di Matematica e Informatica, University of Palermo, Italy)
254
[referring to the development sessions] and at the school [in the study groups] we noticed that we increasingly need to study the curriculum and see how my student learns, but now I can help my student better". Final Remarks As pointed by Jaworski (2009), we noticed that, mainly in groups G1, G2 and G3, the developed dynamics placed the teacher in the role of investigator of his own practice. The information collected also enabled us to identify aspects that, according to Murphy and Lick (1998), allow for the promotion of professional development of teachers through the establishment of study groups formed at their own school; in other words, mutual support, planning and learning together, contributing for knowledge and practice, immersing into work based on ideas, materials and colleagues; testing ideas, sharing and reflecting together, constructing knowledge about the content. REFERENCES
Bogdan, R.; Biklen, S. (1999). Investigação qualitativa em educação. Uma introdução à teoria e aos métodos. Porto: Porto Ed.
Jaworski, B. (2009). Building and sustaining inquiry communities in mathematics teaching development. Em K. Krainer, & T. Wood, The international handbook on mathematics teacher education, Participants in mathematics teacher education: individuals, teams, communities and networks (pp. 309-330). Rotterdam: The Nerthelands: Sense publisher, 2009. p.309-330. Llinares, S. (1999). Conocimiento y práctica profesional del profesor de matemáticas. Características de una agenda de investigación. Zetetiké, 7. Miranda, M. (2014). Uma investigação sobre a (re)construção do conhecimento de professores participantes de um grupo que estuda o campo conceitual aditivo. Dissertação de Mestrado , UNIAN , São Paulo-Brasil.
Murphy, C., & Lick, D. (1998). Whole faculty study groups: A powerful way to change schools and enhance learning. California, USA: Corwin.
“Quaderni di Ricerca in Didattica (Mathematics)”, n. 25, Supplemento n.2, 2015 G.R.I.M. (Departimento di Matematica e Informatica, University of Palermo, Italy)
255
Is this a proof? Future teachers’ conceptions of proof
Alexandra Gomes, CIEC/IE, University of Minho, [email protected] Floriano Viseu, CIEd/IE, University of Minho, [email protected]
Paula Mendes Martins, CMAT, University of Minho, [email protected] Luís Menezes, CI&DETS, Polytechnic of Viseu, [email protected]
Abstract: In this paper we present part of an ongoing investigation that aims at disclosing the conceptions of proof held by future elementary school teachers. Using a qualitative and interpretative approach, we analyzed data from 66 questionnaires and results show that almost all participants recognize the formal aspect of an algebraic proof but they also accept some examples as proof.
Résumé: Dans cet article, nous présentons partie d'une enquête en cours qui vise à révéler les conceptions de la preuve détenue par les futurs enseignants du primaire. En utilisant une approche qualitative et interprétative, nous avons analysé les données de 66 questionnaires et les résultats montrent que presque tous les participants reconnaissent l'aspect formel d'une preuve algébrique mais ils acceptent aussi quelques exemples comme preuve.
Introduction Proof plays a fundamental role in the construction of mathematical knowledge, having a different nature and assuming a different structure that in other sciences (Davis & Hersh, 1995; Dreyfus, 2000; Hanna, 2000; Knuth, 2002). To prove is intrinsic to mathematical activity because no result can be considered valid/acceptable until it is proven. Assuming a formal, logical view, proof can be defined as “a sequence of transformations of formal sentences, carried out according to the rules of the predicate calculus” (Hersh, 1993, p. 391). But proof can also be regarded in a more practical manner as “an argument that convinces qualified judges” (ibidem). Therefore, for the same result we can have different proofs. Some proofs have a geometric approach, some are more algebraic, and some have only words while others have only diagrams. Thus, what characteristics must a proof have to be considered as such? Also important is to consider why proof is used. There are several functions attributed to proof (De Villiers, 2003). In teaching and learning mathematics two functions tend to be predominant: conviction and explanation (Hanna, 2000; Hersh, 1993). The importance of proof in the classroom, especially in the early years, has not always been recognized (Hanna, 2000). Proof appears more linked to secondary and higher education and its’ understanding is sometimes referred to the good students only (Knuth, 2002). However, several authors have highlighted the role of proof in the construction of mathematical knowledge by students from the beginning of schooling (Bussi, 2009; Hanna, 2000; Knuth, 2002; Stylianides, 2007). Proof of mathematical results comes prized in the current reformulation of programs from the early grades, in Portugal (ME, 2007; MEC, 2013). From the early grades, children should start to learn and to deal with proof and proving. For this to happen it is important that teachers develop strategies to motivate and encourage students for the activity of proving showing them the power/importance of proof and do not reduce proof to a mere memorization of sequential meaningless steps. This process is clearly dependent on the perception that teachers have of proof and of what it means to prove. Therefore, teachers need to be prepared to deal with proof and to have a clear understanding about proof and proving. Consequently, during initial teacher training, future teachers should be involved in proof activities that enable them to deepen their knowledge on proof, and enhance their ability to validate, organize, justify and generalize acquired mathematical knowledge.

“Quaderni di Ricerca in Didattica (Mathematics)”, n. 25, Supplemento n.2, 2015 G.R.I.M. (Departimento di Matematica e Informatica, University of Palermo, Italy)
256
Methodology The purpose of this study was to disclose the conceptions held by future elementary school teachers (grades 1 through 6) concerning the notion of proof. Nowadays, in Portugal, in order to become an elementary school teacher, one has to have a 3 years degree in Basic Education and then take a Masters degree in teaching. These teachers have to teach several subjects; therefore, the curriculum of these degrees is very wide and covers a great variety of topics.
The participants on this study were 66 students enrolled in the 3rd year of a Basic Education Degree. These participants had already taken 5 courses in mathematics during which they had some contact with proof, performing proofs of some mathematical results, such as the irrationality of the square root of two, Pythagoras theorem or the constant sum of the distances from a point inside a triangle.
Given the nature of the outlined goal, we adopted a qualitative and interpretative approach in order to understand the meaning that future teachers give to this activity (Bogdan & Biklen, 1994).
We designed a short questionnaire containing four mathematical results and, for each, we gave three proposals of proof. We then asked the students to say whether they considered each proposal to be a proof or not and to justify their choices. This questionnaire was completed individually, at the end of a regular class, taught by one of the authors. The participation was voluntary and could be anonymous, that is, students only identified themselves if they wanted to. For this paper we selected the following two results: (1) Diagonals of a rhombus are perpendicular; (2) For ( ) 222 2,, bababaRba ++=+∈ .
Some findings
Result 1 Diagonals of a rhombus are perpendicular. For this result, students were confronted with the 3 proposals of proof. 1st proposal of proof
Draw the diagonals [AC] and [BD] and consider the intersection point (E). Measuring one of the angles defined by the diagonals we easily conclude that the diagonals are perpendicular. Now we check that the same happens for other rhombus, in other positions and other shapes:
In these cases, measuring the angles, we also check that the diagonals are perpendicular. For many other different rhombus we would come to the same conclusion. Hence, we have proved that the diagonals of a rhombus are perpendicular. 2nd proposal of proof
Let [ABCD] be an rhombus represented as follows:
[AC] and [BD] are the diagonals of [ABCD]. M is the midpoint of [AC] and of [BD]. [ABD] is an isosceles triangle, then [AM] is the height of the triangle relatively to the side [BD]. [AC] is perpendicular to [BD].
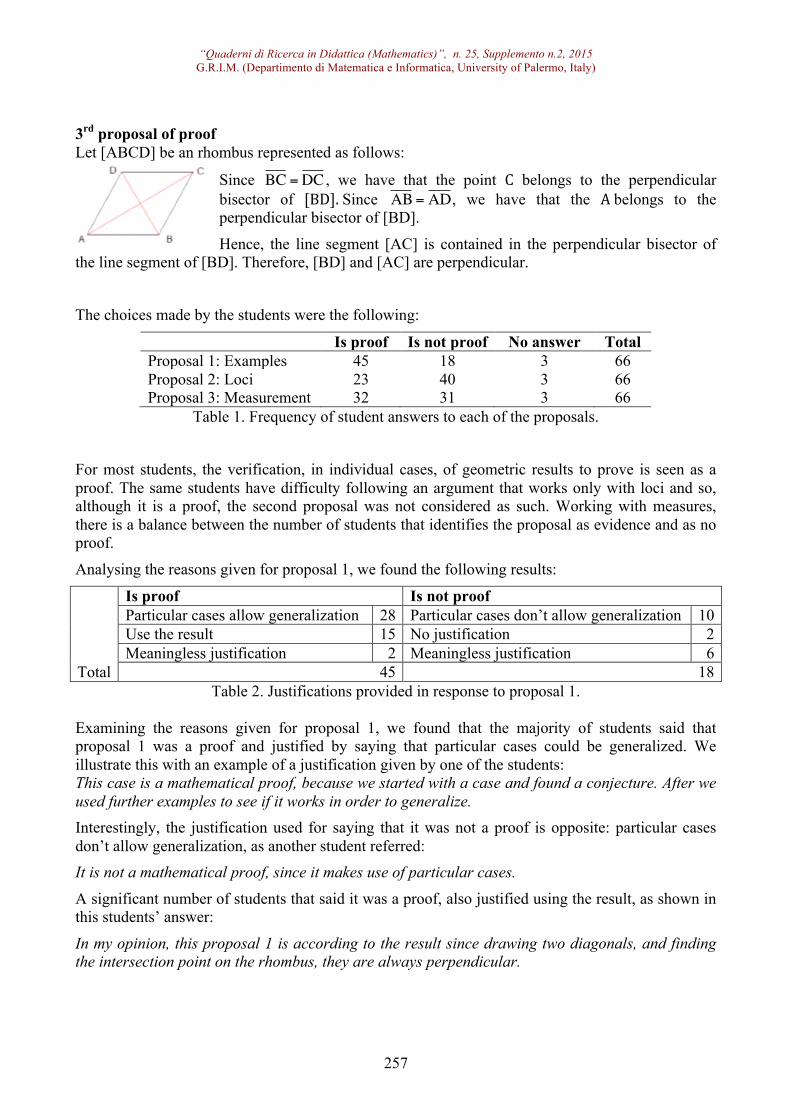
“Quaderni di Ricerca in Didattica (Mathematics)”, n. 25, Supplemento n.2, 2015 G.R.I.M. (Departimento di Matematica e Informatica, University of Palermo, Italy)
257
3rd proposal of proof Let [ABCD] be an rhombus represented as follows:
Since
€
BC =DC , we have that the point C belongs to the perpendicular bisector of [BD]. Since
€
AB= AD, we have that the A belongs to the perpendicular bisector of [BD].
Hence, the line segment [AC] is contained in the perpendicular bisector of the line segment of [BD]. Therefore, [BD] and [AC] are perpendicular.
The choices made by the students were the following:
Is proof Is not proof No answer Total Proposal 1: Examples 45 18 3 66 Proposal 2: Loci 23 40 3 66 Proposal 3: Measurement 32 31 3 66
Table 1. Frequency of student answers to each of the proposals.
For most students, the verification, in individual cases, of geometric results to prove is seen as a proof. The same students have difficulty following an argument that works only with loci and so, although it is a proof, the second proposal was not considered as such. Working with measures, there is a balance between the number of students that identifies the proposal as evidence and as no proof.
Analysing the reasons given for proposal 1, we found the following results:
Total
Is proof Is not proof Particular cases allow generalization 28 Particular cases don’t allow generalization 10 Use the result 15 No justification 2 Meaningless justification 2 Meaningless justification 6
45 18 Table 2. Justifications provided in response to proposal 1.
Examining the reasons given for proposal 1, we found that the majority of students said that proposal 1 was a proof and justified by saying that particular cases could be generalized. We illustrate this with an example of a justification given by one of the students: This case is a mathematical proof, because we started with a case and found a conjecture. After we used further examples to see if it works in order to generalize. Interestingly, the justification used for saying that it was not a proof is opposite: particular cases don’t allow generalization, as another student referred: It is not a mathematical proof, since it makes use of particular cases.
A significant number of students that said it was a proof, also justified using the result, as shown in this students’ answer:
In my opinion, this proposal 1 is according to the result since drawing two diagonals, and finding the intersection point on the rhombus, they are always perpendicular.

“Quaderni di Ricerca in Didattica (Mathematics)”, n. 25, Supplemento n.2, 2015 G.R.I.M. (Departimento di Matematica e Informatica, University of Palermo, Italy)
258
Looking at the reasons given for proposal 2, we found the following results:
Is proof Is not proof Use the result 6 Diagram as particular case 28 Identifies a correct reasoning 5 Insufficient data 5 Meaningless justification 6 Meaningless justification 5 No justification 2
No justification 2 Validation of a step of reasoning 4
Total 23 40 Table 3. Justifications provided in response to proposal 2.
The majority of the students said that it was not a proof and among these, more than half justified their opinion saying that they considered the drawing/diagram to be a particular case. An example of the justifications given is:
If [AC] is perpendicular to [BD] then this rhombus has its diagonals perpendicular. However this is only a particular case, it does not occur for all rhombi.
Some of those saying it was a proof, used the result itself as justification: Proves because the diagonal pass through the point M and have the same angle.
Others said it was a correct reasoning and others justified the all proof identifying just a correct step, as the following example:
This is a proof since in an isosceles triangle the height of the triangle is perpendicular to its base. As for proposal 3, the opinions are divided.
Is proof Is not proof Identify a correct reasoning 8 Diagram as particular case 20 Validation of a step of reasoning 7 Meaningless justification 6
Use the result 3 Insufficient data 3 Meaningless justification 9 No justification 2 No justification 5
Total 32 31 Table 4. Justifications provided in response to proposal 3.
As before, many of those who consider that it is not a proof assume the diagram as a particular case. One of the students wrote:
Does not prove, because we have not proven that we can generalize what is happening with this case.
Also, some of the students that said it was a proof, used the result as justification: It is a proof, because [AC] and [BD] intersected themselves and form a right angle.
There are students that considered the proposal to be a proof since identified a correct reasoning: This is a proof since it is obtained by a sequence of the mathematical statements that no one can refute.

“Quaderni di Ricerca in Didattica (Mathematics)”, n. 25, Supplemento n.2, 2015 G.R.I.M. (Departimento di Matematica e Informatica, University of Palermo, Italy)
259
Result 2 Considering the result: “ ( )2 2 2a,b R, a b a 2ab b∈ + = + + ”, we provided the following proof proposals:
1st proposal of proof
Consider, for example, and . Then, and . If we consider and , we
have and
.
For any real values considered for and , we will obtain equal values for both members of the equality. Hence, the equality is true.
2nd proposal of proof
3rd proposal of proof
Let and be real numbers. Then [Definition of powers]
[Distributivity of over ] [Distributivity of over ] [Definition of powers and commutativity of ] .
Students chose whether each proposal was a proof or not, in the subsequent manner:
Is proof Is not proof No answer Proposal 1: Examples 35 30 1 Proposal 2: Without words 26 38 2 Proposal 3: Algebraic 60 4 2
Table 5. Frequency of student answers to each of the proposals(n=66). In proposal 1, slightly more than half the students said it was a proof.
Is proof Is not proof Formula is checked in particular cases 32 Particular cases don’t allow generalization 24 Use the result 2 No justification 1 Meaningless justification 1 Meaningless justification 5
Total 35 30 Table 6. Justifications provided in response to proposal 1.
Almost all justifications were the same as in proposal 1 from the 1st result, that is, particular cases allow verifying the truth of the statement. One model of this was: Yes, through these examples we can consider that the equality is always true.

“Quaderni di Ricerca in Didattica (Mathematics)”, n. 25, Supplemento n.2, 2015 G.R.I.M. (Departimento di Matematica e Informatica, University of Palermo, Italy)
260
For proposal 2 we have the following results:
Is proof Is not proof Identify the figures to complete equality 14
Insufficient data 28 Check with concrete values 2 Use the result 2 Meaningless justification 6 Diagram as particular case 8 No justification 2 No justification 2
Total 26 38 Table 7. Justifications provided in response to proposal 2.
In this proposal, more students said it wasn’t a proof since most of them considered that data was insufficient. An example of a justification given by students is: It’s not a proof, as is not accompanied with any explanation / justification. Nevertheless, half of the students that considered this proposal to be a proof did it because they could read the figures to complete the equality: It proves because both figures represent the same number. Finally, almost all students consider proposal 3 a proof.
Is proof Is not proof Identify a correct reasoning 29
Insufficient data 3 Validation of a step of reasoning 8 Taken as a generalizable example 9 Meaningless justification 5
Meaningless justification 1 No justification 4 Use the result 4 Verify each step with values 1
Total 60 4 Table 8. Justifications provided in response to proposal 3.
The justification given by most of them is that they recognize a well-justified reasoning. For example: It is a mathematical proof as it demonstrates the equality through mathematical properties and definitions for any real numbers a and b.
There are some students that see this proposal as a generalizable example. One such answer was: Yes, through this mathematical proof it is possible to generalize.
As before, there are some students that only gave importance to one of the steps of the proof: It is a proof because it uses the distributive law of the multiplication to adition for real numbers. Conclusions and Implications The majority of the students accept that a mathematical result may be proven using a few examples. They tend to evaluate specific cases to ascertain the truth of a result. This finding is corroborated by several researches (Harel & Sowder, 1998). Even though there is some sense that to prove, one needs to generalize, students fail to give a valid argumentation that supports the generalization or they fail to recognize that only giving some examples doesn’t necessarily mean that the result is valid. They still think empirically/inductively. This result points to the need of providing opportunities for these students to evolve from this inductive stage.
Some students look at diagrams, in geometry, as particular cases and not as generic as they are

“Quaderni di Ricerca in Didattica (Mathematics)”, n. 25, Supplemento n.2, 2015 G.R.I.M. (Departimento di Matematica e Informatica, University of Palermo, Italy)
261
intended to be. For them, diagrams seem to represent particular, concrete objects, so they haven’t acquired the figural concept (Fischbein, 1993). On the other hand, this result may also be due to the lack of activities during the school trajectory of students that consider different representations of mathematical proof in the results. (Hanna, 2000) Several students fail to see the need for proof since they simply use the result as a justification. This apparent lack of curiosity for why such result is true seems to indicate that students consider that proof is something irrelevant, meaningless that they just need to memorize.
Almost all students recognize the formal aspect of an algebraic proof. They seem to pay more attention to the formal aspect of a proof than to its’ correctness.
These results point to the necessity of rethinking the way proof is approached in the initial teacher training courses. The training of these future teachers should emphasize the understanding and the process of proving rather than the memorization and replication of proofs. Future teachers should appreciate the role of proof and be challenged through appropriate tasks to evolve from the inductive stage. They also should be given opportunities to select and use various types of reasoning and methods of proof.
REFERENCES Bogdan, R., & Biklen, S. (1994). Investigação Qualitativa em Educação. Porto: Porto Editora.
Bussi, M. (2009). Proof and proving in primary school: An experimental approach. In Proceedings of the ICMI Study 19 conference: Proof and Proving in Mathematics Education (Vol. 1, pp. 53-58). Davis, P. J., & Hersh, R. (1995). A experiência matemática. Lisboa: Gradiva.
De Villiers, M. (2003). Rethinking proof with The Geometer´s Sketchpad. Emeryville: Key Curriculum Press.
Dreyfus T. (2000). Some views on proofs by teachers and mathematicians. In A. Gagatsis (Ed.), Proceedings of the 2nd Mediterranean Conference on Mathematics Education (Vol. 1, pp. 11-25). Nikosia. Cyprus: The University of Cyprus. Fischbein, E. (1993). The theory of figural concepts. Educational Studies in
Mathematics, 24(2), 139-162. Hanna, G. (2000). Proof and its classroom role: a survey. In Atas do Encontro de Investigação em Educação Matemática-IX EIEM (pp. 75-104). Fundão: SPCESEM. Harel, G. & Sowder, L. (1998). Students’ proof schemes: results from exploratory studies. CBMS Issues in Mathematics Education, 7, 234-283.
Hersh, R. (1993). Proving is convincing and explaining. Educational Studies in Mathematics, 24, 389-399.
Knuth, E. (2002). Teachers’ conceptions of proof in the context of secondary school mathematics. Journal of Mathematics Teacher Education, 5, 61–88.
Ministério da Educação (ME) (2007). Programa de Matemática do Ensino Básico. Lisboa: Ministério da Educação.
Ministério da Educação e Ciência (MEC) (2013). Programa de Matemática do Ensino Básico. Lisboa: Ministério da Educação e Ciência.
Stylianides, A. (2007). Proof and proving in school mathematics. Journal for Research in Mathematics Education, 38(3), 289-321.

“Quaderni di Ricerca in Didattica (Mathematics)”, n. 25, Supplemento n.2, 2015 G.R.I.M. (Departimento di Matematica e Informatica, University of Palermo, Italy)
262
“Quaderni di Ricerca in Didattica (Mathematics)”, n. 25, Supplemento n.2, 2015 G.R.I.M. (Departimento di Matematica e Informatica, University of Palermo, Italy)
263
Mathematics teaching and digital technologies: a challenge to the teacher's everyday school life
Nielce Meneguelo Lobo da Costa Rua Dr. Sampaio Viana, 238 apto 92, São Paulo, SP, Brazil ([email protected])
Maria Elisabette Brisola Brito Prado
Rua Rafael Saglioni, 332, Campinas, SP. Brazil, ([email protected])
Maria Elisa Esteves Lopes Galvão Rua Carajuá, 60 apto 12, São Paulo, SP. Brazil ([email protected])
Anhanguera University of São Paulo (UNIAN), Brazil
Abstract: This article aims to discuss and analyze the support to be offered to mathematics teachers in continuous formative processes, so as to help them develop the type of knowledge involved in the integration of Digital Information and Communication Technologies (DICT) in their classroom practice. The central idea is to discuss the theoretical frame in which digital technologies are acquired so as to enable the construction and reconstruction of knowledge represented in TPACK, which consists of the intersection of three types of knowledge - specific content, pedagogical and technological - and their connections, interactions and restraints. Based on theoretical references and on results from various studies, we highlight one event that involved the planning and the application of a teaching practice activity using digital technology. We came to the conclusion that it is not simple for the teacher to integrate the available digital technologies to mathematics teaching in order to help the student learn to think using digital technology and "do math" in the classroom. The latter requires him to have new learnings and reconstruct knowledge in a learning process throughout his life, in the professional development perspective.
Key words: Educational Technology, Mathematics Teaching, Professional knowledge, DICT, TPACK
Résumé: Cet article vise à discuter et analyser le soutien à offrir aux professeurs de mathématiques en un processus de formation continue, de manière à les aider à développer le type de connaissances impliquées dans l'intégration des technologies de l'information numérique et (DICT) dans la pratique en salle de classe de l'école secondaire de mathématiques. L'idée centrale est de discuter le cadre théorique dans lequel les technologies numériques sont acquises afin de permettre la construction et la reconstruction de la connaissance représentée dans TPACK, qui se compose de l'intersection de trois types de connaissances - un contenu spécifique, pédagogique et technologique - et de leurs connexions , les interactions et les contraintes. Basés sur des références théoriques et sur les résultats de diverses études, nous soulignons un événement qui implique la planification et l'application d'une activité pratique de l'enseignement en utilisant la technologie numérique. Nous sommes venus à la conclusion qu'il est pas simple pour l'enseignant d'intégrer les technologies numériques disponibles pour l'enseignement des mathématiques afin d'aider l'élève à apprendre à penser en utilisant la technologie numérique et "faire des mathématiques» dans la salle de classe. Ce dernier lui demande d'avoir des nouveaux apprentissages et de reconstruire des connaissances dans un processus d'apprentissage tout au long de sa vie, dans la perspective de développement professionnel. Mots clés: Technologie Éducative, l'enseignement des mathématiques, connaissances professionnelles, DICT, TPACK
Introduction The evolution of Digital Information and Communication Technologies (DICT) has stimulated researchers from different areas of knowledge to understand the potentialities of using technological resources in teaching and learning processes. However, many studies confirmed the difficulty experienced by teachers to make pedagogical use of computer resources integrated to syllabus
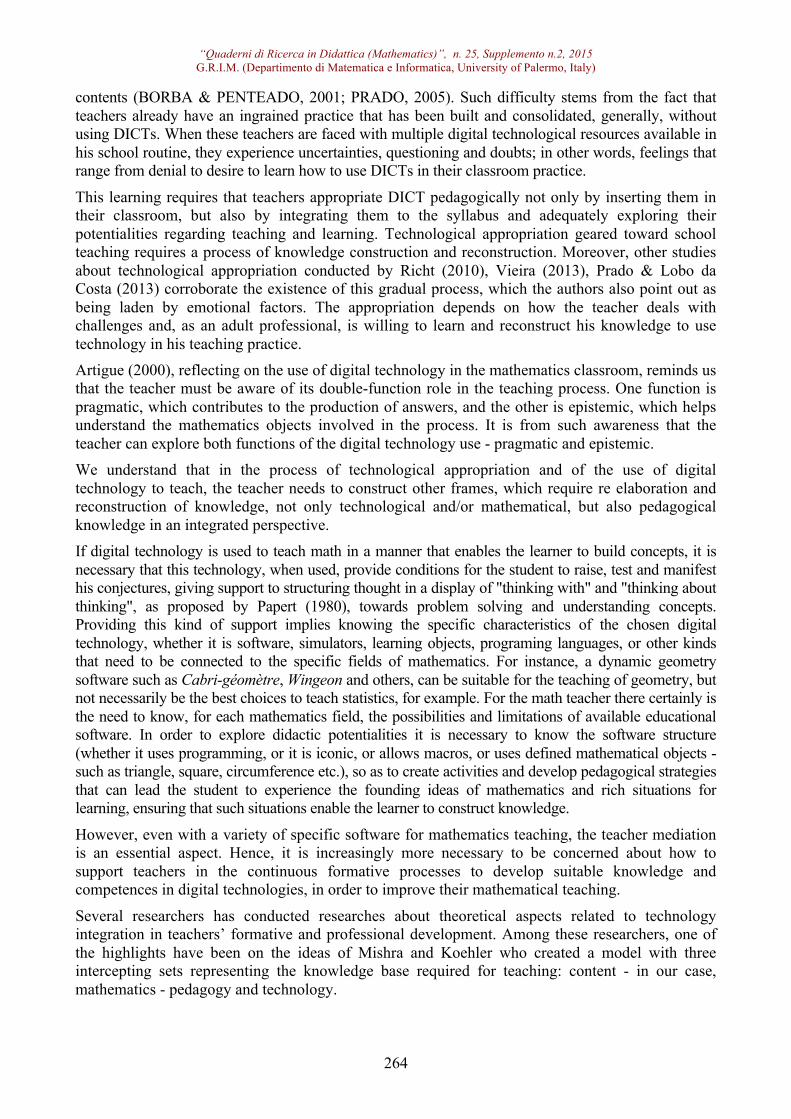
“Quaderni di Ricerca in Didattica (Mathematics)”, n. 25, Supplemento n.2, 2015 G.R.I.M. (Departimento di Matematica e Informatica, University of Palermo, Italy)
264
contents (BORBA & PENTEADO, 2001; PRADO, 2005). Such difficulty stems from the fact that teachers already have an ingrained practice that has been built and consolidated, generally, without using DICTs. When these teachers are faced with multiple digital technological resources available in his school routine, they experience uncertainties, questioning and doubts; in other words, feelings that range from denial to desire to learn how to use DICTs in their classroom practice.
This learning requires that teachers appropriate DICT pedagogically not only by inserting them in their classroom, but also by integrating them to the syllabus and adequately exploring their potentialities regarding teaching and learning. Technological appropriation geared toward school teaching requires a process of knowledge construction and reconstruction. Moreover, other studies about technological appropriation conducted by Richt (2010), Vieira (2013), Prado & Lobo da Costa (2013) corroborate the existence of this gradual process, which the authors also point out as being laden by emotional factors. The appropriation depends on how the teacher deals with challenges and, as an adult professional, is willing to learn and reconstruct his knowledge to use technology in his teaching practice. Artigue (2000), reflecting on the use of digital technology in the mathematics classroom, reminds us that the teacher must be aware of its double-function role in the teaching process. One function is pragmatic, which contributes to the production of answers, and the other is epistemic, which helps understand the mathematics objects involved in the process. It is from such awareness that the teacher can explore both functions of the digital technology use - pragmatic and epistemic. We understand that in the process of technological appropriation and of the use of digital technology to teach, the teacher needs to construct other frames, which require re elaboration and reconstruction of knowledge, not only technological and/or mathematical, but also pedagogical knowledge in an integrated perspective. If digital technology is used to teach math in a manner that enables the learner to build concepts, it is necessary that this technology, when used, provide conditions for the student to raise, test and manifest his conjectures, giving support to structuring thought in a display of "thinking with" and "thinking about thinking", as proposed by Papert (1980), towards problem solving and understanding concepts. Providing this kind of support implies knowing the specific characteristics of the chosen digital technology, whether it is software, simulators, learning objects, programing languages, or other kinds that need to be connected to the specific fields of mathematics. For instance, a dynamic geometry software such as Cabri-géomètre, Wingeon and others, can be suitable for the teaching of geometry, but not necessarily be the best choices to teach statistics, for example. For the math teacher there certainly is the need to know, for each mathematics field, the possibilities and limitations of available educational software. In order to explore didactic potentialities it is necessary to know the software structure (whether it uses programming, or it is iconic, or allows macros, or uses defined mathematical objects - such as triangle, square, circumference etc.), so as to create activities and develop pedagogical strategies that can lead the student to experience the founding ideas of mathematics and rich situations for learning, ensuring that such situations enable the learner to construct knowledge.
However, even with a variety of specific software for mathematics teaching, the teacher mediation is an essential aspect. Hence, it is increasingly more necessary to be concerned about how to support teachers in the continuous formative processes to develop suitable knowledge and competences in digital technologies, in order to improve their mathematical teaching.
Several researchers has conducted researches about theoretical aspects related to technology integration in teachers’ formative and professional development. Among these researchers, one of the highlights have been on the ideas of Mishra and Koehler who created a model with three intercepting sets representing the knowledge base required for teaching: content - in our case, mathematics - pedagogy and technology.

“Quaderni di Ricerca in Didattica (Mathematics)”, n. 25, Supplemento n.2, 2015 G.R.I.M. (Departimento di Matematica e Informatica, University of Palermo, Italy)
265
The model was named TPACK4(Technological Pedagogical Content Knowledge) and it is a theoretical structure aimed to help understand the nature of knowledge fields that are retrieved by teachers in their practice. In the intersection shared by the three fields is the pedagogical technological knowledge of content.
Figure 1: TPACK model
Source: Adapted from Mishra & Koehler (2006) TPACK, which is in the intersection of three fields: Pedagogical Knowledge – PK, Content Knowledge – CK and Technological Knowledge – TK, symbolizes a blend that stands as an emerging form of knowledge, which goes beyond all its components (content - in our case, mathematics - pedagogy and technology). This is the kind of knowledge to be retrieved to teach with technology (KOEHLER & MISHRA, 2009).
How could we give support to teachers to help them construct TPACK? In search of the answer to this question, we have conducted researches and we need theories to provide us support. We sought to understand the TPACK construction process by the teacher and, chiefly in this article; we focused our reflection in studies about Rabardel's instrumented activity, which specifically encompasses technology. Artigue (2000) reminds us not to underestimate the complexity of instrumentation process (instrument adaptation by the user for specific purposes) and the instrumented activity (how the instrument models the user's strategies and knowledge) by teachers. She also emphasizes Rabardel's (1995) idea of instrumental genesis, that is, the process from which an artifact (the object - that is, a map, some software, a computer, a tablet etc.) becomes an instrument for the individual. When an individual starts to use an artifact, he constructs his own schemes of utilization and, by doing so, develops his mental schemes.
Technological appropriation is not simple, and from the TPACK's perspective, such knowledge cannot be seen in an isolation way. The integrated understanding of pedagogical, technological and content knowledge has been a great challenge both in and for teacher development, as they require new knowledge construction. Considerations based on researches From this theoretical discussion, we present what we have learned from our experience and
4Initially, the authors adopted the acronym TPCK and later renamed it as TPACK - pronounced "tee-pack", so it would sound like a "total package" (total package, that is, an integrated amalgam of the three kinds of knowledge: technological, pedagogical and content, which then produce a new kind of knowledge.

“Quaderni di Ricerca in Didattica (Mathematics)”, n. 25, Supplemento n.2, 2015 G.R.I.M. (Departimento di Matematica e Informatica, University of Palermo, Italy)
266
researches about what can help and/or hinder the TPACK development by teachers. In the researches mentioned here, the teachers participated in continued education development processes which all focused on the use and/or integration of technology in the teaching of mathematics. The research projects were supervised by each of us, and include: Muraca (2011), Castro (2011) and Vieira (2013), which provided support for our conclusions. All of them share at least one common aspect which is the need for the teacher to develop a specific kind of integrating-based knowledge defined as "pedagogical technological content knowledge" (TPACK) in a process of instrumented activity and technology appropriation to teach, in our case, mathematics. In this article, we bring detailed considerations about the support to be offered to teachers based on aspects of the study conducted by Vieira (2013), who researched the professional knowledge of elementary school teachers and the appropriation of digital technology for geometry teaching. The process of digital technology appropriation by the teachers of the same school for teaching spatial and plane geometry and where the professional knowledge construction, in particular TPACK, was studied. Data collection was conducted through direct observation, audio and video recording of meetings, and logs of the teachers' production. The teachers had no experience with the use of software for teaching geometry and were involved in the research project during one school term, learning and using SketchUp5.
The software SketchUp is free and makes it possible to create 3D models and post them and also to import shapes from the Internet for its interface. This software has not been conceived for specific educational purposes, although it can help students develop their spatial perception and, mainly, lead them to assimilate knowledge related to the spatial representation of shapes on a two-dimensional screen. In Figure 2 there is an example of a project developed within the research project using the application.
Figure 2: Screen showing spatial shapes created using SketchUp
Source: Vieira, 2013, p. 242. At the geometry class, the use of this software enables students to explore geometric elements such as points, lines, planes, angles, parallel lines, perpendicular lines, plane shapes and geometric solids.
5SketchUp available for download at: <http://www.sketchup.com/intl/pt-BR/download/gsu.html>. Last accessed: February 28, 2015.

“Quaderni di Ricerca in Didattica (Mathematics)”, n. 25, Supplemento n.2, 2015 G.R.I.M. (Departimento di Matematica e Informatica, University of Palermo, Italy)
267
One of the software tools called Orbit allows for adding animation to created shapes to be viewed from different viewpoints. According to Vieira (2013) "The student is able to change the spatial reference system, choose the perspective and change the viewpoint to observe and explore the spatial geometric shapes, hence achieving a better three-dimensional view of the object" (p.75). Figure 2 brings the representation of a pentagonal prism and some viewings available when the solid is animated using the Orbit tool.
Figure 3: Two views of a pentagonal prism using the Orbit tool Source: Adapted from Vieira (2013) p.77.
Next, we will discuss an episode that exemplify the process of mobilization of knowledge by one of the participants of the formative process (Teacher A). This involved the planning and development of classroom activities with students aged between 7 and 10 with Teacher-A.
In the lesson planning session, Teacher-A made decisions about the content - determining the type of solid to be explored, which software tools to use in the constructions and which pedagogical approach and strategy to apply. During the classroom activity planning section for Teacher-A's, dialogs like the one that follows were present, specifically when choosing between approaching prisms or pyramids, besides the teaching of terminology to be introduced to the students and the way to use the software tools in class.
Researcher: Let's create a pentagonal prism. How? Teacher-A: Click on number 7. Researcher: Which faces? Teacher-A: Two five-sided ones. Two pentagons and five rectangles. Teacher-A: I think it's difficult for a child, because they have to know the number of edges and the type of face. Researcher: Use transparent! [a software tool] Teacher-A: How interesting! In the transparent mode I can see the vertices and the edges.
Table 1: Dialogs among Researcher and Teacher-A
In the dialog above it is possible to notice reflections that point towards the construction/mobilization of technological, pedagogical and geometrical knowledge by Teacher-A. There is one attempt made by the researcher to give support to Teacher-A for TPACK construction, which is the kind of knowledge that supports decisions regarding the exploration of concepts in class.
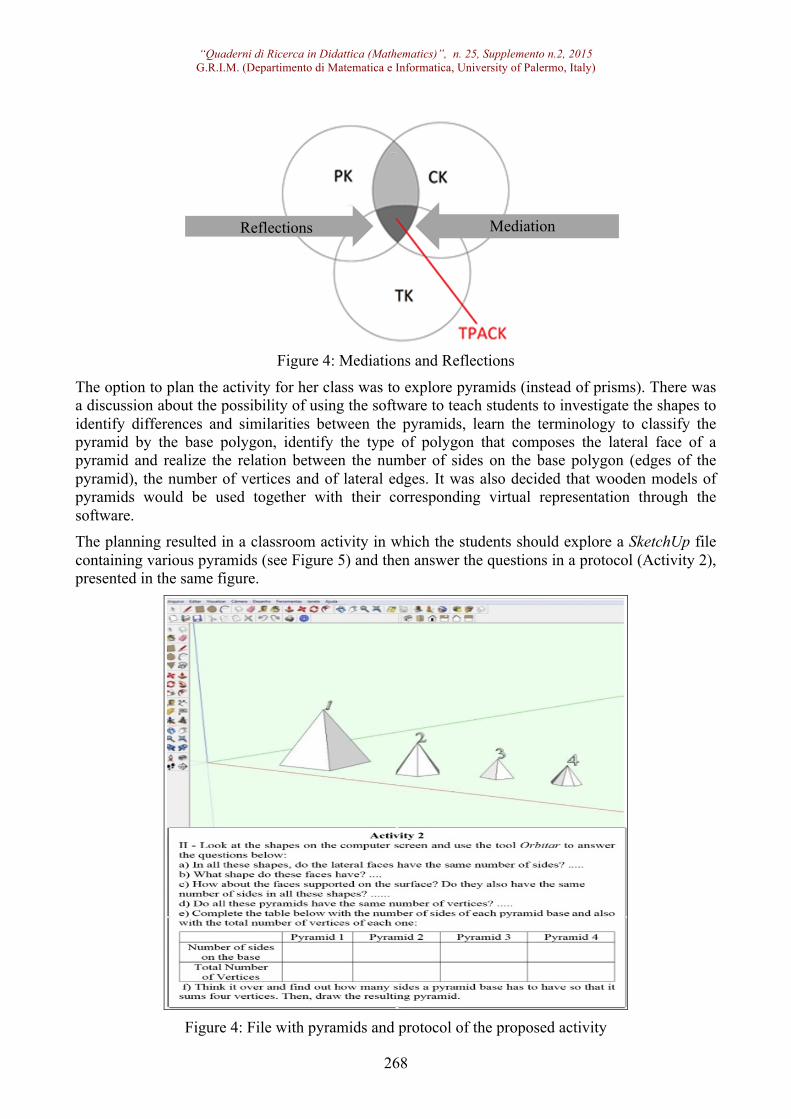
“Quaderni di Ricerca in Didattica (Mathematics)”, n. 25, Supplemento n.2, 2015 G.R.I.M. (Departimento di Matematica e Informatica, University of Palermo, Italy)
268
Figure 4: Mediations and Reflections
The option to plan the activity for her class was to explore pyramids (instead of prisms). There was a discussion about the possibility of using the software to teach students to investigate the shapes to identify differences and similarities between the pyramids, learn the terminology to classify the pyramid by the base polygon, identify the type of polygon that composes the lateral face of a pyramid and realize the relation between the number of sides on the base polygon (edges of the pyramid), the number of vertices and of lateral edges. It was also decided that wooden models of pyramids would be used together with their corresponding virtual representation through the software. The planning resulted in a classroom activity in which the students should explore a SketchUp file containing various pyramids (see Figure 5) and then answer the questions in a protocol (Activity 2), presented in the same figure.
Figure 4: File with pyramids and protocol of the proposed activity
Mediation
Reflections

“Quaderni di Ricerca in Didattica (Mathematics)”, n. 25, Supplemento n.2, 2015 G.R.I.M. (Departimento di Matematica e Informatica, University of Palermo, Italy)
269
Source: Adapted from Vieira (2013) p.173. This activity was applied when the students were familiarized with the software and its basic tools (they already have learned about its basic tools, which involved the construction and exploration of various plane shapes and solids). The proposal was presented to explore the four pyramids in the file, analyze them and fill out the protocol. The excerpt below was taken from Teacher-A classroom dialog during her class.
Student: How many are there on the base? [referring to the edges on the base] Teacher-A: You have to count them. Student: The sides? Teacher-A: Orbit around it so you can see and count. In pyramid 1 the base has 4 edges and 4 vertices, with the top one it makes 5, doesn't it? Pyramid 2 has 6 on the base and with the top one, 7. Look, you have to keep on counting. Teacher-A: Now, tell me, how many does pyramid 3 have on its base? And the total? Student: 5 and 6. Teacher-A: How about pyramid 4? Student: 8 and 9. Teacher-A: What will be the pyramid base with a total of 4 vertices? Consider using the Polygon tool. What do you have to enter? Student: Three.
Table 2: Dialogs among Student and Teacher-A
Teacher-A instigates her student with questions to stimulate and guide him in the exploration and investigation of the proposal situation. It can be seen that Teacher-A mobilizes pedagogical, technological and content knowledge to guide the student's thinking. She chooses not correct imperfect nomenclature used by the student in order to focus on what considered essential in the activity and was talking with the student and urging him to explore the figures, investigate and reason with the software tools
The discussions and reflections about geometric solid properties that happened between Teacher-A and the researcher during the joint lesson planning were key for her guidance, and her experience as a learner, when she developed activities in the software. The construction and reconstruction of concepts were made possible, as well as the re-signification of the teaching of these concepts.
Conclusion The challenge of knowing how to use technology to teach mathematics in order to attend the specificities of each mathematical field (numeric, algebraic, geometric), considering the educational context of practice; so as to help the learner to construct syllabus-established mathematical knowledge and achieve goals set by us, researchers, is a challenge that requires the teacher to develop knowledge of the type discussed here as TPACK, which takes place through gradual appropriation and instrumented activities. To help and provide support to teachers construct TPACK in formative processes, it is necessary to propose situations with technology so that the participants can experience them. Such situations should have as their starting point the specific content knowledge and involve both pedagogical discussions and the ones referring to implications of the use of technological resources in teaching as a means of structuring thought. The actions into the formative process should prioritize strategies that help the teacher in his process of appropriation of digital technology for the teaching of mathematics, always taking into account that such process is gradual and experience needs to take place and be discussed to reconstruct practices. Finally, we reiterate that it is not simple for the teacher to integrate the available digital technologies to mathematics teaching in order to help the student learn to think using digital

“Quaderni di Ricerca in Didattica (Mathematics)”, n. 25, Supplemento n.2, 2015 G.R.I.M. (Departimento di Matematica e Informatica, University of Palermo, Italy)
270
technology and "do math" in the classroom. The process requires, mainly from teachers, that they experience new learnings and knowledge reconstruction in a life-long learning process, under the professional development perspective.
Acknowledgements The researches referenced herein have been partially financed from the Education Observatory Program (Programa Observatório da Educação), from CAPES/Inep, Ministério da Educação da República Federativa do Brasil, to which we are grateful. REFERENCES
Artigue, M. (2000). Instrumentation issues and the integration of computer technologies into secondary mathematics teaching. Proceedings of the Annual Conference on Didactics of Mathematics. Potsdam. Acesso em 28 de February de 2015. Borba, M. D. & Penteado, M. G. (2001). Informática e educação matemática. Autêntica.
Castro, A. L. (2011). Tecnologias Digitais de Informação e Comunicação e o Ensino de Funções Quadráticas: contribuições para a compreensão das diferentes representações. Dissertação de Mestrado, Universidade Bandeirante de São Paulo, São Paulo, Brasil. Available for download at: <http://www.matematicaepraticadocente.net.br/pdf/teses_dissertacoes/dissertacao_AnnaLuisadeCastro_2011_Bette.pdf> Last accessed: February 28, 2015.
Koehler, M. J. & Mishra, P. (2009). What is technological pedagogical content knowledge? Contemporary Issues in Technology and Teacher Education, 9. Available for download at:<http://goo.gl/zXfvrr>. Last accessed: February 28, 2015. Mishra, P. & Koehler, M. (2006). Technological Pedagogical Content Knowledge: A framework for teacher knowledge. Teachers College Record, 108(6), 1017-1054. Muraca, F. (2011). Educação Continuada do Professor de Matemática: um contexto de problematização desenvolvido por meio de Atividades Exploratório-Investigativas envolvendo Geometria Espacial de Posição. Dissertação de Mestrado, Universidade Bandeirante de São Paulo, São Paulo, Brasil. Available for download at:<http://www.matematicaepraticadocente.net.br/pdf/teses_dissertacoes/dissertacao_FernandoSpadiniMuraca_2011_Nielce.pdf> Last accessed: February 28, 2015. Papert, S. (1980). Mindstorms: Children, Computers, and Powerful Ideas. New York: Basic Books. Prado, M. E. (2005). Integração de mídias e a reconstrução da prática pedagógica. In: Almeida, M.E.B. & Moran, J.M. (orgs.). Integração de Tecnologias, Linguagens e Representações. Brasília, Brasil: Secretaria de Educação a Distância, Ministérios da Educação. Available for download at:<http://salto.acerp.org.br/saltotvescola/livros.asp> Last accessed: February 28, 2015.
Prado, M. E. & Lobo da Costa, N. M. (2013). O processo de apropriação das TIC e a reconstrução de novas práticas no ensino de Matemática. Actas del VII CIBEM - Congreso Iberoamericano de Educación Matemática, 1, pp. 6973-6970. Montevidéu. Rabardel, P. (1995). Les hommes et les technologies une approche cognitive des instruments contemporains.Paris: Armand Colin.
Vieira, E. R. (2013). Grupo de Estudos de professores e a apropriação de tecnologia digital no ensino de geometria: caminhos para o conhecimento profissional. Tese de Doutorado, Universidade Bandeirante de São Paulo, São Paulo-Brasil.
“Quaderni di Ricerca in Didattica (Mathematics)”, n. 25, Supplemento n.2, 2015 G.R.I.M. (Departimento di Matematica e Informatica, University of Palermo, Italy)
271
Pre-service Teachers’ Informal Inferential Reasoning
Orta Amaro José Antonio1, [email protected]
García Ríos Víctor Nozair2, [email protected] Altamirano Abad José Antonio3, [email protected]
Sánchez Sánchez Ernesto Alonso4, [email protected] 1, 3 Escuela Nacional para Maestras de Jardines de Niños
2, 4 Centro de Investigación y de Estudios Avanzados del IPN
Abstract: The aim of this research is to explore the informal inferential reasoning (IIR) of pre-service teachers. We pose the question: to which extent do pre-service teachers depend on prior statistics knowledge and on day-to-day knowledge or experience? The proposal of Zieffler et. al. about the RII has been used to guide the theoretical approach of this research. Since results show the absence of statistical concepts in rational decision making, actions carried out in the classroom have to be set up in order to balance the pre-service teachers’ statistical and day-to-day knowledge. Abstract: Le but de la recherche est d'explorer le raisonnement déductif informel (IIR) des enseignants en formation. Nous posons la question: dans quelle mesure les enseignants en formation dépendent des connaissances préalables en statistiques et des connaissances acquises au long de la vie quotidienne? La caractérisation de l’IIR dû à Zieffler et al. a été utilisé pour guider l'approche théorique de cette recherche. Puisque les résultats montrent une absence des concepts statistiques dans la prise des décisions rationnelles, il a fallu mettre en classe une série des actions afin d'équilibrer les connaissances statistiques des futurs enseignants avec les connaissances qu’ils ont acquis au long de sa vie quotidienne.
Introduction The study of statistics provides tools and ideas to analyze and interpret information; statistical inference enables people to read, understand and interpret conclusions derived from data analysis. The teachers, as part of their daily exercise, need to understand statistical information as charts, averages, and other concepts (Estrada, 2007). Make efficient use of this information is useful when they prepare their classes, or if they are part of a research team. This knowledge coupled with appropriate analysis tools lead them to make decisions in a changing society. Mexican kindergarten teachers (teaching students between 3 and 5 years of age) must be able to collect, organize, present and analyze data to take on problem solving in the educational context, aside from applying those concepts and procedures in research projects (SEP, 2012). However, students and teachers make mistakes for instance, in the concepts of sampling and distribution (Castro-Sotos, et al. 2007). This has led to a greater interest to study IIR, which is reasoning between the exploratory data analysis and the formal statistical inference. This research seeks to explore pre-service teachers’ IIR and, based on that, to know the way they reason, the way they become the model to plan the teaching during their training. Zieffler, Garfield, delMas and Reading (2008) ask the question that guides this exploration: how heavily the student depends on prior knowledge of statistics (previously learned concepts) and how much the student depends on his or her knowledge of the world (or experience) (p.53).
Background and conceptual framework Several publications in recent years deal with IIR, but there is no agreement on its meaning.

“Quaderni di Ricerca in Didattica (Mathematics)”, n. 25, Supplemento n.2, 2015 G.R.I.M. (Departimento di Matematica e Informatica, University of Palermo, Italy)
272
Pfannkuch (2006) described the term informal inference as the drawing of conclusions from data that is based mainly on looking at, comparing, and reasoning from distributions of data in an empirical enquiry cycle. Ben-Zvi (2006) compares inferential reasoning to argumentation, and emphasizes the need for this type of reasoning to include data-based evidence. Zieffler et al. (2008) in an attempt to combine these perspectives, define IIR as the way in which students use their informal statistical knowledge to make arguments to support inferences about unknown populations based on observed samples. In this exploration, IIR is used to describe the way in which pre-service teachers formulate conclusions. A type of tasks that allows to studying the IIR and the arguments of the students are the comparisons of data sets, which have been used by different authors (Gal, I., Rothschild, K. & Wagner, D.A. 1989; Watzon & Moritz, 1999). Garfield and Ben-Zvi (2008) indicate the following advantages of comparing data sets: this activity can be structured as an informal and early version of statistical inference, problems that involve group comparisons are often more interesting, students of any level require develop strategies to compare data sets, motivates the need for and use of data graphical representations and get summaries (center and dispersion) of the data. Comparing groups is an activity that meets the components needed to support research on IIR: Make judgments, claims, or predictions. Draw on, utilize, and integrate prior knowledge (formal and informal) to the extent that this knowledge is available and articulate evidence-based arguments for judgments, claims, and predictions based on evidence (Zieffler et al. 2008). The Context is another basic element in IIR it provides the uncertainty or doubt that evokes the need for inquiry and triggers suggestions from which an inquiry initiates, is central to giving meaning to an inference and provides an opportunity to evaluate the meaning of an inference (Makar, Bakker & Ben-Zvi, 2011). In this research an adaptation of the risk context proposed by Kahneman and Tversky (1984) on accepting a gambling game is used. This type of context engages students to solve the problem and encourages them to justify their answers (Orta & Sanchez, 2014). Kahneman and Tversky point out that “the paradigmatic example of decision under risk is the acceptability of a gamble that yields monetary outcomes with specified probabilities” (p. 341). Consider the following problem: The gains of realizations of n times the game A and m the game B are:
Game A:
Game B: Which of the two games would you choose to play in?
The solution is reached by following a flow diagram: 1) Compare and , 2) if then chose the Game whose mean is the greatest; 3) if then there are two options: 3a) Choose any game, 3b) Analyze the dispersion of data in each game and choose according to risk preferences. These preferences can be defined as generalizations of the attitudes to reject or seek the risk identified by psychologists:
The preference for a sure outcome over a gamble that has higher or equal expectation is called risk averse, and the rejection of a sure thing in favor of a gamble of lower or equal expectation is called risk seeking (Kahneman & Tversky, 1984, p. 341).
It is worth noting that in a game, the dispersion of winnings (including losses) can be considered a measure of risk. Let’s say that a preference is motivated by risk aversion when an option whose data have less dispersion over another whose data have greater dispersion is preferred. The decision is motivated by risk seeking when the option whose data have greater dispersion is chosen.
Methodology The participants in this research were 63 kinder garden pre-service teachers, from a public school in

“Quaderni di Ricerca in Didattica (Mathematics)”, n. 25, Supplemento n.2, 2015 G.R.I.M. (Departimento di Matematica e Informatica, University of Palermo, Italy)
273
Mexico City. The problem shown in Figure 1 was used to know the future teachers’ ideas and it was solved before initiating the course of statistical information processing (SEP, 2012) in a time of 60 minutes. The pre-service teachers´ arguments were analyzed starting from key words: losses and winnings. Subsequently the solution strategies were differentiated win more (by comparing the sum of the winnings of each game or the ratio between winnings and losses of each game), lose less (by comparing the sum of the losses of each game), and win the same in both games (by comparing the sum of all quantities of each game). Finally, three analysis categories of comparison were stablished: comparison of informal mean, comparison of the ratio between winnings and losses, and comparison between losses or winnings.
Analysis and results discussion The analysis of the responses of the pre-service teachers began differentiating them according to the chosen game and, later, they were categorized based on the strategy of comparison with which the future teachers argued their election. Thirty-six pre-service teachers chose game 1, 21 game 2, and six answered any. In the following section there appear examples of the strategies of comparison used by the teachers in training.
In a fair, the attendees are invited to participate in one of two games, but not in both. In order to know which game to play, John observes, takes note and sorts the results of 10 people playing each game. The losses (-) or cash prizes (+) obtained by the 20 people are shown in the following lists: Game 1: 15 -21 -4 50 -2 11 13 -25 16 -4
Game 2: 120 -120 60 -24 -21 133 -81 96 -132 18
a) If you had the possibility of playing only one of the two games, which one would you choose? Why?
Figure 1. Problem.
Comparison of informal mean Six pre-service teachers justified their answer arguing the winnings or initial investment were the same (49), which resulted from adding all the numbers in each game (comparison of informal mean). Figure 2 shows an example in which a future professor replied that she would choose either of the two games.

“Quaderni di Ricerca in Didattica (Mathematics)”, n. 25, Supplemento n.2, 2015 G.R.I.M. (Departimento di Matematica e Informatica, University of Palermo, Italy)
274
Figure 2. Comparison of informal mean.
It is possible to observe that the pre-service teacher added the winnings and the losses of every game, later she calculated the difference between they and got 49. The justification for her choice was: Adding up the winnings and losses of each game I noticed that despite the fact that in the game 2, the winnings are greatest, there is an initial investment in both of $49, that is to say that any game who I play my difference between winnings and losses will be the same. In these cases the future teachers perhaps not considered the risk involved.
Comparison of the ratio between winnings and losses The answers chosen in game 1 are divided in two types: in the first one, the choice argument is based on the comparison of the ratio between the winnings and the losses of the games (25 answers), choosing game 1 since one could win almost twice as much one could lose as opposed to the losses in game 2 . An instance of the justifications of this type was like the following one: Because of the data reflects that in this game there are more likely to going out winner since the number winners almost duplicates that of losers and although it was less quantity the gained that the game 2, in the 1 it is safer to win even little in game 2 I would not play because although earn larger amounts of similarly lost much (see Figure 3). In this example it is observed, on the one hand the use of the ratio between the winnings and the losses and, on the other the risk aversion since part of the argument says that it is safer to win even little.
Figure 3. Comparison of the ratios.

“Quaderni di Ricerca in Didattica (Mathematics)”, n. 25, Supplemento n.2, 2015 G.R.I.M. (Departimento di Matematica e Informatica, University of Palermo, Italy)
275
Comparison between losses or winnings In the second type, out of the answers chosen in game 1, the arguments were based in the comparison of the sum of losses in games 1 and 2 (6 answers).
Figure 4. Comparison of the sum of losses. The losses in game 1 were fewer (56 < 378), an instance of this strategy is the next one : There is the possibility to obtain winnings according to the results of the samples in the game 1 winnings were 105 and the losses 56 in the second game winnings were 427 and the losses 378. In conclusion in the first game it will get lost less than in the second one although the winnings are better in the second one (see Figure 4). In this response is perceived risk aversion, since what is claimed is losing less although in other game the winnings are better. The answers in which game 2 was picked (20 answers) were based on the comparison of the sum of winnings (427 > 105). Figure 5 shows an example in which the sum of the winnings of each game was compared. The chosen game was number 2 and the justification was: Invested more and apparently lost more but in equivalence to the 1 win more. In this example in addition to the use of the maximum winnings to decide between a game and another, the risk seeking is observed since at the end of the justification one comments I win more.
Figure 5. Comparison of the sum of winnings.
In regard to the arguments of the future teachers the initial strategy was to add the winnings and losses of each of the games and on the basis of these results substantiate their answer. We see from these results that the pre-service teachers do not use formal statistical knowledge as measures of

“Quaderni di Ricerca in Didattica (Mathematics)”, n. 25, Supplemento n.2, 2015 G.R.I.M. (Departimento di Matematica e Informatica, University of Palermo, Italy)
276
central tendency and dispersion to justify their choice; they depend on day-to-day/informal knowledge: additions, subtractions, and ratios. The absence or little use of statistical concepts, such as the arithmetic mean has been reported in other studies of comparisons of data sets (Gal et al. 1989, Watson & Moritz, 1999). Only some pre-service teachers used an informal arithmetic mean. In the answers in which game 1 was chosen, we can sense that the answer revolved around an aversion to risk or a refusal to participate in game 2 since the latter had the highest losses. In the answers in which game 2 was chosen, we see that the answer is given by a tendency towards risk since there are more winnings. The future teachers’ solving strategies may be classified as follows: answers based on the comparison between the sum of winnings or losses; answers that choose any game comparing the sum of winnings and losses (informal arithmetic mean); and answers that compare the ratio between winnings and losses in both games. Although the pre-service teachers realize judgments and articulate them on the basis of the evidence that they have, they do not use statistical formal knowledge like measures of center and dispersion. The context proposed considerably lowers the excessive use of prejudices and beliefs when making inferences compared with García-Rios (2013) in which high school students based their answers on their beliefs and in their personal knowledge about the context and not in the data of the problem. It is necessary to stress the reflection upon the use and meaning of statistical concepts during pre-service teachers training because if they have solid and structured statistical tools, they will have a better performance as individuals and in the classroom.
REFERENCES
Ben-Zvi, D. (2006). Scaffolding students’ informal inference and argumentation. In A. Rossman & B. Chance (Eds.), Working cooperatively in statistics education: Proceedings of the Seventh International Conference on Teaching Statistics, Salvador, Brazil. Voorburg, The Netherlands: International Statistical Institute. Retrieved from https://www.stat.auckland.ac.nz/~iase/publications/17/2D1_BENZ.pdfCastro Sotos, A. E., Vanhoof, S., Van den Noortgate, W., & Onghena, P. (2007). Students' misconceptions of statistical inference: A review of the empirical evidence from research on statistics education. Educational Research Review, 2(2), 98-113. doi:10.1016/j.edurev.2007.04.001 Estrada, A. (2007). Evaluación del conocimiento estadístico en la formación del profesorado. Uno. Revista de Didáctica de las Matemáticas, 45, 78-97. Retrieved from http://web.udl.cat/usuaris/z4084849/docs/uno45.pdf Gal, I., Rothschild, K. & Wagner, D.A. (1989). Which group is better? The development of statistical reasoning in elementary school children. Paper presented at the meeting of the Society for Research in Child Development, Kansas City, MO. Garcia-Rios, N. (2013). Inferencias estadísticas informales en estudiantes mexicanos. In J. M. Contreras, G. R. Cañadas, M. M. Gea & P. Arteaga (Eds.), Actas de las Jornadas Virtuales en Didáctica de la Estadística, Probabilidad y Combinatoria (pp. 343-357). Granada, Departamento de Didáctica de la Matemática de la Universidad de Granada. Retrieved from http://www.jvdiesproyco.es/documentos/ACTAS/2%20Comunicacion%2035.pdf Garfield, J. & Ben-Zvi, D. (2008). Developing Students’ Statistical Reasoning: Connecting Research and teaching. New York: Springer. Kahneman, D. & Tversky, A. (1984). Choices, values, and frames. American Psychologist 39 (4), 341-350. Retrieved from http://web.missouri.edu/~segerti/capstone/choicesvalues.pdf Makar, K., Bakker, A., & Ben-Zvi, D. (2011). The reasoning behind informal statistical inference. Mathematical Thinking and Learning, 13, 152–173. doi:10.1080/10986065.2011.538301 Orta, J. A. & Sánchez, E. A. (2014). Interpreting variation of data in risk-context by middle school students. In K. Makar, B. de Sousa, & R. Gould (Eds.), Sustainability in statistics
“Quaderni di Ricerca in Didattica (Mathematics)”, n. 25, Supplemento n.2, 2015 G.R.I.M. (Departimento di Matematica e Informatica, University of Palermo, Italy)
277
education: Proceedings of the Ninth International Conference on Teaching Statistics, Flagstaff, Arizona, USA. Retrieved from http://iase-web.org/icots/9/proceedings/pdfs/ICOTS9_7F3_ORTA.pdf Pfannkuch, M. (2006). Informal inferential reasoning. In A. Rossman & B. Chance (Eds.), Working cooperatively in statistics education: Proceedings of the Seventh International Conference on Teaching Statistics, Salvador, Brazil. Voorburg, The Netherlands: International Statistical Institute. Retrieved from https://www.stat.auckland.ac.nz/~iase/publications/17/6A2_PFAN.pdf SEP. (2012). Procesamiento de Información Estadística. México: Secretaría de Educación Pública. Retrieved from http://www.dgespe.sep.gob.mx/public/rc/programas/lepree/procesamiento_de_informacion_estadistica_lepree.pdf Watson, J. M. & Moritz, J. B. (1999). The beginning of statistical inference: comparing two data sets. Educational Studies in Mathematics, 37 (2), 145-168. doi:10.1023/A:1003594832397 Zieffler, A., Garfield, J. delMas, R. & Reading, C. (2008). A framework to support research on informal inferential reasoning. Statistics Education Research Journal. 7(2), 40-58. Retrieved from http://iase-web.org/documents/SERJ/SERJ7%282%29_Zieffler.pdf

“Quaderni di Ricerca in Didattica (Mathematics)”, n. 25, Supplemento n.2, 2015 G.R.I.M. (Departimento di Matematica e Informatica, University of Palermo, Italy)
278

“Quaderni di Ricerca in Didattica (Mathematics)”, n. 25, Supplemento n.2, 2015 G.R.I.M. (Departimento di Matematica e Informatica, University of Palermo, Italy)
279
A study about the knowledge required from teachers to teach probability notions in early school years
Ruy Cesar Pietropaolo, Alameda Santos, 721, apto 71,Jardim Paulista, São Paulo, SP, Brazil
([email protected]). Angélica da Fontoura Garcia Silva, Rua Antonio Celeguim, 180, Vila Zanela, Franco da Rocha, S.
P., Brazil ([email protected]). Tânia M. M. Campos, Rua Fausto Ferraz, 61 apartamento 151, São Paulo, SP, Brazil
([email protected]). Maria Elisa Esteves Lopes Galvão, Rua Carajuá, 60 apto 12, Moema, São Paulo, SP. Brazil
([email protected]). Anhanguera University of São Paulo (UNIAN), Brazil
Abstract : The goal of this article is to present a study about Brazilian teachers’ knowledge on probability for teaching in the elementary school early years. This research was developed within the scope of a continued education course of the Education Observatory - a project on research and development by UNIAN/CAPES. Data presented here refer to the first phase of the research classified as Diagnostic. The theoretical basis to analyze content retention by the teachers is Tall and Vinner’s notion of conceptual image. Regarding the knowledge that teachers should master, we chose the categories established by Ball, Thames and Phelps such as knowledge of core/specific content, knowledge of content and of students, knowledge of content and of teaching. The answers given by the teachers in the diagnostic tool revealed inconsistent conceptions about probability and its teaching. This finding was used as a starting point for the development process throughout the project's second phase. Key words: Teaching Probability; Early Education Teacher Development; Mathematical Knowledge for Teaching.
Résumé : L’objectif de ce travail est de présenter une étude sur les connaissances des professeurs brésiliens pour enseigner la probabilité dans les premières années de l’école primaire. Cette investigation a été développée au sein d’un cours de formation continue de l’Observatoire de l’Éducation – un projet de formation et de recherche de l’UNIAN/CAPES. Les données discutées ici se rapportent à la première phase de la recherche appelée Diagnostique. À propos de la base théorique, en ce qui concerne la compréhension d’un contenu par les professeurs, on a utilisé la notion d’image conceptuelle, selon Tall et Vinner. Relativement aux connaissances qui doivent être maîtrisées par les professeurs, on a considéré les catégories établies par Ball, Thames et Phelps, telles que: connaissance du contenu commun/spécialisé, connaissance du contenu et de l’étudiant et connaissance du contenu et de l’enseignement. Les réponses des professeurs à l’instrument diagnostique ont révélé des conceptions inconsistantes à propos de la probabilité et de son enseignement, constituant ainsi un point de départ pour le processus de formation, au long de la deuxième phase. Mots-clés: Enseignement de Probabilité; Formation de Professeurs dans les deux premières années; Connaissance de Mathématiques pour l’Enseignement
Introduction
This presentation refers to a research whose goal was to look into the knowledge required from teachers to teach probability in the early school years of elementary school. This research was developed within the scope of a continued education course of the Education Observatory - a project on research and development by UNIAN/CAPES - that involved 27 teachers at the public school network of the State of São Paulo, Brazil. The participants had a teaching degree in mathematics and attended the course voluntarily. Data initially discussed in this presentation refer to the phase called Diagnostic, which consisted of

“Quaderni di Ricerca in Didattica (Mathematics)”, n. 25, Supplemento n.2, 2015 G.R.I.M. (Departimento di Matematica e Informatica, University of Palermo, Italy)
280
questionnaires and interviews used to identify the knowledge teachers had about probability and their conceptions regarding its teaching. The second phase named Development - which will not be discussed here - was conducted according to the principles of the Design Experiments Methodology. This development process had as its assumption that a sequence of activities - initially exploring the notion of randomness followed by the notion of sample space, and then, by quantification of probabilities - enhances teacher knowledge improvement and/or reconstruction in relation to probability. As for the theoretical basis regarding content retention by the teachers, we used the notion of conceptual image by Tall and Vinner. These authors consider the conceptual image notion as the cognitive structure that develops within a person's mind through rich experiences and studies about a particular mathematical concept. Such image involves impressions, visual representations, examples, applications, and verbal descriptions about the properties and processes of a given concept. In relation to the knowledge that teachers should master, we chose the categories established by Ball, Thames and Phelps such as knowledge of core/specific content, knowledge of content and of students, knowledge of content and of teaching. The authors focused specifically on the manner by which the teachers need to know a certain content in order to teach it, and also “whatever else teachers need to know about mathematics and how and where teachers could use such knowledge in practical terms” (Ball et al., 2008, p.4), on top of the pedagogical knowledge of content and knowledge of syllabus. Hence, the focus of studies developed by Ball et al. (2008) is on the teaching job, that is, about what teachers do when they teach mathematics and about their perceptions, understanding and mathematical thinking required for such job. The answers given by the teachers in the diagnostic tool revealed inconsistent conceptions about probability and its teaching. This finding was used as a starting point for the development process throughout the project's second phase. In this process, definitions of probability from the geometrical and frequency viewpoints, and also its classical definition, were used for the study of probability and reflections about its teaching.
Teachers Knowledge We used a questionnaire with 13 questions, assuming that the conceptual image would be composed by, for instance, identification of random phenomena; understanding of the different probability definitions and their respective limitations; meaning and quantification of sample spaces; probability quantification; relations between variables in double-entry tables; connections with different contents; different strategies for approaches; difficulties inherent to the process of construction of this specific knowledge. Below, we present our analysis of some data that allowed for the outlining of the conceptual image that constituted, at that moment, the knowledge repertoire about the meaning of probability, sample space and probability quantification. In relation to the question “how would you define probability? (Use your own words)”, 20 teachers wrote a definition that can be associated to the classic definition, as evidenced in the excerpt below:
Probability is written with two numbers; the first shows the total number of possible outcomes, and the second, the number of outcomes we expect. (Teacher 16) The probability of a result in a game of chance is a fraction: the numerator is the number of cases we want to get, and the denominator is the total. I say the probability of getting an even number when I roll a dice is of three chances in six, so I write 3/6. (Teacher 21) The probability is the chance we have to win a game. When I toss a coin I can have either a head or a tail, the probability of getting a head is 1 in 2, and the same for a tail, 1 in 2. (Teacher 9) Probability is the number of possibilities that you have to win and the result is a fraction. I remember we can write probability in percentage, for instance, the chances of a pregnant woman having a girl is 50%. (Teacher 11)
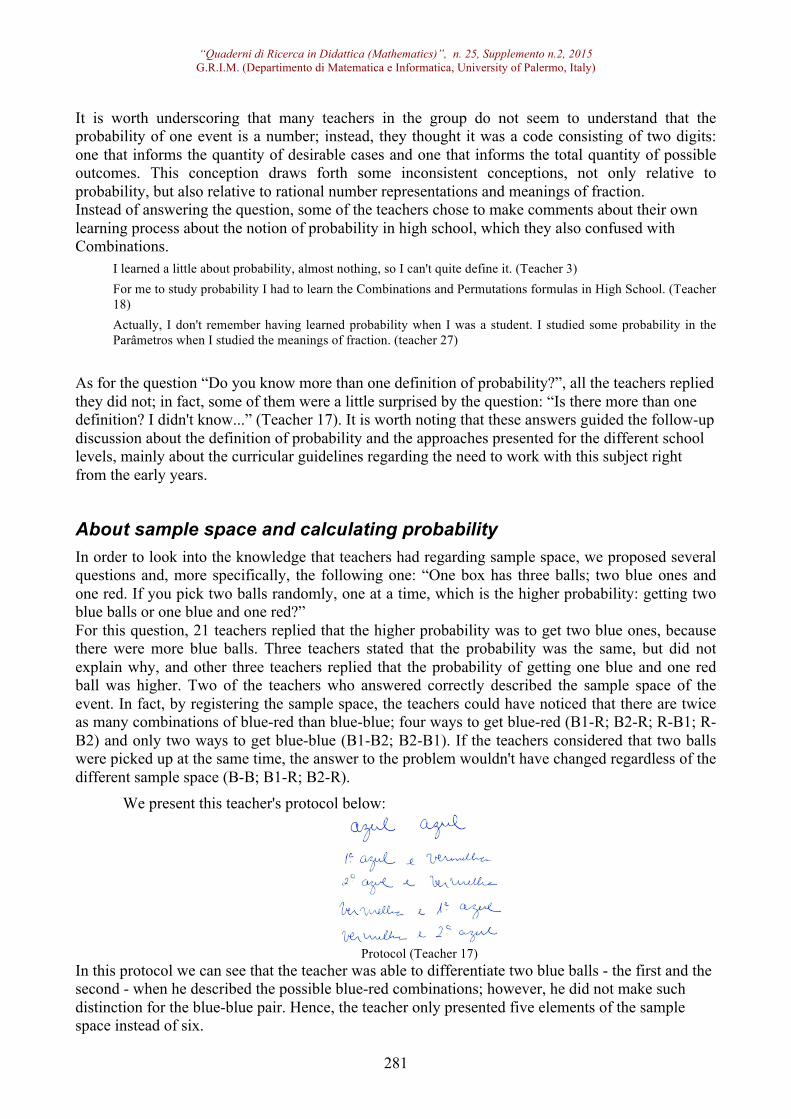
“Quaderni di Ricerca in Didattica (Mathematics)”, n. 25, Supplemento n.2, 2015 G.R.I.M. (Departimento di Matematica e Informatica, University of Palermo, Italy)
281
It is worth underscoring that many teachers in the group do not seem to understand that the probability of one event is a number; instead, they thought it was a code consisting of two digits: one that informs the quantity of desirable cases and one that informs the total quantity of possible outcomes. This conception draws forth some inconsistent conceptions, not only relative to probability, but also relative to rational number representations and meanings of fraction. Instead of answering the question, some of the teachers chose to make comments about their own learning process about the notion of probability in high school, which they also confused with Combinations.
I learned a little about probability, almost nothing, so I can't quite define it. (Teacher 3) For me to study probability I had to learn the Combinations and Permutations formulas in High School. (Teacher 18) Actually, I don't remember having learned probability when I was a student. I studied some probability in the Parâmetros when I studied the meanings of fraction. (teacher 27)
As for the question “Do you know more than one definition of probability?”, all the teachers replied they did not; in fact, some of them were a little surprised by the question: “Is there more than one definition? I didn't know...” (Teacher 17). It is worth noting that these answers guided the follow-up discussion about the definition of probability and the approaches presented for the different school levels, mainly about the curricular guidelines regarding the need to work with this subject right from the early years.
About sample space and calculating probability In order to look into the knowledge that teachers had regarding sample space, we proposed several questions and, more specifically, the following one: “One box has three balls; two blue ones and one red. If you pick two balls randomly, one at a time, which is the higher probability: getting two blue balls or one blue and one red?” For this question, 21 teachers replied that the higher probability was to get two blue ones, because there were more blue balls. Three teachers stated that the probability was the same, but did not explain why, and other three teachers replied that the probability of getting one blue and one red ball was higher. Two of the teachers who answered correctly described the sample space of the event. In fact, by registering the sample space, the teachers could have noticed that there are twice as many combinations of blue-red than blue-blue; four ways to get blue-red (B1-R; B2-R; R-B1; R-B2) and only two ways to get blue-blue (B1-B2; B2-B1). If the teachers considered that two balls were picked up at the same time, the answer to the problem wouldn't have changed regardless of the different sample space (B-B; B1-R; B2-R).
We present this teacher's protocol below:
Protocol (Teacher 17)
In this protocol we can see that the teacher was able to differentiate two blue balls - the first and the second - when he described the possible blue-red combinations; however, he did not make such distinction for the blue-blue pair. Hence, the teacher only presented five elements of the sample space instead of six.

“Quaderni di Ricerca in Didattica (Mathematics)”, n. 25, Supplemento n.2, 2015 G.R.I.M. (Departimento di Matematica e Informatica, University of Palermo, Italy)
282
The answers to this problem reinforce that the sample space plays a key role in the understanding and calculation of event probability, even for very simple problems. According to Nunes and Bryant (2012), people frequently underestimate the sample space when solving probability situations. We interviewed the three teachers who solved the problem correctly. One of them said that he replied to the question using simple intuition and could not justify his answer. Two other teachers stated that the reason for their correct answer was the fact that they wrote down all possible outcomes and they would not be able to solve the problem without that description. One of the teachers had a curious reply, to say the least:
To me, it was evident that the higher probability was of two blue ones. I was going to answer like that, but then I thought, gee, if they are asking this it's because the probability is the same, or, conversely, getting one red and one blue is the higher probability. Then, I decided to write down the possibilities for the outcomes. Then I saw I was wrong. (Teacher 17)
For our analysis of the knowledge that teachers had about calculating probabilities, we proposed, among other activities, the following problem:
Ø This picture represents a dartboard. The bull’s eye is formed by two squares whose sides measure, respectively, 3 meters and 1 meter.
A player throws one dart and hits the bull’s eye. What is the probability that she hit the bull’s eye in the smaller square?
As for the third problem, which involved the geometrical definition of probability, the number of correct answers was not high: only four teachers chose the correct answer: which is the ratio between the areas of the smaller and bigger squares. The other teachers either did not solve or did not answer that the probability was of , because they only considered the measurements of the sides of the square. It is interesting to note that two of the teachers that had the correct answer did not directly calculate the areas of the squares as the other teachers did, but they checked how many times the smaller square fitted in the bigger one, as shown in one of these teacher's protocol:

“Quaderni di Ricerca in Didattica (Mathematics)”, n. 25, Supplemento n.2, 2015 G.R.I.M. (Departimento di Matematica e Informatica, University of Palermo, Italy)
283
Protocol (teacher 17)
It is possible that these teachers, in this situation, did not explicitly consider the sample space as continuous, but rather by its “discreet” feature: the “sample space” was obtained through counting the nine same-size little squares inside the bigger square. The group’s answers revealed inconsistent conceptions about sample space and, hence, about probability calculations. It was also possible to identify that aspects such as acknowledging the need to discuss the notion of randomness and the importance of organizing and describing the sample space using different representations were not part of the participants’ conceptual image regarding the teaching of probability. From the teachers’ conceptual image of probability and its teaching, and from research results, we conceived and developed a continued education process aiming to enhance the knowledge base of these teachers about the teaching of this subject, as proposed by Ball, Thames and Phelps (2008). Reflections about the situations proposed during the Development Process, enhanced this knowledge base not only regarding the teaching of probability, but also about counting problems. This development process also enabled the implementation of innovations concerning probability in the 5th year of elementary school by the majority of the teachers participating in our research.
On the teaching and learning process of probability Specialized content knowledge is considered to be the kind of knowledge that allows teachers, among other specificities, to identify the mistakes and the causes of such mistakes in materials produced by students. (Ball et al., 2008). In this regard, we underscore that the teacher should not only master the notions and procedures of what he is to teach, but also develop other contents that can support teaching. According to Pietropaolo (2005), the teacher must have a supplementary stack of knowledge so that he can perform his role adequately. However, by analyzing the answers given by the subjects of our research to the questions about concepts related to probability, we can assert that the great majority of teachers are not ready - prior to the formative process - to teach this matter in the early years. In other words, teachers have little knowledge about the specialized content required to teach probability. For instance, we saw that many teachers did not consider the probability of one event as a number, but rather as an index composed by two numbers. We also identified that the great difficulty felt by the teachers concerning the theme stemmed from the description and quantification of the sample space. The multiplication principle was not part of the knowledge base of some of the teachers, either. Notwithstanding this fact, in one of our diagnostic tool questionnaires we proposed questions about the teaching of probability, such as strategies they used in their lessons. Below, we present some of the questions raised about the teaching and learning of probability.

“Quaderni di Ricerca in Didattica (Mathematics)”, n. 25, Supplemento n.2, 2015 G.R.I.M. (Departimento di Matematica e Informatica, University of Palermo, Italy)
284
Ø The state of São Paulo's curriculum suggests that the notion of probability should be started at the final years of Elementary School. Do you agree with this proposition? Justify your answer.
Ø Have you taught, or do you teach probability in your math classes at the early years? If so, which strategies have you used?
Ø Have your students presented, or still present, any difficulties in learning the concepts related to probability? Describe your experience regarding the teaching of concepts related to this theme.
In relation to the first question, we had total unanimity among the teachers: although they believe probability is an interesting theme - mainly for children - they did not praise the state educational department's initiative to propose this subject: all of them replied that there was not enough time to develop the theme, due to the extension of the content proposed in the current syllabus. Teacher 19’s answer gives a general idea regarding the group’s position.
I think probability is interesting, so much so that I enrolled in the course. I also think this subject can motivate the children. But we don't have time to teach this subject. We give priority to literacy and there is little time left for math. Then we have to teach numbers, the operations, the problems, a little about fraction, the metric system, money, tables and graphs. If I can hardly handle this, how can I teach probability if I have difficulty in it myself? And there is more: probability is never in the Saresp (similar to STAs in the US). I talk a little about probability when I teach fractions. (Teacher 19)
As for the second question, 16 teachers reported discussions with their students only in the following situations while teaching fractions: the probability to get a certain number when rolling a dice or a certain face when tossing a coin.
I know that probability is in Data Treatment. In a course I attended at the Education Directory about the meanings of fractions, the teacher gave examples of probability: rolling dices, tossing coins, playing cards and picking balls from a box. In probability there is fraction, I just didn't quite understand if the meaning was part-whole or ratio. (teacher 7)
Other teachers reported, however, that they never approached the theme of probability in their classes. It is also important to highlight that when some of the teachers stated that they did teach probability in their classes, they were, in fact, referring to Combinations.
I use something concrete when I'm teaching probability. In the problem of combining skirts and tops, I cut out the shapes and show the possible combinations. I think that kids see the combinations and learn. (Teacher 16) When I teach probability I use drawings to show all the combinations. I give them a problem with a table containing the prices, for instance, of three sandwiches and two beverages. I ask them to calculate the price of each combination. This makes it easier for the students to understand. (Teacher 20)
The answers given by our research subjects to the third question added little to what they had stated previously in the two first questions: the ones who really do some work with problems of probability claim that their students have little difficulty in the theme. This was an expected answer, since they rarely proposed situations involving probability and, when they did do it, it was through repetitive situations. The ones who pointed out difficulties actually meant the difficulties presented by children on counting. None of teachers mentioned the term “randomness” in their answers. As for the sample space, they only made indirect references to it. Hence, and taking into account Ballet al (2008) ideas about the content pedagogical knowledge, these teachers would not have the required knowledge to teach probability in the early years of elementary school.
Diagnostics:asummaryBy analyzing the results of this data collection as proposed by Tall and Vinner (1981), we consider that the conceptual image constructed by the majority of the participants of our study regarding the

“Quaderni di Ricerca in Didattica (Mathematics)”, n. 25, Supplemento n.2, 2015 G.R.I.M. (Departimento di Matematica e Informatica, University of Palermo, Italy)
285
teaching of probability in the early years was chiefly constituted by a field of problems for the application of ratio as one of the meanings of fractions. In other words, the probability of one event would always translate into a ratio between two whole positive numbers. Besides this, the teachers' conceptual images did not present other views about probability, namely the algebraic and frequency definitions, a fact that restrained the scope of the proposed problems. Hence, the study of probability would offer to these teachers few connections with other mathematical content and would be a less rich context to develop important cognitive skills. The notion of sample space - a concept whose discussion might improve the understanding of probability calculation - was not part of the knowledge repertoire of specific contents accumulated by the teachers, suggesting that there are significant gaps in the pedagogical knowledge required to present such content to students. Some of the teachers barely mastered the multiplication principle. Another point worth noting is the non-utilization of systematized procedures by the teachers, such as the tree diagram for naming and counting groupings in a sample space. Many researchers, such as Borba (2013), noticed that the use of tree diagrams allows for better understanding of combination problems. In short, taking into account the categories proposed by Ballet al (2008), we conclude that our research subjects still did not have the required knowledge to teach notions concerning probability in the early years of school. These results underscore the need to promote discussions about the relevance of notions concerning the theme of probability in the formative and/or continued development courses, and to discuss the difficulties felt by students when they start to construct this knowledge as well as the importance of its study at the different school levels.
REFERENCES Ball, D. L., Thames, M. H., & Phelps, G. Content knowledge for teaching: what makes it special? Journal of Teacher Education, 59(5), 389-407, 2008. Batanero, C. Didáctica de la Probabilidad. Universidad de Granada. Departamento de Didáctica de la Matemática. 2001. Available at: <http://www.ugr.es/~batanero>. Last accessed: July 22, 2013. Batanero, C.. La comprensión de la probabilidad en los niños. ¿Qué podemos aprender de la investigación? En J. A. Fernandes, P. F. Correia, M. H. Martinho, & F. Viseu, (Eds..). Atas do III Encontro de Probabilidades e Estatística na Escola. Braga: Centro de Investigação em Educação. Universidade do Minho, 2013. Gal, I. Towards “Probability Literacy” for all citizens: Building Blocks and Instructional Dilemmas. In Jones, G. A. (Ed), Exploring probability in school: Challenges for teaching and learning. p. 39-63. 2005. Pietropaolo, R. C., (Re) Significar a demonstração nos currículos da Educação Básica e da formação de professores de Matemática. Tese (Doutorado em Educação Matemática). São Paulo: PUC/SP, 2005. Tall, D. & Vinner, S. Concept image and concept definition in mathematics with particular reference to limits and continuity. Educational Studies in Mathematics, 12, 151-169, 1981.

“Quaderni di Ricerca in Didattica (Mathematics)”, n. 25, Supplemento n.2, 2015 G.R.I.M. (Departimento di Matematica e Informatica, University of Palermo, Italy)
286

“Quaderni di Ricerca in Didattica (Mathematics)”, n. 25, Supplemento n.2, 2015 G.R.I.M. (Departimento di Matematica e Informatica, University of Palermo, Italy)
287
Pedagogical use of tablets in mathematics teachers continued education
Maria Elisabette Brisola Brito Prado Rua Rafael Saglioni, 332, Campinas, SP. Brazil, ([email protected])
Nielce Meneguelo Lobo da Costa, Rua Dr. Sampaio Viana, 238, apto 92. São Paulo, SP. Brazil. ([email protected])
Tânia Maria Mendonça Campos Rua Fausto Ferraz, 61 apto 151, Bela Vista, São Paulo, SP. Brazil,([email protected])
Anhanguera University of São Paulo (UNIAN), Brazil Abstract: This article aims to identify conceptions shared by a group of five mathematics teachers and the way tablets were appropriated as a pedagogical tool in the context of teaching polynomial functions of the first degree. This group of teachers works at high schools at the São Paulo's public school network and participates in the Education Observatory Project. This qualitative research is in its final phase of analysis and is developed in the context of a continued education course involving the use of tablets and educational software. Studies of this nature are needed due to the fact that digital mobile technology is increasingly more accessible for students, and also because teachers need support in their process of appropriation and understanding of the cognitive potentialities of teaching mathematics using mobile technology. The analysis showed that the process of appropriation is gradual and, hence, continued education should create situations to enable teachers not only to learn how to operate the technological resources, but also to experience the possibilities of exploring mathematics with their students, attributing both personal and professional meanings to technology. This requires having experiences, dialogs, experimentation, sharing and also individual and collective reflections in a process of appropriation and knowledge construction and reconstruction.
Key words: Digital Technologies - Mathematics Education - appropriation - practice reconstruction
Résumé: Cet article vise à identifier les conceptions d'un groupe de cinq enseignants de mathématiques et de l'utilisation pédagogique crédit de sorte que la tablette dans le contexte de la fonction polynomiale de l'enseignement du 1er degré. Ce groupe d'enseignants agit à l'école secondaire de l'état de São Paulo et sont les participants au projet du Programme Observatoire de l'enseignement. Cette recherche qualitative, dans la phase d'analyse finale, se développe dans le cadre d'un cours de formation continue impliquant l'utilisation de comprimés et de logiciels éducatifs. La nécessité de ce genre d'étude est justifiée par le fait que les technologies numériques mobiles sont de plus en plus disponibles dans les mains des élèves et les enseignants ont besoin de soutien dans le processus d'appropriation et la compréhension du potentiel cognitif de l'enseignement des mathématiques avec la technologie mobile. L'analyse evidenciouque le processus d'appropriation est situations de devecriar éducation progressive et ensuite poursuivies où, en plus d'apprendre à exploiter les ressources technologiques, l'enseignant peut éprouver les possibilités d'explorer les mathématiques avec des étudiants, donner un sens personnel et professionnel. Cela nécessite des expériences, des dialogues, des essais, des actions et des réflexions individuelles et collectives dans un processus d'appropriation et de la construction et de la reconstruction de la connaissance. Mots clés: Technologie Digital - Mathématiques Education - l'appropriation - reconstruction pratique
Introduction Today, people in general and students in particular use digital information and communication technology (DICT) with great skills and seek to be constantly connected, communicating and accessing information from many regions in the world. This generation of learners - known as digital natives -is different from that of a few years ago. Children and young adults study and listen to music, communicate using the internet and do their homework, all at the same time. This kind of
“Quaderni di Ricerca in Didattica (Mathematics)”, n. 25, Supplemento n.2, 2015 G.R.I.M. (Departimento di Matematica e Informatica, University of Palermo, Italy)
288
behavior is attached to the fast-paced way in which information reaches the individual and how it can be produced and made accessible through digital technology. How do schools deal with this reality lived by their students? Are teachers prepared to teach this new paradigm of the digital culture society? As far as using digital mobile technology at schools, the Brazilian government has encouraged its use since 2007 by means of various programs, among which is UCA Project (One-computer per Student, in Portuguese)6 whose goal is the creation and socialization of different ways to use digital technology at public schools in Brazil, promoting the pedagogical use of DICT. Hence, many schools started to consider this new reality in which technology is in their students' hands. More recently, the ministry of education 7invested in the purchase of tablets, which were initially delivered to high school teachers at public schools to be used as a pedagogical resource, enabling mobility and accessibility to digital content via Wi-Fi. Although the experiences using digital mobile technology in the context of elementary education are recent, there are a few researches that derived mainly from the UCA Project, which analyzed the effects of having laptops in the students' hands and their educational use in the classroom. According to Almeida and Prado (2009), in the classroom routine the use of mobile computers can encourage new ways for students to relate with information, to learn and to teach, generating “[...] changes in the relationships of all existing elements in this space and also in the way they act, which will push for changes in the school context” (p.5). The study by Mendes & Almeida (2011) conducted within the scope of the UCA Project in a public school in the north of Brazil, found that teachers pointed out the need to change the classroom organization, ranging from the physical settings to the way the class should be conducted. Mainly, it was necessary to review the syllabus and the didactic planning. They considered that the class became more dynamic, requiring, however, that teachers develop strategies so that the students would keep their focus on the subject content and, at the same time, could acknowledge the searches and discoveries made by the students from their interaction with the laptop.
In fact, before the appearance of mobile technology, schools used to have, at best, computer labs and the use of computers was dependent on previously arranged appointments and on the availability of access, as there was usually a single lab to service a great number of students and teachers in the same school. We are aware that schools reality changes with the insertion of mobile technology, and it presents new educational challenges together with amenities offered by the mobility and connectivity of devices such as tablets, iPods and smartphones. Especially because they are available for students and teachers, which characterizes, according to Eivazian (2012), as “[...] a new paradigm of the use of technology in education” (p.15).
Hence, there is a need to broaden and deepen studies about the use of digital mobile technology in school spaces, and consider the possible impacts in teachers practice. This digital mobile technology easily triggers curiosity and stimulates students' creativity, allowing for the collaboration among them for new discoveries, the agility to search for information and communication, while enabling new ways of interaction and learnings. Particularly, touchscreen digital technology can bring new possibilities for the process of teaching and learning. In this aspect, the studies conducted by Arzarello et al (2013) underscore that “the manipulation on tablet is different from that with mouse clicking, this kind of research investigates a new aspect of students’ behavior’s when using dynamic geometry software” (p. 59). In term of
6For more information: <http://www.fnde.gov.br/programas/programa-nacional-de-tecnologia-educacional-proinfo/proinfo-projeto-um-computador-por-aluno-uca> Accessed on March 5, 2015. 7For more information: <http://portal.mec.gov.br/index.php?option=com_content&id=17479> Accessed on March 5, 2015.

“Quaderni di Ricerca in Didattica (Mathematics)”, n. 25, Supplemento n.2, 2015 G.R.I.M. (Departimento di Matematica e Informatica, University of Palermo, Italy)
289
researches conducted in Brazil, specifically in mathematics education using such devices, we highlight those by Bairral (2013), who points out the touchscreen potentiality for learning dynamic geometry, conform your words [...] we assume that the handling of this type of environment should be seen as a cognitive tool that potentializes the learners' skills to explore, conjecture and construct different ways to justify them. (p.8).
If this technology can potentialize cognitive processes, it is an indication of the need to understand how students and teachers use the resources in the school context, with focus on the syllabus content. Concomitantly to this demand, we also become instigated to explore and reflect upon teachers' preparation to make the best out of the potentialities present in digital technology for the processes of teaching and learning. Acknowledging such needs and urgency, because this type of technology evolves very rapidly and its immediate access by children and young adults is almost instant after their appearance, our focus of study and research is on the continued education of mathematics teachers involving the pedagogical use of digital mobile technology.
Research Development The goal of this study was to identify conceptions shared by a group of five mathematics teachers and the way tablet were appropriated as a pedagogical tool in the context of teaching polynomial functions of the first degree. This group of high school teachers works at the São Paulo's public school network and participates in the Education Observatory Project.8
This qualitative research - in its final phase of analysis - is being developed in the context of a continued education course involving the use of tablet and educational software. Data collection was made using the following: one questionnaire, semi-structured interviews, field logbooks and protocols of activities developed by the participating teachers during the course.
The questionnaire included questions related to the teachers' profiles and to the level of familiarization and knowledge of tablet regarding both personal and professional uses. The interviews were conducted after the course meetings, with the aim of listening to the teachers' accounts about the experiences lived in the course. Besides these, records were made of classroom observations and activities developed by the teachers using educational software for the exploration of different notations for the representation of functions, and, in particular, of graphs of polynomial functions of the first degree. Data analysis about the process of technology appropriation by teachers has been developed using the theoretical basis provided by Sandholtz, Ringstaff & Dwyer (1997); Almeida & Valente (2011). These authors, while supervising the experiences regarding the implementation of technology in schools, identified that such process occurs gradually and starts by the adoption of technology and the mastering of operating for others who approach their pedagogical practice without using technology. For the latter, starting from a reflective process and the sharing among peers with the mediation of developers, makes the process of technology appropriation to evolve, instead of being used solely as an operating tool for creative and innovative practices (PRADO & LOBO DA COSTA, 2013). According to Rabardel (1995), in the process of appropriation of digital technology, the human being have to develop an instrumentalization process and an instrumentation process. For this reason, the continued education in the context of pedagogical use of technology has to prioritize the construction - from the teachers - of new knowledge and the reconstruction of other types of
8The Education Observatory Project - funded by the Brazilian agencies CAPES/Inep - is developed through the partnership between post-graduate programs of universities and elementary public schools aiming at the development of researches and continued education actions to enhance education.

“Quaderni di Ricerca in Didattica (Mathematics)”, n. 25, Supplemento n.2, 2015 G.R.I.M. (Departimento di Matematica e Informatica, University of Palermo, Italy)
290
knowledge so as to integrate them to enhance instrumented activities.
Hence, based on these principles, the course being analyzed here sought to promote dialog and the integration among the participating teachers during the exploration of tablet resources in a contextualized manner, using mathematics content in the school syllabus. In this sense, we chose to focus on the use of Grapher and Geogebra no software on tablet to explore the content of polynomial function of the first degree.
Description and Analysis The preliminary analyses identified the teachers' reaction when they interacted with the tablet, initially using the software Grapher during the continued education course. Grapher is a free software, easy to use and it allows for the creation of graphs of functions, changes in the background in the Cartesian plane, changes in the color of grids, zooming in and out images by tapping and opening with two fingers. This makes it possible to change scales, zoom effects and observe the particularities of these functions.
Figure 1 shows a Grapher screen shot representing the graph of function f(x) = 2x and two moments of exploration of the graph with touchscreen resources, demonstrating the possibility of zooming in and out to observe the variations in scale.
Figure 1: Grapher screen shot
Source: Author’s file

“Quaderni di Ricerca in Didattica (Mathematics)”, n. 25, Supplemento n.2, 2015 G.R.I.M. (Departimento di Matematica e Informatica, University of Palermo, Italy)
291
Another example of use is related to the possibility of tapping the touchscreen to observe an intersection point of graphs of various functions designed on a single Cartesian plane on the tablet. The teachers explored Grapher in the tablet by performing activities that involved functions. Some of them showed more difficulty in interacting with the touchscreen due to lack of familiarity, but even so, all of them reported the desire to learn how to use digital mobile technology, in particular tablet, in their classroom practice. This group of teachers showed their awareness of the new social and educational reality, i.e., that the use of DICT is part of people's lives and they have to know their pedagogical potentialities to integrate them to the teaching of math.
Such acknowledgment is essential to start the process of appropriation of DICT because, as we mentioned before, digital mobile technology is in the students' hands, which echoes the teachers' concerns about how to prepare their lessons, i.e., how to teach using educational software and other resources available on tablet.
During the development, the teachers used tablet to teach polynomial functions of the first degree and discussed with their colleagues the pedagogical possibilities that they were able to identify, as shown in the testimonials below, in the situation where they were developing the creation of the graph f(x) = x-1, using Grapher and Geogebra.
-In the tablet it is easier because I can show to the student the linear coefficient in the graph and by zooming in and out the student can notice the changes in values, and that the line remains the same regardless of values of y (Teacher E’s log). -It's easier and faster - just a tap - to confirm for the student, the same graph with different values. The student likes the looks, it's easier to notice and analyze the graphs and compare functions. (Teacher B’s log) -By using the software [Grapher] it's easier for the student to identify the points... (Teacher B’s log)
Table 1: testimony of teachers According to the teachers' testimonials it can be observed that even in an initial interaction with the software resources on the tablet, they pointed out a few possibilities, mainly in terms of making the viewing easier.
We noticed that the group of teachers adopted the same attitude usually taken in the classroom, in the sense that they present the graph to the students rather than give the task to the students so they can manipulate the software resources in the mathematical context, allowing for hypotheses formation and the elaboration of conjectures about the concepts at stake.
However, early in the process of appropriation it is usual for teachers to transfer all of what they habitually do when teaching a class using the chalkboard for a similar class, for instance, projecting slides, showing a graph on a screen. This means they produce "a clean version" of the same class using digital technology. In the intermediate phases of the process of appropriation, one example of what happens is when the teacher uses one of the resources of digital technology in isolation, as a complement to other teaching resources, rather than using the technology potentialities integrated with the goals of a certain activity. The process of pedagogical appropriation of digital technology was also made clear through the reports of the majority of the teachers in this group, who made exceptions to the idea by underscoring that first it is necessary to teach using the chalk-and-board, and then explore the tablet as an aid to view and analyze graphs. This means that the pedagogical appropriation of the use of digital technologies so as to integrate their resources to syllabus content requires teachers to go through a process of knowledge construction and reconstruction. In this sense, one of the teachers in the group who is already

“Quaderni di Ricerca in Didattica (Mathematics)”, n. 25, Supplemento n.2, 2015 G.R.I.M. (Departimento di Matematica e Informatica, University of Palermo, Italy)
292
familiar with tablet and uses software to teach mathematics, expressed her understanding about the pedagogical use of DIC
-[...] with technology, students explore and integrate with mathematical concepts and this requires another type of lesson...but we were not prepared for this" (Teacher A's log)
Table 2: testimony of teacher In fact, teachers have to be prepared to reconstruct their pedagogical practice to integrate digital technology, because the center of the educational process in this context is neither the teacher nor the student: it is in student's interactive process with the technology, between students, and between students and teacher, who conducts the pedagogical mediation.
Some considerations The preliminary analyses of this research point out relevant aspects to be considered in continued education courses for mathematics teachers regarding the use of digital technology in teaching and learning processes. In development processes, it is necessary to create situations where teachers learn not only how to operate the technological resources, but also how to attribute personal and professional meanings for their use. This requires having experiences, dialogs, experimentation, sharing and also individual and collective reflections in the group of professionals participating in a process of appropriation and knowledge construction and reconstruction, leading them to go through an initial process of instrumentalization that will evolve into instrumentation. From the professional development viewpoint, continued education has to develop strategies that wake the willingness in teachers to learn throughout life and that, in this process, each person can also teach other persons ways to overcome challenges to develop their intellectual autonomy. This is a necessary quest so that in digital culture society we are able not only to be consumers of information but also producers who express and share knowledge in the technological network into a learning network.
Acknowledgements The researches referenced herein have been partially financed from the Education Observatory Program (Programa Observatório da Educação), from CAPES/Inep, to which we are grateful.
REFERENCES
Almeida, M.E.B. & Prado, M.E.B.B. (2009). Formação de Educadores para o uso dos computadores portáteis: indicadores de mudança na prática e no currículo. Anais da VI Conferência Internacional de Tecnologias de Informação e Comunicação na Educação. Braga, Portugal. Almeida, M.E.B. & Valente, J. A. (2011). Tecnologias e Currículo: trajetórias convergentes ou divergentes? São Paulo: Paulus. Arzarello F., Bairral M., Danè C. & Yasuyuki I. (2013). Ways of manipulation touchscreen in one geometrical dynamic software. In: E. Faggiano & A. Montone (Eds.). Proceedings of the 11th International Conference on Technology in Mathematics Teaching ICTMT11, Department of Mathematics. University of Bari,

“Quaderni di Ricerca in Didattica (Mathematics)”, n. 25, Supplemento n.2, 2015 G.R.I.M. (Departimento di Matematica e Informatica, University of Palermo, Italy)
293
Italy. (pp. 59-64). Available for download at: <http://www.dm.uniba.it/ictmt11/download/ICTMT11_Proceedings.pdf>. Last accessed: February 20, 2015. Bairral, M. A. (2013). Do clique ao touchscreen: Novas formas de interação e de aprendizado matemático. 36a Reunião Nacional da Anped. Sistema Nacional de Educação e Participação Popular: Desafios para as Políticas Educacionais. Goiânia: Anped/UFG (pp. 1-18). Eivazian, A.M.B. (2012). O Computador Móvel e a Prática de Professores que Ensinam Matemática em uma Escola do Projeto UCA. Dissertação de Mestrado em Educação Matemática. Universidade Bandeirante de São Paulo, Brasil. Available for download at: < http://www.matematicaepraticadocente.net.br/>. Last accessed: February 20, 2015. Mendes, M. & Almeida, M.E.B. (2011). Utilização do laptop educacional em sala de aula. In: Almeida, M.E.B. & Prado, M.E.B.B. (orgs). O Computador Portátil na Escola - Mudanças e desafios nos processos de ensino e aprendizagem. São Paulo: Avercamp. (pp. 49-59). Prado, M.E.B.B. & Lobo da Costa, N.M. (2013). O processo de apropriação das TIC e a reconstrução de novas práticas no ensino de matemática. Actas VII Congreso Iberoamericano de Educación Matemática – CIBEM. Montevidéu, Uruguai. (pp. 6973-6980). Available for download at: <http://www.cibem7.semur.edu.uy/7/actas/pdfs/588.pdf>. Last accessed: February 20, 2015. Prado, M.E.B.B., Lobo da Costa, N.M. & Padilha, W.R. (2015). Tecnologias Digitais Móveis reconstrução de práticas no ensino de matemática. In: Lobo da Costa, N.M., Pietropaolo, R.C., Prado, M.E.B.B. & Campos, T.M.M. (orgs.) Formação de professores de Matemática e suas Práticas: experiências e reflexões no contexto do Observatório da Educação. In press. Sandholtz, J.H., Ringstaff, C. & Dwyer, D.C. (1997). Ensinando com Tecnologia: criando salas de aula centradas no aluno. Porto Alegre: Ed. Artes Médicas. Rabardel, P. (1995). Les hommes et les technologies une approche cognitive des instruments contemporains. Paris: Armand Colin.

“Quaderni di Ricerca in Didattica (Mathematics)”, n. 25, Supplemento n.2, 2015 G.R.I.M. (Departimento di Matematica e Informatica, University of Palermo, Italy)
294
“Quaderni di Ricerca in Didattica (Mathematics)”, n. 25, Supplemento n.2, 2015 G.R.I.M. (Departimento di Matematica e Informatica, University of Palermo, Italy)
295
Investigating future primary teachers' grasping of situations related to unequal partition word problems
Libuše Samková University of South Bohemia
Jeronýmova 10, České Budějovice, Czech Republic [email protected]
Marie Tichá Institute of Mathematics of the Academy of Sciences of the Czech Republic
Žitná 25, Praha 1, Czech Republic [email protected]
Abstract : This contribution focuses on future primary teachers' grasping of situations related to unequal partition word problems. In the first part of the text we introduce an educational tool called Concept Cartoons, and investigate how it can be helpful in the process of identifying various aspects of the process of grasping of a situation. Our findings show that a suitably composed Concept Cartoon can be used to indicate understanding as well as misunderstanding and misconceptions. The second part of the text deals with various graphical representations of word problems, and their applicability in the process of solving unequal partition word problems. We show why schemes in the form of branched chains are not appropriate for representing the structure of this kind of word problems. Résumé : Notre contribution est focalisée à la description des approches des enseignants du primaire en saisissant les situations basées sur les problèmes de type Parties-Tout. Dans la première partie, nous présentons un outil pédagogique appelé «Concept Cartoons» et nous le décrivons en tant qu'un outil d'aide pour identifier de divers phénomènes qui se manifestent en saisissant une situation. Nous constatons qu'un Concept Cartoon bien conçu peut être utilisé en tant qu'un indicateur de la compréhension, de la mauvaise compréhension et des erreurs. Dans la deuxième partie, nous proposons de diverses représentations graphiques (visualisations) des problèmes mathématiques et les possibilités de leur utilisation dans le processus de la résolution des problèmes de type Parties-Tout. Nous montrons les raisons pourquoi les schémas sous forme des „chaînes ramifiées“ ne sont pas convenables pour la visualisation (représentation) de la structure de ce genre de problèmes.
Introduction In the study presented here we focus on future primary school teachers, and consider the question of how to identify whether a future teacher grasps a situation related to a word problem with understanding (cf. Polya, 2004). Particularly we deal with unequal partition word problems. For our investigations we innovatively use an educational tool called Concept Cartoons. Following up our research on problem posing presented at previous CIEAEMs (Tichá, 2009; Tichá & Hošpesová, 2013), we also consider the issue how using schemes for visual representation of the problem structure could help to grasp the situation related to the problem. We build on our recent experience showing that this approach might be helpful (Tichá, 2014; Tichá & Hošpesová, 2015).
Concept Cartoons In mathematics education we make use of various schemes and visualizations. They help us to create a model of a problem or a record of its solution process. An educational tool called Concept Cartoons (CCs) can be also used for such purposes.
This tool was developed more than 20 years ago (Keogh & Naylor, 1993). Its original goal was to support teaching and learning in science classroom by generating discussion, stimulating investigation, and promoting learners' involvement and motivation (Naylor & Keogh, 2012). In later years the tool also expanded to other school subjects, including mathematics. Several years ago, the team of authors introduced a set of 130 CCs designed for classroom use in elementary school

“Quaderni di Ricerca in Didattica (Mathematics)”, n. 25, Supplemento n.2, 2015 G.R.I.M. (Departimento di Matematica e Informatica, University of Palermo, Italy)
296
mathematics (Dabell, Keogh & Naylor, 2008).
Each Concept Cartoon (CC) is a picture presenting a situation well known to children, and a group of 5 children in a bubble-dialogue. The (mathematical) problem arises from the pictured situation, and sometimes is closely specified by the beginning of the text in the top left bubble – usually by the if-part of a conditional sentence. Texts in the other bubbles (and also the end of the text in the top left bubble) present alternative viewpoints on the situation and alternative solutions of the
problem. One speech bubble is blank, with just "?" inside, to give a clear impression that there may be more alternative ideas that are not yet included in the dialog. See Fig. 1.
Figure 1: Concept Cartoon; taken from (Dabell, Keogh & Naylor, 2008), slightly modified. The authors of the CC based the alternatives in bubbles on real classroom events or on common conceptions and misconceptions; they might also prepare some alternatives intentionally as authentic-looking unusual conceptions or misconceptions.
The situation pictured in the CC may be more or less open (with various ways of grasping, various ways of solving the problem based on the situation, or with multiple correct solutions to the problem – as in Fig. 1) or closed (with only one correct solution to the problem based on the situation – as in Fig. 2).
From the perspective of future primary school teachers' educators we feel the strength of CCs not only in teaching and learning, but also in diagnosing various types of teachers' mathematics knowledge: e.g. recently we have presented a study (Samková & Hošpesová, 2015) confirming that suitably chosen CCs allow to distinguish between subject matter knowledge and pedagogical content knowledge in the sense of Shulman (1986), and also between procedural and conceptual knowledge in the sense of Baroody, Feil and Johnson (2007). For that study we prepared a set of CCs, each of them presenting a closed situation leading to a calculation problem with one solution. We had two types of bubbles in these CCs: bubbles containing various procedures and their results, and bubbles containing just results. This combination of types of bubbles allowed us to investigate

“Quaderni di Ricerca in Didattica (Mathematics)”, n. 25, Supplemento n.2, 2015 G.R.I.M. (Departimento di Matematica e Informatica, University of Palermo, Italy)
297
various aspect of teachers' knowledge (for details see Samková & Hošpesová, 2015).
Reported study (participants, methodology) For the study reported here we chose a CC showing a closed situation leading to a calculation problem with one solution.
Since we did not plan to employ the blank bubble in this research, we replaced the "?" in the bottom left bubble by another alternative viewpoint, and offered there an intentionally prepared misconception. See Fig. 2.
Figure 2: Concept Cartoon; taken from (Dabell, Keogh & Naylor, 2008), slightly modified.
Participants of our ongoing study are university master degree students – future primary school teachers. We collected data from them in two separate stages:
- In the first stage of the study we gave each participant a worksheet with the CC from Fig. 2. We asked them to decide which statements in bubbles are right, and to justify their decision. The participants worked individually, they wrote their conclusions on the worksheet. We put emphasis on the need to justify the decisions, in order to stimulate and deepen students' argumentation ability.
- In the second stage of the study we assigned the participants a word problem similar to the problem from the first stage, as a part of a standard written exam on arithmetic. We asked them not to use algebraic equations in the solution process, and to record the solution in detail.
The data from both stages of the study were processed qualitatively; we focused on aspects related to whether a participant grasps a situation with understanding. To be more precise, we monitored phenomena by which we characterized the process of grasping of a situation in our previous

“Quaderni di Ricerca in Didattica (Mathematics)”, n. 25, Supplemento n.2, 2015 G.R.I.M. (Departimento di Matematica e Informatica, University of Palermo, Italy)
298
research (e.g. Tichá & Hošpesová, 2010), and phenomena which comply with the Polya's requirements for successful problem solution process (Polya, 2004). By grasping of a situation we mean a process consisting of
- seeking and discovering the key phenomena of the situation and the relationships between them;
- insight into the subject of study; - formulation of questions;
- searching for answers; - interpretation of answers;
- evaluation of answers; - identification of new questions and problems;
- continuing in a new process of searching using experience gained in previous activities (Koman & Tichá, 1998).
Unequal partition problems The problem outlined in the CC from Fig. 2 can be rephrased as a word problem:
There are 757 pupils in the Millgate School. Girls are 37 more than boys. How many boys are in the Millgate School?
This word problem belongs to so-called unequal partition problems, i.e., problems of partition of a given quantity with the relationship between the parts expressed as a comparison of quantities (MacGregor & Stacey, 1998). In our case, both compared quantities are unknown.
In the second stage of the study we let students solve the following unequal partition word problem: Tom and Carl have 68 marbles altogether. Carl has 14 marbles more than Tom. How many marbles has Tom?
The situation with marbles is typical for unequal partition problems in our educational environment (cf. Novotná, 1997). These problems are usually solved either algebraically (i.e. using algebraic equations) or arithmetically (i.e. without equations, just by a sequence of arithmetic operations); graphical approach to the solution is not so common. There are two prevailing arithmetic solution methods, based on two different representations of the situation: sum-of-parts, and division-into-parts (MacGregor & Stacey, 1998). The case of sum-of-parts representation consists in searching one of the parts by taking away the extra quantity from the sum, and halving the reminder. In particular, solving the two word problems above results in calculating 757 – 37 = 720, 720 : 2 = 360 for the number of boys, and in calculating 68 – 14 = 54, 54 : 2 = 27 for the number of Tom's marbles. It is clearly seen from this representation that the unequal partition problem has a solution if the reminder is even, that means if the extra quantity and the sum have the same parity (both are even, or both are odd).
The case of division-into-parts representation consists in dividing the sum into two equal shares, and then adjusting these amounts by adding or subtracting half of the extra quantity. In particular, solving the two word problems above results in calculating 757 : 2 = 378.5, 37 : 2 = 18.5, 378.5 – 18.5 = 360 for the number of boys, and in calculating 68 : 2 = 34, 14 : 2 = 7, 34 – 7 = 27 for the number of Tom's marbles. We can see that if the solver can work with natural numbers only, then this method is not applicable for tasks with the extra quantity or the sum being odd.
“Quaderni di Ricerca in Didattica (Mathematics)”, n. 25, Supplemento n.2, 2015 G.R.I.M. (Departimento di Matematica e Informatica, University of Palermo, Italy)
299
Samples of actual findings First stage of the study
i) Answers indicating understanding
Among the responses from the first stage of the study we revealed four different types of correct strategies:
- The most frequent one consisted in verifying (checking) of all offered alternatives. Such responses do not allow us to ascertain whether their authors know how to solve the problem and argue the solution procedure, but at least we can state that they grasped the situation successfully. Among these responses we revealed two different methods with diverse quality of the grasping process:
- an analogue to guess-and-check method consisting of verifying every single offered alternative by calculating the number of girls and the number of all pupils for the given number of boys, and comparing such a number of all pupils with 757, e.g. by 397 + 37 = 434, 397 + 434 = 831 ≠ 757 in case of the top left bubble;
- a method using comparisons or estimates to reject immediately 794 and 720 for being too big.
- Less frequent was an arithmetic strategy consisting of a sum-of-parts method, i.e. of calculations 757 – 37 = 720, 720 : 2 = 360.
- Significantly fewer participants used another arithmetic strategy, a division-into-parts method, i.e. calculations 757 : 2 = 378.5; 37 : 2 = 18.5; 378.5 – 18.5 = 360.
- Quite rarely appeared an algebraic strategy using an equation x + (x + 37) = 757, where x denotes the number of boys.
ii) Answers indicating misconceptions or misunderstanding
In the first stage of the study we revealed three different types of incorrect answers:
(a) Statement 720 is right, because 720 + 37 = 757. (b) No statement is right, because 757 : 2 – 37 = 341.5 does not appear in bubbles.
(c) Statement 323 is right, because (323 + 37) + 397 = 757. All three types indicate unsuccessful attempts to grasp the situation. Key phenomena of the situation and relationships between them were not discovered properly, the results were not verified with respect to the task, and on top of that – the author of the second answer was not even surprised by a decimal number as a result for the number of persons. We find interesting the fact that all authors of incorrect answers tried to justify somehow their answers.
Besides, the (c) misconception is a nice illustration of “take all numbers from the task, and do something with them” strategy – numbers 37 and 397 come from the top left bubble, and 757 comes from the information plate in the centre of the picture. There has to be noted that 323 is the intentionally prepared misconception we added into the blank bubble instead the question mark. Our previous experience had indicated that such a misconception might occur, and this suspicion was confirmed.
Second stage of the study
In the second stage of the study, the respondents mostly solved the word problem by the sum-of-parts method, i.e. 68 – 14 = 54, 54 : 2 = 27. Among the incorrect solutions, only misconceptions analogical to (a) and (b) appeared.

“Quaderni di Ricerca in Didattica (Mathematics)”, n. 25, Supplemento n.2, 2015 G.R.I.M. (Departimento di Matematica e Informatica, University of Palermo, Italy)
300
The student, who made the (c) misconception in the first stage, solved the task correctly by the sum-of-parts method in the second stage. That attracted our attention, and we interviewed this student subsequently to realize that she had just learned the sum-of-parts method by rote, without understanding. In this particular case, CCs helped us to reveal a weakness in understanding which could not be revealed in the standard written exam.
Graphical representation, visualization To our surprise, none of the participants provided a graphical solution, nor offered a visualization of the problem – despite the fact that they had already met with schemes of problem structure in math courses. We see the issue of graphical solutions and visualisations as important, since we believe that understanding deepens through enriching the repertoire of representations (cf. Janvier, 1987). We consider an iconic representation provided by visualization as very valuable, and as a non-skippable component of the process of grasping. In our conception, schemes of a problem structure are linear or branched chains in the sense of Kittler and Kuřina (1994). Samples from their primary school textbook you can see in Fig. 3. We use these schemes as the means of visualization, as a graphical representation either of the problem structure or of the problem solving procedure. Moreover, we use them as a diagnostic tool in future
primary school teacher training (Tichá & Hošpesová, 2015).
Figure 3: Linear and branched chains as schemes of a problem structure; taken from (Kittler &

“Quaderni di Ricerca in Didattica (Mathematics)”, n. 25, Supplemento n.2, 2015 G.R.I.M. (Departimento di Matematica e Informatica, University of Palermo, Italy)
301
Kuřina, 1994, p. 70), translated. Similar schemes were introduced also by Nesher and Hershkovitz for representing the problem structure: “Using a scheme, in our view, constitutes a mapping between semantic relations underlying a given text and its mathematical structure. The scheme serves as generalized habit of action in a given situation.” (Nesher & Hershkovitz, 1994, p. 1) For some types of word problems such schemes may help to grasp the situation, e.g. for two-step word problems such as:
There are 15 green and 17 blue matchbox cars on a big shelf, and 9 red matchbox cars on a small shelf. How many matchbox cars are there?
For these word problems we can depict all key phenomena of the situation and relations between them to create two separate sub-schemes (Fig. 4 left). These sub-schemes have one common element and their composition produce a compound scheme suggesting us how to solve the problem (Fig. 4 right). For comparison see hierarchical scheme in (Nesher & Hershkovitz, 1994, p. 8).
Figure 4: Schemes of the two-step problem with matchbox cars. Two separate sub-schemes (left), a
compound scheme (right).
In the case of unequal partition problems the issue is more complicated. We may also create the sub-schemes (Fig. 5 left), but they have two common elements, and the compound scheme does not uncover the solution (in any rearrangement – see Fig. 5 middle, right). Concluded, in the case of unequal partition problems such schemes are not appropriate.
Figure 5: Schemes of the unequal partition problem outlined in Fig. 2. Two separate sub-schemes
(left), a compound scheme (middle), a rearranged compound scheme (right).
For unequal partition problems we have to use a different kind of graphical representation. A suitable visualization can be obtained e.g. by a segment model (Novotná, 1997). This model serves just for getting an idea of the situation, thus the ratios of lengths of the segments are not supposed to

“Quaderni di Ricerca in Didattica (Mathematics)”, n. 25, Supplemento n.2, 2015 G.R.I.M. (Departimento di Matematica e Informatica, University of Palermo, Italy)
302
correspond to the ratios of the numbers (Fig. 6 left). But our classroom experience show that students prefer to replace segments by rectangles, in order to be able to inscribe numbers inside, i.e. they use a bar diagram (Fig. 6 right).
Figure 6: A segment model of the unequal partition problem outlined in Fig. 2 (left), a bar diagram
of the same problem (right).
How to continue As this text is a report of an ongoing study, we plan to continue in the research. We shall realize interviews with the participants of the study to reveal closer reasons for misconceptions that appeared in their responses, as well as reasons why none of them got use of a graphical representation.
As for CCs, preliminary findings of our study suggest that CCs could be used as a diagnostic tool for investigating future primary teachers' grasping of a situation. For the future we consider an interesting the issue of how particular features of CCs could help to reveal particular parts of the process of grasping.
We also plan to systematize CCs from the perspective of mathematics content. We aspire to create a set of CCs that would match Czech educational traditions, and cover regularly all important aspect of primary school mathematics. Finally, this study shows how advantageous is the possibility to use a CC created by somebody else as a base for mediating our own thoughts and views. We may take such a CC, and adapt the content of its bubbles according to our intentions and previous experience. Our example with bottom left bubble in Fig. 2 illustrates how suitably chosen content of a newly added bubble can help to reveal a misconception that would stay unnoticed not only in the standard written exam, but probably also when working with the original version of the CC.
Acknowledgement: This research is supported by the Czech Science Foundation (project No. 14-01417S), and by RVO 67985840.
REFERENCES Baroody, A. J., Feil, Y., & Johnson, A. R. (2007). An alternative reconceptualization of procedural and conceptual knowledge. Journal for Research in Mathematics Education, 38, 115-131. Dabell, J., Keogh, B., & Naylor, S. (2008). Concept Cartoons in Mathematics Education. Sandbach: Millgate House Education.

“Quaderni di Ricerca in Didattica (Mathematics)”, n. 25, Supplemento n.2, 2015 G.R.I.M. (Departimento di Matematica e Informatica, University of Palermo, Italy)
303
Janvier, C. (Ed.). (1987). Problems of representation in the teaching and learning of mathematics. Michigan: Lawrence Erlbaum Associates. Keogh, B., & Naylor, S. (1993). Learning in science: another way in. Primary Science Review, 26, 22-23. Kittler, J., & Kuřina, F. (1994). Matematika pro 2. ročník základní školy. Pracovní sešit 1. [In Czech: Mathematics for the 2nd grade of primary school level. Workbook 1.] Praha: MÚ AV ČR & ALBRA.
Koman, M., & Tichá, M. (1998). On travelling together and sharing expenses. Teaching Mathematics and Its Applications, 17(3), 117-122.
MacGregor, M., & Stacey, K. (1998). Cognitive models underlying algebraic and non-algebraic solutions to unequal partition problems. Mathematics Education Research Journal, 10, 46-60. Naylor, S., & Keogh, B. (2012). Concept Cartoons: what have we learnt? Paper presented at the Fibonacci European Conference, Leicester. Retrieved from conceptcartoons.com/research.html Nesher, P., & Hershkovitz, S. (1994). The role of schemes in two-step problems: analysis and research findings. Educational Studies in Mathematics, 26, 1-23. Novotná, J. (1997). Using geometrical models and interviews as diagnostic tools to determine students' misunderstandings in mathematics. In Proceedings of SEMT, Prague, Czech Republic, 1997, 61-67.
Polya, G. (2004). How to solve it. A new aspect of mathematical method. Princeton and Oxford: Princeton University Press.
Samková, L., & Hošpesová, A. (2015). Using Concept Cartoons to investigate future teachers' knowledge. Paper presented at the Ninth Congress of the European Society for Research in Mathematics Education, CERME 9, Prague, Czech Republic; February 4-8, 2015.
Shulman, L. S. (1986). Those who understand: knowledge growth in teaching. Educational Researcher, 15, 4-14.
Tichá, M. (2009). Problem posing in teacher training and as a research object in didactics: Two complementary perspectives. In Proceedings CIEAEM 61 – Montréal, Canada, 2009, Vol. 2, 445-449. Tichá, M. (2014). On the way to discovering structure of word problems. In M. Pytlak (Ed.), Proceedings of the Communication in the mathematics classroom, Poznan, Poland, 43-45. Tichá, M., & Hošpesová, A. (2010). Problem posing and development of pedagogical content knowledge in pre-service teacher training. In Proceedings of CERME 6 – Lyon, France, 2010, 1941-1950.
Tichá, M., & Hošpesová, A. (2013). Problem posing as a motivational tool in improving primary school teacher knowledge. In Proceedings CIEAEM 65 – Turin, Italy, 2013, Vol. 1, 307-316. Tichá, M., & Hošpesová, A. (2015). Word problems of a given structure in the perspective of teacher training. Paper presented at the Ninth Congress of the European Society for Research in Mathematics Education, CERME 9, Prague, Czech Republic; February 4-8, 2015.

“Quaderni di Ricerca in Didattica (Mathematics)”, n. 25, Supplemento n.2, 2015 G.R.I.M. (Departimento di Matematica e Informatica, University of Palermo, Italy)
304
“Quaderni di Ricerca in Didattica (Mathematics)”, n. 25, Supplemento n.2, 2015 G.R.I.M. (Departimento di Matematica e Informatica, University of Palermo, Italy)
305
Sociocultural contexts as difficult resources to be incorporated by prospective mathematics teachers
Yuly Vanegas. Autonoma Barcelona University. Spain. [email protected]
Joaquín Giménez. Barcelona University. Spain. [email protected]
Javier Diez-Palomar. Barcelona University. Spain. [email protected] Vicenç Font, Barcelona University. Spain. [email protected]
Abstract: The paper explains a collaborative research in which we built a cycle of training named “learning to teach citizenship through mathematics”. During such transversal training cycle, it was observed the difficulty that future teachers have to introduce contextualized activities during their own mathematical practices as part of their didactical analysis. Keywords: contextualized activities, didactical analysis, and teacher training Résumé : Le document explique une recherche collaborative dans laquelle nous avons construit un cycle de formation intitulé "apprendre à enseigner la citoyenneté à travers les mathématiques". Durant ce cycle de formation transversale, on a observé la difficulté que les futurs enseignants doivent mettre en place des activités contextualisés au cours de leurs propres pratiques mathématiques dans le cadre de leur analyse didactique. Mots clé: activités en contexte, analyse didactique, formation des professeurs
Introduction and theoretical background This paper draws on our institutional training experience to reveal difficulties and successful elements regarding mathematics teacher training, in the frame of our Masters’ degree on Teacher Training for Middle and High School Teachers, which is compulsory in order to be a Math Teacher in secondary schools in Catalonia (Spain). The degree involves a total of 600 hours of class. In our research, we start from the analysis of productions and reflections of the future teachers, as a fundamental process for teach them how to “redesign professional tasks”. This experience is part of a research involving professors from six Latin American universities. The aim of this research is looking for the recognition of difficulties to design proposals enabling high school future mathematics teachers develop critical thinking and citizenship competencies through mathematics. According to De Lange (1996), there are basically four reasons to integrate contextualized problems in the curriculum: a) facilitating the learning of mathematics, b) developing the mathematical skills of citizens, c) developing competencies and general attitudes associated with problem solving and d) allowing to see the usefulness of mathematics to solve both situations from other areas and everyday life situations. To contextualize and decontextualize as a set of processes, enables us to interpret mathematics as a tool of knowledge in order to establish a natural relationship with basic activities of human beings. On the one hand, such a contextualized perspective promotes abilities in the use of techniques and mathematical models that explain situations of everyday life, and on the other hand, it also promotes the ability to evaluate its role in situations that exceed the needs of the private life of the individuals. All this will allow people to develop a perception of the nature incorporating the “mathematical” knowledge-basis, thus helping to make visible the mathematics (Niss, 1995). Drawing on such perspective, the contextualized look that has been described above suggested to us the consideration of five axes of analysis: (a) a look at the social aspects about the mathematical work; (b) an analysis of classically psychological problems such as the analysis of meanings,
“Quaderni di Ricerca in Didattica (Mathematics)”, n. 25, Supplemento n.2, 2015 G.R.I.M. (Departimento di Matematica e Informatica, University of Palermo, Italy)
306
interactions, and processes of construction, which usually are present in the common part of the curricula of the training program; (c) an emphasis on the modeling perspective; (d) a global feature about experiencing mathematical practices and (e) an approach of teaching reflection based on the need of a set of different material, personal and theoretical mediators as didactic analysis tools, and evaluation tools. The training cycle and the research associated To focus such holistic perspective, it is clear that we must follow a path that will lead the future teachers of mathematics to: (1) knowing contextualized interesting experiences, (2) to identify what are their strong and weak points, (3) to have theoretical tools in order to analyze this type of practice, (4) to know how to organize and design contextualized practice, recognizing the type of mathematical knowledge involved, and the processes that are magnified, (5) to recognize the richness of processes that are involved in examples which also draw upon everyday life, from a modeling perspective, (6) to intertwine elements to integrate such practices in the construction of sequences in future teachers’ school planning, and (7) to have elements to improve these practices, once implemented. From a realistic perspective, (8) training for citizenship and mathematical communication is also added as transversal issue. The inter-agency proposal of training has been organized into three large blocks of tasks which will be described now in terms of their contribution to citizenship through mathematics education. In fact a classic psycho-socio-pedagogical block shows videos, texts and social problems affecting mathematics education. A mathematical perspective about modeling has been discussed from the Anthropological perspective and Project work. Some historical problems (as the elasticity problem when Hooke did trials to obtain the proportionality between the force and distance changing) had been introduced emphasizing how they contributed to some changes in the history of humanity and in some of them to assume a sense of belonging to a particular community. The second block of mathematical topics is focused on how it’s possible to develop in the classroom processes through an interdisciplinary perspective, focusing on elements such as problems of housing, and in general, addressing issues of social and natural contexts in a class of mathematics. A specific project called "Tàndem" is presented observing how it works on the basis of social consumption, nutrition, and habitability problems. A third block deals with different aspects related to mathematics education training. It deals with the knowledge of the evolution of theoretical approaches about teaching mathematics, as the realistic mathematics education. During this part, we discuss the idea that resources allow to set mathematically significant situations, where some of them are contextualized practices. Innovative experiences were shared as the role of teachers associations, the repository of resources of CREAMAT, and its contribution to teacher professional development. A set of 11 professional tasks have been organized. Table 1 shows three examples of activities, in which some different contexts influence the relationship between Math and learning to improve Citizenship through mathematical activities when we implemented the professional tasks above cited.
Table 1. Some example of tasks in the unit Main idea of the professional task
Math content involved Scope in the formation of learning to train in citizenship through
mathematics Reflecting on citizenship transversal competencies and contextualized mathematics
Extra-mathematical contexts Mathematization
Competencies associated to different contexts
Integrating contextualized practices. Identifying the idea of connection. Rating the interdisciplinarity and math enculturation
Extra-mathematical: context natural world and cultural contexts. Connectivity analysis. It affects multiple representations. To interpret
Recognition of that from cultural elements to do mathematics, allows a possible empowerment of students, since models generate or interpret models developed by

“Quaderni di Ricerca in Didattica (Mathematics)”, n. 25, Supplemento n.2, 2015 G.R.I.M. (Departimento di Matematica e Informatica, University of Palermo, Italy)
307
phenomena is recognized as research tasks of long-term projects
others. By insisting on aspects of the Ethnomathematics, we interpret the same mathematics as problem solving and modeling activity
Observations about the use of citizenship in the hot analysis of a mathematics school practice
Description and analysis of an implementation in the school.
Identification of citizenship characteristics, in their school proposal
Self-delayed analysis of school practice.
Epistemic analysis in which it’s described the need of more tasks in the classroom experience
Observing the use of improvement criteria coming from the theoretical perspectives introduced for didactical analysis including citizenship ideas
About the research developmental process.
During the three year research process, we implemented and reconstructed the tasks in the unit. The global task planning and redesign in relation to didactical analysis, was described in detail in another article (Giménez, Vanegas and Font, 2013). The Project was built with the following traits: (a) Reinforcing cognitive and epistemic values through didactical analysis lenses in order to see the need for professional development as lifelong learning process. (b) Identifying the role of promoting Social Transversal competencies as citizenship, critical perspective, creativity, learning to learn through Math practices, interpreted as a modelling culturally developed human activity. (c) Analyzing social –cultural variables as family involvement, historical development. Introducing Reflective Collaborative Enquiry attitude, when doing and analyzing math practices, by using suitability criteria (OSA). (d)Improving self-confidence by doing Final Master’s work as a first delayed self-reflective process. Our main aim was to identify epistemic difficulties for professional development changes. We search for immediate impact by analyzing final work.
We assigned a set of characteristics according to the use of indicators of citizenship and we compute the indicators according to different levels. In the table, we see the average of future teachers in each level, in order to see that we observe better results after years.
Level 1 Level 2 Level 3
2012 (n=25) 52 % 29 % 19 %
2013 (n=28) 51 % 31 % 18 %
2014 ( n= 49) 44 % 32 % 24 %
2015 (n= 47) 46 % 28 % 26 %
Table 1. Assigned levels for future teachers according the level of citizenship
In general, the future teachers had difficulties to relate didactical analysis to epistemic mathematical ideas. For instance, Future teacher 5 says “When I did the didactic unit I didn’t contextualize

“Quaderni di Ricerca in Didattica (Mathematics)”, n. 25, Supplemento n.2, 2015 G.R.I.M. (Departimento di Matematica e Informatica, University of Palermo, Italy)
308
enough the exercises. Now, I think it’s important to use activities proposed in the article: ‘Algebra for all Junior High School students’. In these kinds of sentences, we expected to talk more about the specific iterative algebraic approach as an explicit content in the article explained by the student. It’s an example of the initial difficulties to accept the role of an epistemic and cognitive analysis. They talk about problem solving needs, not introduced in his practice, coming from Polya perspective. And some of them also explain the need to articulate the role of letters and unknowns recognizing the richness of processes in their practice.
It was observed that the students focus more on the dialogue than the mathematics involved. Future teacher 12 says, “short challenges appear, with follow up questions in order to engage students in brief conversations just to clarify responses”, and many others as Student 6, talks about “the teacher remains vigilant in order to ensure that classmates did not distract students“.
The future teachers had a few autonomy to apply in the design and implementation many learned knowledge. This aspect was considered a difficult problem to solve during redesign process because of institutional framework for the proposal, which did not deal a selection of schools.
Researching upon the reflections that future teachers made after their own practice in what is called Final work of Master (TFM), we see short references to the intentional teacher curriculum, and their declaration of intent regarding to integrate contextualized practices. We also found that future teachers improved their general didactical analysis of tasks, out of the citizenship arguments. They also relate some mathematical comments to the difficulties they found when using intra-mathematical contexts instead of contexts coming from the society. As an example, future teacher 8, relates the ambiguity in front to a theoretical article. He said about “the need of searching analogies found because of an incorrect use of contextual framework”. He read a text from Reed to reflect about the use of two important variables influencing the decisions of the teacher.
“The context understood as a set of traits perceived in a certain problematic of real world involving objects, and facts”… But, the laws, principles, relations among quantities, and equations, constitute the structure of a problem”. It is interesting that the future teacher explain some conclusions from this discussion: “the need to describe the similarities and differences among structures and surfaces of the source problems and aiming problems, because it influences the decisions about the equations presented to solve the aiming problems. It is also important to identify that familiarity can help the transference processes, but it also could be an obstacle to see the similarities and structural differences among problems”.
We also analyze how the future teachers faced the use of internal and external connections in their school practice, and also in their self-reflection after the school practice. Some future teachers relate their comments to their previous background and explain the need for including applications to other disciplines.
As an economist, I can say the use of systems of equations to find equilibrium points, as intersection of different conditions, interpreted by curves of offer and demand… and planning problems of dead points… programming problems… We also use algebra as a process to solve engineering problems… chemistry problems, understanding digital images… (St 12)
Some future teachers told about intra-mathematical connections, when algebraic systems of

“Quaderni di Ricerca in Didattica (Mathematics)”, n. 25, Supplemento n.2, 2015 G.R.I.M. (Departimento di Matematica e Informatica, University of Palermo, Italy)
309
equations are used as referent knowledge for optimization problems…We assume that some of these knowledge must be introduced and adapt according the age of the students.
In terms of representativeness, some teachers, tell us that it’s needed not only a look for meanings, but to see a historical, epistemological and curricular perspective. When analyzing the particular case of algebra, the future teacher 8, for instance, proposed a set of ideas about the Arabic way of solving problems to be introduced next time. In this case, he just offer a reflection about “considering algebra as part of cultural legacy”.
Conclusions The experience shows that it is possible to overcome some classical epistemic view about math as a finished product, at least in their intentions, and focus a lot about social issues, perhaps due to our epistemic pressure and self-reflection about the Program itself. Prospective mathematics teachers recognize school math activity as being involved in school math “interesting contextualized practices”. As useful for life as possible, but, it remains the belief that contextualization takes a lot of time. The future teachers identify and exemplify in their practices the ideas of connectiveness and representativeness of knowledge and the ideas of interdisciplinarity and enculturation. Nevertheless, they didn’t achieve to interpret how to develop citizenship and the influence of the critical thinking in their own practices. Only half of the future teachers mention explicitly “citizenship” in their TFM, although in most of the cases we perceived some examples trying to introduce contextual elements as social problems, or cooperative work, in their redesigned activities. Likewise, they considered that the context is important not only to motivate students, but also to generate cross-disciplinary skills through mathematics. Almost all future teachers recognize the value of the critical dialogue to build excellent mathematical meanings. Thus, for example, almost all of them mention the role of dialogue as an instrument to develop critical thinking. In some cases where future teachers developed small research we conjecture that they consider math as a way to offer opportunities and powerful tools to interpret phenomena. For instance, in one of the proposals of redesigned-activity, we see a student who initially had difficulties addressing the cone from a contextualized perspective, proposing the use of the LORAN (Long Range Navigation) navigation system to address the problem of a ship that had lost its location when navigating between two cities (Castelldefels and Torredambarra). This was an example to explain the tapered path. This example allowed that future teacher to address complex situations that are not usual in high school math classes. Another student referred to the same idea when he said: "Contextualization links knowledge to a need and not a scheme set by the index of a book. Learn the concepts when you'll need them brings motivation to learning and strengthens the competence “learning to learn”, since students learn how to make connections between concepts and their uses, and also allows you to use the learning in different contexts. If we use social contexts we will help them to develop their social skills and citizenship." One well-known constraint for Teacher education, is that new curricula (in many countries ) introduces good educational guidelines (as the need for contextualization, connections, citizenship, the role of professional reflection, and so on) just as “beginning sentences” when introducing the programs for disciplines as general aims. Therefore, the need of inter-related explanations to the mathematical content, that must be interpreted as resources. In “many of Teacher Training programs”, there is not enough time for consolidating personal changes. The reflection about social variables as communication, implication, family involvement, …) Therefore, the need of relating pre-service and in service teacher training, in which young teachers should be self-motivated being included in reflective enquiry teams with teacher-researchers.
“Quaderni di Ricerca in Didattica (Mathematics)”, n. 25, Supplemento n.2, 2015 G.R.I.M. (Departimento di Matematica e Informatica, University of Palermo, Italy)
310
Acknowledgement
The work is supported by the Project EDU2012-32644 from Ministry of Science and Competitivity (Spain). Also from GREAV consolidated group of Generalitat de Catalunya. The proposal “Citizenship and Developing Mathematics Teacher Trainig” had been approved as Chair CAB – AUALCPI and Convenio Andrés Bello. (2013-2015).
REFERENCES CASADAVALL, M. (2010). L’educació matemàtica a través del treball en contextos no matemáticas. Memòria del treball de Llicència d’estudis retribuïda. Generalitat de Catalunya. Retrieved http://www.xtec.cat/sgfp/llicencies/200809/memories/1877m.pdf
DE LANGE, J. (1996). Using and applying mathematics in education, In: Bishop et al., International handbook of mathematics education, Dordrecht, 1996, Kluwer A.P., pp. 49–97.
FONT, V. (2007) Comprensión y contexto: una mirada desde la didáctica de las matemáticas. En: La gaceta de la Real Sociedad Matemática Española, Vol. 10.2 (2007), 427– 442.
NISS, M. (1995). Las matemáticas en la sociedad. UNO. Revista de didáctica de las matemáticas. 6, 45-58. Barcelona. Graò.
VANEGAS, Y. M. (2013). Competencias ciudadanas y desarrollo profesional en matemáticas. Unpublished phD Universidad de Barcelona, Barcelona, España.
VANEGAS, Y.; GIMÉNEZ, J.; FONT, V. & DÍEZ-PALOMAR, J. (2014). Improving reflective analysis of a secondary school mathematics teachers program, In Nicol, C., Oesterle, S., Liljedahl, P., & Allan, D. (Eds.) Proceedings of the Joint Meeting of PME 38 and PME-NA 36, Vol. 5, pp. 321-328. Vancouver, Canada: PME.

“Quaderni di Ricerca in Didattica (Mathematics)”, n. 25, Supplemento n.2, 2015 G.R.I.M. (Departimento di Matematica e Informatica, University of Palermo, Italy)
311
Instrumentation didactique des futurs enseignants de
mathématiques. Exemple de la co-variation
Fabienne Venant
Département de mathématiques, UQAM C.P. 8888, Succursale Centre-ville, PK-5151
Montréal, QC H3C 3P8 [email protected].
Abstract : This work falls within the theoretical framework of the double instrumental genesis (Rabardel 1995, Tapan 2006). We are interested in the construction of techno-educational tools by teachers. We offer an analysis of two initial training sequences on the concept of co-variation using a dynamic geometry software. We highlight the fact that the didactic genesis is not necessarily correlated with advanced technical instrumentation. We use a classical educational tool (a priori analysis -- Charnay, 2003) to engage students in a didactic instrumental genesis.
Résumé : Ce travail s’inscrit dans le cadre théorique de la double genèse instrumentale (Rabardel 1995, Tapan 2006). Nous nous intéressons à la construction d’instruments techno-didactiques par les enseignants. Nous proposons l’analyse de deux séquences de formation initiale portant sur la notion de co-variation avec un logiciel de géométrie dynamique. Nous mettons en évidence le fait que la genèse didactique n’est pas nécessairement corrélée à une instrumentation technique poussée. Nous proposons une utilisation de l’outil pédagogique classique constitué par les analyses a priori (Charnay 2003) pour engager les étudiants dans une genèse instrumentale didactique.
Introduction Le travail présenté ici repose sur une volonté de favoriser l’intégration de la technologie dans l’enseignement des mathématiques. Ainsi que le remarquent Leclère et al. (2007) :
« La plupart des politiques visant à équiper les établissements ou à former les enseignants n’ont pas abouti à un développement important des usages en classe. Les recommandations incitatives, notamment dans les programmes officiels, n’ont pas suffi non plus à dynamiser les pratiques de façon significative. »
De nombreux chercheurs ont mis en avant la difficulté à changer les pratiques comme frein à l’intégration des TICS. Qu’en est-il pour les futurs enseignants qui sont en train de développer leurs propres pratiques? Bien que baignant dans une culture numérique, ils ne semblent pas plus enclins à intégrer la technologie dans leurs pratiques quotidiennes que leur ainés. Nous défendons ici l’idée qu’une bonne intégration de la technologie ne repose pas tant sur des compétences techniques poussées que sur une conscience des possibilités didactiques offertes par la technologie. Nous cherchons donc à développer une réflexion techno-didactique chez les enseignants, aussi bien en formation initiale que continue. Nous appuyons nos réflexions sur deux séquences de formation technologique dispensées dans le cadre des cours MAT3225 (Didactique de la variable et de la fonction) et MAT4812 (explorations mathématiques à l’aide de l’informatique) aux étudiants du Bac en Enseignement des Mathématiques de l’UQAM. Ces séquences portent sur le concept de co-variation, l’accent étant mis sur l’articulation entre les différentes représentations d’une fonction. L’objectif est double: amener les futurs enseignants à appréhender aussi bien qualitativement que quantitativement une situation de co-variation, et les amener à une réflexion didactique sur les possibilités offertes par les logiciels de géométrie dynamique pour articuler ces représentations.

“Quaderni di Ricerca in Didattica (Mathematics)”, n. 25, Supplemento n.2, 2015 G.R.I.M. (Departimento di Matematica e Informatica, University of Palermo, Italy)
312
Cadre théorique Nous nous inscrivons dans le cadre théorique de la genèse instrumentale (Guin & Trouche, 1998; Rabardel, 1995; Trouche, 2007) en reprenant essentiellement l’idée que l’artéfact informatique devient un instrument à travers le double processus de l’instrumentation (l’artéfact conditionne l’action du sujet ) et de l’instrumentalisation (adaptation de l’artéfact à l’usage qui en est fait) (Hoyles et Noss, 2003). Ainsi que le souligne Trouche 2007, l’analyse des processus d’instrumentalisation et d’instrumentation est un outil aidant à suivre les processus de conceptualisation
Figure 1. Genèse instrumentale (Trouche, 2007)
A travers ce double processus, c’est l’impact de l’instrument sur la conceptualisation mathématique et didactique qui nous intéresse. Nous reprenons l’idée d’une double genèse instrumentale proposée par Tapan (2006). Pour pouvoir intégrer de façon pertinente la technologie dans leur enseignement, les enseignants doivent non seulement construire des instruments leur permettant de résoudre eux-mêmes des tâches mathématiques, mais aussi et surtout des instruments didactiques leur permettant d’enseigner les mathématiques. Nous ferons donc la distinction entre le premier niveau d’instrumentation, que nous appelons instrumentation technique et le second que nous appelons instrumentation didactique. Dans le cas de futurs enseignants, on peut faire l’hypothèse que la genèse instrumentale didactique se fait en parallèle avec la genèse des connaissances didactiques et s’appuie sur des connaissances mathématiques dont certaines sont récemment acquises. C’est le cas pour la co-variation. La partie psychologique de la genèse d’un instrument peut-être appréhendée par l’intermédiaire des schèmes mis en place. Nous reprenons ici la caractérisation de schème donnée par Vergnaud (1996): une organisation invariante de l’activité, incluant notamment des règles d’action, structurée par des invariants opératoires (connaissances implicites) qui se forgent au cours de l’activité et qui la pilotent. Ce sont les schèmes que le sujet constitue dans le cadre de la réalisation d’un type de tâches. Ces schèmes font partie intégrante de l’instrument construit par le sujet. Notre objectif est de mieux comprendre le processus d’instrumentation didactique des futurs enseignants de mathématiques et de mettre au point des outils de formation permettant à la fois d’observer et d’accompagner leur genèse instrumentale.
Registres sémiotiques de la fonction Les situations à l’étude ont été sélectionnées selon leur adéquation aux préconisations du MELS (Programme de formation de l’école québécoise -- Second cycle du secondaire en mathématiques -- MELS, p. 51)

“Quaderni di Ricerca in Didattica (Mathematics)”, n. 25, Supplemento n.2, 2015 G.R.I.M. (Departimento di Matematica e Informatica, University of Palermo, Italy)
313
« Au cours de sa formation, l’élève […] développe son habileté à modéliser des situations…[…] Il améliore aussi sa capacité à évoquer une situation en faisant appel à plusieurs registres de représentation. Par exemple, les fonctions peuvent être représentées graphiquement ou sous forme de tableau ou de règle, et chacune de ces représentations est porteuse d’un point de vue qui lui est propre, complémentaire ou équivalent aux autres. »
Le programme fait ici explicitement référence aux registres de représentations sémiotiques tels qu’ils ont été définis par Duval (1993). De nombreuses recherches (Carlson 1998; Hitt 1998; Monk 1992; De Cotret 1985) soulignent les difficultés éprouvées par les étudiants avec le concept de fonctions et plus particulièrement avec l’articulation entre les différents registres de représentation. Nous avons sélectionné des situations qui s’appuient sur la géométrie dynamique pour permettre une conception plus globale de la co-variation, basée sur des allers et retours entre différents registres sémiotiques. Duval (1993) définit trois critères constitutifs d’un registre sémiotique : l’existence de représentations identifiables, l’existence d’activités de traitement, c’est-à-dire de transformations d’une représentation à une autre au sein du même registre et enfin l’existence de mécanismes de conversion vers d’autres registres. Se basant sur ces critères, Passaro (2007) considère deux registres de représentation pour la fonction, que nous reprenons ici : le registre graphique et la situation. Nous nous intéressons ici à des situations de co-variation, c’est-à-dire une description verbale ou figurale d’une situation, accompagnée de l’identification explicite des grandeurs en co-variation. Nous considérons également un troisième registre : le registre symbolique, c’est-à-dire la représentation d’une fonction par une équation de type y=f(x).
Les fonctions du déplacement La géométrie dynamique repose sur l’utilisation du déplacement, c’est-à-dire la possibilité de déplacer les éléments d’une figure avec la souris. Les fonctions du déplacement ont été étudiées depuis longtemps. Restrepo (2008) propose une très bonne synthèse des différentes utilisations du déplacement (déplacement erratique, limité, guidé, discret, continu…) Elle montre également que l’utilisation de déplacement n’est immédiate ni pour les élèves ni pour les enseignants. Une utilisation efficace et pertinente du déplacement repose donc sur une instrumentation efficace. Ainsi que le souligne Soury-Lavergne (2011), « un savoir didactique sur la géométrie dynamique est le fait que le déplacement peut avoir plusieurs fonctions. ». Les situations que nous avons choisies reposent sur deux fonctions du déplacement :
- le déplacement pour explorer, qu’il soit continu (exhiber une continuité de configurations intermédiaires entre deux configurations données) ou discret (exploration de quelques configurations particulières),
- le déplacement pour visualiser la trajectoire un point, reposant sur l’utilisation de l’activation de la trace d’un point modélisant la situation fonctionnelle.
Situations exploitées Le tableau ci-dessous récapitule les situations mises en jeu ainsi que leurs différentes représentations. Les trois situations sont construites sur un même schéma : on part d’un énoncé écrit décrivant la situation, accompagné éventuellement d’un dessin statique illustrant cet énoncé (situation 3). Les étudiants commencent par construire la figure modélisant la situation dans le logiciel. La construction de la figure est facilitée par les outils de construction disponibles dans le logiciel, de sorte que l’obtention de la figure repose principalement sur une compréhension des relations entre les différentes grandeurs géométriques. A partir de là, on s’attend à ce que les étudiants utilisent le déplacement des points mobiles pour explorer la situation. Ils ont ainsi accès à une exploration qualitative de la situation, et notamment la recherche des valeurs limites. Le graphe peut ensuite être obtenu depuis la figure, par activation de trace d’un point représentant la co-

“Quaderni di Ricerca in Didattica (Mathematics)”, n. 25, Supplemento n.2, 2015 G.R.I.M. (Departimento di Matematica e Informatica, University of Palermo, Italy)
314
variation, et piloté en déplaçant le point mobile sur la figure. Le graphe peut également être obtenu à partir de l’équation de la fonction. Les étudiants peuvent utiliser la figure dynamique pour donner du sens au graphique obtenu. La juxtaposition et la comparaison de toutes les représentations permettent de faire des liens entre elles, de leur donner du sens et de comprendre la nature de la relation en jeu (il s’agit de relations quadratiques)
Situation 1 Situation 2 Situation 39
figural
verbal
Le carré PQRS est inscrit dans le carré ABCD de côté 4 cm. P est un point mobile sur [AB]
Les triangles ADC et CEB sont équilatéraux. Le point C est mobile sur [AB]
Le rectangle CBDA représente un bâtiment de largeur 9 cm. Les pièces colorées sont des carrés. La pièce hachurée est rectangulaire.
Co-V
ariation
Aire de PQRS en fonction de AP Somme des aires des triangles en fonction de AC
Aire de la pièce rectangulaire en fonction de la largeur du bâtiment.
Graphique
Symbolique
f (x) = 2x2 −8x +16 On pose AB=a
h(x) = 34(2x2 − 2ax + a2 )
h(x) = −6x2 + 63x −162
9 D’après : http://eduscol.education.fr/bd/urtic/maths/index.php?commande=aper&id=2769
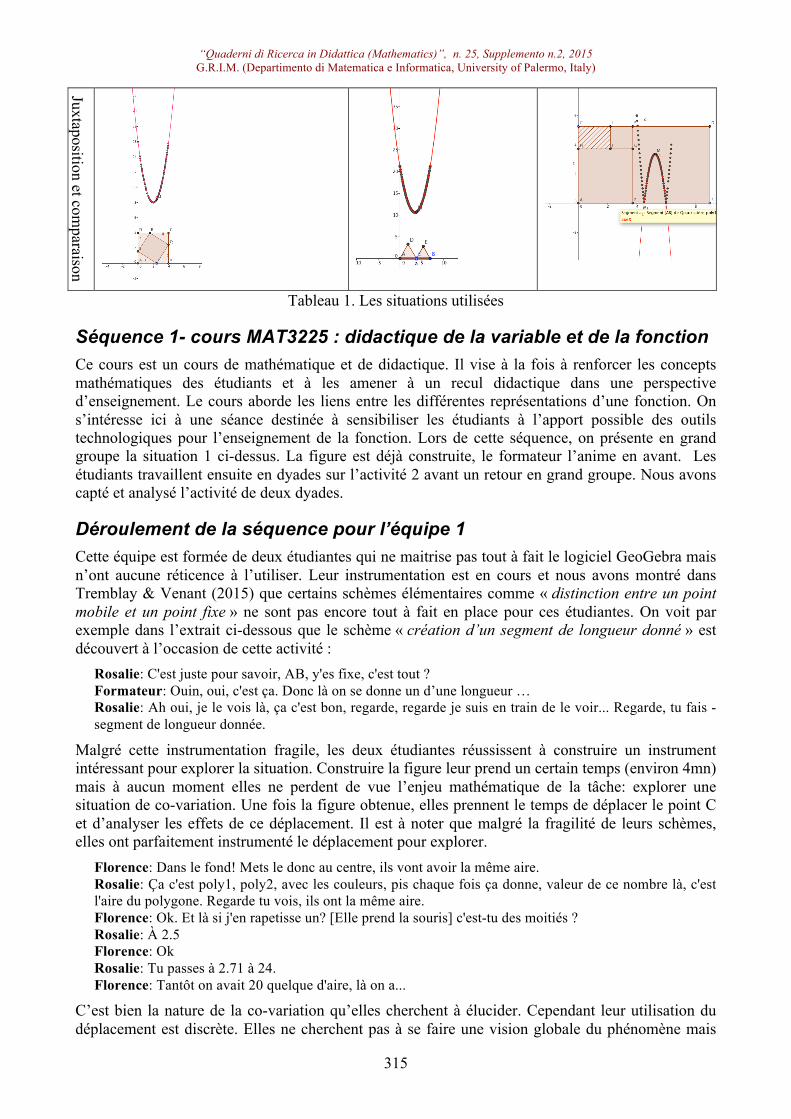
“Quaderni di Ricerca in Didattica (Mathematics)”, n. 25, Supplemento n.2, 2015 G.R.I.M. (Departimento di Matematica e Informatica, University of Palermo, Italy)
315
Juxtaposition et comparaison
Tableau 1. Les situations utilisées
Séquence 1- cours MAT3225 : didactique de la variable et de la fonction Ce cours est un cours de mathématique et de didactique. Il vise à la fois à renforcer les concepts mathématiques des étudiants et à les amener à un recul didactique dans une perspective d’enseignement. Le cours aborde les liens entre les différentes représentations d’une fonction. On s’intéresse ici à une séance destinée à sensibiliser les étudiants à l’apport possible des outils technologiques pour l’enseignement de la fonction. Lors de cette séquence, on présente en grand groupe la situation 1 ci-dessus. La figure est déjà construite, le formateur l’anime en avant. Les étudiants travaillent ensuite en dyades sur l’activité 2 avant un retour en grand groupe. Nous avons capté et analysé l’activité de deux dyades.
Déroulement de la séquence pour l’équipe 1 Cette équipe est formée de deux étudiantes qui ne maitrise pas tout à fait le logiciel GeoGebra mais n’ont aucune réticence à l’utiliser. Leur instrumentation est en cours et nous avons montré dans Tremblay & Venant (2015) que certains schèmes élémentaires comme « distinction entre un point mobile et un point fixe » ne sont pas encore tout à fait en place pour ces étudiantes. On voit par exemple dans l’extrait ci-dessous que le schème « création d’un segment de longueur donné » est découvert à l’occasion de cette activité :
Rosalie: C'est juste pour savoir, AB, y'es fixe, c'est tout ? Formateur: Ouin, oui, c'est ça. Donc là on se donne un d’une longueur … Rosalie: Ah oui, je le vois là, ça c'est bon, regarde, regarde je suis en train de le voir... Regarde, tu fais -segment de longueur donnée.
Malgré cette instrumentation fragile, les deux étudiantes réussissent à construire un instrument intéressant pour explorer la situation. Construire la figure leur prend un certain temps (environ 4mn) mais à aucun moment elles ne perdent de vue l’enjeu mathématique de la tâche: explorer une situation de co-variation. Une fois la figure obtenue, elles prennent le temps de déplacer le point C et d’analyser les effets de ce déplacement. Il est à noter que malgré la fragilité de leurs schèmes, elles ont parfaitement instrumenté le déplacement pour explorer.
Florence: Dans le fond! Mets le donc au centre, ils vont avoir la même aire. Rosalie: Ça c'est poly1, poly2, avec les couleurs, pis chaque fois ça donne, valeur de ce nombre là, c'est l'aire du polygone. Regarde tu vois, ils ont la même aire. Florence: Ok. Et là si j'en rapetisse un? [Elle prend la souris] c'est-tu des moitiés ? Rosalie: À 2.5 Florence: Ok Rosalie: Tu passes à 2.71 à 24. Florence: Tantôt on avait 20 quelque d'aire, là on a...
C’est bien la nature de la co-variation qu’elles cherchent à élucider. Cependant leur utilisation du déplacement est discrète. Elles ne cherchent pas à se faire une vision globale du phénomène mais

“Quaderni di Ricerca in Didattica (Mathematics)”, n. 25, Supplemento n.2, 2015 G.R.I.M. (Departimento di Matematica e Informatica, University of Palermo, Italy)
316
visent rapidement des positions caractéristiques du point C (au milieu, au quart du segment AB) et entrent directement dans une approche quantitative. L’instrument qu’elles construisent relève donc plus de l’instrument de mesure perfectionné que de la représentation dynamique. Cette observation les amène cependant assez rapidement à dégager la grandeur la plus pertinente à étudier : la somme des aires des deux triangles.
Florence: On est rendu quasiment à 27 là. Plus que 27 même. Rosalie: De quoi là? Ça c'est 24 ça. Florence: Si tu calcules l'aire totale des deux Rosalie: Ah d'accord.
Elles utilisent pour établir une table de valeur en effectuant des mesures à bonds constants. Cette approche quantitative aboutit et elles en viennent à découvrir la nature quadratique de la relation.
Florence : Ah! That's it! (Elles se tapent dans les mains) C'est une parabole!
Elles cherchent ensuite à vérifier leur conjecture en traçant le graphique. Elles connaissent l’existence du schème « activer la trace d’un point modélisant les grandeurs en relation ». Elles sont même conscientes de certains invariants opératoires mais ne sont pas capables de les mettre en œuvre. Leur problème est essentiellement de créer les variables correspondant aux grandeurs en co-variation :
Rosalie : De quoi le sommet? Ah ouais... mais il faudrait faire le sommet avec une trace active. Rosalie : on pourrait créer un point de coordonnées distance AC, mais ça c'est h, de h et i.
Avec l’aide du formateur, elles finissent par obtenir le graphique. Elles commencent alors une exploration plus qualitative, cherchant à faire le lien entre les calculs qu’elles ont effectués, le tableau de valeurs obtenu, le déplacement du point de coordonnées dynamiques sur le graphique et la position du point C.
Florence : Pourquoi qu’il part là ? Pourquoi qu’il est dans les airs ? Rosalie : Ben, un, il ne va jamais y avoir une aire de zéro, tu comprends? Florence : Ok donc là il est à 5, et la plus petite aire qu'on peut avoir c'est quoi ? Rosalie : C'est à 5. Florence : Qu’est-ce qu’on avait dit ? C’est à 21,5. C’est la plus petite somme qu’on va avoir. Florence : Ah OK je comprends. Et puis le maximum c’est quoi ? C’est à 43,3 ? Rosalie : on peut se rendre à AC=0 pis à AC=10. Il faudrait Florence : j’comprends, j’comprends tout.
Elles sont interrompues à ce stade de leur exploration par le lancement de la mise en commun.
Bilan de l’activité pour l’équipe 1 L’instrument d’exploration construit n’est pas celui attendu, de ce fait l’exploration qualitative n’a pas réellement lieu. Les étudiantes restent dans une approche très quantitative. Du début à la fin, elles restent accrochées aux valeurs des aires affichées. On peut cependant supposer que si l’activité avait duré un peu plus longtemps, elles seraient entrées dans une exploration plus globale de la co-variation. Le fait que leur instrumentation technique n’est pas solide n’est pas tellement préjudiciable ici dans la mesure où le formateur travaille en permanence avec elle. On peut se demander jusqu’où elles auraient été si elles avaient été livrées à elles-mêmes. Si l’activité échoue à développer chez ces étudiantes une intuition globale d’une variation quadratique, elle leur permet cependant de donner du sens à la notion de graphique, avec des allers et retours systématiques entre la figure dynamique et le graphique, pour chaque position du point courant sur le graphique. On ne les voit à aucun moment prendre un recul didactique sur ce qu’elles sont en train de vivre, ni sur le rôle joué par la technologie dans cette exploration. Cependant, l’état de réflexion dans lequel elles se trouvent à la fin de l’activité les rend réceptives à la réflexion didactique proposée par le formateur durant la période de mise en commun.

“Quaderni di Ricerca in Didattica (Mathematics)”, n. 25, Supplemento n.2, 2015 G.R.I.M. (Departimento di Matematica e Informatica, University of Palermo, Italy)
317
Déroulement de l’activité pour l’équipe 2 L’équipe 2 est constituée de deux étudiants très à l’aise avec le logiciel, et la technologie en général, et fiers de l’être. Ils possèdent parfaitement les schèmes élémentaires. Ainsi construire la figure ne leur prend que 2 minutes, et encore parce qu’ils ont construits des triangles isocèles plutôt qu’équilatéraux. En revanche, ils sont concentrés uniquement sur les aspects techniques de la tâche et perdent facilement de vue les enjeux mathématiques et didactiques. Ainsi, après avoir construit la figure, ils sont obligés de revenir à l’énoncé pour se rappeler l’enjeu mathématique :
Olivier : Maintenant qu’est-ce qu’on fait ? [Lisant la consigne au tableau.] On s’intéresse aux effets sur l’aire des triangles Franck : Ben fait afficher l’aire du polygone1, polygone2, polygone3, polygone 4. Fais juste t’assurer que 1 et 2 soient les triangles isocèles pis 3 et 4 les équilatéraux là. Franck : après ça met un curseur ben avec la somme des deux pis check qu’elle reste constante.
On voit que la réponse de Franck est purement technique. Son activité est complètement pilotée par les schèmes instrumentaux. Il ne cherche pas à anticiper quelles sont les grandeurs pertinentes ni la nature de leur relation. Il applique sans réfléchir le schème: « afficher l’aire d’un polygone ». En fait, il a une idée préconçue de la situation (la somme des aires des triangles est constante), et ne cherche pas à la mettre en question. Les deux étudiants évacuent les enjeux mathématiques et didactiques pour se concentrer sur la réalisation d’un fichier GeoGebra le plus aboutit possible techniquement. Ainsi Olivier passe beaucoup de temps à peaufiner l’affichage des aires des triangles à l’aide de textes dynamiques au lieu de se contenter de l’affichage des variables correspondantes dans l’onglet algèbre du logiciel. Franck quant à lui cherche à tracer le plus de polygones possibles dans le même fichier. Il n’envisage pas cela comme une variable didactique mais plutôt comme un défi technologique.
Franck: Ouais c'est ça, là ça va être mieux. Fait qu'on va avoir des triangles isocèles et des triangles équilatéraux. T'effaceras... ou tu mettras une couleur différente pour les autres triangles. Olivier: ouais c'est ça que j'comptais faire. Franck: Fait que comme ça on va être deux fois meilleurs que les autres puisqu'on aura deux triangles. Deux sets de triangles. Nicolas: Il y en a qui vont... Franck: Ouais et tu feras des hexagones après qui ont la même base. On va voir si avec des hexagones on va se faire battre.
C’est Olivier qui finit par ramener la tâche sur l’obtention de graphiques mais sans qu’aucune exploration de la figure dynamique ait eu lieu.
Franck : pis après ça tu vas faire les hexagones. Olivier : tu veux pas qu’on voit comme… les courbes ? Franck : ben c’est juste pour qu’on… soit meilleurs qu’les autres (rires). Olivier : j’préfèrerais faire… aller voir la courbe à quoi qu’elle ressemble Franck : Ok d’abord.
Comme ils maitrisent parfaitement la création de points de coordonnées dynamiques, ils vont multiplier les traces actives. Leur but est de visualiser toutes les combinaisons possibles entre les différentes grandeurs présentes dans la figure (aire des divers polygones en fonction de la distance AC, aires d’un triangle isocèle en fonction de celle d’un triangle équilatéral…) Ils obtiennent finalement trois courbes sur lesquelles ils ne prennent pas le temps de s’interroger, obsédés par l’idée d’en obtenir de nouvelles avec d’autres polygones. La mise en commun commence alors qu’ils peaufinent leur fichier par un jeu de couleur sur les courbes. Ils ne questionnent par le fait que plusieurs des points dynamiques génèrent la même courbe (avec 7 points dynamiques, ils obtiennent 3 courbes dont une droite). Ils ne s’interrogent pas non plus sur la nature des relations traduites par les courbes et ne reviennent jamais vers la figure dynamique.
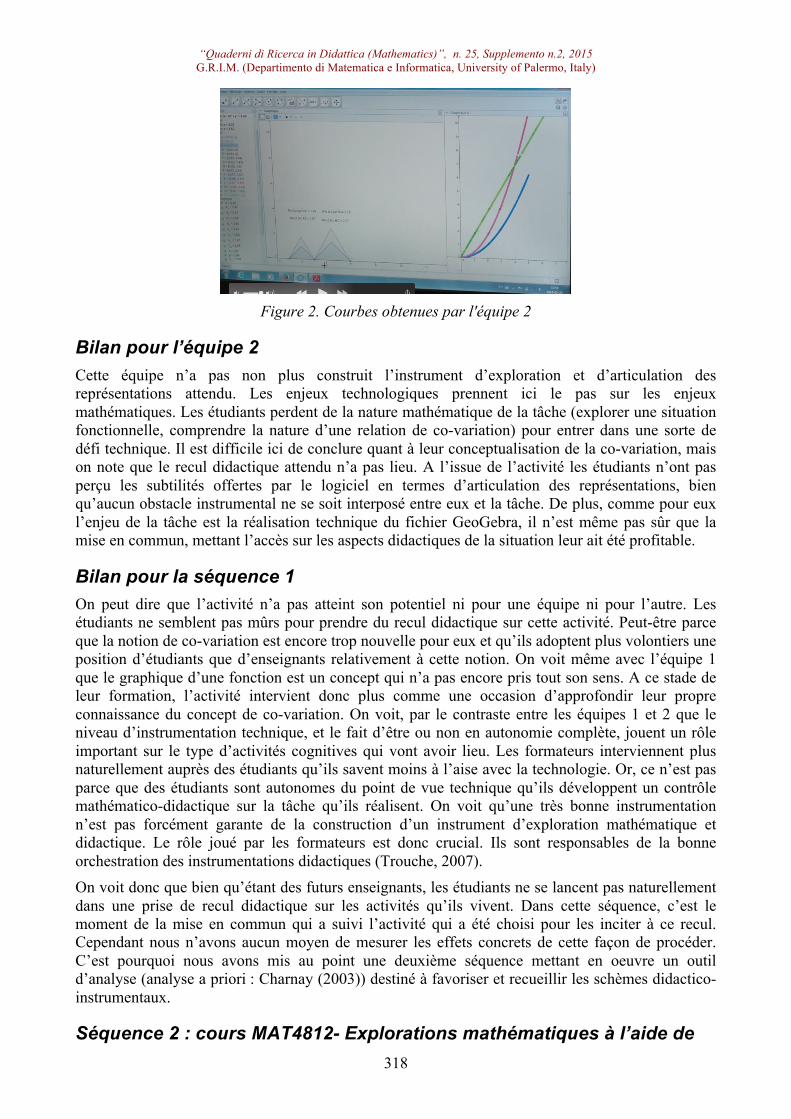
“Quaderni di Ricerca in Didattica (Mathematics)”, n. 25, Supplemento n.2, 2015 G.R.I.M. (Departimento di Matematica e Informatica, University of Palermo, Italy)
318
Figure 2. Courbes obtenues par l'équipe 2
Bilan pour l’équipe 2 Cette équipe n’a pas non plus construit l’instrument d’exploration et d’articulation des représentations attendu. Les enjeux technologiques prennent ici le pas sur les enjeux mathématiques. Les étudiants perdent de la nature mathématique de la tâche (explorer une situation fonctionnelle, comprendre la nature d’une relation de co-variation) pour entrer dans une sorte de défi technique. Il est difficile ici de conclure quant à leur conceptualisation de la co-variation, mais on note que le recul didactique attendu n’a pas lieu. A l’issue de l’activité les étudiants n’ont pas perçu les subtilités offertes par le logiciel en termes d’articulation des représentations, bien qu’aucun obstacle instrumental ne se soit interposé entre eux et la tâche. De plus, comme pour eux l’enjeu de la tâche est la réalisation technique du fichier GeoGebra, il n’est même pas sûr que la mise en commun, mettant l’accès sur les aspects didactiques de la situation leur ait été profitable.
Bilan pour la séquence 1 On peut dire que l’activité n’a pas atteint son potentiel ni pour une équipe ni pour l’autre. Les étudiants ne semblent pas mûrs pour prendre du recul didactique sur cette activité. Peut-être parce que la notion de co-variation est encore trop nouvelle pour eux et qu’ils adoptent plus volontiers une position d’étudiants que d’enseignants relativement à cette notion. On voit même avec l’équipe 1 que le graphique d’une fonction est un concept qui n’a pas encore pris tout son sens. A ce stade de leur formation, l’activité intervient donc plus comme une occasion d’approfondir leur propre connaissance du concept de co-variation. On voit, par le contraste entre les équipes 1 et 2 que le niveau d’instrumentation technique, et le fait d’être ou non en autonomie complète, jouent un rôle important sur le type d’activités cognitives qui vont avoir lieu. Les formateurs interviennent plus naturellement auprès des étudiants qu’ils savent moins à l’aise avec la technologie. Or, ce n’est pas parce que des étudiants sont autonomes du point de vue technique qu’ils développent un contrôle mathématico-didactique sur la tâche qu’ils réalisent. On voit qu’une très bonne instrumentation n’est pas forcément garante de la construction d’un instrument d’exploration mathématique et didactique. Le rôle joué par les formateurs est donc crucial. Ils sont responsables de la bonne orchestration des instrumentations didactiques (Trouche, 2007). On voit donc que bien qu’étant des futurs enseignants, les étudiants ne se lancent pas naturellement dans une prise de recul didactique sur les activités qu’ils vivent. Dans cette séquence, c’est le moment de la mise en commun qui a suivi l’activité qui a été choisi pour les inciter à ce recul. Cependant nous n’avons aucun moyen de mesurer les effets concrets de cette façon de procéder. C’est pourquoi nous avons mis au point une deuxième séquence mettant en oeuvre un outil d’analyse (analyse a priori : Charnay (2003)) destiné à favoriser et recueillir les schèmes didactico-instrumentaux.
Séquence 2 : cours MAT4812- Explorations mathématiques à l’aide de

“Quaderni di Ricerca in Didattica (Mathematics)”, n. 25, Supplemento n.2, 2015 G.R.I.M. (Departimento di Matematica e Informatica, University of Palermo, Italy)
319
l’informatique C’est un des derniers cours de la formation des futurs enseignants. A ce stade, les étudiants sont considérés comme des experts mathématiques et on cherche à provoquer chez eux une réflexion didactique. La séquence se déroule en deux temps :
Phase 1: situation 2 Le travail est collectif et se fait en grand groupe, en salle machine. Les étudiants manipulent en même temps que le formateur. La construction de la figure et la réflexion sont collectives et partagées. Les étudiants doivent ensuite proposer une analyse a priori de l’activité. Certains des étudiants ont déjà exploré la situation lors de la séquence 1 et d’autres non. L’accent est mis sur les aspects didactiques. À la lecture des analyses a priori fournies durant la phase 1, on peut distinguer trois catégories d’étudiants : La première catégorie regroupe les étudiants qui montrent par leur analyse de la situation qu’ils ont compris que l’enjeu est de travailler la notion de situation fonctionnelle et d’articuler différentes représentations d’une fonction. Ces étudiants maitrisent également les schèmes didactico-instrumentaux en jeu: construction d’un graphique dynamique par activation de la trace, utilisation d’un tableur pour générer le graphique, gestion des points mobiles, articulation entre les différentes représentations. La deuxième catégorie regroupe les étudiants qui ont bien compris les enjeux didactiques autour de la co-variation mais maitrisent moins bien les schèmes instrumentaux en jeu. Comme on peut le voir dans l’extrait ci-dessous, l’utilisation de l’outil trace est envisagée de façon très technique, ce qui laisse supposer un manque de recul:
« Ils [les élèves] peuvent définir deux variables, soit x = distance entre AC et y = somme des aires des triangles afin de pouvoir créer deux droites qui leur sont associées. Par la suite, en utilisant le point d’intersection de ces droites et la trace de ce point, les élèves peuvent bouger le schéma afin de voir la production de la trace. »
L’importance est donnée à la procédure à suivre plus qu’à l’instrument didactique construit. Ces étudiants concentrent leur attention sur le rôle que l’on peut faire jouer au tableur. Ils préconisent l’obtention du graphique à partir d’une table de valeur. Les deux façons envisagées d’obtenir le graphique (trace ou tableur) ne sont pas commentées dans une perspective didactique. Ces étudiants ne perçoivent pas la possibilité d’articulation entre les différentes représentations offertes pas la technologie. Pour eux, le rôle de la technologie est essentiellement d’offrir des possibilités de visualisation et d’automatisation. Ils ont cependant perçu que le déplacement peut remplir plusieurs fonctions didactiques et sont capables de nommer celle qui est mise en jeu :
« Les élèves peuvent utiliser le déplacement afin de bien visualiser la situation. Le déplacement leur permet d’explorer une infinité de cas possibles afin d’émettre une hypothèse. »
La troisième catégorie regroupe des étudiants qui maitrisent mal les enjeux didactiques de la situation: ils la considèrent comme ancrée dans le domaine de la géométrie, centrée sur les polygones réguliers et les calculs d’aire, tout en lui reconnaissant une composante algébrique :
« Possibilité d’analyse algébrique (connaitre l’aire du deuxième triangle selon la base du premier triangle ainsi que la longueur du segment AB). »
Dans ce cas, les enjeux technologiques tournent autour de la construction de figures dans GeoGebra et l’exploration de différents cas possibles. La situation ayant été étudiée en classe, ces étudiants se rappellent qu’on a construit des graphiques mais on sent que le lien entre le graphique obtenu et la situation de départ est artificiel pour eux. Les stratégies proposées sont très procédurales. Elles décrivent les actions à effectuer dans le logiciel sans vraiment de vision globale.
“Quaderni di Ricerca in Didattica (Mathematics)”, n. 25, Supplemento n.2, 2015 G.R.I.M. (Departimento di Matematica e Informatica, University of Palermo, Italy)
320
Phase 2 : Situation 3 Les étudiants travaillent individuellement. Ils sont invités à explorer la situation selon trois modes : papier/crayon, tableur et GeoGebra. Ils doivent ensuite proposer une activité mettant en jeu cette situation avec des élèves du secondaire, en milieu technologique. Ils sont laissés libres dans le choix du logiciel à utiliser avec les élèves. Ils doivent fournir une analyse a priori de l’activité proposée. On constate que les étudiants des catégories 1 et 2 reconnaissent dans la situation 3 la possibilité d’appréhender la notion de co-variation et de situation fonctionnelle. La différence dans leurs propositions respectives se situe au niveau de l’instrumentation de la trace. Les étudiants de la catégorie 1 analyse son utilisation :
« L’élève doit se rendre compte qu’il n’y a en effet qu’une seule valeur maximale pour l’aire de la pièce (connaissances sur la quadratique). »
Ils anticipent également les difficultés des élèves: « Difficultés: Comment et sur quoi afficher la trace? ».
Les étudiants de la catégorie2 sont plus évasifs quant à l’obtention du graphique : « Il [l’élève] peut construire le graphique (avec la techno ou en papier-crayon) ».
Cela donne à penser que la technologie ne fait qu’automatiser les méthodes utilisées en papier crayon. Cela se confirme avec le choix presque systématique du tableur pour travailler la situation avec les élèves. Ces étudiants s’attardent donc davantage que les autres sur les enjeux didactiques de l’utilisation d’un tableur :
« Les élèves passeraient progressivement vers une méthode plus algébrique (pour pouvoir répondre à la question) à partir des réponses obtenues par essais-erreurs grâce aux méthodes intuitives arithmétiques réalisées dans le tableur ».
Ce sont cependant ces étudiants de la catégorie 2 qui sont le plus sensibles à l’articulation entre les différents registres de représentation de la fonction :
« But de l’activité: Amener les élèves à explorer une relation fonctionnelle et à la traduire dans différents modes de représentations (graphique, équation, tableau, etc.). Pour cela, ils devront dégager les variables dépendantes et indépendantes.»
Les autres étudiants situent cette activité dans le domaine de la géométrie pour un travail sur l’aire des rectangles. Les grandeurs en situation de co-variation sont identifiées mais le lien avec le concept de fonction n’est pas fait :
« Les élèves doivent trouver de quelle manière la largeur donnée au bâtiment influencera les dimensions des autres pièces. ».
La résolution proposée est numérique, avec éventuellement un lien vers l’algèbre pour exprimer les relations entre les différentes grandeurs :
« On veut faire travailler l’élève avec une inconnue, une variable et différentes expressions algébriques dans lesquelles on utilise l’inconnue de départ. »
Les différentes représentations sont envisagées sous l’angle de l’exploration de différents cas de figure. La mesure (ou affichage des valeurs) est omniprésente dans l’exploration envisagée.
« En déplaçant les points non-fixes, il observe toutes les valeurs possibles des dimensions du rectangle brun et les écrits sur une feuille. Avec l’outil aire, on affiche l’aire de la région brune pour identifier les dimensions maximisant l’aire de la région brune. »
Le lien avec la notion de fonction n’est pas fait. L’utilisation de l’outil Trace n’est pas envisagée.
Bilan de la séquence 2 : Les étudiants sont entrés dans une analyse didactique des situations travaillées, dans la mesure de

“Quaderni di Ricerca in Didattica (Mathematics)”, n. 25, Supplemento n.2, 2015 G.R.I.M. (Departimento di Matematica e Informatica, University of Palermo, Italy)
321
leur propre compréhension des concepts à l’étude. L’instrumentation didactique qui est réalisée durant ces séquences est assez peu dépendante du niveau d’instrumentation technique. Lors de la phase 1 cela s’explique par le fait que l’activité est réalisée collectivement, et que donc les instrumentations des uns et des autres (y compris celle du formateur) se mettent au service d’une exploration collective. Si un étudiant est moins à l’aise pour certaines manipulations dans le logiciel, il se trouve toujours quelqu’un pour l’aider à s’approprier les schèmes sous-jacents. Dans la phase 2, on constate que les étudiants ne se tournent pas nécessairement vers le logiciel avec lequel ils sont le plus à l’aise, mais vers celui pour lequel ils maitrisent mieux les enjeux didactiques. Ainsi durant le cours, les étudiants ont été très sensibles au rôle intermédiaire entre arithmétique et algèbre joué par le tableur. Et on constate en effet que bien que les étudiants soient globalement plus à l’aise avec GeoGebra, ils proposent majoritairement de faire travailler les élèves dans le tableur. Ceci est à nuancer avec le fait que beaucoup d’entre eux ont vu dans cette situation l’occasion d’un travail sur les équations plus que sur les fonctions.
Conclusion Nous voyons dans ce travail une avancée vers la mise en place d’une instrumentation didactique des futurs enseignants. Il apparaît qu’il ne suffit pas de faire travailler les étudiants en milieu technologique pour provoquer cette genèse. Le rôle du formateur est primordial et nous comptons approfondir cette question dans le cadre théorique de l’orchestration instrumentale proposé par (Trouche, 2003). Le rôle du formateur est très subtil car il ne doit être ni trop intrusif, ce qui empêcherait les étudiants de mettre en place leurs propres schèmes, ni trop extérieur car les genèses doivent être guidées. Le point important, qui nous conforte dans nos hypothèses de travail, c’est que la genèse didactique n’est pas nécessairement corrélée à une instrumentation technique poussée. Les observations de la séquence 1 nous confortent dans l’idée qu’il est plus important de sensibiliser les futurs enseignants aux choix didactiques plus ou moins conscients, sous-jacents à l’utilisation d’un logiciel pour une tâche mathématique, que de vouloir en faire des experts techniques. Une expertise technique sans conscience didactique ne mènera pas à une intégration efficace de la technologie dans l’enseignement.
La séquence 2 constitue un premier pas vers cette prise de conscience. Cependant, on voit que l’instrumentation didactique nécessite un recul didactique sur les notions travaillées. Les étudiants les moins sensibles aux apports possibles de la technologie sont ceux qui ont aussi du mal à cerner les enjeux pédagogiques et didactiques des situations proposées. Le cas de la co-variation est un peu particulier car de nombreuses recherches ont montré qu’il s’agit d’un concept difficile à appréhender de façon globale, même pour des étudiants en mathématiques. Nous proposons donc de poursuivre nos investigations sur des concepts pour lesquels nous serions plus à même de distinguer la connaissance didactique sur le concept de la connaissance didactique sur la technologie.
REFERENCES Carlson, M. (1998). Physical enactment : a powerful representational tool for understanding the nature of covarying relationships ? In Representations and mathematics visualization (p. 63-77).
Charnay, R. (2003). L’analyse a priori, un outil pour l'enseignant! RMT: potentialités pour la classe et la formation, 199-208.
De cotret, S. R. (1985). « Etude historique de la notion de fonction: analyse epistemologique et expérimentation didactique ». Université du Québec à Montréal.
Duval, R. (1993). Registres de représentation sémiotique et fonctionnement cognitif de la
“Quaderni di Ricerca in Didattica (Mathematics)”, n. 25, Supplemento n.2, 2015 G.R.I.M. (Departimento di Matematica e Informatica, University of Palermo, Italy)
322
pensée. Annales de Didactique et de Sciences Cognitives, 5, 37-65.
Guin, D., & Trouche, L. (1998). Complex process of converting tools into mathematical instruments: The case of calculators. International Journal of Computers for Mathematical Learning, 3(3), 195-227. doi:10.1023/A:1009892720043 Hitt, F. (1998). Systèmes sémiotiques de représentation liés au concept de fonction. Annales de didactique et de sciences cognitives,. Leclère, P., Simonnot, B., & Barcenilla, Javier, Dinet, J. (2007). Les freins à l’intégration des tice en classe. TICE Méditerranée, 1-11. MELS. (s. d.). Programme de formation de l’école québécoise. Consulté 17 janvier 2015, à l’adresse https://www7.mels.gouv.qc.ca/dc/liste%5Forthographique/ MELS. (2000). Programme de formation de l’école québecoise - deuxième cycle du secondaire en mathématiques. Monk, S. (1992). The concept of function aspects of epistemology and pedagogye. In G. H. Dubinsky (Éd.), MAA notes and reports series (p. 175-194). Passaro, V. (2007). Covariation Entre Deux Grandeurs Révélé Par Une Analyse Des Représentations Spontanées D ’ Élèves Du Premier Cycle Par Valériane.
Rabardel, P. (1995). Les hommes et les technologies; approche cognitive des instruments contemporains. Consulté à l’adresse https://hal.archives-ouvertes.fr/hal-01017462/document
Restrepo, A. M. (2008). Genèse instrumentale du déplacement en géométrie dynamique chez des élèves de 6ème. Université Joseph-Fourier, Grenoble.
Soury-Lavergne, S. (2011). De l’intérêt des construction molles en géométrie dynamique. Mathématice.
Tapan, M. S. (2006). Différents types de savoirs mis en oeuvre dans la formation initiale d’enseigants de mathématiques à l'intégration de technolgoies de géométrie dynamique. Université Joseph Fourier- Grenoble 1. Tremblay, K.-P., & Venant, F. (2015). La technologie au carrefour des cadres théoriques : une double analyse autour de la notion de co-variation. Montréal: GDM. Trouche, L. (2003). Construction et conduite des instruments dans les apprentissages mathématiques : nécessité des orchestrations. Consulté à l’adresse https://telearn.archives-ouvertes.fr/hal-00190091/
Trouche, L. (2007). Chapitre 1. Environnements informatisés d’apprentissage : quelle assistance didactique pour la construction des instruments mathématiques ? Perspectives en éducation et formation. De Boeck Supérieur. doi:10.3917/dbu.flori.2007.01.0019 Vergnaud, G. (1996). Au fond de l‘action, la conceptualisation. In J.-M. Barbier (Éd.), Savoirs théoriques et savoirs d‘action (Pédagogie ). PUF.

“Quaderni di Ricerca in Didattica (Mathematics)”, n. 25, Supplemento n.2, 2015 G.R.I.M. (Departimento di Matematica e Informatica, University of Palermo, Italy)
323
L’orientation des enseignants de mathématiques et sciences sur les modèles constructivistes et transmissivistes
d'enseignement. Les résultats de la recherche Prisma sur les enseignants
valdôtains des niveaux primaire et secondaire
Zanetti M. A., Università della Valle d’Aosta, Strada Cappuccini 2A - 11100 Aosta; [email protected]
Graziani S., Università della Valle d’Aosta, Strada Cappuccini 2A - 11100 Aosta; [email protected]
Parma A., Università della Valle d’Aosta, Strada Cappuccini 2A - 11100 Aosta; [email protected]
Bertolino F., Università della Valle d’Aosta, Strada Cappuccini 2A - 11100 Aosta; [email protected]
Perazzone A., Università degli Studi di Torino, Via Accademia Albertina 13 - 10123 Torino; [email protected]
Résumé: L’article analyse la nature des processus d’enseignement et d’apprentissage développés par les enseignants valdotaines en vérifiant la présence des orientations transmissivistes ou constructivistes et en essayant d’enquêter sur les différences dans les approches des enseignants en mathématiques et disciplines scientifiques. Les données utilisées proviennent de la recherche de PRISMA, conduite par le Département de la surintendance des écoles de la Région Autonome Vallée d’Aoste et l’Université de la Vallée d’Aoste par une enquête administrée à l’ensemble des enseignants des écoles primaires et secondaires du premier degré de la région. Les énoncés permettant de mesurer l’orientation constructiviste ou trasmissiviste des enseignants ont été développés à partir de l’échelle d’attitude proposée par la recherche TALIS (Teaching and Learning International Survey, OCDE 2008). En utilisant la technique de l’analyse factorielle, à partir des réponses sur ces points, ils ont été extraits deux facteurs qui ont peut résumer dans le concepts des constructivisme et transmissivisme. Les notes factoriels ont ensuite été utilisés pour vérifier l’existence de différentes approches entre les enseignants de mathématiques par rapport à ceux des autres disciplines dans les différents niveaux d’enseignement.
Abstract: The article analyzes the nature of teaching and learning processes developed by teachers Aosta Valley by checking the presence of transmissivistes or constructivist orientations and trying to investigate the differences in the approaches of teachers in mathematics and scientific disciplines. The data used are from the PRISMA research, conducted by the Department of superintendent of schools of the Autonomous Region Aosta Valley and Aosta Valley University by a survey administered to all primary school teachers and secondary first degree in the area. The analysis measures the transmissivity or constructivist orientationthat teachers may have developed from the scale attitude offered by TALIS (Teaching and Learning International Survey, OECD 2008). Using factor analysis, based on the answers to these points, two factors were extracted, related to the concepts of constructivism and transmissivisme. The factorial scores were then used to verify the existence of different approaches between teachers of mathematics in relation to other 10 Massimo Angelo Zanetti, Stefania Graziani, Andrea Parma et Fabrizio Bertolino affèrent au Département de Sciences Humaines et Sociales de l’Université de la Vallée d’Aoste. Anna Perazzone affère au Département de Sciences de la Vie et Biologie des systèmes de l’Université des Etudes de Turin. La contribution des auteurs à la rédaction de l’article est articulée comme suit: Zanetti, Bertolino et Perazzone ont contribué à la rédaction du premier paragraphe; le deuxième paragraphe a été préparé par Zanetti et Parma; Zanetti et Graziani ont travaillé à la rédaction du troisième paragraphe. La responsabilité globale de l’article est imputable à Zanetti. La traduction française a été réalisée par Graziani, Parma et Zanetti.
“Quaderni di Ricerca in Didattica (Mathematics)”, n. 25, Supplemento n.2, 2015 G.R.I.M. (Departimento di Matematica e Informatica, University of Palermo, Italy)
324
disciplines in the different levels of education.
Introduction Cet article présente des résultats concernant les modèles pédagogiques et didactiques des enseignants qui émergent de la recherche PRISMA (Projet de Recherche sur les Enseignements et Apprentissages Scientifiques et Mathématiques), réalisée dans la Vallée d’Aoste grâce à une enquête11 qui a impliqué la population régionale des enseignants des écoles primaire et secondaire. En particulier, les concepts d’enseignement – apprentissage des enseignants sont analysées en utilisant les catégories analytiques du « transmissivisme » et du « constructivisme », sur lesquels on a comparé les orientations des enseignants de mathématiques et de la science avec ceux d'autres disciplines.
1. La recherche PRISMA. Objectifs et méthodologie Conçue dans le but de promouvoir le développement des mesures et actions visant à l’amélioration de l’enseignement et de l’apprentissage des disciplines scientifiques et mathématiques dans les écoles de la région, la recherche PRISMA a été activée en collaboration entre le Département de la surintendance des écoles de la Région Autonome Vallée d’Aoste et l’Université de la Vallée d’Aoste.12 Conjointement à la conception et à l'exécution de l'enquête sur l’ensemble du corps enseignant des écoles primaire et secondaire, des dispositions ont été prises pour la collecte systématique d’informations relatives aux établissements scolaires, dans le but de disposer d’un environnement adéquat dans lequel le corps enseignant est appelé à travailler. La recherche a eu un caractère interdisciplinaire impliquant soit des pédagogues soit des sociologues. Parmi les premiers ont été se sont engagés soit les spécialistes afférents dans les domaines de la pédagogie générale soit de la didactique des mathématiques et des sciences, tandis que pour la sociologie ont été touchés les domaines de la sociologie de l’éducation et des politiques éducatives, ainsi que la sociologie de s sciences et des professions. Les instruments qui ont été utilisés pour la collecte sont:
1. Un questionnaire distribué aux enseignants pour l’auto remplissage, en version complète (73 questions) pour les enseignants des disciplines mathématiques et scientifiques, focus spécifique de l’enquête et dans la version réduite et moins exigeant (36 questions) pour les enseignants des autres disciplines à l'égard desquels on voulait faire une comparaison seulement pour des questions transversales. Le questionnaire est constitué soit de certaines questions didactiques sur les spécificités valdôtaines, soit, surtout, de questions proviennent d'enquêtes par sondage les plus populaires nationales et internationales (VOSTS, NSTQ, VOSE, TIMSS, TALIS, etc.)13, pour permettre la comparaison des résultats;
2. Des tableaux pour la collecte des données de contexte relatives soit à chaque établissement scolaire soit au système scolaire régional dans son ensemble. Le questionnaire destiné aux enseignants a touché les domaines suivants:
• Biographie personnelle et professionnelle;
11 La soi-disante phase de field de la recherche PRISMA, c’est-à-dire la campagne de collecte des données, a été
conduite au cours de la première moitié de l’année scolaire 2010-11. 12 La recherche PRISMA dans son ensemble est coordonné par Piero Aguettaz e Chiara Allera Longo du Bureau soutien
à l’autonomie scolaire – Département de la surintendance des écoles de la Région Autonome Vallée d’Aoste et par Fabrizio Bertolino du Département de Sciences humaines et sociales - Université de la Vallée d'Aoste.
13 VOST - Views on Science- Technology-Society, 1989; NSTQ - Nature of Science and Technology, 2001; TIMSS - Trends in International Mathematics and Science Study, 2003; VOSE - Views on science and education, 2006; TALIS - Teaching and Learning International Survey, 2008.
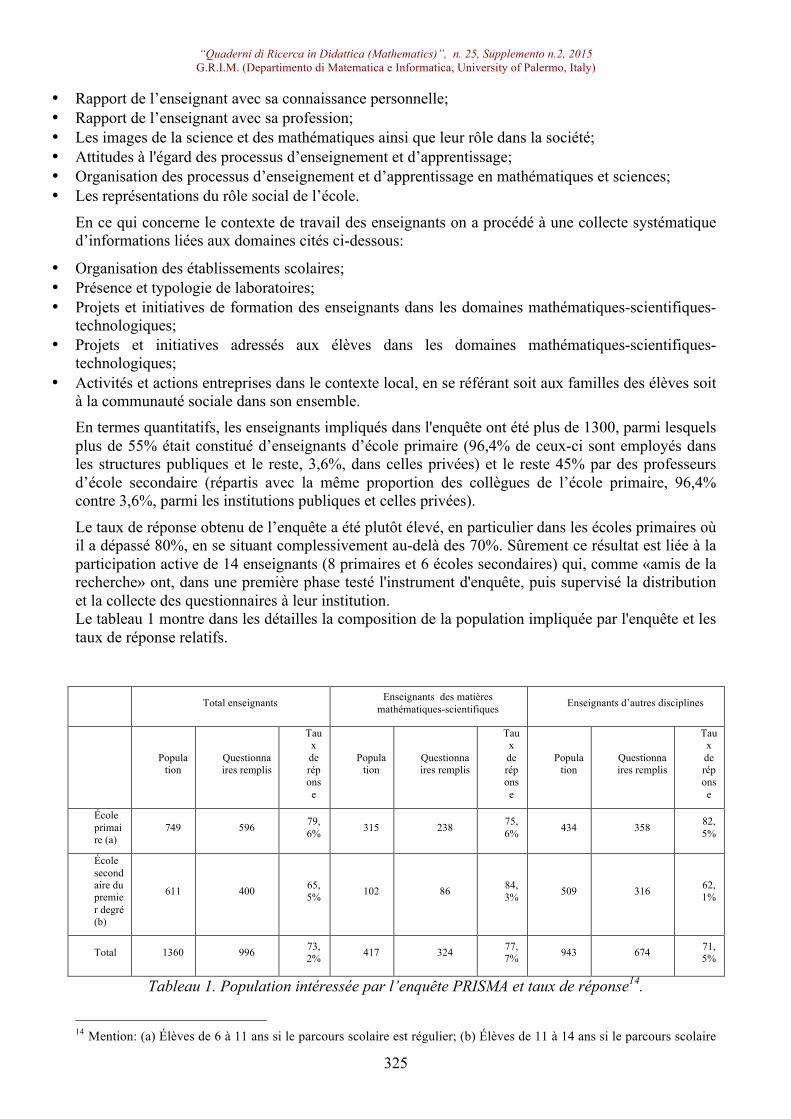
“Quaderni di Ricerca in Didattica (Mathematics)”, n. 25, Supplemento n.2, 2015 G.R.I.M. (Departimento di Matematica e Informatica, University of Palermo, Italy)
325
• Rapport de l’enseignant avec sa connaissance personnelle; • Rapport de l’enseignant avec sa profession; • Les images de la science et des mathématiques ainsi que leur rôle dans la société; • Attitudes à l'égard des processus d’enseignement et d’apprentissage; • Organisation des processus d’enseignement et d’apprentissage en mathématiques et sciences; • Les représentations du rôle social de l’école.
En ce qui concerne le contexte de travail des enseignants on a procédé à une collecte systématique d’informations liées aux domaines cités ci-dessous:
• Organisation des établissements scolaires; • Présence et typologie de laboratoires; • Projets et initiatives de formation des enseignants dans les domaines mathématiques-scientifiques-
technologiques; • Projets et initiatives adressés aux élèves dans les domaines mathématiques-scientifiques-
technologiques; • Activités et actions entreprises dans le contexte local, en se référant soit aux familles des élèves soit
à la communauté sociale dans son ensemble. En termes quantitatifs, les enseignants impliqués dans l'enquête ont été plus de 1300, parmi lesquels plus de 55% était constitué d’enseignants d’école primaire (96,4% de ceux-ci sont employés dans les structures publiques et le reste, 3,6%, dans celles privées) et le reste 45% par des professeurs d’école secondaire (répartis avec la même proportion des collègues de l’école primaire, 96,4% contre 3,6%, parmi les institutions publiques et celles privées).
Le taux de réponse obtenu de l’enquête a été plutôt élevé, en particulier dans les écoles primaires où il a dépassé 80%, en se situant complessivement au-delà des 70%. Sûrement ce résultat est liée à la participation active de 14 enseignants (8 primaires et 6 écoles secondaires) qui, comme «amis de la recherche» ont, dans une première phase testé l'instrument d'enquête, puis supervisé la distribution et la collecte des questionnaires à leur institution. Le tableau 1 montre dans les détailles la composition de la population impliquée par l'enquête et les taux de réponse relatifs.
Total enseignants Enseignants des matières
mathématiques-scientifiques Enseignants d’autres disciplines
Population
Questionnaires remplis
Taux de réponse
Population
Questionnaires remplis
Taux de réponse
Population
Questionnaires remplis
Taux de réponse
École primaire (a)
749 596 79,6% 315 238 75,
6% 434 358 82,5%
École secondaire du premier degré (b)
611 400 65,5% 102 86 84,
3% 509 316 62,1%
Total 1360 996 73,2% 417 324 77,
7% 943 674 71,5%
Tableau 1. Population intéressée par l’enquête PRISMA et taux de réponse14.
14 Mention: (a) Élèves de 6 à 11 ans si le parcours scolaire est régulier; (b) Élèves de 11 à 14 ans si le parcours scolaire
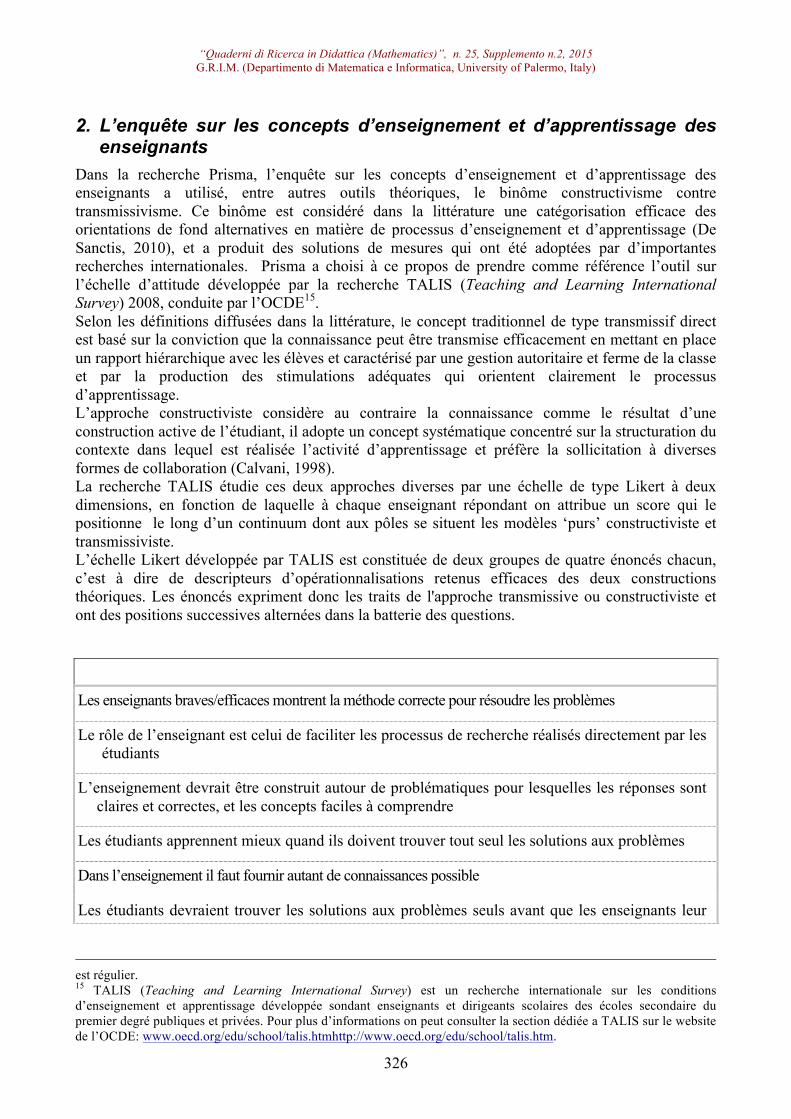
“Quaderni di Ricerca in Didattica (Mathematics)”, n. 25, Supplemento n.2, 2015 G.R.I.M. (Departimento di Matematica e Informatica, University of Palermo, Italy)
326
2. L’enquête sur les concepts d’enseignement et d’apprentissage des enseignants
Dans la recherche Prisma, l’enquête sur les concepts d’enseignement et d’apprentissage des enseignants a utilisé, entre autres outils théoriques, le binôme constructivisme contre transmissivisme. Ce binôme est considéré dans la littérature une catégorisation efficace des orientations de fond alternatives en matière de processus d’enseignement et d’apprentissage (De Sanctis, 2010), et a produit des solutions de mesures qui ont été adoptées par d’importantes recherches internationales. Prisma a choisi à ce propos de prendre comme référence l’outil sur l’échelle d’attitude développée par la recherche TALIS (Teaching and Learning International Survey) 2008, conduite par l’OCDE15. Selon les définitions diffusées dans la littérature, le concept traditionnel de type transmissif direct est basé sur la conviction que la connaissance peut être transmise efficacement en mettant en place un rapport hiérarchique avec les élèves et caractérisé par une gestion autoritaire et ferme de la classe et par la production des stimulations adéquates qui orientent clairement le processus d’apprentissage. L’approche constructiviste considère au contraire la connaissance comme le résultat d’une construction active de l’étudiant, il adopte un concept systématique concentré sur la structuration du contexte dans lequel est réalisée l’activité d’apprentissage et préfère la sollicitation à diverses formes de collaboration (Calvani, 1998). La recherche TALIS étudie ces deux approches diverses par une échelle de type Likert à deux dimensions, en fonction de laquelle à chaque enseignant répondant on attribue un score qui le positionne le long d’un continuum dont aux pôles se situent les modèles ‘purs’ constructiviste et transmissiviste. L’échelle Likert développée par TALIS est constituée de deux groupes de quatre énoncés chacun, c’est à dire de descripteurs d’opérationnalisations retenus efficaces des deux constructions théoriques. Les énoncés expriment donc les traits de l'approche transmissive ou constructiviste et ont des positions successives alternées dans la batterie des questions.
Les enseignants braves/efficaces montrent la méthode correcte pour résoudre les problèmes
Le rôle de l’enseignant est celui de faciliter les processus de recherche réalisés directement par les étudiants
L’enseignement devrait être construit autour de problématiques pour lesquelles les réponses sont claires et correctes, et les concepts faciles à comprendre
Les étudiants apprennent mieux quand ils doivent trouver tout seul les solutions aux problèmes
Dans l’enseignement il faut fournir autant de connaissances possible
Les étudiants devraient trouver les solutions aux problèmes seuls avant que les enseignants leur
est régulier. 15 TALIS (Teaching and Learning International Survey) est un recherche internationale sur les conditions d’enseignement et apprentissage développée sondant enseignants et dirigeants scolaires des écoles secondaire du premier degré publiques et privées. Pour plus d’informations on peut consulter la section dédiée a TALIS sur le website de l’OCDE: www.oecd.org/edu/school/talis.htmhttp://www.oecd.org/edu/school/talis.htm.

“Quaderni di Ricerca in Didattica (Mathematics)”, n. 25, Supplemento n.2, 2015 G.R.I.M. (Departimento di Matematica e Informatica, University of Palermo, Italy)
327
montrent comment faire pour les résoudre
Les enseignants ne devraient pas laisser que les étudiants développent des explications de manière autonomes, qui pourraient être fausses, mais plutôt donner des explications directes
C’est plus important apprendre à penser et à raisonner qu’apprendre des contenus spécifiques disciplinaires
Tableau 2. Question PRISMA sur les concepts d’enseignement des enseignants16 (« Pour chacune des affirmations suivantes relatives à l’enseignement/apprentissage en général, indiquez combien
vous êtes d’accord. S’exprimer sur toutes les affirmations »).
La recherche PRISMA a emprunté substantiellement la formulation originale17 des énoncés, en intervenant cependant avec une atténuation relative de l’importance du climat de la classe (qui doit être « calme » comme exigence généralement nécessaire pour l’apprentissage efficace en référence au quatrième énoncé transmissif original TALIS) et davantage l’accent sur la directivité de l’enseignant (voir le quatrième énoncé transmissif PRISMA18). Le tableau 2 montre la formulation des énoncés adoptés en PRISMA. En ce qui concerne les solutions de mesure adoptées, dans Talis les réponses fermées sur l'échelle des attitudes de Likert à quatre modes de réponse ont été disposées selon un motif symétrique à double polarité de désaccord-accord, à partir de lequel nous avons calculé les scores ipsatives19. Dans la recherche PRISMA nous avons adopté la solution à quatre mode de réponse et avec une seule polarité (de «pas du tout d’accord» à «tout à fait d’accord») qui peut être observé dans le tableau 2, et on n'a pas pris ex ante l'alternative entre les concepts transmissif et constructiviste, mais on a laissé l’émerger éventuellement à partir des données adoptant la technique de l'analyse factorielle oblique20, c’est à dire faite sans l'hypothèse ni d'une relation entre les deux constructions opposition/alternativité, qui prend statistiquement la forme de corrélation négative (comme on dirait que l'équipe de recherche TALIS a plutôt fait), ni indépendance ou, avec la langue de l'analyse factorielle, l'orthogonalité des deux facteurs extraits. Ceci afin d'éviter précisément que l’alternativité ou l’indépendance des deux constructions pourrait subrepticement dériver par le 16 Les énoncés impairs représentent expressions d’une attitude transmissive, tandis que les énoncés pairs représentent
une attitude constructiviste. 17 La formulation des énoncés adoptée par TALIS 2008 est représentée dans sa traduction en langue italienne in De
Sanctis (2010). Pour la formulation originale en langue anglaise, veuillez consulter la publication OCDE « Creating Effective Teaching and Learning Environments: First Results from TALIS ». (www.oecd.org/education/school/43023606.pdf). Autres documents, en particulier le manuel technique de la recherche 2008 (OCDE 2009a), sont disponibles sur les website de l’OCDE (www.oecd.org/edu/school/talis.htm). Le lien au manuel technique mentionné est le suivant: www.oecd.org/education/school/44978960.pdf.
18 Il s’agit de l’énoncé G, indiqué dans le tableau 2. 19 L’échelle Likert TALIS est graduée dans la façon suivante: pas de tout d’accord, désaccord, d’accord, tout à fait
d’accord. Les scores ipsatifs constituent une solution pour standardiser les réponses individuelles au but de réduire les effets distorsifs. En particulier, l’adoption des scores ipsatives dans la recherche TALIS en ce qui concerne l’analyse des attitudes a été dictée par la nécessité d’affronter les problèmes liés à l’application de l’analyse factorielle à un cadre cross-culturel qui présentent plusieurs différences dans les moyennes des indicateurs dans les pays considérés (OCSE 2009a, De Sanctis 2010). Les scores ipsatives sont calculées en décomptant le score moyenne obtenue par les huit énoncés soit à le score moyenne calculée sur les quatre énoncés qui constituent l’indice de transmissivisme soit sur le score moyenne calculée sur les quatre énoncés qui constituent l’indice de constructivisme. Puisque que la recherche PRISMA insiste au contraire sur un contexte subnational, les susdit problèmes ne se manifestent pas dans l’analyse factorielle.
20 On a évidement réalisé des analyses factorielles soit avec rotations orthogonales soit avec rotations obliques, mais ces dernières présentent à notre avis un intérêt théorique plus élevé en non imposant l’alternative ex ante entre les deux constructs-facteurs de transmissivisme et constructivisme, mais plutôt en la testant empiriquement.
Les configurations de l’analyse factorielle reportée dans cet article sont les suivants: extraction nombre fixe de facteurs=2; maximum de vraisemblance, rotation oblique Oblimin avec normalisation de Kaiser.

“Quaderni di Ricerca in Didattica (Mathematics)”, n. 25, Supplemento n.2, 2015 G.R.I.M. (Departimento di Matematica e Informatica, University of Palermo, Italy)
328
réglage de la technique d'analyse. En effet les deux facteurs extraits ont présenté les corrélations attendues avec les deux groupes des énoncés (voir le tableau 3 qui montre la matrice structure de l'analyse factorielle, ou les corrélations entre les facteurs et les énoncés); ils sont donc identifiés comme «Constructivisme» et «Transmissivisme». Ils sont également corrélés les uns aux autres d'une manière négative, comme implicitement supposé par la recherche TALIS, mais seulement faiblement, comme on peut le voir dans le tableau 4.
Facteur
1 (Constructivisme)
2 (Transmissivisme)
B1.A Les enseignants braves/efficaces montrent la méthode correcte pour résoudre les problèmes -,262 ,621
B1.B Le rôle de l’enseignant est celui de faciliter les processus de recherche réalisés directement par les étudiants
,212 -,003
B1.C L’enseignement devrait être construit autour de problématiques pour lesquelles les réponses sont claires et correctes, et les concepts faciles à comprendre
-,057 ,432
B1.D Les étudiants apprennent mieux quand ils doivent trouver tout seul les solutions aux problèmes
,671 -,159
B1.E Dans l’enseignement il faut fournir autant de connaissances possible -,025 ,453
B1.F Les étudiants devraient trouver les solutions aux problèmes seuls avant que les enseignants leur montrent comment faire pour les résoudre
,624 -,226
B1.G Les enseignants ne devraient pas laisser que les étudiants développent des explications de manière autonomes, qui pourraient être fausses, mais plutôt donner des explications directes
-,184 ,369
B1.H C’est plus important apprendre à penser et à raisonner qu’apprendre des contenus spécifiques disciplinaires
,302 -,119
Tableau 3. Matrice de structure de l'analyse factorielle.
Facteur 1 (Constructivisme)
2 (Transmissivisme)
1 (Constructivisme) 1,000 -,230
2 (Transmissivisme) -,230 1,000

“Quaderni di Ricerca in Didattica (Mathematics)”, n. 25, Supplemento n.2, 2015 G.R.I.M. (Departimento di Matematica e Informatica, University of Palermo, Italy)
329
Tableau 4. Matrice de corrélation des facteurs de l’analyse factorielle.
Sur la base des leurs scores factorielles, nous avons ensuite effectué des analyses de la variance univariée: le modèle adopté a pris comme variables dépendantes les variables cardinales liées aux scores factorielles «Constructivisme» et «Transmissivisme» et comme variables indépendantes la variable dichotomique de la matière scolaire, c’est à dire mathématiques et/ou sciences versus les autres matières. Les analyses de la variance ont été réalisées soit sur tous les enseignants répondants, soit séparant les enseignants des écoles primaires de ceux de l’école secondaire du premier degré.
3. Les résultats de l'analyse: l’orientation constructiviste des enseignants de mathématiques et/ou sciences
L’analyse de la variance des scores attribués aux répondants sur le deux facteurs «Constructivisme» et «Transmissivisme» – les résultats sont présentés dans les tableaux 5 et 6 – montre que les différences entre les enseignants de mathématiques et/ou science et ceux d'autres matières sont toutes significatives au test F (p <0,05). Le test de signification statistique dans ce cas est de peu d'importance car il a été choisi de faire correspondre l'échantillon de l'enquête à la population de référence et il a été donc établie pour chaque enseignant une probabilité d’inclusion dans l'échantillon égal à 1. Toutefois, bien que on a été établi de interviewer l’entière population d’enseignants, un peu moins du 30% d’eux n’a pas répondu au questionnaire, en posant des problèmes de représentativité des résultats obtenus. Mais si on suppose que la non-participation à l’enquête n’est pas influencée de façon significative par l’orientation constructiviste plutôt que transmissiviste de chaque enseignant, on peut assumer que les différences dans les scores factorielles sont significatives pour la totalité de la population d’enseignants
N Moyenne
Écart type
Erreur type
Intervalle de confiance 95% pour
la moyenne
Limite
inférieure
Limite supérieure
Tous les enseignants
Transmissivisme
Mathématiques/sciences
274
-,20868 ,77053
,04655
-,3003
2
-,11704
Autres disciplines 554
,10321 ,72518
,03081
,04269 ,16373
Total 828
,00000 ,75445
,02622
-,0514
6 ,05146
Constructivisme
Mathématiques/sciences
274
,22298 ,71884
,04343
,13749 ,30848
Autres disciplines 554
-,11028 ,80193
,03407
-,1772
1
-,04336
Total 828
,00000 ,79071
,02748
-,0539
4 ,05394
Enseignants
Transmissivisme
Mathématiques/sciences
19
-,13727 ,79218
,05658
-,2488
-,02568
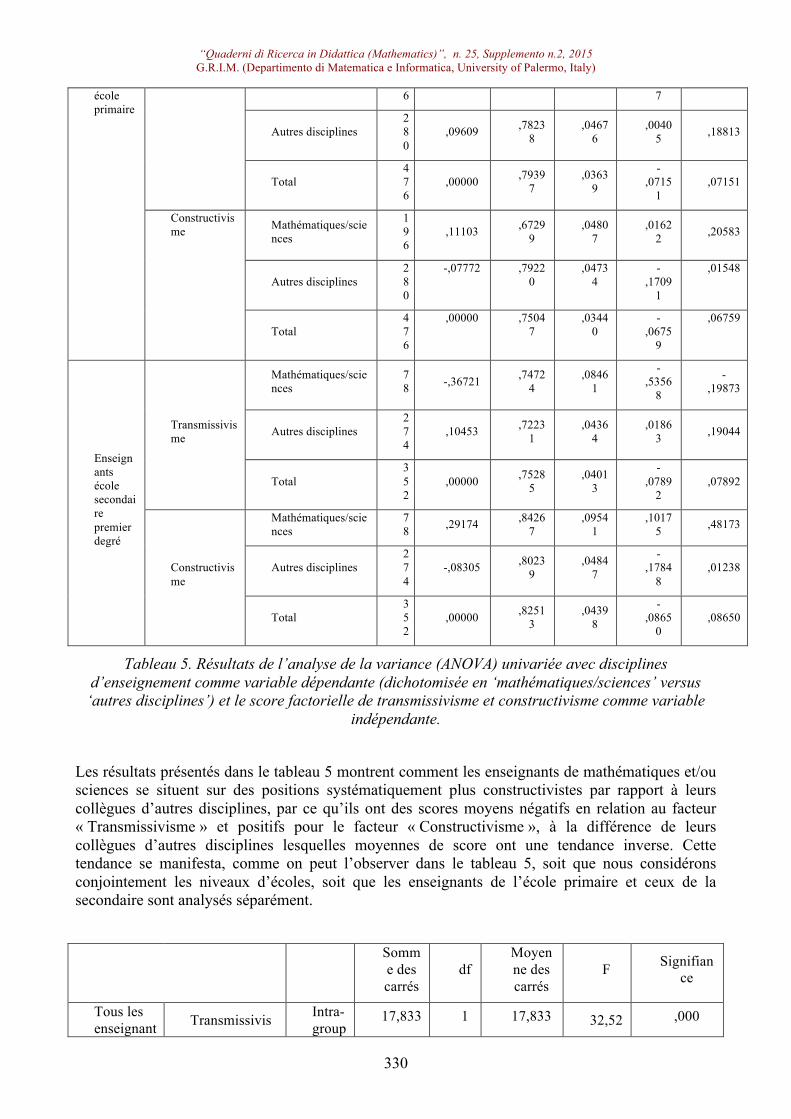
“Quaderni di Ricerca in Didattica (Mathematics)”, n. 25, Supplemento n.2, 2015 G.R.I.M. (Departimento di Matematica e Informatica, University of Palermo, Italy)
330
école primaire
6 7
Autres disciplines 280
,09609 ,78238
,04676
,00405 ,18813
Total 476
,00000 ,79397
,03639
-,0715
1 ,07151
Constructivisme Mathématiques/scie
nces
196
,11103 ,67299
,04807
,01622 ,20583
Autres disciplines 280
-,07772 ,79220
,04734
-,1709
1
,01548
Total 476
,00000 ,75047
,03440
-,0675
9
,06759
Enseignants école secondaire premier degré
Transmissivisme
Mathématiques/sciences
78 -,36721 ,7472
4 ,0846
1
-,5356
8
-,19873
Autres disciplines 274
,10453 ,72231
,04364
,01863 ,19044
Total 352
,00000 ,75285
,04013
-,0789
2 ,07892
Constructivisme
Mathématiques/sciences
78 ,29174 ,8426
7 ,0954
1 ,1017
5 ,48173
Autres disciplines 274
-,08305 ,80239
,04847
-,1784
8 ,01238
Total 352
,00000 ,82513
,04398
-,0865
0 ,08650
Tableau 5. Résultats de l’analyse de la variance (ANOVA) univariée avec disciplines d’enseignement comme variable dépendante (dichotomisée en ‘mathématiques/sciences’ versus
‘autres disciplines’) et le score factorielle de transmissivisme et constructivisme comme variable indépendante.
Les résultats présentés dans le tableau 5 montrent comment les enseignants de mathématiques et/ou sciences se situent sur des positions systématiquement plus constructivistes par rapport à leurs collègues d’autres disciplines, par ce qu’ils ont des scores moyens négatifs en relation au facteur « Transmissivisme » et positifs pour le facteur « Constructivisme », à la différence de leurs collègues d’autres disciplines lesquelles moyennes de score ont une tendance inverse. Cette tendance se manifesta, comme on peut l’observer dans le tableau 5, soit que nous considérons conjointement les niveaux d’écoles, soit que les enseignants de l’école primaire et ceux de la secondaire sont analysés séparément.
Somme des carrés
df Moyenne des carrés
F Signifiance
Tous les enseignant Transmissivis Intra-
group17,833 1 17,833 32,52 ,000
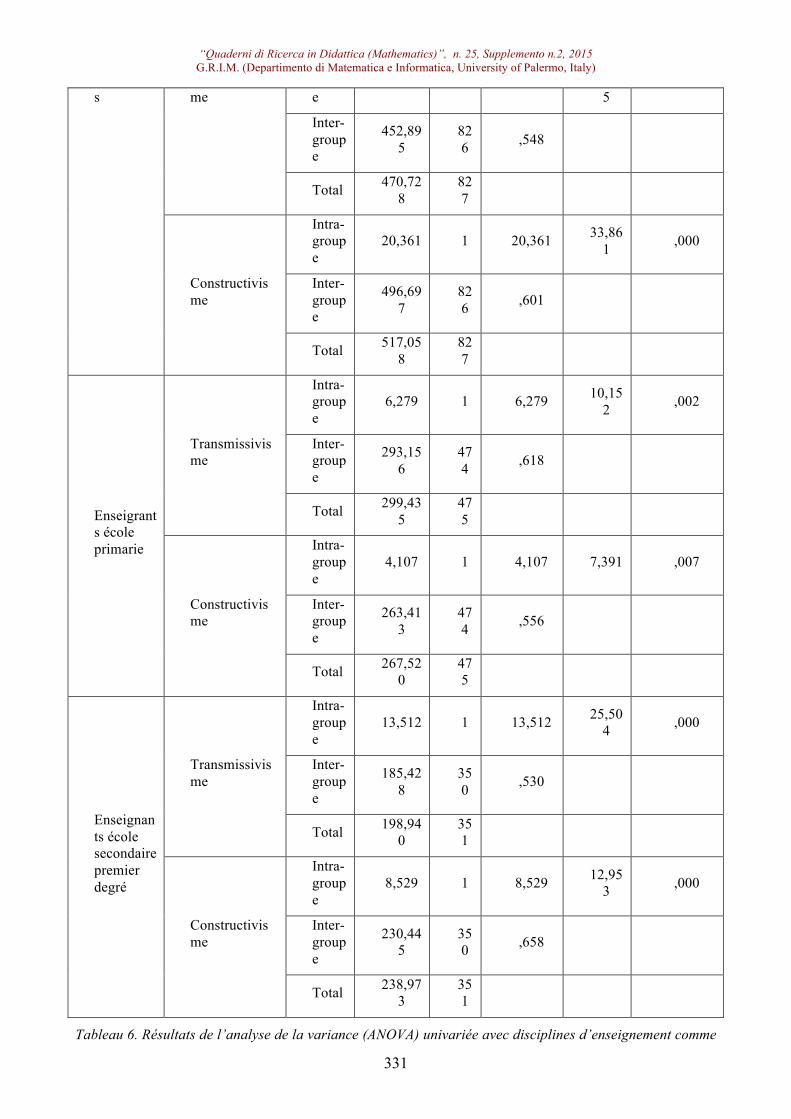
“Quaderni di Ricerca in Didattica (Mathematics)”, n. 25, Supplemento n.2, 2015 G.R.I.M. (Departimento di Matematica e Informatica, University of Palermo, Italy)
331
s me e 5 Inter-groupe
452,895
826 ,548
Total 470,728
827
Constructivisme
Intra-groupe
20,361 1 20,361 33,861 ,000
Inter-groupe
496,697
826 ,601
Total 517,058
827
Enseigrants école primarie
Transmissivisme
Intra-groupe
6,279 1 6,279 10,152 ,002
Inter-groupe
293,156
474 ,618
Total 299,435
475
Constructivisme
Intra-groupe
4,107 1 4,107 7,391 ,007
Inter-groupe
263,413
474 ,556
Total 267,520
475
Enseignants école secondaire premier degré
Transmissivisme
Intra-groupe
13,512 1 13,512 25,504 ,000
Inter-groupe
185,428
350 ,530
Total 198,940
351
Constructivisme
Intra-groupe
8,529 1 8,529 12,953 ,000
Inter-groupe
230,445
350 ,658
Total 238,973
351
Tableau 6. Résultats de l’analyse de la variance (ANOVA) univariée avec disciplines d’enseignement comme

“Quaderni di Ricerca in Didattica (Mathematics)”, n. 25, Supplemento n.2, 2015 G.R.I.M. (Departimento di Matematica e Informatica, University of Palermo, Italy)
332
variable dépendante (dichotomisée en ‘mathématiques/sciences’ versus ‘autres disciplines’) e la score factorielle de transmissivisme et constructivisme comme variable indépendante
L’orientation plus constructiviste des enseignants de mathématiques et/ou sciences, et en particulier ceux de l’école secondaire, où les caractéristiques disciplinaires sont plus significatives et stables, trouvée en Vallée d’Aoste ressemble à un résultat intéressant de la recherche PRISMA, pour plus dans le seul pays de l'OCDE qui, parmi ceux étudiés dans l'enquête TALIS, a présenté une prévalence d’orientations transmissives parmi les enseignants de l’école secondaire de premier degré (De Sanctis, 2010).
REFERENCES BIBLIOGRAPHIQUES Bramanti, D. (Ed.) (1998). Progettazione formativa e valutazione. Roma : Carocci. Calvani, A. (1998). Costruttivismo, progettazione didattica e tecnologie. In D. Bramanti (Ed.), Progettazione formativa e valutazione. Roma : Carrocci. De Sanctis, G. (2010). TALIS. I docenti italiani tra bisogni di crescita professionale e resistenze. Torino: Fondazione Giovanni Agnelli.
OCDE (2009a). TALIS 2008. Technical Report. Paris : OCDE. Repéré le 11 mars 2015 à www.oecd.org/education/school/44978960.pdf
OCDE (2009b). Creating Effective Teaching and Learning Environments: First Results from TALIS. Paris: OCDE. Repéré le 11 mars 2015 à www.oecd.org/dataoecd/17/51/43023606.pdf

“Quaderni di Ricerca in Didattica (Mathematics)”, n. 25, Supplemento n.2, 2015 G.R.I.M. (Departimento di Matematica e Informatica, University of Palermo, Italy)
333
A Pedagogical Coaching Design Focused on The Pedagogy of Questioning in Teaching Mathematics
Tiruwork Mulat Abraham Berman
[email protected] [email protected]
The Technion, Department of Mathematics, Haifa 3200003, Israel
Abstract: This study presents the impact of a pedagogical coaching designed for pre-service mathematics teachers, focusing on the pedagogy of questioning in teaching. The aim was to promote their understanding of why it is crucial to be knowledgeable about questions and questioning strategies, and to support them in developing skills to plan and pose quality and timely questions that encourage student thinking, effective classroom interaction and further learning. Using action research we examined the effectiveness of the design conducted within the context of their teaching practicum.
Résumé : Cette étude présente l'impact d'un encadrement pédagogique conçu pour les enseignants de mathématiques pré-service, en mettant l'accent sur la pédagogie du questionnement dans l'enseignement. L'objectif était de promouvoir leur compréhension des raisons pour lesquelles il est crucial d'être bien informés sur les questions et les stratégies d'interrogation, et de les aider à développer les compétences nécessaires pour planifier et poser des questions de qualité et en temps opportun qui encouragent la réflexion des élèves, l'interaction en classe efficace et plus d'apprentissage. Par la recherche-action, nous avons examiné l'efficacité de la conception menée dans le cadre de leur enseignement stage. Key words: mathematics, pedagogical coaching, practicum, pre-service, questioning
Introduction The teaching practicum plays a central role in teacher training programs. It fosters the pedagogical content knowledge (PCK) of pre-service teachers and helps in analyzing the effect of different theories through actual classroom observations preparing lessons, teaching and reflecting upon them. To this effect the college pedagogic supervisor plays an important role to facilitate the process and to support the development of student teachers, in order to maximize their professional gain from these practices. This role of the supervisor is too ambiguous and sometimes it can become complex in relation to school variables where the practicum is taking place, as well as in relation to the total number of practicum days that pre-service teachers are obliged to conduct throughout their training program. This number ranges between 25 and 90 days, depending on the type of the teacher education program in which each student teacher is enrolled at the college. The supervisor's effort to deal with the various pedagogical issues and mathematics knowledge for teaching, within the intensive individual and group conference sessions within the practicum raises a feeling of concern, inefficiency and discomfort, and the need for seeking new ideas and practices that may enhance her professional contribution to the pre service teachers. Accordingly, we plan a pilot study, focusing on a central pedagogical issue in relation to mathematics teaching and learning, and work on it with enough depth through a number of practicum days.
The pedagogy of questioning in the mathematics classroom One major aspect of any successful teaching and learning process is the interaction between the teacher and the students. It is argued that in order to have good classroom interaction, teachers should pose questions. Cotton (1998) found that in K-12 education, teachers’ methods of

“Quaderni di Ricerca in Didattica (Mathematics)”, n. 25, Supplemento n.2, 2015 G.R.I.M. (Departimento di Matematica e Informatica, University of Palermo, Italy)
334
questioning were the second most used teaching skill after lecturing. According to Schuster & Anderson (2005), good questions can set the stage for meaningful classroom discussion and learning, yet the power of questioning lies in answering. They contend that teachers not only need to ask good questions to obtain good answers; they also must ask good questions to promote the thinking required to provide good answers. Furthermore, research shows that the average wait time teachers allow students to generate response is one second or less (Rowe 1974), within which no one can expect students to understand a question, process it, and formulate a response. Cazden (2001) found that waiting at least three seconds helps students give longer, more elaborate, and better responses and with more evidence of learning; it encourages more questioning, and increases student-to-student and student-to-teacher interactions and engagement. Although teacher guides provide direction and questions to ask, the teacher must devise good questions that will enable students to learn. However, research shows that teachers receive little training on how to ask, what to ask, and when to ask questions, and how long they should wait after they pose a question. According to Martino and Maher (1994), developing effective questioning skills may take years to develop, for it requires an in-depth knowledge of both mathematics and children’s learning of mathematics. To this effect, the role of the pedagogic supervisors has become significant. In this study we designed a pedagogical coaching process to promote pre-service teachers' understanding of the pedagogy of questioning. We refer to the supervisors' role a coach rather than a supervisor, to highlight that there isn't any evaluation of performance (for grades) at any stage of the process with regard to this study as it seems to be in supervision. This approach encourages pre service teachers to collaborate and work better with the supervisor as a coach.
The research question What, if any, impact does pedagogical coaching focused on the pedagogy of questioning, have on the professional preparation of pre-service teachers? How effective was the design within the context of a teaching practicum?
Participants 13 pre-service teachers, who participated in a teaching practicum one day a week at two secondary schools in 2013-2014. All held relevant academic degrees and have work experience in other fields and enrolled in two different teacher education programs to prepare for secondary school mathematics teaching. 8 of them enrolled for a one year teaching certification program, and the other 5 were in their second and last year of their study, to earn a master degree of teaching (M Teach) secondary school mathematics.
Research methodology The research questions were approached through action research, which is a disciplined process of inquiry conducted by and intended for those taking the action (Sagor, 2000). Action research facilitates evaluation and reflection in order to implement changes needed in practice – both for an individual and within an institution. Martino and Maher (1994) stated that “The art of questioning may take years to develop for it requires an in-depth knowledge of both mathematics and children’s learning of mathematics.
Data sources Documents and protocols from the pedagogical coaching sessions conducted by the first author (underlined), who has been the pedagogical supervisor of the practicum, along with the professional guidance of the second author who is her post - doctoral mentor and reflective reports by the participating students. The pedagogical coaching design consisted of the following four processes:

“Quaderni di Ricerca in Didattica (Mathematics)”, n. 25, Supplemento n.2, 2015 G.R.I.M. (Departimento di Matematica e Informatica, University of Palermo, Italy)
335
1. Pedagogic workshops: whole-group discussions and exercises after reading relevant literature (mostly in Hebrew)i and watching videotaped lessons.
2. Pre-lesson conversations between the individual student teacher and the pedagogical supervisor, to assist lesson planning that include effective questions and questioning strategies.
3. Focused classroom observations that include recording the lesson and use rubrics to analyze questioning practices and their impact on student learning.
Post-lesson pedagogical conferences and conversations based on analyzing data from the classroom observations and the student teachers' reflective reports.
Research findings The findings here are based on data analyses collected from participants in at one of the two practicum schools. Various attempts made by the supervisor to implement the plan in the other school, where all of the participants were in the one year long teaching certification program showed unsatisfactory outcomes from the beginning. Their mathematics knowledge for teaching was not strong enough, and the focused coaching on questioning ended at its early stage.
Professional gains of the pre-service teachers from the focused coaching The focused coaching promoted pre-service teachers' understandings and perspectives regarding the different types of questions and the use of questioning in instruction. They used the pre-lesson conversations effectively to plan quality questions and basic follow-up and probing questions based on anticipating students' conceptions and potential responses to mathematical tasks. They learned about the importance of ''wait time'' in enhancing student thinking and participation. In their few instructional practices, the student teachers used the planned questions to engage students in mathematical thinking and in facilitating productive classroom mathematical discourse at higher cognitive levels. In one of their practicum lessons two pre-service teachers were encouraged to let their 7th grade students determine, what sign would the sum of any two integers with different signs have, after practicing addition using arrows on the number line. They realized that even the mathematically weak students are able to learn effectively and participate actively, when given opportunities to do so. They highlighted this in their conclusion using the quotation: “When you teach a child something you take away forever his chance of discovering it for himself.” (Piaget) They continued to pay attention and focus on questioning processes in classrooms and showed interest in further studying the topic. For example, two participants conducted a study on questioning by recording and analyzing their mentor's lessons in a 9th grade mathematics class. They summarized their experience and achievements:
Until now, we did not pay enough attention to the issue of asking questions such as what questions to ask and when to ask them. We learned about the importance and the amount of questions in class and how to respond to students in order to promote their thinking.
They also developed relevant knowledge and skills to characterize questions with respect to different cognitive levels and analyzed lessons from this viewpoint:
This study made us become aware of the impact of the rate structure for the questions that appear in it, about the types of questions that exist, which of them should be used and how much. We feel that we have been exposed to a new topic and learned about ways of promoting learning and class discussion.
Effectiveness of the design as a pedagogical supervision strategy The coaching design was found to be a productive pedagogical supervision strategy. Knowing the purpose and the emphasis of a specific supervision session based on consistent and relevant

“Quaderni di Ricerca in Didattica (Mathematics)”, n. 25, Supplemento n.2, 2015 G.R.I.M. (Departimento di Matematica e Informatica, University of Palermo, Italy)
336
readings enhanced the pre-service teachers' active participation and interest. When writing lesson plans, the pre-lesson conversations were found effective in assisting the student teachers think on how they can engage students in active learning during instruction. The classroom observations done with the help of well-defined guides and rubrics, made it easier to hold topic focused post lesson conversations and reflections, minimizing the tension that both the teacher and the pedagogical supervisor usually experience regarding such conversations. Furthermore, it allows collection and systematic documentation of data about what has been accomplished and also indicates how it affects the professional development of each pre-service teacher. However, it was difficult to assess whether there were significant changes in the instructional skills of the pre-service teachers because of the small number of lessons that they were allowed to teach in their classes.
Discussion and implication
Overall, the focused coaching design helped the pre-service teachers develop a better understanding of the role that questions and questioning strategies can play to achieve effective student thinking and learning. They learned relevant skills needed to characterize and analyze different types of questions, how to effectively use questioning, and the importance of wait time as a powerful teaching tool in mathematics classrooms. The study also highlighted the difficulties that hindered us in assessing possible changes regarding pre-service teachers' instructional practices; within the practicum context the pre-service teachers had few opportunities to teach whole-class lessons, thus we were not able to collect enough data to draw adequate conclusions. Furthermore, to develop effective questioning skills teachers need to have a deep knowledge of mathematics for teaching. Hence, we assume that a focused coaching design to improve instruction may be more effective for teachers, who teach lessons on a regular basis. REFERENCES
Cazden, C. B. 2001. Classroom discourse: The language of teaching and learning (2nd.ed). Portsmouth, NH: Heinemann. Cotton, K. 1998. Classroom questioning. North West Regional Educational Laboratory. Retrieved from: http://www.learner.org/workshops/socialstudies/pdf/session6/6.ClassroomQuestioning.pdfCotton (1998)
Martino, A. M., & Maher, C. A. (1994). Teacher questioning to stimulate justification and generalization in mathematics. New Orleans, LA: Paper presented at the Annual Meeting of the American Educational Research Association.
Rowe, M.B. (1974). Wait-time and rewards as instructional variables, their influence on language, logic and fate control: Parts I and II. Journal of Research in Science Teaching, 11, 81-84 and 291-308.
Sagor, R. (2000). Guiding school improvement with action research. Alexandria, VA: Association of Supervision and Curriculum Development.
Schuster, L. & Anderson, N. C. (2005). Good Questions for Math Teaching: Why Ask Them and What to Ask, Grades 5-8. Math Solutions Publications, Sausalito, CA.