Specific heat study of single crystalline Pr0.63 Ca0.37 MnO3 in presence of a magnetic field
20
arXiv:cond-mat/0105384v1 [cond-mat.str-el] 20 May 2001 Specific heat study of single crystalline Pr 0.63 Ca 0.37 MnO 3 in presence of a magnetic field A.K.Raychaudhuri † and Ayan Guha Department of Physics, Indian Institute of Science, Bangalore 560 012, India I.Das and R. Rawat Inter University Consortium for DAE facilities, University Campus, Khandwa Road, Indore- 452017, India C.N.R. Rao CSIR Center of Excellence in Chemistry, Jawaharlal Nehru Center for Advanced Scientific Research, Jakkur P.O., Bangalore 560 064, India (February 1, 2008) We present the results of a study of specific heat on a single crystal of Pr0.63 Ca0.37 MnO3 performed over a temperature range 3K-300K in presence of 0 and 8T magnetic fields. An estimate of the entropy and latent heat in a magnetic field at the first order charge ordering (CO) transition is presented. The total entropy change at the CO transition which is ≈ 1.8 J/mol K at 0T, decreases to ∼ 1.5 J/mol K in presence of 8T magnetic field. Our measurements enable us to estimate the latent heat LCO ≈ 235 J/mol involved in the CO transition. Since the entropy of the ferromagnetic metallic (FMM) state is comparable to that of the charge-ordered insulating (COI) state, a subtle change in entropy stabilises either of these two states. Our low temperature specific heat measurements reveal that the linear term is absent in 0T and surprisingly not seen even in the metallic FMM state. 75.30.Kz 65.40.+g 75.30.Vn The discovery of a number of fascinating properties like colossal magneto- resistance, charge / orbital order- ing and electronic phase separation in manganites with generalized formula Re 1-x Ae x MnO 3 (Re being a triva- lent rare-earth ion, Ae a divalent alkaline earth element) has resulted in a spurt of research activities [1,2]. For certain values of x, close to 0.5, these manganites undergo a first order transition at certain temperature T CO to a Charge Ordered Insulating (COI) state where the Mn 3+ and Mn 4+ species arrange themselves in a commensu- rate order in the lattice. The charge ordering transition in these oxides is accompanied by a large change in vol- ume and hysteresis in resistivity and is believed to be a first order transition. A fascinating aspect of the COI state (which is also accompanied by orbital ordering) is that it is unstable under an applied magnetic field and there is an insulator- metal transition (melting) of the COI state to a ferromagnetic metal state (FMM) below a temperature T MH . In this paper we have investigated the specific heat and related thermodynamic quantities in a single crystalline CO system over a wide temperature range (3K<T< 300K) and in a magnetic field upto 8T which can melt the CO order. A study of specific heat over an extensive temperature range is crucial in understanding the nature of the CO transition and in addition it can provide values of various fundamental parameters of manganites like the density of states at the Fermi level N (E F ), the Debye temperature θ D , ferromagnetic / antiferromagnetic spin wave stiffness constant etc. Measurements of specific heat in manganites particu- larly with CMR composition has been reported before, particularly in the low temperature region. In the CO systems there are reports of specific heat measurements both in single and polycrystalline samples mainly at low temperatures. Specific heat measurements in CO sys- tems near T CO have been done in polycrystalline samples and no magnetic field data have been reported. There exists no data on thermodynamics associated with the transition at T MH . The charge ordering transition in these oxides is be- lieved to be a first order transition, as mentioned before. Measurements across the CO transition should therefore show a discontinuous jump in entropy as the compound absorbs latent heat from the bath to transform to a new phase. However, till date there exists no proof from calorimetry that the transitions are indeed first order and whether a latent heat is released at the transition. There has been no calorimetric investigation of the melting of COI state to a FMM state, the transition which is also believed to be a first order transition. In this paper we investigate this fundamental issues related to changes in entropy and latent heat across the charge-ordering transition near T CO and T MH in a single- crystal of Pr 0.63 Ca 0.37 MnO 3 . Pr 1-x Ca x MnO 3 happens to be a prototypical and perhaps the most studied charge- ordered system. Due to its low tolerance factor it re- mains insulating for all values of x. For x =0.37 com- position, charge and orbital ordering occurs at T CO (≈ 235K), while a long range AFM order sets in only below T N (≈ 170K). A small ferromagnetic component appears with the canting of AFM spins at a lower temperature, T CA (≈ 30K). Though there have been a number of studies on low 1
-
Upload
independent -
Category
Documents
-
view
2 -
download
0
Transcript of Specific heat study of single crystalline Pr0.63 Ca0.37 MnO3 in presence of a magnetic field

arX
iv:c
ond-
mat
/010
5384
v1 [
cond
-mat
.str
-el]
20
May
200
1
Specific heat study of single crystalline Pr0.63 Ca0.37 MnO3 in presence of a
magnetic field
A.K.Raychaudhuri † and Ayan GuhaDepartment of Physics, Indian Institute of Science, Bangalore 560 012, India
I.Das and R. RawatInter University Consortium for DAE facilities, University Campus, Khandwa Road, Indore- 452017, India
C.N.R. RaoCSIR Center of Excellence in Chemistry, Jawaharlal Nehru Center for Advanced Scientific Research, Jakkur P.O.,
Bangalore 560 064, India
(February 1, 2008)
We present the results of a study of specific heat on a single crystal of Pr0.63Ca0.37MnO3 performedover a temperature range 3K-300K in presence of 0 and 8T magnetic fields. An estimate of theentropy and latent heat in a magnetic field at the first order charge ordering (CO) transition ispresented. The total entropy change at the CO transition which is ≈ 1.8 J/mol K at 0T, decreasesto ∼ 1.5 J/mol K in presence of 8T magnetic field. Our measurements enable us to estimate the latentheat LCO ≈ 235 J/mol involved in the CO transition. Since the entropy of the ferromagnetic metallic(FMM) state is comparable to that of the charge-ordered insulating (COI) state, a subtle change inentropy stabilises either of these two states. Our low temperature specific heat measurements revealthat the linear term is absent in 0T and surprisingly not seen even in the metallic FMM state.
75.30.Kz 65.40.+g 75.30.Vn
The discovery of a number of fascinating propertieslike colossal magneto- resistance, charge / orbital order-ing and electronic phase separation in manganites withgeneralized formula Re1−xAexMnO3 (Re being a triva-lent rare-earth ion, Ae a divalent alkaline earth element)has resulted in a spurt of research activities [1,2]. Forcertain values of x, close to 0.5, these manganites undergoa first order transition at certain temperature TCO to aCharge Ordered Insulating (COI) state where the Mn3+
and Mn4+ species arrange themselves in a commensu-rate order in the lattice. The charge ordering transitionin these oxides is accompanied by a large change in vol-ume and hysteresis in resistivity and is believed to be afirst order transition. A fascinating aspect of the COIstate (which is also accompanied by orbital ordering) isthat it is unstable under an applied magnetic field andthere is an insulator- metal transition (melting) of theCOI state to a ferromagnetic metal state (FMM) belowa temperature TMH .
In this paper we have investigated the specific heat andrelated thermodynamic quantities in a single crystallineCO system over a wide temperature range (3K < T <300K) and in a magnetic field upto 8T which can meltthe CO order. A study of specific heat over an extensivetemperature range is crucial in understanding the natureof the CO transition and in addition it can provide valuesof various fundamental parameters of manganites like thedensity of states at the Fermi level N(EF ), the Debyetemperature θD, ferromagnetic / antiferromagnetic spinwave stiffness constant etc.
Measurements of specific heat in manganites particu-larly with CMR composition has been reported before,
particularly in the low temperature region. In the COsystems there are reports of specific heat measurementsboth in single and polycrystalline samples mainly at lowtemperatures. Specific heat measurements in CO sys-tems near TCO have been done in polycrystalline samplesand no magnetic field data have been reported. Thereexists no data on thermodynamics associated with thetransition at TMH .
The charge ordering transition in these oxides is be-lieved to be a first order transition, as mentioned before.Measurements across the CO transition should thereforeshow a discontinuous jump in entropy as the compoundabsorbs latent heat from the bath to transform to a newphase. However, till date there exists no proof fromcalorimetry that the transitions are indeed first order andwhether a latent heat is released at the transition. Therehas been no calorimetric investigation of the melting ofCOI state to a FMM state, the transition which is alsobelieved to be a first order transition.
In this paper we investigate this fundamental issuesrelated to changes in entropy and latent heat across thecharge-ordering transition near TCO and TMH in a single-crystal of Pr0.63Ca0.37MnO3. Pr1−x CaxMnO3 happensto be a prototypical and perhaps the most studied charge-ordered system. Due to its low tolerance factor it re-mains insulating for all values of x. For x = 0.37 com-position, charge and orbital ordering occurs at TCO (≈235K), while a long range AFM order sets in only belowTN (≈ 170K). A small ferromagnetic component appearswith the canting of AFM spins at a lower temperature,TCA (≈ 30K).
Though there have been a number of studies on low
1

temperature specific heat of this particular system (T <20K), a clear picture is yet to be emerge on the presence(or absence) of a linear term in specific heat. Recentlythere have been reports of large linear contribution tospecific heat and appearance of excess specific heat asso-ciated with charge ordering [3] in this system. Since sucha linear term is often associated with a electronic contri-bution to the specific heat, appearance of this term in aninsulating sample is intriguing. In this paper, we havealso investigated the low temperature region and reachedcertain definite conclusions about the linear term.
In our experiments we have specifically asked the fol-lowing questions:
1. Is it possible to identify the relevant transitions inzero and finite magnetic fields through calorimetricmeasurements ?
2. What latent heat is released and the entropy changeacross the first order transitions, one at TCO in zeromagnetic field and the other at TMH in 8T mag-netic field ?
3. When the FMM state is obtained from the COIstate in presence of a magnetic field, do we obtaina linear term (arising from electronic contribution)in the specific heat ?
4. Do we see a linear term in specific heat in COI stateas reported by some investigators ?
The remainder of the paper is divided into two prin-cipal sections. In the first section after the experimentalsection, we present and discuss the experimental data inthe region T ≥ 50K which essentially encompasses theregion where most of the transition occurs and this alsohappens to be the region where no experimental datahave been reported in the past either in presence of mag-netic field or in a single crystal. The second major sectionrefers to the data at low temperatures where issues likelinear term in the heat capacity, the Debye term, spinwave contributions etc. are looked into. In this regionthere are past studies , as mentioned earlier and we com-pare our results on these material with results from otherCO systems.
I. EXPERIMENTAL
The crystal used in our experiment has been grown byfloat zone technique and has been used in a number ofprevious experiments by our group [5,6]. The resistiv-ity (ρ) vs. T curve in zero field and in a field of H =8T are shown in fig. 1. The COI state can be meltedto a FMM state by application of a magnetic field of 8Tat TMH ≈ 90K. In presence of magnetic field the regionTMH < T < TCO is termed as “mixed charge order”(MCO) region, where the COI phase coexist with the
FMM phase. We have used a semi-adiabatic heat pulsetechnique to measure the specific heat in a wide temper-ature range of 2K - 300K and in 0T and 8T magneticfields.
II. SPECIFIC HEAT AT HIGH (T ≥ 50K)
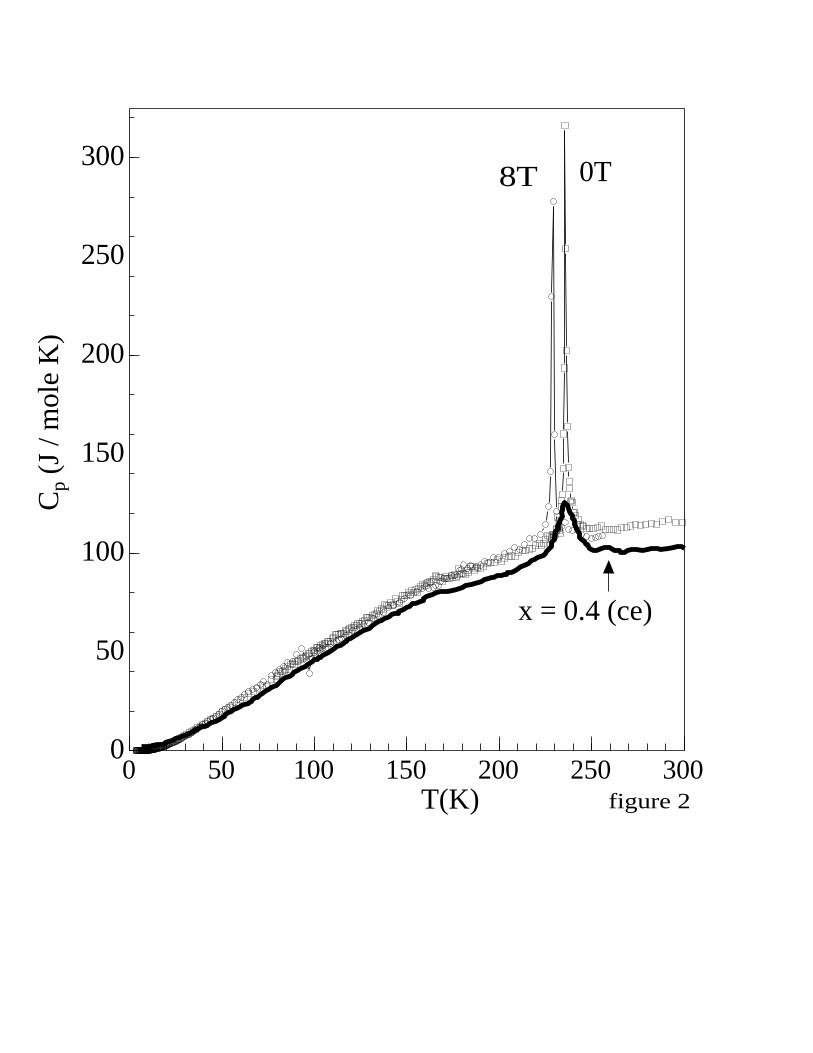
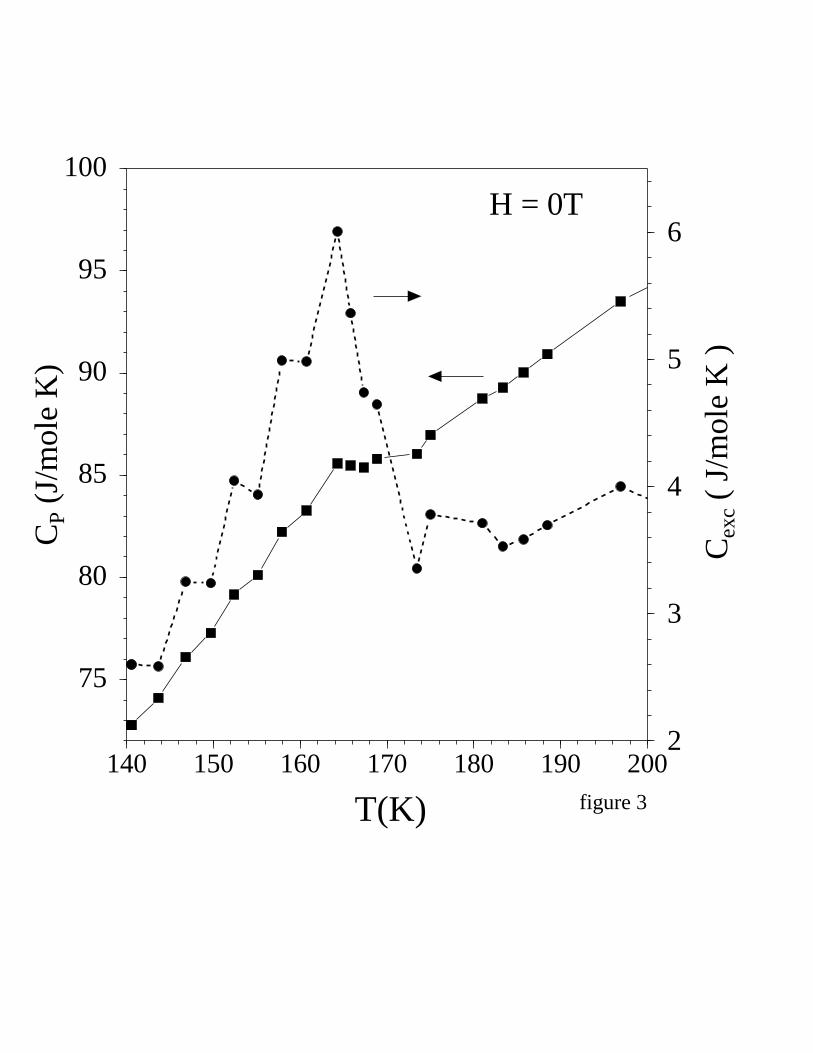
In figure 2 we show the specific heat (Cp) data overan extended temperature range 3K - 300K for both 0and 8T. The most prominent feature is the sharp peakat TCO both for H = 0 and 8T. The peak is much largerand sharper compared to that seen in polycrystalline ma-terials [4](which is also plotted in the same graph). Thepeak at TCO retains its narrowness and sharpness at H= 8T while it shifts to lower T with dTCO/dT ≈ -1K/T.In figure 3 we show the region close to TN . The graphshows the actual observed step like feature in Cp (atH = 0T) at TN . In the same graph we show the Cexc
after subtraction of the lattice contribution (the proce-dure for subtraction of the lattice contribution is givenin the next sub-section). A peak in Cexc ≈ 6J/moleKat TN is visible. This feature is suppressed by appli-cation of a magnetic field of 8T. The entropy change,∆Sexc(TN ), associated with this transition has been es-timated to be ≈ 0.5 − 0.8J/mole.K. Lee et. al. [4]reported for Pr0.6Ca0.4MnO3(polycrystal) ∆Sexc(TN )≈ 0.6J/mole K at TN =160K. Ramirez et.al. [7] forLa0.35Ca0.65MnO3(polycrystal) obtained ∆Sexc(TN) ≈
1J/moleK. It can be seen that all these are much lessthan that what one would expect from a complete spinordering. The calorimetry data therefore points towardsan incomplete spin ordering at TN .
Another very interesting feature in our calorimetrydata is a clear signature of the magnetic field inducedtransition at TMH ≈78K (see fig. 2 and 9). This smallyet distinct feature, discussed in detail later on, is thefirst signature of field-induced melting in a calorimetryexperiment.
A. Estimation of the Lattice contribution
In this subsection we describe the procedure to esti-mate the lattice contribution to specific heat, the back-ground on which the specific heat contribution by theother degrees of freedom add up. Proper estimation ofthe lattice contribution will thus allow us to get the con-tribution of CO and magnetic ordering to Cp. We defineCexc as :
Cexc = Cp − Clattice (1)
According to Dulong and Petit’s law, the limiting heatcapacity at high temperature for a compound with ratoms per molecule is expected to be 3rR, where R is the
2
gas constant [13]. In our case (r = 5) this limiting valueof the lattice (vibrational) heat capacity turns out to be ≈125 J / mole K. From our data we find that at T = 300K,observed Cp is ≈ 90% of the Dulong Petit value. For mostpublished data on manganites, Cp at room temperaturereaches this value ∼ 100 -120 J / mole K. This signifiesthat bulk of the contribution indeed comes from the vi-brational heat capacity in this temperature range. Thiscontribution must be subtracted from the observed datato obtain the excess specific heat.
We have obtained the lattice contribution Clattice byfitting Cp in a region 40K ≤ T ≤ 150K using three stan-dard models as described below. The calculated Clattice
is then extrapolated to T > 150K. Since, we are in-terested in Cp in the range 80K - 300K, the lower tem-perature for lattice contribution has been limited onlyto 40K. The upper limit of 150K was considered sinceit was lower than the AFM and CO transition tempera-tures. We have not estimated the background by includ-ing the data about TCO. We are of the opinion that thereis structural transition/ modification associated with theCO transition . As a result it is not advisable to includethe data above TCO in the estimation of lattice heat ca-pacity below TCO.
The following models were used for estimating thebackground lattice contribution :The Einstein model [13]:CEinstein = 3rR
∑i ai[xi
2exi/(exi − 1)2] ; where xi =hνE/KBTi. In this model, all the 3rN independent oscil-lators populate three optical modes in ratios a1 : a2 : a3
having Einstein frequencies hνEi. The best fit to the data
is given the three Einstein modes with hν/KB = 145 K,410 K and 625 K. It is interesting to note that a recentRaman measurement on x = 0.37 composition observedoptical modes at ≈ 360 K, 417 K, and 648 K. The 417Kand 648K modes nicely matches with those seen in ourspecific heat measurements. [14]The Debye model [13]:CDebye = 9rR/x3
D
∫ xD
0x4
DexD/(exD − 1)2dxD ; wherexD = hνD/KBT . The specific heat is due to collectivelow-frequency oscillations of phonons with a cut off fre-quency given by hνD/KB. For our sample, the best fitwas obtained with θD = 470K. This is typically the valueof θD seen in most oxides.The Thirring model [15]:CThirring = 3rR
∑∞
n=0Bnu−n ; where u = [(T/Tb)
2 + 1]The harmonic portion of the lattice specific heat canbe expressed in a series with the above form whereTb ≈ θD/2π [17]. The above expansion permits theharmonic portion of the lattice specific heat to be fit-ted reasonably well down to temperatures ∼ 50K evenwhen the Debye temperature is ∼ 500K. In our case,Tb = 65K and we used n upto 50. The Tb gives an esti-mated θD ≈ 410K, which is close to that obtained fromfitting the data with Debye model.
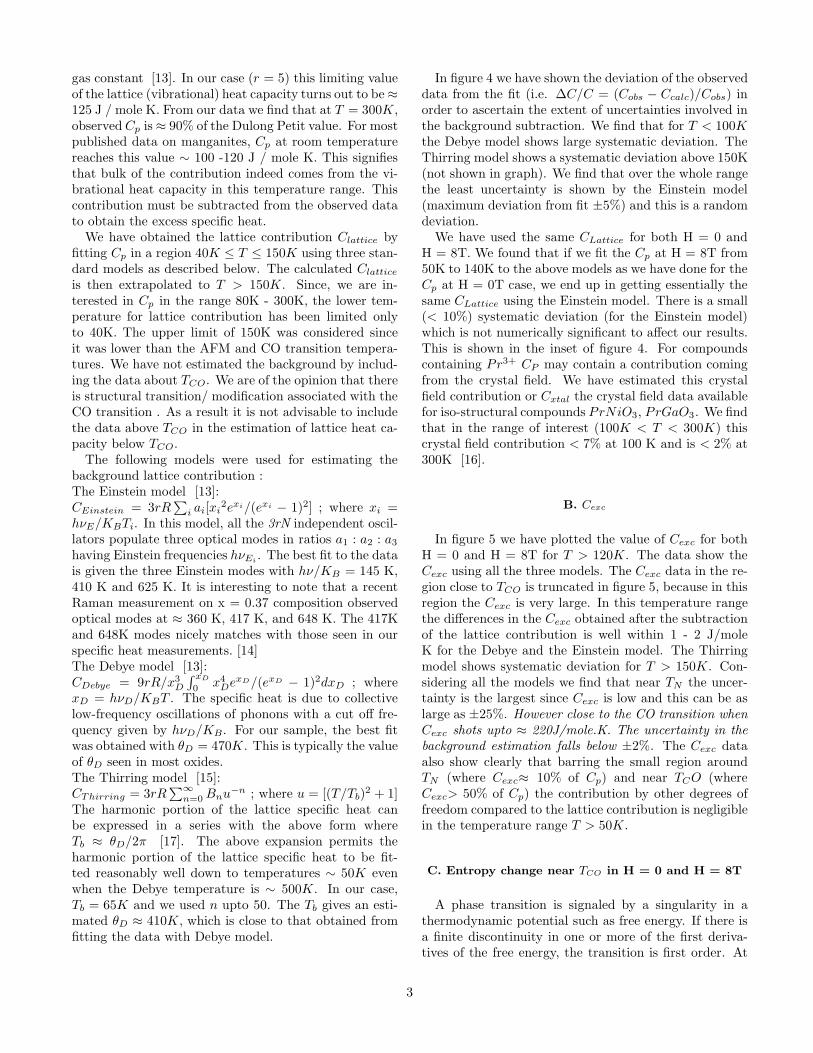
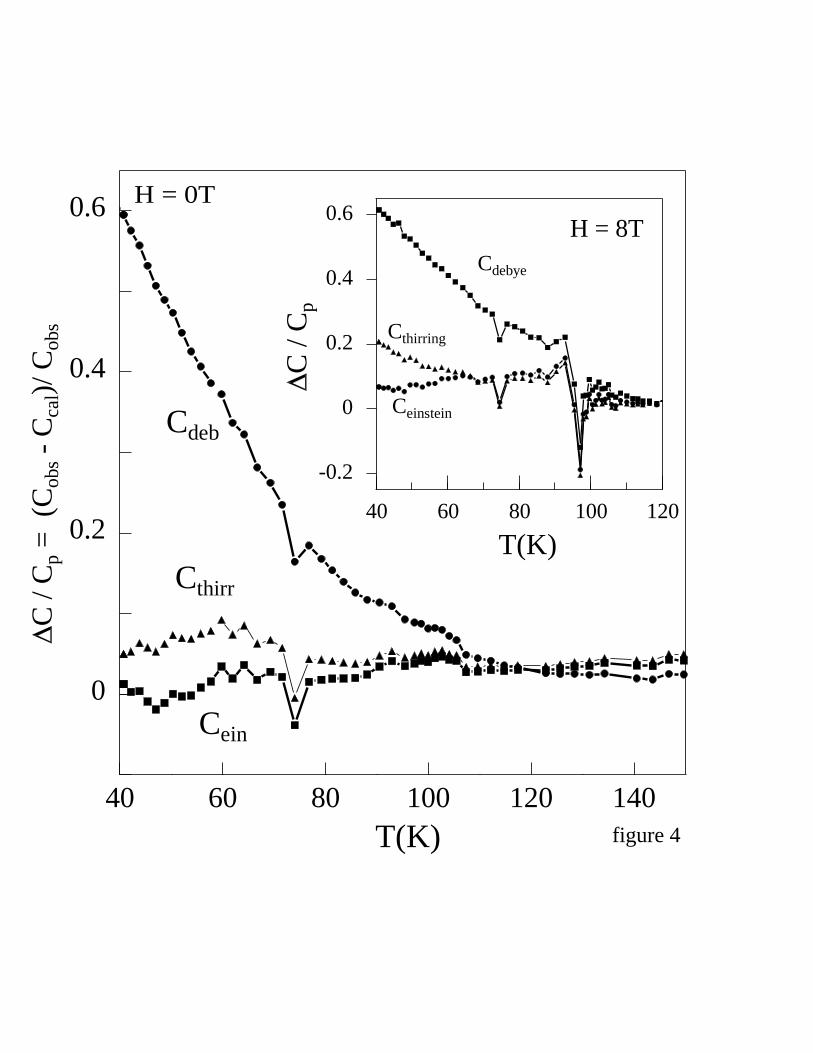
In figure 4 we have shown the deviation of the observeddata from the fit (i.e. ∆C/C = (Cobs − Ccalc)/Cobs) inorder to ascertain the extent of uncertainties involved inthe background subtraction. We find that for T < 100Kthe Debye model shows large systematic deviation. TheThirring model shows a systematic deviation above 150K(not shown in graph). We find that over the whole rangethe least uncertainty is shown by the Einstein model(maximum deviation from fit ±5%) and this is a randomdeviation.
We have used the same CLattice for both H = 0 andH = 8T. We found that if we fit the Cp at H = 8T from50K to 140K to the above models as we have done for theCp at H = 0T case, we end up in getting essentially thesame CLattice using the Einstein model. There is a small(< 10%) systematic deviation (for the Einstein model)which is not numerically significant to affect our results.This is shown in the inset of figure 4. For compoundscontaining Pr3+ CP may contain a contribution comingfrom the crystal field. We have estimated this crystalfield contribution or Cxtal the crystal field data availablefor iso-structural compounds PrNiO3, PrGaO3. We findthat in the range of interest (100K < T < 300K) thiscrystal field contribution < 7% at 100 K and is < 2% at300K [16].
B. Cexc
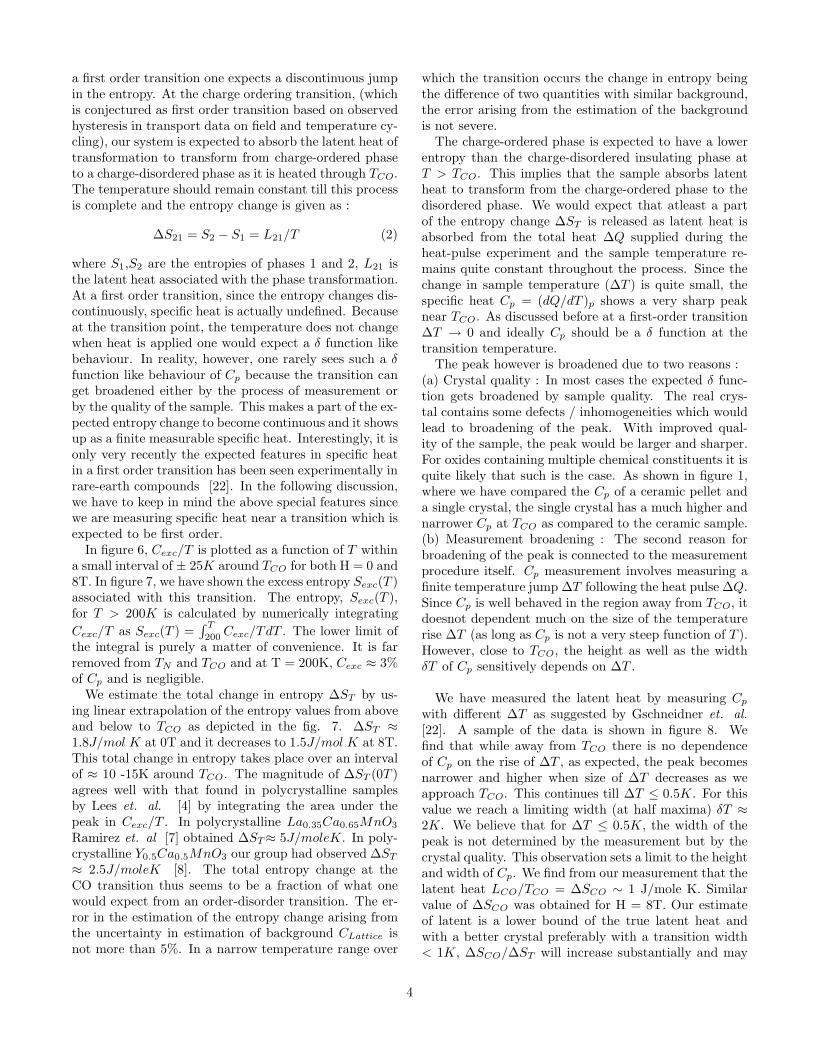
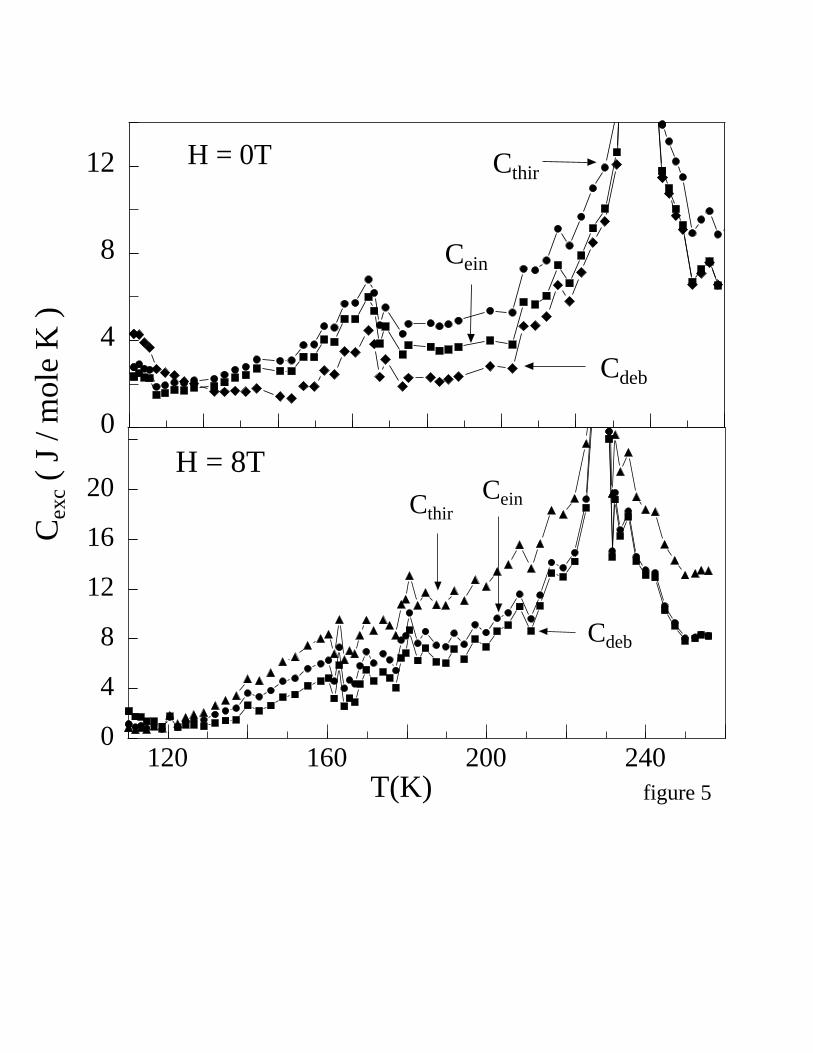
In figure 5 we have plotted the value of Cexc for bothH = 0 and H = 8T for T > 120K. The data show theCexc using all the three models. The Cexc data in the re-gion close to TCO is truncated in figure 5, because in thisregion the Cexc is very large. In this temperature rangethe differences in the Cexc obtained after the subtractionof the lattice contribution is well within 1 - 2 J/moleK for the Debye and the Einstein model. The Thirringmodel shows systematic deviation for T > 150K. Con-sidering all the models we find that near TN the uncer-tainty is the largest since Cexc is low and this can be aslarge as ±25%. However close to the CO transition whenCexc shots upto ≈ 220J/mole.K. The uncertainty in thebackground estimation falls below ±2%. The Cexc dataalso show clearly that barring the small region aroundTN (where Cexc≈ 10% of Cp) and near TCO (whereCexc> 50% of Cp) the contribution by other degrees offreedom compared to the lattice contribution is negligiblein the temperature range T > 50K.
C. Entropy change near TCO in H = 0 and H = 8T
A phase transition is signaled by a singularity in athermodynamic potential such as free energy. If there isa finite discontinuity in one or more of the first deriva-tives of the free energy, the transition is first order. At
3
a first order transition one expects a discontinuous jumpin the entropy. At the charge ordering transition, (whichis conjectured as first order transition based on observedhysteresis in transport data on field and temperature cy-cling), our system is expected to absorb the latent heat oftransformation to transform from charge-ordered phaseto a charge-disordered phase as it is heated through TCO.The temperature should remain constant till this processis complete and the entropy change is given as :
∆S21 = S2 − S1 = L21/T (2)
where S1,S2 are the entropies of phases 1 and 2, L21 isthe latent heat associated with the phase transformation.At a first order transition, since the entropy changes dis-continuously, specific heat is actually undefined. Becauseat the transition point, the temperature does not changewhen heat is applied one would expect a δ function likebehaviour. In reality, however, one rarely sees such a δfunction like behaviour of Cp because the transition canget broadened either by the process of measurement orby the quality of the sample. This makes a part of the ex-pected entropy change to become continuous and it showsup as a finite measurable specific heat. Interestingly, it isonly very recently the expected features in specific heatin a first order transition has been seen experimentally inrare-earth compounds [22]. In the following discussion,we have to keep in mind the above special features sincewe are measuring specific heat near a transition which isexpected to be first order.
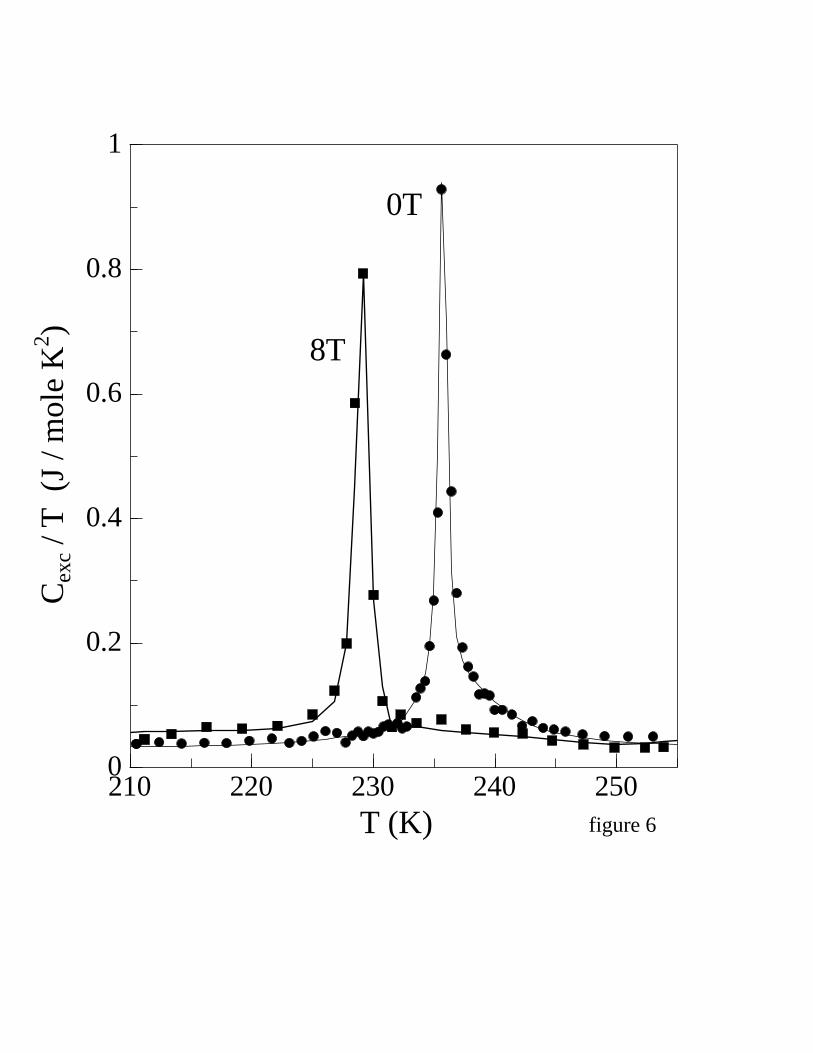
In figure 6, Cexc/T is plotted as a function of T withina small interval of ± 25K around TCO for both H = 0 and8T. In figure 7, we have shown the excess entropy Sexc(T )associated with this transition. The entropy, Sexc(T ),for T > 200K is calculated by numerically integrating
Cexc/T as Sexc(T ) =∫ T
200Cexc/TdT . The lower limit of
the integral is purely a matter of convenience. It is farremoved from TN and TCO and at T = 200K, Cexc ≈ 3%of Cp and is negligible.
We estimate the total change in entropy ∆ST by us-ing linear extrapolation of the entropy values from aboveand below to TCO as depicted in the fig. 7. ∆ST ≈
1.8J/mol K at 0T and it decreases to 1.5J/mol K at 8T.This total change in entropy takes place over an intervalof ≈ 10 -15K around TCO. The magnitude of ∆ST (0T )agrees well with that found in polycrystalline samplesby Lees et. al. [4] by integrating the area under thepeak in Cexc/T . In polycrystalline La0.35Ca0.65MnO3
Ramirez et. al [7] obtained ∆ST≈ 5J/moleK. In poly-crystalline Y0.5Ca0.5MnO3 our group had observed ∆ST
≈ 2.5J/moleK [8]. The total entropy change at theCO transition thus seems to be a fraction of what onewould expect from an order-disorder transition. The er-ror in the estimation of the entropy change arising fromthe uncertainty in estimation of background CLattice isnot more than 5%. In a narrow temperature range over
which the transition occurs the change in entropy beingthe difference of two quantities with similar background,the error arising from the estimation of the backgroundis not severe.
The charge-ordered phase is expected to have a lowerentropy than the charge-disordered insulating phase atT > TCO. This implies that the sample absorbs latentheat to transform from the charge-ordered phase to thedisordered phase. We would expect that atleast a partof the entropy change ∆ST is released as latent heat isabsorbed from the total heat ∆Q supplied during theheat-pulse experiment and the sample temperature re-mains quite constant throughout the process. Since thechange in sample temperature (∆T ) is quite small, thespecific heat Cp = (dQ/dT )p shows a very sharp peaknear TCO. As discussed before at a first-order transition∆T → 0 and ideally Cp should be a δ function at thetransition temperature.
The peak however is broadened due to two reasons :(a) Crystal quality : In most cases the expected δ func-tion gets broadened by sample quality. The real crys-tal contains some defects / inhomogeneities which wouldlead to broadening of the peak. With improved qual-ity of the sample, the peak would be larger and sharper.For oxides containing multiple chemical constituents it isquite likely that such is the case. As shown in figure 1,where we have compared the Cp of a ceramic pellet anda single crystal, the single crystal has a much higher andnarrower Cp at TCO as compared to the ceramic sample.(b) Measurement broadening : The second reason forbroadening of the peak is connected to the measurementprocedure itself. Cp measurement involves measuring afinite temperature jump ∆T following the heat pulse ∆Q.Since Cp is well behaved in the region away from TCO, itdoesnot dependent much on the size of the temperaturerise ∆T (as long as Cp is not a very steep function of T ).However, close to TCO, the height as well as the widthδT of Cp sensitively depends on ∆T .
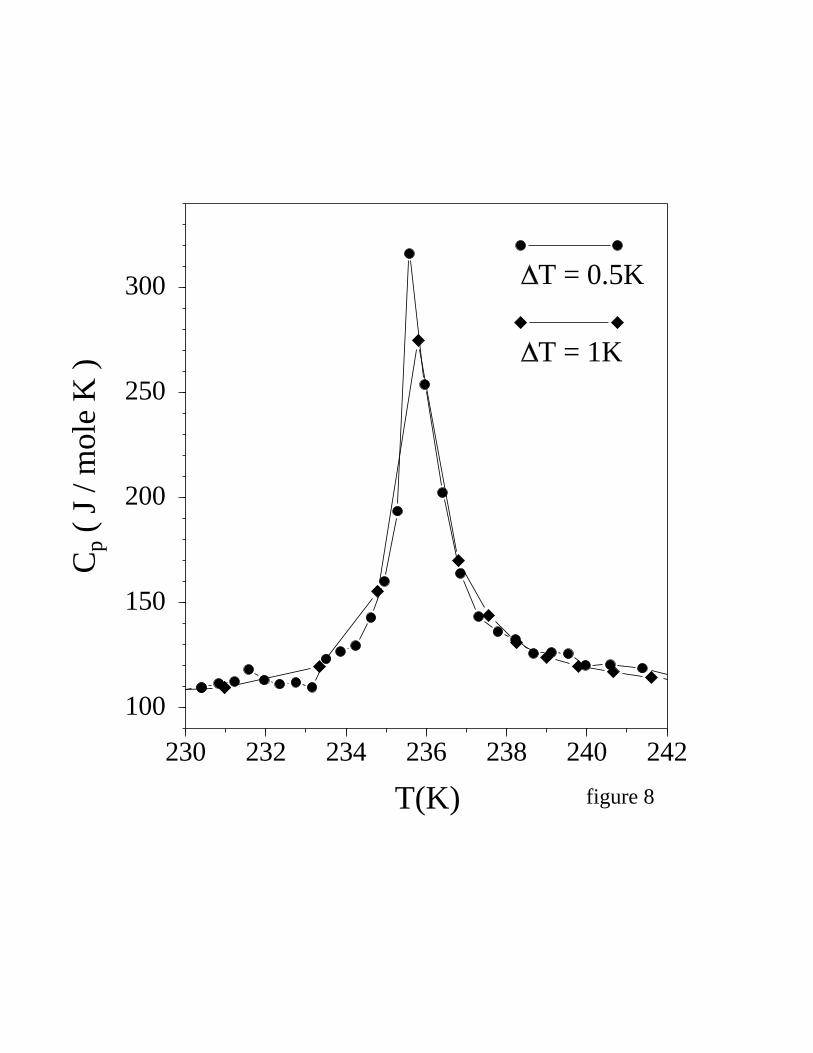
We have measured the latent heat by measuring Cp
with different ∆T as suggested by Gschneidner et. al.[22]. A sample of the data is shown in figure 8. Wefind that while away from TCO there is no dependenceof Cp on the rise of ∆T , as expected, the peak becomesnarrower and higher when size of ∆T decreases as weapproach TCO. This continues till ∆T ≤ 0.5K. For thisvalue we reach a limiting width (at half maxima) δT ≈
2K. We believe that for ∆T ≤ 0.5K, the width of thepeak is not determined by the measurement but by thecrystal quality. This observation sets a limit to the heightand width of Cp. We find from our measurement that thelatent heat LCO/TCO = ∆SCO ∼ 1 J/mole K. Similarvalue of ∆SCO was obtained for H = 8T. Our estimateof latent is a lower bound of the true latent heat andwith a better crystal preferably with a transition width< 1K, ∆SCO/∆ST will increase substantially and may
4
even → 1, as expected for a strong first order transition.We note that such a narrow peak might arise from a verynarrow second order transition that has been broadenedby defects or inhomogeneities. However we find that theapplied field shifts the position of the peak but doesnotappreciably broaden the peak. This we take as a proofof a first order transition at TCO [23].
D. Entropy change near TMH in 8T
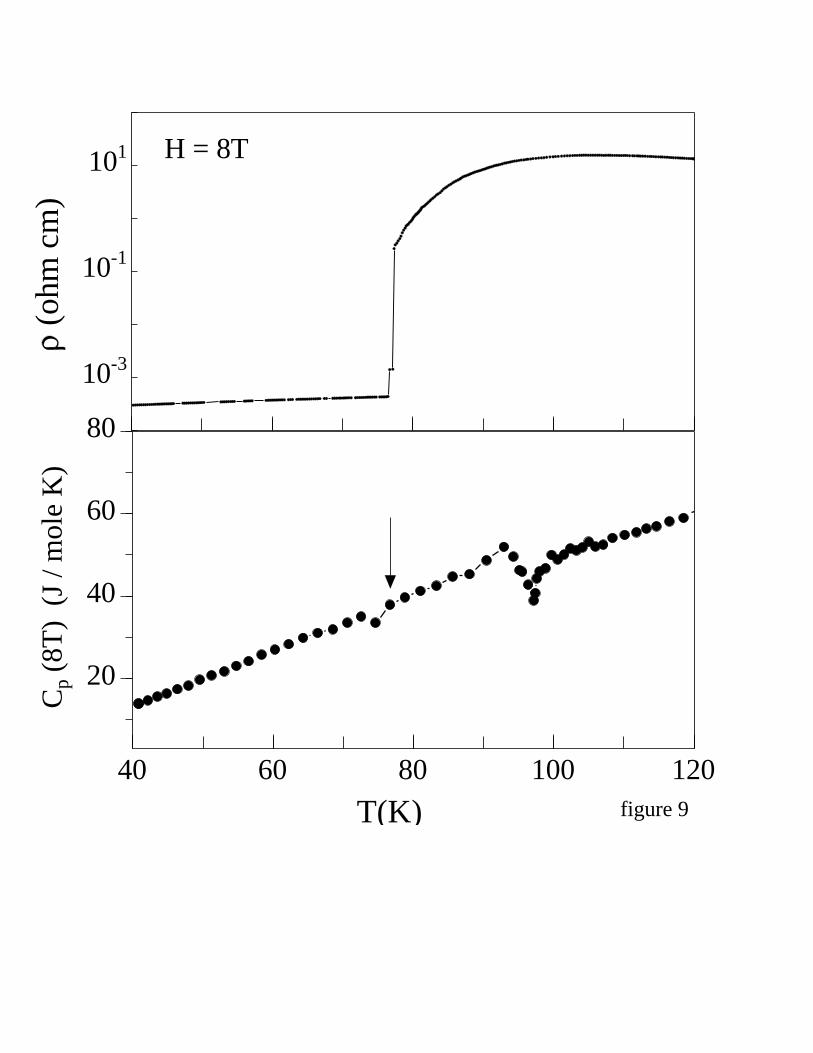
In a field of 8T the low temperature phase is an FMMor a spin-aligned metal, allowing for spin canting. Butthe phase is metallic as can be seen from figure 1. Onheating, the FMM state (8T) becomes unstable towardsthe COI state formation and makes transition to themixed charge ordered (MCO) state at TMH . This is ac-companied by a jump in ρ. We would like to ask if thereis a change in entropy associated with the melting of theCOI state to FMM state at TMH ? This question is inter-esting because both the phases have ordering of a kind,in addition the FMM phase is expected to have extra en-tropy due to presence of free electrons. A close look atthe region T ≈ 95K, as shown in figure 9, shows a smalldip in Cp which as explained below can be considered assignature of this melting. It is important to note that, asexpected in zero field, this feature is absent. As shownin fig. 9, Cp(8T) starts to show change at T = TMH ≈
88K where ρ shows a jump on heating and the specificheat transition is complete at 100K after a small dip inCp, where the resistivity transition also stops.
The small dip in Cp is associated with a small heatrelease of ≈ 10J/mole at around 95K - 100K on heating.This suggests that on heating the FMM phase, stable in8T for low T, starts to disorder. This probably destabi-lizes the FMM phase with regions of high resistivity COIregions appearing in it. Eventually at T ≈ TMH the in-sulating regions increase in size and ρ shows a jump in ρ.The resistivity transition has an element of percolationassociated with it and thus occurs at a different volumefraction of the new phase in contrast to the specific heattransition which occurs mainly when the bulk of the sam-ple is transformed. Nevertheless, the small but distinctchange in Cp close to TMH is clearly seen.
In the temperature range TMH < T < TCOin a mag-netic field(i.e, the MCO region) we find an interesting ef-fect. The thermal relaxation time of the sample increasesby more than one order of magnitude. This anomalouslylarge relaxation is not observed at any temperature rangein zero field or for T > TCO and T < TMH in H = 8T .The existence of this large thermal relaxation necessi-tated that the sample be properly equilibrated before thedata are taken. We have done that and the data pre-sented here are taken after the sample has been properlyequilibrated thermally. The thermal relaxation, however,
is interesting in its own right and has been discussed ina separate publication [25].
III. LOW TEMPERATURE CP IN 0 AND 8TMAGNETIC FIELD
As it has been pointed out before, that the issue oflow temperature specific heat (T < 10K) is controversialin manganites showing charge ordering, particularly inPr1−xCaxMnO3 system. A large number of observationson low temperature specific heat is available for differ-ent compositions of Pr1−x CaxMnO3, mostly in poly-crystalline pellets and some in single crystals.
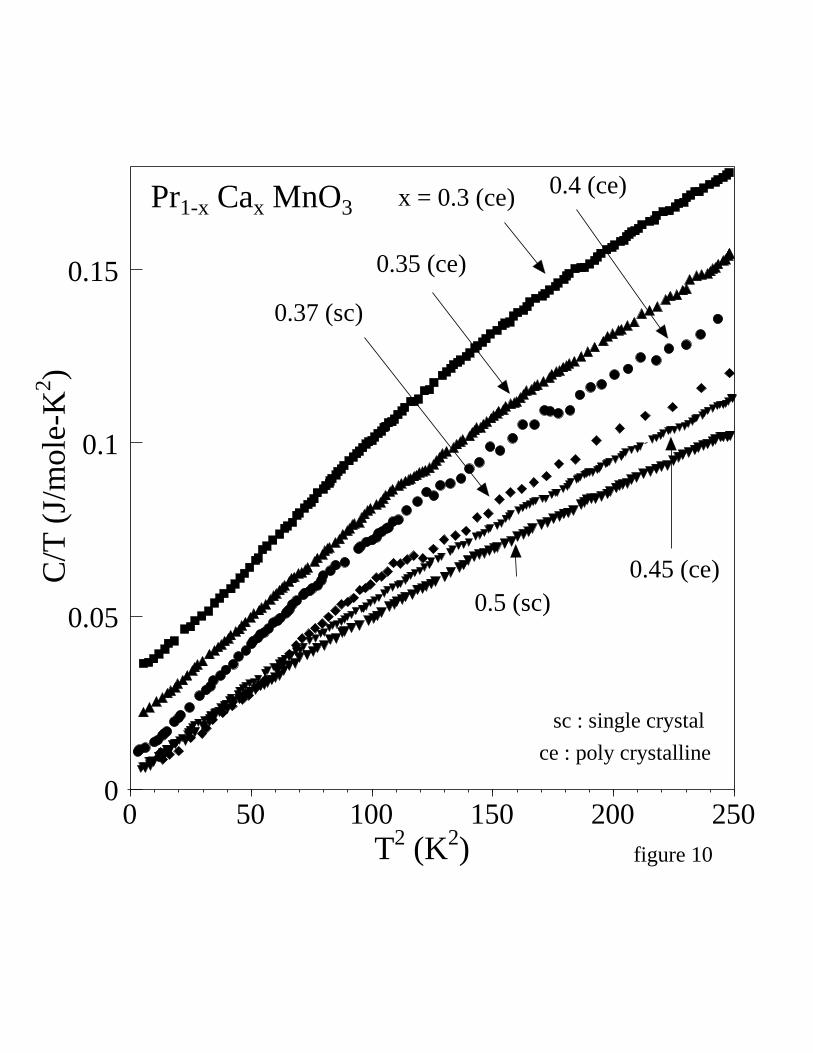
In figure 10 we show the specific heat data of our sam-ple with that of different compositions as obtained bydifferent groups [4,3]. Such a comparison is meaningfulbecause it brings out the essential similarity and differ-ences in these materials. A large linear term (γ ≈ 30.6mJ/mole-K2 for x = 0.3 and γ ≈ 15.7 mJ/mole-K2 forx = 0.35 [3]) appears in polycrystalline samples with x= 0.3 and x = 0.35 composition which decreases as x →
0.5. We note that such a large linear γ has not been seenany of the single crystal data. From a comparison of thedata shown in figure 10 we can reach the following con-clusions:(i) The polycrystalline ceramic samples have higher spe-cific heat than the single crystal samples,(ii) There is a clear trend that the specific heat of theceramic samples decreases as we approach x = 0.5.Inparticular,linear term in specific heat, is only observedfor the ceramic samples and it decreases with increasingx.(iii)The specific heat of the single crystal samples withcompositions x = 0.37 and 0.5 are very similar forT < 10K.
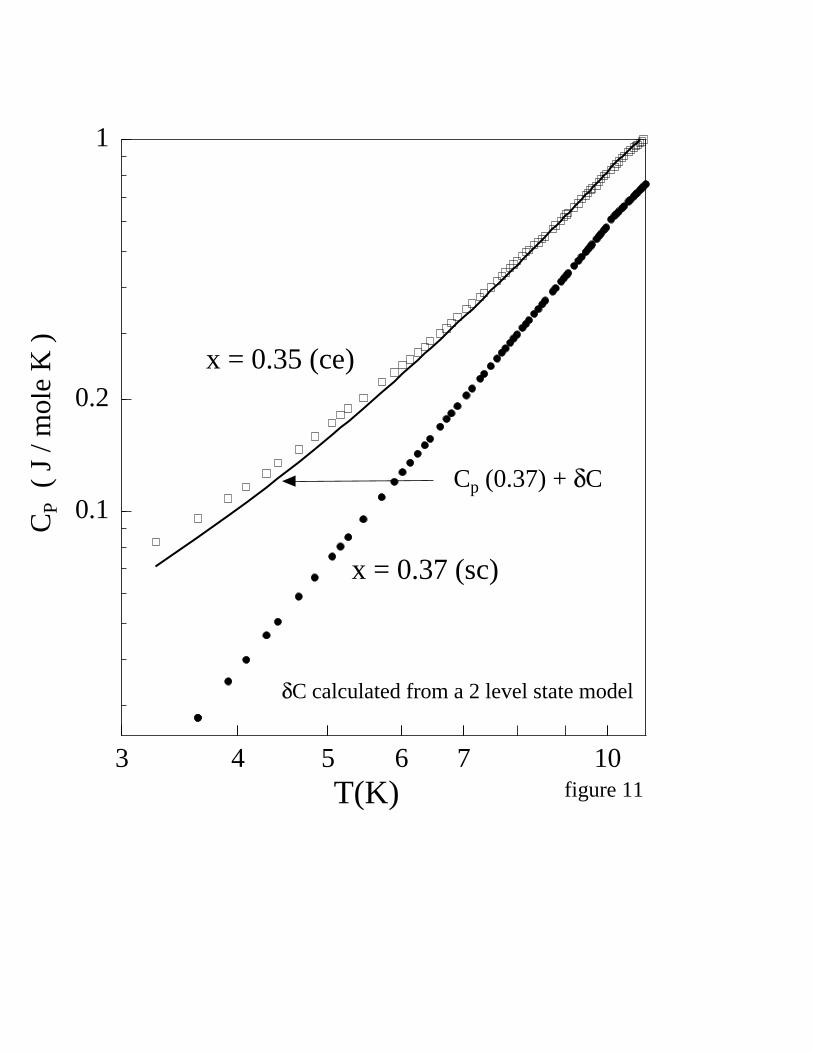
In figure 11 we have compared the specific heat of twoclose compositions: a polycrystalline x = 0.35 sample[3] and a single crystal sample with x = 0.37 composi-tion. The comparison is to elucidate how much of theexcess specific heat is due to polycrystallinity and canwe infer a likely origin of the excess specific heat. Thereare two mechanisms that can contribute to the excessspecific heat: (1) Due to grains of small dimensions [27]and (2)Due to two-level-systems(TLS) arising due to dis-order as in amorphous solids and several disordered crys-tals [27]. If the excess specific heat, is due to grains thenδC can be expressed as δC = C1T + C2T
2, where thecoefficients C1 and C2 are related to the average graindiameter < R > as < R >= kB [6hvsoundC1]
−0.5, wherevsound is the sound velocity in the crystal [27]. Wecan fit the experimentally observed Cpoly to the equa-tion Cpoly = Csc + δC. Using Csc from our observeddata and the above expression of δC we obtain an es-timate of the average grain size < R > and we obtain< R >≈ 10−4µm which is far too small compared to the
5

typical < R >> 1µm seen in most polycrystalline sam-ples. We can thus rule out finite grain size as the sourceof excess specific heat.
If the excess specific heat δC arises from TLS then itcan be fit to a form δC = C1T + C2T
3. This would arisefrom TLS with density of state P (E) = a + bE2, wherea and b are constants [27]. Using this expression forδC we then fitted the observed Cpoly as had been donebefore. The fit is shown in figure 11. From the fittedparameters C1 and C2, we arrive at values of a ≈ 2.3 ×
1035 erg−1/cc and b ≈ 1.5 × 1035 erg−3/cc. These val-ues are quite comparable to but some what larger thanthose obtained in glasses. We conclude that extra specificheat of the polycrystalline samples arise from excitationswhich behave as TLS. We have no clear understanding ofthe origin of these TLS but we can speculate that theywill arise from incomplete orbital /charge order that canhappen in polycrystalline samples due to random strains.What is needed for TLS to occur is to have multitudeof ground states with almost degenerate energy. Thiscan actually be due to the predominant incommensuratecharge ordering as seen in both x = 0.35 and x = 0.37compositions. As the charge-ordering becomes commen-surate with the lattice with x → 0.5, the difference inthe specific heat between the polycrystalline and the sin-gle crystal samples decrease. We thus suggest that thedisorder in polycrystalline samples give rise to TLS lowenergy excitations typically with energy ≤ 10K and asx → 0.5, the P (E) → 0.
Next we attend to the low temperature data taken onour single crystal sample. Figure 12 shows the specificheat data for the x = 0.37 sample plotted as Cp/T vs.T 2, a customary way to plot the data in anticipation ofa linear term. It is clear that the linear term is absentin the COI state. This is not surprising for an insulatingsample, the linear term was also absent in the specificheat data observed in the ceramic samples of x = 0.4 byLees et. al [4]. Neglecting the linear term, we have fittedthe our observations to the following relation :
Cp = αT−2 + β3T3 + β5T
5 (3)
where, αT−2 hyperfine contribution caused by the localmagnetic field at the Mn nucleus due to electrons in un-filled shells, β3T
3 and β5T5 are the lattice contribution to
the specific heat, arising from phonons. A part of the T 3
contribution to Cp can also arise from AFM spin waves.The T 3 contribution is likely to be enhanced over andabove the actual Debye contribution because of the pres-ence of AFM spin waves, since our COI sample has cantedAF order in this temperature range. The results of fit-ting the data to the above equation are shown in table 1.The parameters obtained by us are very similar to thatseen by Lees et. al [4]. In table 1 we have collected theparameters from different published data for comparison.
However, the interesting question is whether in a mag-netic field of 8T where the COI is melted into a FMM
phase, we see appearance of a linear specific heat term.In a past investigation on polycrystalline samples of La0.5
Ca0.5MnO3 in a magnetic field of 8.5 T [10] (which ishigh enough to melt the COI state) no linear term hadbeen observed. The issue of absence of a linear term inthe FMM phase obtained after melting the COI stateis thus real. Particularly, when one compares it withthe low temperature specific heat of the FMM phase asseen in the CMR region γ ≈ 7.8 mJ/mole K2 in La0.8
Ca0.2MnO3 [21], ≈ 5.2 mJ/mole K2 in La0.7 Ca0.3MnO3
[26].The Cp/T vs. T 2 for our sample in presence of an 8T
magnetic field are shown in figure 12. The specific heatdata have been fitted using the eqn. 1, with the param-eters as shown in table 1. Interestingly, the specific heatin presence of magnetic field is distinctly lower than thespecific in 0T for all T < 40K. Lowering of specific heatin presence of magnetic field has been reported Smolyani-nova et. al [3]. Since resistivity measurements indicatethe sample to be in a metallic state, one would expectan extra linear term appearing in the eqn.1 in presenceof magnetic field. As seen in fig. 12, we couldnot detectthe presence of any linear term even in presence of 8T.From the uncertainty in the data we find an upper limitof γ ≤ 0.1mJ/moleK2, which is too small.
It is apparent from table 1, that contribution of theβ3 term is halved in presence of magnetic field. Thisappears to be the main reason for lower Cp in H = 8Tcompared to that in absence of magnetic field. This canbe explained as follows. The T 3 term contains an addi-tional antiferromagnetic spin wave contribution for theCOI sample. For an antiferromagnetic spin wave spec-trum where E = Dq, the magnetic contribution to spe-cific heat is ∝ T 3. The melting of COI state to a FMMstate leads to collapse of this AFM order and thus therewill be no AFM spin wave contribution to the specificheat. This would result in a decrease of the T 3 term.However, presence of FM order should give a ferromag-netic spin wave contribution ∝ T 3/2. We have attemptedfitting a T 3/2 term to the 8T specific heat data. However,we could not detect any T 3/2 term. Thus, it appears thatthe specific heat as observed in presence of magnetic fielddoesnot have a ferromagnetic spin wave contribution.
Briefly, we find that the specific heat at low temper-ature needs more investigation in single crystalline COsystems and in high magnetic field. The existing data(which includes too few single crystal data) both in zerofield and magnetic field (high enough to melt the COstate) does not allow us to reach much definite conclu-sion other than the fact that in the FMM phase obtainedby melting COI state in a high magnetic field does nothave a large enough γ that is comparable to FMM phasesseen in manganites showing CMR behavior.
6
IV. CONCLUSION
Our study of specific heat in a CO system done overan extended temperature range of 3K - 300K in presenceof 0 and 8T magnetic field gives us a number of usefuland new information regarding the thermodynamics ofCO transition. This paper gives the first clear measure-ment of the entropy in a single crystal and also the latentheat (at TCO) in zero field and in a magnetic field. Thelatent heat released proves the strong first order natureof the transition, which had never been shown to be soin actual measurement of specific heat. An estimate ofthe numbers like the latent heat in 0 and 8T field setsclearly the bound and scale within which any theoreti-cal models must work. It is a very important numberfor any phase transition which gives the CO transition(both in 0T and 8T) a thermodynamic basis. Importantis also the observation of a finite entropy change at theCO melting in a magnetic field. The result shows thata small but finite and qualitative difference in entropyexists between the FMM phase and the CI phase at themelting transition in the magnetic field where the former(FMM) phase (which is the low T phase) has a lower en-tropy than the other phase (which is the high T phase).Interesting also is the smallness of the entropy. The lowtemperature Cp (T < 15K), show no linear dependenceon T as expected from an insulating sample. Surpris-ingly, this electronic term is absent even when the COIstate is melted to a FMM state by a 8T magnetic field.An attempt had been made to understand the observeddiscrepancy between the specific heat of a single crys-tal and a polycrystalline sample in the low temperatureregime.
A.G. thanks the CSIR Center of Excellence in Chem-istry, JNCASR, for financial support. A.K.R. thanksBRNS and DST for partial support through a sponsoredscheme.
† Electronic mail: [email protected]
[1] H. Kuwahara, Y. Tomioka, A. Asamitsu, Y. Moritomoand Y. Tokura, Science 270, 961 (1995).
[2] Colossal Magnetoresistance, Charge Ordering and Re-
lated Properties of Manganese Oxides, edited by C.N.R.Rao and B. Raveau (World Scientific, Singapore, 1998).
[3] V.N. Smolyaninova, A. Biswas, X. Zhang, K.H. Kim,Bog-Gi Kim, S-W. Cheong and R.L. Greene, Phys. Rev.B, 62, R6093 (2000).
[4] M.R. Lees, O.A. Petrenko, G. Balakrishnan, and D.Mck.Paul, Phys. Rev. B 59, 1298 (1999).
[5] A. Guha, A.K. Raychaudhuri, A.R. Raju and C.N.R.Rao, Phys. Reb. B, 62, 5320 (2000).
[6] A. Guha, N. Khare, A.K. Raychaudhuri and C.N.R. Rao,Phys. Rev. B, 62, R11 941, (2000).
[7] A.P. Ramirez, P. Schiffer, S-W. Cheong, C.H. Chen, W.Bao, T.T.M. Palstra, P.L. Gammel, D.J. Bishop, and B.Zegarski, Phys. Rev. Lett 76, 3188, (1996).
[8] A. Arulraj, R. Gundakaram, A. Biswas, N. Gayathri,A.K. Raychaudhuri and C.N.R. Rao, J. Phys.:Condens.Matter 10, 4447 (1998).
[9] J.E. Gordon, R.A. Fisher, Y.X. Jia, N.E. Phillips, S.F.Reklis, D.A. Wright, and A. Zettl, Phys. Rev B 59, 127(1999).
[10] V.N. Smolyaninova, K. Ghosh, and R.L. Green, Phys.Rev B 58, R14725 (1998).
[11] I. Das and E. V. Sampathkumaran, Pramana J. Phys,42, 251 (1994).
[12] S. Uhlenbruck, R. Teipen, R. Klingeler, B. Buchner, O.Friedt, M. Hucker, H. Kierspel, T. Niemoller, L. Pinsard,A. Revcolevschi, and R. Gross, Phys. Rev. Lett 82, 185(1999).
[13] E.S.R. Gopal, Specific Heats at low temperatures PlenumPress, New York (1966).
[14] R. Gupta (private communication).[15] H. Thirring, Physik. Z. 14, 867 (1913).[16] S. Rosenkranz, M. Medarde, F. Fauth, J. Mesot, M. Zol-
liker, A.Furrer, U. Staub, P. Lacorre, R. Osborn, R.S. Ec-cleston and V. Trounov, Phys. Rev B 60, 14857 (1999);A. Podlesnyak, S. Rosenkranz, F. Fauth, W. Marti, H.J.Scheel and A. Furrer, J. Phys.:Condens. Matter 6, 4099,(1994).
[17] J.E. Gordon, M.L. Tan, R.A. Fisher, and N.E. Phillips,Solid State Com. 69, 625 (1989).
[18] A. Arulraj, A. Biswas, A.K. Raychaudhuri, C.N.R.Rao, P.M. Woodward, T. Vogt, D.E. Cox, and A.K.Cheetham, Phys. Rev. B 57, R 8115 (1998).
[19] B.F. Woodfield, M.L. Wilson, and J.M. Byers, Phys. Rev.
Lett 78, 3201 (1997).[20] L. Ghivelder, I.A. Castillo, M.A. Gusmao, J.A. Alonso,
and L.F. Cohen, Phys. Rev. B 60, 12184 (1999).[21] J.J. Hamilton, E.L. Keatley, H.L. Ju, A.K. Raychaud-
huri, V.N. Smolyaninonva, and R.L. Greene, Phys. Rev.
B 54, 14926 (1996).[22] K.A. Gschneidner Jr., V.K. Pecharsky, and D. Fort,
Phys. Rev. Lett. 76, 4281 (1997).[23] The authors thank the referee for pointing this out.[24] H. Hunklinger and A.K. Raychaudhuri, Prog. in low
temp. Phys 9, 265 (1986).[25] A.K. Raychaudhuri, A. Guha, I. Das, R. Rawat and
C.N.R. Rao, (unpublished).[26] J.M.D. Coey, M. Viret, L. Ranno, and K. Ounadjela,
Phys. Rev. Lett. 75, 3910 (1995).[27] R.O. Pohl, Amorphous Solids : Low Temperature Proper-
ties edited by W.A. Phillips (Springer-Verlag, New York,1981).
7
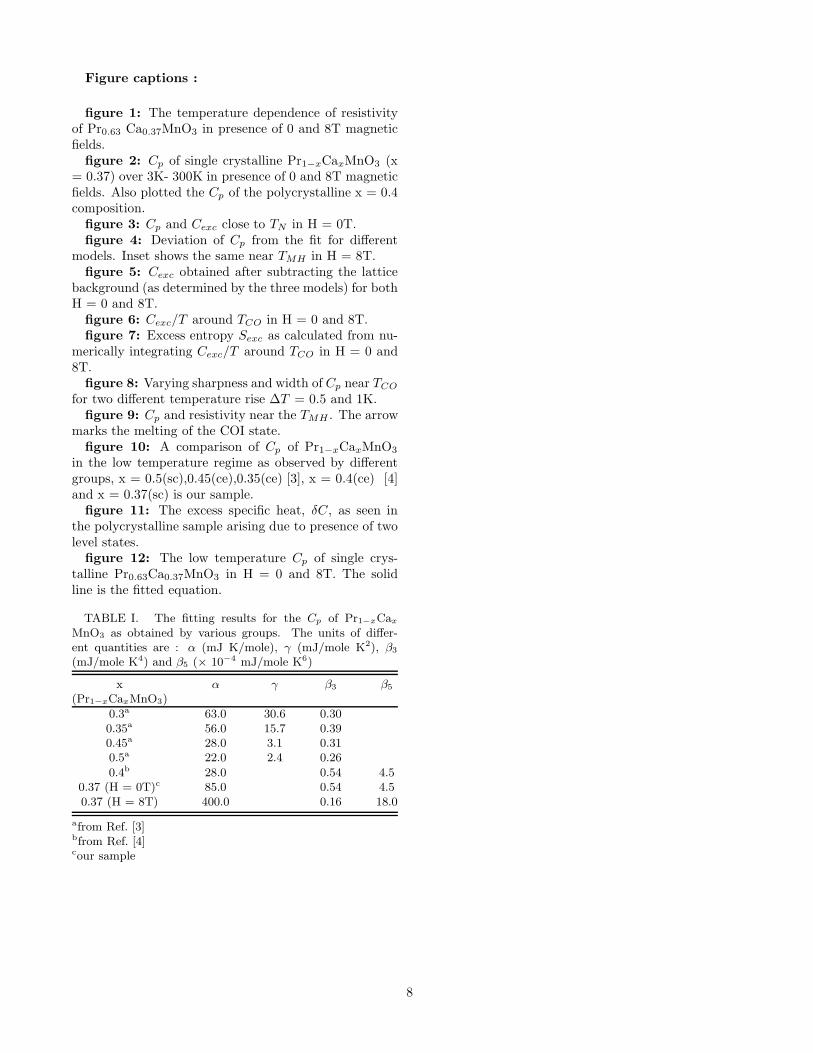
Figure captions :
figure 1: The temperature dependence of resistivityof Pr0.63 Ca0.37MnO3 in presence of 0 and 8T magneticfields.
figure 2: Cp of single crystalline Pr1−xCaxMnO3 (x= 0.37) over 3K- 300K in presence of 0 and 8T magneticfields. Also plotted the Cp of the polycrystalline x = 0.4composition.
figure 3: Cp and Cexc close to TN in H = 0T.figure 4: Deviation of Cp from the fit for different
models. Inset shows the same near TMH in H = 8T.figure 5: Cexc obtained after subtracting the lattice
background (as determined by the three models) for bothH = 0 and 8T.
figure 6: Cexc/T around TCO in H = 0 and 8T.figure 7: Excess entropy Sexc as calculated from nu-
merically integrating Cexc/T around TCO in H = 0 and8T.
figure 8: Varying sharpness and width of Cp near TCO
for two different temperature rise ∆T = 0.5 and 1K.figure 9: Cp and resistivity near the TMH . The arrow
marks the melting of the COI state.figure 10: A comparison of Cp of Pr1−xCaxMnO3
in the low temperature regime as observed by differentgroups, x = 0.5(sc),0.45(ce),0.35(ce) [3], x = 0.4(ce) [4]and x = 0.37(sc) is our sample.
figure 11: The excess specific heat, δC, as seen inthe polycrystalline sample arising due to presence of twolevel states.
figure 12: The low temperature Cp of single crys-talline Pr0.63Ca0.37MnO3 in H = 0 and 8T. The solidline is the fitted equation.
TABLE I. The fitting results for the Cp of Pr1−xCax
MnO3 as obtained by various groups. The units of differ-ent quantities are : α (mJ K/mole), γ (mJ/mole K2), β3
(mJ/mole K4) and β5 (× 10−4 mJ/mole K6)
x α γ β3 β5
(Pr1−xCaxMnO3)
0.3a 63.0 30.6 0.300.35a 56.0 15.7 0.390.45a 28.0 3.1 0.310.5a 22.0 2.4 0.26
0.4b 28.0 0.54 4.50.37 (H = 0T)c 85.0 0.54 4.50.37 (H = 8T) 400.0 0.16 18.0
afrom Ref. [3]bfrom Ref. [4]cour sample
8

T(K)
0 50 100 150 200 250
(ohm
cm)
10-4
10-2
100
102
104
106
TCO
TN
0T
8T
TMH
Pr0.63Ca0.37MnO3
figure 1
T(K)0 50 100 150 200 250 300
Cp
(J/m
ole
K)
0
50
100
150
200
250
3008T 0T
x = 0.4 (ce)
figure 2
T(K)140 150 160 170 180 190 200
CP
(J/m
ole
K)
75
80
85
90
95
100
Cex
c(
J/m
ole
K)
2
3
4
5
6H = 0T
figure 3
T(K)40 60 80 100 120
C/C
p
-0.2
0
0.2
0.4
0.6
Cthirring
Cdebye
Ceinstein
H = 8T
T(K)40 60 80 100 120 140
C/C
p=
(Cob
s-
Cca
l)/C
obs
0
0.2
0.4
0.6
Cthirr
Cdeb
Cein
H = 0T
figure 4
T(K)120 160 200 240
0
4
8
12
16
20Cthir
Cdeb
Cein
H = 8T
Cex
c(
J/m
ole
K)
0
4
8
12 Cthir
Cdeb
Cein
H = 0T
figure 5
T (K)210 220 230 240 250
Cex
c/T
(J/m
ole
K2 )
0
0.2
0.4
0.6
0.8
1
8T
0T
figure 6

T (K)210 220 230 240 250
S(J
/mol
eK
)
1
2
3
4
8T
0T
SCOST
figure 7
T(K)
230 232 234 236 238 240 242
Cp
(J
/mol
eK
)
100
150
200
250
300 T = 0.5K
T = 1K
figure 8
T(K)40 60 80 100 120
Cp
(8T
)(J
/mol
eK
)
20
40
60
80
(ohm
cm)
10-3
10-1
101 H = 8T
figure 9
Pr1-x Cax MnO3
figure 10T2 (K2)0 50 100 150 200 250
C/T
(J/m
ole-
K2 )
0
0.05
0.1
0.15
x = 0.3 (ce)
0.35 (ce)
0.45 (ce)0.5 (sc)
sc : single crystal
0.37 (sc)
0.4 (ce)
ce : poly crystalline
T(K)3 4 5 6 7 10
CP
(J
/mol
eK
)
0.1
0.2
1
x = 0.37 (sc)
x = 0.35 (ce)
Cp (0.37) + C
C calculated from a 2 level state model
figure 11

T2 (K2)0 20 40 60 80 100
CP
/T(J
/mol
eK
2 )
0
0.02
0.04
0T
figure 12
8T