Species Richness, Tropical Forest Dynamics, and Sampling: Response to Sheil
6
Nordic Society Oikos Species Richness, Tropical Forest Dynamics, and Sampling: Response to Sheil Author(s): Oliver Phillips, Pamela Hall, Stanley Sawyer, Rodolfo Vásquez Source: Oikos, Vol. 79, No. 1 (May, 1997), pp. 183-187 Published by: Blackwell Publishing on behalf of Nordic Society Oikos Stable URL: http://www.jstor.org/stable/3546105 . Accessed: 22/09/2011 09:35 Your use of the JSTOR archive indicates your acceptance of the Terms & Conditions of Use, available at . http://www.jstor.org/page/info/about/policies/terms.jsp JSTOR is a not-for-profit service that helps scholars, researchers, and students discover, use, and build upon a wide range of content in a trusted digital archive. We use information technology and tools to increase productivity and facilitate new forms of scholarship. For more information about JSTOR, please contact [email protected]. Blackwell Publishing and Nordic Society Oikos are collaborating with JSTOR to digitize, preserve and extend access to Oikos. http://www.jstor.org
Transcript of Species Richness, Tropical Forest Dynamics, and Sampling: Response to Sheil

Nordic Society Oikos
Species Richness, Tropical Forest Dynamics, and Sampling: Response to SheilAuthor(s): Oliver Phillips, Pamela Hall, Stanley Sawyer, Rodolfo VásquezSource: Oikos, Vol. 79, No. 1 (May, 1997), pp. 183-187Published by: Blackwell Publishing on behalf of Nordic Society OikosStable URL: http://www.jstor.org/stable/3546105 .Accessed: 22/09/2011 09:35
Your use of the JSTOR archive indicates your acceptance of the Terms & Conditions of Use, available at .http://www.jstor.org/page/info/about/policies/terms.jsp
JSTOR is a not-for-profit service that helps scholars, researchers, and students discover, use, and build upon a wide range ofcontent in a trusted digital archive. We use information technology and tools to increase productivity and facilitate new formsof scholarship. For more information about JSTOR, please contact [email protected].
Blackwell Publishing and Nordic Society Oikos are collaborating with JSTOR to digitize, preserve and extendaccess to Oikos.
http://www.jstor.org

O N P
I I 0
N I I
P 0
Opinion is intended to facilitate communication between reader and author and reader and reader. Comments, viewpoints or suggestions arising from published papers are welcome. Discussion and debate about important issues in ecology, e.g. theory or terminology, may also be included. Contributions should be as precise as possible and references should be kept to a minimum. A summary is not required.
N
Species richness, tropical forest dynamics, and sampling: response to Sheil
Oliver Phillips, School of Geography, Univ. of Leeds, Leeds, UK LS2 9JT ([email protected]). - Pamela Hall, Dept of Systematic Botany, Aarhus Univ, AarhusAarhus Univ., Denmark. - Stanley Sawyer, Dept of Mathematics, Washington Univ., St. Louis, MO 63130, USA. - Rodolfo Vdsquez, Proyecto Flora del Peru, Missouri Botanical Garden, Apartado 280, Iquitos, Peru.
Phillips et al. (1994a) demonstrated that of all factors examined, mean annual tree mortality and recruitment (turnover) is the most predictive factor of species rich- ness in tropical forests worldwide. This was the first biome-wide evidence for the importance of small-scale disturbance in maintaining tropical forest diversity, a prediction of ecological hypotheses that link tree diver- sity to disturbance (e.g., Grubb 1977, Connell 1978, Denslow 1987, Brandini et al. 1988). Since we also showed that turnover rates are closely related to the amount of basal area turnover in mature tropical forests, we went on to suggest that the contribution of stand dynamics to maintaining tropical forest diversity may ultimately be driven by ecosystem productivity.
Sheil (1996) uses that paper in a critique of the use of permanent sample plots in understanding tropical forests. He raises various issues. For example, he cor- rectly emphasises that it is difficult to infer cause and effect from observational data and that local and re- gional historical factors must have a role in influencing site diversity. We also agree that further data and analysis would be helpful to better understand the relationship between productivity and stand dynamics. However, other points are not well supported by closer consideration of the data and analyses, and most of the alternative models proposed are not consistent with what is known about tropical forests. There are three principal elements in his critique which we respond to here.
First, Sheil states that species richness is the outcome of the detailed history of a particular site and the available species, and that diversity cannot therefore be explained as a product of current conditions. Interacting biogeographical and ecological factors must at some point limit the species pool, but we suggest that an appropriate strategy for understanding the factors that
determine species richness involves first quantifying the relationship between species richness and contemporary processes. Once the potential effects of contemporary factors have been accounted for we can invoke less directly measurable and testable historical factors. Fur- thermore, while recognising that in some sense every forest is unique, the explicit purpose of our paper was to identify common principles rather than treat tropical forest plots as a series of case studies. We therefore focused on the potential for global explanations, using multiple regression to develop a model of species rich- ness as factor-rich as possible, and partial correlation to identify which environmental and ecological factors co-vary with one another. For example, these analyses allowed us to partition out the known tropics-wide effects of climate seasonality on species richness (Cline- bell et al. 1995). In interpreting the statistical models we explicitly invoked a historical argument as a possible explanation for variance in species richness that could not be accounted for by contemporary factors ("... Asian sites tended to have higher species richness than expected from the recorded values of Dynamism and Climate, and Other sites had negative residuals -
perhaps reflecting a historical effect of the relatively depauperate African and Central American floras"). Finally, we would point out that the best ecological model we propose still leaves more than 60% of the variance in species richness unaccounted for. Therefore there is ample room for historical explanations!
Sheil (1996) asserts that existing permanent sample plots (PSPs) provide a biased sample of global tropical forests. Clearly the dataset is not flawless (see Sheil (1995a, b), Sheil et al. (1995), and Sheil and May (1996) for other critiques, and Phillips (1995) for one re- sponse), but we disagree about the severity of any bias and the impact that any bias may have on the statistical
OIKOS 79:1 (1997)
0
183

:m -v- ! I FM !L,RME. I f .- .f- I ! : 'I I Mg I I I ' I I
80
60-.
'40 -
I20!
La -l 20 -
2a0-1 . L-
B -
I1
MI
relationships we described. For example, our collective field experience does not support the presupposition that "researchers place PSPs preferentially at sites which yield exceptional species counts". We suggest that it would be difficult to select locally "exceptional" sites in predominantly species-rich, lowland equatorial America and Asia. Here, even the most skilled botanists cannot determine most canopy tree species to morpho- species without painstaking inspection. Many trees re- quire collections to be made from the canopy which must be subsequently compared and formally identified in herbaria half a world away. This makes it very difficult in the field to determine a priori the richest particular sites in a given community in which to place fixed-angle, fixed-dimension plots.
At a larger scale, the data we compiled demonstrate that a broad range of diversity has been sampled in each tropical continent (for instance, SE Asian sites vary from 130 to 235 species per 500 stems, with a coefficient of variation (CV) of 22%, and South Ameri- can values range from 51 to 267 (CV 39%)). Of course, some important forest regions did not have turnover data available, so we cannot claim to have full global representation. But the lowest diversity forests we sam- pled are as depauperate as some areas of "monodomi- nant" mature tropical forests (Connell and Lowman 1989), and the highest diversity forests are as rich as forests in renowned "diversity hotspots" such as the Choco, Amazonian Columbia, western Brazil, the At- lantic forests of Brazil, and eastern Madagascar (Myers 1988, Maciel and Lisboa 1989, Faber-Langendoen and Gentry 1991, Gentry 1992, Duivenvoorden and Lips 1995, Lowry et al. in press) none of which were repre- sented in our dataset.
A similar rationale applies to the assumption that forest ecologists select particularly disturbance-free sites for their PSPs, a bias that could inadvertently result in both a biased diversity measure and in non-representa- tive subsequent estimates of stand-level mortality and recruitment. We suggest that conscious or unconscious PSP site-selection biasing with respect to the natural matrix of forest stages may be hard to achieve. In western Amazonia and Southeast Asia, at least, visibil- ity in the forest understory is often <20 m, yet the maximum dimension of most PSPs is >100 m. Only with very extensive preliminary surveys would botanists be able to position 1-ha plots that avoid any recently disturbed areas. We have tested the hypothesis that ecologists have been prone to pick areas with an un- usual temporary dominance by late building/late grow- ing or mature phase/homeostatic sylvigenetic phase forest (in the respective terminologies of Whitmore 1975 and Halle et al. 1978), by examining the fate of large trees and total basal area through the available inventory period for a number of plots. Key predictions are that with time they will (1) lose large trees, and thereby (2) lose basal area as a consequence of mature-
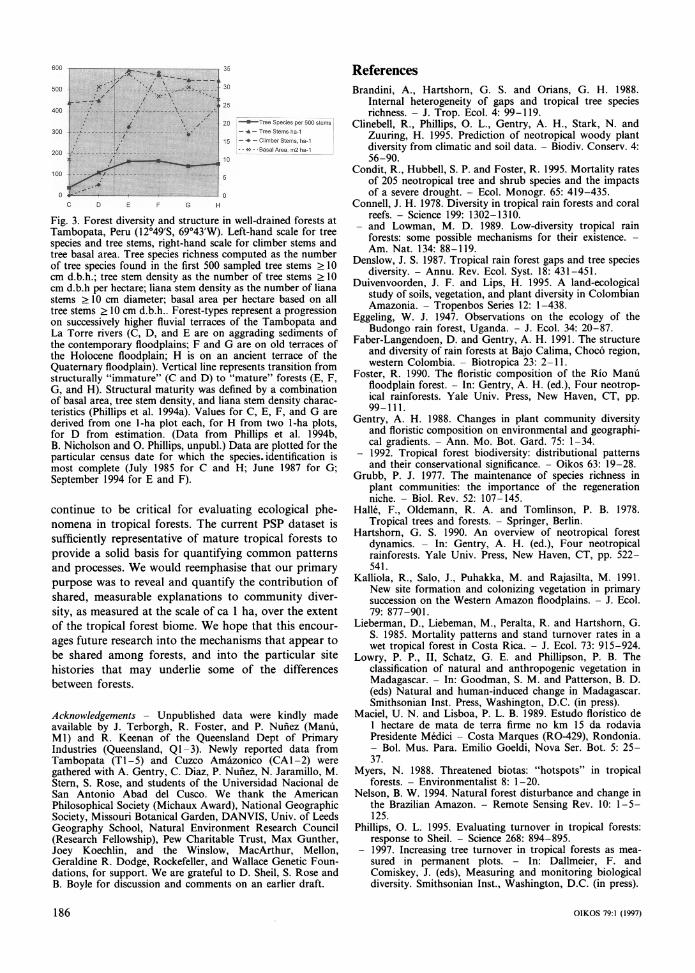
phase forest breaking down to a more typical mix of all forest developmental stages, and (3) that smaller plots will tend to be more susceptible to the effect than larger plots. There is no tendency for PSPs to experience a decline in the number of big trees, whether trees are considered "big" at >50 or > 75 cm d.b.h. (Fig. 1). Of the lowland forest sites with sequential basal area data, few have experienced large changes in basal area and the mean change in basal area between the first and final inventories is not distinguishable from zero (+0.92 + 0.91%, t = 1.01, p = 0.32). Moreover, there is no tendency for smaller plots to lose basal area (Fig. 2). Together, these results indicate that most PSPs in ma- ture tropical forests were sited with little or no bias with respect to forest developmental stage. This strengthens confidence in the representativeness of dy- namics and diversity estimates from PSPs.
Sheil's third point is that variation in stand parame- ters may be more appropriate than averaged values when considering the maintenance of diversity. Clearly, a long-term goal of tropical ecology is to incorporate a species-level perspective on tree population dynamics. However, such large sample sizes are required to com- pute dynamic parameters (Hall et al., unpubl.) that definitive mortality rates for sympatric tree species are available only for the more locally common taxa at a handful of abnormally well-studied and mostly low- diversity regions or localities - hardly a basis for exploring global patterns and processes (e.g., Lieberman et al. 1985, Vanclay 1991, Condit et al. 1995). Plot-wide values of stem mortality and recruitment are much easier to determine than their species-level equivalents.
Proportional Change in the Numbers of Big Trees in PTPs
a Trees >50 cm diameter
: Trees >75 cm diameter
. F] . . r-i . . iq u- ---r - i -
^ , - - i
a i I, , -a \p'
,
;2 N g ii !
ll o
-40 -
SITE
Fig. 1. Proportional change in numbers of big trees in plots. Percentage change computed as the number of big trees at the final census minus the number of big trees at the initial census, divided by the number of big trees at the initial census. All mature tropical forest sites for which tree-by-tree data were available are plotted. Intervals, in years, are: 10.9 (T1), 11.1 (T2), 11.0 (T3), 14.5 (T4), 11.0 (T5), 5.2 (CA1), 5.2 (CA2), 15.5 (MA), 9.8 (YA), 7.6 (MI), 20 (LA), 22 (ME), 37.2 (Q1), 15.7 (Q2), 12.0 (Q3). Site codes are as given in Phillips et al. (1994a) except: CA1 (Cuzco Amazonico old floodplain, Peru), CA2 (Cuzco Amazonico swamp, Peru), QI-3 (Queensland sites 1-3). Further site details are given in Phillips (1997).
184 OIKOS 79:1 (1997)
* PI . F

Fig. 2. Change in basal area vs plot size. Percentage change in basal area is computed as the final basal area minus the initial basal area, divided by the initial basal area. All mature tropical forest sites for which sequential basal area data were available are plotted. The maximum available inventory period was used for each site. r= -0.197, n = 28, p > 0.10.
Change in Basal Area vs Plot Size
<? + + ~~~~~~~~~~< >
20
z
0
in ,,=
I,a
15
10
5
0
-10 ' -2 -1
As we showed, they also co-vary with important com- munity parameters (soil richness, stem density, basal area, species richness, and basal area turnover) over large geographical scales, so we may infer that they have important biological meaning.
Sheil explores in more detail the implications of his three points (the importance of site history, PSP selec- tion bias, and variation in stand parameters) in relation to our original paper, but we cannot agree with all of his arguments. Having pointed out that "The richness of a plot is a story of many interwoven events and processes" and affirming that "broad inter-regional generalisations must be undertaken with care", he goes on to present three very different generalised models of tropical forests.
Sheil's first scenario is based on Connell's "intermedi- ate disturbance hypothesis" (Connell 1978). There are two discrete guilds of tropical forest trees (fast-growing "pioneers", and slow-growing "climax" species), and succession in natural forests proceeds to an essentially non-disturbed state until the next major vegetation extrinsic disturbance occurs. Such a model certainly has some applicability. In some surviving Ugandan forests, species richness does apparently decline with time after major extrinsic disturbance (Eggeling 1947, Connell 1978) and treefall rates in mature forests may indeed be very low (Skorupa and Kasanene 1984). We certainly agree that a variety of disturbances can affect forests, ranging from those occurring at very small spatial or temporal scales, through to much larger, longer or more intense perturbations (e.g., Salo et al. 1986, Nelson 1994). But extrinsic disturbance factors are not funda- mentally relevant to the spatial and temporal scales that our study focussed on. We deliberately screened out sites where forest structure and dynamics information indi- cated recovery from a past catastrophic disturbance. Continuing disturbance via treefalls, branchfalls, and
0
LN (PLOT SIZE), HECTARES
other small canopy openings maintains individuals of many disturbance-dependent species in mature forest (e.g., Lieberman et al. 1985, Denslow 1987, Hartshorn 1990). The importance of frequent small-scale distur- bance is borne out by our data from a well-studied Neotropical site that supports a chronosequence of forests on variously aged fluvial deposits. Here, tree species richness increases progressively with forest suc- cession on aggrading fluvial sediments (cf. Foster 1990, Kalliola et al. 1991, Terborgh et al. 1996), yet once forests have attained physiognomic maturity, taxa that depend on small disturbances for regeneration continue to persist, even in forests >> 103 yr old that lie beyond the present river floodplains (Gentry 1988, Phillips et al. 1994b). Both species richness and tree turnover rates remain high as these mature forests age (cf. Fig. 3, and Phillips et al. 1994a, Phillips 1997). These data are not consistent with Sheil's interpretation of Connell's model. Rather, it is apparent that species-rich forests can expe- rience lengthy phases during which they are at some equilibrium with respect to species richness, the balance of two or more guilds, or stand-level turnover rates.
In Sheil's second scenario, forest growth rates are independent of forest structure and floristic composi- tion. While this may be possible in some environments, it is not consistent with the biome-wide data we com- piled (Table 3 in Phillips et al. 1994a). It also conflicts with the logic and graphical representation of his first scenario, which indicates that any given pair of equally diverse forests with different susceptibility to distur- bances must have a different species composition.
In his final scenario, Sheil invokes the more complex model of forests having a dynamic mosaic-patch struc- ture, and suggests that studies should examine the spatial and temporal variation in species densities and turnover. These are vital, ultimate goals shared by many tropical ecologists. Yet existing plot data will
OIKOS 79:1 (1997)
I
185
600
30 500
400
300
200
100
25
20 - -Tre Specis per 500 tes -*- Tree Stems h-1
15 - - -Climber Stems, ha1 - - * -ml Are, m2 ha-1
G 1H
Fig. 3. Forest diversity and structure in well-drained forests at Tambopata, Peru (12?49'S, 69043'W). Left-hand scale for tree species and tree stems, right-hand scale for climber stems and tree basal area. Tree species richness computed as the number of tree species found in the first 500 sampled tree stems > 10 cm d.b.h.; tree stem density as the number of tree stems > 10 cm d.b.h per hectare; liana stem density as the number of liana stems >10 cm diameter; basal area per hectare based on all tree stems > 10 cm d.b.h.. Forest-types represent a progression on successively higher fluvial terraces of the Tambopata and La Torre rivers (C, D, and E are on aggrading sediments of the contemporary floodplains; F and G are on old terraces of the Holocene floodplain; H is on an ancient terrace of the Quaternary floodplain). Vertical line represents transition from structurally "immature" (C and D) to "mature" forests (E, F, G, and H). Structural maturity was defined by a combination of basal area, tree stem density, and liana stem density charac- teristics (Phillips et al. 1994a). Values for C, E, F, and G are derived from one 1-ha plot each, for H from two 1-ha plots, for D from estimation. (Data from Phillips et al. 1994b, B. Nicholson and 0. Phillips, unpubl.) Data are plotted for the particular census date for which the species. identification is most complete (July 1985 for C and H; June 1987 for G; September 1994 for E and F).
continue to be critical for evaluating ecological phe- nomena in tropical forests. The current PSP dataset is sufficiently representative of mature tropical forests to provide a solid basis for quantifying common patterns and processes. We would reemphasise that our primary purpose was to reveal and quantify the contribution of shared, measurable explanations to community diver- sity, as measured at the scale of ca 1 ha, over the extent of the tropical forest biome. We hope that this encour- ages future research into the mechanisms that appear to be shared among forests, and into the particular site histories that may underlie some of the differences between forests.
Acknowledgements - Unpublished data were kindly made available by J. Terborgh, R. Foster, and P. Nufiez (Manu, M1) and R. Keenan of the Queensland Dept of Primary Industries (Queensland, Q1-3). Newly reported data from Tambopata (T1-5) and Cuzco Amazonico (CA1-2) were gathered with A. Gentry, C. Diaz, P. Nufiez, N. Jaramillo, M. Stern, S. Rose, and students of the Universidad Nacional de San Antonio Abad del Cusco. We thank the American Philosophical Society (Michaux Award), National Geographic Society, Missouri Botanical Garden, DANVIS, Univ. of Leeds Geography School, Natural Environment Research Council (Research Fellowship), Pew Charitable Trust, Max Gunther, Joey Koechlin, and the Winslow, MacArthur, Mellon, Geraldine R. Dodge, Rockefeller, and Wallace Genetic Foun- dations, for support. We are grateful to D. Sheil, S. Rose and B. Boyle for discussion and comments on an earlier draft.
~35~ ~References Brandini, A., Hartshorn, G. S. and Orians, G. H. 1988.
Internal heterogeneity of gaps and tropical tree species richness. - J. Trop. Ecol. 4: 99-119.
Clinebell, R., Phillips, 0. L., Gentry, A. H., Stark, N. and Zuuring, H. 1995. Prediction of neotropical woody plant diversity from climatic and soil data. - Biodiv. Conserv. 4: 56-90.
Condit, R., Hubbell, S. P. and Foster, R. 1995. Mortality rates of 205 neotropical tree and shrub species and the impacts of a severe drought. - Ecol. Monogr. 65: 419-435.
Connell, J. H. 1978. Diversity in tropical rain forests and coral reefs. - Science 199: 1302-1310.
- and Lowman, M. D. 1989. Low-diversity tropical rain forests: some possible mechanisms for their existence. - Am. Nat. 134: 88-119.
Denslow, J. S. 1987. Tropical rain forest gaps and tree species diversity. - Annu. Rev. Ecol. Syst. 18: 431-451.
Duivenvoorden, J. F. and Lips, H. 1995. A land-ecological study of soils, vegetation, and plant diversity in Colombian Amazonia. - Tropenbos Series 12: 1-438.
Eggeling, W. J. 1947. Observations on the ecology of the Budongo rain forest, Uganda. - J. Ecol. 34: 20-87.
Faber-Langendoen, D. and Gentry, A. H. 1991. The structure and diversity of rain forests at Bajo Calima, Choc6 region, western Colombia. - Biotropica 23: 2-11.
Foster, R. 1990. The floristic composition of the Rio Manf floodplain forest. - In: Gentry, A. H. (ed.), Four neotrop- ical rainforests. Yale Univ. Press, New Haven, CT, pp. 99-111.
Gentry, A. H. 1988. Changes in plant community diversity and floristic composition on environmental and geographi- cal gradients. - Ann. Mo. Bot. Gard. 75: 1-34.
- 1992. Tropical forest biodiversity: distributional patterns and their conservational significance. - Oikos 63: 19-28.
Grubb, P. J. 1977. The maintenance of species richness in plant communities: the importance of the regeneration niche. - Biol. Rev. 52: 107-145.
Halle, F., Oldemann, R. A. and Tomlinson, P. B. 1978. Tropical trees and forests. - Springer, Berlin.
Hartshorn, G. S. 1990. An overview of neotropical forest dynamics. - In: Gentry, A. H. (ed.), Four neotropical rainforests. Yale Univ. Press, New Haven, CT, pp. 522- 541.
Kalliola, R., Salo, J., Puhakka, M. and Rajasilta, M. 1991. New site formation and colonizing vegetation in primary succession on the Western Amazon floodplains. - J. Ecol. 79: 877-901.
Lieberman, D., Liebeman, M., Peralta, R. and Hartshorn, G. S. 1985. Mortality patterns and stand turnover rates in a wet tropical forest in Costa Rica. - J. Ecol. 73: 915-924.
Lowry, P. P., II, Schatz, G. E. and Phillipson, P. B. The classification of natural and anthropogenic vegetation in Madagascar. - In: Goodman, S. M. and Patterson, B. D. (eds) Natural and human-induced change in Madagascar. Smithsonian Inst. Press, Washington, D.C. (in press).
Maciel, U. N. and Lisboa, P. L. B. 1989. Estudo floristico de 1 hectare de mata de terra firme no km 15 da rodavia Presidente M6dici - Costa Marques (RO-429), Rondonia. - Bol. Mus. Para. Emilio Goeldi, Nova Ser. Bot. 5: 25- 37.
Myers, N. 1988. Threatened biotas: "hotspots" in tropical forests. - Environmentalist 8: 1-20.
Nelson, B. W. 1994. Natural forest disturbance and change in the Brazilian Amazon. - Remote Sensing Rev. 10: 1-5- 125.
Phillips, 0. L. 1995. Evaluating turnover in tropical forests: response to Sheil. - Science 268: 894-895.
- 1997. Increasing tree turnover in tropical forests as mea- sured in permanent plots. - In: Dallmeier, F. and Comiskey, J. (eds), Measuring and monitoring biological diversity. Smithsonian Inst., Washington, D.C. (in press).
OIKOS 79:1 (1997)
U : e
186

-, Hall, P., Gentry, A. H., Vasquez, R. and Sawyer, S. 1994a. Dynamics and species richness of tropical forests. - Proc. Nat. Acad. Sci. USA 91: 2805-2809.
-, Gentry, A. H., Reynel, C., Wilkin, P. and Galvez- Durand, C. 1994b. Quantitative ethnobotany and Amazo- nian conservation. - Conserv. Biol. 8: 225-248.
Salo, J., Kalliola, R., Hakkinen, I., Makinen, Y., Niemela, P., Puhakka, M. and Coley, P. 1986. River dynamics and the diversity of Amazon lowland forest. - Nature 322: 254- 258.
Sheil, D. 1995a. Evaluating turnover in tropical forests. - Science 268: 894.
- 1995b. A critique of permanent plot methods and analysis with examples from Budongo forest, Uganda. - For. Ecol. Manage. 77: 11-34.
- 1996. Species richness, tropical forest dynamics and sam- pling: questioning cause and effect. - Oikos 76: 587-590.
- and May, R. M. 1996. Mortality and recruitment rate evaluations in heterogeneous tropical forests. - J. Ecol. 84: 91-100.
-, Burslem, D. F. R. P. and Alder, D. 1995. The interpreta- tion and misinterpretation of mortality rate measures. - J. Ecol. 83: 331-333.
Skorupa, J. P. and Kasanene, J. M. 1984. Tropical forest managment: can rates of natural tree-falls help guide us? - Oryx 18: 96-101.
Terborgh, J., Foster, R. and Nuiiez, P. V. 1996. Tropical tree communities: a test of the nonequilibrium hypothesis. - Ecology 72: 561-567.
Vanclay, J. K. 1991. Mortality functions for north Queensland rain forests. - J. Trop. For. Sci. 4: 15-36.
Whitmore, T. C. 1975. Tropical forests of the Far East. - Clarendon, Oxford.
OIKOS 79:1 (1997) 187