Spatio-Temporal Ultrafast Laser Tailoring for Bulk Functionalization ...

PALADYN Journal of Behavioral Robotics
Spatio-temporal dependencies in functional connectivity inrodent cortical culturesMatthew C. Spencer1∗,Julia H. Downes1,Dimitris Xydas1,Mark W. Hammond1,2,Victor M. Becerra1,Benjamin J. Whalley1,2,Kevin Warwick1,Slawomir J. Nasuto1
1 Cybernetic Research Group,School of Systems Engineering,University of Reading,Whiteknights, RG6 6AY, UK2 School of Pharmacy,University of Reading,Whiteknights, RG6 6AP, UK
AbstractModels of functional connectivity in cortical cultures on multi-electrodes arrays may aid inunderstanding how cognitive pathways form and improve techniques that aim to interfacewith neuronal systems. To enable research on such models, this study uses both data-and model-driven approaches to determine what dependencies are present in and betweenfunctional connectivity networks derived from bursts of extracellularly recorded activity.Properties of excitation in bursts were analysed using correlative techniques to assess thedegree of linear dependence and then two parallel techniques were used to assess functionalconnectivity. Three models presenting increasing levels of spatio-temporal dependency wereused to capture the dynamics of individual functional connections and their consistencieswere verified using surrogate data. By comparing network-wide properties between modelgenerated networks and functional networks from data, complex interdependencies wererevealed. This indicates the persistent co-activation of neuronal pathways in spontaneousbursts, as can be found in whole brain structures.KeywordsFunctional Connectivity · Cortical Cultures · Multi-Electrode Arrays
1. IntroductionCultures of cortical neurones on Multi-Electrode Arrays (MEAs;specialised glass dishes with a lattice of embedded electrodes),are good platforms for investigating anatomical and functionalneuronal networks because they are maintainable for weeks ormonths, can be recorded for extended periods, can be observedunder a microscope, and experimental control can be maintainedover the chemical and electrical environments of the neurones[12, 16, 20, 24]. Also, these cultures are an accessible platform∗E-mail: [email protected]
for studying the computational properties of biological neuronalnetworks to gain understanding of their behaviour and to po-tentially enable their use for control of robotic systems [6, 27].These neurones are initially dissociated to sever synaptic con-nections, but upon seeding onto an MEA, they begin to rein-tegrate their network through the extension of neurites andthe formation of synapses (governed by complex biological pro-cesses, effectively producing a random network), and they be-gin to exhibit action potentials within several days, leading tospontaneous and highly synchronous bursts of excitation aroundthe 14th day in vitro (DIV 14) [16, 27]. These bursts are rem-iniscent of both developmental behaviour in embryonic brains,thought to be responsible for optimising the network for informa-tion processing [23], and of the pathological behaviour observed
1

PALADYN Journal of Behavioral Robotics
in ailments like epilepsy or ataxia [28]. They also may be anobstacle to experimentally inducing synaptic plasticity [12, 28].Nonetheless, these bursts of activity represent a natural sep-aration of time-scales [5] and are ideal phenomena for gaininginsight into the inter-regional interactions [4] of these neuronalnetworks because they are formed spontaneously and tend toinvolve most, if not all, of the observable network.These bursts likely represent cascades of excitation through thesynaptic connections of a neuronal network [16]. While synap-tic changes can occur quickly, the anatomical structure, in theabsence of outside intervention, generally changes on a muchslower time-scale [11]. While this relatively stable anatomicalstructure lends a degree of consistency to these bursts, there isalso significant variation, not only in the burst intensities andlocations, but also in the inter-channel synchrony [15, 23]. Somecultures tend to exhibit burst sizes drawn from a narrow, mono-modal distribution (referred to as a fixed distribution), whileothers exhibit wider mono-modal (variable distribution) or evendistinctly multi-modal distributions (typically bimodal distribu-tions) [27]. While the fixed distribution cultures produce a pro-gression of bursts that are very similar in intensity, the othertwo culture types produce widely varying behaviour, which maypoint to distinct hierarchical arrangements of sub-networks ormodules or a variety of modes of activation [13].Techniques to measure the anatomical connectivity of live neu-ronal networks are limited [17], but functional connectivity (howthe regions of the network interact) can be assessed by throughcommonalities in the spiking patterns recorded from these dif-ferent regions with an MEA [19, 25] and can give insight intothe anatomical structure when observed over long durations [11].Within bursts of excitation, the functional connectivity of the cul-ture can be assessed, creating functional connectivity networks(FCNs) by treating the regions of neuronal tissue surroundingeach recording electrode as nodes and significantly synchronousactivity between regions as edges [4]. These FCNs exhibitsmall-world characteristics, which are important for informa-tion flow and storage [29] and are common in self-organisingsystems, including brain networks [4]. Further, it is likely thatinformation may not be only encoded in the static structures ofthese networks, but also in how they evolve from burst to burst[3].Understanding the precise temporal and spatial dependenciesbetween the regions of the neuronal networks in these burstscould lead to a better understanding of both why and when thebursts occur, as well as their physiological significance. Fur-ther, understanding these dependencies may ultimately lead tomodels that are capable of capturing the inter and intra burstdynamics, thus allowing classification and interpretation of net-work wide spiking activity and help guide intervention to accessthe computational capacity of these networks. To this end, this
0 2000 40000
0.2
0.4
0.6
0.8
1
Burst Size
Variable
0 1000 2000 30000
0.2
0.4
0.6
0.8
1
Burst Size
Bimodal
0 500 10000
0.2
0.4
0.6
0.8
1
Burst Size
Fixed
0
5
10
15
Variab
le
Bimod
al
Fixed
Recordings per Category
# R
ecor
ding
s
Figure 1. Burst Size Distributions. Typical distributions are shown to illustratethe three classifications: variable is wide and unimodal, bimodal hastwo distinct modes, and fixed is narrow and unimodal. The bar graphdenotes the number of cultures of each class that were present inthe analysed dataset.
study aims to investigate the temporal and spatial dependen-cies in the robust and recurrent spontaneous bursts of culturesaged ≈21 DIV [23].The following paper uses data-driven and modelling techniquesto investigate the importance of these spatio-temporal depen-dencies. Properties such as temporal dependence on priorbursts and the range dependence of synchronous links are testedusing linear correlative analyses, while the importance of spa-tial dependencies in FCNs on their small-world properties aretested using three models that incorporate increasing spatio-temporal dependence structures. Ultimately, this study demon-strates the importance of inter-edge dependencies and the com-plexities in the temporal dependence between the FCNs ofbursts.12. Methods2.1. Cortical cultures and spike detectionThe cultures were prepared from chemically and mechanicallydissociated cortical neurones from foetal Wistar rats and seededonto substrate embedded MEAs from MultiChannel SystemsGmbH which provided 60 recording electrodes (59 viable record-ing channels and one ground), arranged in a square lattice, 200µm apart [10, 27]. Fluctuations in extracellular membrane po-tential were observed at these 59 sites for 20 to 40 minutesand spikes of negative polarity, representative of single-unit ormultiple single-unit excitatory events [7], were identified usinga sufficiently sensitive adaptive threshold to avoid missing anyrelevant events. The times of these spikes and the channelson which they occurred were recorded and cleaned to removepositive spikes and other artefacts.The cultures used for this analysis were drawn from two data1 This study is based on work presented in IEEE CIS 2010 [22].
2

PALADYN Journal of Behavioral Robotics
sets: the publicly available data set from [27] and a data setrecorded at the University of Reading. Cultures from both labswere produced using the same protocol and plated at similardensities and were found to have very similar bursting charac-teristics.In choosing recordings for this study, two criteria were consid-ered: that there be a sufficient number of network-wide burstsfor statistical significance, and that the natural behaviour of thecultures be apparent. Cultures aged 21 ± 1 DIV exhibited ro-bust bursting behaviour, therefore the first criterion was met bychoosing cultures of this age where the majority of the channelsshowed regular burst activity. The latter criterion was satisfiedby ensuring that all recordings were made under electrical andpharmacological control conditions. In total, 24 recordings metthese criteria and were studied in this investigation.2.2. Burst detectionNetwork burst detection was performed using the SIMMUX al-gorithm [26], which identifies bursts as periods of significantlyheightened spiking frequency that spanned multiple channels.Overlapping bursts were merged to give a sequence of burstsβr,b for each recording r ∈ [1 . . . 24], such that b ∈ [1 . . . ηr ],where ηr is the number of bursts detected in recording r. Foreach burst, the duration was defined as the time between thefirst spike and the last spike and the size was defined as thenumber of spikes in the burst, across all channels. The inter-burst interval (IBI) was defined as the time between the lastspike of one burst and the first spike of the subsequent burst.For each burst, channels that contributed more than 0.15Nspikes to the burst were said to be active, where N was thenumber of spikes on the channel that contributed the most.2.2.1. Burst classificationThe burst size distributions from recordings were classified intothree categories: fixed and variable distributions (unimodal withlow and high variance, respectively) and bimodal distributions(containing two distinct classes of burst sizes) [27]. The classi-fication was done using the technique described in [27], by firstdividing the burst size distribution into three segments (classify-ing small, medium, and large bursts). First a burst size, N , waschosen as the third largest burst in the sequence, then burstswere classified such that small < 0.25N ≤ medium < 0.75N ≤large. Then the burst distributions were defined as shown inequation 1. Examples of the three burst distribution classes andtheir frequencies within the data set are shown in Figure1.
Fixed ≡ |large| > |medium| ≥ |small|Variable ≡ |medium| ≥ |large|Bimodal ≡ |large| > |medium| < |small| (1)
, where |·| denotes the number of bursts in a segment.2.2.2. Temporal burst analysisBefore considering the spatio-temporal properties of functionalconnectivity in these bursts, some analysis was performed toassess the linear dependencies between the burst properties.This analysis involved performing auto- and cross-correlationsbetween the burst durations, sizes, and preceding IBIs to judgehow these properties interrelate.2.3. Correlations and significanceA number of tests for linear dependence between variables wereperformed in this study using correlation. These correlationswere performed by finding the Pearson’s Coefficient of Correla-tion between two sequences of values at 0 or several lags. Ateach lag step, significance was assessed using Student’s t-test,α = 0.05, unless stated otherwise.2.4. Synchrony analysisFor the two spike trains, si and sj , simultaneously recordedfrom channels, ci and cj , the synchrony between them was de-fined by σ (si, sj ). There are many ways to assess and definesynchronous spike activity [19, 25], but for the purpose of thisstudy, synchrony between two spike trains was defined as reoc-curring coincident spike patterns. Two parallel techniques werechosen to evaluate σ to ensure that the results would not beoverly biased by the chosen technique.The first, denoted σD , is related to lagged correlation and mutualinformation [9] and requires that the spike trains be discretisedinto binary vectors. While this technique is more conventional, ithas a number of known disadvantages [9, 18]. The second tech-nique, denoted σS , is related more to the concept of phase syn-chrony [19] and requires that non-binary instantaneous phasevectors be created from each spike train [14]. This techniqueis faster, time-scale adaptive, but less commonly used than thefirst. Since bursts tend to begin with extremely high spike fre-quency and then fade out, the time-scale adaptive property ofthis technique might be helpful. In both cases, σ was normalizedrelative to the expected synchrony from two independent spiketrains with the same spiking frequencies as si and sj . Bothtechniques are commutative and result in symmetric similaritymatrices.
3

PALADYN Journal of Behavioral Robotics
These similarity matrices were then thresholded to produceunweighted and undirected functional connectivity networks(FCNs), GDr,b and GS
r,b, respectively, where b is the index ofthe burst in recording r. The FCNs are defined on a constantset of nodes that represent the electrodes of the MEA. Edgesbetween the nodes represent significant synchrony.2.4.1. Binned correlation, σDTaking inspiration from the Unitary Events method discussedin [9], the spike trains were first discretised into binary vectorsof 1 ms bins, s∗i and s∗j of length n, where a bin had a valueof 1 when at least one spike occurred during that bin and 0otherwise. Then, σD(si, sj ) = σ ∗D(s∗i , s∗j ) (equation 2) gave thesimilarity value between these two vectors. A maximum lag of14 ms was chosen to reflect the likely maximum time windowin which to observe a monosynaptic interaction across an MEA.Since the vectors are much longer than the number of lag stepsused (≈ 700 vs 14), the reduction in temporal overlap from lagsis negligible. Note that σ ∗D is normalised such that σ ∗D > 1 ifthere are more synchronous events than one might expect fromtwo independent spike trains with spiking frequencies of si andsj , and σ ∗D ≤ 1 otherwise.
σ ∗D(s∗i , s∗j ) = max`∈[−14,14]
n(s∗i (t − `) · s∗j (t))∑t s∗i (t)∑t s∗j (t) (2)
2.4.2. Binless SPIKE distance, σSThe binless technique used here was the SPIKE distance, de-fined in [14], where SPIKE = 0 when two spike trains are iden-tical and SPIKE→ 1 as the spike trains become progressivelydesynchronised. To mitigate the effect of frequency, an empiri-cal distribution was created from the SPIKE value of surrogatespike trains, generated using dithering (100 surrogates, 5 msjitter window) [9]. A p-value, pS (si, sj ), was found from the em-pirical distribution to indicate the significance of the SPIKEdistance. Thus, σS (si, sj ) = 1 − pS (si, sj ), such that σS → 1when two spike trains become more synchronised than expectedby chance.2.4.3. ThresholdingOnce σ values were found for each pair of channels in a burst,a threshold was chosen to convert the similarity matrices intoFCNs. To ensure that all active nodes had neighbours, equation3 was used to define a uniform threshold, T , such that an edgewas placed between nodes i and j in a network if σ (si, sj ) >= T .
T = mini
[maxjσ (si, sj )] (3)
2.5. Complex network modelsEach recording produced a sequence of FCNs, Gr,b, associatedwith the bursts found in that recording. These FCNs representa stochastic series of undirected and unweighted complex net-works on a fixed set of v nodes. Thus, in any burst, an FCN,Gr,b, is a network randomly chosen from the space of all possi-ble networks on v nodes, where significant synchrony betweennodes i and j ∈ [1 . . . v ] during burst b of recording r is denotedeij (r, b) = 1 and 0 otherwise. As v increases, this state spacescales as 2v2 , making the problem quickly intractable. By un-derstanding the precise dependencies in the system, a concisemodel might be produced that adequately captures the dynam-ics.To investigate these spatio-temporal dependencies in the FCNs,three network models were considered. The first two mod-els were homogeneous and heterogeneous Erdös-Renyi randomgraph models, denoted HomER and HetER, respectively. TheHomER model assumes that edges appear in an FCN inde-pendently of each other, their place in the network, and oftheir own pasts. The HetER model maintained the temporaland inter-edge independence, but considers that edges may ap-pear more frequently between some nodes than between others.For each recording, r, the HomER model’s single parameter,pr = P(eij (r, b) = 1), was fit according to equation 4, and theHetER model’s v2 parameters, prij = P(eij (r, b) = 1), were fitaccording to equation 5.
pr = 1ηrv2
ηr∑b=1
v∑i=1
v∑j=1 ei,j (r, b) (4)
prij = 1ηr
ηr∑b=1 ei,j (r, b) (5)
The third model, denoted the Independent Birth-Deathmodel (IndBD), was based on a model presented byGrindrod and Higham [8], in which edges are depen-dent on their pasts but remain independent of each other.In this model, an edge is a binary Markovian birth-death process (P(eij (r, b)|eij (r, 1), eij (r, 2), . . . , eij (r, b − 1)) =P(eij (r, b)|eij (r, b−1))), such that it can be born (transition from0→ 1) or die (transition from 1→ 0) as the network transitionsfrom (b− 1)→ b. Thus the model for each recording is definedby the 2v2 parameters defined in equation 6.
αrij = P(eij (r, b) = 1|eij (r, b− 1) = 0)ωrij = P(eij (r, b) = 0|eij (r, b− 1) = 1) (6)
These birth paramters, α , and death parameters, ω, were fitusing expectation maximization, as described in [8].
4

PALADYN Journal of Behavioral Robotics
2.5.1. Model capture performanceEach model was evaluated to compare how well each capturedthe dynamics of the data. The evaluation was performed firstby considering how well individual edge series were captured,and then by considering how well entire network series werecaptured.The capture performance was evaluated by using each fittedmodel to generate 1000 surrogate networks, whose likelihoods,given the model that created them, were used to create an em-pirical distribution for that model. Then, the likelihood of eachreal network sequence was found, given the model which wasfitted to it, and compared to the empirical distributions to geta p-value. The p-value for a model indicated the probabilitythat the model could have generated the real sequence and wasused to assess the quality of fit. Since all three models haveedges that evolve independently, the likelihood of a network issimply the product of the likelihoods of the edges.2.6. Network topology analysisAll three models described in section 2.5 assume that the edgesin the FCNs are independent of each other. To evaluate thishypothesis, four topological properties were compared betweenthe real networks and model generated surrogates. Since brainnetworks regularly have a small-world topology [4], the firstthree measures evaluated this property: average path length(also called characteristic path) and mean clustering coefficientmeasured the long and short range efficiency, respectively [1, 2],and small-worldness was used to evaluate whether the MCCto APL ratio was greater than might be expected in equivalentrandom networks [29]. The last was mean node degree, a typicalindicator of the edge density of a network [2].For each FCN and its related surrogates, these four measureswere calculated and their distributions across the bursts withineach recording were compared.3. Results3.1. Network burstsTwenty-four electro-physiological recordings taken from rodentcortical neurones cultured on MEAs were analysed and burstsof excitation were identified using the SIMMUX algorithm andtheir sizes, durations, and inter-burst intervals were identified(see section 2.2). The linear dependencies between these prop-erties were assessed with cross-correlation. A strong positivecorrelation was found between the burst size and burst dura-tion, which is unsurprising given that neurones have a minimumpost-firing refractory time, limiting their maximum spiking fre-
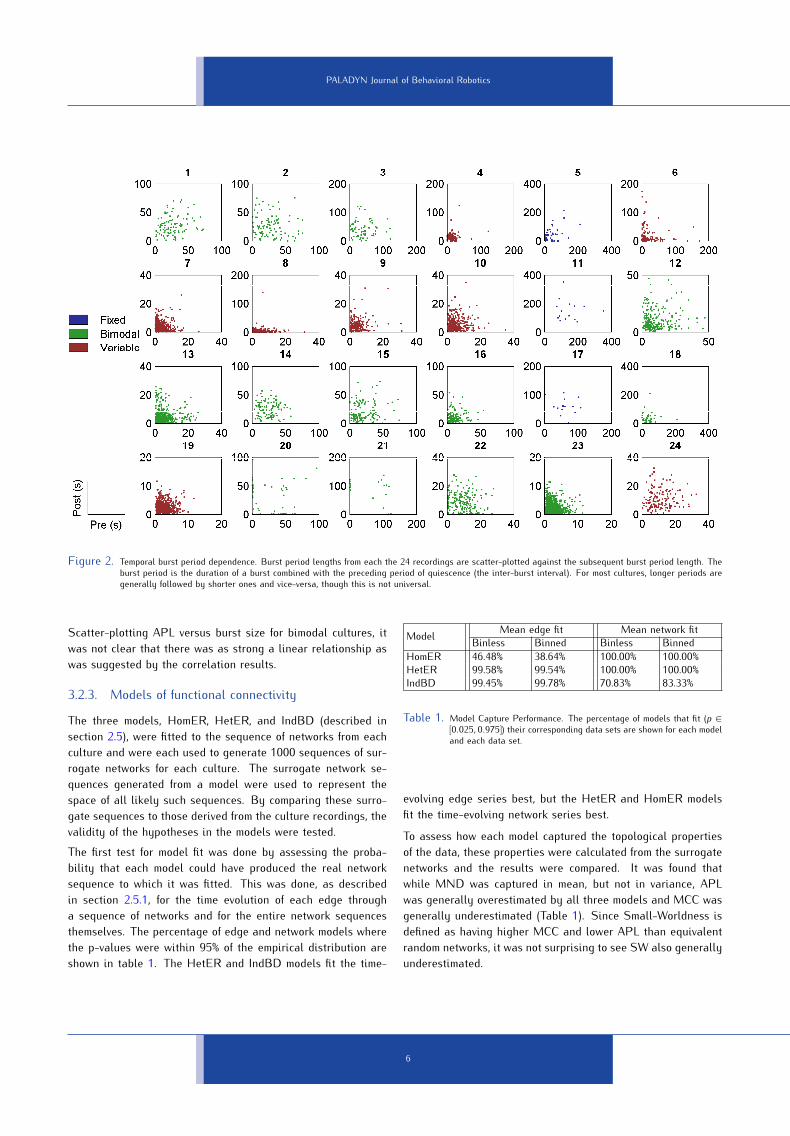
quency.The nature of periodicity in the bursting patterns of the cul-tures was investigated, first by defining burst periods as theduration of a burst combined with its preceding inter-burst in-terval, and then by scatter-plotting and correlating each periodduration with the subsequent one (Figure2). It was found thatmany variable and bimodal cultures were periodic, where longburst periods tended to follow short ones and vice-versa. Fixeddistribution cultures showed a more positive linear relationship,but the bursts in these cultures are by definition very similar insize.3.2. Functional connectivityThe binned and binless synchrony techniques described in sec-tion 2.4 were applied to each burst from each culture and theresults were thresholded to yield sequences of functional con-nectivity networks for each culture. For each network of each se-quence, four network properties were calculated: Average PathLength (APL), Mean Clustering Coefficient (MCC), Mean NodeDegree (MND), and Small-Worldness (SW); refer to section 2.6for details. In Figure4, the topological parameters from binnedand binless functional connectivity networks were compared andshowing that the two techniques are largely analogous.3.2.1. Range dependenceIn 19 of the binless sequences and in 14 of the binned sequences,edges were significantly more likely to appear between a pair ofnodes if their corresponding electrodes were closer on the MEA.In a single binned sequence, there was a small but significantpositive relationship which can be explained by there being noactivity on the central electrodes of the MEA (likely because thecells in the centre had died or lifted off the surface). However,none of these correlations were stronger than −0.3, 14% werestronger than −0.2, and around 30% were not significant at all.3.2.2. Topological dependence on burst sizeThe effect of burst size on each of the four topological propertiesfrom a network was assessed by correlating each property withthe size of the burst that generated the network. Scatter-plots ofthese comparisons are shown in Figure3 for network sequencesproduced by each technique.In most sequences produced by both synchrony techniques, themean degrees of the networks increased as the bursts grew insize and this had direct consequence for mean clustering. Therelationship between average path length and burst size wasnot quite as clear, though. With increased numbers of edgesin the network, one would have expected the APL to decrease,and while it did for the binned variable cultures, the oppositewas generally true for all others, especially for bimodal cultures.
5
PALADYN Journal of Behavioral Robotics
Figure 2. Temporal burst period dependence. Burst period lengths from each the 24 recordings are scatter-plotted against the subsequent burst period length. Theburst period is the duration of a burst combined with the preceding period of quiescence (the inter-burst interval). For most cultures, longer periods aregenerally followed by shorter ones and vice-versa, though this is not universal.
Scatter-plotting APL versus burst size for bimodal cultures, itwas not clear that there was as strong a linear relationship aswas suggested by the correlation results.3.2.3. Models of functional connectivityThe three models, HomER, HetER, and IndBD (described insection 2.5), were fitted to the sequence of networks from eachculture and were each used to generate 1000 sequences of sur-rogate networks for each culture. The surrogate network se-quences generated from a model were used to represent thespace of all likely such sequences. By comparing these surro-gate sequences to those derived from the culture recordings, thevalidity of the hypotheses in the models were tested.The first test for model fit was done by assessing the proba-bility that each model could have produced the real networksequence to which it was fitted. This was done, as describedin section 2.5.1, for the time evolution of each edge througha sequence of networks and for the entire network sequencesthemselves. The percentage of edge and network models wherethe p-values were within 95% of the empirical distribution areshown in table 1. The HetER and IndBD models fit the time-
Model Mean edge fit Mean network fitBinless Binned Binless BinnedHomER 46.48% 38.64% 100.00% 100.00%HetER 99.58% 99.54% 100.00% 100.00%IndBD 99.45% 99.78% 70.83% 83.33%Table 1. Model Capture Performance. The percentage of models that fit (p ∈[0.025, 0.975]) their corresponding data sets are shown for each modeland each data set.
evolving edge series best, but the HetER and HomER modelsfit the time-evolving network series best.To assess how each model captured the topological propertiesof the data, these properties were calculated from the surrogatenetworks and the results were compared. It was found thatwhile MND was captured in mean, but not in variance, APLwas generally overestimated by all three models and MCC wasgenerally underestimated (Table 1). Since Small-Worldness isdefined as having higher MCC and lower APL than equivalentrandom networks, it was not surprising to see SW also generallyunderestimated.
6

PALADYN Journal of Behavioral Robotics
Figure 3. Topological dependence on burst size in network sequences. Each of the four topological properties (Average Path Length, Mean Clustering Coefficient,Mean Node Degree, and Small-Worldness) from each of the three classes (variable, bimodal, and fixed) and constructed with each synchrony technique(Binless and Binned) are shown scatter-plotted against burst size, measured in 103 spikes.
−10 −5 0 50
0.05
0.1
0.15
0.2
APLD
− APLS
Den
sity
−1 0 10
0.05
0.1
0.15
0.2
MCCD
− MCCS
Den
sity
−50 0 500
0.1
0.2
0.3
0.4
0.5
MNDD
− MNDS
Den
sity
−1000 0 10000
0.2
0.4
0.6
0.8
SWD
− SWS
Den
sity
Figure 4. Comparison of topological properties between Binned networks andBinless networks. The synchrony in the Binned networks, D, wasassessed using a binned covariance measure, while the synchronyin the Binless networks, S, was assessed using the binless SPIKEdistance measure. The dramatic peaks at 0 indicate that the twotechniques produce networks with very similar topologies, with thebinned technique producing slightly more edges, as indicated by theright weighted MND and MCC, and left-weighted APL.
4. DiscussionTo assess the spatio-temporal dependencies in both excitationand functional connectivity within network bursts, correlations
were performed between burst properties, functional connectiv-ity networks were produced, and the properties of these net-works were analysed. The burst property correlations foundthat most variable and bimodally distributed cultures tend to adegree of periodicity, in which short burst periods follow longones, and vice-versa.Once functional connectivity networks (FCNs) were constructedfrom the bursts, further spatial and temporal dependencies wereinvestigated between the synchronous links. In many cultures,significant range dependence was found, suggesting that syn-chronous links were more likely to be found between electrodesthat are located close together on the surface of the MEA. Thisis not surprising, considering that proximal electrodes may de-tect much of the same local field potential and that neighbour-ing neurones might be more likely to be synaptically connected.However these correlations were inconsistent and minor, sug-gesting that the distance between a pair of electrodes is not a
7

PALADYN Journal of Behavioral Robotics
0 2 4 6 8 10 12
RealHomERHetERIndBD
0 2 4 6 8 10
RealHomERHetERIndBD
0 0.2 0.4 0.6 0.8
RealHomERHetERIndBD
0 0.2 0.4 0.6 0.8 1
RealHomERHetERIndBD
0 10 20 30 40
RealHomERHetERIndBD
0 10 20 30 40 50
RealHomERHetERIndBD
0 200 400 600 800
RealHomERHetERIndBD
0 200 400 600 800 1000
RealHomERHetERIndBD
Binless Binned
APL
MCC
MND
SW
Figure 5. Topological properties of networks produced from real data sets and the models fitted to them. Each subplot shows the aggregate distributions of onenetwork property from networks generated using one of the two synchrony techniques (denoted real) and the surrogate network generated from the threemodels fit to those networks. Regardless of synchrony technique, Average Path Length is generally overestimated by the models and Mean ClusteringCoefficient is generally underestimated. The models tend to reproduce the average mean node degree of the data, but not the variance. Since APL andMCC are poorly captured, Small-Worldness is correspondingly underestimated.
major factor in predicting the likelihood of a functional connec-tion between them.Topological properties were calculated from the networks andthese were compared to the sizes of the bursts that had pro-duced them. It was found that in variable and bimodal cultures,larger bursts tended to have larger minimum clustering coeffi-cients and larger minimum node degrees, though the values donot linearly follow the burst size. In bigger bursts, more chan-nels are active in the burst, increasing the maximum number ofpossible functional links. Thus, it is not surprising to observethat larger bursts might produce more edges (as reflected bythe degree), however because these additional edges also comewith additional nodes, the degree, clustering, or path length donot necessarily follow linearly.Spatiotemporal relationships between edges were investigatedthrough the use of three models of edge appearance in func-tional networks. The first model, HomER, hypothesised thatedge might appear completely at random between any nodes,independent of each other or their pasts. For capturing indi-vidual edge progressions through sequences of networks, this
model was a poor choice, only accurately capturing the dynam-ics of 46.48% and 38.64% of the edge individual sequences foundin the data, for Binless and Binned networks respectively. How-ever, this model quite accurately captured the network progres-sion dynamics when assuming that all edges were independent.The second model, HetER, hypothesised that each pair of nodesmight have a specific probability of being joined by a functionallink in a given network, but maintained that these links wouldbe independent of each other and their pasts. This model veryaccurately captured both the edge and network progression dy-namics.The final model, IndBD, added to the HetER hypothesis thatthe appearance of an edge between a pair of nodes may alsobe dependent on whether those nodes were functionally linkedin the previous burst. Since the edge appearance dynamicswere modelled with ergodic Markov chains, the steady-statebehaviour closely resembled that of the independent identicallydistributed edge dynamics of the HetER model. However, whilethis model captured the edge dynamics very accurately, only70% and 83% of the network sequences’ dynamics were captured,
8

PALADYN Journal of Behavioral Robotics
for Binless and Binned networks, respectively. This suggeststhat the functional network observed during a burst has littledependence on the network observed during the previous burst.The three models used in this study assume that the edge dy-namics in functional networks are independent from each other.The validity of this assumption was tested by observing the gen-eral topological properties of surrogate networks generated bythese models and comparing them to analogous properties fromthe real data. In both Binless and Binned networks, the averagepath length was generally over-estimated by the models, and themean clustering coefficient was generally under-estimated. Themodels tended to produce an average mean node degree similarto the data, but the data exhibited more than triple the varia-tion. The lower MCC and higher APL of the surrogate networksshows that none of the models capture the small-world proper-ties of the biological networks; properties that are thought tobe crucial to information passing and storage [4].By assessing synchrony by two different techniques, it wasfound that while the Binned technique tended to produceslightly denser networks, the specific definition of functionalconnectivity did not drastically affect the small-world proper-ties of the networks.5. ConclusionThis study used a variety of techniques to investigate the spatialand temporal dependencies of evolving functional connectivityin cultures of cortical neurones. Understanding these depen-dencies will provide the insight necessary to construct modelsthat can accurately capture the dynamics of bursts of activity inneuronal networks. Such models would be useful for classifyingburst dynamics, gaining insight into neuronal network struc-ture, and planning interventions to prevent or alter the natureof these bursts, allowing further understanding of the computa-tional capabilities of biological neuronal networks and perhapsenabling their use as suitable robotic controllers [6]. While thepresent study focuses on randomly arranged neuronal networksin culture, these findings might generalise to the highly struc-tured networks found in the whole brain, where network burstsare either formative or pathological [23], and interventions mightbe used to repair damage or pre-empt seizures.This study found that many cultures tend to exhibit periodicsequences of longer bursts followed by shorter bursts and vice-versa. It was also found that the functional networks withinthese bursts do not depend on the preceding bursts, but dohave strong small-world topologies that are not captured bymodels that lack inter-edge dependencies. This means that notall functional pathways are activated in every burst, nor arepathways regularly activated in subsequent bursts. However,
the presence of spatial dependencies would indicate that whena pathway between two nodes is activated, it is activated alongwith a regular set of other pathways. This might point to thepresence of discrete subnetworks or consistent information flowpathways within the neuronal network, as are found in mem-ory recall, discrimination, and decision making in whole brainstructures.Random network models that aim to make use of these findingswould need to consider the inter-edge dependencies and theresultant small-world characteristics as well as the variabilityof burst durations and inter-burst intervals. While the Watts-Strogatz model for randomly generating small-world networks[29] or the configuration model for generating networks with pro-scribed degree distributions [2] might be reasonable places tostart, neither of these models can capture the inter-edge de-pendencies or the variability seen in the data. Instead, it wouldlikely be better to search for a model inspired by the underlyingbiological system, and perhaps one that uses finer-grained andmore regular time-steps than those investigated here. Such amodel, using the past interplay between node dynamics to con-struct functional connections at any given step has been recentlyshown to be promising [21]. Another possible direction might beto track a resource, such as an abstract ’cellular energy’ whichmight encompass a variety of intra-cellular properties (eg. num-ber of available vesicles), and use this resource to regulate thefrequency and duration of bursting events. Also, once a suitablemodel has be found to capture the dynamics in the data, sucha model would be limited by the manageability of its inversesolution.Supposing that these challenges can be overcome, these modelsmay provide a key to improving clinical neurological treatments,understanding neuronal network function, and building the nextgeneration of interfaces between biological tissue and roboticsystems.AcknowledgementThe authors would like to thank Prof S. Potter at the GeorgiaInst. of Technology for generously providing the set of neuronalrecordings used for this study.References[1] R. Albert and A. L. Barabási. Statistical mechanics of com-plex networks. Reviews of Modern Physics, 74(1):47–97,2002.[2] S. Boccaletti, V. Latora, Y. Moreno, M. Chavez, andD. Hwang. Complex networks: Structure and dynamics.
9

PALADYN Journal of Behavioral Robotics
Physics Reports, 424(4-5):175–308, February 2006.[3] P. Borgnat, E. Fleury, J. L. Guillaume, C. Magnien, C. Ro-bardet, and A. Scherrer. Evolving networks. In FrançoiseFogelman-Soulié, Domenico Perrotta, Jakub Piskorski, andRalf Steinberg, editors, Proceedings of NATO AdvancedStudy Institute on Mining Massive Data Sets for Security,pages 198–204. IOS Press, 2008.[4] E. Bullmore and O. Sporns. Complex brain networks: graphtheoretical analysis of structural and functional systems.Nature Reviews Neuroscience, 10(3):186–98, March 2009.[5] M. Chiappalone, A. Novellino, I. Vaida, A. Vato, S. Marti-noia, and J. Van Pelt. Burst detection algorithms for theanalysis of spatio-temporal patterns in cortical networks ofneurons. Neurocomputing, 65-66:653–662, 2005.[6] T.B. DeMarse, D.A. Wagenaar, A.W. Blau, and S.M. Potter.The neurally controlled animat: biological brains actingwith simulated bodies. Autonomous Robots, 11(3):305–310,2001.[7] U. Egert, D. Heck, and A. Aertsen. Two-dimensional mon-itoring of spiking networks in acute brain slices. Experi-mental Brain Research, 142(2):268–74, January 2002.[8] P. Grindrod and D. J. Higham. Evolving graphs: dynamicalmodels, inverse problems and propagation. Proc. Roy. Soc.A, 466(2115):753–770, November 2009.[9] S. Grün. Data-driven significance estimation for pre-cise spike correlation. Journal of Neurophysiology,101(3):1126–40, March 2009.[10] M. W. Hammond, S. Marshall, J. Downes, D. Xydas, S. J.Nasuto, V. M. Becerra, K. Warwick, and B. J. Whalley. Ro-bust methodology for the study of cultured neuronal net-works on MEAs, 2008.[11] C. J. Honey, R. Kötter, M. Breakspear, and O. Sporns. Net-work structure of cerebral cortex shapes functional connec-tivity on multiple time scales. Proc. Nat. Acad. Sci. USA,104(24):10240–5, June 2007.[12] Y. Jimbo, T. Tateno, and H. P. C. Robinson. Simultaneous in-duction of pathway-specific potentiation and depression innetworks of cortical neurons. Biophysical Journal, 76:670–678, 1999.[13] M. Kaiser. Hierarchy and dynamics of neural networks.Frontiers in Neuroinformatics, 4(August):10–12, 2010.[14] T. Kreuz, D. Chicharro, M. Greschner, and R. G. Andrzejak.Time-resolved and time-scale adaptive measures of spiketrain synchrony. J. Neurosci. Methods, 195(1):92–106, De-cember 2010.[15] R. Madhavan, Z. C. Chao, and S. M. Potter. Plasticity ofrecurring spatiotemporal activity patterns in cortical net-works. Physical Biology, 4(3):181–193, 2007.[16] E. Maeda, H. P. Robinson, and A. Kawana. The mecha-
nisms of generation and propagation of synchronized burst-ing in developing networks of cortical neurons. J. Neurosci.,15(10):6834–45, October 1995.[17] A. Minerbi, R. Kahana, L. Goldfeld, M. Kaufman, S. Marom,and N. E. Ziv. Long-term relationships between synaptictenacity, synaptic remodeling, and network activity. PLoSBiology, 7(6):e1000136, June 2009.[18] A. R. C. Paiva, I. Park, and J. C. Príncipe. A comparison ofbinless spike train measures. Neural Computing & Appli-cations, 19(3):405–419, 2010.[19] E. Pereda, Q. R. Quiroga, and J. Bhattacharya. Non-linear multivariate analysis of neurophysiological signals.Progress in Neurobiology, 77(1-2):1–37, 2005.[20] G. Shahaf and S. Marom. Learning in networks of corticalneurons. J. Neurosci., 21(22):8782, 2001.[21] M. C. Spencer, J. H. Downes, D. Xydas, M. W. Hammond,V. M. Becerra, K. Warwick, B. J. Whalley, and S. J. Nasuto.Multi-scale evolving complex network model of functionalconnectivity in neuronal cultures. IEEE Trans. Bio-med.Eng., pages 1–5, October 2011.[22] M. C. Spencer, D. Xydas, J. H. Downes, M. W. Hammond,V. M. Becerra, K. Warwick, B. J. Whalley, and S. J. Nasuto.Investigation of spatio-temporal dependencies in neuronalfunctional connectivity. In 9th IEEE Int. Conf. Cyber. Intel.Sys., 2010.[23] J. van Pelt, I. Vajda, P. S. Wolters, M. A. Corner, and Ger J. A.Ramakers. Dynamics and plasticity in developing neuronalnetworks in vitro. Prog. Brain Res., 147:173–88, January2005.[24] J. van Pelt, P. S. Wolters, Michael A. Corner, W. L. C. Rut-ten, and Ger J. A. Ramakers. Long-term characterizationof firing dynamics of spontaneous bursts in cultured neu-ral networks. IEEE Trans. Bio-med. Eng., 51(11):2051–62,November 2004.[25] J. D. Victor. Spike train metrics. Current Opinion in Neu-robiology, 15(5):585–92, October 2005.[26] D. A. Wagenaar and T. B. DeMarse. Meabench: A toolsetfor multi-electrode data acquisition and on-line analysis.Proc. 2nd Int. IEEE EMBS Conf. Neural Eng., 2005.[27] D. A. Wagenaar, J. Pine, and S. M. Potter. An extremely richrepertoire of bursting patterns during the development ofcortical cultures. BMC Neuroscience, 7:11, January 2006.[28] D. A. Wagenaar, J. Pine, and S. M. Potter. Searching forplasticity in dissociated cortical cultures on multi-electrodearrays. Journal of Negative Results in Biomedicine, 5:16,January 2006.[29] D. J. Watts and S. H. Strogatz. Collective dynamics of’small-world’ networks. Nature, 393:440–442, 1998.
10
Copyright © 2022 FDOKUMEN