On the Influence of Nozzle Geometries on Supersonic Curved ...
75th EAGE Conference & Exhibition incorporating SPE EUROPEC 2013
London, UK, 10-13 June 2013
Spatial variations in geometries of polygonal faults due to stress perturbations & interplay with
fluid venting features
2Sutieng Ho*,
2Dan Carruthers*,
1Patrice Imbert and
2Joe Cartwright
1Total, CSTJF, avenue Larribau, 64018, Pau
23D Lab, Cardiff University, School of Earth and Ocean Sciences, Main Building, Park
Place, Cardiff, UK, Wales, CF10 3YE
*Email contact: [email protected]; [email protected];[email protected]
Summary
High-resolution 3-D seismic data from offshore Angola is used to document spatial variations
in the planform geometry of polygonal faults (PFs) hosted in a succession of Neogene-
Quaternary hemipelagite deposits. We show that the regionally isotropic PF network becomes
anisotropic around pockmarks, salt stocks and salt withdrawal basins. Four main patterns are
observed: ladder patterns composed of long (first-order) and short (second-order) faults
which are orthogonal to each other, radial patterns around salt stocks, concentric patterns
around pockmarks and in salt withdrawal basins, and a hybrid form of radial and concentric
fault patterns where pockmarks occur on diapir flanks. Fluid venting structures such
methane-related carbonates and chimneys stem from PF intersections. The linear-to-elliptical
planform geometry of fluid venting structures is controlled by the local state of stress around
PFs. The transition between radial faults and background PF occurs at 0.5-1 stock radius from
the salt contact and is interpreted as a marker of the diapirs hoop stress field. Our work
highlights the sensitivity of polygonal fault systems to perturbations in the regional stress
state, which further controls the location and geometry of fluid venting structures.
Author's personal copy uploaded to academia.edu - Not for commercial use
DOI: 10.3997/2214-4609.20131054

75th EAGE Conference & Exhibition incorporating SPE EUROPEC 2013
London, UK, 10-13 June 2013
Introduction
Joint and fracture networks provide pathways for fluid flow and predicting spatial variations in their
length, spacing and orientations is vital in reservoir modelling (Rawnsley and Wei, 2001). In the
absence of cores from densely spaced wellbores, reservoir geologists rely on constraints of the in-situ
or palaeo stress field and analogous outcrop exposures to extrapolate fracture models to the 10-1000’s
m scale (Bourne et al. 2000; Rawnsley and Wei, 2001). To overcome the limitations imposed by the
scale of outcrop exposures and discontinuity of data samples between adjacent wells we present a case
study of laterally extensive (>100 km2) arrays of small intra-formational normal faults in a Neogene-
Quaternary succession of hemipelagites offshore Angola. These small, densely-spaced normal faults
formally known as Polygonal Faults (PFs) cut seismic horizons with throws of 10-15 m and define
vast polygonal fault networks (Fig 1). The spacing and length of the faults are crudely related to tier
thickness and because they are confined to very fine-grained sediments they are potentially, scalable
analogues to sub-seismic fracture networks in units containing shale gas.
Polygonal fault systems (PFS) are a unique type of normal fault in that they form in subsiding
sedimentary basins free of lateral tectonic forces (Goulty, 2001). They form by contraction-driven
shear failure during the early stages of sediment compaction and dewatering (Cartwright, 2011).
During one-dimensional consolidation of the sediment layer, the maximum compressive stress (Sv) is
vertical and the intermediate (SH) and least compressive stresses (Sh) are horizontal (Terzaghi and
Peck, 1948). The lack of strongly preferred fault strikes in PFS implies that the horizontal stress is
effectively isotropic over large areas of basins where polygonal faults form (Cartwright, 2011; Goulty,
2001). In this study we show that polygonal faults are strongly aligned around pockmark craters, salt
withdrawal basins and around salt stocks and walls (Figs 2-3). Since SH is parallel to fault strike it
can be deduced that regions where the faults are aligned the regional stress state was anisotropic. The
aim of this work is to use high-resolution 3-D seismic data to investigate relationships between the
planform geometry of PFs and their proximity to salt structures and fluid venting structures. We also
demonstrate that the planform arrangements of PFSs control the location and geometry of fluid
venting structures such as seismic chimneys and methane-related carbonate patches.
Examples of different polygonal fault patterns
Two layer-bound arrays (tiers) of PFs are identified in the Neogene-to-Quaternary section of the study
area (Fig 1). The deepest tier (Tier 1) ranges from 70-130 m thick and is composed of Late Miocene
fine-grained turbidites. The shallowest tier (Tier 2) contains Pliocene claystones and has a maximum
thickness of c. 250 m but thins laterally until the tier pinches out (Fig 1). Where the seismic facies is
parallel stratified and dips gently, the normal faults cut intra-tier horizons so as to define vast
(isotropic) polygonal fault networks (Fig 2a). The strike length and spacing between individual PF
segments in map view are crudely related to tier thickness. For example, PF segments in Tier 1 range
from 100-180 m in length and have an average spacing of 150-200 m, whilst those in Tier 2 are 150-
250 m in length and have an average spacing of 100-150 m.
Fig 1 - Arbitrary seismic line intersecting 6E and E flank of Salt Stock 1and showing the variable
thickness of PF tiers. See position of line on Fig 3d. The transition from radials (RFs) to PFs is
denoted by the transition boundary. The pinch-out of Tier 1 is indicated by the dashed line.
S
Author's personal copy uploaded to academia.edu - Not for commercial use
DOI: 10.3997/2214-4609.20131054
75th EAGE Conference & Exhibition incorporating SPE EUROPEC 2013
London, UK, 10-13 June 2013
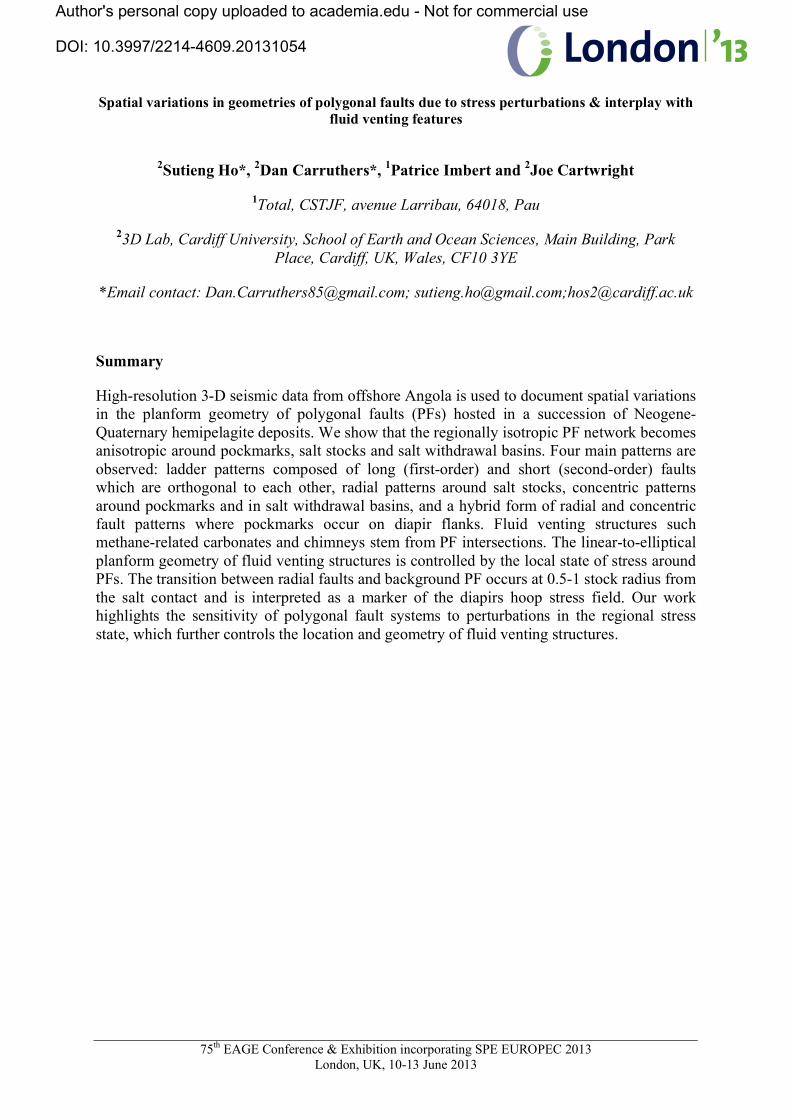
Fig 2 - a) Dip map of a horizon within Tier 2 showing PF patterns switching to Concentric faults
(CFs) above a pockmark crater. b) Dip map showing concentric first-order PF in a salt withdrawal
basin. c) Zoomed amplitude map showing aligned first-order PFs in a withdrawal basin between two
salt stocks. Blue and brown arrows denote locations of elongate pipes and methane-related
carbonates respectively. d) Zoomed seismic section bisecting pockmark crater, e) Zoomed seismic line
of an elongate fluid pipe between conjugate PFs. Stress ellipses are defined by ratio of Sh (blue
arrow) and SH (red arrow).
Ladder patterns
Polygonal faults define ladder-type patterns in Figures 2a-c which are composed of unidirectional,
long faults (referred to as first-order PFs) and shorter orthogonal faults which we refer to as second-
order PFs. Both first and second order PFs are confined to the aforementioned tiers but first-order
faults segments have aspect ratios exceeding 30-60 whilst second-order faults segments have the same
lengths as in PFs (100-200 m). First-order faults deflect to maintain either normal or tangential
relationships with local structures or where subtle changes in dip occur (Fig 2a-c). First-order faults
are interpreted to form preferentially to second-order faults and in a weak anisotropic stress state
where the strike of first-order faults are parallel to the maximum horizontal principle stress (see stress
ellipse on Fig 2a-c).
Concentric fault patterns around pockmark craters and salt withdrawal basins
PFs switch to locally developed concentric faults (CFs) around and above pockmark craters located
near the base of tiers (Fig 2a-b, d). The diameter of the concentrically faulted regions is ca. 600-1200
m and closely matches the diameter of pockmarks although the CFs sometimes occur outside of the
N
N
c
500 m
Second-order PF
First-order PF
Fig 2d
Deflection of first-order PF
a
N
Author's personal copy uploaded to academia.edu - Not for commercial use
DOI: 10.3997/2214-4609.20131054
75th EAGE Conference & Exhibition incorporating SPE EUROPEC 2013
London, UK, 10-13 June 2013
immediate pockmark crater (Fig 2d). The strikes of first-order PFs deflect around pockmarks or spiral
toward the centre of the pockmark crater (Fig 2a). First-order PFs are also concentrically aligned in
salt withdrawal basins (Fig 2b). Since they are aligned parallel to the contours of the folded substrate
and the strikes of ‘through-going’ tectonic faults we suggest their alignment reflects extensional
stresses imposed on tiers during deepening of the salt withdrawal basins.
Relationship between fluid venting structures and anisotropic PF patterns
Small chimneys 150 m in diameter occur between PF’s in some localised areas. They are often
elongate and parallel to the strikes of the nearest PFs (Fig 2c). The chimneys occur directly above the
intersection of conjugate PF pairs in the crest of hangingwall monoclines (Fig 2e). We postulate that
the fluid migrated along fractures which opened preferentially in these locations and perpendicular to
the perturbed stress field around adjacent PFs. Fluid flow also facilitated production of methane-
related carbonates (see Ho et al. 2012) which are expressed as positive high-amplitude anomalies
(PHAAs) on (Fig 2c). PHAAs have linear planforms which are also parallel to PF strikes. The close
spatial and geometric relationship of venting structures to PFs strongly suggests that PFs provided
venting-exits and that the local stress state controlled their elongate geometry.
Radial faults around salt stocks
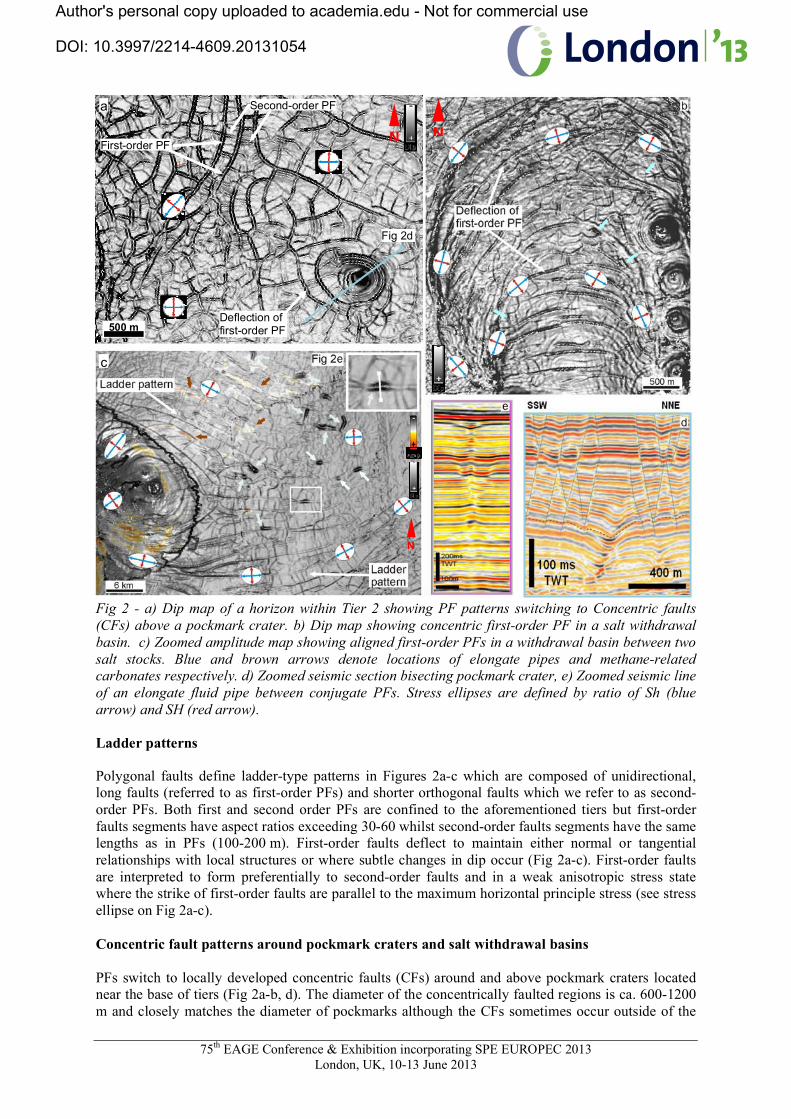
PFs switch to a closely-spaced array of radial faults (RFs) around salt stocks (Fig 3a-g). RFs have the
same spacing (100-230 m) as PFs and are confined to the same tiers. The one exception occurs where
Tier 2 pinches out ca. 6-7 km before the salt contact on the East-and-Western flank of Salt Stock 1
(Fig 1, 3d). Note that RFs occur at the same location in the underlying tier (Fig 3a). The regional
nn
Fig 3 – a-c) Zoomed dip maps within Tier 1 showing RFs around Salt Stock 1. d) Dip map of horizon
within Tier 2 around Salt Stock 1. e-g) Dip map of horizon with Tier 2 around Salt Stock 2. Yellow
N
N
N
N
Author's personal copy uploaded to academia.edu - Not for commercial use
DOI: 10.3997/2214-4609.20131054

75th EAGE Conference & Exhibition incorporating SPE EUROPEC 2013
London, UK, 10-13 June 2013
line on ‘d’ define the pinch-out of PF Tier 2, red dashed line shows position of transition boundaries
TBi and TBo. Stress ellipses are defined by ratio of Sh (blue arrows) and SH (red arrows).
isotropic (polygonal) faults pattern is separated from locally developed RFs by an intermediate zone
of RFs and CFs in Figure 3f. The lateral tips of CFs terminate at longer RFs like in the ladder patterns
shown in Figures 2a-c. Deflections of first-order PFs provide an indication of stress trajectories at the
time of faulting and constrain the lateral extent of the local hoop stress field associated with the salt
stocks. This outermost transition boundary is located approximately 1 stock radius from the salt
contact (Fig 3f) whilst the boundary marking the switch to just RFs is only 0.5 stock radius from the
salt contact (Fig 3a,d,e). Both transition boundaries mimic the plan form geometry of the salt stocks.
The change from radial-to-concentric and concentric-to-PFs is interpreted to represent decaying
magnitudes of hoop stress with distance from the salt stock.
Super-imposed radial and concentric fault patterns
The spoke-like RF patterns are disrupted around locally developed pockmarks (Fig 3d, g, e). The RFs
deflect from their initial, normal trajectory by 15-40° around the perimeter of pockmark craters (Fig
3g) forming a hybrid radial-concentric fault. The angle of deflection depends on the diameter of the
pockmark with respect to fault spacing and the proximity of the pockmark to the salt contact. The
patterns indicate that hoop stresses can vary as much as 40° from the tangent to the salt contact at the
base of the flank but is no more than 15° within the first 200 m of the salt contact. The deflection of
RFs toward adjacent salt withdrawal basins (Fig 2b-c) reflect the superimposition of stress states
associated with the diapir and extensional withdrawal basin onto the regional isotropic stress field.
Conclusions
We have demonstrated that the planform geometry of PFs is anisotropic in the vicinity of salt stocks
and fluid venting structures. We interpret the anisotropy to reflect perturbations in the regional stress
field by local stresses related to diapirism and fluid venting. The geometry and location of fluid
venting structures is controlled by the location of PF intersections and the local state of stress.
Acknowledgments
We thank Total and Cardiff University for the funding, Total for giving the permission of publication.
References
Bourne, S., Franz, B., Lex, R., Stephenson, B., Alex, W., Willemse, E. [2000]. Predictive modelling
of naturally fractured reservoirs using geomechanics and flow simulation. In Abu Dhabi International
Petroleum Exhibition and Conference.
Cartwright, J., [2011]. Diagenetically induced shear failure of fine-grained sediments and the
development of polygonal fault systems. Marine and Petroleum Geology. 28(9), 1593-1610.
Goulty, N., [2001]. Mechanics of layer-bound polygonal faulting in fine grained sediments. Journal of
Geological Society 159(3), 239-246.
Ho, S., Cartwright, J. A., Imbert, P. [2012]. Vertical evolution of fluid venting structures in relation to
gas flux, in the Neogene-Quaternary of the Lower Congo Basin, Offshore Angola. Marine Geology.
Rawnsley, K., Wei, L. [2001]. Evaluation of a new method to build geological models of fractured
reservoirs calibrated to production data. Petroleum Geoscience, 7(1), 23-33.
Terzaghi, K., Peck, R.B., Mesri, G., [1948]. Soil Mechanics in Engineering Practice, Wiley. New
York.
Author's personal copy uploaded to academia.edu - Not for commercial use
DOI: 10.3997/2214-4609.20131054
Copyright © 2022 FDOKUMEN