Molecular dynamics simulations of evaporation-induced nanoparticle assembly
Upload
independentCategory
view
2download
0
Spatial variability of evaporation and moisture storage in the
swamps of the upper Nile studied by remote sensing techniques
Y.A. Mohameda,*, W.G.M. Bastiaanssenb, H.H.G. Savenijea
aIHE, P.O. Box 3015, 2601 DA Delft, The NetherlandsbITC, P.O. Box 6, 7500 AA Enschede, The Netherlands
Received 29 August 2002; revised 19 September 2003; accepted 14 November 2003
Abstract
The water balance of the upper Nile swamps, in particular, the Sudd, has been the topic of debate for many years. Surface
Energy Balance Algorithm for Land (SEBAL) is a parameterization scheme of surface heat fluxes based on spectral satellite
measurements. The SEBAL scheme has been applied to derive the energy balance components from National Oceanic
Atmospheric Administration-Advanced Very High Resolution Radiometer (NOAA-AVHRR) images over the extensive
swamps in the upper Nile. The study area covers the swamps of the Sudd, Bahr el Ghazal and the Sobat sub-basins. The actual
evaporation and soil moisture for an area between 2–128N and 26–368E (approximately 1000 km £ 1000 km) have been
investigated. Monthly (actual) evaporation and soil moisture maps for the year 2000 have been generated. The evaporation
results were verified against longer-term averaged rainfall and flow data of the three sub-basins. A close resemblance was
obtained for the Sudd (1.8% error) and the Sobat Basin (5.7% error), while the balance lacks closure for the Ghazal basin (27%)
due to un-gauged or inadequately gauged inflow from the upper catchments. It is concluded that soil moisture availability
controls the monthly evaporation rates for all areas that are not saturated with water, and that a significant dry-down in the
winter period occurs. It is concluded that the evaporation for the Sudd wetlands is 20% less and the average area occupied by the
wetlands is 74% larger than assumed in earlier hydrological studies (e.g. Jonglei canal studies). The derived results can serve as
a sound basis to support the widely debated evaporation losses from the Sudd, as well as form an input to regional scale climate
models for studying atmospheric circulation patterns over Africa and the Nile Basin.
q 2003 Elsevier B.V. All rights reserved.
Keywords: Evaporation; Water balance; Remote sensing; Surface energy balance algorithm for land; Nile; Sudd swamps
1. Introduction
The estimation of spatial variation of evaporation
ðEÞ in a catchment is fundamental to many appli-
cations in water resources and climate modeling.
Evaporation, being the sum of interception, soil
evaporation, open water evaporation and transpira-
tion, is a key variable not only in water balance
determinations, but also to estimate the moisture, heat
and CO2 interactions between land and atmosphere
(e.g. Sellers et al., 1996). Several climatic studies
have indicated that atmospheric circulation and rain-
fall are significantly affected by the large-scale
variation of soil moisture and evaporation (Savenije,
0022-1694/$ - see front matter q 2003 Elsevier B.V. All rights reserved.
doi:10.1016/j.jhydrol.2003.11.038
Journal of Hydrology 289 (2004) 145–164
www.elsevier.com/locate/jhydrol
* Corresponding author.
E-mail address: [email protected] (Y.A. Mohamed).

1996b; Enthekhabi et al., 1999). Three methods can
be used to estimate the evaporation at a regional scale:
by up-scaling point measurements, by remote sensing
techniques (e.g. modeling the energy balance at the
land surface) and by hydrological modeling (Savenije,
1997). Each of the three methods has its limitations,
and an optimal procedure probably would be a
combination of the three approaches. To maximally
profit from remote sensing and hydrological model-
ing, data assimilating is gaining terrain in hydro-
logical studies (Walker et al., 2001; Jhorar et al.,
2002; Schuurmans et al., 2003) as well as in climate
studies (Dolman et al., 2001). Extensive reviews of
remote sensing flux determination methods have been
presented by Choudhury (1989), Moran and Jackson
(1991) and Kustas and Norman (1996).
Unlike hydrological models, remote sensing tech-
niques compute evaporation directly from the energy
balance equation without the need to consider other
complex hydrological processes. As a result, the error
in the quantification of other hydrological processes is
not propagated into evaporation ðEÞ; and this is a
strong advantage. On the other hand, a major
limitation of remote sensing data is that the temporal
distribution of satellite-based estimates is poor, and
that interpolation techniques are necessary to define
evaporation between satellite overpasses. Due to
extremely scarce ground hydrometeorological data
in the vast study area of the Sudd marshes, utilization
of satellite imagery is an attractive study approach.
Advanced remote sensing techniques have a high
potential to estimate hydrological processes, and are
probably far better than the scanty field data available
for this large tropical wetland.
The vast wetlands in Southern Sudan are charac-
terized by huge evaporation from the Sudd, Bahr el
Ghazal and the Sobat sub-basins. The evaporation
from the Sudd alone (Bahr el Jebel swamps) is
estimated to be more than 50% of the Nile inflow into
the Sudd near Juba, i.e. about 28 Gm3/yr out of the
49 Gm3/yr (Sutcliffe and Parks, 1999). The whole
river inflow of the Bahr el Ghazal Basin (12 Gm3/yr)
is evaporated before reaching the Nile. About 4 Gm3/
yr is claimed to be evaporated from the Machar
marches (PJTC, 1960). Therefore, the Sudd became
subject of research by planners and engineers to save
water and carry more water to the rapidly expanding
population living in the downstream areas in North
Sudan and Egypt. Their aim is to save water by
reducing the evaporation (losses) from the wetlands.
Numerous studies and projects were proposed to
reduce these losses, of which the (uncompleted)
Jonglei canal is the most famous (Jonglei investi-
gation team, 1954; PJTC, 1960).
Most of the past studies to estimate evaporation
from the Sudd wetlands rely on the computation of
evaporation using meteorological ground station data
under the basic assumption that the area is wet
throughout the year and moisture is not limiting
evaporation rates (Sutcliffe and Parks, 1999; Jonglei
investigation team, 1954; Penman, 1963). Although
some experiments were made to estimate evaporation
from papyrus grown in water tanks (Butcher, 1938),
their results were rejected in the subsequent hydro-
logical studies as being too low (1533 mm/yr).
Instead, more recent studies used open water evapor-
ation of 2150 mm/yr estimated with the Penman
formula (Chan et al., 1980; Sutcliffe and Parks, 1999).
Penman (1963) assumed that transpiration from
papyrus is similar to the evaporation from open
lagoons. However, the computed evaporation by his
well-known formula represents the potential open
water evaporation, and not the actual evaporation ðEaÞ
from the land surface with a certain heterogeneity in
vegetation types and development. The major diffi-
culty of this estimation procedure is that evaporation
from point measurements is applied to the total Sudd
area. One of the complexities in determining the
regional scale evaporation is the variability of the
boundaries of the Sudd swamps and the soil moisture
behavior throughout the year.
Some of the earlier studies intended to define the
extent of the Sudd wetlands from satellite imagery.
Travaglia et al. (1995) applied a methodology based
on the thermal inertia difference between dry and
wetlands from the National Oceanic Atmospheric
Administration-Advanced Very High Resolution
Radiometer (NOAA-AVHRR). NOAA-AVHRR ther-
mal data were complemented with maps of the
Normalized Difference Vegetation Index (NDVI).
They defined the seasonal and inter-annual variation
of the Sudd area between 28.0 and 48.0 Gm2 during
1991–1993. Mason et al. (1992) used the thermal
channel of Meteosat to estimate the Sudd area during
1985–1990 between 8.0 Gm2 at its minimum and
40.0 Gm2 at its maximum. These methods showed
Y.A. Mohamed et al. / Journal of Hydrology 289 (2004) 145–164146

a successful application of NOAA-AVHRR and
Meteosat thermal data to define the area of wetlands,
but such methods fail in the rainy season (cloudy
conditions) and do not determine the evaporation.
The approach adopted in this study is based on the
derivation of the actual evaporation using the SEBAL
techniques (Bastiaanssen et al., 1998a). All com-
ponents of evaporation (evaporation from open water,
from vegetative surface and from bare soil) are
calculated based on the surface reflectance and
emittance in different parts of the spectrum. This
forms basic data that can be used in hydrological and
meteorological studies. SEBAL was selected because
it does not require any input data, except routine
weather station data.
Moisture evaporated into the atmosphere may
again precipitate at a different location, but in the
same basin (Savenije, 1999, 1996a; Trenberth, 1999).
If this holds true, the need for reclamation efforts
loose ground. Estimation of evaporation by remote
sensing over the Sudd is a first step in a larger research
project to model moisture recycling in the Nile basin.
The derived evaporation results from remote sensing
will be used subsequently to verify moisture
exchanges between land surface and atmosphere in a
regional climate model.
2. The study area: Sudd, Bahr el Ghazal and Sobat
basins
NOAA-AVHRR images have been selected to
cover three sub-basins: the Sudd, Bahr el Ghazal and
the Sobat basins. These basins stretch from the
outfalls on the White Nile to the upstream side near
the discharge measuring stations. The names of the
most important places are provided in Fig. 1. Fig. 1
shows the natural drainage network within the image
boundary, superimposed over the digital elevation
model.
The largest wetlands of the Sudd are located at the
center of the image, extending from Mangala in
Fig. 1. DEM (in m þ MSL), drainage map and location of hydrometeorological gauging stations.
Y.A. Mohamed et al. / Journal of Hydrology 289 (2004) 145–164 147

the South up to Malakal in the North. The Bahr el
Ghazal basin on the west extends from the Nile–
Congo divide and joins the Sudd at several places. The
Sobat Basin on the eastern side starts from the
Ethiopian Plateau and joins the Nile at Malakal, it also
spreads northward into the Machar marches. The
upper part of the Ghazal and the Sobat catchments lie
on relatively high grounds 1000–2000 m above mean
sea level, while the lower part, and the flat Sudd
swamps lie at 300 m above MSL. The rainfall varies
from 1500 mm/yr on the southwestern part of the
image to around 900 mm/yr on the plains, decreasing
to 600 mm/yr on the northern part of the image. The
rainy season extends from April to October, with the
peak in July/August. The distribution of the rainfall in
Sudan is dominated by the position of the Intertropical
Convergence Zone (ITCZ). The ITCZ travels to as far
as 208N during the peak rainy season July to
September, and back to closer to the equator during
the period November to March. Rainfall intensities
increase southward from the position of the ITCZ.
The second influence on the distribution of rainfall
after the altitude is the effect of orography, this is
clearly shown by the curvature of the isohyets parallel
to the Ethiopian Plateau (Figs. 1 and 2). The main
sources of flowing water to the study area are the
tributaries coming from the Ethiopian Plateau receiv-
ing summer rainfall originating from the Atlantic
Ocean, and the tributaries coming from the Equatorial
lakes plateau subjected to spring and autumn rain
originating from the Indian Ocean. The main climatic
features of the study area during the year 2000 at four
meteorological stations are presented in Fig. 3a–d.
The air temperature reaches its maximum in March/
Fig. 2. Mean annual rainfall isohyets over the Sudan.
Y.A. Mohamed et al. / Journal of Hydrology 289 (2004) 145–164148

April and gradually declines in July, August and
September. The annual average temperature is
approximately 28 8C very high. The relative humidity
has a distinct annual variation, from about 20% in the
dry season to 80% in the rainy season. The reference
evaporation ðE0Þ is computed according to the FAO
Penman–Monteith method (Allen et al., 1998). The
monthly variations show that E0 , 10 mm/d in the
dry season and reduces to E0 , 4 mm/d during the
wet season. The accumulated values of E0 are
2400 mm/yr for the Juba station and 2900 mm/yr for
the Neyala station, respectively. The actual evapor-
ation ðEaÞ is expected to be substantially lower as the
basin does not exist of a reference crop (12 cm clipped
grass) with ideal moisture regimes throughout the
whole year.
The main vegetation species in the study area are:
Eichhornia crassipes (water hyacinth) floating on the
moving water of the Sudd. The Vossia cuspidata
(hippo grass) grows in the shallow water towards the
land direction. Cyperus papyrus (papyrus) and/or
Phragmites karka (reed) dominate the vegetation
behind the Vossia. The Typha domingensis (cattail) is
grown on the higher grounds within the swamps
(Denny, 1984). Outside the wetlands, vegetation is
mainly floodplain and rain-fed grasses grow only
during the rainy season.
3. Major SEBAL model principles
The Surface Energy Balance Algorithm for Land
(SEBAL) is an energy partitioning algorithm over the
land surface, which has been developed to estimate
actual evaporation from satellite images (Bastiaans-
sen et al., 1998a, 2000). The scheme has found
applications in different basins of the world, e.g.
Snake River basin in Idaho, USA (Allen et al., 2002),
Fig. 3. Climatic features at Demazine, Neyala, Malakal and Juba during year 2000.
Y.A. Mohamed et al. / Journal of Hydrology 289 (2004) 145–164 149

the lake Naivasha drainage basin in Kenya (Farah,
2001), all river basins in Sri Lanka (Bastiaanssen and
Chandrapala, 2003) and the irrigated Indus Basin in
Pakistan (Bastiaanssen et al., 2002). In this paper, a
brief review of the algorithm is presented along with
its assumptions, and the range of the attainable
accuracies. For detailed derivation of SEBAL algor-
ithm, refer to the literature quoted above. One distinct
feature of the SEBAL algorithm is that the actual
evaporation from various surface types, including
different leaf coverages, soil types or groundwater
table conditions can be derived. SEBAL estimates the
spatial variation of the hydrometeorological par-
ameters using satellite spectral measurements and
(limited) ground-based meteorological data (Farah
and Bastiaanssen, 2001). These parameters of the
Soil–Vegetation–Atmosphere system are used to
assess the surface energy balance terms. The latent
heat flux lE is computed as the residue of the energy
balance equation
lE ¼ Rn 2 G0 2 H ð1Þ
where Rn is the net radiation over the surface, G0 is the
soil heat flux, H is the sensible heat flux and lE is the
latent heat flux. The SEBAL procedure consists of 25
steps, which can be re-grouped into five main steps
appropriate for automatic processing, Fig. 4. The
steps are:
1. Pre-processing of the satellite image. Radiometric
correction, geometric correction and removal of
cloud pixels. Spectral radiances at the top of the
atmosphere signaled by the satellite are converted
to brightness temperatures using Planck’s radiation
equation and to surface reflectances. The planetary
albedo derived from the visible channels 1 and 2
were radiometrically corrected to estimate the land
surface albedo r0 as in Zhong and Li (1988).
2. Computation of the SVAT parameters (Soil–
Vegetation–Atmosphere Transfer Parameters).
The NDVI normalizes the difference between red
and near-infrared reflectance (Tucker, 1979). The
thermal infrared emmisivity 10 is estimated based
on NDVI (van der Griend and Owe, 1993). The
surface roughness Z0M is also estimated based on
NDVI (Moran and Jackson, 1991) The temperature
T01 is the land surface temperature over the
horizontal plain of the image which is T0 corrected
for elevation height (6.5 8C/km).
Fig. 4. SEBAL flow chart for instantaneous surface energy balance.
Y.A. Mohamed et al. / Journal of Hydrology 289 (2004) 145–164150

3. Computation of net radiation Rn and soil heat flux
G0: The net short wave radiation is scaled by the
land surface albedo, while the net thermal infrared
radiation emitted by the earth surface ðRnlÞ is
scaled according to land surface temperatures ðT0Þ:
The soil heat flux G0 is estimated as a function of
Rn; T0; r0 and NDVI over the pixels.
4. Computation of sensible heat H by iteration
procedure to describe buoyancy effects on the
aerodynamic resistance of the land surface ðrahÞ:
First, the temperature difference between land
surface and the air ðdTÞ is scaled over the image by
a linear relation with T01: dT is bounded by zero on
a wet pixel and dTmax on a dry pixel selected
manually over the image. The sensible heat H apart
from dT is also function of rah: However, rah is also
a function of H: This is solved by iteration utilizing
Monin–Obukhov similarity theory to correct for
the buoyancy effects. The wind speed at the
blending height U100; derived from the ground
measurements is used to estimate the friction
velocity.
5. Computation of instantaneous latent heat flux lE
and instantaneous evaporative fraction L based on
Eqs. (1) and (2), respectively.
The evaporative fraction is the key parameter in
SEBAL to express energy partitioning
L ¼lE
lE þ H¼
lE
Rn 2 G0
¼1
1 þ bð2Þ
where b is the Bowen ratio ðH=lEÞ: The advantage of
using the evaporative fraction over the Bowen ratio is
that the former shows less variation during the
daytime than the Bowen ratio. The energy partitioning
calculated with the evaporative fraction L is related
primarily to the available moisture content (Boni et al.,
2001). Therefore, soil moisture can be empirically
derived from the evaporative fraction as (Ahmed and
Bastiaanssen, 2003)
u
usat
¼ eðL21Þ=0:421 ð3Þ
where soil moisture u is expressed as a percentage of
the moisture value at full saturation usat: The value
ranges, therefore, between 0 and 1. The main
assumption to obtain daily evaporation from the
instantaneous SEBAL results is that the instantaneous
evaporative fraction is equal to its daily value
integrated over a period of 24 h. This was proven to
hold true for the midday conditions when lE is high
(Brutsaert and Sugita, 1992;Farah, 2001). The daily
soil heat flux is assumed negligible as it balances out
during day and night. The daily net radiation is
obtained from routine meteorological data at the
ground stations and then interpolated to the pixels of
the image using the distributed albedo values. The
daily evaporation is calculated as the instantaneous
evaporative fraction times the daily net radiation. This
is based on the fact that L is relatively constant during
the day, as mentioned above
Ealday ¼ LRnlday ð4Þ
The estimation of evaporation during days with no
satellite image is calculated by assuming that the daily
ratio of actual evaporation to the reference evapor-
ation is valid, also on a monthly basis (Morse et al.,
2000; Allen et al., 2001).
Ea
E0
����daily
¼Ea
E0
����monthly
ð5Þ
Daily and monthly reference evaporation E0 were
computed by the FAO Penman–Monteith formula
(Allen et al., 1998) based on routine weather data
(temperature, sunshine hours, wind speed, relative
humidity) at point stations. The climate data are first
interpolated to the pixels of the raster maps based on
spatial averages from point measurements, then E0 is
calculated assuming that the land surface consists of
grass. Depending on the availability of suitable
images, it was attempted to prepare Ea maps for the
5th, 15th and 25th day of the month. The monthly
evaporation Ea is calculated through Eq. (5), where
daily Ea stems from SEBAL and daily E0 and monthly
E0 from the FAO method. The presence of clouds
forms part of the weather data and thus is incorporated
into both E0 daily and E0 monthly: The SEBAL procedure
involves the following main requirements and
assumptions, viz.:
1. The presence of a dry pixel (zero evaporation) and
a wet pixel (zero sensible heat) in the same image
for scaling of the sensible heat flux.
2. The wind speed at the blending height (,100 m) is
assumed constant over the whole area of interest.
Y.A. Mohamed et al. / Journal of Hydrology 289 (2004) 145–164 151

3. The temperature difference dT is a linear function
of the surface temperature T01:
The accuracy of the SEBAL-based evaporative
fraction and daily evaporation estimates, Ea daily; have
been evaluated in earlier studies against field
measurements collected from different hydrometeor-
ological projects. Data from large-scale field exper-
iments such as EFEDA-Spain, HAPEX-Niger and
HEIFE-China have been explored for this. An over-
view of the validation results of SEBAL is given in
Bastiaanssen et al. (1998b). The error of the
evaporative fraction from SEBAL single day events
and for scales is in the order of 1 km2 is 17% or lower
(at a probability of 90%), Fig. 5. The error reduces
when Ea is aggregated over longer time steps, because
the errors cancel out, as experimentally demonstrated
in the Savannah of Kenya (Farah, 2001), the humid
tropical mixed vegetation of Sri Lanka (Hemakumara
et al., 2003) and the irrigated Snake River basin in
Idaho, USA (Allen et al., 2002).
NOAA-14 satellite images (bounded by 2–128N
and 26–368E) were downloaded from the NOAA
Satellite Active Archive, SAA. The AVHRR sensor
measures in five bands, and the resolution is 1.1 km,
which is sufficient for regional scale hydrological
modeling. Although the frequency of NOAA-14 over
the Sudd is daily, two shortcomings were faced to
make full use of this extensive image series feasible.
First, as the image is very large
(1000 km £ 1000 km), only few scenes completely
cover the required area. Secondly, many images, in
particular, during the rainy season (June–October),
are contaminated by clouds. The images were first
radiometrically calibrated to obtain reflectance and
temperature. The images are then georeferenced using
the drainage map of Sudan as a background basis.
4. SEBAL results
Eq. (1) has been applied to compute the energy
balance components and hence to derive the latent
heat flux on a pixel-by-pixel basis over an area of
1000 km £ 1000 km, covering the Sudd and the
neighboring swamps of the Ghazal and the Sobat
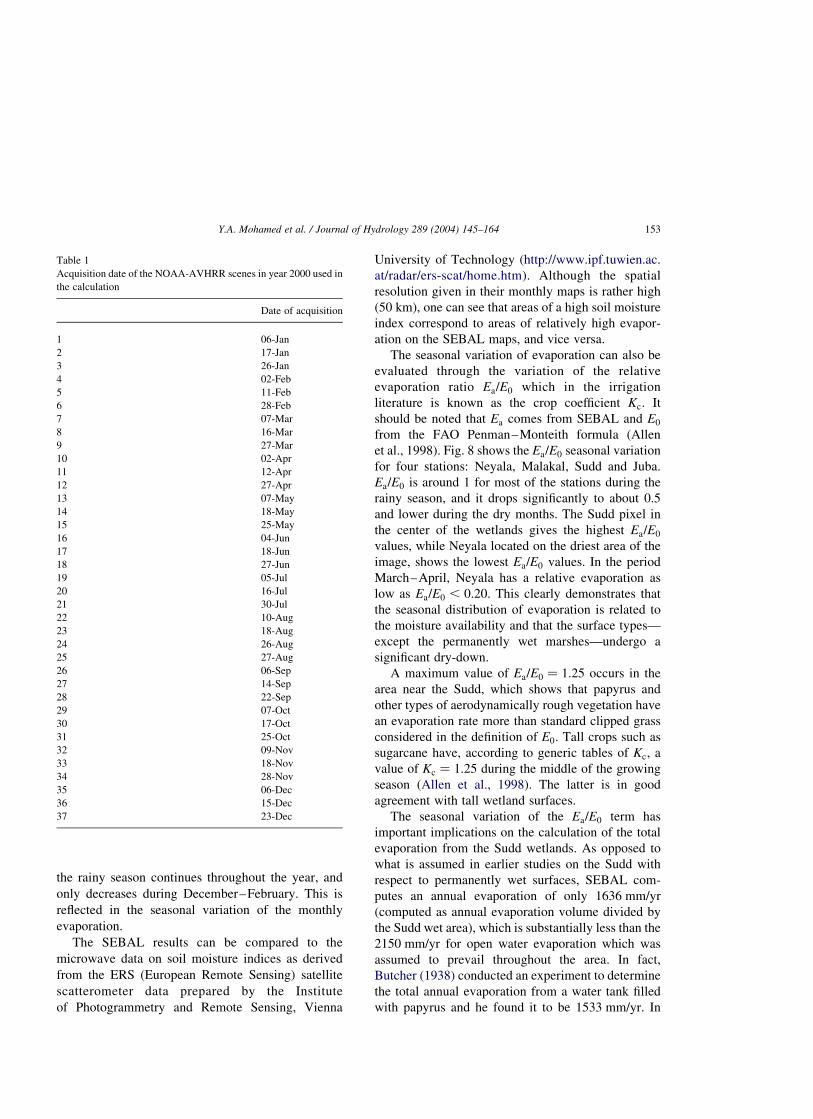
basins. SEBAL has been applied for 37 images
acquired during individual days of the year 2000,
Table 1 for the date of acquisition. The daily
integrated Ea values have been obtained through the
evaporative fraction as defined in Eq. (2) and applied
in Eq. (4).
The monthly evaporation maps have been calcu-
lated from the daily evaporation maps using Eq. (5).
Fig. 6 shows the results of particular places such as
Neyala (dry area), Malakal (middle of the image),
Sudd (center of wetland), and Juba (southern part of
the image). As can be seen from these graphs, the
pixels in the middle of the Sudd show the highest
evaporation rates, which is in agreement with the
abundant water availability present at the floor of this
lowland region. Relatively lower evaporations during
the rainy season were found (high humidity and more
clouds). At Neyala, the evaporation is lowest, in
particular, during the hot dry months of March–June
when the area is dry. It can be concluded that, during
the dry season (November/December to March/
April), evaporation is limited to the wetlands only,
which are fed continuously from the Nile, and some
little areas in the Ghazal sub-basin. During the peak of
the rainy season (August–October), evaporation is
high throughout the entire Sudd plain due to soil
moisture saturation. Fig. 7 gives the annual evapor-
ation map. It shows evaporation from wetlands (e.g.
Sudd) to be higher than for other areas. Note that the
white color indicates missing data (cloudy pixels).
Due to uneven rainfall distribution, evaporation is
lower in the northern part of the image (600–700 mm/
yr), as well as on the southeastern corner. For the
Congo catchment on the southwestern corner, the
seasonal rainfall distribution is somewhat different
from the Nile basin part covered by the image, i.e.Fig. 5. Accuracy of SEBAL against eddy-correlation for single day
events.
Y.A. Mohamed et al. / Journal of Hydrology 289 (2004) 145–164152
the rainy season continues throughout the year, and
only decreases during December–February. This is
reflected in the seasonal variation of the monthly
evaporation.
The SEBAL results can be compared to the
microwave data on soil moisture indices as derived
from the ERS (European Remote Sensing) satellite
scatterometer data prepared by the Institute
of Photogrammetry and Remote Sensing, Vienna
University of Technology (http://www.ipf.tuwien.ac.
at/radar/ers-scat/home.htm). Although the spatial
resolution given in their monthly maps is rather high
(50 km), one can see that areas of a high soil moisture
index correspond to areas of relatively high evapor-
ation on the SEBAL maps, and vice versa.
The seasonal variation of evaporation can also be
evaluated through the variation of the relative
evaporation ratio Ea=E0 which in the irrigation
literature is known as the crop coefficient Kc: It
should be noted that Ea comes from SEBAL and E0
from the FAO Penman–Monteith formula (Allen
et al., 1998). Fig. 8 shows the Ea=E0 seasonal variation
for four stations: Neyala, Malakal, Sudd and Juba.
Ea=E0 is around 1 for most of the stations during the
rainy season, and it drops significantly to about 0.5
and lower during the dry months. The Sudd pixel in
the center of the wetlands gives the highest Ea=E0
values, while Neyala located on the driest area of the
image, shows the lowest Ea=E0 values. In the period
March–April, Neyala has a relative evaporation as
low as Ea=E0 , 0:20: This clearly demonstrates that
the seasonal distribution of evaporation is related to
the moisture availability and that the surface types—
except the permanently wet marshes—undergo a
significant dry-down.
A maximum value of Ea=E0 ¼ 1:25 occurs in the
area near the Sudd, which shows that papyrus and
other types of aerodynamically rough vegetation have
an evaporation rate more than standard clipped grass
considered in the definition of E0: Tall crops such as
sugarcane have, according to generic tables of Kc; a
value of Kc ¼ 1:25 during the middle of the growing
season (Allen et al., 1998). The latter is in good
agreement with tall wetland surfaces.
The seasonal variation of the Ea=E0 term has
important implications on the calculation of the total
evaporation from the Sudd wetlands. As opposed to
what is assumed in earlier studies on the Sudd with
respect to permanently wet surfaces, SEBAL com-
putes an annual evaporation of only 1636 mm/yr
(computed as annual evaporation volume divided by
the Sudd wet area), which is substantially less than the
2150 mm/yr for open water evaporation which was
assumed to prevail throughout the area. In fact,
Butcher (1938) conducted an experiment to determine
the total annual evaporation from a water tank filled
with papyrus and he found it to be 1533 mm/yr. In
Table 1
Acquisition date of the NOAA-AVHRR scenes in year 2000 used in
the calculation
Date of acquisition
1 06-Jan
2 17-Jan
3 26-Jan
4 02-Feb
5 11-Feb
6 28-Feb
7 07-Mar
8 16-Mar
9 27-Mar
10 02-Apr
11 12-Apr
12 27-Apr
13 07-May
14 18-May
15 25-May
16 04-Jun
17 18-Jun
18 27-Jun
19 05-Jul
20 16-Jul
21 30-Jul
22 10-Aug
23 18-Aug
24 26-Aug
25 27-Aug
26 06-Sep
27 14-Sep
28 22-Sep
29 07-Oct
30 17-Oct
31 25-Oct
32 09-Nov
33 18-Nov
34 28-Nov
35 06-Dec
36 15-Dec
37 23-Dec
Y.A. Mohamed et al. / Journal of Hydrology 289 (2004) 145–164 153

almost all the subsequent studies, this lower estimate
has been rejected. Our conclusion is, however, that the
values of Butcher are more reasonable than schema-
tizing the Sudd to exist of permanently saturated
surfaces only.
5. Monthly water balances
A monthly water balance has been computed for
the three sub-basins to verify the plausibility of the
new evaporation results: Sudd, Ghazal and Sobat.
Fig. 6. Evaporation at selected locations over the image.
Fig. 7. Annual evaporation map (mm/yr).
Y.A. Mohamed et al. / Journal of Hydrology 289 (2004) 145–164154

These sub-basins have different land use patterns,
precipitation rates and accuracy of available hydro-
logical data. Table 2 shows that the Sudd basin has
ponding water at the surface throughout most of the
area, and that apart from some higher located spots,
the entire sub-basin is flooded in the wet season, or
has very shallow groundwater table. The Sudd is the
bottom floor of the White Nile, and the in- and outflow
of the Sudd is through the Nile only. The single in-
and outlet makes the area suitable for water balance
determinations. The opposite holds true for the Bahr
el Ghazal sub-basin, which receives inflow through
numerous small streams bringing in surplus water
from the upper catchment areas. The vegetation
growth patterns follow the surplus flow and the
impact on groundwater table fluctuations. The
majority of the area has an unsaturated soil (Table 2).
It has to be recalled that, hydrometeorological data
in the area are scanty. Many gauges are out of
operation after the onset of the civil war in 1983.
Therefore, it is unavoidable to use average data for
some of the parameters, rather than taking data from
2000. Rainfall data for the year 2000 are available for
stations Neyala, Demazine, Renk, Kadugli, Malakal,
Wau and Juba (Fig. 1). River flow records (water
level and discharge) are not measured since 1983,
with the exception of Malakal, Renk and Demazine,
located north of the Sudd. The comparison of the
Nile annual flow at Malakal for the year 2000, and
the long term mean shows negligible difference,
while the 2000 rainfall over the Sudd is slightly less
than the long term mean (Table 3). It is anticipated
beforehand that a small error in the water balance is
expected by assuming the river inflow, outflow and
monthly rainfall of 2000 to be similar to the average
condition.
5.1. The Sudd water balance
The areal size of the sub-basins is one of the key
problems for assessing the water balance. The
Sudd swamps results from water spillage on both
sides of the Bahr el Jebel River, and it extends
from near Juba up to the confluence with the Sobat
River just upstream Malakal. There is an ongoing
debate on the catchment boundaries, which cannot be
Fig. 8. Seasonal variation of the ratio Ea=E0.
Table 2
Main characteristics of the sub-basins
Sub-basin Area of sub-basin (Gm2) Catchment cover Hydrological record
Sudd 38.6 Dominated by swamps Good quality
Baher el Ghazal 59.3 Mix of swamps and dry land (around 10–20% swamps) Incomplete, partially gauged
Sobat 42.9 Mostly dry land, with some seasonal swamps Fair
Y.A. Mohamed et al. / Journal of Hydrology 289 (2004) 145–164 155

straightforwardly surveyed because of its immense
dimensions and because the area is not freely
accessible. The area of the Sudd swamps shrinks
and swells during the season. The boundary between
the Sudd and Bahr el Ghazal swamps is highly
questionable, and some hydrological state parameters
should be used to help identifying the boundaries. The
catchment boundary has—in this study—been deli-
neated based on the annual evaporation map because
wetlands can be discerned from its surrounding areas
(Fig. 7). The annual evaporation map can be
considered as a suitable indicator for the annual
wetland area. A threshold of annual evaporation of
1550 mm/yr is selected to represent open water bodies
covered with swampy vegetation. The high annual
evaporation in the area can be attributed to the
presence of papyrus and water hyacinth grown on
water, and dense-flooded woodlands. The delineated
Sudd area is 38.3 Gm2, which is 74% larger than the
most recent estimate of 22 Gm2 (average area) by
Sutcliffe and Parks (1999).
The hydrological records of inflow, outflow and
rainfall—used in this study to verify the evaporation
estimates from remote sensing—are based on long
term averages and are withdrawn from Sutcliffe and
Parks (1999). The average rainfall from eight stations
in the area was used. Inflow is taken as the river flow
at Mangala. The two tributaries (Lau, Tapari), coming
from the west entering the Nile north of Mangala, are
not included in the balance as their flow is small
(1.6 Gm3/yr, compared to the Nile inflow of
49.6 Gm3/yr), and most likely a high proportion of
this water spreads and evaporated before reaching the
Sudd. It is relevant to review the water balance of the
Sudd made by Sutcliffe and Parks (1999) to under-
stand their model concept and interpret the value of
their results. Their formulation of the water balance is
as follows
dV ¼ ½Qin 2 Qout þ AðP 2 EÞ2 r dA�dt ð6Þ
where V is the storage, Qin is inflow, Qout is outflow, P
is rainfall, E is evaporation, A is the flooded area and r
is soil moisture recharge. This term accounts for the
infiltration in the unsaturated zone during the expan-
sion of the swamps. There is no capillary rise
(negative recharge) foreseen when the groundwater
table draws down. However, this term is negligible
compared to the other terms. Note that the recharge
pertains to expanding areas dA only. A linear relation
between A and V is assumed to eliminate two
unknowns from Eq. (6). The area ponded with water
A and the surface storage V are schematized to be
linearly related as A ¼ kV ; with a constant depth
1=k ¼ 1 m. The evaporation E was assumed to be
from open water surfaces and was computed by means
of the Penman formula using meteorological data
from Bor. Penman (1963) assumed that transpiration
from papyrus is similar to the evaporation from open
lagoons. The resulting water balance for open water
areas as a result of Eq. (6) is provided in Appendix 1.
Iterative calculations have been made to close V at the
start of the year with V at the end of the year. A key
result is that an average swamp area of 21.1 Gm2 is
required to conserve the water balance based on an
annual open water evaporation of 2150 mm/yr.
Satellite imagery of the NDVI shows, however, that
wetlands in the Sudd are covered with vegetation:
papyrus, water hyacinths, etc. (NDVI values ranges
between 0.2 and 0.3 over the Sudd), while water
bodies and reservoirs have a NDVI below zero (20.2
to 20.3). Therefore, the evaporation schematization
of the Sudd to exist of open water surface is basically
incorrect. Secondly, evaporation from the papyrus
grown in water is less than open water evaporation,
because the albedo of green vegetation is (theoreti-
cally) 15%, three times higher than an albedo of 5%
for water, and this yields to less net radiation available
for Ea: The actual values of albedo derived over the
image were 0.15–0.25 over the Sudd, while it is
around 0.10–0.15 over the Demazine reservoir. In
addition, a canopy resistance is present in plants due to
the pathway of water flow through the stems and the
obstruction for water vapor through stomata, which
does not hold for open water surfaces. The evaporation
resistance to papyrus and water hyacinth is, therefore,
Table 3
Comparison of year 2000 and long-term average of 1960–2000
Parameter Year 2000 Long term average
(1961–2000)
Nile Flow at Malakal 33.84 Gm3/yr 32.04 Gm3/yr
Rain average of Malakal,
Juba and Wau
830 mm/yr 923 mm/yr
Y.A. Mohamed et al. / Journal of Hydrology 289 (2004) 145–164156

in all circumstances higher than for open water where
water molecules can freely convert from liquid into
gaseous phase. Hence, open water evaporation should
be higher than the evaporation from vegetative
wetlands. However, in the literature (Gilman, 1994),
the comparison of wetland evaporation against open
water evaporation shows a wide range of results, and
the truth is probably very site specific, as it depends on
the unique combination of the soil, climate and t1he
bio-physical parameters including albedo, LAI, aero-
dynamic and canopy resistances.
The evaporation volume from all pixels within the
delineated sub-basin of the Sudd has been computed
on a monthly basis. Applying the water balance based
on the monthly evaporation volume, ðQin þ PÞ2
ðQout þ EÞ gives the change in storage dV =dt (Table 4).
The accumulated value for 12 months of
dV =dt ¼ 21:15 Gm3/yr is very small and less than
2% of the annual evaporation. This finding supports
two conclusions: (i) the Sudd area is with 38 Gm2,
approximately 74% larger than the 21 Gm2 assumed
in previous studies and (ii) the evaporation rates are
significantly lower as assumed previously due to
foliage properties and an annual soil moisture cycle.
5.2. The Bahr el Ghazal water balance
The streams of Bahr el Ghazal Basin start from the
Nile Congo divide at an elevation of 700–1000 m,
and flows in the northeastern direction. Rainfall over
the upper catchment is not well gauged, but it is
assumed to vary between 1200 and 1600 mm/yr, and
declines to about 900 mm/yr on the plains (Fig. 2).
There is sufficient slope to create drainage up to the
line of the gauging stations: Juba, Rembek, Wau and
Nyamlel (location shown in Fig. 1), where numerous
un-gauged streams flow on very mild slopes and cause
spillage over the banks. The gauging stations roughly
follow the boundary of the ironstone plateau, and thus
lie at the edge of the zone of runoff generation. Out of
the total inflow of 11.3 Gm3/yr measured at the
upstream stations, only a small fraction of 3%
emerges at the basin exit just upstream Lake No.
The Bahr el Ghazal sub-basin has been deli-
neated on the basis of streams and location of
gauging stations (Fig. 7). The boundaries are
hydrologically correct, but the total area could be
easily expanded if more streams are included. The
gauging stations used for the delineation are
Nyamlel on the Lol River, the Road Bridge across
the Pongo River, Wau on River Jur, Tonj on River
Tonj, the Road Bridge across the Maridi River near
Rembek and Mvolo on River Naam. Although these
streams have been gauged (intermittently) starting
from the 1930s and 1940s, measurements at high
flows are very limited. It is probable that during
high flows, these stations underestimate flows that
bypass the gauge over the inundated land. The rivers
Table 4
Water balance of the Sudd basin (area ¼ 38.6 Gm2)
Month P
(mm/month)
E
(SEBAL)
(mm/month)
Qin
(Gm3/month)
Qout
(Gm3/month)
Qin þ P
(Gm3/month)
Qout þ E
(SEBAL)
(Gm3/month)
dV=dt
(Gm3/month)
Jan 2 141 3.89 1.95 3.96 7.40 23.44
Feb 3 125 3.37 1.63 3.48 6.44 22.96
Mar 22 135 3.62 1.77 4.47 6.98 22.51
Apr 59 141 3.60 1.62 5.88 7.06 21.19
May 101 146 4.00 1.58 7.90 7.22 0.67
Jun 116 138 3.86 1.50 8.34 6.83 1.51
Jul 159 129 4.19 1.51 10.32 6.49 3.83
Aug 160 143 4.65 1.59 10.82 7.12 3.69
Sep 136 135 4.61 1.70 9.85 6.91 2.95
Oct 93 150 4.69 1.94 8.28 7.70 0.58
Nov 17 121 4.47 1.94 5.12 6.62 21.50
Dec 3 131 4.21 2.06 4.33 7.12 22.79
Total 871 1636 49.16 20.80 82.75 83.89 21.15
Y.A. Mohamed et al. / Journal of Hydrology 289 (2004) 145–164 157

flowing to Bahr el Jebel, Lau, and Tapari, are
excluded from the balance. The total area within the
catchment boundary amounts to 59.2 Gm2 (Table 2).
The flow and rainfall data given in Table 5 are
withdrawn from Appendix 1.
The annual evaporation of Bahr el Ghazal is
1499 mm/yr (Table 5), which is less than found for the
Sudd area and in agreement with the large tracts of
unsaturated soil present during the dry season. The
monthly water balance using SEBAL evaporation
volumes formulated according to Eq. (7) shows a
shortfall of dV =dt ¼ 224:5 Gm3/yr.
dV
dt¼ ðQin þ RÞ2 ðQout þ EÞ ð7Þ
This shortfall can be explained by two possibilities:
the inflow should be considerably more (by a factor
3), or there is a carry-over storage. However, storage
changes over a period of a year are expected to be
small. To test the latter, dV =dt was computed from the
changes in soil moisture storage in the upper 1 m of
the unsaturated/saturated soil column. Eq. (3) has been
used to compute the degree of soil moisture saturation
u=usat for every month. Taking a soil moisture content
at full saturation of 0.45 m3/m3, being an average
value for alluvial soils, the opportunity is provided
to compute the month-to-month variation of soil
moisture storage for a soil layer of 1 m depth, Eq. (8).
V ¼u
usat
£ 0:45 £ 1 ð8Þ
An example of the monthly variation of dV =dt
based on soil moisture computations is shown in
Fig. 9. The results of Fig. 9 show a distinct temporal
variability, but confirms that the annual storage
change is negligibly small (see also Fig. 10 for the
dynamics of one specific pixel).
Since the missing inflow of 224.5 Gm3/yr cannot
be attributed to rainfall anomalies and storage
releases, it has to be concluded that the error is
related to the un-gauged or inadequately gauged
runoff from the higher catchment to the lower
Ghazal plains. A similar shortfall was computed in
the balance derived by Chan and Eagleson (1980)
for the Ghazal basin, who also explained un-gauged
runoff as a missing element in the hydrological
puzzle, plus 6 Gm3/yr, they assumed as spillage
from Bahr el Jebel to the Ghazal swamps. Spill from
Bahr el Jebel to the Ghazal basin is likely to be
small, since there are no visible channels and also
that the balance of the Sudd alone fits as given in
Section 5.1. Chan and Eagleson (1980) in their
water balance calculation of the Ghazal central
Table 5
Water balance of the Baher el Ghazal sub-basin (area ¼ 59.27 Gm2)
Month P
(mm/month)
E
(SEBAL)
(mm/month)
Qin
(Gm3/month)
Qout
(Gm3/month)
Qin þ P
(Gm3/month)
Qout þ E
(SEBAL)
(Gm3/month)
dV=dt
(Gm3/month)
dV=dt ðuÞ
(Gm3/month)
Jan 0 124 0.05 0.02 0.05 7.35 27.30 23.63
Feb 4 106 0.01 0.03 0.25 6.30 26.05 20.40
Mar 14 104 0.00 0.04 0.83 6.18 25.35 23.31
Apr 49 130 0.01 0.04 2.91 7.75 24.84 2.85
May 110 135 0.16 0.03 6.68 8.05 21.37 2.05
Jun 143 126 0.47 0.02 8.93 7.46 1.47 20.83
Jul 175 118 1.06 0.02 11.43 7.00 4.43 3.23
Aug 184 142 2.01 0.03 12.91 8.44 4.47 1.12
Sep 141 136 3.05 0.02 11.39 8.07 3.32 21.17
Oct 69 139 2.92 0.02 7.01 8.23 21.22 1.87
Nov 10 113 1.29 0.01 1.88 6.73 24.85 24.83
Dec 1 127 0.31 0.01 0.37 7.56 27.19 3.04
Total 900 1499 11.33 0.31 64.64 89.12 224.48 0.00
Y.A. Mohamed et al. / Journal of Hydrology 289 (2004) 145–164158

swamps estimated additional unmeasured inflow as
19.8 Gm3/yr. Their amount of missing water is in
fair agreement with the 24.6 Gm3/yr found in this
study. The interim conclusion related to the
validation of the Ghazal basin is that this basin is
not suitable for testing. The runoff from the upper
catchment should be about three times higher than is
actually recorded.
5.3. The Sobat water balance
It has to be noted that, inflow and outflows to the
Machar swamp area, used in earlier studies differ
Fig. 10. Soil moisture map of January 2000.
Fig. 9. Bahr el Ghazal sub-basin: average monthly soil moisture and change of storage in the unsaturated zone during year 2000.
Y.A. Mohamed et al. / Journal of Hydrology 289 (2004) 145–164 159

appreciably from one study to another. The Jonglei
investigation team (1954) estimated annual spill of
2.8 Gm3/yr from Baro towards Machar Marches, plus
annual flow of 1.7 Gm3/yr from the eastern catch-
ment, and an outflow of 0.5 Gm3/yr. In the study of
El-Hemry and Eagleson (1980), runoff to the Machar
marches from the eastern torrents and plains was
estimated as 5.61 Gm3/yr, plus 3.5 Gm3/yr as spill
from Baro, outflow from Machar estimated as
0.12 Gm3/yr. Sutcliffe and Parks (1999) in their
investigation of the flow records between 1950 and
1955 estimated flows to the Machar marches as:
2.3 Gm3/yr spill from Baro, 1.7 Gm3/yr from eastern
streams, and outflow of 0.12 Gm3/yr. The Sobat
contributes to about half of the White Nile flows at
Malakal (13 Gm3/yr). The average rainfall over the
Machar is 933 mm/yr.
Rainfall over the basin varies appreciably, around
800/yr mm on the plains to 1300 mm/yr near
Gambela, and it is even higher on the Ethiopian
mountains. The average rainfall over the delineated
catchment is estimated as the average of Gambela
and Machar marches (1115 mm/yr), which is more
than the 871 mm/yr for the Sudd (Appendix 1). At
large discharges, the Baro River spills over towards
the Machar marches on the North, which also
receives flow from smaller streams from the east.
The river system of the Sobat and down to the Machar
marches is very complex and little is known to
determine an accurate water balance. There are a few
gauging stations in the basin, but they are not
operational.
The catchment boundary given in Fig. 7 has been
delineated from the gauging stations of Akobo,
Gambela, Daga and Yabus up to the confluence near
Malakal. The outflow is defined at the Sobat mouth
(Hillet Dolieb). Outflow to the Nile north of the
Machar marches through Khor Adar and Khor Wol is
believed to be negligible. The inflow constitutes river
discharges from Baro at Gambela, Pibor at Akobo,
Akobo at Akobo, Gila, Mekwai, Jeakau, and the
eastern streams of Dagga and Yabus. About 13 Gm3/
yr comes from Baro at Gambela, and only 5 Gm3/yr
comes from the other streams (Table 7.2, Sutcliffe and
Parks, 1999).
The results of the water balance are provided in
Table 6. On an annual basis, dV =dt computed
according to Eq. (7) becomes dV=dt ¼ 23:1 Gm3/
yr. The monthly variation of dV =dt based on soil
moisture computations shows distinct temporal
variation in the Sobat sub-basin, but confirms
negligible annual change of storage. The annual dV =
dt closure term amounts to 5.7% of the annual
evaporation within the confidence limits of the
collected longer-term average flow data. Fig. 7
shows no wetlands in the Sobat catchment similar
Table 6
Water balance of the Sobat sub-basin (area ¼ 42.9 Gm2)
Month P
(mm/month)
E
(SEBAL)
(mm/month)
Qin
(Gm3/month)
Qout
(Gm3/month)
Qin þ P
(Gm3/month)
Qout þ E
(SEBAL)
(Gm3/month)
dV=dt
(Gm3/month)
dV=dt ðuÞ
(Gm3/month)
Jan 0 121 0.35 1.02 0.35 6.20 25.85 0.10
Feb 2 102 0.23 0.45 0.33 4.84 24.51 0.33
Mar 4 84 0.22 0.29 0.38 3.91 23.53 25.08
Apr 37 91 0.28 0.25 1.87 4.16 22.29 0.97
May 130 115 0.62 0.43 6.21 5.37 0.84 3.79
Jun 151 113 1.57 0.86 8.04 5.71 2.33 20.58
Jul 214 111 2.65 1.29 11.84 6.05 5.79 2.57
Aug 288 117 3.53 1.59 15.90 6.60 9.30 1.22
Sep 166 125 4.05 1.77 11.18 7.14 4.04 0.50
Oct 92 128 2.75 1.99 6.71 7.47 20.76 0.10
Nov 31 83 1.11 1.98 2.45 5.56 23.11 25.02
Dec 0 98 0.60 1.76 0.60 5.95 25.35 1.12
Total 1115 1287 17.96 13.69 65.84 68.97 23.12 0.00
Y.A. Mohamed et al. / Journal of Hydrology 289 (2004) 145–164160

to the Sudd and Ghazal. The famous Machar marches
appear to be seasonal wetlands whose evaporation
drops drastically during the dry season, yielding a
substantially smaller annual evaporation than the
Sudd and Ghazal swamps.
5.4. The total drainage system west from the White
Nile
The western part of the White Nile has only a
minor contribution to the flow of the River Nile. The
outflow of the Bahr el Ghazal sub-basin is
0.31 Gm3/yr only. This implies that rainfall and
evaporation for the natural drainage system west of
the Nile must be in approximate equilibrium. This
test was worked out further by plotting the outer
catchment boundaries on the drainage network map.
The Ghazal catchment, from the Nile–Congo divide
below Bahr al Arab and west of the Sudd was
determined (236.5 Gm2). The area above Bahr el
Arab was excluded as the inflow of Bahr el Arab and
Ragbat el Zaraga is negligible (0.5 Gm3/yr). Average
evaporation calculated with SEBAL over the catch-
ment amounts to 1580 mm/yr, while average rainfall,
derived from Fig. 2 amounts to 1200 mm/yr. This
shows a mismatch of 380 mm/yr. Secondly, the
catchment area of both Bahr el Ghazal (below Bahr
el Arab) and the Sudd west of Sobat was determined
as 350.5 Gm2. Average evaporation and rainfall over
this catchment, amounts to 1616 and 1150 mm/yr,
respectively. Inflow is 49.2 Gm3/yr, and outflow is
20.8 Gm3/yr. The balance of this catchment shows a
mismatch of 385 mm/yr. There are two possible
explanations for this mismatch, either the rainfall
over the highland of the Bahr el Ghazal catchment
is underestimated, or, SEBAL overestimates
evaporation over the highlands, mainly composed
of dense forests. Since SEBAL gives acceptable
results for the other investigated basins, it is more
likely that rainfall is underestimated, in particular,
from the forested highlands. It is very well possible
that rainfall on the highlands, which is not being
recorded, is substantially higher than is indicated by
the isohyets of Fig. 2.
6. Conclusions
Monthly actual evaporation and soil moisture
maps during the year 2000 have been computed for
an area of 1000 km £ 1000 km of the Nile basin
covering the wetlands of the Sudd, the Bahr Ghazal,
and the Sobat. The SEBAL algorithm has been used
to derive the energy balance components at the land
surface from the NOAA-AVHRR images because
only routine weather data need to be known. The
evaporation estimates were verified against water
balance results, and close resemblance was derived
for two of the three selected sub-basins. The closure
terms in the water balance were 1.8 and 5.7% for the
Sudd and the Sobat sub-basin. The balance does not
close for the Bahr el Ghazal sub-basin, due to
considerable small inflow, attributed to un-gauged
catchment runoff.
The areal average evaporation rates for the three
sub-basins are 1636 mm/yr (Sudd), 1499 mm/yr
(Ghazal) and 1287 mm/yr (Sobat) which is substan-
tially less than the 2150 mm/yr used in earlier studies
(Table 7). These differences can be explained by the
inclusion of larger areas not permanently saturated
throughout the year. The latter does not hold true for
the Sudd, which is exposed to dominant floods. In
Table 7
Different estimates of evaporation over the Sudd swamp
Evaporation
(mm/yr)
Average Sudd area in Gm2 Source Method
1533 7.2 Butcher, 1938 Measurements of Papyrus grown in water tanks, areal photo, water
balance
8.3 Hurst and Black, 1931 Water balance and limited surveys
2400 Migahid, 1948 Lysimeter experiment on the Sudd, close to Bahr el Zeraf cuts
2150 21.1 Sutcliffe and Parks, 1999 Penman formula, water balance
1636 38.0 This study Remote sensing and SEBAL
Y.A. Mohamed et al. / Journal of Hydrology 289 (2004) 145–164 161

the Sudd, the difference is caused by both the
dominant evaporation mechanism and the areal
extent of the swamp. The value used for evaporation
by Butcher of papyrus (1533 mm/yr) is in good
agreement with the SEBAL estimates of the Sudd.
The analysis showed that the Sudd wetlands are
larger than assumed before and that these areas
contain moist soil with shallow ground water tables.
Comparison of the monthly (actual) evaporation, Ea
against reference evaporation E0; and its seasonal
variations showed that, evaporation from the three
sub-basins is largely controlled by the soil moisture
condition. A summary of historical evaporation
assessment studies in the Sudd is given in Table 7.
Appendix A. Hydrological data in the study area
Tables A1–A3
Table A1
Sudd basin: mean record of input data and water balance results based on Sutcliffe and Parks (1999) model
Month R (mm/month) E (mm/month) Qin (Gm3/month) Qout (Gm3/month) V (Gm3) dV (Gm3/month) A (Gm2)
Jan 2 217 3.89 1.95 19.64 22.56 19.64
Feb 3 190 3.37 1.63 17.86 21.77 17.86
Mar 22 202 3.62 1.77 16.61 21.25 16.61
Apr 59 186 3.60 1.62 16.51 20.10 16.51
May 101 183 4.00 1.58 17.38 0.87 17.38
Jun 116 159 3.86 1.50 18.72 1.34 18.72
Jul 159 140 4.19 1.51 21.33 2.61 21.33
Aug 160 140 4.65 1.59 24.36 3.03 24.36
Sep 136 150 4.61 1.70 26.59 2.22 26.59
Oct 93 177 4.69 1.94 27.03 0.44 27.03
Nov 17 189 4.47 1.94 25.07 21.95 25.07
Dec 3 217 4.21 2.06 22.17 22.91 22.17
Total average 871 2150 49.16 20.80 20.03
Table A2
Baher el Ghazal sub-basin: mean record of input data and water balance results based on Sutcliffe and Parks (1999) model
Month R (mm/month) E (mm/month) Qin (Gm3/month) Qout (Gm3/month) V (Gm3) dV (Gm3/month) A (Gm2)
Jan 0 217 0.05 0.02 7.26 21.74 7.26
Feb 4 190 0.01 0.03 6.01 21.26 6.01
Mar 14 202 0.00 0.04 4.94 21.07 4.94
Apr 49 186 0.01 0.04 4.38 20.56 4.38
May 110 183 0.16 0.03 4.23 20.16 4.23
Jun 143 159 0.47 0.02 4.54 0.32 4.54
Jul 175 140 1.06 0.02 5.58 1.04 5.58
Aug 184 140 2.01 0.03 7.54 1.96 7.54
Sep 141 150 3.05 0.02 10.10 2.57 10.10
Oct 69 177 2.92 0.02 11.62 1.52 11.62
Nov 10 189 1.29 0.01 10.88 20.74 10.88
Dec 1 217 0.31 0.01 9.02 21.86 9.02
0.00
Total average 900 2150 11.33 0.31 7.18 0.02
Y.A. Mohamed et al. / Journal of Hydrology 289 (2004) 145–164162

References
Ahmed, M.D., Bastiaanssen, W.G.M., 2003. Retrieving soil
moisture storage in the unsaturated zone from satellite imagery
and bi-annual phreatic surface fluctuations. Irrig. Drain. Syst. 17
(2), 3–18.
Allen, R.G., Pereira, L.S., Raes, D., Smith, M., 1998. Crop
evapotranspiration: guidelines for computing crop water
requirements, United Nations FAO, Irrigation and Drainage
Paper 56, Rome, Italy, 300 pp.
Allen, R.G., Bastiaanssen, W.G.M., Tasumi, M., Morse, A., 2001.
Evapotranspiration on the watershed scale using the SEBAL
model and Landsat images, ASAE Meeting Presentation, Paper
Number 01-2224, Sacramento, California, USA, July 30–
August 1, 2001,.
Allen, R.G., Morse, A., Tasumi, M., Trezza, R., Bastiaanssen,
W.G.M., Wright, J.L., Kramber, W., 2002. Evapotranspiration
from a satellite-BASED surface energy balance for the Snake
Plain Aquifer in Idaho, Proceedings of the National USCID
Conference, San Luis Obispo, California, July 8–10, 2002, 10
pp.
Bastiaanssen, W.G.M., 2000. SEBAL-based sensible and latent heat
fluxes in the irrigated Gediz Basin, Turkey. J. Hydrol. 229,
87–100.
Bastiaanssen, W.G.M., Chandrapala, L., 2003. Water balance
variability across Sri Lanka for assessing agricultural and
environmental water use. Agric. Water Mgmt 58 (2), 171–192.
Bastiaanssen, W.G.M., Menenti, M., Feddes, R.A., Holtslag,
A.A.M., 1998a. The Surface energy balance algorithm for
land (SEBAL). Part 1. Formulation. J. Hydrol. 212/213,
198–212.
Bastiaanssen, W.G.M., Pelgrum, H., Wang, J., Ma, Y., Moreno, J.,
Roerink, G.J., van der Wal, T., 1998b. The surface energy
balance algorithm for land (SEBAL): Part 2. Validation.
J. Hydrol. 212/213, 213–229.
Bastiaanssen, W.G.M., Ud-din-Ahmed, M., Chemin, Y., 2002.
Satellite surveillance of evaporative depletion across the Indus
Basin. Water Resour. Res. 38 (12), 1273–1282.
Boni, G., Enthekabi, D., Castelli, F., 2001. Land data assimilation
with satellite measurements for the estimation of surface energy
balance components and surface control on evaporation. Water
Resour. Res. 37 (6), 1713–1722.
Brutsaert, W.H., Sugita, M., 1992. Regional surface fluxes from
satellite-derived surface temperatures (AVHRR) and radiosonde
profiles. Bound.-Layer Meteorol. 58, 355–366.
Butcher, A.D., 1938. The Sadd Hydraulics. Ministry of Public
Works, Cairo.
Chan, S.-O., Eagleson, P.S., 1980. Water balance studies of the
Bahr el Ghazal swamp, Report No. 261, Department of Civil
Engineering, Massachusetts Institute of Technology.
Choudhury, B.J., 1989. Estimating evaporation and carbon
assimilation using infrared temperature data: vistas in modeling.
In: Asrar, G., (Ed.), Theory and Applications in Optical Remote
Sensing, Wiley, New York, pp. 628–690.
Denny, P., 1984. Permanent swamp vegetation of the Upper Nile.
Hydrobiologia 110, 79–90.
Dolman, A.J., Hall, M., Kavvas, M.L., Oki, T., Pomeroy, J.W.
(Eds.), 2001. Soil–vegetation–atmosphere transfer schemes
and large-scale hydrological models. Proceedings of an
International Symposium (Symposium S5) held during the
Sixth IAHS Scientific Assembly at Maastricht, The Netherlands,
IAHS Publication No. 270,.
El-Hemry, I.I., Eagleson, P.S., 1980. Water balance estimates of the
Machar Marches, Report No. 260, Department of Civil
Engineering, Massachusetts Institute of Technology.
Enthekhabi, D., Asrar, G.R., Betts, A.K., Beven, K.J., Bras, R.L.,
Duffy, C.J., Dunne, T., Koster, R.D., Lettenmaier, D.P.,
McLaughlin, D.B., Shuttleworth, W.J., van Genuchten, M.Th.,
Wei, M.Y., Wood, E.F., 1999. An agenda for land surface
hydrology research and a call for the second international hydro-
logical decade. Bull. Am. Meteorol. Soc. 80 (10), 2043–2058.
Farah, H.O., 2001. Estimation of regional evaporation under
different weather conditions from satellite and meteorological
data. PhD Thesis. Department of Water Resources, Wageningen
University, 170 pp
Farah, H.O., Bastiaanssen, W.G.M., 2001. Impact of spatial
variations of land surface parameters on regional evaporation:
a case study with remote sensing data. Hydrol. Process. 15 (9),
1585–1607.
Gilman, K., 1994. Water balance of wetland areas, Conference on
The Balance of Water—Present and Future, 7–9 Sep, 1994.
AGMET Group (Ireland) and Agricultural Group of Royal
Meteorological Society, Dublin, pp. 123–142.
van der Griend, A.A., Owe, M., 1993. On the relationship between
thermal emissivity and the normalized difference vegetation
index of natural surfaces. Int. J. Remote Sensing 14 (6), 119–131.
Hemakumara, H.M., Chandrapala, L., Moene, A., 2003. Evapo-
transpiration fluxes over mixed vegetation areas measured
from large aperture scintillometer. Agric. Water Mgmt 58,
109–122.
Table A3
Sobat Sub-basin: Input data based on Sutcliffe and Parks (1999)
Month R
(mm/month)
E
(mm/month)
Qin
(Gm3/month)
Qout
(Gm3/month)
Jan 0 217 0.35 1.02
Feb 2 190 0.23 0.45
Mar 4 202 0.22 0.29
Apr 37 186 0.28 0.25
May 130 183 0.62 0.43
Jun 151 159 1.57 0.86
Jul 214 140 2.65 1.29
Aug 288 140 3.53 1.59
Sep 166 150 4.05 1.77
Oct 92 177 2.75 1.99
Nov 31 189 1.11 1.98
Dec 0 217 0.60 1.76
Total 1115 2150 17.96 13.69
Y.A. Mohamed et al. / Journal of Hydrology 289 (2004) 145–164 163

Hurst, H.E., Black, R.P., 1931. General description of the Basin,
Meteorology, Topography of the White Nile Basin, The Nile
Basin, vol. I. Government Press, Cairo.
Jhorar, R.K., Bastiaanssen, W.G.M., Feddes, R.A., van Dam, J.C.,
2002. Inversely estimating soil hydraulic
functions using evapotranspiration fluxes. J. Hydrol. 258,
198–213.
Jonglei investigation team, 1954. The Equatorial Nile Project and its
effects in the Anglo-Egyptian Sudan, Report of the Jonglei
Investigation Team, Sudan Government, Khartoum.
Kustas, W.P., Norman, J.M., 1996. Use of remote sensing for
evapotranspiration monitoring over land surfaces. Hydrol. Sci.
J. 41 (4), 495–515.
Mason, I.M., Harris, A.R., Moody, J.N., Birkett, C.M., Cudlip, W.,
Vlachogiannis, D., 1992. Monitoring wetland hydrology by
remote sensing: a case study of the Sudd using infra-red imagery
and radar altimetr, Proceedings of the Central Symposium of
the International Space Year Conference, Munich, ESA SP-341,
pp. 79–84.
Migahid, A.M., 1948. Report on a Botanical Excursion to the Sudd
Region. Fouad I University Press, Cairo.
Moran, S.M., Jackson, R.D., 1991. Assessing the spatial distribution
of evaporation using remotely sensed inputs. J. Environ. Qual.
20, 725–737.
Morse, A., Tasumi, M., Allen, R.G., Kramber, W.J., 2000.
Application of the SEBAL Methodology for Estimating
Consumptive Use of Water and Streamflow Depletion in the
Bear River Basin of Idaho through Remote Sensing, Final
Report. Idaho Department of Water Resources and University of
Idaho, Idaho, 107 pp.
Penman, H.L., 1963. Vegetation and Hydrology, Technical
Commission 53. Commonwealth Bureau of soils, Harpenden,
Englan.
PJTC, 1960/61. Permanent Joint Technical Committee for the Nile
Waters, First Annual Report.
Savenije, H.H.G., 1995. New definitions for moisture recycling and
the relation with land-use changes in the Sahel. J. Hydrol. 167,
57–78.
Savenije, H.H.G., 1996a. The runoff coefficient as the key to
moisture recycling. J. Hydrol. 176, 219–225.
Savenije, H.H.G., 1996b. Does moisture feedback affect rainfall
significantly? Phys. Chem. Earth 20 (5/6), 507–513.
Savenije, H.H.G., 1997. Determination of evaporation from a
catchment water balance at a monthly time scale. Hydrol. Earth
Syst. Sci. 1, 93–100.
Schuurmans, J.M., Troch, P.A., Veldhuizen, A.A., Bastiaanssen,
W.G.M., Bierkens, M.F.P., 2003. Assimilation of remotely
sensed latent heat flux in a distributed hydrological model. Adv.
Water Resour. 26 (2), 151–159.
Sellers, P.J., Randall, D.A., Collatz, G.J., Berry, J.A., Field, C.B.,
Dazlich, D.A., Zhang, C., Collelo, G.D., Bounoua, I., 1996. A
revised land surface parameterization (SIB2) for atmospheric
GCMs. Part 1. Model formulation. J. Clim. 9, 676–705.
Sutcliffe, J.V., Parks, Y.P., 1999. The Hydrology of the Nile, IAHS
Special Publication No. 5. IAHS Press, Institute of Hydrology,
Wallingford, Oxfordshire.
Travaglia, C., Kapetsky, J., Righini, G., 1995. Monitoring Wetlands
for Fisheries by NOAA AVHRR LAC Thermal Data. FAO/
SDRN, Rome, Italy.
Trenberth, K.E., 1999. Atmospheric moisture recycling: role of
advection and local evaporation. J. Clim. 12, 1368–1381.
Tucker, C.J., 1979. Red and photographic infrared linear combi-
nations for monitoring vegetation. Remote Sensing Environ. 8,
127–150.
Walker, J.P., Willgoose, G.R., Kalma, J.D., 2001. One-dimensional
soil moisture profile retrieval by assimilation of near-surface
observations: a comparison of retrieval algorithms. Adv. Water
Resour. 24, 631–650.
Zhong, Q., Li, Y.H., 1988. Satellite observation of surface albedo
over the Qinghai-Xizang plateau region. Adv. Atmos. Sci. 5,
57–65.
Y.A. Mohamed et al. / Journal of Hydrology 289 (2004) 145–164164
Copyright © 2022 FDOKUMEN