Spatial variability of above-ground net primary production in Uruguayan grasslands: a remote sensing...
14
Spatial variability of above-ground net primary production in Uruguayan grasslands: a remote sensing approach S. Baeza, F. Lezama, G. Pin˜ eiro, A. Altesor & J. M. Paruelo Abstract Question: How does above-ground net primary production (ANPP) differ (estimated from remotely sensed data) among vegetation units in sub-humid temperate grasslands? Location: Centre-north Uruguay. Methods: A vegetation map of the study area was generated from LANDSAT imagery and the land- scape configuration described. The functional heterogeneity of mapping units was analysed in terms of the fraction of photosynthetically active radiation absorbed by green vegetation (fPAR), calculated from the normalized difference vegeta- tion index (NDVI) images provided by the moderate resolution imaging spectroradiometer (MODIS) sensor. Finally, the ANPP of each grassland class was estimated using NDVI and climatic data. Results: Supervised classification presented a good overall accuracy and moderate to good average accuracy for grassland classes. Meso-xerophytic grass- lands occupied 45% of the area, Meso-hydrophytic grasslands 43% and Lithophytic steppes 6%. The landscape was shaped by a matrix of large, unfragmented patches of Meso-xerophytic and Meso-hydrophytic grasslands. The region presented the lowest anthropic fragmentation degree reported for the Rio de la Plata grasslands. All grassland units showed bimodal annual fPAR seasonality, with spring and autumn peaks. Meso-hydrophytic grasslands showed a radiation interception 10% higher than the other units. On an annual basis, Meso-hydrophytic grasslands produced 3800 kg dry matter (DM) ha 1 yr 1 and Meso-xerophytic grasslands and Lithophy- tic steppes around 3400 kg DM ha 1 yr 1 . Meso- xerophytic grasslands had the largest spatial variation during most of the year. The ANPP temporal varia- tion was higher than the fPAR variability. Conclusions: Our results provide valuable informa- tion for grazing management (identifying spatial and temporal variations of ANPP) and grassland conservation (identifying the spatial distribution of vegetation units). Keywords: Land-cover classification; Native grass- lands; Normalized difference vegetation index (NDVI); Radiation-use efficiency; Rı´o de la Plata grasslands. Nomenclature: Zuloaga et al. (1994), Zuloaga & Morrone (1996a,b). Abbreviations: ANPP 5 Above-ground net primary production; fPAR 5 Fraction of photosynthetically active radiation absorbed by green vegetation; NDVI 5 Normalized difference vegetation index; APAR 5 Photosynthetically active vegetation ab- sorbed by the canopy. Introduction The description of the spatial and temporal variation of vegetation variables is a critical step in defining management actions in rangelands. Such characterization can be based either on structural or functional attributes. Structural approaches focus on floristic or physiognomic descriptions of com- munities or vegetation types. Functional approaches can be based on the relative abundance of plant functional types (Lavorel et al. 1997), and on the seasonal variation of the exchange of matter and energy between the biota and the environment (Paruelo et al. 2001). Above-ground net primary Baeza, S. (corresponding author, sbaeza@fcien. edu.uy) & Altesor A. ([email protected]): Seccio´n Ecologı´a Terrestre, Departamento de Ecologı´a, Facul- tad de Ciencias, Universidad de la Repu´blica, Igua´ 4225, Montevideo, Uruguay. Lezama F. (fl[email protected]): Instituto Nacio- nal de Investigacio´n Agropecuaria, Ruta 8 km282, Treinta y Tres CP 33000, Uruguay. Pin˜ eiro G. ([email protected]): Laboratorio de Ana´lisis Regional y Teledeteccio´n, IFEVA, Facultad de Agronomı´a, Universidad de Buenos Aires/CONI- CET, Av. San Martin 4453, C1417DSE, Buenos Aires, Argentina. Paruelo J.M. ([email protected]): Seccio´n Ecolo- gı´a Terrestre, Departamento de Ecologı´a, Facultad de Ciencias, Universidad de la Repu´blica, Igua´ 4225, Montevideo, Uruguay; Laboratorio de Ana´ lisis Regio- nal y Teledeteccio´n, IFEVA, Facultad de Agronomı´a, Universidad de Buenos Aires/CONICET, Av. San Martin 4453, C1417DSE, Buenos Aires, Argentina. Applied Vegetation Science 13: 72–85, 2010 DOI: 10.1111/j.1654-109X.2009.01051.x & 2009 International Association for Vegetation Science
Transcript of Spatial variability of above-ground net primary production in Uruguayan grasslands: a remote sensing...
Spatial variability of above-ground net primary production in
Uruguayan grasslands: a remote sensing approach
S. Baeza, F. Lezama, G. Pineiro, A. Altesor & J. M. Paruelo
AbstractQuestion: How does above-ground net primaryproduction (ANPP) differ (estimated from remotelysensed data) among vegetation units in sub-humidtemperate grasslands?Location: Centre-north Uruguay.Methods: A vegetation map of the study area wasgenerated from LANDSAT imagery and the land-scape configuration described. The functionalheterogeneity of mapping units was analysed interms of the fraction of photosynthetically activeradiation absorbed by green vegetation (fPAR),calculated from the normalized difference vegeta-tion index (NDVI) images provided by the moderateresolution imaging spectroradiometer (MODIS)sensor. Finally, the ANPP of each grassland classwas estimated using NDVI and climatic data.Results: Supervised classification presented a goodoverall accuracy and moderate to good averageaccuracy for grassland classes. Meso-xerophytic grass-lands occupied 45% of the area, Meso-hydrophyticgrasslands 43% and Lithophytic steppes 6%.The landscape was shaped by a matrix of large,unfragmented patches of Meso-xerophytic andMeso-hydrophytic grasslands. The region presented
the lowest anthropic fragmentation degree reportedfor the Rio de la Plata grasslands. All grassland unitsshowed bimodal annual fPAR seasonality, with springand autumn peaks. Meso-hydrophytic grasslandsshowed a radiation interception 10% higher than theother units. On an annual basis, Meso-hydrophyticgrasslands produced 3800kg dry matter (DM) ha� 1
yr� 1 and Meso-xerophytic grasslands and Lithophy-tic steppes around 3400kg �DM �ha� 1 � yr� 1. Meso-xerophytic grasslands had the largest spatial variationduring most of the year. The ANPP temporal varia-tion was higher than the fPAR variability.Conclusions: Our results provide valuable informa-tion for grazing management (identifying spatialand temporal variations of ANPP) and grasslandconservation (identifying the spatial distribution ofvegetation units).
Keywords: Land-cover classification; Native grass-lands; Normalized difference vegetation index(NDVI); Radiation-use efficiency; Rıo de la Platagrasslands.
Nomenclature: Zuloaga et al. (1994), Zuloaga &Morrone (1996a,b).
Abbreviations: ANPP5Above-ground net primaryproduction; fPAR5Fraction of photosyntheticallyactive radiation absorbed by green vegetation;NDVI5Normalized difference vegetation index;APAR5Photosynthetically active vegetation ab-sorbed by the canopy.
Introduction
The description of the spatial and temporalvariation of vegetation variables is a critical step indefining management actions in rangelands. Suchcharacterization can be based either on structural orfunctional attributes. Structural approaches focuson floristic or physiognomic descriptions of com-munities or vegetation types. Functional approachescan be based on the relative abundance of plantfunctional types (Lavorel et al. 1997), and on theseasonal variation of the exchange of matter andenergy between the biota and the environment(Paruelo et al. 2001). Above-ground net primary
Baeza, S. (corresponding author, sbaeza@fcien.
edu.uy) & Altesor A. ([email protected]): Seccion
Ecologıa Terrestre, Departamento de Ecologıa, Facul-
tad de Ciencias, Universidad de la Republica, Igua
4225, Montevideo, Uruguay.
Lezama F. ([email protected]): Instituto Nacio-
nal de Investigacion Agropecuaria, Ruta 8 km282,
Treinta y Tres CP 33000, Uruguay.
Pineiro G. ([email protected]): Laboratorio de
Analisis Regional y Teledeteccion, IFEVA, Facultad
de Agronomıa, Universidad de Buenos Aires/CONI-
CET, Av. San Martin 4453, C1417DSE, Buenos Aires,
Argentina.
Paruelo J.M. ([email protected]): Seccion Ecolo-
gıa Terrestre, Departamento de Ecologıa, Facultad de
Ciencias, Universidad de la Republica, Igua 4225,
Montevideo, Uruguay; Laboratorio de Analisis Regio-
nal y Teledeteccion, IFEVA, Facultad de Agronomıa,
Universidad de Buenos Aires/CONICET, Av. San
Martin 4453, C1417DSE, Buenos Aires, Argentina.
Applied Vegetation Science 13: 72–85, 2010DOI: 10.1111/j.1654-109X.2009.01051.x& 2009 International Association for Vegetation Science

production (ANPP) is an integrative descriptor ofecosystem functioning and it determines the totalamount of available energy for upper trophiclevels (McNaughton et al. 1989). For rangelands,ANPP is the main control of stock density (Oes-terheld et al. 1998). There are many methodologicalalternatives for estimating ANPP, including bio-mass harvesting, empirical models relating ANPPand precipitation or remotely sensed data (Sala &Austin 2000).
Many attempts have been made to characterizeland-cover patterns over extensive areas (thousandsof square kilometres) using high-resolution satelliteimages (i.e. Brown de Colstoun et al. 2003; Guersh-man et al. 2003). These attempts were based on thedifferential spectral response of the distinct landcover types. Multitemporal data allows capture of aspectral signal related with phenological differences,increasing the ability to discriminate among land-cover units (Guershman et al. 2003).
Spectral indices and biophysical variables derivedfrom remotely sensed data have been extensively usedto quantify ecosystem functioning attributes such asprimary production (Prince 1991), or evapotranspira-tion (Jackson et al. 1983). Most of these attempts havebeen based on the analysis of the seasonal variation ofthe normalized difference vegetation index (NDVI), aspectral index calculated from the reflectance in thered (R) and infrared (IR) portions of the electro-magnetic spectrum [NDVI5 (IR�R)/(IR1R)]. Thisindex shows a positive and linear relationship with thefraction of photosynthetically active radiation ab-sorbed by green vegetation (fPAR) and hence withprimary production (Prince 1991; Di Bella et al. 2004;Pineiro et al. 2006a). Monteith’s model (1972) pro-vides the conceptual link between fPAR (estimatedfrom the NDVI) and primary production: ANPP isequivalent to the total amount of photosyntheticallyactive vegetation absorbed by the canopy (APAR)multiplied by a radiation-use efficiency coefficient(see below). The use of Monteith’s model increasessignificantly the correspondence between field andremotely sensed estimates of ANPP (Pineiro et al.2006a).
The Rıo de la Plata grasslands are one of largestareas of natural temperate sub-humid grasslands inthe world (Soriano 1991; Paruelo et al. 2007). Theyoccupy more than 70�106 ha in southern SouthAmerica, including the Pampas in Argentina and theCampos in Uruguay and southern Brazil. An im-portant portion of this region has been or is beingmodified by the expansion of agriculture and affor-estation (Jobbagy et al. 2006; Paruelo et al. 2006).However, large areas are still dominated by natural
(native) or semi-natural grasslands, grazed by cattleand sheep (Paruelo et al. 2007). Land use/land coverdescriptions are scarce in the region (Paruelo et al.2004a; Baldi et al. 2006; Baldi & Paruelo 2008), parti-cularly those describing the floristic and physiognomicheterogeneity of rangelands. The characterization ofstructural (i.e. plant communities or physiognomictypes) and functional (i.e. ANPP gradients) variationis a key step in designing sustainable rangeland man-agement schemes or conservation plans. In Uruguay,livestock production is based mainly on extensive sys-tems where animals graze large paddocks all year-round. Supplementation or more intensive grazingsystems (i.e. rotational management) are not common.Traditional extensive management is characterized bythe low production efficiency and it has been identifiedas a driver of grassland degradation (e.g. the reductionof the relative cover of plant species highly preferredby livestock) (Rodrıguez et al. 2003). The lack ofknowledge of the spatial distribution of grasslandtypes (plant communities) and the interannual andseasonal variability of their productivity restrict,among other factors, the development of sustainablegrazing management (Golluscio et al. 1998).
In this article we combined remote sensing dataand a previous published phytosociological descrip-tion of grassland communities (Lezama et al. 2006) tocharacterize the structure and functioning of the mostextensive areas of natural grasslands in South Amer-ica. Specifically, our goals were: (1) to map the mainvegetation units defined by Lezama et al, 2006 for theBasaltic region in the centre-north portion of Ur-uguay; (2) to describe the degree of grasslandfragmentation of the study area; (3) to characterize thefunctional heterogeneity of the mapped units in termsof fPAR, as derived from spectral indices; and (4) toestimate ANPP for each grassland class using NDVIand climatic data. Finally, we discuss how to integratethis information to devise management actions.
Materials and Methods
Study area
The study area is located in centre-north ofUruguay, on a geomorphological unit based onBasaltic rocks (Panario 1988) (311350S, 561120Wand321120S, 571200W). The analysis was restricted totwo cartographic soil units: ‘‘Cuchilla de Haedo –Paso de los Toros’’ and ‘‘Queguay Chico’’ (Fig. 1).These soil units cover 1.5 million hectares with highpercentages of natural grassland. The dominant soilsin the study area are Hapludols and Udorthents as-sociated with rock outcrops (Altamirano et al. 1976).
Spatial variability of ANPP in uruguayan grasslands 73

The climate of the study areas is temperate to sub-tropical with a mean annual temperature of 181C andmean annual precipitation around 1300mm. (Direc-cion Nacional de Meteorologıa 2005).
Grassland heterogeneity of the region has beendescribed using a phytosociological approach(Lezama et al. 2006). Based on vegetation and en-vironmental variables recorded in 45 homogeneousstands, and from the classification of the species bystand matrix, Lezama et al. (2006) defined six com-munities grouped in three main vegetation units.The main units were named: Meso-xerophyticgrasslands, Lithophytic steppes and Meso-hydro-phytic grasslands (detailed description in App. 1).Ordination analysis showed that floristic variabilitywas mainly associated with a gradient of wateravailability defined by soil depth, texture, slope andslope form (Lezama et al. 2006).
Spatial distribution of grassland units
Supervised classifications were performed onLandsat TM imagery (spatial resolution 30m�30m) to map the vegetation units described by Lezamaet al. (2006). We used two images (Path, 224/Row,082), corresponding to spring (30 September 1999)
and early summer (28 December 2000), to capturephenological differences among units. Both imageswere radiometric and atmospherically correctedto make the spectral information comparable bothin time and space (Chuvieco 2002). We calculatedtop-of-atmosphere reflectance values for each imageusing the headers’ information. Atmosphericcorrections were performed using the ‘‘dark objectsubtraction’’ method. This method estimates therelative atmosphere contribution in the total ra-diance received by the sensor from patches thatshould present null reflectance (shadow zones,water, etc.) and includes multiplicative correctionsfor the effect of atmospheric transmittance (Chavez1996). The Sep image was georeferenced toGauss-Krugger projection (Transverse Mercator;Ellipsoid: Hayford, international 1924; Datum:Yacare) and the Dec image was co-registered tothe first one. We generated a multitemporal imagewith 12 bands (six reflective bands for each date)to capture spectral differences in vegetation cover.The analyses were performed on a subset of the ori-ginal images corresponding to the two soil unitsstudied.
Nine land-cover classes were defined: afforesta-tion, native forest, water bodies, winter crops,
Fig. 1. Study area in centre-north Uruguay. Grey-tone areas correspond to the soil units analyzed. The rectangle shows thevegetation map of the study area derived from Landsat TM images. Unit A: Meso-xerophytic grasslands; Unit B: Litho-phytic steppes; Unit C: Meso-hydrophytic grasslands; W. Crops: winter crops; S. Crops: summer crops; P. soils: Plowed soilsin both dates of images acquisition. The location of the polygons used for training and evaluation process are showed withcrosses (grassland releves) and dots (non-grassland areas).
74 Baeza, S. et al.

summer crops, ploughed soils in both dates of imageacquisition and three grassland types based on theunits defined in the phytosociological analysis(Meso-xerophytic grasslands, Lithophytic steppesand Meso-hydrophytic grasslands). The trainingpolygons for the first six classes were defined byphotointerpretation of false-colour Landsat images(bands 4, 3 and 2). We identified 25 training poly-gons for the non-grassland classes. These classespresented a clear contrast with the grasslands unitsand its identification was simple. For the grasslandunits, 25 homogeneous vegetation stands sampled inLezama’s et al. (2006) phytosociological study wereused as training polygons in the classification pro-cesses. The spectral information of six bands of eachimage and maximum likelihood decision rule wereused to classify all the pixels of the study area (Lil-lesand & Kiefer 1994). The remaining 20 ofLezama’s et al. (2006) vegetation stands and 25polygons of the non-grassland classes were used theto evaluate the accuracy of the classification process.To evaluate the classification we calculated theKappa coefficient and the overall accuracy from acontingency matrix based on polygons not used inthe classification processes (Congalton 1991).
The degree of landscape fragmentation wasanalysed calculating the mean patch size (MPS) andthe effective mesh size (EMS) indexes (Riitters et al.1995). The EMS simultaneously takes into accountthe patch size and the level of dissection and it is notsensitive to the inclusion/omission of small patches;the greater the EMS, the lower is the fragmentationlevel (Jaeger 2000). We removed the ‘‘salt and pep-per’’ appearance of supervised classification byapplying a moving window majority filter (5�5 pix-els). We grouped the grassland units (Meso-
xerophytic grasslands, Lithophytic steppes andMeso-hydrophytic grasslands) and the ploughedsoils, summer and winter crops, into a ‘‘grassland’’and a ‘‘crop’’ class respectively. The remaining mapwas converted from raster to vector format in orderto calculate MPS and EMS.
Vegetation functioning
We used NDVI images from the MODIS sensor(Moderate Resolution Imaging Spectroradiometer)onboard the EOS Terra satellite to characterize akey functioning attribute: the seasonality of lightinterception. The ‘‘MODIS Land Science Team’’(http://modis-land.gsfc.nasa.gov/) produces an NDVIcomposite image every 16 days with a spatial re-solution of 250m�250m. We used a NDVI timeseries corresponding to the period 2000-2004 (112images). The MODIS images were projected tothe same system used for Landsat images. EachNDVI image was filtered using its associated ‘‘perpixel’’ quality image (Roy et al. 2002) and onlythose pixels with acceptable or superior quality wereanalysed.
The supervised classification was intersectedwith a squared cell grid of 250m�250m where eachcell corresponded to a MODIS pixel (Fig. 2). Foreach cell we identified the majority class (mode)on the supervised classification and its proportionwithin the cell. Only those cells with more than 75%of a single class were considered. The NDVI timeseries (112 values) was extracted for each cell.The image analyses and GIS operations were carriedout with ERDAS 8.7 (Leyca Geosystems, Atlanta,GA, US) and ARCMAP-ARCGIS 8.3 (ESRI, Redlands,CA, US).
Fig. 2. Left, supervised classification of Landsat images. Right, the same portion of territory in a NDVI MODIS image. InRed, grid built from MODIS pixels. For each cell the majority class and the percentage of this class were extracted. Onlythose pixels with a percentage of a single class higher than 75% were considered in the functional analysis.
Spatial variability of ANPP in uruguayan grasslands 75

The NDVI values were transformed into fPARusing linear interpolation (Ruimy et al. 1994). Themaximum NDVI was fixed as the 98th percentile ofthe time series (NDVI5 0.83), setting to 95% offPAR interception (assuming saturation at high leafarea index values). The minimum NDVI was fixedas the 5th percentile of bare soil areas (NDVI5
0.215), setting to fPAR5 0. We obtained the fol-lowing equation:
FPAR ¼MINðð�0:3321þ 1:5445� IVNÞ; 0:95Þð1Þ
fPAR data derived from NDVI were used to esti-mate ANPP (g �DM �m� 2 � d� 1) using Monteith’s(1972) model:
ANPP ¼ APAR� ea ¼ PAR� fPAR� eað2Þ
where APAR is the total amount of photosyntheticallyactive radiation absorbed by green vegetation(MJ �m� 2 � day� 1), PAR is the incident photo-synthetically active radiation (MJ �m� 2 � day� 1),fPAR is the fraction of that radiation intercepted bygreen vegetation and ea the energy conversion coeffi-cient of absorbed radiation into above-groundbiomass (gMJ� 1). The PAR data were obtained fromthe BIOME BGC project (http://www.ntsg.umt.edu/cgi-bin/show_good_ncdc_stations.pl) and they corre-sponded to the nearest meteorological station (Salto:311240S,571580W). We calculated average PAR valueswith the daily values for the 16-day intervals corre-sponding to the same dates of NDVI MODIScomposites. The fPAR values were calculated from theNDVI MODIS images as described above. To esti-mate ea we followed the approach presented byPineiro et al. (2006a) and Pineiro et al. (2004) whereseasonal values of ea are calculated from an empiricalrelationship with climatic variables:
ea ¼ 0:36206þ pEf � 0:00214� tmax� 0:01141ð3Þ
where pEF is the effective precipitation accumulatedover the period of ANPP measurement and tmax is theaverage maximum temperature for the same period.Effective precipitation is the fraction of water effec-tively available for plants; it is calculated as a dailywater balance based on precipitation, potential evapo-transpiration and water holding capacity (Pineiro et al.2006b). Water-holding capacity was computed usingpedotransfer functions based on texture data (Rawls1983), and used to estimate runoff, a critical processneeded to properly simulate water dynamics in land-scapes with shallow soils. We used climatic data from
the INIA Salto meteorological station (http://www.inia.org.uy/disciplinas/agroclima/banco_met). Equa-tion 3 was specifically calibrated from local dataincluded in the study area (Pineiro et al. 2004). TheANPP was calculated for every grassland class and for16-day intervals. Annual ANPP was calculated aver-aging the values of the 23 dates of the five growingseason (July-June).
Monthly fPAR and ANPP values from eachgrassland class were averaged over the 5-year periodand compared using repeated measures ANOVA. Vege-tation unit was used as the independent variable andmonths of the average year were used as the repeatedfactor. We used a post hoc comparison Tukey HSDtest (Zar 1996) to evaluate differences among pairs ofclasses. Statistical analyses were performed with STA-
TISTICA 6.0. (Statsoft, Inc. Tulsa, OK, US).The spatial(among pixels pertaining to the same vegetation unit)and temporal (among years) variability of monthlyAPAR, fPAR and ANPP values was evaluated fromthe coefficient of variation.
Results
Spatial distribution of grassland units
The supervised classification of Landsat imagesshowed that more than 90% of the study area is oc-cupied by natural grasslands (Fig. 1). Of the 440 000classified hectares, approximately 45% corre-sponded to Meso-xerophytic grasslands, 43% toMeso-hydrophytic grasslands, 6% to Lithophyticsteppes, 3% to forest, 2% to winter crops and 1% toafforestation. The classes water, ploughed soils andsummer crops were marginal and in total they cov-ered only 0.5% of the classified area (Fig. 1). Thecontingency matrix showed an overall accuracy of91.5%, and a value of kappa coefficient of 0.9. Thishigh overall accuracy could be an artefact of thedistribution of control pixels between the differentclasses because grassland classes represent only 32%of control pixels and 94% of the study area. Theaverage accuracy for grassland classes was 76.8%(Table 1), a good result given the relative homo-geneous physiognomy of these land-covers.
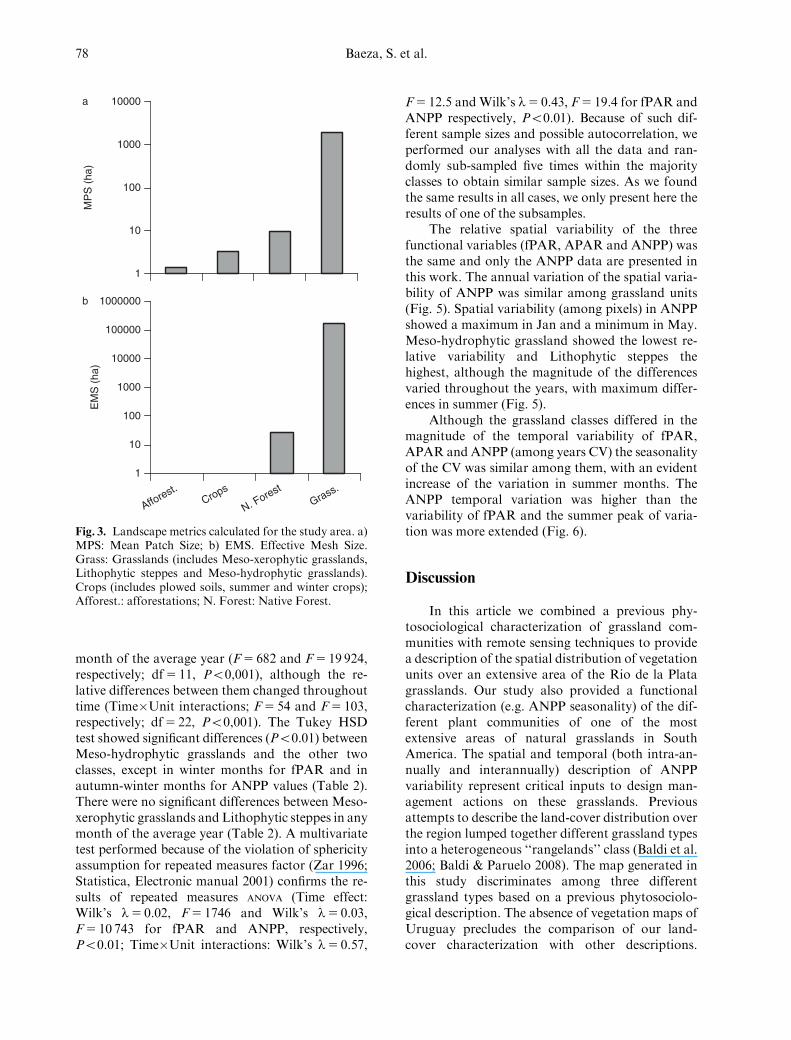
The landscape was conformed by a matrix ofgrasslands. On average, a patch of grassland covered1962 ha, while native forest occupied 9.5 ha. Themore modified land-covers (crops and afforesta-tions) had, on average, patches smaller than 3.2 ha(Fig 3a). The natural land-covers (grasslands andnative forests) are much less fragmented (high EMS)than implanted forests and crop areas (Fig. 3b).
76 Baeza, S. et al.

Vegetation functioning
More than 34 000 ‘‘pure’’ cells (i.e. withmore than 75% of the Landsat pixels belonging to aparticular class within the cell) were identified bysuperimposing the square cell grid of 250m�250mover the supervised classification (Fig. 2). All thegrassland classes analysed showed a bimodal annualvariation of fPAR, with a clearly defined spring peak(maximum values in Oct), a decrease in late spring-early summer and a gradual increase along the sum-mer with maximum values in autumn (Fig. 4j).Despite some variations, this bimodal pattern wasevident throughout all the growing season analysed(Fig. 4i). The highest fPAR values occurred inMarch 2003, onMeso-hydrophytic grasslands, whenthe vegetation absorbed 85% of the available pho-tosynthetically active radiation (Fig. 4i). The lowestfPAR (39%) was observed in Mar 2004 on Litho-phytic steppes (Fig. 4i). The Meso-hydrophyticgrasslands had the highest values of fPAR, with acurve clearly different from the other two grasslandclasses (Fig. 4i,j). The Meso-xerophytic grasslandshad higher average fPAR values than the Lithophy-tic steppes from October to March and were lowerthe rest of the year. The maximum average values offPAR for all the classes occurred in autumn (May),whereas the minimum values occurred in summer
(December) for the xerophytes classes (Meso-xer-ophytic grasslands and Lithophytic steppes) and inwinter for theMeso-hydrophytic grasslands (Fig. 4j).
The 16-d estimates of ANPP (Fig. 4k) resultedfrom the product of fPAR (Fig. 4i), PAR (Fig. 4g)and the radiation-use efficiency (ea) (Fig. 4e). Allgrassland classes showed again a bimodal pattern,with a clear ANPP peak in spring (maximum valuesin Nov) and a much smaller peak in summer (max-imum values in Feb) (Fig. 4k). The differencebetween the spring and summer peaks is bigger inANPP than in fPAR. The second ANPP peakwas also displaced toward mid-summer, withrespect to the fPAR average maximum. On aver-age, maximum ANPP occurred in Nov andwas 15.5 kg � ha� 1 � day� 1 for Meso-xerophyticgrasslands and Lithophytic steppes, and18 kg � ha� 1 � day� 1 for the Meso-hydrophyticgrasslands (Fig. 4l). All grassland classes showed thelowest ANPP values in June (approximately5 kg � ha� 1 � day� 1) (Fig. 4l). On an annual basis,the most productive class was theMeso-hydrophyticgrassland, with an average value of approximately3800 kg � ha� 1 � yr� 1. The other two units presentedsimilar ANPP values (around 3400 kg � ha� 1 � yr� 1).
The fPAR and ANPP were significantly differ-ent among the grassland classes (F5 147 andF5 151, respectively; df5 2, Po0,001) in every
Table 1. Contingency matrix among the classification results and field data expressed by (1) percentage and (2) pixel count.Percentages of correctly classified pixels are shown in bold type. Unit A5Meso-xerophytic grasslands; Unit B5Lithophy-tic steppes; Unit C5Meso-hydrophytic grasslands; W. Crops5winter crops; S. Crops5 summer crops;Affor.5 afforestation; P. soils5 ploughed soils in both dates of images acquisition.
(1) Class Land truth
Unit A W. crops S. crops Water Unit B Unit C Affor Forest P. soils
Classification1
Unit A 78.5 0.0 0.0 0.0 25.6 17.7 1.7 0.1 0.0W. Crops 0.0 99.4 0.0 0.0 0.0 0.0 0.9 0.1 0.0S. Crops 0.0 0.0 54.6 0.0 0.0 0.0 0.0 0.0 0.0Water 0.0 0.0 0.0 100.0 0.0 0.0 0.0 0.0 0.0Unit B 4.0 0.0 0.0 0.0 73.8 0.7 0.0 0.0 0.0Unit C 17.5 0.3 4.6 0.0 0.6 78.2 0.0 0.0 0.0Affor 0.0 0.0 9.1 0.0 0.0 0.7 85.3 0.2 0.0Forest 0.0 0.1 31.8 0.0 0.0 2.8 12.1 99.5 0.0P. soils 0.0 0.1 0.0 0.0 0.0 0.0 0.0 0.0 100.0
Total 100 100 100 100 100 100 100 100 1002
Unit A 274 0 0 0 43 81 2 1 0W. Crops 0 687 0 0 0 0 1 1 0S. Crops 0 0 12 0 0 0 0 0 0Water 0 0 0 162 0 0 0 0 0Unit B 14 0 0 0 124 3 0 0 0Unit C 61 2 1 0 1 359 0 0 0Affor 0 0 2 0 0 3 99 2 0Forest 0 1 7 0 0 13 14 828 0P. soils 0 1 0 0 0 0 0 0 210
Total 349 691 22 162 168 459 116 832 210
Spatial variability of ANPP in uruguayan grasslands 77
month of the average year (F5 682 and F5 19 924,respectively; df5 11, Po0,001), although the re-lative differences between them changed throughouttime (Time�Unit interactions; F5 54 and F5 103,respectively; df5 22, Po0,001). The Tukey HSDtest showed significant differences (Po0.01) betweenMeso-hydrophytic grasslands and the other twoclasses, except in winter months for fPAR and inautumn-winter months for ANPP values (Table 2).There were no significant differences between Meso-xerophytic grasslands and Lithophytic steppes in anymonth of the average year (Table 2). A multivariatetest performed because of the violation of sphericityassumption for repeated measures factor (Zar 1996;Statistica, Electronic manual 2001) confirms the re-sults of repeated measures ANOVA (Time effect:Wilk’s l5 0.02, F5 1746 and Wilk’s l5 0.03,F5 10 743 for fPAR and ANPP, respectively,Po0.01; Time�Unit interactions: Wilk’s l5 0.57,
F5 12.5 andWilk’s l5 0.43, F5 19.4 for fPAR andANPP respectively, Po0.01). Because of such dif-ferent sample sizes and possible autocorrelation, weperformed our analyses with all the data and ran-domly sub-sampled five times within the majorityclasses to obtain similar sample sizes. As we foundthe same results in all cases, we only present here theresults of one of the subsamples.
The relative spatial variability of the threefunctional variables (fPAR, APAR and ANPP) wasthe same and only the ANPP data are presented inthis work. The annual variation of the spatial varia-bility of ANPP was similar among grassland units(Fig. 5). Spatial variability (among pixels) in ANPPshowed a maximum in Jan and a minimum in May.Meso-hydrophytic grassland showed the lowest re-lative variability and Lithophytic steppes thehighest, although the magnitude of the differencesvaried throughout the years, with maximum differ-ences in summer (Fig. 5).
Although the grassland classes differed in themagnitude of the temporal variability of fPAR,APAR and ANPP (among years CV) the seasonalityof the CV was similar among them, with an evidentincrease of the variation in summer months. TheANPP temporal variation was higher than thevariability of fPAR and the summer peak of varia-tion was more extended (Fig. 6).
Discussion
In this article we combined a previous phy-tosociological characterization of grassland com-munities with remote sensing techniques to providea description of the spatial distribution of vegetationunits over an extensive area of the Rio de la Platagrasslands. Our study also provided a functionalcharacterization (e.g. ANPP seasonality) of the dif-ferent plant communities of one of the mostextensive areas of natural grasslands in SouthAmerica. The spatial and temporal (both intra-an-nually and interannually) description of ANPPvariability represent critical inputs to design man-agement actions on these grasslands. Previousattempts to describe the land-cover distribution overthe region lumped together different grassland typesinto a heterogeneous ‘‘rangelands’’ class (Baldi et al.2006; Baldi & Paruelo 2008). The map generated inthis study discriminates among three differentgrassland types based on a previous phytosociolo-gical description. The absence of vegetation maps ofUruguay precludes the comparison of our land-cover characterization with other descriptions.
1
10
100
1000
10000M
PS
(ha
)
1
10
100
1000
10000
100000
1000000
Afforest.Crops
N. Forest
Grass.
EM
S (
ha)
b
a
Fig. 3. Landscape metrics calculated for the study area. a)MPS: Mean Patch Size; b) EMS. Effective Mesh Size.Grass: Grasslands (includes Meso-xerophytic grasslands,Lithophytic steppes and Meso-hydrophytic grasslands).Crops (includes plowed soils, summer and winter crops);Afforest.: afforestations; N. Forest: Native Forest.
78 Baeza, S. et al.
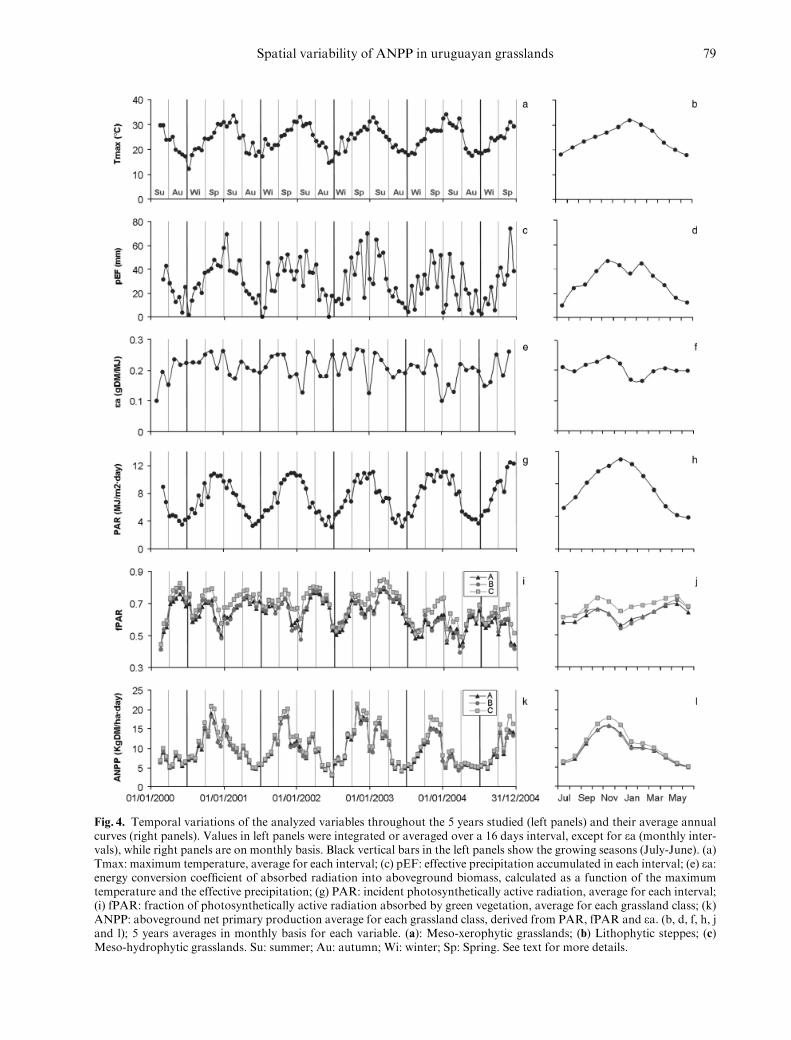
Fig. 4. Temporal variations of the analyzed variables throughout the 5 years studied (left panels) and their average annualcurves (right panels). Values in left panels were integrated or averaged over a 16 days interval, except for ea (monthly inter-vals), while right panels are on monthly basis. Black vertical bars in the left panels show the growing seasons (July-June). (a)Tmax: maximum temperature, average for each interval; (c) pEF: effective precipitation accumulated in each interval; (e) ea:energy conversion coefficient of absorbed radiation into aboveground biomass, calculated as a function of the maximumtemperature and the effective precipitation; (g) PAR: incident photosynthetically active radiation, average for each interval;(i) fPAR: fraction of photosynthetically active radiation absorbed by green vegetation, average for each grassland class; (k)ANPP: aboveground net primary production average for each grassland class, derived from PAR, fPAR and ea. (b, d, f, h, jand l); 5 years averages in monthly basis for each variable. (a): Meso-xerophytic grasslands; (b) Lithophytic steppes; (c)Meso-hydrophytic grasslands. Su: summer; Au: autumn; Wi: winter; Sp: Spring. See text for more details.
Spatial variability of ANPP in uruguayan grasslands 79

However, our area estimates for the different land-covers showed a good agreement with the figures ofthe national agricultural statistics. According toMGAP DIEA (2000) the percentage of naturalgrasslands in the census units included in our studyarea varies between 85% and 97%. For the non-grassland classes this census units shows averagevalues of 2.8% for native forest, 1.3% for afforesta-tions, 0.6% for winter crops and 0.2% for summercrops.
The analysis of the spatial configuration of theland-cover units showed that the fragmentation le-vel of the grasslands was extremely low. The studyarea corresponds to one of the less disturbed sites ofthe whole Rıo de la Plata Grasslands biome. Saura(2002) found the EMS very suitable for comparingmaps with different extents and grains. For fourother areas of the Rıo de la Plata grasslands, Baldiet al. (2006) reported EMS values two orders ofmagnitude lower than those found in our analysis.The ‘‘Flooding Pampa’’ grasslands – the less frag-
mented grassland subregion in Baldi et al. (2006)analysis – showed an EMS average value of 41 km2,which is much lower than found in our study (morethan 1600 km2) (Fig. 3b). According to the scaleoutlined by Forman (1995) and extended by Jaeger(2000) the region studied would be in incipientstages of landscape fragmentation, with big patchesof undisturbed grasslands interrupted by small andisolated patches of crops and afforestations and in-tersected by native forest patches associated withwater streams (Figs 1, 3a,b).
Despite the relative physiognomic homogeneityof the area, the spectral data provided by theMODIS/TERRA sensor allowed us to detect sig-nificant differences in carbon gains among grasslandunits. The dominant communities (Meso-xerophyticand Meso-hydrophytic grasslands) differed inmonthly ANPP except in autumn and wintermonths when light and temperature constrained theproduction of both grassland units (Fig. 4k,l). Thehigher ANPP values of Meso-hydrophytic grass-lands may be explained by community and edaphicattributes, such us the high values of vegetationcover of this unit and soils with greater amounts ofwater available for plant growth (App. 1). Litho-phytic steppes seem to be a particular case of Meso-xerophytic grasslands in terms of their carbon gains.The fPAR values of Lithophytic steppes (a unit withlow plant cover) were higher than expected. Thisunit is dominated by the spike moss Selaginellaselowii (App. 1), a species well-adapted to xeric en-vironments. Studies with other Selaginella species(Selaginella densa) in Canadian grasslands showedthat this species may show a similar NDVI signal(and hence a similar fPAR) to those of other speciesof grasses and bushes (Hall-Beyer & Gwyn 1996).Additionally, Selaginella canopies may have differ-ent a radiation-use efficiency than the other plantfunctional types. Paruelo et al. (1997) showed alower ea in xeric grassland than in humid ones. The
Table 2. Average values (in monthly basis) for the fraction of photosynthetically active radiation absorbed by greenvegetation (fPAR) and aboveground net primary production (ANPP) for grassland classes. Different letters denotesignificant differences between grassland classes (Tukey HSD test, Po0.01). A5Meso-xerophytic grasslands; B5Litho-phytic steppes; C5Meso-hydrophytic grasslands.
July August September October November December January February March April May June
fPARA 0.57 a 0.57 a 0.62 a 0.66 a 0.63 a 0.57 a 0.60 a 0.62 a 0.64 a 0.67 a 079 a 0.64 a
B 0.61 a 0.62 a 0.65 a,b 0.66 a 0.63 a 0.55 a 0.57 a 0.61 a 0.65 a,b 0.69 a,b 0.72 a,b 0.68 a
C 0.61 a 0.62 a 0.68 b 0.73 b 0.71 b 0.66 b 0.67 b 0.69 b 0.70 b 0.72 b 0.74 b 0.69 a
ANPP (kg �DM �m� 2 � d� 1)A 6.11 a 7.30 a 11.10 a 14.80 a 15.90 a 13.78 a 10.29 a 10.04 a 9.30 a 7.51 a 5.79 a 4.92 a
B 6.47 a 7.71 a 11.44 a,b 14.59 a 15.63 a 13.24 a 9.81 a 9.88 a 9.33 a 7.57 a 5.93 a 5.14 a
C 6.42 a 7.67 a 11.92 b 16.13 b 17.68 b 15.88 b 11.49 b 11.04 b 10.05 a 7.94 a 6.10 a 5.20 a
0
4
8
12
16
20
Jul
Aug Sep OctNov Dec Ja
nFeb M
ar AprM
ay Jun
CV
_S A
NP
P (
%)
ABC
Fig. 5. Spatial (among pixels) variability in monthlyAboveground Net Primary Production (ANPP) within thethree grassland units studied, expressed as the coefficientof variation (CV_S). Values are averages over the 5 yearsstudied. (a) Meso-xerophytic grasslands; (b) Lithophyticsteppes; (c) Meso-hydrophytic grasslands.
80 Baeza, S. et al.

model used to calculate ea was generated for mesicgrasslands and is perhaps overestimating the radia-tion-use efficiency of the lithophytic species. Also,given the small size of the patches of this unit, wecannot rule out ‘‘contamination’’ of the MODISpixel with other (more productive) units.
The bimodal seasonality of fPAR can be asso-ciated with the relative abundance of C3 and C4
species in the communities analysed. The springpeak would have an important contribution of C3
(cool season) species, as found in other Uruguayangrasslands (Altesor et al. 2005) The second peak offPAR in late summer-autumn should be related tothe relative importance of C4 grasses (Lezama et al.2006), with a clear summer peak of photosyntheticactivity (Epstein et al. 1997). An analysis based on20 years of NOAA/AVHRR images (PathfinderAVHRR land database, spatial resolution: 8�8 km,temporal resolution: 10 days) also identified a latesummer-autumn peak of NDVI for this region ofthe country (Baeza et al. 2006).
Our results showed important differences be-tween the seasonality of fPAR and ANPP. TheANPP peak of all the units was concentrated in latespring and summer when incoming radiation (PAR)is maximum (Fig. 4g-l). During summer the sharpdecrease in ANPP was associated not only with alower fPAR (probably associated with a lower leafarea caused by water stress-induced senescence) butalso with a lower radiation-use efficiency. ea was lowin summer because of the interaction between hightemperatures and low effective precipitation (Fig.4a,c,e). The ANPP curves generated from remotelysensed data based on Monteith’s model agree withthose generated from field data based on biomassharvest (Berreta & Bemhaja 1998). This study, per-formed on basaltic shallow soils over 14 years (1980-1994), also showed a late-spring/summer peak and agreater variability during summer months; the an-nual average value of forage production between thedifferent soil types analysed in this work was3744 kg � ha� 1 � yr� 1. The lack of superposition be-tween the period studied by Berreta & Bemhaja(1998) and the one analysed in this work precludes aformal comparison between both datasets.
Differences in fPAR and ANPP spatial varia-bility among vegetation units can be explained bythe floristic and environmental (topographic andedaphic) differences among units. The unit showingthe highest ANPP variability in space (Meso-xer-ophytic grasslands) (Fig. 5), was also the mostvariable floristically (Lezama et al. 2006). Also, soildepth, a critical control of water availability, variesbetween 10 and 60 cm in this unit (Lezama 2005;
0
10
20
30
40C
V_T
(%
)
PAR
0
10
20
30
40
CV
_T (
%)
fPAR AfPAR BfPAR C
0
10
20
30
40
CV
_T (
%)
APAR AAPAR BAPAR C
0
10
20
30
40
CV
_T (
%)
εa
0
10
20
30
40
Jul
Aug Sep OctNovDec Ja
nFeb M
ar AprM
ay Jun
CV
_T (
%)
ANPP AANPP BANPP C
Fig. 6. Temporal (among years) variability in monthly va-lues of the considered variables expressed as the coefficientof variation (CV_T). PAR: incident photosyntheticallyactive radiation; fPAR: fraction of photosynthetically ac-tive radiation absorbed by green vegetation; APAR:photosynthetically active radiation absorbed by green ve-getation; ea: energy conversion coefficient of absorbedradiation into aboveground biomass; ANPP: above-ground net primary production; (a) Meso-xerophyticgrasslands; (b) Lithophytic steppes; (c) Meso-hydrophyticgrasslands. fPAR, APAR and ANPP values are averagesfor all pixels in each unit.
Spatial variability of ANPP in uruguayan grasslands 81
Lezama et al. 2006). The soil water-holding capacityof the profile has been identified as a major de-terminant of ANPP in sub-humid grasslands (Salaet al. 1988). Stands of this vegetation unit maytherefore experience a wide range of water avail-ability conditions, which in turn determine fPARand ANPP variability. The high spatial variation ofsummer fPAR (and ANPP) in the Lithophyticsteppes should be related to rapid changes in watercontent of these extremely shallow soils and to thefast response of the photosynthetic activity of Sela-ginella, the dominant species of this community, towater pulses (Hall-Beyer & Gwyn 1996).
Monteith’s model identifies three sources oftemporal and spatial variation in ANPP: theincoming radiation, the fraction of radiation inter-cepted by green leaves and the efficiency ofconversion of radiation into biomass. Figure 4shows that these three variables have a differenttemporal variation. As a consequence, the varia-bility of intercepted radiation (fPAR) is amplifiedwhen the radiation-use efficiency (ea) and the in-cident radiation (PAR) are considered in ANPPcalculations. The ANPP relative variability was al-most twice the variability of fPAR (Fig. 6). The eawas particularly variable in summer months due tothe high variation of the effective precipitation (Fig.4c). ANPP variability peaked during summer andearly autumn (January-April) owing to the com-bined effect of the high variability of ea in January,February and March; and the interaction betweenPAR and fPAR April variations (Fig. 6).
Management implications
Our results provide valuable information for twoapplied issues: grazing management and grasslandconservation. ANPP is the major determinant of stockdensity in extensive rangelands (Oesterheld et al. 1998).The availability of ANPP data is extremely scarce bothin space and time. To date, ANPP for the study areahas only been measured on a few scattered sites (Bem-haja 1996; Berreta & Bemhaja 1998). The estimatespresented provide the basis for assessing forage avail-ability at the paddock level. For extensive rangelandsof Patagonia in Argentina, Golluscio et al. (1998) de-rived stock densities from remotely sensed estimates ofANPP and empirical harvest index coefficients thataccount for the fraction of ANPP that can be con-sumed by domestic herbivores (Oesterheld et al. 1992).The data presented in this work not only providesaverage values of ANPP to define stock carrying ca-pacity but also identifies the range of its spatialvariability: Meso-xerophytic grasslands vegetation
showed an average ANPP of 3447kg � ha� 1 � yr� 1,with a range of 2750kg � ha� 1 � yr� 1. Assuming a har-vest index of forage of 36.3% (Oesterheld et al. 1992;Golluscio et al. 1998) the forage available for herbi-vores will have a 90% chance of being between 253 and2250kg � ha� 1 � yr� 1. Given an average consumptionof a sheep of 365kg � ha� 1 � yr� 1 the estimated stock-ing density will vary in space between 0.7 and6.2 sheepha� 1. Such spatial variability illustrates theproblem that arises when point data are extrapolatedto larger areas and the advantages of spatially ex-haustive methods to assess carrying capacity(Golluscio et al. 1998), and the risk of a general defini-tion of stocking densities over large areas.
Just as important as characterizing ANPP spa-tial variability is describing the seasonal andinterannual changes in the rate of biomass accumu-lation. Monthly average values of ANPP andestimates of their temporal variability are criticalpieces of information to derive forage budgets andto quantify risk and efficiency in livestock produc-tion (Grigera et al. 2007). Our results, for example,highlighted a contrast in interannual variability be-tween summer and late spring. Summer not onlyhad a lower ANPP (Fig. 4k, l) but also it showed ahigh interannual variability (Fig. 6). These two pie-ces of information on forage availability provide auseful tool to manage livestock production systems.
As ANPP estimates at the pixel scale are asso-ciated with a floristic characterization, it is possibleto derive estimates of forage quality based on herbi-vore preference for the dominant species of thecommunity. The inertia or temporal autocorrelationof the ANPP data (Wiegand et al. 2004) allows us todefine a range of expected values of production atleast 1 month ahead. This information, and algo-rithms capable of modelling the influence of wateravailability scenarios, are the basis of devising‘‘warning systems’’ for forage availability.
An improved grazing management scheme willcontribute in itself to grassland conservation. A de-finition of carrying capacity based on ANPP datamay help reduce overgrazing and grassland de-gradation. However, our results may makeadditional contributions to this goal. First, we iden-tified the spatial distribution and location oftargeted entities of conservation plans: plant com-munities. By identifying the connectivity betweenpatches of different classes our map provided ele-ments to define actions to protect communities andspecies (i.e. size and distribution of protected areas).Second, the functional analysis presented is the basisto devise monitoring programs able to detect trendsin ecosystems functioning associated with either
82 Baeza, S. et al.
management-forcing variables or global change dri-vers (climate and atmospheric composition).
Finally, our work provides valuable informa-tion to evaluate the role of grassland heterogeneityon ecosystem health and its impact on biodiversitymaintenance. Several authors pointed out that highlevels of spatial and temporal vegetation variabilitypromote the conservation of species of highertrophic levels (Benton et al. 2003; Fuhlendorf et al.2006; Briske et al. 2008). Here we provided methodsand information to evaluate the spatial and tem-poral heterogeneity of grasslands, which provide thebasis for habitat quality evaluation to test hy-potheses about the impact of heterogeneity onbiodiversity and to define better conservation andlivestock production practices.
Acknowledgements. Research was partly funded by FON-
TAGRO (IICA/BID FTG/RF 0103RG), FPTA 175 –
INIA, SENSOR – TTC 003874–2 (Uruguay and Argentine
partners) and by a grant from the Inter-American Institute
for Global Change Research (IAI, CRN II 2031), which is
supported by the US National Science Foundation (Grant
GEO-0452325). We thank the members of the Laboratorio
de Analisis Regional y Teledeteccion, IFEVA, FAUBA for
their help in the processing of IVN-MODIS images and
German Baldi for providing special help for the landscape
analysis. We thank Aaron Moody and two anonymous re-
viewers for their support and comments.
References
Altamirano, A., Da Silva, H., Duran, A., Echeverrıa, A.,
Panario, D. & Puentes, R. 1976. Carta de
reconocimiento de suelos del Uruguay. Tomo III,
Clasificacion de Suelos. Direccion de Suelos y
Fertilizantes. Ministerio de Agricultura y Pesca,
Montevideo, UY.
Altesor, A., Oesterheld, M., Leoni, E., Lezama, F. &
Rodrıguez, C. 2005. Effect of grazing on community
structure and productivity of a Uruguayan grassland.
Plant Ecology 179: 83–91.
Anon. (Direccion Nacional de Meteorologıa) 2005.
Estadısticas climatologicas 1961–1990. Available at
http://www.meteorologia.com.uy/estadistica_climat.htm
(accessed 1 September 2008).
Anon (Ministerio de Ganaderıa Agricultura y Pesca.).
Direccion de Estadısticas Agropecuarias (MGAP,
DIEA). Censo general Agropecuario 2000. Available at
http://www.mgap.gub.uy (accessed 1 September 2008).
Baeza, S., Paruelo, J.M. & Altesor, A. 2006. Caracter-
izacion funcional de la vegetacion de Uruguay
mediante el uso de sensores remotos. Interciencia 31:
382–388.
Baldi, G. & Paruelo, J.M. 2008. Land use and land
cover dynamics in South American temperate
grasslands. Ecology and Society. 13 (2): 6. [online]
URL: http://www.ecologyandsociety.org/vol13/iss2/
art6/
Baldi, G., Guerschman, J.P. & Paruelo, J.M. 2006.
Characterizing fragmentation in temperate South
America grasslands. Agricultural Ecosystem and
Environment 116: 197–208.
Bemhaja, M. 1996. Produccion de pasturas en Basalto.
INIA Serie Tecnica 80: 231–240.
Benton, T.G., Vickery, J.A. & Wilson, J.D. 2003.
Farmland biodiversity: is habitat heterogeneity the
key? Trends in Ecology and Evolution 18: 182–188.
Berreta, E.J. & Bemhaja, M. 1998. Produccion estacional de
comunidades naturales sobre suelos de Basalto en la
Unidad Queguay Chico. INIA, Serie Tecnica 102: 11–20.
Briske, D.D., Derner, J.D., Brown, J.R., Fuhlendorf,
S.D., Teague, W.R., Havstad, K.M., Gillen, R.L.,
Ash, A.J. & Willms, W.D. 2008. Rotational Grazing
on Rangelands: reconciliation of perception and
experimental evidence. Rangeland Ecology and
Management 61: 3–18.
Brown de Colstoun, E.C., Story, M.H., Thompson, C.,
Commisso, K., Timothy, G., Smith, T.C. & Irons, J.R.
2003. National park vegetation mapping using
multitemporal Landsat 7 data and a decision
tree classifier. Remote Sensing of Environment 85:
316–327.
Chavez, P.S. 1996. Image-based atmospheric corrections.
Revisited and improved. Photogrammetric Engineering
and Remote Sensing 62: 1025–1036.
Chuvieco, E. 2002. Teledeteccion ambiental. La obser-
vacion de la Tierra desde el espacio. Editorial Ariel,
Barcelona, ES.
Congalton, R. 1991. A review of assessing the accuracy of
classifications of remotely sensed data. Remote
Sensing of Environment 37: 35–46.
Di Bella, C.M., Paruelo, J.M., Becerra, J.E., Bacour, C. &
Baret, F. 2004. Effect of senescent leaves on NDVI-
based estimates of fAPAR: experimental and model-
ing evidences. International Journal of Remote Sensing
25: 5415–5427.
Epstein, H.E., Lauenroth, W.K., Burke, I.C. & Coffin,
D.P. 1997. Productivity patterns of C3 and C4
functional types in the U.S. Great Plains. Ecology 82:
722–731.
Forman, R.T.T. 1995. Land mosaics. The ecology of
landscapes and regions. Cambridge University Press,
Cambridge, UK.
Fuhlendorf, S.D., Harrell, W.C., Engle, D.M., Hamilton,
R.G., Davis, C.A. & Leslie, D.M. Jr. 2006. Should
heterogeneity be the basis for conservation? Grassland
bird response to fire and grazing. Ecological
Applications 16: 1706–1716.
Golluscio, R.A., Deregibus, V.A. & Paruelo, J.M. 1998.
Sustainability and range management in the Pata-
gonian steppes. Ecologıa Austral 8: 265–284.
Spatial variability of ANPP in uruguayan grasslands 83
Grigera, G., Oesterheld, M. & Pacın, F. 2007. Monitoring
forage production for farmers’ decision making.
Agricultural Systems 94: 637–648.
Guershman, J.P., Paruelo, J.M., Di Bella, C., Giallorenzi,
M.C. & Pacin, F. 2003. Land cover classification in the
Argentine Pampas using multi-temporal Landsat TM
data. International Journal of Remote Sensing 24:
3381–3402.
Hall-Beyer, M. & Gwyn, Q.H.J. 1996. Selaginella densa
reflectance: relevance to rangeland remote sensing.
Journal of Range Management 49: 470–473.
Jackson, R.D., Hatfield, J.L., Reginato, R.J., Idso, S.B. &
Pinter, P.J. Jr. 1983. Estimation of daily evapotranspi-
ration from one time-of-day measurements. Agricul-
tural Water Management 7: 351–362.
Jaeger, J.A.G. 2000. Landscape division, splitting index,
and effective mesh size: new measures of landscape
fragmentation. Landscape Ecology 15: 115–130.
Jobbagy, E.G., Vasallo, M., Farley, K.A., Pineiro, G.,
Garbulsky, M.F., Nosetto, M.D., Jackson, R.B. &
Paruelo, J.M. 2006. Forestacion en pastizales: hacia
una vision integral de sus oportunidades y costos
ecologicos. Agrociencias 10: 109–124.
Lavorel, S., McIntyre, S., Landsberg, J. & Forbes, T.D.A.
1997. Plant functional classifications: from general
groups to specific groups based on response to dis-
turbance. Trends in Ecology & Evolution 12: 474–478.
Lezama, F. 2005. Las comunidades herbaceas de un area
de pastizales naturales de la Region Basaltica,
Uruguay. Tesis PEDECIBA, Biologıa, Facultad de
Ciencias, Montevideo, UY.
Lezama, F., Altesor, A., Leon, R.J., Paruelo, J.M. 2006.
Heterogeneidad de la vegetacion en pastizales
naturales de la region basaltica de Uruguay. Ecologıa
Austral 16: 167–182.
Lillesand, T. & Kiefer, R. 1994. Remote sensing and image
interpretation. 3rd ed. John Wiley & Sons, New York,
NY, US.
McNaughton, S.J., Oesterheld, M., Frank, D.A. &
Williams, J.K. 1989. Ecosystem-level patterns of pri-
mary productivity and herbivory in terrestrial
habitats. Nature 341: 142–144.
Monteith, J.L. 1972. Solar radiation and productivity in
tropical ecosystems. Journal of Applied Ecology 9:
747–766.
Oesterheld, M., Sala, O.E. & Naughton, S.J. 1992. Effect
of animal husbandry on herbivore-carrying capacity at
a regional scale. Nature 356: 234–236.
Oesterheld, M., DiBella, C.M. & Kerdiles, H. 1998.
Relation between NOAA AVHRR satellite data and
stocking rate of rangelands. Ecology Application 8:
207–212.
Panario, D. 1988. Geomorfologıa del Uruguay. Publi-
cacion de la Facultad de Humanidades y Ciencias,
Universidad de la Republica, Montevideo, UY.
Paruelo, J.M., Epstein, H.E., Lauenroth, W.K. &
Burke, I.C. 1997. ANPP estimates from NDVI for the
central grasslands region of theU.S.Ecology 78: 953–958.
Paruelo, J.M., Jobbajy, E. & Sala, O.E. 2001. Current
distribution of ecosystem functional types in tempe-
rate South America. Ecosystem 4: 683–698.
Paruelo, J.M., Guershman, J.P., Baldi, G. & Di Bella, C.
2004a. La estimacion de la superficie agrıcola.
Antecedentes y una propuesta metodologica.
Interciencia 29: 421–427.
Paruelo, J.M., Guershman, J.P., Pineiro, G., Jobbagy,
E.G., Veron, S.R., Baldi, G. & Baeza, S. 2006.
Cambios en el uso de la tierra en Argentina y
Uruguay: marcos conceptuales para su analisis.
Agrociencia 10: 47–61.
Paruelo, J.M., Jobbagy, E.G., Oesterheld, M., Golluscio,
R.A. & Aguiar, M.R. 2007. The grasslands and
steppes of Patagonia and the Rio de la Plata plains.
In: Veblen, T., Young, K. & Orme, A. (eds.) The
physical geography of South America. pp. 232–248.
Oxford University Press, Oxford, UK.
Pineiro, G., Paruelo, J.M. & Oesterheld, M. 2004.
Estimacion regional de la productividad del campo
natural mediante sensores remotos. In: Proc.
XX Reunion del grupo Campos-Cono Sur, p. 243–
244. Facultad de Agronomia, UDELAR, Montevideo
UY.
Pineiro, G., Oesterheld, M. & Paruelo, J.M. 2006a.
Seasonal variation in aboveground production and
radiation-use efficiency of temperate rangelands
estimated through remote sensing. Ecosystems 9: 357–
373.
Pineiro, G., Paruelo, J.M. & Oesterheld, M. 2006b.
Potential long-term impacts of livestock introduction
on carbon and nitrogen cycling in grasslands of
Southern South America. Global Change Biology 12:
1267–1284.
Prince, S.D. 1991. Satellite remote sensing of primary
production: comparison of results for Sahelian grass-
lands 1981–1988. International Journal of Remote
Sensing 12: 1301–1311.
Rawls, W. 1983. Estimating soil bulk density from particle
size analysis and organic matter content. Soil Science
135: 123–125.
Riitters, K.H., O’Neill, R.V., Hunsaker, C.T., Wickham,
J.D., Yankee, D.H., Timmins, S.P., Jones, K.B. &
Jackson, B.L. 1995. A factor analysis of landscape
pattern and structure metrics. Landscape Ecology 10:
23–39.
Rodrıguez, C., Leoni, E., Lezama, F. & Altesor, A. 2003.
Temporal trends in species composition and plant
traits in natural grasslands of Uruguay. Journal of
Vegetation Science 14: 433–440.
Roy, D.P., Borak, J.S., Devadiga, S., Wolfe, R.E., Zheng,
M. & Descloitres, J. 2002. The MODIS Land product
quality assessment approach. Remote Sensing of
Environment 83: 62–76.
Ruimy, A., Saugier, B. & Dedieu, G. 1994. Methodology
for the estimation of terrestrial net primary production
from remotely sensed data. Journal of Geophysical
Research 99: 5263–5283.
84 Baeza, S. et al.

Sala, O.E. & Austin, A.T. 2000. Methods of estimating
aboveground net primary productivity. In: Sala, O.,
Jackson, R., Mooney, H. & Howarth, R. (eds.)
Methods in ecosystem science. pp. 31–43. Springer,
New York, NY, US.
Sala, O.E., Parton, W.J., Joyce, L.A. & Lauenroth, W.K.
1988. Primary production of the central grassland
region of the United States: spatial pattern and major
controls. Ecology 69: 40–45.
Saura, S. 2002. Effects of minimum mapping unit on land
cover data spatial configuration and composition.
International Journal of Remote Sensing 23: 4853–
4880.
Soriano, A. 1991. Rıo de la Plata Grasslands. In:
Coupland, R.T. (ed.) Natural Grasslands. Introduction
and Western Hemisphere. pp. 367–407. Elsevier,
Amsterdam, NL.
Wiegand, T., Snyman, H.A., Kellner, K. & Paruelo, J.M.
2004. Do grasslands have a memory: modelling
phytomass production of a semiarid South African
grassland. Ecosystems 7: 243–258.
Zar, J.H. 1996. Biostatistical analysis. 3rd ed. Prentice
Hall, NJ, US.
Zuloaga, F.O., Nicora, E.G., Rugolo de Agrasar, Z.E.,
Morrone, O., Pensiero, J. & Cialdella, A.M. 1994.
Catalogo de la Familia Poaceae en la Argentina.
Monographs in Systematic Botany from the Missouri
Botanical Garden. 47: 1–178.
Zuloaga, F.O. & Morrone, O. 1996a. Catalogo de plantas
Vasculares de la Republica Argentina I. Monographs in
Systematic Botany from the Missouri Botanical
Garden. 60: 1–1323.
Zuloaga, F.O. & Morrone, O. 1996b. Catalogo de plantas
Vasculares de la Republica Argentina II. Monographs
in Systematic Botany from the Missouri Botanical
Garden. 74: 1–1269.
App. 1
Macrotopography, physiognomy and list of in-dicator species of the vegetation units studied.Vegetation cover: these are given as modal valueswith minimum and maximum values in parenthesisTable A1.
Received 4 November 2008;
Accepted 16 July 2009.
Co-ordinating Editor: A. Moody
Table A1. The plant functional type corresponding to each species is presented in parenthesis: CS-g5 cool-season grass;WS-g5warm-season grass; A-g5 annual grass; F5 forb; Sh5 shrub; J-C5Cyperaceae or Juncaceae; L5 legume.
VegetationUnit
Microtopography Physiognomy Indicator species
Meso-xerophytic grasslands Shallow soils on steep and gentleslopes and convex interfluves of hills
Two strata mosaic: low (5–10 cm)with grasses and forbs, high (30 cm)dominated by erect grasses and thesub shrub Baccharis coridifoliaSoil cover: 95 (40, 95)
Piptochaetium montevidense (CS-g)Richardia humistrata (F)Baccharis coridifolia (Sh)Botriochloa laguroides (WS-g)Wahlenbergia linarioides (F)Schizachyrium spicatum (WS-g)Ayenia mansfeldiana (F)Eragrostis neesii (WS-g)Aristida venustula (WS-g)Oenothera sp. (F)
Lithophytic steppes Flat erosion surfaces at high andmiddle topographical positions
One open herbaceous stratum of 5–10 cm height, basically a mosaic ofpatches dominated by Selaginellasellowii (a prostrated spike moss)interspersed among rocky outcropsSoil cover: 50 (15, 80)
Hordeum pusillum (A-g)Selaginella sellowiiPortulaca papulosa (F)Euphorbia pampeana (F)Bulbostylis sp. (J-C)Richardia stellaris (F)Tripogon spicatus (WS-g)
Meso-hydrophytic grasslands Deep soils of gentle low slopes,valleys and plains
Two strata: one stratum of prostrategrasses and graminoids (o5 cm) andone stratum of erect grasses (30 cm)Soil cover:100 (75, 100)
Paspalum dilatatum (WS-g)Scutellaria racemosa (F)Coelorhachis selloana (WS-g)Axonopus affinis (WS-g)Panicum hians (WS-g)Mecardonia montevidensis (F)Piptochaetium stipoides(CS-g)Stipa charruana (CS-g)Rhynchospora luzuliformis (J-C)Aristida uruguayensis(WS-g)
Spatial variability of ANPP in uruguayan grasslands 85