Spatial Processes in the Evolution of Resistance in Helicoverpa zea (Lepidoptera: Noctuidae) to Bt...
17
PLANT RESISTANCE Spatial Processes in the Evolution of Resistance in Helicoverpa zea (Lepidoptera: Noctuidae) to Bt Transgenic Corn and Cotton in a Mixed Agroecosystem: a Biology-rich Stochastic Simulation Model NICHOLAS P. STORER, 1 STEVEN L. PECK, 2 FRED GOULD, JOHN W. VAN DUYN, AND GEORGE G. KENNEDY Department of Entomology, College of Agriculture and Life Sciences, North Carolina State University, Raleigh, NC 27695Ð7613 J. Econ. Entomol. 96(1): 156Ð172 (2003) ABSTRACT A simulation model is developed to examine the role of spatial processes in the evolution of resistance in Helicoverpa zea populations to Bt corn and Bt cotton. The model is developed from the stochastic spatially explicit Heliothis virescens model described by Peck et al. (1999), to accom- modate a spatial mix of two host crops (corn and cotton), and to reßect the agronomic practices, as well as the spatial and temporal population dynamics of H. zea, in eastern North Carolina. The model suggests that selection for resistance is more intense in Bt cotton Þelds than in Bt corn Þelds. It further suggests that local gene frequencies are highly dependent on local deployment levels of Bt crops despite the high mobility of the adult insects. Region-wide average gene frequencies depend on the region-wide level of Bt deployment, so incomplete technology adoption slows the rate of resistance evolution. However, on a local scale, H. zea populations in clusters of Þelds in which Bt use is high undergo far more rapid evolution than populations in neighboring clusters of Þelds in which Bt use is low. The model suggests that farm-level refuge requirements are important for managing the risk of resistance. The model can be used as an aid in designing plans for monitoring for resistance by suggesting the appropriate distribution of monitoring locations, which should focus on areas of highest Bt crop deployment. The Þndings need to be placed in the context of the input parameters, many of which are uncertain or highly variable in nature, and therefore, a thorough sensitivity analysis is warranted. KEY WORDS Bacillus thuringiensis, transgenic crops, computer simulation, resistance management IN RECENT YEARS, VARIETIES of corn and cotton express- ing -endotoxin crystal proteins (Cry) from Bacillus thuringiensis (Berliner) (Bt cotton and Bt corn) have been widely deployed. These are effective at protect- ing the crops from attack by a variety of lepidopteran pests (Armstrong et al. 1995, Benedict et al. 1996). Bt crops can be valuable pest management tools, improv- ing the efÞciency and safety of agricultural produc- tion. They can also reduce the chemical inputs needed and thus may improve agricultural sustainability. Pre- serving their efÞcacy has become a high priority of entomologists, the biotechnology industry, and regu- latory authorities (Environmental Protection Agency 1998). Whenever pests are exposed to pesticides, selection occurs for alleles that confer resistance to those pes- ticides. In recent years, Þeld and laboratory popula- tions of insects resistant to Cry1 Bt toxins have been reported (see Tabashnik 1994, Chaufaux et al. 1997, Perez and Shelton 1997, Luttrell et al. 1999, Huang et al. 1999, Burd et al. 2000, Tabashnik et al. 2000). With constitutive expression of the toxins throughout the plant and for the entire growing season, Bt crops have the potential to place the highest selection pressure for such resistance of any insecticide deployed to date (Wearing and Hokkanen 1995). These concerns have led to much effort to develop practical resistance management plans that can delay resistance evolution for 10 Ð15 yr while permitting signiÞcant use of the new technology (Environmental Protection Agency 1997). As we learn more about interactions among the biological, genetic, environ- mental, agronomic, and operational factors that inßu- ence the rate of resistance evolution (Georghiou and Taylor 1977a, b), we are learning that generalizations are rarely valid. This in turn has led to the develop- ment of sophisticated computer models and a demand for system-speciÞc modeling tools. Integration of spa- tial population dynamics and population genetics en- ables the examination of how new insecticidal tech- 1 Current address: Dow AgroSciences LLC, 9330 Zionsville Road, Indianapolis, IN 46268 Ð1054 (E-mail: [email protected]). 2 Department of Biomathematics, North Carolina State University, Raleigh, NC 27695. 0022-0493/03/0156Ð0172$04.00/0 2003 Entomological Society of America
Transcript of Spatial Processes in the Evolution of Resistance in Helicoverpa zea (Lepidoptera: Noctuidae) to Bt...

PLANT RESISTANCE
Spatial Processes in the Evolution of Resistance in Helicoverpa zea(Lepidoptera: Noctuidae) to Bt Transgenic Corn and Cotton in aMixed Agroecosystem: a Biology-rich Stochastic Simulation Model
NICHOLAS P. STORER,1 STEVEN L. PECK,2 FRED GOULD, JOHN W. VAN DUYN, AND
GEORGE G. KENNEDY
Department of Entomology, College of Agriculture and Life Sciences, North Carolina State University,Raleigh, NC 27695Ð7613
J. Econ. Entomol. 96(1): 156Ð172 (2003)
ABSTRACT Asimulationmodel isdeveloped toexamine the roleof spatial processes in theevolutionof resistance in Helicoverpa zea populations to Bt corn and Bt cotton. The model is developed fromthe stochastic spatially explicit Heliothis virescens model described by Peck et al. (1999), to accom-modate a spatial mix of two host crops (corn and cotton), and to reßect the agronomic practices, aswell as the spatial and temporal population dynamics ofH. zea, in eastern North Carolina. The modelsuggests that selection for resistance ismore intense in Bt cotton Þelds than in Bt corn Þelds. It furthersuggests that local gene frequencies are highly dependent on local deployment levels of Bt cropsdespite the high mobility of the adult insects. Region-wide average gene frequencies depend on theregion-wide level of Bt deployment, so incomplete technology adoption slows the rate of resistanceevolution. However, on a local scale, H. zea populations in clusters of Þelds in which Bt use is highundergo far more rapid evolution than populations in neighboring clusters of Þelds in which Bt useis low. The model suggests that farm-level refuge requirements are important for managing the riskof resistance. The model can be used as an aid in designing plans for monitoring for resistance bysuggesting the appropriate distribution ofmonitoring locations,which should focus on areas of highestBt crop deployment. The Þndings need to be placed in the context of the input parameters, many ofwhich are uncertain or highly variable in nature, and therefore, a thorough sensitivity analysis iswarranted.
KEY WORDS Bacillus thuringiensis, transgenic crops, computer simulation, resistancemanagement
IN RECENT YEARS, VARIETIES of corn and cotton express-ing �-endotoxin crystal proteins (Cry) from Bacillusthuringiensis (Berliner) (Bt cotton and Bt corn) havebeen widely deployed. These are effective at protect-ing the crops from attack by a variety of lepidopteranpests (Armstrong et al. 1995, Benedict et al. 1996). Btcrops can be valuable pestmanagement tools, improv-ing the efÞciency and safety of agricultural produc-tion. They can also reduce the chemical inputs neededand thus may improve agricultural sustainability. Pre-serving their efÞcacy has become a high priority ofentomologists, the biotechnology industry, and regu-latory authorities (Environmental Protection Agency1998).Whenever pests are exposed to pesticides, selection
occurs for alleles that confer resistance to those pes-ticides. In recent years, Þeld and laboratory popula-tions of insects resistant to Cry1 Bt toxins have been
reported (see Tabashnik 1994, Chaufaux et al. 1997,Perez and Shelton 1997, Luttrell et al. 1999, Huang etal. 1999, Burd et al. 2000, Tabashnik et al. 2000). Withconstitutive expression of the toxins throughout theplant and for the entire growing season, Bt crops havethe potential to place the highest selection pressurefor such resistance of any insecticide deployed to date(Wearing and Hokkanen 1995).These concerns have led to much effort to develop
practical resistance management plans that can delayresistance evolution for 10Ð15 yr while permittingsigniÞcant use of the new technology (EnvironmentalProtection Agency 1997). As we learn more aboutinteractions among the biological, genetic, environ-mental, agronomic, and operational factors that inßu-ence the rate of resistance evolution (Georghiou andTaylor 1977a, b), we are learning that generalizationsare rarely valid. This in turn has led to the develop-ment of sophisticated computermodels and a demandfor system-speciÞc modeling tools. Integration of spa-tial population dynamics and population genetics en-ables the examination of how new insecticidal tech-
1 Current address: Dow AgroSciences LLC, 9330 Zionsville Road,Indianapolis, IN 46268Ð1054 (E-mail: [email protected]).
2 Department of Biomathematics, North Carolina State University,Raleigh, NC 27695.
0022-0493/03/0156Ð0172$04.00/0 � 2003 Entomological Society of America

nologies affect the area-wide pest populations, andhow the pest populations can respond.Themanagement of insect resistance to insecticides
has for many years stimulated the development oftheoretical models to explore the forces that deter-mine the rate at which such resistance evolves (e.g.,Georghiou and Taylor 1977a, b, Taylor andGeorghiou1979, Tabashnik 1986, Roush 1989). The advent oftransgenic insecticidal crops has further boosted thiswork(e.g.,Gould1994,Roush1994,Alstad andAndow1995, Onstad and Gould 1998). The role played byspatial processes has been explicitly addressed in sev-eral recentpapers(e.g.,Mallet andPorter1992,Caprioand Tabashnik 1992, Peck et al. 1999)
Helicoverpa zea (Boddie) is a lepidopteran pest ofseveral crops in the USA. Two of its major host cropsare corn (Zea mays L.) and cotton (Gossypium hirsu-tum L.). Bt varieties of these crops provide moderatecontrol of H. zea (Mahaffey et al. 1995, Lambert et al.1996, Benedict et al. 1996, Halcomb et al. 1996, Sims etal. 1996, Pilcher et al. 1997, Lynch et al. 1999, Storer etal. 2001). The toxins expressed in currently availableBt varieties of corn (Cry1Ab) and cotton (Cry1Ac)are very similar in structure andmodeof action.Cross-resistance to these toxins has been reported in pop-ulationsofthelepidopteranPlutellaxylostella(Tabash-nik et al. 1994) and Heliothis virescens (Gould et al.1992). It is therefore a reasonable assumption thatalleles that confer cross-resistance to both toxins existat low frequencies in populations ofH. zea.To addressconcerns about such resistance evolving in H. zea, asound understanding of how resistance may evolve inthis species is required to guide a practical resistancemanagement strategy.This paper describes a spatially-explicit computer
model that simulates the population dynamics andpopulation genetics of H. zea in a mixed croppingsystem. Resistance alleles, as genetic mutations ofwild-type alleles, are likely to be rare. Therefore, ran-dom events, such as genetic drift, local extinction, anddeviations from Hardy-Weinberg genetics, are likelyto play signiÞcant roles in the onset of resistance(Caprio and Tabashnik 1992). To simulate these ran-dom events, a stochastic model of H. zea was devel-oped, where the number of insects of each genotypein each Þeld are integers, and several events are prob-abilistic rather than deterministic. The model inte-grates agronomy, the biology of H. zea, insect resis-tancegenetics, and theeffectsof currently availableBtcorn and cotton varieties on the insect. It simulatesresistance evolution over a wide area of mixed cropsand weed hosts. The model has its roots in both pop-ulation genetics and population dynamics theory.The population dynamics ofH. zea in easternNorth
Carolina were Þrst modeled by Stinner et al. (1974)(HELSIM), and improved by Stinner et al. (1977b)(HELSIM II). Their model incorporated several hostcrops and important life history processes to predictthe size, location, and timing of damaging populations.The density-dependent effects of cannibalism on thesize and timing of the adult population from ear-stagecornÞelds was modeled by Stinner et al. (1977a). The
principles andprocesses in thesemodelswere adaptedfor use in the present model.The population genetics in themodel were adapted
from the model of Peck et al. (1999), a stochasticspatially-explicit model of resistance evolution to Btcotton in H. virescens populations. In the currentstudy, PeckÕs model is modiÞed to accommodate aspatial mix of multiple hosts of the polyphagous pest,H. zea, with similar Bt toxins expressed in cotton andcorn. Themodel incorporates the spatial and temporalpopulation dynamics ofH. zea as described for easternNorthCarolina.Additionally, theeffectsofBt cropsonthe insect population were altered to reßect the mod-erate-dose imposed onH. zea by the Bt crops (causing�100%mortality of susceptible insects) as opposed tothehighdose(�100%mortalityof susceptible insects)imposed on H. virescens. This model represents theÞrst biology-rich, stochastic, spatially-explicit modelsimulating the evolution of resistance to Bt toxins inmultiple host crops. Themodel is parameterized usinghistorical Þeld data onH. zea biology in eastern NorthCarolina, and Þeld data on the effects of Bt corn onH. zea that are presented in Storer et al. (2001). Thispaper describes the model and uses it to investigatethe effect of deployment patterns of Bt crops on thespatial and temporal patterns of resistance evolution.A companion paper (Storer et al. 2003) describes asensitivity analysis to look at the effect of altering thevalue of many of the model parameters on the modeloutput.
Materials and Methods
The single-crop, high Bt dose, spatially explicitmodel presented by Peck et al. (1999)wasmodiÞed asfollows to simulate themore complex biology ofH. zeaand more complex agronomy in a mixed croppingsystem.
Agricultural Environment. A geographical area,representing a section of eastern North Carolina, isdivided into a spatial Þeld grid of 24 or 30 rows and 24or 30 columns. Each Þeld is 10 acres, for a total of 5260or 9000 acres modeled. Preliminary model runsshowed that region sizes above 12� 12had little effecton themodel output, and that Þeld sizes of 10 acres orlarger performed similarly. Ten acres is an averageÞeld size for eastern North Carolina (J.W.V.D., un-published data). The simulated region is planted tofour host crops: Bt cotton, non-Bt cotton, Bt corn, andnon-Bt corn.Each year starts in mid-May with insects emerging
as adults from diapaused pupae (Rabb et al. 1975). Asthe year progresses, the phenology of the crops andweeds advances.Early in theyear, cornÞelds are in thewhorl stage, cotton Þelds are prebloom, and weedhosts are available in andaroundeachÞeld.Theweedsare used by a proportion, wp, of insects. At the be-ginning of July, weeds become less suitable and avail-able as hosts, and corn enters the reproductive stage,producing silks and ears. During 11 d in the middle ofJuly, cotton starts to bloom and corn silks start to dry.During August, cotton reaches peak bloom and boll
February 2003 STORER ET AL: SPATIAL PROCESSES IN RESISTANCE EVOLUTION 157

productions, while corn plants are unattractive andunsuitable as hosts. During the second half of August,through September, cotton Þelds mature. The seasonends as the Þelds are harvested in October. This phe-nology follows that typical for eastern North Carolina(Fig. 1) (J.W.V.D, unpublished data), and here isfollowed deterministically for all Þelds.
Agronomic Operations. A proportion, Pcorn, of theÞelds in the region is planted to corn. The remainingproportion of the Þelds (1-Pcorn) is planted to cotton.BtCR is the proportion of cornÞelds that are plantedto Bt hybrids. BtCT is the proportion of cotton Þeldsthat areplanted toBt varieties. The spatialmixof cropscan be Þxed or randomized, and can be changed eachyear to simulate crop rotation. With random cropassignment, as used for the runs presented here, someÞelds can remain in the same crop for more than 1 yr,representingÞelds that arenot rotated. Figure 2 showsan example of a random Þeld layout with 55% of Þeldsas corn (Pcorn), 75% of which are Bt hybrids (BtCR),with the remaining 45% of Þelds as cotton with 75% asBt hybrids (BtCT).Insecticidal spray thresholds in Bt and non-Bt cot-
ton are adjusted to correspond with the North Caro-lina Agricultural Extension Service recommendationsfor treatment of H. zea (Bacheler 1996a). In additionto the larval threshold in theH. virescensmodel, an eggthreshold can also be employed. The number of eggsin a Þeld is derived in the H. zea model from thenumber of neonate and 1-d-old larvae by assuming90% natural mortality of eggs and 50% natural mor-tality of neonates in the Þrst day after hatching (thenumber of eggs is thus assessed as 10 times the numberof newly produced larvae plus twice the number of1-d-old larvae). Using this modeling convenience, a
2-d delay between Þeld scouting and Þeld treatmentis built in. These numbers reßect the number of eggslaid before egg mortality factors, such as parasitismand predation, take effect. Because in the Þeld, onlyeggs on terminals are the primary target for scouting,the recommended egg threshold of 10 eggs per 100terminals (Bacheler 1996b) is modiÞed in the modelto account for the distribution of eggs on cotton plantsaccording to Farrar and Bradley (1985). The eggthreshold for Bt Þelds is 10 times higher than fornon-Bt Þelds, as recommended for North Carolina Btcotton to allow for high larval mortality. The sprays
Fig. 1. Sequential host use byH. zea in eastern North Carolina through four generations. Dark arrows indicate where theinsects switch hosts as the crop phenology changes through the year. As the season progresses an increasing proportion ofinsects enter diapause as pupae, as indicated by the increasing width of the gray arrows from later generations.
Fig. 2. Random crop layout: 55% of Þelds are corn; 45%are cotton. 75% of Þelds in each crop are planted to Btcultivars. The region size is 30 Þelds � 30 Þelds.
158 JOURNAL OF ECONOMIC ENTOMOLOGY Vol. 96, no. 1

have a residual activity that declines linearly to zeroover a period of 7 d, during which time the Þeld is notresprayed, as recommended by Bacheler (1996b). Inthe model, spray efÞcacy is not affected by Bt inges-tion (though see Brickle et al. 2001), and there is nocross-resistancebetweenBt and the insecticidal spray.
Insect Genetics. The genetics of resistance in themodel (mutation rate, Þtness costs, random-matingwithin Þelds) remain as described by Peck et al.(1999). A single diallelic locus controlled susceptibil-ity (S-allele) or resistance (R-allele) in the insects.S-alleles mutated to R-alleles at a Þxed rate. The mu-tation rate was applied probabilistically to each po-tential gamete at mating, whereby the number of S-alleles that mutated to R-alleles in each Þeld each daywas a random deviate drawn from a binomial distri-bution with population size as the number of S-allelesand probability 5 � 10�6. This mutation rate is inkeeping with that often reported for insects(Dobzhansky et al. 1977). As the dose of Bt in thesecrops is not high againstH. zea, the assumption inPecket al. (1999) of a recessive resistance allele is lessrobust. A default assumption of co-dominance be-tween the susceptible and resistant alleles (h � 0.5)was made by extrapolating from the functional dom-inance of Bt resistance in the YHD2 strain of theclosely relatednoctuidmoth,H. virescens (Gould et al.1995). At Bt concentrations that kill 75% of the sus-ceptible strain (as Bt corn does with H. zea), twoexperiments with the YHD2 strain gave 25% and 50%mortality of heterozygous larvae. These mortality Þg-ures translate to functionaldominanceof0.67and0.33,respectively. The average of these Þgures, 0.5, wasused here. In this paper, Bt-susceptible homozygotesare designated SS, heterozygotes are designated RS,and homozygous resistant are designated RR.
Insect Biology andEffects of TransgenicCrops.Theinsect life cycle is divided into two stages: the egg,larval, and pupal stages of development are all mod-eled as one stage; the adult stage is modeled sepa-rately.
Egg/Larval/Pupal Mortality. Juvenile mortality isapplied deterministically to the neonates, with sur-vival calculated as the product of the survival rate toeach of several mortality factors. The offspring sur-viving toadultproducedperparent adult varies amonggenerations. Overwintering adults produce fewer sur-viving offspring than do in-season adults. Fecunditymay be lower, and environmental resistance for theÞrst generation larvae is high because of less suitablefood sources (whorl-stage corn and weeds) (Grossand Young 1977), greater vulnerability to inimicalagents, and less benign weather conditions (Gross etal. 1976). Hence, in the model the replacement rate(R1) for this generation is low. By contrast, the secondgeneration is highly fecund, and ear-stage corn is anexcellent host, so the replacement rate in themodel ishigh (R2). During subsequent generations, host suit-ability is lower, and environmental resistance ishigher, so the replacement rates are reduced (R3). Inthe absence of direct measurements of these replace-ment rates, the values used are set so that the seasonal
population dynamics in the absence of Bt cropsmimicthose typical for eastern North Carolina (Neunzig1969; Stinner et al. 1974; Stinner et al. 1977b; J. S.Bacheler, personal communication). These replace-ment rates are used to calculate the expected numberof neonates in each Þeld each day. The actual numberof neonates of each genotype is a randomdeviate froma binomial distribution with population size as theexpectednumberofneonates andprobability givenbythe expected genotypic frequency based on Hardy-Weinberg proportions (see Peck et al. 1999).Larval survival on Bt relative to survival on non-Bt
dependson the insect genotype, thecrop type, and thecrop phenology (see Table 1). Data in Storer et al.(2001) and Pilcher et al. (1997) suggest that the tox-icity of Bt in whorl stage corn is much higher thantoxicity in ear-stage corn. In whorl-stage Bt corn, theproportion of SS larvae that survive the Bt is given byScw and the proportion of RS larvae that survive the Btis 2Scw (the high toxicity makes the R-allele function-ally recessive here). In ear-stage Bt corn, the propor-tion of SS larvae that survive the Bt is given by Scr. InBt cotton, the proportion of SS larvae that survive theBt is given by Sct. In ear-stage Bt corn and in Bt cotton,RS insects survive according to their relative Þtness:
WRS � h�WRR � WSS� � WSS [1]
whereWRS � Þtness of genotypeRS;WRR � Þtness ofgenotype RR; WSS � Þtness of genotype SS; and h �functional dominance of R-allele.The relative Þtness of genotype RR on all crops,
WRR, is equal to one Ð theÞtness cost of resistance. Forruns presentedhere, the Þtness costwas set to balancethe mutation rate so that the equilibrium R-allele fre-quency is the initial value, q0, as described by Peck etal. (1999). For the default parameter settings, this wascalculated as 0.1.Onear-stage corn, additional larvalmortality occurs
as a result of cannibalism (Stinner et al. 1977a). Can-nibalism is generallyof such intensity in this insect thatusually only one larva will survive in each ear of corn.On non-Bt corn, that survivor is most likely to be theÞrst one to enter the ear because it will be the largestlarva during cannibalistic encounters. On Bt corn,resistant insects grow faster and reach a larger Þnalsize than susceptible insects. Resistant larvae aretherefore likely to have a size advantage in most can-nibalistic encounters even if they enter the ear laterthan susceptible larvae, and are thus more likely towin. Cannibalism therefore acts to increase the Þtnessdifferential between resistant and susceptible pheno-types on Bt corn. The role played by cannibalism inresistance evolution is both density-dependent andR-allele frequency-dependent. [See Storer (1999) fora full discussion of the role played by cannibalism inresistance evolution.] A brief description of the can-nibalism model, and the equations used in this modelfor cannibalism mortality of each insect genotype onear stage corn, are given in Appendix A.Toward the end of summer, as cotton matures and
the environmental resistance to H. zea rises, the suit-ability of cotton as a host declines. In the model,
February 2003 STORER ET AL: SPATIAL PROCESSES IN RESISTANCE EVOLUTION 159
neonate mortality rises linearly with time from midAugust (model day 79) until the end of the season, onboth Bt and non-Bt cotton.
Larval Development Rate. The development ofsusceptible insects on transgenic crops is delayed by6Ð8 d (Pilcher et al. 1997, Storer et al. 2001). In themodel, larval development follows a cohort-based dis-tributed delay, each cohort consisting of the eggs laidin a single day. Thedelay is distributednormally abouta mean dependent on the crop type and insect geno-type. On non-Bt crops, the mean development dura-tion for all larvae is 28 d. On Bt crops, the meandevelopment duration for RR larvae is 28 d, and for SSlarvae is 34 d. The standard deviation, also varies withinsect genotype and plant type. On non-Bt crops, thestandard deviation is 1.5 d. On Bt crops, the standarddeviation for RR larvae is 1.5 d, and for SS larvae it is1.8 d. The mean and standard deviation of develop-ment duration for RS larvae on Bt are intermediatebetween those for RR and SS on Bt according to theirrelative Þtness (equation 1 above).On ear-stage corn, the timing of adult recruitment
is alteredby the intensity of cannibalism(Stinner et al.1977a). The cannibalism model by Storer (1999)showed that as cannibalism becomes more intense,insects entering ears later have a higher probability ofbeing eaten than do those entering earlier. Conse-quently, the mean time to adult eclosion is reducedslightly at higher cannibalism rates.
Pupal Diapause. In Peck et al. (1999), insects thatare in the pupal stage at the end of the season enter
diapause. This creates a high sensitivity to season-length when coupled with a developmental delay onBt crops because it creates differential survivalthrough the winter. In the present model, the propor-tionof insects that becomediapausedpupae insteadofbecoming adults increases as the year progresses,starting at the end of July (day 58) and reaching themaximum probability at the end of September. Asdemonstrated by Rabb et al. (1975), this proportionfollows an approximately cumulative normal curvethrough time. The mean diapause date is �DP, and thestandard deviation is calculated as one third of thedifference between the Þrst diapause date and�DP.Asdiapause is primarily a response to photoperiod (Rabbet al. 1975), adjusting �DP effectively adjusts the timeof the start of the season.Diapaused pupae suffer winter mortality related to
environmental andbiotic factors. The level of survival,WS, is applied stochastically to the diapaused popu-lation, whereby the number of pupae of each geno-type surviving winter in each Þeld is a random deviatefrom a binomial distribution with population size asthe number of diapaused pupae of each genotypegoing into winter, and probability WS.
Adult Movement.The adult movement distributionkernel of Peck et al. (1999) is modiÞed by the relativeÞeld attractiveness, which changes with time. Fieldattractiveness is dependent on relative crop phenol-ogy: cornÞelds in the whorl stage are 10 times moreattractive than prebloom cotton Þelds (all Þelds alsohave suitable weed hosts available at this stage); corn-
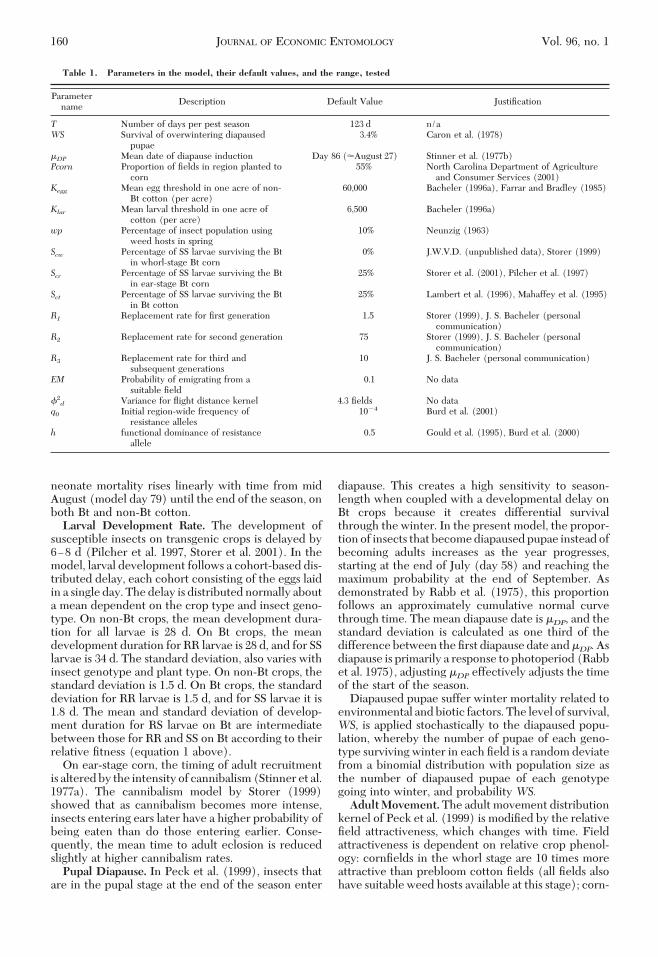
Table 1. Parameters in the model, their default values, and the range, tested
Parametername
Description Default Value JustiÞcation
T Number of days per pest season 123 d n/aWS Survival of overwintering diapaused
pupae3.4% Caron et al. (1978)
�DP Mean date of diapause induction Day 86 (�August 27) Stinner et al. (1977b)Pcorn Proportion of Þelds in region planted to
corn55% North Carolina Department of Agriculture
and Consumer Services (2001)Kegg Mean egg threshold in one acre of non-
Bt cotton (per acre)60,000 Bacheler (1996a), Farrar and Bradley (1985)
Klar Mean larval threshold in one acre ofcotton (per acre)
6,500 Bacheler (1996a)
wp Percentage of insect population usingweed hosts in spring
10% Neunzig (1963)
Scw Percentage of SS larvae surviving the Btin whorl-stage Bt corn
0% J.W.V.D. (unpublished data), Storer (1999)
Scr Percentage of SS larvae surviving the Btin ear-stage Bt corn
25% Storer et al. (2001), Pilcher et al. (1997)
Sct Percentage of SS larvae surviving the Btin Bt cotton
25% Lambert et al. (1996), Mahaffey et al. (1995)
R1 Replacement rate for Þrst generation 1.5 Storer (1999), J. S. Bacheler (personalcommunication)
R2 Replacement rate for second generation 75 Storer (1999), J. S. Bacheler (personalcommunication)
R3 Replacement rate for third andsubsequent generations
10 J. S. Bacheler (personal communication)
EM Probability of emigrating from asuitable Þeld
0.1 No data
�2d Variance for ßight distance kernel 4.3 Þelds No data
q0 Initial region-wide frequency ofresistance alleles
10�4 Burd et al. (2001)
h functional dominance of resistanceallele
0.5 Gould et al. (1995), Burd et al. (2000)
160 JOURNAL OF ECONOMIC ENTOMOLOGY Vol. 96, no. 1

Þelds in the ear stage are 100 times more attractivethanprebloomcottonÞelds; andcottonÞelds inbloomand fruiting stages are 75 times more attractive thanpostsilking cornÞelds. The relative attractiveness ofthe different hosts and host phenology for ovipositionis based on the data in Johnson et al. (1975). Aftercalculations of the distance and attractiveness of eachÞeld, the proportions of dispersing adults ßying toeach Þeld in the distance kernel are modiÞed so thatthey sum to 1.0.
Sources of Stochasticity. Stochasticity occurswithinseasons, as within each Þeld the number of neonatesassigned to each genotype is probabilistic, and thenumber of genetic mutations from susceptible to re-sistant alleles is probabilistic. Additional stochasticityoccurs between years as the number of diapausedpupae surviving winter is also probabilistic. Finally,the spatial matrix of crops is randomly determined atthe start of eachmodel year, based on the proportionsof the four crop types.
The Subroutines and Model Flow.Figure 3 outlinesthemodel ßowover an entire run. Themodel starts byassigning crops to Þelds in the required proportions ofBt corn, non-Bt corn, Bt cotton, and non-Bt cotton. Arandom number (drawn from a normal distribution)of adults is then assigned to each Þeld in the region, inthegenotypicproportionsdeterminedby the requiredinitial R-allele frequency. The model is run for 3 yrwithout Bt in the system so that the R-alleles becomedistributed through the region according to the biol-ogy of the insect. Because there are no detailed Þelddata on population substructure inH. zea, running themodel without Bt creates a simulated population sub-structure based on insect movement and genetic drift(Peck et al. 1999). A period of 3 yr was chosen for thisnull run because the average and standard deviationfor both population sizes and R-allele frequencies donotchange systematicallywithina runwithoutBtafterthis time. The values for these measures at 3 yr arerepresentative of the values after 3 yr.
Fig. 3. Model ßow over an entire run. The individual Þeld procedures are shown in Fig. 4.
February 2003 STORER ET AL: SPATIAL PROCESSES IN RESISTANCE EVOLUTION 161

For each time-step, the program ßow follows thatoutlined in Fig. 4. Each of the processes describedabove can occur in each Þeld at each time step.
Model Outputs. Yearly output gives the total num-ber of diapaused pupae in the region and the averageR-allele frequency in this pupal population. Ancillaryoutput includes the average number of times non-Btcotton Þelds were sprayed during the year. Optionaldaily output consists of the average number of adultsand the average R-allele frequency, both across allÞelds and across the Þelds planted to each of the fourcrops. In addition, themodel gives the variance amongÞelds for each of these variables.A matrix giving the crop, the diapaused pupal pop-
ulation, and the R-allele frequency in each Þeld isproduced at the end of the year when the averageR-allele frequency Þrst exceeds 0.25, or at any othertime of interest during a model run. Using these data,ameasureof thevariation inR-allele frequencyamongÞelds, the adjusted coefÞcient of variation in R-allelefrequency, is calculated as:
cv* �sq2
q �1 � q�[2]
where cultivar* � adjusted coefÞcient of variation,q � region-wide R-allele frequency, and sq
2 � among-Þeld variance in R-allele frequency. This statistic thusgives a measure of population subdivision (Wright1978).The program is written in C��, running in a UNIX
environment. The runs presented here were made ona SUN SPARC Workstation.
Model Parameterization. The model is highly ßex-ible with many agronomic, genetic, and biologicalparameters whose effects can be investigated. Thechoice of default parameters is made to best representwhat is knownabout the life systemofH.zea in easternNorth Carolina. This information is drawn from his-torical information and from published literature. Ta-ble 1gives thedefault value foreachof theparameters.The effects of varying these parameters on the model
Fig. 4. Model ßow in each Þeld each day.
162 JOURNAL OF ECONOMIC ENTOMOLOGY Vol. 96, no. 1

output are discussed in a companion paper (Storer etal. 2003).
Model Validation.To validate the insect populationdynamics of the model, the output was qualitativelycompared with Þeld data. The temporal pattern ofadult numbers during the Þnal year before Bt deploy-ment was qualitatively compared with actual light-trap data of H. zea in the region (J. S. Bacheler, per-sonal communication). Larval infestation datapresented by Neunzig (1969) and Storer et al. (2001)was used to validate the population dynamics in corn.Thenumberof timesnon-Bt cottonÞelds arenormallysprayed with insecticides forH. zea in North Carolinawas used to validate population dynamics in cotton.The genetics of the model cannot be validated in theabsence of documented resistance evolution in theÞeld.
Model Runs. Themodel was used to investigate theeffects on the population dynamics and genetics ofincreasing deployment of Bt corn and Bt cotton fromaminimumof 1%of corn Þelds and 5%of cotton Þelds,up to 75%of each. For these runs, crops in the selectedproportions were assigned to Þelds at random at thestart of each model year. With 1% of cornÞelds as Bt,the model simulated the strict limitations imposed bythe U.S. Environmental Protection Agency on plant-ing Bt corn in cotton-growing regions up to the 1997season (Environmental Protection Agency 1997).With 75% of both crops planted to Bt varieties, themodel simulated the highest deployment of Bt cropsenvisaged for eastern North Carolina, accounting forrequired refugia and nonadoption of the technology.A 4 � 4 factorial design was used to investigate the
effects of the acreage of both Bt corn and Bt cotton.The model output from these runs was the region-wideR-allele frequency each year for 15 yr, or until anR-allele frequency of 50% is reached. Each set-up wasrun three times.Analysisof variance(ANOVA)for thelog-transformed region-wide R-allele frequency after8 yr of Bt crop deployment (q8) was conducted as acompletely randomized design using PROC GLM inSAS(SASInstitute1990),with theprobability level forrejecting the null hypothesis set at 0.10.
Spatial Pattern ofCrops.For thedefault runs above,cropswere assigned toÞelds at randomeachyear.Thiscreated a distribution of Þelds that can by chancecontain areas of locally high Bt deployment, and areasof locally low Bt deployment. Areas of high Bt de-ployment can spur the evolution of resistance becauseof the unselected population being small. However,current resistance management plans require eachfarm to have its own refuge, and include recommen-dations for the maximum distance between Bt cropsand the nearest refuge. This forces the distribution ofrefuge andBtÞelds tobemoreuniform.Bycontrollingthe spatial layout of Þelds, this model was used toassess the role of the refuge structure in resistanceevolution in the highly mobile pest, H. zea.
Farm-Level Refuge. The model was used to simu-late a farm-level refuge requirementbydividinga30�30-Þeld region into 36 farms, each occupying a squareof 5 � 5 Þelds. Each farm contained the same pro-
portion of each of the four crops, assigned to Þeldsrandomly. This ensured that Bt Þelds always havenon-Bt Þelds in close proximity. An example of such acrop layout is shown in Fig. 5. Three model runs weremadewith these assumptions at three levels of Bt corndeployment (BtCR � 25, 50, and 75%) across threelevels of Bt cotton deployment (BtCT � 25, 50, and75%) in a 3 by 3 factorial design. The 8-yr region-wideR-allele frequencies were compared with those fromsimilar runs using the default spatial assumptions byANOVA.
Incomplete Adoption of Bt Crops. As with any ag-ricultural innovation, not all farmers will adopt Bttransgenic crops. It seems reasonable to expect thatfarms that do not adopt Bt technology could providesome of the refuge for those that do, and that conse-quently the on-farm refuge requirements could bereduced to account for the nonadopting farms. Tosimulate this, the30�30Þeld regionwasagaindividedinto 36 5 � 5 farms. For these runs, a number of farmsdid not adopt Bt crops. An example of such a croplayout is shown in Fig. 6. The farms that adopted Btwere the same each year, but positions of cropswithinfarms were randomized each year. Analyses of vari-ancewereconducted to compare the region-wide8-yrR-allele frequency at different levels of Bt adoptionwhen the proportion of Bt crops used on Bt-adoptingfarms is Þxed (so the regional Bt proportion dependson adoption rate). Additional analyses compared theregion-wide 8-yr R-allele frequency at different levelsof Bt adoption when the proportion of Bt crops usedregion-wide is Þxed (i.e., on-farm Bt proportion de-pends on adoption rate). The contribution of non-adopting farms to resistance management in adoptingfarms was assessed by examining the spatial distribu-tion ofR-alleles in the different Bt-adoption scenarios.
Fig. 5. Crop layout with farm-level refuge. Region isdivided into farms of 25 Þelds.Within each farm, 55%of Þeldsare corn 45% are cotton. Within each farm, 75% of Þelds ineach crop are planted to Bt cultivars. Crop postions arerandomized within farms. The region size is 30 Þelds � 30Þelds.
February 2003 STORER ET AL: SPATIAL PROCESSES IN RESISTANCE EVOLUTION 163

Results and Discussion
The relative abundance of moths over a season inthe model (Fig. 7) is qualitatively comparable withactual light-trap data of H. zea in the region (J. S.Bacheler, personal communication), with larval infes-tation data presented by Neunzig (1969). Light trapand larval infestation in eastern North Carolina showhighvariability in timingandsize fromyear toyearandlocation to location. However, the model output is inagreement with the general patterns in these data,such as 3Ð4 population peaks per year,with the largestbeing in early- to mid-August, and continual adultpresence over the entire summer. To validate larvaldensity estimates from the model, we compared Þeldestimateswithmodel predictions for the neonate den-sity on ear-stage corn (region-widemean� 1.85, SE�0.04, from16 runs), and for thenumberof times cottonÞelds reach threshold and are sprayed (region-widemean � 4.6, SE � 0.05, from 16 runs). The number of
neonates per corn ear agrees closely with the numberof small larvae found in Þeld tests in North Carolinaunder moderate infestations (Storer et al. 2001). Thenumber of times cotton Þelds are sprayed also is closeto the average in regions of theNorthCarolina coastalplain under moderate to heavy insect pressure(J.W.V.D., unpublished data).
Default Runs
Insect Populations. One of the prospects raised byhigh deployment of insecticidal crops is the potentialfor area-wide insect suppression. In the model, thepopulation level (overwintering pupae per Þeld be-fore winter mortality) is reduced by the deploymentof Bt (Fig. 8, where the population at year 0 is thenumber of pupae diapaused at the end of the pre-Btperiod). The level of population suppression at thehighest Bt deployment level (suppressed to a levelone-third of the pre-Bt numbers) may be measurablein the Þeld if the effects of the suppression do notinteract with the causes of the large inter-annual vari-ation in populations. However, if there are interac-tions not modeled here, such as compensatory mor-tality or density-dependence outside of corn ears,such population suppression could be difÞcult to ob-serve. It seems that the current Bt transgenic varietiesof these two crops are likely to play only a minor rolein the kind of area-wide population suppression pro-gram envisaged by Knipling and Stadlebacher (1983),especially if there is signiÞcant immigration.A result of population suppression is a reduction in
theneed to spraynon-Bt cottonÞelds. Sprayednon-Btcotton Þelds produce a smaller refuge population thanunsprayed non-Bt cotton Þelds. The reduction in pop-ulation achieved by high Bt deployment reduces thereliance on insecticide sprays to control the popula-tion on non-Bt cotton, but atmost only by around 45%(Fig. 9). The reduction in spraying of these Þelds inturn can increase their contribution to the refugepopulation.
Population Genetics. Under the high levels of Btcorn and Bt cotton deployment that achieve measur-able population suppression, both the population andthe need to spray non-Bt cotton start to return towardthe pre-Bt levels as the years progress. This is a resultof the populations becoming resistant to Bt (Fig. 10).ANOVA for the dependence of the 8-yr region-wideR-allele frequency (q8, log-transformed) on the pro-portion of cotton Þelds that are Bt and the proportionof cornÞelds that are Bt showed a strong main effectof the proportion of cotton planted to Bt (F � 1700;df � 3,32; P � 0.01), a strong main effect of theproportion of corn planted to Bt (F � 697; df � 3,32;P � 0.01), and a signiÞcant interaction effect betweenthese (F � 4.79; df � 9, 32; P � 0.01). This indicatesthat the more Bt that is deployed, the faster the rateof evolution. The effects of Bt corn are a little smallerthan theeffects ofBt cottonÑforexample, theR-allelefrequency if 75% of cotton is Bt and 25% of corn is Btis higher than if 25% of cotton is Bt and 75% of corn isBt. The greater importance of Bt cotton is mostly
Fig. 6. Crop layoutwith incomplete adoptionofBt crops.Region is divided into farms of 25 Þelds. Within each farm,55% of Þelds are corn and 45% are cotton. 67% of farms adoptBt technology; within each adopting farm, 75% of Þelds ineach crop are planted to Bt cultivars (so 50% of Þelds in eachcrop areBt across the region). Crop postions are randomizedwithin farms. Region size is 30 Þelds � 30 Þelds.
Fig. 7. Number of adults per Þeld, averaged across theentire model region, each day during Þnal year before Btdeployment. Output from a single run. Values for all param-eters are the default values shown in Table 1.
164 JOURNAL OF ECONOMIC ENTOMOLOGY Vol. 96, no. 1

attributable to the spraying of non-Bt cotton Þeldswhen they reach threshold, which reduces the effec-tive refuge size. Non-Bt corn Þelds are not sprayed, sothe ratio of adults emerging from non-Bt and Bt cornis higher than the ratio from cotton. The effects of thetwo crops appear additive over most of the range ofvalues tested, except at high deployment of Bt in both
crops where the rise in R-allele frequency tails off asthe frequency approaches one (Fig. 10). This createsthe signiÞcant interaction between the levels of de-ploymentofBt in the twocrops. In theÞeld, theeffectsof the levels of the two crops will likely be seen asadditive, as Bt would not likely be deployed onceresistance reached high levels.
Fig. 8. Reduction in population of diapaused pupae (average per Þeld) over 10Ð15 yr after deployment of different levelsof Bt corn and Bt cotton. Output from default model runs. Each point represents the average of three runs. Values for allparameters are the default values shown in Table 1.
Fig. 9. Average number of times each non-Bt cotton Þeld is sprayed for 10Ð15 yr after deployment of different levels ofBt corn and Bt cotton. Output from default model runs. Each point represents the average of three runs. Values for allparameters are the default values shown in Table 1.
February 2003 STORER ET AL: SPATIAL PROCESSES IN RESISTANCE EVOLUTION 165

Unlike the Þndings of Peck et al. (1999) using theparent model, extinction of the R-allele never oc-curred. This difference is a result of the lower toxicityof Bt to H. zea in comparison with its toxicity toH. virescens, and the associatedhigh survivorshipofRSlarvae on Bt crops. The R-allele is maintained in allpopulations.It is worth noting that in these runs, the standard
errors, representing run-to-run variation, are verysmall, generally smaller than the symbols in the Þg-ures. This contrasts with the Þndings of Peck et al.(1999) who saw great run-to-run variability with asimilar model. Thus, the model suggests that for a
nonhighdose toxin that allowsconsiderable survival ofboth susceptible insects and heterozygotes, rareevents involving rare homozygous resistant insects areless important than they are for the high dose toxinmodeled by Peck et al. (1999).
Spatial Distribution of Crops, Pupae, and R-alleles.The spatial aspects of the model output are shown inFig. 11. Figure 11A shows the overwintering popula-tion in each Þeld in a 30 by 30 matrix after 7 yr at 75%Bt cotton and 75% Bt corn. The Þeld layout for thisyear is that shown in Fig. 2. Fields with the lowestpopulations (palest squares) are cornÞelds, fromwhere most insects have left (for cotton) during the
Fig. 10. R-allele frequency changes for 10Ð15 yr after deployment of different levels of Bt corn and Bt cotton. Outputfrom default model runs. Each point represents the average of three runs. Values for all parameters are the default valuesshown in Table 1.
Fig. 11. (A) Distribution of populations of diapaused pupae (N), and (B) distribution of R-allele frequencies (q), whenregion-wide R-allele frequency is 0.25. Crop layout for the year shown is the same as in Fig. 2. Darker squares represent Þeldswith higher populations or higher gene frequencies. The region size is 30 Þelds� 30 Þelds. 75%of corn is Bt, and 75%of cottonis Bt. All other parameters are set at default values shown in Table 1.
166 JOURNAL OF ECONOMIC ENTOMOLOGY Vol. 96, no. 1

summer. Dark squares are cotton Þelds in which mostof the overwintering population is produced. The re-gion-wide R-allele frequency at the time point is 0.26,but the R-allele frequency is variable among Þelds(Fig. 11B). The lowest frequency is 0.052, and thehighest is 0.47. The adjusted coefÞcient of variation inFig. 11B is 0.06. Across the region there are severalpatches of up to 20 contiguous Þelds, where the R-allele frequency is above 0.4. These small patches aregenerally in broader areas of the region with above-average gene frequencies. Areas of locally high-Btdeployment can create increased resistance, whichthen rapidly spread through the region because of thehigh mobility of the insect.
Spatial Pattern of Crops
Farm-level Refuge. Figure 12 shows the effect ofdistributing the refuge more uniformly across the re-gion on the region-wide R-allele frequency after 8 yr.In theANOVA, themain effect of the refuge structureis signiÞcant (F � 3.55; df � 1,36; P � 0.07), a farm-level refuge structure slowing resistance evolutionbecause of improved population mixing. The effect ofmaking the refuge structure uniform rather than ran-dom is very small and does not interact with theproportion of cotton planted to Bt or the proportionof corn planted to Bt (Fig. 12).Improving the uniformity of refuge distribution can
also reduce the variability in R-allele frequenciesamong Þelds. At 75% deployment of Bt varieties ineach crop, the adjusted coefÞcient of variation (equa-tion 2 when the region-wide R-allele frequencyreaches 0.25 is reduced froman average of 0.059 (SE�0.0024) to an average of 0.047 (SE � 0.0022). Thisdifference is signiÞcant at the 0.05 level (t � 3.52; df�4; P � 0.02) (log�1 transformed data). The distribu-tion of R-allele frequencies using a farm-level refugestructure (Fig. 13) is improved when compared withthe default regional refuge structure (Fig. 11B).
Reduced Adoption of Bt Crops. If not all farmersadopt Bt, the region-wide rate of resistance evolutionwill be slowed.The farmersplantingonlynon-Bt cropsprovide a nonselected insect population additional tothat produced from the refuge planted onBt-adoptingfarms. When the on-farm refuge is 50% in each crop(i.e., BtCR � 0.5 and BtCT � 0.5), the region-wideR-allele frequency after 8 yr is around 0.02 if all farmsadopt Bt, but only 0.001 if 50% of farms do not adoptBt. The effect is signiÞcant (F � 300.8; df � 1,4; P �0.01; Fig. 14A). Similarly, when the on-farm refuge is25% in each crop (BtCR � 0.75 and BtCT � 0.75), theregion-wide R-allele frequency after 8 yr is 0.5 if allfarms adopt Bt, 0.05 if 67% of farms adopt Bt, and 0.001if 33% of farms adopt Bt. The effect is again signiÞcant(F � 409.6; df � 2, 6; P � 0.01; Fig. 14B).By considering the total refuge across the region,
the contributionof farmsnot adoptingBt to the refugepopulation for farms that do adopt Bt can be assessed.Having part of the region-wide refuge supplied byfarms thatdonotadoptBtdisrupts the structureof thatrefuge. In these runs, when the region-wide refuge is75% of Þelds, the region-wide R-allele frequency after8 yr is the same whether all farms adopt Bt (on-farmBt deployment: BtCR � 0.25, BtCT � 0.25), 50% offarms adopt Bt (on-farm Bt deployment: BtCR � 0.5,BtCT � 0.5), or 33% of farms adopt Bt (on-farm Btdeployment:BtCR� 0.75,BtCT� 0.75) (F� 0.92; df�2, 6; Fig. 14C). Hence, the region-wide R-allele fre-quency is unaffected by disrupting the uniformity ofthe refuge distribution when the total refuge is large.When the regional refuge is 50% of Þelds, the region-wide R-allele frequency after 8 yr is lower when allfarms adopt Bt (on-farm Bt deployment: BtCR � 0.5,BtCT�0.5) thanwhen67%of farmsadoptBt(on-farmBt deployment: BtCR � 0.75, BtCT � 0.75). This dif-ference is signiÞcant (F � 27.5; df� 1, 4; P � 0.01; Fig.14D). The production of susceptible insects fromnearbynon-Bt farms is insufÞcient to completely com-pensate for the local selection on farms that use onlya 25% refuge.
Fig. 12. Comparison between regional refuge structure(as in Fig. 2) and farm-level refuge structure (as in Fig. 5) intheir effect on R-allele frequency after 8 yr of deployment ofthree levels of Bt corn and three levels of Bt cotton. Eachpoint represents the average of three runs. Values for allparameters are the default values shown in Table 1.
Fig. 13. Distribution of R-allele frequencies using farm-level refuge when region-wide R-allele frequency is 0.25.Region is divided into 25-Þeld farms, each with the sameproportion of each crop type. Crop layout for the year shownis in Fig. 5.
February 2003 STORER ET AL: SPATIAL PROCESSES IN RESISTANCE EVOLUTION 167

More importantly, the local R-allele frequency isnot uniform when the refuge distribution is not uni-form (Fig. 15). The average adjusted coefÞcient ofvariation (equation 2 for the three runs with 67%adoption of Bt crops with a 25% refuge was 0.323, anorder of magnitude higher than for the runs withrandom crop distribution throughout the region. Inthe run illustrated, the farm layout is as shown in Fig.6. The R-allele frequencies are far higher in areaswhere Bt deployment is high than in areas where Btdeployment is low. When the R-allele frequency re-gion-wide is 0.25, in someÞelds it has reached 0.9 (Fig.
15A). Thus, farms that have deployed Bt varieties in75% of both corn and cotton Þelds rapidly create aresistance problem for themselves. Those Bt farmsthat have a large proportion of their neighbors alsodeploying Bt (e.g., lower left quadrant) have higherresistance levels than those Bt farms where a largerproportion of neighbors do not deploy Bt (e.g., lowerright quadrant). Therefore, Bt farms may not gainmuch protection from resistance by one or two neigh-bors who do not deploy Bt.Even farms that have never deployed Bt crops can
end up with populations with elevated R-allele fre-
Fig. 14. Effect of incomplete adoption of Bt crops by all farms on R-allele frequency after 8 yr. A) On-farm refuge setat 50% of both cotton and corn Þelds (i.e., BtCT � 50%, BtCR � 50%); B) on-farm refuge set at 25% of both cotton and cornÞelds (i.e.,BtCT � 0.75,BtCR � 0.75); C) region-wide refuge set at 75%of both cotton and corn Þelds (on farmBt deploymentdiffers among adoption levels); and D) region-wide refuge set at 50% of both cotton and corn Þelds (on-farm Bt deploymentdiffers between adoption levels). Each column represents the average of three runs. Values for all parameters are the defaultvalues shown in Table 1.
Fig. 15. Distribution of R-allele frequencies (q) with incomplete adoption of Bt crops. Region is divided into 25-Þeldfarms, 67% of which adopt Bt technology. Crop layout for the year shown is in Fig. 6. Region-wide R-allele frequency is A)0.25 after 11 yr; B) 0.5 after 13.5 yr.
168 JOURNAL OF ECONOMIC ENTOMOLOGY Vol. 96, no. 1

quencies. When the R-allele frequency region-widehas reached 0.5, the highly resistant populations havespread through nearly the entire region (Fig. 15B). Ifrefuge requirements onBt farms are low, the adoptingfarms create resistance problems for other farms thatare slower in adopting the new technology.These simulation outputs on the spatial distribution
of R-alleles under different Bt deployment regimessuggest that it may be very important to monitor R-allele frequencies at several sites in a region to get acomplete picture of region-wide resistance, and to beable to track the spread of populations with higher-than-average R-allele frequencies. The spatial varia-tion depends on assumptions about insect movementmade in these model runs. When improved empiricaldata on insect movement and spatial patterns of Btdeployment become available, this model can be usedto help guide an effectivemonitoring scheme. Priorityshould be placed on sampling populations from areasof historically high Bt crop deployment. Even withallele frequency data from a small number of sites, theamong-Þeld variation in R-allele frequency predictedby this model can be used to estimate the highest andlowest local R-allele frequencies likely to be found ina region.In conclusion, the aim of insect resistance manage-
ment is to reduce the risk of creating resistant insectpopulations while deploying the insect control mea-sure. Transgenic insecticidal crops present extremelystrong selection pressure for resistance (Gould 1998).The moderately effective dose of toxin in Bt corn andBt cotton againstH. zeadoesnotmeet the assumptionsof conventional resistance management using thehigh-dose plus refuge strategy. This simulation modelhas been used to indicate the likely course of resis-tance evolution under different moderate dose Bt-crop deployment scenarios. Because values for manyof the parameters in themodel are either unknown orinherently variable, the output cannot be interpretedas predictive. The model can be used as a tool forinvestigating the effects of varying some of these pa-rameters on model output, and how the parametersinteract. Details on these tests are published in a com-panion paper (Storer et al. 2003).The biology and life history of H. zea differs among
regions (Raulston et al. 1990, Bradley 1993). Themodel presented here was designed to simulate theevolution of resistance in populations of H. zea tocurrently commercialized varieties of Bt corn and Btcotton in the mixed cropping system of eastern NorthCarolina. Because the biology and life history of theinsects, and their interactions with their hosts, playvery important roles in resistance evolution, the re-sults presented here should not be extended to dif-ferent insect/host systems or the same system in dif-ferent regions. Rather, the validity of the assumptionsshould be reassessed, the model should be adjusted toaccount for differences in the life system and theparameter values should be altered to Þt local condi-tions.The spatial distribution of transgenic and nontrans-
genic plantings can affect both the region-wide evo-
lution of resistance, and, especially when the on-farmrefuge size is small, the resistance levels in local sub-populations. It is clear that farm-level refuge require-ments are important, even for this highlymobile insectpest, if the risk of resistance on farms is to bemanaged.Because resistant populations can rapidly spread tofarms that do not use Bt, all farmers in a region wouldpay for the highBt deployment of others. Understand-ing the spatial aspects of population dynamics andgenetics will be crucial to our ability to manage insectresistance to transgenic crops.As with any model, which is a simpliÞed represen-
tationof the realworld, key assumptions aremade thatmay not accurately reßect reality. Thorough investi-gation of the effects of these assumptions on modeloutputs is required. A companion paper (Storer et al.2003) presents the results of sensitivity analyses onseveral of the model parameters. Future work shouldaddress the implications of some of the assumptionsmade in the model architecture on the spatial dynam-ics of resistance evolution. For example, soybean, analternate host for H. zea, is planted on roughly thesamenumberofhectares as corn andcottoncombinedin easternNorth Carolina. Preliminary workwith soy-bean included in the model showed that in thesecircumstances soybean can greatly reduce the rate atwhich resistance evolves (Storer 1999). However, be-causeÞelddataon theproductionofH.zea adults fromsoybean Þelds are not currently available for easternNorth Carolina, soybean was ignored as a host for theruns presented here. It will be important to conductÞeld research to obtain such data to understand fullypest adaptation to Bt crops. Other features of thepresent model that need critical examination includethe lack of natural features of the landscape that couldinhibit or promote local adultmovement amongÞelds,and the lack of insect inter-regional migration.
Appendix
Appendix A—Cannibalism Mortality on Ear StageCorn
A separate model was created to simulate larvalcannibalism in corn ears. This was a stochastic indi-vidual-basedmodel, with neonates assigned randomlyto ears within a Þeld. Larvae develop through six sizeclasses on non-Bt corn ears. On Bt corn ears, suscep-tible larvae develop through four size classes to reßecttheir reduced pupal weight (Storer et al. 2001), resis-tant larvae develop through six size classes, and het-erozygotes develop through Þve. Development isprobabilistic, such that the age-dependent probabilityof reaching the next size class follows a cumulativenormal curve. Development rate is slower for suscep-tible and heterozygote larvae on Bt than for resistantlarvae on Bt or any larvae on non-Bt. In the model,larvae can only cannibalize other larvae of equal orsmaller size, and thecannibalismprobabilities are size-pair-speciÞc, according to data in Caron (1976). Thecannibalism probabilities observed by Caron (1976)are sufÞciently high that rarely does more than one
February 2003 STORER ET AL: SPATIAL PROCESSES IN RESISTANCE EVOLUTION 169
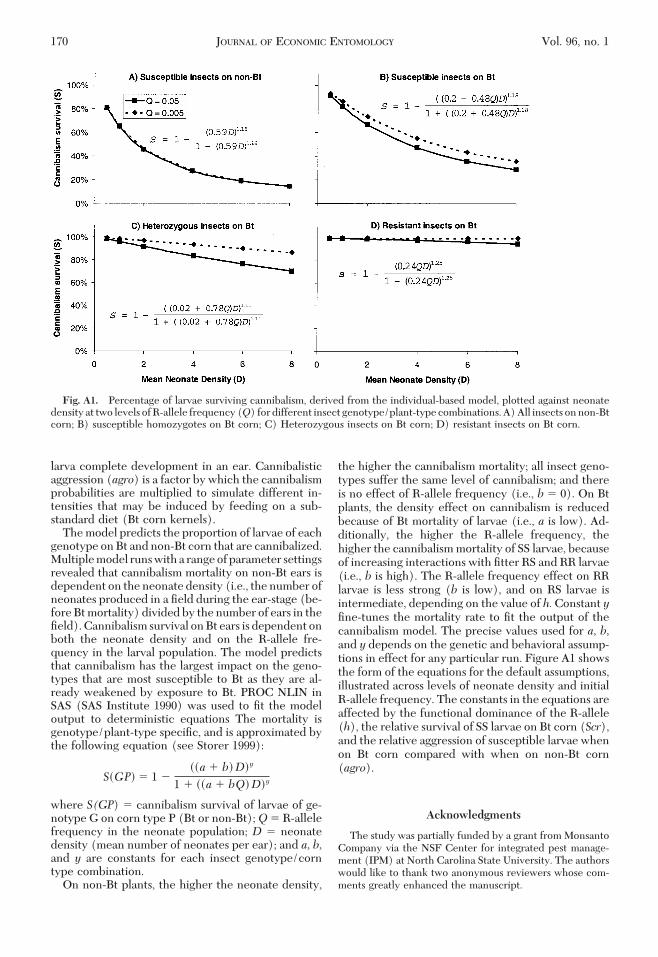
larva complete development in an ear. Cannibalisticaggression (agro) is a factor by which the cannibalismprobabilities are multiplied to simulate different in-tensities that may be induced by feeding on a sub-standard diet (Bt corn kernels).Themodel predicts the proportion of larvae of each
genotype onBt andnon-Bt corn that are cannibalized.Multiplemodel runswitha rangeofparameter settingsrevealed that cannibalism mortality on non-Bt ears isdependent on the neonate density (i.e., the number ofneonates produced in a Þeld during the ear-stage (be-foreBtmortality) dividedby thenumber of ears in theÞeld).Cannibalism survival onBt ears is dependent onboth the neonate density and on the R-allele fre-quency in the larval population. The model predictsthat cannibalism has the largest impact on the geno-types that are most susceptible to Bt as they are al-ready weakened by exposure to Bt. PROC NLIN inSAS (SAS Institute 1990) was used to Þt the modeloutput to deterministic equations The mortality isgenotype/plant-type speciÞc, and is approximated bythe following equation (see Storer 1999):
S�GP� � 1 ���a � b� D�y
1 � ��a � bQ� D�y
where S(GP) � cannibalism survival of larvae of ge-notype G on corn type P (Bt or non-Bt);Q � R-allelefrequency in the neonate population; D � neonatedensity (mean number of neonates per ear); and a, b,and y are constants for each insect genotype/corntype combination.On non-Bt plants, the higher the neonate density,
the higher the cannibalism mortality; all insect geno-types suffer the same level of cannibalism; and thereis no effect of R-allele frequency (i.e., b � 0). On Btplants, the density effect on cannibalism is reducedbecause of Bt mortality of larvae (i.e., a is low). Ad-ditionally, the higher the R-allele frequency, thehigher the cannibalismmortality of SS larvae, becauseof increasing interactions with Þtter RS and RR larvae(i.e., b is high). The R-allele frequency effect on RRlarvae is less strong (b is low), and on RS larvae isintermediate, depending on the value of h.Constant yÞne-tunes the mortality rate to Þt the output of thecannibalism model. The precise values used for a, b,and y depends on the genetic and behavioral assump-tions in effect for any particular run. Figure A1 showsthe form of the equations for the default assumptions,illustrated across levels of neonate density and initialR-allele frequency. The constants in the equations areaffected by the functional dominance of the R-allele(h), the relative survival of SS larvae on Bt corn (Scr),and the relative aggression of susceptible larvae whenon Bt corn compared with when on non-Bt corn(agro).
Acknowledgments
The study was partially funded by a grant fromMonsantoCompany via the NSF Center for integrated pest manage-ment (IPM) at North Carolina State University. The authorswould like to thank two anonymous reviewers whose com-ments greatly enhanced the manuscript.
Fig. A1. Percentage of larvae surviving cannibalism, derived from the individual-based model, plotted against neonatedensity at two levels ofR-allele frequency(Q) fordifferent insect genotype/plant-typecombinations.A)All insects onnon-Btcorn; B) susceptible homozygotes on Bt corn; C) Heterozygous insects on Bt corn; D) resistant insects on Bt corn.
170 JOURNAL OF ECONOMIC ENTOMOLOGY Vol. 96, no. 1

References Cited
Alstad, D. N., and D. A. Andow. 1995. Managing the evolu-tion of insect resistance to transgenic plants. Science 268:1894Ð1896.
Armstrong, C. L., G. B. Parker, J. C. Pershing, S. M. Brown,P. R. Sanders, D. R. Duncan, T. Stone, D. A. Dean, D. L.DeBoer, J. Hart, A. R. Howe, F. M. Morrish, M. E. Pajeau,W. L. Petersen, B. J. Reich, R. Rodriguez, C. G. Santino,S. J. Sato, W. Schuler, S. R. Sims, S. Stehling, L. J. Taro-chione, and M. E. Fromm. 1995. Field evaluation of Eu-ropean corn borer control in progeny of 173 transgeniccorn evens expressing an insecticidal protein from Bacil-lus thuringiensis. Crop. Sci. 35: 550Ð557.
Bacheler, J. S. 1996a. Insect management on cotton. pp.137Ð157 in North Carolina Cooperative Extension Ser-vice. 1996 Cotton Information. NCCES, Raleigh, NC.
Bacheler, J. S. 1996b. Cotton Insect Scouting Guide.NCCES, Raleigh, NC. 24 pp.
Benedict, J. H., E. S. Sachs, D. W. Altman, W. R. Benton, R. J.Kohel, D. R. Ring, and S. A. Berbrerich. 1996. Fieldperformance of cottons expressing transgenic CryIA in-secticidal proteins for resistance toHeliothis virescens andHelicoverpa zea (Lepidoptera: Noctuidae). J. Econ. En-tomol. 89: 230Ð238.
Bradley, J. R. Jr. 1993. Inßuence of habitat on the pest statusand management of Heliothis species on cotton in thesouthernUnited States, pp. 375Ð91. InK. C. Kim and B. A.McPheron [eds.], Evolution of Insect Pests: Patterns ofVariation. Wiley, New York.
Brickle, D. S., S. G. Turnipseed, and M. J. Sulivan. 2001.EfÞcacy of Insecticides of Different Chemistries AgainstHelicoverpa zea (Lepidoptera:Noctuidae) inTransgenicBacillus thuringiensis and Conventional Cotton. J. Econ.Entomol. 94: 86Ð92.
Burd, A. D., J. R. Bradley, Jr., J. W. van Duyn, and F. Gould.2000. Resistance of bollworm, Helicoverpa zea, toCryIA(c) toxin. Proc. Cotton Res. Conf. Natl. CottonCouncil Amer. Memphis TN, pp. 923Ð926.
Burd, A. D., J. R. Bradley, Jr., J. W. van Duyn, F. Gould, andW. Moar. 2001. Estimated frequency of non-recessiveB. t. resistance genes in bollworm, Helicoverpa zea. Proc.Cotton Res. Conf. Natl. Cotton Council Am. MemphisTN, pp. 820Ð822.
Caprio, M. A., and B. E. Tabashnik. 1992. Gene ßow accel-erates local adaptation among Þnite populations: simu-lating the evolution of insecticide resistance. J. Econ.Entomol. 85: 611Ð620.
Caron, R. E. 1976. Production of Heliothis zea (Boddie) oncorn in North Carolina with notes on factors affectingsurvival. M. S. Thesis, North Carolina State University,Raleigh, NC. 98 pp.
Caron, R. E., J. R. Bradley, R. H. Pleasants, R. L. Rabb, andR. E. Stinner. 1978. Overwinter survival of Heliothis zeaproduced on late-planted Þeld corn in North Carolina.Environ. Entomol. 7: 193Ð196.
Chaufaux, J., J. Muller-Cohn, C. Buisson, V. Sanchis, D.Lereclus, andN. Pasteur. 1997. Inheritance of resistanceto the Bacillus thuringiensis CryIC toxin in Spodopteralittoralis (Lepidoptera: Noctuidae). J. Econ. Entomol. 90:873Ð878.
Dobzhansky, T. G., F. J. Ayala, G. L. Stebbins, and J. W.Valentine. 1977. Evolution.Freeman, SanFrancisco. 572pp.
[EPA] Environmental Protection Agency. 1997. Plant pes-ticides resistance management. Federal Register. 62:8242Ð8244.
[EPA] Environmental Protection Agency. 1998. White pa-per on Bt plant-pesticide resistance management, 84 pp.
Biopesticides and Pollution Prevention Division, OfÞceof Pesticide Programs, U.S. Environmental ProtectionAgency, Washington DC.
Farrar, R. R. Jr., and J. R. Bradley, Jr. 1985. Within-plantdistribution of Heliothis spp. (Lepidoptera: Noctuidae)eggs and larvae on cotton in North Carolina. Environ.Entomol. 14: 205Ð209.
Georghiou, G. P., and C. E. Taylor. 1977a. Genetic and bi-ological inßuences in the evolution of insecticide resis-tance. J. Econ. Entomol. 70: 319Ð323.
Georghiou, G. P., and C. E. Taylor. 1977b. Operational in-ßuences in theevolutionof insecticide resistance. J.Econ.Entomol. 70: 653Ð658.
Gould, F. 1994. Potential problems with high-dose strate-gies for pesticidal engineeredcrops. Biocontrol Sci. Tech-nol. 4: 451Ð461.
Gould, F. 1998. Sustainability of transgenic insecticidal cul-tivars: integrating pest genetics and ecology. Annu. Rev.Entomol. 43: 701Ð726.
Gould, F., A. Anderson, A. Reynold, L. Bumgarner, and W.Moar. 1995. Selection and genetic analysis of aHeliothisvirescens (Lepidoptera: Noctuidae) strain with high lev-els of resistance to Bacillus thuringiensis toxins. J. Econ.Entomol. 88: 1545Ð1559.
Gould, F., A. Martinez-Ramirez, A. Anderson, J. Ferre, F. J.Silva, and W. J. Moar. 1992. Broad-spectrum resistanceto Bacillus thuringiensis toxins inHeliothis virescens. Proc.Natl. Acad. Sci. USA. 89: 7986Ð7990.
Gross,H. R., Jr., B. R.Wiseman, andW.W.McMillian. 1976.Comparative suitability of whorl stages of sweet corn forestablishment by larvae of the corn earworm. Environ.Entomol. 5: 955Ð958.
Gross, H. R., and J. R. Young. 1977. Comparative develop-ment and fecundity of corn earworm reared on selectedwild and cultivated early-season hosts common to thesoutheastern U.S. Ann. Entomol. Soc. Am. 70: 63Ð65.
Halcomb, J. L., J.H. Benedict, B.Cook, andD.R.Ring. 1996.Survival and growth of bollworm and tobacco budwormon nontransgenic and transgenic cotton expressing aCryIA insecticidal protein (Lepidoptera: Noctuidae).Environ. Entomol. 24: 250Ð255.
Huang, F. N., L. L. Buschman, R. A. Higgins, and W. H.McGaughey. 1999. Inheritance of resistance to Bacillusthuringiensis toxin (Dipel ES) in the European cornborer. Science 284: 965Ð967.
Johnson, M. W., R. E. Stinner, and R. L. Rabb. 1975. Ovi-positional response of Heliothis zea to its major hosts inNorth Carolina. Environ. Entomol. 4: 291Ð297.
Knipling, E. F., and E. A. Stadelbacher. 1983. The rationalefor areawide management of Heliothis (Lepidoptera:Noctuidae) populations. Bull. Entomol. So. Am. Winter.1983: 29Ð37.
Lambert, A. L., J. R. Bradley, Jr., and J. W. Van Duyn. 1996.Effects of natural enemy conservation and planting dateon the susceptibility of Bt cotton to Helicoverpa zea inNorth Carolina. Proc. Beltwide Cotton Res. Conf., Natl.Cotton Council Am., Memphis TN, vol. 2, pp. 931Ð935.
Luttrell, R. G., L. Wan, and K. Knighten. 1999. Variation insusceptibility of noctuid (Lepidoptera) larvae attackingcotton and soybean to puriÞed endotoxin proteins andcommercial formulationsofBacillus thuringiensis. J.Econ.Entomol. 92: 21Ð32.
Lynch, R. E., B. R. Wiseman, D. Plaisted, and D. Warnick.1999. Evaluation of transgenic sweet corn hybrids ex-pressing CryIA(b) toxin for resistance to corn earwormand fall armyworm (Lepidoptera: Noctuidae). J. Econ.Entomol. 92: 246Ð252.
February 2003 STORER ET AL: SPATIAL PROCESSES IN RESISTANCE EVOLUTION 171

Mahaffey, J. S., J. R. Bradley, Jr., and J. W. Van Duyn. 1995.Bt cotton: Þeld performance in North Carolina underconditions of unusually high bollworm populations. Proc.1995 Beltwide Cotton Res. Conf., Natl. Cotton CouncilAm., Memphis TN, vol. 2, pp. 795Ð798.
Mallet, J., and P. Porter. 1992. Preventing insect adaptationto insect resistant crops: are seed mixtures or refugia thebest strategy. Proc. R. Soc. London Ser. B. 250: 165Ð169.
Neunzig, H. H. 1963. Wild host plants of the corn earwormand the tobacco budworm in eastern North Carolina. J.Econ. Entomol. 56: 135Ð39.
Neunzig, H. H. 1969. The biology of the tobacco budwormand the corn earworm in North Carolina with particularreference to tobacco as a host. North Carolina Agricul-tural Experiment Station Technical Bulletin, No. 196.63pp.
[NCDACS] North Carolina Department of Agriculture andConsumer Services. 2001. Annual Summary: Crop Esti-mates, North Carolina, 1998Ð2000. Agricultural StatisticsDivision, Field Crops. http://www.ncagr.com/stats/crop_ßd/ßdannyr.htm.
Onstad, D. W., and F. Gould. 1998. Modeling the dynamicsof adaptation to transgenicmaizebyEuropeancornborer(Lepidoptera: Pyralidae). J. Econ. Entomol. 91: 585Ð593.
Peck, S. L., F. Gould, and S. P. Ellner. 1999. Spread ofresistance in spatially-extended regions of transgenic cot-ton: implications for management of Heliothis virescens(Lepidoptera: Noctuidae). J. Econ. Entomol. 92: 1Ð16.
Perez, C. J., and A. M. Shelton. 1997. Resistance of Plutellaxylostella (Lepidoptera: Plutellidae) to Bacliilus thurin-giensis Berliner in Central America. J. Econ. Entomol. 90:87Ð93.
Pilcher,C.D.,M.E.Rice, J. J.Obrycki, andL.C.Lewis. 1997.Field and laboratory evaluations of transgenic Bacillusthuringiensis corn on secondary lepidopteran pests (Lep-idoptera: Noctuidae). J. Econ. Entomol. 90: 669Ð678.
Rabb, R. L., J. R. Bradley, Jr., R. E. Stinner, R. H. Pleasants,and L. Pearce. 1975. Diapause in North Carolina strainsof Heliothis zea and Heliothis virescens. J. Ga. Entomol.Soc. 10: 191Ð198.
Raulston, J. R., K. R. Summy, J. Loera, S. D. Pair, and A. N.Sparks. 1990. Population dynamics of corn earworm lar-vae (Lepidoptera: Noctuidae) on corn in the lower RioGrande valley. Environ. Entomol. 19: 274Ð280.
Roush, R. T. 1989. Designing resistance management pro-grams: how can you choose? Pestic. Sci. 26: 423Ð441.
Roush, R. T. 1994. Managing pests and their resistance toBacillus thuringiensis: can transgenic crops be better thansprays? Biocontrol Sci. Tech. 4: 501Ð516.
SAS Institute. 1990. SAS/STAT UserÕs Guide, Version 6.0.4th Edition. vol. 1 and 2. SAS Institute, Cary, NC.
Sims, S. R., J. C. Pershing, and B. J. Reich. 1996. Field eval-uation of transgenic corn containing a Bacillus thurin-giensis Berliner insecticidal protein gene against Helico-verpa zea (Lepidoptera: Noctuidae). J. Entomol. Sci. 31:340Ð346.
Stinner, R. E., R. L. Rabb, and J. R. Bradley, Jr. 1974. Pop-ulation dynamics of Heliothis zea (Boddie) and H. vire-scens (F.) inNorthCarolina: a simulationmodel. Environ.Entomol. 2: 163Ð168.
Stinner, R. E., J. W. Jones, C. Tuttle, and R. E. Caron. 1977a.Populationmortality andcyclicity as affectedby intraspe-ciÞc competition. Can. Entomol. 109: 879Ð890.
Stinner, R. E., R. L. Rabb, and J. R. Bradley, Jr. 1977b.Natural factors operating in the population dynamics ofHeliothis zea in North Carolina. pp. 622Ð42 in Proc. XVIntl. Congr. Entomol., 1976, Wash. D.C.
Storer, N. P. 1999. The corn earworm, Bt transgenic cornand Bt-resistance evolution in a mixed cropping system,319 pp. Ph.D. Dissertation, North Carolina State Univer-sity, Raleigh, NC.
Storer,N. P., J.W.VanDuyn, andG.G.Kennedy. 2001. LifeHistory Traits of Helicoverpa zea (Boddie) (Lepidop-tera: Noctuidae) on non-Bt and Bt transgenic corn hy-brids in eastern North Carolina. J. Econ. Entomol. 94:1268Ð1279.
Storer, N. P., F. Gould, J. W. Van Duyn, and G. G. Kennedy.2003. Sensitivity analysis of a spatially-explicit stochasticsimulation model of the evolution of resistance in Heli-coverpa zea (Leipdoptera: Noctuidae) to Bt transgeniccorn and cotton. J. Econ. Entomol. 96: 173Ð187.
Tabashnik, B. E. 1986. Computer simulations as a tool forpesticide resistance management, pp. 194Ð206. In Pesti-cide Resistance: Strategies and Tactics for Management.National Acad. Press, Washington D.C.
Tabashnik, B. E. 1994. Evolution or resistance to Bacillusthuringiensis. Annu. Rev. Entomol. 39: 47Ð79.
Tabashnik, B. E., Y. B. Liu, N. Finson, L. Masson, and D. G.Heckel. 1994. One gene in diamondback moth confersresistance to four Bacillus thuringiensis toxins. Proc. Natl.Acad. Sci. U.S.A. 94: 1640Ð1644.
Tabashnik, B. E., A. L. Patin, T. J. Dennehy, Y. B. Liu, Y.Carriere, M. A. Sims, and L. Antilla. 2000. Frequency ofresistance to Bacillus thuringiensis in Þeld populations ofpink bollworm. Proc. Natl. Acad. Sci. U.S.A. 97: 12980Ð12984.
Taylor, C. E., and G. P. Georghiou. 1979. Suppression ofinsecticide resistance by alteration of gene dominanceand migration. J. Econ. Entomol. 72: 105Ð109.
Wearing, C. H., and H.M.T. Hokkanen. 1995. Pest resis-tance toBacillus thuringiensis: ecological crop assessmentfor Bt gene incorporation and strategies of management,pp. 236Ð252. In H.M.T. Hokkanen, and Lynch [eds.],Biological Control: BeneÞts and Risks. Cambridge Uni-versity Press, Cambridge, UK.
Wright, S. 1978. Evolution and theGenetics of Populations,vol. 4. University of Chicago Press, Chicago.
Received for publication 25 May 2001; accepted 19 August2002.
172 JOURNAL OF ECONOMIC ENTOMOLOGY Vol. 96, no. 1