Spatial hot-wire visualization of the Λ-structure transformation into the turbulent spot on the...
8
REGULAR PAPER Valery G. Chernoray • Genrich R. Grek • Victor V. Kozlov • Yuriy A. Litvinenko Spatial hot-wire visualization of the K-structure transformation into the turbulent spot on the smooth flat plate surface and riblet effect on this process Received: 30 March 2009 / Revised: 26 May 2009 / Accepted: 28 September 2009 / Published online: 12 December 2009 Ó The Visualization Society of Japan 2009 Abstract Evolution of the K-vortex and its transformation into the turbulent spot in a flat plate boundary layer are investigated experimentally. Extensive measurements visualizing the K-structure transformation into the turbulent spot on the smooth and ribbed surfaces of the flat plate are presented. The flow behavior in the course of spatial evolution of the K-structure and turbulent spot is discussed. Specific features of the downstream evolution of K-structure and turbulent spot on the smooth and ribbed surfaces are demonstrated, such as suppression by riblets of the K-vortex transformation into the turbulent spot, appearance of the coherent structures of K-vortex within ensemble-averaged turbulent spot, and oblique waves generation both by the K-vortex and turbulent spot. Keywords Visualization Hot-wire anemometry K-structure Turbulent spot Riblets 1 Introduction In many cases, the transition process in the Blasius boundary layer and Poiseuille channel flow passes through the formation of so-called turbulent spots. The turbulent spot is easy to generate and visualize, e.g., in water table, by dropping on the water surface or using other methods (e.g., see Fig. 1). This means that a strong-enough initial disturbance in near-wall shear flow can produce the turbulent spot without the stage of instability wave amplification even in the subcritical region. Boundary layer transition at high free stream turbulence is certainly connected to occurrence of the turbulent spots. The example of the turbulent spot smoke visualization in the flat plate boundary layer at high free stream turbulence is shown in Fig. 2. On the other hand, the turbulent spots can arise in downstream evolution of the K-structures. The smoke visualization of the solitary K-structure transformation into the turbulent spot in a flat plate boundary layer is shown in Fig. 3. Naturally, flow visualization by such method gives mainly qualitative information about disturbance evolution. The detailed quantitative information can be received, using the modern methods of experimental studies, e.g., such as a PIV method or a space–time hot-wire flow visualization method. All these methods allow receiving the qualitative information usually obtained by conventional manners of the flow visualization, and especially important the quantitative data about disturbance development. The method of space–time hot-wire visualization of the K-structure transformation into the turbulent spot in a flat plate boundary layer and influence on this process of the riblet have been used in the present experi- mental study. V. G. Chernoray Applied Mechanics, Chalmers University of Technology, 412 96 Gothenburg, Sweden G. R. Grek V. V. Kozlov (&) Y. A. Litvinenko Institute of Theoretical and Applied Mechanics, SB RAS, 630090 Novosibirsk, Russia E-mail: [email protected] J Vis (2010) 13:151–158 DOI 10.1007/s12650-009-0004-7
Transcript of Spatial hot-wire visualization of the Λ-structure transformation into the turbulent spot on the...

REGULAR PAPER
Valery G. Chernoray • Genrich R. Grek •
Victor V. Kozlov • Yuriy A. Litvinenko
Spatial hot-wire visualization of the K-structuretransformation into the turbulent spot on the smoothflat plate surface and riblet effect on this process
Received: 30 March 2009 / Revised: 26 May 2009 / Accepted: 28 September 2009 / Published online: 12 December 2009� The Visualization Society of Japan 2009
Abstract Evolution of the K-vortex and its transformation into the turbulent spot in a flat plate boundarylayer are investigated experimentally. Extensive measurements visualizing the K-structure transformationinto the turbulent spot on the smooth and ribbed surfaces of the flat plate are presented. The flow behavior inthe course of spatial evolution of the K-structure and turbulent spot is discussed. Specific features of thedownstream evolution of K-structure and turbulent spot on the smooth and ribbed surfaces are demonstrated,such as suppression by riblets of the K-vortex transformation into the turbulent spot, appearance of thecoherent structures of K-vortex within ensemble-averaged turbulent spot, and oblique waves generation bothby the K-vortex and turbulent spot.
Keywords Visualization � Hot-wire anemometry � K-structure � Turbulent spot � Riblets
1 Introduction
In many cases, the transition process in the Blasius boundary layer and Poiseuille channel flow passesthrough the formation of so-called turbulent spots. The turbulent spot is easy to generate and visualize, e.g.,in water table, by dropping on the water surface or using other methods (e.g., see Fig. 1). This means that astrong-enough initial disturbance in near-wall shear flow can produce the turbulent spot without the stage ofinstability wave amplification even in the subcritical region. Boundary layer transition at high free streamturbulence is certainly connected to occurrence of the turbulent spots. The example of the turbulent spotsmoke visualization in the flat plate boundary layer at high free stream turbulence is shown in Fig. 2.
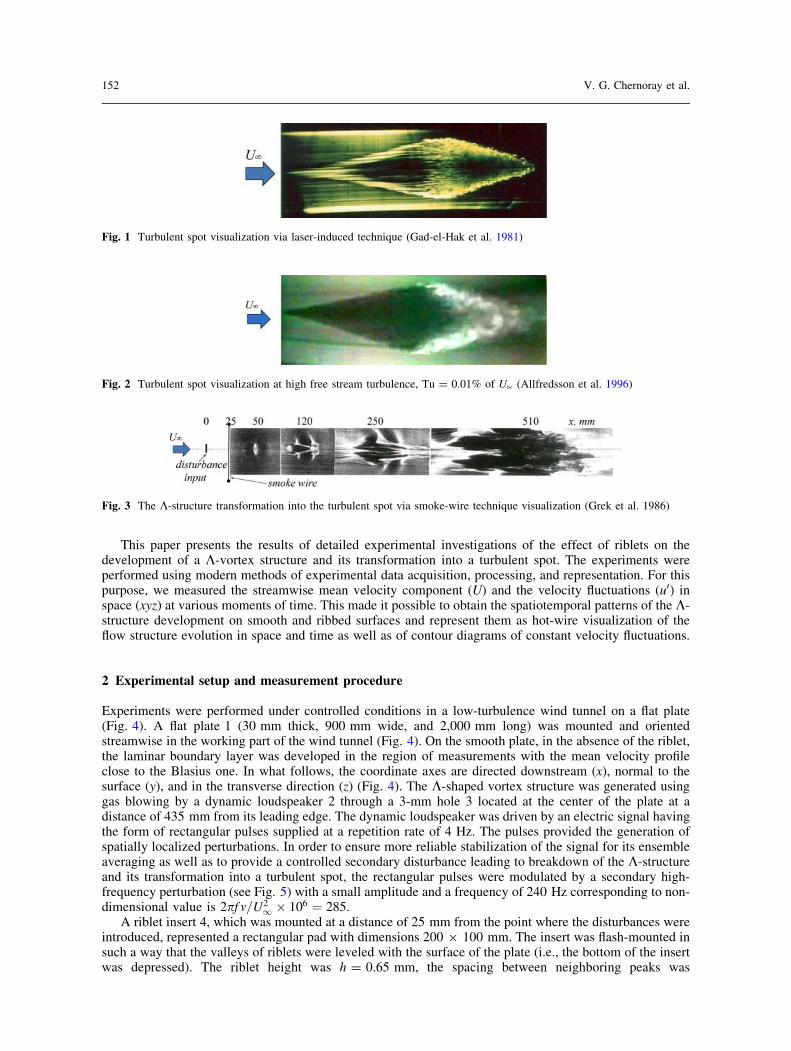
On the other hand, the turbulent spots can arise in downstream evolution of the K-structures. The smokevisualization of the solitary K-structure transformation into the turbulent spot in a flat plate boundary layer isshown in Fig. 3. Naturally, flow visualization by such method gives mainly qualitative information aboutdisturbance evolution. The detailed quantitative information can be received, using the modern methods ofexperimental studies, e.g., such as a PIV method or a space–time hot-wire flow visualization method. Allthese methods allow receiving the qualitative information usually obtained by conventional manners of theflow visualization, and especially important the quantitative data about disturbance development. Themethod of space–time hot-wire visualization of the K-structure transformation into the turbulent spot in aflat plate boundary layer and influence on this process of the riblet have been used in the present experi-mental study.
V. G. ChernorayApplied Mechanics, Chalmers University of Technology, 412 96 Gothenburg, Sweden
G. R. Grek � V. V. Kozlov (&) � Y. A. LitvinenkoInstitute of Theoretical and Applied Mechanics, SB RAS, 630090 Novosibirsk, RussiaE-mail: [email protected]
J Vis (2010) 13:151–158DOI 10.1007/s12650-009-0004-7
This paper presents the results of detailed experimental investigations of the effect of riblets on thedevelopment of a K-vortex structure and its transformation into a turbulent spot. The experiments wereperformed using modern methods of experimental data acquisition, processing, and representation. For thispurpose, we measured the streamwise mean velocity component (U) and the velocity fluctuations (u0) inspace (xyz) at various moments of time. This made it possible to obtain the spatiotemporal patterns of the K-structure development on smooth and ribbed surfaces and represent them as hot-wire visualization of theflow structure evolution in space and time as well as of contour diagrams of constant velocity fluctuations.
2 Experimental setup and measurement procedure
Experiments were performed under controlled conditions in a low-turbulence wind tunnel on a flat plate(Fig. 4). A flat plate 1 (30 mm thick, 900 mm wide, and 2,000 mm long) was mounted and orientedstreamwise in the working part of the wind tunnel (Fig. 4). On the smooth plate, in the absence of the riblet,the laminar boundary layer was developed in the region of measurements with the mean velocity profileclose to the Blasius one. In what follows, the coordinate axes are directed downstream (x), normal to thesurface (y), and in the transverse direction (z) (Fig. 4). The K-shaped vortex structure was generated usinggas blowing by a dynamic loudspeaker 2 through a 3-mm hole 3 located at the center of the plate at adistance of 435 mm from its leading edge. The dynamic loudspeaker was driven by an electric signal havingthe form of rectangular pulses supplied at a repetition rate of 4 Hz. The pulses provided the generation ofspatially localized perturbations. In order to ensure more reliable stabilization of the signal for its ensembleaveraging as well as to provide a controlled secondary disturbance leading to breakdown of the K-structureand its transformation into a turbulent spot, the rectangular pulses were modulated by a secondary high-frequency perturbation (see Fig. 5) with a small amplitude and a frequency of 240 Hz corresponding to non-dimensional value is 2pf m=U2
1 � 106 ¼ 285.A riblet insert 4, which was mounted at a distance of 25 mm from the point where the disturbances were
introduced, represented a rectangular pad with dimensions 200 9 100 mm. The insert was flash-mounted insuch a way that the valleys of riblets were leveled with the surface of the plate (i.e., the bottom of the insertwas depressed). The riblet height was h = 0.65 mm, the spacing between neighboring peaks was
Fig. 2 Turbulent spot visualization at high free stream turbulence, Tu = 0.01% of U� (Allfredsson et al. 1996)
Fig. 3 The K-structure transformation into the turbulent spot via smoke-wire technique visualization (Grek et al. 1986)
Fig. 1 Turbulent spot visualization via laser-induced technique (Gad-el-Hak et al. 1981)
152 V. G. Chernoray et al.

s = 1.3 mm, and the rib top width was 0.1 mm (see the insert in Fig. 4). The dimensionless parameter of theriblets is defined as s? = su*/m, where u� ¼ ðmjo~uoyjy¼0Þ
1=2is the velocity of the laminar flow, jo~uoyjy¼0 ¼
0:332 ~U/d is the gradient of the mean velocity at the wall, and d * (mx/U�)1/2. In the range of Reynoldsnumbers under investigation, Rex = (2.82 – 3.77) 9 105, the dimensionless parameter s? normalized to theinternal variables (mu*) was within 19 C s? C 18. This value is rather close to the analogous parameter(26 C s? C 21) determined in Grek et al. (1996) and approaches the optimal parameter of riblets for theturbulent boundary layer (s? = 15) reported in Walsh (1980). The flow velocity was U� = 8.9 m/s and theturbulence level did not exceed 0.04% of U�. The hot-wire anemometer measured the streamwise velocitycomponent u. The hot-wire probe was equipped with a gold-plated tungsten wire of 1.2 mm active lengthand 5 lm in diameter. The maximum error in the probe calibration was within 1% for all calibration points.All measurements were performed in an automated mode with use of a traversing system moving the probein a 3D space by a specially developed software involving LabVIEW. Approximately 104 spatial pointswere mapped in each case.
Data reduction and visualization are performed using the Mat Lab software package. The measuredvoltage traces were converted into the velocity traces and then phase averaged over 100 disturbance periodsto form a matrix uave(x, y, z, t). This velocity is decomposed into a mean U and fluctuation u0 componentssuch that uave = U ? u0. Subtraction of the base undisturbed flow UB gives the total disturbance velocityutot = uave - UB.
2000 mm200 mm
100 mm
460 mm435 mm
900 mm
U ∞ = 8.9 m/s
30 mm
1
4
3
2
0.1 mm
1.3 mm0.65 mm
riblet crossection
•
•
•
•
•
•
•
•
•
•
•
•
y
z
x
+-
Fig. 4 Experimental setup (see the text for explanations)
Fig. 5 The low-frequency pulses modulated by a high-frequency signal
Spatial hot-wire visualization of the K-structure 153

3 Results of measurements
Let us consider the results of our investigation in detail. The study of the flow structure in the boundary layeron the smooth and ribbed surfaces of the flat plate showed that the flow is laminar and the velocity profile isclose to that in the Blasius boundary layer. The pattern of generated perturbations mapped by the isolines ofvelocity fluctuations at the point of the beginning of measurements (x = 40 mm) on both smooth and ribbedsurfaces of the plane plate at z = 0 demonstrates that, in both cases, the flow structure remains virtuallyunchanged (see Fig. 6). In other words, at the initial stage of development of perturbations, the riblets didnot produce any noticeable effect on the flow structure.
Figure 7 demonstrates the contour diagrams of constant velocity fluctuations of the ensemble-averagedK-structure transforming into the turbulent spot downstream on the smooth flat plate surface at y = 1.5 mm,U� = 8.9 m/s. The maps of isolines of velocity fluctuations obtained during the development of the K-structure moving downstream on the smooth surface demonstrate that the structure of perturbations rep-resents closed regions of decreased and increased velocities, which are located strictly symmetrically aboutits plane of symmetry. Streamwise and spanwise extension of the disturbance grows downstream. Inaddition, one can note the presence of oblique waves generated both by the K-structure and by the turbulentspot. On the diagrams, this is reflected by the appearance of regions of defect and excess velocity on eachside at the periphery of the basic structures.
Figure 8 demonstrates isosurfaces of the u0 velocity fluctuations (±0.025U�) in space (xyz) for theensemble-averaged K-structure and the turbulent spot on the smooth flat plate surface. It is clearly seen thatthe K-structure generated in the beginning (at x & 100 mm) transforms downstream into a complex patternconsisting of a number of coherent structures at x & 200 mm. These coherent structures are very similar toK-structures. The similar conclusion that the turbulent spot contains numerous hairpin eddies arranged in anarrowhead formation has been made by Wygnanski et al. (1982).
The contour diagrams of constant velocity fluctuations of the disturbance’s downstream evolution on thesmooth and ribbed flat plate surfaces at two downstream positions are shown in Fig. 9. It is clearly seen thaton the smooth surface the disturbance evolves into a turbulent spot, while on the ribbed surface it isobviously damped.
Fig. 6 Contour diagrams of constant velocity fluctuations of the disturbance evolution on the smooth and ribbed flat platesurfaces at x = 40 mm and y = 1.5 mm, U� = 8.9 m/s (the black and red isolines correspond to excess and defect velocities,respectively)
154 V. G. Chernoray et al.

Fig. 7 Contour diagrams of constant velocity fluctuations of the ensemble-averaged K-structure convertible into the turbulentspot downstream on the smooth flat plate surface at y = 1.5 mm, U� = 8.9 m/s
Fig. 8 Spatial patterns of the hot-wire visualization of the ensemble-averaged K-structure and turbulent spot on the smooth flatplate surface; the amplitude levels of the u0 isosurfaces are ±0.025U�; U� = 8.9 m/s (the dark blue and blue colors correspondto excess and defect velocities, respectively)
Spatial hot-wire visualization of the K-structure 155

Now, we shall consider dynamics of the localized perturbation development on the smooth and ribbedsurfaces, as reflected by the isosurfaces of the u0 velocity fluctuations (±0.025U�) in space (xyz). Figure 10shows the results of measurements at various positions downstream. A detailed analysis of the pattern ofevolution of the localized perturbation downstream at various coordinates x on the smooth and ribbedsurfaces shows that if the structure of a disturbance at x = 40 mm remains without changes in both cases(see Fig. 6) then further downstream the pattern of the disturbance evolution on the smooth and ribbedsurfaces sharply varies. As evident from Fig. 10, on moving downstream, the K-structure on the smoothsurface transforms into a complex pattern characterized by a large number of regions of defect and excessvelocity and by a progressive increase in the streamwise and spanwise perturbation scales. Eventually, theK-structure gradually transforms into a single turbulent spot observed at x = 175 mm. It is also necessary tonote a longitudinal stretching of the K-structure (x = 75 mm) that is typical of the K-vortex transformationinto a so-called hairpin vortex in a downstream shear flow. In contrast to this pattern, the structure of the K-vortex moving downstream on the riblet surface exhibits rather small variations. The spanwise andstreamwise scales change insignificantly, and finally (see Fig. 10 for riblet surface, x = 175 mm), it is seenthat the K-structure is virtually unable to transform into a turbulent spot in this situation.
Figure 11 shows the dependences of the intensity of perturbations developed on the smooth and ribbedsurfaces on the longitudinal coordinate x. For the same initial value (0.19U� at x = 40 mm), the amplitudeof perturbations on the smooth surface sharply increases (to 0.47U� at x = 200 mm) and a turbulent
100 200
z, mm
0
� 10
10
x, mm150
200
z, mm
0
� 10
10
x, mm250150
smooth surface
smooth surface
ribbed surface
ribbed surface
Apeak-peak
Apeak-peak
Apeak-peak
Apeak-peak
ª 20 % of U•
ª 48 % of U•
ª 28 % of U•
ª 35 % of U•
Fig. 9 Contour diagrams of constant velocity fluctuations of the disturbance downstream evolution on the smooth and ribbedflat plate surfaces at y = 1.5 mm, U� = 8.9 m/s (the black and red isolines correspond to excess and defect velocities,respectively)
156 V. G. Chernoray et al.
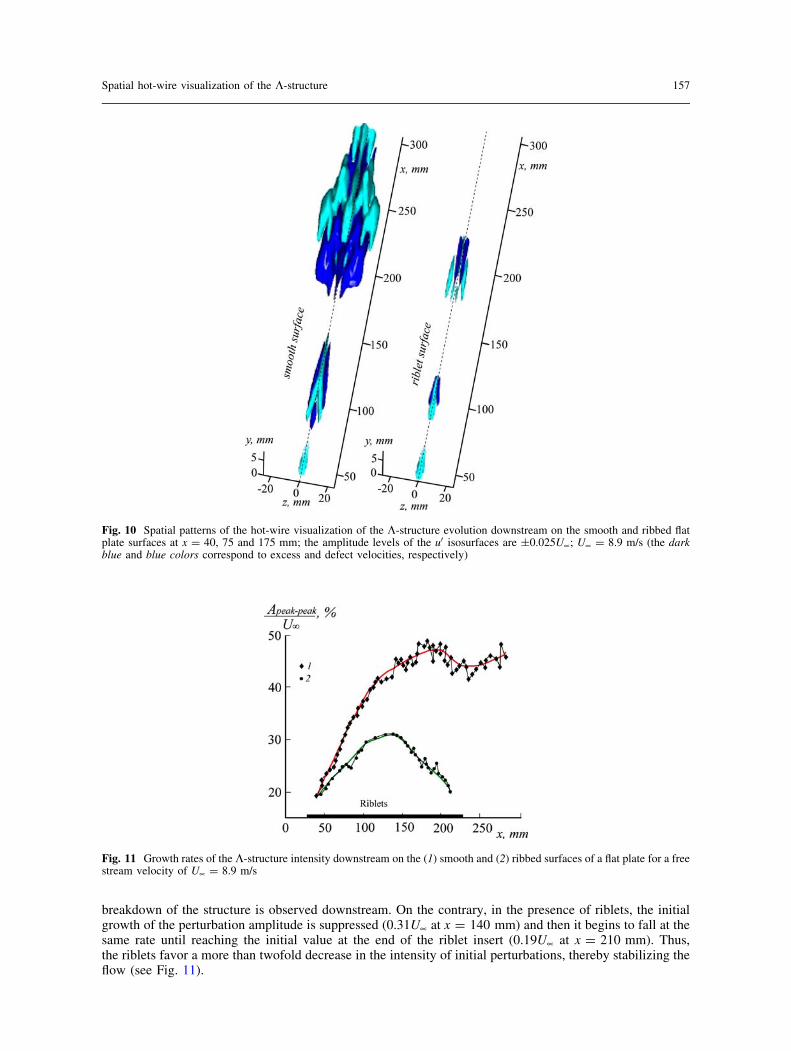
breakdown of the structure is observed downstream. On the contrary, in the presence of riblets, the initialgrowth of the perturbation amplitude is suppressed (0.31U� at x = 140 mm) and then it begins to fall at thesame rate until reaching the initial value at the end of the riblet insert (0.19U� at x = 210 mm). Thus,the riblets favor a more than twofold decrease in the intensity of initial perturbations, thereby stabilizing theflow (see Fig. 11).
Fig. 10 Spatial patterns of the hot-wire visualization of the K-structure evolution downstream on the smooth and ribbed flatplate surfaces at x = 40, 75 and 175 mm; the amplitude levels of the u0 isosurfaces are ±0.025U�; U� = 8.9 m/s (the darkblue and blue colors correspond to excess and defect velocities, respectively)
Fig. 11 Growth rates of the K-structure intensity downstream on the (1) smooth and (2) ribbed surfaces of a flat plate for a freestream velocity of U� = 8.9 m/s
Spatial hot-wire visualization of the K-structure 157

On the whole, the results of measurements showed that riblets provide an effective means of controllingthe development of the K-structure and its transformation into a turbulent spot. On a higher level ofinvestigations (with computer-controlled acquisition, processing, and spatiotemporal representation ofexperimental data), the obtained results confirmed the conclusion made in work by Grek et al. (1996) aboutthe stabilizing effect of riblets on the development of non-stationary vortex structures of the K-vortex type.We obtained quantitative information about the mechanism of suppression of the process of K-structuretransformation into a turbulent spot on riblets. Thus, the hypothesis concerning the stabilizing effect ofriblets on the development of coherent structures in a viscous sublayer in the turbulent boundary layer isonce more confirmed in experiments on the controlled development of a coherent structure of the laminar–turbulent transition in the boundary layer on a ribbed surface.
Apparently, the repression mechanism of the coherent vortical structures by riblets both in transitionalflow and viscose sublayer of the turbulent boundary layer is the same. One of possible mechanism ofrepression of K-vortices by riblets can be the weakening of the intensity of streamwise vorticity fluctuationsof streamwise vortices, i.e., a pair of counter-rotating longitudinal vortices of the K-structure.
4 Conclusion
In conclusion, it should be noted that the results of our experiments showed that the K-structure is trans-formed into a turbulent spot downstream on a smooth surface of a flat plate. In this case, the ensemble-averaged turbulent spot consists of an array of the determinated coherent structures such as K-vortices. Inthe case of a ribbed surface, it is found that riblets prevent the transformation of the K-structure into aturbulent spot and lead to a decay of this perturbation. It is found that the intensity of the K-structure onriblets initially increases and then decays (at about 180 mm downstream) to less than half of the levelobserved in the case of perturbation development on a smooth surface. It is found that the K-structure isstretched downstream on a smooth surface and transforms into a hairpin vortex. In both cases (i.e., forsmooth and ribbed surfaces), the single K-structure and the turbulent spot generate oblique waves at theperiphery.
Acknowledgments This work was supported by the Russian Foundation for Basic Research (grant no. 08-01-00027), theProgram of Support for Leading Scientific Schools (NSh-454.2008.1), Ministry of Education and Science of the RussianFederation (project RNP 2.1.2.541) and by grant of the Russian Federation President (MK-420.2008.1).
References
Allfredsson PH, Bakchinov AA, Kozlov VV, Matsubara M (1996) Laminar-turbulent transition at high level of free streamturbulence. In: Duck PW, Hall PH (eds) Proceedings of the IUTAM symposium on nonlinear instability and transition inthree-dimensional boundary layer. Kluwer Academic Publishers, pp 423–436
Gad-el-Hak M, Blackwelder RF, Riley JJ (1981) On the growth of turbulent regions in laminar boundary layers. J Fluid Mech110:73–95
Grek GR, Kozlov VV, Ramasanov MP (1989) Receptivity and stability of the boundary layer at a high turbulence level. In:IUTAM symposium, Toulouse. Springer, Berlin, pp 511–522
Grek GR, Kozlov VV, Titarenko SV (1996) An experimental study on the influence of riblets on transition. J Fluid Mech315:31–49
Walsh MJ (1980) Drag characteristics of V-groove and transverse curvature riblets. In: Hough GR (ed) Viscose drag reduction.AIAA, Washington, DC, pp 168–184
Wygnanski I, Haritonidis JH, Zilberman H (1982) On the spreading of a turbulent spot in the absence of a pressure gradient.J Fluid Mech 123:69–90
158 V. G. Chernoray et al.