How to define functionals on free structures in typed λ calculus
Upload
independentCategory
view
2download
0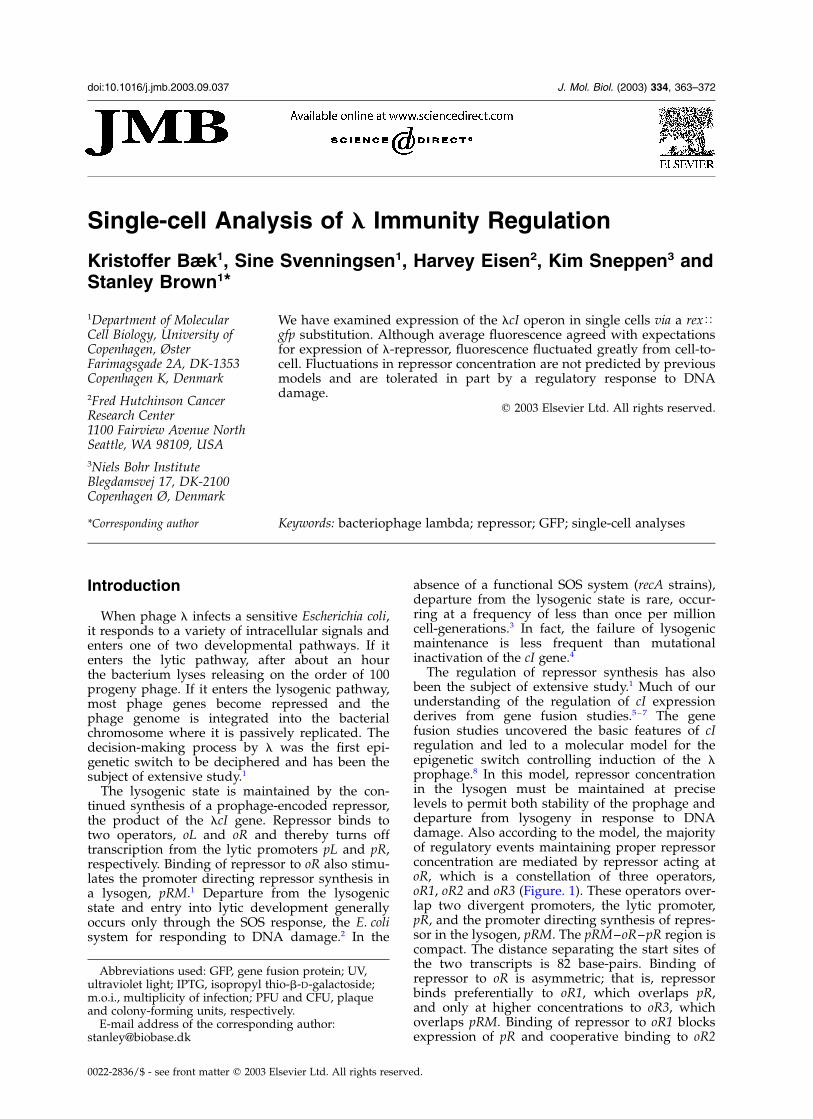
Single-cell Analysis of l Immunity Regulation
Kristoffer Bæk1, Sine Svenningsen1, Harvey Eisen2, Kim Sneppen3 andStanley Brown1*
1Department of MolecularCell Biology, University ofCopenhagen, ØsterFarimagsgade 2A, DK-1353Copenhagen K, Denmark
2Fred Hutchinson CancerResearch Center1100 Fairview Avenue NorthSeattle, WA 98109, USA
3Niels Bohr InstituteBlegdamsvej 17, DK-2100Copenhagen Ø, Denmark
We have examined expression of the lcI operon in single cells via a rex<gfp substitution. Although average fluorescence agreed with expectationsfor expression of l-repressor, fluorescence fluctuated greatly from cell-to-cell. Fluctuations in repressor concentration are not predicted by previousmodels and are tolerated in part by a regulatory response to DNAdamage.
q 2003 Elsevier Ltd. All rights reserved.
Keywords: bacteriophage lambda; repressor; GFP; single-cell analyses*Corresponding author
Introduction
When phage l infects a sensitive Escherichia coli,it responds to a variety of intracellular signals andenters one of two developmental pathways. If itenters the lytic pathway, after about an hourthe bacterium lyses releasing on the order of 100progeny phage. If it enters the lysogenic pathway,most phage genes become repressed and thephage genome is integrated into the bacterialchromosome where it is passively replicated. Thedecision-making process by l was the first epi-genetic switch to be deciphered and has been thesubject of extensive study.1
The lysogenic state is maintained by the con-tinued synthesis of a prophage-encoded repressor,the product of the lcI gene. Repressor binds totwo operators, oL and oR and thereby turns offtranscription from the lytic promoters pL and pR,respectively. Binding of repressor to oR also stimu-lates the promoter directing repressor synthesis ina lysogen, pRM.1 Departure from the lysogenicstate and entry into lytic development generallyoccurs only through the SOS response, the E. colisystem for responding to DNA damage.2 In the
absence of a functional SOS system (recA strains),departure from the lysogenic state is rare, occur-ring at a frequency of less than once per millioncell-generations.3 In fact, the failure of lysogenicmaintenance is less frequent than mutationalinactivation of the cI gene.4
The regulation of repressor synthesis has alsobeen the subject of extensive study.1 Much of ourunderstanding of the regulation of cI expressionderives from gene fusion studies.5– 7 The genefusion studies uncovered the basic features of cIregulation and led to a molecular model for theepigenetic switch controlling induction of the lprophage.8 In this model, repressor concentrationin the lysogen must be maintained at preciselevels to permit both stability of the prophage anddeparture from lysogeny in response to DNAdamage. Also according to the model, the majorityof regulatory events maintaining proper repressorconcentration are mediated by repressor acting atoR, which is a constellation of three operators,oR1, oR2 and oR3 (Figure. 1). These operators over-lap two divergent promoters, the lytic promoter,pR, and the promoter directing synthesis of repres-sor in the lysogen, pRM. The pRM–oR–pR region iscompact. The distance separating the start sites ofthe two transcripts is 82 base-pairs. Binding ofrepressor to oR is asymmetric; that is, repressorbinds preferentially to oR1, which overlaps pR,and only at higher concentrations to oR3, whichoverlaps pRM. Binding of repressor to oR1 blocksexpression of pR and cooperative binding to oR2
0022-2836/$ - see front matter q 2003 Elsevier Ltd. All rights reserved.
E-mail address of the corresponding author:[email protected]
Abbreviations used: GFP, gene fusion protein; UV,ultraviolet light; IPTG, isopropyl thio-b-D-galactoside;m.o.i., multiplicity of infection; PFU and CFU, plaqueand colony-forming units, respectively.
doi:10.1016/j.jmb.2003.09.037 J. Mol. Biol. (2003) 334, 363–372
stimulates expression of cI from pRM. Thus, theasymmetry of oR readily explains the synthesis ofrepressor and the repression of lytic functions in alysogen.
Since the early measurements of cI expressionwere made on gene fusions separated from theother elements of the immunity region such as oL,features intrinsic to the context of the immunityregion were not investigated. Recent reportssuggest more features regulate the immunity ofphage l than previously proposed. First is the par-ticipation of oL in repression at oR,9,10 consistentwith the crystal structure of repressor.11 oL overlapspL, the lytic promoter for the left operon of l(Figure 1). A second and more surprising obser-vation is the lack of a requirement for asymmetryat oR.12 Models relying on asymmetry are difficultto reconcile with the observations by Little andco-workers12 that phage with a symmetric oR formstable lysogens that can induce and grow lytically.The ability to form stable lysogens for mutantswith symmetric operators suggests three possiblescenarios for control of pRM. First, although all ornearly all transcription of cI in a lysogen is initiatedat pRM,13 there may be a second promoter respon-sible for a small amount of cI in a lysogen. Second,pRM may be substantially repressed in a wild-type lysogen and thus regulation of pRM toleratesor perhaps relies on repression. The second modelis especially attractive in light of the observationthat pRM is at least 60% repressed in a lysogen.10
A third model would rely on a higher-order com-plex including oL to generate the asymmetry atoR, reducing the requirement for asymmetry at oRitself.
Results and Discussion
Role of pRE in stability of lysogens
We tested the contribution of another promoterto synthesis of repressor in a lysogen. The mostlikely candidate for a second promoter expressingcI is pRE, the promoter active in the establishmentof repression. Reichardt & Kaiser14 found the con-centration of repressor to be slightly lower fromprophages defective in pRE-initiated transcription.Although they concluded the decrease was not sig-
nificant, the observations cited above suggested therole of pRE in maintaining lysogeny should bere-examined. If pRE contributed to repressor syn-thesis in lysogens, prophage mutated in pRE(cy) or its activator, CII, would display reducedstability of the lysogenic state. A decrease in lyso-genic stability would result in a higher frequencyof spontaneously released phage. We preparedsingle lysogens of lþ, lcy and lcII in a recA bac-terium and measured the frequency of releasedphage (Materials and Methods). The results of ourmeasurements are described in Table 1. It can beseen in Table 1A that the frequency of totalreleased phage was not elevated in lysogens defec-tive in activating pRE. This observation suggestspRE is unlikely to contribute to repressor synthesisin lysogens.
The lþ lysogens release phage able to form bothclear and turbid plaques. The majority of phagereleased are cI mutants and form clear plaques.Presumably, the phage forming turbid plaques arewild-type and result from the spontaneous failureof the regulatory circuit maintaining lysogeny.lcy phage form clear plaques independently ofwhether they contain a wild-type or mutant cIallele. To distinguish the two possible types ofphage released from the lcy lysogens, we testedthe ability of the released phage to provide repres-sor in the lysogenic state. We tested their ability tocomplement a lysogen of lcI ts (lcI857) permittingbacterial growth at 42 8C. It can be seen in Table1B that of 40 phage released from lcy lysogens,none was able to complement lcI ts as efficientlyas the lcy parents. Hence, these 40 phage werereleased due to mutations rather than due tofailures of lysogenic regulation. This observationsupports the above conclusion that pRE is unlikelyto direct sufficient repressor synthesis to make asubstantial contribution to the stability of estab-lished lysogens. If pRM is the sole source of repres-sor in lysogens, the ability of the symmetric oRmutants to form stable lysogens must be due tothe ability of pRM to tolerate strong repression orthe ability of oL to generate asymmetry at oR.
The cI complementation behavior of phagereleased from the lþ lysogen was examined as acontrol for the cy experiment above. We expectedthe clear plaque-forming phage to complement cI ts
poorly and it can be seen in Table 1 that of ten
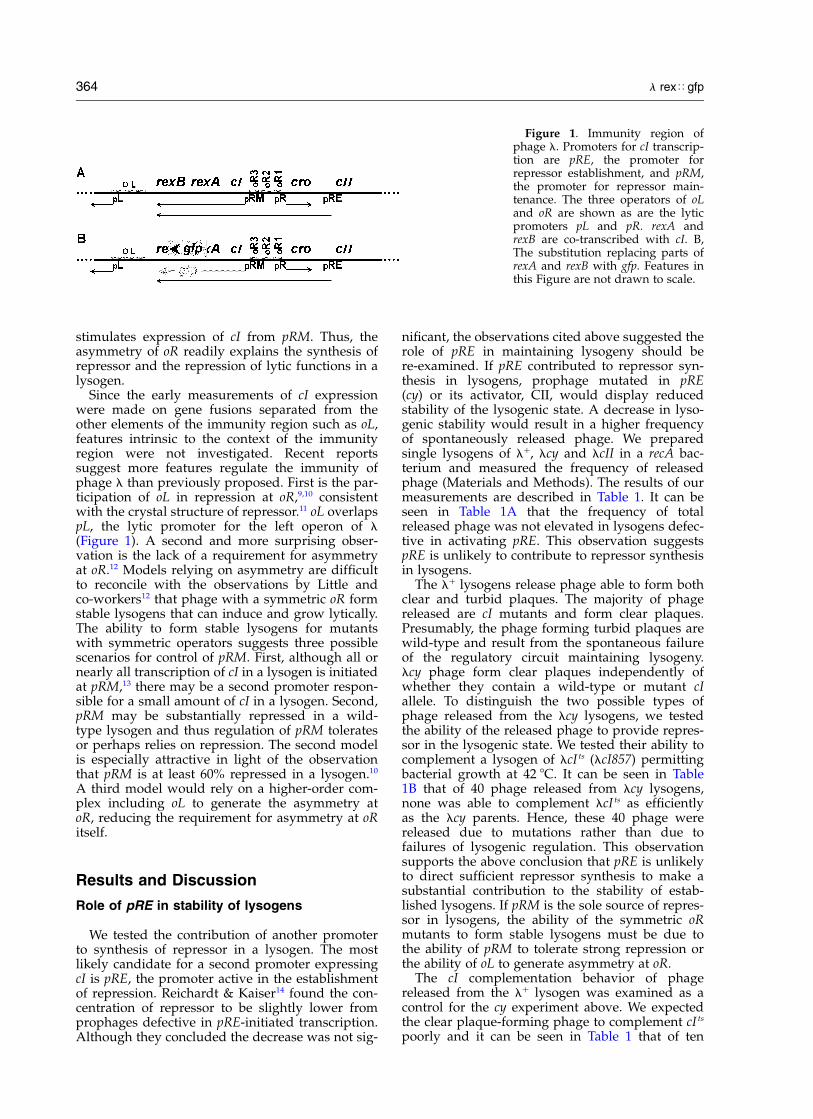
Figure 1. Immunity region ofphage l. Promoters for cI transcrip-tion are pRE, the promoter forrepressor establishment, and pRM,the promoter for repressor main-tenance. The three operators of oLand oR are shown as are the lyticpromoters pL and pR. rexA andrexB are co-transcribed with cI. B,The substitution replacing parts ofrexA and rexB with gfp. Features inthis Figure are not drawn to scale.
364 l rex<gfp
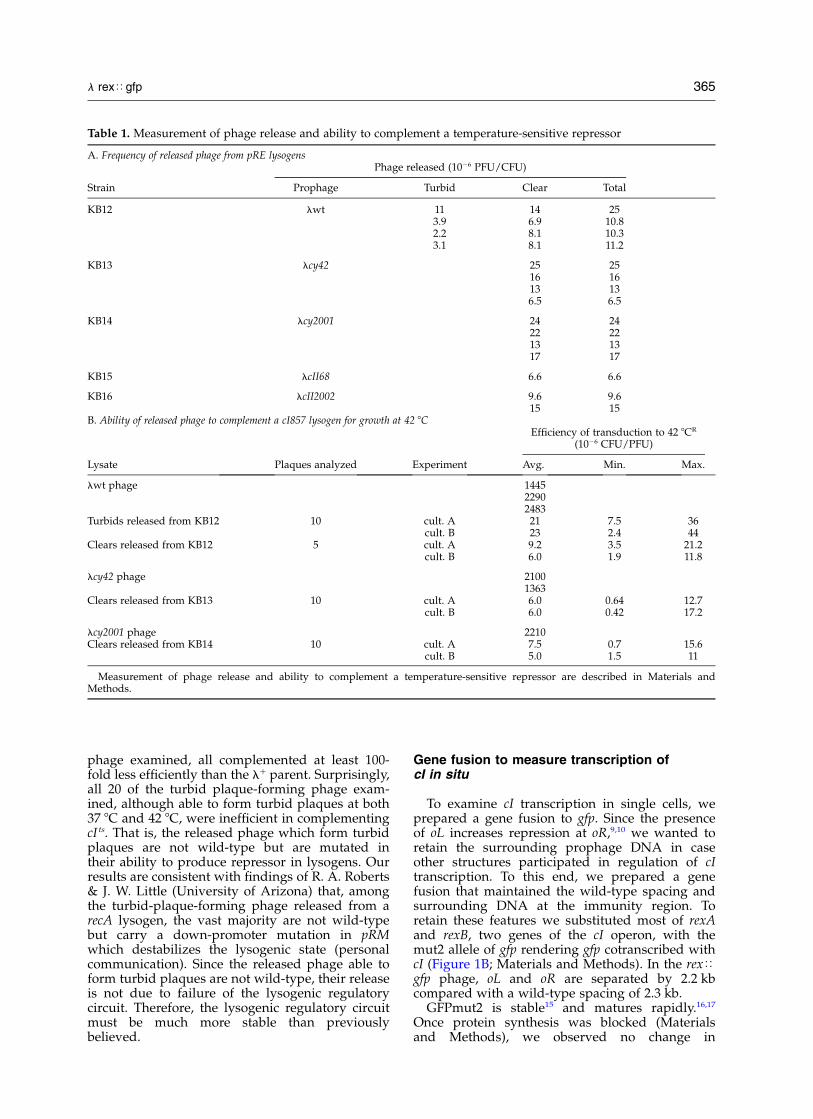
phage examined, all complemented at least 100-fold less efficiently than the lþ parent. Surprisingly,all 20 of the turbid plaque-forming phage exam-ined, although able to form turbid plaques at both37 8C and 42 8C, were inefficient in complementingcI ts. That is, the released phage which form turbidplaques are not wild-type but are mutated intheir ability to produce repressor in lysogens. Ourresults are consistent with findings of R. A. Roberts& J. W. Little (University of Arizona) that, amongthe turbid-plaque-forming phage released from arecA lysogen, the vast majority are not wild-typebut carry a down-promoter mutation in pRMwhich destabilizes the lysogenic state (personalcommunication). Since the released phage able toform turbid plaques are not wild-type, their releaseis not due to failure of the lysogenic regulatorycircuit. Therefore, the lysogenic regulatory circuitmust be much more stable than previouslybelieved.
Gene fusion to measure transcription ofcI in situ
To examine cI transcription in single cells, weprepared a gene fusion to gfp. Since the presenceof oL increases repression at oR,9,10 we wanted toretain the surrounding prophage DNA in caseother structures participated in regulation of cItranscription. To this end, we prepared a genefusion that maintained the wild-type spacing andsurrounding DNA at the immunity region. Toretain these features we substituted most of rexAand rexB, two genes of the cI operon, with themut2 allele of gfp rendering gfp cotranscribed withcI (Figure 1B; Materials and Methods). In the rex<gfp phage, oL and oR are separated by 2.2 kbcompared with a wild-type spacing of 2.3 kb.
GFPmut2 is stable15 and matures rapidly.16,17
Once protein synthesis was blocked (Materialsand Methods), we observed no change in
Table 1. Measurement of phage release and ability to complement a temperature-sensitive repressor
A. Frequency of released phage from pRE lysogensPhage released (1026 PFU/CFU)
Strain Prophage Turbid Clear Total
KB12 lwt 11 14 253.9 6.9 10.82.2 8.1 10.33.1 8.1 11.2
KB13 lcy42 25 2516 1613 136.5 6.5
KB14 lcy2001 24 2422 2213 1317 17
KB15 lcII68 6.6 6.6
KB16 lcII2002 9.6 9.615 15
B. Ability of released phage to complement a cI857 lysogen for growth at 42 8CEfficiency of transduction to 42 8CR
(1026 CFU/PFU)
Lysate Plaques analyzed Experiment Avg. Min. Max.
lwt phage 144522902483
Turbids released from KB12 10 cult. A 21 7.5 36cult. B 23 2.4 44
Clears released from KB12 5 cult. A 9.2 3.5 21.2cult. B 6.0 1.9 11.8
lcy42 phage 21001363
Clears released from KB13 10 cult. A 6.0 0.64 12.7cult. B 6.0 0.42 17.2
lcy2001 phage 2210Clears released from KB14 10 cult. A 7.5 0.7 15.6
cult. B 5.0 1.5 11
Measurement of phage release and ability to complement a temperature-sensitive repressor are described in Materials andMethods.
l rex<gfp 365
fluorescence during the course of our measure-ments. Therefore, fluorescence represents GFPconcentrations in the cells upon withdrawal fromthe growing culture.
Regulation of rex<gfp
In order to test whether gfp expression in indi-vidual cells reflected repressor concentrations, wefirst verified that gfp showed the regulationexpected for cI. We supplied excess repressor froma multicopy plasmid expressing repressor fromthe lac promoter, pcIþ. Both pcIþ and the controlplasmid bearing the defective cI60 allele, pcI60, arederivatives of pUC19 and maintained with at least50 copies per cell.18 Transformants were grown tomid-log phase and the fluorescence of individualcells compared (Table 2).
We observed decreased fluorescence in thepresence of multicopy cI. We interpret the reducedfluorescence of KB126pcIþ when compared withthe cI2 control, KB126pcI60, to reflect repression ofpRM. We cannot assess the degree of repression,since the residual fluorescence produced byKB126pcIþ approaches our threshold of detection,the auto-fluorescence observed with the KB124which lacks gfp. Repression of pRM by multicopyexpression of repressor was reported earlier.5
Therefore the rex<gfp fusion showed properregulation.
We also examined the response of a lysogen lack-ing oL, SS122 (Table 2). Its fluorescence was alsostrongly repressed by pcIþ indicating proper regu-lation of pRM. The unrepressed fluorescenceobserved with SS122pcI60 is substantially higherthan that of the oLþ strain, KB126pcI60. Increasedexpression from pRM in the absence of oL hasbeen described (Figure 2).10
Intriguing results were obtained with pSS5. LikepcIþ, pSS5 has the lac promoter placed upstreamfrom cI. However, pSS5, unlike pcIþ, retains oR. Inthe majority of our experiments a fraction of thecells harboring pSS5 fluoresced as strongly as thepUC18 control (Table 2). We suggest the stronglyfluorescing cells result from an interaction betweenoR retained on pSS5 and the operators of theprophage. In support of this conclusion we note
that when KB126 or SS122 was made lacI Q by trans-duction, the fluorescence of the weakly fluorescingcells decreased with added IPTG but the fluor-escence of the strongly fluorescing cells wasinsensitive to IPTG (data not shown). Thus, thebimodal distribution observed with pSS5 is notdue to repressor becoming insoluble in a fractionof the cells due to a high concentration. We suggestoR of pSS5 formed an aberrant complex withrepressor and oR of the prophage and interferedwith the ability of excess repressor to inhibit pRM.Lastly, we observed a bimodal distribution of gfpexpression in the absence of recombination(the recA strain, SS74pSS5; data not shown) indi-cating recombination is not necessary to form thede-repressed population.
Distribution of fluorescence in single cells
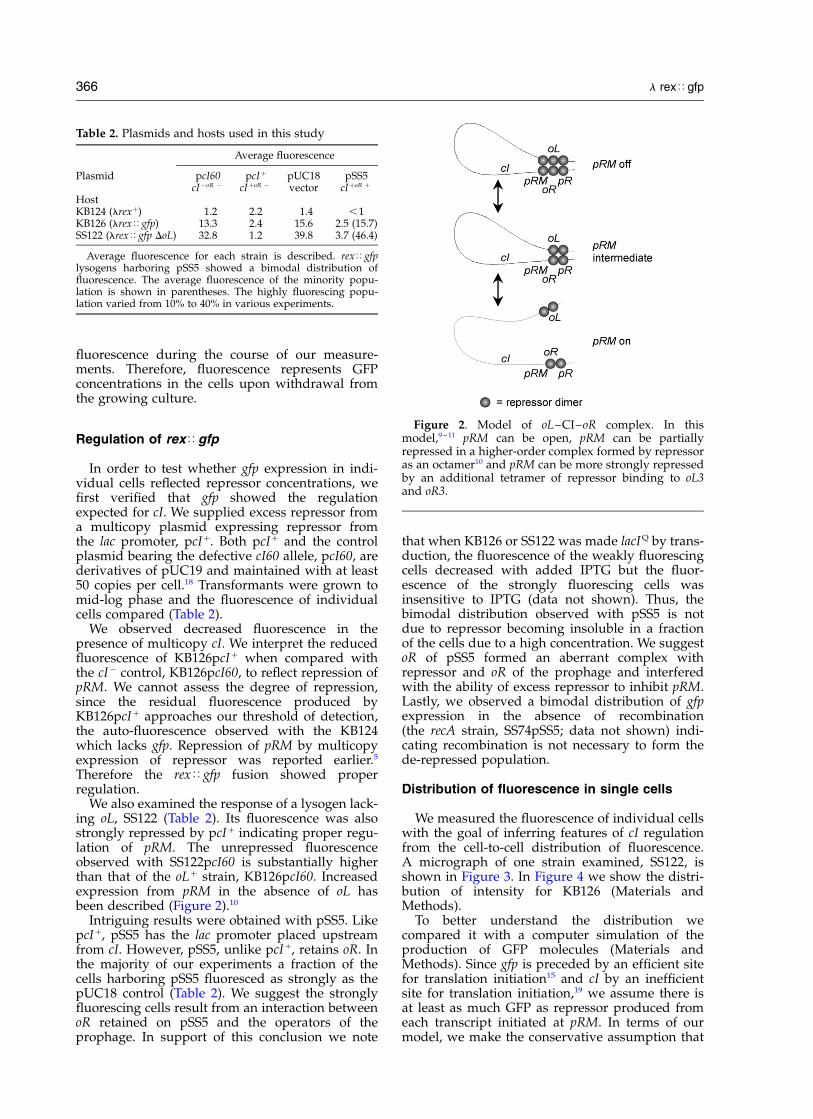
We measured the fluorescence of individual cellswith the goal of inferring features of cI regulationfrom the cell-to-cell distribution of fluorescence.A micrograph of one strain examined, SS122, isshown in Figure 3. In Figure 4 we show the distri-bution of intensity for KB126 (Materials andMethods).
To better understand the distribution wecompared it with a computer simulation of theproduction of GFP molecules (Materials andMethods). Since gfp is preceded by an efficient sitefor translation initiation15 and cI by an inefficientsite for translation initiation,19 we assume there isat least as much GFP as repressor produced fromeach transcript initiated at pRM. In terms of ourmodel, we make the conservative assumption that
Figure 2. Model of oL–CI–oR complex. In thismodel,9 – 11 pRM can be open, pRM can be partiallyrepressed in a higher-order complex formed by repressoras an octamer10 and pRM can be more strongly repressedby an additional tetramer of repressor binding to oL3and oR3.
Table 2. Plasmids and hosts used in this study
Average fluorescence
Plasmid pcI60 pcIþ pUC18 pSS5cI2oR 2 cIþoR 2 vector cIþoR þ
HostKB124 (lrexþ) 1.2 2.2 1.4 ,1KB126 (lrex<gfp) 13.3 2.4 15.6 2.5 (15.7)SS122 (lrex<gfp DoL) 32.8 1.2 39.8 3.7 (46.4)
Average fluorescence for each strain is described. rex<gfplysogens harboring pSS5 showed a bimodal distribution offluorescence. The average fluorescence of the minority popu-lation is shown in parentheses. The highly fluorescing popu-lation varied from 10% to 40% in various experiments.
366 l rex<gfp
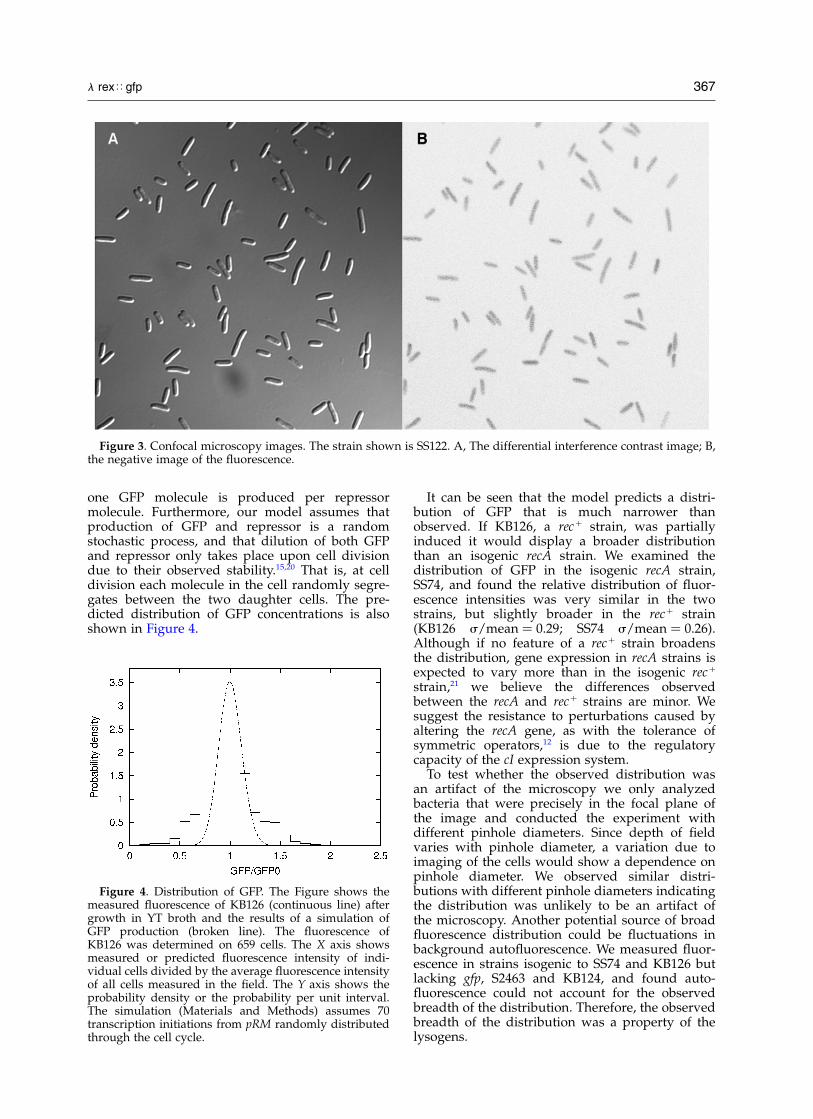
one GFP molecule is produced per repressormolecule. Furthermore, our model assumes thatproduction of GFP and repressor is a randomstochastic process, and that dilution of both GFPand repressor only takes place upon cell divisiondue to their observed stability.15,20 That is, at celldivision each molecule in the cell randomly segre-gates between the two daughter cells. The pre-dicted distribution of GFP concentrations is alsoshown in Figure 4.
It can be seen that the model predicts a distri-bution of GFP that is much narrower thanobserved. If KB126, a recþ strain, was partiallyinduced it would display a broader distributionthan an isogenic recA strain. We examined thedistribution of GFP in the isogenic recA strain,SS74, and found the relative distribution of fluor-escence intensities was very similar in the twostrains, but slightly broader in the recþ strain(KB126 s/mean ¼ 0.29; SS74 s/mean ¼ 0.26).Although if no feature of a recþ strain broadensthe distribution, gene expression in recA strains isexpected to vary more than in the isogenic recþ
strain,21 we believe the differences observedbetween the recA and recþ strains are minor. Wesuggest the resistance to perturbations caused byaltering the recA gene, as with the tolerance ofsymmetric operators,12 is due to the regulatorycapacity of the cI expression system.
To test whether the observed distribution wasan artifact of the microscopy we only analyzedbacteria that were precisely in the focal plane ofthe image and conducted the experiment withdifferent pinhole diameters. Since depth of fieldvaries with pinhole diameter, a variation due toimaging of the cells would show a dependence onpinhole diameter. We observed similar distri-butions with different pinhole diameters indicatingthe distribution was unlikely to be an artifact ofthe microscopy. Another potential source of broadfluorescence distribution could be fluctuations inbackground autofluorescence. We measured fluor-escence in strains isogenic to SS74 and KB126 butlacking gfp, S2463 and KB124, and found auto-fluorescence could not account for the observedbreadth of the distribution. Therefore, the observedbreadth of the distribution was a property of thelysogens.
Figure 3. Confocal microscopy images. The strain shown is SS122. A, The differential interference contrast image; B,the negative image of the fluorescence.
Figure 4. Distribution of GFP. The Figure shows themeasured fluorescence of KB126 (continuous line) aftergrowth in YT broth and the results of a simulation ofGFP production (broken line). The fluorescence ofKB126 was determined on 659 cells. The X axis showsmeasured or predicted fluorescence intensity of indi-vidual cells divided by the average fluorescence intensityof all cells measured in the field. The Y axis shows theprobability density or the probability per unit interval.The simulation (Materials and Methods) assumes 70transcription initiations from pRM randomly distributedthrough the cell cycle.
l rex<gfp 367
In our simulation, the stability of the prophagewould not be substantially reduced by the fluc-tuations in repressor concentrations per se, such asobserved for GFP concentrations. This is becausefailure of cI expression would have to occur forseveral generations in order to deplete the intra-cellular pool of repressor. Thus, the observedfluctuations of GFP concentrations are compatiblewith the observed stability of the prophage. How-ever, if the observed fluctuations were due to aneffect of Cro, an antagonist of repressor synthesis,then in the absence of additional mechanisms tocontrol cI expression, the predicted instability isincompatible with the observed stability of theprophage.
UV experiment
To search for a mechanism to maintain cIexpression in the presence of the large fluctuations,we examined the response of the rex<gfpexpression to reductions in repressor concen-trations such as those induced by DNA damage.We expected increased repressor synthesis inresponse to DNA damage could compensate forthe cell-to-cell variation and permit the prophageto regulate departure from lysogeny. To investigatethis possibility, we examined the response of thecI operon expression to UV irradiation in the Recþ
lysogen.Cultures of KB126 were exposed to various
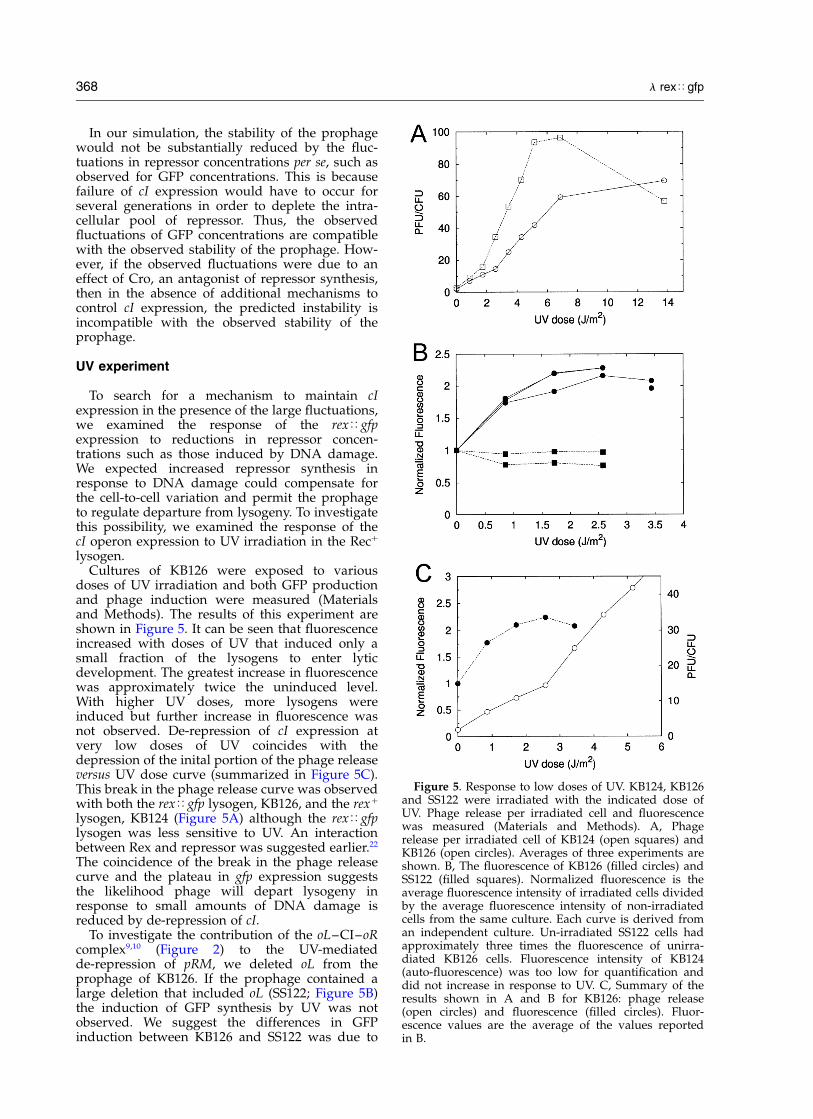
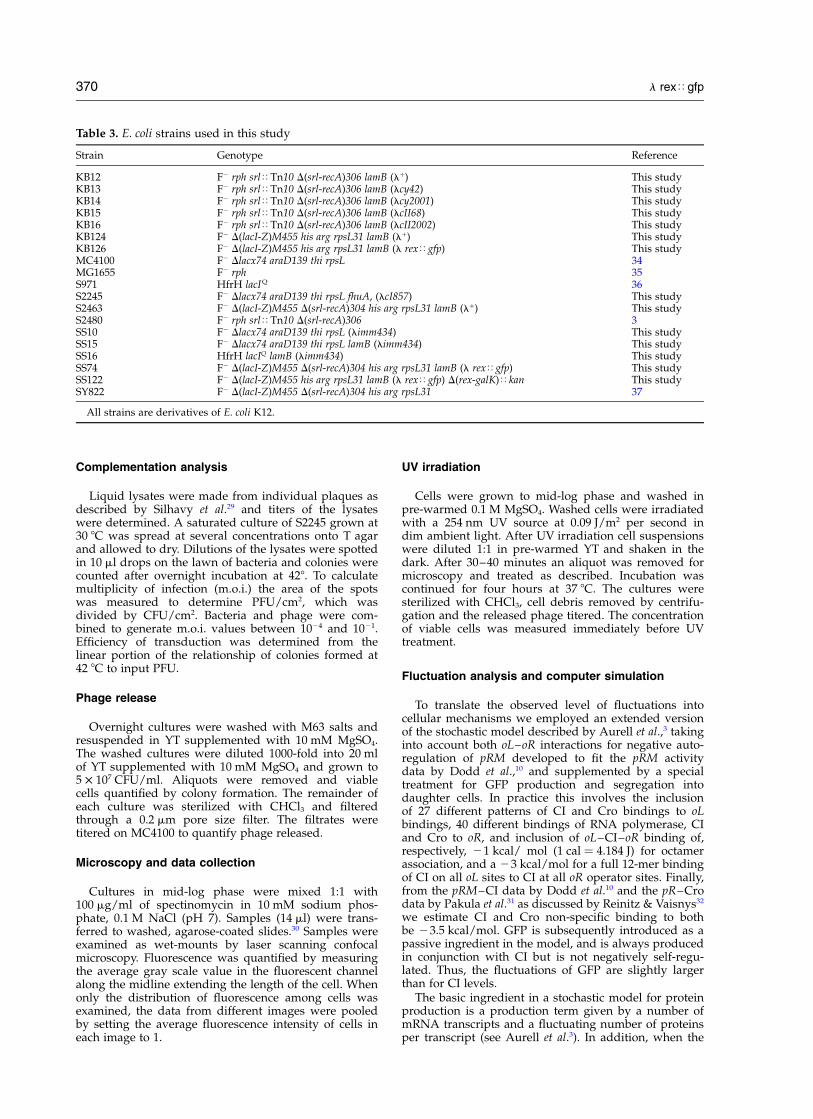
doses of UV irradiation and both GFP productionand phage induction were measured (Materialsand Methods). The results of this experiment areshown in Figure 5. It can be seen that fluorescenceincreased with doses of UV that induced only asmall fraction of the lysogens to enter lyticdevelopment. The greatest increase in fluorescencewas approximately twice the uninduced level.With higher UV doses, more lysogens wereinduced but further increase in fluorescence wasnot observed. De-repression of cI expression atvery low doses of UV coincides with thedepression of the inital portion of the phage releaseversus UV dose curve (summarized in Figure 5C).This break in the phage release curve was observedwith both the rex<gfp lysogen, KB126, and the rexþ
lysogen, KB124 (Figure 5A) although the rex<gfplysogen was less sensitive to UV. An interactionbetween Rex and repressor was suggested earlier.22
The coincidence of the break in the phage releasecurve and the plateau in gfp expression suggeststhe likelihood phage will depart lysogeny inresponse to small amounts of DNA damage isreduced by de-repression of cI.
To investigate the contribution of the oL–CI–oRcomplex9,10 (Figure 2) to the UV-mediatedde-repression of pRM, we deleted oL from theprophage of KB126. If the prophage contained alarge deletion that included oL (SS122; Figure 5B)the induction of GFP synthesis by UV was notobserved. We suggest the differences in GFPinduction between KB126 and SS122 was due to
Figure 5. Response to low doses of UV. KB124, KB126and SS122 were irradiated with the indicated dose ofUV. Phage release per irradiated cell and fluorescencewas measured (Materials and Methods). A, Phagerelease per irradiated cell of KB124 (open squares) andKB126 (open circles). Averages of three experiments areshown. B, The fluorescence of KB126 (filled circles) andSS122 (filled squares). Normalized fluorescence is theaverage fluorescence intensity of irradiated cells dividedby the average fluorescence intensity of non-irradiatedcells from the same culture. Each curve is derived froman independent culture. Un-irradiated SS122 cells hadapproximately three times the fluorescence of unirra-diated KB126 cells. Fluorescence intensity of KB124(auto-fluorescence) was too low for quantification anddid not increase in response to UV. C, Summary of theresults shown in A and B for KB126: phage release(open circles) and fluorescence (filled circles). Fluor-escence values are the average of the values reportedin B.
368 l rex<gfp
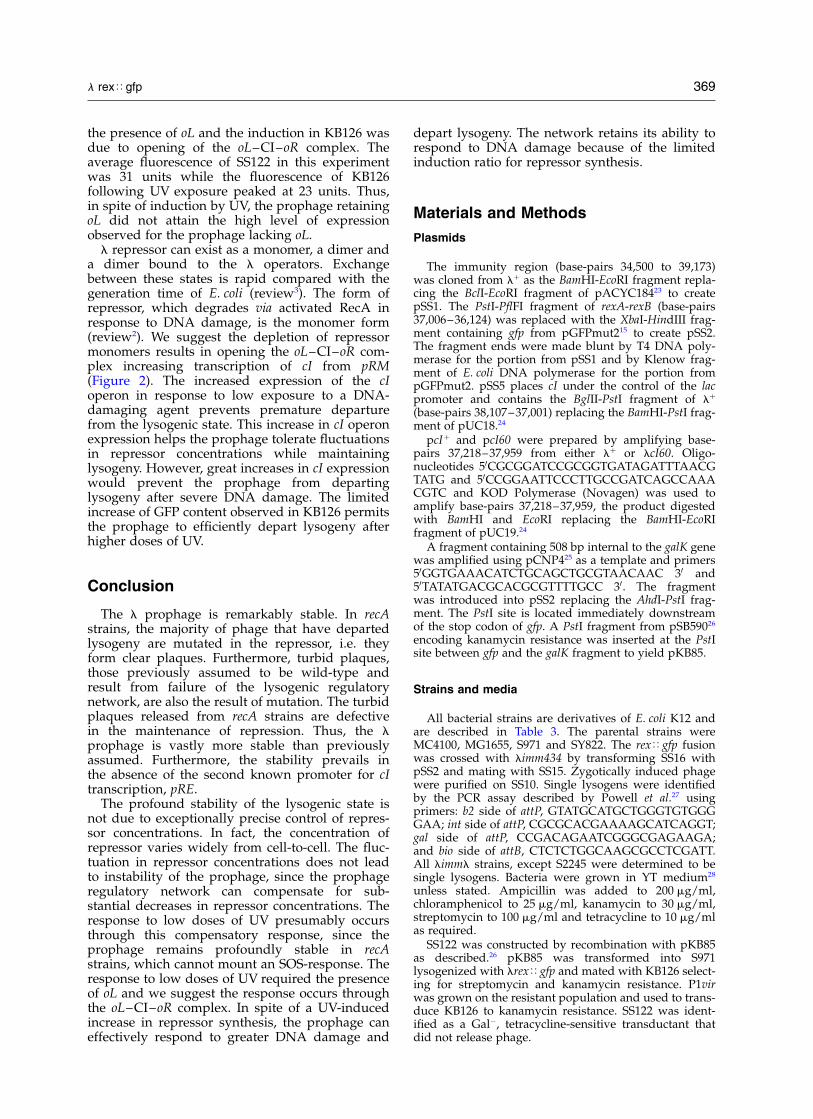
the presence of oL and the induction in KB126 wasdue to opening of the oL–CI–oR complex. Theaverage fluorescence of SS122 in this experimentwas 31 units while the fluorescence of KB126following UV exposure peaked at 23 units. Thus,in spite of induction by UV, the prophage retainingoL did not attain the high level of expressionobserved for the prophage lacking oL.
l repressor can exist as a monomer, a dimer anda dimer bound to the l operators. Exchangebetween these states is rapid compared with thegeneration time of E. coli (review3). The form ofrepressor, which degrades via activated RecA inresponse to DNA damage, is the monomer form(review2). We suggest the depletion of repressormonomers results in opening the oL–CI–oR com-plex increasing transcription of cI from pRM(Figure 2). The increased expression of the cIoperon in response to low exposure to a DNA-damaging agent prevents premature departurefrom the lysogenic state. This increase in cI operonexpression helps the prophage tolerate fluctuationsin repressor concentrations while maintaininglysogeny. However, great increases in cI expressionwould prevent the prophage from departinglysogeny after severe DNA damage. The limitedincrease of GFP content observed in KB126 permitsthe prophage to efficiently depart lysogeny afterhigher doses of UV.
Conclusion
The l prophage is remarkably stable. In recAstrains, the majority of phage that have departedlysogeny are mutated in the repressor, i.e. theyform clear plaques. Furthermore, turbid plaques,those previously assumed to be wild-type andresult from failure of the lysogenic regulatorynetwork, are also the result of mutation. The turbidplaques released from recA strains are defectivein the maintenance of repression. Thus, the lprophage is vastly more stable than previouslyassumed. Furthermore, the stability prevails inthe absence of the second known promoter for cItranscription, pRE.
The profound stability of the lysogenic state isnot due to exceptionally precise control of repres-sor concentrations. In fact, the concentration ofrepressor varies widely from cell-to-cell. The fluc-tuation in repressor concentrations does not leadto instability of the prophage, since the prophageregulatory network can compensate for sub-stantial decreases in repressor concentrations. Theresponse to low doses of UV presumably occursthrough this compensatory response, since theprophage remains profoundly stable in recAstrains, which cannot mount an SOS-response. Theresponse to low doses of UV required the presenceof oL and we suggest the response occurs throughthe oL–CI–oR complex. In spite of a UV-inducedincrease in repressor synthesis, the prophage caneffectively respond to greater DNA damage and
depart lysogeny. The network retains its ability torespond to DNA damage because of the limitedinduction ratio for repressor synthesis.
Materials and Methods
Plasmids
The immunity region (base-pairs 34,500 to 39,173)was cloned from lþ as the BamHI-EcoRI fragment repla-cing the BclI-EcoRI fragment of pACYC18423 to createpSS1. The PstI-PflFI fragment of rexA-rexB (base-pairs37,006–36,124) was replaced with the XbaI-HindIII frag-ment containing gfp from pGFPmut215 to create pSS2.The fragment ends were made blunt by T4 DNA poly-merase for the portion from pSS1 and by Klenow frag-ment of E. coli DNA polymerase for the portion frompGFPmut2. pSS5 places cI under the control of the lacpromoter and contains the BglII-PstI fragment of lþ
(base-pairs 38,107–37,001) replacing the BamHI-PstI frag-ment of pUC18.24
pcIþ and pcI60 were prepared by amplifying base-pairs 37,218–37,959 from either lþ or lcI60. Oligo-nucleotides 50CGCGGATCCGCGGTGATAGATTTAACGTATG and 50CCGGAATTCCCTTGCCGATCAGCCAAACGTC and KOD Polymerase (Novagen) was used toamplify base-pairs 37,218–37,959, the product digestedwith BamHI and EcoRI replacing the BamHI-EcoRIfragment of pUC19.24
A fragment containing 508 bp internal to the galK genewas amplified using pCNP425 as a template and primers50GGTGAAACATCTGCAGCTGCGTAACAAC 30 and50TATATGACGCACGCGTTTTGCC 30. The fragmentwas introduced into pSS2 replacing the AhdI-PstI frag-ment. The PstI site is located immediately downstreamof the stop codon of gfp. A PstI fragment from pSB59026
encoding kanamycin resistance was inserted at the PstIsite between gfp and the galK fragment to yield pKB85.
Strains and media
All bacterial strains are derivatives of E. coli K12 andare described in Table 3. The parental strains wereMC4100, MG1655, S971 and SY822. The rex<gfp fusionwas crossed with limm434 by transforming SS16 withpSS2 and mating with SS15. Zygotically induced phagewere purified on SS10. Single lysogens were identifiedby the PCR assay described by Powell et al.27 usingprimers: b2 side of attP, GTATGCATGCTGGGTGTGGGGAA; int side of attP, CGCGCACGAAAAGCATCAGGT;gal side of attP, CCGACAGAATCGGGCGAGAAGA;and bio side of attB, CTCTCTGGCAAGCGCCTCGATT.All limml strains, except S2245 were determined to besingle lysogens. Bacteria were grown in YT medium28
unless stated. Ampicillin was added to 200 mg/ml,chloramphenicol to 25 mg/ml, kanamycin to 30 mg/ml,streptomycin to 100 mg/ml and tetracycline to 10 mg/mlas required.
SS122 was constructed by recombination with pKB85as described.26 pKB85 was transformed into S971lysogenized with lrex<gfp and mated with KB126 select-ing for streptomycin and kanamycin resistance. P1virwas grown on the resistant population and used to trans-duce KB126 to kanamycin resistance. SS122 was ident-ified as a Gal2, tetracycline-sensitive transductant thatdid not release phage.
l rex<gfp 369
Complementation analysis
Liquid lysates were made from individual plaques asdescribed by Silhavy et al.29 and titers of the lysateswere determined. A saturated culture of S2245 grown at30 8C was spread at several concentrations onto T agarand allowed to dry. Dilutions of the lysates were spottedin 10 ml drops on the lawn of bacteria and colonies werecounted after overnight incubation at 428. To calculatemultiplicity of infection (m.o.i.) the area of the spotswas measured to determine PFU/cm2, which wasdivided by CFU/cm2. Bacteria and phage were com-bined to generate m.o.i. values between 1024 and 1021.Efficiency of transduction was determined from thelinear portion of the relationship of colonies formed at42 8C to input PFU.
Phage release
Overnight cultures were washed with M63 salts andresuspended in YT supplemented with 10 mM MgSO4.The washed cultures were diluted 1000-fold into 20 mlof YT supplemented with 10 mM MgSO4 and grown to5 £ 107 CFU/ml. Aliquots were removed and viablecells quantified by colony formation. The remainder ofeach culture was sterilized with CHCl3 and filteredthrough a 0.2 mm pore size filter. The filtrates weretitered on MC4100 to quantify phage released.
Microscopy and data collection
Cultures in mid-log phase were mixed 1:1 with100 mg/ml of spectinomycin in 10 mM sodium phos-phate, 0.1 M NaCl (pH 7). Samples (14 ml) were trans-ferred to washed, agarose-coated slides.30 Samples wereexamined as wet-mounts by laser scanning confocalmicroscopy. Fluorescence was quantified by measuringthe average gray scale value in the fluorescent channelalong the midline extending the length of the cell. Whenonly the distribution of fluorescence among cells wasexamined, the data from different images were pooledby setting the average fluorescence intensity of cells ineach image to 1.
UV irradiation
Cells were grown to mid-log phase and washed inpre-warmed 0.1 M MgSO4. Washed cells were irradiatedwith a 254 nm UV source at 0.09 J/m2 per second indim ambient light. After UV irradiation cell suspensionswere diluted 1:1 in pre-warmed YT and shaken in thedark. After 30–40 minutes an aliquot was removed formicroscopy and treated as described. Incubation wascontinued for four hours at 37 8C. The cultures weresterilized with CHCl3, cell debris removed by centrifu-gation and the released phage titered. The concentrationof viable cells was measured immediately before UVtreatment.
Fluctuation analysis and computer simulation
To translate the observed level of fluctuations intocellular mechanisms we employed an extended versionof the stochastic model described by Aurell et al.,3 takinginto account both oL–oR interactions for negative auto-regulation of pRM developed to fit the pRM activitydata by Dodd et al.,10 and supplemented by a specialtreatment for GFP production and segregation intodaughter cells. In practice this involves the inclusionof 27 different patterns of CI and Cro bindings to oLbindings, 40 different bindings of RNA polymerase, CIand Cro to oR, and inclusion of oL–CI–oR binding of,respectively, 21 kcal/ mol (1 cal ¼ 4.184 J) for octamerassociation, and a 23 kcal/mol for a full 12-mer bindingof CI on all oL sites to CI at all oR operator sites. Finally,from the pRM–CI data by Dodd et al.10 and the pR–Crodata by Pakula et al.31 as discussed by Reinitz & Vaisnys32
we estimate CI and Cro non-specific binding to bothbe 23.5 kcal/mol. GFP is subsequently introduced as apassive ingredient in the model, and is always producedin conjunction with CI but is not negatively self-regu-lated. Thus, the fluctuations of GFP are slightly largerthan for CI levels.
The basic ingredient in a stochastic model for proteinproduction is a production term given by a number ofmRNA transcripts and a fluctuating number of proteinsper transcript (see Aurell et al.3). In addition, when the
Table 3. E. coli strains used in this study
Strain Genotype Reference
KB12 F2 rph srl<Tn10 D(srl-recA)306 lamB (lþ) This studyKB13 F2 rph srl<Tn10 D(srl-recA)306 lamB (lcy42) This studyKB14 F2 rph srl<Tn10 D(srl-recA)306 lamB (lcy2001) This studyKB15 F2 rph srl<Tn10 D(srl-recA)306 lamB (lcII68) This studyKB16 F2 rph srl<Tn10 D(srl-recA)306 lamB (lcII2002) This studyKB124 F2 D(lacI-Z)M455 his arg rpsL31 lamB (lþ) This studyKB126 F2 D(lacI-Z)M455 his arg rpsL31 lamB (l rex<gfp) This studyMC4100 F2 Dlacx74 araD139 thi rpsL 34MG1655 F2 rph 35S971 HfrH lacIQ 36S2245 F2 Dlacx74 araD139 thi rpsL fhuA, (lcI857) This studyS2463 F2 D(lacI-Z)M455 D(srl-recA)304 his arg rpsL31 lamB (lþ) This studyS2480 F2 rph srl<Tn10 D(srl-recA)306 3SS10 F2 Dlacx74 araD139 thi rpsL (limm434) This studySS15 F2 Dlacx74 araD139 thi rpsL lamB (limm434) This studySS16 HfrH lacIQ lamB (limm434) This studySS74 F2 D(lacI-Z)M455 D(srl-recA)304 his arg rpsL31 lamB (l rex<gfp) This studySS122 F2 D(lacI-Z)M455 his arg rpsL31 lamB (l rex<gfp) D(rex-galK)<kan This studySY822 F2 D(lacI-Z)M455 D(srl-recA)304 his arg rpsL31 37
All strains are derivatives of E. coli K12.
370 l rex<gfp
cells divide all molecules should be randomly distribu-ted to the two daughter cells. The resulting fluctuationsin GFP concentration will be of order Nevent
21/2 where Nevent
is the number of independent events that control theamount of GFP in the cell. However, because each celldivision limits the overall meandering of concentrationof any protein in a cell, a more precise estimate of fluctu-ations needs a simulation. However, in practice we findthat the spread over mean for the GFP signal is wellfitted by:
s
mean¼
1ffiffiffiffiffiffiffiffiffiffiffiffiffiffiffi
NmRNA
p
where NmRNA is the number of CI–GFP mRNA transcriptproduced in a cell generation. The simulation assumed70 transcripts per cell cycle were initiated at pRM togenerate 170 repressor monomers. This efficiency oftranslation of cI is derived from the ratio of translationof cI from pRM to lacZ from its own ribosome-bindingsite19 and the efficiency of translation of lacZ.33 Thenumber of repressor monomers per cell is derived fromthe concentration of repressor in lysogens14 and themolecular mass of the l-repressor.
Acknowledgements
We thank Sankar Adhya, Kasper Eriksen,Max Gottesman, Anders Løbner-Olesen, MichaelSørensen and Genevieve Thon for helpful sugges-tions. We thank the Novo Nordisk Foundation forsupport.
References
1. Ptashne, M. (1992). A Genetic Switch, Cell Press,Blackwell Scientific Publications, Cambridge, MA.
2. Roberts, J. W. & Devoret, R. (1983). Lysogenic induc-tion. In Lambda II (Hendrix, R. W., Roberts, J. W.,Stahl, F. W. & Weisberg, R. A., eds), pp. 123–144,Cold Spring Harbour Laboratory Press, Cold SpringHarbor, NY.
3. Aurell, E., Brown, S., Johanson, J. & Sneppen, K.(2002). Stability puzzles in phage. Phys. Rev. ser. E,65, 05191.
4. Brooks, K. & Clark, A. J. (1967). Behavior of l bac-teriophage in a recombination deficient strain ofEscherichia coli. J. Virol. 1, 283–293.
5. Maurer, R., Meyer, B. & Ptashne, M. (1980). Generegulation at the right operator (OR) bacteriophagel. I. OR3 and autogenous negative control by repres-sor. J. Mol. Biol. 139, 147–161.
6. Meyer, B. J., Maurer, R. & Ptashne, M. (1980). Generegulation at the right operator (OR) of bacterio-phage l. II. OR1, OR2, and OR3: their roles inmediating the effects of repressor and cro. J. Mol.Biol. 139, 163–194.
7. Meyer, B. J. & Ptashne, M. (1980). Gene regulationat the right operator (OR) of bacteriophage l. III. lrepressor directly activated gene transcription.J. Mol. Biol. 136, 195–205.
8. Johnson, A. D., Poteete, A. R., Lauer, G., Sauer, R. T.,Ackers, G. K. & Ptashne, M. (1981). l repressor andcro–components of an efficient molecular switch.Nature, 294, 217–223.
9. Revet, B., von Wilcken-Bergmann, B., Bessert, H.,Barker, A. & Muller-Hill, B. (1999). Four dimers oflambda repressor bound to two suitably spacedpairs of lambda operators form octamers andDNA loops over large distances. Curr. Biol. 9,151–154.
10. Dodd, I. B., Perkins, A. J., Tsemitsidis, D. & Egan, B. J.(2001). Octamerization of l CI repressor is neededfor effective repression of pRM and efficient switch-ing from lysogeny. Genes Dev. 15, 3013–3022.
11. Bell, C. E., Frescura, P., Hochschild, A. & Lewis, M.(2000). Crystal structure of the l repressor C-terminaldomain provides a model for cooperative operatorbinding. Cell, 101, 801–811.
12. Little, J. W., Shepley, D. P. & Wert, D. W. (1999).Robustness of a gene regulatory ciruit. EMBO J. 18,4207–4299.
13. Yen, K.-M. & Gussin, G. N. (1973). Genetic charac-terization of a prm2 mutant of bacteriophage l.Virology, 56, 300–312.
14. Reichardt, L. & Kaiser, A. D. (1971). Control of lrepressor synthesis. Proc. Natl Acad. Sci. USA, 68,2185–2189.
15. Cormack, B. P., Valdivia, R. H. & Falkow, S. (1996).FACS—optimized mutants of the green fluorescentprotein (GFP). Gene, 173, 33–38.
16. Løbner-Olesen, A. (1999). Distribution of mini-chromosomes in individual Escherichia coli cells:implications for replication control. EMBO J. 18,1712–1721.
17. Kalir, S., McClure, J., Pabbaraju, K., Southward, C.,Ronen, M., Leibler, S. et al. (2001). Ordering genes ina flagella pathway by analysis of expression kineticsfrom living bacteria. Science, 292, 2080–2083.
18. Lutz, R. & Bujard, H. (1997). Independent tight regu-lation of transcriptional units in Escherichia coli viathe LacR/O, the TetR/O and AraC/I1-I2 regulatoryelements. Nucl. Acids Res. 25, 1203–1210.
19. Shean, C. S. & Gottesman, M. E. (1992). Translationof the prophage l cI transcript. Cell, 70, 513–522.
20. Reichardt, L. F. (1975). Control of bacteriophagelambda repressor synthesis: regulation of the main-tenance pathway by the cro and cI products. J. Mol.Biol. 93, 289–309.
21. Elowitz, M. B., Levine, A. J., Siggia, E. D. & Swain,P. S. (2002). Stochastic gene expression in a singlecell. Science, 297, 1183–1186.
22. Eisen, H., Pereira da Silva, L. H. & Jacob, F. (1968).Sur la regulation precoce du bacteriophage. C.R.Acad. Sci. Paris, 266, 1176–1178.
23. Chang, A. C. Y. & Cohen, S. N. (1978). Constructioncharacterization of amplifiable multicopy DNAcloning vehicles derived from the P15A cryptic mini-plasmid. J. Bacteriol. 134, 1141–1156.
24. Yanisch-Perron, C., Vieira, J. & Messing, J. (1985).Improved M13 phage cloning vectors and hoststrains: nucleotide sequences of the M13mp18 andpUC19 vectors. Gene, 33, 103–119.
25. Petersen, C. (1987). The functional stability of thelacZ transcript is sensitive towards sequence altera-tions immediately downstream of the ribosomebinding site. Mol. Gen. Genet. 209, 179–187.
26. Brown, S. & Fournier, M. J. (1984). The 4.5 S RNAgene of E. coli is essential for cell growth. J. Mol.Biol. 178, 533–550.
27. Powell, B. S., Rivas, M. P., Court, D. L., Nakamura, Y.& Turnbough, C. L. (1994). Rapid confirmation ofsingle copy lambda prophage integration by PCR.Nucl. Acids Res. 22, 5765–5766.
l rex<gfp 371
28. Miller, J. H. (1972). Experiments in Molecular Genetics,Cold Spring Harbor Laboratory Press, Cold SpringHarbor, NY.
29. Silhavy, T. J., Berman, M. L. & Enquist, L. W. (1984).Experiments with Gene Fusions, Cold Spring HarborLaboratory Press, Cold Spring Harbor, NY.
30. Lemon, K. P. & Grossman, A. D. (1998). Localizationof bacterial DNA polymerase: evidence for a factorymodel of replication. Science, 282, 1516–1519.
31. Pakula, A., Young, V. & Sauer, R. (1986). Bacterio-phage l cro mutations: effect on activity and intra-cellular degradation. Proc. Natl Acad. Sci. USA, 83,8829–8833.
32. Reinitz, J. & Vaisnys, J. R. (1990). Theoretical andexperimental analysis of the phage l genetic switchimpies missing levels of co-operativity. J. Theor. Biol.145, 295–318.
33. Kennell, D. & Riezman, H. (1977). Transcription
translation initiation frequencies of the Escherichiacoli lac operon. J. Mol. Biol. 114, 1–21.
34. Casadaban, M. J. (1976). Transposition fusion ofthe lac genes to selected promoters in E. coli usingbacteriophage lambda and mu. J. Mol. Biol. 104,541–555.
35. Jensen, K. F. (1993). The Escherichia coli K-12 “wildtypes” W3110 and MG1655 have an rph frameshiftmutation that leads to pyrimidine starvation dueto low pyrE expression levels. J. Bacteriol. 175,3401–3407.
36. Brown, S. (1987). Mutations in the gene for EF-Greduce the requirement for 4.5 S RNA in the growthof E. coli. Cell, 49, 825–833.
37. Isberg, R. R., Lazaar, A. L. & Syvanen, M. (1982).Regulation of Tn5 by the right-repeat proteins: con-trol at the level of the transposition reaction? Cell,30, 883–892.
Edited by M. Gottesman
(Received 23 June 2003; received in revised form 10 September 2003; accepted 15 September 2003)
372 l rex<gfp
Copyright © 2022 FDOKUMEN