Noradrenergic neurons expressing Fos during waking and paradoxical sleep deprivation in the rat
Upload
independentCategory
view
3download
0
Spatial Correlations of Laminar BOLD and CBVResponses to Rat Whisker Stimulation with NeuronalActivity Localized by Fos Expression
Hanbing Lu,1 Sachin Patel,2 Feng Luo,1 Shi-Jiang Li,1 Cecilia J. Hillard,2
B. Douglas Ward,1 and James S. Hyde1
The spatial relationship between a measured fMRI signal and itsunderlying neuronal activity remains unclear. One obstacle isthe localization of neuronal activity; another is the spatial res-olution of fMRI. In the present study, high-resolution BOLD andCBV fMRI experiments (voxel size: 156 � 156 � 2000 �m3) wereconducted in the rat whisker barrel cortex at 3 T; neuronalactivity across cortical layers was mapped using the Fos ex-pression technique. Results show that BOLD response isweighted by blood volume and that pixels with high BOLDresponse can be located at the cortical surface or in deeplayers, depending on local vasculature. In contrast to BOLDresponse, the pixels with high CBV response were consistentlyclustered in the deep cortical layers. Percentage-CBV changein cortical layers IV–V was 7.3 � 1.5%, which was significantlyhigher than in layers I–III (4.1 � 0.9%) and VI (4.3 � 0.7%)(mean � SEM). The laminar distribution of CBV response cor-relates well with neuronal activity localized by Fos expression.We conclude that neuronal activity can be inferred from CBVfMRI data with high spatial accuracy. The data indicate thatboth intracolumn functional connectivity and neurovascularcoupling can be studied using CBV fMRI. Magn Reson Med 52:1060–1068, 2004. © 2004 Wiley-Liss, Inc.
Key words: whisker barrel cortex; Fos expression; high-resolu-tion fMRI; BOLD; CBV
INTRODUCTION
Neuronal activity in cortical gray matter induces localchanges in blood flow, volume and oxygenation, which arecollectively termed “the hemodynamic response.” Func-tional magnetic resonance imaging (fMRI) techniques existthat permit imaging with contrast that is determined bychanges in each of the three aspects of the hemodynamicresponse. Despite widespread application using fMRI as atool for exploring human brain function, the spatial rela-tionship between a measured fMRI signal and its underly-ing neuronal activity remains unclear. A question arises:does the distribution of the fMRI signal across corticallayers match neuronal activity? This article is intended toaddress this question through high-resolution fMRI andneuronal-activity mapping using Fos expression.
The functional resolution in fMRI is fundamentally lim-ited both by the physiologic processes underlying the he-modynamic response and the anatomy of the microcircu-lation. Optical imaging studies in the cat visual cortex (1)revealed an early increase in deoxyhemoglobin content inresponse to stimulus. The preundershoot of BOLD re-sponse (“initial dip”), which has been thought to arisefrom immediate consumption of oxygen prior to the he-modynamic response, was reported to exhibit improvedfunctional resolution in BOLD fMRI (2). This technique,however, suffers from substantial technical challenges, in-cluding low contrast-to-noise ratio (CNR) (3). For generalfMRI applications, the positive BOLD response is the mostcommon choice. From a cortical vasculature perspective,Duvernoy et al. (4) classified cortical penetrating veins intofive groups of variable diameters and defined the “venousunit” as the volume of tissue that is drained by a “princi-ple” penetrating vein. We hypothesize that the venous unitlimits the spatial resolution that is obtainable in fMRIemploying the positive BOLD response at 3 T.
Microscopic observations of vessel response to hyper-capnia challenge by Lee et al. (5) have shown that frac-tional changes in vessel diameter are much greater in thesmallest vessels (10–20 �m diameter) and that the changesoccur on both the venous and arterial sides but are morepronounced on the arterial side. Thus there is hope thatfMRI based on changes in cerebral blood volume (CBV)can break the resolution barrier imposed by the venousunit. Assuming that the hemodynamic change induced byhypercapnia is a good model for change caused by neuro-nal activity, we hypothesize that fMRI based on CBV con-trast should be localized to small vessels close to the site ofneuronal activity with minimal extension to adjacent tis-sue. CBV contrast based on use of injected Gd(DTPA)2-
contrast agent was utilized in the first human fMRI studiesby Belliveau et al. (6). Improved CNR was obtained in ratsusing monocrystalline iron oxide nanocolloid (MION)contrast agent by Mandeville et al. (7,8). We have followedthe work of these authors in designing experiments in ratwhisker barrel cortex to test this hypothesis.
The rat whisker barrel cortex is a unique region that ischaracterized by dense cell aggregates in cortical layer IVof the posterior medial part of the primary somatosensorycortex (9). Each barrel responds in one-to-one fashion to asingle principal whisker (10,11). Cox et al. (12) haveshown that the capillary beds are confined to single barrelssuch that each barrel has a relatively independent bloodsupply. In light of the anatomic and physiologic specific-ity, a whisker barrel stimulation model appears to be ide-
1Department of Biophysics, Medical College of Wisconsin, Milwaukee, Wis-consin.2Department of Pharmacology, Medical College of Wisconsin, Milwaukee,WisconsinCorrespondence to: J. S. Hyde, Department of Biophysics, Medical College ofWisconsin, 8701 Watertown Plank Road, Milwaukee, WI 53226. E-mail:[email protected] 27 April 2004; revised 21 June 2004; accepted 23 June 2004.DOI 10.1002/mrm.20265Published online in Wiley InterScience (www.interscience.wiley.com).
Magnetic Resonance in Medicine 52:1060–1068 (2004)
© 2004 Wiley-Liss, Inc. 1060
ally suited for studying the limit of functional resolutionin fMRI.
In the present study, we mapped neuronal activityacross cortical layers of the whisker barrel cortex using thec-Fos immunochemistry technique, in parallel with high-resolution BOLD and CBV fMRI experiments. Fos is theprotein product of the immediate early gene (IEG) c-Fos.This gene and its protein product Fos have been exten-sively used as markers to trace neuroanatomical connec-tions as well as for metabolic mapping (13–16). It is as-sumed that, for an “ideal” mapping of neuronal activityusing fMRI methods, the distribution of fMRI response andFos expression across cortical layers should have similarpatterns.
Even if it were true that activated regions are small andwell localized to neuronal activity, it does not follow thatexisting fMRI methods are adequate with respect to stim-ulus methods, CNR, and spatial resolution to test the hy-pothesis. Here we used hardware and software advancesthat were recently developed in this laboratory. The keyaspects of this technology are as follows: 1) half k-spacemultishot echo-planar imaging (EPI), which was used in amanner that permitted optimization of the trade-off be-tween temporal and spatial resolution. This pulse se-quence improves the point-spread function (psf) (17,18)and therefore permits higher resolution. 2) An efficientgradient coil and tailored high-sensitivity RF coils weredesigned and constructed (19) and 3) a computer-con-trolled piezoelectric whisker stimulator (20) was devel-oped for reliable somatosensory activation. High-resolu-tion BOLD and CBV fMRI experiments were carried out at3T. Results suggest that CBV fMRI can break the resolutionbarrier imposed by the venous unit; laminar-specific CBVresponse was detected and the laminar distribution of theCBV response correlated well with neuronal activity local-ized by Fos expression. Preliminary accounts of this workwere described in Refs. 21 and 22.
METHODS
Animal Preparation
Nineteen rats were employed in this study (BOLD only,n � 5; CBV only, n � 5; BOLD and CBV, n � 2; Fos only,n � 6; BOLD and Fos, n � 1). The animal preparationprotocol was adapted from Ref. 23 and was reported in Ref.18. Briefly, male Sprague-Dawley rats weighing 250–350 gwere anesthetized with 1–2% (v/v) isoflurane (isofluranevaporizer, Model 100F, Ohio Medical Products, Madison,WI, USA) in a 1:1 mixture of O2:air during surgery. Theright femoral artery and vein were cannulated for bloodpressure monitoring and blood gas measurements as wellas drug delivery. Rats were artificially ventilated with aHarvard Rodent Ventilator (Model 683, Harvard Appara-tus, South Natick, MA, USA). The tidal volume and fre-quency of the ventilator were adjusted to keep blood gaseswithin the normal range. Arterial blood pressure was con-tinuously monitored. Rectal temperature was maintainedat 37 � 0.5°C by a temperature-controlled water-heatingpad. The rat head was fixed with a homemade bite bar andear bars to minimize motion artifacts during the fMRIexperiments. A neuromuscular blocking agent (gallamine
triethiodide, 250 mg/kg i.v.) was used during the fMRIexperiment to further minimize motion artifacts. After sur-gery, the anesthesia was switched from isoflurane to 5%�-chloralose in propylene glycol with an initial dose of50 mg/kg followed by 40 mg/kg/hr. All animal protocolswere approved by the Laboratory Animal Safety Commit-tee of the Medical College of Wisconsin.
fMRI Experimental Setup
All fMRI experiments were carried out on a Bruker Bio-spec 30/60 3T scanner (Bruker Medizintechnik, Karlsruhe,Germany) equipped with a water-cooled torque-balancedlocal gradient coil. This gradient coil was designed using amomentum-weighted conjugate gradient descent algo-rithm (19). It has an inner diameter of 12.8 cm with anefficiency of 2.13, 2.08, and 4.12 mT/m/A along X, Y, andZ, respectively, and is driven at 96-�s rise time. A saddle-type RF excitation coil of 9 cm I.D. and 10 cm in lengthwas used together with a single-turn surface coil with anI.D. of 1.5 cm for reception. Isolation of the surface coilfrom the RF excitation coil was achieved by geometricaldecoupling combined with passive decoupling using PINdiodes. An interleaved partial-k-space echo-planar imag-ing sequence with the phase corrected by phase-encodedreference scans (18) was used.
A homemade computer-controlled whisker stimulatorwas used in this study (20). Briefly, the stimulus waveformof the desired frequency and duration was generated by alaptop computer, power-amplified, and used to drive apiezoelectric device. A small comb (1.5 cm in length,0.8 cm in height, 12 teeth) was connected to the piezoelec-tric device through an actuator arm (0.75 m in length). Thebackward/forward displacement of the comb was about2.5 mm, and the distance between the rat face and thecomb was about 1 cm. Before putting the rat into themagnet, the whiskers on the left side were cut completely,whereas the whiskers on the right side were cut to a lengthof about 3 cm so that only the long whiskers on the rightside were stimulated. No dynamic susceptibility artifactsinduced by whisker-stimulator motion were observed inthis study.
Scanning Method
Slice localization to the whisker barrel cortex was deter-mined as follows: medial-sagittal anatomic images wereacquired using a regular gradient-echo sequence [repeti-tion time (TR) 500 ms, echo time (TE) 18 ms, field of view(FOV) 3.5 � 3.5 cm2, 4 averages]. The interface betweenthe hard and soft palates was identified from the anatomicimages and was chosen as the reference, which corre-sponds approximately to interaural 11.2 mm according tothe stereotaxic coordinates of the rat brain (24). Threecontiguous coronal slices (2-mm thick) with the centerslice at 6.5 mm caudal to the reference cover the whisker-barrel region.
For the BOLD fMRI experiment, the stimulus paradigmwas a block design consisting of four cycles of 64 s off and32 s on. Scan parameters were as follows: FOV � 2 cm,matrix size � 128 � 128, TE � 24 ms, data acquisitionbandwidth � 166 kHz, slice thickness � 2.0 mm, two
Spatial Correlations of Laminar BOLD and CBV Responses 1061
interleaves with an effective TR of 2 s (1 s per shot),in-plane resolution � 156 � 156 �m2 (voxel volume:0.0487 �L). For each rat, the experiment was repeatedthree times and averaged to improve the signal-to-noiseratio (SNR).
For the CBV fMRI experiments, MION was injected at adose of 12 mg/kg. CBV fMRI experiments were initiated15 min after the injection to allow the blood-MION con-centration to reach a steady state. The stimulus paradigmwas a block design consisting of four cycles of 80 s off and64 s on. A single coronal slice was centered within thewhisker barrel cortex with a slice thickness of 2 mm. TheFOV � 2 � 2 cm2 and the matrix size was either 96 � 96or 128 � 128. Images were reconstructed to 128 � 128,resulting in a nominal voxel size of 156 � 156 � 2000 �m3.The slice orientation was such that each needle-shapedvoxel intersected several barrels and was in a definedneuronal layer. The stimulus frequency was fixed at 12 Hzfor both the BOLD and the CBV fMRI experiments. Previ-ous studies indicated that this frequency results in thehighest fMRI signal using this stimulus setup (25). TheCBV fMRI experiments were repeated three times; datawere averaged to improve SNR. The total time for theentire experiment was typically about 2 hr. We used dif-ferent on- and off-period paradigms for the BOLD and CBVfMRI experiments. This was based on the fact that, com-pared with BOLD response, CBV response takes longer toreach a plateau with the onset of stimulus and longer toreturn to baseline with the cessation of stimulus (8). How-ever, because the on and off periods were fairly long inboth experiments, this should not influence the quantifi-cation of the BOLD and CBV responses.
BOLD Data Analysis
Activation maps were generated by cross-correlating pixeltime courses with a time-shifted boxcar function (26). A Pvalue of 0.01 was typically chosen as the threshold. Allpixels in the barrel cortex with a P value less than thethreshold were considered “activated.” The activatedpixel time courses were split into four windows based onthe on/off periods of the stimulus. For each activatedpixel, a single BOLD response curve was generated byaveraging across the four windows. Pixelwise BOLD-per-centage signal changes were calculated by (s1–b0)/b0 �100, where s1 represents the averaged fMRI signal duringthe plateau period and b0 is the baseline signal.
CBV Data Analysis
Cross-Correlation Analysis
For each study, the CBV-response time course was com-pared with the scan paradigm initially using the cross-correlation method. The boxcar reference waveform wastime-shifted by 8 s to allow for the CBV hemodynamicresponse delay. In CBV fMRI, the MR signal decreases withthe onset of the stimulus and gradually returns to baselineafter cessation of the stimulus. As a result, the CBV re-sponse curves are negatively correlated with the boxcarwaveform. All pixels in the whisker barrel cortex regionwith correlation-coefficient values less than �0.25, corre-sponding to P � 0.005, were considered “activated.” In
this study, on average for each rat there were 79 � 9(mean � SD) pixels in the barrel-cortex regions that passedthe threshold. The time courses of the “activated” pixelswere averaged to synthesize a reference vector. It wasassumed that this reference vector had appropriate delayand width of the hemodynamic response. Activation mapswere created by cross-correlating this reference waveformwith each time course. A cross-correlation coefficient(CCC) of 0.25 was chosen, and all pixels with CCC greaterthan the threshold were considered activated. This processwas carried out using the AFNI software package (27).
Quantifications of CBV Response
Previous studies have shown that if an intravascular su-per-paramagnetic contrast agent reaches steady-state con-centrations, the change in the transverse relaxation rate(�R2*) relative to the preinjection baseline can be ex-pressed as �R2* � kV, where V is the blood volume and kdepends on local vascular geometry and contrast-agentdosage (6,8). Keeping the echo time the same for pre- andpostcontrast experiments, and assuming monoexponentialsignal decay and negligible competing BOLD signalchanges, the percentage of CBV signal changes in a pixelduring functional challenge can be calculated by:
% CBV �lnSt/Spost
lnSpost/Spre� 100, [1]
where Spre and Spost represent pre- and post-MION base-line signal intensities, respectively, and S(t) is the dy-namic signal change during whisker stimulation. Spre andSpost were obtained by averaging 15 baseline images beforeand after contrast-agent injection, respectively. S(t) wasestimated as follows: first, each time course was split intofour windows, each window starting immediately follow-ing the onset of stimulus. Second, the baseline signal wasestimated by least-squares fitting of a quadratic function oftime to the fMRI data, excluding those time points con-tained within the four windows. Third, the CBV responsesignal was obtained by subtracting the estimated baselinefrom the fMRI data. The CBV response signal was averagedover the four windows to improve the signal-to-noise ratio.Percentage-CBV changes were calculated using Eq. [1], andmean percentage-CBV changes were obtained by averaging16 data points (from the 5th to the 20th points followingthe onset of stimulus). These calculations were performedon a pixelwise basis in the AFNI software package (27).
It is noted that the transverse-relaxation-rate changesdue to MION injection (�R2*) can be calculated by thefollowing:
�R2* � lnSpost/Spre/TE, [2]
which reflects baseline CBV values (8). To account forinteranimal variations, �R2* values were normalized towhite matter (28), and relative CBV (rCBV) maps werecreated. The white matter in the cingulum and corpuscallosum appears dark in the rCBV maps and can bereadily identified (24).
1062 Lu et al.
Fos Immunohistochemistry Experiment
Seven rats (five for test and two for control) were used inthis study. The unstimulated side in the test rats served asa self-control. One test rat for the Fos expression experi-ment was processed immediately after the BOLD experi-ment, the other four test rats were stimulated in separateexperiments using the same stimulator setup. The stimu-lus paradigm was 60 s off and 60 s on for 2 hr. Afterwhisker stimulus, the rats were subsequently perfusedwith 200 mL 0.9% saline under deep anesthesia, and fixedwith 200 mL of 4% paraformaldehyde. Brains wereblocked and incubated with 30% sucrose in 0.1 M phos-phate buffer for 48 hr and sectioned into 40-�m coronalsections using a cryostat.
Fos immunohistochemistry was performed as previ-ously described (16). Briefly, sections were washed threetimes in 0.05 M Tris-buffered saline (TBS), incubated in amethanolic peroxide bath containing 88% TBS, 10%MeOH, and 2% H202 (30% v/v solution) for 20 min, andthoroughly washed again in TBS. Sections were incubatedfor 20 min in TBS containing 4% goat serum and 0.2%Triton X-100, (TBS�) followed by an overnight room-temperature incubation in rabbit, anti-c-Fos antibody (On-cogene Labs, Cambridge, MA) at 1:5,000 made in TBS�.Sections were subsequently washed in TBS and incubatedin biotinylated goat antirabbit IgG (1:500) for 90 min,washed again in TBS, and developed with the Vector Elite
ABC kit (Vector Laboratories, Burlingame, CA) accordingto the manufacturer’s directions. Nickel-cobalt heavy-metal intensification was used to yield black nuclear reac-tion product upon development. For quantitative analysis,Fos-li cells were counted within a 2-mm wide corticalcolumn within the whisker barrel cortex from correspond-ing regions of the stimulated and unstimulated hemi-spheres. Data are presented as mean � SEM number ofFos-li cells in each cortical layer, with P � 0.01 consideredsignificant. No differences in Fos expression were ob-served comparing the four test rats that were stimulated inthe bench setup with the one that was stimulated duringBOLD fMRI.
RESULTS
Whisker Stimulation-Induced BOLD Response
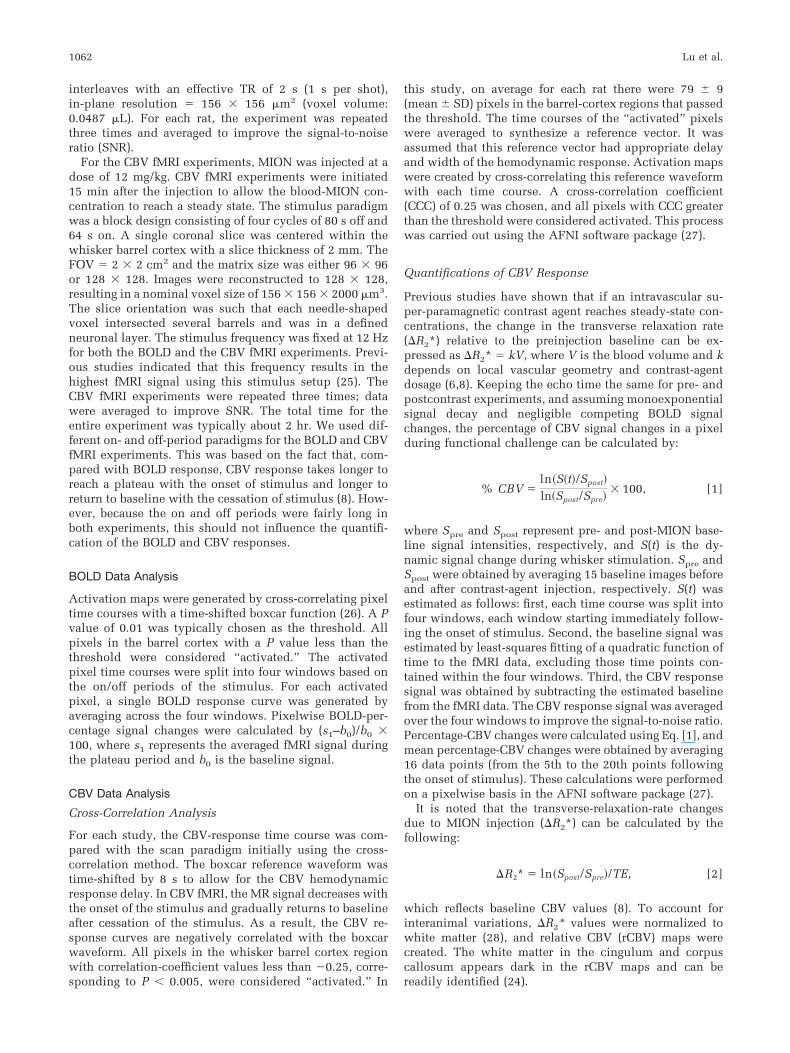
Figure 1 shows representative BOLD activation maps fromthree rats. Functional images were superimposed on thefirst EPI images in the time series. In each case, the BOLDresponses appear to be within gray matter. In Figs. 1a andb, the pixels that showed high BOLD responses (yellowpixels) were located on the surface as well as in deeplayers. A pial vein may be present in Fig. 1a. In Fig. 1c,however, the yellow pixels were primarily clustered in thedeep cortical layers. Of the eight rats we scanned, two ratshad high BOLD responses in the deep cortical layers and
FIG. 1. High-resolution cross-correlation BOLD activation maps in the whisker barrel cortex from three rats. The activation maps aresuperimposed on pre-MION EPI anatomic images. a,b: The pixels with high correlation-coefficients (yellow) are clustered on the surface andextend to the deep cortical layers. However, those pixels are primarily clustered in deep cortical layers in c.
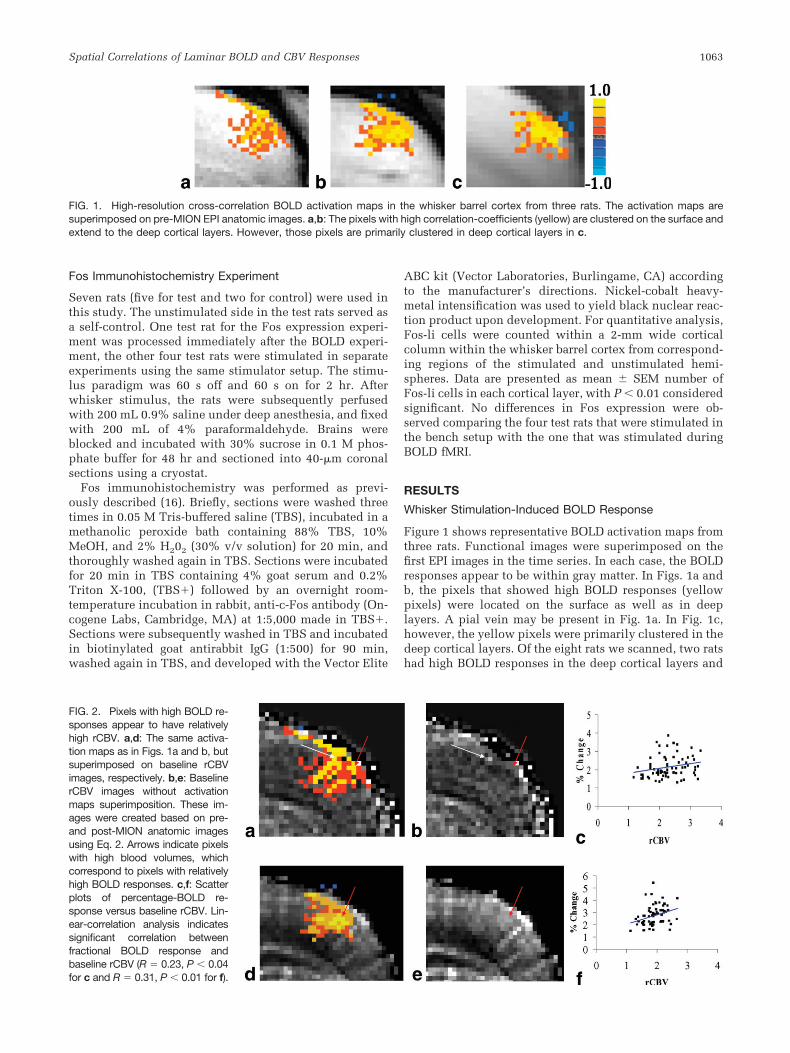
FIG. 2. Pixels with high BOLD re-sponses appear to have relativelyhigh rCBV. a,d: The same activa-tion maps as in Figs. 1a and b, butsuperimposed on baseline rCBVimages, respectively. b,e: BaselinerCBV images without activationmaps superimposition. These im-ages were created based on pre-and post-MION anatomic imagesusing Eq. 2. Arrows indicate pixelswith high blood volumes, whichcorrespond to pixels with relativelyhigh BOLD responses. c,f: Scatterplots of percentage-BOLD re-sponse versus baseline rCBV. Lin-ear-correlation analysis indicatessignificant correlation betweenfractional BOLD response andbaseline rCBV (R � 0.23, P � 0.04for c and R � 0.31, P � 0.01 for f).
Spatial Correlations of Laminar BOLD and CBV Responses 1063
the other six rats had high BOLD response both on thesurface and in deep cortical layers. In addition, the clusterpatterns of the “hot spots” (yellow pixels) change from ratto rat, as shown in Figs. 1a–c.
To investigate the vascular characteristics of the pixelswith high BOLD signals, five rats received the contrastagent MION. Figures 2a and 2d are the same BOLD acti-vation maps as Figs. 1a and b but are superimposed onbaseline rCBV images. These rCBV images (Figs. 2b and e)were created based on pre- and post-MION anatomic im-ages using Eq. [2]. Arrows indicate pixels that exhibitsignificant BOLD activations. The white arrow in Fig. 2aindicates a line of yellow pixels that runs across corticallayers radially, which coincides with a line of pixels withrelatively high baseline rCBV values, as indicated by thewhite arrow in Fig. 2b.
To explore the relationship between BOLD response andbaseline rCBV, particularly the pixels with relatively highBOLD response, the threshold was chosen at P � 0.001.Pixelwise BOLD-signal changes and baseline rCBV valueswere calculated using Eq. [2]. Scatter plots of percentage-BOLD response versus rCBV values are shown in Figs. 2cand 2f. We have performed correlation analysis betweenpercentage-BOLD changes (y) and rCBV (x). This was doneby fitting y and x with a straight line using a least-squaresapproach. P values and correlation values (R) were calcu-lated for each data set. Results were as follows: y � 0.26x� 1.56 for Fig. 2c (R � 0.23, P � 0.04) and y � 0.76x � 1.29for Fig. 2f (R � 0.31, P � 0.01). These results indicate thatsignificant correlation exists between fractional BOLD re-sponse and baseline rCBV. There are some pixels withhigh rCBV values, but low BOLD responses; this may bedue to the fact that the CBV values we measured are totalCBV, which is the sum of the blood volumes from thearterial, venous, and the capillary sides. However, only thelatter two components contribute to the BOLD signal.
These data suggest that the magnitude of BOLD responseacquired using the GR-EPI sequence at 3 T is weighted byblood volume and that the distribution of BOLD response
across cortical layers is dependent on the distribution ofthe blood-volume weightings, which is determined by thelocal vasculature.
Whisker Stimulation-Induced CBV Response Detected byfMRI
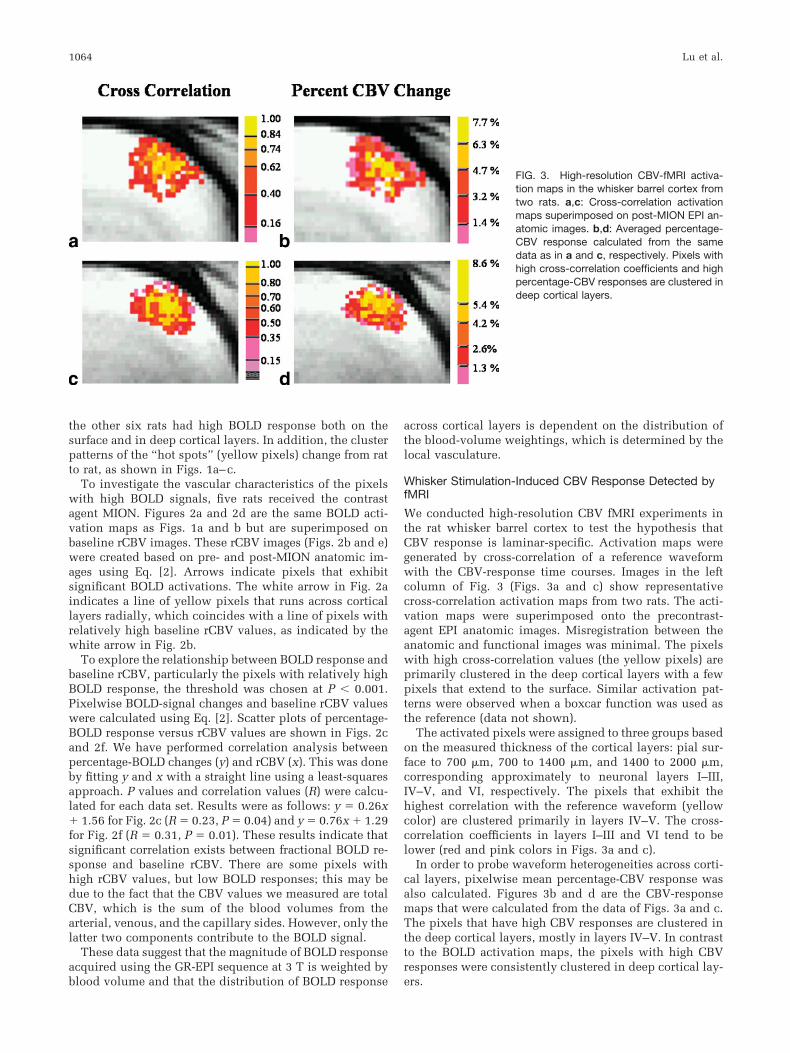
We conducted high-resolution CBV fMRI experiments inthe rat whisker barrel cortex to test the hypothesis thatCBV response is laminar-specific. Activation maps weregenerated by cross-correlation of a reference waveformwith the CBV-response time courses. Images in the leftcolumn of Fig. 3 (Figs. 3a and c) show representativecross-correlation activation maps from two rats. The acti-vation maps were superimposed onto the precontrast-agent EPI anatomic images. Misregistration between theanatomic and functional images was minimal. The pixelswith high cross-correlation values (the yellow pixels) areprimarily clustered in the deep cortical layers with a fewpixels that extend to the surface. Similar activation pat-terns were observed when a boxcar function was used asthe reference (data not shown).
The activated pixels were assigned to three groups basedon the measured thickness of the cortical layers: pial sur-face to 700 �m, 700 to 1400 �m, and 1400 to 2000 �m,corresponding approximately to neuronal layers I–III,IV–V, and VI, respectively. The pixels that exhibit thehighest correlation with the reference waveform (yellowcolor) are clustered primarily in layers IV–V. The cross-correlation coefficients in layers I–III and VI tend to belower (red and pink colors in Figs. 3a and c).
In order to probe waveform heterogeneities across corti-cal layers, pixelwise mean percentage-CBV response wasalso calculated. Figures 3b and d are the CBV-responsemaps that were calculated from the data of Figs. 3a and c.The pixels that have high CBV responses are clustered inthe deep cortical layers, mostly in layers IV–V. In contrastto the BOLD activation maps, the pixels with high CBVresponses were consistently clustered in deep cortical lay-ers.
FIG. 3. High-resolution CBV-fMRI activa-tion maps in the whisker barrel cortex fromtwo rats. a,c: Cross-correlation activationmaps superimposed on post-MION EPI an-atomic images. b,d: Averaged percentage-CBV response calculated from the samedata as in a and c, respectively. Pixels withhigh cross-correlation coefficients and highpercentage-CBV responses are clustered indeep cortical layers.
1064 Lu et al.
Percentage-CBV changes from each group for the sevenrats were averaged. Mean CBV changes in cortical layersI–III, IV–V, and VI were 4.1 � 0.9%, 7.3 � 1.5%, and 4.3 �0.7% (mean � SEM), respectively, with a ratio of about1:2:1. A two-tailed paired t-test was performed to comparethe percentage-CBV responses across cortical layers. Theresults are summarized in Fig. 6a (vide infra). In this study,the second group (layers IV–V) had significantly higherpercentage-CBV changes than Group 1 (layers I–III, P �0.01) or Group 3 (layer VI, P � 0.02). The difference be-tween Group 1 and Group 3 was not significant (P � 0.05).
The CBV fMRI data indicate that both the shape of theCBV-activated regions (cross-correlation maps, Figs. 3aand c) and percentage-CBV changes (Figs. 3b and d) ex-hibit laminar specificity.
Whisker Stimulation-Induced Cortical Fos Expression
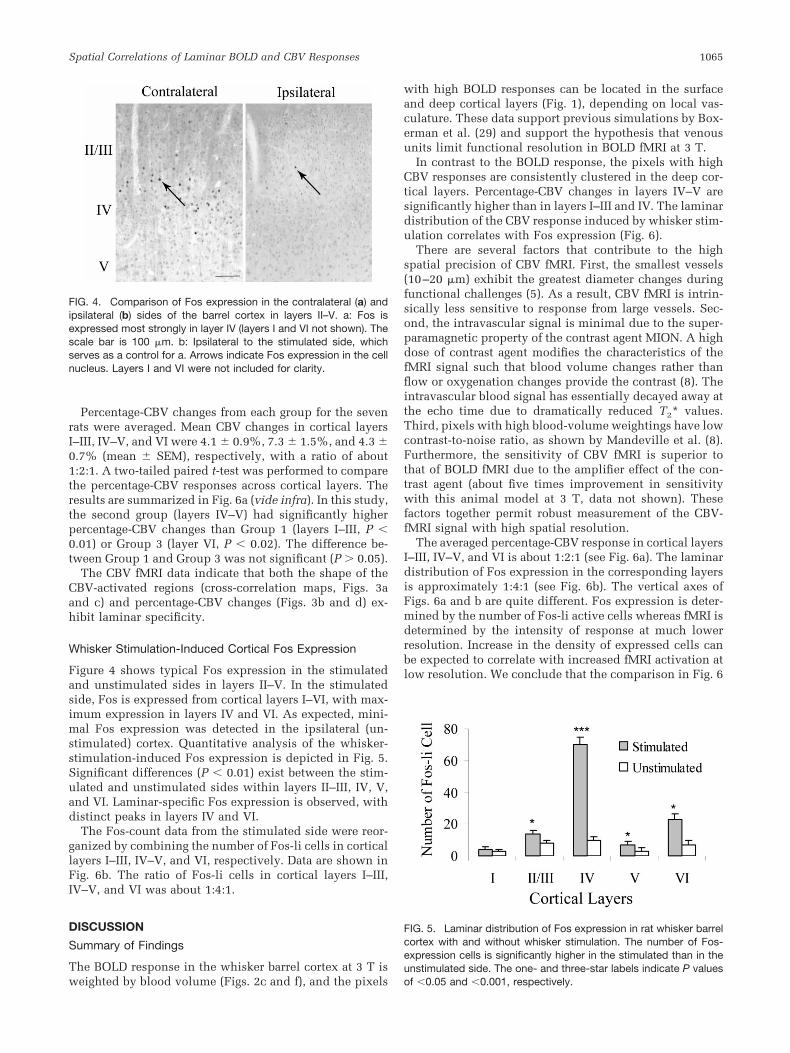
Figure 4 shows typical Fos expression in the stimulatedand unstimulated sides in layers II–V. In the stimulatedside, Fos is expressed from cortical layers I–VI, with max-imum expression in layers IV and VI. As expected, mini-mal Fos expression was detected in the ipsilateral (un-stimulated) cortex. Quantitative analysis of the whisker-stimulation-induced Fos expression is depicted in Fig. 5.Significant differences (P � 0.01) exist between the stim-ulated and unstimulated sides within layers II–III, IV, V,and VI. Laminar-specific Fos expression is observed, withdistinct peaks in layers IV and VI.
The Fos-count data from the stimulated side were reor-ganized by combining the number of Fos-li cells in corticallayers I–III, IV–V, and VI, respectively. Data are shown inFig. 6b. The ratio of Fos-li cells in cortical layers I–III,IV–V, and VI was about 1:4:1.
DISCUSSION
Summary of Findings
The BOLD response in the whisker barrel cortex at 3 T isweighted by blood volume (Figs. 2c and f), and the pixels
with high BOLD responses can be located in the surfaceand deep cortical layers (Fig. 1), depending on local vas-culature. These data support previous simulations by Box-erman et al. (29) and support the hypothesis that venousunits limit functional resolution in BOLD fMRI at 3 T.
In contrast to the BOLD response, the pixels with highCBV responses are consistently clustered in the deep cor-tical layers. Percentage-CBV changes in layers IV–V aresignificantly higher than in layers I–III and IV. The laminardistribution of the CBV response induced by whisker stim-ulation correlates with Fos expression (Fig. 6).
There are several factors that contribute to the highspatial precision of CBV fMRI. First, the smallest vessels(10–20 �m) exhibit the greatest diameter changes duringfunctional challenges (5). As a result, CBV fMRI is intrin-sically less sensitive to response from large vessels. Sec-ond, the intravascular signal is minimal due to the super-paramagnetic property of the contrast agent MION. A highdose of contrast agent modifies the characteristics of thefMRI signal such that blood volume changes rather thanflow or oxygenation changes provide the contrast (8). Theintravascular blood signal has essentially decayed away atthe echo time due to dramatically reduced T2* values.Third, pixels with high blood-volume weightings have lowcontrast-to-noise ratio, as shown by Mandeville et al. (8).Furthermore, the sensitivity of CBV fMRI is superior tothat of BOLD fMRI due to the amplifier effect of the con-trast agent (about five times improvement in sensitivitywith this animal model at 3 T, data not shown). Thesefactors together permit robust measurement of the CBV-fMRI signal with high spatial resolution.
The averaged percentage-CBV response in cortical layersI–III, IV–V, and VI is about 1:2:1 (see Fig. 6a). The laminardistribution of Fos expression in the corresponding layersis approximately 1:4:1 (see Fig. 6b). The vertical axes ofFigs. 6a and b are quite different. Fos expression is deter-mined by the number of Fos-li active cells whereas fMRI isdetermined by the intensity of response at much lowerresolution. Increase in the density of expressed cells canbe expected to correlate with increased fMRI activation atlow resolution. We conclude that the comparison in Fig. 6
FIG. 4. Comparison of Fos expression in the contralateral (a) andipsilateral (b) sides of the barrel cortex in layers II–V. a: Fos isexpressed most strongly in layer IV (layers I and VI not shown). Thescale bar is 100 �m. b: Ipsilateral to the stimulated side, whichserves as a control for a. Arrows indicate Fos expression in the cellnucleus. Layers I and VI were not included for clarity.
FIG. 5. Laminar distribution of Fos expression in rat whisker barrelcortex with and without whisker stimulation. The number of Fos-expression cells is significantly higher in the stimulated than in theunstimulated side. The one- and three-star labels indicate P valuesof �0.05 and �0.001, respectively.
Spatial Correlations of Laminar BOLD and CBV Responses 1065
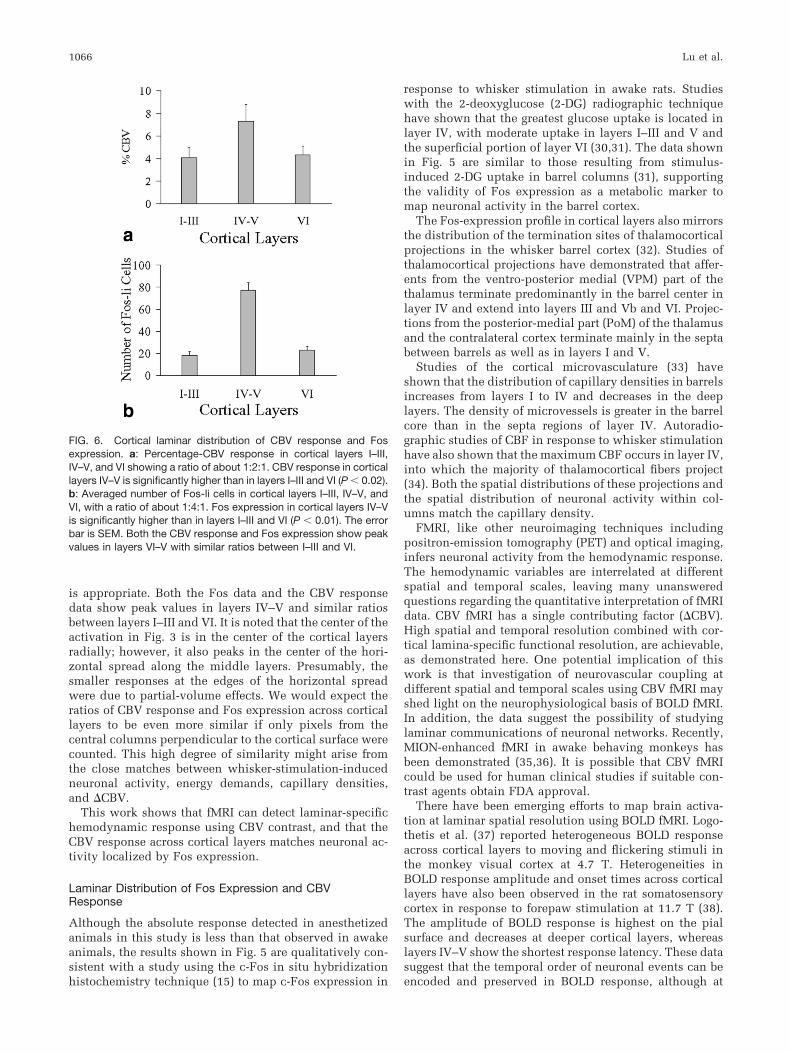
is appropriate. Both the Fos data and the CBV responsedata show peak values in layers IV–V and similar ratiosbetween layers I–III and VI. It is noted that the center of theactivation in Fig. 3 is in the center of the cortical layersradially; however, it also peaks in the center of the hori-zontal spread along the middle layers. Presumably, thesmaller responses at the edges of the horizontal spreadwere due to partial-volume effects. We would expect theratios of CBV response and Fos expression across corticallayers to be even more similar if only pixels from thecentral columns perpendicular to the cortical surface werecounted. This high degree of similarity might arise fromthe close matches between whisker-stimulation-inducedneuronal activity, energy demands, capillary densities,and �CBV.
This work shows that fMRI can detect laminar-specifichemodynamic response using CBV contrast, and that theCBV response across cortical layers matches neuronal ac-tivity localized by Fos expression.
Laminar Distribution of Fos Expression and CBVResponse
Although the absolute response detected in anesthetizedanimals in this study is less than that observed in awakeanimals, the results shown in Fig. 5 are qualitatively con-sistent with a study using the c-Fos in situ hybridizationhistochemistry technique (15) to map c-Fos expression in
response to whisker stimulation in awake rats. Studieswith the 2-deoxyglucose (2-DG) radiographic techniquehave shown that the greatest glucose uptake is located inlayer IV, with moderate uptake in layers I–III and V andthe superficial portion of layer VI (30,31). The data shownin Fig. 5 are similar to those resulting from stimulus-induced 2-DG uptake in barrel columns (31), supportingthe validity of Fos expression as a metabolic marker tomap neuronal activity in the barrel cortex.
The Fos-expression profile in cortical layers also mirrorsthe distribution of the termination sites of thalamocorticalprojections in the whisker barrel cortex (32). Studies ofthalamocortical projections have demonstrated that affer-ents from the ventro-posterior medial (VPM) part of thethalamus terminate predominantly in the barrel center inlayer IV and extend into layers III and Vb and VI. Projec-tions from the posterior-medial part (PoM) of the thalamusand the contralateral cortex terminate mainly in the septabetween barrels as well as in layers I and V.
Studies of the cortical microvasculature (33) haveshown that the distribution of capillary densities in barrelsincreases from layers I to IV and decreases in the deeplayers. The density of microvessels is greater in the barrelcore than in the septa regions of layer IV. Autoradio-graphic studies of CBF in response to whisker stimulationhave also shown that the maximum CBF occurs in layer IV,into which the majority of thalamocortical fibers project(34). Both the spatial distributions of these projections andthe spatial distribution of neuronal activity within col-umns match the capillary density.
FMRI, like other neuroimaging techniques includingpositron-emission tomography (PET) and optical imaging,infers neuronal activity from the hemodynamic response.The hemodynamic variables are interrelated at differentspatial and temporal scales, leaving many unansweredquestions regarding the quantitative interpretation of fMRIdata. CBV fMRI has a single contributing factor (�CBV).High spatial and temporal resolution combined with cor-tical lamina-specific functional resolution, are achievable,as demonstrated here. One potential implication of thiswork is that investigation of neurovascular coupling atdifferent spatial and temporal scales using CBV fMRI mayshed light on the neurophysiological basis of BOLD fMRI.In addition, the data suggest the possibility of studyinglaminar communications of neuronal networks. Recently,MION-enhanced fMRI in awake behaving monkeys hasbeen demonstrated (35,36). It is possible that CBV fMRIcould be used for human clinical studies if suitable con-trast agents obtain FDA approval.
There have been emerging efforts to map brain activa-tion at laminar spatial resolution using BOLD fMRI. Logo-thetis et al. (37) reported heterogeneous BOLD responseacross cortical layers to moving and flickering stimuli inthe monkey visual cortex at 4.7 T. Heterogeneities inBOLD response amplitude and onset times across corticallayers have also been observed in the rat somatosensorycortex in response to forepaw stimulation at 11.7 T (38).The amplitude of BOLD response is highest on the pialsurface and decreases at deeper cortical layers, whereaslayers IV–V show the shortest response latency. These datasuggest that the temporal order of neuronal events can beencoded and preserved in BOLD response, although at
FIG. 6. Cortical laminar distribution of CBV response and Fosexpression. a: Percentage-CBV response in cortical layers I–III,IV–V, and VI showing a ratio of about 1:2:1. CBV response in corticallayers IV–V is significantly higher than in layers I–III and VI (P � 0.02).b: Averaged number of Fos-li cells in cortical layers I–III, IV–V, andVI, with a ratio of about 1:4:1. Fos expression in cortical layers IV–Vis significantly higher than in layers I–III and VI (P � 0.01). The errorbar is SEM. Both the CBV response and Fos expression show peakvalues in layers VI–V with similar ratios between I–III and VI.
1066 Lu et al.
different temporal scales (39). It is noted that these exper-iments were performed using gradient-echo sequences,which are known to be sensitive to BOLD effects from largevenous vessels that run across cortical layers, even atultrahigh field strength. The BOLD effects from the largevenous vessels are expected to combine with effects frommicrovessels, which can be expected to compromise thespatial precision of fMRI (37). The CBV response, in con-trast, is intrinsically insensitive to vascular response fromlarge vessels. In fact, we detected no or very low CBVresponse in voxels with high blood-volume weightingsthroughout the cortical layers (data not shown here).
Technical Considerations
In the Fos-expression experiments, we used a stimulusperiod of 2 hr because maximum Fos-protein expressionoccurs 1 to 2 hr after stimulation (40). Our fMRI experi-ments also take about 2 hr. However, Fos expression re-flects the integral of excitatory-stimulation-inducedpostsynaptic neuronal activity over the entire stimulusperiod, whereas CBV fMRI reflects acute vascular response(CBV changes) during each run of the stimulus (about10 min). Induction of Fos also reflects the spatial integra-tion of postsynaptic activity over the entire dendritic arborof the neurons of interest. Thus, the spatial localization ofneuronal activity per se (i.e., energy-dependent membranerepolarization) extends beyond the area of Fos-protein ex-pression. Despite these differences, these two methodsgenerated similar patterns across cortical layers in the ratwhisker barrel cortex.
The ratio of Fos-li neurons in cortical layers IV–V rela-tive to layers I–III and VI is about twice that of the CBVresponse, which may be due to several factors. Because ofSNR concerns, we used a slice thickness of 2 mm, whichcovers most of the barrel columns of five rows. Overlap ofneighboring cortical layers can be expected due to thearc-shaped organization of the barrel columns. Further-more, the nominal in-plane resolution was 156 �m, whichapproximately matches the thickness of the cortical layers.However, the true resolution may be lower due to blurringarising from T2* decay. Spatial heterogeneity of T2* decayarising from local variability of tissue magnetic suscepti-bility is complex and poorly understood. Another possibleexplanation for the observed differences seen in Fig. 6 isthat differences in capillary densities along cortical col-umns (33) are not as sharp as the differences in Fos ex-pression seen in Fig. 4. Because CBV-weighted fMRI relieson the vascular response in small vessels, anatomic differ-ences in capillary densities between cortical layers mightimpose an upper limit of functional resolution in fMRIusing CBV contrast. Another possible factor is BOLD con-tamination in CBV-weighted fMRI. BOLD responses ac-quired with gradient-echo sequences are sensitive to allsizes of vessels, which would compromise the functionalspecificity. However, because we used an iron dose of12 mg/kg, BOLD contributions were estimated to have verylittle influence on the CBV-fMRI signal.
CBV-weighted fMRI using an exogenous contrast agentrelies on the susceptibility properties of the agent, and thesusceptibility effect is field dependent. Our data showthat, at an iron dose of 12 mg/kg, laminar specificity of the
CBV response can be achieved in this animal model at 3 T.Increasing the iron dose would shift the sensitivity tosmaller vessels. However, iron doses that are too highwould compromise the SNR. A recent high-resolutionCBV-fMRI study in the cat visual cortex at 4.7 T (41)reported high CBV response in cortical layers II–IV. It ispossible that different doses are required to achieve corti-cal-laminar specificity at different fields in different spe-cies of animals. CBV fMRI using an intravascular contrastagent is of particular benefit at intermediate and low fieldsbecause of amplification of functional signals and suppres-sion of signals from intravascular blood.
ACKNOWLEDGMENTS
This work was supported by Grants EB002014, EB000215,and F30DA15575 from the National Institutes of Healthand by an Independent Investigator Award to C.J. Hillardfrom the National Alliance for Research on Schizophreniaand Depression (NARSAD).
REFERENCES
1. Malonek D, Grinvald A. Interaction between electrical activity andcortical microcirculation revealed by imaging spectroscopy: implica-tions for functional brain mapping. Science 1996;272:551–554.
2. Kim DS, Duong TQ, Kim SG. High resolution imaging of iso-orientationcolumns using fMRI. Nat Neurosci 2003;3:164–169.
3. Menon RS, Goodyear BG. Submillimeter functional localization in hu-man striate cortex using BOLD contrast at 4 tesla: implications for thevascular point-spread function. Magn Reson Med 1999;41:230–235.
4. Duvernoy HM, Delon S, Vannson JL. Cortical blood vessels of thehuman brain. Brain Res 1981;7:519–579.
5. Lee SP, Duong TQ, Yang G, Iadecola C, Kim SG. Relative changes ofcerebral arterial and venous blood volumes during increased cerebralblood flow: implications for BOLD fMRI. Magn Reson Med 2001;45:791–800.
6. Belliveau JW, Kennedy DN, McKinstry RC, Buchbinder BR, WeiskoffRM, Cohen MS, Vevea JM, Brady TJ, Rosen BR. Functional mapping ofthe human visual cortex by magnetic resonance imaging. Science 1991;254:716–719.
7. Mandeville J, Moore J, Chesler D, Carrido L, Weissleder R, Weisskoff R.Dynamic liver imaging with iron oxide agents: effects of size andbiodistribution on contrast. Magn Reson Med 1997;37:885–890.
8. Mandeville JB, Marota JJA, Kosofsky BE, Keltner JR, Weissleder R,Rosen BR, Weisskoff RM. Dynamic functional imaging of relative cere-bral blood volume during rat forepaw stimulation. Magn Reson Med1998;39:615–624.
9. Woolsey TA, Van DLH. The structural organization of layer IV in thesomatosensory region SI of mouse cerebral cortex. Brain Res 1970;17:205–242.
10. Welker C. Microelectrode delineation of fine grain somatotopic organi-zation of SmI cerebral neocortex in albino rat. Brain Res 1971;26:259–275.
11. Simons DJ. Response properties of vibrissa units in rat SI somatosen-sory neocortex. J Neurophysiol 1978;41:798–820.
12. Cox SB, Woolsey TA, Rovainen CM. Localized dynamic changes incortical blood flow with whisker stimulation corresponds to matchedvascular and neuronal architecture of rat barrels. J Cereb Blood FlowMetab 1993;13:899–913.
13. Morgan JI, Curran T. Role of ion influx in the control of c-fos expres-sion. Nature 1986;322:552–555.
14. Sagar SM, Sharp FR, Curran T. Expression of c-fos protein in brain:metabolic mapping at the cellular level. Science 1988;240:1328–1331.
15. Melzer P, Steiner H. Stimulus-dependent expression of immediate-early genes in rat somatosensory cortex. J Comp Neurol 1997;380:145–153.
16. Patel S, Hillard CJ. Cannabinoid-induced Fos expression within A10dopaminergic neurons. Brain Res 2003;963:15–25.
Spatial Correlations of Laminar BOLD and CBV Responses 1067
17. Hyde JS, Biswal BB, Jesmanowicz A. High-resolution fMRI using mul-tislice partial k-space GR-EPI with cubic voxels. Magn Reson Med2001;46:114–125.
18. Lu H, Mazaheri Y, Zhang R, Jesmanowicz A, Hyde JS. Multishot partialk-space EPI for high-resolution fMRI demonstrated in a rat whisker-barrel stimulation model at 3T. Magn Reson Med 2003;50:1215–1222.
19. Lu H, Jesmanowicz A, Li SJ, Hyde JS. Momentum-weighted conjugategradient descent algorithm for gradient coil optimization. Magn ResonMed 2003;51:158–164.
20. Gerrits RJ, Stein EA, Greene AS. Laser-Doppler flowmetry utilizing athinner skull cranial window preparation and automated stimulation.Brain Res Brain Res Protoc 1998;3:14–21.
21. Lu H, Luo F, Li SJ, Hyde JS. Rat brain vasculature in BOLD activatedvoxels at ultra-high resolution using MION. In: Proc 11th AnnualMeeting, ISMRM, 2003, Toronto. p 217.
22. Lu H, Patel S, Luo F, Xu G, Li SJ, Hillard C, Hyde JS. Spatial correlationof BOLD fMRI and neuronal activation localized by Fos expression. In:Proc 11th Annual Meeting, ISMRM, 2003, Toronto. p 357.
23. Hyder F, Behar KL, Martin MA, Shulman RG. Dynamic magnetic res-onance imaging of the rat brain during forepaw stimulation. J CerebBlood Flow Metab 1994;14:649–655.
24. Paxino G, Watson C. The rat brain in stereotaxic coordinates. AcademicPress, San Diego, 1998.
25. Lu H, Luo F, Kostenko T, Xu G, Prieto T, Li S-J, Hyde JS. BOLDresponse under graded stimulus frequency in a rat whisker barrelstimulation (WBS) model. In: Proc 11th Annual Meeting, ISMRM,2003, Toronto. p 1850.
26. Bandettini PA, Jesmanowicz A, Wong EC, Hyde JS. Processing strate-gies for time-course data sets in functional MRI of the human brain.Magn Reson Med 1993;30:161–173.
27. Cox RW, Hyde JS. Software tools for analysis and visualization of FMRIdata. NMR Biomed 1997;10:171–178.
28. Lin W, Celik A, Pacznski PP. Regional cerebral blood volume: a com-parison of the dynamic imaging and the steady state methods. J MagnReson Imag 1999;9:44–52.
29. Boxerman JL, Hamberg LM, Rosen BR, Weisskoff RM. MR contrast dueto intravascular magnetic susceptibility perturbations. Magn ResonMed 1995;34:555–566.
30. Durham D, Woolsey TA. Barrels and columnar cortical organization:evidence from 2-deoxyglucose (2-DG) experiments. Brain Res 1977;137:168–174.
31. Chmielowska J, Kossut M, Chmielowski M. Single vibrissal corticalcolumn in the mouse labeled with 2-deoxyglucose. Exp Brain Res1986;63:607–619.
32. White EL. Thalamocortical synaptic relations: a review with emphasison the projections of specific thalamic nuclei to the primary sensoryareas of the neocortex. Brain Res 1979;180:275–311.
33. Patel U. Non-random distribution of blood vessels in the posteriorregion of the rat somatosensory cortex. Brain Res 1983;289:65–70.
34. Gerrits RJ, Raczynski C, Green AS, Stein EA. Regional cerebral bloodflow response to variable frequency whisker stimulation: an autoradio-graphic analysis. Brain Res 2000;864:205–212.
35. Vanduffel W, Fize D, Mandeville JB, Nelissen K, Van Hecke P, RosenBR, Tootell RB, Orban GA. Visual motion processing investigated usingcontrast agent-enhanced fMRI in awake behaving monkeys. Neuron2001;32:565–577.
36. Leite FP, Tsao D, Vanduffel W, Fize D, Sasaki Y, Wald LL, Dale AM,Kwong KK, Orban GA, Rosen BR, Tootell RB, Mandeville JB. RepeatedfMRI using iron oxide contrast agent in awake, behaving macaques at 3tesla. NeuroImage 2002;16:283–294.
37. Logothetis NK, Merkle H, Augath M, Trinath T, Ugurbil K. Ultra high-resolution fMRI in monkeys with implanted RF coils. Neuron 2002;45:227–242.
38. Silva AC, Koretsky AP. Laminar specificity of functional MRI onsettimes during somatosensory stimulation in rat. Proc Natl Acad Sci USA2002;99:15182–15187.
39. Armstrong-James M, Fox K, Das-Gupta A. Flow of excitation within ratbarrel cortex on striking a single vibrissa. J Neurophysiol 1992;68:1345–1358.
40. Sharp FR, Sagar SM, Swanson RA. Metabolic mapping with cellularresolution: c-fos vs. 2-Deoxyglucose. Crit Rev Neurobiol 1993;7:205–228.
41. Harel N, Zhao F, Wang P, Kim S-G. Cortical layer specificity of BOLDand CBV fMRI signals at ultra-high resolution. In: Proc 10th AnnualMeeting, ISMRM, 2002, Honolulu. p 9.
1068 Lu et al.
Copyright © 2022 FDOKUMEN