
Spatial and temporal variation in the relative contribution of density dependence, climate variation...
13
Journal of Animal Ecology 2009, 78, 447–459 doi: 10.1111/j.1365-2656.2008.01488.x © 2008 The Authors. Journal compilation © 2008 British Ecological Society Blackwell Publishing Ltd Spatial and temporal variation in the relative contribution of density dependence, climate variation and migration to fluctuations in the size of great tit populations Vidar Grøtan 1, *, Bernt-Erik Sæther 1 , Steinar Engen 2 , Johan H. van Balen 3 , Albert C. Perdeck 3 and Marcel E. Visser 3 1 Centre for Conservation Biology, Department of Biology, Norwegian University of Science and Technology, NO-7491 Trondheim, Norway; 2 Centre for Conservation Biology, Department of Mathematical Sciences, Norwegian University of Science and Technology, NO-7491 Trondheim, Norway; and 3 Netherlands Institute of Ecology (NIOO-KNAW), P.O. Box 40, NL-6666 ZG Heteren, The Netherlands Summary 1. The aim of the present study is to model the stochastic variation in the size of five populations of great tit Parus major in the Netherlands, using a combination of individual-based demographic data and time series of population fluctuations. We will examine relative contribution of density-dependent effects, and variation in climate and winter food on local dynamics as well as on number of immigrants. 2. Annual changes in population size were strongly affected by temporal variation in number of recruits produced locally as well as by the number of immigrants. The number of individuals recruited from one breeding season to the next was mainly determined by the population size in year t, the beech crop index (BCI) in year t and the temperature during March–April in year t. The number of immigrating females in year t + 1 was also explained by the number of females present in the population in year t, the BCI in autumn year t and the temperature during April–May in year t. 3. By comparing predictions of the population model with the recorded number of females, the simultaneous modelling of local recruitment and immigration explained a large proportion of the annual variation in recorded population growth rates. 4. Environmental stochasticity especially caused by spring temperature and BCI did in general contribute more to annual fluctuations in population size than density-dependent effects. Similar effects of climate on local recruitment and immigration also caused covariation in temporal fluctu- ations of immigration and local production of recruits. 5. The effects of various variables in explaining fluctuations in population size were not inde- pendent, and the combined effect of the variables were generally non-additive. Thus, the effects of variables causing fluctuations in population size should not be considered separately because the total effect will be influenced by covariances among the explanatory variables. 6. Our results show that fluctuations in the environment affect local recruitment as well as annual fluctuations in the number of immigrants. This effect of environment on the interchange of individuals among populations is important for predicting effects of global climate change on the pattern of population fluctuations. Key-words: demographic stochasticity, density regulation, dispersal, environmental stochasticity, stochastic population dynamics Journal of Animal Ecology(2007) >doi: 10.1111/j.1365-2656.2007.0@@@@.x Introduction A recurrent theme in population ecology has been how density- dependent processes interact with stochastic variation in the environment to cause fluctuations in population size (Andrewartha & Birch 1954; Lack 1966; Turchin 1995). This problem has recently received increased attention because we need to understand how the expected changes in climate will affect population fluctuations. The necessary decomposition of the population dynamics into density-dependent and density-independent components requires that the effects of environmental variation must be estimated and modelled and that other factors that affect population fluctuations, such as the form of density regulation and demographic stochasticity, *Correspondence author. E-mail: [email protected]
-
Upload
independent -
Category
Documents
-
view
6 -
download
0
Transcript of Spatial and temporal variation in the relative contribution of density dependence, climate variation...

Journal of Animal Ecology
2009,
78
, 447–459 doi: 10.1111/j.1365-2656.2008.01488.x
© 2008 The Authors. Journal compilation © 2008 British Ecological Society
Blackwell Publishing Ltd
Spatial and temporal variation in the relative contribution
of density dependence, climate variation and migration
to fluctuations in the size of great tit populations
Vidar Grøtan
1,
*, Bernt-Erik Sæther
1
, Steinar Engen
2
, Johan H. van Balen
3
, Albert C. Perdeck
3
and Marcel E. Visser
3
1
Centre for Conservation Biology, Department of Biology, Norwegian University of Science and Technology, NO-7491 Trondheim, Norway;
2
Centre for Conservation Biology, Department of Mathematical Sciences, Norwegian University of Science and Technology, NO-7491 Trondheim, Norway; and
3
Netherlands Institute of Ecology (NIOO-KNAW),
P.O. Box 40, NL-6666 ZG Heteren, The Netherlands
Summary
1.
The aim of the present study is to model the stochastic variation in the size of five populations ofgreat tit
Parus major
in the Netherlands, using a combination of individual-based demographic dataand time series of population fluctuations. We will examine relative contribution of density-dependenteffects, and variation in climate and winter food on local dynamics as well as on number of immigrants.
2.
Annual changes in population size were strongly affected by temporal variation in number ofrecruits produced locally as well as by the number of immigrants. The number of individualsrecruited from one breeding season to the next was mainly determined by the population size in year
t
, the beech crop index (BCI) in year
t
and the temperature during March–April in year
t
. Thenumber of immigrating females in year
t
+ 1 was also explained by the number of females presentin the population in year
t
, the BCI in autumn year
t
and the temperature during April–May in year
t
.
3.
By comparing predictions of the population model with the recorded number of females, thesimultaneous modelling of local recruitment and immigration explained a large proportion of theannual variation in recorded population growth rates.
4.
Environmental stochasticity especially caused by spring temperature and BCI did in generalcontribute more to annual fluctuations in population size than density-dependent effects. Similareffects of climate on local recruitment and immigration also caused covariation in temporal fluctu-ations of immigration and local production of recruits.
5.
The effects of various variables in explaining fluctuations in population size were not inde-pendent, and the combined effect of the variables were generally non-additive. Thus, the effects ofvariables causing fluctuations in population size should not be considered separately because the totaleffect will be influenced by covariances among the explanatory variables.
6.
Our results show that fluctuations in the environment affect local recruitment as well as annualfluctuations in the number of immigrants. This effect of environment on the interchange of individualsamong populations is important for predicting effects of global climate change on the pattern ofpopulation fluctuations.
Key-words:
demographic stochasticity, density regulation, dispersal, environmental stochasticity,stochastic population dynamics
Journal of Animal Ecology
(2007) >doi: 10.1111/j.1365-2656.2007.0@@@@.x
Introduction
A recurrent theme in population ecology has been how density-dependent processes interact with stochastic variation in theenvironment to cause fluctuations in population size(Andrewartha & Birch 1954; Lack 1966; Turchin 1995). This
problem has recently received increased attention because weneed to understand how the expected changes in climate willaffect population fluctuations. The necessary decompositionof the population dynamics into density-dependent anddensity-independent components requires that the effects ofenvironmental variation must be estimated and modelled andthat other factors that affect population fluctuations, such asthe form of density regulation and demographic stochasticity,
*Correspondence author. E-mail: [email protected]

448
V. Grøtan
et al.
© 2008 The Authors. Journal compilation © 2008 British Ecological Society,
Journal of Animal Ecology
,
78
, 447–459
are properly accounted for. Furthermore, immigration amongpopulations that are separated in space will also influencelocal population dynamics. Theoretical studies have demon-strated that immigration of individuals will strongly affect thepopulation dynamical responses to temporal variation in theenvironment and may in turn affect the spatial autocorrela-tions in population fluctuations (Kendall
et al
. 2000; Engen,Lande & Sæther 2002a,b; Ranta, Lundberg & Kaitala 2006).Thus, accounting for density dependence and immigrations isa prerequisite for reliable modelling of global climate changeon avian population dynamics.
Two important theoretical advances over the past decadeshave considerably improved our basic understanding of fac-tors affecting the patterns in natural population fluctuations.One important advancement was provided by May’s (1976)analyses of simple deterministic population models that showedthat small variation in critical parameters could stronglyaffect dynamical characteristics of the populations. In parti-cular, varying the form and strength of density regulation canchange the system from stable fluctuations around an equi-librium into a chaotic behaviour (May 1976; Royama 1992).The other important advancement was provided by the devel-opment of stochastic population models (May 1973; Turelli1977) that also included environmental stochasticity, that is,random variation that affects the whole or parts of the popula-tion (Lande, Engen & Sæther 2003), and later demographicstochasticity (Engen, Bakke & Islam 1998), that is, randomvariation among individuals in their fitness contributions(Lande
et al
. 2003). This provided an analytical frameworkfor decomposing population fluctuations into deterministicand stochastic components. Such a partitioning is importantwhen assessing the impact of changes in environmental con-ditions on fluctuations in population size. As a consequence,during the last decade of the previous century, a large numberof studies (e.g. Bjørnstad, Falck & Stenseth 1995; e.g. Turchin1990) of temporal variation in population fluctuations appearedthat were based on statistical time-series analyses techniques.
In studies of population dynamics of natural populations,the geographical origin of new recruits is often ignoredbecause this requires that a large proportion of the nestlingsare individually marked and breeding birds identified. Thelack of such data makes it impossible to distinguish therelative contribution of local recruitment and immigrationto changes in population size. This can seriously restrict ourability to assess the importance of the various processesunderlying population dynamics. For instance, theoreticalanalyses (Engen
et al
. 2002a,b) and empirical evidence indi-cate that migration can strongly affect density regulationprocesses (Ives
et al
. 2004) and viability of small populations(Arcese & Marr 2006). Thus, a proper understanding of reg-ulatory processes in populations requires that the effects ofboth local recruitment and immigration on the annual fluctu-ations in population size are accounted for.
Small passerines, and especially the great tit
Parus major
L.,are model species for studies of vertebrate population dynamicsthat have provided several classical papers in populationecology (Lack 1947; Perrins 1965) that still relate directly to
contemporary ecological questions. One of the most impor-tant contributions from these studies was Lack’s (1947, 1954,1966) suggestions that annual changes in population size weredetermined by a combination of stochastic factors affectingthe production of nestlings, as well as density-dependenteffects operating through losses of birds during the non-breeding season. It is now generally realized that populationfluctuations in small passerines are strongly influencedby density-dependent effects (McCleery & Perrins 1985;Lebreton 1990; McCallum, Kikkawa & Catterall 2000; Smith
et al
. 2006), as well as environmental stochasticity, often relatedto random variation in weather (Perrins 1965a; Slagsvold1975; Arcese
et al
. 1992; Sæther
et al
. 2000b, 2002a; Sæther,Sutherland & Engen 2004b). In European tits, variation in beechmast represents also an important environmental influenceon the population dynamics (Perdeck, Visser & van Balen 2000).
Here we will use an approach that allows us to partitionpopulation fluctuations into their deterministic and stochas-tic components by developing a stochastic demographicmodel for analysing long-term fluctuations in the size of fivegreat tit
Parus major
populations in Netherlands (Table 1).We separate variation in local recruitment and immigrationinto components due to density dependence, environmentalstochasticity and demographic stochasticity (e.g. Engen
et al
.2005). This enables us to examine how different environ-mental covariates affect local recruitment as well as immigration.This approach allows us also to evaluate whether the effects ofenvironmental covariates shows nonlinear relationship topopulation size (Grenfell
et al
. 1998; Stenseth
et al
. 2004),causing non-additive effects on the population fluctuations(Coulson
et al
. 2001). The proportion of the variance in theannual fluctuations in population size explained by the modelcan then be decomposed into contributions from densitydependence and environmental variables. In this way, we canmodel how demographic effects of different variables trans-late into changes in population size due to local recruitmentand immigration.
Study areas and field methods
Data were collected (1955–2003) at four different forestedlocalities in the Netherlands (Table 1): Vlieland (VL), HogeVeluwe (HV), Oosterhout (OH) and Liesbos (LB). Thesestudy sites were chosen along two axes: mature oak vs. mixedwoodland and isolated vs. part of a larger area (Table 1). VLis an island in the Dutch Waddensea, and consists of mixedpine–deciduous woodland. HV (HV1) included mixed conif-erous–deciduous woodland and a large block of pure pineplantation until 1972. A severe storm damaged the pine plan-tation in the winter of 1972/73, and from 1973, the studyincluded only mixed coniferous–deciduous woodland (HV2).Thus, we treated HV1 and HV2 as two independent popula-tions. Mature oaks dominate in OH, an isolated forest, andLB. For more details, see Table 1, van Balen & Potting (1990)and Verhulst & van Eck (1995).
The average number of breeding birds per hectare was highin the oak woods and low in the mixed woodlands. Throughout

Population dynamics of great tits
449
© 2008 The Authors. Journal compilation © 2008 British Ecological Society,
Journal of Animal Ecology
,
78
, 447–459
the study period, the population size increased in VL,HV1 and OH. This increase in population size in HV1 and VLwas probably caused by maturation of the forest. Selectivefelling of conifers on VL also took place (Kluijver 1971),thereby increasing the proportion of deciduous trees. In OH,the population growth is probably partly due to an increasein the number of nest boxes. In all areas there was a largesurplus of nest boxes as the number of females relative to thenumber of nest boxes was 0·41(0·26,0·67), 0·33(0·15,0·51),0·43(0·19,0·79), 0·23(0·09,0·43) and 0·34(0·11,0·59)[mean(min,max)] in areas HV1, HV2, LB, OH and VL,respectively. The study areas remained the same size through-out the years included in the study.
The great tit data were collected during the period 1955–2003 (see Table 1 for details). In all areas, nest boxes were vis-ited at least once every week. The number of females presentin an area in a given year was defined as the number of firstclutches. The number of eggs or young present was counted.When the nestlings were 7–10 days old, the parents were caughton the nest using a spring trap. Parents already ringed wereidentified and unringed birds were given a metal ring with aunique number. Young were ringed either at day 7 (HV, OH,LB) or day 10–15 (VL). As all fledglings from nest boxes wereringed and very few birds bred in natural cavities, we classifiedall adults caught unringed or ringed outside the study area asimmigrants. If the number of caught females were lower thanthe number of first clutches, the number of immigrant femalesand local females (including surviving adults and locally pro-duced recruits) were calculated by multiplying the proportionof the respective categories with the number of first clutches.We thus assume that there is no difference in the probability ofidentification of breeding birds that have immigrated to thearea and of local recruits/surviving adults. Note that birds areonly classified as immigrants in the year of their arrival. Forthe subsequent year(s), they are classified as local birds.
We excluded years if large-scale experiments were carriedout that affected parental survival (breeding birds wereremoved), recruitment probability (removal of second broods
or an overall reduction of brood size), or the number of fledg-lings produced (overall reduction of brood size). For someyears in LB and OH, parents were not identified, and theseyear/area combinations were therefore not included in themodel of individual fitness contributions (Table 1).
Population model
Writing
N
t
for the population size at time
t
, we have
N
t
+1
=
Λ
t
N
t
+
I
t
+1
, where
I
t
+ 1
is the number of immigrants inyear
t
+ 1 and
Λ
t
is the stochastic multiplication rate of thepopulation in absence of migration. In general, the bivariatedistribution of (
Λ
t
,
I
t
+1
) will depend on
N
t
as well as anobserved vector of covariates. The mean and the variance ofthe population size the next year is then
eqn 1a
and
eqn 1b
respectively.We model the local recruitment by considering annual
variation in the contribution to the next generation by afemale, that is, the number of female offspring she givesbirth to during this year that survive for at least 1 year, plus 1if the female herself survives to the next year (Sæther
et al
.1998). Considering the emigrants as dead individuals, we get
where
w
i
is the contribution offemale
i
in year
t
.Let
Z
denote the vector of environmental covariates. Weassume that (
Λ
t
N
t
|
Z
) is approximately Poisson distributed(see Appendix S1) with parameter
λ
N
t
, where
λ
= E(
w
|
Z
,
N
t
).The parameter
λ
is density dependent, characterized by thestrength of density dependence
γ
, as well as linear functions ofdifferent environmental covariates
Z
i
,
Table 1. Characteristics of the five study populations. The size of the areas, and the number of boxes that are put up varied between years. TheHoge Veluwe area was damaged in a severe storm in the winter 1972/73. HV1 included a large block of pure pine plantation, while HV2 consist onlyof mixed coniferous–deciduous woodland. For ‘No. of years included in selection’, I represents the modelling of local recruitment, II is the modellingof immigration, and III is the prediction of number of females. The selection criteria for including years are described in the Methods section
AreaCoordinates(long./lat.) Period
No. of Years incl. in selection Area
size (ha)
Median no. of nestboxes (min–max)
Mean no. of females (min–max) Vegetation IsolationI II III
Hoge Veluwe (HV1) 52°23′N, 05°51′E
1955–72 16 14 290 222 (70–287) 86 (10–151) Mixed + pure pine Part of larger area
Hoge Veluwe (HV2) 52°23′N, 05°51′E
1973–2003 30 30 29 170 376 (309–439) 125 (56–189) Mixed woodland Part of larger area
Liesbos (LB) 51°35′N, 04°41′E
1955–2003 37 39 48 18 97 (63–103) 39 (18–62) Mature oak wood Part of larger area
Oosterhout (OH) 51°52′N, 05°50′E
1956–2003 38 35 40 11 130 (12–147) 27 (4–56) Mature oak wood Isolated woodland
Vlieland (VL) 53°17′N, 05°03′E
1955–96 32 37 300 250 (86–401) 90 (7–195) Mixed woodland Island
E E E( | ) ( | ) ( | )N N N N I Nt t t t t t t+ += +1 1Λ
var( | ) var(( ) | ) var( | ) var( | ) cov(( , ) | ),
N N N I N N NI N N I N
t t t t t t t t t
t t t t t t
+ +
+ +
= + =+ +
1 1
1 12Λ Λ
Λ
Λt N tw w w N ( ... )/ ,= + + +1 2

450
V. Grøtan
et al.
© 2008 The Authors. Journal compilation © 2008 British Ecological Society,
Journal of Animal Ecology
,
78
, 447–459
eqn 2
where the time index has been omitted for simplicity. Here,
ε
denotes the residual environmental variance not accountedfor by any of the specified environmental covariates
Z
i
. Weassume, following Lebreton (1990), a logistic model (May1981) of density regulation. It is shown in the Appendix S2how the variance of
Λ
can be partitioned into a demographicand environmental component.
eqn 3
We further show in Appendix S2 that
eqn 4
and
eqn 5
where ββββ
is the vector of effect sizes of environmental covariates
Z
on the change in population size. Thus, the environmentalvariance in the local recruitment is decomposed into acomponent due to contribution from specific environmentalcovariates Z as well as a component from residual, unobservedvariation in the environment
U
(see Appendix S2). We alsosee that in this model, both become densitydependent.
Our next step was to model the immigration process. Veryfew birds have been observed breeding in natural cavities (seeMethods). Thus, the number of nest boxes
b
was consideredto represent an upper limit of the number of possible immi-grants. We assume that the number of female immigrants
I
tothe population is determined by the number of availableboxes (because
b
in all areas is always larger than
N
) and fol-lows a beta-binominal distribution with probability density,
eqn 6
where B(
α
1
,
α
2
) denotes the beta function with parameters
α
1
and
α2. The variable I can take values from 0 to b, and itsdistribution shows overdispersion relative to the binomialdistribution. The overdispersion parameter is defined asφ = 1/( α1 + α2 + 1). We assume that (α1 + α2) is constant,whereas α1/α2 fluctuates among years due to their dependenceon Z, U and N (see Appendix S2).
Following the same approach as when decomposingthe variance in local recruitment, the variance in thenumber of immigrants var(I) has a component E var(I | Z,U, N) due to demographic stochasticity and a componentvar E(I | Z, U, N) due to environmental stochasticity so that(see Appendix S2)
eqn 7
In Appendix S2, we give the precise expressions showing how depend on Z, U and N.
The final term in the population model (equation 1) is thecovariance between the local dynamics and the immigrationcov(NΛ, I ), which also can be partitioned into a demographiccomponent E cov(NΛ, I | Z, U, N), and an environmentalcomponent cov(E(NΛ, I | Z, U, N), E(I | Z, U, N ) of thecovariance (for details of this partitioning, see Appendix S2).
We will now use this model to examine how variation in climateand density dependence affects local recruitment and immigration.
EXPLANATORY VARIABLES
To examine extrinsic influences on the population fluctu-ations, we included environmental covariates that are knownto affect the demography of the dynamics of great tit popu-lations. Beech mast is an important source of food for greattits, especially during winter when other resources are scarce(Betts 1955; Ulfstrand 1962). It is also indicative of seed pro-duction of other tree species (Perdeck et al. 2000). There is nocontinuous series of beech-crop data for the whole studyperiod. For the years 1955–76, a beech-crop index (BCI) isavailable that was collected on a 10-point scale throughoutthe Netherlands, whereas for 1976–2003, we have measure-ments on nuts per square metre for the Hoge Veluwe studyarea. As these indices cannot be mixed, Perdeck et al. (2000)defined a three-level index to combine the series, which we willalso use here. The relationship between the index and theamount of food supply could be far from linear, so weincluded BCI as a factor in the models.
Winter weather is an important determinant of mortalityand hence changes in population size in tits (Kluijver (1951),Gibb (1960), Perrins (1965), van Balen (1980) and Tinbergen,van Balen & van Eck (1985). We characterized winterseverity by the monthly mean temperatures of the monthsDecember, January, February and March from the De Biltmeteorological station of the Royal Netherlands Meteorolo-gical Institute (KNMI), which is situated in the centre of theNetherlands. Spring temperature determines the date of peakcaterpillar biomass (Visser, Holleman & Gienapp 2006),and although great tits are phenotypically plastic in theirreproduction, laying earlier in warm springs (van Balen 1973;Nussey et al. 2005), there are regional differences with respectto phenological changes as a response of the recent climatechange (Visser et al. 1998, 2003), causing a mistimed reproduc-tion in relation to the food peak (Visser, Both & Lambrechts2004). Thus, temperatures during spring (February toMay) the year of breeding was therefore included as candidateexplanatory variables. All temperature variables were testedsingly, and as 2, 3, and 4 monthly averages.
ESTIMATION OF PARAMETERS
The yearly estimates of demographic stochasticity in the localdynamics were calculated according to Sæther et al. (2000a).
We modelled individual fitness w using the function glm (RDevelopment Core Team 2007) with a Poisson error distribution
λγ β β ε
,=∑+ + +
=eN Zi
i
n
i01
var( ) ( ) ( ).Λ = +1 2 2
NN Nd eσ σ
σ σγ ε γεd
N NN e e e e2 2112
( ) ,= ≈ +⎛⎝⎜
⎞⎠⎟
+E Eββ ββZ Z
σ σ σγε εe
NN e e e2 2 2 2 21( ) [ ( ) var( )],≈ + +E ββ ββZ Z
σ σd e2 2 and
P II b I
( ) ( , )
( , ),=
+ −BB
α αα α
1 2
1 2
σdI2
σeI2
var( ) var( | , , ) var ( | , , )
.
I I N I N
b beI dI
= += +
E EZ U Z U
σ σ2 2 2
σ σdI eI2 2 and

Population dynamics of great tits 451
© 2008 The Authors. Journal compilation © 2008 British Ecological Society, Journal of Animal Ecology, 78, 447–459
(see Appendix S1) and a log-link function. Candidate explan-atory variables entered were area, number of females, BCIand one temperature variable. We also allowed the possibilityfor interaction between area and the other explanatory vari-ables. The environmental variance was calculated as
eqn 8
The parameters in the model describing the number of femaleimmigrants in year t + 1 was estimated by the beta-binominalgeneralized linear model implemented in function betabin inpackage aod using a logit link function (Lesnott & Lancelot2005). Area, number of females in year t, BCI in year t andone temperature variable were used as candidate explanatoryvariables. In addition, possible interactions between the areaand the other explanatory variables were also included duringmodel selection. The overdispersion was also allowed to havean interaction with area.
Model selection was based on the Akaike informationcriterion (AIC) and corrected AIC (AICc) (Burnham &Anderson 1998) for local recruitment and immigration re-spectively. Modelling local recruitment was based on data from7604 breeding females, whereas immigration was modelledby analyses of 146 area × year combinations. The model setconsisted of all possible combinations of main effects of area,N, BCI and one temperature covariate. In addition, wealso tested models including combinations of interactionsbetween area and the other explanatory variables. All modelsranging from one single main effect (e.g. area) to a full modelincluding main effects of area, N, BCI and a temperaturecovariate and interactions area × N, area × BCI andarea × temperature covariate were therefore included in themodel set subject to selection by the information criterion.
All statistical analyses and simulations were performedusing r (R Development Core Team 2007).
POPULATION PREDICTIONS
Engen and colleagues (Engen, Sæther & Møller 2001; Sæther& Engen 2002a) have advocated the use of the conceptpopulation prediction interval (PPI) when making predic-tions about future population fluctuations. A PPI is defined asthe stochastic interval that includes the population size with afixed probability (1 − α). The advantage of this approach isthat the width of the PPI accounts for varying influences ofdemographic stochasticity with varying population sizesand uncertainties in parameter estimates. For instance, uncer-tainty in parameter estimates will over a given time perioddecrease the precision of population predictions (Sætheret al. 2000a; Engen et al. 2001; Sæther & Engen 2002a,b;Asbjørnsen et al. 2005).
Here, our goal is to study whether the population modelcould produce PPI’s that included the observed popula-tion sizes within a given coverage. This was examined bysimulating the stochastic population process defined by thepopulation model, the estimated parameters (Table 2) andmeasured environmental variables (temperature and BCI).If we denote the vector of parameter estimates as 0,uncertainty in parameter estimates was accounted for bysimulating sets of parameters from a multivariate normaldistribution with mean 0 and the estimation covariancematrix Vθθθθ (see Gelman & Hill 2007 for a similar approach).The sets of simulated parameter values were thereafterused when simulating the population sizes. Thus, thisapproach not only account for uncertainty in parameterestimates, but also for dependencies among parameters inuncertainty.
To simulate the first annual change in population sizes, weused the observed population sizes the first year in each studyarea, but at other time-steps, we substituted the observedpopulation sizes with the simulated population sizes. Simi-larly, the effects of environmental variables (temperature and
σ σe t t tt
T
d tTE N N2 2
1
211
[( ( )) / ].=−
− −=∑ w w
Table 2. Estimated parameters in the selected model for (a) local recruitment in year t (equation 2), and (b) number of immigrating females inyear t + 1 (equation 6). Model selection was based on the Akaike information criterion (AIC) and corrected AIC (AICc) for local recruitmentand immigration, respectively. In (a) γ is the effect of number of females in year t, βTemp is the effect of beech crop index (BCI) in autumn yeart, and βTemp is the effect of mean temperature during March–April in year t. In (b) δ is the effect of number of females in year t, ζBCI is the effectof BCI during autumn year t and, and ζTemp is the effect of mean temperature during April–May in year t. Different intercepts for each area wereincluded in both models, but the parameter estimates are omitted here. Both selected models for (a) and (b) included interaction effects betweenarea and the number of females (γ and δ) and between area and temperature. Confidence intervals (95%) are enclosed in brackets
a) Local recruitment
γ × HV1 γ × HV2 γ × LB γ × OH γ × VL βBCI=2 βBCI=3 βTemp×HV1 βTemp×HV2 βTemp×LB βTemp×OH βTemp×VL
–0·0015 [–0·0039, 0·0009]
–0·0102 [–0·0132, –0·0072]
–0·0188 [–0·0284, –0·0091]
0·0013 [–0·0065, 0·0092]
–0·0011 [–0·0038, 0·0016]
0·32 [0·25, 0·39]
0·41 [0·33, 0·50]
–0·22 [–0·29, –0·15]
–0·06 [–0·15, 0·02]
–0·10 [–0·20, 0·00]
–0·08 [–0·19, 0·02]
–0·01 [–0·10, 0·07]
b) Immigration
δ × HV1 δ × HV2 δ × LB δ × OH δ × VL ζBCI=2 ζBCI=3 ζTemp×HV1 ζTemp×HV2 ζTemp×LB ζTemp×LB ζTemp×VL
–0·0051 [–0·0100, –0·0001]
–0·0025 [–0·0086, 0·0035]
–0·0138 [–0·0250, –0·0027]
0·0042 [–0·0097, 0·0182]
0·0046 [–0·0012, 0·0104]
0·33 [0·2, 0·46]
0·44 [0·3, 0·59]
0·34 [0·13, 0·54]
0·01 [–0·21, 0·24]
0·10 [–0·12, 0·33]
0·17 [–0·08, 0·43]
0·14 [–0·11, 0·40]
452 V. Grøtan et al.
© 2008 The Authors. Journal compilation © 2008 British Ecological Society, Journal of Animal Ecology, 78, 447–459
BCI) were incorporated by calculating yearly effect sizesbased on observations of the environmental variables andparameter estimates.
We used two different approaches to evaluate the predictivepower of our model. First, we estimated parameters based onthe complete data set and calculated the PPI for all years withobservations. Second, we estimated the parameters based ondata before 1985 and simulated the stochastic fluctuationsin population sizes from 1985 and onwards. The predictionintervals were only constructed for the areas HV2, LB andOH, as the numbers of years with experimental manipula-tions in areas HV1 and VL were large.
CALCULATIONS OF RELATIVE CONTRIBUTIONS TO ANNUAL CHANGES IN POPULATION SIZE
Based on the fitted models (equations 1, 2, 6), we calculatedthe relative contributions from the explanatory variables tovariation in local recruitment and immigration. Generally,the contribution of a component θ1 varying with time wascalculated as
eqn 9
and the interaction between two components θ1 and θ2
was calculated as
eqn 10
Thus, a negative interaction indicates a positive covariationbetween the temporal effects of the components and the frac-tion of the explained variance that could be attributed to thecombined effect of the components is less than sum obtainedwhen calculating fractions separately.
Results
DEMOGRAPHIC VARIANCE
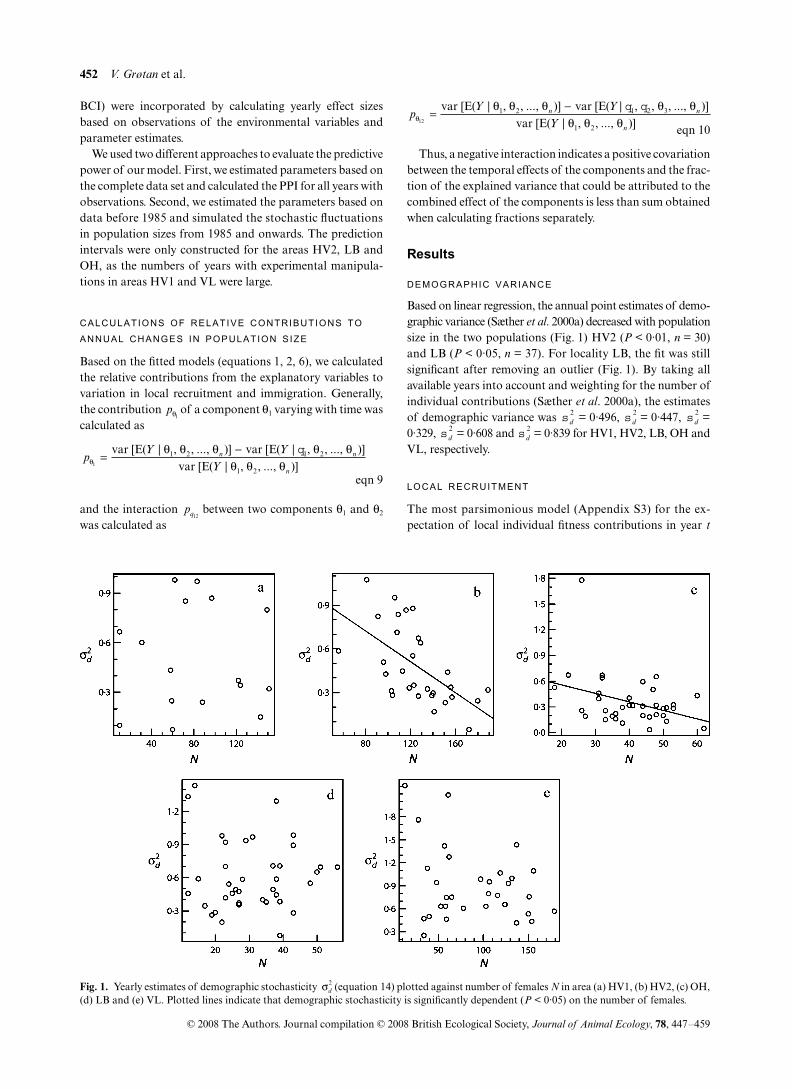
Based on linear regression, the annual point estimates of demo-graphic variance (Sæther et al. 2000a) decreased with populationsize in the two populations (Fig. 1) HV2 (P < 0·01, n = 30)and LB (P < 0·05, n = 37). For locality LB, the fit was stillsignificant after removing an outlier (Fig. 1). By taking allavailable years into account and weighting for the number ofindividual contributions (Sæther et al. 2000a), the estimatesof demographic variance was = 0·496, = 0·447, =0·329, = 0·608 and = 0·839 for HV1, HV2, LB, OH andVL, respectively.
LOCAL RECRUITMENT
The most parsimonious model (Appendix S3) for the ex-pectation of local individual fitness contributions in year t
Fig. 1. Yearly estimates of demographic stochasticity (equation 14) plotted against number of females N in area (a) HV1, (b) HV2, (c) OH,(d) LB and (e) VL. Plotted lines indicate that demographic stochasticity is significantly dependent (P < 0·05) on the number of females.
σd2
pθ1
pY Y
Yn n
nθ
θ θ θ θ θθ θ θ1
1 2 1 2
1 2
var [ ( | , , .., )] var [ ( | , , .., )]
var [ ( | , , .., )]=
−E . E .E .
q
pq12
pY Y
Yn n
nθ
θ θ θ θ θθ θ θ12
1 2 1 2 3
1 2
var [ ( | , , .., )] var [ ( | , , , .., )]
var [ ( | , , .., )]=
−E . E .E .
q q
sd2
sd2
sd2
sd2
sd2

Population dynamics of great tits 453
© 2008 The Authors. Journal compilation © 2008 British Ecological Society, Journal of Animal Ecology, 78, 447–459
(equations 2, 3) included the effect of number of females inyear t, BCI in the autumn of year t and mean temperatureduring March–April in year t, that is, few birds were recruitedafter years with high spring temperatures and after yearswith no beech crop (Table 2a). In addition, all areas haddifferent intercepts, and interactions with area were alsopresent between number of females and temperature (AppendixS3). In contrast, the positive effect of beech crop on localrecruitment did not differ among areas (likelihood-ratiotest, P > 0·1). Population size had a negative effect on localrecruitment in all areas except OH. The ratio of residual devi-ance to degrees of freedom was 0·94, indicating slightunderdispersion. The environmental variance in the localindividual fitness contributions (equation 8) were = 0·108,
= 0·048, = 0·038, = 0·051 and = 0·145 in HV1,HV2, LB, OH and VL, respectively.
Based on the fitted model, the largest contribution tovariation in local recruitment was in general provided by BCI(Table 3a). However, density explained the highest propor-tion of the annual variation in the localities HV2 and LB.Temperature during March–April had also a strong effect inlocalities HV1 and LB. In all areas except OH, the temporaleffects of the explanatory variables were correlated. Thus, thecombined effects of the explanatory variables were generallynot additive due to covariation among variables in the yearlyeffects on local recruitment (equation 10).
IMMIGRATION
The most parsimonious model explaining the number ofimmigrant females in year t + 1 was a model includingnumber of females in year t, BCI in the autumn of year t and
mean temperature during April–May in year t (Table 2b). Inaddition to separate intercepts for each area, interactionbetween area and number of females as well as interactionbetween area and temperature were included, but no inter-action between area and BCI. However, differences in AICcvalues indicate that support for the area × temperatureinteraction was weak (Appendix S3). A common overdisper-sion parameter among areas f = 0·0054 was included in themost parsimonious model.
The environmental factors affected the immigration in asimilar way in all areas. Immigration increased with meantemperature during April–May (Table 2b). As was the casefor local recruitment, high immigration rates were also foundfor BCI = 2 and BCI = 3. Accordingly, BCI was in generalimportant in explaining the variance in the number of immi-grants (Table 3b). In contrast, the density-dependent effecton immigration differed in sign among areas. The number ofimmigrants decreased with number of females in HV1, HV2and LB, whereas a positive density-dependent relationshipwas found in OH and VL. However, the effects of N and BCIwere not independent (Table 3b), because the temporal con-tributions from N and BCI to population growth rates werepositively correlated in HV1, HV2 and LB, and negativelycorrelated in OH and VL. The effect of temperature duringApril–May was large in HV1, OH and VL, but the effects oftemperature were in these localities correlated to the temporaleffects of BCI and N. Thus, as was the case for local recruit-ment, the effects of various variables in explaining fluctua-tions in population size were not independent, and thecombined effect of the variables were generally not additive.This illustrates that estimating effects of variables causingfluctuations in population size should not be carried out sep-arately because the total effect will be influenced by covari-ances among the explanatory variables.
RELATIVE IMPORTANCE OF LOCAL RECRUITMENT AND IMMIGRATION
Following the same approach as for separate models of localrecruitment and immigration, we estimated the contributionsfrom the local recruitment, immigration and the effects of theexplanatory environmental variables for both local recruit-ment and immigration. Both local recruitment and immigra-tion contributed to temporal variation in population growthrates. Local recruitment was more important than immigra-tion in areas HV2, OH and VL (OH and VL are isolatedwoods, see Table 1), whereas immigration was more impor-tant in area LB (Table 4). In area HV1, there were equal con-tributions from local recruitment and immigration. However,the effects of local recruitment and immigration were notadditive due to correlated effects of local recruitment andimmigration within years. The combined effect of BCI fromlocal recruitment and immigration was the most importantexplanatory variable in all areas except in VL where beechesare absent. Furthermore, there was a covariation betweenlocal recruitment and immigration in the temporal effects ofBCI (Table 4). However, in area VL, population size was the
Table 3. The proportion of explained variance in the model for (a)individual fitness contributions, and (b) number of immigratingfemales attributed to number of females (N), beech crop index (BCI),mean spring temperature (temp) during March–April for (a), andApril–May for (b), and all possible combinations of these variables(equation 13). In columns with combinations of variables, a negativevalue means that the calculated proportion of the variance explainedby these variables is less than the sum of variances explained byentering them separately, indicating that the temporal effects of thevariables are positively correlated
Area N BCI TempN BCI
N Temp
BCI Temp
N BCITemp
a) Local recruitmentHV1 0·16 0·53 0·76 –0·08 –0·10 –0·31 0·04HV2 0·76 0·32 0·07 –0·11 –0·03 0·03 –0·03LB 0·53 0·52 0·32 –0·18 –0·10 –0·12 0·02OH –0·04 0·80 0·11 0·02 0·02 0·08 0·00VL 0·20 0·92 0·08 –0·13 –0·03 –0·06 0·01b) ImmigrationHV1 0·35 0·44 0·50 –0·18 –0·11 –0·10 0·09HV2 0·25 0·89 0·03 –0·15 0·00 –0·02 0·00LB 0·40 0·62 0·23 –0·15 –0·04 –0·06 0·00OH 0·03 0·49 0·55 0·07 –0·06 –0·08 0·00VL 0·54 0·19 0·44 0·13 –0·26 –0·03 0·00
se2
se2
se2
se2
se2

454 V. Grøtan et al.
© 2008 The Authors. Journal compilation © 2008 British Ecological Society, Journal of Animal Ecology, 78, 447–459
explanatory variable explaining the largest proportion of thevariance in the model predictions.
PREDICTIONS OF POPULATION FLUCTUATIONS
As expected, the prediction intervals (Figs 2, 3) were gener-ally wide due to demographic stochasticity and parameteruncertainty causing large variation among simulated realiza-tions of the stochastic processes. However, effects of variationin environmental variables and density dependence are still soinfluential that there is large year-to-year variation in popu-lation sizes covered by the PPI. The observed processes did in
general fluctuate within the 95% intervals (Figs 2, 3). How-ever, the number of observations outside the 95% predictioninterval was larger than expected for area OH, possibly indi-cating that some important processes or effects of climate,especially during the 1970s (Fig. 2), were not accounted for inthe model for this area.
Discussion
Our analyses of the dynamics of the Dutch great tit popula-tions reveal that they are influenced by density-dependentfeedback mechanisms as well as stochastic variation in the
Table 4. The proportion of the explained variance in total population size attributed to the local recruitment and the immigration in the model(equation 1), the interaction effect of local recruitment and immigration, the proportion of the explained variance attributed to the explanatoryvariables N (number of females), BCI (beech crop index), and spring temperature (local recruitment: March–May; immigration: April–May)and the interactions between local recruitment and immigration for N, BCI and temperature (equation 13). Please note that the rows do not addup to 1 (100% of the explained variance) as interactions such as, for example, N (local recruitment) × BCI (immigration) are omitted
Area Local Immigration Local × immigration N BCI Temp N × N BCI × BCI Temp × Temp
HV1 0·59 0·61 –0·20 0·20 0·70 0·35 0·41 –0·48 0·39HV2 0·85 0·59 –0·44 0·14 0·89 0·00 0·01 –0·27 0·00LB 0·57 0·76 –0·34 0·19 0·89 0·19 0·50 –0·32 0·02OH 0·90 0·36 –0·26 0·04 0·28 0·11 –0·04 –0·31 0·01VL 0·98 0·35 –0·32 0·10 0·05 0·01 0·20 –0·34 0·01
Fig. 2. Observed number of females (blackline with points) and 50% and 95% predictionintervals (shaded dark grey and light grey,respectively). Prediction intervals are basedon the simulated number of females in area(a) HV2, (b) LB and (c) OH. The simulationsare based on the number of females onthe first year of observation, the estimatedparameters and the observed values of BCIand temperature. Please note that experimentscould affect the population in 1997 in areaOH.

Population dynamics of great tits 455
© 2008 The Authors. Journal compilation © 2008 British Ecological Society, Journal of Animal Ecology, 78, 447–459
environment, affecting both local recruitment and immigra-tion from surrounding areas. An implication of this is that wecan predict the population responses to changes in thetemporal variation of key ecological variables. For instance,this modelling framework can be used, provided availabilityof long-term individual-based demographic data, to quan-titatively predict the effects of global climate change on thepattern of population fluctuations.
MODEL ASSUMPTIONS
Although our model includes several parameters, it is stillbased on several simplifying assumptions. First, we assume alogistic model of density regulation, that is, that the densityregulation is linear in N. This model seems to give a reason-able description of the density regulation in great tit popula-tions (Lebreton 1990), as well as for small passerines ingeneral (Sæther & Engen 2002b). Second, we assume noage-specific effects in the adult segment of the populationsbecause the age composition of the populations is unknowndue to several of the recruits having unknown origin. Agedependency in demographic traits can easily induce autocor-relations in the population fluctuations that can be wronglyinterpreted as density dependence (Lande, Engen & Sæther2002; Lande et al. 2006). However, age-specific demographiceffects seem to be small in small passerines such as the great tit
compared to other species (Clobert et al. 1988; Sæther 1990).Accordingly, fluctuations in the age structure had only aminor influence on the dynamics of a willow tit Parus mont-anus population (Ekman 1984). It also seems to be a tendencythat changes in size of different age classes of tit populationsare highly correlated (Sæther, Engen & Matthysen 2002c). Asa consequence, an examination of the residuals after fittingthe density model (equation 1) did not reveal any significantlagged autocorrelations. Third, we assume that the immigrantshave demographic characteristics that do not differ from theresidents, which may not necessarily be true (Clobert et al. 1988;Altwegg, Ringsby & Sæther 2000; Postma & van Noordwijk2005). Fourth, we assume that the density regulation acts onlyon the number of females present. If total population size (i.e.including both males and females) is important, this maystrongly affect the estimates of both the population para-meters as well as the stochastic components (Sæther et al.2004a). Fifth, we assume no census error that is known tointroduce biases especially in the estimates of the environ-mental variance (Freckleton et al. 2006). However, in presentstudy areas almost all great tits nests in nest boxes. In addi-tion, the environmental stochasticity is relatively large (seeResults section), so the bias introduced by observation errorin the population estimates is likely to be neglectable. Finally,we assumed that the fraction of nest boxes occupied by femaleimmigrants were unaffected by the number of local females
Fig. 3. Observed number of females (blackline with points) and 50% and 95% predictionintervals (shaded dark grey and light grey,respectively). Prediction intervals are basedon the simulated number of females in area(a) HV2, (b) LB and (c) OH. The simulationsare based on the number of females in year1985, the estimated parameters based on databefore 1985 and the observed values of BCIand temperature. Please note that experimentscould have affected the population size in1997 in the area OH.

456 V. Grøtan et al.
© 2008 The Authors. Journal compilation © 2008 British Ecological Society, Journal of Animal Ecology, 78, 447–459
present. The numbers of nest boxes relative to the numbersof local and immigrant females were large (see Study Areassection) in all areas and years. Thus, competition for nestboxes should be quite limited. Despite all these simplifyingassumptions, our model was still able to describe the actualpopulation fluctuations quite accurately (Fig. 2). Thisindicates that the model (equation 1) captures some basicfeatures of the underlying dynamics of these populations.
RELATIVE CONTRIBUTION OF DENSITY DEPENDENCE AND ENVIRONMENTAL STOCHASTICITY
In this study, we modelled both the demographic andenvironmental stochasticity as density-dependent functions(equations 3, 4 and 7). Significant effects of population sizewere found on the demographic variance (Fig. 1) in the areasHV2 and LB. Previously, a similar density-dependent decreasein demographic variance was found for the great tits in WythamWood (Sæther et al. 1998). Such a decrease was interpretedthat relatively fewer females were able to produce a largenumber of recruits at higher population size that will result ina density-dependent decrease in the among-female fitness-variation. Although we used a slightly different model toestimate the stochastic components, our estimates of (see Results section) were quite similar to previously pub-lished estimates (Sæther et al. 2003) for the same populations.With Poisson-distributed individual contributions, thedemographic variance should theoretically be equal to 1 atthe carrying capacity (Engen et al. 1998), and this theoreticalexpectation differs from our estimates of the demographicvariance that were < 1 in all populations. However, in ourmodelling of the local recruitment process, we have con-sidered fledglings that were not found in subsequent years asdead. Some of these individuals could have migrated out ofthe study area. In addition, there is an influx of individualsinto the study area from other populations. Hence, at carryingcapacity, the mean contribution from local females isexpected to be < 1, and estimates of demographic variance< 1 could thus be explained by the properties of the Poissondistribution.
It is now generally accepted in population ecology thatthe magnitude of population fluctuations is determined by acombination of density-dependent processes and the effectsof environmental stochasticity (Turchin 1995), as originallysuggested by Lack (1954, 1966). Our results (Tables 2, 3, 4)show that fluctuations in the size of great tit populations aremore influenced by stochastic variations in the environmentalvariables such as the beech mast and temperature than bydensity-dependent feedback mechanisms. Annual fluctuationsin the size of great tit populations are generally dependenton two mechanisms that both were identified more thanhalf a century ago (Lack 1947; Kluijver 1951). First, density-independent factors affect the fledgling production (Both &Visser 2000) and the number of juveniles and adults surviv-ing, especially during winter (Tables 2a, 3a). Second, densitydependence affects the number of individuals surviving fromone breeding season to the next (Clobert et al. 1988) or the
number of new individuals that enable themselves to establishin the breeding population (Kluijver & Tinbergen 1953;Krebs 1971; Klomp 1972). Our quantitative evaluation of therelative contribution of these two mechanisms to fluctuationsin the size of Dutch great tit populations showed that, ingeneral, density-independent effects contributed more to thevariance in population growth rates than density-dependenteffects of the number of females present the previous year(Tables 3a, 4).
The strong effects of beech mast on the fluctuations in thesize of great tit populations operate mainly through an effecton the survival of both juveniles and adults (Perrins 1965a;Perrins 1979; McCleery & Perrins 1985; Clobert et al. 1988;Perdeck et al. 2000). Similarly, the influence on the dynamicsof climate during late winter and spring was also found bySlagsvold (1975) in an analysis of the dynamics of great tits inWytham Wood outside Oxford, UK. This suggests that cli-mate during this period may also affect juvenile survival orthe probability that especially juveniles are able to establishthemselves in the population (Krebs 1971). The effects oftemperature during spring could possibly be explained by themistiming hypothesis (Visser et al. 1998, 2004, 2006). Hightemperatures during late spring, after the birds have startedlaying, leads to a faster development of vegetation and preyspecies causing a mismatch with the offsprings’ needs and thepeak date in food availability, which in turn would lead to alower reproductive output. Accordingly, the effects of tem-perature during spring were included in the selected models(Table 2) both for local recruitment and immigration.However, while for the local recruitment we find the predictednegative relationship between spring temperature andpopulation growth rate, this estimate is positive for the immi-gration term. One possible explanation for this is that in coldsprings, which are favourable for local recruitment, increasedcompetition will reduce the number of immigrants that canestablish themselves in the population. Accordingly, inseveral passerine species (Sutherland, Gill & Norris 2002;Wilson & Arcese 2008) as well as in great tit in particular(Tufto et al. 2005), there is a decrease in immigration rateswith local population size.
An important conclusion of our analyses is the presence ofan interaction between the effects on the population fluctu-ations of density dependence and environmental stochasticityso these two processes cannot be considered as independent.Royama (1992, p. 38) has previously suggested that variationin beech crop could cause a nonlinear perturbation on thecurve relating population growth rate to population density.Similar interactions among density-dependent and density-independent effects have been found in other studies on ver-tebrate population dynamics as well (Grenfell et al. 1998;Coulson et al. 2001; Stenseth et al. 2002; Stenseth et al. 2004;Haugen et al. 2007). This could imply that proper modellingof the effects of changes in the environment, for example, dueto climate on great tit dynamics must take into account den-sity-dependent processes affecting local recruitment as well asimmigration in a nonlinear way. However, it is important tonote that our findings are based on analyzing contributions to
σ σd e2 2 and

Population dynamics of great tits 457
© 2008 The Authors. Journal compilation © 2008 British Ecological Society, Journal of Animal Ecology, 78, 447–459
annual changes in population sizes (equations 9, 10). Thisimplies that non-additive contributions could also be causedby correlations among explanatory variables (Altwegg et al.2003). Irrespective of the detailed mechanism causing non-additive contributions, the findings underline the importanceof modelling and estimating effects of important factorsinfluencing variations in population size simultaneouslyrather than as the effects of single variables separately.
THE RELATIONSHIP BETWEEN LOCAL RECRUITMENT AND IMMIGRATION
Variation in the size of natural populations is caused by acombination of demographic processes that act locally andinflux of individuals from outside. The interaction betweenthose two processes is, however, poorly known. For instance,few examples have been provided for the presence of density-dependent migration rates (Sutherland et al. 2002), eventhough such relationships can have strong dynamical con-sequences (Sæther, Engen & Lande 1999; Andreassen, Stenseth& Ims 2002). Density dependence as well as stochasticenvironmental effects, such as weather and beech mast,affected local recruitment as well as immigration of new birds(Table 4). Thus, immigration represents a key process for thedynamics of these tit populations.
This large effect of immigration on the local dynamics maybe more typical for most passerine populations than the morelimited influence found in more geographically isolatedpopulations (e.g. Smith et al. 2006). However, our results showthat local variation in demography generally contributedmore to annual changes in population size than the numberof immigrants (Table 4) except that immigration was moreimportant than local recruitment in area LB (Table 4). Thisstudy area is located within a larger area of suitable habitat forthe great tit (Table 1). This suggests that the degree of isola-tion may influence the relative importance of immigration inthe local dynamics of great tit populations. Accordingly, thetwo most isolated populations VL and OH (Table 1) were lessinfluenced by immigration than the other populations. Fur-thermore, the reduced importance of immigration relative tolocal recruitment after the reduction of the study area in HVdue to a severe storm damaging the pine plantation in winterof 1972/73 suggests that the effect of immigration was notdependent upon size of the study area.
A problem in studies of immigration on the dynamics ofnatural population is that the effects will depend on the spa-tial scale of the study area. If the study includes localities thatare located far away, the effects of immigration are likely to befar less than among populations located within close dis-tances (Harrison & Taylor 1997). The distance between thestudy sites ranged from 17 km between HV and OH to169 km between VL and LB. Over such short distances, someinterchange of individuals may be possible (Tufto et al. 2005),which may induce independence among the populations intheir dynamics. However, movements of individuals amongthe study sites were rare. During the period from 1955 to 2006,we have 298 991 catches of 123 312 individual great tits in the
four study populations. Of these, there were only eight indi-viduals that have been recorded at two different localities:three birds were ringed as a nestling in one area and bred inanother area while the other five cases are on winter catchesand hence do not affect the number of breeding birds. Thus,our best estimate is that 3 out of 123 312 individuals movedbetween sites (0·0024% of the birds). This indicates that ourlocalities represent geographically separated populations, inwhich the dynamics are not influenced by movements of indi-viduals among the four study populations.
Still there was a positive association in all study popu-lations between local recruitment and the number of immi-grants (Table 4). This positive association supports thesuggestion that the population dynamics of tits are affectedby processes that affect all classes in the population similarly(Sæther et al. 2002c) over larger geographical areas (Sætheret al. 2007). The short spatial scaling of dispersal in the greattit (Tufto et al. 2005) also supports this explanation. Accordingly,the same environmental variables (BCI and temperatureduring spring) were important for predicting temporalvariation in local recruitment and the number of immigrantsfrom other areas (Table 2).
Acknowledgements
We thank Jan Visser and Huybert van Eck (†) for all their efforts in the field, andJan Visser for careful management of the great tit data that form the basis of thispaper. This study was supported by the EU 5th framework (METABIRDproject) and the Research Council of Norway (NORKLIMA). We thank theboard of the National Park ‘de Hoge Veluwe’, the State Forestry Service atVlieland and Breda (Liesbos), and Barones van Boetzelaer van Oosterhout forpermission to work in their woodlands for all these years. We thank M. Lima forcomments on a previous version of this paper.
References
Altwegg, R., Ringsby, T.H. & Sæther, B.-E. (2000) Phenotypic correlates andconsequences of dispersal in a metapopulation of house sparrows Passerdomesticus. Journal of Animal Ecology, 69, 762–770.
Altwegg, R., Roulin, A., Kestenholz, M. & Jenni, L. (2003) Variation andcovariation in survival, dispersal, and population size in barn owls Tyto alba.Journal of Animal Ecology, 72, 391–399.
Andreassen, H.P., Stenseth, N.C. & Ims, R.A. (2002) Dispersal behaviour andpopulation dynamics of vertebrates. Dispersal Ecology (eds J.M. Bullock,R.E. Kenward & R.S. Hails), pp. 237–256. Blackwell Publishing, Oxford, UK.
Andrewartha, H.G. & Birch, L.C. (1954) The Distribution and Abundance ofAnimals. University of Chicago Press, Chicago, Illinois.
Arcese, P. & Marr, A.B. (2006) Population viability in the presence and absenceof cowbirds, catastrophic mortality, and immigration. Conservation and theBiology of Small Populations: The Song Sparrows of Mandarte Island (edsJ.N.M. Smith, L.F. Keller, A.B. Marr & P. Arcese), pp. 175–191. OxfordUniversity Press, Oxford, UK.
Arcese, P., Smith, J.N.M., Hochachka, W.M., Rogers, C.M. & Ludwig, D.(1992) Stability, regulation, and the determination of abundance in an insu-lar song sparrow population. Ecology, 73, 805–822.
Asbjørnsen, E.J., Sæther, B.-E., Linnell, J.D.C., Engen, S., Andersen, R. &Bretten, T. (2005) Predicting the growth of a small introduced muskoxpopulation using population prediction intervals. Journal of Animal Ecology,74, 612–618.
Betts, M.M. (1955) The food of titmice in oak woodland. Journal of AnimalEcology, 24, 282–323.
Bjørnstad, O.N., Falck, W. & Stenseth, N.C. (1995) A geographic gradient insmall rodent density-fluctuations: a statistical modelling approach. Proceed-ings of the Royal Society B: Biological Sciences, 262, 127–133.
Both, C. & Visser, M.E. (2000) Breeding territory size affects fitness: an ex-perimental study on competition at the individual level. Journal of AnimalEcology, 69, 1021–1030.

458 V. Grøtan et al.
© 2008 The Authors. Journal compilation © 2008 British Ecological Society, Journal of Animal Ecology, 78, 447–459
Burnham, K.P. & Anderson, D.R. (1998) Model Selection and Inference: APractical Information-theoretic Approach. Springer, New York.
Clobert, J., Perrins, C.M., McCleery, R.H. & Gosler, A.G. (1988) Survival ratein the great tit Parus major in relation to sex, age, and immigration status.Journal of Animal Ecology, 57, 287–306.
Coulson, T., Catchpole, E.A., Albon, S.D., Morgan, B.J.T., Pemberton, J.M.,Clutton-Brock, T.H., Crawley, M.J. & Grenfell, B.J. (2001) Age, sex, density,winter weather, and population crashes in Soay sheep. Science, 292, 1528–1531.
Ekman, J. (1984) Stability and persistence of an age-structured avian popula-tion in a seasonal environment. Journal of Animal Ecology, 53, 135–146.
Engen, S., Bakke, O. & Islam, A. (1998) Demographic and environmentalstochasticity – concepts and definitions. Biometrics, 54, 840–846.
Engen, S., Sæther, B.-E. & Møller, A.P. (2001) Stochastic population dynamicsand time to extinction of a declining population of barn swallows. Journal ofAnimal Ecology, 70, 789–797.
Engen, S., Lande, R. & Sæther, B.-E. (2002a) Migration and spatio-temporalvariation in population dynamics in a heterogeneous environment. Ecology,83, 570–579.
Engen, S., Lande, R. & Sæther, B.-E. (2002b) The spatial scale of populationfluctuations and quasi-extinction risk. American Naturalist, 160, 439–451.
Engen, S., Lande, R., Sæther, B.-E. & Weimerskirch, H. (2005) Extinction inrelation to demographic and environmental stochasticity in age-structuredmodels. Mathematical Biosciences, 195, 210–227.
Freckleton, R.P., Watkinson, A.R., Green, R.E. & Sutherland, W.J. (2006)Census error and the detection of density-dependence. Journal of AnimalEcology, 75, 837–851.
Gelman, A. & Hill, J. (2007) Data Analysis Using Regression and Multilevel/Hierarchical Models. Cambridge University Press, Cambridge, Massachusetts.
Gibb, J.A. (1960) Populations of tits and goldcrests and their food supply inpine plantations. Ibis, 102, 163–208.
Grenfell, B.T., Wilson, K., Finkenstädt, B.F., Coulson, T.N., Murray, S.,Albon, S.D., Pemberton, J.M., Clutton-Brock, T.H. & Crawley, M.J. (1998)Noise and determinism in sychronized sheep dynamics. Nature, 394, 674–677.
Harrison, S. & Taylor, A.D. (1997) Empirical evidence for metapopulationdynamics. Metapopulation Biology: Ecology, Genetics and Evolution (eds I.Hanski & E. Gilpin), pp. 27–42. Academic Press, San Diego, San California.
Haugen, T.O., Winfield, I.J., Vollestad, L.A., Fletcher, J.M., Ben James, J. &Stenseth, N.C. (2007) Density dependence and density independence in thedemography and dispersal of pike over four decades. Ecological Mono-graphs, 77, 483–502.
Ives, A.R., Woody, S.T., Nordheim, E.V., Nelson, C. & Andrews, J.H. (2004)The synergistic effects of stochasticity and dispersal on population densities.American Naturalist, 163, 375–387.
Kendall, B.E., Bjørnstad, O.N., Bascompte, J., Keitt, T.H. & Fagan, W.F.(2000) Dispersal, environmental correlation, and spatial synchrony inpopulation dynamics. American Naturalist, 155, 628–636.
Klomp, A. (1972) Regulation of the size of bird populations by means ofterritorial behaviour. Netherlands Journal of Zoology, 22, 456–488.
Kluijver, H.N. (1951) The population ecology of the great tit, Parus m. major L.Ardea, 39, 1–135.
Kluijver, H.N. (1971) Regulation of numbers in populations of great tits (Parusm. major). Proceedings of the Advanced Study institute Dynamics NumbersPopulations, Oosterbeek 1970 (eds P.J. den Boer & G.R. Gradwell), pp. 507–523. PUDOC, Wageningen, The Netherlands.
Kluijver, H.N. & Tinbergen, L. (1953) Territory and the regulation of densityin titmice. Archives Neerlandaises de Zoologie, 10, 265–289.
Krebs, J.R. (1971) Territority and breeding density in the great tit, Parus major.Ecology, 52, 2–22.
Lack, D. (1947) The significance of clutch-size. Ibis, 89, 302–352.Lack, D. (1954) The Natural Regulation of Animal Numbers. Clarendon Press,
Oxford, UK.Lack, D. (1966) Population Studies of Birds. Oxford University Press, Oxford,
UK.Lande, R., Engen, S. & Sæther, B.-E. (2002) Estimating density dependence in
time-series of age-structured populations. Philosophical Transactions ofthe Royal Society of London. Series B, Biological Sciences, 357, 1179–1184.
Lande, R., Engen, S. & Sæther, B.-E. (2003) Stochastic Population Dynamics inEcology and Conservation. Oxford University Press, Oxford, UK.
Lande, R., Engen, S., Sæther, B.-E. & Coulson, T. (2006) Estimating densitydependence from time series of population age structure. American Natur-alist, 168, 76–87.
Lebreton, J.-D. (1990) Modelling density dependence, environmental variability,and demographic stochasticity from population counts: an example using
Wytham Wood great tits. Population Biology of Passerine Birds (eds J.Blondel, A. Gosler, J.-D. Lebreton & R. McCleery), pp. 89–102. Springer-Verlag, Berlin, Germany.
Lesnott, M. & Lancelot, R. (2005) aod: Analysis of Overdispersed Data. Rpackage version 1.1–8. Available fromURL: http://cran.r-project.org.
May, R.M. (1973) Stability in randomly fluctuating versus deterministicenvironments. American Naturalist, 107, 621–650.
May, R.M. (1976) Simple mathematical models with very complicateddynamics. Nature, 261, 459–467.
May, R.M. (1981) Models for single populations. Theoretical Ecology (ed.R.M. May), pp. 5–29. Blackwell Scientific Publications, Oxford, UK.
McCallum, H., Kikkawa, J. & Catterall, C. (2000) Density dependence in anisland population of silvereyes. Ecology Letters, 3, 95–100.
McCleery, R.H. & Perrins, C.M. (1985) Territory size, reproductive successand population dynamics in the great tit, Parus major. Behavioural Ecology.Ecological Consequences of Adaptive Behaviour (eds R.M. Sibly & R.H.Smith), pp. 353–373. Blackwell Scientific Publications, Oxford, UK.
Nussey, D.H., Postma, E., Gienapp, P. & Visser, M.E. (2005) Selection on her-itable phenotypic plasticity in a wild bird population. Science, 310, 304–306.
Perdeck, A.C., Visser, M.E. & van Balen, J.H. (2000) Great tit Parus majorsurvival, and the beech-crop cycle. Ardea, 88, 99–108.
Perrins, C.M. (1965a) Population fluctuations and clutch size in the great tit,Parus major L. Journal of Animal Ecology, 34, 601–647.
Perrins, C.M. (1979) British Tits. Collins, London.Postma, E. & van Noordwijk, A.J. (2005) Gene flow maintains a large genetic
difference in clutch size at a small spatial scale. Nature, 433, 65–68.R Development Core Team (2007) r: A Language and Environment for Statis-
tical Computing. R Foundation for Statistical Computing, Vienna, Austria.Available from URL: http://www.R-project.org.
Ranta, E., Lundberg, P. & Kaitala, V. (2006) Ecology of Populations.Cambridge University Press, Cambridge, UK.
Royama, T. (1992) Analytical Population Dynamics. Chapman & Hall, London.Sæther, B.-E. (1990) Age-specific variation in reproductive performance of
birds. Current Ornithology, 7, 251–283.Sæther, B.-E. & Engen, S. (2002a) Including uncertainties in population
viability analysis using population prediction intervals. Population ViabilityAnalysis (eds S.R. Beissinger & D.R. McCullough), pp. 191–212. Universityof Chicago Press, Chicago, Illinois.
Sæther, B.-E. & Engen, S. (2002b) Pattern of variation in avian populationgrowth rates. Philosophical Transactions of the Royal Society of London.Series B, Biological Sciences, 357, 1185–1195.
Sæther, B.-E., Engen, S., Islam, A., McCleery, R. & Perrins, C. (1998)Environmental stochasticity and extinction risk in a population of a smallsongbird, the great tit. American Naturalist, 151, 441–450.
Sæther, B.-E., Engen, S. & Lande, R. (1999) Finite metapopulation modelswith density-dependent migration and stochastic local dynamics. Proceed-ings of the Royal Society B: Biological Sciences, 266, 113–118.
Sæther, B.-E., Engen, S., Lande, R., Arcese, P. & Smith, J. N. M. (2000a)Estimating the time to extinction in an island population of song sparrows.Proceedings of the Royal Society B: Biological Sciences, 267, 621–626.
Sæther, B.-E., Tufto, J., Engen, S., Jerstad, K., Røstad, O.W. & Skåtan, J.E.(2000b) Population dynamical consequences of climate change for a smalltemperate songbird. Science, 287, 854–856.
Sæther, B.-E., Engen, S., Lande, R., Visser, M. & Both, C. (2002a) Densitydependence and stochastic variation in a newly established population of asmall songbird. Oikos, 99, 331–337.
Sæther, B.-E., Engen, S. & Matthysen, E. (2002c) Demographic characteristicsand population dynamical patterns of solitary birds. Science, 295, 2070–2073.
Sæther, B.-E., Engen, S., Møller, A.P., Matthysen, E., Adriansen, F., Fiedler,W., Leivits, A., Lambrechts, M.M., Visser, M.E., Anker-Nilssen, T., Both,C., Dhondt, A.A., McCleery, R.H., McMeeking, J., Potti, J., Røstad, O.W.& Thomson, D. (2003) Climate variation and regional gradients in popu-lation dynamics of two hole-nesting passerines. Proceedings of the RoyalSociety B: Biological Sciences, 270, 2397–2404.
Sæther, B.-E., Engen, S., Lande, R., Møller, A.P., Bensch, S., Hasselquist, D.,Beier, J. & Leisler, B. (2004a) Time to extinction in relation to mating systemand type of density regulation in populations with two sexes. Journal ofAnimal Ecology, 73, 925–934.
Sæther, B.-E., Sutherland, W.J. & Engen, S. (2004b) Climate influences on apopulation dynamics. Advances in Ecological Research, 35, 185–209.
Sæther, B.-E., Engen, S., Grøtan, V., Fiedler, W., Matthysen, E., Visser, M.E.,Wright, J., Møller, A.P., Adriaensen, F., Van Balen, H., Balmer, D.,Mainwaring, M.C., McCleery, R., Pampus, M. & Winkel, W. (2007) Theextended Moran effect and large-scale synchronous fluctuations in thesize of great tit and blue tit populations. Journal of Animal Ecology, 76, 315–325.

Population dynamics of great tits 459
© 2008 The Authors. Journal compilation © 2008 British Ecological Society, Journal of Animal Ecology, 78, 447–459
Slagsvold, T. (1975) Critical period for regulation of great tit (Parus major L.)and blue tit (Parus caeruleus L.) populations. Norwegian Journal of Zoology,23, 67–88.
Smith, J.N.M., Marr, A.B., Arcese, P. & Keller, L.F. (2006) Fluctuations innumbers: population regulation and catastrophic mortality. Conservationand Biology of Small Populations: The Song Sparrows of Mandarte Island(eds J.N.M. Smith, L.F. Keller, A.B. Marr & P. Arcese), pp. 43–64. OxfordUniversity Press, Oxford, UK.
Stenseth, N.C., Mysterud, A., Ottersen, G., Hurrell, J.W., Chan, K.S. & Lima,M. (2002) Ecological effects of climate fluctuations. Science, 297, 1292–1296.
Stenseth, N.C., Chan, K.S., Tavecchia, G., Coulson, T., Mysterud, A., Clutton-Brock, T. & Grenfell, B. (2004) Modelling non-additive and nonlinearsignals from climatic noise in ecological time series: Soay sheep as an example.Proceedings of the Royal Society B: Biological Sciences, 271, 1985–1993.
Sutherland, W.J., Gill, J.A. & Norris, K. (2002) Density-dependent dispersal inanimals: concepts, evidence, mechanisms and consequences Dispersal Eco-logy (eds J.M. Bullock, R.E. Kenward & R.S. Hails), pp. 134–151. BlackwellPublishing, Oxford, UK.
Tinbergen, J.M., van Balen, J.H. & van Eck, H.M. (1985) Density-dependentsurvival in an isolated great tit population: Kluyver’s data reanalysed. Ardea,73, 38–48.
Tufto, J., Ringsby, T.H., Dhondt, A.A., Adriaensen, F. & Matthysen, E. (2005)A parametric model for estimation of dispersal patterns applied to fivepasserine spatially structured populations American Naturalist, 165, E13–E26.
Turchin, P. (1990) Rarity of density dependence or population regulation withlags. Nature, 344, 660–663.
Turchin, P. (1995) Population regulation: old arguments and a new synthesis.Population Dynamics (eds N. Cappucino & P.W. Price), pp. 19–40. AcademicPress, New York.
Turelli, M. (1977) Random environments and stochastic calculus. TheoreticalPopulation Biology, 12, 140–178.
Ulfstrand, S. (1962) On the nonbreeding ecology and migratory movements ofthe great tit (Parus major) and the blue tit (Parus caeruleus) in southernSweden. Vår Fågelv., suppl. 3, 1–145.
van Balen, J.H. (1973) Comparative study of breeding ecology of great tit Parusmajor in different habitats. Ardea, 61, 1–93.
van Balen, J.H. (1980) Population fluctuations of the great tit and feedingconditions in winter. Ardea, 68, 143–164.
van Balen, J.H. & Potting, R.P.J. (1990) Comparative reproductive biology offour blue tit populations in the Netherlands. Population Biology of PasserineBirds (ed. J. Blondel), pp. 19–38. Springer-Verlag, Berlin, Germany.
Verhulst, S. & van Eck, H.M. (1995) The role of immigration in the dynamicsof an island population of great tits. Reproductive decisions in great tits. An
optimality approach (S. Verhulst), pp. 15–26. PhD. Thesis, University ofGroningen, The Netherlands.
Visser, M.E., van Noordwijk, A.J., Tinbergen, J.M. & Lessells, C.M. (1998)Warmer springs lead to mistimed reproduction in great tits (Parus major).Proceedings of the Royal Society B: Biological Sciences, 265, 1867–1870.
Visser, M.E., Adriaensen, F., van Balen, J.H., Blondel, J., Dhondt, A.A., vanDongen, S., du Feu, C., Ivankina, E.V., Kerimov, A.B., de Laet, J., Matthy-sen, E., McCleery, R., Orell, M. & Thomson, D.L. (2003) Variable responsesto large-scale climate change in European Parus populations. Proceedings ofthe Royal Society B: Biological Sciences, 270, 367–372.
Visser, M.E., Both, C. & Lambrechts, M.M. (2004) Global climate changeleads to mistimed avian reproduction. Advances in Ecological Research, 15,89–110.
Visser, M.E., Holleman, L.J.M. & Gienapp, P. (2006) Shifts in caterpillarbiomass phenology due to climate change and its impact on the breedingbiology of an insectivorous bird. Oecologia, 147, 164–172.
Wilson, A.G. & Arcese, P. (2008) Influential factors for natal dispersal in anavian island metapopulation. Journal of Avian Biology, 39, 341–347.
Received 7 July 2008; accepted 9 September 2008Handling Editor: Tim Coulson
Supporting Information
Additional Supporting Information may be found in theonline version of this article:
Appendix S1. Poisson-distributed individual contributions.
Appendix S2. Decomposition of the variance components.
Appendix S3. Model selection.
Please note: Wiley-Blackwell are not responsible for the con-tent or functionality of any supporting information suppliedby the authors. Any queries (other than missing material)should be directed to the corresponding author for the article.