Mussel Genetics in Relation to Selection Methods for High ...
Upload
independentCategory
view
2download
0
ORIGINAL ARTICLE
Spatial and Temporal Genetic Variation of Green Mussel,Perna viridis in the Gulf of Thailand and Implicationfor Aquaculture
Warangkana Prakoon & Suriyan Tunkijjanukij &Thuy T. T. Nguyen & Uthairat Na-Nakorn
Received: 17 February 2009 /Accepted: 2 October 2009 /Published online: 27 November 2009# Springer Science + Business Media, LLC 2009
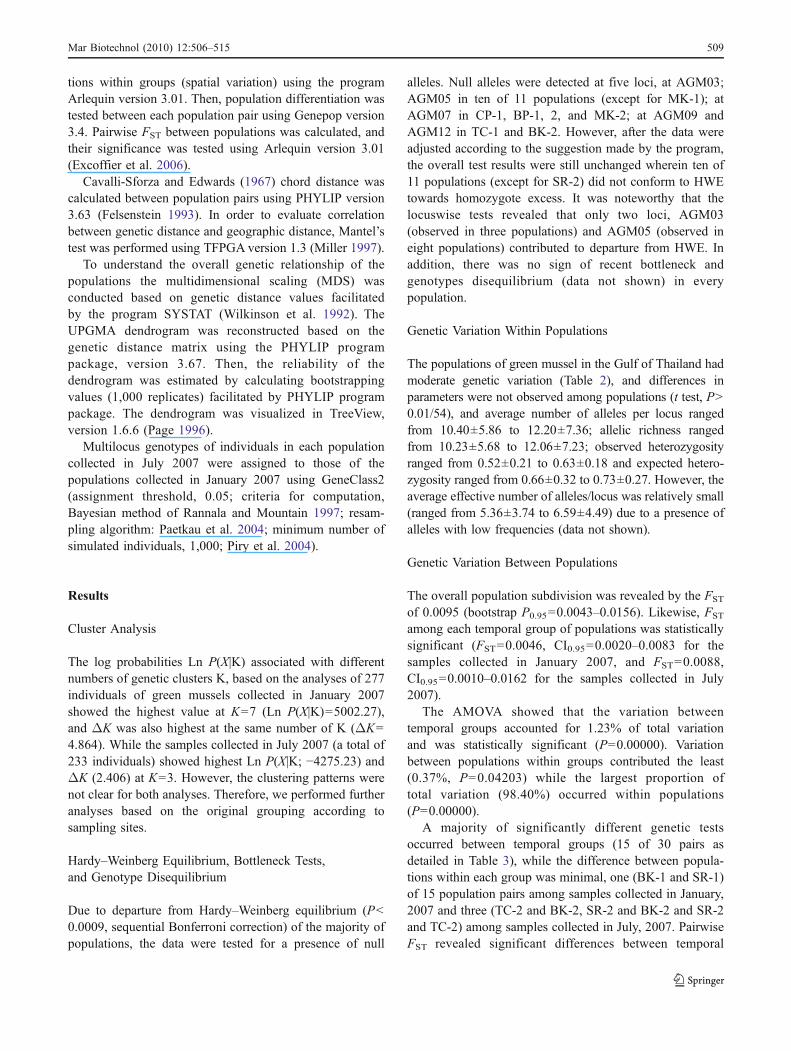
Abstract The culture of green mussel (Perna viridis) in theGulf of Thailand depends on natural spat which arebelieved to come from spawning grounds adjacent to majorriver mouths. In the present paper, genetic diversity of spatialand temporal populations of green mussel in the Gulf ofThailand was investigated using five microsatellite loci. Theresults showed moderate genetic variation of all 11 popula-tions (averaged number of alleles per locus, A=10.4–12.2;effective number of alleles per locus, Ae=5.36–6.59; meanallelic richness, Ar=10.23–12.06; observed heterozygosity,Ho=0.52–0.63, and expected heterozygosity, He=0.66–0.73)without significant differences among populations. No signof bottleneck or genetic disequilibrium was observed.Genetic differentiation among spatial populations was low
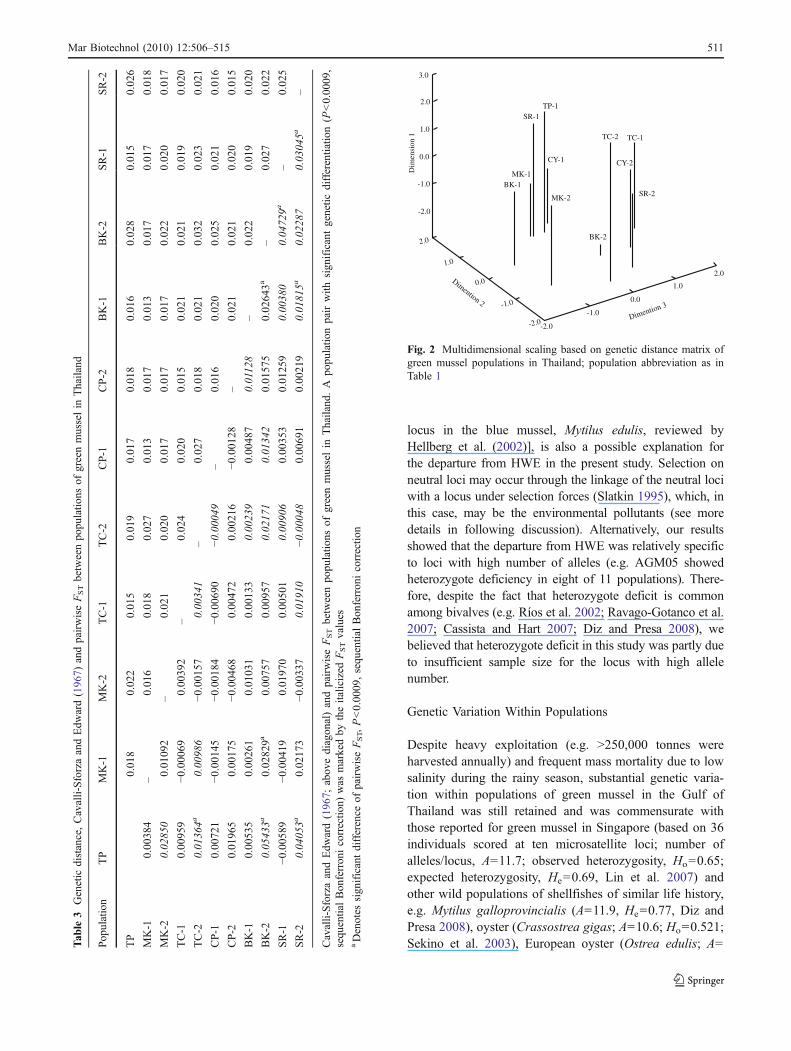
(FST=0.0046, CI0.95=0.0020–0.0083 for the samplescollected in January, 2007, and FST=0.0088, CI0.95=0.0010–0.0162 for the samples collected in July, 2007)while temporal variation was significant as revealed by theanalysis of molecular variance. Multidimensional scalingseparated temporal population groups with minor exception.The assignment test revealed that most of the recruits werefrom other populations.
Keywords Genetic diversity . Perna viridis . Temporalvariation
Introduction
The bivalves Perna viridis which is often referred to asthe green mussel, occurs naturally in Asian coastal watersfrom across the Indo-Pacific encompassing the PersianGulf, India, Malaysia, Papua New Guinea, and the SouthPacific islands and to the north to Japan (Benson et al.2001). The green mussel has been attracting a lot ofattention as a potential organism for commercial aquacul-ture (Parulekar et al. 1982; Hickman 1992; Rajagopal etal. 1998), due to its fast growing characteristics andrelatively high level of tolerance to many environmentalfactors. Aquaculture of green mussel is rapidly expanding,with only 69,000 tonnes produced in 1995 and reachingmore than 300,000 tonnes in 2006 (FAO 2006).
In Thailand, green mussel is known to occur in sixmain river mouths which drain into the Gulf of Thailand,namely Chao Phraya River (CY) in Bangkok, BangpakongRiver (BK) in Chacheongsao, Tachin River (TC) in SamutSakorn, Meklong River (MK) in Samut Songkhram and TapiRiver (TP) in Surat Thani Province (Fig. 1). Aquaculture ofgreen mussel in Thailand dates back to 1950s, and currently,
W. PrakoonDepartment of Aquaculture, Graduate School,Kasetsart University,Chatujak,Bangkok 10900, Thailand
U. Na-Nakorn (*)Department of Aquaculture, Faculty of Fisheries,Kasetsart University,Chatujak,Bangkok 10900, Thailande-mail: [email protected]
S. TunkijjanukijDepartment of Marine Science, Faculty of Fisheries,Kasetsart University,Chatujak,Bangkok 10900, Thailand
T. T. T. NguyenNetwork of Aquaculture Centres in Asia Pacific,Kasetsart University Campus,Chatujak,Bangkok 10900, Thailand
Mar Biotechnol (2010) 12:506–515DOI 10.1007/s10126-009-9234-x

green mussel farming focuses in only several areas such asSriracha Bay in Chonburi, Klongdan, in Samut Prakarn, andBandon Bay in Surat Thani Province (Intharachart andPloypradup 2002). Mussel culture in Thailand relies entirelyon the collection of natural spat using ropes or poles. Themajority of farms use local spat for culture while approxi-mately a half of the spat cultured in Surat Thani Province weretransplanted from local populations in the upper gulf(Wangvoralak et al. 2006). The green mussel cultureproduced about 257,087 tonnes (FAO 2006), accountingfor more than 90% of world green mussel production.Although green mussel tolerates a wide range of environ-mental parameters (Rajagopal et al. 2006), decreasingsalinity during rainy season often caused mass mortality ofmussel (Sivalingam 1977; AQUACOP and de Gaillande1979; Coeroli et al. 1984). This often occurred in the uppergulf of Thailand (Sriraja Fisheries Station Undate), and theexperimental result showed 100% mortality of green musselexposed to low salinity (5 and 10 ppt.) within 72 h (Raochai2004). The annual occurrence of mass mortality and heavyexploitation of green mussel raise concern on losing geneticvariation due to a reduction of effective population size.
Information on genetic diversity of green mussel islimited. A report based on allozyme showed high geneticvariation of eight populations of green mussel along thecoast of Peninsular Malaysia (Ho=0.108–0.334; He=0.133–0.303). Population structuring existed with moderate FST
(0.149; Yap et al. 2002). Recently, microsatellite primerswere developed from DNA of green mussel by Lin et al.(2007), and five of them were used in this study. Micro-satellite markers were popular for their highly polymorphicnature, neutrality, and requirement of only small amount oftissue samples (reviewed by O’Connell and Wright 1997).
The purposes of the present study were to assess statusof populations of green mussel which may be depleted dueto various causes, e.g. heavy exploitation and massmortality, by looking at genetic variation within popula-tions. We also would like to investigate if geneticdifferentiation exists among spatial and temporal popula-tions. Finally, we expected to identify information onrecruitment pattern of green mussel in the Gulf. Theinformation obtained would contribute to a better under-standing of green mussel resources and hence, benefitmanagement of mussel culture activities in the Gulf ofThailand leading to sustainability.
Materials and Methods
Sampling Locations
Samples of green mussel, P. viridis were collected from fiveriver mouths, four in the upper Gulf of Thailand and onefrom Tapi River mouth in southern Thailand and one majorculture area in Sriraja Bay (SR; details for sampling localitiesare in Table 1 and Fig. 1). From each sampling site 40–50adult green mussels were collected twice (except for TapiRiver mouth), in January 2007 and July 2007, whichrepresented the two main spawning seasons, the Januarysamples representative of the young of July 2006 spawningseason and the July 2007 samples that of October 2006.Although the samples were collected from mussel farms, thesamples were from natural settlements on poles without anytranslocation. A small amount of adductor muscle wascollected and preserved in 95% ethanol and kept at 4°Cuntil required.
N
S
EW
LAO
THAILAND
CAMBODIA
Gulf of Thailand
300 km
TPM
eklong R.
Tachin R.
Chaophraya R
.
Bangpakong R.
MKTC CY
SR
Fig. 1 A map of the Gulf ofThailand showing samplinglocations of green mussel;population abbreviation as inTable 1
Mar Biotechnol (2010) 12:506–515 507

DNA Extraction and Amplification
For each sample, approximate 30 g of adductor muscle wasdigested with proteinase K, and DNA was extracted usingthe standard phenol–chloroform methods modified fromTaggard et al. (1992). Then, the individual DNA samplewas amplified in polymerase chain reactions primed byeach of five primer pairs, AGM03, AGM05, AGM07,AGM09, and AGM12 developed from DNA of P. viridis byLin et al. (2007). Each 10-µl reaction contained 1×PCRbuffer, 1.5 mM dNTPs, 0.2 µM forward and reverseprimers, 0.5 Unit Taq polymerase, 25–30 ng DNA templateand 2–2.5 mM MgCl2. PCR profiles comprised of thefollowing steps: 5 min at 94°C, 20 s at annealingtemperature of 55–61°C, 2 min at 72°C, 35 cycles of 30 sat 94°C, 30 s at each annealing temperature and 30 s at 72°C and 5 min at 72°C. PCR reactions were performed inPTC-100MP Programmable Thermal Controller (MJ Re-search, Inc). The PCR products were then electrophoresedon 4.5% polyacrylamide gel and stained with silver nitrate.Alleles were visualized after silver staining, and allele sizeswere determined relative to M13 sequence ladder.
Data Analyses
Due to the concern that there are no apparent geographicbarriers between the presumed populations of green musselin the Gulf of Thailand and the high dispersal ability of thelarvae, a model-based clustering method for inferringpopulation structure was performed using the programSTRUCTURE version 2.2 (Pritchard et al. 2000; burn-inand Markov chain Monte Carlo lengths of 10,000; K=8 forthe January 2007 samples and K=7 for the July 2007samples, and with each given K the mean likelihood wasobtained over 20 runs). The best number of cluster, K wasdecided according to the ad hoc statistic ΔK based on the
rate of change in the log probability of data between thesuccessive K values (Evano et al. 2005).
Each population was tested for conformation to Hardy–Weinberg equilibrium (HWE), and the linkage disequilib-rium test was performed using Genepop version 3.4(Raymond and Rousset 1995). However, the results showeddeparture of all but one population from HWE towardshomozygote excess. Therefore, the program Micro-Checkerversion 2.2.3 (Oosterhout et al. 2004) was employed to testfor the presence of null alleles which often causehomozygote excess. Then, allele frequencies were adjustedaccording to suggestion made by Micro-Checker.
A recent occurrence of bottleneck, significant reductionof effective population size, was tested using the programBottleneck version 1.2.02 (Cornuet and Luikart 1997).Random association of genotypes (genetic disequilibrium)was tested using Genepop version 3.4 (Raymond andRousset 1995), and the exact P value was estimated byMarkov chain method (Dememorization, 1,000; batches,100; iterations per batch, 1,000; Guo and Thompson 1992).Critical values were adjusted for multiple tests usingsequential Bonferroni correction (Hochberg 1988; Rice1989).
Genetic variation within populations were calculatedusing the program Popgene version 1.13 (Yeh et al. 1999)and FSTAT version 2.9.3.2 (Goudet 2001). Parameters suchas mean number of alleles per locus (A), mean effectivenumber of alleles per locus (Ae), allelic richness (averagenumber of alleles per locus based on smallest sample size,Ar), observed heterozygosity per individual (Ho) andexpected heterozygosity per individual (He).
To test for population structuring the F-statistics (FIS,FIT, and FST) were calculated using Arlequin version 3.01(Excoffier et al. 2006). The analysis of molecular variance(AMOVA) was performed to quantify the variance betweengroups (temporal variation) and variance among popula-
Localities Latitude/longitude
Populationabbreviation
Collectiontime
Shellsize(cm)
Samplesizes
Tapi River mouth, Surat ThaniProvince
9°16′35.45″N TP-1 Jan. 2007 8–9 5099°25′00.12″E
Meklong River mouth, SamutSongkhram Province
13°21′26.5″N MK-1 Jan. 2007 6–7 48
100°00′57.51″E MK-2 Jul. 2007 3–5 47
Tachin River mouth, SamutSakorn Province
13°27′40.99″N TC-1 Jan. 2007 6–7 46
100°19′45.76″E TC-2 Jul. 2007 3–5 46
Chao Phraya River (CY) mouth,Samut Prakarn Province
13°28′54.93″N CY-1 Jan. 2007 7–8 41
100°32′39.95″E CY-2 Jul. 2007 1–3 50
Bangpakong River mouth,Chachoengsao Province
13°25′46.35″N BK-1 Jan. 2007 8–9 46
100°55′52.77″E BK-2 Jul. 2007 2–4 44
Sriraja Bay, Chon Buri Province 13°07′07.65″N SR-1 Jan. 2007 8–9 46
100°52′14.53″E SR-2 Jul. 2007 3–6 46
Table 1 Sampling localities ofgreen mussel samples, latitude,and longitude, timing of collec-tion, population abbreviation,and sample sizes
508 Mar Biotechnol (2010) 12:506–515
tions within groups (spatial variation) using the programArlequin version 3.01. Then, population differentiation wastested between each population pair using Genepop version3.4. Pairwise FST between populations was calculated, andtheir significance was tested using Arlequin version 3.01(Excoffier et al. 2006).
Cavalli-Sforza and Edwards (1967) chord distance wascalculated between population pairs using PHYLIP version3.63 (Felsenstein 1993). In order to evaluate correlationbetween genetic distance and geographic distance, Mantel’stest was performed using TFPGA version 1.3 (Miller 1997).
To understand the overall genetic relationship of thepopulations the multidimensional scaling (MDS) wasconducted based on genetic distance values facilitatedby the program SYSTAT (Wilkinson et al. 1992). TheUPGMA dendrogram was reconstructed based on thegenetic distance matrix using the PHYLIP programpackage, version 3.67. Then, the reliability of thedendrogram was estimated by calculating bootstrappingvalues (1,000 replicates) facilitated by PHYLIP programpackage. The dendrogram was visualized in TreeView,version 1.6.6 (Page 1996).
Multilocus genotypes of individuals in each populationcollected in July 2007 were assigned to those of thepopulations collected in January 2007 using GeneClass2(assignment threshold, 0.05; criteria for computation,Bayesian method of Rannala and Mountain 1997; resam-pling algorithm: Paetkau et al. 2004; minimum number ofsimulated individuals, 1,000; Piry et al. 2004).
Results
Cluster Analysis
The log probabilities Ln P(X|K) associated with differentnumbers of genetic clusters K, based on the analyses of 277individuals of green mussels collected in January 2007showed the highest value at K=7 (Ln P(X|K)=5002.27),and ΔK was also highest at the same number of K (ΔK=4.864). While the samples collected in July 2007 (a total of233 individuals) showed highest Ln P(X|K; −4275.23) andΔK (2.406) at K=3. However, the clustering patterns werenot clear for both analyses. Therefore, we performed furtheranalyses based on the original grouping according tosampling sites.
Hardy–Weinberg Equilibrium, Bottleneck Tests,and Genotype Disequilibrium
Due to departure from Hardy–Weinberg equilibrium (P<0.0009, sequential Bonferroni correction) of the majority ofpopulations, the data were tested for a presence of null
alleles. Null alleles were detected at five loci, at AGM03;AGM05 in ten of 11 populations (except for MK-1); atAGM07 in CP-1, BP-1, 2, and MK-2; at AGM09 andAGM12 in TC-1 and BK-2. However, after the data wereadjusted according to the suggestion made by the program,the overall test results were still unchanged wherein ten of11 populations (except for SR-2) did not conform to HWEtowards homozygote excess. It was noteworthy that thelocuswise tests revealed that only two loci, AGM03(observed in three populations) and AGM05 (observed ineight populations) contributed to departure from HWE. Inaddition, there was no sign of recent bottleneck andgenotypes disequilibrium (data not shown) in everypopulation.
Genetic Variation Within Populations
The populations of green mussel in the Gulf of Thailand hadmoderate genetic variation (Table 2), and differences inparameters were not observed among populations (t test, P>0.01/54), and average number of alleles per locus rangedfrom 10.40±5.86 to 12.20±7.36; allelic richness rangedfrom 10.23±5.68 to 12.06±7.23; observed heterozygosityranged from 0.52±0.21 to 0.63±0.18 and expected hetero-zygosity ranged from 0.66±0.32 to 0.73±0.27. However, theaverage effective number of alleles/locus was relatively small(ranged from 5.36±3.74 to 6.59±4.49) due to a presence ofalleles with low frequencies (data not shown).
Genetic Variation Between Populations
The overall population subdivision was revealed by the FST
of 0.0095 (bootstrap P0.95=0.0043–0.0156). Likewise, FST
among each temporal group of populations was statisticallysignificant (FST=0.0046, CI0.95=0.0020–0.0083 for thesamples collected in January 2007, and FST=0.0088,CI0.95=0.0010–0.0162 for the samples collected in July2007).
The AMOVA showed that the variation betweentemporal groups accounted for 1.23% of total variationand was statistically significant (P=0.00000). Variationbetween populations within groups contributed the least(0.37%, P=0.04203) while the largest proportion oftotal variation (98.40%) occurred within populations(P=0.00000).
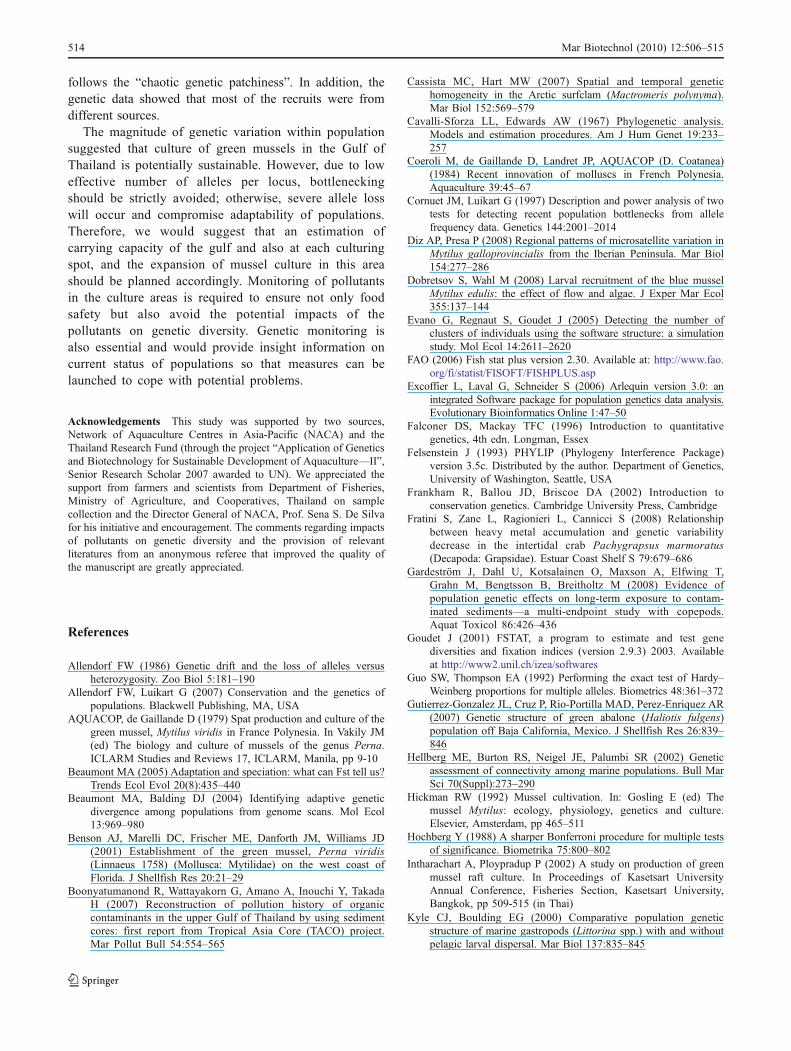
A majority of significantly different genetic testsoccurred between temporal groups (15 of 30 pairs asdetailed in Table 3), while the difference between popula-tions within each group was minimal, one (BK-1 and SR-1)of 15 population pairs among samples collected in January,2007 and three (TC-2 and BK-2, SR-2 and BK-2 and SR-2and TC-2) among samples collected in July, 2007. PairwiseFST revealed significant differences between temporal
Mar Biotechnol (2010) 12:506–515 509

groups in eight population pairs, but differences were notobserved within each temporal group based on pairwiseFST. It should be noted that differences between temporalsamples within a location were observed for TC (based onpopulation differentiation test), BK (based on pairwise FST)and SR (based on both tests).
Genetic Distance and Multiple Dimensional Scaling
Genetic distance between populations within or betweentemporal groups fell in the same range (0.013–0.021 forJanuary, 2007 samples; 0.015–0.032 for July, 2007 samplesand 0.015–0.028 between populations collected at differenttimes; Table 3). MDS (stress value=0.107; R2=0.889;Fig. 2) separated populations into two groups almostentirely according to collection times except for twopopulations, TC-1 and MK-2, which were grouped withdifferent temporal groups.
Correlation Between Genetic Distance and GeographicDistance
Mantel’s test showed no correlation between geneticdistance and geographic distance between populations ofgreen mussel, correlation coefficient r=0.1445 (P>0.05)for samples collected in January 2007 and r=0.4302 (P>0.05) for samples collected in July 2007.
Population Assignment
In order to identify the most likely origins of populationrecruitment, Bayesian assignment was used to assign
individuals of each population collected in July 2007 topopulations collected in January 2007 based on multilocusgenotypes. The result is shown in Table 4 wherein self-recruitment was observed only for MK. The other fourpopulations were likely recruited from other populationseither nearby or far away.
Discussion
Heterozygote Deficiency of all but one Population
In general, departure from HWE towards homozygote excessmay be explained by one or combinations of the followingmechanisms; inbreeding, positive assortative mating, mixingof genetically distinct populations in a sample (Wahlundeffect) and selection against heterozygotes or particular alleles(Falconer and Mackay 1996). In addition, presence of nullallele, alleles that produce no PCR products, also causeheterozygote deficiency (O’Connell and Wright 1997).However, in marine bivalves, especially species with highdispersal ability, not all of these mechanisms are accountedfor heterozygote deficits. In green mussel, inbreeding andpositive assortative mating unlikely occurs because ofbroadcast mating and high dispersal ability of larvae(reviewed by Rajagopal et al. 2006). Furthermore, in thepresent study, a problem associated with null alleles has beenfixed by adjusting allele frequencies as suggested by theMICRO-CHECKER program. Wahlund effect was notobserved as indicated by absence of genotype disequilibrium(Falconer and Mackay 1996). Selection which was shownfor allozymes in bivalves [e.g. at the leucine aminopeptidase
Table 2 Genetic diversity within populations of eleven populations of green mussel representing six populations collected from differentlocalities and five populations representing temporal populations of five localities
Population A Ae Ar Ho He
TP-1 11.20±6.76 5.92±4.68 10.77±6.51 0.52±0.22 0.66±0.32
MK-1 11.80±6.90 5.72±3.98 11.49±6.60 0.59±0.25 0.70±0.26
MK-2 11.60±6.70 5.82±3.51 11.35±6.42 0.57±0.19 0.73±0.26
TC-1 11.40±6.73 6.15±4.13 11.16±6.63 0.54±0.29 0.70±0.30
TC-2 11.60±6.80 5.86±4.40 11.38±6.63 0.59±0.22 0.70±0.30
CY-1 10.80±5.50 5.44±3.55 10.80±5.50 0.58±0.11 0.73±0.22
CY-2 12.00±7.04 6.35±4.77 11.62±6.69 0.63±0.18 0.72±0.25
BK-1 11.00±7.21 5.99±5.04 10.80±7.01 0.54±0.23 0.68±0.31
BK-2 12.20±7.36 6.59±4.49 12.06±7.23 0.58±0.27 0.73±0.27
SR-1 11.20±5.98 5.64±4.05 11.10±5.94 0.52±0.21 0.67±0.30
SR-2 10.40±5.86 5.36±3.74 10.23±5.68 0.62±0.23 0.70±0.28
Mean 11.38±0.53 5.90±0.37 11.16±0.50 0.57±0.04 0.70±0.02
Note: A mean number of alleles per locus, Ae effective number of alleles per locus, Ar allelic richness, Ho observed heterozygosity, He expectedheterozygosity (population abbreviation as in Table 1). The t tests revealed no difference of each genetic variation parameter among populations(P>0.01/54, Bonferroni correction)
510 Mar Biotechnol (2010) 12:506–515
locus in the blue mussel, Mytilus edulis, reviewed byHellberg et al. (2002)], is also a possible explanation forthe departure from HWE in the present study. Selection onneutral loci may occur through the linkage of the neutral lociwith a locus under selection forces (Slatkin 1995), which, inthis case, may be the environmental pollutants (see moredetails in following discussion). Alternatively, our resultsshowed that the departure from HWE was relatively specificto loci with high number of alleles (e.g. AGM05 showedheterozygote deficiency in eight of 11 populations). There-fore, despite the fact that heterozygote deficit is commonamong bivalves (e.g. Ríos et al. 2002; Ravago-Gotanco et al.2007; Cassista and Hart 2007; Diz and Presa 2008), webelieved that heterozygote deficit in this study was partly dueto insufficient sample size for the locus with high allelenumber.
Genetic Variation Within Populations
Despite heavy exploitation (e.g. >250,000 tonnes wereharvested annually) and frequent mass mortality due to lowsalinity during the rainy season, substantial genetic varia-tion within populations of green mussel in the Gulf ofThailand was still retained and was commensurate withthose reported for green mussel in Singapore (based on 36individuals scored at ten microsatellite loci; number ofalleles/locus, A=11.7; observed heterozygosity, Ho=0.65;expected heterozygosity, He=0.69, Lin et al. 2007) andother wild populations of shellfishes of similar life history,e.g. Mytilus galloprovincialis (A=11.9, He=0.77, Diz andPresa 2008), oyster (Crassostrea gigas; A=10.6; Ho=0.521;Sekino et al. 2003), European oyster (Ostrea edulis; A=T
able
3Genetic
distance,Cavalli-SforzaandEdw
ard(196
7)andpairwiseFSTbetweenpo
pulatio
nsof
greenmusselin
Thailand
Pop
ulation
TP
MK-1
MK-2
TC-1
TC-2
CP-1
CP-2
BK-1
BK-2
SR-1
SR-2
TP
0.01
80.02
20.01
50.01
90.01
70.01
80.01
60.02
80.01
50.02
6
MK-1
0.00
384
–0.01
60.01
80.02
70.01
30.01
70.01
30.01
70.01
70.01
8
MK-2
0.02
850
0.01
092
–0.02
10.02
00.01
70.01
70.01
70.02
20.02
00.01
7
TC-1
0.00
959
−0.000
690.00
392
–0.02
40.02
00.01
50.02
10.02
10.01
90.02
0
TC-2
0.01
364a
0.00
986
−0.001
570.00
341
–0.02
70.01
80.02
10.03
20.02
30.02
1
CP-1
0.00
721
−0.001
45−0
.001
84−0
.006
90−0
.000
49–
0.01
60.02
00.02
50.02
10.01
6
CP-2
0.01
965
0.00
175
−0.004
680.00
472
0.00
216
−0.001
28–
0.02
10.02
10.02
00.01
5
BK-1
0.00
535
0.00
261
0.01
031
0.00
133
0.00
239
0.00
487
0.0112
8–
0.02
20.01
90.02
0
BK-2
0.05
433a
0.02
829a
0.00
757
0.00
957
0.02
171
0.01
342
0.01
575
0.02
643a
–0.02
70.02
2
SR-1
−0.005
89−0
.004
190.01
970
0.00
501
0.00
906
0.00
353
0.01
259
0.00
380
0.04
729a
–0.02
5
SR-2
0.04
053a
0.02
173
−0.003
370.01
910
−0.000
480.00
691
0.00
219
0.01
815a
0.02
287
0.03
045a
–
Cavalli-SforzaandEdw
ard(196
7;abov
ediagon
al)andpairwiseFSTbetweenpo
pulatio
nsof
greenmusselin
Thailand
.A
popu
latio
npairwith
sign
ificantgenetic
differentiatio
n(P
<0.00
09,
sequ
entialBon
ferron
icorrectio
n)was
markedby
theitalicized
FSTvalues
aDenotes
sign
ificantdifference
ofpairwiseFST,P<0.00
09,sequ
entialBon
ferron
icorrectio
n
BK-1MK-1
SR-1TP-1
CY-1
MK-2
BK-2
CY-2
SR-2
2.0
1.0
0.0
3.0
2.0
1.0
0.0
-1.0
-2.0
-1.0
-2.0-2.0
-1.0
0.0
1.0
2.0
Dim
ensi
on 1
Dimention 2
Dimention 3
TC-2 TC-1
Fig. 2 Multidimensional scaling based on genetic distance matrix ofgreen mussel populations in Thailand; population abbreviation as inTable 1
Mar Biotechnol (2010) 12:506–515 511

14.92, Ho=0.736, Vercaemer et al. 2003), green abalone(Haliotis fulgens; A=13.33; Ho=0.715, Gutierrez-Gonzalezet al. 2007) and Japanese scallop (Patinopecten yessoensis)(A=7.9, Ho=0.52, He=0.67; Li et al. 2007). Therefore,despite lacking baseline data for genetic variation of greenmussel in the area studied presently, a failure to detectbottleneck (significant reduction of effective populationsize) suggests that heavy exploitation and mass mortalitydid not cause genetic degradation of green mussels in theGulf of Thailand. Our results agree with farmers’ practicewhereby the green mussels were harvested when about8 months old (Intharachart and Ploypradup 2002) when firstspawning already took place at about 2 months old(Niemsab 1975). Therefore, they already contributedgenetic materials to the next generation prior to harvesting.Similarly, mass mortality due to low salinity had limitedimpacts on genetic variation. This may be explained byasynchronous occurrence of mass mortality in each area. Assuch, the depleted population(s) is recovered by the recruitsfrom other areas. This explanation is supported by a reportthat recruitment of green mussel in the Gulf of Thailandwas from other sources (Prakoon et al., present study) andalso low genetic differentiation among spatial populationsobserved in this study.
The current genetic variation indicated substantialadaptive potential of green mussel populations in the Gulfof Thailand. Hence, this may ensure sustainability of greenmussel culture provided that environmental factors arewithin the optimal range. In general, number of alleles perlocus is more important than heterozygosity because highnumber of alleles allow better adaptability of populations tochanging environment (Allendorf 1986; Allendorf andLuikart 2007). Furthermore, loss of allele diversity is hardto recover (theoretically two mechanisms are involved,genetic introgression from other populations and mutationwhich requires 104 generations to generate novel micro-satellite allele in mammal, Frankham et al. 2002), whileheterozygosity, although relates with effective populationsize (Ne), can be recovered if Ne increases in subsequentgenerations (Falconer and Mackay 1996). The relativelylow effective number of alleles per locus indicated thatthere were many alleles with low frequencies and thus willeasily become extinct if bottleneck occurs.
Population Structure
The model-based approach failed to re-cluster the samples,although a new number of populations was suggested. Thiswas because of low level of population structuringindicated by low FST that compromised the power of thismethod (Pritchard et al. 2000).
Low level of genetic differentiation among spatialpopulations of green mussel in the Gulf of Thailand(FST=0.0046 and 0.0088 respective to January and Julysamples compared with the average of 0.062 reported for57 marine species; Waple 1998) was in accordance withits early life history as planktonic larvae and the smallgeographic distance between populations. Although greenmussel is a sedentary species, its larvae have lengthyplanktonic stages (about 3 to 4 weeks, reviewed byRajagopal et al. 2006), thus enhancing gene flow amonglocal populations by dispersal of larvae triggered by seacurrents. As such, like other marine invertebrates, popu-lation differentiation is minimal (e.g. lack or very lowpopulation structure of planktonic-developing gastropods,Littorina scutulata and Littorina plena, compared withthat of the direct developed congeneric gastropods,Littorina subrotundata; Kyle and Boulding 2000; thesame level of genetic differentiation of two species ofcoral possessing different reproductive modes and larvaltypes but with equivalent larval dispersal (Miller and Ayre2008)). Among the samples collected in January, only BK-1and SR-1, only 22 km apart, showed substantial geneticdifferentiation. Such difference also occurred for the cohortcollected in July and thus supported that genetic differentia-tion existed. The population assignment showed that BK-2was recruited from MK-1 suggesting that genetic differenti-ation observed here was caused by differences of recruitsrather than other causes, e.g. historic geographic event orlimitation of current gene flow between adjacent populations(reviewed by Kyle and Boulding 2000) or post-settlementselection (Diz and Presa 2008). In addition, it is also possiblethat an active process affected by some factors (e.g.boundary-layer hydrodynamics and algal waterborne com-pounds, Dobretsov and Wahl 2008) have played a role inshaping the settlement pattern which may eventually lead topopulation differentiation.
Assigningpopulations
Populationof origin-1
Percentage(%)
Populationof origin-2
Percentage(%)
Populationof origin-3
Percentage(%)
MK-2 MK-1 98.01 BK-1 1.92 CY-1 0.08
TC-2 TP-1 99.00 BK-1 0.94
CY-2 TC-1 99.18 CY-1 0.44 MK-1 0.38
BK-2 MK-1 100.00
SR-2 CY-1 99.99
Table 4 Results of Bayesianassignment of populationscollected in July 2007 to basepopulations collected in January2007
512 Mar Biotechnol (2010) 12:506–515

It may also be possible that the seasonal sea currents,moving clockwise (during May–June) and counterclock-wise (during Nov–Jan; NEDECO 1965 cited afterPutikiatkajorn 1998) accounted for a lack of geneticdifferentiation between TP and the upper gulf’s popula-tions located more than 450 km apart. The studyconducted on the scallop, Mimachlamys senatoria whichis mostly sedentary with pelagic larvae, in the Gulf ofThailand showed significant genetic difference between apopulation collected from the upper gulf and one fromPrachuab Kirikhan, 255 km apart (Na-Nakorn, unpub-lished data). Therefore, we surmise that the TC populationmay be of upper gulf origin and was transferred foraquaculture. This practice is common due to insufficientspat being available in Tapi River mouth (Wangvoralak etal. 2006).
It is likely that a genetic structure of green mussel wasinconsistent with the stepping-stone genetic model, whereingenetic distance correlates with geographic distance, rather,it followed the “chaotic genetic patchiness” where geneticdifferentiation among spatial populations was very low, andgenetic differentiation of different cohorts was significant(reviewed by Hellberg et al. 2002).
Possible Impacts of Marine Pollutants on Genetic Diversity
Owing to pollutants found in the Gulf of Thailand [e.g.polychlorinated biphenyl, linear alkylbenzenes, hopanes,polycyclic aromatic hydrocarbons (Boonyatumanond et al.2007), 1.2 mg of cadmium, 0.78 mg of chromium, 9.85 mgof copper, 1.09 mg of lead and 2.78 mg of manganese per kgdry weight of green mussel (Ruangwises and Ruangwises1998)], it has been our concern that they may impact geneticdiversity of the green mussel in this study. Recent reportsshowed the effects of pollutants on genetic variation ofaquatic animals based on different marker types, forexample, decline of allozyme heterozygosity of chub(Leuciscus cephalus) collected from polluted part of smallriver system (Larno et al. 2001); higher allozyme variation ofgreen mussel exposed to pollutants (Yap et al. 2004);reduction of AFLP heterozygosity of the harpacticoidcopepod, Attheyella crassa exposed to copper but not ofthe group exposed to natural contaminants (Gardeström et al.2008); decline of microsatellite allelic diversity and hetero-zygosity of the midge (Chironomus riparius) strains exposedto selection for tributyltin resistance (Nowak et al. 2009);decline of d2(the square of the difference in repeat unitsbetween two alleles at one locus) and increase geneticrelationship between individual of the intertidal crab,Pachygrapsus marmoratus exposed to heavy metal pollu-tants (Fratini et al. 2008). The impacts were attributed toreduction of effective population sizes (e.g. Nowak et al.2009) and selection (e.g. Yap et al. 2004). Selection on a
microsatellite occurs if it closely links with a selectedlocus, whereby the results on genetic variation varyaccording to any of the following types of selection; areduction on variance of allele size due to backgroundselection (a selected locus is deleterious) and hitch-hiking selection (a selected locus is selectively favorable)and increase variance of allele size due to overdominanceat a selected locus (Slatkin 1995). For example, Nielsenet al. (2006) demonstrated hitch-hiking selection, with astrong support of statistical analyses (Lewontin–Krakauertest and ln Rθ test), at about 25% of microsatellite loci inAtlantic cod, Gadus morhua which resulted in elevatedgenetic differentiation and low variability. Nevertheless,based on the present data, whether and how the contam-inants impact genetic diversity of the green musselpopulations in the upper gulf is still uncertain and henceneeds follow-up study using sufficient number of loci (e.g.>10 loci), good sample collection plan, and appropriatedata analyses (for details see Beaumont and Balding 2004;Beaumont 2005; Nielsen et al. 2006).
Temporal Variation and Sources of Recruits
Temporal variation observed for TC, BK, and SR popula-tions may be explained by the following reasons: (1)recruitment from different genetic distinct population(s), (2)selection at early life stage, (3) small chance of fertilizationand survival during pelagic phase (reviewed by Hellberg etal. 2002). Population assignment suggested that TC2 couldhave been recruited from larvae of TP. Likewise, recruits ofCY was from TC, BK from MK, and SR from CY.However, due to the possibility of spats transplant from theupper gulf to TP (Wangvoralak et al. 2006), the analysiswas rerun without TP. We found that the most likely sourcepopulation of TC was BK-1 (data not shown). Recruitmentfrom other source was possible in marine shellfish, e.g.Goniodoris nodosa (Lambert et al. 2003; reviewed byLarson and Julian 1999). Notably, in this study, most of therecruitment was not from the adjacent population. It ispossible that mass mortality may occur more seriously insome populations (e.g. MK) than the others. Consequently,the abundance of larval decline hence allows for settlementof larvae from other distant origins.
Conclusion and Implication for Aquaculture
In conclusion, the populations of green mussel in the Gulfof Thailand had substantial within-population geneticvariation which implied limited adverse impacts fromheavy exploitation and frequent mass mortality. They weregenetically distinct in space and time, wherein the magni-tude of genetic differentiation did not conform to geo-graphic distances. The overall population structure likely
Mar Biotechnol (2010) 12:506–515 513
follows the “chaotic genetic patchiness”. In addition, thegenetic data showed that most of the recruits were fromdifferent sources.
The magnitude of genetic variation within populationsuggested that culture of green mussels in the Gulf ofThailand is potentially sustainable. However, due to loweffective number of alleles per locus, bottleneckingshould be strictly avoided; otherwise, severe allele losswill occur and compromise adaptability of populations.Therefore, we would suggest that an estimation ofcarrying capacity of the gulf and also at each culturingspot, and the expansion of mussel culture in this areashould be planned accordingly. Monitoring of pollutantsin the culture areas is required to ensure not only foodsafety but also avoid the potential impacts of thepollutants on genetic diversity. Genetic monitoring isalso essential and would provide insight information oncurrent status of populations so that measures can belaunched to cope with potential problems.
Acknowledgements This study was supported by two sources,Network of Aquaculture Centres in Asia-Pacific (NACA) and theThailand Research Fund (through the project “Application of Geneticsand Biotechnology for Sustainable Development of Aquaculture—II”,Senior Research Scholar 2007 awarded to UN). We appreciated thesupport from farmers and scientists from Department of Fisheries,Ministry of Agriculture, and Cooperatives, Thailand on samplecollection and the Director General of NACA, Prof. Sena S. De Silvafor his initiative and encouragement. The comments regarding impactsof pollutants on genetic diversity and the provision of relevantliteratures from an anonymous referee that improved the quality ofthe manuscript are greatly appreciated.
References
Allendorf FW (1986) Genetic drift and the loss of alleles versusheterozygosity. Zoo Biol 5:181–190
Allendorf FW, Luikart G (2007) Conservation and the genetics ofpopulations. Blackwell Publishing, MA, USA
AQUACOP, de Gaillande D (1979) Spat production and culture of thegreen mussel, Mytilus viridis in France Polynesia. In Vakily JM(ed) The biology and culture of mussels of the genus Perna.ICLARM Studies and Reviews 17, ICLARM, Manila, pp 9-10
Beaumont MA (2005) Adaptation and speciation: what can Fst tell us?Trends Ecol Evol 20(8):435–440
Beaumont MA, Balding DJ (2004) Identifying adaptive geneticdivergence among populations from genome scans. Mol Ecol13:969–980
Benson AJ, Marelli DC, Frischer ME, Danforth JM, Williams JD(2001) Establishment of the green mussel, Perna viridis(Linnaeus 1758) (Mollusca: Mytilidae) on the west coast ofFlorida. J Shellfish Res 20:21–29
Boonyatumanond R, Wattayakorn G, Amano A, Inouchi Y, TakadaH (2007) Reconstruction of pollution history of organiccontaminants in the upper Gulf of Thailand by using sedimentcores: first report from Tropical Asia Core (TACO) project.Mar Pollut Bull 54:554–565
Cassista MC, Hart MW (2007) Spatial and temporal genetichomogeneity in the Arctic surfclam (Mactromeris polynyma).Mar Biol 152:569–579
Cavalli-Sforza LL, Edwards AW (1967) Phylogenetic analysis.Models and estimation procedures. Am J Hum Genet 19:233–257
Coeroli M, de Gaillande D, Landret JP, AQUACOP (D. Coatanea)(1984) Recent innovation of molluscs in French Polynesia.Aquaculture 39:45–67
Cornuet JM, Luikart G (1997) Description and power analysis of twotests for detecting recent population bottlenecks from allelefrequency data. Genetics 144:2001–2014
Diz AP, Presa P (2008) Regional patterns of microsatellite variation inMytilus galloprovincialis from the Iberian Peninsula. Mar Biol154:277–286
Dobretsov S, Wahl M (2008) Larval recruitment of the blue musselMytilus edulis: the effect of flow and algae. J Exper Mar Ecol355:137–144
Evano G, Regnaut S, Goudet J (2005) Detecting the number ofclusters of individuals using the software structure: a simulationstudy. Mol Ecol 14:2611–2620
FAO (2006) Fish stat plus version 2.30. Available at: http://www.fao.org/fi/statist/FISOFT/FISHPLUS.asp
Excoffier L, Laval G, Schneider S (2006) Arlequin version 3.0: anintegrated Software package for population genetics data analysis.Evolutionary Bioinformatics Online 1:47–50
Falconer DS, Mackay TFC (1996) Introduction to quantitativegenetics, 4th edn. Longman, Essex
Felsenstein J (1993) PHYLIP (Phylogeny Interference Package)version 3.5c. Distributed by the author. Department of Genetics,University of Washington, Seattle, USA
Frankham R, Ballou JD, Briscoe DA (2002) Introduction toconservation genetics. Cambridge University Press, Cambridge
Fratini S, Zane L, Ragionieri L, Cannicci S (2008) Relationshipbetween heavy metal accumulation and genetic variabilitydecrease in the intertidal crab Pachygrapsus marmoratus(Decapoda: Grapsidae). Estuar Coast Shelf S 79:679–686
Gardeström J, Dahl U, Kotsalainen O, Maxson A, Elfwing T,Grahn M, Bengtsson B, Breitholtz M (2008) Evidence ofpopulation genetic effects on long-term exposure to contam-inated sediments—a multi-endpoint study with copepods.Aquat Toxicol 86:426–436
Goudet J (2001) FSTAT, a program to estimate and test genediversities and fixation indices (version 2.9.3) 2003. Availableat http://www2.unil.ch/izea/softwares
Guo SW, Thompson EA (1992) Performing the exact test of Hardy–Weinberg proportions for multiple alleles. Biometrics 48:361–372
Gutierrez-Gonzalez JL, Cruz P, Rio-Portilla MAD, Perez-Enriquez AR(2007) Genetic structure of green abalone (Haliotis fulgens)population off Baja California, Mexico. J Shellfish Res 26:839–846
Hellberg ME, Burton RS, Neigel JE, Palumbi SR (2002) Geneticassessment of connectivity among marine populations. Bull MarSci 70(Suppl):273–290
Hickman RW (1992) Mussel cultivation. In: Gosling E (ed) Themussel Mytilus: ecology, physiology, genetics and culture.Elsevier, Amsterdam, pp 465–511
Hochberg Y (1988) A sharper Bonferroni procedure for multiple testsof significance. Biometrika 75:800–802
Intharachart A, Ploypradup P (2002) A study on production of greenmussel raft culture. In Proceedings of Kasetsart UniversityAnnual Conference, Fisheries Section, Kasetsart University,Bangkok, pp 509-515 (in Thai)
Kyle CJ, Boulding EG (2000) Comparative population geneticstructure of marine gastropods (Littorina spp.) with and withoutpelagic larval dispersal. Mar Biol 137:835–845
514 Mar Biotechnol (2010) 12:506–515
Lambert WJ, Todd CD, Thorpe JP (2003) Genetic population structureof two intertidal nudibranch molluscs with contrasting larvaltypes: temporal variation and transplant experiments. MarBiotechnol 142:461–471
Larno V, Laroche J, Launey S, Flammarion P, Devaux A (2001)Responses of chub (Leuciscus cephalus) populations to chemicalstress, assessed by genetic markers, DNA damage and cytochromeP4501A induction. Ecotoxicology 10:145–158
Larson RJ, Julian RM (1999) Spatial and temporal genetic patchinessin marine populations and their implications for fisheriesmanagement. CalCOFI Rep 40:94–99
Li Q, Xu K, Yu R (2007) Genetic variation in Chinese hatcherypopulations of the Japanese scallop (Patinopecten yessoensis)inferred from microsatellite data. Aquaculture 253:229–237
Lin G, Feng F, Yue GH (2007) Isolation and characterization ofpolymorphic microsatellites from Asian green mussel (Pernaviridis). Mol Ecol Notes 7:1036–1038
Miller MP (1997) Tools for population genetic analyses (TFPGA)version 1.3. Department of Biological Sciences, NorthernArizona University, Arizona
Miller KJ, Ayre DJ (2008) Population structure is not a simplefunction of reproductive mode and larval type: insights fromtropical coral. J Anim Ecol 77:713–724
NEDECO (1965) Cited after Putikiatkajorn P (1998) MS Thesis,Graduate School, Burapha University, Chon Buri. (in Thai)
Nielsen EE, Hansen MM, Meldrup D (2006) Evidence of microsatellitehitch-hiking selection in Atlantic cod (Gadus morhua L.): implica-tions for inferring population structure in nonmodel organisms.Mol Ecol 15:3219–3229
Niemsab P (1975) Effects of environment on growth of green musselMytilus viridis Linn. MS Thesis, Department of Marine Science,Graduate School, Chulalongkorn University, Bangkok. (in Thai)
Nowak C, Vogt C, Pfenninger M, Schwenk K, Oehlmann J, Streit B,Oetken M (2009) Rapid genetic erosion in pollutant-exposedexperimental chironomid populations. Environ Pollut 157:881–886
O’Connell M, Wright JM (1997) Microsatellite DNA in fishes. RevFish Biol Fish 7:331–363
Oosterhout CV, Hutchinson WF, Wills DPM, Shipley P (2004) MICRO-CHECKER: software for identifying and correcting genotypingerrors in microsatellite data. Mol Ecol Notes 4:535–538
Page RDM (1996) TreeView: an application to display phylogenetictrees on personal computers. Computer Applications in theBiological Sciences 12:357–358
Paetkau D, Slade R, Burden M, Estoup A (2004) Genetic assignmentmethods for the direct, real-time estimation of migration rate: asimulation-based exploration of accuracy and power. Mol Ecol13:55–65
Parulekar AH,Dalal SG, Ansari ZA, Harkantra SN (1982) Environmentalphysiology of raft-grownmussels in Goa, India. Aquaculture 29:83–93
Piry S, Alapetite A, Cornuet JM, Paetkau D, Baudouin L, Estoup A(2004) GENECLASS2: a software for genetic assignment andfirst-generation migrant detection. J Hered 95(6):536–539
Pritchard JK, Stephens M, Donnelly P (2000) Inference of populationstructure using multilocus genotype data. Genetics 155:945–959
Rajagopal S, Venugopalan VP, Nair KVK, Van der Velde G, JennerHA, Den Hartog C (1998) Reproduction, growth rate and culturepotential of the green mussel, Perna viridis (L.) in Edaiyurbackwaters, east coast of India. Aquaculture 162:187–202
Rajagopal S, Venugopalan VP, van der Velde G, Jenner HA (2006)Greening of the coast: a review of the Perna viridis success story.Aquat Ecol 40:273–297
Rannala B, Mountain JL (1997) Detecting immigration by usingmultilocus genotypes. Proc Natl Acad Sci USA 94:9197–9221
Raochai S (2004) Effects of low salinity on mortality of green-lippedmussel (Perna viridis Linneaus). Thai Fish Gasette 57(3):229–233
Ravago-Gotanco RG, Magsino RM, Juinio-Menez MA (2007)Influence of the north equatorial current on the populationgenetic structure of Tridacna crocea (Mollusca: Tridacnidae)along the eastern Philippine seaboard. Mar Ecol Prog Series336:161–168
Raymond M, Rousset F (1995) Genepop (version 1.2): populationgenetics software for exact tests and ecumenicism. J Hered86:248–249
Rice WR (1989) Analyzing tables of statistical tests. Evolution43:223–225
Ríos C, Sanz S, Saavedra C, Pena JB (2002) Allozyme variation inpopulations of scallops, Pecten jacobeus (L.) and P. maximus (L.)(Bivalvia: Pectinidae), across the Almería-Oran front. J Exp MarBiol Ecol 267:223–244
Ruangwises N, Ruangwises S (1998) Heavy metals in green mussels(Perna viridis) from the Gulf of Thailand. J Food Protect 61:94–97
Sekino M, Hamaguchi M, Aranishi F, Okashi K (2003) Developmentof novel microsatellite DNA markers from the Pacific oyster(Crassostrea gigas). Mar Biotechnol 5:227–233
Sivalingam PM (1977) Aquaculture of the green mussel, Mytilusviridis Linnaeus, in Malaysia. Aquaculture 11:297–312
Slatkin M (1995) Hitchhiking and associative overdominance at amicrosatellite locus. Mol Biol Evol 12(3):473–480
Sriraja Fisheries Station. Undate. Culture and processing of greenmussel. Technical Paper, Sriraja Fisheries Station, KasetsartUniversity Research and Development Institute, Bangkok. (inThai)
Taggart JB, Hynes RA, Prodöhl PA, Ferguson A (1992) A simplifiedprotocol for routine total DNA isolation from salmonid fishes. JFish Biol 40:963–965
Vercaemer B, Spence K, Kenchington E, Mallet A, Harding J (2003)Assessment of genetic diversity of the European oyster (Ostreaedulis) in Nova Scotia using microsatellite markers. CanadianTechnical Report of Fisheries and Aquatic Science No. 2453,Department of Fisheries and Oceans, Dartmouth. pp 30
Wangvoralak S, Kaewnoen M, Ajjimangkool S, Srisomvongse C(2006) Study on culture pattern, using of woods and cost-benefitanalysis in green mussel (Perna viridis) culture: a case study inChachoengsao and Surat Thani province. In Proceedings of 44thKasetsart University Annual Conference: Fisheries Section.Kasetsart University, Bangkok, pp. 501–509 (in Thai)
Waple RS (1998) Separating the wheat from the chaff: patterns ofgenetic differentiation in high gene flow species. J Heredity89:438–450
Wilkinson L, Hill M, Weln JP, Birkenbeuel GK (1992) SYSTAT forwindows Statistics, Version 5.0 Edition. Evanston, IL: SYSTAT,Inc.751 pp
Yap CK, Tan SG, Ismail A, Omar H (2002) Genetic variation of thegreen-lipped mussel Perna viridis (L.) (Mytilidae: Mytiloida:Mytilicae) from the West Coast of Peninsular Malaysia. ZoologicalStudies 41:376–387
Yap CK, Tan SG, Ismail A, Omar H (2004) Allozyme polymorphismsand heavy metal levels in the green-lipped mussel Perna viridis(Linnaeus) collected from contaminated and uncontaminatedsites in Malaysia. Environ Int 30:39–46
Yeh FC, Yang RC, Boyle T (1999) POPGENE version 1.31. Microsoftwindow-based software for population genetics analysis, Universityof Alberta and Centre for International Forestry Research, Alberta,Canada
Mar Biotechnol (2010) 12:506–515 515
Copyright © 2022 FDOKUMEN