Central Place Models of Acorn and Mussel Processing
13
Journal of Archaeological Science (1997) 24, 887–899 Central Place Models of Acorn and Mussel Processing Robert L. Bettinger and Ripan Malhi Department of Anthropology, University of California, Davis, CA 95616 U.S.A. Helen McCarthy 1100 Dartmouth Pl., Davis, CA 95616 U.S.A. (Received 21 February 1996, revised manuscript accepted 10 August 1996) We use a central place foraging model of field resource processing to explore the archaeological implications of experimental and ethnographical observations pertaining to the collection and processing of black oak (Quercus kelloggii) and big mussel (Mytilus californianus). These data suggest oak field processing will generally be minimal and confined mainly to drying and that big mussel may be transported unprocessed or completely processed depending on round-trip travel time and mussel colony productivity. Archaeological data further demonstrate that the field processing of mussels is frequently at odds with central place model predictions, suggesting optimization of quantities other than calories and time. ? 1997 Academic Press Limited Keywords: CENTRAL PLACE FORAGING, FIELD PROCESSING, ACORN (QUERCUS SPP.), MUSSEL (MYTILUS SPP.), WESTERN MONO. Introduction A rchaeology is by nature a quantitative disci- pline, but the relationship between the quan- tities we measure (e.g. number, density, relative frequency, length) and theories we hold has not always been clear. Recognition of this was the impetus behind the current ‘‘generation of middle range research’’ (Binford, 1977; Grayson, 1986; Thomas, 1986) which seeks to identify the distinctive archaeological signa- tures of specific human behaviours with reference to the general principles that organize those behaviours. The most successful of these attempts have proceeded on the assumption that human behaviour is rational (i.e. that alternatives are weighed with reference to specified goals) and that this is reflected by patterned regularities in the archaeological record. The pursuit of such regularities in subsistence behaviour using models drawn from optimal foraging theory (OFT) has been particularly active. To date, the bulk of this work has investigated archaeological implications derived from what is termed the diet breadth model, in which sub- sistence alternatives are ranked according to energetic return on time invested once a potential resource is located (handling time), and resources are added by rank to the diet in a way that balances pre-encounter search time and post-encounter handling time to opti- mize energetic return on overall foraging time (i.e. search and handling; see MacArthur & Pianka, 1966). This approach has provided many useful insights (Bettinger, 1991) but suffers a variety of important complications (e.g. Grayson, 1991; Broughton & Grayson, 1993; Madsen, 1993). One is that when locations of procurement and consumption are differ- ent, the content of archaeological plant and animal macrofossil assemblages may be heavily conditioned by post-foraging behaviours designed to increase the efficiency of resource transport from field camps/ locations to residential bases. As Binford (e.g. 1978) has detailed with respect to faunal remains, in that event, since what is left in the field cannot end up at home, and vice versa, field and residential assemblages will present opposite pictures of essentially the same strategic behaviour. A growing body of central place foraging research speaks directly to such situations. Central Place Foraging Theory Central place foraging models are distinct within the larger set of optimal foraging constructs in that they solve problems in which things that have utility (e.g. prey, toolstone, food) are obtained in one location for use in another (Orians & Pearson, 1979). Posing foraging problems in this way constrains the optimal solution by adding round-trip travel time (i.e. to and from central place) to search and handling time expended in foraging. The marginal value theorem (Charnov, 1976) and patch choice model (MacArthur & Pianka, 1966) also consider travel time, but in those cases it is one way between patches, and utility is not imagined as being transported. 887 0305–4403/97/100887+13 r25.00/as960168 ? 1997 Academic Press Limited
Transcript of Central Place Models of Acorn and Mussel Processing
Journal of Archaeological Science (1997) 24, 887–899
Central Place Models of Acorn and Mussel Processing
Robert L. Bettinger and Ripan Malhi
Department of Anthropology, University of California, Davis, CA 95616 U.S.A.
Helen McCarthy
1100 Dartmouth Pl., Davis, CA 95616 U.S.A.
(Received 21 February 1996, revised manuscript accepted 10 August 1996)
We use a central place foraging model of field resource processing to explore the archaeological implications ofexperimental and ethnographical observations pertaining to the collection and processing of black oak (Quercuskelloggii) and big mussel (Mytilus californianus). These data suggest oak field processing will generally be minimal andconfined mainly to drying and that big mussel may be transported unprocessed or completely processed depending onround-trip travel time and mussel colony productivity. Archaeological data further demonstrate that the fieldprocessing of mussels is frequently at odds with central place model predictions, suggesting optimization of quantitiesother than calories and time. ? 1997 Academic Press Limited
Keywords: CENTRAL PLACE FORAGING, FIELD PROCESSING, ACORN (QUERCUS SPP.), MUSSEL(MYTILUS SPP.), WESTERN MONO.
Introduction
A rchaeology is by nature a quantitative disci-pline, but the relationship between the quan-tities we measure (e.g. number, density, relative
frequency, length) and theories we hold has not alwaysbeen clear. Recognition of this was the impetus behindthe current ‘‘generation of middle range research’’(Binford, 1977; Grayson, 1986; Thomas, 1986) whichseeks to identify the distinctive archaeological signa-tures of specific human behaviours with reference tothe general principles that organize those behaviours.The most successful of these attempts have proceededon the assumption that human behaviour is rational(i.e. that alternatives are weighed with reference tospecified goals) and that this is reflected by patternedregularities in the archaeological record. The pursuit ofsuch regularities in subsistence behaviour using modelsdrawn from optimal foraging theory (OFT) has beenparticularly active. To date, the bulk of this work hasinvestigated archaeological implications derived fromwhat is termed the diet breadth model, in which sub-sistence alternatives are ranked according to energeticreturn on time invested once a potential resource islocated (handling time), and resources are added byrank to the diet in a way that balances pre-encountersearch time and post-encounter handling time to opti-mize energetic return on overall foraging time (i.e.search and handling; see MacArthur & Pianka, 1966).This approach has provided many useful insights(Bettinger, 1991) but suffers a variety of important
880305–4403/97/100887+13 r25.00/as960168
complications (e.g. Grayson, 1991; Broughton &Grayson, 1993; Madsen, 1993). One is that whenlocations of procurement and consumption are differ-ent, the content of archaeological plant and animalmacrofossil assemblages may be heavily conditionedby post-foraging behaviours designed to increase theefficiency of resource transport from field camps/locations to residential bases. As Binford (e.g. 1978)has detailed with respect to faunal remains, in thatevent, since what is left in the field cannot end up athome, and vice versa, field and residential assemblageswill present opposite pictures of essentially the samestrategic behaviour. A growing body of central placeforaging research speaks directly to such situations.
Central Place Foraging TheoryCentral place foraging models are distinct within thelarger set of optimal foraging constructs in that theysolve problems in which things that have utility (e.g.prey, toolstone, food) are obtained in one locationfor use in another (Orians & Pearson, 1979). Posingforaging problems in this way constrains the optimalsolution by adding round-trip travel time (i.e. to andfrom central place) to search and handling timeexpended in foraging. The marginal value theorem(Charnov, 1976) and patch choice model (MacArthur& Pianka, 1966) also consider travel time, but in thosecases it is one way between patches, and utility is notimagined as being transported.
7? 1997 Academic Press Limited
888 R. L. Bettinger et al.
Central place models posit that, holding technologyand field conditions constant, optimal foraging behav-iour changes as a function of increasing round-triptravel time from central place to foraging location andback. For example, minimum acceptable prey sizegenerally increases with travel time (Schoener, 1971),which agrees with intuition that larger rewards areneeded to justify longer trips. This has importantarchaeological implications since, in such cases, sub-sistence behaviour at foraging locations cannot bepredicted from the quality and abundance of preyalone, which is assumed in diet breadth model(MacArthur & Pianka, 1966). Similarly, if distance tocentral place encourages field processing of low utilityresource components to increase transport efficiency,the nature and quantity of evidence left from foragingwill also be differentially biased at foraging locationsand the central places from which it is staged. Notsurprisingly, when read this way the archaeologicalexpectations arising from central place foraging paral-lel arguments about site formation explored at lengthby Binford with respect to the importance of establish-ing the strategic context being monitored by individualarchaeological assemblages. Central place foraging hasthe advantage of making these relationships explicitwith respect to critical variables susceptible tomeasurement over a wide range of conditions, mostimportantly, time, weight, and some measure of utility,e.g. energy, nutrients.Among the more familiar central place formulations
(see Kaplan & Hill, 1992: 184–186), the field processingmodel developed and explored by Metcalfe & Barlow(1992; Barlow & Metcalfe, 1996), and more recentlyby Bird & Bliege Bird (1997), is especially well suitedto archaeological application. It asks whether, aftercollecting a resource, one or more stages of fieldprocessing would increase the overall efficiency withwhich resources are delivered from foraging locationsto a central place, the goal being to deliver as muchuseful material (i.e. utility) as quickly as possible tothat central place. Processing usually entails the cullingof waste, for example, the husking and winnowing ofseeds or nuts, or early stage lithic reduction (e.g.decortication), that increases the relative utility of theresource as measured by the proportion of it that willactually be used. For example, if 2 kg of raw toolstoneare required to make 1 kg of finished bifaces, therelative utility (by weight) of unprocessed toolstonewould be 0·50 (because half will end up as waste), whilethe relative utility of toolstone when completely re-duced to usable bifaces would be 1·00. Accordingly, aload of finished bifaces (utility=1·00) will contain twiceas much useful material as the same load of un-processed toolstone (utility=0·50). Since the goal issimply to optimize the delivery of useful material, inwhatever state, from foraging location to central place,any processing that might be subsequently required atthe central place is irrelevant, hence ‘‘costless’’ andpreferred by default, unless field processing decreases
the amount of time it takes to transport useful materialto the central place. Processing can be envisioned as asingle operation during which resource utility increasescontinuously as a function of time, but is more easilytreated as occurring in discrete stages, each character-ized by specific processing times and utility increases,as when bifaces are reduced in a series of stages.The crux of the central place foraging problem is a
tradeoff between processing time and travel time. Fieldprocessing increases the amount of useful material thatcan be carried, hence decreases the amount of traveltime expended per unit of useful material that isdelivered. In the toolstone example above, for instance,because a load of finished bifaces contains twice asmuch useful material as an equal load of unprocessedtoolstone, transporting finished bifaces cuts the traveltime expended per unit of useful material in halfrelative to transporting unprocessed toolstone. At thesame time, field processing increases the amount oftime expended per unit of useful material at theforaging location. Again, with reference to the tool-stone example, it will clearly take more time to collectand reduce 2 kg of toolstone into 1 kg of finishedbifaces than just to collect 2 kg of toolstone, whichrepresents the same amount of useful material.Whether field processing will increase the rate at whichuseful material is delivered to the central place thendepends on: (1) the amount of time processing takes;(2) the amount by which processing increases the utilityof material being transported; and (3) the distance tothe central place. If processing time is low enough, andthe resulting increase in resource utility is high enough,field processing will increase the rate at which usefulmaterial reaches the central place. Even if processing istime costly, it may still increase efficiency if the distancebetween the central place is large, because fewer tripswill have to be made.Barlow & Metcalfe (1996) solved this problem by
comparing the overall rate at which resource utilityis delivered when resources are processed to a givenstage, against the overall rate at which resource utilityis delivered when resources are processed only to theimmediately preceding stage. We present a simpleralternative solution.To start, the rate at which utility is delivered to the
central place when processing to stage j is:
where z is the round-trip travel time, xj is time tocollect and process a load to stage j, formally definedas, xj=(tj /wj)L where tj is time to collect and processan amount of resource equal to wj to stage j, and L isthe size of the load; and yj is the utility of a loadat stage j, formally defined as: yj=ujL, where uj isthe relative utility of the resource at stage j (i.e. theproportion of useful material), and L is again the sizeof the load.
Central Place Models of Field Processing 889
By like reasoning, the rate at which utility isdelivered to the central place without processing tostage j is:
where xj-1is time to collect and process a load to stagej"1 (the stage immediately prior to stage j ), and yj"1is the utility of a load at stage j"1.Processing to stage j will then increase the efficiency
of resource delivery when this reduces the time it takesto get a unit of useful resource to the central place, orwhen
Since the rates at which utility is gained in collectingand specific stages of processing are assumed to beconstant for a given problem, it is round-trip traveltime z that determines whether a particular stage offield processing will be advantageous. It is sensible,then, to solve for the critical round-trip travel time zj,above which field processing to stage j increases, andbelow which it decreases, transport efficiency. This (i.e.zj) is the round-trip travel time at which processing tostage j and processing to stage j"1 deliver utility atexactly the same rate, or when
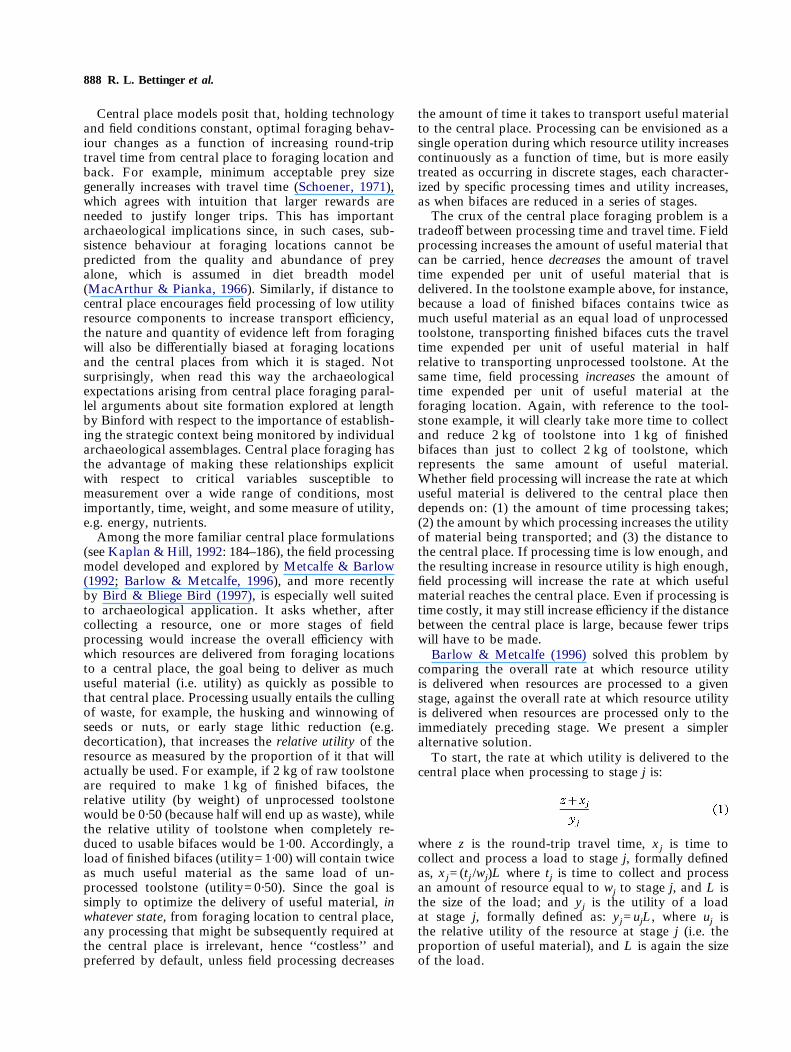
The graphical solution to this problem is shown inFigure 1.Unfortunately, it is difficult to assess the effects of
processing at stage j using equation 4. That is becausetime spent processing at stage j is incorporated in themore general term xj, which also includes time ex-pended in collection and any processing that occursprior to stage j. Similarly, the term yj incorporates theutility gained as a result of processing at stage j withutility gained as a result of collecting and prior pro-cessing. The latter problem is easily dealt with byreworking equation 4 so that the utility gained as aconsequence of processing at stage j is represented bythe term yj"yj"1 (i.e. utility at stage j less utility atprior stage j"1)
The term xj can also be modified to segregate timespent processing at stage j from the time that must bespent in collecting and processing before proceeding tostage j. This is possible because there is a directrelationship between the increase in utility that resultsfrom processing at stage j (i.e. the difference between yjand yj"1) and the amount of time that must be spentcollecting and processing before stage j. Note in par-ticular that since processing at stage j increases re-source utility by removing waste, the collecting andprior processing time needed to complete a full loadwill necessarily increase relative to the amount of time
Travel time
Stage Jtravel threshold
Collecting andprocessing time
at stage J–1
Utility
Xj–1 XjZj
Yj–1
Collecting and processing time
Utility at stage J–1
YjUtility at stage J
A'
B'
AB
Collecting andprocessing time
at stage J
CD
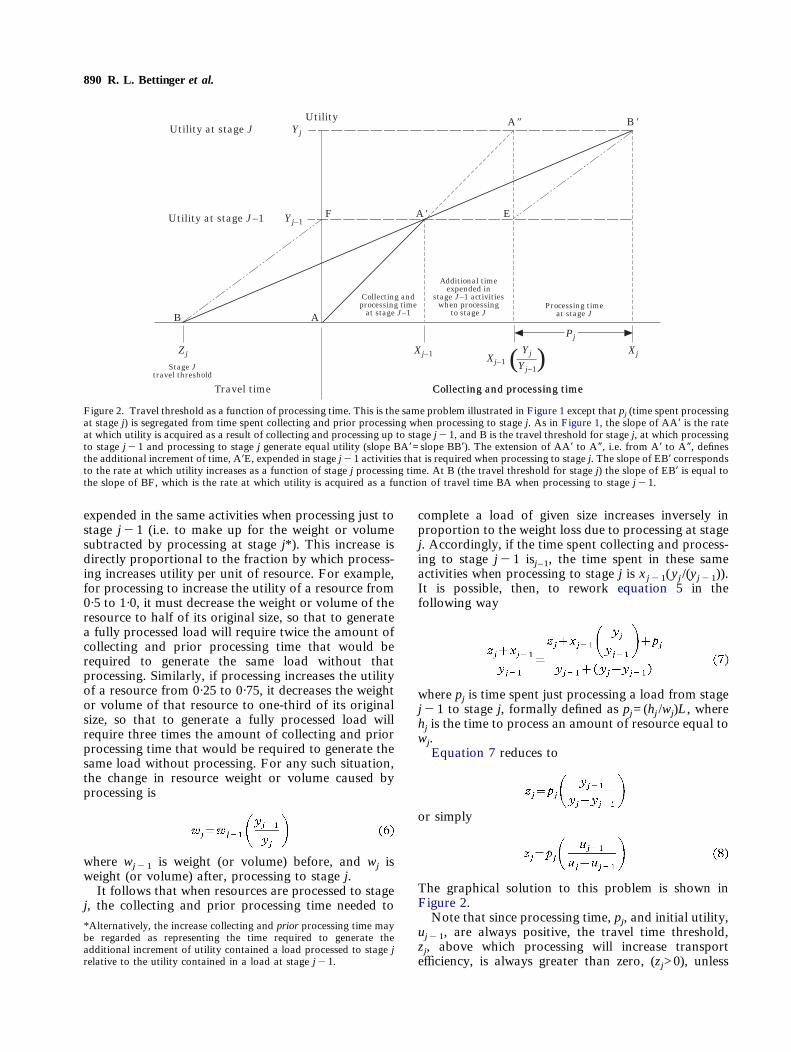
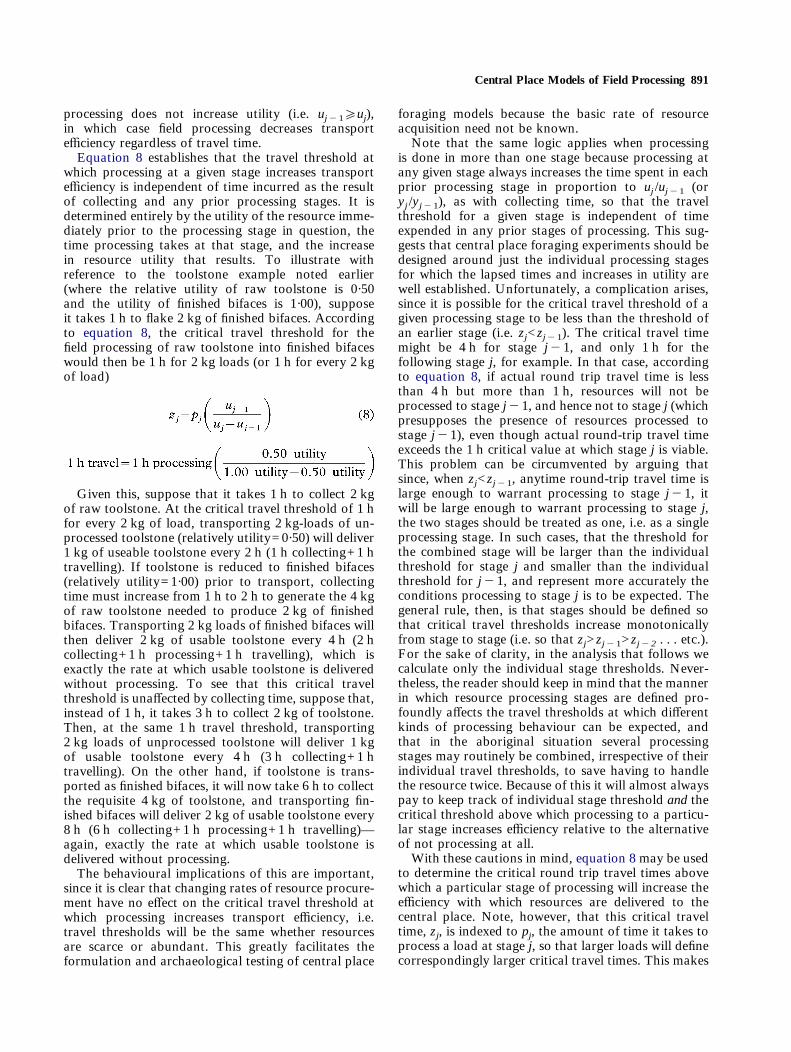
Figure 1. Graphical solution to the central place foraging problem. Time is plotted on the X-axis and utility on the Y-axis. The slope of AA*is the rate at which utility is acquired as a result of collecting and processing up to stage j"1. If travel time were zero, processing to stage jwould generate utility at a rate equal to the slope of a line drawn from A to B* (not plotted), which is less than the slope of AA*, and decreasetransport efficiency. However, when travel time is equal to B (the travel threshold for stage j), processing to stage j"1 and processing to stagej generate equal utility (slope BA*=slope BB*). So, for travel times less than B, processing to stage j"1 generates utility at a greater rate thanprocessing to stage j. For example the slope CA* is greater than the slope CB* (not plotted). For travel times greater than B, processing to stagej generates utility at a greater rate than processing to stage j"1. For example, the slope of DB* is greater than the slope of DA* (not plotted).
890 R. L. Bettinger et al.
expended in the same activities when processing just tostage j"1 (i.e. to make up for the weight or volumesubtracted by processing at stage j*). This increase isdirectly proportional to the fraction by which process-ing increases utility per unit of resource. For example,for processing to increase the utility of a resource from0·5 to 1·0, it must decrease the weight or volume of theresource to half of its original size, so that to generatea fully processed load will require twice the amount ofcollecting and prior processing time that would berequired to generate the same load without thatprocessing. Similarly, if processing increases the utilityof a resource from 0·25 to 0·75, it decreases the weightor volume of that resource to one-third of its originalsize, so that to generate a fully processed load willrequire three times the amount of collecting and priorprocessing time that would be required to generate thesame load without processing. For any such situation,the change in resource weight or volume caused byprocessing is
where wj"1 is weight (or volume) before, and wj isweight (or volume) after, processing to stage j.It follows that when resources are processed to stage
j, the collecting and prior processing time needed to
complete a load of given size increases inversely inproportion to the weight loss due to processing at stagej. Accordingly, if the time spent collecting and process-ing to stage j"1 isj–1, the time spent in these sameactivities when processing to stage j is xj"1(yj /(yj"1)).It is possible, then, to rework equation 5 in thefollowing way
where pj is time spent just processing a load from stagej"1 to stage j, formally defined as pj=(hj /wj)L, wherehj is the time to process an amount of resource equal towj.Equation 7 reduces to
or simply
The graphical solution to this problem is shown inFigure 2.Note that since processing time, pj, and initial utility,
uj"1, are always positive, the travel time threshold,zj, above which processing will increase transportefficiency, is always greater than zero, (zj>0), unless
Collecting and processing timeTravel time
Stage Jtravel threshold
Collecting andprocessing time
at stage J–1
Additional timeexpended in
stage J–1 activitieswhen processing
to stage JProcessing time
at stage J
Utility
Xj–1 Xj–1Yj
Yj–1( ( XjZj
Yj–1
Collecting and processing time
Utility at stage J–1
YjUtility at stage J
F A' E
A" B'
ABPj
Figure 2. Travel threshold as a function of processing time. This is the same problem illustrated in Figure 1 except that pj (time spent processingat stage j) is segregated from time spent collecting and prior processing when processing to stage j. As in Figure 1, the slope of AA* is the rateat which utility is acquired as a result of collecting and processing up to stage j"1, and B is the travel threshold for stage j, at which processingto stage j"1 and processing to stage j generate equal utility (slope BA*=slope BB*). The extension of AA* to A+, i.e. from A* to A+, definesthe additional increment of time, A*E, expended in stage j"1 activities that is required when processing to stage j. The slope of EB* correspondsto the rate at which utility increases as a function of stage j processing time. At B (the travel threshold for stage j) the slope of EB* is equal tothe slope of BF, which is the rate at which utility is acquired as a function of travel time BA when processing to stage j"1.
*Alternatively, the increase collecting and prior processing time maybe regarded as representing the time required to generate theadditional increment of utility contained a load processed to stage jrelative to the utility contained in a load at stage j"1.
Central Place Models of Field Processing 891
processing does not increase utility (i.e. uj"1¢uj),in which case field processing decreases transportefficiency regardless of travel time.Equation 8 establishes that the travel threshold at
which processing at a given stage increases transportefficiency is independent of time incurred as the resultof collecting and any prior processing stages. It isdetermined entirely by the utility of the resource imme-diately prior to the processing stage in question, thetime processing takes at that stage, and the increasein resource utility that results. To illustrate withreference to the toolstone example noted earlier(where the relative utility of raw toolstone is 0·50and the utility of finished bifaces is 1·00), supposeit takes 1 h to flake 2 kg of finished bifaces. Accordingto equation 8, the critical travel threshold for thefield processing of raw toolstone into finished bifaceswould then be 1 h for 2 kg loads (or 1 h for every 2 kgof load)
Given this, suppose that it takes 1 h to collect 2 kgof raw toolstone. At the critical travel threshold of 1 hfor every 2 kg of load, transporting 2 kg-loads of un-processed toolstone (relatively utility=0·50) will deliver1 kg of useable toolstone every 2 h (1 h collecting+1 htravelling). If toolstone is reduced to finished bifaces(relatively utility=1·00) prior to transport, collectingtime must increase from 1 h to 2 h to generate the 4 kgof raw toolstone needed to produce 2 kg of finishedbifaces. Transporting 2 kg loads of finished bifaces willthen deliver 2 kg of usable toolstone every 4 h (2 hcollecting+1 h processing+1 h travelling), which isexactly the rate at which usable toolstone is deliveredwithout processing. To see that this critical travelthreshold is unaffected by collecting time, suppose that,instead of 1 h, it takes 3 h to collect 2 kg of toolstone.Then, at the same 1 h travel threshold, transporting2 kg loads of unprocessed toolstone will deliver 1 kgof usable toolstone every 4 h (3 h collecting+1 htravelling). On the other hand, if toolstone is trans-ported as finished bifaces, it will now take 6 h to collectthe requisite 4 kg of toolstone, and transporting fin-ished bifaces will deliver 2 kg of usable toolstone every8 h (6 h collecting+1 h processing+1 h travelling)—again, exactly the rate at which usable toolstone isdelivered without processing.The behavioural implications of this are important,
since it is clear that changing rates of resource procure-ment have no effect on the critical travel threshold atwhich processing increases transport efficiency, i.e.travel thresholds will be the same whether resourcesare scarce or abundant. This greatly facilitates theformulation and archaeological testing of central place
foraging models because the basic rate of resourceacquisition need not be known.Note that the same logic applies when processing
is done in more than one stage because processing atany given stage always increases the time spent in eachprior processing stage in proportion to uj /uj"1 (oryj /yj"1), as with collecting time, so that the travelthreshold for a given stage is independent of timeexpended in any prior stages of processing. This sug-gests that central place foraging experiments should bedesigned around just the individual processing stagesfor which the lapsed times and increases in utility arewell established. Unfortunately, a complication arises,since it is possible for the critical travel threshold of agiven processing stage to be less than the threshold ofan earlier stage (i.e. zj<zj"1). The critical travel timemight be 4 h for stage j"1, and only 1 h for thefollowing stage j, for example. In that case, accordingto equation 8, if actual round trip travel time is lessthan 4 h but more than 1 h, resources will not beprocessed to stage j"1, and hence not to stage j (whichpresupposes the presence of resources processed tostage j"1), even though actual round-trip travel timeexceeds the 1 h critical value at which stage j is viable.This problem can be circumvented by arguing thatsince, when zj<zj"1, anytime round-trip travel time islarge enough to warrant processing to stage j"1, itwill be large enough to warrant processing to stage j,the two stages should be treated as one, i.e. as a singleprocessing stage. In such cases, that the threshold forthe combined stage will be larger than the individualthreshold for stage j and smaller than the individualthreshold for j"1, and represent more accurately theconditions processing to stage j is to be expected. Thegeneral rule, then, is that stages should be defined sothat critical travel thresholds increase monotonicallyfrom stage to stage (i.e. so that zj>zj"1>zj"2 . . . etc.).For the sake of clarity, in the analysis that follows wecalculate only the individual stage thresholds. Never-theless, the reader should keep in mind that the mannerin which resource processing stages are defined pro-foundly affects the travel thresholds at which differentkinds of processing behaviour can be expected, andthat in the aboriginal situation several processingstages may routinely be combined, irrespective of theirindividual travel thresholds, to save having to handlethe resource twice. Because of this it will almost alwayspay to keep track of individual stage threshold and thecritical threshold above which processing to a particu-lar stage increases efficiency relative to the alternativeof not processing at all.With these cautions in mind, equation 8 may be used
to determine the critical round trip travel times abovewhich a particular stage of processing will increase theefficiency with which resources are delivered to thecentral place. Note, however, that this critical traveltime, zj, is indexed to pj, the amount of time it takes toprocess a load at stage j, so that larger loads will definecorrespondingly larger critical travel times. This makes

892 R. L. Bettinger et al.
sense intuitively, since the goal of central place forag-ing is to optimize resource delivery, which, ignoring theenergetic costs of transport, increases with increasingmaximum load size (on the ‘‘big loads mean fewertrips’’ premise). At the same time, this means that, inthe absence of reliable estimates of prehistoric loadsizes, it is impossible to specify concrete round-triptravel thresholds, even where one can reliably estimaterates of utility return on time spent in various stages ofresource processing.Jones & Madsen (1989), Barlow & Metcalfe (1996),
and Barlow et al. (1993) have previously attempted toestimate load size for Great Basin hunter–gatherers onthe basis of museum collections of conical basketsknown or thought have been used for resource trans-port. Barlow & Metcalfe (1996) incorporated thesedata, along with data obtained from two key GreatBasin plant species, pinyon (Pinus monophylla) andpickleweed (Allenrolfea occidentalis) to demonstratehow utility gains associated with the processing ofthese resources to different stages of refinementaffected critical round-trip travel times, and exploredthe archaeological implications of their results. Wehave been separately pursuing the same rangequestions with respect to the potential utility andarchaeological implications of ethnographical andexperimental field processing information for two re-sources known to have been important in aboriginalCalifornia, acorn (specifically Quercus kelloggii) andbig mussel (Mytilus californianus), with reference toload sizes determined on the basis of an extensive seriesof burden baskets collected throughout California atthe turn of the century. We consider first belowprobable load size on the basis of the burden basketdata, since load determines the critical round-triptravel times in which we are ultimately interested. Wethen consider data for utility gains associated with theprocessing of acorns and mussels and discuss thearchaeological implications of our findings.
California Burden BasketsTo obtain baseline data regarding the scale of aborigi-nal resource transport in California, we examined atotal of 34 burden baskets made and intended forresource procurement by ethnographical groups withterritories lying partly or entirely in California andcollected by the anthropologist C. Hart Merriam dur-ing the early part of this century. These specimens, allbut one of which are basically conical, are currentlyhoused as part of the C. Hart Merriam EthnographicCollection at the University of California, Davis.Height and mouth and base diameters were measuredby tape (Malhi & Bettinger, n.d.). Container volumewas measured by filling each basket (protectively linedwith a light plastic film) with Styrofoam packing‘‘peanuts’’ and transferring the contents to a cardboardbox graduated in 0·5 l increments.
The mean measured volume for the Merriam sampleis 25·74 l (..=15·25, range 1·5–59·0 l, N=34), whichis virtually identical to the values obtained by Barlowet al. (1993) for a sample of 34 conical carrying basketscollected from Great Basin, California, and a few otherNorth American groups (mean=25·6, .. 18·5, range2–84·74 l). Unlike theirs, however, volume in oursample is distinctly bimodal, with a primary modecentring around 22 l and a secondary one around 56 l.We think these modes reflect fundamentally differenttransport functions, and that the smaller mode isconnected with residential transport, or the transport ofresources acquired on daily excursions in which theforager begins and ends at the same residential base.Most such activity is conducted within a 2 h walk ofthe residential base, sometimes termed the foragingradius (Binford, 1982). The larger mode of carryingbasket size, on the other hand, is mostly likely con-nected with logistical transport, or the transport ofresources procured using temporary settlements lo-cated outside the foraging radius of the residential baseto which these resources are subsequently transferred(see Malhi & Bettinger, n.d.). This hypothesis tends tobe supported by presently available ethnographicaldata on transport load size. McCarthy (1993: 264)notes that the Western Mono of California transportedacorns from acorn camps to residential bases in burdenbasket loads of about 52 l (36 kg), which wouldrepresent the larger (logistical transport) mode in oursample. This value is compatible with the findings ofMaloiy et al. (1986), who suggest that trained individ-uals are capable of carrying loads of up to 70% of bodyweight without undue hardship. Assuming they arecorrect, any experienced gatherer weighing more thanabout 51 kg (or about 113 lb) would be capable oftransporting the 36 kg load suggested by the larger sizemode of carrying baskets in the Merriam collection.The smaller size mode, which suggests transport loadson the order of 22 l (the equivalent of 18·5 kg inacorns), is consistent with the residential transport ofloads from 3 to 15 kg noted by Barlow et al. (1993) fora variety of contemporary hunter-gatherers.Equally noteworthy is that carrying basket volume
appears to vary between groups in the Merriam sampledepending on the primary plant staple. Here samplesize limits comparison to carrying baskets representingthe smaller, residential transport mode. Of these, theones made by acorn-dependent groups are noticeablysmaller (mean=20·35, ..=11·67, N=23) than thoseof pinyon-dependent groups (mean=27·33, ..=8·82,N=6)—very likely because pinenuts at 0·48 kg/l(Barlow & Metcalfe, 1996) are less dense than acornsat 0·84–0·69 kg/l (McCarthy, 1993). If it is assumedthese baskets were filled to capacity with the appropri-ate plant staple (i.e. acorns for acorn-dependentgroups, pinenuts for pinenut-dependent groups), loadweight for both groups is virtually identical (acorndependent mean=14·04, ..=8·06, N=23; pinenut-dependent mean=13·67, ..=4·41, N=6). Clearly, this
Central Place Models of Field Processing 893
suggests it is generally weight rather than volume thatconstrains resource transport and that carrying basketvolume was adjusted locally to achieve optimal trans-port load size. On the basis of this, in the course of thefollowing analysis we use weights representing residen-tial transport (15 kg) and logistical transport (36 kg) toestimate the critical travel thresholds at which variousdegrees of resource processing would have beenprofitable in connection with the procurement of blackoak acorns and big mussel. We stress that these loadsizes are coarse estimates.
Black Oak (Quercus kelloggii) AcornProcurement and ProcessingThe fruit of several species of oaks (Quercus spp.,Lithocarpus densiflorus) were an aboriginal staplewherever they occurred in California (Kroeber, 1925;Baumhoff, 1963; Gifford, 1971; Basgall, 1987). Thefruit is typically abundant and very high in energeticcontent (4835 kcal/kg raw, 4443 kcal/kg leached),largely as a function of fat, which makes up to about20% of the leached product, depending on species.Baumhoff (1981) calculated, on the basis of oak densi-ties and annual tree yield, that the acorn subsistenceeconomy in the North Coast Range of California couldhave sustained as many as 1·9 million individuals—about 65 times the accepted figure for realized pre-contact population. That actual population did notbegin to approach this figure is traceable in part to thelabour-intensive processing required since Californiaoaks produce fruit that is high in tannin, which must beremoved by leaching to make the food value availableto the human digestive system (Kroeber, 1925; Gifford,1971; Chestnut, 1974; Basgall, 1987). This costly pro-cessing surely discouraged more intensive native useand more readily explains the relatively tardy appear-ance of acorn-based economies in the prehistoricrecord (Basgall, 1987) than the traditional view thatthis reflects initial aboriginal ignorance of the leachingprocess needed to make the crop usable (Gifford,1971).Full appreciation of the labour-intensity of acorn
processing derived in no small part from time-motion-
product data collected for this activity by Goldschmidt(1974) among the Hupa of northern California. Onewishes his contemporaries had been similarly inclinedin documenting other traditional subsistence practicesthat have since disappeared. Fortunately, acorn pro-duction continues to be practiced by several NativeAmerican groups around California, for use both inthe home and in connection with native celebrationsand gatherings. In a particularly noteworthy study,McCarthy (1993) recently documented, in muchgreater detail than Goldschmidt, contemporary acornproduction among the Western Mono in the centralSierra Nevada. She obtained data for the entire processof acorn production from collection to cooking andconsumption, recording times consumed and quantitiesproduced in connection with each stage.As she notes, this is not as easy as it seems, since
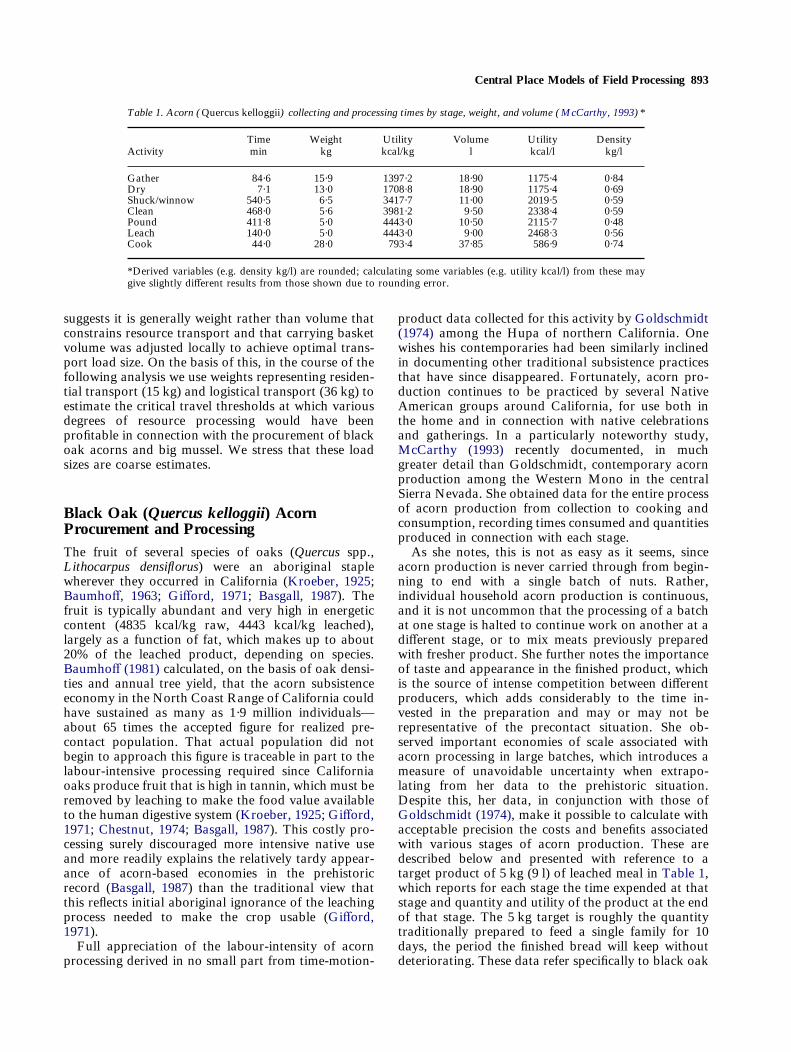
acorn production is never carried through from begin-ning to end with a single batch of nuts. Rather,individual household acorn production is continuous,and it is not uncommon that the processing of a batchat one stage is halted to continue work on another at adifferent stage, or to mix meats previously preparedwith fresher product. She further notes the importanceof taste and appearance in the finished product, whichis the source of intense competition between differentproducers, which adds considerably to the time in-vested in the preparation and may or may not berepresentative of the precontact situation. She ob-served important economies of scale associated withacorn processing in large batches, which introduces ameasure of unavoidable uncertainty when extrapo-lating from her data to the prehistoric situation.Despite this, her data, in conjunction with those ofGoldschmidt (1974), make it possible to calculate withacceptable precision the costs and benefits associatedwith various stages of acorn production. These aredescribed below and presented with reference to atarget product of 5 kg (9 l) of leached meal in Table 1,which reports for each stage the time expended at thatstage and quantity and utility of the product at the endof that stage. The 5 kg target is roughly the quantitytraditionally prepared to feed a single family for 10days, the period the finished bread will keep withoutdeteriorating. These data refer specifically to black oak
Table 1. Acorn (Quercus kelloggii) collecting and processing times by stage, weight, and volume (McCarthy, 1993)*
ActivityTimemin
Weightkg
Utilitykcal/kg
Volumel
Utilitykcal/l
Densitykg/l
Gather 84·6 15·9 1397·2 18·90 1175·4 0·84Dry 7·1 13·0 1708·8 18·90 1175·4 0·69Shuck/winnow 540·5 6·5 3417·7 11·00 2019·5 0·59Clean 468·0 5·6 3981·2 9·50 2338·4 0·59Pound 411·8 5·0 4443·0 10·50 2115·7 0·48Leach 140·0 5·0 4443·0 9·00 2468·3 0·56Cook 44·0 28·0 793·4 37·85 586·9 0·74
*Derived variables (e.g. density kg/l) are rounded; calculating some variables (e.g. utility kcal/l) from these maygive slightly different results from those shown due to rounding error.

894 R. L. Bettinger et al.
(Quercus kelloggii), the fruit of which is large, rich infat content, produces the most satisfactory finishedproduct, and was and is the preferred acorn in allexcept the north-western part of California, whereproduction centered on the fruit of the tan oak(Lithocarpus densiflorus).Among the Western Mono, the acorn is gathered off
the ground individually by hand and transferred toburden baskets carried by the gatherer. Poles weretraditionally used to dislodge nuts from higherbranches, which was laborious but decreased thenumber of visits per tree and losses to natural competi-tors. The acorn of the black oak is highly susceptible tomould (McDonald, 1969) and for that reason wasspread out to dry, reducing weight but not volume,either at the collecting location as collection continued,or following transport to main camps prior to beingcached in large, beehive-like granaries elevated onplatforms or nest-like caches resting directly on slickbedrock granite outcrops. Time charged to drying inTable 1 does not refer to the time drying itself requiresbut rather the handling time spent spreading, periodi-cally turning, and repacking the quantity of unhullednuts shown (18·9 l, 13 kg) to facilitate drying. Nutswithdrawn from caches for consumption were crackedwith a nutting stone, husked from the enclosing shell,winnowed, and then cleaned to remove the bitterpaper-like coat covering the surface of the meat. Asnoted above and indicated by the data in Table 1,cleaning is extremely time consuming and it is prob-lematic whether it was as intensely pursued in the pastas the present. In any event, the nut meats are thenpounded by mortar and pestle to flour, during whichthe loss of stray particles reduces the product weight byabout 10%, from 5·58 to 5·00 kg. Pounding decreasesthe density of the product from 0·59 to 0·48 kg/l. Themeal is then leached, which reduces caloric content(4835 to 4443 kcal/kg), but increases product density0·48 to 0·56 kg/l, and then cooked which substantiallyincreases product density, mainly by the addition ofwater, but decreases caloric value from 4443 to793·4 kcal/kg.The times and unit quantities by weight and volume
shown in Table 1 make it possible to calculate traveltimes that would be needed to make the variousprocessing steps economical in the field. Before pro-ceeding to these calculations, two points need dis-cussion. First, it is arguable whether this exercise hasany point at all, since ethnographical data past andpresent make it quite clear acorn was mostly stored inthe shell to reduce mould and insect loss, whichpre-empted extensive field processing. Against this,most California groups permitted, even encouraged,some acorns to mould above ground or in submerged(i.e. underwater) caches, which obviated leaching(e.g. Goddard, 1903–1904: 29; Essene, 1945: 8). Forthis portion of the acorn crop at least, nothing wouldhave barred in-field hulling to optimize transportefficiency.
The second question centres on the calculation ofutility by stage. Barlow & Metcalfe (1996) noted seedlosses associated with various stages of pickleweedprocessing that are analogous to the weight loss thataccompanies acorn pounding and caloric loss thatattends leaching. They calculated utilities at each stageignoring these eventual losses. However, if processinglosses are inevitable somewhere down the line, in a realsense they do not constitute potential ‘‘utility’’ at anyearlier stage. Leaching, for instance, reduces caloriccontent of acorns in the abstract (from 4835 to4443 kcal/kg), but certainly not in any practical sensesince it is required to make the product digestible. Thegeneral rule here is that required processing, i.e. thatwill be necessary at some point to make the productedible, does not affect absolute utility, that is, theactual quantity of useful material in any product. Itfollows that weight losses associated with a necessarystage of processing, as happens with acorns in pound-ing, for example, must be thought of as culling non-useful product, so that the absolute amount ofpotentially usable product is the same before and afterprocessing. What does change is the relative utility ofthe load, which increases as a consequence of theseparation of non-useful material.Needless to say, the differences in calculating utility,
hence threshold travel time, can be substantiallyaltered, in particular increased, if the above assump-tion is ignored. Clearly, if weight loss at a givenprocessing stage is counted as lost utility, i.e. chargedagainst that stage, it will decrease the apparent effi-ciency of processing at that stage relative to earlierones and the critical travel threshold for that stage willincrease. To illustrate, suppose acorn pounding tookno time at all but still resulted in 10% product loss.Then, pounding would not be done in the field, sincethis would reduce transport efficiency (i.e. because, forany given load size, gathering and prior processingtime would have to increase by 10% to make up forpounding losses). Alternatively, if the unavoidable 10%product loss in pounding is counted as useless weight/volume, as it should be, then the utility of the un-pounded nuts would be 0·90, which would be inferiorto the utility of pounded meal, 1·00. Then pounding (ifit took no time at all—which, of course, it does) shouldalways occur in the field to eliminate the transport ofthe useless weight represented by the fraction of the nutmeat that would otherwise be lost in pounding at thecentral place.
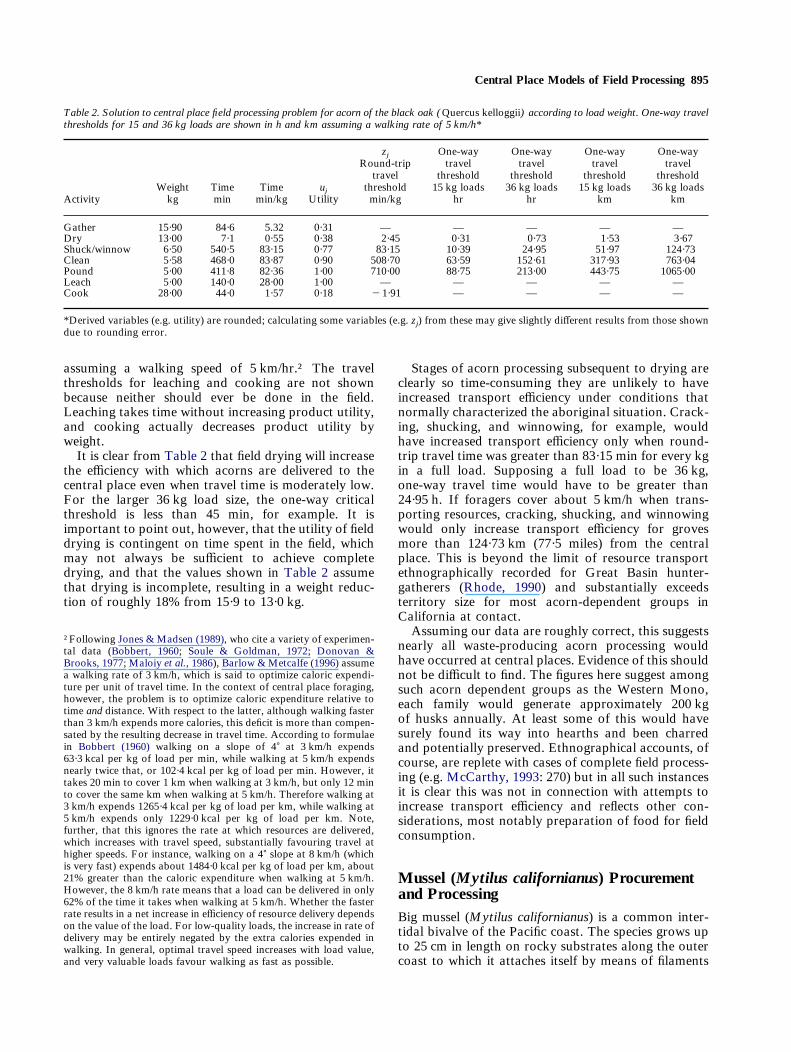
SolutionWith these things established, the data relevant to fieldprocessing acorn according to loads measured byweight are shown in Table 2. The individual travelthresholds associated with each stage of processing areshown for round-trip travel time in min per kg of load,for one-way travel times for loads of 15 and 36 kg, andfor one-way travel distances for 15 and 36 kg loads,
Central Place Models of Field Processing 895
assuming a walking speed of 5 km/hr.† The travelthresholds for leaching and cooking are not shownbecause neither should ever be done in the field.Leaching takes time without increasing product utility,and cooking actually decreases product utility byweight.It is clear from Table 2 that field drying will increase
the efficiency with which acorns are delivered to thecentral place even when travel time is moderately low.For the larger 36 kg load size, the one-way criticalthreshold is less than 45 min, for example. It isimportant to point out, however, that the utility of fielddrying is contingent on time spent in the field, whichmay not always be sufficient to achieve completedrying, and that the values shown in Table 2 assumethat drying is incomplete, resulting in a weight reduc-tion of roughly 18% from 15·9 to 13·0 kg.
Stages of acorn processing subsequent to drying areclearly so time-consuming they are unlikely to haveincreased transport efficiency under conditions thatnormally characterized the aboriginal situation. Crack-ing, shucking, and winnowing, for example, wouldhave increased transport efficiency only when round-trip travel time was greater than 83·15 min for every kgin a full load. Supposing a full load to be 36 kg,one-way travel time would have to be greater than24·95 h. If foragers cover about 5 km/h when trans-porting resources, cracking, shucking, and winnowingwould only increase transport efficiency for grovesmore than 124·73 km (77·5 miles) from the centralplace. This is beyond the limit of resource transportethnographically recorded for Great Basin hunter-gatherers (Rhode, 1990) and substantially exceedsterritory size for most acorn-dependent groups inCalifornia at contact.Assuming our data are roughly correct, this suggests
nearly all waste-producing acorn processing wouldhave occurred at central places. Evidence of this shouldnot be difficult to find. The figures here suggest amongsuch acorn dependent groups as the Western Mono,each family would generate approximately 200 kgof husks annually. At least some of this would havesurely found its way into hearths and been charredand potentially preserved. Ethnographical accounts, ofcourse, are replete with cases of complete field process-ing (e.g. McCarthy, 1993: 270) but in all such instancesit is clear this was not in connection with attempts toincrease transport efficiency and reflects other con-siderations, most notably preparation of food for fieldconsumption.
Mussel (Mytilus californianus) Procurementand ProcessingBig mussel (Mytilus californianus) is a common inter-tidal bivalve of the Pacific coast. The species grows upto 25 cm in length on rocky substrates along the outercoast to which it attaches itself by means of filaments
Table 2. Solution to central place field processing problem for acorn of the black oak (Quercus kelloggii) according to load weight. One-way travelthresholds for 15 and 36 kg loads are shown in h and km assuming a walking rate of 5 km/h*
ActivityWeightkg
Timemin
Timemin/kg
ujUtility
zjRound-triptravel
thresholdmin/kg
One-waytravel
threshold15 kg loads
hr
One-waytravel
threshold36 kg loads
hr
One-waytravel
threshold15 kg loads
km
One-waytravel
threshold36 kg loads
km
Gather 15·90 84·6 5.32 0·31 — — — — —Dry 13·00 7·1 0·55 0·38 2·45 0·31 0·73 1·53 3·67Shuck/winnow 6·50 540·5 83·15 0·77 83·15 10·39 24·95 51·97 124·73Clean 5·58 468·0 83·87 0·90 508·70 63·59 152·61 317·93 763·04Pound 5·00 411·8 82·36 1·00 710·00 88·75 213·00 443·75 1065·00Leach 5·00 140·0 28·00 1·00 — — — — —Cook 28·00 44·0 1·57 0·18 "1·91 — — — —
*Derived variables (e.g. utility) are rounded; calculating some variables (e.g. zj) from these may give slightly different results from those showndue to rounding error.
†Following Jones & Madsen (1989), who cite a variety of experimen-tal data (Bobbert, 1960; Soule & Goldman, 1972; Donovan &Brooks, 1977; Maloiy et al., 1986), Barlow &Metcalfe (1996) assumea walking rate of 3 km/h, which is said to optimize caloric expendi-ture per unit of travel time. In the context of central place foraging,however, the problem is to optimize caloric expenditure relative totime and distance. With respect to the latter, although walking fasterthan 3 km/h expends more calories, this deficit is more than compen-sated by the resulting decrease in travel time. According to formulaein Bobbert (1960) walking on a slope of 4) at 3 km/h expends63·3 kcal per kg of load per min, while walking at 5 km/h expendsnearly twice that, or 102·4 kcal per kg of load per min. However, ittakes 20 min to cover 1 km when walking at 3 km/h, but only 12 minto cover the same km when walking at 5 km/h. Therefore walking at3 km/h expends 1265·4 kcal per kg of load per km, while walking at5 km/h expends only 1229·0 kcal per kg of load per km. Note,further, that this ignores the rate at which resources are delivered,which increases with travel speed, substantially favouring travel athigher speeds. For instance, walking on a 4) slope at 8 km/h (whichis very fast) expends about 1484·0 kcal per kg of load per km, about21% greater than the caloric expenditure when walking at 5 km/h.However, the 8 km/h rate means that a load can be delivered in only62% of the time it takes when walking at 5 km/h. Whether the fasterrate results in a net increase in efficiency of resource delivery dependson the value of the load. For low-quality loads, the increase in rate ofdelivery may be entirely negated by the extra calories expended inwalking. In general, optimal travel speed increases with load value,and very valuable loads favour walking as fast as possible.

896 R. L. Bettinger et al.
(byssus) growing from the base of the shell. It fre-quently forms sheet colonies in which many individualsare attached to each other rather than the rock thatultimately supports the colony. As attested by thearchaeological presence of its valves, which are amajor component of middens up and down coastalCalifornia, big mussel was important in the NativeCalifornia diet. Shell valves are widely distributedbeyond the coastal zone and frequently contribute tofaunal assemblages in sites 25 km or more inland. Thisis understandable since the species is widely occurringand easy to acquire and process with rudimentarytechnical aids. Since colonies are generally extensive,mussels may be plucked one at a time, ignoring thesmaller individuals, or detached in sheet-like sectionsof colony by what is known as stripping (White, 1989;Bouey & Basgall, 1991; Jones & Richman, 1995). Theshell is then opened by boiling/heating and the meatextracted by hand. Valves larger than 4 cm in lengthgenerally constitute more than 64% of the total inassemblages generated by plucking and less than 35%in assemblages generated by stripping (Jones, 1995:table 73).Table 3 summarizes data on collection and pro-
cessing times obtained by Jones & Richman (1995)in connection with plucking and stripping experi-ments conducted in two locations: Landels Hill–BigCreek Reserve, Monterey County, California, wheremussels had not been collected by humans within thelast 15 years, and Davenport, Santa Cruz County,California, where contemporary mussel collecting iscommon and where, as a result, mussel densities aredepleted relative to those at the Landels Hill–Big CreekReserve. Utility is calculated relative to meat content,which varies from 0·06 to 0·30 in the unprocessedsamples.From these data two things are clear from the start.
First, return rates for both plucking and strippingare higher in depleted beds than pristine ones. This
unexpected result might be due to human predation,which, by thinning mussel colonies, is likely to increasegrowth rates while reducing the efficiency of byssalattachment for both individuals and colonies, facilitat-ing the detachment of mussels in sheets or individually.Second, plucking always returns calories at higher ratesthan does stripping in the same setting. This is partly afunction of the low returns on processing that go withstripping, which, as might be expected, produces largenumbers of small (hence costly to process) individuals.Even disregarding processing, stripping remains theinferior method since it generates less meat thanplucking per unit of collection time. It is simply moredifficult to detach whole sections of colony than indi-vidual mussels containing the same amount of meat. Itfollows that if the goal is to optimize the rate at whichmeat is acquired and delivered from foraging locationto central place, mussel collectors should never stripwhole sections of colony. For this reason, the travelthresholds shown for stripping in Table 3 are problem-atic, there being no reason to think that aboriginalcoastal foragers willing to compromise procurementefficiency by engaging in suboptimal mussel strippingwould subsequently attempt to optimize transport ef-ficiency by field processing (see below). The travelthresholds for mussels obtained by plucking are moreinformative. They differ markedly by setting, and aremuch lower for the less productive pristine colonies(7·28 min/kg) than the more productive depleted ones(14·18 min/kg). Assuming the lower 15 kg load size,which would more likely apply when procuring bigmussel for immediate consumption, the thresholds arebelow the 2 h, one-way travel time radius within whichmost hunter–gatherers confine their daily foraging.This implies that mussel processing is likely to behighly situational within the foraging radius. Theseobservations are compatible with the findings of Bird& Bliege Bird (1997), who conducted an extensivestudy of shellfish processing among the Meriam of the
Table 3. Procurement, processing, and threshold travel times associated with different collection methods and field conditions for mussels (Mytiluscalifornianus; Jones & Richman, 1995). One-way travel thresholds for 15 and 36 kg loads are shown for time in h and for distance in km assuminga walking rate of 5km/h*
Location ActivityWeightkg
Timemin
Timemin/kg
ujUtility
zjRound-triptravel
thresholdmin/kg
One-waytravel
threshold15 kg loads
hr
One-waytravel
threshold36 kg loads
hr
One-waytravel
threshold15 kg loads
km
One-waytravel
threshold36 kg loads
km
Big Creek Plucking 5·95 20·00 3·36 0·08 — — — — —(pristine) Extraction 0·47 40·00 84·98 1·00 7·29 0·91 2·19 4·56 10·94Big Creek Stripping 5·51 20·00 3·63 0·06 — — — — —(pristine) Extraction 0·34 90·87 264·54 1·00 17·60 2·20 5·28 11·00 26·40Davenport Plucking 4·86 20·00 4·11 0·30 — — — — —(depleted) Extraction 1·48 48·00 32·48 1·00 14·18 1·77 4·25 8·86 21·27Davenport Stripping 10·23 20·00 1·96 0·07 — — — — —(depleted) Extraction 0·75 116·57 155·39 1·00 12·30 1·54 3·69 7·69 18·45
*Derived variables (e.g. utility) are rounded; calculating some variables (e.g. zj) from these may give slightly different results from those showndue to rounding error.
Central Place Models of Field Processing 897
Torres Straits Islands, Australia. They calculate travelthresholds varying from less than 2 min/kg to about27 min/kg, depending on shellfish species. The lattervalue (27 min/kg) is for a bivalve (Asaphis violenscens)which is somewhat smaller, and hence more costly toprocess, than big mussel, which would explain its largertravel threshold.All the above suggests that the interpretation of
archaeological mussel shell requires caution. For in-stance, on-coast middens containing high proportionsof large valves indicative of plucking might potentiallyindicate: (1) on-site residential consumption; (2) trans-port from pristine colonies less than about 55 minaway, or depleted colonies less than about 1·8 h away;(3) processing for transport from pristine colonies tocoastal central places more than 55 min away, or fromdepleted colonies to coastal central places more thanabout 1·8 h away. Inland (i.e. off-coast) middens will,of course, reflect the last pattern in reverse, shellsbeing present or absent depending on distance to, andcondition of, the mussel colonies involved. Since travelthresholds vary with load size, changes in load sizeassociated with shifts in the intensity of mussel pro-curement would further complicate the picture. Evenholding load size, procurement intensity, and settle-ment pattern all constant, one might still expect changein the abundance and distribution of large mussel shellin middens simply as a function of resource depletion.That is, if procurement depletes regularly used coloniesover time, large mussel shell density in seaside middenswill decrease, as depletion raises return rates andincreases the round-trip travel threshold at which fieldprocessing becomes profitable. Conversely, sites imme-diately inland—close enough that field processing isnever profitable—will show no change over time. Sitesslightly further inland—outside the initial travelthreshold but inside the larger subsequent one, willshow abrupt increases in mussel shell reflecting thisthreshold change (i.e. not subsistence change), whilesites still further inland—those always outside thetravel threshold—will never contain much large shell atall.Note that none of these observations are of rel-
evance to the disposition of shell assemblages with thedisproportionately high frequencies of small valvesthat signify stripping. This form of procurementclearly produces inferior return rates relative to equallyfeasible alternatives (i.e. plucking), hence cannot beassumed to have been conditioned by the energeticrate constraints that provide the basis for decisionmaking in the central place foraging theory. Sincestripping is clearly attested in the archaeological record(e.g. Jones, 1995: 74), but does not optimize procure-ment time with respect to energetic returns, it waspresumably undertaken to satisfy other goals, to servea preferred method of cooking—steaming, for example(see Bird & Bliege Bird, 1997: 21), or to facilitatetransport when containers were unavailable (or full).Alternatively, mussel is high in a variety of important
nutrients, and in certain organisms nutrient content isinversely related to weight, occurring in higher concen-trations in smaller individuals than large ones (e.g.some seeds). It is possible that by maximizing musselnumber rather than mussel size, stripping optimizedreturn rates for critical nutrients while returning sub-optimal energetic return rates. That, of course, wouldpreclude field processing to optimize transport effi-ciency by weight, which would compromise transportefficiency of mussel loads whose nutrient utilitywas more a function of number of individuals thansimple gross load weight. In that event field pro-cessing might conceivably entail the culling, andpossibly consumption, of larger individuals in thefield.
ImplicationsWhat recent studies of resource procurement andtransport costs (e.g. Jones & Madsen, 1989; Barlowet al. 1993; Barlow & Metcalfe, 1996), including thisone, are beginning to reveal very clearly is that logisti-cal procurement (Binford, 1980) that involves fieldprocessing is generally costly relative to the alternativein which the same resource is procured within theforaging radius and processed and consumed resi-dentially. This is consistent with ethnographical datasuggesting that even resources that, in theory, couldhave been profitably procured and processedlogistically—pinenuts in the American Great Basin, forexample—were generally procured and processed resi-dentially when they were important dietary staples(Steward, 1938: 27–28; Jones & Madsen, 1989; Rhode,1990; Barlow et al. 1993: 33–34). Where residentialmobility is high, therefore, virtually all procurementshould be residential, as where foragers sequentially‘‘map on’’ to seasonally important foods (Binford,1980). As residential mobility decreases, residentialbases will be increasingly tethered to locations wherekey staples are abundant, from which lesser resourceswill be taken less profitably logistically. Logisticalprocurement and field processing, then, will generallybe a signature of supplementary resources in a systemcommitted to other key staples (cf. Madsen, 1986: 34).A shift in the importance of a resource from non-stapleto staple, therefore, will frequently be signified by areplacement of temporary camps and field processingstations by residential bases in the same vicinity (e.g.Bettinger, 1976, 1989). Conversely, a shift from short-term residential procurement to logistical procurementshould occur when a resource formerly important as aseasonal staple in a residentially mobile system istransformed to non-staple status in a less residentiallymobile settlement system anchored to other resources.These changes should be detectable in archaeologicalresidues that reflect resource processing and clarify ourunderstanding of settlement behaviours that wouldotherwise be difficult to disentangle.

898 R. L. Bettinger et al.
AcknowledgementsWe wish to thank Terry Jones and Jennifer Richmanfor access to their data on mussel procurement andprocessing. We are also grateful to James F. O’Connelland David B. Madsen for providing thoughtful, con-structive criticisms on an earlier version of this paper.Doug Bird, John Beaton, and Peter Rodman wereparticularly helpful at various points during thepreparation of this paper.
ReferencesBarlow, K. R. & Metcalfe, D. (1996). Plant utility indices: TwoGreat Basin examples. Journal of Archaeological Science 23,351–371.
Barlow, K. R., Henricksen, P. R. & Metcalfe, D. (1993). Estimatingload size in the Great Basin: Data from conical burden baskets.Utah Archaeology (1993), 27–36.
Basgall, M. E. (1987). Resource intensification among hunter-gatherers: Acorn economics in prehistoric California. Research inEconomic Anthropology 9, 21–52.
Baumhoff, M. A. (1963). Ecological determinants of aboriginalCalifornia populations. University of California Publications inAmerican Archaeology and Ethnology 49(2), 155–236.
Baumhoff, M. A. (1981). The carrying capacity of hunter-gatherers.In (S. Koyama & D. H. Thomas, Eds) Affluent Foragers: PacificCoasts East and West. Senri Ethnological Series 9. Osaka: NationalMuseum of Ethnology, pp. 77–87.
Bettinger, R. L. (1976). The development of pinyon exploitation incentral eastern California. Journal of California Anthropology 2(2),198–210.
Bettinger, R. L. (1989). The archaeology of Pinyon House, TwoEagles, and Crater Middens: Three residential sites in OwensValley, eastern California. American Museum of Natural HistoryAnthropological Papers 67. New York.
Bettinger, R. L. (1991). Hunter-Gatherers: Archaeological and Evolu-tionary Theory. New York: Plenum.
Binford, L. R. (1977). General introduction. In (L. R. Binford, Ed.)For Theory Building in Archaeology. New York: Academic Press,pp. 1–10.
Binford, L. R. (1978). Nunamiut Ethnoarchaeology. New York:Academic Press.
Binford, L. R. (1980). Willow smoke and dogs’ tails: Hunter-gatherer settlement systems and archaeological site formation.American Antiquity 45(1), 3–20.
Binford, L. R. (1982). The archaeology of place. Journal of Anthro-pological Archaeology 1(1), 5–31.
Bird, D. W. & Bliege Bird, R. L. (1997). Contemporary shellfishgathering strategies among the Merriam of the Torres StraitsIslands, Australia: Testing predictions of a central place foragingmodel. Journal of Archaeological Science 24, 39–63.
Bobbert, A. C. (1960). Energy expenditure in level and gradewalking. Journal of Applied Physiology 15, 1015–1021.
Bouey, P. D. & Basgall, M. E. (1991). Archaeological Patterns Alongthe South Coast, Piedras Blancas, San Luis Obispo, California:Archaeological Test Evaluations of Sites CA-SLO-264, CA-SLO-266, CA-SLO-267, CA-SLO-268, CA-SLO-1226, and CA-SLO-1227. Submitted to the California Department of Transportation,Contract No. SA05B86100. Copies available from CaliforniaDepartment of Transportation, Environmental Branch, San LuisObispo, California.
Broughton, J. M. & Grayson, D. K. (1993). Diet breadth, adaptivechange, and the White Mountains faunas. Journal of Archaeologi-cal Science 20, 331–336.
Charnov, E. L. (1976). Optimal foraging: The marginal valuetheorem. Theoretical Population Biology 9, 129–136.
Chestnut, V. K. (1974). Plants Used by the Indians of MendocinoCounty, California. Fort Bragg, CA: Mendocino County Histori-cal Society (original 1902).
Donovan, C. M. & Brooks, G. A. (1977). Muscular efficiency duringsteady-rate exercise, 2. Effects of walking speed and workrate.Journal of Applied Physiology 43, 431–439.
Essene, F. J. (1945). Culture element distributions XXI: RoundValley. University of California Anthropological Records 8(1), 1–97.
Gifford, E. (1971). California balanophagy. In (R. F. Heizer & M. A.Whipple, Eds) The California Indians: A Source Book. Berkeley:University of California Press, pp. 301–305.
Goldschmidt, W. (1974). Subsistence activities among the Hupa. In(R. Beals & J. Hester, Jr., Eds) Indian Land Use and Occupancy inCalifornia, Volume I. New York: Garland Publishing, pp. 52–55.
Goddard, P. E. (1903–1904). Life and Culture of the Hupa.University of California Publications in American Archaeologyand Ethnology 1(1), 1–88.
Grayson, D. K. (1986). Eoliths, archaeological ambiguity, andthe generation of ‘‘middle-range’’ research. In (D. J. Meltzer &D. D. Fowler, Eds) American Archaeology: Past and Future.Washington, DC: Smithsonian Institution Press, pp. 77–133.
Grayson, D. K. (1991). Alpine faunas from the White Mountains,California: Prehistoric change in the Great Basin? Journal ofArchaeological Science 18, 483–506.
Jones, K. T. & Madsen, D. B. (1989). Calculating the cost ofresource transportation: A Great Basin example. Current Anthro-pology 30, 529–534.
Jones, T. L. (1995). Transitions in Prehistoric Diet, Mobility, Ex-change, and Social Organization Along California’s Big Sur Coast.Ph.D. Dissertation, Department of Anthropology, University ofCalifornia, Davis, CA.
Jones, T. L. & Richman, J. R. (1995). On mussels: Mytilus califor-nianus as a prehistoric resource. North American Archaeologist 16,33–58.
Kaplan, H. & Hill, K. (1992). The evolutionary ecology of foodacquisition. In (E. A. Smith & Winterhalder, B., Eds) EvolutionaryEcology and Human Behavior. New York: Aldine de Gruyter,pp. 167–201.
Kroeber, A. L. (1925). Handbook of California Indians. Bureau ofAmerican Ethnology Bulletin 78. Washington, D.C.
MacArthur, R. H. & Pianka, E. R. (1966). On optimal use of apatchy environment. American Naturalist 100, 603–609.
McCarthy, H. (1993). A Political Economy of Western Mono AcornProduction. Ph.D. Dissertation, Department of Anthropology,University of California, Davis, CA.
McDonald, P. M. (1969). Silvical characteristics of California blackoak (Quercus kelloggii, Newb.). USDA Forest Service ResearchPaper PSW-53.
Madsen, D. B. (1986). Great Basin nuts: a short (sic) treatise on thedistribution, productivity, and use of pinyon. In (C. Condie & D.Fowler, Eds) Anthropology of the Desert West. University of UtahAnthropological Papers 110, pp. 21–41. Salt Lake City.
Madsen, D. B. (1993). Testing diet breadth models: Examiningadaptive change in the late prehistoric Great Basin. Journal ofArchaeological Science 20, 321–330.
Malhi, R. & Bettinger, R. (n.d.). Load sizes as estimated fromCalifornia and Great Basin carrying baskets. Manuscripts on file,Department of Anthopology, University of California, Davis.
Maloiy, G. M. O., Heglund, N. C., Prager, L. M., Cavagna, G. A. &Taylor, C. R. (1986). Energetic cost of carrying loads: HaveAfrican women discovered an economic way? Nature 319, 668–669.
Metcalfe, D. & Barlow, K. R. (1992) A model for exploring theoptimal tradeoff between field processing and transport. AmericanAnthropologist 94, 340–356.
Orians, G. H. & Pearson, N. E. (1979). On the theory of central placeforaging. In (D. J. Horn, G. R. Stairs & R. D. Mitchell, Eds)Analysis of Ecological Systems. Columbus: Ohio State University,pp. 155–177.
Rhode, D. (1990). On transportation costs of Great Basin resources:An assessment of the Jones-Madsen model. Current Anthropology31, 413–419.

Central Place Models of Field Processing 899
Schoener, T. W. (1971). Theory of feeding strategies. Annual Reviewof Ecology and Systematics 2, 369–404.
Soule, R. G. & Goldman, R. F. (1972). Terrain coefficients forenergy cost prediction. Journal of Applied Physiology 32, 706–708.
Steward, J. H. (1938). Basin–Plateau aboriginal sociopoliticalgroups. Bureau of American Ethnology Bulletin 120. Washington,D.C.: Smithsonian Institution.
Thomas, D. H. (1986). Contemporary hunter-gatherer archaeologyin America. In (D. J. Meltzer & D. D. Fowler, Eds) AmericanArchaeology: Past and Present. Washington, D.C.: SmithsonianInstitution Press, pp. 237–276.
White, G. (1989). A Report Of Archaeological Investigations AtEleven Native American Coastal Sites, MacKerricher State Park,Mendocino County, CA. Ms. on file, Northwestern InformationCenter, California State University, Sonoma. Rohnert Park.