Spatial and seasonal evolution of dissolved oxygen and nutrients in the Southern Levantine Basin...
26
Deep-Sea Research I 48 (2001) 2347–2372 Spatial and seasonal evolution of dissolved oxygen and nutrients in the Southern Levantine Basin (Eastern Mediterranean Sea): chemical characterization of the water masses and inferences on the N : P ratios Nurit Kress*, Barak Herut Israel Oceanographic a Limnological Research, The National Institute of Oceanography, P. O. Box 8030, Tel Shikmona, 31080, Haifa, Israel Received 13 July 1999; received in revised form 19 September 2000; accepted 6 April 2001 Abstract The spatial and seasonal variability of nutrients and dissolved oxygen concentrations as well as the chemical characterization of the different water masses of the Southern Levantine Basin were determined in detail. In summer, the upper 150 m of the water body was stratified and the cross basin distribution of dissolved oxygen and nutrients was fairly constant. Surficial waters were saturated with dissolved oxygen, and a shallow oxygen maximum (oversaturated) was present at about 80 m depth. Oversaturation was attributed mainly to the physical process of rapid capping and trapping of oxygen in the Atlantic water (AW) mass, with only 28% of the excess oxygen originating from biological production. Nutrient concentrations were very low and showed an increase in the intermediate levels, coupled with a decrease in oxygen. The winter cross-section distribution showed an upper mixed layer of 100 m, with dissolved oxygen and nutrient concentrations fairly constant across the basin. The concentration of nitrate was higher than in summer, while phosphate was slightly lower and silicic acid similar. In winter, the influence of the physical features (gyres) could be detected up to the surface, and in summer they were detected by the chemical properties in the 150–600 m layer. In the transition layer between the Levantine intermediate water (LIW) and the deep water (DW) (400–700 m) there was a gradual decrease in dissolved oxygen and an increase in nutrient concentrations eastwards. The DW showed no seasonal variation, only spatial variability: dissolved oxygen decreased and silicic acid increased eastwards. No differences were found in nitrate and phosphate concentrations between the DW in the western and eastern provinces, indicating the oxidation of organic matter poor in N and P. N : P ratios in the upper water masses were seasonally dependent. The largest variation was found in the Levantine surface water (LSW), from an average of 52 in winter to 5 in summer. It is hypothesized that the gradual decrease from winter to summer values was due mainly to preferential atmospheric input of N in *Corresponding author. Tel. +972-4-8515202; fax: +972-4-8511911. E-mail address: [email protected] (N. Kress). 0967-0637/01/$ - see front matter r 2001 Elsevier Science Ltd. All rights reserved. PII:S0967-0637(01)00022-X
-
Upload
independent -
Category
Documents
-
view
0 -
download
0
Transcript of Spatial and seasonal evolution of dissolved oxygen and nutrients in the Southern Levantine Basin...

Deep-Sea Research I 48 (2001) 2347–2372
Spatial and seasonal evolution of dissolved oxygen andnutrients in the Southern Levantine Basin (Eastern
Mediterranean Sea): chemical characterization of the watermasses and inferences on the N : P ratios
Nurit Kress*, Barak Herut
Israel Oceanographic a Limnological Research, The National Institute of Oceanography, P. O. Box 8030,
Tel Shikmona, 31080, Haifa, Israel
Received 13 July 1999; received in revised form 19 September 2000; accepted 6 April 2001
Abstract
The spatial and seasonal variability of nutrients and dissolved oxygen concentrations as well as thechemical characterization of the different water masses of the Southern Levantine Basin were determined indetail. In summer, the upper 150m of the water body was stratified and the cross basin distribution ofdissolved oxygen and nutrients was fairly constant. Surficial waters were saturated with dissolved oxygen,and a shallow oxygen maximum (oversaturated) was present at about 80m depth. Oversaturation wasattributed mainly to the physical process of rapid capping and trapping of oxygen in the Atlantic water(AW) mass, with only 28% of the excess oxygen originating from biological production. Nutrientconcentrations were very low and showed an increase in the intermediate levels, coupled with a decrease inoxygen. The winter cross-section distribution showed an upper mixed layer of 100m, with dissolved oxygenand nutrient concentrations fairly constant across the basin. The concentration of nitrate was higher thanin summer, while phosphate was slightly lower and silicic acid similar. In winter, the influence of thephysical features (gyres) could be detected up to the surface, and in summer they were detected by thechemical properties in the 150–600m layer. In the transition layer between the Levantine intermediatewater (LIW) and the deep water (DW) (400–700m) there was a gradual decrease in dissolved oxygen and anincrease in nutrient concentrations eastwards. The DW showed no seasonal variation, only spatialvariability: dissolved oxygen decreased and silicic acid increased eastwards. No differences were found innitrate and phosphate concentrations between the DW in the western and eastern provinces, indicating theoxidation of organic matter poor in N and P.
N : P ratios in the upper water masses were seasonally dependent. The largest variation was found in theLevantine surface water (LSW), from an average of 52 in winter to 5 in summer. It is hypothesized that thegradual decrease from winter to summer values was due mainly to preferential atmospheric input of N in
*Corresponding author. Tel. +972-4-8515202; fax: +972-4-8511911.
E-mail address: [email protected] (N. Kress).
0967-0637/01/$ - see front matter r 2001 Elsevier Science Ltd. All rights reserved.
PII: S 0 9 6 7 - 0 6 3 7 ( 0 1 ) 0 0 0 2 2 - X

winter and P in summer, together with biological consumption and differential regeneration of N and P. Inthe DW, the N : P ratios were constant throughout the year (25.272.7, n ¼ 567), and higher than Redfield’sratio. It was speculated that the high N : P ratio in the DW was a result of oxidation of particulate organicmatter deficient in P.
The winter wet atmospheric input of N provided 12% of new N to the LSW. Average new production forthe Southern Levantine Basin was estimated from the new N as 4.75 g Cm@2 yr@1. The dry atmosphericcontribution of P was estimated to significantly increase the P pool in the LSW. Dry deposition is notevenly distributed and occurs in episodic and localized events, which may have a large effect on productivityin the short periods when deposition occurs.
There have been recently reported changes in the deep thermohaline circulation of the EasternMediterranean, with main contribution of the Aegean Sea as a source of DW. The data presented here canserve as a reference for assessing future changes in the chemical composition of the water masses in theSouthern Levantine. r 2001 Elsevier Science Ltd. All rights reserved.
Keywords: Eastern Mediterranean; Seawater; Oxygen; Nutrients; Seasonality; N : P ratio
1. Introduction
The chemical characteristics of the Eastern Mediterranean, in particular the Levantine Basin,the easternmost basin of the Mediterranean, have been studied to date on a limited basis, eitherwith low resolution, basinwide surveys (Salihoglu et al., 1990; Yilmaz et al., 1994;Souvermezoglou et al., 1992; Yacobi et al., 1995) or in high resolution studies of limited areas(Krom et al., 1991, 1992, 1993). In contrast to the chemical knowledge, the circulation andhydrography of the Levantine Basin were thoroughly described by Hecht et al. (1988) and Ozsoyet al. (1989, 1993). The main persistent features of the circulation are the cyclonic Rhodes gyrelocated southeast of Rhodes in the Northern Levantine Basin, and the Mersa Matruh andShikmona anticyclonic gyres located in the Southern Levantine (POEM group, 1992). Hecht et al.(1988) characterized four water masses in the area based mainly on climatological salinity andwater depth values: Levantine surface water (LSWFSX38:95, 0–40m), Atlantic water(AWFSp38:87, 65–95m), Levantine intermediate water (LIWFSX38:94, 200–310m) andDeep water (DWFTo13:81C and So38:74; below 700m). The AW enters the EasternMediterranean through the straits of Sicily, and its salinity and depth range increase as it flowseastwards. In summer, because of increased evaporation, the AW is capped with a layer of saltierand warmer waters, the LSW. In winter, AW is essentially the LSW. LIW is formed in theLevantine Basin and flows into the Western Mediterranean and from there to the Atlantic Ocean(POEM group, 1992). Deep waters of the Eastern Mediterranean are formed primarily in theAdriatic, but recently Roether et al. (1996) and Klein et al. (1999) observed changes in the deepthermohaline circulation of the Eastern Mediterranean, with main contribution of the Aegean Seaas a source of DW. This change in the thermohaline circulation was traced back to 1991(Malanotte-Rizzoli et al., 1999).Nutrients and oxygen in the Ionian Sea were described by Souvermezoglou et al. (1992), along a
transect from the Otranto straits to Crete. The authors characterized the chemical parameters offour distinct water masses in summer and winter: surface water, LIW, Adriatic bottom water
N. Kress, B. Herut / Deep-Sea Research I 48 (2001) 2347–23722348

(AdBW) and DW that flowed into the Levantine Basin. The vertical distribution of chemicalparameters in the Northern Levantine Basin was studied by Salihoglu et al. (1990) and Yilmazet al. (1994) at the cyclonic Rhodes gyre and the anticyclones in the Cilician Basin and south ofRhodes. The vertical distribution of nutrients in both areas had completely reversed trends: thenutricline at the cyclonic gyre was close to the surface (ca. 75m) while at the anticyclonic areas itappeared at 250–300m. However, the nutricline was independent of the geographical location andalways appeared at isopycnal surfaces of 29.0–29.05 and 29.15 (upper and lower boundaries,respectively). Chlorophyll-a (chl-a) maxima were found at 70–75m and at 100–110m depth in thecyclonic and anticyclonic regions, respectively. In the Southern Levantine Basin, Yacobi et al.(1995) described summer chl-a distribution and its relationship to the physical fields. Chl-a rangedbetween 0.009 and 0.4mg l@1, and had a similar vertical distribution across the basin. Maximalchl-a values were found at 90–110m except at the anticyclone south of Crete, where chl-a wasdistributed evenly in the water column. More than 90% of the chl-a was confined to particlessmaller than 10mm and 60% to particles smaller than 2 mm.A detailed temporal, localized, chemical study was performed in the Southeastern Levantine
Basin, at the site of a warm core eddy located southeast of Cyprus (Krom et al., 1991, 1992, 1993).The vertical distribution of the chemical parameters followed the physical fields: the depth profilesin the core of the eddy were displaced downward by 250–300m relative to the boundary station.In winter, this displacement started from the surface, while in summer the upper mixed layer wasconstant across the eddy and the vertical displacement noticeable only below 100m depth. Deepwinter mixing of the upper 450m of the eddy core resulted in phytoplankton biomass buildup,well above the biomass at the boundary station (70 and 44mg chl-am@2, respectively). Annualnew production of 300mmol Nm@2 yr@1 and 14.9mmol Pm@2 yr@1 was calculated (Kromet al., 1991). The N : P ratio in the core was 27.574.0 and a similar ratio was found for the watercolumn across much of the Southern Levantine Basin. These data lead to the conclusion that theSoutheastern Mediterranean is strongly P limited and the degree of P limitation increases fromwest to east across the entire basin (Krom et al., 1991)Between 1989 and 1995 we performed a series of basinwide cruises in the Southern Levantine as
part of the biological-chemical (BC) component of the POEM program (Physical Oceanographyof the Eastern Mediterranean) (POEM group, 1992, 1996). This paper aims to describe thebasinwide distribution of dissolved oxygen and nutrients in the Southern Levantine and theirseasonal variation as well as to characterize the chemical properties of the different water massesfound in the region. It will address the question of potential nutrient limitation and the seasonalityof the N : P ratios found in the various water masses in the area.
2. Sampling and methods
2.1. Study site and seasons
The research cruises were conducted on board the R/V Shikmona during March–April 1989(POEM-MAp89, 87 stations), August 1990 (POEM-Au90, 82 stations), October 1991 (POEM-Oc91, 95 stations) and April 1995 (POEM-Ap95, 15 stations) (Fig. 1). The POEM-MAp89 surveywas performed in three legs: beginning of March, end of March and mid-April. Because of the
N. Kress, B. Herut / Deep-Sea Research I 48 (2001) 2347–2372 2349

time of the year (transition between winter and spring conditions) the survey was not synopticfrom the chemical point of view. It was, therefore, divided into three periods: winter (50 stations),winter–spring (w–sp) transition (24 stations) and spring (13 stations). POEM-Ap95 (LIWEX-95)was a process-oriented cruise (POEM group, 1996) of limited coverage.We essentially used the definition of seasons in the study area adopted by Hecht et al. (1988) of
winter as the period of minimum heat storage in the upper 200m of water and summer as theperiod of maximum heat storage. February and March are defined as winter and July, August,September and October as summer. May and June, and November, December and January aredefined as spring and fall. The only difference is that in this study April was defined as spring andnot winter after examination of the chemical parameters.
2.2. Sampling and analysis
Stations were located on a regular 0.51 (latitude and longitude) grid of stations covering almostthe entire Southern Levantine (Fig. 1). Continuous profiles of temperature and salinity weremeasured with a Neil-Brown CTD or an SBE Model 9 CTD (POEM-Ap95). The physicaloceanography is described at length by Ozsoy et al. (1993). Temperatures are given in degreeCelsius and salinity on a practical salinity scale. Water samples were collected with a GeneralOceanics Rosette equipped with 10–12 1.7 l Niskin bottles. Water was sampled at 5–6 depths inthe upper 300m and at six depths between 300 and 1200m. During the POEM-MAp89 thesampling scheme was different, with four samples at the upper 300m and 7 at 300–1200m. As aresult of the sampling scheme during the 1989 cruise, LIW was not sampled. At a few stations,double casts were used to sample down to 3000m depth. Water samples for dissolved oxygen weresampled first and pickled, and duplicate samples for nutrient analysis were collected in 15ml acidwashed plastic scintillation vials and immediately frozen. Dissolved oxygen was measured at seaby the Carpenter–Winkler titration procedure (Carpenter, 1965) and a Radiometer automatictitrator (TTT80), equipped with a dual platinum electrode, in the dead-stop end point mode. Theprecision was 0.4%. Nutrients were determined in duplicate in the laboratory with a segmentedflow Technicon AutoAnalyser II (AA-II) system, by the methods described by Krom et al. (1991,1993). The precision for nitrate+nitrite, phosphate and silicic acid was 0.02, 0.003 and 0.06mM,respectively. The limit of detection (two times the standard deviation of the blank) was 0.075mMfor nitrate+nitrite, 0.008mM for phosphate and 0.03mM for silicic acid. For simplicity, in the textwe will refer to nitrate+nitrite as nitrate.
2.3. Quality control and quality assurance
The Eastern Mediterranean is ultra-oligotrophic, and nutrient analyses, in particular of upperlayer water samples, require work close to the detection limit of the methods. As no internationalstandard reference material is available for the determination of the accuracy of the results, thefollowing procedures were used to perform quality control and assurance of the results:
(a) Each sample was analyzed in duplicate. The data were then filtered using plots of nutrientagainst temperature. Values were rejected if higher or lower than expected by0.025 mmol kg@1 for o-phosphate and by 0.5 mmol kg@1 for nitrate and silicic acid. The
N. Kress, B. Herut / Deep-Sea Research I 48 (2001) 2347–23722350

percentage of the points rejected in this way was less than 1%. In addition, within cruiseconsistency of the results was examined by comparing the DW results of adjacent stations.The coefficient of variation found was less than 5% for phosphate, nitrate and silicic acid.
(b) We participated in an intercomparison exercise, where identical seawater samples weredistributed to the research institutions participating in the POEM program (Kress et al.,1991). The among-lab coefficients of variation for o-phosphate was 8% at 0.3mM (highconcentration) and 31% at 0.06mM (low concentration). The among-lab coefficient ofvariation for nitrate and silicic acid were 10% at high concentrations (10 and 11 mM for nitrateand silicic acid, respectively) and 20% at low concentration (1mM for both nutrients).
(c) There were intercomparison stations at sea during each cruise among the POEM participants(unpublished results). The stations were located at the same position or adjacent to each other.
Fig. 1. Map of station locations. (A) POEM-MAp89 (winter, open squares; w-sp transition, crosses; spring, filled
squares) and POEM-Ap95 (open triangles). (B) POEM-Au90 (open circles) and POEM-Oc91 (open diamonds).
N. Kress, B. Herut / Deep-Sea Research I 48 (2001) 2347–2372 2351
However, because of logistics problems, the stations were not occupied simultaneously;therefore, only results of the DW (below 600m) were compared. The coefficient of variationwere 13% for o-phosphate, 8% for nitrate and 9% for silicic acid.
(d) Recently, we participated in the NOAA/NRC Intercomparison for nutrients in seawater withgood results (Willie and Clancy, 2000). The methods used in our lab today are the same asthose used for the duration of this research and other studies in the area (Krom et al., 1991,1992, 1993).
2.4. Statistical analyses
T-test and Anova, at the 95% confidence level, were used in statistical comparisons for thechemical characterization of the water masses. Comparison of the N : P ratios was performed alsowith the non-parametric Mann–Whitney test at the 95% confidence level.
3. Results
3.1. Basinwide seasonal distribution
To describe the general features of the chemical oceanography in the studied area we showvertical sections along 331300 N in winter and summer (Figs. 2 and 3). Typical vertical profiles areshown as well. We chose to depict typical vertical profiles for stations that were not in any of themesoscale features present in the area.
3.1.1. Winter cross basin distributionThe salinity cross section showed one major downwelling region centered on 291000 E and a
weak upwelling at 271300 E, at the southern reaches of the Rhodes gyre. These features can be seenin the dynamic height anomaly map presented by Ozsoy et al. (1993). The distribution of oxygenin the upper 250m of the water body was fairly constant across the region, with signatures of themesoscale Mersa Matruh and Shikmona gyres at 281300 E and 331000 E, respectively. Surficialwaters were slightly undersaturated with oxygen, and the concentration decreased with depth. Theinfluence of the Mersa Matruh and Shikmona gyres could be detected from the surface down toabout 600 and 400m, respectively, causing a heterogeneous distribution of the nutrients along thetransect. In the transition layer between the LIW and the DW (400–700m) there was a gradualdecrease in dissolved oxygen and an increase in nutrient concentrations eastwards. In the DW,dissolved oxygen still decreased eastwards and silicic acid increased, while no significant changeswere seen in nitrate and phosphate concentrations between west and east. The depth profilesshowed constant concentrations of dissolved oxygen and nutrients in the upper 200m. Nutrientconcentrations increased rapidly with depth up to 400m and continued to increase slowly down to600m, where they remained constant, except for silicic acid which continued to increase slowlywith depth. Dissolved oxygen decreased rapidly in the 200–600m water depth interval and thenremained essentially constant (Fig. 2).
N. Kress, B. Herut / Deep-Sea Research I 48 (2001) 2347–23722352

Fig. 2. Winter vertical section along 331300 N and depth profile for (a) salinity, (b) dissolved oxygen (mmol kg@1),(c) silicic acid (mmol kg@1), (d) nitrate (mmol kg@1), and (e) phosphate (mmol kg@1). Filled circles denote samplingdepths. Depth profile is drawn for the station located at 331300 N, 291300 E.
N. Kress, B. Herut / Deep-Sea Research I 48 (2001) 2347–2372 2353

3.1.2. Summer cross basin distributionThe salinity cross section showed two downwelling regions below 100m, in the Mersa Matruh
(291300 E) and in the Shikmona (341 E) gyres (Ozsoy et al., 1989). The distribution of oxygen inthe upper 150m of the water body was stratified and fairly constant across the region. Surficialwaters were slightly oversaturated with dissolved oxygen, and a shallow oxygen maximum waspresent at ca. 80m depth, with maximum measured value of 117%. Nutrients in the upper 150mwere homogeneous with very low values. The influence of the downwelling regions was detectedbetween 200 and 400m depth by the depression of the oxygen and nutrient isolines. As in winter,the transition layer between LIW and DW was not homogeneous across the basin: dissolvedoxygen decreased and nutrients increased eastwards. In the DW dissolved oxygen decreased andsilicic acid increased eastwards but no significant changes occurred in the nitrate and phosphate
Fig. 2. (continued).
—————————————————————————————————————————-Fig. 3. Summer 1991 vertical section along 331300 N and depth profile for (a) salinity, (b) dissolved oxygen
(mmol kg@1), (c) silicic acid (mmol kg@1), (d) nitrate (mmol kg@1), and (e) phosphate (mmol kg@1). Filled circles denotesampling depths. Depth profile is drawn for the station located at 331300 N, 331300 E.
N. Kress, B. Herut / Deep-Sea Research I 48 (2001) 2347–23722354

N. Kress, B. Herut / Deep-Sea Research I 48 (2001) 2347–2372 2355
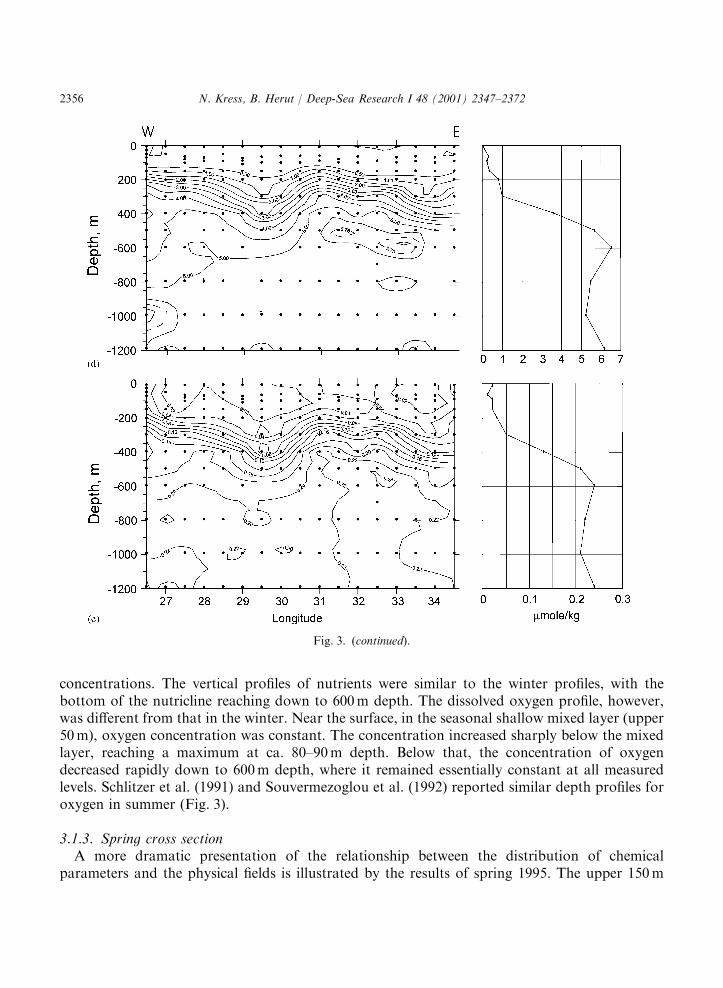
concentrations. The vertical profiles of nutrients were similar to the winter profiles, with thebottom of the nutricline reaching down to 600m depth. The dissolved oxygen profile, however,was different from that in the winter. Near the surface, in the seasonal shallow mixed layer (upper50m), oxygen concentration was constant. The concentration increased sharply below the mixedlayer, reaching a maximum at ca. 80–90m depth. Below that, the concentration of oxygendecreased rapidly down to 600m depth, where it remained essentially constant at all measuredlevels. Schlitzer et al. (1991) and Souvermezoglou et al. (1992) reported similar depth profiles foroxygen in summer (Fig. 3).
3.1.3. Spring cross sectionA more dramatic presentation of the relationship between the distribution of chemical
parameters and the physical fields is illustrated by the results of spring 1995. The upper 150m
Fig. 3. (continued).
N. Kress, B. Herut / Deep-Sea Research I 48 (2001) 2347–23722356

were fairly constant in composition along the transect, showing the effects of the beginning of theseasonal stratification. Below 150m, a strong downwelling feature was centered at 291450 E.Oxygen and nutrient isolines were depressed by ca. 350m at the center of this anticyclonecompared to its boundaries (Fig. 4).
3.2. Chemical characterization of the different water masses
The chemical data collected during this study were used to characterize the four distinct watermasses of the Levantine Basin (LSW, AW, LIW and DW) and are summarized in Table 1 bysurvey and Table 2 by season. The classification by water mass was based on the climatologicaldefinitions given by Hecht et al. (1988), therefore, factoring out the influence of the physicalfeatures on the characterization of the chemical parameters. The chemical properties of the four
Fig. 4. Spring 1995 vertical section along 331300 N for (a) salinity, (b) dissolved oxygen (mmol kg@1), (c) silicic acid(mmol kg@1), (d) nitrate (mmol kg@1), and (e) phosphate (mmol kg@1). Filled circles denote sampling depths.
N. Kress, B. Herut / Deep-Sea Research I 48 (2001) 2347–2372 2357

Table 1Chemical properties of the water masses in the Southern Levantine Basin during the different surveys. Average
(standard deviation) for dissolved oxygen (mmol kg@1), % oxygen saturation, nutrient concentrations (mmol kg@1) andN : P ratio. Data classification based on Hecht et al. (1988): LSWFSX38.95, 0–40m; AWFSp38.87, 65–95m;LIWFSX38.94, 200–310m; DWFTo13.81C and So38.74; below 700m
Water mass Cruisea O2 % O2 sat Si(OH)4 NO3 PO4 N : Pb
LSW s-91(105,105) 207.2 (8.2) 100.6 (2.2) 1.20 (0.20) 0.07 (0.14) 0.03 (0.02) 5.5 (9.6) 62
s-90(87, 95) 210.2 (16.9) 102.8 (3.3) 0.98 (0.44) 0.04 (0.09) 0.01 (0.01) 4.4 (5.0) 27sp-95(17,17) 230.6 (1.0) 98.9 (0.6) 0.85 (0.24) 0.22 (0.19) 0.02 (0.02) 14.1 (19.2) 11sp-89(15, 14) 227.5 (4.4) 102.1 (1.8) 1.53 (0.22) 0.18 (0.06) 0.02 (0.03) 8.7 (6.0) 8
tr-89(34, 41) 232.6 (4.1) 99.9 (2.3) 1.47 (0.20) 0.29 (0.18) 0.02 (0.01) 16.0 (14.5) 27w-89 (34, 53) 232.0 (8.7) 98.4 (3.4) 1.23 (0.48) 0.60 (0.50) 0.01 (0.01) 52.2 (55.7) 34
AW s-91 (42, 42) 232.6 (6.0) 102.1 (4.5) 1.11 (0.31) 0.15 (0.25) 0.02 (0.02) 10.3 (13.7) 27
s-90 (80, 91) 230.6 (12.0) 101.3 (6.4) 1.19 (0.81) 0.28 (0.88) 0.01 (0.03) 19.4 (28.2) 25sp-95 (30, 30) 227.8 (7.2) 96.3 (3.5) 1.06 (0.41) 0.41 (0.62) 0.02 (0.02) 25.0 (27.7) 14sp-89 (29, 29) 230.7 (4.3) 99.3 (2.0) 1.65 (0.14) 0.25 (0.12) 0.02 (0.02) 11.7 (5.6) 13
tr-89 (16, 19) 232.3 (4.3) 99.2 (2.0) 1.58 (0.27) 0.38 (0.35) 0.01 (0.02) 20.7 (16.2) 10w-89 F F F F F
LIW s-91 (32, 32) 218.4 (7.8) 94.7 (4.9) 1.24 (0.27) 0.40 (0.35) 0.03 (0.02) 18.8 (14.8) 30s-90 (29, 31) 225.8 (7.4) 97.2 (3.9) 1.16 (0.65) 0.70 (0.82) 0.03 (0.02) 22.6 (19.2) 22sp-95 (66, 66) 210.0 (8.1) 87.8 (4.0) 1.81 (0.87) 1.99 (1.02) 0.05 (0.04) 54.0 (32.9) 58
Schlitzer et al. (1991) s-87 219 87 1.7 1.3 0.04
DWFEast s-91 (49, 47) 175.1 (3.8) 70.2 (1.5) 10.72 (0.54) 5.40 (0.35) 0.22 (0.03) 24.5 (2.8) 47s-90 (40, 47) 174.8 (1.9) 70.7 (0.8) 10.12 (0.56) 5.71 (0.22) 0.24 (0.03) 24.3 (2.7) 47
sp-89 (15, 14) 174.5 (0.8) 70.5 (0.3) 10.93 (0.70) 5.53 (0.26) 0.22 (0.03) 25.6 (3.0) 14tr-89 (14, 12) 177.7 (1.6) 71.9 (0.6) 10.38 (0.37) 5.57 (0.15) 0.22 (0.02) 25.0 (1.7) 12w-89 (10, 15) 173.5 (0.6) 70.2 (0.2) 10.13 (0.43) 5.73 (0.07) 0.22 (0.01) 26.3 (1.6) 15
DWFCentral s-91 (43, 41) 177.5 (4.7) 71.2 (2.0) 10.06 (0.86) 5.31 (0.28) 0.22 (0.02) 24.3 (2.3) 41s-90 (40, 46) 177.1 (3.3) 71.7 (1.5) 9.68 (0.70) 5.79 (0.22) 0.23 (0.02) 24.8 (1.9) 46
sp-95 (26, 25) 181.2 (3.3) 73.3 (1.4) 7.81 (0.78) 5.27 (0.29) 0.19 (0.02) 27.7 (2.1) 25tr-89 (14, 16) 176.6 (1.5) 71.4 (0.6) 10.27 (0.78) 5.37 (0.33) 0.22 (0.02) 24.1 (2.6) 16w-89 (6, 17) 178.1 (1.4) 72.3 (0.6) 9.62 (0.51) 5.73 (0.14) 0.20 (0.01) 28.1 (1.4) 17
Schlitzer et al. (1991) s-87 177 10.6 4.9 0.23
DWFWest s-91 (61, 62) 179.4 (4.6) 72.3 (2.6) 9.46 (0.94) 5.32 (0.41) 0.22 (0.02) 24.5 (2.5) 62s-90 (56, 70) 179.8 (2.9) 73.0 (1.3) 9.47 (0.84) 5.70 (0.40) 0.23 (0.04) 25.1 (3.0) 70
sp-95 (15, 15) 178.6 (2.2) 72.2 (0.9) 8.14 (0.59) 5.25 (0.18) 0.19 (0.01) 27.4 (1.3) 15tr-89 (10, 16) 177.3 (1.9) 71.8 (0.8) 9.88 (0.84) 5.59 (0.26) 0.24 (0.04) 24.2 (2.7) 16w-89 (13, 27) 181.6 (2.8) 73.8 (1.2) 9.27 (0.73) 5.68 (0.26) 0.21 (0.01) 27.4 (1.6) 27
a sFsummer, spFspring, trFw–sp transition, wFwinter. Given in parentheses is the number of O2 and nutrientdata points.
bNutrient values below detection limit were neglected in the calculation of the average and standard deviation.
Number of data points is given in italics.
N. Kress, B. Herut / Deep-Sea Research I 48 (2001) 2347–23722358

different water masses were characterized by their mean and standard deviation. The data pointsthat did not fall within the climatological definition of the water masses were not used in thecalculation of the mean value; e.g. all the data in the transition layer between LIW and DW. TheDW was divided into three different provinces: western (261300 E–291000 E), central (291300 E–311300 E) and eastern (321000 E–341300 E), all at latitudes lower than 331300 N . This latitude waschosen in order to exclude the Cretean passage area, where younger waters of Aegean origin areusually observed at depths between 500 and 1200m (Hecht et al., 1988; Schlitzer et al., 1991;Malanotte-Rizzoli et al., 1997). Characterization of DW at a latitude higher than 33130’ N wasperformed separately (Table 3). In general, the nutrients’ mean concentrations in the LSW andAW had very high standard deviations, due to the low levels measured (Table 1). However, thelarge number of data points made the comparisons statistically significant. In the DW, thecoefficient of variation was 2–10% for silicic acid and nitrate, and 5–17% for phosphate, withhigher standard deviations in the western province.
3.2.1. Levantine surface waterThe LSW during winter extends down to 100m, shallowing towards summer to ca. 50m (Hecht
et al., 1988; Ozsoy et al., 1989). Average temperature was 16.237 0.401C in winter, 19.1670.341C in the spring and 24.0572.301C in summer, in agreement with the average values reportedby Hecht et al. (1988). The surficial waters were close to oxygen saturation during all seasons,slightly oversaturated in summer and spring 1989 and slightly undersaturated in winter and springof 1995. Similar summer averages for dissolved oxygen and oversaturation were reported bySchlitzer et al. (1991). Nitrate concentration was highest in winter and decreased to minimalvalues in summer. The winter nitrate was similar to the value reported by Krom et al. (1992). Theaverage nitrate concentrations in the two summers and springs were not significantly different.
Table 2Chemical characterization of the upper water masses in the Southern Levantine Basin during the different seasons.
Average (standard deviation) for dissolved oxygen (mmol kg@1), % oxygen saturation, nutrient concentrations(mmol kg@1) and N : P ratio
Water mass Season O2 % O2 sat Si(OH)4 NO3 PO4 N : P
LSW Summer 208.6 (13.0) 101.6 (3.0) 1.09 (0.36) 0.06 (0.11) 0.02 (0.02) 5.2(8.5)Spring 229.1 (3.5) 100.4 (2.1) 1.16 (0.41) 0.20 (0.15) 0.02 (0.03) 14.2 (10.7)
Transition 232.6 (4.1) 99.9 (2.3) 1.47 (0.20) 0.29 (0.18) 0.02 (0.01) 16.0 (14.5)Winter 232.0 (8.7) 98.4 (3.4) 1.23 (0.48) 0.60 (0.50) 0.01 (0.01) 52.2 (55.7)
AW Summer 231.2 (10.4) 101.6 (5.9) 1.16 (0.69) 0.23 (0.74) 0.02 (0.03) 14.7 (22.1)Spring 229.2 (6.1) 97.8 (3.2) 1.35 (0.42) 0.33 (0.45) 0.02 (0.02) 18.6 (21.0)Transition 232.3 (4.3) 99.2 (2.0) 1.58 (0.27) 0.38 (0.35) 0.01 (0.02) 20.7 (16.2)
LIW Summer 221.9 (8.5) 95.9 (4.7) 1.20 (0.50) 0.55 (0.65) 0.03 (0.02) 20.5 (16.8)Spring 210.0 (8.1) 87.8 (4.0) 1.81 (0.87) 1.99 (1.02) 0.05 (0.04) 54.0 (32.9)Wintera 214.1 (13.0) 90.6 (6.5) 1.70 (1.17) 1.19 (1.22) 0.03 (0.04) 44.3 (13.1)
aKrom et al., 1992.
N. Kress, B. Herut / Deep-Sea Research I 48 (2001) 2347–2372 2359

Phosphate was close to the detection limit during all seasons. The only significant difference wasfound between winter 1989 and summer 1991, with phosphate higher in the latter. When bothsummer phosphate values were pooled there was no significant difference from winter (Table 2).The concentrations of silicic acid were variable. The highest concentrations were found in thew–sp transition and spring 1989 followed by winter 1989 and summer 1991. The lowestconcentrations were found in summer 1990 and spring 1995.
3.2.2. Atlantic waterA discrete layer of AW was found during the w–sp transition, spring and summer surveys but
not in winter (as expected). Average summer temperature was 18.2271.391C. AW was slightlyoversaturated with dissolved oxygen in summer, close to saturation in the w–sp transition andspring of 1989 and slightly undersaturated in spring 1995. Essentially similar dissolved oxygenconcentrations were found during all cruises, with slightly lower concentrations in spring 1995.The highest silicic acid concentrations were found in the w–sp transition and spring 1989 andlower in summer and spring 1995. Nitrate and phosphate were very low during all the surveys withno significant differences among them.
3.2.3. Levantine intermediate waterData are available only for the spring 1995 cruise and the two summer cruises (Table 1).
Dissolved oxygen concentration and oxygen saturation were lower in the spring than in summer.The oxygen concentration and saturation in summer 1990 were higher than in summer 1991.Silicic acid, nitrate and phosphate were higher in spring 1995 than in summer.
3.2.4. Deep waterIn the eastern province dissolved oxygen, oxygen saturation and phosphate were not
significantly different among the cruises, except for oxygen and oxygen saturation in w–sptransition 1989 and phosphate in summer 1990 that were significantly higher than the others.Nitrate and silicic acid were statistically different but with small absolute differences (5.40–5.73and 10.12–10.93mmol kg@1, respectively). In the western province there was more variabilityamong the surveys (Table 1). Oxygen, oxygen saturation and silicic acid were not significantlydifferent, except for higher oxygen and oxygen saturation in winter 1989 and lower silicic acid in
Table 3
Chemical characterization of the deep water mass in the different provinces of the Southern Levantine Basin. Average(standard deviation) for dissolved oxygen (mmol kg@1), % oxygen saturation, nutrient concentrations (mmol kg@1) andN : P ratioa
Water mass Province O2 % O2 sat Si(OH)4 NO3 PO4 N : P
DW East 175.1 (2.9) 70.6 (1.2) 10.44 (0.60) 5.57 (0.30) 0.23 (0.03) 24.7 (2.7)
Central 177.3 (3.8) 71.5 (1.6) 9.88 (0.79) 5.56 (0.34) 0.22 (0.02) 25.0 (2.4)West 179.9 (4.0) 72.7 (1.8) 9.45 (0.90) 5.55 (0.40) 0.22 (0.03) 25.2 (2.8)West-high lat 191.4 (9.2) 77.9 (4.1) 7.70 (1.50) 4.80 (0.61) 0.19 (0.03) 25.9 (2.7)
aWest and central provinces without the results for spring 1995.
N. Kress, B. Herut / Deep-Sea Research I 48 (2001) 2347–23722360

spring 1995. Phosphate was lower in winter 1989 and spring 1995 and nitrate was lowest insummer 1991 and spring 1995.
4. Discussion
4.1. Seasonal evolution of the chemical character of the upper water masses (LSW, AW and LIW)
At the end of winter the surface water warms up giving way to the buildup of the seasonalthermocline, and the division of LSW into ‘‘spring’’ LSW and AW. During the spring andsummer the LSW occupies the narrow (shallow) upper mixed layer and is warmer and more salinethan winter LSW (Hecht et al., 1988; Ozsoy et al., 1989). The underlying AW is cooler and lesssaline than the LSW. Neglecting biological activity and assuming rapid capping of the AW thatprevents gas exchange with the atmosphere, the dissolved oxygen concentration of the AW shouldbe the same as ‘‘winter’’ LSW. In the LSW, dissolved oxygen concentration should decrease fromwinter to summer due to atmospheric loss with increasing water temperature. This was indeed thecase (Table 2). Dissolved oxygen in summer LSW was lower by 23 mmol kg@1 than the wintervalues, but the AW retained essentially the same concentration. However, both the LSW and theAW are in the photic zone, where biological activity cannot be neglected. The increase in oxygensaturation in the LSW from slightly undersaturated in winter to slightly oversaturated in summercould then be attributed to biological activity. In the AW, the increase in oxygen saturation wasprobably a result of physical and biological processes that will be elaborated below.Phosphate in the LSW and AW was very low and close to the detection limit, with no detectable
seasonal differences (Table 2). Nitrate concentrations decreased gradually from winter to summerin both the LSW and AW. Silicic acid in the LSW was higher in the w–sp transition and similar inall the other seasons, while in the AW there was a gradual decrease from w–sp transition tosummer. The seasonality in nutrient concentration was probably due to the seasonalphytoplankton bloom that occurs during winter and the beginning of spring (Azov, 1986; Kimoret al., 1987; Krom et al., 1992). Nitrate was consumed rapidly between winter and spring whilephosphate concentrations remained low. Phosphate can be introduced by atmospheric dry input(Herut et al., 1999a), but it is probably utilized rapidly by the phytoplankton (Buat-Menard et al.,1989) so that no changes in the concentration are detected in the water. Only during summer 1991(Table 1) is there an indication that phosphate may be higher than in the other seasons. This, inconjunction with the low nitrate values measured at the end of the summer, indicates thatproductivity may be limited by the availability of nitrate at the end of summer or co-limited by it.The reason for the increase in silicic acid in the w–sp transition LSW is not clear, but it may be thedry atmospheric input of quartz and alumino-silicates that occurs mainly during the transitionseasons (Ganor and Mamane, 1982; Herut et al., 1999b). The role of atmospheric nutrient inputon seawater concentrations will be addressed later. Silicic acid and nitrate in the AW were alwayshigher than in the LSW, probably as a result of remineralization.The LIW is formed by the sinking of LSW in winter at specific areas of the Levantine Basin and
subsequently spreading westwards (Hecht et al., 1988; Schlitzer et al., 1991; Malanotte-Rizzoliet al., 1997). Dissolved oxygen in the LIW was higher and nutrients were lower in summer than inwinter and spring (Table 2), indicating younger LIW. It is, therefore, reasonable to assume that
N. Kress, B. Herut / Deep-Sea Research I 48 (2001) 2347–2372 2361

the LIW sampled in winter and spring was formed in the previous year but that LIW in summerwas formed during winter of the same year. This may be indicative of the time scale it takes for theLSW to sink and form the LIW. Higher concentrations of nitrate and phosphate (5.0 and0.22mM, respectively) were measured in the LIW at the Otranto Straits (Civitarese et al., 1998)than in the Southern Levantine, in agreement with the circulation pattern in the basin and theolder age of this water mass at the straits.
4.2. Spatial characterization of the DW mass
The spatial characterization of DW (Table 3) was performed without taking into account theresults of spring 1995 that were consistently different from the other cruises: higher dissolvedoxygen and lower nutrients (Table 1). The reason is not known and may be due to the limitedspatial coverage, in an area of intense downwelling. In the DW, there was a gradual decrease ofdissolved oxygen and oxygen saturation and an increase in silicic acid from the western provinceto the central and eastern provinces (Table 3). Nitrate and phosphate were not significantlydifferent among the three provinces, indicating that the organic matter oxidized in the DW waspoor in N and P. The regeneration of N and P was not coupled to that of silicic acid, for the latteris regenerated mainly as a result of chemical dissolution and not respiration (Broecker and Peng,1982). The same trends were reported by Schlitzer et al. (1991) between the central and easternLevantine.It is interesting to note that in the transition layer between LIW and DW (between ca. 250 and
700m) there was a slight increase in nitrate and phosphate concentrations eastwards, concurrentwith the decrease in dissolved oxygen (Figs. 2b, d, e, and 3b, d, e). Calculation of the expectednitrate and phosphate increase from the decrease in dissolved oxygen (assuming Redfield’sstoichiometry) and comparison to the measured values showed that the latter explains only ca.50% of the expected, theoretical value. This again indicates the oxidation of organic matter poorin N and P in the transition layer as well.There was a striking latitudinal dependence of the DW characteristics on the western side of the
basin: oxygen increased and nutrient decreased with increasing latitude (Table 3). This is inagreement with the findings by Hecht et al. (1988), Schlitzer et al. (1991), and Malanotte-Rizzoliet al. (1997), who reported ventilation of the 500–1200m depth range south of Crete by relat-ively shallow (300m) Aegean water. This intrusion of younger water is probably the cause of thehigher coefficient of variation found for the nutrients in the DW of the western provincecompared to that of the eastern province. Although the decrease in dissolved oxygen at lowerlatitudes was concurrent with an increase in nutrients, the measured additions of N and P werejust 35% of those calculated from the differences in mean dissolved oxygen concentrations(DWhigh lat@DWwest, Table 3). and Redfield’s molar ratios. This again indicates the oxidation oforganic matter poor in N and P.
4.3. Source of subsurface oxygen maximum in summer: physical vs. biological source
The distribution of dissolved oxygen in the sea is determined by an interplay of physical(atmospheric exchange and mixing) and biological (photosynthetic production and respiration)processes (Broenkow, 1965). A notable subsurface dissolved oxygen maximum (O2 max) is
N. Kress, B. Herut / Deep-Sea Research I 48 (2001) 2347–23722362

ubiquitous in the Levantine Basin in summer (Fig. 3) and has been observed before (Schlitzeret al., 1991; Krom et al., 1992; Souvermezoglou et al., 1992; Yacobi et al., 1995). Schlitzer et al.(1991) found that the oxygen anomaly was higher than the CFM-12 anomaly and, therefore,attributed some of the O2 oversaturation to in situ biological production. In our study, the O2
maximum appeared at 50–80m depth (up to 117% saturation), between the bottom of the uppermixed layer and the deep chlorophyll maximum (Yacobi et al., 1995), and was associated with theAW (Fig. 3, Table 1).Table 2 shows that the average summer oxygen concentration in the AW was the same as in
winter LSW. Therefore, the O2 maximum could be attributed only to the physical process oftrapping ‘‘winter’’ oxygen in the AW. Rapid capping of the upper layer would prevent gasexchange with the LSW and atmosphere, keeping the oxygen concentration constant. Theoversaturation would then result from the warming of the AW due to high solar penetration insummer. However, AW is in the euphotic zone, where productivity occurs, and the assumption ofoversaturation due to physical processes only does not hold. The fact that there was no net changein the average oxygen concentration indicates that photosynthetic production was balanced by theoxidation of organic matter in the AW.The amount of oxygen of photosynthetic origin in the O2 maximum layer can be calculated
assuming that: (a) The average N concentration in the LSW in winter (0.6mmol kg@1) is the initialconcentration in the AW, prior to the phytoplankton bloom; (b) There is no physical exchange ofoxygen between the O2 maximum layer and the upper and lower layers; (c) N decreases from 0.6to 0.23mmol kg@1 in summer due to consumption in the AW (Table 2); (d) The consumptionfollows Redfield ratios (O2 :NO3=138 : 16), a reasonable assumption for a fast growing phyto-plankton population (Harris, 1986). Therefore, [email protected]=0.37mmol Nkg@1 were consumedbetween winter and summer (essentially end of spring) in the O2 maximum layer (AW),corresponding to the production of 3.2mmol O2 kg
@1 (oxygen of biological origin). The averagemaximal oxygen anomaly (O2 measured@O2 calculated) for both summer cruises was11.676.8mmol kg@1 (n ¼ 45) out of which 3.2mmol kg@1 were of photosynthetic origin,equivalent to 28% of the O2 anomaly. Therefore, the O2 max was mainly a result of physicalprocesses of capping and trapping, similar to the O2 max found in the Costa Rica dome(Broenkow, 1965), and in contrast to the 80% of the O2 max attributed to net photosyntheticproduction in the North Pacific gyre during summer (Craig and Hayward, 1987).
4.4. Seasonal evolution of the N :P ratios
One of the most exceptional characteristics of the DW in the Eastern Mediterranean is the highN : P ratio, higher than the Redfield ratio of 16 found in most of the oceans (Redfield et al., 1963).Water of Mediterranean origin can be traced in the Atlantic Ocean by the high N : P ratios(Gruber and Sarmiento, 1997). While high N : P ratios have been found in other oceans in theupper layer, in the DW the ratio converges to 16 (Fanning, 1992; Michaels et al., 1994; Andersonand Sarmiento, 1994; Gruber and Sarmiento, 1997), which is not the case in the Levantine Basin.High N : P ratios in the area have been reported by Krom et al. (1991), and in this study theaverage N : P, neglecting the higher latitude stations, was 25.272.7 (n ¼ 567) with no seasonalvariations. The cause for the high ratio is not clear, and various theories have been put forward toexplain it: nitrogen fixation (Bethoux and Copin-Montegut, 1986; Bethoux et al., 1998),
N. Kress, B. Herut / Deep-Sea Research I 48 (2001) 2347–2372 2363

phosphate removal by adsorption onto Saharan dust particles (Krom et al., 1991) and nitrateenriched waters of Adriatic origin forming the DW of the Eastern Mediterranean (Civitarese et al.,1998). In addition, it was suggested that atmospheric inputs of N and P may reinforce theunusually high N : P (Herut et al., 1999b). Because of the high N : P ratios, the productivity in thearea is thought to be limited by the availability of P (Krom et al., 1991), in contrast to Nlimitation in most of the world oceans (Codispoti, 1989, Vitousek and Howarth, 1991). Zohariand Robarts (1998) performed nutrient enrichment experiments in the Eastern Mediterranean andmeasured bacterial activity that showed very fast turnover of phosphate, indicating P limitationduring winter.In many studies, the N : P ratios were studied as the ratio proper, while in others they were
obtained from the slope of the linear regression of N on P (e.g., Krom et al., 1991; Fanning, 1992;Michaels et al., 1994). Both ratios coincide if the line passes through the origin in what is referredto as ideal covariation by Fanning (1992). In this study, we looked at the N : P ratios in both ways:(a) slope of N vs. P, and (b) the calculated ratio for each sampling point in a specific water mass(Tables 1–2). Fig. 5 (Oc-91 cruise) is an example of the N vs. P plot. Similar plots were obtainedfor all the surveys (Table 4). Using all the data in the regression, the linear regression wasstatistically significant (r2 ¼ 0:926, n ¼ 807, po0:01) with a slope of 24.7 and an intercept of 0.04,similar to that found previously in the area (Krom et al., 1991). The line passed very close to theorigin, indicating ideal co-variation (Fanning, 1992). However, it is possible that the linearregression was statistically significant due to the large number of observations, because visualinspection of the plot showed it to have non-linear parts, mainly at low and high phosphateconcentrations. The same non-linearity was reported also by Krom et al. (1991). We divided the
Fig. 5. Nitrate vs. phosphate linear plot for cruise POEM-Oc91.
N. Kress, B. Herut / Deep-Sea Research I 48 (2001) 2347–23722364

data into the linear part, corresponding to the transition layer between the AW and the DW, andthe non-linear LSW, AW and DW (Table 4). In the transition layer the linear correlation wassignificant with slope of 23.6, similar to the results with the whole data set, but with a higherintercept value. In the LSW, AW and DW the linear correlations were not significant. The sameanalysis was performed for all cruises, and the results are summarized in Table 4. The slopes of thelines calculated with all the data points for each cruise were similar among the cruises, but therewas a marked seasonality of the intercept. The highest value (0.73mmol kg@1) was in winter,suggesting P limitation due to the large excess of N. The intercept was similar to the averagenitrate (0.6 mmol kg@1) calculated from the survey’s data for the LSW in winter (Table 2). Thelowest value (@0.04mmol kg@1) was calculated for the end of summer, suggesting N limitationdue to the slight excess of P over N. Intermediate intercept values were found for spring andsummer.
Table 4Linear regression of N vs. P for the whole data set at each survey and for the different water masses. Transition is the
layer between the AW and DW (ca.150–700m)
Season All Transition LSW AW DW
w-89 Slope 23.3 21.6 10.54 14.4Intercept 0.73 1.07 0.49 2.48na 448 230 53 138
r2 0.949 0.941 0.07 0.56
tr-89 Slope 22.7 22.1 0.46 2.21 6.85
Intercept 0.26 0.64 0.28 0.35 3.93n 235 108 40 19 40r2 0.912 0.884 0.003 0.017 0.435
sp-89 Slope 24.5 23.4 @1.12 3.18 4.11Intercept 0.03 0.35 0.21 0.20 4.57n 130 68 14 29 17
r2 0.930 0.898 0.373 0.291 0.244
sp-95 Slope 25.2 21.7 @0.84 8.52 7.51
Intercept 0.54 1.22 0.24 0.26 3.84n 232 128 16 30 39r2 0.911 0.92 0.003 0.109 0.160
s-90 Slope 23.3 21.8 1.22 26.3 10.8Intercept 0.33 0.93 0.03 @0.06 3.07n 872 395 95 91 220
r2 0.918 0.889 0.031 0.663 0.411
s-91 Slope 24.7 23.6 0.61 0.71 8.93
Intercept @0.04 0.36 0.06 0.11 3.31n 807 414 106 57 174r2 0.926 0.928 0.011 0.005 0.231
an is the number of data points.
N. Kress, B. Herut / Deep-Sea Research I 48 (2001) 2347–2372 2365

Inspection of the linear regression for the transition layer (150–700m) in all the cruises showedit to be similar to the results when all the data were taken, but with higher intercepts. In the DW,the slope of the regression was smaller and the excess of N over P, taken as the intercept,increased. The increase could be either because the source of DW had excess N over P (Civitareseet al., 1998) and the processes occurring in the upper water masses did not affect it, or that theorganic matter being remineralized in the DW is poor in P due to its faster recycling in the photiczone compared to N.Fig. 6 depicts the depth profiles of N : P, calculated from the individual determinations, for
winter and summer. During our surveys, N : P ratios in seawater ranged between 0.2 and 250(Fig. 6), neglecting N : P values when P or N were below detection limit. There was a markeddifference between seasons in the depth profiles in the upper water layers, and no seasonalvariation in the deep waters. The largest seasonal variations were found in the LSW, from anaverage of 52.2 in winter to 5.2 in summer (Table 2). Large variations were found in the AW andLIW as well, with ratios changing from much higher to lower than Redfield’s. Only in the DW didthe N : P remain constant throughout the year, with an average value of 25.2. In Bermuda,another oligothrophic area, high N : P ratios were observed in the upper 600–700m at the BATSstation, while in the deep waters the N : P was close to Redfield’s. No seasonality was found in theratios (Michaels et al., 1994)In winter, the upper mixed layer reaches down to at least 100m depth (Hecht et al., 1988; Ozsoy
et al., 1989), and there is a supply of nutrients from below, with N : P of ca. 25. Three possibleprocesses could increase the N : P ratio in the LSW to 52.2 in winter:
(a) Luxury uptake of nutrients by the phytoplankton, without growth. It is known that thecapacity of cells to store P is much higher that the storage capacity of N and Si (Tiessen,1995), so that the luxury uptake of P can increase the N : P ratios in the water. There are nodata on luxury uptake in the study area, and therefore no means to quantify its importance. Itis, however, known that the main bloom species during the seasonal phytoplankton bloom arethe cocolithophorids (Kimor et al., 1987), which utilize N as nitrate and are able also to storeexcess P, using it in the formation of their soft tissues as well as their test (Fanning, 1992).
(b) Supply of deep waters with N : P higher than Redfield’s and consumption conforming toRedfield’s model. In the study area, deep waters with high N : P mix with end of summer LSWwith lower than Redfield’s ratio, so that Redfield consumption may either increase or decreasethe ratio, according to the relative volumes mixing.
(c) Preferential atmospheric deposition of N over P. Atmospheric input in the EasternMediterranean can supply both N and P, N mostly by wet deposition and P by drydeposition, mainly as continental dust (Herut et al., 1999a, b). This supply is not equallydivided through the year. Rain (main N supplier) occurs just during winter; drydepositionFdust from the Saharan desert (main P supplier)Foccurs in episodic events,mainly during the transitional seasons (spring and fall) (Ganor and Mamane, 1982).Bergametti et al. (1992) showed that in the Western Mediterranean (Corsica) higherparticulate P inputs occur in summer, higher by a factor of 2 than in winter, in an inversepattern of the precipitation. Therefore, it is reasonable to assume that atmospheric Ndeposition in winter increases N : P in the LSW and that P deposition during the transitionand summer seasons may decrease the ratio. Duce (1986) has shown that atmospheric inputs
N. Kress, B. Herut / Deep-Sea Research I 48 (2001) 2347–23722366

of N to surface waters are significant compared to fluxes from deeper waters in open oceanoligotrophic zones (8–70% in the Sargasso and 1–27% in the North Pacific), whereas Patmospheric inputs seem to be of much less importance (0.2–5% of new P in the Sargasso andless than 1% in the North Pacific).
During the spring, the N : P ratio in the LSW continued to decrease towards its lowest value insummer (Table 2). There is no nutrient supply from below, due to the development of the seasonalthermocline, so the changes may be explained by: (a) biological activity and (b) atmospheric input
Fig. 6. Depth profiles of N : P for winter (1989) and summer (1991) cruises.
N. Kress, B. Herut / Deep-Sea Research I 48 (2001) 2347–2372 2367

of nutrients. Biological activity and consumption according to Redfield would further increase theN : P ratio, opposite to the trend found. It is reasonable to assume that P was introduced from theatmosphere, as reported before (Ganor and Mamane, 1982; Bergametti et al., 1992; Herut et al.,1999a), decreasing the N : P ratio. Consumption, however, is fast due to the ultra-oligothrophiccharacter of the area. Buat-Menard et al. (1989) reported rapid biological removal (as fast as oneweek) of particulate aerosols from the sea surface in the Northwestern Mediterranean. Therefore,both processes are assumed to determine the decrease of the N : P from winter to summer.It is known that in the Levantine Basin there is a shift to smaller phytoplankton from spring to
summer (Azov, 1986; Kimor et al., 1987), which can be sustained by rapid nutrient regenerationand are efficient users of scarce nutrients and capable of rapid growth. They are highly grazed,increasing the recycling rate of the nutrients (Harris, 1986). A similar shift in species compositionwith changing nutrient conditions, in order to keep maximum relative growth rates in the waterbody, was also observed elsewhere (Harris, 1986; Hutchings et al., 1995; Thingstad andRassoulzadegan, 1995). However, high recycling rate cannot explain the further decrease in N : Pfrom spring to summer values, and one might surmise that differential regeneration of N and P isoccurring. It is known that P is recycled much faster than N (Bishop et al., 1980; Harris, 1986;Vitousek and Howarth, 1991; Michaels et al., 1994; Thingstad and Rassoulzadegan, 1995).Therefore, regenerated production can utilize more P than N, depleting the N pool in the seawaterand further decreasing N : P. Sinking particles will be mostly pieces of detritus, with high N : Pratios, which when remineralized will reflect that in the water N : P. Particulate matter sinking inthe water column of the low-productivity, open ocean Northeast Pacific (Knauer et al., 1979) andthe eastern tropical Pacific (Bishop et al., 1980) have N : P of 29–34 even at 75m depth, showingthat P is recycled in the upper water column. Abdel-Moati (1990) found N : P ratios of about 20 inparticulate organic matter in water above the deep chlorophyll maximum at the continental shelfof Egypt. High C : P and N : P ratios in particulate matter were also found at 4 stations in theMediterranean Sea (Berland et al., 1988). In order to check the assumption that N- and P-depletedorganic matter is remineralized we calculated the expected addition of N and P to the DW fromthe differences in mean dissolved oxygen concentrations (AW–DW east, Table 1) assuming: (a)Redfield’s molar ratios, (b)AW to be uniform across the basin and (c) that the supply of nutrientsto the DW was due to remineralization. We then compared the calculated addition of N and P tothe DW and the measured differences. The measured N concentration was ca. 80% of thecalculated value while P was ca. 50% in all the surveys, indicating oxidation of N- and, inparticular, P-poor organic matter.Similar seasonal trends in N : P were seen in the AW and the LIW but within a smaller range
(Table 2).
4.5. New production and atmospheric input
The average nitrate concentration of 0.670.5mmol kg@1 in the LSW during winter can beconsidered to be new N because of essentially no N in summer LSW and AW (Table 1). Thus,taking winter’s mixed layer to be 100m (Hecht et al., 1988; Ozsoy et al., 1989) we calculated a fluxof 60mmol Nm@2 yr@1 of new N to the photic zone, equivalent to a new production of 4.75 gCm@2 yr@1 using Redfield’s stoichiometry (C/N/P : 106/16/1 molar ratio). This estimate is verysimilar to the new estimate of 5.5 g Cm@2 yr@1 by Bethoux et al. (1998) for the Eastern
N. Kress, B. Herut / Deep-Sea Research I 48 (2001) 2347–23722368

Mediterranean. This study utilized the average winter nitrate for the Southern Levantine Basinonly, where the main features of the circulation are known to be anticyclonic (POEM group,1992), and did not consider the Northern Levantine where cyclonic circulation increasesproduction due to deep mixing. Dugdale and Wilkerson (1988) estimated only 2.85 g Cm@2 yr@1
taking into account the production during only 7 months of the year, but Krom et al. (1992)estimated a much higher new production (23.8 g Cm@2 yr@1) than found in this study. Theirestimate was based on an annual nutrient cycle in the core of a warm core eddy in the LevantineBasin, and may be specific to these features. The estimate in this study is an average for the wholeSouthern Levantine Basin.Using the atmospheric input of 0.24 g Nm@2 yr@1 to the area given in Herut et al. (1999b), we
produced a rough estimate of the atmospheric contribution to the new production. Again, takinga winter mixed layer of 100m (Hecht et al., 1988; Ozsoy et al., 1989) and assuming that (a) there isno significant primary production in winter and (b) the rainy season lasts 5 months, with inputuniformly distributed through the season, then the monthly flux of 0.05 gNm@2 month@1
(0.0034mol Nm@2 month@1) will increase N by 0.034mmol Nm@3 month@1 in the mixedlayer. Assuming that the ‘‘sea’’ winter (negligible production) lasts for 2 months, then 0.068mmolNm@3 or 0.07mM new N are contributed from wet atmospheric deposition. This is equivalent to12% of new N to the LSW, slightly higher than the calculated 7.7% that Krom et al.(1992)attributed to atmospheric input.The same rough estimate was performed for P in the transition period. Taking the yearly
deposition of dry, leacheable, P as 0.01 g Pm@2 yr@1 (Herut et al., 1999b) to take place during 4months, we get a monthly flux of 0.00008mol Pm@2 month@1. Assuming the transition betweenspring and summer takes 2 months and that the depth of the upper mixed layer to be 50m due tothe development of the seasonal thermocline, the dry atmospheric contribution of P to the waterbody is 0.003 mM. This value is below the detection limit of the method, but compared to theconcentrations in the LSW, a significant contribution to the P pool. Dry deposition is not evenlydistributed and occurs in episodic and localized events. Therefore, it is likely that the influence ofP dry deposition on productivity is high in the short period during which the deposition occurs.
Acknowledgements
We would like to show our appreciation to Dr. A. Hecht, who introduced us to the POEMprogram and provided us with knowledge and data on the physical oceanography of the area. Wethank the captain and crew of the R/V Shikmona for their devoted work at sea, Yaron Gertner forthe dissolved oxygen determinations and Lara Izraelov for the determination of nutrients. Thehelp of the physical oceanography and electronics departments at IOLR was invaluable. Thiswork was part of the POEM multinational research and funded by the Israeli Ministry ofInfrastructure. We thank the reviewers for their comments which helped improve the manuscript.
References
Abdel-Moati, A.R., 1990. Particulate organic matter in the subsurface chlorophyll maximum layer of the Southeastern
Mediterranean. Oceanologica Acta 13, 307–315.
N. Kress, B. Herut / Deep-Sea Research I 48 (2001) 2347–2372 2369

Anderson, L.A., Sarmiento, J.L., 1994. Redfield ratios of remineralization determined by nutrient data analysis. Global
Biogeochemical Cycles 8, 65–80.
Azov, Y., 1986. Seasonal patterns of phytoplankton productivity and abundance in nearshore oligothrophic waters of
the Levant Basin (Mediterranean). Journal of Plankton Research 8, 41–53.Bergametti, G., Remoudaki, E., Losno, R., Steiner, E., Chatenet, B., Buat-Menard, P., 1992. Source, transport and
deposition of atmospheric phosphorus over the northwestern Mediterranean. Journal of Atmospheric Chemistry 14,
501–513.Berland, B.R., Benzhitski, A.G., Burlakova, Z.P., Georgieva, L.V., Izmestieva, M.A., Kholodov, V.I., Maestrini, S.Y.,
1988. Conditions hydrologiques estivales en Mediterranee, repartition du phytoplancton et de la matiere organique.
(In: Minas, H.J., Nival, P. (Eds.), Oceanologica Acta special issue) Pelagic Mediterranean Oceanography, 9, pp.
163–177.
Bethoux, J.P., Copin-Montegut, G., 1986. Biological fixation of atmospheric nitrogen in the Mediterranean Sea.
Limnology and Oceanography 31, 1353–1358.Bethoux, J.P., Morin, P., Chaumery, C., Connan, O., Gentili, B., Ruiz-Pino, D., 1998. Nutrients in the Mediterranean
Sea, mass balance and statistical analysis of concentrations with respect to environmental change. Marine Chemistry
63, 155–169.Bishop, J.K.B., Collier, R.W., Kettens, D.R., Edmond, J.M., 1980. The chemistry, biology and vertical flux of
particulate matter from the upper 1500 m of the Panama basin. Deep Sea Research 27A, 615–640.Broecker, W.S., Peng, T.H., 1982. Tracers in the Sea. Eldigio Press, New York.
Broenkow, W.W., 1965. The distribution of nutrients in the Costa Rica Dome in the eastern tropical Pacific Ocean.
Limnology and Oceanography 10, 40–52.Buat-Menard, P., Davies, J., Remowdaki, E., Miquel, J.C., Bergametti, G., Lambert, C.E., Ezat, U., Quetel, C., la
Rosa, J., Fowler, S.W., 1989. Non steady state biological removal of atmospheric particles from Mediterranean
surface waters. Nature 340, 131–134.Carpenter, J.H., 1965. The Chesapeake Bay Institute technique for the Winkler dissolved oxygen method. Limnology
and Oceanography 10, 141–143.Civitarese, G., Gacic, M., Vetrano, A., Boldrin, A., Bregant, D., Rabitti, S., Souvermezoglou, E., 1998. Biochemical
fluxes through the Strait of Otranto (Eastern Mediterranean). Continental Shelf Research 18, 773–789.
Craig, H., Hayward, T., 1987. Oxygen supersaturation in the ocean: biological versus physical contributions. Science
235, 199–202.Codispoti, L.A., 1989. Phosphorus vs. nitrogen limitation of new and export production. In: Berger, W.H., Smetacek,
V.S., Wefer, G. (Eds.), Productivity of the Ocean: Present and past. Wiley, New York, pp. 377–394.Duce, R.A., 1986. The impact of atmospheric nitrogen, phosphorus and iron species on marine biological productivity.
In: Buat-Menard, P. (Ed.), The Role of Air-sea Exchange in Geochemical Cycling, NATO ASI Series, Vol. 185. D.
Reidel Pub. Company, Dordrecht, pp. 497–529.
Dugdale, R.C., Wilkerson, F.P., 1988. Nutrient sources and primary production in the Eastern Mediterranean.
Oceanologica Acta 9, 179–184.Fanning, K.A., 1992. Nutrient provinces in the sea: concentration ratios, reaction rate ratios, and ideal covariation.
Journal of Geophysical Research 97, 5693–5712.Ganor, E., Mamane, Y., 1982. Transport of Saharan dust across the Eastern Mediterranean. Atmospheric
Environment 16, 581–587.Gruber, N., Sarmiento, J.L., 1997. Global patterns of marine nitrogen fixation and denitrification. Global
Biogeochemical Cycles 11, 235–266.
Harris, G.P., 1986. Phytoplankton Ecology: Structure, Function and Fluctuation. Chapman a Hall, London.Hecht, A., Pinardi, N., Robinson, A.R., 1988. Currents, water masses, eddies and jets in the Mediterranean Levantine
Basin. Journal of Physical Oceanography 18, 1320–1353.Herut, B., Krom, M.D., Pan, G., Mortimer, R., 1999a. Atmospheric input of nitrogen and phosphorus to the SE
Mediterranean: sources, fluxes and possible impact. Limnology and Oceanography. 44, 1683–1692.
Herut, B., Zohari, T., Robarts, R.D., Kress, N., 1999b. Adsorption of dissolved phosphate onto loess particles in
surface and deep Eastern Mediterranean water. Marine Chemistry 64, 253–265.
N. Kress, B. Herut / Deep-Sea Research I 48 (2001) 2347–23722370

Hutchings, L., Pitcher, G.C, Probyn, T.A., Bayley, G.W., 1995. The chemical and biological consequences of coastal
upwelling. In: Summerhayes, C.P., Emeis, K.-C., Angel, M.V., Smith, R.L., Zeitzschel, B. (Eds.), Upwelling in the
Ocean: Modern Processes and Ancient Records. Wiley, England, pp. 64–81.Kimor, B., Berman, T., Schneller, A., 1987. Phytoplankton assemblages in the deep chlorophyll maximum layers off the
Mediterranean Coast of Israel. Journal of Plankton Research 9, 433–443.Klein, B., Roether, W., Manca, B.B., Bregant, D., Beitzel, V., Kovacevic, V., Luchetta, A., 1999. The large deep water
transient in the Eastern Mediterranean. Deep Sea Research I 46, 371–414.
Knauer, G.A., Martin, J.H., Bruland, K.W., 1979. Fluxes of particulate carbon, nitrogen and phosphorus in the upper
water column of the northeast Pacific. Deep Sea Research 26A, 97–108.
Kress, N., Krom, M.D., Gordon, L.I., 1991. POEM phase II intercalibration exercise. Dissolved nutrients
determination. IOLR Report H19/91, 33pp.Krom, M.D., Brenner, S., Kress, N., Neori, A., Gordon, L.I., 1992. Nutrient dynamics and new production in a warm-
core eddy from the eastern Mediterranean. Deep Sea Research 39, 467–480.Krom, M.D., Brenner, S., Kress, N., Neori, A., Gordon, L.I., 1993. Nutrient distributions during an annual cycle
across a warm-core eddy from the eastern Mediterranean Sea. Deep Sea Research I 40, 805–825.Krom, M.D., Kress, N., Brenner, S., Gordon, L.I., 1991. Phosphorus limitation of primary productivity in the E.
Mediterranean Sea. Limnology and Oceanography 36, 424–432.Malanotte-Rizzoli, P., Manca, B.B., d’Alcala, M.R., Theocharis, A., Brenner, S., Budillon, G., Ozsoy, E., 1999. The
Eastern Mediterranean in the 80’s and in the 90’s: The big transition in the intermediate and deep circulation.
Dynamic of Atmospheres and Oceans 29, 365–395.
Malanotte-Rizzoli, P., Manca, B.B., d’Alcala, M.R., Theocharis, A., Bergamasco, A., Bregant, D., Budillon, G.,
Civitarese, G., Georgopoulos, D., Michelato, A., Sansone, E., Scarazzato, P., Souvermezoglu, E., 1997. A synthesis
of the Ionian Sea hydrography, circulation and water mass pathways during POEM-Phase I. Progress in
Oceanography 39, 153–204.
Michaels, A.F., Knap, A.H., Dow, R.L., Kjell, G., Johnson, R.J., Sorensen, J., Close, A., Knauer, G.A., Lohrenz, S.E.,
Asper, V.A., Yuel, M., Bidigare, R., 1994. Seasonal patterns of ocean biogeochemistry at the U.S. JGOFS Bermuda
Atlantic Time-series Study site. Deep Sea Research I 41, 1013–1038.Ozsoy, E., Hecht, A., Unluata, U., 1989. Circulation and hydrography of the Levantine Basin. Results of POEM
coordinated experiments 1985-1986. Progress in Oceanography 22, 125–170.Ozsoy, E., Hecht, A., Unluata, U., Brenner, S., Sur, H.I., Bishop, J., Latif, M.A., Rozentraub, Z., Oguz, T., 1993. A
synthesis of the Levantine Basin circulation and Hydrography 1985-1990. Deep Sea Research II 40, 1075–1119.POEM Group, 1992. General circulation of the Eastern Mediterranean. Earth-Science Reviews 32, 285–309.POEM Group, 1996. Experiment in eastern Mediterranean probes origin of deep water masses. EOS, Transactions,
American Geophysical Union. 77 (32) 5pp.Redfield, A.C., Ketchum, B.H., Richards, F.A., 1963. The influence of organisms on the composition of sea-water. In:
Hill, M.N. (Ed.), The Sea, Vol. 2. Interscience, New York, pp. 26–77.Roether, W., Manca, B.B., Klein, B., Bregant, D., Georgopoulus, D., Beitzel, V., Kovacecic, V., Luchetta, A., 1996.
Recent changes in Eastern Mediterranean Deep Water. Science 271, 333.Salihoglu, I., Saydam, C., Basturk, O., Yilmaz, K., Gocmen, D., Hatipoglu, E., Yilmaz, A., 1990. Transport and
distribution of nutrients and chlorophyll-a by mesoscale eddies in the Northeastern Mediterranean. Marine
Chemistry 29, 375–390.Schlitzer, R., Roether, W., Oster, H., Junghans, H.G., Hausmann, M., Johannsen, H., Michelato, A., 1991.
Chlorofluoromethane and oxygen in the Eastern Mediterranean. Deep-Sea Research 38, 1531–1551.Souvermezoglou, E., Hatzigeorgiou, E.I., Pampidis, I., Siapsali, K., 1992. Distribution and seasonal variability of
nutrients and dissolved oxygen in the northeastern Ionian sea. Oceanologica Acta 15, 585–594.Thingstad, T.F., Rassoulzadegan, F., 1995. Nutrient limitations, microbial food webs and biological C-pump:
suggested interactions in a P-limited Mediterranean. Marine Ecology Progress Series 117, 299–306.Tiessen, H. Ed., 1995. Phosphorus in the Global Environment. Transfers, Cycles and Management, SCOPE 54
(Scientific Committee on Problems of the Environment). Wiley, New York.Vitousek, P.M., Howarth, R.W., 1991. Nitrogen limitation on land and in the sea. How can it occur? Biogeochemistry
13, 87–115.
N. Kress, B. Herut / Deep-Sea Research I 48 (2001) 2347–2372 2371

Willie, S., Clancy, W., 2000. NOAA Technical Memorandum NOS NCCOS CCMA 143. NOAA/NRC
Intercomparison for nutrients in seawater. 36pp.Yacobi, Y., Zohari, T., Kress, N., Hecht, A., Robarts, R.D., Wood, A.M., Li, W.K.W., 1995. Chlorophyll distribution
throughout the southeastern Mediterranean in relation to the physical structure of the water mass. Journal of
Marine Systems 6, 179–190.Yilmaz, A., Ediger, D., Basturk, O., Tugrul, S., 1994. Phytoplankton fluorescence and deep chlorophyll maxima in the
Northeastern Mediterranean. Oceanologica Acta 17, 69–77.
Zohari, T., Robarts, R.D., 1998. Experimental study of microbial P limitation in the Eastern Mediterranean.Limnology and Oceanography 43, 387–395.
N. Kress, B. Herut / Deep-Sea Research I 48 (2001) 2347–23722372