SORGHUM AGRONOMY IN WEST KENYA - WUR eDepot
241
SORGHUM AGRONOMY IN WEST KENYA INVESTIGATIONS FROM A FARMING SYSTEMS PERSPECTIVE 0000 06845891
-
Upload
khangminh22 -
Category
Documents
-
view
1 -
download
0
Transcript of SORGHUM AGRONOMY IN WEST KENYA - WUR eDepot

SORGHUM AGRONOMY IN WEST KENYA
INVESTIGATIONS FROM A FARMING SYSTEMS PERSPECTIVE
0000 0684 5891

Promotor: dr. ir. M. Flach emeritus hoogleraar in de tropische plantenteelt
H.J. Enserink
SORGHUM AGRONOMY IN WEST KENYA
INVESTIGATIONS FROM A FARMING SYSTEMS PERSPECTIVE
Proefschrift ter verkrijging van de graad van doctor
in de landbouw- en milieuwetenschappen op gezag van de rector magnificus,
dr. CM. Karssen, in het openbaar te verdedigen op vrijdag 22 december 1995
des namiddags te vier uur in de Aula van de Landbouwuniversiteit te Wageningen

To my parents, who taught me the principles of smallholder farming.
(Aan mijn ouders, die mij de principes van het boeren op kleine bedrijven leerden)
BIBLIOTHEEK LANDBOUWUNr/ERSTTEIT
WAGENINGEN
CIP-DATA KONINKLIJKE BIBLIOTHEEK, DEN HAAG
Enserink, H.J.
Sorghum agronomy in West Kenya : investigations from a farming systems perspective / H.J. Enserink. - Amsterdam : Koninklijk Instituut voor de Tropen Thesis Landbouwuniversiteit Wageningen. ISBN 90-6832-100-5 NUGI 835 Subject headings: sorghum recommendation development / adaptive research; Kenya / extension approaches.
© 1995 Royal Tropical Institute - Amsterdam Cover design: Ad van Helmond - Amsterdam Printer: Krips Repro - Meppel ISBN 90-6832-100-5

A/ua8̂ «; ioae
STELLINGEN
1 Om er achter te komen hoe een teeltsysteem werkelijk in elkaar zit, moet je proberen er iets aan te veranderen.
De door Doggett en Majisu geclaimde superioriteit van sorghum hybride rassen in Oost-Afrika berust voornamelijk op een keuze van niet representatieve proefvelden. Dogget, H., 1970. Sorghum. Longmans, Harlow, England. Majisu, B.N. and H. Doggett, 1972. The yield stability of sorghum varieties and hybrids in East African environments. East African Agricultural and Forestry Journal 38:179-192.
De lage adoptie van aanbevolen mai's hybride rassen in Siaya moet niet, zoals door CIMMYT gesteld, primair verklaard worden vanuit hun te lange groeiduur, maar vooral vanuit hun gebrek aan Striga tolerantie. CIMMYT, 1977. Reports on demonstrations of an interdisciplinary approach to planning adaptive agricultural research programmes. No 1: Part of Siaya District, Kenya. CIMMYT, Nairobi, 41 pp.
De door CIMMYT geformuleerde stelling, dat er door verlate inzaai van vroegrijpende sorghum rassen meer ruimte zal ontstaan voor een tijdige inzaai van mai's in het Busia-Siaya landbouwbedrijfssysteem, berust op een te grove analyse van agro-ecologische factoren. Dit proefschrift
5 De meeste mengteelten in Busia-Siaya zijn eerder het gevolg van seizoensafhankelijke beslissingen dan van doelbewuste teeltplanning van boeren. Dit proefschrift
Kleine demonstratievelden zijn ongeschikt in sorghumvoorlichtingsprogramma's. Een geconcentreerde dorpsbenadering vormt een bruikbaar en effectief alternatief. Dit proefschrift
7 Het gebruik van de verzamelnaam "millets" voor de groep van kleine tropische granen compliceert het landbouwbedrijfssystemen onderzoek onnodig.
Begrip is een voorwaarde voor en de sleutel tot het ontwerpen van nuttige modellen. Het ontwerpen van een model leidt echter niet automatisch tot vergroting van begrip. Vrij naar Collinson, M., 1981. A low cost approach to understanding small farmers. Agricultural Administration 8: 433-450.

Voedselhulpprogramma's in Afrika bevorderen een verschuiving van voedselpatronen in de richting van mais en tarwe. Dit maakt lokale verbouw van droogteresistente gewassen als sorghum onaantrekkelijk.
10 Oost-Afrikaanse landen hebben individueel te weinig middelen voor toegepast gewas-onderzoek. De tijd lijkt rijp voor initiatieven tot hernieuwde regionale samenwerking.
11 Om recht te doen aan de leerdimensie van ontwikkelingssamenwerking, dient het begrip "projectcyclus" vervangen te worden door het begrip "projectspiraal".
12 Het argument, dat de "time-out" de spelkwaliteit van het voetballen zal verhogen, leidt de aandacht af van het belang dat de commercie heeft bij de veramerikanisering van deze sport.
13 Het aantal aankondigingen in de categorie "treintje komt zo" is een objectieve graadmeter voor de kwaliteit van de door de NS geleverde diensten.
H.J. Enserink Sorghum Agronomy in West Kenya: investigations from a farming systems perspective Wageningen, 22 december 1995

CONTENTS
Abstract Preface and acknowledgements
1 Introduction
IX
xi
2 The Sorghum Project in West Kenya 5 2.1 Background 5 2.1.1 Replacement of sorghum and millets by maize 5 2.1.2 Renewed interest in sorghum and millets in Kenya 5 2.1.3 Start of the sorghum and millet programme in Kenya 6 2.2 Objectives 8 2.2.1 Long-term objectives of the national programme 8 2.2.2 Short-term objectives of the national programme 9 2.2.3 Tasks of the sorghum agronomy programme in West Kenya 9 2.3 Strategies for sorghum development in West Kenya 9 2.3.1 Food quality, bird damage risk and pricing policy 9 2.3.2 Strategy and results of the former EAAFRO sorghum programme 13 2.3.3 Long-term and short-term strategies for West Kenya 14 2.4 Target zones for implementation in West Kenya 17 2.4.1 Selection of target area 17 2.4.2 Target zones and research resource constraints 18
3. Agro-environmental setting of the Busia-Siaya area 25 3.1 Climate 25 3.1.1 Annual distribution of rainfall 25 3.1.2 Reliability of seasonal rainfall 26 3.1.3 Start, length and end of the rainy seasons 30 3.1.4 Risk of dry spells 34 3.2 Soils 37 3.2.1 Introduction 37 3.2.2 Physiography 37 3.2.3 Classification 38 3.2.4 Soil catena 38 3.2.5 Soil fertility 39 3.2.6 Water storage capacity 40 3.2.7 Drainage 42 3.3 Pests, diseases and witchweeds of local cereal crops 42 3.3.1 Introduction 42 3.3.2 Shoot fly - a review 44 3.3.3 Sorghum midge - a review 46 3.3.4 Witchweeds (Striga spp.) - a review 49 3.4 Implications for cereal cropping, yields and research 53 3.4.1 Crop suitability, variety choice and potential yield expectations 54 3.4.2 Major agronomic constraints and research on possible solutions 57

4. Busia-Siaya farming systems 59 4.1 History of local farming systems 59 4.1.1 Socio-cultural setting 59 4.1.2 Evolution of fanning systems 60 4.2 Objectives, priorities and resources of households 65 4.2.1 Dominance of subsistence objectives 65 4.2.2 Land, labour and capital resources 67 4.3 Current cropping systems 70 4.3.1 Cropping patterns 70 4.3.2 Rotational decisions 70 4.3.3 Maize and sorghum varieties, crop calendar and seasonal decisions 72 4.4 Concluding remarks 77
5 Research hypothesis and design implications 79 5.1 Formulation of the research hypothesis 79 5.2 Implications for sorghum programme design 79 5.2.1 Choice of variety 79 5.2.2 Time of planting 83 5.2.3 Method of planting 84 5.2.4 Thinning and weeding 86 5.2.5 Use of purchased inputs 87 5.3 Trial programme development and implementation 88 5.3.1 Development of trial programme 88 5.3.2 Implementation of trial programme 89
6. Sorghum and maize performance; 1979-82 Variety Trials 93 6.1 Objective of the variety testing programme 93 6.2 Materials and methods 93 6.3 Results and discussion 96 6.3.1 Yield performances of planted and ratoon crops 97 6.3.2 Shoot fly and sorghum midge incidence and entry performance 104 6.3.3 Leaf blight incidence and performance of entries 108 6.3.4 Striga incidence and performance of entries 110 6.3.5 Ratoon survival and ratoon performance of entries 116 6.4 Conclusions 119
7. Time of planting and sorghum and maize performance 123 7.1 Introduction 123 7.2 Planting date, rainfall pattern and pest damage 125 7.2.1 Seasonal fluctuations in shoot fly damage; 1979-1982 125 7.2.2 Seasonal fluctuations in sorghum midge damage; 1979-1982 128 7.3 Planting date, youth growth and growing period 134 7.4 Planting date, growing period, pests and interactions 139 7.5 Conclusions 147

8. Development of adaptive sorghum agronomy packages 149 8.1 Plant population and distribution patterns 149 8.2 Use of fertilizers 154 8.3 Weed control 171 8.4 Ratooning 183 8.5 Pest control of crops planted in the second rains 195
9. Extension efforts on adaptive technology packages 205 9.1 Introduction 205 9.2 The 1981 Demonstration Approach Programme 207 9.3 The 1981 Village Approach Programme 213 9.4 The 1982 Village Approach Programme 221 9.5 Conclusions and recommendations 232
10. Toward adaptive research programmes and farmer recommendations - a synthesis 235 10.1 Institutional considerations 235 10.1.1 Research capacity to plan adaptive programmes 235 10.1.2 Support of extension and farmers to adaptive research programmes 238 10.1.3 Development of adaptive research programmes in West Kenya 240 10.1.4 Adaptive Regional Research Programmes - a new development 242 10.2 Toward targeted and conditional sorghum recommendations 245 10.2.1 Choice of variety, type of agricultural season and sorghum pests 246 10.2.2 Farmers constraints and flexibility of agronomy recommendations 248
Annexes Al. CIMMYT's approach to planning adaptive research programmes 251
1 Need to plan adaptive experimental programmes 251 2 Rise of farming system-oriented agricultural research 251 3 Concepts and testing of CIMMYT's approach in East Africa 252 4 CIMMYT's methodology in East Africa 253 4.1 Grouping of farmers in preliminary recommendation domains 253 4.2 Diagnosis of farming systems 254 4.3 Designing relevant experimental programmes 256 4.4 Testing promising strategies and technologies 257 4.5 Extension of successful strategies and technologies 260
A2. Finger millet and its changing place in local economies 261
Abbreviations 267 References 269 Summary 281 Samenvatting 285 Curriculum vitae 291

ABSTRACT
Enserink, H.J., 1995. Sorghum agronomy in West Kenya : investigations from a farming systems perspective. Royal Tropical Institute, Amsterdam. Thesis Agricultural University Wageningen, The Netherlands, 304 pp., 24 figures, 12 photos, 92 tables, loose soil map, with summary in Dutch.
Additional index words: adaptive research / extension approaches / variety selection / ratooning / crop husbandry practices / Striga hermonthica I soil fertility / weed control / rotational decisions / cereal cropping systems / conditional recommendations / Regional Research Programmes.
An adaptive sorghum research and extension programme (1979-82) in West Kenya is reviewed. The focus is on factors operating at farm level. Research results are based on 70 on-farm trials and on some long-term experiments on NPK fertilizer and pest incidence. Extension results are based on two programmes using different approaches. 200 farmers participated in the demonstration approach; in the village approach 100 farmers participated the first year, and 400 the second year.
The impact of the rainfall pattern on local cropping systems is highlighted with respect to 'first rains' (March-June) and 'second rains' (August-November). Until recently, the short unreliable season of second rains played a minor role. However, current constraints on ox-ploughing result in delays in land preparation. This reduces the growing period for cereal crops during the first rains and increases the risk of failure for local late-maturing varieties. Cropping areas are increasingly restricted to what can be cultivated manually; more farmers are tempted to grow cereal crops during the second rains. As an assured food supply dominates farmer decisions, it was hypothesized that introduction of early-maturing sorghum varieties with a potential for ratooning would increase farmers management flexibility.
Initial knowledge of effects of sorghum pests, leaf blight and Striga hermonthica proved insufficient. Crop moisture availability analyses commonly used in Kenya do not permit sufficient quantification of variability to understand farmer response to uncertainty. Three types of sorghum cropping seasons must be distinguished based on the variable start of the first rains. These types differ not only in length of growing period but also in shoot fly and midge incidence. Success of late planted crops varies with type of season. Farmers must play each season by ear; conditional recommendations on variety use and time of planting were developed accordingly. Some early-maturing cultivars were selected. However, their ratooning potential proved limited. Hence, attention shifted to planting these cultivars at the start of the second rains. As such plantings are seriously affected by shoot fly, more research on control by seed treatments and cultural methods is required.
ix

Crop yields and weed composition in farmer fields are related to land use pattern and soil fertility depletion. P is the most limiting nutrient. As N applications often results in negative effects, P/N ratios may play a role. Current socio-economic conditions restrict P applications to first-rain crops to 20 kg/ha P205. Higher levels may only be recommended if residual effects of P on second-rain crops are optimized through land preparation. Row planting with 3 plants/hill is advised as it facilitates placement of P and rapid handhoe weedings.
The on-farm demonstration approach proved ineffective in stimulating farmer participation in the sorghum technology development process; it puts too much emphasis on selling preconceived messages. Also, the small isolated plots are threatened by birds. In contrast, the village approach proved effective. Its large, clustered plots generated much discussions among farmers and minimized the bird damage threat. Farmer opinions and crop-cut sampling results were used to fine-tune the recommendations for husbandry practices.
The former compartmentalized research structure in Kenya was not conducive to adaptive research. Insufficient critical mass was available within the small commodity sections at regional level. However, recent interdisciplinary adaptive Regional Research Programmes allow better priority setting. The Farming Systems Approach to Research, Extension and Training is used, which could lead to more demand-driven research.

PREFACE AND ACKNOWLEDGEMENTS
During my practical training period at the UNDP/FAO/Kenya Beef Industry Development Project in 1975,1 became interested in sorghum improvement and development efforts. When Bert van Arkel approached me in 1978 for an Agronomist Associate Expert position within the UNDP/FAO/Kenya Sorghum and Millet Development Project, I was eager to join. As a result of policy changes in 1976-77, the focus of the sorghum development efforts had shifted from introducing new fodder crops for the beef feedlot industry to improving smallholder food grain production systems. Based on my personal background, the new target group was near to my heart.
Shortly after I arrived in Nakuru (Lanet) the senior agronomist, Bert van Arkel, left the Project. Felix Pinto, a plant breeder, became the new team leader and Peter Whiteman the new senior agronomist. However, both were based at Machakos (Katumani), the new Project's headquarters. Jeremiah Rutto and I were in charge of programme implementation in West Kenya. After having been transferred, Rutto became the new Director of the Western Agricultural Research Station (WARS) at Kakamega. His work focused on finger millet agronomy. I was posted at Busia (Alupe, a sub-station of WARS) as the sorghum agronomist.
When B.S. Rana and Newton Ochanda, both plant breeders, joined the Alupe sorghum programme, sufficient critical mass had become available for planning a comprehensive programme. Although Rana had to return to India prematurely, his contributions to the research priority setting process have been highly appreciated.
During the period of these drastic changes I sometimes wondered whether I was not too young and inexperienced to bear responsibility for developing a sorghum agronomy programme in West Kenya. However, due to an excellent team spirit, these 'moments of doubt' were brief. Jeremiah Rutto and Felix Pinto were always prepared to listen and with renewed energy put me back on track. Most staff members had to perform duties usually belonging to the territory of higher job categories. Technical Assistants (TAs) showed considerable initiative, commitment and ability in running specific programme components e.g. Noah Alwodi in the Demonstration Approach, Gerald Panyako and Peter Odipo in Regional Variety Testing, Patrick Lusamamba and Okumu Masindano in seed multiplication schemes. However, all TAs were involved in research to develop adaptive agronomy packages. Subordinate staff and casuals (often locally recruited farmers) showed remarkable capabilities in running Village Approach extension programmes (Charles Okanda and Franklin Ochieng), pest incidence studies (Charles Okanda) and laboratory experiments (Festus Namisi). Henk Peters, a graduate student, joined the team during 1981. Eston Njeru, a Technical Officer, became a member of our team in 1982. The research data presented in this thesis have resulted from substantial collective efforts. I am greatly indebted to all members of the team. To show my respect, I frequently used the word 'we' in this thesis.
XI
Most of the work described is based on a 4 year posting at the UNDP/FAO/Kenya Sorghum and Millet Development Project (1978-82), with a focus on West Kenya. I would like to thank the Kenya Agricultural Research Institute (KARI) and the Food and Agriculture Organization (FAO) for their permission to use the data presented. Although these data were collected in the course of Project implementation, I bear sole responsibility for any errors in interpretation. The opinions expressed therefore do not necessarily reflect those of KARI or FAO.
I would like to express my appreciation for the farmers and extension workers who participated in our programmes with such enthusiasm. Angoromo and Bugengi households are thanked in particular for their great hospitality and willingness to sharing their knowledge.
I am grateful to Michael Collinson and Steven Franzel of CIMMYT (Nairobi) in helping me to become less crop science and more farmer oriented. I am also grateful to Peter Whiteman. Although we were based at different stations, he continuously encouraged me to be creative and use common sense. He was also the first to stimulate me to explore the possibilities of using the collected data for a Ph.D. thesis. After Prof. Michiel Flach visited the Project in 1981, he invited me to report on the methodology and results of the sorghum agronomy programme to obtain a Ph.D. at Wageningen Agricultural University, the Netherlands. However, his department had no funds to support me and my family. To cut a long story short, the struggle for funds to study and time to write has continued for over ten years. I am grateful to Wageningen Agricultural University for a 10 month period of financial support and to the Netherlands Foundation for the Advancement of Tropical Research (WOTRO) for providing funds for my study trip to India. I am particularly grateful to the Royal Tropical Institute (KIT) in Amsterdam, the Netherlands for generously allowing me time to complete this thesis.
Many people have played a supporting role during the period of study and writing. Specific literature reviews were made by several graduate students: Wim Schreurs (ratooning), Henk Peters (time of planting), Marjon Fredrix (pest incidence), Joep Slaats and Gerard Straver (adaptive research). Wim Andriesse assisted in writing the sub-chapter on soils. James Matata and Adri Pols provided valuable advice on statistical topics. B.S. Rana helped to organize my study trip to India in 1984. I am also very grateful to Prof. Michiel Flach, Bram Huijsman, Ilonka Barsony, Reint Bakema and Piet Verhagen for their continuous support.
Roel Boekelman, Reint Bakema, Bram Enserink, Joke van Oostrum, Chris Wijs, Hans Romberg and Sjack van Zee are thanked for their help on the presented figures and photos. Among the many people who provided comments on earlier drafts, I want to single out Reint Bakema and Han Bantje. Ilonka Barsony has been helpful in her 'never ending' efforts to correct my writings.
I am particularly grateful to Joke, Remko and Marijke, who provided an encouraging background, put up with my doubts and gave me emotional and practical support. Special words of thanks should also go to my parents.
xii

1. INTRODUCTION
This study reports on the methodology, contents and results of a sorghum agronomy research programme in the Busia and Siaya Districts of West Kenya (1979-82). This production-oriented programme was part of the Kenya Sorghum and Millet Development Project, jointly implemented by the United Nations Development Programme (UNDP), the Food and Agriculture Organization (FAO) and the Government of Kenya (GK). The Project's national mandate concerned crop improvement research on sorghum and millets. Its long-term objective was to enhance the role of sorghum and millets in the national economy. The author was in charge of the agronomy research programme in West Kenya that was focused on developing adapted technology at farm level.
Commodity-oriented research has led to some spectacular successes in Kenya (for examples, see Annex 1). However, failures are also known particularly in the smallholder sector. They mainly stem from the fact that technology developed at research stations does not take smallholder production constraints sufficiently into account. To define the need for improved sorghum varieties and technologies and determine their relative priorities, the demands for and constraints on the national sorghum grain market as well as the local farming system must be taken into consideration.
This study focuses on factors operating at the local farming system level. The discussion of determinant factors at national level is kept brief. Only factors with a direct bearing on the decision-making process at West Kenya farm level are described, in particular the sorghum pricing policy, bird damage risk and sorghum food quality.
Sorghum is a traditional staple crop in the Busia and Siaya Districts. Local fanning systems are characterized by a high level of 'insurance cropping' on small subsistence holdings. Appreciation of farmers total circumstances and identification of major local problems related to sorghum cropping were necessary to develop a relevant research programme.
The International Maize and Wheat Improvement Centre (CIMMYT) has developed an approach to such situations (Byerlee and Collinson, 1980). This approach uses surveys and provides guidelines for generating information on farmers circumstances, which may then be used to orient research on improved technologies. A detailed description of CIMMYT's approach to planning adaptive experimental programmes is presented in Annex 1.
Funds, staffing and facilities of our agronomy programme were inadequate to conduct major surveys on local farming systems. Fortunately, the first demonstration of CIMMYT's interdisciplinary approach to planning adaptive agricultural research programmes in East Africa was held in the Siaya District

(CIMMYT, 1977a). Besides, in 1981 the economist of the Western Agricultural Research Station (WARS) conducted a similar farming system survey in the Busia District (Rop, 1981).
Although these exercises focused on specific target crops such as maize and finger millet, the analysis of local farming systems served to direct our research efforts in sorghum agronomy. Thus, the major tasks of our sorghum programme were identified as follows: - making available to farmers early-maturing sorghum varieties to enhance their
management flexibility to cope with uncertainties of rainfall; - developing an adapted husbandry package for these early-maturing sorghum
varieties.
Based on these guidelines, our agronomy programme was divided into an experimental and an operational part.
The experimental part focused on selection of early-maturing sorghum cultivars and identification of farm level factors limiting their production. Conventional field experiments served to quantify the various yield gaps due to choice of varieties, time of planting, plant population, fertility, weeds and pests. In accordance with the Farming Systems Research (FSR) methodology, the majority of these trials were conducted in farmers fields, to overcome the site-specific nature of crop responses. Growing conditions at research stations often differ from those on farmers fields (Whiteman, 1981a). However, these on-farm trials were managed by the agronomy section. Later, altering only those factors which in our opinion were within reach of farmers management capabilities, adapted husbandry packages for promising early-maturing sorghums were designed and tested.
The operational element of our agronomy programme shifted the centre of activity from the research station to farmers fields. It involved extension, research, adoption and evaluation in collaboration with the extension service and the farmers simultaneously. This part of the programme emphasized farmers own assessment of new varieties and husbandry packages as the dominant form of evaluation. As a result, pre-extension trials and crop production plots were managed by farmers themselves. Problems emerging from this operational part of our programme helped to set priorities for further experimental research.
CIMMYT's approach is mainly aimed at facilitating the planning phase of adaptive agricultural research programmes. In East Africa only a few commodity-oriented research programmes have systematically used information on farmers circumstances in the design and implementation of their experimental field programmes. More field studies are needed to evaluate CIMMYT's approach by testing whether or not knowledge of farmers circumstances indeed leads to more relevant research priorities that are more adapted to farmers needs.

Accordingly, the sorghum programme in the Busia and Siaya Districts started implementing the following objectives: - translation of ideas about adaptive research into a concrete experimental and
operational programme on sorghum agronomy; - implementation of such a programme in the field; - formulation of adaptive technologies based on programme results; - monitoring of technology adoption by local fanners.
Our programme was implemented in a period when CIMMYT's efforts were aimed at introducing a systems perspective into existing commodity research programmes in Kenya. Difficulties in incorporating this approach in Kenya (CIMMYT, 1985b) led to a subsequent period in which administratively independent Farming Systems Teams (or Adaptive Research Planning Teams) were established in other countries (e.g. Enserink, 1994a). Unfortunately, FSR often became a new discipline instead of an approach improving the efficiency of research in designing technologies appropriate to the need of small farmers. It remained difficult to plan joint research agendas for FSR and commodity teams. To increase efficiency and cost-effectiveness, many research policy makers again started supporting the incorporation of FSR as an approach to adaptive research programmes in the 1990s (Mutsaers, 1994).
After a recent reorganization of the Kenya Agricultural Research Institute (KARI), certain research centres were given a regional mandate. These Regional Research Centres (RRCs) have to conduct adaptive research giving due considerations to research-extension linkages and linkages with commodity and factor programmes. RRCs are responsible for developing appropriate technologies for specific target groups of farmers within the agro-ecological zones of their mandate area. All research sections must contribute to the development and implementation of these RRC programmes. Within these integrated, interdisciplinary, problem-oriented programmes the Farming Systems Approach to Research, Extension and Training (FSA-RET) is expected to play a major role (Rutto, 1990; KARI/KIT, 1994).
It is hoped that this study will assist staff of RRC Kakamega in better planning and priority setting of their activities. The 'body of knowledge' presented in this thesis may contribute to further development of a comprehensive adaptive Regional Research Programme. It may also help the RRC team to circumvent some of the pitfalls of the past.

2. THE SORGHUM PROJECT IN WEST KENYA
2.1 BACKGROUND
2.1.1 Replacement of sorghum and millets by maize
Sorghum and millets are important crops in medium and low altitude areas of Kenya. In the past, they constituted the main staple food and a base for beverages and alcoholic drinks. With the advent of European settlers at the beginning of this century, these crops became less important due to the introduction of maize. Maize outyielded the original crops in areas with better rainfall and a free draining soil (Acland, 1973). It adapted well to the more fertile soils in the medium and high altitude zones favoured by these settlers. A taste for maize developed as European farmers started using maize as a staple food for their labour force (Huxley, 1972).
The trend to replace sorghum and millets, spread to areas with less reliable rainfall, where, in bad seasons maize either yields poorly or fails entirely. This has occurred although sorghum and millets have particular advantages of drought resistance or evasion. Maize cultivation is encouraged by (FAO, 1979): - vulnerability of sorghum and millets to bird damage, a problem aggravated by
scarcity of labour on small-scale farms; - a shorter preparation time for maize, the often preferred food; - a large influx of people from areas with higher potential into more marginal
areas. These settlers have brought the cultivation of maize with them. In case crop failures occurred, relief campaigns were organized;
- a well developed marketing and pricing system for maize; - substantial resources allocated to maize research in Kenya. Its national maize
programme is well advanced and hybrid maize seed is available in all major maize growing areas of Kenya. In contrast, basic research on sorghum and millets was conducted by the East African Community through the East African Agriculture and Forestry Research Organization (EAAFRO). Between 1958-77 the EAAFRO sorghum section operated from Serere in Uganda. EAAFRO material was tested on a large scale in Tanzania and Uganda, but only on a limited scale in Kenya, where no national sorghum and millet programme existed. The EAAFRO programmes yielded a number of successful cultivars.
2.1.2 Renewed interest in sorghum and millets in Kenya
Since 1976 more attention has been paid to sorghum and millets, as: - the East African Community was dissolved which led to termination of the
EAAFRO sorghum and millet research programme; - a breakthrough was made by the UNDP/FAO Kenya Beef Industry Development
Project. It was found that, where previous efforts had failed, certain cold-tolerant sorghums were well adapted to the drier high altitude areas of Kenya. They were capable of producing grain yields on land previously

considered unsuitable for cereal crops (Arkel, 1982); - there was an increasing awareness of having to reverse the trend that took maize
beyond its ecological limits. Optimism about possibilities of developing drought-resistant maize cultivars was replaced by the conviction that development of already drought-resistant species such as sorghum and certain millets would be more rewarding (Senga, 1976).
2.1.3 Start of the sorghum and millet programme in Kenya
Phase I, 1977-1978
This renewed interest resulted in the establishment of the UNDP/FAO Kenya Sorghum and Millet Development Project (Phase I) at Nakuru in 1977. Due to lack of experience in sorghum and millet research and development, no clear national priorities were identified at that time. Consequently, this small interim project focused on further development of cold-tolerant grain sorghums for the drier high altitude areas. A modest start was made with research in the medium potential areas below 1500 m; the Ministry of Agriculture identified Machakos in Eastern Province and Busia in Western Province as representative sites.
While the grain yields of some newly introduced cold-tolerant sorghums gave rise to optimism about prospects for food production in the drier high altitude areas, the use of sorghum grain posed a problem. The high tannin content of the brown seed coat gave the grain a bitter, astringent taste reducing its digestibility. Mechanical processing would be required to remove the tannin-rich seed coat. But this was constrained by the soft endosperm and small size of the grains (Arkel, 1982). The adapted sorghums could only be classified as feed grain sorghums.
A major breeding programme, aimed at reducing the time to maturity and producing high quality white sorghums or brown tannin-containing, bird resistant sorghums with hard endosperm and large grain size, was required for the development of food quality sorghums (Pinto, 1982).
Phase II, 1978-1981
By 1978, when Phase II of the Kenya Sorghum and Millet Development Project had become operational, national priorities for sorghum and millets had been identified. The Government promoted these crops for human consumption in densely populated medium and low altitude areas, which are marginal for wheat, maize and rice. Consequently, the major research efforts were concentrated in the Eastern, Western and Nyanza Provinces. The Project base was shifted from Nakuru to Machakos. At the end of 1979 sub-bases for sorghum and finger millet programmes in West Kenya were established at Busia and Kakamega, respectively. Figure 2.1 shows the geographical distribution of ecological areas of interest to the sorghum programme. The various provinces and major centres for sorghum research are also indicated.

SUDAN
I SOMALI | REPUBLIC
Altitude
[ 1 0-1000 m
g ? | 1000- 1500 m
IIIIIH over 1500m
Rainfall
0- 500 mm
500-1000 mm
jgijj3 over 1000 mm
Figure 2.1. Map of Kenya indicating nine different ecological environments according to annual rainfall and altitude (based on Anon., 1970).

From 1980 onwards sorghum programmes have been based at Machakos, Busia and Nakuru, catering for those areas where major production increases are anticipated: - Machakos; the semi-arid midlands and lowlands of Eastern, Central and Coast
Provinces (altitude: < 1500 m; annual rainfall: 500-1000 mm); coordinating centre: Katumani Agricultural Research Station (ARS);
- Busia; the drier midlands around Lake Victoria (called Lake Basin Area) covering parts of Nyanza and Western Provinces (altitude: 1200-1500 m; annual rainfall: >700 mm); coordinating centre: Alupe ARS;
- Nakuru; the semi-arid midlands and highlands mainly located in the Rift Valley Province (altitude: > 1500 m; annual rainfall: 500-1000 mm); coordinating centre: Lanet ARS.
Machakos and Busia cater for traditional sorghum and millet areas. Bulrush millet is the most important millet in Eastern Province, while in the Nyanza and Western Provinces finger millet plays this role. The areas around Lake Victoria, the subject of this study, currently produce 70% of the country's sorghum and most of its finger millet (Table 2.1).
Table 2.1. Areas under sorghum and millets by province, 1975-77.
Province
Nyanza Western Eastern
Rift Valley Central Coast N. Eastern
Total
Sorqhum
1975
21.6
19.3 17.0
0.6 0.2 0.1 0.3
59.1
-000 ha) 1976
36.0 8.7
25.1 2.1 0.1 0.4
-72.4
1977
51.8 22.2
22.9 0.7
0.1 0.4 1.5
99.6
Millets 1975
5.9 29.4 23.7
8.2 0.4 0.1
-67.7
'000 ha) 1976
9.3 22.3 31.6
7.9 0.1 0.1
-71.3
1977
11.2 21.4
30.8 9.6 0.1 0.1
-73.2
Note: based on Chiodo-Juve (1980).
2.2 OBJECTIVES
2.2.1 Long-term objectives of the national programme
The long-term development objectives of the Kenya Sorghum and Millet Development Project were (FAO, 1979): - to improve the position of sorghum and millets in the national economy, and
more specifically to assist the Government in implementing a research and development programme on sorghum and millets;
- to assist the Government in developing a national capacity for conducting sorghum and millet research.

2.2.2 Short-term objectives of the national programme
The short-term objectives of the Project were (Pinto, 1982): - to develop and identify suitable sorghum and millet varieties or hybrids for each
important ecozone; - to conduct agronomic studies aimed at defining target areas for cereal crops and
developing adapted crop husbandry packages; - to investigate village processing methods for brown tannin-containing sorghums
to improve their nutritional value; - to advise on the marketing and utilization of sorghum and millets and the
promotion of acceptable foods; - to disseminate results by training and on-farm testing in collaboration with the
extension service and assist in seed production; - to train staff and build up links with (inter)national institutions.
2.2.3 Tasks of the sorghum agronomy programme in West Kenya
The specific tasks of the sorghum agronomy section based at Busia were: - to assess problems and set priorities for sorghum agronomy investigations in the
Lake Basin Area, taking account of farmers socio-economic constraints; - to design, conduct and analyze crop husbandry trials in target areas for the
evaluation of effects of fertilizer application, plant population and distribution pattern, time of planting, weed control, ratoon crop management and pest control;
- to assist the breeding section in the design, implementation and analysis of a multi-locational programme in the Lake Basin Area to test the best varieties and hybrids identified or developed. This programme looked into the wide adaptability, appropriate maturity, ratooning ability, acceptable grain quality and satisfactory disease, pest and Striga resistance of selected sorghums;
- to assist in establishing farmers demonstration plots around research stations in close collaboration with the local extension service.
2.3 STRATEGIES FOR SORGHUM DEVELOPMENT IN WEST KENYA
2.3.1 Food quality, bird damage risk and pricing policy
Should sorghum remain a staple food in marginal areas, high quality varieties should be developed. Their availability is also necessary for the development of commercial sorghum food products for urban and rural markets. Industrialization of part of the sorghum production is seen as a key factor in sustained development in Kenya. Therefore, the Project had to consider the total infrastructure concerned with production and consumption. The chain from rural production to urban consumption has many links. In Kenya these links are only poorly developed or completely lacking. It is important to develop them in their proper sequence.

The Project had limited facilities and staff. Therefore, many aspects were studied in collaboration with other national and international institutions (e.g. processing and product development research, utilization studies). On some aspects we could only prepare advisory notes as other institutions were responsible for implementation (e.g. pricing and marketing policy).
At national level we gave priority to certain links within the chain: - development and stabilization of a national sorghum research programme with a
network of (sub-)stations in selected ecological zones; - initiation of crop production programmes in district target areas; - establishment of a pricing, marketing and storage policy for sorghum; - start of industrial processing of part of the sorghum produce. Each regional sorghum programme had to develop its own strategy within the framework of the national strategy, taking the local situation into account. This implied that the traditional role of sorghum in local farming systems had to be studied and understood.
As will be discussed in Chapter 4 sorghum plays a multi-purpose role in the farming systems of the Lake Basin Area; it is used for brewing, as a supplementary starchy staple, as a drought-resistant 'insurance crop', and finally as a cash crop sold at local markets only. Unlike the situation in India, the stover does not play an important role in dry season cattle feeding as yet. However, stover usage may increase in the future.
The majority of local sorghums are tall and late cultivars with coarse brown grains, which are high in tannin content. These types have a good brewing quality and a high level of resistance to bird damage, weathering and moulds. Grain hardness of local varieties varies; soft grain varieties store badly, those with hard grains store well. The food quality of the majority of these sorghums is poor.
Potentially high quality sorghums can take over the multi-purpose role of sorghum in local farming systems. With appropriate pricing, marketing, storage and utilization policies, however, this role of sorghum may expand. Quality grain may fetch a higher guaranteed price on the national market compared to coarse grain. However, in some areas, the husbandry of quality sorghum may differ considerably from that of local sorghum. Due to its sweet taste and high food quality, this sorghum grain is also preferred by birds. The bird damage risk may become so high in some areas or seasons that cropping without bird scaring is impossible. As bird scaring increases the costs of production, farmers will not consider growing quality sorghums in such areas unless an equitable pricing system has been established.
Higher quality, bird damage risk and production costs are important factors differentiating quality sorghum from local sorghum cropping. Below these factors are described in detail as they determine the possibilities for either successful acceptance of sorghums on the national food grain market or successful cropping of quality sorghum by farmers in the Lake Basin Area.
10

Food quality and sorghum kernel structure
The kernel structure of sorghum resembles that of other cereals. It consists of three parts: seed coat, endosperm and germ. However, grain sorghums vary widely in kernel size, structure, shape, endosperm texture and hardness, pigmentation and other characteristics. The structure of the kernel has an important bearing on many processing and food quality characteristics (Rooney and Murty, 1982). The most promising deterrent to birds is related to seed colour (Bruggers and Jaeger, 1982).
Seed colour is determined by pigmentation found in the seed coat. The seed coat consists of a fused pericarp and testa. Size and colour of the pericarp and presence or absence of the testa are all genetically determined. The pericarp may appear white, tan, pink, red or brown. Some sorghum varieties have a testa beneath the pericarp. This highly pigmented layer often gives the kernel a red to brown colour at maturity. Testa pigmentation is associated with a high level of tannins and other polyphenols compounds, providing a natural protective system against birds and resistance to moulds and fungi. Unfortunately, these compounds not only give the grain a bitter taste, they also interact with certain proteins lowering digestibility (Axtell et al., 1982). For this reason, if red or brown sorghums are to be utilized for human consumption, it is recommended to remove the pigmented seed coat by decortication. To obtain a well dehulled pearled product with improved consumption quality, it is usually necessary to remove 20-30% of the grain weight.
The endosperm represents the largest kernel portion. Its texture is genetically determined. Whether varieties are described as floury or corneous depends on the ratio of soft to hard endosperm within the kernel. The hard outer layer provides a natural protection against insect penetration. In food processing, this corneous layer prevents the grain from collapsing when pressure is applied during decortication. This is a major consideration when abrasive decortication is used to produce a pearled product which may be milled into flour (James, 1982).
Quality products can easily be made from white sorghum types without testae and with hard and flinty endosperms. These types produce white quality flour similar to that derived from maize. Processing brown-seeded sorghum types with soft and floury endosperms is more problematic. From a nutritional point of view the seed coat should be removed, as it is the major contributor to colour and bitterness in the end product. However, decortication is difficult due to the soft endosperm. Available milling technologies, are not very suitable for sorghum. New sorghum milling technologies are being developed and were recently tested on a larger scale (Munck et al., 1982; Eisener, 1979; Reichert, 1982).
Bird damage risk
Bird damage in East Africa is mainly caused by small seed eating birds, Quelea quelea being the best known species. These Quelea migrate in flocks of
11

millions of birds from breeding grounds in Tanzania reaching Kenya in June. Later they disperse, and reunite again in Central Tanzania in February or March of the following year. Although of more importance to the Rift Valley Province, they sometimes reach the eastern shores of Lake Victoria. In the course of their migrations these birds cause serious damage to all cereals except maize. The Quelea are wasteful feeders on larger grains such as rice and sorghum; they peck the germ out of the soft green grain, the remaining parts are dropped on the ground (Doggett, 1970).
Other bird species, particularly weavers and bishop birds, pose a more permanent threat to sorghum in the Lake Basin Area causing extensive local damage where they are abundant.
Not all sorghum grains are taken readily by birds. Hardness, size and particularly the taste of the grain influence damage levels. The order of bird preference is (Doggett, 1970): (1) white corneous sorghum grains; (2) grass seed; (3) sorghum grains with testae.
Even the sorghum grains with testae are not immune to attacks by hungry birds in the absence of alternate food. Thus, 'bird resistance' is a relative term and 'less susceptible' is to be preferred (Bruggers and Jaeger, 1982). Other plant characteristics, such as loose and pendant heads, large glumes, awns, have been associated with 'bird resistance' but the term 'less susceptible' is more appropriate.
The bird damage problem should not be underestimated; the economic cost of birds is far greater than often quoted (Doggett, 1982). The risk of bird damage to sorghum stimulates the spreading of maize into the drier, marginal areas of Kenya. It also affects the type of sorghum grown. In areas with high bird pressure, bird scaring and/or cultivation of less palatable sorghum types is inescapable (Leonard and Martin, 1963).
A number of these considerations are reflected in the present cropping pattern of the Lake Basin Area. Although sorghum is the more reliable crop across seasons, most farmers are planting maize at least on some fields. This has increased bird pressure on the remaining sorghum fields and has already resulted in the disappearance of local white-seeded sorghums.
Doggett (1970) gives a clear account of the effect of the local bird situation on the choice of grain types grown in East Africa. If the bird problem is mainly caused by migratory birds, good quality sorghums can still be grown if they mature while these birds are absent. Even in areas with a large resident bird population, quality types may sometimes be cultivated. Thus, in eastern Uganda local bird pressure is high during March-June when birds are greedy because they are breeding. During August-November bird pressure is low because breeding is over and the birds have dispersed. Consequently, only brown coarse types can be grown in the first rains, but high quality white types can be grown without difficulty in the second rains.
12

Over time bird situations have not been static, either. Since the 1950s many bird control organizations have been established. Presently, UN-funded regional and national projects and government bird control units are operating in many countries in both East and West Africa. These programmes are becoming increasingly more effective in the control of birds especially of the migratory Quelea quelea (Bruggers and Jaeger, 1982; Elliot, 1986).
Damage by resident seed eating birds will decrease to acceptable levels if bush cover is reduced and more land has gone under the plough. High population growth in the Lake Basin Area may create such a situation in the near future as the area under cultivation increases rapidly.
Sorghum pricing policy
A realistic sorghum pricing policy must take two principal issues into account. These include the price inter-relationship between maize and sorghum and the between-grade prices for sorghum. An equitable relationship between the price for maize and sorghum is important especially to farmers in marginal areas. It will help them to rationalize their cereal cropping system in relation to agro-ecological suitability and risk of crop failure.
The between-grade price differences should provide an incentive for farmers to start growing better quality types. Sufficient compensation should be given for the bird scaring effort in case high quality sorghums are grown. The Project suggested three principal grades (Pinto, 1982): - Premium grade; hard, mostly pearly white grain without a testa and with a large
grain size. It is used in industrial processing of food products; - Food grade; hard white or coloured grain with a testa. It is processed in village
dehullers to obtain food of improved palatability for rural areas; - Feed grade; soft grain, with or without testa. It may be used for human
consumption; however, it is unsuitable for processing with present technology.
The local price for premium grade sorghum should be established in relation to the price for maize. International parity price relationships may provide a basis for this inter-relationship. The food and feed grade prices may then be set 10% and 20% lower. This should still provide a reasonable return for producers and encourage development of appropriate industries for food and feed. It is essential to motivate producers to grow quality types even though market demand for the various grades is not fully established. It is safer to have a surplus of premium grades than to have an embarrassing surplus of poor quality sorghums.
2.3.2 Strategy and results of the former EAAFRO sorghum programme
Since 1958 the EAAFRO project has been successful in identifying early-maturing, high yielding brown varieties and hybrids. The Serena, Simila and Dobbs varieties and the Hijak (CK60 x SB65) and Hibred (CK60 x Simila) hybrids were released. Some other varieties and hybrids were identified at Serere but were never produced
13

commercially. Although grain yields were high, their food quality was poor due to testa pigmentation and soft endosperm. However, these brown sorghums had a clear advantage over high quality white sorghums; they were more resistant to grain deterioration and less susceptible to bird damage.
During the early seventies the EAAFRO sorghum project retargeted its programme towards the development of high quality grain types. Emphasis was put on developing high yielding white-seeded cultivars with a corneous endosperm which made the grain less susceptible to the two major storage pests in East Africa viz. the rice weevil Sitophilus oryzae and the flour beetle Tribolium castaneum (Overman and Muhwana, 1972; Doggett, 1982). Although the Lulu variety and the Himidi (CK60 x Lulu) hybrid had already been released their quality was not considered high enough. In the new programme many crosses were made and selection criteria were based on the amount of corneous endosperm, seed size and leaf disease resistance. However, in the more humid areas the problem of grain deterioration was encountered. A crossing programme was initiated to transfer resistance to the more promising lines (Mukuru et al., 1976). The improvement programme was still going on when the EAAFRO sorghum project came to an end.
The EAAFRO project also tried to combine the good characteristics of both brown and white types into one variety. Work was initiated to develop high yielding brown cultivars with hard endosperms but without testae. Pigmentation was to be restricted to the pericarp only. The hard endosperm rendered the grain more resistant to weevil damage during storage and improved its processing quality. It was presumed that the brown pericarp would provide resistance to grain deterioration and birds. Although some brown types with good processing qualities were identified, they were low yielders and required further improvement at the time the EAAFRO project was terminated (Mukuru et al., 1974, 1975 and 1976).
2.3.3 Long-term and short-term strategies for West Kenya
West Kenya is characterized by a unimodal rainfall pattern. However, the annual distribution of rainfall makes it possible to grow two successive early-maturing crops instead of one late-maturing crop. Therefore, often two, relatively short, growing seasons are distinguished. The 'first rains' cover the period March-June; the 'second rains' cover the period August-November. A more detailed analysis is presented in Chapter 3.1.
The majority of local sorghums are late maturing which restricts successful sorghum cropping to the 'first rains'. In the 'second rains' no local sorghums are grown. As will be reported (Chapters 3 and 4) interdisciplinary research into local farming systems (CIMMYT, 1977a) and agro-ecological potential (Jaetzold and Schmidt, 1982) indicated that introduction of early-maturing sorghums should have high priority. These sorghums are considered of great value to local farmers as they would increase management flexibility to cope with uncertainties of rainfall. It was also thought that by introducing early maturity, a second-rain sorghum crop
14

would become a viable option. Another advantage could be that this second-rain crop might be less troubled by birds as is the case in Uganda. For the Busia and Siaya Districts a bird situation similar to eastern Uganda was anticipated as these areas are adjoining. Field studies were necessary as only pre-harvest damage assessments could provide the answer.
Long-term strategy
The adopted research strategy for the Lake Basin Area encouraged the production of two short-season crops from March-June and August-November; the second crop possibly being a ratoon crop. The selection of grain type was more difficult. There were strong indications that farmers would be helped by an immediate introduction of early-maturing, brown-seeded sorghum types. However, this conflicted with the preference for white-seeded sorghum as a food crop.
It was realized that proper coordination would be needed to introduce early-maturing sorghums with high quality white grains in the Lake Basin Area. The disappearance of local white sorghums produced evidence for such a statement. If grown in the first rains the new types will mature before the bulk of local brown sorghums. This will increase the risk of bird damage to these more palatable types. Growing a second-rain crop will be risky as sorghum cropping in this season is not widely practised yet. Bird scaring is then required, particularly if these types are grown on small isolated fields. This requires additional labour which might not be available. Hiring of bird-scarers may then be an option increasing production costs even further.
The bird problem needs to be given consideration in view of lack of labour and funds required for bird scaring. If nothing is being undertaken, farmers have no choice but to grow bitter brown varieties or to abandon sorghum cropping altogether. The contribution of sorghum to the national economy will then continue to decline and an opportunity for developing stable cereal cropping systems for marginal areas will have been missed.
To solve this problem the Project advocated an integrated approach (Pinto, 1982). Breeders should continue to develop varieties with a high potential yield of high quality grain and possibly with some inherent bird deterrent characteristics. Agronomists and extension staff must see to it that these varieties are introduced through properly coordinated programmes in sufficiently large and concentrated areas to justify support of the National Bird Control Unit. Farmers should be encouraged to use simple mechanical devices to scare birds. A better market pricing system should motivate farmers to better look after their crops.
Short-term strategy
Because good quality white-seeded sorghum types were not available for the Lake Basin Area, our breeders had to concentrate on the continuation and expansion of the breeding programme started by the former EAAFRO sorghum improvement
15

project at Serere. As Busia and Serere are situated in similar agro-ecological zones, the strategy and results of the former EAAFRO project laid the foundation for further action within the breeding programme and have therefore been described in detail in Chapter 2.3.2.
Pending the availability of good quality white-seeded sorghums and the establishment of an equitable pricing system our agronomy section adopted a two-stage strategy. During the first stage some high yielding, early-maturing brown-seeded sorghums, available from the former EAAFRO project, were to be introduced. As soon as our breeders had developed some good quality white-seeded sorghums the second stage would comprise the introduction of these types through properly coordinated programmes.
It was our conviction that the introduction of early-maturing, brown-seeded sorghums would not lead to an improvement in the position of sorghum within the national economy. However, we also felt that the impact on the local economy in West Kenya could be great, especially if these new sorghums proved to be well adapted to the needs of local farmers. Therefore, to test these sorghums, they had to be exposed to farmers circumstances. This called for a production-oriented agronomy research programme with experimental and operational sub-programmes.
In the experimental sub-programme the most suitable varieties among the available early-maturing, brown-seeded sorghums would be identified. An adapted husbandry package would also be developed. For this purpose on-farm trials were conducted to ensure more representative soil, disease and pest conditions. However, trial management was the responsibility of our team.
In the operational sub-programme the selected varieties would be exposed to farmers total circumstances. In these on-farm tests sorghum production plots were used. These plots had to be managed by farmers themselves who could freely modify the recommendations.
It was hoped that this production-oriented programme would provide us with an insight into a range of questions concerning the practical value of new varieties and husbandry methods. Important questions were: - would the availability of early-maturing sorghum varieties really enhance
management flexibility at farm level? - what factors operate under farmers conditions that are not seen at the research
station? - how are conflicts in quality, level or timing of resource use related to the
capacity of farmers? - what is the performance of early-maturing varieties under a range of farmers
environmental and management conditions?
A better understanding of the merits and limits of the selected brown varieties and husbandry methods would benefit the relevance of the programme on early-maturing, white sorghums. It would help to better target this programme to
16

farmers specific needs and circumstances. In this sense, agronomy efforts dealing with brown sorghums were seen as an integral part of the technology development process for white sorghums.
2.4 TARGET ZONES FOR IMPLEMENTATION IN WEST KENYA
2.4.1 Selection of target area
The sorghum programme was implemented in the Nyanza and Western Provinces. Our activities concentrated on the lower altitudes and thus on the warmer areas of these provinces, in which sorghum still plays an important traditional role. An agro-climatic zoning of West Kenya is presented in Figure 2.2 (its key is presented in Table 2.3), in which the target area (indicated by the temperature zone symbol 3) is left unshaded. This map clearly shows that all fairly warm Midlands adjoin Lake Victoria.
The target area thus defined adequately reflects the area under sorghum in West Kenya (Table 2.2). Although the accuracy of the presented data is questionable, they may be used to indicate the districts where sorghum is still an important crop. Difficulties with data collection by extension staff in remote areas largely explain the substantial changes in area within some districts.
In Nyanza Province the major sorghum growing districts are South Nyanza and Siaya. Kisumu has considerably decreased its share as farmers have been substituting sorghum for sugar-cane and cotton which are more profitable. Busia is the major sorghum growing district of Western Province.
Table 2.2. Area under sorghum by district in Western and Nyanza Provinces, 1971-77 ('000 ha).
Province
Western
Nyanza
District
Busia
Kakamega Bungoma
Siaya South Nyanza
Kisumu Kisii
1971
21.0 10.6
8.4 2.0
83.2 33.4
40.2
9.3 0.3
1972
20.7
10.8 9.0 0.9
62.1
18.3 24.5 19.0
0.3
1973
14.2 7.2
6.2 0.8
22.5 18.6
1.4 2.5
-
1974
13 .2 6.6
6.0 0.6
20.2 14.1
1.4
4.5 0.2
1975
19.3 10.0
8.9 0.4
21.6
16.8 1.6
2.8 0.4
1976
8.6 7.9 0.2 0.5
36.0
10.8 19.6
5.3 0.3
1977
22.2 6.6 6.3 9.3
51.8
23.8 24.2
3.2 0.6
Mean
17.0
8.5 6.4 2.1
42.5 19.4
16.1 6 .7
0.3
Note: based on Chiodo-Juve (1980).
Figure 2.2 shows that a typical agro-climatic zoning exists within the target area. Dry zones (700 mm) occur near Lake Victoria whereas wet zones (2000 mm) occur at 50 km distance. The reason for this is increased rainfall due to local convergence of the daily westerly lake winds with the south-east monsoon (Jaetzold and Schmidt, 1982). These winds, caused by the different rates of heating and cooling of land and water, are blowing on-shore during the day and off-shore at night. The south-east monsoon is caused by the presence of a low pressure belt between the
17

tropics, which follows the sun in its seasonal swing. In Kenya this belt, called the Inter-Tropical Convergence Zone (ITCZ), usually passes the equator in April and October reaching its northerly extreme in July. The south-east monsoon blows over the target area from April until October. These winds are moist as they have blown over the Indian Ocean. When they converge with other winds, either inside or outside the ITCZ, the air rises producing heavy showers in the afternoons.
Table 2.3. Agro-climatic zones of West Kenya ; key to Figure 2.2.
Part A: Moisture availability zones with an indication of rainfall, evaporation, potential for plant growth and risk of maize crop failure, assuming that soil conditions are not limiting.
P/Bo
(%) P (mm); mean annual rainfall
Eo (mm); mean annual potential evaporation
potential for plant growth
risk of failure of adapted maize crop
I II III IV
>80 1100-2700 65-80 1000-1600 50-65 800-1400 40-50 600-1100
1200-2000 1300-2100 1450-2200 1550-2200
very high high medium-high medium
extremely low very low; 1-5% fairly low,- 5-10% low; 10-25%
Part B: Temperature zones with an indication of mean maximum, mean minimum and absolute minimum temperatures and altitudes.
temperature (°C) zone mean annual mean max. mean min. abs. min.
altitude (m) general classification
<14 14-16 16-18 18-20 20-23
<20 20-22 22-24 24-26 26-28
8-10 10-12 12-14 14-16
<0 0-2 2-4 4-6 6-8
>2450 2150-2450 1850-2150 1500-1850 1200-1500
Upper and Afro-Alpine Highlands Lower Highlands; fairly cool Lower Highlands; cool temperate Midlands; warm temperate Midlands; fairly warm
Note: based on Braun (1980), Kenya Soil Survey, Nairobi.
In West Kenya the relatively wet agro-climatic zones are dominating (zones I and II in Figure 2.2). However, relatively dry zones (zones III and IV) are found closer to the lake. In the wetter zones the rainfall is more or less continuous between March and November. Therefore, it is difficult to establish the onset of the second rains. As a result of the local convergence, rainfall between June and August is sufficient; hence, there is no reason for dividing the growing period into two defined seasons. However, it is possible to plant two early-maturing crops instead of one late-maturing. Less rainfall occurs in the drier zones between June and August; the first and second rains are separated by a distinct dry period.
As varietal requirements had to be considered against these variations in rainfall (amount, duration and distribution) it was intended to implement a programme in each of the agro-climatic zones within the target area.
2.4.2 Target zones and research resource constraints
Constraints on research resources often occurred and were responsible for programme adjustments. This should be said so as not to belittle our efforts but regard them in their true perspective. To better understand the focus of the programme in West Kenya these constraints are briefly described below.
18

-+ International boundary — Provincial boundary — District boundary
Agro.climatic zone symbol [see table 2.2) — temperature zone symbol — moisture availability zone symbol — moisture availability zone boundary —- temperature zone boundary (only if
different from the moisture availability zone boundary)
Based on map of Kenya Soil Survey (Braun, 1980)
Figure 2.2. Map of West Kenya showing agro-climatic zones (for key see Table 2.3).
19
Implications of staff constraints
Problems with the posting of an FAO breeder at Busia severely hampered the development of a meaningful long-term sorghum improvement programme in West Kenya. Of the original objective to initiate a sorghum screening, selection and breeding programme for West Kenya, it was only possible to develop the screening and selection components. The breeding component, aimed at developing high-yielding, early-maturing, S?n'ga-resistant varieties or hybrids with high grain quality and adequate disease and pest resistance, could not be developed properly.
Our breeding section tried to broaden the germplasm base. Locally collected and introduced material was simultaneously tested in adaptation nurseries. The new material was tested against improved varieties or hybrids originating from the former EAAFRO programme and from other collaborating organizations e.g. ICRISAT. This was necessary to better evaluate the potential of material from different sources and appreciate the specific problems in our target area. The local sorghum collections, acquired throughout Kenya, contained 1103 entries. Most introduced material came from EAAFRO, ICRISAT, CIMMYT, Ethiopia, India, USA (Purdue, Texas) or Botswana and included over a thousand entries.
Our agronomy programme was less affected by staff constraints; the author (in charge of the sorghum agronomy section at the Alupe ARS) was present throughout Phase II of the Project. In consultation with the breeding sections at Busia and Machakos the agronomy section was given the additional responsibility of developing a multi-locational programme in the Lake Basin Area to test the best varieties and hybrids identified by the breeders. Looking back, this testing programme benefited from the division of tasks; its continuity had been guaranteed.
Implications of constraints on facilities
At the time the Government of Kenya had selected Busia as the base for the Lake Basin sorghum programme, facilities at the Alupe ARS were inadequate, but plans to improve them were at an advanced stage. However, they did not materialize during the Project period. Kenya's high oil bill and low export prices for coffee from 1978 onwards had resulted in a balance of payments deficit forcing the Government to resort to severe budget cuts (Parrott et al., 1978; Anon., 1981). Less money was available to cover the development and operational costs of research stations. As a case in point, annual Government contributions to the Project (Phase II) did not exceed 40% of its initial commitment (Pinto, 1982). The Busia based sorghum programme had to learn to make the best of what was available.
In 1979 our multi-locational testing programme had trial sites in three out of the six important sorghum districts of West Kenya. The actual sites were located at Homa Bay, Ahero, Nambale and Alupe (Figure 2.2). The 1980 budget cuts and shortage of transport operating funds forced us to restrict further testing to the relevant areas of the Siaya, Busia, Kakamega and Bungoma Districts only.
20

However, all agro-climatic zones were still present within this reduced target area. It was therefore anticipated that the sorghum programme would remain useful to West Kenya as a whole. Unfortunately, additional budget cuts in 1981-82 required further programme adjustments. Priority was given to a continuation of the multi-locational testing programme for varieties and hybrids in as many ecological environments as possible. Consequently, the agronomy programme on crop husbandry aspects, could be implemented in fewer ecological environments.
Selection of target zones
Already during the implementation of the 1979 programme it was concluded that the reduced target area (consisting of the Siaya, Busia, Kakamega and Bungoma Districts) had to be further sub-divided. The importance of sorghum in the local cereal cropping systems varied considerably due to variation in ecology and population density. For practical reasons the number of zones had to be limited.
In the development of a research framework constituting the baseline for planning an adaptive experimental programme on sorghum in the reduced target area (Enserink, 1982), three reports featured prominently: - CIMMYT's (1977a) report describing farmers practices and circumstances
related to maize cropping in a part of the Siaya District; - a report prepared by the Western ARS economist (Rop, 1981) presenting
exploratory survey results on finger millet and sorghum crop husbandry practices in the Busia District;
- the West Kenya Farm Management Handbook (Jaetzold and Schmidt, 1982), in which small farm survey results were published.
Based on these reports, the outcome of our field trips, and discussions with farmers, village-based extension staff and research officers, the reduced target area was sub-divided into three target zones: - Zone A: Wetter areas between 1350-1500 m altitude; - Zone B: Wetter areas between 1200-1350 m altitude; - Zone C: Drier areas between 1200-1350 m altitude.
Roughly, the relevant areas within the Kakamega and Bungoma Districts belong to Zone A. The Busia District mainly belongs to Zone B. The Siaya District belongs to Zone B as well as to Zone C.
In Zone A maize and beans are the major crops in the first and second rains. As soils are deep, their high water storage capacity reduces negative effects of dry spells on crop production. Maize hybrids are dominant in the first rains but local maize varieties are preferred in the less reliable second rains. Farming systems studies (Lihanda, 1978; Pollard, 1981; Jaetzold and Schmidt, 1982) identified the major farming problems as:
21
- shortage of land for agricultural use due to high population pressure; - degradation of soil fertility due to continuous cropping of land; - inadequacy and uncertainties of rainfall in the second rains; - clash of operations at the end of the first rains and start of the second rains.
Frequently the second rains find a maturing crop in the field.
Consequently, maize yields are low resulting in food shortages which are often more pronounced in the February-June period. Sorghum has become a minor first-rain crop in Zone A. In the second rains a sorghum ratoon crop is preferred, but also some new crops are established, usually through undersowing in maize. In the densely populated areas of Kakamega District (350-700 persons per km2) the local traditional red-brown varieties (e.g. Kisudi) have become less popular since the early 1960s (Lihanda, 1978). They have been substituted by more palatable white varieties (e.g. Ingumba) which were introduced from the neighbouring Nyanza area. This indicates that in these areas the local bird population no longer poses a serious threat to growing high quality white-seeded sorghums.
For Zone A we had to concentrate on a selection of a good quality white-seeded sorghum crop for the second rains. This crop should grow well in maize fallows or should tolerate relay-planting with maize. Such sorghums would ensure availability of high quality food at farm level from January until June or provide the industrial market with high quality grain supplies. Because of lower temperatures, growth and development of sorghum are slower compared to the other target zones and non-sensitivity to low night temperatures is essential. Although Striga is less common in higher altitude areas, tolerance might still be required. The sorghum crop should be capable of benefiting from residual effects of fertilizers applied to the maize crop.
In Zones B and C sorghum is still a major first-rain crop. As both zones have shallow to moderately deep soils, drought may occur even in the first rains. Therefore farmers cannot rely on maize alone as in Zone A with its deep to very deep soils. Also an entirely different set of farming problems is prevailing in these less densely populated zones (150-230 persons per km2). Labour scarcity, particularly for planting and weeding, and uncertainties of rainfall are among them. Availability of early-maturing sorghum varieties would considerably enhance the management flexibility of farmers in both zones.
For Zone B we concentrated on early maturity to facilitate growing two short-season sorghum crops. The possibility of ratooning had to be investigated as this would further reduce labour costs. Resistance to Striga is required. Resistance to grain moulding and weathering is essential, particularly for a first-rain crop. Available early-maturing brown varieties seemed to be adequate but ultimately also this zone will need high yielding, good quality white varieties or hybrids. Credit facilities for inputs (fertilizer and labour) should then also be available to be recovered from surplus sales.
22

In Zone C the yields and thus the input use will always be lower due to its lower natural potential and higher risk. Emphasis should therefore be put on food security with any surplus to be used for strategic storage within the districts. To grow two successive short-season sorghum crops, the selection programme also had to focus on early maturity and ratooning. Available early-maturing brown varieties seemed to be adequate but priority should be given to the development of high yielding brown varieties with hard endosperms but without testae and to the development of rural processing facilities. Striga resistance should be high but, compared to Zones A and B, resistance to grain moulding and weathering is less important. Continued use of farm-yard manure should be stimulated.
Within the limits of available resources, the agronomy programme could only cover Zones B and C. The multi-locational testing programme for varieties and hybrids covered both zones in the Busia and Siaya Districts. However, the crop husbandry programme had to be restricted to Zone B. Due to transport problems this programme was mainly carried out in the Busia District. The remaining chapters of this study will therefore be devoted to the Siaya and Busia Districts.
23
3. AGRO-ENVIRONMENTAL SETTING OF THE BUSIA-SIAYA AREA
3.1 CLIMATE
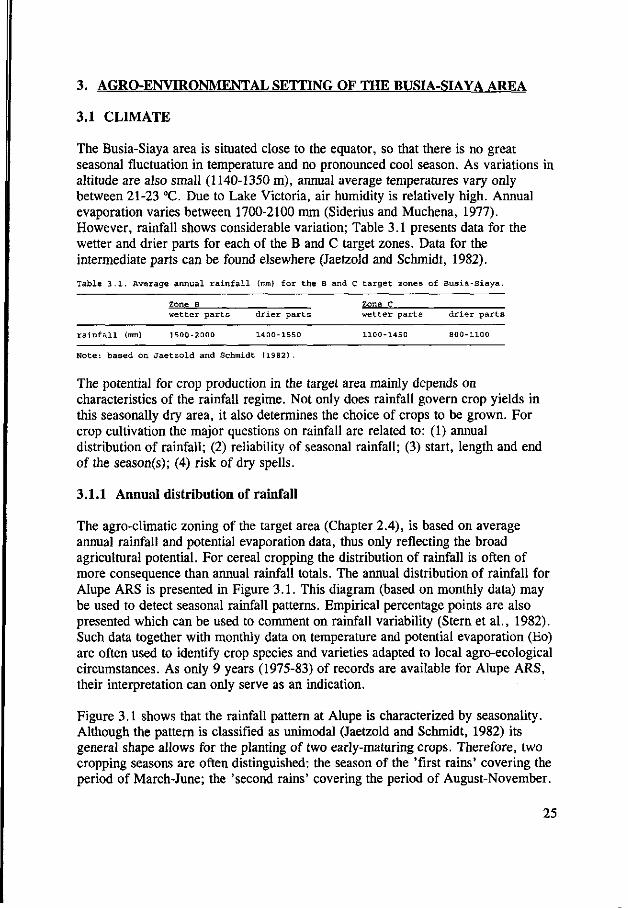
The Busia-Siaya area is situated close to the equator, so that there is no great seasonal fluctuation in temperature and no pronounced cool season. As variations in altitude are also small (1140-1350 m), annual average temperatures vary only between 21-23 °C. Due to Lake Victoria, air humidity is relatively high. Annual evaporation varies between 1700-2100 mm (Siderius and Muchena, 1977). However, rainfall shows considerable variation; Table 3.1 presents data for the wetter and drier parts for each of the B and C target zones. Data for the intermediate parts can be found elsewhere (Jaetzold and Schmidt, 1982).
Table 3.1. Average annual rainfall
Zone B wetter parts
rainfall {mm) 1500-2 000
(mm) for the
drier parts
1400-1550
B and C target zones of Busia-Siaya.
Zone C wetter parts drier parts
1100-1450 800-1100
Note: based on Jaetzold and Schmidt (1982)
The potential for crop production in the target area mainly depends on characteristics of the rainfall regime. Not only does rainfall govern crop yields in this seasonally dry area, it also determines the choice of crops to be grown. For crop cultivation the major questions on rainfall are related to: (1) annual distribution of rainfall; (2) reliability of seasonal rainfall; (3) start, length and end of the season(s); (4) risk of dry spells.
3.1.1 Annual distribution of rainfall
The agro-climatic zoning of the target area (Chapter 2.4), is based on average annual rainfall and potential evaporation data, thus only reflecting the broad agricultural potential. For cereal cropping the distribution of rainfall is often of more consequence than annual rainfall totals. The annual distribution of rainfall for Alupe ARS is presented in Figure 3.1. This diagram (based on monthly data) may be used to detect seasonal rainfall patterns. Empirical percentage points are also presented which can be used to comment on rainfall variability (Stern et al., 1982). Such data together with monthly data on temperature and potential evaporation (Eo) are often used to identify crop species and varieties adapted to local agro-ecological circumstances. As only 9 years (1975-83) of records are available for Alupe ARS, their interpretation can only serve as an indication.
Figure 3.1 shows that the rainfall pattern at Alupe is characterized by seasonality. Although the pattern is classified as unimodal (Jaetzold and Schmidt, 1982) its general shape allows for the planting of two early-maturing crops. Therefore, two cropping seasons are often distinguished: the season of the 'first rains' covering the period of March-June; the 'second rains' covering the period of August-November.
25

Rainfall.Evoporation 1
J F M A M J J A S O N D mwith
Figure 3.1. Monthly averages for potential evaporation (Eo), maximum, mean and minimum temperatures (Tmax, Tmean and Tmin) and rainfall totals (Pmean) for Alupe ARS. The 78 and 22 percentage points (P78 and P22) and individual observations (>) for rainfall totals are also indicated. Percentage points (e.g. P78) are rainfall totals having a given percentage of observations below or equal to it (e.g. 78% = 7 out of 9 years).
Figure 3.1 also shows the considerable variability in rainfall totals. The first rains are more reliable than the second, not only as far as quantities and variability are concerned but also in relation to crop production. April and May will coincide with the period when early-maturing crops, planted in late February or early March, are at their peak water requirements (>Eo). For both months rainfall surpasses Eo in 7 out of 9 years. In the second rains, however, drought-resistant crops are needed. When an early-maturing crop is planted in August, it is at its peak water requirement in October or November. Rainfall surpasses Eo in only 2 out of 9 years and 4 out of 9 years for October and November, respectively.
3.1.2 Reliability of seasonal rainfall
As the area's rainfall mainly occurs in two periods with a short dry season (January-February) and a trough of reduced rainfall (June-July) in-between, annual rainfall may conveniently be discussed in terms of sub-totals for these two seasons,
26

viz. the first and second rains. A methodology for handling seasonal rainfall data was developed by Braun (1977), who compiled seasonal probability tables for various regions in Kenya.
The seasonal rainfall probability maps for the Busia-Siaya target area (Figures 3.2 and 3.3), are based on district maps published in the Farm Management Handbook for West Kenya (Jaetzold and Schmidt, 1982). These maps are based on Braun's calculations. They show a zoning according to seasonal rainfall totals (e.g. 400 mm, 500 mm) which are reached or surpassed at the 60% probability level (= in 6 out of 10 years). Although the complicated annual rainfall patterns in the wetter parts make it difficult to set rigid limits for the start and end of each of the two seasons, the most likely periods for crop production are selected. In the drier parts closer to Lake Victoria, calculations are based on the actual seasons. Resulting crop production periods are presented in Table 3.2.
Figures 3.2 and 3.3 indicate that crop production in the Busia-Siaya area is strongly related to distribution and totals of seasonal rainfall. Table 3.2 summarizes results according to target zones.
Table 3.2. Seasonal 60% probability rainfall Busia-Siaya area, with an indication of the
First rains Zone B wetter drier parts parts
rainfall (mm) 750-950 600-700 season Feb-July Feb-July
Zone C wetter parts
480-650 Feb-July
totals {mm most likely
drier parts
350-480 Mar-June
in the B cropping
and C target zones seasons.
Second rains Zone B wetter parts
550-800 Aug-Jan
drier parts
450-580 Aug-Jan
Zone C wetter parts
300-550 Sep-Jan
of the
drier parts
50-250 Nov-Dec
Note: based on Jaetzold and Schmidt (1982).
From Alupe going into a south-easterly direction, two separate seasons should be distinguished progressively; the June-July trough of reduced rainfall is widening until August and even September are included. For sorghum production chances of ratoon crop survival are decreasing due to the increasing length of the dry period between these cropping seasons. Even further south the second rains are insufficient for crop production.
From Alupe going into a north-easterly direction, rainfall also decreases. As the length of both seasons is not changing, the decrease in rainfall is reflected in seasons of lesser quality. Compared to the situation in the south the decrease in the north is less pronounced. Going further north-east, after passing the Busia District's boundary, the orographic effects of Mount Elgon are increasingly influencing the climate, resulting in more favourable seasons.
With the exception of the drier parts of Zone C, two crops per year may be grown. Rainfall reliability within each season will determine whether water-demanding or drought-resistant crops are to be grown. Growing season length will determine the most suitable cultivar (e.g. a 120-day or a 150-day variety).
27

N | 10km |
*++ **+s / ^
• • A
CO o
State boundary
District boundary
River
District H.Q.
Divisional H.Q.
Location of experiments
Target zone B Target zone C
Figure 3.2. First-rain 60% probability map (mm) for the B and C Zones of Busia-Siaya.
28

N 10km
**» ^.y / w
• • A
m m
State boundary
District boundary
River
District H.Q.
Divisional H.Q.
Location of experiments
Target zone B
Target zone C
700
Figure 3.3. Second-rain 60% probability map (mm) for the B and C Zones of Busia-Siaya.
29

This kind of data analysis was used when studying the quality of growing seasons for Alupe ARS. As this quality depends on the balance between rainfall (P) and potential evaporation (Eo), Figure 3.5 presents a decadal moisture availability analysis based on the ratio between P and Eo. The year-to-year distribution of moisture availability provides an approximate feature for the length of the growing periods if the following guidelines are taken into account: - P/Eo less than 0.2: most crops are dying; - P/Eo from 0.2 to 0.4: survival period particularly for perennial crops; - P/Eo from 0.4 to 0.6: sub-normal water supply; survival period for most annual
crops in their mid-season stage of peak water requirements; - P/Eo from 0.6 to 0.8: sub-normal water supply; sufficient for the early- and
late-season stages but still insufficient for optimal growth of most annual crops in their mid-season stage of peak water requirements;
- P/Eo more than 0.8: optimum water supply; however sorghum and particularly maize require a higher level (from 1.0 to 1.2) for maximum production during their mid-season stage of peak water requirements.
decode 11 2 311 2 31 1 2 31 1 2 311 2 3 I 1 2 311 2 311 2 311 2 311 2 31 1 2 3 | 1 2 3 | month I J I F I M I A I M I J I J I A I S I O I N I D I
• 7EO<0-2 • 0 . 2 < P / E O < C H y04<7Eo<06 HO.6<P/EO<°-8 gOB<p/Eo<1.0 H I .0< P /EO
Figure 3.5. Decadal analysis of moisture availability, defined as the ratio between rainfall and evaporation (P/Eo), at Alupe ARS, 1975-83.
Figure 3.5 indicates that the average data presentation is of little use as it only confirms the general picture. On average Alupe has a long cropping season followed by a medium cropping season, which are not separated by a distinct arid period. However, for farm management the variability is much more important. Compared to earlier analyses, striking information is provided by the annual presentation in Figure 3.5, particularly on the start and length of growing seasons.
32

For the first rains the following remarks can be made: - the probability for a successful start of the growing season before the third
decade of January is low; - the start of the first rains is unreliable. Depending on the occurrence and
reliability of 'grass rains' in January or February, three types of seasons may be distinguished: Type 1. Grass rains with enough rainfall, lasting long enough to permit successful early sowings (e.g. 1975-77, 1979). Dry spells before the actual onset of the first rains being too short to affect crop production ensuring the availability of relatively long growing seasons; Type 2. Grass rains with initial good showers (20 mm or more), not lasting long enough (e.g. 1980, 1983). Almost all farmers are tempted to sow early but the risk of failure of crop establishment is high due to dry spells in February and early March. Resowing and gapfilling are often necessary. Depending on the rate of successful crop establishment, relatively long or short growing seasons may be distinguished; Type 3. Grass rains being absent (e.g. 1978, 1981) or very weak (e.g. 1982). No early crops being sown or in case of weak rains few farmers trying to establish crops resulting in many failures. Availability of relatively short growing seasons;
- the end of the first rains is unreliable. By definition this rainy season ends after the last week of July. However, frequently these rains stop much earlier; severe dry spells occur in the first two decades of June in 3 out of 9 years;
- due to a variable start and end of the rains, effective growing periods for cereal crops vary between 80 (e.g. 1980) and 190 days (e.g. 1977).
For the second rains the following remarks can be made: - the start of the second rains is quite reliable. During the first two decades of
August crop establishment is successful in most years; - the quality of the growing season is extremely variable. In some years successful
maize crops can be grown (e.g. 1982, 1983) but in most years drought-resistant crops are a better choice due to the occurrence of dry spells and/or long periods with low moisture availability;
- the first two December decades may be defined as the end of the season; - the effective growing season for cereal crops covers 120 days or less.
Considerable variations in the effective length of the first-rain cropping season confirm the dilemma of how this variation should be exploited in terms of optimum management (e.g. length of growing cycle of crops).
The short effective length of the second-rain cropping season poses problems to cultivation of long-maturing crops. For instance cotton reaches its peak water requirements between 105-165 days after planting (Acland, 1973). For successful cotton cropping in the second rains, crops should be planted before August. Therefore, Busia farmers are trying to relay-plant cotton in maturing maize crops by late June or early July following the occurrence of a good rain shower.
33

As only nine years of data are available and neither water storage capacity of soils nor water consumption curves of specific crops are taken into account, the moisture availability analysis of the Alupe data can only be indicative for local growing season lengths.
Length of these growing seasons as presented by Jaetzold and Schmidt (1982) are more accurate. Their model uses decadal data from many local stations having at least 10 years of records. Their decadal moisture availability analysis does not only take into account the water storage capacity of local soils but is also based on a general water consumption curve for annual crops (Doorenbos and Pruitt, 1977) which was adapted to local agro-climatical conditions. Growing seasons are defined as periods with enough soil moisture supply to grow most crops starting with a supply to transpire more than 0.4 Eo, coming up to more than 1.0 Eo during the time of peak demand and subsequently dropping to 0.4 Eo in the maturity phase.
With this model the length of the growing periods for each individual year may be calculated. Subsequently, probability levels for the length of these periods may be established. Table 3.3 presents the 60% probability length for both growing periods in the two target zones of Busia-Siaya. Figures presented are calculated for crops grown on medium textured soils of at least 60 cm depth.
Table 3.3. Seasonal 60*
growing period length (days)
probabili
First rains Zone B wetter drier parts parts
>195 >170
ty lengths of growing
Zone C wetter drier parts parts
150-175 125-135
period (days) in B and
Second rains Zone B wetter drier parts parts
120-130 105-120
C target
Zone C wetter parts
80-95
zones.
drier parts
<45
Note: based on Jaetzold and Schmidt (1982).
3.1.4 Risk of dry spells
Dry spells are thought to play a role in shaping local cropping systems as soils of shallow to medium depth are dominating the target area. Daily rainfall data are used to investigate the occurrence of dry spells; much useful information may get lost by summations into 10-day totals.
Stern et al. (1982) developed a simple method to analyze dry spells. To use their method, a threshold value for daily rainfall must be defined below which a day is considered 'dry'. For the Alupe rainfall records the method was used twice, applying two different threshold values viz. 3.0 and 5.0 mm. These were selected as, particularly during dry spells, rainfall of less than 3.0 mm (Whiteman, 1981b) or 5.0 mm (Hay, 1981) is thought to be almost entirely lost by surface evaporation.
For each defined threshold value and individual year daily rainfall records are re-coded as sequences of wet and dry days. Subsequently, the method takes a period as its basis (e.g. the month of May). To assess the risk of dry spells, the longest series of dry days in the selected period is extracted for each year. This method assumes that dry spells can start before and continue into selected periods.
34

The proportion of years with dry spells lasting longer than a particular number of days (e.g. 5 or 10 days) during selected periods can then be found directly.
To show the change in dry spell probabilities through the year more clearly, an analysis of overlapping periods is made. Figure 3.6 presents the results of such an analysis for Alupe. A 30-day period was taken as the basis for the analysis. These 30-day periods overlap each other by definition (Period I: 1-30 Jan; Period II: 6 Jan-5 Feb) and results can therefore be plotted at 5-day intervals.
number of years proportion of years
1.00
-0.78
0.56
—0.33
9 T 1.00
0.78
0.56
- -0.33
N | D | month
Figure 3.6. Alupe's (1975-83) probability of dry spells of at least 5, 10, 15, 20, 25 and 30 days occurring within 30 days following each date plotted, with dry-day-threshold values of 3 and 5 mm.
35

Figure 3.6 confirms that the first rains are the most reliable for crop production, as: - the probability of a 10-day dry spell decreases considerably for both threshold
values and is rather low in the March-May period; - the value of the dry-day-threshold does not greatly influence the shape of the
figure in the January-May period. This indicates that rainfall is effective as showers often surpass the 5 mm level.
The June-July period appears to be unsuitable for crops in their mid-season stage of peak water requirements; probabilities of dry spells lasting longer than 10 or even 15 days are high. Therefore, crop management should see to it that this crop development stage ends early June. Planting new crops in the June-July period is also risky.
Figure 3.6 confirms that the second rains are less reliable for crop production than the first, as: - the value of the dry-day-threshold considerably influences the shape of the figure
in particular for the probabilities of 10 and 15-day dry spells during September and October. This indicates that during this period rainfall is often not effective as light showers occur (3-5 mm);
- the probabilities of 5, 10 and 15-day dry spells at the 5 mm threshold are much higher compared to the first rains;
- the probabilities of 10 and 15-day dry spells at the 5 mm threshold are high throughout the entire growing season but in particular during September, November and December. Therefore, crop management should see to it that the mid-season stage of peak water requirements ends before the second half of November.
The dry spell analysis emphasizes that based on climatical data only, the growing of drought-sensitive crops such as maize and finger millet should be restricted to the first rains. Drought-resistant crops such as sorghum may be grown during both rainy seasons; however, also for these crops more reliable yields are obtained in the first rains.
Although the first rains are more reliable, Figure 3.6 shows that the period of reliable rainfall is rather short. Early March and late May show high probabilities for 10-day dry spells, seriously affecting production when crops are in vulnerable development stages. Again it is emphasized that particularly for drought-sensitive crops, care should be taken that such critical stages coincide with periods of reliable rainfall or satisfactory soil moisture status.
36

3.2 SOILS
3.2.1 Introduction
At the start of the Project little was known about local soils. Only preliminary district soil maps were available (Siderius, 1978), based on a generalization of a draft edition of the 'Exploratory Soil Map of Kenya' (Sombroek et al., 1982).
In the course of the Project more information became available from soil surveys conducted in Busia and Siaya. The Kenya Soil Survey (KSS) published a draft edition of a soil map for the Busia area (Michieka and Rachilo, 1984). A draft soil map for the Bondo area was in preparation (C.K.K. Gachene, KSS, pers. comm.).
Within the framework of our sorghum study, available information on soils together with some additional field observations was pooled by the Netherlands Soil Survey Institute to compile a detailed map. This map, entitled 'Soils of Busia and Siaya Districts, Kenya (scale 1:250,000)' is published as a loose Appendix to this study. In the following chapters reference is made to this map. Soil classification names in the map legend refer to the Legend of the Soil Map of the World (FAO-UNESCO, 1974). Some modifications, as presented in the legend of the Exploratory Soil Map of Kenya (Sombroek et al., 1982), have been incorporated.
3.2.2 Physiography
The physiography of the Busia-Siaya area is characterized by undulating to rolling uplands (symbol U on soil map) at an altitude of 1250-1350 m and with slopes of 2-16%. Only some small uplands occur in areas of higher altitude (e.g. the Luanda-Yala-Siaya triangle). All other physiographic units cover smaller areas.
From these uplands steeper and higher hillranges and isolated inselbergs (symbol H on the map) arise up to heights of about 1700 m. Hill slopes are predominantly over 16%. Transitions between the hillranges and uplands are generally formed by gently undulating footslopes (symbol F) with slopes of 2-8%.
These physiographic units (U, H and F) encompass a variety of parent rocks including basic (symbol B), intermediate (I) and acid (mainly granites, G) igneous rocks as well as undifferentiated sedimentary formations (S) comprising mudstones, sandstones and conglomerates.
The area is dissected by many minor river valleys and some major ones (V), viz. the Sio river in the Busia District and the Yala and Nzoia rivers in the Siaya District. Locally, some floodplains (A) have been formed along major rivers. In the upper parts of the smaller valleys without proper drainage outlets, so-called bottomlands (B) occur. These are subject to periodic waterlogging or flooding.
Almost continuous flooding occurs in Yala Swamp (S), an extensive swamp bordering Lake Victoria. Some small beach ridges (B) are found in this swamp. Minor swamps occur locally along rivers and streams.
Sedimentary plains (P) of relatively limited extent have been formed, with some lacustrine influence along the shores of Lake Victoria.
37

3.2.3 Classification
Soils of the most extensive physiographic unit, the uplands, belong to the Acrisols, ferralic Cambisols and Ferralsols. These soil types have a low natural soil fertility and, in addition, a restricted soil depth (shallow or moderately deep) due to the occurrence of continuous ironstone pans ('murram' or, in classification terminology, 'petroferric contact'), concretionary ironstone layers ('pisoferric contact') or rock ('lithic contact'). These soils can also be gravelly or stony.
In the uplands of the southern part of the area, verto-luvic Phaeozems have developed on basic igneous rocks (UB3). These soils have, by definition, thick humic topsoils rendering them highly fertile (high cation exchange capacity (CEC)). In the area, however, these soils are only shallow to moderately deep over rock.
In restricted upland areas Nitisols and Luvisols of moderate to high fertility occur over basic parent rocks (UB1) and over mudstones (US1). These soils are well drained, deep and fine-textured.
The soils of the hills are mainly (very) shallow and stony (Lithosols and some Regosols) and have steep slopes. Their agricultural potential is limited.
Various soils occur on the footslopes. The deep, fine-textured Nitisols, occurring on parent material from basic igneous rocks (FBI) are most favourable for crop production due to their relatively high inherent fertility level (favourable CEC and base saturation). The Luvisols developed on granites (FG1) are moderately fertile, whereas Ferralsols and (ferralic) Cambisols (low CEC, high phosphorus fixation) have a low fertility rating.
Most of the generally deep soils developed on recent alluvial deposits (swamps, bottomlands, floodplains, sedimentary plains, beach ridges, valley bottoms) have in common that due to their relatively low position in the landscape, their drainage is restricted and ranges from imperfect to poor. The soils of these physiographic units (gleyic, vertic, eutric and/or humic Fluvisols, Luvisols, Cambisols, Gleysols or Planosols and Vertisols) have mainly moderate to high fertility levels (favourable CEC and base saturation). Adverse characteristics may include stratification (Fluvisols), abrupt textural changes (Planosols) and heavy cracking clays (Vertisols). Locally salinity and sodicity affect the suitability of these soils. The Arenosols of the beach ridges (ZA1) are coarse-textured; hence they are not fertile and have a low moisture retention capacity. Due to their intricate distribution pattern, on the map alluvial soils could only be identified as complexes.
3.2.4 Soil catena
Crops in the target area are mainly grown on the undulating to rolling uplands. These uplands are associated with a dendritic pattern of small streams. Local soils frequently occur in a fairly regular sequence related to relief. Such soil catenas are often of major importance to local farming practices (Ahn, 1970).
38

Around Alupe a typical catena exists in which Acrisols are associated with Gleysols (Gelens and Ngari, 1973). Along the local streams there are wide zones of poor drainage ('vleis'). In-between these vleis, low almost flat to gently sloping interfluves are found. Under a soil cover of varying thickness these well drained interfluves have sheets of hardened plinthite. These may form massive crusts (locally up to 5 m thick) or may consist of loose concretions (pebbles, boulders). In the transition zone, soils with sandy loam topsoils may be found. These topsoils, consisting of colluvial material, are usually thin (20-40 cm).
The width of local vleis varies between 500-1200 m. The width of local interfluves varies between 1000-2500 m. On these interfluves homesteads and roads have been constructed. Agriculture is mainly restricted to the upland soils (plintic Acrisols). Due to impeded drainage, vlei soils (plintic Gleysols) are not cultivated. The natural clump grass cover of these vleis is used for grazing. Soils of the transition zone receive soil moisture seeping downslope from the uplands. In relatively dry growing seasons this additional seepage water is a blessing and increases crop yields. However, in relatively wet growing seasons it results in more waterlogging and total crop failures.
3.2.5 Soil fertility
Although most dominant upland soils are fine-textured, their natural fertility is low (see map legend). Intensive and continuous weathering over a long period have resulted in leaching of bases and silica. Soils are depleted and have a low base saturation. Little or no weatherable mineral is left and often kaolinite is the most abundant clay mineral. The CEC of the clay fraction is low (Buringh, 1979). Soil organic matter therefore plays an important role. Unfortunately, decomposition of organic matter is high due to favourable soil temperatures and moisture conditions combined with the high activity of many soil organisms (e.g. termites).
Chemical and mechanical soil analysis results for some locally representative trial sites are presented in Table 3.4. More information can be found elsewhere (Enserink and Rutto, 1979; Enserink et. al., 1980; Enserink and Njeru, 1981 and 1982). Table 3.4 confirms that most upland soils are fine-textured. In general soil reaction is moderately acid. Deficiencies in bases (K and Ca) do occur whereas available phosphorus is mostly deficient. Organic carbon and total nitrogen levels of these soils are low to moderate. However, C/N ratios are rather low, indicating that N-mineralization is not restricted.
Based on soil analyses alone, accurate fertilizer and management recommendations cannot be made yet. Interpretation depends on experience gained from correlating laboratory analyses with actual crop performances in the field. For Busia-Siaya far too few data are available to establish reliable correlations. Although laboratory results are useful when soils need to be compared (important for classification and mapping), not enough is known about their interpretation yet to make them of much practical value to farmers (Ahn, 1970). Deficiencies (Table 3.4) are therefore only indicative; specific fertilizer recommendations cannot be derived from them.
39

Table 3.4. Results of chemical and mechanical soil analyses for some on-farm sites representative of the Busia-Siaya target area (1981 Sorghum Regional Variety Trial).
character
P H
Na m.e. % K m.e. % Ca m. e . % Hg m.e. % Mn m.e. % P p ,p ,m. N % C % C/N ratio Hp m.e. %
% Clay * Silt * Sand Texture
Busia Alupe
5.5 0.04 0.34
4.20 2.30 0.76
12 0.19 1.72 9.1 0.1
42
26 32
C
District Murumba
5.0 0.02 0.22 1.30
1.70 0.88
10 0.13 0.98 7.5 0.3
44 24 32 C
Nangina
5.3 0.04 0.24 1.10
2.40 0.96 6 0.18 1.72 9.6 0.3
36 36 28 CL
Siava Si ay a
4.7 0.12 0.28 0.70 1.60 1.06
10
0.13 0.92 7.1 0.9
48 14 38 C
District Kabura
6.0 0.32 0.28 5.80 4.00 0.38
12 0.12 0.77 6.4 n.a.
34
14 52
SCL
Bondo
5.8 0.06 0.14 3.20 1.70 0.49
26 0.12 1.07 8.9 n.a.
30
26 44 CL
Gobei
5.8 0.06 0.44 5.30 4.20 1.20 6 0.15 1.28 8.5 n.a.
56 14 30 C
Notes: analyses made by the National Agricultural Laboratories, Nairobi; possible deficiencies for crop production are underlined.
As few and scattered results of soil analyses and tests were available for the Busia-Siaya area in 1978, collaboration between the Kenya Soil Survey and the Project provided a unique opportunity for a systematic increase in agricultural knowledge of local soils. The more accurate soil descriptions and maps (presented by the KSS), assisted us in deliberately siting our experiments on dominant local soils. Our large-scale testing programme made it possible to combine field crop yields with laboratory soil analysis results.
3.2.6 Water storage capacity
A crumbly, porous topsoil in which air and water can freely circulate, has about 50% of its total volume occupied by solid materials and the other 50% by pores (Aim, 1970). Bulk density (i.e. the ratio of dry weight of the soil to the weight of the same volume of water) for such a typical topsoil is low (about 1.2). A typical bulk density for a non-gravelly subsoil is higher (about 1.6). In gravelly and stony subsoils it is even higher (about 2.0).
Investigations (G.O. Machiemo, KSS, unpublished work) into some representative upland fields around Alupe with moderately deep, clayey soils showed that bulk densities were about 1.2 for thin topsoils and 1.3 for subsoils. The porosity obtained from moisture determination at saturation point (pF 0) was about 49% for topsoils and 47% for subsoils. Results of bulk density and porosity analyses indicate that from a physical point of view local upland soils may be classified as highly productive. These results are in line with those reported for Acrisols in the Kisii District (Wielemaker and Boxem, 1982).
The water held at field capacity depends not only on the porosity but also on the content of clay and humus colloids (Ann, 1970). As local upland soils are low in
40

organic matter (Table 3.4) and kaolinite is the dominant clay mineral, there is far less water available for plant growth than the soil texture analysis indicates.
In principle all water held between field capacity (pF 2.0) and wilting point (pF 4.2) is available for plant growth. However, water near wilting point is not readily available. In Kenya the moisture content at pF 3.7 is often used as a more conservative estimate for the upper limit. The amount of water held between pF 2.0 and pF 3.7 is called 'Readily Available Moisture (RAM)'. Extensive research on RAM of soils in Kenya showed that the volume percentage of water held in the topsoils belonging to the Ferralsol-Acrisol soil classification group was only about 14% (Siderius and Muchena, 1977). Wielemaker and Boxem (1982) reported a slightly higher percentage (16%) for the topsoils of Acrisols in Kisii.
Investigations into some representative upland fields around Alupe with moderately deep clayey soils (G.O. Mochiemo, KSS, unpublished work) confirmed these low volume percentages indicating that the capacity of local soils to store water is limited. Even lower volume percentages were found on gravelly soils.
Soil depth determines the rooting possibilities for plants and, thus, also the amount of moisture available to plants. Although root density in the deeper soil layers is scarcer and moisture uptake is less intensive, stored moisture at deeper layers may contribute substantially to crop production. Siderius and Muchena (1977) estimated that from the subsoil layer between 50-100 cm a maximum of 50% of stored water is readily available to most crops. This maximum for the subsoil layer between 100-200 cm is 25%. Based on these assumptions the total amount of moisture readily available to crops can be calculated in relation to soil depth. Table 3.5 presents the results of such calculations for soils from the Ferralsol-Acrisol classification group. Results of field tests on Acrisols in the Kisii District are juxtaposed (Wielemaker and Boxem, 1982).
Table 3.5. Maximum
soils belonging to
class name
shallow moderately deep deep
total amount of different depth
soil depth (cm)
up to 50 up to 80 up to 120
soil moi classes.
sture readily available to
total RAM (mm) Ferralsol-Acrisol group
70 91
112
crops grown on upland
Kisii-Acrisols
80 110 150
Table 3.5 indicates that with an increase in soil depth, RAM values calculated for the Ferralsol-Acrisol group become increasingly lower than those reported for field tests in Kisii. It is unknown whether this is due to systematic errors or to actual differences in subsoil composition (gravel). Subsoils around Alupe are known to be gravelly; the amount of plinthite pebbles increases to 90% usually between 50 and 80 cm (Gelens and Ngari, 1973). This coarse material is of no value to crops as it does not store moisture. Due to the high gravel concentrations in local subsoils, use of the more conservative moisture availability estimates (Table 3.5) is appropriate.
41

3.2.7 Drainage
Poorly drained soils occur in valley bottoms and on the lower slopes of soil catenas. At the current stage of technology these seasonally waterlogged areas (see soil map) are not used for crop production. Its vegetation plays an important role in dry season cattle feeding.
Due to increased population pressure, cultivation of the lower catena slopes has been initiated. The rate of success depends on the amount and intensity of rainfall. Around Alupe and Nambale we observed that farmers obtained high yields from the lower slope fields in relatively dry growing seasons. However, in wet seasons the fluctuating water-table came close to the surface and total crop failures occurred. Seepage water amounts are responsible for these seasonal differences.
Soils developed on the upper and middle slopes of a catena are well drained; their porosity is relatively high. However, when these soils are shallow due to massive layers of hardened plinthite, drainage is impeded in many places, especially in the higher rainfall Zone B. In such fields drought stress and waterlogging may occur in the same season. Crop performance is highly variable which is reflected in high coefficients of variation for individual trial sites.
3.3 PESTS, DISEASES AND WITCHWEEDS OF LOCAL CEREAL CROPS
3.3.1 Introduction
Agriculture in Busia-Siaya is influenced by the incidence of pests and diseases. High humidity and temperatures favour their multiplication. As the dry seasons are rather short, drought does not entirely control pest and disease populations. Close seasons (when cropping of a particular crop is forbidden by law) seems to be an attractive solution but their implementation is difficult in situations where small-scale production dominates. If a pest or disease has many alternative hosts, close seasons may even be of no value at all. For instance American bollworm {Heliothis armigera), a major local cotton pest, also feeds on maize and sorghum. Many local pests and diseases are frequently reported in publications (e.g. Acland, 1973). Others, often more important to understanding local farmers practices, are less well described. For instance, our on-farm trial programme revealed that crop establishment is more difficult for maize than for sorghum or finger millet. Particularly in fields further away from homesteads and adjacent to either bush or valley bottom lands, germinating maize seeds are dug out by e.g. rats, ground squirrels, birds and monkeys. Only germinating maize seeds appear to be big and tasty enough to attract these animals. We learnt that on such fields it is difficult to establish maize crops, even if repeated resowing is carried out. Therefore many farmers are planting maize closer to their homesteads. Planting of maize is then preceded by sorghum and finger millet. Due to this time-lag more alternative animal food is available by the time maize will be sown.
42

The Busia-Siaya target area is a 'hot spot' for identifying tolerance or resistance among sorghum lines to pests, such as sorghum midge (Contarinia sorghicola), shoot fly (Atherigona soccata) and stem borers (e.g. Chilo partellus) and to diseases, such as smuts (Sphacelotheca spp.), leaf blight (Helminthosporium turcicum), anthracnose (Colletotrichum graminicola) and grain moulds (Rana et al., 1980). Local maize crops, particularly in the second rains, suffer from damage by stem borers (e.g. Busseola fusca) and the incidence of the maize streak virus (transmitted by Cicadullina leafhoppers).
The influence of birds and storage pests on local cereal cropping systems was described earlier (Chapter 2.3). In this chapter attention is focused on other locally important pests (shoot fly and sorghum midge) and parasitic weeds (Striga spp.), which are playing an important role. However, this does not mean that from the start of the programme in West Kenya their role in shaping cereal cropping systems was well understood. Selection of shoot fly, sorghum midge and Striga is based on hindsight. The following descriptions are based on information which was or became available in the course of the Project.
In Kenya basic research on shoot fly was initiated by the International Centre of Insect Physiology and Ecology (ICIPE) at Kibos (Kisumu District) and Nairobi in 1974. In 1978 ICIPE established a field station at Mbita Point in West Kenya (South Nyanza District). This station became the centre of ICIPE's sorghum shoot fly project. Since then, basic knowledge on shoot fly has increased rapidly. In 1980 ICIPE organized an international workshop on the biology, ecology and control of the sorghum shoot fly. Its proceedings were published in a special issue of the journal 'Insect Science and its Application (1981: Volume 2; No 1/2)'.
Nevertheless, the amount of applied research on shoot fly, aimed at resolving specific constraints within the context of local fanning systems, is still rather limited. Applied research is not a priority among international institutes; by tacit agreement this is the domain of national institutes.
Basic and applied knowledge of the occurrence and incidence of the sorghum midge and Striga spp. are limited for the East Africa situation. No international institute is covering these issues and there is a shortage of funds and trained staff at national institutes. Although there has been a growing awareness, particularly for Striga, no specific programmes were initiated in the course of the Project.
Production losses due to midge are often underestimated. Davies (1982) states that midge was repeatedly missed by trained biologists and the damage it caused was reported as ranging from hail to blight. He further argues that the situation in East Africa has not been looked at objectively since 1960 (for instance by Nye, 1960). A shift in pest complex may have occurred as was the case in India, after the introduction of early-maturing sorghums (Rao, 1982).
43

3.3.2 Shoot fly - a review
Shoot fly (Atherigona soccata) is confined to Africa and Asia and does not occur in the Americas and Australia. By larval feeding it destroys the growing point of seedlings, causing a typical deadheart symptom (ICIPE, 1978; Teetes et al., 1983).
Biology and ecology
The fly deposits small eggs singly on the undersurface of leaves (Photo 6). After hatching (2-3 days), the larva enters the plant through the whorl and destroys the growing point. Two days later the deadheart symptom is visible (Raina, 1981a). For 6-10 days the larva feeds on decaying tissue. Pupation takes place either in the plant or in the soil. The pupal period also lasts 6-10 days. The life cycle is completed fastest when temperature and humidity are high. To develop from egg to fly takes 17 days at 30 °C and 90% RH, and 34 days at 20 °C and 30% RH (Doharey et al., 1977). During the life span of a female fly about 80 eggs are laid (Raina, 1982); 90% of these eggs are laid within the first 20 days.
Certain leaves are preferred for oviposition. Ogwaro (1978) found eggs to be distributed as follows (1st is the oldest leaf): 5th (54.1%), 6th (28.5%), 4th (13.3%), 3rd (3.2%), 2nd (0.5%), 7th (0.4%) and 1st (0.1%). On young seedlings (2 leaves) the leaf of oviposition is not important; the result is always a deadheart. On older seedlings, eggs laid on the 4th and the 5th leaf result in more damage than eggs on older leaves. The young larva has to eat through less plant material to reach the growing point (Sukhani and Jotwani, 1979). With low infestation, one egg per plant is deposited; further egg laying seems to be deterred by a persistent chemical substance secreted during oviposition (Raina, 1981b).
Young seedlings die after deadhearts have been formed. Older seedlings develop two side tillers in the two weeks following the formation of deadhearts (Sukhani and Jotwani, 1979). Plants infected after the 6th leaf stage escape damage as larvae are unable to reach growing points (Young, 1981).
Shoot fly survives dry seasons by larval and pupal aestivation (Ogwaro, 1979; Young, 1981) and by maintaining low population levels on: - alternative host plants. Wild sorghums are often involved such as Sorghum
halepense in India (Davies and Seshu Reddy, 1981). At Alupe, eggs were laid on Sorghum arundinaceum, confirming findings of Delobel and Unnithan (1981);
- regrowth of stubble ('unintended ratooning') or seedlings (germinated from shed grains) on old sorghum fields.
The incidence of shoot fly is correlated with the rainfall pattern and cultivation of sorghum. In the dry season, the shoot fly population is small due to low air humidity and absence of young sorghum seedlings. After the onset of the rains, however, humidity increases rapidly, activating pupae in aestivation. Ogwaro (1979) found that in West Kenya the peak for fly appearance occurred a few days after the onset of the rains; the peak in the number of flies present, occurred
44

4-6 weeks later. On early planted sorghum crops the first flies will deposit their eggs; 3 weeks later the second generation will heavily infest later planted crops (Young, 1981; Adesiyun, 1981; Taksdal and Baliddawa, 1975). This indicates that if conditions are favourable and sorghum seedlings are present during a prolonged period of time, a rapid build-up may occur.
Control
Cultural practices To control shoot fly it is often recommended to sow within 2 weeks after the onset of the rains. Shoot fly incidence is also lower in areas where a single crop of sorghum is grown annually. If labour is cheap as in India, sorghum may be sown with a high seed rate (10-15 kg/ha) and thinned later whereby infested seedlings are removed and buried (Jotwani, 1981a). This prevents a quick population build-up, but is only practical if infestation is low and if it is practised on a large scale. Removal of wild sorghums and general hygiene on old sorghum fields (removal of stubble) are also reported as cultural control methods.
Biological control Little research has been conducted on this control method. Some predators and parasites have been identified; they partially (<35%) control shoot fly (Jotwani, 1981a). Additional research is required.
Host plant resistance More knowledge on host plant resistance to shoot fly has been acquired. Complete resistance has not been discovered yet. Some varieties show a moderate degree of resistance which is stable across environments. This partial resistance is based on (Jotwani, 1981b; Seshu Reddy, 1982): - Non-preference. Fewer eggs are deposited on resistant plants than on susceptible
ones. Plant characteristics responsible include: (1) presence of trichomes (minute hairs) on the leaf surface, and (2) yellowish green glossy leaf appearance;
- Antibiosis. Certain negative effects on survival and development of larvae are observed when they feed on resistant plants. Various causes are responsible for this: (1) unbalanced and low nutritional value of larval food, and (2) physical barriers in plants hampering larvae to reach the growing points e.g. density of silica bodies in leaf sheaths and lignification and thickness of cell-walls;
- Recovery. In this type of resistance, first observed by Doggett and Majisu (1966), killing of central shoots results in rapid tillering and side tiller survival so that yields are little affected. The cultivar Serena possesses good recovery resistance; that for 'Dobbs' is intermediate (Taksdal and Baliddawa, 1975).
Due to development of reliable screening techniques (Agrawal and House, 1982) some resistance sources have become known. Shoot fly resistance can be transferred from donor parents and maintained in successive segregating generations. As shoot fly resistance is polygenic in nature and is governed by additive genes, breeding for resistance is a gradual process depending on accumulation of desirable alleles (Rana et al., 1981). Development of resistant, high yielding sorghums is time-consuming and requires experienced breeders.
45

Chemical control Chemical control of shoot fly can be practised by means of: - foliar application of insecticides by spraying; - whorl or soil application of granular systemic insecticides; - seed treatment with systemic insecticides. Foliar applications are less effective. Some granular insecticides are very effective but expensive. Seed treatment is inexpensive and provides adequate control in India (Jotwani, 1972; Kulkarni and Jotwani, 1978).
Actual data on losses due to shoot fly are hard to establish. Clearly, early sown crops are only slightly damaged (Photo 7). Such attacks are even considered beneficial as damaged plants are encouraged to tiller early and produce more panicles before drought conditions set in (Pury, 1978). Such reports have led to a general underestimation of the pest's importance.
In later plantings, when the shoot fly population has increased, the attack can be devastating. The crop continues to tiller but these tillers are attacked in turn. The plant develops into a tussock of shoots with numerous deadhearts (Photo 8). The general crop appearance becomes very irregular with plants either not heading or heading at different times (Swaine and Wyatt, 1954; Doggett, 1970). In such cases chemical control seems justified.
Attempts to establish economic threshold levels for chemical control showed these thresholds (expressed in % deadhearts) to be location-specific (Rai et al., 1978a and 1978b; Davies and Jowett, 1970), depending on: - local management and yield levels for sorghum cropping; - relationships between yield and level of attack; - availability and type of chemical for shoot fly control; - field prices for sorghum grain and control treatment (inputs and labour). In India under high management and yield levels, the 1978 deadheart threshold level was 8-15% for soil applications with disulfoton granules; for a carbofuran seed treatment it was only 3-4% (Rai et al., 1978b).
3.3.3 Sorghum midge - a review
The sorghum midge (Contarinia sorghicola) is a pest in all sorghum areas of the world. By larval feeding it prevents normal grain development. Spikelets are empty or contain shrivelled grains. With heavy infestation it looks as if whole panicles have failed to set seed (the typical blasted panicle symptom; Teetes et al., 1983).
Biology and ecology
Adults are small (1.5 mm). During its short 1-day life, the female adult lays about 75 eggs (Walter, 1941; Taley et al., 1971). Ovipositors can only be inserted during flowering (Photo 9) when glumes are parted by protruding anthers (Walter, 1941; Harris, 1961). After hatching (2-3 days), the larva feeds on the ovary for 9-11 days. Pupation occurs beneath the glume. The pupal period lasts about 3 days.
46

Optimum temperatures for adult emergence range from 20-24 °C (Summers, 1975). The life cycle takes 14-25 days depending on climatical conditions.
Adults emerge soon after daybreak (Geering, 1954; Summers, 1975). After mating, female adults must find flowering panicles before egg laying starts. By mid-day (or when the weather is dull at sunset) most adults are dead. Distances covered are limited due to behaviour during oviposition and the short adult life (Wiseman et al., 1972; Roth and Pitre, 1975). Consequently, spread of infestation is restricted but may be influenced by prevailing wind directions. The infestation source is located on or near the sorghum field itself (Harris, 1976).
Midge incidence is correlated with climatical conditions (rainfall, temperature) and availability of flowering panicles. Under optimal conditions the generation cycle is completed in 14-16 days. This rapid cycle combined with the presence of flowering panicles over a prolonged period, permits 9-13 generations to occur during one season (Walter, 1941; Passlow, 1965).
Midge survives dry seasons by larval diapause when cocoons are formed in the spikelets (Harris, 1961), and by maintaining low population levels on: - alternative host plants. In most cases it concerns wild sorghums, such as
Sorghum halepense (Johnson grass), Sorghum verticilliflorum, Sorghum sudanense and Sorghum arundinaceum (Geering, 1954; Bowden, 1965);
- stubble regrowth on old sorghum fields.
In Uganda changing weather conditions activate larvae in diapause (Geering, 1954). Adult emergence starts after a 20-day period in which humidity has been high, irrespective of the length of the previous diapause period (range 120-227 days). Larvae in diapause will stay viable for at least 3 years (Passlow, 1965). Emergence is highest and incubation periods shortest with temperatures of 22-28 °C and high humidity (RH: 98-100%). When spikelets are wetted (simulating rainfall) adult emergence improves considerably. The adults will deposit their eggs on early flowering panicles of wild and cultivated sorghums; 6 weeks later the fourth generation may heavily infest any flowering crop (Teetes, 1982).
Control
Cultural practices To control midge, early and uniform planting over large areas are often recommended (Photo 10). However, when cultivars are used with different maturity lengths, flowering (and not planting) should be synchronized (Doggett, 1970). Some hygienic improvements are also helpful: - destroying larvae in diapause. After threshing, all empty panicles and chaff
should be burned, composted or buried. Spikelet residues from the previous season are the main source of midge carry-over;
- reducing sources on which the midge population can build up before attacking the main sorghum crop. This can be done by removing early flowering plants from the field itself and from its surroundings.
47

Biological control Various parasites have been identified which feed on midge, viz.: Tetrastichus spp., Eupelmus spp. and Aprostocetus spp. (Walter, 1941; Harris, 1961; Passlow, 1965; Chundurwar, 1977; Wiseman et al., 1978). In Uganda Tetrastichus sp. and Aprostocetus sp. are the dominant parasites (Geering, 1954). The midge population increases rapidly during the sorghum cropping season after which it decreases by parasite activity; percentages of parasitism increased to 100%. Therefore, in the past midge was seldom regarded as a serious pest in Uganda (Doggett, 1970). More recent reports (Wiseman et al., 1978) state that the role of parasites is more variable; between years big differences occur.
Host plant resistance Some sources of resistance are known, but complete resistance has not been identified yet. Resistance is reported for varieties with cleistogamous spikelets. The glumes in these spikelets are papery instead of indurate; the inner glume is rolled, clasping the internal flowering structures, preventing a normal opening of the glumes. It creates a mechanical barrier; midge prefers to lay eggs in spikelets with parted glumes (Harris, 1961; Bowden, 1965; Passlow, 1965). This type of resistance seems to be based on non-preference, but more research is required. However, it cannot be used to breed hybrids as the cleistogamous parent prevents production of hybrid seed (Merwine et al., 1981).
Another mechanism of resistance was identified in the non-cleistogamous cultivar AF-28. It is again based on non-preference. Although spikelets of 'AF-28' are frequently visited, few eggs are laid (Faris et al., 1979). Other varieties expressed a similar type of resistance (Harris, 1976; Page, 1979).
Due to the development of reliable screening techniques (Agrawal and House, 1982) the number of sources known to be resistant is increasing. At present such sources are used in crossing programmes to introduce a degree of midge resistance within commercial varieties and hybrids. Midge-resistant sorghum hybrids recently became available in the USA.
Chemical control Chemical control shows some inadequacies; it is directed at the adult, a non-injurious stage. The damaging larva develops in a spikelet and is well protected from sprayed insecticides. However, killing adults during flowering prevents egg laying at the time sorghum is susceptible.
Reinfestations and long flowering periods (one panicle may take 6 days and fields may require 14 days or more to flower) make control difficult (Teetes, 1982). With densities above 1 adult/panicle, repeated applications are required in the USA. Application intervals depend on actual midge densities but often a 3-5 day interval is recommended (Stanford et al., 1972; Teetes, 1982). The first spray must be applied when 90% of the panicles have appeared from the flag leaf, the second 4 days later (Doering and Randolph, 1963; Huddleston et al., 1972; Page, 1979). Recommendations are based on economics rather than on efficiency.
Other attempts to establish economic threshold levels for chemical control (expressed in number of adults/panicle) show that such thresholds are location-specific (Teetes, 1982; MacQuillan et al., 1975).
48

3.3.4 Witchweeds (Striga spp.) - a review
Maize, sorghum, bulrush millet, finger millet and other graminaceous crops can be parasitized by witchweeds. The attack causes leaf wilting and yellowing. Severely attacked plants are stunted and may die prior to seed setting.
In Busia-Siaya Striga asiatica and Striga hermonthica occur attacking cereal crops and wild grasses (Enserink and Njeru, 1981). S. asiatica is a slender erect herb with bright red flowers reaching a height of 20-30 cm. S. hermonthica is an erect herb (50-70 cm) with bright pink flowers.
Quantitative information on the local incidence of the two witchweeds was lacking. Our programme provided an opportunity for increasing the 'body of knowledge'. Cereal grain yields and witchweed counts became available from many trial sites.
Striga asiatica was often observed in our on-farm trials, but infestation levels were low (about 0.1 Striga plants per m2). We only observed heavy infestations on a field with Napier grass (Pennisetum purpureum).
Striga hermonthica is the dominant species. Some incidence results are presented in Chapter 6.3.4. Local infestation levels are often high. In our on-farm trials with 'E 525 HR' (a Sfn'ga-tolerant sorghum), the heaviest average infestation recorded was 79 plants per m2; infestations of 11-44 plants per m2 were common. Striga must no longer be considered a weed but an important local pest.
Biology and ecology
Striga seeds are minute (0.3 mm). They are produced in very large numbers (several 10,000 seeds/plant) and are dispersed by wind, water, cattle and man (Ramaiah et al., 1983). Seeds may stay viable in the soil for 15-20 years; viability is longest in soils which are usually dry (Doggett, 1970).
Due to the small seed size, short radicles (0.5-1 cm) are produced. Within a few days radicles must become attached to a host root (Ramaiah and Parker, 1982). Seeds only germinate in response to stimulants exuded by young host roots. Strigol and strigol acetate are stimulants exuded by cotton, sorghum and maize roots.
However, some additional germination requirements exist (Parker, 1983), viz. - after-ripening. New seeds stay dormant for a period of some months; - preconditioning. Following after-ripening, seeds may germinate if some
preconditions are fulfilled. A 10-15 day imbibition period under optimum temperature and moisture conditions is required, before seeds react to germination stimulants. Imbibition periods of 3 weeks or more result in a decline in germination. This is not due to loss of viability. Ungerminated seeds could be dried, preconditioned again and subsequently made to germinate. This phenomenon, called 'wet dormancy', may be the reason why Striga thrives best under intermittent dry soil conditions;
- a suitable high germination temperature (30-35 °C).
49

Once all requirements are met, germination occurs within 24 hours. The radicle grows towards the host root under the influence of a chemotropic gradient (Doggett, 1970). Host root penetration is assisted by an enzymic process (Ba, 1983). After the establishment of the first haustorium, in which vascular systems of host and parasite are linked, secondary haustoria may be produced.
Between establishment and appearance above ground ('emergence'), Striga deprives the host of water, assimilates and nutrients. Host plants are reduced in height and vigour even before Striga emerges. However, effects are out of all proportion to the amount of assimilates removed. Most damage results from creating an imbalance in the host's own growth substances; growth inhibitors increase and growth promoters decrease (Ramaiah and Parker, 1982; Ramaiah et al., 1983). However, growth of the host's shoots is more reduced than that of its roots.
After haustorial establishment, it takes 3-6 weeks before Striga emerges. On reaching daylight green leaves are developed. Although Striga is then capable of producing its own photosynfhates, the flow of water, minerals and carbohydrates from the host continues (Doggett, 1970; Ramaiah et al., 1983). After emergence it takes 4-10 weeks before seed is produced.
Doggett (1965, 1970 and 1988) reports difficulties in interpreting infestation levels from the number of emerged plants. Not all Striga plants develop far enough to appear above ground; only 10-30% emerge on heavily infested land. Moreover, the ratio between 'aerial' and 'subterranean' plants is not constant and depends on e.g. infestation level and soil fertility. Sorghum fields producing a similar number of 'aerial' plants may still carry very different total Striga populations. Field selection of cultivars for resistance should therefore be based on Striga counts in combination with yield data and observations on general agronomic expression.
Control
An effective Striga control programme (Ramaiah, 1983) includes: - elimination or reduction of Striga seed number on heavily infested soils; - prevention of further seed multiplication. Crop rotation and use of germination stimulants are the two most important methods to reduce the Striga seed number in the soil. The methods preventing further seed multiplication include: (1) hand pulling or weeding shortly before Striga plants are flowering; (2) growing resistant varieties; (3) using herbicides and other appropriate cultural practices such as high crop density, high doses of nitrogen and altered time of planting. Other reported control practices (Ramaiah and Parker, 1982) are too expensive (fumigants), often unavailable (irrigation), or not yet developed and/or understood (biological control, crop seed treatment).
Rotation Any rotation with non-host crops will reduce the Striga problem. However, there are a number of crops which are known to be more beneficial. These crops, called 'trap-crops', stimulate germination but are either not parasitized
50

or fail to support the Striga plant to its maturity (Ivens, 1975). Crops claimed to be 'trap-crops' are cotton, sunflower, cowpea, groundnut, castor bean (Ramaiah and Parker, 1982). In the case of heavy infestation it takes many years even with trap-crops to bring the population under control. In East Africa it took Doggett (1965) 5 years to effectively reduce Striga populations. He used continuous sorghum cropping in combination with hand pulling before flowering.
In some countries 'trap-cropping' is practised for the control of Striga (Doggett, 1970). On infested fields susceptible crops are thickly sown and ploughed under after only two months of growth. Many Striga seeds have then germinated and as fields are ploughed before flowering starts, seed numbers in the soil are reduced.
Stimulants Germination stimulants, to trigger suicidal germination, are used in the Striga asiatica eradication programme in the USA. Applications of ethylene destroy about 90% of the viable seed (Eplee, 1983). A disadvantage is the sophisticated equipment needed to inject ethylene gas into the soil.
Natural stimulants (e.g. strigol) are too expensive for field application. Cheaper artificial analogues (GR 7 and GR 24) are available but slightly less effective than ethylene (Norris and Eplee, 1983). Further development is warranted, especially for the potential benefit to Africa (Eplee, 1983).
Hand pulling Hand pulling is only practical in case infestations are not too heavy. Repeated rounds are needed as Striga germination, growth and flowering may continue over long periods. Removal of sorghum stubble will prevent ratoon growth and subsequent germination of witchweed seeds.
Host plant resistance Selection of resistant cultivars (Photo 5) depends on availability of reliable screening techniques. However, Striga emergence is highly affected by non-host factors e.g. soil type, fertility and rainfall. Physiological strains within a Striga species (e.g. for bulrush millet and for sorghum) complicates the situation. Striga incidence is the result of complex interactions between parasite, host and environment. A reliable screening technique should take all these factors into account; field screening seems to be the most appropriate method.
However, field screening on naturally infested fields is unreliable. This is due to non-uniformity of Striga distributions and environmental influences on Striga germination and growth (differences in fertility and water storage capacity of the soil). Field screening on naturally infested soils is therefore only meaningful if for various seasons multi-locational testing is undertaken. Field screening efficiency may be improved by (Ramaiah, 1983): - using uniform test sites (with respect to fertility and water storage capacity); - establishing uniform Striga field infestation by artificial means; - selecting a proper experimental design and evaluation criteria. However, there is scope for developing more reliable methods. Application of the three-stage screening methodology for field resistance to Striga developed at ICRISAT seems promising (Vasudeva Rao et al., 1983).
51

Laboratory and pot screening techniques were developed to overcome some of the field screening problems. However, the rate of success of screening under controlled conditions depends on the level of understanding of the specific host-plant resistance mechanism. Unfortunately, the resistance mechanism is currently only partly understood and so far three resistance mechanisms have been reported (Doggett, 1970; Ramaiah and Parker, 1982): - low stimulant production by the host resulting in low Striga germination; - mechanical barriers to haustorial establishment in host roots. Penetration beyond
the endodermis does not occur in resistant cultivars. They show marked endodermal and pericyclic thickening and deposition of silica in the endodermal cells. Thickening of pericyclic cells in response to entrance of the haustorium was also observed (Maiti et al., 1984). 'Dobbs' (one of the parents of the cultivar Serena) possesses this type of resistance (Doggett and Jowett, 1961);
- antibiosis factors in hosts operating after Striga establishment.
In 1975 screening for low stimulant production started at ICRISAT (India). Many lines resistant to Striga asiatica were identified. In 1979-80 these were tested for resistance to Striga hermonthica by the ICRISAT/Upper Volta Striga Programme in Africa. Some resistant lines were identified.
However, little is understood about chemical and mechanical barriers hampering parasite establishment and growth. Identification of lines possessing these mechanisms and an understanding of their interactions with other mechanisms would assist breeding (Vasudeva Rao et al., 1983). Rapid progress in breeding for Striga resistance cannot be made as yet. The transfer of resistance from source lines with a poor agronomic background to agronomically elite lines is time-consuming. Absence of reliable techniques to screen segregating progenies for individual plants resistant to Striga poses a constraint (Ramaiah and Parker, 1982; Vasudeva Rao et al., 1983).
Development of random-mating populations (based on resistant and agronomically elite lines and the use of male-sterile genes) followed by a recurrent selection scheme on Striga infested fields was suggested as a method to stimulate progress in breeding (Ramaiah and Parker, 1982).
Herbicides Identification of selective herbicides has not been successful yet. Timely application of 2,4-D to cereal crops at the time of Striga germination may partially prevent emergence. Later applications of 2,4-D may kill emerged plants thus preventing seed multiplication. The USA programme identified some other effective herbicides (paraquat, trifluralin, oxyfluorfen; Eplee, 1983). For African mixed crop situations the use of 2,4-D is not safe. Other herbicides (ametryne, bromoxynil, linuron) are suggested for direct spot-spraying (Ogborn, 1972).
Cultural practices Some cultural practices are said to reduce Striga incidence. Planting of crops at the time of continuous rainfall is one option. The intermittent drying cycles (often occurring at the start of the rains) favouring Striga incidence are avoided (Ramaiah and Parker, 1982).
52

Another beneficial practice concerns the establishment of high plant populations. Through these dense populations shading of the soil will increase and occur earlier in the season. Soil temperatures will drop earlier, probably to lower levels, which may cause less Striga seed to germinate.
The influence of soil fertility on Striga incidence is not clear. Many researchers state that low fertility encourages Striga infestation. Stoop et al. (1983) report that Striga-affected areas in Ghana are associated with the less fertile soils (low organic matter content, coarse texture). Such soils are also more prone to moisture stress; the chance of breaking the 'wet dormancy' is high. Consequently, crops are not only suffering from increased moisture stress and lower soil fertility but also from increased Striga attacks. Fertilizer and manure applications to infertile soils not only increase crop yields but often also cause more Striga plants to emerge (Doggett, 1970). A stronger host may support more 'aerial' Striga plants.
High levels of nitrogen application are often reported to reduce Striga incidence (Bebawi, 1981). The role of N in suppressing Striga is not exactly known. Possibilities suggested include (Ramaiah and Parker, 1982): - reduced exudation of host stimulants; - changed host physiology reducing susceptibility to attachment; - reduced Striga germination and radicle length (Pesch et al., 1983); - reduced root/shoot ratios of the host together with a reduced flow of
photosynthates to the root; - increased crop leafiness resulting in increased shading and lower soil
temperatures, less optimal for Striga germination.
Obilana (1983) reviewed such studies and concluded that applications of 100-200 kg N/ha were required to substantially reduce Striga infestations. As Striga is mainly a problem in drier areas, crop response is not assured as N uptake depends on moisture availability. Economic and risk considerations will therefore often prevent such high levels of N application.
3.4 IMPLICATIONS FOR CEREAL CROPPING, YIELDS AND RESEARCH
Most dominant upland soils in Busia-Siaya are shallow (20-50 cm) to moderately deep (50-80 cm). Consequently, the occurrence of moisture stress is strongly related to actual depth of local soils and determines local crop production. Using data from Table 3.5, the maximum number of dry days can be calculated before local crops are affected by moisture stress. Results for maize in its mid-season stage of peak water requirements, are presented in Table 3.6. At Alupe, maize needs about 50-55 mm (June) and 65-70 mm (October-November) of moisture per decade during this stage.
Table 3.6 shows that maize can only survive for limited periods of time on moisture stored by local soils. When these results are combined with those of the
53

dry spell analysis (Figure 3.6), it is evident that drought-resistant crops are to be recommended for the second rains. For the first rains, maize should be managed in such a way that critical growth stages coincide with periods of reliable rainfall.
However, on shallow soils or on moderately deep soils with gravelly subsoils, cropping of maize is risky even during the first rains. During the second rains, no crops should be grown on these soils; their moisture storage capacity is too low and the risk of 10-day dry spells is too high for successful cropping.
Table 3 without
6. Number of dry days, maize in its mid-season growth stage can being affected by moisture stress on fully charged upland soils
soil depth in (cm)
30 50 80
120
maximum total readily available moisture (mm)
42 70 91
112
number June
8 13 17 21
of days
continue to grow of varying depth.
rfithout moisture stress October-November
e 10 13 17
However, the extent to which moisture stress affects crop production, does not only depend on the crop species grown (e.g. maize or sorghum); it also depends on the type of variety planted. Late- (e.g. 150-day) and early-maturing (100-day) varieties differ not only in length of growing periods but also in the timing of occurrence of critical growth stages. This is an important management tool when attempts are made to synchronize critical growth stages with periods of reliable rainfall.
3.4.1 Crop suitability, variety choice and potential yield expectations
Optimal water requirements for maximum production of crops and varieties can be calculated using specific water requirement curves. These curves define the water requirements during the various development stages of each specific crop (Doorenbos and Pruitt, 1977). When optimal water requirements are not met, moisture stress develops and crop production is affected. Actual evapotranspiration (ETa) falls below maximum evapotranspiration (ETm) and consequently the actual yield (Ya) will be lower than the potential maximum yield (Ym). Doorenbos and Kassam (1979) quantify the response of yield to a deficit in water supply through the yield response factor (ky). This factor relates the relative yield decrease (1-Ya/Ym) to the relative evapotranspiration deficit (1-ETa/ETm), as follows:
(1 - Ya/Ym) = ky (1 - ETa/ETm) The ky values for most crops assume relationships between relative yield (Ya/Ym) and relative evapotranspiration (ETa/ETm) to be linear and valid for water deficits of up to about 50%.
A water supply deficit may either occur continuously over a crop's total growing period or in any one of the individual growth periods, viz. establishment, vegetative, flowering, yield formation and ripening. Table 3.7 presents the yield response factor (ky) values for maize and sorghum.
54

Table 3.7 shows that when water supply deficits are evenly distributed over the total growing season, the yield decrease for maize (ky = 1.25) is greater than for sorghum (ky = 0.9). Yield responses to water deficits in specific growth periods also differ substantially between maize and sorghum. Synchronization of the flowering period with the most reliable rainfall decades is more important to cropping of maize (ky = 1.5) than to sorghum (ky = 0.55). This must be taken into account in local decisions on the most suitable crop calendar.
Table 3.7. Yield response factors (ky) of maize and sorghum for specific individual growth periods and the total growing period.
crop
maize sorghum
specific individual qrowth vegetative flowering
0.4 1.5 0.2 0.55
period yield formation
0.5 0.45
ripening
0.2 0.2
total growing period
1.25 0.9
Note: based on Doorenbos and Kassam (1979).
A model for calculating yield reductions due to water supply deficits for crops in Kenya was published by Jaetzold and Schmidt (1982). In their model, calculation of the actual water supply is based on a decadal moisture availability analysis; calculation of the optimal water supply for maximum production is based on crop specific water requirement curves (Doorenbos and Pruitt, 1977). Resulting water supply deficits are used to quantify yield reductions whereby crop and growth period specific yield response factors (ky) are used (Doorenbos and Kassam, 1979).
Inter-annual distribution of yield reductions for different crops may be used to establish yield expectation probabilities. Yield expectation is claimed to be a good indicator for suitability and potential of a particular crop species or variety within a certain agro-ecological zone. Yield expectations of late-, medium- and early-maturing varieties of sorghum and maize for the target zones, are presented in Table 3.8. They are representative of soils which are moderately deep (50-80 cm).
Table 3.8. Average yield expectations, as a percentage of the potential maximum yield, for different sorghum and maize types in the B and C target zones of Busia-Siaya.
crop type
sorghum: 150-day 120-day 100-day ratoon (#)
maize: 150-day 120-day 100-day
First rains Zone B wetter parts
70-80 >80
*
60-70 >80
*
drier parts
60-80 >80
*
60-70 60-80
*
Zone c wetter parts
* 70-80
>80
40-60 60
60-80
drier parts
40
* * 60
* *
-50
Second Zone B wetter parts
* 60-80
* 60-80
40-60 60-80
*
rains
drier parts
* 40-60 60-80 60-80
* 20-40 40-60
Zone C wetter parts
* *
40-60 40-80
* *
20-40
drier parts
* * * *
* * *
Notes: based on Jaetzold and Schmidt (1982); *: not calculated due to existence of better alternatives or crop failures (yield expectation below 20%); (#): of a 120-day variety.
55

Table 3.8 indicates sufficient agro-climatic scope for the introduction of earlier maturing varieties. They will usually enhance the reliability of crop production.
Yield results from the Village Approach Programme (Chapter 9) can be used to get an impression of potential maximum yields from 120-day sorghum varieties. The highest grain yield recorded was 7410 kg/ha. It was obtained from a large field that had been fallowed for many years. The field's soil fertility was high, its soil depth exceeded 100 cm, and Striga infestation was low. Crop husbandry practices (land preparation, time of planting and weed control) were about optimal.
Although useful information is presented in Tables 3.7 and 3.8, its value should not be overestimated. For instance, presented results are derived from situations in which crop production is only limited by the supply of water; all other management practices are optimal. Moreover, only average yield expectations are presented; their variability is not shown. Consequently, these expectations only indicate what is climatically possible on average, when all other conditions (e.g. sowing date; soil fertility; control of weeds, pests and diseases) are optimized.
However, in the rainfall dependent cropping systems of Busia-Siaya, many farmers are unable to optimize all other conditions. Local relevance of these potential maximum yield models is therefore questionable. As these models optimize production from an agro-climatic point of view, they take insufficient notice of technical and non-technical constraints faced by farmers. In actual situations, it is often more relevant to know the performance of crops when conditions are not optimal. For instance, many local farmers are unable to optimize their planting dates due to constraints on timely land preparation. To them, it is more relevant to know the response of crops (e.g. maize and sorghum) to staggered plantings, instead of knowing that the optimal time of planting for all crops coincides with early March.
Although 60% probability presentations (such as Figures 3.2 and 3.3 and Tables 3.2 and 3.3) present more useful information than just average data presentations, their value should not be overestimated, either. Though more conservative and therefore less risky than average presentations, these probability presentations also present only one figure per characteristic; their variability is still not shown.
A quantification of variability is often essential to understanding farmers way of organizing their cropping systems. Only through more detailed studies can the variability and uncertainty farmers have to face, be fully grasped. For instance, the detailed Alupe presentations indicate that (depending on grass rains) three types of first-rain cropping seasons have to be distinguished. The corresponding length of the growing period for cereal crops varies from short (80 days) to very long (190 days). To understand local sorghum management practices, these discoveries proved to be much more valuable than probability analysis results. In Chapter 4 the consequences of such variability for local cropping systems are described.
In actual situations, potential maximum yield models may help to find some fundamental explanations for better understanding present management strategies
56

and local farmers production techniques. However, to design improved farming systems based on results from agro-climatic models alone, is too risky as only some of the factors, which are shaping the farming system, are included.
3.4.2 Major agronomic constraints and research on possible solutions
Moisture stress The occurrence of moisture stress is a major constraint determining local cereal cropping systems. In addition to rainfall, soil depth plays an important role. Most local soils are shallow (20-50 cm) to moderately deep (50-80 cm). As farmers cannot alter soil depths, they manage their cropping system in such a way that effects of moisture stress are minimized. We found that local farmers often prefer to grow maize on fields with deeper soils; sorghum crops are often planted on fields with shallower soils. We presume that shallowness of local soils is a major reason for sorghum to continue to play an important role in cropping systems of the higher rainfall parts in Zone B.
Soil fertility Another major constraint on cereal production is the low natural soil fertility of local upland soils. Possible solutions may be the use of manure and chemical fertilizers. However, not all households have access to manure, and local cash availability is restricted. Our research programme tried to develop locally adaptive recommendations (Chapters 5.2.5 and 8.2).
Witchweeds Striga hermonthica is an important local pest. Its incidence is the third major constraint on local cereal cropping systems. Hence, Striga control in West Kenya is urgently required. However, as local farmers operate close to the subsistence level and have limited cash, options for Striga control are limited. The local control approach must be based on an integrated strategy, combining only those components that seem feasible: - use of resistant maize and sorghum cultivars; - prevention of seed multiplication by pulling or weeding of Striga plants before
they flower. Fewer plants have to be pulled if resistant cultivars are grown; - rotation of cereals with cotton to trap some of the Striga seed; - stubble removal of sorghum after harvest to prevent regrowth on which Striga
can complete its life cycle.
In our research programme we investigated the spread of Striga infestation and its infestation levels on local fields. Its effect on maize and sorghum production was studied (Chapter 6.3.4). Effects of cultivation, fallow periods, and local weeding regimes on Striga incidence were also studied (Chapter 8.3). Based on these studies we tried to develop locally adaptive recommendations for its control.
Pests The fourth major constraint on sorghum production is the potential threat of pests when plantings are delayed. We anticipated that in the Busia-Siaya target area, favourable conditions exist for rapid population build-up of shoot fly and sorghum midge at the start of the first rains and probably also at the start of the
57

second rains. Local approaches to controlling shoot fly and midge have to be based on integrated strategies that combine some of the known control components.
Potentially relevant components for shoot fly control in Busia-Siaya comprise: - planting of crops within two weeks after the start of the rains to escape damage.
Late or staggered plantings in a village or group of villages must be discouraged;
- growing of relatively resistant, high yielding sorghum cultivars; - using higher seed rates followed by removal and burying of two-week old
infested seedlings; - using chemicals in judicious and safe manners when planting is delayed.
Potentially relevant components for midge control in Busia-Siaya comprise: - synchronization of flowering of sorghum crops on neighbouring fields.
Flowering periods within fields must also be kept as brief as possible to prevent internal reinfestations;
- early sowing, which permits flowering to occur before damaging midge infestations develop;
- destruction of panicle residues (after harvesting or threshing) before larvae will emerge from diapause;
- removal of infestation sources from the field itself or its surroundings; - growing of more resistant sorghum cultivars, if available.
In case midge still reaches the local economic threshold level, chemical control may be implemented. With mild infestations one application following the appearance of panicles is sufficient. With heavy infestations two applications are required. For the USA and Australia such applications are economically feasible. However, for small-scale farming situations in West Kenya, it is questionable whether chemical control is to be recommended. Practicability and economic feasibility are doubtful.
One of our tasks was to determine if and when shoot fly and midge actually pose a threat to sorghum production in the target area (Chapter 7.2). Due to low use of external inputs in local agriculture, our programme focused on pest control strategies through cultural practices (Chapter 7) and use of inexpensive seed treatments (Chapter 8.5).
58

4. BUSIA-SIAYA FARMING SYSTEMS
4.1 HISTORY OF LOCAL FARMING SYSTEMS
4.1.1 Socio-cultural setting
Due to variations in the agro-ecological setting of West Kenya, a number of target zones were identified for crop production (Zones A, B and C; Chapter 2.4.2). However, socio-cultural and historical factors account for additional variations in farming practices. These are associated with the presence of several ethnic groups, viz. the Iteso, the Abaluyia and the Luo. Figure 4.1 shows their distribution.
iifiili! «•••••...;.;.;.;;.;;;.;...• / " v - g
wm
l l l Y A
HI ).*• Alupe
ABALUYIA Kakarnega|
N | 20 km
LUO
Figure 4.1. Distribution of the Iteso, Luo and Abaluyia in West Kenya.
For centuries West Kenya and East Uganda have been characterized by migrations (Ochieng', 1974). Around the 1850s their population had grown to such an extent that hitherto migratory groups began to stake out permanent claims to land and to defend these claims against new arrivals. The 'age of confrontation' had started.
In the 17th century, ancestors of the 'Nilotic' Luo and the 'Bantu' Abaluyia were already occupying large stretches of Busia-Siaya. In the 17th and in the 18th century the Luo population increased considerably. Early in the 19th century the Luo expanded northwards into territories of the Abaluyia. The 'Nilo-Hamitic' Iteso arrived in West Kenya from Uganda in the middle of the 19th century, fighting for land with the Abaluyia (Were, 1967a).
59

There were famous blacksmiths among the Abaluyia (Osogo, 1966). Their agriculture was modernized as a result of the adoption of locally made iron hoes. The Luo and Iteso, who were pastoralists and thus more mobile (Webster et al., 1973), started using these tools at a much later stage. During the 'age of confrontation' the settled agricultural communities of the Abaluyia were more vulnerable; much of their territory was occupied by the Luo and Iteso (Were, 1967a and 1967b). However, the vulnerability of the Abaluyia must also be attributed to poor military organization and lack of unity. However, more effective fighting techniques by the Abaluyia and pacification efforts by the British administration at the start of the 20th century, put an end to further expansionist ambitions of the Iteso and Luo.
4.1.2 Evolution of farming systems
The 1900-1950 period
At the beginning of the 20th century all three ethnic groups had more or less developed cereal cropping systems based on finger millet and sorghum (Osogo, 1966; Ochieng', 1974; Were, 1967b).
Under British administration agriculture was further developed. Cheap iron hoes became available to all tribes and crops, such as cassava and sweet potatoes, were introduced as an insurance against famine and failure of cereal crops. Especially cassava fitted well within the existing crop rotation cycle; it became the last crop before the start of the fallow period. In some areas administrative pressure was exerted on heads of households to grow an acre of root crops each year and to initiate compulsory storage of grain (Uchendu and Anthony, 1975).
In the 1910-20 period the plough was introduced. Ox ploughing became increasingly important as a method of land preparation especially among pastoralists (Teso and Luo) where cattle were abundant and lower population densities allowed larger areas to be cropped.
Cotton was introduced in the same period as the plough. Cotton cultivation in Uganda and Kenya was stimulated by the need to pay hut and poll taxes. To pay for these taxes, local households were forced to grow cash crops or to go and work on European farms (Winston Cone and Lipscomb, 1972). The Teso in particular took up cotton growing. The Abaluyia became more involved in wage employment; in Kakamega District male out-migration accounted for 30% in 1937 and had doubled by the 1950s (Staudt, 1985).
Maize was also introduced in the early part of the 20th century. Varieties grown by European settlers became genetically mixed and were grown as local maize varieties by many smallholders. The adoption of maize was fastest and most wide-spread among the agriculturally oriented Abaluyia. It was stimulated by their exposure to maize. Since 1922 all employers (railway, Government, plantation industries, large-scale farms) had to provide their labourers with daily rations of maize. Smallholder maize production in Kenya was stimulated during the Second
60

World War when guaranteed high prices were offered for maize. The Abaluyia increased production and they became maize exporters.
Contrary to the Abaluyia, ox ploughing became common among the Teso and Luo. As rainfall in both seasons is more reliable in the Teso area, the Teso could develop a cropping system based on large fields of finger millet (in the first rains) and cotton (in the second rains). As security crop cassava became important partly substituting sorghum. The Luo could not rely on this system as rainfall in their area is less reliable. Ecological conditions and food security objectives forced the Luo to grow large fields of sorghum and cassava. In addition, sweet potatoes and finger millet cropping were practised, but in many areas gradual substitution of finger millet by early maize varieties was started. Although the Luo were also involved in cotton cultivation, they planted cotton at a much earlier date (during the first rains) than the Teso. Their cotton crops could not entirely depend on the second rains as these are far more unreliable. This created a labour constraint as weeding of food crops (e.g. sorghum) competed with planting of cotton. As food crops were given preference, cotton cultivation among the Luo never became as important as among the Teso.
Hand hoeing remained the major land preparation method among the Abaluyia. With fewer cattle and less land available, the Abaluyia could not increase their agricultural output by adopting ox-ploughs to cultivate larger fields. Their area was already densely populated and they were forced to intensify their production practices to obtain higher yields per hectare. Consequently, when the early maize varieties with a high yield potential became available, they were quickly adopted by the Abaluyia. As maize is also far easier to cultivate by handhoe farmers it soon largely substituted finger millet in the Abaluyia area.
In search of additional explanations for the divergence of cereal cropping systems among local ethnic groups, we compared the crop characteristics for maize, sorghum and finger millet. A list of differences with respect to agro-ecological and husbandry requirements is presented in Annex 2.
Annex 2 shows that finger millet has some important disadvantages over maize and sorghum. It is a labour-intensive, low yielding crop requiring reliable rainfall. Its management is difficult and not flexible. Availability of weed-free and fine seedbeds early in the season is a precondition for successful finger millet crops.
Annex 2 also indicates that finger millet can only retain its position as a major crop when farmers have easy access to ox-plough units and are growing cotton during the second rains. The demand for a fine and weed-free seedbed is met by land previously sown to cotton. These plots can be prepared quickly by ox-plough units early in the first-rain cropping season to provide the required seedbeds for finger millet. Hand hoeing delays land preparation; it results in rather weedy and rough seedbeds that are unsuitable for finger millet. Maize is then a better option. It is therefore no surprise that only among the Teso could finger millet maintain its position as a major crop.
61

central small
2.3 65.2 17.4 17.4
2.0 10.0
Busia medium
6.4
57.8 29.7 12.5
3.3 70.0
large
14.8 25.7 64.2 10.1
4.5 100.0
southern Siava small
2.7
55.6 22.2 22.2
5.1 30.0
medium
6.0 43.3 45.0 11.7
2.8
30.0
large
15.9 38.4
45.3 16.3 14.1
100.0
The 1950-1980 period
Due to the growing population, competition increased between the use of land for agriculture and its use for grazing. Large herds could no longer be supported. As land adjudication continued, the need for farmers to manage their livestock within the boundaries of their own landholdings increased (Photo 1). In Siaya a decrease in grazing area led to reduced cattle numbers (CIMMYT, 1977a). With smaller herds it became increasingly difficult to maintain a team of working oxen; land preparation by ox ploughing was jeopardized (Photo 2). Table 4.1 indicates that small farms are much more affected by these trends than large farms.
Table 4.1. Some information on farm organization during the first-rain cropping season for small, medium and large farms in certain parts of the Busia-Siaya target area.
item
total farm land (ha) portion {%) under crops portion (%) fallowed/grazed portion (%) used for other purposes number of cattle on farms portion of farmers {%) owning a plough
Note: based on 1977 Small Farm Survey {Jaetzold and Schmidt, 1982), for which samples of 30 farmers were drawn from the members register of local cooperative societies; due to the sampling method, results may only be used to indicate certain trends.
The portion of farmers in an area maintaining a team of working oxen and a plough determines the way in which farmers, who do not have such ox-plough units, prepare their fields. From experiences elsewhere it may be deducted that when this portion is: - over 50%, all farmers will be able to use ox-plough units for land preparation.
Farmers who do not possess a complete unit may either hire a unit to plough their fields, borrow a unit from relatives, or attach themselves as 'drivers' to a unit of a neighbour who permits them to proportionally use the unit on their own fields (Uchendu and Anthony, 1975; Johnson, 1979). Although farmers without units experience some delay in land preparation and planting, they regard labour shortage for weeding as their major constraint;
- about 30%, not all farmers can use ox-plough units for land preparation. Delays in land preparation and planting are common on these farms severely reducing crop yields. The shortage also increases unit hiring prices. Many farmers without units therefore handhoe part of their fields using family and/or casual labour (CIMMYT, 1977a). Labour constraints occur in the period of land preparation and weeding;
- below 10%, many farmers without units will depend on hand hoeing for land preparation. This implies even fewer timely plantings due to labour constraints, and/or a reduction in the area cultivated per household. Invariably these farmers regard land preparation as the major constraint on increased crop production (CIMMYT, 1977a; Pollard, 1981).
62

At the end of the 1970s all scenarios occurred in the Busia and Siaya Districts. Among the Teso in the northern part of Busia enough ox-plough units were still available to make ploughing the dominant land preparation method (Jaetzold and Schmidt, 1982). In the central part of Busia and in most parts of Siaya fields were prepared either by hand hoeing or by ploughing (CIMMYT, 1977a; Rop, 1981). For the Abaluyia living in the southern part of Busia hand hoeing was the dominant land preparation method. Also among the Luo living in densely populated areas of Siaya hand hoeing had become important (CIMMYT, 1977a).
Delayed land preparation either by plough or by hand hoe does not provide a weed-free seedbed, which is of paramount importance to successful finger millet cropping. As handhoe farmers are also cultivating smaller areas, strong push-factors stimulated cultivation of crops with a higher yield potential. Maize is therefore continuing to replace finger millet in the target area especially among households having less access to ox-plough units.
However, substitution of finger millet by maize is also encouraged by other factors. Since the 1960s some major agricultural changes have occurred (Annex 2). These stimulated a change in farm output composition. The strong national market for maize, the availability of improved maize cultivars and the extensive maize promotion campaigns pushed farmers into maize cultivation. Dietary preferences (e.g. for finger millet among the Teso) are therefore gradually becoming less important (Annex 2). Consequently, the importance of maize in the target area has increased tremendously. Adoption of maize hybrids was most favourable among the Abaluyia and Teso living in the higher rainfall zones. However, adoption rates were lower among those Abaluyia and Luo living in the drier zones. Although the majority of households tried maize hybrids many reverted to local maize varieties (CIMMYT, 1977a).
Current trends
Details on current cropping patterns from farms in the traditional ethnical areas are presented in Table 4.2. Certain trends are indicated which are confirmed by results from other surveys (CIMMYT, 1977a; Rop, 1981).
Sorghum was a major crop in the farming systems of all ethnic groups. Currently it is only important among Abaluyia and Luo living in the drier zones. In the higher rainfall zones soil depth is a decisive criterion. When soils are shallow to moderately deep, as in the central zone of Busia, sorghum is still important among local Abaluyia and Teso. However, when soils are deep to very deep, as in the northern zone of Busia, sorghum is no longer grown by local Teso. Maize and finger millet are now the preferred food crops, and cassava has replaced sorghum as an 'insurance crop'.
63

Table 4.2. Percentage of seasonally cultivated land under various crops of farmers laving in the traditional ethnical areas within the Busia and Siaya Districts.
ethnical area: target zone:
first rains: maize sorghum finger millet maize-bean mixtures cereal crop mixtures beans and cowpeas cassava sweet potatoes cotton (1) sunflower sugarcane others (e.g. groundnuts,
second rains: maize maize-bean mixtures beans cassava cotton sunflower sugarcane others (e.g. groundnuts)
tobacco)
Relative importance of the cropped area in the second rains (2)
northern Teso Zone B-C
24.9 0.5
15.6 7.9 0.3 0.5
11.1
-22.6 13.7
-2.9
---
71.7 15.4 11.3
-1.6
15.4
north-eastern Abaluyia Zone B
25.7 9.7 8.2 4.6
-2.5 8.5
-14.1 11.1 11.7 3.9
1.6 4.8 3.2
30.1 5.6
10.9 41.3 2.5
28.4
southern Luo Zone C
28.2 24.6 0.9 6.3 6.4 7.3 4.6 1.4
16.1 0.9
-3.3
12.9 22.6
-64.5
----
7.1
Notes: based on the Small Farm Survey (Jaetzold and Schmidt, 1982), for which samples of 30 farmers were drawn from the members register of local cooperative societies; due to the sampling method, results may only be used to indicate certain trends. (1)= although listed as a first-rain crop, classification as a second-rain crop is more appropriate (especially among the Teso) as planting is often seriously delayed (April-July). (2)= expressed as a percentage of the cropped area in the first rains.
Finger millet was a major crop among all ethnic groups. It is currently only important in the Teso area. Their cropping system is still influenced by the requirements of this traditionally preferred crop (Rop, 1981). Finger millet has become less important among the Abaluyia although it is still widely grown among those living in the higher rainfall zones. Finger millet is no longer grown by the Luo.
Maize is currently the major cereal crop in the Abaluyia, Luo and Teso economies. It has replaced finger millet and substituted sorghum to a limited extent among Luo and Abaluyia living in the drier zones. In the wetter zones on deep soils maize has replaced sorghum but substituted finger millet only to a limited extent. Although also here finger millet has become less important, it is still valued by local Teso. In the wetter zones on shallow soils maize has replaced finger millet and sorghum to a certain extent, but both crops are still valued by local Teso and Abaluyia.
64

4.2 OBJECTIVES, PRIORITIES AND RESOURCES OF HOUSEHOLDS
4.2.1 Dominance of subsistence objectives
Local households produce close to the subsistence level. As incomes are low, an assured, reliable food supply dominates production objectives. Today, traditional food preferences (determined by the household's socio-cultural background) play a minor role; maize is often preferred. Cash income to buy necessities is a secondary goal. Farmers will only change their tried and tested farming system in small steps meeting their priorities. Even in below average rainfall seasons enough food should be available. As in such seasons the survival of households is at stake, cropping patterns attempt to avoid the risk of complete crop failures.
Management strategies are aimed at obtaining a reliable food (and beer) supply within the constraints operating at household level. In this context CIMMYT (1977a) defined a good Luo farm manager as: 'a man who produces enough maize regularly every year to feed his family on their preferred food until the new harvest. He also produces enough sorghum to allow his wife to brew throughout the year, and a surplus of crops to raise enough cash to meet his family's household requirements (fish, meat, clothes and children's school fees) and add to his herd of livestock from time to time. He will have his own ox-team and plough.'
Local foods prepared from the local cereal crops include 'ugali' and 'uji'. Ugali is a porridge cooked from a mixture of water with maize, sorghum and/or finger millet flour. Cassava flour may be added. Uji is a stiff gruel with finger millet or maize flour and water as its basic ingredients. Sometimes sugar is added. In Kenya it is the traditional breakfast food. With milk it is considered very suitable for infants and small children.
Local beers are produced from sorghum or finger millet. A thick paste is made from ungerminated grains which have been freshly ground and fermented under water for about a week (Acland, 1973). Meanwhile, malt is produced from sorghum or finger millet grain which has been soaked, germinated and dried. Subsequently, the paste is fried and, after addition of the malt, again submerged. This second fermentation usually lasts a few days but there are many variations in brewing practices. The alcoholic content of the beers is about 3%. Long pipes are used for drinking; sieves tied to their ends prevent suspended fragments from passing. Boiling water is frequently added to the beer. Beer parties are social events in which many people join either by being invited or by paying cash.
Today, both ugali and uji are prepared from maize flour. Maize ugali is considered tasty. Sorghum ugali, particularly when prepared from brown-seeded varieties with testae, is now considered too heavy. It has a reputation for 'sitting on the stomach', causing constipation. Hence, many households are mixing sorghum with cassava flour to make it more digestible. Often relishes are eaten with ugali. Fish and meat are preferred when cash is available, but commonly vegetables are used. Many
65
local plants are eaten as vegetables, some are cultivated (e.g. amaranth), others are just gathered (e.g. jute). Cowpea leaves and 'sukuma wiki' (a leaf cabbage) are widely cultivated and sold on local markets. Sweet potato is also used as a vegetable. Green grams, groundnuts, beans and bambarra groundnuts are also common.
Maize did not replace sorghum or finger millet as a base for local brewing. The brown-seeded sorghums and red-seeded finger millets are still preferred for their flavour. They produce a good bitter brew not unlike the flavour obtained from hops (Doggett, 1970). As the brewing qualities of maize are considered poor, sorghum and finger millet may maintain their position as home brewing grains even in maize-growing areas.
Unreliable rainfall was the major problem in keeping households supplied with food (CIMMYT, 1977a; Rop, 1981). Only in densely populated areas was shortage of land equally important. Effects on food supply and actions taken for alleviation were studied by CIMMYT (1977a). Many farmers in Siaya are unable to produce enough maize to feed their families throughout the year. Depending on the quality of the preceding season, the number of households purchasing maize increases considerably between February and July due to depletion of maize stocks. However, many farmers have large enough stocks of sorghum and cassava to feed their families. Purchases of sorghum and cassava are not so common. Cash to buy maize on local markets comes from sales of animals, crops, vegetables, poultry and milk. Some money is also provided for by relatives and casual labouring.
Many tactics are available to spin out food supplies. Maize may be mixed with sorghum and/or cassava. It may be bought with the sale of another stored crop. When maize purchases are not feasible, sorghum and cassava are mixed for ugali preparation. Sometimes the hard, red and bitter sorghums, preferred for brewing, are mixed with cassava. Rop (1981) reports that in any mixture of sorghum and finger millet with cassava, a higher volume proportion of cassava chips is used. However, this proportion varies with the bitterness of the other ingredient. Pure cassava is the last in the order of food preferences.
The senior woman is responsible for controlling household food supplies. CIMMYT (1977a) describes her tasks as follows: 'She is responsible for the state of the food stores and in liaison with her husband, in times of shortage, as to how supplies will be spun out. She will, for example, initiate the plan for the opening of a new cassava field in anticipation of scarcities 6 months or a year ahead.'
Foods are stored inside the house or in outdoor granaries. Cereals are kept unthreshed when stored outdoors. Farmers claim that this minimizes theft. Through storage close to fire-places or regular sun-drying, insect damage is minimized. For control of storage pests, few households (15%) use insecticides but many (72%) scatter ash (CIMMYT, 1977a).
66

4.2.2 Land, labour and capital resources
Land
In 1979 about 300,000 and 475,000 people lived in the Busia and Siaya Districts, respectively. About 8% of the population lived in townships in Busia; this was only 1 % for Siaya. The total area available in rural Busia covers 157,900 ha; about 85% of this land is suitable for agriculture. These figures are 251,700 ha and 83% for rural Siaya. Detailed results on average population pressure and availability of agricultural land are presented in Table 4.3.
Table 4.3. Average population density, household size and availability of agricultural land in the rural areas of the Busia and Siaya Districts and some selected contrasting divisions.
District Division
Busia
Northern (1) Hakati/Southern
Siaya Bondo Ukwala
rural densi
173
159 180
187
143 232
population
ty (persons/km2) rural
size
5.52
5.39 5.48
5.26 6.13 4.78
household (persons)
available agricultural land (ha)
per household
2.72
2.99 2.28
2.33 3.49 1.73
per person
0.49 0.55 0.42
0.44 0.57 0.36
Notes: based on the 1979 census (Jaetzold and Schmidt, 1982); (1)= Northern Division is the traditional ethnical area of the Teso.
Tables 4.1 and 4.3 imply that in all divisions traditional fertility management by shifting cultivation can no longer be practised. The shifting cultivation system has been replaced by an intensive fallow system (Ruthenberg, 1976). Today's cropping intensity of fields ranges from 33% to 66%. On small farms fallow periods have been shortened to the extent that permanent cropping systems have developed with cropping intensities above 66%.
Due to this intensification of land use, soil fertility maintenance has become a pivotal problem. As soil fertility decreases, crops produce lower yields. This creates the need for cropping larger areas to maintain production levels required for feeding households. This in turn shortens fallow periods. As local fallow systems are not balanced they will move slowly towards a steady situation with low yield levels.
After adoption of ploughs, some mixed fanning practices were developed. At least some animals stayed on the farm; their manure was applied to homegardens. Recent land adjudication forced farmers to increasingly manage their livestock within their own holdings. Due to a shortage of feeds, farmers have started feeding crop residues to their animals. Not much fodder cropping is practised yet. This usually clashes with traditional grazing rights during dry seasons.
Increased use of manure is reported for fields near homesteads. However, application levels are low (< 1 tonne/ha; Jaetzold and Schmidt, 1982). Lack of transportation facilities prevents manure application on fields further away.
67

CIMMYT (1977a) reports that 62% of the Siaya households are using manure at least on some of their fields. Farmers are aware of the positive effects of manure on soil fertility maintenance.
Increased population pressure has led to a reduction in the grazing area. This, in turn, has led to a reduction in cattle numbers per household. Not enough manure is available to maintain soil fertility. Inevitably artificial fertilizers will soon be needed. As the inherent soil fertility of dominant soil types is low it must be assumed that the process of declining yields per hectare has already made great strides, particularly where fallow periods are short and no manure is used.
More permanent use of fields has increased infestation levels of Striga hermonthica (Chapter 3.3.4). CIMMYT (1977a) reports that 67% of the Siaya farmers regard it as a problem in sorghum and 52% feel it is also a problem in maize. Striga incidence makes weeding more labour intensive. Many farmers feel that uprooting is the only way to reduce infestation.
Labour
Farm labour is mainly provided by the household. Household size in rural areas averages 5.52 persons in Busia and 5.26 persons in Siaya (Table 4.3). About half the rural population are younger than 15. Adult members of 43% of the households emigrated from Siaya as permanent off-farm workers (CIMMYT, 1977a). Temporary off-farm employment is taken up by adults in 39% of the households. Migration is higher in densely populated areas where 55 % of the households are receiving cash from non-resident relatives.
Few households (1%) employ permanent labourers. However, 40% of the Siaya households hire temporary labour (CIMMYT, 1977a) during the busiest periods in farm operation. Many households regard February-May as the first busiest period of the year. August-October is regarded as the second busiest period (CIMMYT, 1977a; Rop, 1981).
On closer examination of the first-rain labour peak, it appears that not all households face the same constraints. In less densely populated areas, where households have easy access to ox-plough units, cultivation of larger areas results in numerous hirings for weeding; households regard a labour shortage for weeding as their major constraint. In areas where access to ox-plough units is more difficult, hiring ox-plough units for land preparation is as common as hiring labour for weeding. In areas where access to ox-plough units is very difficult hiring labour for land preparation is more common than hiring labour for weeding.
Traditionally there was an intra-household division of labour. As far as food crop production is concerned the women were responsible for weeding and harvesting operations. As men had to look after livestock they became responsible for seedbed preparation following the introduction of ploughs.
68

CIMMYT (1977a) reports that this traditional specialization has largely broken down. Only in the weeding operation can vestiges of this specialization still be observed. Women currently perform weeding operations without the aid of men in some 11% of the male-headed households.
Capital
Most farmers depend on food crop sales to generate cash income. Almost all transactions take place in local markets. Only a small share of the surplus produce is sold to local cooperative unions. Originally these unions bought only cotton but recently they started acting as general purchasing agents for the national Maize and Produce Board.
The availability of capital to local households is difficult to establish as no statistics are available on the volume of trade in local village markets and on the level of support from outside the area. However, if capital is defined as the income surplus available for reinvestment after consumption requirements (including school fees) have been met, a capital availability estimate can still be made.
Farm surpluses are invested in cattle, ploughs, hired labour or ox-plough units, seeds and fertilizer. Due to increased population and consumption needs, numbers of both cattle and ploughs are decreasing. Major household expenditures such as food purchases and payment of school fees are met by cattle sales. For Siaya a 20% reduction in cattle numbers was reported over a 5 year period (CIMMYT, 1977a). The portion of farmers owning ox-ploughs used to be 10% above the current 37%.
CIMMYT (1977a) reports that 56% of the Siaya households use cash income as farm working capital. Their average outlay is about 230 Kshs. About 85% is spent on hire of labour and ox-plough units for land preparation and weeding. The remainder is spent on purchasing improved seed and fertilizer. Among the households using cash as farm working capital, 84% hire labour and ox-plough units, 55% purchase improved seeds (mainly maize hybrids) and 21% buy fertilizer.
In the central part of Busia District 96% of the local cooperative society members use maize hybrid seed (Jaetzold and Schmidt, 1982). Fertilizer application rates to maize crops average 2 kg/ha N and 15 kg/ha P205. Many member households only apply basic dressings with phosphate fertilizers (75 % apply 0 kg/ha N and less than 19 kg/ha P205). Some insecticides are purchased for the control of stem borers in maize.
In the southern part of Siaya District 67% of the local cooperative society members use maize hybrid seed. Maize fertilizer application rates average 3 kg/ha N and 13 kg/ha P205. In most cases only basic dressings of phosphate are applied (75% apply 0 kg/ha N and less than 20 kg/ha P205). Fewer insecticides are purchased than in the Busia District.
69

rains using the complete package of insecticides. Recommended cultivars are screened and selected under such conditions.
As cotton is weeded 3-5 times, weed-free and fine seedbeds are available for next year's first-rain crops. Plantings of finger millet are then optional, but often priority of food sufficiency prevails resulting in plantings of maize. If soil fertility is still sufficiently high, maize or finger millet may be followed by a second-rain cotton crop. During the first rains sorghum is always planted on fields which were previously cropped. However, relay-planting of cotton within maturing sorghum crops is impossible, as: - most local sorghums take more than 150 days to mature; - contrary to maize, most sorghum is broadcast-planted making planting of cotton
in lines difficult; - sorghum is planted late in the rotation cycle. The decreased soil fertility hampers
successful cultivation of cotton; - heavy shading of cotton by local sorghums which are tall (2.5-4 m) and leafy.
Their stover does not dry out as is the case with maize but stays green, competing with cotton seedlings for moisture, nutrients and light.
After sorghum the rotation cycle is completed by planting cassava. This can either occur during the second rains or during the first rains of the following year. After establishment, cassava fields require limited attention. Most farmers regard this as the start of the fallow period.
Although cotton may still be regarded as a cash crop, an additional function of cotton has emerged for households having limited access to land and ox-plough units. For them cotton cultivation has become a kind of seedbed preparation guaranteeing some early plantings and thus high yields during the subsequent first rains. In addition, cash is saved as no ox-plough units or labour for land preparation have to be hired for at least some of their fields. It is only through this additional function that an explanation can be given for households still growing cotton. In the 1980-81 period, the national press repeatedly reported that cotton farm-gate prices were too low and that long delays in payments occurred.
4.3.3 Maize and sorghum varieties, crop calendar and seasonal decisions
Available varieties of maize and sorghum
The existing range of local maize and sorghum varieties increases management flexibility of households in meeting reliable food supplies. Unfortunately, their identification is difficult and rather confusing. CIMMYT (1977a) classified the local varieties on the basis of four characteristics: (1) length of growing cycle, (2) colour and taste, (3) storage quality, and (4) yield potential. Although our findings differed considerably on one major characteristic (the length of the growing cycle) it is considered a valuable classification. Hence, it is summarized below.
72

Maize Three variety groups are identified: - 'Rachar' (or 'Indere/Ndere'). This is the local white variety preferred for
preparing ugali. It stores relatively well and takes 5 months to mature; - 'Nyamula' (or 'Sipindi/Kipindi'). This is the local yellow variety. It is
considered less palatable and more drought-resistant than the other varieties maturing more quickly than 'Rachar';
- Hybrids. This group consists of the hybrids 'H511', 'H512', 'H622' and 'H632'. They are considered palatable and are even preferred to 'Rachar'. However, they do not store well. 'H511' and 'H512' need 120-130 days to mature and 'H622' and 'H632' about 140-150 days. Under optimal growing conditions the yield potential of 'H622' and 'H632' is higher than that of 'H511' and 'H512'. However, in the drier zones 'H622' and 'H632' take too long to mature and are sensitive to rainfall shortages, especially at the end of the season. 'H 511' and 'H 512' seem to better fit in with such climatical conditions. Seed availability of 'H512' is restricted.
Performance of maize entries in our regional testing programme (Chapter 6) confirms the findings of CIMMYT, including those on maturity length: - local white maize varieties mature slower than 'H511' and 'H512'. Their
maturity length (150-160 days) is comparable to or a little longer than that of 'H622' and 'H632';
- local yellow maize varieties mature quicker than 'H622' and 'H632'. Their maturity length (130 days) is comparable to that of 'H511' and 'H512'.
Sorghum Four variety groups are identified: - 'Ohunjo'. This group of light brown varieties is favoured for ugali and beer
production. Compared to the 'Oloro' varieties, these varieties are less coloured and bitter. CIMMYT reported that they mature in about 3 months. If planted early, they mature before the other sorghums and bird scaring is required. Due to soft seeds, their storage qualities are poor. Consequently, this type of sorghum is consumed or sold not long after its harvest;
- 'Oloro'. This group of red varieties is favoured for its bird resistance and good storage qualities. These sorghums (e.g.'Ochuti') have hard seeds which are bitter tasting (high tannin content). Under proper management, two-year storage periods have been recorded. Although their grain type is preferred neither for food nor for beer production, they are grown as an 'insurance'. As these sorghums take long to mature, they must be planted early in the season;
- 'Kumba'. This group of local white varieties has almost disappeared. It includes both medium- (e.g.'Nyakitos') and long-term varieties (e.g.'Kumba'). Due to risk of bird damage and low yield potential, these varieties have been replaced by white maize. Seed has become scarce, although some senior women still maintain small stocks;
- 'Serena'. This improved brown variety was introduced in the late 1960s. 'Serena' was selected from a cross involving material originating from West Kenya (e.g. 'Dobbs'). 'Serena' is about 1.5 m in height and is reported
73

5.2.3 Method of planting
Current practice and its determinants
In Zone B sorghum is usually grown in pure stands. If some mid season surveys indicate sorghum to be grown in crop mixtures, this is often the result of unreliable grass rains in combination with gapfilling using other crops. In Zone B early planted sorghum crops are often broadcast. Broadcasting is a suitable method of planting in view of the urgency of getting crops established as early as possible. Although broadcasting often results in variable plant densities, which in turn may decrease yields, early season corrections (thinning and gapfilling) are possible. The need for early broadcast-plantings may also be determined by other factors: - late maturity of local varieties; - shortage of labour in combination with the need to spread labour; - availability of fine and weed-free seedbeds. Later plantings often result in heavy
weed competition and seedbeds which are too sticky to permit the seed to be properly covered by a thin layer of soil.
In case sorghum plantings are delayed, households often use a planting method whereby seed is dibbled ('hill-planting'). Compared to broadcasting, hill-planting requires more labour. Reasons for hill-planting include: - weeding of hill-planted sorghum crops is easier than broadcast-planted crops.
As late planted crops have to compete with already established weeds, easy weeding is important;
- it is difficult to properly cover broadcast seed by a thin layer of soil if these soils are wet and sticky or if, due to delayed land preparation, seed beds are rather rough;
- gapfilling of late planted crops is often not successful. Compared to broadcasting, hill-planting often results in a more accurate crop establishment.
In Zone C many households plant sorghum in pure stands. CIMMYT (1977a), however, reports that substantial areas of sorghum are intercropped with maize. Of all households planting maize, 52% planted maize in pure stands; a further 21 % mixed maize with sorghum. Mixing of maize and sorghum is related to assurance of food supplies. The proportions of the two crops reflect the household's own balance between a preference for maize and a desire for security in grain production through sorghum. In the drier parts of Zone C sorghum is the dominant crop in these mixtures.
In maize cropping in Zone C, 48% of the fields are row-planted and 29% hill-planted; only 23% are still broadcast (CIMMYT, 1977a). This indicates that more systematic planting methods have become widely accepted. Under increasing pressure from labour constraints, households have begun to appreciate that systematic planting facilitates rapid weeding. Similar trends are observed for sorghum, particularly for sorghum mixed with maize.
84

Suggested changes and implications for the system
Although for 'Type 1 and Type 2' seasons broadcasting offers advantages (e.g. urgency of crop establishment) over the more systematic methods of planting, it should be remembered that broadcasting is tied to the availability of fine and weed-free seedbeds. However, access to ox-plough units decreases and non-owners increasingly depend on rather rough seedbeds which are less weed-free. Complete land preparation by two or three rounds of the ox-plough has become rare among non-owners. Non-owners may only have the resources to hire ox-plough units once, but often some fields are entirely prepared by hand hoeing. In such situations sorghum yields are determined by: - the rate of success in crop establishment (plant density); - the level of weed control (timing and frequency). As has been discussed before, systematic plantings offer advantages over broadcasting, particularly when plantings are delayed.
Based on this analysis we initiated a research programme to determine an adaptive systematic method of planting. The programme aimed at: - establishing the optimum range of plant densities for earlier maturing sorghums
grown in pure stands; - identifying a more systematic way of sorghum planting to reduce labour required
for weeding; - exposing the package to the judgement of households.
Possible implications for the system may be summarized as follows: - more stable yields, especially for late planted crops, as plant population and
spacing are better regulated; - weeding in hill-planted or row-planted crops is easier and faster compared to
broadcast-planted crops. Hence, there may be time available for a second weeding. Mechanization of weeding (by ox drawn or hand weeders) is possible in case row-planting is practised. Some farmers already use ploughs for inter-row weeding; its success depends on the level of ox training and accuracy in distances between rows;
- although systematic planting is more labour-intensive, opening of small furrows by ox-ploughs may reduce the labour demand during planting;
- better fertilizer or manure utilization is possible if these are applied close to crops. Hill- or row-planting permits this placement. Under local conditions broadcasting of fertilizer is a waste of money, as: (1) weeds benefit most, and (2) phosphorus fixation occurs on local soils;
- relay-planting of cotton in maturing sorghum crops is facilitated when hill- or row-planting is practised;
- possible residual effects of fertilizer to crops planted in the second rains can be optimized when band (in the case of row-planting) or spot (in the case of hill-planting) applications occur during the first rains.
85

5.2.4 Thinning and weeding
Current practice and its determinants
As much sorghum is still planted early in the season (grass rains) the risk of losing part of the germinated seedlings by dry spells is high. When seeds are also broadcast there is always the risk of seeds not being properly covered by a thin layer of soil. Birds may eat uncovered seeds. In addition, the germination percentage of local seed varies greatly (25-90%) depending on the length and method of storage. Drought, birds and seed quality result in fluctuating rates of success in the establishment of sorghum crops. However, too low plant densities are more common than too high densities. Households do not worry much about these low densities, as: - local sorghum varieties have the potential to produce many tillers; - gaps can always be filled by other crops e.g. maize. Consequently, thinning of local sorghum crops does not occur frequently. Sometimes during the first weeding a rough thinning is carried out on spots within a sorghum field where plant densities are clearly too high.
Most broadcast-planted sorghum crops are only weeded once as their weeding is time-consuming. With easy access to ox-plough units, weed-free seedbeds can be made available. Hence, the first weeding may occur rather late in the season. The planting of other crops (maize) is preferred to weeding of sorghum.
With no easy access to weed-free seedbeds, the care for sorghum crops appears to be more directly related to crop performances of other grain crops and grain quantities still available in the stores. If food reserves are low, and expected yields of maize are low, households may decide on weeding sorghum crops for a second time. However, if food reserves and expected maize yields are promising, a second and sometimes third weeding of maize is given priority over a time-consuming second weeding of broadcast-planted sorghum. Depending on the situation a sorghum field may look well taken care of or discarded at harvesting time.
Suggested changes and implications for the system
If a 'row-hill-planting' method is adopted by local households, it is anticipated that a change in weeding practice will also occur.
Households having no easy access to ox-plough units are cropping smaller areas. Their major labour constraint is identified during the period of land preparation. To obtain satisfactory total yields on these farms, intensification through crop management improvements is necessary. As smaller areas are cropped and seedbeds are less weed-free, a second weeding seems necessary to increase yields per hectare. It is expected that for such an exercise labour will be available on these farms. The change in planting method is aimed at facilitating an intensification in weed control. A second weeding will also help in the control of Striga and will improve crop response to applications of fertilizer or manure.
86

For households not yet cropping smaller areas and having easy access to ox-plough units priorities are different. Such households are still capable of better satisfying their objectives by less intensive cereal cropping systems. Their major labour constraint is identified during the period of weeding. Although another planting method may help to ease their constraints during weeding, other more effective measures must be taken to substantially increase production. As these households often have more capital available to invest in farming, we decided to conduct research on herbicides using cheap battery-operated low volume sprayers. As capital is scarce, investments in herbicides compete with other productive investments (fertilizers, ox drawn weeders). Economic analyses of weed control trial results will help to determine how capital can best be invested.
5.2.5 Use of purchased inputs
Current practice and its determinants
Household incomes in the target area are low. Consequently, the amount of capital available for productive farm investments is limited. Households mainly depend on crop sales to generate cash income. Most transactions take place in local markets. Especially in the drier Zone C, where no cash crops are produced, this type of marketing prohibits the initiation of a viable credit scheme for e.g. the purchase of fertilizers. In the wetter Zone B it may be possible to introduce credit schemes based on cotton production. However, it should be realized that cotton yields are low and cotton production in the second rains is risky. CIMMYT (1977a) concluded that even with appropriate credit schemes, households are unlikely to be encouraged to double their present cash outlays.
Most of the working capital for farming is currently spent on hiring labour and ox-plough units for land preparation and weeding. Some capital is spent on the purchase of improved seed and fertilizer (Chapter 4.2.2). Purchased inputs are rarely used in sorghum production. As no seed of improved varieties or hybrids is available, households do not even buy sorghum seed. Annually they select seed from their own harvest. Purchased inputs are mainly channelled into the production of maize. Many cooperative society members use maize hybrid seed. Fertilizer application levels to maize crops are low; 75% of the members apply no nitrogen and less than 20 kg/ha P205. Some insecticides are bought for pest control.
Suggested changes and implications for the system
In connection with improved sorghum cropping the inputs purchased in addition to seed are fertilizer and possibly insecticides; the latter being used for control of shoot fly, sorghum midge, stem borer and storage pests. However, fertilizers are most important, because of the urgent need for an alternative means of fertility maintenance (CIMMYT, 1977a).
87

Due to shortage of capital on local farms, we decided that initially we had to embark on the development of adapted varieties. Unlike hybrids, varieties need not be purchased annually. Farmers were advised to buy fresh seed of the new varieties every 3-5 years to keep varieties true to type. We expected that hybrids would become economically feasible in the long run.
Once the change in planting method is accepted, low levels of fertilizer application may be introduced. However, if more sorghum is produced households must be able to sell their increased surplus on the market at reasonable and stable prices. The use of fertilizer will therefore depend on the development of a national sorghum marketing and pricing system. Establishment of an equitable relationship between guaranteed prices for maize and sorghum in combination with establishment of between-grade sorghum prices should provide the incentive to farmers to grow more sorghum (Chapter 2.3.1). Introduction of credit schemes for fertilizers will be facilitated if good quality sorghums can be sold on the national cereal market. Sorghum will then have become a cash as well as a food crop; a function now often performed by maize.
In view of the urgent need to tackle the soil fertility problem, we initiated research on fertilizer applications. Our starting point was that farmers would apply fertilizer to sorghum crops at levels similar to those now applied to maize crops.
The pest control research programme concentrated on identification of low-cost approaches (e.g. avoiding pests by adjustments in planting time). If chemicals were needed, attention focused on promising cheap application methods for pest control (e.g. control of shoot fly by a sorghum seed treatment).
For the introduction of sorghum cropping in the second rains, more control by chemicals may be needed due to high incidence of pests. This increased investments during this season may be acceptable to households, as: - compared to the first rains, few opportunities exist for investments; - the rate of return to investments in pest control may be very attractive.
5.3 TRIAL PROGRAMME DEVELOPMENT AND IMPLEMENTATION
5.3.1 Development of trial programme
The EAAFRO programme at Serere, Uganda, was conducted in agro-ecological zones similar to the target zones of the Alupe-based programme. It formulated useful recommendations on how to grow sorghum crops and its selected early-maturing sorghums achieved high grain yields (> 4 tonnes/ha) in on-station trials. These compared favourably with yields of farmers (mean: < 1 tonne/ha). However, the EAAFRO staff stated (Doggett et al., 1968): 'that the large yield advances obtained at Serere under good farming may not show at all at a lower level of farming, as in some of the district trials. Serena and Dobbs may be able to yield as well as any other variety when cultural factors are limiting and imposing a yield ceiling.'
88

During our first year in West Kenya we therefore decided to keep the formal on-station experimentation to a minimum. Rather than refining the experimental yield, emphasis was put on: - observing and understanding typical household practices and circumstances
related to sorghum cropping; - scrutinizing optional research components.
In doing so, we better identified the problems of the households. Subsequently, a relevant adaptive research programme was developed. The core of the experimental programme was implemented in the second and in the third year resulting in some recommended management practices for sorghum.
However, the operational problems of implementing these recommendations on a practical field scale, required careful observation. Consequently, in the third and fourth year, we shifted the emphasis from research to extension. An on-farm extension-oriented programme was developed to observe farmers reactions to the introduction of early-maturing sorghums and recommended management practices. Simultaneously, a small on-station and on-farm experimental programme was conducted. It incorporated new problems emerging from the extension programme.
5.3.2 Implementation of trial programme
In designing the actual contents of our sorghum research programme special consideration was given to the following topics: - deciding on the location of trials (e.g. should a long-term fertilizer trial be
conducted on-farm or on-station?); - deciding on what components are designated as experimental variables, which
are non-experimental, and why? (e.g. is it relevant to include tests on herbicides in the weed control research programme?);
- deciding on levels of a variable and the range of levels to test (e.g. is it relevant to include the treatment '3 weedings' in a hand weeding frequency trial or will 'one weeding' and 'two weedings' sufficiently cover the range of optional management practices?);
- deciding on what levels non-experimental variables are fixed (e.g. the frequency of weeding in a variety trial).
On-station versus on-farm trials
We tried to develop a relevant production-oriented research programme, which was divided into an experimental and an operational part.
The experimental sub-programme aimed at selecting adapted earlier maturing sorghums and identifying factors limiting the growth of these sorghums at farm level. Consequently, we decided that yield trials regarding these sorghums had to be implemented under circumstances similar to those prevailing on farms. As it was difficult to estimate the precise manuring level and apply it to fields of Alupe ARS
89

(the station did not possess any cattle) we located most variety selection and agronomy trials in fanners fields. Usually fields were selected where households intended to grow sorghum during that particular season. Most trials were still managed by research staff. However, agronomic parameters pertaining to environment and husbandry, were similar to those occurring on the rest of the field. Type, depth and fertility of soils, levels of Striga infestation, weed population, pest and disease infestations were representative. Methods of land preparation and levels of manuring were those used by farmers. However, some trials were still conducted on-station, viz.: - trials with a more fundamental research objective; - trials where observations had to be made very frequently; - trials which extended over several seasons on the same field (e.g. long-term
fertilizer experiment).
The operational sub-programme was jointly implemented by farmers, extension staff and researchers. Emphasis was put on households perceptions regarding new sorghums and husbandry practices. The centre of decision-making was therefore shifted from the research station to farmers fields and pre-extension trials and crop production plots were managed by participating households themselves.
Levels of fixed and non-fixed variables
Within an adaptive research programme it is not only the siting of experiments which determines the applicability of research findings to local farming circumstances. Also the setting of experimental and non-experimental variables at relevant levels merits attention. We tried to operate within the constraints on local farming systems by: - limiting fertilizer application in most research trials, all pre-extension trials and
all crop production plots to 20 kg/ha N and 20 kg/ha P2Os. Controls without fertilizer application were often included, especially in the pre-extension and crop production plot programmes. Higher fertilizer application levels were only used in fertilizer experiments;
- restricting weedings of trials to once or twice during the first two months after planting. However, in the production plots households were free to decide for themselves on the frequency of weeding. Herbicides were only used in weed control experiments;
- not permitting blanket insecticide applications in the experimental programme. If insecticides had to be applied, sufficient justification had to be provided based on expected yield losses.
90

Photo 3: A promising early-maturing brown-seeded cultivar at one of the regional variety testing sites. In the back-ground a tall maize hybrid.
Photo 4: A promising early-maturing white-seeded cultivar at one of the regional variety testing sites. In the back-ground a tall local brown-seeded variety.
91

Photo 5: Effects of heavy Striga hermonthica infestation on the agronomic expression of a tolerant (A) and a susceptible (B) sorghum cultivar.
92

6. SORGHUM AND MAIZE PERFORMANCE; 1979-82 VARIETY TRIALS
6.1 OBJECTIVE OF THE VARIETY TESTING PROGRAMME
Each year we grouped the most promising early-maturing sorghum entries from the screening and selection programme of our breeding section, and the previous year's regional variety trial programme, into a new regional variety trial to identify the best entries for yield, Striga resistance, disease and pest resistance and ratoon potential.
The occurrence of two rainy seasons in some parts of the Busia-Siaya area permitted either trials to be ratooned or to plant trials twice each year. Initially, our focus was on ratooning. It was anticipated that trial results from the drier Zone C during the first rains would sufficiently represent those from the wetter Zone B during the second rains.
6.2 MATERIALS AND METHODS
Locations
The 1979 testing programme was conducted in a larger area of West Kenya compared to the 1980-82 testing programmes. After 1979, shortage of funds forced us to restrict our multi-locational testing programme to the Busia-Siaya area. Based on the 1979 results, most trials in subsequent years were conducted in farmers fields to ensure representative Striga infestations.
Planted crops Four trial sites were used in 1979, six in 1980 and eight in 1981. Care was taken to equally distribute sites over the higher (Zone B) and lower (Zone C) rainfall zones. In 1982 only one site was used in Zone B.
Ratoon crops Not all sites were available in the second rains; some households wanted to use the field themselves. In addition, cows or monkeys destroyed some ratoon crops (Homa Bay, 1979; Gobei, 1980; Bondo, 1981). Consequently, complete observations on ratoon crop performance were made on two sites in 1979, on four sites in 1980, and on five sites in 1981. Fortunately, the remaining sites were equally distributed over the B and C Zones. No observations were made in 1982.
Entries
Planted crops Entries in the testing programme included improved sorghum cultivars (Serena, Dobbs Bora) and a sorghum hybrid (Hijak) released in East Africa by the EAAFRO sorghum improvement programme, and material from a follow-up crossing and selection programme intended to produce superior replacements (3DX 57/1/H/4, 5DX 135/13/1/3/1, E 525 HR, 2KX 76/325, 2KX 17). Other entries were screened by our breeding section from in-country
93
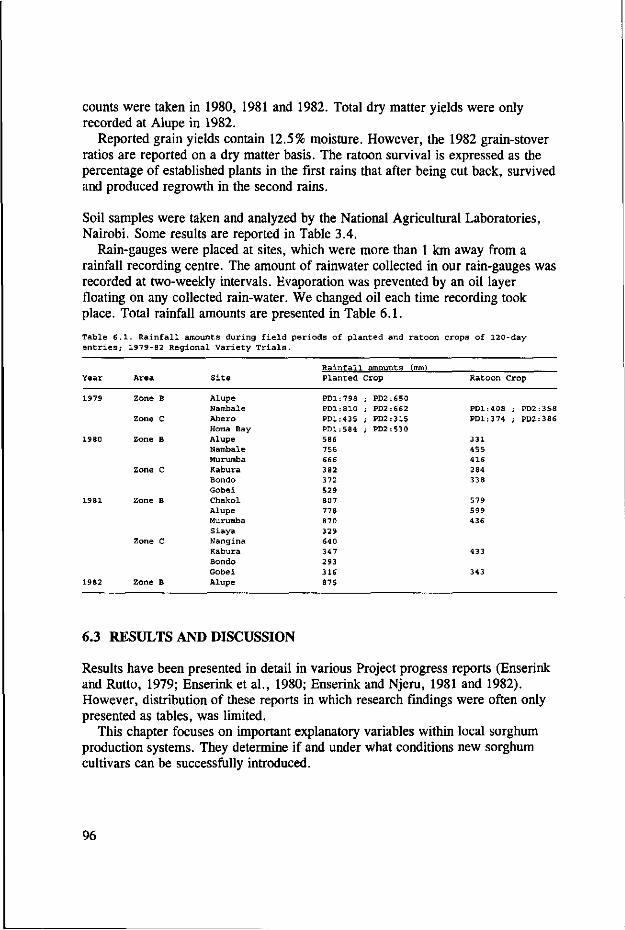
counts were taken in 1980, 1981 and 1982. Total dry matter yields were only recorded at Alupe in 1982.
Reported grain yields contain 12.5% moisture. However, the 1982 grain-stover ratios are reported on a dry matter basis. The ratoon survival is expressed as the percentage of established plants in the first rains that after being cut back, survived and produced regrowth in the second rains.
Soil samples were taken and analyzed by the National Agricultural Laboratories, Nairobi. Some results are reported in Table 3.4.
Rain-gauges were placed at sites, which were more than 1 km away from a rainfall recording centre. The amount of rainwater collected in our rain-gauges was recorded at two-weekly intervals. Evaporation was prevented by an oil layer floating on any collected rain-water. We changed oil each time recording took place. Total rainfall amounts are presented in Table 6.1.
Table 6.1. Rainfall amounts during field periods of planted and ratoon crops of 120-day entries; 1979-82 Regional Variety Trials.
Year
1979
1980
1981
1982
Area
Zone B
Zone C
Zone B
Zone C
Zone B
Zone C
Zone B
Site
Alupe Nambale Ahero Homa Bay Alupe Nambale Murumba Kabura Bondo Gobei Chakol Alupe Murumba Si ay a Nangina Kabura Bondo Gobei
Alupe
Rainfall Planted
PD1 PD1
PD1 PD1
586 756 666
382 372 529 807 778 870 329 640 347 293 316
875
798 810 435 584
amounts (mm) Crop
; PD2 ; PD2 ; PD2 ; PD2
650 662
315 530
Ratoon Crop
PD1:408 ; PD2:358 PD1:374 ; PD2:386
331 455 416 284 338
579 599 436
433
343
6.3 RESULTS AND DISCUSSION
Results have been presented in detail in various Project progress reports (Enserink and Rutto, 1979; Enserink et al., 1980; Enserink and Njeru, 1981 and 1982). However, distribution of these reports in which research findings were often only presented as tables, was limited.
This chapter focuses on important explanatory variables within local sorghum production systems. They determine if and under what conditions new sorghum cultivars can be successfully introduced.
96

6.3.1 Yield performances of planted and ratoon crops
In 1979 and 1980 due to limited seed availability not all genotypes could be planted at all locations. They were substituted by other genotypes. The analysis of grain yields included whatever genotype was grown at a particular site. In 1980, however, a few genotypes germinated badly at a few trial sites and had to be excluded from the grain yield analysis for planted and ratooned crops.
Tables 6.2, 6.3, 6.5 and 6.6 summarize the results of the analysis of variance on grain yields for each site in 1979, 1980, 1981 and 1982, respectively. For individual sorghum entries, yields per site and mean yields over sites are only reported when they were planted (or successfully germinated) at all sites. Although yields of other entries have been included in the analysis of variance on grain yields and mean grain yield calculations for each site, they are not reported here. They are grouped into a separate class of 'remaining entries' (Tables 6.2 and 6.3). Entries successfully grown at all sites are arranged in descending order according to mean grain yields.
Although mean yields for the best maize hybrid and for local sorghum are presented in Table 6.2, this is not entirely correct as the choice of maize hybrid and local sorghum varied among trial sites. In 1980 and 1981 the maize hybrid was standardized at all sites to make better comparisons between maize and sorghum genotypes possible. No standardization for local sorghum occurred, although from 1980 farmers supplied their early-maturing types to facilitate trial husbandry.
1979
Planted crops Due to delayed land preparation all trials were planted late compared to surrounding fields. All PD1 main plots were planted between 19-23 March. All PD2 main plots were planted between 9-12 April.
Maize outyielded all sorghums (Table 6.2) irrespective of the date of planting. The best yielding maize hybrids were: H622 at Alupe and Ahero; H632 at Nambale and H511 at Homa Bay.
Sorghum yields were low due to high incidence of shoot fly and sorghum midge. However, at Nambale and Homa Bay some early-maturing sorghums yielded satisfactorily, but only for the PD1 treatment. Late-maturing local sorghums never yielded satisfactorily. A relationship was observed between maturity length of sorghums and yield due to internal reinfestations of sorghum midge. Consequently, compared to maize, sorghums were more susceptible to yield reductions caused by delays in planting. Detailed analyses of effects of shoot fly and sorghum midge are presented in Chapter 6.3.2.
In 1979 on-station trials were conducted at Alupe and Ahero. The sites proved to be free from Striga. On-farm trials were conducted at Homa Bay and Nambale. Here, the Striga problem was encountered, but counts were not taken. As farmers fields are often infested with Striga, more on-farm trials were conducted in 1980-81 to ensure more appropriate testing conditions.
97

Table 6.2. Grain yields ('000 kg/ha) of entries planted on two different dates and ratooned in the 1979 Regional Variety Trial.
Entries
Planted Crop: Best Maize Hybrid
E 525 HR 3DX 57/1/H/4 (SC108-3xCS3541)3-l
MY 57
Dobbs Bora 5DX 135/13/1/3/1
9DX 5/F5/9 2KX 14/1 Local Sorghum Bulk Y 398-1047
Remaininq Entries (-) Mean
F ratio for: PD Entries
Type
W
Br Br W
Br Br Br
w w Br
w
PDxEntries CV
Ratoon Crop: 3DX 57/1/H/4 MY 57 E 525 HR Dobbs Bora 5DX 135/13/1/3/1
9DX 5/F5/9 (SC108-3XCS354D3-1 Bulk Y 398-1047
2KX 14/1 Local Sorghum
Remaininq Entries (-) Mean
F ratio for: PD Entries
Br Br Br Br
Br W
w w w Br
PDxEntries CV
Zone
Alupe PD1
3 0 0 1 0 0 0 0 0 0 0
0
62 24 38 06 26 15 31 09 08 20 02
-) 70
3 12
0 91
3
PD2
2.42
0.06 0.13 0.21 0.32 0.06 0.05 0.08 0.06 0.08 0.02
(-) 0.43
.8ns
.7**
.5ns
.5*
Nambale PD1
3.04 2.72 2.72 1.18 1.83 1.82 1.82 1.15 0.75 0.91 0.36
(-) 1.59
44 8 2
56
2.24
1.42 1.38 1.78 1.96 1.31 0.94 0.39 0.90 0.12
(-) 1.14
1 11
1 34
PD2
4.29 0.65 0.39 0.40 0.44
0.23 0.36 0.23 0.12 0.08 0.02
(-) 0.63
.0ns
.5** ,2ns .9%
1.50 1.46 1.96 1.49 1.04 1.69 0.90 0.86 0.63 0.04
(-) 1.07
.2ns
.0**
.5ns
.5*
Zone
Ahero PD1
2.52 0.68 0.90 0.20 0.66 0.93 0.29 0.20 0.98 0.24 0.08
(-) 0.95
2 7 1
85
2.51 2.56 1.95 2.08 2.28 1.91 2.18 1.47
1.92 1.71
(-) 2.06
0 0 1
28
PD2
2.48 0.12 0.84 0.18 0.28 0.29 0.25 0.17 0.24 0.22 0.05
(-) 0.51
.2ns
.1**
.6ns
.3%
1.95 1.86 1.68 1.59 1.62 1.86 1.70 2.74 1.67
1.12
(-) 1.78
.9ns
.8ns
. Ins
.5*
Homa PD1
3 3 1
3 2 2 2 1 1 0
0
2
48 17
75 38 77
61 17
76 41
95 29
-) 00
7 6 2
47
Bav PD2
1.04 0.50 0.94 1.23 0.61 0.18 0.40 0.31 0.12 0.10 0.06
(-) 0.47
.2ns
.0**
.3*
.8%
Mean PD1
3.16 1.70 1.44
1.46 1.38 1.38 1.15 0.80 0.80 0.58 0.19
(-)
2.37 1.99 1.67 1.93 2.12 1.61 1.56 0.93 1.41 0.92
(-) 1.60
PD2
2.56 0.33 0.S8 0.50 0.41 0.19 0.27 0.20 0.13 0.12 0.04
(-)
1.73 1.66 1.82 1.54
1.33 1.78 1.30 1.80 1.15 0.58
(-) 1.43
Notes: Grain colour type: Br= brown; W= white; Y= yellow; ns= not significant (P>0.05); *= significant (P<0.05); **= highly significant (P<0.01); CV= the coefficient of variation does not describe the total amount of variation between entries as in Tables 6.3, 6.5, 6.6, 6.13 and 6.14 but the amount of variation between entries for a single PD treatment; {-)= no individual entry yields are presented as entries were not successfully grown at all sites. However, mean yield and statistical analysis for a site are based on all entries (including remaining entries) successfully grown at that particular site.
The 1979 results indicate that sorghum is not always a more reliable crop than maize. Based on the 1979 results alone, it is unclear why households are growing sorghum. However, households do plant sorghum and its bad performance needs to be explained (Chapter 6.3.2) to better understand local sorghum cropping systems.
Ratoon crops Ratoon yields of most early-maturing sorghums were satisfactory (Table 6.2). Especially at Ahero where the trial was located on a deep Vertisol, ratoon yields were high. Ratoon yields of the late-maturing local sorghums were low. A relationship was observed between maturity length and yield of sorghum entries. In the wetter Zone B this relationship was stronger than in the drier
98

Zone C, due to internal reinfestation of sorghum midge (Chapter 6.3.2). In Zone C the relationship was mainly caused by unfavourable moisture conditions during the grain filling period of late-maturing sorghums.
The results of ratoon crops highlight that it was not the yield potential that had limited the performance of the planted sorghum crops. Contrary to expectation, yields of ratoon crops were often higher than those of planted crops. Therefore, other reasons, particularly the incidence of pests must be held responsible for the bad performance of planted sorghum crops in 1979.
1980
Planted crops In 1980 all trials were planted late (28 March-2 April). Observations on surrounding fields in late March revealed shoot fly incidence levels to be already high, particularly in Zone B. We decided to protect all trials from shoot fly through application of carbofuran-granules.
At nearly all sites most sorghum entries yielded significantly higher than the maize hybrid H632 (Table 6.3). Especially in the drier Zone C yields of 'H632' were low. In addition to its medium maturity length, 'H632' was susceptible to Striga. This further reduced maize yields in fields infested with the weed. A detailed analysis is presented in Chapter 6.3.4.
In 1980 the earlier maturing maize hybrid H512 was grown on 3 out of 6 sites as a remaining entry. At Murumba 'H512' yielded 1300 kg/ha whereas 'H632' yielded only 180 kg/ha. At Kabura 'H512' and 'H632' yielded 1330 and 530 kg/ha, respectively. At Bondo 'H512' and 'H632' yielded 440 and 480 kg/ha, respectively. We decided that in 1981 'H512' was to replace 'H632' as the standard maize check.
Under favourable and Striga-free conditions (Alupe) the yield potential of several selected sorghums proved to be over 6000 kg/ha. The yield potential of the sorghum hybrid Hijak was highest (7500 kg/ha). However, at Nambale and Murumba 'Hijak' yielded significantly lower than the best sorghum cultivar MY 146. The hybrid sorghum proved to be more susceptible to Striga. A detailed analysis is presented in Chapter 6.3.4.
Local sorghums yielded well, especially in the drier Zone C. However, at Nambale and Murumba low yields for local sorghums were recorded. High incidence levels of midge on these later maturing sorghums showed that the two applications with endosulfan during the flowering period of sorghums were insufficient to control internal reinfestation of midge in Zone B. We decided that in 1981 trials had to be sprayed at 4-day intervals during the flowering period.
Compared to the early brown entries, the best yielding white cultivar (SC108-3xCS3541)3-l showed an unstable yield performance across locations in 1979 and 1980. As it was the earliest flowering entry, midge incidence due to internal reinfestation would not yet have taken place. Susceptibility to leaf blight, particularly in Zone B, was the main reason for its unstable performance. A detailed analysis is presented in Chapter 6.3.3.
99

Table 6.3. Grain yields ('000 k Variety Trial.
Entries Type
g/ha) of entries planted and ratooned in the 1980 Regional
Zone B Zone C Alupe Nambale Murumba Kabura Bondo Gobei Mean
Planted Crop: MY 146 Br 5.77 2.77 3.87
5DX 135/13/1/3/1 Br 6.86 2.77 2.58 E 525 HR Br 6.74 2.57 2.68 Hijak (CK60AXSB65) Br 7.52 1.55 2.34 Dobbs Bora Br 6.13 1.89 2.49 3DX 57/1/H/4 Br 6.28 2.23 2 (SC108-3xCS3541]3-l W 4.21 1.78 0 Local Sorghum Br 5.32 0.21 0 9DX 5/41/1 W 5.54 0.23 1 Diall.Pop. 1008-801 W 5.18 0.31 1 Maize hybrid H632 W 5.31 1.36 0
2.54 2.29 2.37 2.46 2.67
83 96 94 67 64 53 40 20 86 90 48
45 37 84 49 81 33 88 68 21 40 21
Ratoon Crop: MY 146 Br Local Sorghum Br Hijak (CK60AXSB65) Br
5DX 135/13/1/3/1 Br E 525 HR Br Dobbs Bora Br 3DX 57/1/H/4 Br 9DX 5/41/1 W Diall.Pop. 1008-801 W Maize hybrid H511 (#) W (SC108-3xCS3541)3-l W
Remaining Entries (-)
1.29 1.74
1.64 1.40 1.27 0.45
1.18 0.50 0.64 0.66 0.24
H
2.07 2.09
1.53 1.76 1.37 1.78 0.75 1.21 1.32 1.75 0.02
(-)
1.11 0.86
1.31 0.66 0.69 0.82 0.84 0.77
0.69 0.10 0.48
<-)
0.28 0.02 0.06 0.27 0.30 0.27
0.52 0.37
0.14 0.04 0.00
(-)
70 64 52 52 44 36 58 38 24 95 35
Remaining Entries (-) Mean
F ratio for Entries LSD (5% level) CV
(-) 5.86 3.2** 1.45
17.3%
(-) 1.41
9.1** 0.96
47.6%
(-) 1.76 3.7**
1.52 60.4%
(-) 2.21 5.4** 0.74
23.5%
(-) 2.56
13.7**
0.92 25.0%
(-) (-) 2.84
3.9** 1.62
39.8%
.19
.18
.14
.02
.91
.83
.82
.71
.70
.64
.18 L±
Mean F ratio for Entries LSD (5% level) CV
0.98
5.1** 0.69
1.38 2.3* 1.09
0.76 4.2** 0.48
0.21 1.4ns 0.37
44.3% 121.0%
Note: (#)= planted crop; for an explanation of other signs see notes under Table 6.2.
Ratoon crops At all sites ratoon yields of most sorghums were equal or higher than yields of the planted maize hybrid H511 (Table 6.3). Maize yields were particularly low in the drier Zone C. In the second rains ratooning might be a promising practice compared to the risky maize plantings. However, especially in Zone C, yields were low casting doubts on the practicality of the ratooning policy. More research was needed.
Ratoon yields for individual entries showed a much greater variation over sites than yields of planted crops. Yield levels were mainly determined by the ratoon crop plant population. Plant populations of ratoon crops depended on the percentage of plants that survived and produced regrowth after being cut back. Ratoon survival rates proved to vary significantly among sorghum entries. A detailed analysis is presented in Chapter 6.3.5.
In the wetter Zone B ratoon crop yields of local sorghums were high. In the drier Zone C some earlier maturing sorghums produced slightly better yields. In the B and C Zones local sorghums showed better ratoon survival rates than other sorghums. With proper midge control this resulted in high yields in Zone B.
100

However, in Zone C the ratoon of local sorghums took too long to mature and grain filling was jeopardized by drought. A detailed analysis is presented in Chapters 6.3.2 and 6.3.5.
The ratoon yields of cultivar (SC108-3xCS3541)3-l were very low. This confirmed earlier research findings regarding this entry. Leaf blight seriously affected the planted crop. Consequently, ratoon survival rates were very low. High leaf blight scores combined with low ratoon crop plant populations explained the bad ratoon performance of this cultivar. Details are presented in Chapter 6.3.3.
1981
Planted crops In January and February the grass rains were absent. As the onset of the first rains was also delayed, trials had to be planted late. The Chakol and Alupe trials were dry-planted on 7 and 9 March, respectively. All other trials were planted between 23-27 March. Observations on surrounding fields showed that local sorghums were planted in the same period. Consequently, shoot fly incidence was low as no earlier seasonal build-up had occurred. None of the trials needed protection from shoot fly.
The results over years show a strong seasonal relationship between rainfall pattern and population build-up of shoot fly. For successful sorghum cropping either shoot fly needs to be controlled by application of chemicals or planting needs to be early enough in the season to avoid high incidence levels. Detailed analyses are presented in Chapters 6.3.2 and 7.
With the exception of the Murumba site the early-maturing brown sorghums outyielded the maize hybrid H512 at all sites (Table 6.5). Mean yields of entries averaged over all sites in a particular zone are presented in Table 6.4. Only the four best yielding entries in each of the groups of brown and white early-maturing sorghums are shown (see also Photos 3 and 4).
Table 6.4. Mean grain yields ('000 kg/ha) of some entries in Zones B and C of the target area; 1981 Regional Variety Trial.
Entries
Early-maturing brown sorghums: 5DX 135/13/1/3/1 MY 146 E 525 HR Serena
Early-maturing white sorghum: 2KX 76/325 IS 76 TI/23
SPV 3 70 2KX 17
Maize H512 Local Sorghum
Type
Br Br Br Br Mean
W W W W Mean
W Br
Br
w
Zone B
3.56 3.17
3.14 3.12 3.25
2.95 2.92 2.87 2.69 2.86
2.68 2.48
Zone C
3.12 3.35 3.27 2.80 3.25
2.80
2.70 2.56 2.57 2.66
1.51 1.85
101

Table 6.5. Grain yields ('000 kg/ha) of entries planted and ratooned in the 1981 Regional Variety Trial.
Entries
Planted Crop: 5DX 135/13/1/3/1 MY 146 E 525 HR Serena 3DX 57/1/H/4 Dobbs Bora 2KX 76/325 IS 76 TI/23 SPV 370 2KX 17 NES 830x705 E 35-1 Ind.Syn. 387-1 NES 7360 Local Sorghum Maize H512 Mean
Zone B
Type Chakol
Br Br Br Br Br Br
w W
w w w w w w Br W
F ratio for Entries
LSD (5% level) CV
Ratoon Crop: Local Sorghum Dobbs Bora MY 146 Serena IS 76 TI/23
E 525 HR 5DX 135/13/1/3/1 2KX 76/325 NES 830x705 E 35-1 Ind.Syn. 387-1 3DX 57/1/H/4 2KX 17 SPV 3 70 NES 7360 Mean
Br Br Br Br W
Br Br W W W W Br
w W W
F ratio for Entries LSD (5* level) CV
4 .46 4.18 4.50 4.71 4.08 3.03 4.33 4.17
4.60 3.96 3.72 4.07
4.31 3 .27 3 .43 2.33
3.95 2.4*
1.19 21.2%
2.25 0.89 0.85 0.78 0.31
0.59 0.48 0.60 0.36 0.32 0.66 0.34 0.29 0.28 0.43 0.63
13.0** 0.39
43.6*
Alupe
4.92 4.25 3.90 3.61 4.06 4.39 3.23 3.89 4.07
3.17 3.20 3.11 3.21 3.73 3.24 3.62
3.73 1. 4ns 1.28
24.2%
1.76 0.57 0.16 0.23 0.12
0.28 0.08 0.31
0.15 0.21 0.11 0.09 0.16 0.06 0.08 0.29 9.4** 0.40
95.8%
Murumba
3.69 2.97 2.84 3.05 3.18 3 .92 3.15 2.78 2.46 2.26 1.91 1.80 1.49 1.49 2.46 4.27
2.73 3.1** 1.34
34.3%
1.61 1.99 1.11 0.74
0.85 0.83 1.00 0.45
0.39 0.42 0.32 0.43 0.69 0.42 0.72 0.80 3.8** 0.70
61.4%
Siaya
1.16 1.26 1.33 1.11
1.09 1.27 1.10 0.85
0.35 1.36 0.89 0.92
0.73 0.67 0.78
0.48 0.96 3.5** 0.46
33.5%
Zone C Nangina Kabura
2.22 2.76 2.72 2.66 2.97 2.02 1.45 1.66 1.22
1.95 1.54 1.38 2.17
1.59 0.66 1.02 1.88 6.4** 0.77
24.7%
2.88 3 .26 3 .64
2.99 3.39 2.22 3.00 2.75 2.65 2.78 2.54
2.88 2.63 2.19 1.73 0.81 2.65 5.8**
0.81 21.5%
0.90 0.46 0.97 0.71
0.82 0.64 0.62 0.76
0.66 0.75 0.48 0.77
0.36 0.73 0.19 0.66 1.5ns 0.48
51.3%
Bondo
3.10 2.96 2.28
3.16 2.48 2.54 2.71
2.49 2.11 1.72 1.82
1.95 1.88 1.52 1.20 2.01 2.24 2.5* 1.04
32.4%
Gobei
4.27
4.41 4.45 4.23 3.79 4.21 4.04 3.90 4.26 3.82 4.62 3.67
3.15 2.82 3.79 2.21 3.85 4.6**
0.85 15.5%
0.61 1.18 1.13 1.40 1.54 1.28 1.41
0.93 1.43 1.13 1.18 1.05 1.15 1.10 0.37 1.13 3 .1** 0.50
31.3%
Mean
3.34 3.26 3.21 3.19 3.13 2.95 2.88 2.81 2.72 2.63 2.53 2.47
2.45 2.16 2.16 2.09 2.75
1.43 1.02 0.85 0.77
0.73 0.72 0.72
0.61 0.60 0.56 0.55 0.54
0.53 0.52 0.36 0.70
Note: for an explanation of signs see notes under Table 6.2.
Table 6.4 shows that the yield advantage of the group of early-maturing brown sorghums over maize hybrid H512 and local sorghum was evident in both zones but highest in the drier Zone C. In Zone B yield levels of the group of early-maturing white sorghums were similar to or slightly higher than those of maize 'H512' and local sorghum. However, in Zone C yield levels of the group of white sorghums clearly surpassed those of maize 'H512' and local sorghum. It is clear why the group of brown cultivars is yielding better than the group of white cultivars. Although bird damage might have played a minor role, visual observations indicated white cultivars to be more susceptible to leaf blight and Striga than brown cultivars.
102

Of all sorghum entries, 'NES 7360' was least tolerant to Striga. The cultivar yielded well under Striga-free conditions (Alupe, Nangina) but yielded poorly on Sm'ga-infested fields (Chakol, Murumba, Bondo, Gobei). A detailed analysis of the effect of Striga on crop performance is presented in Chapter 6.3.4.
All crops at Siaya yielded poorly. Sugarcane had been cropped in the previous two years decreasing soil fertility to very low levels.
Ratoon crops The 1981 research findings confirm the results of 1980. Compared to earlier maturing sorghums, local sorghums had better ratoon survival rates. Due to higher survival rates, ratoon crops of local sorghums yielded better than all other sorghums particularly in Zone B (Table 6.5). Although in Zone C higher survival rates were recorded for local sorghums, this did not always result in higher grain yields at the end of the season. The second-rain cropping season in Zone C was too short and late-maturing local sorghums were more at risk during grain filling.
Ratoon yields of early-maturing sorghums showed an almost linear response to survival rates. Details are presented in Chapter 6.3.5. Satisfactory ratoon yields (> 800 kg/ha) were only obtained when survival rates for early sorghums exceeded 40%. In Zone B ratoon yields of local sorghums were already satisfactory at lower survival rates (30%), probably due to their ability to produce many tillers.
1982
Planted crops The trial was planted late (26 March). By late March shoot fly incidence levels on surrounding fields were high. The trial was therefore protected from shoot fly by carbofuran-granules. In addition to grain and total dry matter (DM) yields, some other results are reported (Table 6.6).
Table 6.6. Grain yields ('000 kg/ha), total DM yields ('000 kg/ha), days to flower, grain/stover ratios and crop heights (cm) of entries; 1982 Alupe Variety Trial.
Entries
2KX 76/325
Dobbs Bora E 35-1 Serena E 525 HR 5DX 135/13/1/3/1 3DX 57/1/H/4
SPV 370 IS 76 TI/23 Sweet ex-Brazil
Local Maize MY 146 2KX 17 Local Sorghum NES 830x705 Mean
F ratio for Entries LSD (5% level) CV
Type
W Br W
Br Br Br Br W W
w y Br
w Br W
Grain yield
6.55 6.07
5.64 5.59 5.56 5.42 5.31 5.26 5.24 5.15 5.03 4.94 4.72 4.70 4.40 5.30 1.4ns 1.33
17.5%
DM yield
11.2 12.7
11.0 10.6
9.8 10.3
9.8 8.9
8.9 9.7
12.3 8.6
9.1 17.0
7.2
10.5 5.8** 2.7
18.3*
Days to
flower
70 73 70 67 67
68 69 68 68 70 70 67
69 83 71
Grain/stover ratio
1.05 0.72 0.83 0.88 0.99 0.85 0.92
1.08 1.06 0.96 0.57 1.02 0.83 0.32 1.14
Crop height
175 175 195
14 5 155 150 150 13 0 150 195 250 150 125 320 115
Note: for an explanation of signs see notes under Table 6.2.
103

Using similar cultivars to those in 1981, the group of early-maturing brown sorghums did not yield more grain than the group of early white sorghums. Group mean yields were 5380 and 5440 kg/ha for brown and white sorghums, respectively. As leaf blight incidence and Striga infestation were low, some early white cultivars could fully express their yield potential.
The DM yield of the local sorghum was significantly higher than that of other sorghums. Grain/stover ratios are also presented in Table 6.6. They reflect the success of plant breeders with respect to improving the harvest index. The tall statured (320 cm) local sorghum had a ratio of 0.32. The shorter statured (150 cm) early-maturing brown sorghum group had a mean ratio of 0.94. The shorter statured (145 cm) early-maturing white group had a mean ratio of 1.01.
Compared to the tall local sorghums, medium statured (150 cm) cultivars are easier to cut with a knife during harvesting. Very short statured sorghums are not suitable to current local farming systems in which combine harvesting does not play a role as yet. Current cultivars must be able to produce well in situations where crops are only weeded once. Under such conditions, experiments showed that tall local weeds were casting shadows on top leaves of these very short statured sorghums hampering grain production.
6.3.2 Shoot fly and sorghum midge incidence and entry performance
Shoot fly
Planted crops Visual scores for shoot fly damage to planted crops were carried out in 1979. The 1979 shoot fly damage scores, expressed as percentage deadheart out of total plants, are presented in Table 6.7. Shoot fly scores were recorded 6 weeks after planting. As no significant (P>0.05) differences between entries were detected at all trial sites, only mean scores per planting date treatment are presented.
Table 6.7. Mean scores for shoot fly damage (% deadheart out of total plants) to sorghum entries planted on two different dates in the 1979 Regional Variety Trial.
Planting date
PD1 PD2
Mean
Zone B Alupe
72.0 82.7
77.4
Nambale
74.3 77.9 76.1
Zone C Ahero
90.3
80.9 85.6
Homa Bay
76.5 82.9 79.7
Mean
78.3
81.1 79.7
Shoot fly damage scores were high at all sites. Scores were quite similar for both planting dates, indicating that shoot fly population build-up had already reached high levels by the time PD1 plots were planted (19-23 March). In 1979 the grass rains were extremely reliable (Figures 3.5 and 7.1). By early February many households had started planting local sorghums. Table 6.7 shows that under local
104

conditions such a period of 6-7 weeks would be sufficient for shoot fly to build up its population and reach high damage levels. Ogwaro (1979) reported similar findings on population build-up of shoot fly in West Kenya (Chapter 3.3.2).
In 1980 and 1982 trials were protected from shoot fly by carbofuran-granules. Observations showed that shoot fly incidence was already high at the time of trial planting. The start of the grass rains was promising in 1980 and weak in 1982 (Figures 3.5 and 7.1). By early February of both years many households had tried to establish sorghums at least on part of their fields. Although many of these early sowings proved unsuccessful, sufficient young sorghum seedlings were available for shoot fly to multiply. Trials were planted late in 1980 (28 March-2 April) and 1982 (26 March). By late March a period of 7 weeks had been available to shoot fly to build up its population and reach high damage levels.
In 1981 the planting period of trials (7-9 and 23-27 March) preceded the period in which shoot fly population build-up occurred. No protection from shoot fly was needed. In 1981 the grass rains were absent and the actual onset of the first rains occurred by mid March (Figures 3.5 and 7.1). Consequently, no early sorghum sowings were made and build-up of shoot fly populations could not take place before trials were planted.
These research findings show that shoot fly incidence is strongly dependent on the seasonal rainfall pattern for each individual year. Recommendations based on planting dates alone will have little value. Such recommendations have to take into account the seasonal developments in the rainfall pattern. The relationship between rainfall pattern and shoot fly damage became a special research topic. Results are described in detail in Chapter 7.2.1.
Ratoon crops Visual scores for shoot fly damage to ratoon crops were carried out in 1979. Damage scores were recorded 7 weeks after the planted crop was cut back. The shoot fly damage scores were expressed as percentage deadheart out of total tillers. At Nambale, Ahero and Homa Bay mean scores for shoot fly damage were 15.0%, 9.5% and 13.7%, respectively. No significant (P>0.05) differences in scores were detected between entries and planting dates. Based on these results it was concluded that selective thinning of ratoon tillers and the early stem borer control treatments successfully kept shoot fly damage levels low.
Sorghum midge
Planted crops The low yields of sorghum in 1979 can be explained by the high shoot fly damage scores. However, there were indications that another factor had also played a role, as no explanation could be given for: - the extremely low yields of later maturing sorghums planted on PD1 plots; - the extremely low yields of all sorghums planted on PD2 plots.
105

Closer examination of results (Table 6.2) showed a relationship between the maturity length and the yield of sorghum entries. Maturity length is reflected in the time from planting to 50% flowering of main tillers ('days to flower'). The earliest cultivar (SC108-3xCS3541)3-l flowered in 65 days. This entry was also one of the highest mean yielding entries over sites, although at Nambale it was seriously affected by leaf blight. The latest entry consisting of local sorghums flowered in 87 days on average. Although local sorghums are better adapted to local environments, they had the lowest mean yields over sites.
When the mean yields (Y) for PD1 planted entries are regressed on days to flower (X), a linear yield decrease with increased days to flower is found. The linear regression is significant (P<0.05) and has the following form:
Y = 4915-52X (64 < X <88; r = -0.70) Using the regression equation to predict the average yield of individual sorghum entries, it can be calculated that cultivars flowering in 65, 75 and 85 days will yield 1535, 1015 and 495 kg/ha, respectively. For every 10-day delay in flowering average yields will decrease by 520 kg/ha. The relative yields (65-days: 100%; 75-days: 66.1%; 85-days: 32.2%) show that substantial yield losses occur.
Such losses on PD1 plots could have been caused by unfavourable moisture conditions during grain filling of the later maturing sorghums. However, the high PD2 yields for maize stressed that other reasons were responsible for the PD1 yield decrease among later maturing sorghums. Observations in the field showed that normal grain development on these later maturing entries was hampered. 'Blasted panicles' were common, especially on the PD2 plots. Some damaged panicles were analyzed at the National Agricultural Laboratories in Nairobi. The Entomology Laboratory identified the damage as being caused by sorghum midge.
As sorghum midge already caused serious damage to PD1 planted entries, it is hardly surprising that it destroyed the PD2 planted sorghum crops. Conditions for internal reinfestation had been extremely favourable. Flowering sorghum panicles were nearly always available due to the wide range of maturities and planting dates. Flowering became even more scattered due to the high incidence of shoot fly; most main tillers died and many side tillers were produced.
At some sites even PD1 plantings of early-maturing sorghums showed midge damage. Therefore it became apparent that not only internal reinfestation had been important. Spread of infestation from nearby sorghum fields had also played a role. As in 1979 surrounding fanners fields were planted in early February and PD1 plots were planted between 19-23 March, sufficient time was available for midge build-up on farmers fields. Surrounding local sorghum crops had ample time to flower before early sorghum entries started flowering on PD1 plots.
The literature review on sorghum midge (Chapter 3.3.3) shows that spread of infestation from surrounding fields depends on many factors. However, the distance between fields is an important determining factor.
It is anticipated that the situation of trial plots in relation to surrounding sorghum fields strongly influenced results. Trials located close to early planted local
106

sorghum fields, suffered serious midge damage to all PD1 sorghum plots (Alupe, Ahero). However, if distances were large or if PD1 trial plots and surrounding fields flowered simultaneously, at least some entries escaped from serious damage (Nambale, Homa Bay). However, once midge had infested a field, reinfestations rapidly occurred preventing all PD2 sorghum plots from yielding satisfactorily.
Based on the 1979 results we decided to protect trials from midge by applications of endosulfan. Two applications during flowering were given in 1980. However, this did not adequately control midge at Nambale and Murumba in the wetter Zone B. When mean entry yields over these two sites are regressed on days to flower a linear yield decrease with increased days to flower is found. This linear regression is highly significant (P<0.01) and has the following form:
Y = 8524 - 90 X (67 < X < 96; r = -0.77) When '(SC108-3xCS3541)3-l' is excluded from the regression analysis because its low yields were not due to midge but leaf blight, the closeness of the relationship between days to flower and yield is increased, viz:
Y = 9388 - 99 X (67 < X < 96; r = -0.86) Using the last equation to predict the average yield of individual sorghum entries, it can be calculated that cultivars flowering in 68, 78 and 88 days will yield 2656, 1666 and 676 kg/ha, respectively. For every 10-day delay in flowering average yields will decrease by 990 kg/ha. Although absolute yield losses were higher in 1980 than in 1979, the relative yields (68-days: 100%; 78-days: 62.7%; 88-days: 25.5%) show a similar pattern for the decline in yields; again substantial yield losses occur.
Early planted local sorghum on farmers fields surrounded the trial sites at Nambale and Murumba. It is anticipated that in addition to internal reinfestation, spread of infestation from surrounding fields has played a major role at both locations. At Alupe the trial was not surrounded by early flowering sorghums and no spread of infestation occurred. At Alupe only internal reinfestation may have played a role. Visual observations showed the 1980 spraying regime to be sufficient for midge control at Alupe. However, the regime was insufficient to control midge at Nambale and Murumba. Consequently, the 1980 ratoon trials and all 1981 and 1982 trials were better protected from midge by more frequent endosulfan applications.
We realized that regular endosulfan applications controlled both internal reinfestation of midge and the spread of infestation from nearby fields. When farmers start to grow new cultivars on a field scale possibilities for internal reinfestation are minimized. As spraying of midge is not feasible in the target area, farmers will continue to face the possibility of spread of infestation from or to nearby sorghum fields. Results of the protected regional trials are therefore not entirely representative of what can happen under actual farming conditions. Therefore we initiated a special research topic focusing on the relationships between rainfall pattern, planting dates of local and early-maturing sorghums and the population build-up of midge. Detailed results are described in Chapter 7.2.2.
107

Ratoon crops In 1979 observations on ratoon crops showed that midge could also be a problem in the second rains. However, serious damage only occurred in Zone B where climatical conditions are more favourable for build-up of populations. However, spread of infestation from nearby sorghum fields to early-maturing sorghums did not play a major role, as: - little sorghum was planted in the second rains. Distances between fields were
large. Invariably the planted local sorghum crops were flowering at a later date than the ratoon crops of early-maturing cultivars;
- ratoon crops of local sorghums were flowering simultaneously or later than ratoon crops of the early-maturing cultivars. As few local sorghum fields were ratooned, distances between ratoon crops were large.
In Zone B internal reinfestation of midge was mainly responsible for the low ratoon yields of late-maturing local sorghum entries (Table 6.2). Conditions for midge build-up on ratoon crops were favourable, due to: - the wide range of maturities and planting dates; - the existence of several ratoon tillers per individual plant. These tillers often
flower on different dates; - the increased time-lag between the flowering dates of early selected and late
local sorghums. As local entries needed more time to reach maturity in the first season, they were cut back at a later date than the early entries. Consequently, ratoon crops of the local entries started their growing cycle on a later date than ratoon crops of the early entries.
To make comparisons between entries more meaningful, internal reinfestation of midge had to be prevented. Therefore the 1980 and 1981 ratoon trials were protected from midge by more frequent endosulfan applications. However, visual observations confirmed the 1979 results; midge was only a serious threat to ratoon crops in Zone B.
6.3.3 Leaf blight incidence and performance of entries
Planted crops Disease observations in 1979 indicated that leaf blight was a serious sorghum disease. Especially in the wetter Zone B it had the potential to considerably affect grain production of susceptible entries. Introduced germplasm, particularly the tan plant colour cultivars (e.g.(SC108-3xCS3541)3-l), were far more susceptible than the purple plant colour cultivars (e.g. E 525 HR) bred and/or selected at Serere (Uganda).
Similar results were reported by our breeding section. During the 1980 evaluation of exotic germplasm at Alupe leaf blight appeared to be the most serious disease. Many exotic entries were susceptible (Rana et al., 1980).
The entries of the 1980 Regional Variety Trial were scored for leaf blight susceptibility. Visual scoring took place two weeks after each entry had reached the its 50% flowering stage. Only the three top leaves were taken into account during
108

leaf blight scoring and scores ranged from 1 (no damage) to 5 (all leaves dead). Some results are presented in Table 6.8. In this table two cultivars are compared with a similar 'days to flower' period so as to prevent any possible effect of midge on yields.
The 1980 results (Tables 6.3 and 6.8) confirmed that in the wetter Zone B the tolerant 'E 525 HR' produced far more grain than the susceptible '(SC108-3xCS3541)3-l\ In the drier Zone C their yield levels were similar.
Table 6.8. Grain yields ('000 kg/ha) and blight scores of two sorghum cultivars planted in the 1980 Regional Variety Trial.
(SC108-3xCS3541)3-l Yield Blight Score
E 525 HR Yield Blight Score
Alupe Nambale Murumba Mean
Kabura Bondo Gobei
4.21 1.78 0.56 2.18
2.62 3.40 2.88
3.3 3.0 4.3 3.5
1.0 2.3 1.5
6.74 2.57
2.58 4.00
2.37 2.94 3.84
1.0 1.0 1.0 1.0
1.0 1.0 1.0
In 1981 all trials were effectively protected from midge and meaningful comparisons could be made between all entries. Although, compared to 1980, the 1981 rainfall pattern was less favourable for the development of the leaf blight disease, the general picture was confirmed. Susceptible entries had higher leaf blight scores in Zone B than in Zone C. For instance, scores for the susceptible 'NES 830x705' averaged 2.9 and 1.9 for the Zones B and C, respectively. However, scores for the Bondo site showed that even in Zone C leaf blight incidence can be high. The mean score for Bondo was 2.4; the highest disease score (3.5) was recorded for '2KX 17'.
In 1981 the group of early-maturing brown cultivars showed slightly lower susceptibility to leaf blight than the group of early-maturing white cultivars. In 1981 leaf blight scores, averaged over all sites, were 1.7 and 2.0 for the groups of brown and white cultivars, respectively.
Ratoon crops When the planted crop of an entry was seriously affected by leaf blight, results (Table 6.9) show that little can be expected from the performance of the entry's ratoon crop. At sites where blight incidence was high, ratoon survival rates of susceptible entries were much lower than those of tolerant entries. Although differences in susceptibility may have played a role, yield gaps between ratoon crops of susceptible and tolerant entries mainly originated from differences in plant populations.
Similar observations were made in other years. It appeared that planted crops should be healthy as a precondition for satisfactory ratoon crop yields. However, the performance of 'E 525 HR' at Bondo (Table 6.9) indicated the existence of other preconditions; further research was needed.
109

Another reason why differentiation between resistant and susceptible cultivars should not be based on Striga counts alone, was identified through our trials. A heavily diseased cultivar will show no vigorous growth. Consequently, this cultivar will induce fewer Striga to germinate and emerge. The lower counts for this cultivar are probably due to reduced vigour and not to a resistance mechanism. Such a situation is expected to have occurred for the cultivar (SC108-3xCS3541)3-l in 1980, showing low Striga counts but being seriously hit by leaf blight.
We took these warnings seriously. Our conclusions on the performance of entries in relation to Striga incidence are therefore based on Striga counts, yield data and observations on general agronomic expression. During several field visits an impression was gained on the general agronomic expression of individual entries. Useful objective measurements for agronomic expression appeared to be 'days to flower' and 'crop height'.
Striga count The literature review showed that Striga counts for entries grown at the same site may differ due to: - non-uniform Striga infestation of the trial field; - differences in resistance to Striga between entries. So far three resistance
mechanisms have been identified: (1) low stimulant production by host roots; (2) mechanical barriers to haustorial establishment in host roots; (3) antibiosis factors in host plants after Striga established itself.
Although the experiment was designed as a variety trial and not as a trial to identify potential sources of Striga resistance, it was anticipated that the large number of observations would sufficiently protect us against misleading conclusions due to non-uniform Striga infestation of trial fields. In 1980 a total of 24 plots (6 sites, 4 replicates) per individual entry was used for Striga count observations. In 1981 a total of 32 plots (8 sites, 4 replicates) per entry was used for Striga observations. As some entries featured in both years an evaluation of Striga susceptibility of these entries is based on 56 plots.
Tables 6.10 and 6.11 show that Striga counts are varying according to cultivar and crop. Among the sorghums, some cultivars (MY 146, E 525 HR) had consistently lower Striga counts than some others (Hijak, NES 7360).
Although the maize hybrids supported a similar number of emerged Striga plants per square metre, it should be realized that the plant population of maize is only about 38% of that of sorghum. With similar Striga counts per square metre for maize and sorghum, the number of emerged Striga plants supported by an individual plant is a factor 2.6 higher for maize than for sorghum. This may be another reason why maize hybrids compared to sorghum performed less well in Striga-'mfested fields. Detailed observations on maize performance in relation to Striga incidence are presented below (under agronomic expression).
112

Within replicate differences in Striga counts were analyzed using the sign test. For 1980 the analysis was based on the signs of the differences between paired Striga counts for plots with the sorghum cultivars MY 146 and Hijak (a sorghum hybrid). For 1981 paired Striga counts for plots with the sorghum cultivars MY 146 and NES 7360 were used.
Based on the sign test results it is concluded that: - the 1980 paired Striga counts differed significantly (P<0.01) for 'MY 146' and
'Hijak' plots. In both B and C Zones Striga counts for the 'MY 146' plots were significantly lower (P<0.01) than those for the 'Hijak' plots.
- the 1981 paired Striga counts differed significantly (P<0.01) for 'MY 146' and 'NES 7360' plots. Striga counts for the 'MY 146' plots were significantly lower than those for the 'NES 7360' plots in Zone B (P<0.05) and Zone C (P<0.01).
There are strong indications that the sorghum cultivar MY 146 stimulates fewer Striga plants to emerge. This is probably due to 'MY 146' having better resistance mechanisms for Striga compared to other cultivars.
Grain yield When grain yields (Tables 6.3 and 6.5) are studied in relation to Striga counts (Tables 6.10 and 6.11), two issues feature prominently. The first issue concerns the increase in experimental error due to the non-uniform pattern of Striga infestations. This has lowered the precision of experimental results. High coefficients of variation are reported for many trial sites. Consequently, yield comparisons among cultivars can be made less accurately. As the Striga infestation level has an impact on the crop production level, the use of the analysis of covariance seems appropriate. By adjusting grain yields for differences in Striga infestations lower experimental errors and more accurate comparisons among cultivars may be obtained. However, a correct measurement for Striga infestation is needed to apply the analysis of covariance.
Unfortunately the recorded Striga counts cannot serve as a correct measure for Striga infestations of plots. Our Striga counts (X) or transformed Striga counts (X' = V (X + 0.375)", see Ramaiah (1983)) are not independent from cultivar choice. Some cultivars (Hijak, NES 7360) have higher counts than others (MY 146), probably due to differences in resistance mechanisms. Adjustment for counts then leads to distortion of grain yields as it tries to compare cultivars at some average Striga count level that cultivars do not attain in practice. This may lead to misinterpretation of data (Steel and Torrie, 1960; Snedecor and Cochran, 1967).
Other suggested possibilities to provide a correct Striga infestation index (often based on the use of other within-replicate counts), are frustrated by: - the enormous within-replicate variability of Striga infestations; - the experimental design, which had been chosen to identify cultivar differences
in grain yield production and not in Striga susceptibility.
113

Table 6.12. Striga counts (No. of emerged plants per m2) on planted crops and ratoon survival rates (%) and grain yields {'000 kg/ha) for ratoon crops of two entries; 1981 Variety Trial.
Area
Zone B
Zone C
Site
Chakol
Alupe
Murumba
Kabura
Gobei
Entry
NES 7360 MY 14 6 NES 7360 MY 146
NES 7360 MY 14 6
NES 7360 MY 146
NES 7360 MY 14 6
Planted Striga
28.9 9.2
0.0 0.0
31.0 15.0
49.0 0.2
98.9 4.0
crop count
Ratoon c Survival
15.5 27.3
5.0 8.4
26.5 47.7
20.8 57.0 25.2 51.2
rop rate Yield
0.43 0.85 0.08 0.16 0.72
1.11
0.19 0.97 0.37
1.13
6.3.5 Ratoon survival and ratoon performance of entries
The performance of ratoon crops in 1979 was very satisfactory and further research on the potential of the ratooning policy seemed justified.
However, the 1980 and 1981 results (Tables 6.3, 6.5, 6.13 and 6.14) show that satisfactory ratoon yields were only obtained in case plant populations of ratoon crops were sufficiently high. These plant populations depended on the percentage of plants that survived and produced regrowth after being cut back (ratoon survival rate).
Table 6.13. Ratoon survival rates (%) of entries grown in the 1980 Regional Variety Trial.
Entries
MY 146 Local Sorghum
Hijak (CK60AXSB65) 5DX 135/13/1/3/1 E 525 HR Dobbs Bora 3DX 57/1/H/4 9DX 5/41/1
Diall.Pop. 1008-801 (SC108-3XCS354D3-1
Remaininq Entries [-) Mean
F ratio for Entries LSD (5% level) CV
Type
Br Br Br
Br Br Br Br W
W W
Zone B Nambale
90.2 79.8 57.3 95.7 94.7
69.6 56.9 52.3 55.4
22.8
(-) 65.8 21.8** 14.5 15.4%
Murumba
78.2 87.3 32.6 69.5 62.0 71.9 27.6 43.1 55.7
5.7
(-) 56.9 17.6** 17.1
20.8%
Zone C Kabura
84.1 85.8 84.4 79.8 71.4
81.1 80.3
78.9 64.8 63.0
(-) 76.9
1.9ns 18.0 16.3*
Bondo
8.2 15.9
1.3 2.3 5.3 3.8 4.6 6.4
3.2 0.7
(-) 6.5 2 .8** 8.6
92.3%
Mean
65.2 67.2 43 .9
61.8 58.4 56.6 42.4 45.2
44.8 23.1
(-)
Notes: Entries arranged in descending grain yield order (Table 6.3); for an explanation of signs see notes under Table 6.2.
Once the precondition for adequate plant populations was met, grain yields of ratoon crops were further determined by the distribution and total amount of rainfall in the second rains. High ratoon yields were only obtained in case moisture supply to crops was favourable. An interaction between cultivar and target zone was observed (Table 6.15). The ratoon crop of local sorghums often took too long to mature in the drier Zone C. Compared to earlier maturing cultivars grain filling of local sorghum ratoon crops was more jeopardized by drought.
116

Table 6.14. Ratoon survival rates (%) of entries grown in the 1981 Regional Variety Trial.
Entries
Local Sorghum
Dobbs Bora MY 146
Serena IS 76 TI/23 E 525 HR 5DX 135/13/1/3/1 2KX 76/325
NES 830x705 E 35-1 Ind.Syn. 387-1
3DX 57/1/H/4 2KX 17 SPV 3 70
NES 7360 Mean F ratio for Entries
LSD (5* level) CV
Type
Br Br Br Br W Br Br W W W W Br W W
W
Zone B Chakol
75.1 13.8 27.3 32.9 20.0 23.3
13.1 28.2 26.2 33.4
40.9 15.6 13.8 18.7
15.5
26.5 7.4**
16.6 43.8%
Alupe
33.0
9.3 8.4
7.0 7.1 8.7
3.8 10.1
7.9 15.5 11.0
5.7 7.2 6.0
5.0 9.7
5.5** 8.6
62.0%
Murumba
74.7
61.8 47.7
41.3 47.8
26.1 35.2
50.6 17.6 32.2 38.1 23.9 59.4 26.6 26.5 40.6
4.4** 22.0
38.0%
Zone C Kabura
75.2 27.0 57.0 44.2 53.1 36.5 37.2
32.9 36.5 38.1 46.1 17.1 26.7
50.3 20.8 39.9
3.0** 25.0 43.9%
Gobei
74.1 69.4 51.2 64 .4
77.9 62.8 74.5
47.9 58.2 61.3 78.1 47.9 62.2 51.6 25.2 60.4
3.4**
21.9 25.3%
Mean
66.4 36.3 38.3 37.9 41.2 31.5 32.8
33.9 29.3 36.1 42.8 22.0
33.8 30.6 18.6 35.4
Notes: Entries arranged in descending grain yield order (Table 6.5); for an explanation of signs see notes under Table 6.2.
Many factors influenced the rate of ratoon survival. Some factors such as leaf blight and Striga incidence have already been discussed. In this sub-chapter only the performance of healthy and S/riga-tolerant cultivars will be discussed.
In 1979 the ratoon survival rate had been well over 50% for most entries. 'E 525 HR', for example, had a mean ratoon survival rate of 60.2% and 55.8% at the trial sites of Nambale and Ahero, respectively. However, the 1980 and 1981 results (Tables 6.13 and 6.14) show that the ratoon survival rate was strongly affected by the choice of trial site and cultivar. In trying to find explanations, attention was attracted by the difference in rate of ratoon survival between a group of promising early-maturing brown cultivars and the local sorghum check (Table 6.15). In both years the group of early brown cultivars consisted of MY 146, E 525 HR and 5DX 135/13/1/3/1.
Table 6.15. Mean ratoon survival rates (%) and mean ratoon grain yields ('000 kg/ha) for a group of selected early-maturing brown cultivars and the local brown sorghum check; 1980 and 1981 Regional Variety Trials.
Area
Zone B
Zone C
Site
Alupe (1981) Chakol (1981) Murumba (1981) Murumba (1980) Nambale (1980)
Bondo (1980) Kabura (1981) Gobei (1981) Kabura (1980)
Early group Survival
7.0 21.2 36.3 69.9 93.5
5.3 43.6 62.8 78.4
rate Yield
0.17 0.64 0.98 1.73 1.32
0.28 0.74 1.27 0.82
Local check Survival
33.0 75.1 74.7
87.3 79.8
15.9 75.2 74.1 85.8
rate Yield
1.76 2.25 1.61 2.09 1.74
0.02 0.90 0.61 0.86
117

At most sites survival rates for local checks were better than those for the early group. However, an interaction was present. At sites with low survival rates for the group, rates for the local check were much better. With increasing survival rates for the group, however, the gap between the rates for group and local check narrowed and ultimately disappeared.
Post-flowering moisture stress at the end of the first rains appeared to have strongly influenced the rate of ratoon survival. The observed interaction on ratoon survival indicated that the group and the local check did not react similarly to such stress.
The level of moisture stress on grain filling crops was site-specific. It depended on a combination of factors, such as the distribution and amount of rainfall in the period of grain filling and the water storage capacity of the soil. Some examples will illustrate the effect of post-flowering moisture stress on the rate of ratoon survival.
Compared to 1980, overall ratoon survival rates (Tables 6.13 and 6.14) were much lower in 1981. The 1981 rainfall records for Alupe showed that the first rains were heavy but rather short (10 weeks). They were followed by a severe drought lasting from 20 May to 15 July, when most cereals were grain filling. This rainfall pattern was more or less representative of the entire target area. Therefore in 1981 grain filling of planted crops often took place under conditions of moisture stress.
The Bondo (1980) and Alupe (1981) trial sites showed extreme low ratoon survival rates. At both sites soils were shallow; their water storage capacity was limited. At these sites the post-flowering moisture stress was severer and lasted longer than at other sites with deeper soils.
The literature review on ratooning (Chapter 8.4) shows that during a post-flowering stress redistribution of carbohydrates from the stem to the head is encouraged. This redistribution weakens the stem but stabilizes the production of grain. If severe moisture stress occurs over an extended period of time the carbohydrate reserves in the stem will have dropped to low levels. However, when the crop is cut back for ratooning, the stem reserves in the basal internodes are needed for: - maintenance of the living stubble tissue; - initial supply of carbohydrates to the growing buds and ratoon tillers that have
neither roots nor leaves. Ratoon survival rates will therefore show a strong relationship with the degree of depletion of the stem reserves.
Interaction between cultivar and post-flowering moisture stress on ratoon survival made clear that cultivars react differently to such stress. The literature review on ratooning (Chapter 8.4) indicates that cultivars differ in their capacity to redistribute carbohydrates from the stem to the head. Cultivars bred for high potential yields (e.g. the group of early-maturing brown sorghums) have strong head sinks and are relatively easily redistributing carbohydrates from the stem to
118

the head. Local sorghums are less capable of such redistribution. These cultivars often have tall stems and active stools capable of competing with the head for available carbohydrates. Due to the lower yield potential of local sorghums the demand for carbohydrates by the head sink is also less strong. In periods of post-flowering moisture stress, the stem reserves of local sorghums will therefore not be depleted as far as that of the group of early brown sorghums. Consequently, after post-flowering stress local sorghums will produce better ratoon survival rates than the group of early brown sorghums. Survival rates for the two will only be at par when soil moisture conditions are favourable in the grain filling period.
Especially when ratoon survival rates are low the tillering ability of cultivars is an important additional characteristic determining final ratoon grain yields. It was observed that local sorghums were able to produce more vigorous tillers than the group of early brown sorghums. After being cut back the local sorghum probably remained with a more active stool that also had a higher content of carbohydrates. Especially in Zone B this had a stabilizing effect on the ratoon crop yield of local sorghums.
6.4 CONCLUSIONS
When crops are planted in March the group of early-maturing brown sorghums will consistently produce more grain compared to the late-maturing local sorghums. The promising group consists of the cultivars 5DX 135/13/1/3/1, MY 146, E 525 HR and Serena. They all mature in 110-120 days. These cultivars are originating from the former EAAFRO sorghum improvement programme at Serere, Uganda. Even the cultivar MY 146, collected from a field in the Machakos-Yatta area of Kenya, is believed to be a Serena offspring.
Some promising white sorghum cultivars, maturing in 110-120 days, have also been identified, viz. 2KX 76/325, IS 76 TI/23, SPV 370 and 2KX 17. Again two genotypes are originating from the former EAAFRO programme (2KX series). These white cultivars produce similar but mostly better grain yields than the later maturing local brown sorghums.
However, the group of brown sorghums consistently produces better yields than the best white sorghum cultivars. This is due to better adaptation of the brown cultivars especially with respect to Striga hermonthica and leaf blight incidence. A local improvement programme to breed white cultivars with more tolerance to Striga and leaf blight incidence seems justified.
Successful introduction of sorghum hybrids in local farming systems is not possible yet. The currently available hybrids are far too sensitive to Striga incidence. The local hybrid improvement programme should focus first on identifying Sfn'ga-tolerant parent material.
119

The promising brown and white sorghum cultivars outyield the recommended maize hybrids H632 and H511, especially in the drier Zone C. The yield gap between these maize hybrids and sorghums is particularly large in Sfn'ga-infested fields. The maize hybrids are sensitive to Striga. A local maize improvement programme to breed more Striga tolerance into the maize hybrids seems promising.
The success of sorghum plantings in March is highly dependent on the type of seasonal rainfall pattern.
In years with January and February grass rains, high shoot fly incidence levels prevent unprotected sorghum plantings in March from being successful. In these years later planted sorghum crops will also suffer from sorghum midge incidence if sorghum crops flower earlier on nearby fields. Both pests use sorghum fields planted in January and February to build up their populations.
In years without grass rains, unprotected sorghum plantings in March are very successful. Because local sorghum crops are also planted late, the time for shoot fly and sorghum midge to build up their populations, is insufficient.
To formulate relevant recommendations for local sorghum cropping systems in which insecticides do not play a role yet, we expanded our research into the relationship between seasonal rainfall patterns and population build-up of shoot fly and sorghum midge (Chapter 7.2). Under current farming conditions, avoidance of pests by adjustment of planting dates seems to be the most appropriate control method.
The grain yield of a sorghum ratoon crop depends on two factors: - the rate of ratoon survival. This determines the plant population of the ratoon
crop. Local sorghums have similar but mostly better rates than the promising early sorghums. Post-flowering moisture stress results in low rates particularly for the high yielding early-maturing sorghums.
- the rainfall pattern in the second rains. Although local sorghums have better survival rates this does not always result in higher grain yields. Due to the short growing season grain filling of local sorghums is more at risk, especially in the drier Zone C.
The ratoon policy appears to be not as promising as had been assumed at the start of the Project. Ratooning of selected early-maturing sorghums has to be optional; only in the case of high survival rates is ratooning recommended. With poor survival rates the ratoon should be ploughed in to release the field for other crops. Research on relay or double cropping patterns (e.g. sorghum followed by cotton) as well as identification of promising sorghum cultivars for planting in the second rains should be given higher priority in future programmes.
120

Photo 6: Two shoot fly eggs attached to the undersurface of a sorghum leaf.
Photo 7: Early planted sorghum crop not damaged by shoot fly. In most plants only healthy central shoots have developed.
Photo 8: Late planted sorghum crop heavily damaged by shoot fly. Plants have developed in tussocks of shoots with numerous deadhearts.
121

Photo 9: A female adult of sorghum midge laying eggs in sorghum spikelets with parted glumes and protruding anthers.
Photo 10: Relationship between planting date and midge damage level; with increased delay in planting, more spikelets are empty or contain shrivelled grains.
122

7. TIME OF PLANTING AND SORGHUM AND MAIZE PERFORMANCE
7.1 INTRODUCTION
Households decisions on cropping patterns and crop calendars depend on factors such as reliability of the rainy season and security of food (Chapter 4). Available resources for land preparation and planting also play an important role. Due to the short rainy seasons timely land preparation and planting are required. Yet, the limited labour and draught resources ensure that planting of maize and sorghum crops is spread from February until April. Survey reports (e.g. CIMMYT, 1977a) recommend that the sorghum and maize commodity programmes should concentrate on the development of early-maturing cultivars. These would increase management flexibility. When plantings are delayed these cultivars stand a better chance of maturing before the end of the rainy season. However, they have to be screened for insensitivity to time of planting.
The time of planting (TOP) effect is a widely observed phenomenon in maize and sorghum cropping in Kenya (Cooper and Law, 1977; Arkel, 1980). Early plantings produce much higher yields than late plantings. Most research on TOP was conducted on maize grown in a highland environment (altitude: 1900 m). A number of explanations have been published to account for the TOP effects in maize: - late plantings are more attacked by fungal leaf diseases (Hemingway, 1955); - late plantings benefit less from the flush of soil nitrogen mineralization at the
onset of the rains, when soils undergo wetting and drying cycles (Birch, 1960); - late plantings are more frequently suffering from moisture stress during the
tasselling and grain filling stages (Dowker, 1964); - late plantings are more affected by progressive deterioration of the aeration of
the soil (Allan, 1972).
However, extensive research by Law and Cooper (e.g. Law, 1974; Cooper, 1974; Law and Cooper, 1976; Cooper and Law, 1977) revealed that none of the explanations mentioned above could account for the pronounced TOP effect in the highlands of Kenya. Their research indicated that soil temperature differences during the first five weeks of maize growth were mainly responsible. In this period the maize apical meristem stays below ground level and initial growth is mainly influenced by soil temperatures. As soil temperatures are rapidly decreasing after the start of the rainy season, the initial growth was much slower for late plantings. Grain yield differences resulting from planting date differences were closely correlated with the DM-weight of five week old maize plants. Differences in soil temperature after the initial five weeks of growth had no substantial effect on final grain yield.
Subsequent research at Kitale (Hawkins, 1979; Hawkins and Cooper, 1981) did not confirm the findings of Law and Cooper. Detailed recording showed that daily mean soil temperature changes by only 2-3 °C during the year at Kitale. Reductions in growth rate of 30% in late planted maize were associated with soil temperatures
123

of only 0.7 °C less than that of early planted maize. Consequently, differences in soil temperatures could not be responsible for the lowered growth rates in late planted maize; the reasons remained unclear. These studies suggest, that the TOP effect is more complex than often thought.
Arkel (1980) tried to combine these results with his TOP research findings in sorghum cropping in the highlands of Kenya. However, his findings are not based on a 'youth growth analysis'. Arkel argued that two main factors are responsible for the TOP effect in maize and sorghum cropping in the highlands of Kenya, viz.: - total rainfall and its associated decrease in soil temperature; - length of the rainy season in relation to time required for undisturbed crop
development.
Arkel warned against indiscriminate extrapolation of his TOP findings to lower altitude areas. He reported for instance, that in the Kenyan highlands no relationship existed between TOP and pest scores. He stated this to be an unusual situation as delayed plantings of sorghum in the lowlands are often strongly correlated with increased damage by shoot fly.
Because TOP showed to be a complicated problem involving many interacting factors, we had to split the topic into more manageable components. Based on previous research efforts in Kenya and the importance of pests in sorghum cropping areas (Uganda, India) having more comparable environmental settings to that of the target area, research focused on: - relationships between planting dates, rainfall pattern and pest damage
(Chapter 7.2). Shoot fly and midge damage to sorghum planted on different dates were observed. To investigate seasonal damage fluctuations by each individual pest, no interaction between the two pests was permitted. Emphasis was put on pest damage scores;
- relationships between planting dates, youth growth, length of growing period and final yield of sorghum using maize as a reference crop (Chapter 7.3). The trial was fully protected from shoot fly and midge to investigate if youth growth differences and/or the increasingly shorter growing period could explain part of the TOP effect;
- the relative importance of factors accounting for the TOP effect in local sorghum systems (Chapter 7.4). To study this component some on-farm TOP yield trials were conducted. Attention was focused on three factors: shoot fly damage, midge damage and length of the growing period. Sorghum was grown with and without protection from shoot fly and/or midge. Interaction between the two pests was also possible; the design allowed such to be identified. The existence of 'fully protected' plots for each planting date made it possible that yield reductions due to increased pest incidence could be compared with those due to the increasingly shorter growing period.
124

7.2 PLANTING DATE, RAINFALL PATTERN AND PEST DAMAGE
In many sorghum growing areas, time of planting in relation to pest damage is an important factor determining final sorghum yields (Chapter 3.3). Related management advices are often believed to be within reach of households as they involve little cash. However, we realized that local constraints on land preparation are preventing all crops from being early planted. Therefore, we had to investigate whether shoot fly (Atherigona soccata) and sorghum midge (Contarinia sorghicola) were important enough to determine the local sorghum cropping calendar. If so, this could have far-reaching consequences for the cereal cropping system as a whole.
7.2.1 Seasonal fluctuations in shoot fly damage; 1979-1982
Objective
The objective of the observations was to investigate seasonal fluctuations in shoot fly damage to a sorghum crop over a number of years. Due to this long-term approach it was anticipated that: - the relationship between local rainfall patterns and incidence of shoot fly could
be better described; - the importance of shoot fly in determining the local sorghum cropping calendar
could be identified.
Materials and methods
The trial was located at the Alupe ARS in the wetter Zone B of the target area. The cultivar E 525 HR was used as a sorghum test crop. An unreplicated observational trial was conducted. The first plot was planted in March 1979. Subsequently, plots were planted at two-weekly intervals. The last plot was planted in October 1982. The experimental plot size was 4 m long and 2.25 m wide (3 rows spaced at 0.75 m apart). Fertilizer use was restricted to 20 kg/ha N and 20 kg/ha P205 applied to the planting furrows. Shoot fly control was not practised. Plots were thickly seeded and kept weed-free by hand weeding. Selective thinning to desired plant populations (133,000 pl/ha) occurred 10 days after germination; the healthier plants remained. Consequently, about 120 plants per plot were used for shoot fly incidence observations. In years with a severe January-February dry season, plots were watered to induce germination and initial growth of sorghum to make observations possible. Two weeks after plots had germinated, the number of plants with 'deadheart' main tillers and the number of total plants were counted. The deadheart plants were uprooted and buried to minimize internal reinfestations. Similar records and actions were taken 3, 4, 5 and 6 weeks after germination. Subsequently, all remaining plants were uprooted and buried and the plot was abandoned.
125

In 1982 it was difficult to establish an optimum period for planting. The grass rains started early but remained weak. Moreover, the onset of the first rains was late (21 March). Many fields were planted by early February, but due to drought crop establishment was poor. However, sufficient young seedlings survived on which shoot fly could multiply. Sorghum planted in late March to early April (including resowing and gapfilling) seriously suffered from shoot fly attack.
Shoot fly damage levels were lower during the short dry season in between the first and second rains as climatical conditions are less favourable for multiplication. However, they were still significant as many households are ratooning small parts of their sorghum fields or permit uncontrolled regrowth of sorghum on fallowed fields. Consequently, shoot fly can survive and maintain high population levels. When the second-rain cropping season starts shoot fly damage rapidly increases to high levels again. When plantings of early-maturing sorghums are introduced during the second rains, one has to face these high shoot fly incidence levels. Timely planting of sorghum seems to be even more important in the second rains.
7.2.2 Seasonal fluctuations in sorghum midge damage; 1979-1982
Objective
The objective of the observations was to investigate seasonal fluctuations in midge damage to a sorghum crop over a number of years. Due to a long-term approach it was anticipated that: - the relationship between local rainfall patterns and incidence of sorghum midge
could be better described; - the importance of sorghum midge in determining the local sorghum cropping
calendar could be identified.
Materials and methods
The trial was located at the Alupe ARS. 'E 525 HR' was used as a test crop. An unreplicated observation trial was conducted. The first plot was planted in March 1979. Subsequently, plots were planted at two-weekly intervals. The last plot was planted in October 1982. Fertilizer use was restricted to 20 kg/ha N and 20 kg/ha P205 applied to planting furrows. Full protection from shoot fly was provided by applying carbofuran granules to planting furrows. Protection from stalk borer was provided by applying trichlorphon granules to plant whorls at two-weekly intervals. During dry seasons newly planted plots were not watered; as midge attacks during flowering, flowering rather than germination dates are important. Plots were thickly seeded and kept weed-free. Three weeks after germination crops were thinned to desired plant populations (133,000 pl/ha). Protection from birds was provided by using bird-protecting wire netting and employment of bird-scarers.
128

Plots were 12 m long and 3.75 m wide (5 rows spaced at 0.75 m apart). The planting pattern of rows was as follows: from 0-5 m sorghum was planted, from 5-7 m maize was planted and from 7-12 m sorghum was again planted. Consequently, two paired sub-plots of sorghum were available for observations. Per planting date one sub-plot was protected from midge by endosulfan applications; spraying took place at two-day intervals during the flowering period. The other sub-plot was not protected from midge. The paired sub-plots were separated by the maize strip to minimize effects of drift of insecticide. Although all heads were harvested, only the heads of the three middle rows were used for grain yield determination of sub-plots. However, the actual field lay-out of the experiment varied among years as will be discussed below.
Records on date of 50% flowering, stand and head count, threshed grain yield, and grain moisture content were taken per sub-plot. Reported grain yields contain 12.5% moisture. Unthreshed heads for sub-plots were visually scored for midge damage.
Results and discussion
For each pair of sub-plots a unique flowering date was recorded. Using the grain yields for each pair of sub-plots it was possible to estimate midge damage in relation to flowering dates. As paired sub-plots only differed in protection from midge (full versus none), midge damage could be estimated by the difference in grain yields between the two paired sub-plots. Expressing this difference as a percentage of the protected sub-plot yield provided a useful index for midge damage levels. Plotting of midge damage levels for different flowering dates is then possible. Results for the various years are presented in Figure 7.2. Rainfall totals for each 5-day period (pentade) of 1979-82 are also presented in Figure 7.2. This facilitates a discussion of midge incidence in relation to seasonal rainfall patterns. Results are probably only representative of Zone B of the target area.
In the 1979 field lay-out the second plot was planted adjacent to the first. Two weeks later a third plot was planted adjacent to the second, and so on. In 1979 all protected sub-plots were located on one side of the experiment, all unprotected on the other. This facilitated spraying.
In 1979 it was difficult to separate midge damage due to internal reinfestations from midge damage due to spread of infestations from surrounding fields. Prevention of internal reinfestations for midge is not as simple as for shoot fly, where scoring of damage and removal of infestation sources (deadheart plants) is possible before reinfestation of adjacent plots can take place. Unfortunately, midge damage cannot be accurately estimated prior to the late grain filling stage. Thus scoring of damage can only take place after emergence of the new midge generation. It became clear that once midge was inside the trial the 1979 lay-out guaranteed favourable conditions to maintain high internal populations.
129

Internal reinfestations determined trial results as was stressed by observations in January-February of 1980. Due to severe drought a period occurred in which none of the plots flowered (Period A in Figure 7.2). As climatical conditions in this period were also unfavourable for midge emergence, the cycle of continuous internal reinfestations was interrupted. The few emerging midge adults found no flowering heads to lay their eggs. Midge larvae in diapause were taken to the laboratory as harvesting of plots with mature crops continued. Consequently, no sources for internal reinfestation remained and midge damage dropped to very low levels. The literature review (Chapter 3.3.3) supports these findings.
In 1980 the field lay-out was changed to prevent internal reinfestation. Although plots for successive planting dates remained adjacent, the 1980 lay-out showed a systematic zigzag pattern for protected and unprotected sub-plots. This pattern prevented unprotected sub-plots for two successive dates from being adjacent. However, the 1980 results showed that the adjustments were insufficient to prevent internal reinfestation; distances between unsprayed plots were too small.
Results for the January-February dry season in 1981 confirmed the 1980 findings. Again a period of drought in which no plots flowered (Period A) interrupted the cycle of continuous internal reinfestations.
In 1981 a lay-out was used similar to that in 1980. However, 7 days after flowering all heads on protected and unprotected sub-plots were covered with bags. It was intended to trap and kill the coming generation of midge inside these carefully tied bags, thus preventing internal reinfestation from taking place. The bags had 'windows' of muslin cloth to prevent mould development. Unfortunately bags did not last until harvest. After 3 weeks these bags were full of holes due to insect damage. Termites quickly destroyed bags of any lodged plants. As midge could escape, the pattern for internal reinfestation was similar to 1979 and 1980.
When in July 1981 it was realized that internal reinfestation had not been prevented, bagging was stopped. Instead, a few plots were uprooted where sorghum had not yet reached the flowering stage. Consequently, a period was created in which no flowering occurred (Period B in Figure 7.2). When plots adjacent to the uprooted plots started flowering, hardly any midges were present and damage levels were very low. The cycle of continuous internal reinfestations was again interrupted. However, once internal reinfestations were again permitted, the results show that even in the second rains it was possible for midge to build up and reach high damage levels. Once these levels were reached, plantings were interrupted until the start of the subsequent rainy season. This again created a period in which no flowering occurred (Period C in Figure 7.2) interrupting the cycle of continuous internal reinfestations.
The 1979-81 results indicated that once midge was inside the trial, damage levels were no longer representative. To estimate midge damage levels for different planting dates under normal field conditions, it was necessary to prevent internal reinfestations.
130

pentode rainfall totals (mm) trial start
midge damage (%)
r-100
A | M | J | J | A
pentade .flowering date
Figure 7.2. Effect of flowering date on midge damage to a sorghum crop in relation to the 1979-82 rainfall pattern. For each flowering date plotted midge damage is estimated as the reduction in grain yield (%) by comparing yields from two paired plots differing only in protection from midge (for Periods A, B and C; see text).
131

As the 1980 and 1981 methods for prevention of internal reinfestation had failed the field lay-out was radically changed in 1982. The idea of one experimental field on which adjacent plots were sown according to a systematic sequence of planting dates was abandoned. Instead four experimental sub-fields were used, all located in one large field. The distribution pattern of these sub-fields was systematic; each sub-field was located in one corner of an imaginary square with sides of 150 metres. The first plot was planted on the first sub-field, the second on the second sub-field and so on. However, the fifth plot was again planted on the first sub-field adjacent to the first plot. The sixth plot was planted adjacent to the second plot and so on. As there was an eight week time-lag between adjacent plantings on each sub-field, plots matured and were harvested before adjacent plots were flowering. Consequently, internal reinfestation of sub-fields could not take place. Midge damage levels were a true reflection of damage due to spread of infestation from surrounding fields.
In 1982 a close relationship was found between midge damage levels and the flowering period of sorghum crops on surrounding fields. The first peak in damage occurred in late June, 3 weeks after early-maturing crops flowered on fields located within 100 m distance from the experimental field. The second peak occurred in early August, 3 weeks after a late-maturing local sorghum crop flowered on a farmer's field located within 100 m distance. The third peak occurred in mid-September, 3 weeks after the ratoon of the early-maturing crops flowered. The fourth peak occurred in early December, 3 weeks after the ratoon of the local sorghum crop flowered.
We had underestimated the importance of internal reinfestations on farmers fields. Results from the Village Approach Programme in 1982 (Chapter 9) highlighted that in addition to spread of infestation from surrounding fields, internal reinfestation plays an important role in local sorghum cropping systems. Local within-field conditions, which prolong the flowering period and favour internal midge reinfestation, result from: - gapfilling. Due to dry spells at the start of the first-rain cropping season early
planted crops are often gapfilled; - soil fertility heterogeneity. In some parts of the fields low levels of phosphate
may cause a two-week delay in flowering. Plants growing on old ant hills are often among the first to flower;
- shoot fly damage. Late planted crops are often hit by shoot fly. Side tillers of damaged plants flower later compared to healthy main tillers;
- waterlogging and severe Striga infestations. Both factors may cause delay in flowering in some parts of fields.
As results from the Village Approach Programme proved that internal reinfestations also occur in farmers fields, a re-evaluation of the 1979-81 research findings on midge incidence seems justified. The study on the practical value of the 1979-81
132

findings reveals that experimental results needed to be discussed in relation to the yearly occurrence of two periods: - an initial period in which midge population build-up occurred; - a subsequent period in which high population levels were maintained.
The experimental results for the initial period were valuable as they were found to be representative of actual field situations in which: - flowering periods of adjacent sorghum crops were not synchronized; - favourable conditions existed on a field for internal reinfestations.
The experimental results for the subsequent period had no practical value. They could not be related to actual situations occurring in farmers fields. However, they revealed some interesting points on the biology of midge. They indicated that if continuous flowering occurred in July-January high midge population densities could be maintained. However, fluctuations in damage levels also occurred, which could be related to the local rainfall regime. When flowering was preceded by a 10-day dry period, lower damage levels were recorded. Midge emergence is less under dry conditions.
When full attention is focused on the initial period of midge population build-up, the 1979-81 experimental conditions and results can be used to increase the understanding of what happens under actual field conditions.
In the first rains of 1979 a local sorghum field was the source from which midges infested the experiment. Due to early and reliable grass rains this field was planted in late January. Its sorghum crop flowered about 90 days later in late April. Before the first experimental plot flowered (late May) enough time was available for midge population build-up. As the distance between crops was less than 30 m, many midges could infest the first experimental plot. Spread of infestation in itself sufficed to immediately cause extensive midge damage (72% yield reduction).
In the first rains of 1980 a local sorghum crop was again grown on a nearby field. It had been planted in late February and flowered in late May. As midge damage on the late May flowering experimental plot was already substantial (20% yield reduction), internal reinfestations were important. Although spread of infestation may have occurred, internal reinfestations were mainly responsible for the rapid increase in damage.
In the first rains of 1981 no crops were planted before 7 March as no early grass rains occurred. On surrounding sorghum fields early-maturing and late local types were both planted by early March. However, for build-up of midge populations the early sorghums were much more important. As they flowered in mid May the spread of infestation could start 2-3 weeks later. Consequently, the first experimental plot severely hit by midge (45 % yield reduction) flowered in early June. Subsequently, internal reinfestations assisted midge in quickly reaching the 100% damage level.
133

regression coefficients for PD4 (= 1.05) and PD2 (= 1.07) were higher than for PD1 (= 0.95). There were no indications that when plantings were delayed, maize and sorghum plants had a slower initial growth.
Sorghum PD1:lnY=1.15X-3.72; PD2:lnY-1.20X-3.85; PD4:lnY=1.12X-a57;
r=0.972;P<0.01 r=0.965;P<0.01 r=O.995;P<0.0O1
Maize PD1:lnY=0.95X-1.64; PD2:lnY=1.07X-2.31 PD4:lnY=1.05X-2.14;
r=0.997;P<0.001 r=O.992;P<0.0O1
=0.996; P<0.OO1
Weeks after emergence
PD1: • ; PD2: A ; P D 4 : O
Figure 7.3. Transformed plant DM yields in the first 5 weeks of youth growth. Per crop and planting date a curve was fitted (PD1: 14 March; PD2: 28 March; PD4: 25 April).
Figure 7.3 also shows the likely presence of a small quadratic component. Initial growth of individual maize and sorghum plants was not strictly exponential. Although transition from the exponential into the linear phase of plant growth might have played a role, competition between plants was mainly responsible for this quadratic component. In the first 2-3 weeks competition was low; exponential growth was possible as enough space was still available for each plant. In weeks 4 and 5, however, competition between plants increased the more so as the experiment's sampling method for youth growth analysis caused delayed final thinning. In future experiments with destructive sampling, separate observational plots for youth growth and final yields should be used. Final plant populations for both plots can then be established as early as possible. Competition between plants, decreasing the youth growth of individual plants, is then minimized.
Cooper and Law (1977) reported that in the highlands the most obvious difference in growth curves of early and late planted maize was the much slower rate of youth growth for the latter. They found that grain yields were closely correlated with these plant DM yields at 5 weeks post-emergence. Some of their results are reported in Table 7.2.
136

Table 7.2. Plant DM yields at 5 weeks post-14 -day intervals on four different dates in
DM yie Planting date 14-03
1972 18.6 1973 19.9 1974 14.6 1975 16.9
Ld
emergence for the maize hybric a highland environment (1972-
(q/clant 28-03
15.8 15.7 13.0 17.9
11-04
8.9 14.1 10.0 10.0
H613 75) .
-C planted at
25-04
6.7
13.1 6.3
6.1
Note: based on Cooper and Law (1977).
By comparing Tables 7.1 and 7.2 it turns out that effects of time of planting on youth growth are not similar in the highlands (Kitale: 1900 m altitude) and the target area (Alupe: 1200 m altitude).
Further analysis of the Alupe data confirmed these findings. For both maize (P>0.05) and sorghum (P>0.25) the analysis of variance showed no significant effect of time of planting on plant DM yields at 5 weeks post-emergence. No confirmation was found that the first five weeks of growth are also critical for crop production in the Busia-Siaya target area.
The DM yields for maize plants at 5 weeks post-emergence were slightly higher at Alupe (PD1-4; Table 7.1) than at Kitale (PD1; Table 7.2). This may be due to higher temperatures at Alupe. The mean air temperatures in the growing season vary between 24-22 °C at Alupe and between 18.3-16.0°C at Kitale (Cooper and Law, 1977). Soil temperatures must also have been higher at Alupe than at Kitale.
Final yield analysis Some additional results for the four dates of planting are presented in Table 7.3. Grain yields are presented on a 12.5% moisture basis. Other characteristics are reported on a dry matter basis.
Table 7.3. TOP effects on characteristics of maize and sorghum crops planted on four different
dates at Alupe in 1981.
Character
Grain yield ('000 kg/ha) Total DM yield ('000 kg/ha) Grain/stover ratio No. of heads or cobs/plant No. of kernels/head or cob 1000 kernel weight (g) Days to 50% flowering Stem length (cm)
Sorahum
14-03
4.17 7.82 0.88 1.03 1410 22.6
65 167
28-03
4.27 8.09 0.86
0.95 1680 21.4
66 172
11-04
2.87
6.19 0.69
1.11 1050 19.3
65 143
25-04
2.21 4.84 0.66 0.94
935 19.8
67
132
Maize 14-03
2.40 6.29 0.50 0.97
240 214
65 236
28-03
2.36
6.58 0.47 1.00
240 204
66 267
11-04
0.86 4.24 0.21 0.97
85 215
71 198
25-04
0.61 3.41 0.17
0.95 55
247 78
174
The analysis of variance on grain yields of sub-plots showed that: - grain yield was significantly influenced by choice of crop (P<0.05) and planting
date (P< 0.001); - the interaction (crop x plant date) was not significant (P>0.25).
Sorghum produced more grain than maize for all dates of planting. A considerable drop in grain yield occurred when plantings were delayed beyond PD2. Differences between grain yields for PD1 and other planting dates were of the same magnitude
137

for both crops. However, when differences were expressed as the relative decrease in crop yields, maize proved to be more sensitive than sorghum (Table 7.4).
Table 7.4. Diff
first planting
Comparison
PD1 with PD2 PD1 with PD3 PD1 with PD4
erences in date (PD1)
grain yields
is compared
and the with the
relat other
Yield difference (kq/ha) Sorghum Maize
-100 1300 1960
40 1530 1790
Lve yield planting
decrease for dates (PD2-4)
crops when the
Relative yield Sorghum
- 2 % 31% 47%
decrease (1) Maize
1% 64% 75%
Notes: (1)= in percentage of PD1 grain yield; PD1-4: 14 March, 28 March, 11 April, 25 April.
Youth growth analysis could not provide an explanation for these differences. However, the clear TOP effect on final yields could be explained when the 1981 rainfall was studied in relation to crop growth stages for maize and sorghum planted at different dates.
Table 7.5 presents the 1981 rainfall totals for individual growth stages of 120-day cultivars of maize and sorghum if crop growth could have taken place undisturbed (no drought stress). To compose Table 7.5, data presented by Doorenbos and Pruitt (1977) and growth observations at Alupe were used.
Table 7.5. Rainfall totals (1981) for individual crop growth stages and planting dates.
Crop growth stage
Establishment Vegetative Flowering Yield formation Ripeninq Total
Crop growth period
20 35 20
35 10
120
(days) Rainfall 14-03
274.5 380. 6
66.1 23.4 17.9
762.5
totals (mm) 28-03
280.3 214.6
14.5 43.8 39.3
592.5
11-04
178.9 138.3
18.6 72.8
38.1 446.7
25-04
98.2 77.7 17.9
101.8 42.7
338.3
Figure 7.4 presents the local rainfall pattern based on 5-day totals. The planting dates are also indicated. The four flowering dates presented are assuming that undisturbed crop growth was possible. It shows that an extremely dry period occurred between 21 May and 15 July. In this 56-day period only 44.2 mm rainfall was recorded. Compared to other years the 1981 dry season between the first and second rains started earlier and was drier. At what stage this dry period affected the test crops mainly depended on the planting date.
Table 7.5 shows that crops planted on PD3 and PD4 were more seriously hit by drought during the vegetative and flowering stages than crops planted earlier. In the field, crops planted on PD3 and especially PD4 showed severe signs of wilting even before they reached the flowering stage. For the later planting dates both crops showed an increasing reduction of grain/stover ratio, stem length and number of kernels per head or cob (Table 7.3). Such reductions indicate the presence of increasing drought stress. Maize was more sensitive than sorghum. On the PD3 and PD4 plots, maize considerably prolonged the period before reaching the flowering stage (Table 7.3). This is in line with data from literature (Table 3.7).
138

3 40 in
PD2 PD3 PD4
I M t t t t t
1 March April < May
Planting date: PDl-4 = 14 March; 28March; 11 April; 25 April. Flowering date: F1-4 = 17 May; 30 May; 14 June; 28 June.
-P- July _•_
August
Figure 7.4. The 1981 rainfall pattern (5-day totals) with planting (PD) and flowering (F) dates if undisturbed crop growth is assumed.
PD2 crops were doing surprisingly well. The water storage capacity of the 60 cm deep soil on the trial site was limited. Table 3.5 indicates that only 80 mm readily available soil moisture was available to crops when the soil was fully charged. Table 3.6 reveals that this is only sufficient for 15 days of undisturbed mid-season growth of maize. The test site must have received some additional soil moisture due to seepage downslope from higher elevated areas (Chapter 3.2.7). For the PD2 plots this has helped to postpone the effect of drought stress long enough.
7.4 PLANTING DATE, GROWING PERIOD, PESTS AND INTERACTIONS
Objective
This on-farm experiment was designed to investigate the relative importance of three factors (length of growing period; midge damage; shoot fly damage) accounting for the TOP effect in local sorghum systems. The design allowed all factors and interactions to be studied and yield gaps to be quantified.
Materials and methods
Two on-farm locations were planted around Busia in March-April 1981. Both fields (Chakol and Mundika) were located at the top of the local catena. Both soils were 50-55 cm deep and infested with Striga hermonthica.
139

The experiment was replicated in 4 complete blocks at each location and was designed as a (4x2x2) factorial. To facilitate spraying for midge it was laid out as a split-plot. There were 16 treatment combinations based on: - 4 planting dates: 4 March, 18 March, 1 April and 15 April; - 2 midge control levels: no and full; - 2 shoot fly control levels: no and full.
An early-maturing sorghum cultivar E 525 HR was planted using 20 kg/ha P205 in the planting furrow. Three weeks after germination 20 kg/ha N was side-dressed. Carbofuran 5% -granules (13 g per 4 m row) applied to planting furrow were used for shoot fly control. For midge control 35%-endosulfan (1.0 kg a.i./ha) was used; spraying continued at 4-day intervals from first flowering until all plots had flowered. Bird-scarers were employed and rainfall was recorded.
Rows were 60 cm apart. Five seeds per hill were sown, thinned to two plants per hill within 2 weeks. Shoot fly damage was scored at 6 weeks, prior to the final selective thinning to one healthy plant per hill resulting in a final plant population of 110,000 pl/ha. On the remaining plants shoot fly damage was scored again and trichlorphon was applied to control stalk borers. Shoot fly damage was recorded as the number of plants with 'deadheart' main tillers out of the total number of plants. Midge damage was estimated by visually scoring all unthreshed heads at harvest.
The experimental sub-plot size was 4 m long and 2.4 m wide. The entire sub-plot was used for shoot fly damage scores. However, for midge damage scores and grain yield determinations the central 3.0 m of the 2 middle rows were used.
Per sub-plot records were taken on: flowering date, stem length, lodging, Striga incidence, stand and head count, threshed grain weight, 1000-kernel weight and total DM yields. Reported grain yields contain 12.5% moisture.
Results and discussion
Table 7.6 shows the grain yields in relation to the various treatments.
Table 7.6. Grain yields (kg/ha) from sorghum planted at two locations on four dates under different pest control levels.
Location
Chakol
Mundika
Midge control
No No Full Full
No No Full
Full
Shoot fly control
No Full No Full
No Full
No Full
Planting
04-03
3169 4020 3120 3023
3594
4053 3578 4621
date 18-03
1837
2668 2492 2047
2985 3061 3523 3530
01-04
1006 1303 1356 1596
1684 2432 2196 3896
15-04
344 413 644 872
176 431
1707
2517
The statistical method used for a combined analysis of variance over sites is based on Neeley et al. (1991). Bartlett's tests for heterogeneity of variances (for main and sub-plot errors) were not significant. The degrees of freedom (df) and the sums of
140

squares for sources not factorial to sites were pooled over sites. This provided the df-s and sums of squares for computing block, main plot error and sub-plot error mean squares in the combined analysis. Mean squares for other sources had to be calculated. Table 7.7 summarizes the results of the analysis of variance on grain yields for each site as well as those of two different combined analyses.
Table 7.7. Results of the Analysis of Variance on grain yields for each site and the Combined Analysis of Variance over sites when sites are considered 'fixed' (1) or 'random' (2).
Source
Site
Main plots: Midge (M) (Site x M) Sub-plots: Planting date (PD) Shoot fly (S) (Site x PD) (Site x S)
(M x PD) (M x S) (PD x S) (Site x M x S)
Chakol
F-ratio
0.06
97.24 4.14
2.90 4.78 0.17
df
1;3
3,-42 1;42
3,-42 1;42 3,-42
sig
ns
** *
* * ns
Mundika F-ratio
3.39
46.25
13.56
3.84 2.13 2.01
df
1;3
3,-42 1;42
3;42 1;42 3;42
sig
ns
** t *
* ns ns
Combined (1) F-ratio
11.20
3.22
2.58
124.10
17.49 1.98 3.41 6.11 0.00 1.66 6.00
df
1;6
1;6 l;6
3,-84
1;84 3,-84 1;84
3,-84 1;84 3,-84 1;84
Sig
*
ns ns
** ** ns ns
* ns ns
*
Combined (2) F-ratio
16.61
1.24 2.58
62.61 5.12 1.98 3.41 6.51 0.00 1.46 6.00
df
1;6
1;1 l;6
3,-3
l;l 3,-84 1;84
3;3
1,1 3,3 1;84
sig
..
ns ns
** ns ns ns ns ns ns
* Note: Results for 3- and 4-way interactions are not presented unless one of the analyses showed a significant effect (ns= not significant (P>0.05); *= P<0.05; **= P<0.01).
In the first combined analysis of variances over sites, factors and their interactions are studied in only the experimental sites. The sites are considered 'fixed' and the relevant pooled mean square errors serve as the base of comparison. In the second combined analysis of variances over sites, factors and their interactions are studied when the experimental sites are used as being representative of all sites in the recommendation domain. Sites are considered 'random' and relevant mean squares for (site x factor) or (site x factor interactions) serve as denominators in the F-test.
The TOP effect on the grain yield of sorghum in the Busia area has to be discussed in view of three variables: - length of growing season determined by rainfall distribution; - midge population build-up determining damage levels in grain formation; - shoot fly population build-up determining damage levels to young plants. These variables all depend on the development of the agricultural season. Depending on the season, a measured TOP effect may be caused by one variable or a combination of two or even three variables.
Length of growing season In the first rains of 1981 the length of the growing season dominated other variables. The grass rains were absent. In early March the rains came and the season started. However, the rains stopped early. From 20 May until mid-July a severe drought occurred. In this 56-day period Chakol recorded 45 mm rainfall, whereas Mundika recorded 195 mm. The growing season became extremely short. Rainfall totals during growing periods (from planting to harvest) of crops at different planting dates and sites are presented in Table 7.8.
141

Figure 7.5 shows that grain yields in 1981 were determined by the length of the (remaining) growing season. Due to the short growing season in 1981 this factor overshadowed the other two. However, Figure 7.5 and Table 7.9 also show that with increased delay in planting, midge damages increased rapidly. When planting in 1981 was delayed for 6 weeks, midge damage was serious (see also Photo 10).
Shoot fly population build-up Shoot fly damage scores are presented in Table 7.10. As analyses on grain yields show one significant 3-way interaction results are reported per site, midge control level and planting date. Results are presented for the uncontrolled shoot fly situation only. On sub-plots with control shoot fly damage scores were negligible.
Table 7.10. Average shoot fly damages (% deadheart plants) for uncontrolled shoot fly situations shortly before and after selective thinning.
Location
Chakol
Mundika
Midge control
No Full
No Full
level Plantinq 04-03
0 (0) 0 (0)
1 (0)
1 (0)
date 18-03
0 (0) 0 (0)
2 (0) 2 (0)
01-04
21 (15) 14 (10)
3 (1) 3 (1)
15-04
23 (9) 18 (4)
10 (2) 9 (2)
Note: figures in brackets indicate damage percentages after the selective thinning.
Table 7.10 reflects the pattern of shoot fly build-up during the 1981 season. Given a shoot fly life cycle of about 3 weeks around Alupe (Chapter 3.3.2) the pattern can be explained as follows. Because grass rains were absent no population build-up could occur on surrounding sorghum fields before the first trial sub-plots germinated. Damage levels were extremely low for the first two planting dates. Once young plants on surrounding fields were available shoot fly started multiplying. Compared to midge, shoot fly has a longer life cycle. Hence, only limited shoot fly damage levels were recorded for the last two planting dates. As internal reinfestations were prevented as much as possible, the spread of infestations from neighbouring fields played an important role. The distance to farmers sorghum fields was smaller at Chakol than at Mundika. This resulted in an earlier build-up and higher damage scores at Chakol.
Based on experience with population build-up, we realized that shoot fly could never reach high damage levels. The spread in planting dates was too limited. We decided to plant some additional unprotected plots adjacent to the trial on 29 April and 12 May. For these dates shoot fly damage scores were 44% and 81 % at Chakol and 39% and 52% at Mundika, respectively. This reveals that the trial escaped the period with high shoot fly population levels. However, these on-farm results support those from on-station research (Chapter 7.2.1).
Shoot fly damage levels were already low before thinning. At thinning healthy plants were preferred to deadheart plants. Consequently, shoot fly damage levels for remaining plants were even lower. These plants produced the grain yields. Table 7.10 shows that in 1981 shoot fly damage levels after the selective thinning
144

were extremely low. Therefore, shoot fly could not have played an important role in determining grain yields.
Besides, deadheart main tiller plants may produce side tillers. These may escape damage if shoot fly infestations are low. Even at Mundika, where the highest score reached only 15%, many damaged plants must have produced at least one healthy side tiller, substantially reducing the effect of shoot fly damage on grain yields.
However, analyses on grain yield (Table 7.7) often show a significant shoot fly control (S) effect. As the (sites x S)-interaction show no significance, yields can be averaged over sites. Mean grain yields over sites were 2088 and 2530 kg/ha for the no and full shoot fly control treatments, respectively. The treatment difference in grain yields was big and rather puzzling. It could not be explained by a substantial difference in deadheart scores between treatments. These scores over sites were at par (3 and 1% for no and full control, respectively).
Other factors must have been responsible for the substantial yield difference. Shoot fly was controlled by the insecticide carbofuran applied to planting furrows. It is a well known fact that carbofuran has other beneficial side effects (e.g. control of nematodes, early control of stem borers) on the growth of cereal crops. These effects may have resulted in higher yields for the treatment with carbofuran. In future studies on the effect of shoot fly control it is recommended not to use carbofuran. With the use of carbofuran one runs the risk that its shoot fly control effects cannot be separated from its other effects on grain yields.
Table 7.7 shows that a significant (M x S)-interaction exists at Chakol but not at Mundika. Therefore, the (sites x M x S)-interaction is significant in both combined analyses. Based on earlier field observations we had anticipated such situations and the following model systematizes our knowledge of pest interactions.
Imagine we plant two sites; one on which shoot fly populations have built up to substantial levels, the other on which shoot fly populations are still low (as described above the presence or absence of surrounding early planted sorghum fields may create such situations).
On the site with many shoot flies many plants of the untreated crop will be damaged showing deadheart main tillers. These plants will produce side tillers that may escape any further shoot fly damage. The untreated crop usually flowers two weeks later than the treated crop with healthy main tillers. When midge population build-up starts before flowering and midge control treatments are established at flowering, a large (M x S)-interaction may be expected. •/ two-week period is sufficient to produce a new midge generation. The two-week delay in flowering is causing a substantial difference in midge damage levels. Whether or not such an additional loss in grain yields occurs will depend on whether or not the crop with many side tillers is protected from midge.
On the site with low shoot fly damage levels the (M x S)-interaction will not occur. The cause (shoot fly damage) for the creation of the two-week delay in flowering does not exist.
145
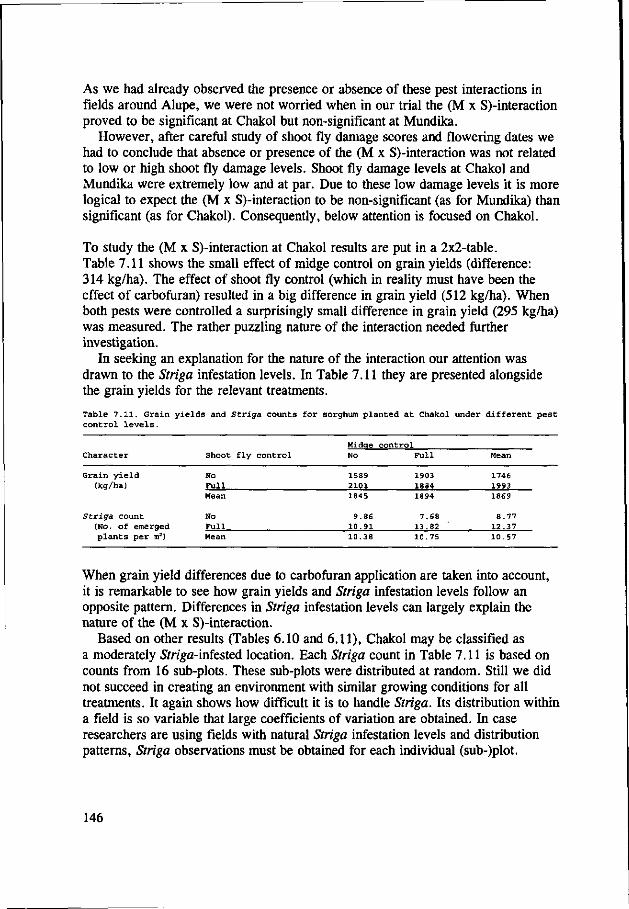
As we had already observed the presence or absence of these pest interactions in fields around Alupe, we were not worried when in our trial the (M x S)-interaction proved to be significant at Chakol but non-significant at Mundika.
However, after careful study of shoot fly damage scores and flowering dates we had to conclude that absence or presence of the (M x S)-interaction was not related to low or high shoot fly damage levels. Shoot fly damage levels at Chakol and Mundika were extremely low and at par. Due to these low damage levels it is more logical to expect the (M x S)-interaction to be non-significant (as for Mundika) than significant (as for Chakol). Consequently, below attention is focused on Chakol.
To study the (M x S)-interaction at Chakol results are put in a 2x2-table. Table 7.11 shows the small effect of midge control on grain yields (difference: 314 kg/ha). The effect of shoot fly control (which in reality must have been the effect of carbofuran) resulted in a big difference in grain yield (512 kg/ha). When both pests were controlled a surprisingly small difference in grain yield (295 kg/ha) was measured. The rather puzzling nature of the interaction needed further investigation.
In seeking an explanation for the nature of the interaction our attention was drawn to the Striga infestation levels. In Table 7.11 they are presented alongside the grain yields for the relevant treatments.
Table 7.11. Grain yields and Striga counts for sorghum planted at Chakol under different pest control levels.
Midge control
No Pull Mean
No Full
1589 2101 1845
9. 86 10.91
1903 1884 1894
7.68 13.82
1746 1993
1869
8.77 12.37
Character Shoot fly control No Full
Grain yield (kg/ha)
Striga count (No. of emerged plants per m2) Mean 10.38 10.75 10.57
When grain yield differences due to carbofuran application are taken into account, it is remarkable to see how grain yields and Striga infestation levels follow an opposite pattern. Differences in Striga infestation levels can largely explain the nature of the (M x S)-interaction.
Based on other results (Tables 6.10 and 6.11), Chakol may be classified as a moderately Sm'ga-infested location. Each Striga count in Table 7.11 is based on counts from 16 sub-plots. These sub-plots were distributed at random. Still we did not succeed in creating an environment with similar growing conditions for all treatments. It again shows how difficult it is to handle Striga. Its distribution within a field is so variable that large coefficients of variation are obtained. In case researchers are using fields with natural Striga infestation levels and distribution patterns, Striga observations must be obtained for each individual (sub-)plot.
146

7.5 CONCLUSIONS
The performance of sorghum and maize is seriously affected by time of planting in the Busia area. However, differences in youth growth are not responsible for the drop in yields when plantings are delayed. The time of planting (TOP) effect for maize is strongly related to the length of the (remaining) growing season. The TOP effect for sorghum is the result of a process with three different variables viz. length of (remaining) growing season, shoot fly incidence, and midge incidence. Each variable depends on developments within the agricultural season. In seasons with good grass rains (Type 1) and moderately to weak grass rains (Type 2) pests are mainly responsible for the lower sorghum yields when plantings are delayed. However, in seasons with absent grass rains (Type 3) the length of the growing season is mainly responsible for the TOP effect.
Shoot fly may be a serious pest in Zone B. It has the potential to determine the sorghum cropping calendar. The damage pattern is more or less systematic: - a period of low damage levels during the January-February dry season and
during the first 3 weeks after the onset of the first rains that are judged promising enough by households to start sorghum planting;
- a period of intermediate damage levels (30-60% deadhearts), 3-6 weeks after the onset of the first rains and plantings;
- a period of high damage levels (60-90% deadhearts) from 6 weeks after the onset of the first rains and plantings;
- a period of intermediate damage levels (40-60% deadhearts) during the brief June-July dry season;
- a period of high damage levels (60-90% deadhearts) during the second rains.
Midge, the second pest, is more difficult to describe. The 1979-81 research results of seasonal midge fluctuations reveal that midge damage in actual field conditions is a combined result of spread of infestation and internal reinfestation. The relative importance of sources of infestation, depends on factors such as distance between crops and synchronization of crop flowering periods.
Under normal first-rain conditions midge starts to build up its population on early flowering sorghum fields. Due to spread of infestation to surrounding fields, the number of midges on later (2-3 week) flowering crops is increased. The new infestation level determines the time when midge damage will be noticed. Heavy infestations (5 midges per flowering head) cause serious instant damage. Low infestations (1 midge per 10 flowering heads) cause limited instant damage, but 2-3 weeks later, reinfestations will cause severe damage to any nearby flowering heads.
Once a critical number of midges is present on a field and conditions for internal reinfestations are favourable, midge damage will rapidly reach high levels. Later flowering heads on such fields are seriously damaged. A two-week delay in flowering results in a 50% grain yield reduction. A four-week delay results in a 90-100% reduction. Based on these high yield losses it is concluded that once a sorghum crop has been planted:
147

- careful judgement is required before practising any gapfilling; - husbandry practices must keep the flowering period as brief as possible.
Therefore, it is concluded that midge can also be a serious pest around Busia, having the potential to determine the sorghum calendar. It is further concluded that: - spread of infestation for midge is rather restricted. Infestation sources are mainly
located on or near the sorghum field itself; - in the first rains control of midge through adjustments in planting dates is
possible. Early plantings often escape high damage levels. In case later plantings occur, flowering periods of adjacent crops should be synchronized. When on neighbouring fields local sorghums have been planted, successful delayed plantings are still possible using earlier maturing sorghums. However, when on neighbouring fields early-maturing sorghums have been planted, management flexibility is rather restricted. Near such fields no late sorghums can be grown and other early sorghums have to be planted within two weeks. Possibilities for midge control through field selection are limited. Distances between sorghum fields in the first rains are often less than 150 metres;
- in the second rains successful plantings are possible. Total prevention of midge damage is possible through adjustments in planting dates to synchronize flowering periods of adjacent crops. Control of midge through field selection seems possible as well. Distances between planted sorghum crops in the second rains are often large. Due to cattle grazing, uncontrolled regrowth of sorghum on fallowed fields often produces no heads.
In seasons with absent grass rains (Type 3) the variable length of the growing season becomes important. In these seasons the growing season is brief and any delay in planting may result in drought stress at the end of the season. Depending on the situation of the field within the local soil catena, a big drop in grain yields occurs when plantings are delayed for 2-4 weeks. Such TOP effects cannot be explained by pest incidence; shoot fly and midge need more time to build up.
In these seasons, length of the rainy season in relation to the time required for undisturbed crop development is the factor responsible for the TOP effect. Severe drought stress hampers the development and grain production of later planted crops. Maize is more sensitive than sorghum.
However, when plantings are delayed for more than 4 weeks, midge is the first and only pest to build up and reach economic damage levels. A four-week delay in planting results in only limited damage (<20% sterility) by midge, but a six-week delay in extensive damage (>65%).
Shoot fly, the second pest, is not able to build up and reach high damage levels. Even a six-week delay in planting results in limited damage (<25% deadheart plants). As selective thinning can easily be practised, grain yield production is not much affected.
Interactions between shoot fly and midge do not occur in these seasons. Shoot fly damage levels are too low to delay flowering, thereby creating favourable conditions for midge population build-up.
148

8. DEVELOPMENT OF ADAPTIVE SORGHUM AGRONOMY PACKAGES
Chapter 6 indicates that promising early-maturing sorghums are available. Chapter 7 reveals that such crops fit within a niche of local systems thereby increasing farmers flexibility. Consequently, our attention was focused on how to grow them best, taking local constraints into account. This chapter will describe our research efforts on topics such as method of planting (populations and patterns) use of fertilizers, weed control, ratoon management and low-cost approaches to shoot fly control. In Chapter 5 each research topic was introduced and justified.
As many trials were conducted it is impossible to describe each trial in detail. Such information may be found elsewhere (Enserink and Rutto, 1979; Enserink et al., 1980; Enserink and Njeru, 1981 and 1982). Here descriptions of objectives, materials, methods and results are kept brief.
8.1 PLANT POPULATION AND DISTRIBUTION PATTERNS
Objectives
Objectives are summarized as follows: - establishment of the optimum range of plant populations for row-planted
early-maturing sorghums; - identification of more adaptive planting patterns to reduce labour needed for
weeding or to facilitate relay-planting with cotton.
Materials and methods
All trials were located in the wetter part (Zone B) of Busia District. They were implemented in the first-rain cropping season of each year. In 1980 one site was planted at Alupe ARS. In 1981 three on-farm sites (Agolot, Mundika and Angoromo) and one on-station site were planted. In 1982 two on-station sites were used. Soil characteristics of sites were representative of the target area (moderately deep with low availability of nutrients).
'E 525 HR' was used as a test crop. Fertilizer applications were restricted to 20 kg/ha N and 20 kg/ha P2Os. Weeding was done twice. Shoot fly and midge control were practised in case plantings were much delayed compared to surrounding farmers fields. Plots were thickly seeded. Thinning was done in two phases to establish the correct plant population treatments. Yields were determined on a net plot by discarding two border rows and two border ends of 50 cm. Net plot areas varied from 13.5 to 24.5 m2.
Per plot we took records on stand and head counts, 1000-kernel weights, grain and total DM yields. Days to flowering, lodging, stem length and Striga infestations were also recorded. Per site rainfall was recorded and soils were analyzed. Reported grain yields contain 12.5% moisture. Each year a Randomized Complete Block Design was used. However, the design and treatments varied over the years.
149

In 1980 2 replications were used and the trial was designed as a 4 x 2 factorial with the following factors and levels: - 4 populations: 50,000, 100,000, 150,000 and 200,000 plants/ha; - 2 inter-row spacings: 50 and 75 cm. In 1981 3 replications were used at each location and the trial was designed as a 3 x 3 factorial with the following factors and levels: - 3 populations: 70,000, 110,000 and 150,000 plants/ha; - 3 inter-row spacings: 60, 75 and 90 cm. In 1982 4 replications were used at each location and the trial was designed as a 2 x 3 factorial with the following factors and levels: - 2 populations: 83,000 and 110,000 plants/ha planted in rows 75 cm apart; - 3 intra-row planting patterns: 1, 2 and 3 plants/hill.
The statistical method used to produce a combined analysis of variance over sites for each year is based on Neeley et al. (1991). As only few sites are available for such pooling, we consider sites to be 'fixed'. Chapter 7.4 provides more background information on the statistical analysis.
Results and discussion
1980 Grain and DM yields for 1980 are presented in Table 8.1. Statistical analyses showed significant plant population effects on grain (P<0.05) and DM (P<0.01) yields. Inter-row spacing effects and two-factor interactions were not significant.
Table 8.1.
Yield
(kg/ha)
Grain and DM yields of the 1980 Population and Spacing Trial.
Row spacinq Plant population (pl/ha) (cm) 50,000 100,000 150,000 200,000 Mean
Grain (12.5% moisture)
50 75 Mean
50
75
2389 2534
2461
4813 4778
2690 3012 2851
6335 6189
3114 3381 3247
6658 7308
2968 3105 3036
7200 7547
2790 3008 2899
6251 6455
The relationship between grain production and plant population is different from that for total DM production. Total DM yields are rising with increasing populations to a maximum which then will remain constant. However, grain yields are rising to a maximum, which remains constant within a certain range, and then declines as populations are further increased (Arnon, 1972). Sorghum has a great ability to adjust differences in plant population (Table 8.1). However, a too low population (50,000 pl/ha) is not optimal for grain production. With 200,000 pl/ha it seems that the optimum range for grain production has been passed. How yield components of individual plants (heads/plant, kernels/head and 1000 kernel weight) are adjusted to population differences is shown in Table 8.2.
150

Table 8.2. Effect of plant population on some characteristics of sorghum crops; AARS, 1980.
Character
Grain/stover ratio
No. of heads/plant
No. of kernels/head 1000 kernel weight (g) Stem length (cm) Lodging (%)
Plant 50,000
0.82 1.12
2170
18.0 158
2
POPUlat ion (pl/ha)
100,000
0.67
0.95
1635 16.3
175 5
150,000
0.69 0.80 1556 15.7
178 6
200,000
0.S6 0.89
993 15.1
188 11
Table 8.2 shows that most yield components are reduced when plant populations are increased. However, components show different degrees in responsiveness. The number of heads/plant (related to tillering) and the 1000 kernel weight were less influenced than the number of kernels/head.
A higher population results in more competition for light and plant heights are increased. This in combination with weaker individual plants (less DM per plant) increases the risk of lodging (Table 8.2). Around Busia any lodged plant will lose its grain quickly due to termite activity.
From a farming systems perspective lower populations within the optimum range must be preferred. It reduces the risks due to lodging and droughts and the time needed for planting and weeding. Harvest of a smaller number of heads of larger size is appreciated by households. We concluded that the optimum plant population range for grain production must lie between 70,000 and 150,000 plants/ha. Research in 1981 was based on these findings.
1981 As Bartlett's tests for heterogeneity of variances were not significant pooling over sites was permitted. Combined analyses of variance for grain and DM yields were produced. Significant site effects existed. Grain yields for Agolot, Mundika, Angoromo and Alupe amounted to 3869, 5105, 2349 and 2193 kg/ha, respectively; DM yields were 6492, 9007, 4848 and 4386 kg/ha. However, the analyses showed treatment effects to be independent of sites. Yields could be averaged over sites (Table 8.3). Significant (P<0.01) population effects on grain and DM yields existed. Inter-row spacing effects and two-factor interactions were not significant.
Table 8.3.
Yield (kg/ha)
Grain and DM yields of the 1981 Population and Spacing Trial.
Row SDacinq Plant population (pl/ha) (cm) 70,000 110,000 150,000 Mean
Grain (12.5% moisture)
60 75 90 Mean
60 75 90
3026 3141 3147 3105
5545 5568 5522
3420 3763 3236 3473
6407
6678 5947
3744 3526 3408
3559
7016 6679
6286
3396 3477 3264 3379
6323 6308 5918
151

The population effect was studied in more detail. Grain (3105 kg/ha) and DM (5545 kg/ha) yields for the lowest population treatment were significantly (P<0.01) lower than the average grain (3516 kg/ha) and DM (6502 kg/ha) yields for the other two treatments. When comparisons were made between the two higher population treatments, both grain and DM yields did not differ much. Table 8.4 indicates the effect of population on other important characteristics. The results presented are means over records of 36 plots.
Table 8.4. Effect of plant population on some characteristics of sorghum crops; Busia, 1981.
Character
Grain/stover ratio
No. of heads/plant No. of kernels/head 1000 kernel weight (g) Stem length (cm) Lodging (%)
Plant 70,000
0.94
1.06 1639 21.9
153 15
population (pl/ha) 110,000
0.91 0.96 1288
21.5 156
19
150,000
0.86 0.91 1075 21.2
157 23
The 1980 and 1981 results showed similar patterns for effects of plant population on grain and DM yields. The optimum plant population range for grain production must be around 110,000 to 150,000 pl/ha. However, yield differences are small and lower plant populations are more compatible with farmers priorities and resource constraints. We continued to study at the lower side; 83,000 and 110,000 pl/ha were selected as treatments in 1982.
Results on row spacing indicate substantial flexibility on recommendation development. Depending on the situation a row spacing can be selected from a range of 50 to 90 cm. If farmers have ox drawn equipment for planting and/or weeding a wider row spacing is justified. Such is also recommended in case sorghum is intercropped or relay-planted. In our extension programme in Busia some farmers interplanted the newly introduced early-maturing sorghums with beans in March, cassava in April-May and cotton in June-July.
In 1982 we no longer studied inter-row spacing but focused on intra-row planting patterns for crops planted in rows 75 cm apart. The number of plants/hill was increased under constant plant populations. Compatibility with farmers resource constraints is at stake; more plants per hill reduce time required for planting and weeding.
1982 As Bartlett's tests for heterogeneity of variances were not significant pooling over sites was permitted. Combined analyses of variance for grain and DM yields were made. Significant site effects existed. For the two sites at Alupe grain yields amounted to 5288 and 2460 kg/ha and DM yields to 9445 and 5038 kg/ha, respectively. Treatment effects were independent of sites. Grain and DM yields were averaged over sites (Table 8.5). The population effect on grain yield was not significant (P>0.05) but its effect on DM yield was significant (P<0.05). Intra-row planting pattern effects and two-factor interactions were not significant.
152
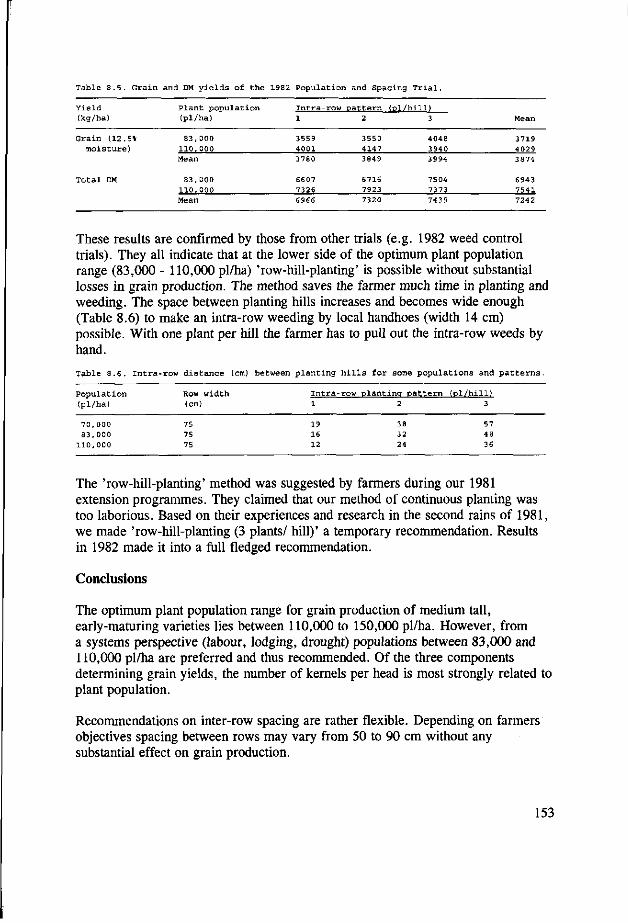
Table 8.5.
Yield (kg/ha)
Grain and DM yields of the 1982 Population and Spacing Trial.
Plant population Intra-row pattern (pl/hill) (pl/ha) 1 2 3 Mean
Grain {12.5% moisture)
83,000
110,000 Mean
83,000 110,000
3559 4001 3780
6607
7326
3550 4147
3849
6716 7923
4048 3940 3994
7504 7373
3719 4029 3874
6943 7541
These results are confirmed by those from other trials (e.g. 1982 weed control trials). They all indicate that at the lower side of the optimum plant population range (83,000 - 110,000 pl/ha) 'row-hill-planting' is possible without substantial losses in grain production. The method saves the farmer much time in planting and weeding. The space between planting hills increases and becomes wide enough (Table 8.6) to make an intra-row weeding by local handhoes (width 14 cm) possible. With one plant per hill the farmer has to pull out the intra-row weeds by hand.
Table 8.6. Intra-row distance (cm) between planting hills for some populations and patterns.
Population (pl/ha)
70,000 83,000
110,000
Row width (cm)
75 75 75
Intra-
1
19 16 12
row plant inq pattern 2
38 32 24
(pl/hill) 3
57 48 36
The 'row-hill-planting' method was suggested by farmers during our 1981 extension programmes. They claimed that our method of continuous planting was too laborious. Based on their experiences and research in the second rains of 1981, we made 'row-hill-planting (3 plants/ hill)' a temporary recommendation. Results in 1982 made it into a full fledged recommendation.
Conclusions
The optimum plant population range for grain production of medium tall, early-maturing varieties lies between 110,000 to 150,000 pl/ha. However, from a systems perspective (labour, lodging, drought) populations between 83,000 and 110,000 pl/ha are preferred and thus recommended. Of the three components determining grain yields, the number of kernels per head is most strongly related to plant population.
Recommendations on inter-row spacing are rather flexible. Depending on farmers objectives spacing between rows may vary from 50 to 90 cm without any substantial effect on grain production.
153

Split-side-dressings for N were applied to small furrows. All N was applied in the form of CAN (26%). All P was applied as TSP (46%).
The N response trial consisted of a Randomized Complete Block Design with 3 replications at each site. It was designed as a 2 x 5 factorial with: - 5 nitrogen levels: 0, 20, 40, 60, 80 kg/ha N applied as CAN (26%); - 2 phosphorus levels: 0 and 30 kg/ha P205 applied as TSP (46%). N was split-side-dressed and applied to small furrows; the first 20 kg/ha N at 3 weeks, remainders at 6 weeks. All P was applied to planting furrows.
The P response trial consisted of a Randomized Complete Block Design with 3 replications at each site. It was designed as a 2 x 5 factorial with: - 2 nitrogen levels: 0 and 30 kg/ha N applied as CAN (26%); - 5 phosphorus levels: 0, 20, 40, 60, 80 kg/ha P2Os applied as TSP (46%). N was split-side-dressed to small furrows; 15 kg/ha N was applied at 3 weeks, the remainder at 6 weeks. All P was applied to planting furrows.
The timing of N application trial consisted of a Randomized Complete Block Design with 3 replications at each site. It was designed as a 2 x 4 factorial. The 8 treatments were based on 4 nitrogen and 2 phosphorus combinations: - (1) 0 kg/ha N; (2) 30 kg/ha N applied to planting furrows;
(3) 30 kg/ha N side-dressed at 3 weeks; (4) 30 kg/ha N split-side-dressed at 3 and 6 weeks;
- (1) 0 kg/ha P205; (2) 30 kg/ha P205 applied to planting furrows. The side-dressings for N were applied to small furrows. All N was applied in the form of CAN (26%). All P was applied as TSP (46%).
Two new variables were created for the statistical analysis of the NPK trial. As the experimental plots remained unchanged, per year we added the plot grain yields for the first and second rains. We did the same for the total DM yields. In this way residual fertilizer effects (measured in the second rains) were added to their direct effects (measured in the first rains) and total effects could be compared.
The method used to produce a combined analysis of variance over sites for each of the other experiments is described in Chapter 7.4.
Results
Soil analyses First the results of chemical and mechanical soil analyses are presented for all trial sites. Table 8.7 confirms the general soil fertility pattern described in Chapter 3.2.5. Most soils are fine-textured and react moderately acid. Deficiencies in bases (K and Ca) occur but available phosphorus is often deficient. Organic carbon and total nitrogen levels are low to moderate, but C/N ratios are rather favourable. Precise fertilizer recommendations cannot yet be based on soil analyses
156

alone. Too few results are available to correlate laboratory results and crop yields in the field. Therefore, underlining of deficiencies (Table 8.7) can only be indicative.
Table 8.7. Results of chemical and mechanical soil analyses for all fertilizer experiments.
Trial
Site
PH Na m.e. % K m.e. % Ca m.e. * H g m . e . fc Mn m.e. % P p .p.m. N % C %
Hp m.e. %
% Clay % Silt % Sand Texture Depth (cm)
NPK
( + )
4.9 0.14
0.23 2.1 1.8 0.33 6 0.17
1.73 0.7
52 14
34 C 70
NP placement No.l
5.3 0.15 0.42
6.1 2.9 0.88 8 0.18 1.93 0.1
40 30
30 C/CL 80
No. 2
4.9 Tr. 0.10 0.5 0.9 0.20 6 0.08 0.74
0.4
28 24
48 SCL 45
N response No.l
5.7 0.12 0.30
3.3 2.4 0.92
8 0.12 1.72
n.a.
36 26
38 CL 30
No. 2
5.1 0.02 0.20
0.5 1.3 0.25 6 0.11 0.92 0.4
36 24
40 CL 50
P response No.l
5.7
0.06 0.36 4.6 2.4
0.88 8 0.17 1.72
n.a.
42 26 32 C 45
No. 2
5.0 0.04 0.14
0.9 1.3 0.40 8 0.10 0.98 0.6
32 44 24 CL 55
N timinq
Alupe
5.1 0.02 0.28
2.6 2.0 0.82 6 0.20 1.87 0.3
36 28 36 CL 55
Angoromo
5.3 0.08 0.14
1.5 1.0 0.44 6 0.08 0.54 0.2
14 26
60 SL 65
Notes: (+) composite site sample taken before 1980 planting; Laboratories, Nairobi; deficiencies underlined.
analyses by National Agricultural
NPK trial The grain and total DM yields for each season and year are presented in Figure 8.1. Direct (in first rains), residual (in second rains) and total (in a year) fertilizer effects are statistically summarized in Table 8.8.
Table 8.8. Significance levels of NPK fertilizer effects on grain and total DM yields summarized from the analyses of variance (1980-82).
Source
N P K
NxP NxK PXK NXPXK
Effect 1st
80
ns
** ns ns ns ns ns
on Grain Yield
rains
81
ns
** ns ns ns ns ns
82
ns
** ns ns ns ns ns
2nd 80
* ** *
ns ns
* ns
rains 81
ns
* *
ns ns ns
ns
82
ns
* ns ns ns ns ns
Total 80
* ** ns ns ns ns ns
81
ns
** ns ns ns ns ns
82
ns
** ns
ns ns ns ns
Effect 1st
80
ns
** ns ns ns ns ns
on Total DM Yield
rains 81
ns
** ns ns ns ns ns
82
ns
** ns ns ns ns ns
2nd 80
* ** ns ns
ns ns ns
rains 81
ns
** *
ns ns ns ns
82
ns
* ns ns ns ns ns
Total
80
* ** ns ns ns ns ns
81
ns * +
ns ns ns ns ns
82
ns
** ns ns ns ns ns
Note: ns= not significant (P>0.05); *= significant (P<0.05); **= highly significant (P<0.01).
Figure 8.1 and Table 8.8 stress the importance of P for grain and DM production. Meaningful direct and residual effects were only obtained for the factor P. Over a 3 year period yield gaps due to different application levels of phosphorus were increasing rapidly; yield gaps due to nitrogen and potassium application levels were decreasing rapidly. On the selected soil type all results point to one direction: at present P is severely limiting sorghum production; N and K are not important yet.
157

The analyses indicated a significant effect of P205 level on grain and DM yields. However, yields for the two phosphorus levels did not show a similar pattern over sites. The 30 kg/ha P2Os on site 2 (Photo 11) had a much stronger impact on yields than on site 1 (Table 8.10). It turned out that if the P fertilizer was broadcast, its positive effects were not always realized.
Comparisons among the 30 P205 treatments indicated significant effects of P placement on grain and DM production. Yields for the two P placement methods showed a similar pattern for both sites. Based on mean yields over sites the effect of P placement on yield was evident. For instance, grain yields increased from 1946 to 2562 kg/ha if the P fertilizer was applied to furrows instead of broadcast.
The NP placement trial results confirm those of the NPK trial. P fertilizers should be recommended to farmers buying fertilizers. Effectiveness and reliability are increased if they are placed in planting furrows or hills.
N response trial As Bartlett's tests for heterogeneity of variances were not significant pooling over sites was permitted. Combined analyses of variance were produced for grain and DM yields. Significant site effects existed. Grain yields for sites 1 and 2 were 1200 and 2121 kg/ha, respectively; DM yields were 3803 and 5571 kg/ha.
Analyses showed N effects to be independent of sites. As also (N x P)- and (site x N x P)-interactions were not significant, yields for N levels could be averaged over sites and P levels. However, as significant P effects on grain and DM yields existed, it was decided to modify the presentation of results. Hence, presented yields (Table 8.11) are based on 6 plots.
Table 8.11. Grain and DM yields for N response trial treatments,
P,0. level N level (ka/ha) Yield (kg/ha) (kg/ha) 0 20 40
1981.
60 80 Mean
Grain (12.5* moisture)
0 30 Mean
0 30
1623 1832 1727
4565 4769
1286 2134 1710
3933 5830
1139 1858 1499
3975 5068
1627
2152 1890
4325 5669
1067
1889 1478
3476 5261
1348 1973 1661
4055 5319
No significant effect of the N factor existed on total DM yields. However, a significant effect of the N factor on grain yields was found. Grain yield comparisons between N levels focused on two contrasts: 0 kg/ha N versus all non-zero N levels, and among non-zero N levels.
The analysis showed grain yields for the 0 N level (1727 kg/ha) and other N levels (mean: 1644 kg/ha) to be statistically at par. However, comparisons among non-zero N levels indicated a significant effect of N level on grain production. Not all grain yields for these N levels were statistically at par with the mean non-zero N yield (1644 kg/ha). Table 8.11 shows no regular pattern in grain
160

yields (such as a response curve) to describe this phenomenon. We cannot explain these results but think that shallow spots in trial fields were responsible.
As mentioned before, a significant P effect on yields existed and all 2- and 3-way interactions with N and P were non-significant. However, contrary to DM yields, grain yield response to application of phosphorus did not show a similar pattern at the two sites. Application of 30 kg/ha P205 at site 1 increased grain yields from 1072 to 1328 kg/ha. The response at site 2 was much stronger; an increase from 1328 to 2618 kg/ha was measured.
Results of the N response trial confirm those of earlier fertilizer trials. Again the importance of P for grain and DM production is stressed. Nitrogen is not a limiting factor yet.
P response trial As Bartlett's tests for heterogeneity of variances were not significant pooling over sites was permitted. Combined analyses of variance were produced for grain and for DM yields. Significant site effects on DM yields existed but not on grain yields. Grain yields at sites 1 and 2 were 2209 and 2266 kg/ha, respectively; DM yields were 6111 and 5414 kg/ha.
Analyses revealed (N x P)-, (site x N)-, (site x P)- and (site x N x P)-interactions to be non-significant. The grain and DM yields for the two N levels could be averaged over sites and P levels. The yields for the five P levels could be averaged over sites and N levels. Presented yields (Table 8.12) are based on 6 plots. However, mean yields for N levels are based on 30 plots, for P levels on 12 plots.
Table 8.12. Grain and DM yields for the P response trial treatments, 1981.
N level P,0B level (kq/ha) Yield (kg/ha) (kg/ha) 0 20 40 60 80 Mean
Grain (12.5% moisture)
Total DM
0 30
Mean
0 30
1839 1119 1479
5137
3935
2146 1908 2027
5444 5305
2370 2237
2303
5856
5793
2901 2640 2771
6799 6617
2533 2681 2607
6172 6566
2358 2117
2237
5881 5643
The combined analyses showed no significant effect of N level on grain and DM yields. However, significant effects of the factor P on grain and DM yields were found. These results confirm those reported earlier.
The yield responses to P applications were independent of sites and showed regular patterns. To examine the trends of yields on P205 level, quadratic response curves were fitted (Figure 8.2). A significant equation for both yields was found to describe the trend of yield on P205 level.
161

The objectives of our fertilizer programme were straightforward. For phosphorus and potassium we wanted to know if our research efforts on sorghum would confirm those on cotton mentioned above. However, for nitrogen we faced a more complex problem. It was rather puzzling that chemical analyses of our samples from local reddish-brown soils showed low N levels whereas other researchers consistently reported no or weak responses to N applications. Were the methods and timing of N applications wrongly chosen or were the local soil N levels not deficient after all? We did not know. Our efforts were concentrated on the first issue and we studied the influence of management practices on the response to N application.
Nitrogen When we started we anticipated a certain pattern for nitrogen utilization. Our expectations were mainly based on research findings from Kenya. The pattern we had in mind can be summarized as follows: - we did not expect a large effect of nitrogen on sorghum production when
nitrogen was applied to the seedbed. With low C/N ratios of local soils (Tables 3.4 and 8.7) and long preceding dry seasons, nitrogen flushes at the start of the rains were expected (Birch, 1960);
- we expected efficiency of seedbed N applications to be low due to leaching in the first weeks after planting when heavy showers occur. Initially N requirements are low and sorghum roots are still in a weak competitive position to reduce such leaching. Taking into account the flush of nitrogen at the start of the rains, we decided to delay N applications until 3 weeks after planting to reduce N leaching. Local maize and cotton fertilizer recommendations are based on the same principle. For maize, N fertilizers are best applied by side-dressing at knee-height stage (Mugambi, 1975). For cotton, side-dressings at 6 weeks after sowing are recommended (Tveitnes and Nyaas-Aakerbakken, 1975);
- we expected the efficiency of N applications to be further increased by introducing split-dressings (at 3 and 6 weeks) in the period of maximum crop growth. In this period the rate of uptake of nitrogen is high (Keulen and Heemst, 1982); hence the residence time of N fertilizer in the soil is short. This also reduces N leaching.
When we combine all trials on fertilizer use, most results are available for a response comparison between the control treatment (0 N) and the N treatment with split-side-dressings at 3 and 6 weeks. We anticipated that the N treatment would produce the highest yields because not only was N applied but ideal conditions were also created for an efficient use. Table 8.15 shows that our expectations were wrong.
None of the trials showed a positive response to N applied at 3 and 6 weeks (Table 8.15). We concluded that nitrogen is not a limiting factor yet. However, due to the consistently negative responses we felt that something else had
164

happened. At first we thought that opening of small application furrows might have caused this negative response. However, these furrows were less than 2 cm deep and other methods of N application showed similar patterns (e.g. NPK trial 1980; 0 N: 1560 kg/ha and 39 N broadcast at planting: 1328 kg/ha). Subsequently, our attention was drawn to a possible interaction between N and P.
Table 8.15. Summary of grain yields responses to split-side dressings of N at 3 and 6 weeks.
Fertilizer
trial
NPK (1981; 1st season)
NP placement
N response
P response
Timing of N
application
Treatment
(kg/ha N)
0
39 0
30 0
40 0
30 0
30
(n=12) (n=12) (n=18)
(n=18) (n=12)
(n=12) (n=30)
(n=30) (n=12)
(n=12)
Grain
12.5%
1695
1590 2141
1899 1727
1499 2358
2117 2122
2073
yield (kg/ha;
moisture)
Grain yield response to
N application
- 105
- 242
- 228
- 241
- 49
Note: n = number of observation plots involved.
Phosphorus and potassium Our research results on P and K fully confirm the results for cotton reported by Tveitnes and Nyaas-Aakerbakken (1975). Local soils are also highly deficient in P for sorghum production but K levels are still sufficient. When we combine all fertilizer trials most results are available for response comparisons between the control treatment and P205 treatments with applications to planting furrows. Table 8.16 summarizes these comparisons for different levels of P application.
Table 8.16. Summary of grain yield responses to Ps06 amounts applied to planting furrows.
Fertilizer trial Treatment (kg/ha P205)
Grain yield (kg/ha; 12.5* moisture)
Grain yield response to P205 application
NPK (pooled; 1st seasons)
NP placement
N response
P response
Timing of N application
0 (n=36) 20 (n=36) 40 (n=36)
0 (n=24) 30 (n=24)
0 (n=3 0) 30 (n=30)
0 (n=12) 20 (n=12) 40 (n=12) 60 (n=12) 80 (n=12)
0 (n=24) 30 (n=24)
915 1506 2285 1538 2562 1348 1973 1479 2027 2303 2771 2607 1880 2825
+ 519
•f 1370
+ 1024
+ 625
+ 548 + 824 + 1292 + 1128
+ 945
Note: n = number of observation plots involved.
CIMMYT (Perrin et al., 1976) developed an economic training manual for use by agronomists as they make farm recommendations from agronomic data. The economic analysis proposed by CIMMYT has been summarized in Annex 1.
Based on Table 8.16, two sets of P response data are available for such an analysis: the 0-20-40 set and the 0-30 set. Results are presented in Table 8.17.
165

Table 8.17. Partial budget analysis for two sets of data on P response.
P20s
(kg/ha)
0 20 40
0 30
Yields Mean
1197 1767 2294
1589 2453
(kq/ha) Net
1077 1590 2065
1430 2208
Gross f benefit
970 1431 1858
1287
1987
Leld
(Kshs) Variable costs TSP
0 224
448
0 336
Labour
0 16 16
0 16
(Kshs) Total
0 240 464
0 352
Net benefit (Kshs)
970 1191 1394
1287
1635
Note: Various assumptions and prices played a role in this partial budget analysis: net yields are mean yields minus 10% (harvest and storage losses); sorghum fetched 80 Kshs per 80 kg bag of grain at the Alupe transit store in 1982. Field prices are estimated to be 10% lower; TSP (46%) cost 233.80 Kshs per 50 kg bag at the Siaya transit store in 1982. Field prices are estimated to be 10% higher,-TSP application takes 2 days/ha. Opportunity costs are 8 Kshs/day.
The marginal analysis for P application levels within the two different data sets is presented in Table 8.18.
Table 8.18. Marginal analysis for P applications in two response data sets.
P,05
(kg/ha) Net benefit (Kshs)
Variable costs (Kshs)
Marginal net benefit (Kshs)
Marginal costs (Kshs)
rate of return (%)
0 20 40
0
30
970 1191 1394
1287
1635
0 240 464
0 352
221 203
348
240 224
92 91
Similar marginal rates of return were obtained. Applications of up to 40 kg/ha P205
may expect marginal rates of return of between 90 and 100%. Amounts selected were still in the range where sorghum responded linearly.
Levels exceeding 40 kg/ha P205 were applied in the P response trial. Based on the P response curve (Figure 8.2) and assumptions and prices mentioned above, a marginal rate of return analysis was made (Table 8.19).
Table 8.19. Marginal analysis for selected levels of the P response curve.
P A
(kg/ha)
0 10 20 30 40 50 60 70 80
Net benefit (Kshs)
1183 1302 1401
1464 1491 1483 1439 1360 1245
Variable costs
0 128 240 352 464 576 688 800 912
(Kshs)
Marginal benefit
119 99
63 27
# # # #
net (Kshs)
Marginal
costs
128 112
112 112
# # # #
(Kshs) Marginal rate of return (%)
93 88 56 24
# # # #
# = level that is dominated by another with higher benefits at lower costs.
Tables 8.18 and 8.19 show that application levels between 20-40 kg/ha P2Os should not be recommended in local sorghum production. Although, such
166

recommendations seem to be promising on average (Table 8.18), they are not very stable (Table 8.19). Based on these results we decided to put forward a temporary recommendation. We advised local farmers not to apply more than 20 kg/ha P205
to sorghum crops. This amount combines stability with acceptable rates of return. As availability of capital within local households is limited, these lower amounts also stand a better chance of being adopted.
A management option exists when P fertilizers are applied to planting furrows. Additional benefits may then be obtained from residual effects of P applications. However, to optimize these effects, mixing of residual P fertilizer with large quantities of soil must be avoided. If farmers are interested, they should prepare their fields with care. Strip hoeing is preferred as it leaves residual fertilizer as much as possible in place. If necessary, the rest of the field may be prepared when the first weeding takes place. Based on our own experience, we consider this system viable particularly for handhoe farmers.
When we practised this system of land preparation in the NPK trial we measured substantial residual effects of P applications (Figure 8.1). Grain yields in the second rains were 79 kg/ha higher for the 'residual 20 kg/ha P205' treatment than for the control treatment. For the 'residual 40 kg/ha P205' treatment this increase was 451 kg/ha. Due to high residual effects of the 40 kg/ha P205 treatment we may have to adjust our temporary fertilizer recommendation for crops grown in the first rains. An increase from 20 to 40 kg/ha P205 seems justified for farmers adopting the described land preparation method for crops planted in the second rains.
P/N ratio To meaningfully interpret results of NP fertilizer experiments, various authors stress the need for establishing the uptake-yield relationships for both nutrients (e.g. Geus, 1973). Grain yields can only increase if the applied N and P nutrients are taken up by the sorghum crop. The uptake may be limited due to management practices (e.g. broadcasting versus placement of P) or climatical conditions (e.g. leaching of N).
After the uptake of a particular nutrient it has to be utilized to produce grain. This utilization process may also be hampered by other growth limiting factors. For instance, there may be shortages in the supply of other nutrients. When limited amounts are available of both N and P, Keulen and Heemst (1982) recommended to carefully study the P/N ratio of plant tissue. In such situations the P/N ratio is a more reliable indicator for the actual growth limitation than the absolute content of N or P.
Penning de Vries et al. (1978) reported that the P/N ratio of plant tissue varies from 0.038 under phosphorus limiting conditions to 0.15 if nitrogen is in short supply. When the P/N ratio is close to one of the boundaries, plant growth is severely affected. Fertilization with P is most effective with P/N ratios close to the lower boundary, while fertilization with N is highly effective with P/N ratios close to the higher boundary.
167

Penning de Vries et al. (1978) and Keulen and Heemst (1982) suggested that another process also affects the uptake of N and P from the soil. They reported that in some situations with sufficient available soil nitrogen, this nitrogen cannot be utilized by plants due to lack of phosphorus. They suggested that a minimum P/N ratio cannot be passed in the tissue without upsetting plant metabolic processes. Although the processes at work are not fully understood, they are inhibiting further uptake of N from the soil.
Results from our fertilizer trials indicated that P/N ratios must have played an important role. However, we were unable to test this hypothesis. Although we took plant samples to study the uptake of N and P, the collaborating laboratory failed to complete the necessary analyses.
Consequently, we tried to find an indirect way to study P/N ratios in relation to crop production. The variable 'days to 50% flowering' seemed to be the best indicator for P availability. In our trials this variable showed large responses to higher availabilities of P (Table 8.13). We also selected this variable as it is the result of metabolic processes inside plants; so after nutrient uptake has taken place.
In most trials N application did not increase grain yields. Often negative responses were obtained (Table 8.15). When N application timings were compared the 'best' results were obtained with N applied at planting. This was contrary to our expectations; it seemed that the better the availability of N was made, the worse its effects on grain production became.
In one trial, however, a significant increase in grain production was measured when N was applied. Table 8.14 shows that the treatment '30 kg/ha N applied to planting furrows' yielded more grain than the 0 kg/ha N treatment. Consequently, these treatments were selected to study the relationship between the variable 'days to 50% flowering' and yield effects of N and P applied to planting furrows.
To classify soils according to P availability to sorghum crops, soil analysis results were not useful (Table 8.7). We used the variable 'days to 50% flowering' and identified three different cases.
The first case is presented by results from the NP placement trial (Table 8.20). It shows a situation where P is severely limiting crop production. When P was applied, large effects on grain production and flowering were measured. When N was applied its effects depended on the level of P application. Without additional P, application of N delayed flowering and reduced grain yields. With additional P, application of N accelerated flowering and increased grain yields. A clear NP interaction was detected.
It is not clear what caused the delay in flowering. Presumably we reduced the P/N ratios of plant tissue and/or soil to such low levels that plant metabolic processes became upset. We concluded that N applications can only be recommended in case sufficient P is applied simultaneously.
168

Table 8.20. Relationship production and flowering
Character
between effects of N and P applications at planting on grain 1981 NP Placement Trial.
P,0K level (kq/ha) N level (ka/ha) in furrows in furrows 0 3 0
Grain yield (kg/ha; 12.5% moisture)
Days to 50% flowering
0 30
0 30
1835 2337
82 73
987 2852
86 71
The second case is presented by results from the NPK trial (Table 8.21). Again P was limiting crop production. When P was applied, large effects on grain production and flowering were measured. When N was applied its effects were not similar to those obtained in the first case. The effect of N application depended strongly on the level of P application. At 0 and 20 kg/ha P205, N application had no effect at all. However, at 40 kg/ha P205, N application resulted in a distinct increase in grain production. A clear NP interaction was detected.
Table 8.21. Relationship between effects of N and P applications at planting on grain production and flowering; 1982 NPK Trial.
Character P,Os level (kg/ha) in furrows
N level
0
714 1404 2006
82
73 72
(kg/ha in furrows 19.5
732 1529 2350
82 72 71
Grain yield (kg/ha; 12.5% moisture)
Days to 50% flowering
0 20 40
0 20 40
We presume the second case to be representative of situations where the P/N ratio of plant tissue is close to its lower boundary. Fertilization with P increases the uptake of P and results in a higher P/N ratio. Consequently, more N can be taken up through which the P/N ratio is again lowered. This process of balancing maintains the P/N ratio close to its lower boundary.
Based on results presented in Table 8.21, we think that the inherent soil fertility for N was high enough to support this balancing process up to application levels of 20 kg/ha P205. No additional nitrogen was needed and N application did not result in increased grain production. However, when the P application level was raised from 20 to 40 kg/ha P205, the inherent soil fertility could no longer supply sufficient N. Additional nitrogen was needed and N application resulted in a grain yield increase.
The third case is presented by results from the 'timing of N application' trial (Table 8.22). Again P was limiting crop production. When P was applied large effects on grain production were measured. However, based on the variable 'days to 50% flowering' the soil P status must have been less deficient than in the other cases. When N was applied its effects were not similar to those described above.
169

Again the effect of N application depended strongly on the level of P application. However, this time, N application already had a positive effect on grain yields at 0 kg/ha P205. However, at 30 kg/ha P205, N application resulted in a more substantial increase in grain production. A clear NP interaction was detected.
Table 8.22. Relationship production and flowering
Character
Grain yield (kg/ha;
12.5% moisture)
Days to 50% flowering
between effects of N and P applications 1981 Timing of N Application Trial.
at
P,0. level (ka/ha) N level in furrows 0
0 1734 30 2510
0 76 30 72
planting on grain
(ka/ha) in furrows 30
2196 3288
75 70
We presume the third case to be representative of situations where N and P are both limiting grain production. The P/N ratios are neither extremely high nor low. Fertilization with N or P increases the uptake of one of these nutrients and changes the P/N ratio. Consequently, the nutrient not applied becomes limiting. However, this limiting nutrient may be diluted until the P/N ratio gets close to one of its boundaries. Subsequently, growth will be halted.
Based on Table 8.22, we think that the inherent soil fertility for N was not high enough. It already limited grain production even if no P fertilizers were applied. Additional nitrogen could be utilized and N application resulted in increased grain production. Similar results were recorded for P applications, although yield increases for P were larger. This indicates that the P/N ratio of plant tissue was closer to the lower than to the higher boundary. Therefore, it is not surprising that a substantial interaction effect on yields existed when both N and P were applied.
Such large N effects were only obtained when N was applied to planting furrows (Table 8.14). This indicates that young plants may utilize the additional N more efficiently than older plants. We think that the additional N puts the young plant in a more favourable starting position. We expect that for this starter function of nitrogen only limited amounts are required. More research is needed to evaluate if similar N starter effects can be obtained with lower amounts (e.g. 10 kg/ha N).
Although we discussed three different cases in a rather hypothetical manner, a general conclusion may be drawn. All cases show that P is the most limiting factor for grain production. We should advise farmers to apply phosphorus fertilizers at a rate of 20 kg/ha P205 first before any N fertilizer applications are considered. When higher levels of P fertilizer applications become feasible, it may be advisable for farmers to apply limited amounts of N fertilizer to planting furrows.
In practice, farmers should buy SSP or TSP fertilizers when only low P application levels are feasible. However, they may shift to compound fertilizers (e.g. 18-46-0) when higher P application levels become feasible. All fertilizers should be applied to planting furrows.
170

Conclusions
Results of all trials on fertilizer use reveal that phosphorus is the nutrient limiting sorghum production on representative local soil types; nitrogen and potassium are not limiting yet. Substantial direct and residual fertilizer effects are only obtained for P applications. When local cropping systems are intensified, P applications are needed to sustain crop yields. Reliability and effectiveness of P applications are substantially increased if P fertilizers are applied to planting furrows or hills.
P fertilizer levels for maximum grain production range from 60 to 80 kg/ha P205. However, economic analyses of P response data show that under current socio-economic conditions P fertilizer applications have to be restricted to 20 kg/ha P205. Only this level combines stability with acceptable rates of return. However, an increase from 20 to 40 kg/ha P205 is feasible if farmers adopt a particular land preparation method for crops planted in the second rains. 'Strip hoeing' optimizes the residual effect of P fertilizers. Consequently, the economic benefit of the higher P amount in particular is increased and stabilized.
Through the consistently negative responses to N applications at 3 and 6 weeks after planting, our attention was focused on possible interactions between N and P. We are aware that P/N ratios of plant tissue or soils may have played an important role in our fertilizer trials. We conclude that N applications may only be recommended if sufficient P is applied simultaneously. N fertilizer applications alone are only capable of increasing grain yields if the P status of the soil is relatively favourable. Best N application results are obtained if N is applied to furrows at planting. We conclude that such nitrogen has a starter function for the crop.
In practice, farmers are advised to buy P fertilizers first before buying of N fertilizers is considered. The recommended P application level is 20 kg/ha P205. When higher levels of P application become feasible, application of limited amounts of N fertilizer to planting furrows seems justified. Use of compound fertilizers (such as 18-46-0) is then attractive.
8.3 WEED CONTROL
In Busia-Siaya weeding costs little cash but is labour-intensive. CIMMYT (1977a) reported the existence of a labour constraint during the weeding period in Siaya. As most farmers broadcast sorghum, weeding is difficult and time-consuming. Hence, most sorghum crops are weeded once.
Two research options are available to remove this constraint. Either herbicides are introduced or the planting method is changed. With herbicides no changes in planting method are required but cash availability might limit adoption. In the second option broadcasting is replaced by more systematic planting patterns to
171

facilitate rapid weeding. However, establishment of such patterns is more labour demanding during planting. It may create another labour constraint. The 'row-hill-planting' method seemed an appropriate compromise (Chapters 5.2.3 and 8.1).
Initially, we focused on the herbicide option. At a later stage our attention shifted towards the other option; compatibility of Atrazine herbicides with local cropping systems is low. The shift was also encouraged by our research findings on fertilizer use. Reliability and effectiveness of phosphorus fertilizers were greatly increased if they were applied to planting furrows or hills. This provided another good reason for changing to more systematic planting patterns.
Weed problems and compositions on local fields are not static. They may change according to land use (fallow or cultivation period), length of cultivation period (soil fertility depletion) and crop rotation decisions (management options). Although these issues are rather difficult to grasp, we adopted an integrated approach. We believed that such an approach would at least improve our understanding of farmer's management options on weed control. If recommendations would emerge from our research efforts they had to fit in with current management systems.
Objectives
Objectives are summarized as follows: - establishment of yield gaps in sorghum production due to a number of selected
weed control treatments. These treatments were based on either handhoe use or Atrazine herbicide applications. Feasibility studies were conducted to indicate the methods within reach of local farmers;
- establishment of effects of intra-row planting methods on sorghum grain and DM yields under three different weed management levels. By handhoe the crop was weeded twice, once or not at all;
- study of differences in weed problem and composition on fields in different stages of the local crop rotation cycle.
Materials and methods
All trials were located in the wetter part (Zone B) of the Busia District. Representative soil types were used. Trials were implemented in the first rains. One on-station site was planted in 1980. A new field was ploughed and disc harrowed by tractor. In 1981 two on-farm sites (Agolot, Magola) were planted. Agolot was representative of farmers growing cotton in the second rains. The field had been cropped for some years and was clean as the previous cotton crop had been weeded frequently. No ox ploughing was needed to prepare the seedbed; a slight hand hoeing was sufficient. Magola was representative of farmers not growing cotton. The old field was weedy. For seedbed preparation it needed ox ploughing and levelling by handhoes. Two on-station sites were planted in 1982. Site 1 was located in a new field. Site 2 was located in a field that had been fallowed for a number of years but had not fully replenished its soil fertility yet.
172

Striga was absent on Site 1, but high infestation was observed on Site 2. As no cotton had been grown, seedbeds were prepared by ox ploughing and handhoe levelling.
'E 525 HR' was used as a test crop. Fertilizer applications were restricted to 20 kg/ha N and 20 kg/ha P205 applied to planting furrows. Shoot fly and midge control was only practised in case plantings were much delayed. Thinning was done in two phases to establish targeted plant populations and patterns. In 1980 our aim was 150,000 pl/ha in rows, 50 cm apart. In 1981 we aimed at 110,000 pl/ha in rows, 60 cm apart. In 1982 this was 110,000 pl/ha in rows, 75 cm apart. Sorghum yields were recorded from net plots by discarding border ends and rows. Net plot areas were 28 m2, 24 m2 and 9 m2 in 1980, 1981 and 1982, respectively.
Standard records were taken on crop performance, Striga infestation, rainfall and soils (see Chapter 8.1). When sorghum grain reached the milk dough stage weed populations were sampled. On the diagonal of each plot weeds were clipped from two areas (1 m2 each). Weed samples of plots were divided into two groups (Monocotyledons and Dicotyledons). For each group the DM weight was recorded.
Samples from control plots were studied in detail to identify dominant local weed species. The Kenya Herbarium at Nairobi assisted in weed identification. Each year the dominant Dicotyledons were identified; their dry matter yields were ranked. In 1980 and 1982 this system was also used to identify dominant Monocotyledons. However, the 1981 Monocotyledon group was divided into two subgroups (grasses and non-grasses) of which dry matter weights were recorded. For dominant species within the 1981 non-grass subgroup dry matter yields were recorded. For the 1981 grass subgroup this was not done due to time constraints. Consequently, dominance among 1981 grass species is based on visual scores.
Each year a Randomized Complete Block Design was used. However, the design and treatments varied over the years.
In 1980 two replications were used. In 1981 three replications were used at each site. In both years the same weed control treatments were selected: - no weeding (control); - 1 handhoe weeding at 4-5 weeks after planting; - 2 handhoe weedings at 3-4 and 7-8 weeks after planting; - a pre-emergence herbicide application (Atrazine 2.0 kg a.i./ha); - a post-emergence herbicide application (Atrazine 2.0 kg a.i./ha) when plants
reached the 3 leaf stage. The selected herbicide (Gesaprim, containing 50% Atrazine) was applied by battery-operated ULV sprayers. Both items were available from local shops.
In 1982 four replications were used at each site. The trial was designed as a 3 x 3 factorial with the following factors and levels: - 3 weed control levels: no weeding; 1 handhoe weeding at 4-5 weeks after
planting; 2 handhoe weedings at 3-4 and 7-8 weeks after planting; - 3 intra-row spacings: 1 plant, 2 plants and 3 plants per hill at a fixed sorghum
plant population (110,000 pl/ha) and inter-row width (75 cm).
173

Results
1980 The sorghum grain and total DM yields for the different weed control treatments are presented in Table 8.23. DM yields for Monocotyledon and Dicotyledon weeds are also presented.
Table 8.23. Grain {12.5% moisture content) and DM yields of sorghum and DM yields of weeds for the five treatments in the 1980 weed control trial.
Treatment
no weeding 1 weeding 2 weedings Atrazine, pre-
Atrazine. post Mean
emergence -emerqence
P ratio treatments LSD (5% level) CV
Sorqhum Grain
3287 3909 4493
4301 4091 4016 2.01ns 1280 11.5%
yields (kq/ha) Total DM
7246 8509 9466 9486 9162 8774
5.35ns 1596
6.6%
Total DM Monocots
441 255
95 270
265
vield of Dicots
388 15
8 80 60
weeds (kq/ha) Total
829 270 103 350
325
Note: ns= not significant (P>0.05).
Statistical analyses showed no significant weed control treatment effect on sorghum yields. Table 8.26 presents the dominant Monocotyledon and Dicotyledon weed species on control plots and shows Striga to be absent.
1981 Results for 1981 are presented in Table 8.24. Results for the 'Atrazine pre-emergence' treatment are not available for Magola; Project staff handhoe weeded plots by mistake. Two local seedbed preparation methods are involved. Agolot is representative of farmers growing cotton. Magola is representative of farmers not growing cotton. As two different recommendation domains are involved, results cannot be pooled over sites.
Table 8.24. Grain and DM yields of sorghum and DM yields of weeds; 1981 weed control trial.
Site
Agolot
Magola
Treatment
no weeding 1 weeding 2 weedings
Atrazine, pre-Atrazine, post Mean
emergence -emerqence
F ratio treatments LSD (5% level) CV no weeding 1 weeding 2 weedings Atrazine, post Mean
-emerqence
F ratio treatments LSD (5% level) CV
Sorqhum Grain
2945 3018 3344
3314 3100 3144 0.35ns
980 16.6%
476 898
1289 757
855 4.87*
531 31.1%
vields (kq/ha)
Total DM
5360 5444
5951 5772 6167
5739 0.56ns 1481 13.7%
1158 1891 2593 1641
1821 5.09*
917 25.2%
Total DM
Monocots
1045 420 269 999
1393
2204 464 343 623
Vield of Dicots
1391 147
52
132 83
515 60 62
298
weeds (kq/ha)
Total
2436 567 321
1131 1476
2719 524 405 921
Note: ns= not significant (P>0.05); significant (P<0.05).
174

Unlike Agolot, Magola showed significant (P<0.05) effects of weed control treatments on sorghum yields. Table 8.26 lists the dominant weed species. Striga infestation was low at Agolot, but high at Magola (2 versus 11 pl/m2).
1982 Seedbed preparations and results of Bartlett's tests permitted pooling over sites. Combined analyses for sorghum grain and DM yields were produced. Significant site effects existed. Intra-row spacing effects were independent of sites. As 3-way interactions were not significant either, yields for intra-row spacings could be averaged over sites and weeding levels.
Level of weed control affected (P<0.01) sorghum grain and DM production; but effects were not independent of sites. However, the 2-way (weed control x intra-row spacing) and 3-way interactions were not significant. Consequently, yields for weed control levels could be averaged over spacings but not over sites. To maintain uniformity in presentation (Table 8.25), results for intra-row spacing are also presented in two-way tables.
Table 8.25.
Factor
Grain and DM yields
Level
of sorghum; 1982 weed control trial.
Grain yield (kq/ha) Total DM vield (kq/ha) Site 1 Site 2 Mean Site 1 Site 2 Mean
Intra-row spacing
Weed control
1 pl/hill 2 pl/hill 3 Dl/hill
Mean
no weeding
1 weeding 2 weedinqs
3574 3740 3679 3664
1857
4330 4807
1264 1620 1462 1449
670 1554 2122
2419 2680 2571 2557
1264 2942 3465
6647 6946 6955
6849
3943 7853 8752
3085 4026 3647
3586
1982 3924 4853
4866 5486 5301 5218
2963
5889 6803
Dominant Monocotyledon and Dicotyledon weeds on control plots (no weeding; 1 plant/hill) are presented in Table 8.26. Striga infestation was very low at Site 1, but high at Site 2 (0 versus 14 pl/m2).
Weed DM production was not influenced (P>0.05) by intra-row spacing. However, weed control had a large effect (P<0.01) on weed DM production. A clear interaction between weed control and sites was detected. Mean weed DM yields for treatments and sites are presented in Table 8.27. Based on weed and sorghum DM yields, the presented biomass yields were calculated.
Table 8.27. Weed, sorghum and biomass DM yields (kg/ha); 1982 weed control trial.
Level
no weeding 1 weeding 2 weedings
Weed DM Site 1
5000 1294
471
vield
Site 2
2852
1337 583
Sorahum Site 1
3943 7853 8752
DM vield Site 2
1982 3924 4853
Biomass Site 1
8943 9147 9223
DM vield Site 2
4834 5261 5436
175

Table 8.26. DM yields (kg/ha) of dominant weeds on control plots, 1980-82.
Monocotyledons
Paspalum scrobiculatum Hackelochloa granularis Commelina benghalensis Panicum maximum Digitaria abyssinica Digitaria nuda Digitaria longiflora Rottboellia exaltata Dactyloctenium aegyptium Sorghum arundinaceum Brachiaria brizantha Rhynchelytrum repens Other minor species
Unidentified drv matter (+) Subtotal
Dicotyledons
Urena lobata Aspilia kotschyi Bidens pilosa Striga hermonthica Cassia obtusifolia Leonotis nepetifolia Corchorus trilocularis Synedrella nodiflora Euphorbia geniculata Galinsoga parviflora Vitex sp. Other minor species Unidentified drv matter
Subtotal
Alupe 1980
293 Tr
73 55 10
--
Tr
--
Tr
-10
-441
155
---
105
-10
---
75 43
-388
Site 1 1982
6
-273 372
58
--
2651
-587
--
13 1694 5654
Tr
-318
--
84
---
86
-14
271
773
Agolot 1981
dom
dom 26
dom
1019
1045
567 104
50 11
194
--
155 149
--
14 147
1391
Magola 1981
dom dom
-
dom dom
dom
2204 2204
48 266
26 68
-19 16
----8
64
515
Site 2 1982
39 107
9 227 229
-23
---
70 64 49
1349 2166
313 120
-8
-------
59
-500
(+)= for grasses only; dominant species (=dom) were established by visual scoring
Discussion
Over the years our knowledge of the significance of weed compositions on local fields increased. Some publications assisted in improving our understanding (Bogdan, 1958 and 1977; Ivens, 1975; Terry, 1984; Terry and Michieka, 1987). Therefore trial results will not be discussed separately. We feel confident to discuss the weed control results at a higher level of abstraction, viz. in view of farmer's management options on soil fertility maintenance and seedbed preparation.
Weed composition, cropping system and soil fertility When a local field is ploughed after a long fallow, its soil fertility is restored. Initial crop yields are high. This is the case on two of our sites (Alupe, 1980; Site 1, 1982). Site weed compositions (Table 8.26) show that grass weeds are initially more important than broadleaved weeds. As new fields are used, some tufted perennial grasses (e.g. Panicum maximum) are still present. However, most troublesome are annual grass species producing many seeds such as Rottboellia exaltata. This grass is known as a primary colonizer of disturbed ground. Its seeds
176

have little dormancy and all germinate together at the start of the growing season. Once crops are cultivated and properly weeded (thus preventing new seed formation), this weed quickly becomes less important. At first we were puzzled by this weed as it was troublesome on one site (Site 1, 1982) and not important on the other (Alupe, 1980). However, seedbed preparation differences were responsible for this phenomenon.
In 1980 plantings were delayed. However, the grass rains (27 February -12 March) were reliable and seedbeds were prepared by early March. When we wanted to plant our trials by the end of March, many weeds had already germinated. The farm manager disc harrowed the field once more to prepare a fresh and clean seedbed. This operation is also a very effective method of weed control (in particular of Rottboellia exaltata). Hence, weed DM yields on control plots are low and no significant treatment effects on sorghum yields are found.
In 1982 we stayed more in line with farmers land preparation methods. We hired an ox-plough team and planted immediately. No adverse conditions for Rottboellia exaltata were created; the weed germinated in a mass and became the dominant weed species on control plots (Table 8.26). However, Tables 8.26 and 8.27 show that one timely weeding was adequate for its control. Weed DM yields on control plots are high and large treatment effects (P<0.01) are found on sorghum yields.
When we discussed our findings with the farmers, they stated that some ox-plough owners use this weed control method unintentionally. As nobody likes to delay planting, this method is not created on purpose. However, once plantings have been delayed on certain fields, ox-plough owners are better capable of quickly re-ploughing these fields to prepare fresh clean seedbeds. Due to its costs this is not feasible for handhoe farmers.
Once cultivation starts soil fertility will slowly but steadily decrease. Some local farmers are capable of slowing down this process by manure applications. Others put old kraal sites back into cultivation. In both cases a longer cultivation period is possible. This is the case on one of our sites (Agolot, 1981). Its soil fertility was rather good and crop yields remained satisfactory. Farmers use these fields to grow cereal crops in the first rains (maize, finger millet) followed by cotton crops in the second rains. The cereal crops are kept weed free to permit cotton relay-planting. Cotton crops are weeded 3-5 times. Consequently, a clean seedbed is provided for the subsequent first-rain crop. Although this cropping system is rapidly depleting soil fertility, it removes labour constraints on land preparation (especially for handhoe farmers).
This intensive cropping system has an impact on weed compositions of local fields (Table 8.26). The tufted, stout, perennial grasses producing low seed quantities (e.g. Panicum maximum) disappear and are replaced by tufted, short-lived, slender perennials producing higher seed quantities (e.g. Paspalum scrobiculatum). A shift also occurs within the annual grasses from those producing high seed quantities (e.g. Rottboellia exaltata) to those with creeping stem-bases (e.g. Digitaria nuda).
Ill

Weed compositions (Table 8.26) also indicate another shift. The initial dominance of grasses disappears and broadleaved weeds become equally important. Most troublesome are those broadleaved weeds that combine high seed production with morphological characteristics instrumental to weed dispersion (e.g. hooked bristles of Bidens pilosa, Synedrella nodiflora and Urena lobata). Many of these weeds start their reproduction soon after germination. They may be classified as typical arable weeds. Striga hermonthica has not yet been capable of building up its infestation to high levels due to frequent weeding practices and rotation with cotton.
If cultivation continues for a number of years and no fertilizers are used, soil fertility will decrease to low levels. In the year(s) before these fields are fallowed, many farmers will still try to grow first-rain sorghum or maize crops. However, they no longer plant second-rain cotton crops. Soil fertility has become too low to sustain such an intensive cropping system. Consequently, fields become rather weedy in the second rains and ox ploughing is required for seedbed preparation. As yields will be low, farmers put less effort in weeding; priority is given to crops grown on more fertile fields. This provides an ideal situation to Striga hermonthica to rapidly build up its infestation levels. This is the case on one of our sites (Magola, 1981). Its soil fertility was depleted and in 1980 the farmer's maize crop produced low yields. Consequently, he no longer planted cotton. He stressed his problems with Striga. In 1983 he started to fallow the field.
The change from intensive to more extensive cultivation practices has an impact on weed compositions of local fields. Table 8.26 shows that the tufted, short-lived, slender perennial grasses (e.g. Paspalum scrobiculatum) are still important. However, the group of annual grasses with creeping stem-bases (e.g. Digitaria nuda, Digitaria longiflora) has become more important. An annual, shortly stoloniferous grass with good seed production (Dactyloctenium aegyptiurri) has also become troublesome. It is known as a common species in abandoned cultivations, fallow and waste lands.
Weed compositions (Table 8.26) indicate another shift. The dominance of grasses is restored and broadleaved weeds have become less important. They cannot compete sufficiently with the annual creeping or stoloniferous grasses under the changed cultivation practices. Striga hermonthica has been capable of building up its infestation to high levels as weeding of cereal crops receives less attention and rotation with cotton has been abandoned.
After years of cultivation soil fertility will decrease to low levels resulting in low crop yields. Once farmers decide to fallow these fields, soil fertility will be slowly restored. However, many farmers do not have enough land to wait until fertility is fully restored. They are forced to start cultivation earlier and must accept lower yields. This is the case on one of our sites (Site 2, 1982). In the past, the field was cultivated and subsequently left fallow to restore its fertility. The fallow period was short and we used the field the second season after it was brought back into cultivation.
178

The sequence, cultivation - short fallow - cultivation, has an impact on weed compositions of local fields. Table 8.26 shows that the tufted, perennial grasses are returning (e.g. Panicum maximum, Brachiaria brizantha, Rhynchelytrum repens). Rhynchelutrum repens is known as a common grass species on fallowed fields. The short-lived, slender perennial grass Paspalum scrobiculatum and the creeping annual grasses (e.g. Digitaria longiflora) are still present but less common. They are replaced by the troublesome rhizomatous perennial grass Digitaria abyssinica.
Weed compositions (Table 8.26) indicate no other major shifts. Grass weeds are still dominant. The same broadleaved weeds are important. Striga hermonthica is maintaining its high infestation levels as the fallow period has been too short to reduce seed viability in the soil.
On Site 2 (1982) a remarkable relationship between Striga DM yield and weed control level was recorded (Table 8.28). It may be the result of a coincidence but if not it has major implications for control recommendations.
Table 8.28. Striga hermonthica DM yields (kg/ha) at Site 2 in 1982.
Weed control level
Control (no weeding) 1 complete handhoe weeding
2 complete handhoe weedinqs Mean
Intra-
1 pl/h
8 82
149
80
cow
ill SDacinq
2 pl/hi
5 48 84
46
11 3 pl/hill
25 63 61 50
Mean
13 64 98 58
Striga plants appear above ground 3-6 weeks after haustoria on sorghum roots are established (Chapter 3.3.4). Therefore, most Striga plants in our trial emerged after the handhoe weedings were completed. Through this escape mechanism it was expected that the different weed control levels would yield similar Striga DM yields. However, it seems that better weed control practices in the first 8 weeks after planting resulted in higher Striga DM yields. We do not know if this is due to less competition with other weeds for light (the parasitic weed can produce photosynthates in its green leaves) or because the crop is stronger and supports more Striga plants in a better way. Whatever the reason, more Striga DM yield is produced with better weed control management. Consequently, if no extra control measures are taken, Striga seed numbers in the soil will increase substantially. Farmers are weeding their maize crops 3 months after planting to prepare seedbeds for relay-planted cotton crops. This is also an effective method of Striga control. Such integrated approaches to Striga control should be encouraged.
Biomass production, cropping system and soil fertility As we measured DM yield productions of sorghum and weeds, total biomass production in first-rain cropping seasons can be studied. The 1982 results (Table 8.27) revealed that total biomass production for different weed control levels were very similar when compared at the same site. However, biomass production levels between sites showed big differences.
179

This indicates that only a certain amount of biomass can be produced in a particular environment. It does not matter if sorghum or weeds are producing the biomass. It appears that sorghum and weeds are in direct competition for one of the growth factors (e.g. light, nutrients, water). As site differences occur the growth limiting factor is able to vary over sites. We believe this factor to be strongly confounded with soil fertility levels. As these levels are strongly influenced by length of cultivation period we were curious to know if our biomass production levels would confirm our findings on cultivation and fallow periods.
When fields are brought back into cultivation after a sufficiently long fallow period to restore soil fertility, local biomass DM yields in the first two years are varying between 10-7 tonnes/ha. This is the case on two of our sites viz. 1980 (Table 8.23) and Site 1, 1982 (Table 8.27).
After a cultivation period of 3-4 years (depending on cropping intensity and manure use) local biomass production levels drop to 7-4 tonnes/ha. This is the case on one of our sites viz. Agolot, 1981 (Table 8.24).
After a cultivation period of 4-7 years local biomass production levels drop to 4-2 tonnes/ha. This is the case on one of our sites viz. Magola, 1981 (Table 8.24). Yields have become so low that fallowing of such fields is necessary to restore soil fertility levels.
When these fallowed fields are brought back into cultivation too soon (within 3-5 years) soil fertility has not been fully restored. Consequently, biomass production levels are restricted to 4-6 tonnes/ha. This is the case on one of our sites viz. Site 2, 1982 (Table 8.27). The NPK fertilizer results (Figure 8.1) are also representative of this production level.
In search of the soil factor limiting local crop growth, soil analyses were again not helpful. Some crop characteristics seemed to be promising indicators. For our study on sorghum yield components at different biomass production levels, effects of seedbed preparation and weed control had to be minimized. Our study therefore focused on the highest weed control level (two handhoe weedings). To standardize plant populations (110,000 pl/ha), 1980 results were excluded. Results are presented in Table 8.29.
Table 8.29. Biomass production and some characteristics of sorghum crops.
Character
Grain/stover ratio No. of heads/plant No. of kernels/head 1000 kernel dry weight (g) Days to 50% flowering Stem length (cm)
Biomass 10-7
0.93 1.03 1996
18.6 67
151
Yield (tonnes 7-4
0.97 1.04 1292 19.8
70 150
/ha)
4-2
0.77 0.84
568
21.5 77
13 0
4-6
0.62 0.82
953
21.6 73
150
Similarity in patterns is distinguished when Tables 8.29 and 8.13 are compared. They support earlier research findings indicating that phosphorus is the major
180
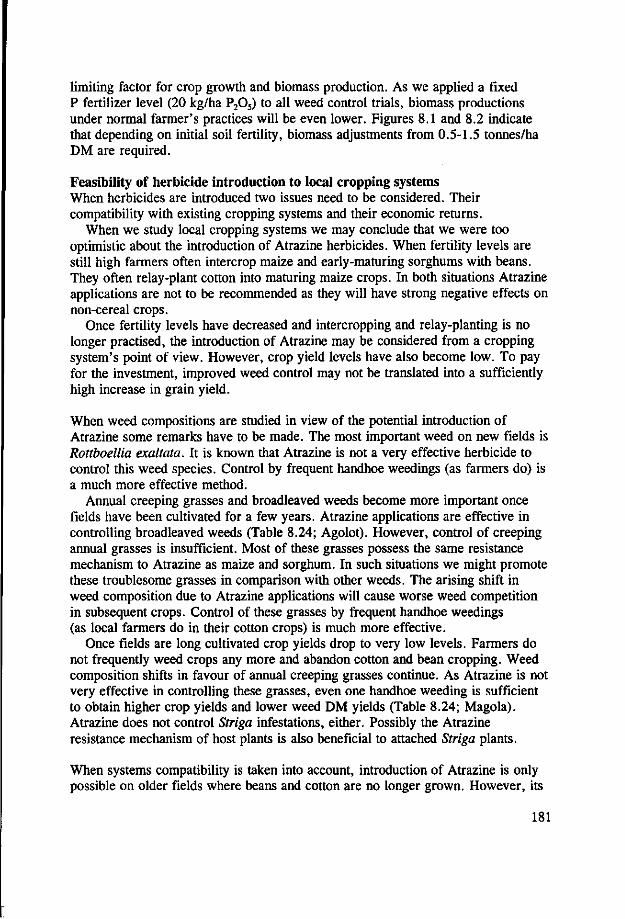
limiting factor for crop growth and biomass production. As we applied a fixed P fertilizer level (20 kg/ha P205) to all weed control trials, biomass productions under normal farmer's practices will be even lower. Figures 8.1 and 8.2 indicate that depending on initial soil fertility, biomass adjustments from 0.5-1.5 tonnes/ha DM are required.
Feasibility of herbicide introduction to local cropping systems When herbicides are introduced two issues need to be considered. Their compatibility with existing cropping systems and their economic returns.
When we study local cropping systems we may conclude that we were too optimistic about the introduction of Atrazine herbicides. When fertility levels are still high farmers often intercrop maize and early-maturing sorghums with beans. They often relay-plant cotton into maturing maize crops. In both situations Atrazine applications are not to be recommended as they will have strong negative effects on non-cereal crops.
Once fertility levels have decreased and intercropping and relay-planting is no longer practised, the introduction of Atrazine may be considered from a cropping system's point of view. However, crop yield levels have also become low. To pay for the investment, improved weed control may not be translated into a sufficiently high increase in grain yield.
When weed compositions are studied in view of the potential introduction of Atrazine some remarks have to be made. The most important weed on new fields is Rottboellia exaltata. It is known that Atrazine is not a very effective herbicide to control this weed species. Control by frequent handhoe weedings (as farmers do) is a much more effective method.
Annual creeping grasses and broadleaved weeds become more important once fields have been cultivated for a few years. Atrazine applications are effective in controlling broadleaved weeds (Table 8.24; Agolot). However, control of creeping annual grasses is insufficient. Most of these grasses possess the same resistance mechanism to Atrazine as maize and sorghum. In such situations we might promote these troublesome grasses in comparison with other weeds. The arising shift in weed composition due to Atrazine applications will cause worse weed competition in subsequent crops. Control of these grasses by frequent handhoe weedings (as local farmers do in their cotton crops) is much more effective.
Once fields are long cultivated crop yields drop to very low levels. Farmers do not frequently weed crops any more and abandon cotton and bean cropping. Weed composition shifts in favour of annual creeping grasses continue. As Atrazine is not very effective in controlling these grasses, even one handhoe weeding is sufficient to obtain higher crop yields and lower weed DM yields (Table 8.24; Magola). Atrazine does not control Striga infestations, either. Possibly the Atrazine resistance mechanism of host plants is also beneficial to attached Striga plants.
When systems compatibility is taken into account, introduction of Atrazine is only possible on older fields where beans and cotton are no longer grown. However, its
181

Ratooning of grain sorghums may be defined as the action to stimulate regrowth from basal or lower epigeal buds. Therefore at or shortly after the grain has been harvested, the largest part of photosynthetically active material is also removed (Plucknett et al., 1970). Basal buds are attached to short and narrow internodes at the plant's base, while epigeal buds are attached to elongated, thicker internodes situated higher on the plant (Escalada and Plucknett, 1975).
To increase our understanding of factors influencing survival and regrowth of stubbles, we developed a descriptive diagram (Figure 8.3). Two basic processes are of equal importance to ratoon survival and regrowth. The first deals with the content of soluble carbohydrates in stubbles ('food stock') at the time of stover removal. Sufficient food stock is needed to maintain the living stubble tissue as well as provide 'food' for the growing buds having neither roots nor leaves (Oizumi, 1977). The second process deals with the physiological activity of stubbles. After removal of the stover, stubbles must remain active to transport water, minerals and carbohydrates to the growing tillers until these have become established (Duncan et al., 1981). Both processes are influenced by many factors. Some of these are internal (e.g. heredity), others are external (e.g. environment).
An important internal factor is the relative sink strength of plant organs. Cultivars with strong head sinks, for instance, are capable of redistributing carbohydrates from stem to head in times of drought; they deplete the food stock needed for survival and regrowth. Another important internal factor is the age of leaves and roots. Nonsenescent cultivars, for instance, are capable of postponing ageing; they retain a higher food stock in their stems (McBee et al., 1983) and remain physiologically active for a prolonged period (Duncan et al., 1981; Zartman and Woyewodzic, 1979).
Environmental factors like pests, diseases, weeds and unfavourable ecological conditions affect food stock and/or activity of stubbles negatively (Plucknett et al., 1970 and 1981), lowering ratoon survival rates. Finally, with early harvests more stubbles with higher physiological activity remain, increasing ratoon survival rates.
cutting
Figure 8.3. A descriptive diagram of rate of ratoon survival.
Ratoon crops of grain sorghums usually yield less than planted crops. One of the reasons is that ratoon crops are rather uneven. This is often the result of irregularities at cutting and the tillering ability of varieties.
184

Cutting height determines the number of basal and epigeal buds left after stover removal. Tillers originating from epigeal buds have roots that do not make immediate soil contact and need more time to become established (Escalada and Plucknett, 1975). They are less vigorous than basal tillers and susceptible to breakage. A low cutting height whereby only basal buds remain, results in a more uniform and vigorous crop (Escalada and Plucknett, 1977; Keefer, 1981; Mackenzie et al., 1970).
Tillering ability is also a characteristic contributing to ratoon capacity (Plucknett et al., 1981). High tillering cultivars display a more uniform distribution of living stubbles and are capable of filling gaps of dead stubbles (Whiteman, 1981b). Many improved varieties have lost their tillering ability; most breeders regard it as undesirable (Duncan et al., 1980).
Research focus
Our findings (Chapter 6) confirm the general picture described above. In Busia ratoon yields are also mainly determined by the rate of ratoon survival. The existence of some important local factors is highlighted. Results (Chapter 6.3.5) indicate that the new cultivars have stronger head sinks than the local sorghums. Drought stress during their grain formation results in lower ratoon survival rates. We concluded that a major interaction between variety choice and climatical conditions exists for ratoon survival rates in Busia. We also found that tillering ability of local sorghums is higher than that of newly selected cultivars.
Relationships between ratoon survival rate and blight score or Striga incidence (Chapter 6.3) show that some external factors are important in Busia. Blight and Striga both negatively affect local survival rates.
We concluded that the ratoon policy appears not to be as promising as anticipated earlier. Ratooning of the early sorghums has to be optional; only in the case of high survival rates may ratooning be recommended.
Beyond variety choice farmers have no direct influence on many of the relationships described above. Once they grow an early-maturing cultivar, they also have to accept its limitations on ratooning. However, some authors are stressing the effects of management practices on ratoon yields. Planted crop plant population, fertilizer management, time of harvesting and cutting height are claimed to be among these practices. As farmers can directly influence such practices they were worth evaluating. Hence, this chapter focuses on effects of such practices.
Objectives
Our objective was to study effects of selected management practices on ratoon performance. Tested practices for planted crops comprised plant population and spacing, fertilizer management level, time of harvesting and cutting height. For ratoon crops the practice of 'tiller thinning' was tested. We wanted to quantify their order of magnitude and relative importance.
185

Materials and methods
Effects of planted crop plant population and spacing on ratoon performance were studied by ratooning the 1981 Population and Spacing Trial (Chapter 8.1). When planted crops were harvested their stover was immediately cut back to ground-level and removed. Standard management for ratoon crops was practised (Chapter 6.2). Planted crop treatments comprised all combinations between 3 plant populations (70,000, 110,000 and 150,000 pl/ha) and 3 inter-row spacings (60, 75 and 90 cm).
Effects of planted crop fertilizer management level on ratoon performance were studied in a trial on a representative field at Alupe ARS in 1980. The cultivar E 525 HR was planted and standard management for planted and ratoon crops was practised. A Randomized Complete Block Design with 3 replications was used. Selected application levels to the planted crop were: - 20 kg/ha N and 20 kg/ha P205 applied to planting furrows; - 40 kg/ha N and 40 kg/ha P205 applied to planting furrows.
Effects of planted crop time of harvesting on ratoon performance were studied in another trial on two representative on-station sites in 1981. 'E 525 HR' was planted and standard management was practised. A Randomized Complete Block Design with 4 replications at each site was used. Heads were harvested in four sequential weeks. The remaining stover was immediately cut back to ground-level and removed. Treatments were related to physiological maturity stage of the grain: - cutting back at physiological maturity (week 0); - cutting back at 1 week past physiological maturity (week 1); - cutting back at 2 weeks past physiological maturity (week 2); - cutting back at 3 weeks past physiological maturity (week 3).
Effects of planted crop cutting height and ratoon tiller thinning were studied in ratoon management trials in 1980-81. One representative on-station site was used in 1980; two were used in 1981. 'E 525 HR' was planted and standard management was practised. However, the ratoon crop was not sprayed for midge on one 1981 site (Alupe 2) to make damage observations possible. Targeted plant populations were 150,000 pl/ha (1980) and 110,000 pl/ha (1981). Randomized Complete Block Designs with 3 replications were used, but design and treatments varied over years. In 1980 a 2 x 3 factorial design was used, with: - 2 cutting heights: ground-level or 7.5 cm above; - 3 ratoon tiller densities: 2, 4 or all tillers/plant left at thinning. In 1981 a 2 x 2 factorial design was used, with: - 2 cutting heights: ground-level or 7.5 cm above; - 2 ratoon tiller densities: 3 or all tillers/plant left at thinning.
Standard records were taken and grain and DM yields of planted and ratoon crops as well as ratoon survival rates were calculated. Midge damage to 1981 ratoon crops was recorded at Alupe 2.
186

The statistical method used to produce a combined analysis of variances over sites for each year is based on Neeley et al. (1991). As only few sites are available for such pooling, we considered sites to be 'fixed'. Chapter 7.4 provides more background information on the statistical analysis.
Results and discussion
Plant population and spacing We cannot use conventional statistical analyses to study the effects of population treatments on ratoon performance. The problem is that our population treatments were established in planted crops. Strictly speaking, they do not apply to ratoon crops. Ratoon populations are the result of complex natural regrowth processes that are site-specific. Hence, we were unable to establish ratoon plant populations at previously determined levels; we had to be satisfied with what nature provided.
For meaningful conclusions we had to split our study on ratoon crop performance into two components. The first focused on ratoon survival; the second on grain and DM production in relation to actual ratoon populations.
Ratoon survival As relevant environmental factors (e.g. dry spells, soil depth) were rather site-specific, ratoon survival showed a large variation over sites. The ratoon survival rates were 48.1%, 22.0%, 36.6% and 31.6% at the Agolot, Mundika, Angoromo and Alupe sites, respectively.
Analyses of variance within sites were made. They showed that the factors plant population and inter-row spacing established in planted crops had no significant effect on ratoon survival rates at all sites. Table 8.30 presents the ratoon survival rates for different factors and sites.
Table 8.30. Ratoon survival rates (%) for different factors and sites and Spacing Trial.
Intra-row Planted croc DODulation (Dlants/ha) Site spacing (cm) 70,000 110,000 150
1981 Plant Population
000 Mean
Agolot
Angoromo
Alupe
60 75 90 Mean
GO
75 90 Mean
SO
75 90 Mean
60 75 90
39.4 58.1 53.9 50.5
22.4 22.9 21.6 22.3
34.6 39.3 41.1 38.4
26.6 40.9 40.8
48.1 49.9 47.1 48.4
17.4 30.3 18.7
22.1
36.5 32.9 36.2 35.2
23.0 33.3 41.1
48.3 48.5 39.3 45.4
20.4 23.9 20.8 21.7
36.7 37.2
35.0 36.3
26.6 32.6 19.7
45.3 52.2 46.8 48.1
20.1 25.7 20.4
22.0
36.0 36.5 37.4 36.6
25.4 35.6 33.9
187

We think that the level of moisture stress during grain filling was mainly responsible for site differences in ratoon survival. The 1981 first rains were heavy but short and were followed by a severe drought lasting from 20 May until 15 July, the period in which grain filling took place. This explains the rather low survival rates at all sites. However, moisture stress varied over sites as they differed in soil depth and thus in water storage capacity. Soils were deep at Agolot (100 cm) and Angoromo (110 cm) but moderately deep at Mundika (60 cm) and Alupe (50 cm). Sites also differed in soil fertility and thus DM production potential. The clay soils at Agolot and Mundika were highly fertile; DM yields were 6500 kg/ha at Agolot and 9000 kg/ha at Mundika. The sandy loam soil at Angoromo was moderately fertile (5000 kg/ha DM yield), whereas fertility of the clay-loam soil at Alupe was low (4500 kg/ha DM yield). Moisture stress was highest at Mundika as here the worst combination existed (heaviest crop, low water storage capacity). Consequently, carbohydrate redistribution and depletion were strongest at Mundika. This resulted in extremely low ratoon survival rates. Similar explanations may be given for survival rates at other sites.
As moisture stress played such a dominant role we anticipated that plant population differences would also affect ratoon survival rates. The higher population treatments produced more dry matter and therefore must have been more affected by drought. However, compared to sites, yield differences between populations were relatively small (e.g. DM yields were 5545, 6344 and 6660 kg/ha for the treatments 70,000, 110,000, and 150,000 pl/ha, respectively; see Table 8.3). They did not result in sufficient variation in moisture stress to cause statistically significant effects on ratoon survival rates. Effects of increased moisture stress may also have been counterbalanced by an effect of decreased redistribution of carbohydrates; higher populations produced plants with smaller head sinks (Table 8.4). Anyhow, only a small downward trend in survival rates was observed when populations increased. Rates amounted to 36.8, 34.6 and 32.4% for 70,000, 110,000 and 150,000 pl/ha, respectively.
As yield differences between intra-row spacings were even smaller than between plant populations, significant effects of intra-row spacings on ratoon survival were not revealed. A systematic trend was not found either. Rates amounted to 31.7, 37.5 and 34.6% for 60, 75 and 90 cm, respectively.
As survival rates showed a large variation over sites, ratoon populations followed the same pattern. However, population treatments within sites recorded similar survival rates. Consequently, population ranking order was never changed; e.g. plots carrying the highest population for planted crops also produced the highest ratoon crop population.
We concluded that ratoon plant populations are not only determined by ratoon survival rates; populations of planted crops also played a role. If selected plant populations are close to the optimum range for grain production, the percentage of surviving plants (ratoon survival rate) is mainly determined by site-specific
188

conditions. However, the number of surviving plants within each site bears a strong relationship with the planted crop plant population.
Ratoon grain and DM production Grain and DM production are now studied in relation to actual ratoon populations. We did not include intra-row spacing as this factor had no significant effect on yields of planted crops. As intra-row spacings were the same for both crops and similar ratoon survival rates were recorded, intra-row spacings had no significant effects on yields of ratoon crops either. When production was averaged over sites, grain yields were 577, 550 and 509 kg/ha and DM yields were 1315, 1352 and 1224 kg/ha for 60, 75 and 90 cm, respectively.
The effect of plant population on ratoon yields could not be studied by producing combined analyses of variance over sites. Bartlett's and Levene's tests for heterogeneity of variance were significant; pooling was not permitted. The problem was that selected plant population levels referred to planted crops, not to ratoon crops. However, analyses within sites showed that population treatments established in planted crops still had significant effects on yields of ratoon crops. To study possible relationships, results are presented graphically (Figure 8.4).
1,600
'a? 3 1'400
w o E 1.200
m cvi
ro 8oo
^£- 600
0)
s j ; 400
c 2 200
CD
- 2 . 2,000
TO 1 ,600
g> >-_ 1,200
Angoromo
Alupe
—1 1 1 -
10 20 30
Mundika,'
Angoromo
v Alupe
40 50 60 70 —I 1 1 1 1 1 1
0 10 20 30 40 50 60 70
Ratoon population (thousand pl/ha)
Plant population (pl/ha) of planted crop: • 70,000; "110,000; * 150,000.
Figure 8.4. Ratoon grain and DM yields for each site in relation to plant population treatments of planted crops and recorded populations in subsequent ratoon crops.
Figure 8.4 shows the positive linear relationships existing between ratoon plant populations and ratoon grain and DM yields for all sites. Due to the low survival rates, ratoon populations were low. Consequently, ratoon populations were still in the range where sorghum responded linearly.
189

Although we may conclude that ratoon yields are mainly determined by ratoon plant populations, Figure 8.4 shows the existence of another factor. Regression coefficients for lines are different. Ratoon crops at our sites responded differently to the factor plant population for which differences in soil fertility seemed to be responsible. Regression coefficients were high for Agolot and Mundika; these sites were fertile and produced 6500-9000 kg/ha dry matter in the previous cropping season. Angoromo's regression coefficient was intermediate; it was moderately fertile and produced 5000 kg/ha dry matter. Alupe's regression coefficient was lowest; it had the lowest fertility and produced only 4500 kg/ha dry matter.
Fertilizer management level Results for selected fertilizer levels are presented in Table 8.31.
Table 8.31. Planted and ratoon crop results for two fertilizer levels; 1980.
Planted crop fertilizer level (kg/ha)
20 N + 20 P2Os
40 N + 40 PjOs
Grain vie planted
2S55 3048
Id (kq/ha) ratoon
665
709
DM vield planted
5471 6117
(kq/ha) ratoon
1759 1654
Ratoon survival rates (*)
44.9 33.4
Planted crop yields were significantly affected by fertilizer levels. Due to increased yields, end of season moisture stress and redistribution of carbohydrates were probably intensified for the higher application level. This significantly reduced the rate of ratoon survival. However, due to larger quantities of residual phosphorus in the soil, no significant treatment differences were observed in ratoon crop yields. Results of this trial fully confirm our earlier findings. Ratoon crop performance was determined by differences in ratoon survival rates and soil fertility levels. Planted crop plant population was not important as no differences existed.
Time of harvesting Ratoon survival rates for both sites were extremely low, viz. 10.5% and 12.6%. Soils were shallow (30-40 cm). The short rainy season in 1981 was followed by a severe drought. Soil depths and climatical conditions caused crops to suffer from extreme moisture stress at the season's end. This was reflected by low 1000 kernel weights, viz. 13.3 and 13.5 g. As the two trials had similar ratoon survival rates, grain and DM yield production levels and showed similar reactions to selected treatments, we pooled crop results over sites. Results are presented in Table 8.32.
Table 8 32 Planted
Time of harvesting of planted crop
week 0 week 1 week 2 week 3
Mean
and ratoon
Grain va planted
2155 2088 1990 2230 2116
crop results
eld (kq/ha) ratoon
212 220 233 241 227
for four time
DM vield planted
5998 5441 5432 5645
5629
of harvesting
(kq/ha) ratoon
617 681 750
1076 781
treatments; 1981.
Ratoon survival rates (%)
11.9 12.0 10.1 12.3
11.6
190

Statistical analyses showed no significant time of harvesting effects on yields of planted and ratoon crops and none on survival rates either.
Some authors (e.g. Plucknett et al., 1981) recommended harvesting grain at physiological maturity and removing the stover as soon as possible. This would stimulate ratoon crop development. Our results do not confirm their findings. Probably due to severe moisture stress these practices did not make an impact. Their potential effects were overshadowed by effects of carbohydrate redistribution.
A remarkable increase in lodging was recorded with progressive delays in harvesting. Lodging scores at harvest were 7, 14, 27, and 85% for weeks 0, 1, 2 and 3, respectively. These results are in line with the concept of 'photosynthetic stress-translocation balance', developed by Dodd (1980) and ICRISAT (1984), viz. - plants are predisposed to rots as senescence of root cells progresses due to
a reduction of carbohydrates to maintain metabolic functions; - carbohydrate availability to root tissue is influenced by stress affecting
photosynthesis and by competition for carbohydrate by developing grain; - if a combination of photosynthetic stress and translocation balance reduces
availability of carbohydrates to root tissue, senescence of root and lower stalk cells progresses rapidly and pathogen resistance is lost;
- stalk rot pathogens invade and destroy root and stalk tissue. This reduces the stalk strength and frequently results in lodging.
Although we cannot prove the role pathogens are playing, our results show increased lodging with progressive delays in harvesting. We presume that moisture stress did not only result in low ratoon survival rates but also in making crops more vulnerable to stalk rots. Invaded pathogens, however, needed time to destroy sufficient tissue to cause lodging.
Cutting height and ratoon tiller thinning Statistical analyses per site showed that the factor interaction (cutting height x ratoon tiller thinning) was never significant. Therefore results for each factor can be presented separately. The 1981 results were not pooled over sites due to differences in midge control. On Alupe 1 ratoon crops were sprayed for midge; no control was practised on Alupe 2.
Cutting height Planted and ratoon crop results for all sites and selected cutting heights are presented in Table 8.33. It must be realized that differences in planted crop grain yields do not result from treatments. They are caused by natural variation as cutting heights were established after the harvest of planted crops.
Statistical analyses per site showed no effect of cutting height on yields of planted and ratoon crops and none on survival rates either. The low survival rates were conspicuous.
Some authors (e.g. Escalada and Plucknett, 1977) reported that cutting height was important in ratoon management. When plants were cut at ground-level the
191

number of basal tillers was highest. However, short stubbles were easily invaded by pathogens. They also claimed that cutting height affected the carbohydrate reserve available for survival and regrowth. Therefore, preferred cutting heights ranged from 3 to 8 cm.
Table 8.33. Planted and ratoon
Cutting height Site of planted crop
crop results for two
Grain vield (kq/ha) planted ratoon
cutting height treatments;
DM vield (kq/ha) planted ratoon
1980-81.
Survival rates {%)
Alupe 1980
Alupe 1 1981
Alupe 2 1981
ground-level 7.5 cm Mean
ground-level 7.5 cm
Mean
ground-level
7.5 cm
4458 4314 4386
1890 1966 1928
3244
3558
762 723 742
257 212 235
238 211
9055 8846 8950
4432 4324 4378
7326
7550
2129 1885 2007
494 482 488
928 919
33.4 37.4 35.4
8.8 10.7
9.8
13.6
13.3
Our results do not confirm these findings. Effects of moisture stress and redistribution of carbohydrates overshadowed possible effects of cutting heights. Ratoon yields were once again strongly related to ratoon survival rates; site-specificity was again stressed.
Ratoon tiller thinning Table 8.34 presents the planted and ratoon crop results per site and selected ratoon thinning treatment. Differences in planted crop yields as well as in ratoon survival rates do not result from thinning treatments; they are caused by natural variation. Ratoon tiller thinning was practised at a later date.
Table 8.34. Planted and ratoon crop results for selected ratoon tiller thinning treatments.
Site
Alupe 1980
Alupe 1 1981
Alupe 2 1981
Ratoon thinning
treatment
2 tillers/plant 4 tillers/plant no thinninq
Mean
3 tillers/plant no thinning Mean
3 tillers/plant no thinninq Mean
Grain vield (kq/ha) planted ratoon
4363 4574 4221 4386
2039 1817
1928
3384 3418
3401
660 762 805 742
230
240 235
205 245 225
DM vield planted
8869 9214 8768
8950
4615
4142 4378
7364 7512 7438
(ko/ha) ratoon
1737 2073 2212 2007
481 495 488
818 1029
924
Survival rates {%)
33.3 34.8 38.2 35.4
9.8 9.8 9.8
13.7
13.3 13. S
In most cases statistical analyses per site showed no significant effect of ratoon tiller thinning on ratoon yields. Only at Alupe-1980 was ratoon DM production significantly affected by tiller thinning.
The low to very low survival rates were conspicuous; their site-specificity was stressed. This demonstrates once again that local environmental factors are more important to ratoon performance than management factors.
192

Visua] score
13 30 70 95
midge damage (% sterility)
Actual yield
12.8 7.3 2.9 0.4
grain (g/head)
Potential grain yield (g/head)
14.7 10.4 9.7 8.0
Comments on midge damage can be made by comparing ratoon results of both 1981 sites. Table 8.34 shows that relatively lower ratoon grain yields were harvested at Alupe 2. Although similar grain-stover ratios for planted crops were recorded at Alupe 1 and 2 (0.64 and 0.68, respectively), ratios for ratoon crops showed big differences (0.75 and 0.28, respectively). Midge damage was mainly responsible; at Alupe 2 where no midge control was practised, the visual damage score averaged 49% sterility.
To establish the relationship between flowering date of ratoon tillers and midge damage levels, additional observations were made at Alupe 2 at 10-day intervals. On four observation dates we randomly labelled 100 flowering heads. At harvest, midge damage was scored (Table 8.35).
Table 8.35. Midge damage in relation to flowering date of ratoon tillers.
Flowering date
24 September, 1981 4 October, 1981
14 October, 1981 24 October, 1981
Note: potential grain yields per head are calculated by using damage scores and actual yields.
Tables 8.34 and 8.35 show that midge severely attacked the 1981 ratoon crops. In the second rains, midge was still present in sufficient numbers to cause serious damage to late flowering tillers. Through internal reinfestations midge populations reached high levels within two weeks.
A ratoon crop is never uniform; its flowering period will always be more prolonged than that of planted crops. Consequently, internal reinfestation of midge will always pose a threat, that may result in extensive damage to late flowering tillers. Fortunately, late tillers contribute less to grain production; their head size is much smaller than that of early tillers (Table 8.35). Our trials showed a long flowering period due to very low ratoon plant populations. From experience we know that the flowering period of ratoon crops is shorter with high survival rates. But, even then flowering periods must remain as brief as possible to prevent serious midge damage.
The potential for tiller thinning to improve ratoon performance was limited. Selected early-maturing varieties had difficulty in producing 2-3 healthy tillers after they were cut back. Their tiller ability was restricted. In the breeding process they had probably lost the ability to tiller.
Conclusions
Results of the ratoon management trials confirm our earlier findings. Once again it is concluded that the ratoon policy is not as promising as originally anticipated. Ratooning of early-maturing cultivars must be optional. Only in case sufficient high ratoon plant populations are expected, may ratooning be recommended.
193

Local ratoon plant populations are determined by ratoon survival. Ratoon survival depends on two variables, viz. the survival rate and the plant population of the planted crop. If selected populations are close to the optimum range for grain production, the percentage of surviving plants (ratoon survival rate) is mainly determined by site-specific conditions. The number of surviving plants within sites, however, bears a strong positive relationship with planted crop plant populations.
Particularly site conditions favouring post-flowering moisture stress (e.g. drought, shallow soil) are causing low ratoon survival rates. Redistribution of carbohydrates from stem to head seems to play a major role. When this stress occurs, reserves needed for survival and regrowth are depleted.
Satisfactory ratoon crop performance depends on two preconditions. First, sufficiently high ratoon plant populations are needed. Second, adequate levels of soil fertility to sustain production are required. If one of these preconditions is not met, ratoon crop yields are disappointing.
Local environmental factors and planted crop plant population are affecting ratoon survival and performance much more than any of the other tested management practices viz. fertilizer management level, time of harvesting, cutting height and ratoon tiller thinning. Probably due to severe moisture stress these practices do not make any impact; effects of carbohydrate redistribution seem to be much more important.
Midge damage may hamper grain production of ratoon crops. Internal reinfestations may quickly result in extensive damage to later flowering tillers. As ratoon crops are never uniform, management practices must be aimed at letting tillers flower as evenly as possible. However, results show that the scope for improvement of ratoon performance through management practices is very limited. Even ratoon tiller thinning to synchronize flowering appears not to be an effective tool; the tillering ability of selected early-maturing cultivars is too low.
In farmer recommendations the conditionality of the ratooning policy should be stressed. Chances of good ratoon crops of early-maturing varieties are increased by selecting fertile fields with deep soils. They are further increased when targeted plant populations are high (150,000 pl/ha) and fields are well weeded to avert moisture competition during grain filling. However, these practices do not guarantee a good ratoon performance. End of season droughts may still interfere and cause low ratoon survival rates.
However, when planted crops are harvested, a fair idea of survival may be obtained by cutting the stover. Dead or dying stems will be apparent. If satisfactory survival rates (>40%) are anticipated, crops may be retained. Stovers should then be cut back immediately (cutting height: 0-7.5 cm) and removed. If poor survival is apparent, crops may be ploughed in.
194

8.5 PEST CONTROL OF CROPS PLANTED IN THE SECOND RAINS
Second-rain ratoon crops of early-maturing cultivars were not as promising as anticipated earlier. However, planted crops of selected cultivars performed well in various second-rain cropping seasons. Many husbandry problems (e.g. low soil fertility) were similar to those encountered in the first rains. But one major aspect in cropping differed between the two seasons. Crops in the second rains always faced high shoot fly damage levels (>50% dead hearts). Consequently, uneven crops were produced that favoured a rapid build up of the midge pest.
With shoot fly and midge control, second-rain planted crops yielded satisfactorily. In our on-farm programme grain yields ranged from 1300 to 4000 kg/ha. At Alupe ARS they ranged from 2000 to 2500 kg/ha.
Conventional control methods for shoot fly and midge are too expensive for local farmers. For instance, we applied carbofuran granules (3.2 kg/ha a.i.) to planting furrows to control shoot fly. In 1981 the cheapest brand of granules (5% a.i.) cost 355 Kshs per 25 kg bag. Hence, 910 Kshs were needed to only buy the insecticide. The 1981 sorghum grain price was 0.90 Kshs/kg. With current yield levels, it is evident that shoot fly control by carbofuran granules is out of the question.
Introduction of cheaper methods of shoot fly control may provide the key to successful sorghum plantings in the second rains. Once such control is feasible, it will be difficult for midge to build up and cause serious damage. With careful husbandry practices synchronization of flowering may be improved (e.g. using low or residual levels of phosphorus), reducing the midge damage risk even further.
Literature review
The general findings of a literature study on shoot fly control by cultural practices, host plant resistance and chemicals are presented in Chapter 3.3.2. In this chapter more attention is paid to cheap chemical control methods. A specific literature study was conducted; a brief review is presented below. As shoot fly is only a pest in Africa and Asia, the review is mainly based on literature from India. Relevant findings determined the content of our research programme in Busia.
Shoot fly control in India was needed when sorghum hybrids were introduced in the 1960s. Initially, application of phorate or disulfoton granules to planting furrows was recommended. Later carbofuran granules were considered more effective, but costs and cumbersome applications prevented widespread adoption. Attention was then focused on spraying of insecticides. These were less expensive and easier to apply, but proved rather ineffective. Subsequent research focused on applications of new systemic insecticides as seed treatments. One carbamate (carbofuran; FMC company) showed great promise (Jotwani, 1972).
In India seed treatments must protect seedlings from shoot fly damage for a 3-4 week period after planting. In Indian research programmes (Jotwani et al., 1971 and 1972; Kulkarni and Jotwani, 1978 and 1979) it is common practice to
195

control stem borers by three insecticide applications at 10-day intervals. These plant whorl applications with endosulfan or carbaryl granules already start 3 weeks after germination. Such early stem borer treatments will also control shoot fly beyond the first 3 weeks.
Many trials were conducted to determine the effective dose of carbofuran seed treatment to control shoot fly. The treatment dose is often expressed on a weight to weight basis; e.g. 3.0% treatment means that 3.0 kg a.i. carbofuran was mixed as a seed treatment with 100 kg seed. With susceptible sorghum hybrids preliminary testing showed carbofuran seed treatment to be effective. Treatment doses ranged from 0.5 to 3.0%. With the 3.0% treatment the dead heart percentage was only 3% at 3 weeks after germination; the untreated check recorded 74% (Jotwani, 1972).
Further multi-locational testing with higher doses (range 3.0-6.0%) showed variable results. Although seed treatments significantly reduced shoot fly damage at all sites, some sites showed no damage whereas others showed moderate damage levels (20-30% dead hearts). Damage levels to the untreated check were always high (60-100% dead hearts). Site differences in soil type and texture, soil moisture content and rate of seedling growth were assumed to be responsible. The seed treatment proved to be more effective in light than in heavy black soils. On some sites drought occurred restricting soil moisture availability. This may also have hampered the uptake of carbofuran by seedlings. In combination with slower seedling growth, this may have resulted in higher shoot fly damage levels.
Jotwani (1972) reported increased oviposition on carbofuran treated seedlings compared to untreated seedlings. Growth of seedlings was stimulated by the insecticide. Flies preferred the more vigorous seedlings for egg laying.
Some experiments studied the adverse effects of carbofuran treatment to seed in storage. Jotwani (1972) reported that when treated seeds (4%) were stored for 9-16 months the seed treatment had not lost its efficacy to control shoot fly. Germination in the field was not affected by seed treatment nor by storage period. Chundurwar and Karanjkar (1979) also found that seed treatment (5%) had no adverse effects on germination when seed had been stored for 2-6 months after treatment.
Objectives
As successful cropping of early-maturing sorghums in the second rains could provide the key to a major shift in the cereal cropping system, we were aware of the importance of a solution to the shoot fly threat. Compared to other chemical control methods, control by seed treatments of systemic insecticides seemed promising and economically feasible. A programme was conducted to study: - relationships between seed treatment dose and shoot fly protection level; - effects of seed treatment dose on germination; - effects of post-treatment seed storage period on germination and efficacy in
shoot fly control; - levels of shoot fly control provided by seed treatments compared to other more
expensive methods.
196

Materials and methods
The programme comprised laboratory and field tests. Laboratory tests were often used in germination studies. Their management is simple compared to field tests. Field tests were mainly used to study the efficacy of treatments in shoot fly control.
In 1980 we only conducted a field experiment. We compared carbofuran seed treatments with applications of DDT powder (plant whorl) and carbofuran granules (plant whorl and soil). Treatment of seed took place a week before the trial was planted. Seed of 'E 525 HR' was used. Planting in late May ensured high shoot fly infestation levels. Per plot 400 healthy seeds were planted; seed rates were about 7 kg/ha. A Randomized Complete Block Design with 3 replications was used. Germination was scored 2 weeks after planting. Shoot fly damage (% dead heart main tillers) was scored 4 weeks after planting. No further records were taken.
Ten treatments were established: - Control treatment (no protection at all); - Carbofuran seed treatment at 0.5% (0.5 kg a.i./100 kg seed); - Carbofuran seed treatment at 1.5%; - DDT powder applied to whorls 1 week after sowing (1.75 kg/ha a.L); - DDT powder applied to whorls 2 weeks after sowing (1.75 kg/ha a.L); - Carbofuran granules banded in planting furrows (3.2 kg/ha a.i.); - Carbofuran granules applied to planting hills (1.6 kg/ha a.i.); - Carbofuran granules applied to whorls 1 week after sowing (1.6 kg/ha a.i.); - Carbofuran granules applied to whorls 2 weeks after sowing (1.6 kg/ha a.i.); - Carbofuran granules to whorls at 1 and 2 weeks (total: 3.2 kg/ha a.i.).
In 1981 the programme included laboratory and field tests. We focused on effects of various carbofuran seed treatment doses. In field tests we included two other treatments (no and full protection), to make meaningful comparisons possible.
At the start of the programme a batch of healthy seed from one of our 'E 525 HR' seed production fields was harvested. For each selected treatment 0.5 kg seed was set aside. Later these were mixed with different amounts of the carbofuran seed treatment to prepare the selected doses. After mixing, the seed was quickly dried, put in paper bags and stored at ambient room temperatures. Except for addition of the chemical, seed for the two other treatments were treated similarly. The FMC company supplied the chemical (350 g/1 a.i).
In our tests the following treatments were established: - 4 doses of carbofuran seed treatment, viz. 0.5%, 1.0%, 1.5% and 3.0%; - 2 other treatments where the seed treatment had not been added. In laboratory tests the last two treatments were identical; the control treatment was measured twice. In our field test, however, these treatments differed; either no or full shoot fly protection was provided. Soil applications of carbofuran granules (3.2 kg/ha a.i.) were used to provide full protection.
197

In laboratory tests effects of seed treatment dose and storage period on seed germination were studied. We had stored the treated seed for periods of 13, 26 and 52 weeks before germination tests were initiated. Each test was designed as a Randomized Complete Block Design with 3 replications. The experimental unit was a petri dish containing 100 seeds. Seeds were put on water soaked filter papers. After closing the dishes were put in a dark cupboard. Germination scores were taken after 4 and 10 days.
In a field test effects of seed treatment dose on shoot fly control efficacy and seed germination were studied. We used seed that had been stored for 13 weeks. Planting in late August ensured high shoot fly infestation levels. Per plot 840 healthy seeds were sown; seed rates were about 7 kg/ha. A Randomized Complete Block Design with 3 replications was used. Germination scores were recorded 2 weeks after planting. Shoot fly damage was scored 6 weeks after planting. No further records were taken.
In 1982 the programme also used laboratory and field tests. General procedures were similar to those described for the 1981 programme. Treatments, however, differed slightly. The selected treatments were: - 4 doses of carbofuran seed treatment, viz. 1.0%, 2.0%, 3.0% and 4%; - 2 other treatments similar to those established in the 1981 programme. In the 1982 laboratory tests we compared freshly treated seeds with treated seeds that had been stored for 26 weeks. This time, germination scores were taken at 4, 8 and 12 days.
In the 1982 field test freshly treated seed was used. Planting in early May ensured high shoot fly infestation levels. Per plot 480 healthy seeds were sown. Germination was scored 2 weeks after planting. As the original plan also included final grain and DM yield determinations, thinning to 120 plants per plot immediately followed germination scoring. This minimized possibilities for selective thinning; shoot fly damage could not be clearly recognized yet. Shoot fly damage was scored 3, 4, 5 and 6 weeks after planting. Unfortunately, due to a severe late season drought we were unable to collect final yield data.
Results and discussion
1980 Results of the 1980 field test are presented in Table 8.36. Germination and shoot fly damage were scored at 2 and 4 weeks after sowing, respectively. Whorl applications of insecticides took place at 1 and 2 weeks after sowing.
Carbofuran seed treatments and soil applications increased germination. Probably germinating seeds were better protected from soil pests.
Application of carbofuran granules to whorls of very young seedlings was cumbersome. Whorls were still tiny and many granules fell on top of the soil. Germination and dead heart scores as well as ease of handling all indicate that soil applications must be preferred.
198

85 96 92
81 77 94 93 86 79 83
20 20 14 26 36
0 0 4
8 0
Table 8.36. Germination and shoot fly damage scores in the 1980 field test.
Germination % Dead heart % Treatment at week 2 at week 4
Control Carbofuran seed treatment (0.5% = 0.5 kg a.i./lOO kg seed) Carbofuran seed treatment {1.5% = 1.5 kg a.i./lOO kg seed) DDT powder in plant whorls at 1 week (1.75 kg/ha a.i.) DDT powder in plant whorls at 2 weeks (1.75 kg/ha a.i.) Carbofuran granules in planting furrows (3.2 kg/ha a.i.) Carbofuran granules in planting hills (1.6 kg/ha a.i.) Carbofuran granules in plant whorls at 1 week (1.6 kg/ha a.i.) Carbofuran granules in plant whorls at 2 weeks (1.6 kg/ha a.i.) Carbofuran granules in plant whorls at 1+2 weeks (3.2 kg/ha a.i.
Dusting with locally available DDT powder was not Helpful at all. In view of these results and environmental dangers, further testing with DDT was abandoned. Compared to the control, DDT treatments even showed higher damage levels. Doggett and Jowett (1964) reported similar findings. In their trials DDT also increased shoot fly attack. They assumed that DDT controlled the pest's parasites and predators without controlling the pest itself.
Effects of the seed treatment dose on shoot fly control efficacy were less than anticipated. Damage levels at 4 weeks after sowing were similar for control and 0.5% seed treatments. The 1.5% seed treatment only showed small improvements in shoot fly control. Potential explanations: - the seed treatment doses were too low (local soils contain a high clay %); - the period was too dry for effective uptake of carbofuran; rainfall in the first
three 10-day periods of the test was 50.6, 10.1 and 6.9 mm, respectively. However, this was contradicted by the results for soil applications of carbofuran granules. Actual carbofuran application levels might have played a role (with 0.5% and 1.5% seed treatment we only applied 0.035 and 0.105 kg/ha a.i.);
- shoot fly damage was recorded too early. As even the control showed low damage, scoring may better be postponed until 6 weeks after planting. Around Busia shoot fly is active until 6 weeks after sowing.
1981 To test these hypotheses we changed the design in 1981. We focused on different doses of carbofuran seed treatment. They were compared with treatments where no (control) and full protection (soil application of carbofuran granules; 3.2 kg/ha a.i.) were provided. A wider range of seed treatments (0.5-3.0%) was covered. Results for the 1981 laboratory and field tests are presented in Tables 8.37 and 8.38, respectively.
Laboratory tests showed that seed treatment affected germination. It decreased as well as delayed germination. Effects were more pronounced with higher doses. Decrease in germination was stronger with longer storage periods. Delay in germination was not much affected by length of storage period.
199

Table 8.37. Germination percentages (%) of treated seeds on days 4 and 10 after the start of laboratory tests. Seeds were treated in 1981 and subsequently stored for 13, 26 and 52 weeks.
Treatment
Control
Carbofuran seed treatment
Carbofuran seed treatment Carbofuran seed treatment Carbofuran seed treatment
(0.5%) (1.0*) (1.5%) (3.0%)
13 day
86 78 69 66 61
rfeeks 4 day
86 83 79 77 73
10 26 day
83 71 62 55 49
rfeeks 4 day
85
78 69 69 64
10 52 day
83 70 66 61 45
weeks 4 day 10
83 77 74 71 58
67 65 65 69 65 65
59 7
60 56 60 54
Although the seed treater decreased germination in the laboratory, this was less noticeable in the field (Table 8.38). Seeds stored for 13 weeks showed a germination of 86% (laboratory) and 67% (field) for the control treatment and 73% (laboratory) and 65% (field) for the highest seed treatment.
Table 8.38. Germination and shoot fly damage in the 1981 field test. Seeds were treated and stored for 13 weeks before planting.
Germination % Dead heart % Treatment at week 2 at week 6
Control Carbofuran granules in planting furrows (3.2 kg/ha a.i.) Carbofuran seed treatment (0.5%) Carbofuran seed treatment (1.0%) Carbofuran seed treatment (1.5%) Carbofuran seed treatment (3.0%)
At least two processes are responsible for lower germination scores in the field. First, soil pests may kill seeds or seedlings before the scores are made. As the 1981 germination scores for control and other treatments were at par, soil pests were not important this year contrary to other years. Second, only those seedlings are counted that are capable of emerging through several centimetres of soil. Weak seeds may germinate but not emerge; they cannot be counted and included in field germination scores.
The difference between laboratory and field germination scores for the highest seed treatment is less pronounced. It seems that the seed treatment coating creates an additional mechanical barrier during germination. Consequently, some weak seeds no longer germinate. This affects laboratory germination scores more; under field conditions these weak seeds would not produce emerging seedlings anyhow.
A decrease in germination caused by the chemical seed coating indicates that seed's respiration is hampered. The higher the dose and the longer the storage period, the lower the germination. However, Table 8.37 shows that germination was still 58% for the highest seed treatment even if seed had been stored for 1 year. Hence, the decrease in germination is small. It can be easily overcome by small adjustments in seed rates.
Seed treatment also delayed germination. The higher the dose the greater the delay. Through the chemical coating, water reached the inner seed at a slower speed. However, delays were small and of minor importance.
200

The complete absence of seed treatment effects on shoot fly damage scores was remarkable. Either the chemical is ineffective or something else had happened. When we notified the chemical company of our findings they suggested that the shelf life of the chemical had expired. We had used a 3 year old batch. We decided to repeat the trial in 1982, after the company had provided us with a fresh bottle of the chemical.
We tried to list other possibilities as well. The doses might have been too low for effective control. Another possibility was that the seed treater did not protect the crop for the full 6 week period after sowing. If the chemical became ineffective or inactive within 4 weeks after sowing, higher egg loads on seed treatment plots might have increased damage rates from 4-6 weeks after sowing.
Rainfall records were studied to determine if the chemical might have become ineffective. Rainfall totals for the first four 10-day periods after sowing were 119.4, 47.1, 56.5 and 48.3 mm, respectively. Heavy rainfall (especially during the first decade) might quickly have dissolved and leached the chemical beyond the reach of the seedling roots. We decided to repeat the trial.
1982 The trial design was again altered. Higher doses of seed treatment were included. From 3-6 weeks after planting shoot fly damage scores were taken at weekly intervals. Results for the 1982 laboratory and field tests are presented in Tables 8.39 and 8.40, respectively. The chemical company supplied a fresh bottle with the seed treatment; it was only 8 months old when applied. The seed treatments were applied in the presence of a representative of the chemical company.
The results confirm earlier findings. Seed treatment decreased and delayed germination in the laboratory (Table 8.39). These decreases were stronger with higher doses and longer storage periods.
Table 8.39. Germination percentages (%) of treated seeds on days 4, 8 and 12 after the start of laboratory tests. Seeds were treated in 1982 and subsequently stored for 2 and 26 weeks.
Treatment
Control Carbofuran seed treatment Carbofuran seed treatment Carbofuran seed treatment Carbofuran seed treatment
(1.0*) (2.0%) (3.0%) (4.0%)
2 weeks
day
76
58 46 46 42
4 day
78 77 71 68 60
10 day
80 78 73 69 65
12 26 day
75 45 43 33 30
weeks 4 day
76 57 53 41 41
10 day 12
76 72
68 57 57
Other effects were more important in the field (Table 8.40). Soil pests substantially reduced germination on control plots; all other treatments provided adequate protection. Similar results were obtained in 1980.
The field germination score for the highest seed treatment dose was good (71%; Table 8.40). Adjustments to seed rates are therefore not required. However, it was puzzling why this treatment had a lower germination in the laboratory than in the field. The carbofuran content of moisture taken up by germinating seeds may
201

Germination % at week 2
55 67 70 71
68 71
Dead 3
9 0 6 4
2 1
heart % 4
25 2
29 25 20 16
5
45 14 42
39 31 28
at week 6
55 24 51 49 43 42
be responsible. This is always higher under laboratory than under field conditions; only small quantities of water are supplied to petri dishes. In addition, leaching and adsorption do not occur in petri dishes.
Table 8.40. Germination and shoot fly damage in the 1982 field test. Seeds were treated and stored for 2 weeks before planting.
Treatment
Control Carbofuran granules in planting furrows (3.2 kg/ha a.i. Carbofuran seed treatment (1.0%) Carbofuran seed treatment (2.0%) Carbofuran seed treatment (3.0%) Carbofuran seed treatment (4.0%)
The level of shoot fly control provided by seed treatments was not as good as we had anticipated. Only the two higher doses showed some systematic pattern in protection. As in India these levels protected the crop from shoot fly attack until 3 weeks after sowing. However, our controls were never damaged as severely as those in India at 3 weeks. Our cultivar was probably less susceptible. Subsequently, shoot fly damage started to build up rapidly. However, the rate was a bit slower for the higher doses.
Compared to other years the extensive damage for the 'full protection' treatment was remarkable. Again rainfall records were studied. Totals for the first four 10-day periods after sowing were 113.8, 224.3, 59.3 and 13.4 mm, respectively. Initial heavy rainfall may have dissolved granules too quickly causing leaching of the chemical beyond the reach of seedling roots. This may explain the lower efficacy in shoot fly control. If leaching was important it would also have occurred on plots protected by seed treatments. This may be the reason why higher doses did not sufficiently protect crops. Further research is required.
Conclusions and recommended future research
The level of shoot fly control provided by the carbofuran seed treatment is not as good as we had anticipated. Only with seed treatment doses of 3-4%, did some systematic pattern in protection become evident. As in India such doses fully protect the crop from shoot fly attack until 3 weeks after sowing. However, subsequently, shoot fly damage start to build up rapidly. Death heart scores at 6 weeks are substantial and only 10-15% less than for control treatments. These disappointing final results may have been caused by abundant rainfall in the first weeks after sowing. Oviposition preference of flies may also have played a role. Further research is required.
In further field research two issues need clarification. The first concerns the control of shoot fly in the second rains by seed treatment alone. Research should be
202
conducted in the second rains; the first rains are often too wet to be representative. A further increase in seed treatment dose (4-6%) seems feasible and promising.
If protection from shoot fly in the first 6 weeks cannot be guaranteed by seed treatment alone, research on the second issue becomes relevant. The following questions can then be posed. Are additional insecticide applications needed at 3-4 weeks (as is practised in India to control stem borers) or is it possible to attain a good crop stand by selective thinning and adjustments in seed rates? In case additional insecticide applications are needed, what is their feasibility?
If additional protection beyond 3-4 weeks is needed, at least the seed treatment application will have brought some major advantages. It controls soil pests during germination and the first part of the shoot fly attack. It further permits easy insecticide applications to sufficiently large plant whorls at 3-4 weeks after sowing.
Depending on the outcome the insecticide Dipterex (3-5 % Trichlorphon) may need testing for late shoot fly/early stem borer control as it is locally available at a low price.
If seed treatment becomes recommended a seed company should handle its application and processing. Large seed quantities and high safety precautions prevent direct farmer involvement. Consequently, a time-lag between time of application and sowing is unavoidable. In our laboratory experiments lower germination was recorded when storage periods and seed treatment doses increased. However, our field experiments did not confirm these laboratory results. On the contrary, field germination often improved when seed treatment had been applied. Most likely, carbofuran protects germinating seeds from soil pests.
203

Photo 11: Response of sorghum 'E 525 HR' to P application; NP Placement Trial, 1981 (site 2). No phosphate was applied to the plot on the left; 30 kg/ha P205 was applied to planting furrows of the plot on the right.
Photo 12: Marking of crop-cut samples on farmers fields; Village Approach Programme.
204

9. EXTENSION EFFORTS ON ADAPTIVE TECHNOLOGY PACKAGES
Chapters 6 and 7 describe the availability of some early-maturing sorghums fitting within a particular niche of the local farming system and increasing management flexibility of local households. Chapter 8 covers the development of adaptive agronomy packages for these varieties. In this chapter extension results with respect to promising varieties and agronomy packages are summarized. Details may be found elsewhere (Enserink and Njeru, 1981 and 1982; Njeru and Enserink, 1982).
9.1 INTRODUCTION
Most of the selected varieties were produced by the former EAAFRO sorghum programme at Serere. Although they had shown large yield increases over local varieties in well-managed on-station trials, EAAFRO staff doubted whether these increases could be maintained when cultural factors were limiting and imposing a yield ceiling (Doggett et al., 1968).
Unfortunately, 16 years later none of the EAAFRO varieties featured widely in acreage in the Busia-Siaya target area. It shows that somewhere or somehow a gap existed between researchers and farmers. Nobody knew whether the failure to make an impact was due to: - inadequate extension efforts (resulting in farmers unawareness); - inappropriate variety characteristics (resulting in rejection of varieties); - insufficient targeting of extension messages (blanket recommendations with
insufficient attention to target groups and conditional clauses, resulting in farmers frustration).
Our research therefore did not focus on refinement of the experimental yield. It tried to identify major critical husbandry factors which impose yield ceilings on the local sorghum cropping system. Attempts were made to develop adaptive husbandry packages based on targeted and conditional recommendations.
The political climate in the early 1980s encouraged researchers to work closely together with extension staff and farmers in developing appropriate messages. The Permanent Secretary for the Ministry of Agriculture stressed the need for researchers to early disseminate their findings, by involving farmers through extended trials. The Director of Agricultural Research emphasized the need to assist farmers in producing more food by establishing maximum collaboration between extension (who should initially recruit farmers) and research staff. He also stressed the need to involve the administration during planning and implementation.
In developing adaptive husbandry packages for the new varieties, extension workers and farmers were already involved in our on-farm experimental programme. However, in looking for a way to expose varieties and packages to more farmers and test them under more environmental conditions, we met the Provincial and District extension staff at Alupe ARS in July 1980. During this
205

mean grain yields were 1630 and 2670 kg/ha for fertilized maize and early brown sorghums; unfertilized crops yielded 1230 and 2300 kg/ha, respectively. In Kakamega (n=3) fertilized maize and early brown sorghums yielded 3470 and 2730 kg/ha; unfertilized crops yielded 3470 and 2300 kg/ha, respectively.
Table 9.2. Average grain yields ('000 kg/ha) for entries in the 1981 demonstration approach programme. 100 kg/ha compound fertilizer (20-20-0) was applied to Block A ; no fertilizer was applied to Block B.
District
Kakamega
Bungoma
Busia
Si ay a
S.Nyanza
Kisumu
Overall mean
n
8
2
11
13
10
12
56
Block
A B A B
A B A B A B A B A B
Maize H 512
n.a. n.a. 2.36 1.06 2.83 1.97 n.a. n.a. 3 .08
2.19 3.34
2.90 n.a. n.a.
Local Sorghum
n.a. n.a.
1.49 1.02
2.23 1.61 n.a. n.a. n.a. n.a. 2.49 1.78 n.a. n.a.
Dobbs Bora
2.85 2.10 1.36 1.09 3.71 2.59 2.47 2.06 3.41 2.46 3.92
2.79 3.21 2.36
Earlv 3DX57
2.34 1.74 2.67
1.12 3.62 2.98 2.54 2.03 4.21 2.85 3.71 3 .04 3 .27 2.51
brown sorghum 5DX13 5 MY 14 6
2.17
1.59 2.62 1.23 3.20 2.66 2.99 2.30 4 .00 3.08 3.54
2.80 3.20 2.48
2.17 1.90 1.49 0.42 3.17 2.57 2.58
2.09 4.07
2.85 3.49 2.82 3.06 2.39
varieties E 525
2.55 1.90 3.02 1.37
3.85 2.82 2.53 1.95 3.76 2.56
3.29 2.70 3.20 2.37
Serena
1.75 1.57
2.15 0.96 3.13 2.50 2.56 1.83
3.89 3.01 3.40 2.57 2.97 2.27
Mean
2.20 1.74
2.39 1.02
3.39 2.71 2.64 2.04
3.98 2.87
3.48 2.79 3.14 2.40
Notes: n= number of sites; n.a.= due to omissions average yields for some entries cannot be presented. This was mainly due to maize and local sorghum not being planted at all sites. However, at some other sites either maize cobs were stolen (Kakamega) or due to drought maize produced such small cobs that shelling was not considered worthwhile (Siaya).
Among the early-maturing brown cultivars 3 DX 57/1/H/4 was the highest yielder followed by 5 DX 135/13/1/3/1. 'Serena' was the lowest yielder in this group. However, care should be taken not to attach too much importance to these yield data as too many factors may have influenced results. An example will be presented for illustration: At all sites '3 DX 57' was grown alongside 'Indian Synthetic 387-1', the white cultivar. This might have resulted in lower bird damage to '3 DX 57' compared to other brown varieties as birds prefer white-seeded varieties (we called this the 'cafetaria effect'). In three years of Regional Variety Testing '3 DX 57' never showed up as the highest yielder; in these trials proper randomization was always carried out.
We also tried to derive adaptive fertilizer recommendations (Perrin et al., 1976) from the average yields of early-maturing brown sorghums (Table 9.2). Net benefits for the fertilizer treatment were calculated for each district. The marginal net benefit (which was obtained from an investment of 367 Kshs in fertilizer and labour) was -31 Kshs for Kakamega, 631 Kshs for Bungoma, 128 Kshs for Busia, 70 Kshs for Siaya, 120 Kshs for South Nyanza and 136 Kshs for Kisumu. The corresponding marginal rates of return to capital were -8% (Kakamega), 172% (Bungoma), 35% (Busia), 19% (Siaya), 120% (South Nyanza) and 37% (Kisumu). Rates in Kakamega were negative probably due to soil fertility not being an important limiting factor yet. Rates in Busia and Siaya were rather low. The short
212

growing season may have played a role. However, based on results from our fertilizer programme we think that more appropriate fertilizers should have been selected. Better results would probably have been obtained if a P fertilizer had been used here instead of the applied NP compound fertilizer.
As researchers, we were rather disappointed by the outcome of the programme. Although the exposure objective was achieved, results of this programme could not be used to evaluate our research findings or fine-tune our farmer recommendations. Too much variation occurred and (to make matters worse) was not properly documented. Meaningful grouping to arrive at targeted recommendations, was impossible. This resulted in the presentation of averages; we only ended up with 'blanket' recommendations. Our understanding had not increased. We felt frustrated as real interaction with farmers and village-based extension workers had not occurred. We concluded that we had to look for other approaches.
9.3 THE 1981 VILLAGE APPROACH PROGRAMME
Objectives
The 1981 Village Approach Programme exposed some early-maturing sorghums to farmers in a concentrated area close to Alupe ARS. A temporary agronomy recommendation package on planting method and phosphate fertilizer use was also tested for compatibility. Angoromo sub-location was selected as its households were familiar with the sorghum programme due to collaborative implementation of on-farm trials.
The test's objective was to establish whether selected sorghums and recommendation package were stable across different farmers production environments. Interaction between households, researchers and extension staff was stimulated, to further develop conditional recommendations.
Materials and methods
All households could participate in the programme as long as they lived in Angoromo. Interested farmers were listed at sub-chief level meetings at which objectives and nature of the programme were explained. Subsequently, they were invited to a 1-day workshop on local sorghum production constraints held in February by local research and extension staff at the Busia Farmers Training Centre. Three workshops had to be organized as about 100 farmers were willing to participate. These workshops were followed by on-farm field days in March-June.
Site selection was left to the farmers and usually a field was chosen where sorghum was to be grown that particular season. The target was 1-acre fields, however, any household which had prepared a reasonably sized piece of land could join the programme. Households themselves were responsible for land preparation and had to decide on husbandry practices (sowing, thinning, weeding, harvesting).
213
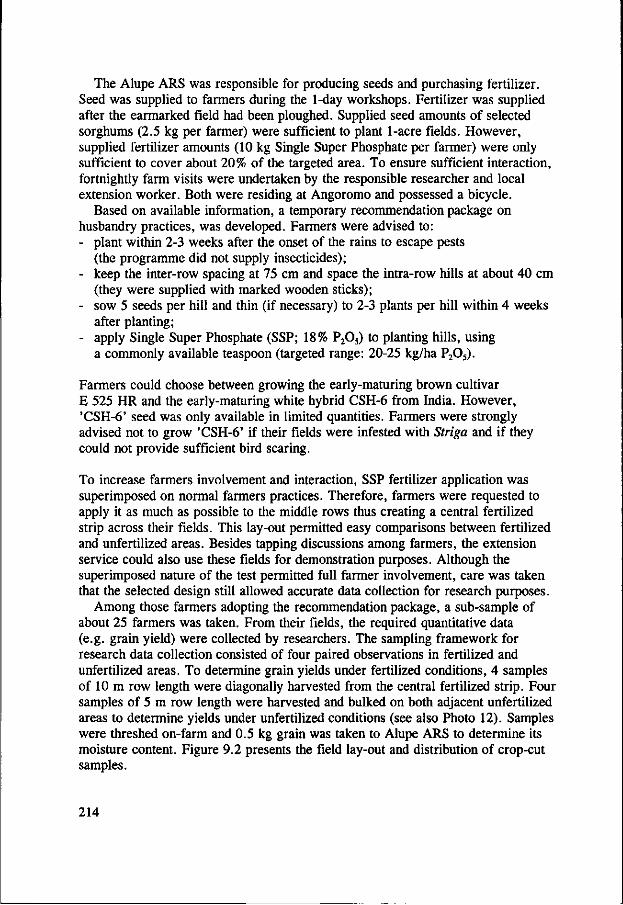
The Alupe ARS was responsible for producing seeds and purchasing fertilizer. Seed was supplied to farmers during the 1-day workshops. Fertilizer was supplied after the earmarked field had been ploughed. Supplied seed amounts of selected sorghums (2.5 kg per farmer) were sufficient to plant 1-acre fields. However, supplied fertilizer amounts (10 kg Single Super Phosphate per farmer) were only sufficient to cover about 20% of the targeted area. To ensure sufficient interaction, fortnightly farm visits were undertaken by the responsible researcher and local extension worker. Both were residing at Angoromo and possessed a bicycle.
Based on available information, a temporary recommendation package on husbandry practices, was developed. Farmers were advised to: - plant within 2-3 weeks after the onset of the rains to escape pests
(the programme did not supply insecticides); - keep the inter-row spacing at 75 cm and space the intra-row hills at about 40 cm
(they were supplied with marked wooden sticks); - sow 5 seeds per hill and thin (if necessary) to 2-3 plants per hill within 4 weeks
after planting; - apply Single Super Phosphate (SSP; 18% P205) to planting hills, using
a commonly available teaspoon (targeted range: 20-25 kg/ha P205).
Farmers could choose between growing the early-maturing brown cultivar E 525 HR and the early-maturing white hybrid CSH-6 from India. However, 'CSH-6' seed was only available in limited quantities. Farmers were strongly advised not to grow 'CSH-6' if their fields were infested with Striga and if they could not provide sufficient bird scaring.
To increase farmers involvement and interaction, SSP fertilizer application was superimposed on normal farmers practices. Therefore, farmers were requested to apply it as much as possible to the middle rows thus creating a central fertilized strip across their fields. This lay-out permitted easy comparisons between fertilized and unfertilized areas. Besides tapping discussions among farmers, the extension service could also use these fields for demonstration purposes. Although the superimposed nature of the test permitted full farmer involvement, care was taken that the selected design still allowed accurate data collection for research purposes.
Among those farmers adopting the recommendation package, a sub-sample of about 25 farmers was taken. From their fields, the required quantitative data (e.g. grain yield) were collected by researchers. The sampling framework for research data collection consisted of four paired observations in fertilized and unfertilized areas. To determine grain yields under fertilized conditions, 4 samples of 10 m row length were diagonally harvested from the central fertilized strip. Four samples of 5 m row length were harvested and bulked on both adjacent unfertilized areas to determine yields under unfertilized conditions (see also Photo 12). Samples were threshed on-farm and 0.5 kg grain was taken to Alupe ARS to determine its moisture content. Figure 9.2 presents the field lay-out and distribution of crop-cut samples.
214

58* area
area
area
unfertilized area
5 m
fertilized strip 10 m
5 m
unfertilized area
5 m
10 m
5 in
5 m
10 m
5 m
5 m
10 m
5 m
Figure 9.2. Field lay-out and distribution of crop-cut sample areas (=) ; 1981 Village Approach Programme.
Observations were paired as we anticipated substantial variation due to the extent of farmers involvement. This permits the use of the sign test (a simple non-parametric comparative test) and may allow the use of the paired t-test. The paired t-test is particularly useful when one wants to accurately measure a treatment effect in an environment which shows a lot of variation (Snedecor and Cochran, 1967). We used paired observations to better establish grain yield differences due to P-fertilizer applications.
As teaspoons were used during fertilizer application, farmers could not accurately apply the targeted rate (20-25 kg/ha P205). We therefore asked them to put sticks next to the first and last hill of application. Within a week after sowing, we measured the marked area and checked several hills on the presence of SSP residues. As participating farmers were supplied with 10 kg SSP and application areas were measured, we could calculate application rates for most fields.
From each field researchers collected additional data on date and method of planting, plant population, soil type, level of Striga infestation, crop rotation, number of weedings, harvesting date, pest infestations and bird damage levels.
In addition to farmers field days, a field day was organized for policy-makers. During these field days participants walked from one field to the next and visited at least 10 different fields. On purpose, good and bad performing crops were included. Farmers acted as guides; they explained why they thought their crops were performing well or badly. This method encouraged discussions among farmers and also raised numerous questions. If research and extension had locally verified information on certain issues, they were invited to respond immediately.
Results and discussion
By far the best result this programme had generated was the enormous enthusiasm it created among farmers, extension and research staff. Not only was there much interaction between the three parties, but the crop performance of the
215
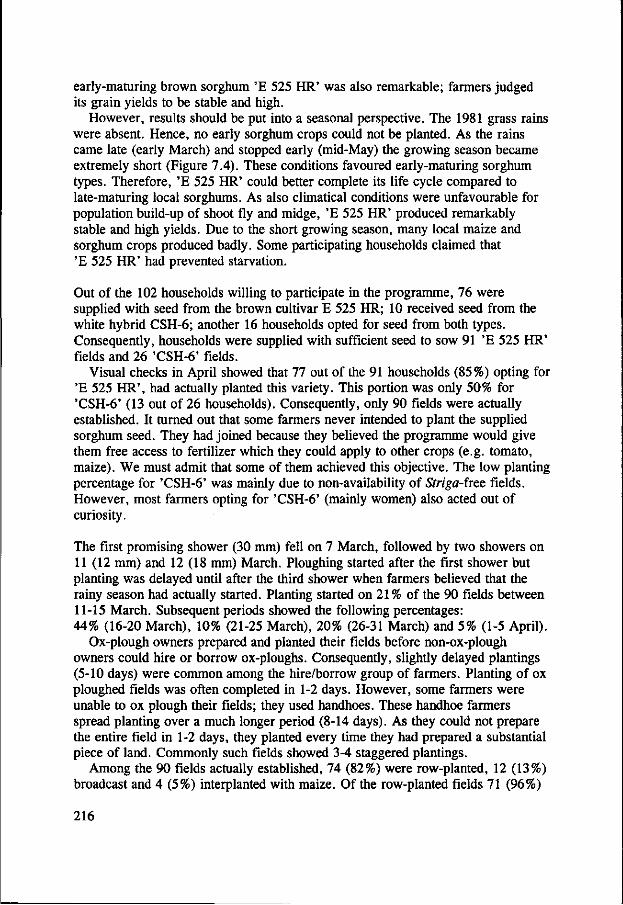
early-maturing brown sorghum 'E 525 HR' was also remarkable; farmers judged its grain yields to be stable and high.
However, results should be put into a seasonal perspective. The 1981 grass rains were absent. Hence, no early sorghum crops could not be planted. As the rains came late (early March) and stopped early (mid-May) the growing season became extremely short (Figure 7.4). These conditions favoured early-maturing sorghum types. Therefore, 'E 525 HR' could better complete its life cycle compared to late-maturing local sorghums. As also climatical conditions were unfavourable for population build-up of shoot fly and midge, 'E 525 HR' produced remarkably stable and high yields. Due to the short growing season, many local maize and sorghum crops produced badly. Some participating households claimed that 'E 525 HR' had prevented starvation.
Out of the 102 households willing to participate in the programme, 76 were supplied with seed from the brown cultivar E 525 HR; 10 received seed from the white hybrid CSH-6; another 16 households opted for seed from both types. Consequently, households were supplied with sufficient seed to sow 91 'E 525 HR' fields and 26 'CSH-6' fields.
Visual checks in April showed that 77 out of the 91 households (85%) opting for 'E 525 HR', had actually planted this variety. This portion was only 50% for 'CSH-6' (13 out of 26 households). Consequently, only 90 fields were actually established. It turned out that some farmers never intended to plant the supplied sorghum seed. They had joined because they believed the programme would give them free access to fertilizer which they could apply to other crops (e.g. tomato, maize). We must admit that some of them achieved this objective. The low planting percentage for 'CSH-6' was mainly due to non-availability of Striga-free fields. However, most farmers opting for 'CSH-6' (mainly women) also acted out of curiosity.
The first promising shower (30 mm) fell on 7 March, followed by two showers on 11 (12 mm) and 12 (18 mm) March. Ploughing started after the first shower but planting was delayed until after the third shower when farmers believed that the rainy season had actually started. Planting started on 21 % of the 90 fields between 11-15 March. Subsequent periods showed the following percentages: 44% (16-20 March), 10% (21-25 March), 20% (26-31 March) and 5% (1-5 April).
Ox-plough owners prepared and planted their fields before non-ox-plough owners could hire or borrow ox-ploughs. Consequently, slightly delayed plantings (5-10 days) were common among the hire/borrow group of farmers. Planting of ox ploughed fields was often completed in 1-2 days. However, some farmers were unable to ox plough their fields; they used handhoes. These handhoe farmers spread planting over a much longer period (8-14 days). As they could not prepare the entire field in 1-2 days, they planted every time they had prepared a substantial piece of land. Commonly such fields showed 3-4 staggered plantings.
Among the 90 fields actually established, 74 (82%) were row-planted, 12 (13%) broadcast and 4 (5%) interplanted with maize. Of the row-planted fields 71 (96%)
216

were dibbled using handhoes; on only 3 fields rows were sown continuously, probably because ox-ploughs had been used to open the planting furrows.
Among the row-hill-planted fields, 60% were weeded twice; 40% were weeded once. However, on 66% of the latter fields, cotton had been grown in the previous second rains resulting in rather weed-free seedbeds.
We restricted data collection on Striga infestations to 'E 525 HR' fields. Striga counts of fields ranged from 0 to 25 emerged plants per m2. To obtain a general impression of the gravity of the situation in the area, fields were classified according to their Striga counts. Based on results of earlier on-farm research (Chapter 6.3.4), three levels of infestation were distinguished, viz. low (<2 plants per m2), medium (2-10 plants per m2), and high (> 10 plants per m2). About one third of the fields belonged to each of the identified infestation classes.
All 'CSH-6' fields were row-hill-planted. However, among the thirteen households planting 'CSH-6', five were just curious and only planted a small area (<500 m2). Consequently, the amount of fertilizer was sufficient to cover the entire field, thus making comparisons between fertilized and unfertilized strips impossible.
Of the remaining eight farmers, two did not adopt the recommendation to plant 'CSH-6' on Striga-free fields. Their 'CSH-6' crops were so badly hit that they decided to re-plough before harvest.
On the other six 'CSH-6' fields yield data were recorded. Average grain yields (containing 12.5% moisture) for the fertilized and non-fertilized areas were 3068 and 2402 kg/ha, respectively. However, one field was not representative; it had only recently been brought under cultivation after a long fallow period. Therefore, its grain yields for fertilized (7413 kg/ha) and unfertilized (6752 kg/ha) areas, better represent potential than actual yield levels in the area. When data from this field are excluded, average grain yields (2199 and 1532 kg/ha for fertilized and unfertilized areas, respectively) are more representative of actual production levels.
In total 58 row-hill-planted fields of 'E 525 HR' were available for further data collection. However, eight fields were too small (< 500 m2) to permit yield comparisons between fertilized and unfertilized areas. Out of the 50 remaining fields, a random sample of 25 fields was taken for observations on plant populations, pest incidence and grain yields. As one field was harvested before research had taken its crop-cut samples, final data analyses are based on a sample of 24 fields.
The average plant population for the sampled fertilized areas was about 69,700 pl/ha. The estimated standard deviation of the sample (n=24) was 23,400 pl/ha. For the unfertilized areas these figures were 68,600 and 27,900 pl/ha, respectively. We concluded that with the recommended temporary husbandry package most farmers could stay within the targeted range of plant populations from 66,700 pl/ha (2 pl/hill) to 100,000 pl/ha (3 pl/hill). Only on a few waterlogged fields, did plant populations drop below 50,000 pl/ha. This
217

might partly have been caused by the recommendation to thin to 2 pl/hill which some farmers had adopted. We concluded that under actual field conditions thinning should not go beyond 3 pl/hill; our temporary recommendation package was adjusted accordingly.
Pest incidence was low. The 1981 rainfall pattern prevented early sorghum plantings and thus an early population build-up of shoot fly and midge. Most fields showed little or no damage. However, on some fields damage levels exceeded the 10% level. Invariably, these fields were either planted late (e.g. April) or showed slow crop development due to temporary waterlogging, high Striga infestation and low soil fertility. Often, as only certain field parts showed slow crop development, the within-field variability was high.
Midge damage to two fields exceeded the 20% level. One field belonged to a handhoe farmer, who staggered plantings over a two-week period. Other factors (soil fertility, Striga incidence) further increased the within-field variability. Although the farmer started planting early (16 March), conditions were ideal for rapid multiplication of midge. The other field was planted on 30 March and bordered an 'E 525 HR' field planted on 14 March. Again, ideal conditions for rapid multiplication of midge were created. These results confirm that infestation sources for midge are mainly located on or near the sorghum field itself.
Bird damage was within acceptable levels. Estimated damage to fields with the brown E 525 HR cultivar (n=24) averaged 5%. Fields with the white CSH-6 hybrid (n=6) averaged 12%. The need for measuring bird damage to sufficiently large fields is highlighted by our observations on the smaller sized CSH-6 plots (<500 m2; n=5). Here bird damage ranged from 20 to 60%. These percentages illustrate that conditions on small plots do not represent those on actual production fields due to either existence of 'cafetaria effects' or less effective bird scaring efforts. Therefore, we concluded that sorghum programmes should be extremely careful in basing their extension efforts on the demonstration site approach.
Actual grain production levels varied greatly between local sorghum fields. Chapter 8.3 indicates that differences in land use systems are mainly responsible for this. To gain an impression about present yield levels and their variation, we used data (n=24) from unfertilized areas. Firstly we defined a number of grain yield classes. Secondly, we identified the number of fields within each grain yield class, using the yield recorded at each field. Results are presented in Figure 9.3.
Figure 9.3 shows that the actual grain production level of many local fields (58%) has dropped below 2000 kg/ha. Based on grain/stover ratios of 0.75 and weed DM yields of 500-1000 kg/ha (Tables 8.29 and 8.27), it can be calculated that the biomass production level of many local fields has dropped below 6000 kg/ha DM. Again it is confirmed that the current land use system cannot sustain a high level of crop production. Its fallow periods have become too short to restore soil fertility to sufficiently high levels. The history of fields with high levels of grain production
218

(>3000 kg/ha) provides further reconfirmation. Invariably, these fields had been used as cattle kraals 5-10 years earlier.
8 -
w c o
+-• CO
> CD Cfl
o
6 -
o c
3 -
m—,—HI 1000 2000 3000 4000 5000 6000
grain yield classes (in steps of 500 kg/ha) 7000
Figure 9.3. Distribution pattern of grain yields among unfertilized sorghum fields, 1981 Village Approach Programme.
Average grain yields for fertilized and unfertilized areas (n=24) were 2832 and 2156 kg/ha, respectively. The sign test showed that fertilized areas produced significantly (P<0.01) higher grain yields than unfertilized areas. The mean fertilizer application level was 29.2 kg/ha P205; about 50% higher than the targeted rate. The median of levels was 24.8 kg/ha P205. As fertilizer rates varied greatly among fields, a more meaningful manner of data presentation was required.
Grain yield responses of sorghum 'E 525 HR' to P205 applications in Angoromo sub-location during the first rains of 1981 are presented in Figure 9.4. For this compilation, grain yield differences due to P205 applications as well as fertilizer rates were calculated for all 24 fields. As P205 application levels varied greatly, we defined a number of fertilizer rate classes. Subsequently, we identified the number of fields that fell within each class and calculated the average grain yield increase per class.
219

1200-1
10 x: o>
a> ID 10 a> o c a> '>. c
"(0
e
1000-
800-
6 0 0 -
4 0 0 -
2 0 0 -
0 - 1
1981-Angoromo
(n=24)
1982-Angoromo (n=32)
1982-Bugengi
(n=28)
n=17
n=6
n=10
n=17 n=6
n=9
5-15 15-25 25-35 0 0 0
>35 5-15 15-25 25-35 0 5-15 15-25 25-35
fertilizer rate classes (kg/ha)
23-46 46-69 69-92 P2OS 9-1 8 1 8-27 27-36 N
Figure 9.4. Grain yield responses of sorghum 'E 525 HR' to fertilizer applications in the 1981 and 1982 Village Approach Programmes.
Based on the mean grain yield increase and the mean fertilizer application rate per class, an economic analysis of results was made. Results of the partial budget analysis are presented in Table 9.3.
Table 9.3. Partial budget analysis for fertilizer rate classes; 1981-Angoromo.
Rate Class
5-15 15-25 25-35
>35
W h a P,0.) Mean
10.7 21.8 29.2 54.9
Increase in
mean yield (kg/ha)
507 686 74 7 670
Increase in gross field benefit (Kshs)
411
556 605
543
Variable costs SSP
117 238 319 600
Labour
16 16
16 16
(Kshs) Total
133 254
335 616
Increase in net benefit
(Kshs)
278 302 270 -73
Rate of return
(%) 209 119 81
-12
Notes: The following assumptions and prices played a role in this partial budget analysis: use of net yields was not required as the entire programme was carried out on-farm, sorghum fetched 0.9 Kshs/kg of grain at the Alupe transit store in 1981. Field prices are estimated to be 10* lower. SSP (18%) cost 89.35 Kshs per 50 kg bag at the Siaya transit store in 1981. Field prices are estimated to be 10% higher. SSP application takes 2 days/ha. Opportunity costs are 8 Kshs/day.
Based on results of the partial budget analysis (Table 9.3), and assuming that all fields belonged to the same recommendation domain, a marginal analysis was made. Marginal rates of return between fertilizer rate classes were calculated, starting with the lowest class and proceeding in a stepwise manner (Table 9.4).
220

Table 9.4. Marginal analysis for fertilizer rate classes; 1981-Angoromo.
Class (kg/ha P20s)
5-15 (n= 3) 15-25 (n=10)
25-35 (n= 6) >35 (n= 5)
Increase net benef (Kshs)
278 302 270 -73
in it
Variable costs (Kshs)
133 254
335 616
Marginal net
benefit (Kshs)
278 24
# #
Marginal costs (Kshs)
133 121
# #
Marginal rate of return (%)
209 20
# #
Notes: #= level dominated by another with higher benefits at lower costs; n= number of fields.
Table 9.3 indicates that only application levels of up to 25 kg/ha P205 may expect rates of return acceptable to local farmers (> 100%). Although Table 9.4 presents a low marginal rate of return for the 15-25 kg/ha P2Os class, this result must be interpreted with care as calculations for the 5-15 kg/ha P205 class are based on few observations.
A study into the riskiness of application levels of up to 25 kg/ha P205 shows that the lowest rate of return recorded among individual observations (n=13) is still 59%. Even in this case the tentative treatment shows good results. Therefore, it is likely that local farmers will adopt fertilizer recommendation rates of up to 25 kg/ha P205. As results were also in line with those of other on-farm experiments (Chapter 8.2), we continued to include rates of 20-25 kg/ha P205 in the temporary agronomy recommendation package for sorghum.
9.4 THE 1982 VILLAGE APPROACH PROGRAMME
Introduction
Extension staff favoured continuation of the sorghum extension efforts in 1982. Although they were willing to be the leading partner, collaboration with Alupe ARS was established again. However, as the extension service intended to undertake a large-scale programme, it was understood that research could never cover the entire range of activities.
Based on a joint evaluation of results in 1981, it was mutually agreed that the 1982 sorghum extension efforts would be concentrated in a few villages representative of the target area. Widely scattered demonstration sites were no longer used.
The extension service would cover the Busia, Siaya, Kisumu and South Nyanza Districts in the first rains of 1982. Three villages in Busia were selected; two in the Nambale Division (Angoromo and Bugengi/Mundika) and one in the Hakati Division (Odiato/Wakhungu). Two villages in Siaya were selected; one in the Ukwala Division (Sega) and one in the Boro Division (East Alego). Kakala (Nyando Division) and Nyakach (Kisumu Division) were selected in Kisumu; Kamenya (Kendu Division) and Orore (Nthiwa Division) in South Nyanza. Each village was covered by an extension worker.
221

Pest incidence Unlike 1981, seedlings at Angoromo in 1982 did not all germinate simultaneously due to gapfilling on the numerous early planted fields. In addition, due to the dry spell in 1982, planting of all sorghum fields at Angoromo took many weeks. This created a favourable environment for pest build-up within fields (internal reinfestation) and between fields (spread of infestation).
As gapfilling on early planted fields at Bugengi in 1982 was negligible, chances of internal shoot fly and midge reinfestation were slim. Due to these conditions and the few early established fields, pest infestations could only spread slowly to neighbouring sorghum fields on which planting had been delayed for 4-6 weeks.
On most Angoromo fields shoot fly damage occurred in 1982. Gapfilling was practised on fields planted before 7 March. Depending on the germination time-lag of gapfilled plants, average shoot fly damage to these earlier planted fields increased from 5% (3-week lag) to 25% deadhearts (6-week lag). As particularly gapfilled plants were hit, actual damage levels to these plants were much higher. Average shoot fly damage to later planted crops ranged from 10% (germination: 21-28 March) to 40% deadhearts (germination: 11-18 April).
These results confirm that in 1982 internal reinfestation as well as spread of infestation occurred at Angoromo. Late gapfilling on fields created favourable conditions for reinfestation. Distances between fields were neither large enough to prevent spread of shoot fly infestation.
Midge damage was clearly visible on most fields. Gapfilling caused extremely favourable conditions for internal reinfestation within early planted crops. Average midge damage levels varied (0-50%) depending on the flowering time-lag and the percentage of gapfilled plants. As gapfilled plants flowered later, their heads were always more damaged. In case gapfilled plants had first been hit by shoot fly, their heads often produced no grain.
Midge damage levels to later planted crops also varied substantially. In addition to flowering dates, distances to earlier flowering sorghum fields had to be taken into consideration. Most fields germinating between 21-28 March showed limited damage (0-20%). Those germinating between 11-18 April often showed damage levels of up to 40%. However, if an adjacent sorghum field had flowered before, or if shoot fly damage to the field itself had been extensive, damage easily reached the 60% level.
These results confirm that infestation sources for midge are located on or near the sorghum field itself. Unlike shoot fly, distances between fields play a major role in controlling the spread of midge infestation.
Additional observations support these statements on infestation sources for the two pests. Out of curiosity we observed two sorghum fields which did not belong to our sample, because they had been planted after 10 April. For both fields distances to neighbouring sorghum fields (planted between 21-28 March) were less than 20 m. About one third of the seedlings on both fields was damaged by shoot fly. Due to
228

extensive midge damage, no grain was harvested on one field. Surprisingly, a reasonable crop without much midge damage was harvested on the other field. However, this field was separated from the neighbouring sorghum field by a thick and high hedge of Euphorbia tirucalli. Unlike shoot fly, midges cannot cross such a barrier during their short life. Consequently, spread of infestation was restricted for midge but not for shoot fly.
At Bugengi shoot fly damage (<20%) only occurred on two of our sampled fields. Both fields germinated between 10-12 April. Out of curiosity we observed some fields which did not belong to our sample, as they had been planted too late. About 50% of the seedlings were damaged on fields germinating at the end of April.
Midge damage was observed on many fields at Bugengi. Average damage levels showed a relationship with germination date (Table 9.5). However, distances to earlier planted sorghum fields also played a major role. Lower damages were recorded when no neighbouring, earlier flowering sorghum crops were present. Table 9.5 presents recorded midge damage levels to sorghum crops grown under fertilized conditions (n=28). However, some records (n=6) for fields planted after 10 April have also been included. No range can be presented for these late planted sorghum crops as they were always close to a neighbouring crop flowering earlier.
Table 9.5. Midge damage (% sterility) to fertilized sorghum crops in relation to germination period and range of damage due to absence or presence of neighbouring crops flowering earlier.
Germination period
< 7 March 8 March - 21 March
22 March - 4 April S April - 18 April
> 18 April
Average damage
0.0 (n= 4) 5.8 (n= 3) 6.8 (n=16)
30.2 (n= 7)
89.8 (n= 4)
Range of damage
not applicable 0.6 - 13.fi
0.3 - 14.7 4.1 - 98.0 not applicable
Pest damage levels to fertilized crops in both villages were slightly lower than to unfertilized crops. Sometimes fertilized young crops grew faster, reducing damage by shoot fly. In addition, fertilized crops flowered a few days earlier and more synchronized, reducing the impact of midge.
Based on these results we concluded that the main reason for the 1982 grain yield reduction at Angoromo was the failure to synchronize germination within and between sorghum fields. An extremely favourable environment for internal reinfestations and spread of infestation of pests was created. Combined with the slightly lower plant population, this resulted in a 35 % reduction in average grain yield (about 750 kg/ha).
Compared to the 1981 yields at Angoromo, the lower yields at Bugengi may be partly explained by the considerably lower plant populations as well as by the higher pest damage levels. Although internal reinfestation was limited, spread of infestation occurred due to the extended planting period.
229

Bird and Striga incidence In 1982 bird damage levels at Angoromo were low (mean 4%) and similar to those recorded in 1981. Those at Bugengi were negligible (mean 1%; range: 0-8%).
The 1982 Striga counts for Bugengi were similar to those recorded at Angoromo in 1981. Again about one third of the fields belonged to each of the three identified infestation classes. As variation between fields can be used as an information source (Steenhuijsen Piters, 1995), we wanted to study relationships between grain yield and some field variables (Table 9.6). Hence, additional data on Striga infestation, weeding practices and soil depth were collected at Angoromo in 1982.
Table 9.6. Relationships between Striga infestation class and grain yield under fertilized and unfertilized conditions, soil depth and number of weedings; 1982-Angoromo.
Striga infestat (plants per m2)
0- 2 (n* 8) 2- 6 (n= 8) 6-10 (n=10)
10-20 (n= 6)
ion Grain ferti
2770 2230 1510 1360
yield lized
(kq/ha)
unfertilized
2120 1660
930 850
increase
650 569 581 512
Soil (cm)
57
32 31 33
depth Number of weedings
1.75 1.63 1.50 1.00
Table 9.6 supports the relationships between land use system, biomass production, soil fertility depletion and Striga infestation presented in Chapter 8.3. When soil fertility levels are still permitting reasonably high yields under unfertilized conditions (2120 kg/ha grain; 7-4 tonnes/ha biomass) management levels are high. Crops are often weeded twice. Striga cannot build up its infestation due to frequent weeding practices and rotation with cotton in the second rains.
However, with continued cultivation, soil fertility is slowly depleted. Consequently, yields are declining (from 1660 to 930 kg/ha grain; 4-2 tonnes/ha biomass). Striga infestation are increasing due to deteriorating weeding practices and reduced cropping of cotton.
If soil fertility is reduced even further, very low yields are produced (850 kg/ha grain; about 2 tonnes/ha biomass). Fallowing is then necessary to restore soil fertility levels. Crops grown under such conditions are often badly weeded. Rotation with cotton has been abandoned. Consequently, Striga infestation is high.
Rather similar grain yield increases for fertilizer use are recorded among the various Striga infestation classes. The slightly higher increases among the lower infestation classes are probably due to an interaction between the number of weedings and the use of fertilizer.
It should be noted that fields with moderately deep soils (50-80 cm) had lower Striga infestation levels and produced higher grain yields than those with shallow soils (20-50 cm). In interviews farmers stated that their best fields were those located on moderately deep soils. Here, management levels (number of weedings, crop rotation) are high. If manure is available, it is applied to these fields. Hence, Striga infestations remain lower whereas soil fertility remains higher.
230

Response to fertilizer Average grain yields (n=32) for fertilized and unfertilized areas at Angoromo were 1976 and 1394 kg/ha, respectively. They (n=28) were 2623 and 1727 kg/ha at Bugengi. The sign test showed that in both villages fertilized areas yielded significantly (P<0.01) more grain. At Angoromo the mean application level of the 20-20-0 compound fertilizer was 19.6 kg/ha N and P205. The median was 19.8 kg/ha N and P205. At Bugengi the mean application level of the 18-46-0 compound fertilizer was 19.4 kg/ha N and 49.7 kg/ha P205. The median was 20.9 kg/ha N and 53.4 kg/ha P205.
Due to changes in fertilizer type and lack of communication, application rates differed dramatically from the targeted range of 20-25 kg/ha P205. The applied fertilizer in both villages included an N component, and at Bugengi application rates for P205 dramatically exceeded the targeted range. However, further study of these data produced interesting results.
To present the sorghum grain yield responses to fertilizer applications, we processed data in accordance with the methodology developed for the compilation of the 1981 data from Angoromo. However, comparison of results between villages and years played an important role in the choice and definition of the 1982 fertilizer rate classes. Therefore, results for 1981 and 1982 are presented simultaneously (Figure 9.4).
When the 1981 and 1982 yield increases for Angoromo are compared (Figure 9.4), it is evident that addition of N was not effective. Although a limited amount of N (e.g. 10 kg/ha N, if P is applied simultaneously) may have a starter function for the crop, higher N applications cannot be justified. Future use of the 20-20-0 compound fertilizer cannot be recommended in view of local soil fertility constraints.
Figure 9.4 shows that grain yield responses at Angoromo in 1981 increased substantially with increased P applications of up to 35 kg/ha P205. However, those at Angoromo in 1982 increased only slightly with similar increases in fertilizer applications. Interactions between fertilizer rates, stand establishment and pest damage levels (shoot fly and midge) may have played a role.
When the grain yield increases for Angoromo (1981) and Bugengi (1982) are compared, it appears that when higher P applications become feasible, application of limited amounts of N fertilizer to planting furrows should be considered. Use of appropriate compound fertilizers (such as 18-46-0) should then be recommended.
Economic analysis of fertilizer responses Based on class averages for yield increase and fertilizer rate, an economic analysis of the 1982 results was made. Results of partial budget analyses for Angoromo and Bugengi are presented in Table 9.7.
231

Table 9.7. Partial budget analyses for fertilizer rate classes; 1982 Village Approach Programme.
Rate (ka/ha) Class
N P205
Angoromo: 5-15 5-15
15-25 15-25 25-35 25-35 Bugengi:
9-18 23-46
18-27 46-69 27-36 69-92
Mean N
10.2 20.8 30.4
15.6 21.1 30.8
P2Os
10.2
20.8 30.4
39.9
54.0 78.7
Increase
mean yie (kg/ha)
526 602 612
690 929 975
in Id
Increase in
gross field benefit
473 542
551
621 836
878
(Kshs) Variable costs (Kshs)
Fert
220 449 658
459 621 905
Labour
16 16 16
16 16
16
Total
236 465 674
475 637
921
Increase in net benefit (Kshs)
237 77
-123
146 199 -43
Rate of return
(%)
100 17
-18
31 31 -5
Note: The following assumptions and prices played a role in these partial budget analyses: use of net yields was not required as the entire programme was carried out on-farm. sorghum fetched 1.0 Kshs/kg of grain at the Alupe transit store in 1982. Field prices are estimated to be 10% lower.
- at the Siaya transit store in 1981, compound fertilizers 20-20-0 and 18-46-0 cost 196.95 and 240.35 Kshs per 50 kg bag, respectively. Field prices are estimated to be 10% higher. fertilizer application takes 2 days/ha. Opportunity costs are 8 Kshs/day.
Based on Table 9.7 marginal analyses were made. It was assumed that fields within each village belonged to the same recommendation domain. Marginal rates of return between fertilizer rate classes were calculated, starting with the lowest class and proceeding in a stepwise manner. Results are presented in Table 9.8.
Table 9.8. Marginal analyses for fertilizer rate classes; 1982 Village Approach Programme.
Class (ka/ha)
N P205
Angoromo: 5-15 5-15
15-25 15-25 25-35 25-35 Bugengi:
9-18 23-46 18-27 46-69 27-36 69-92
(n= 9) (n=17)
<n= 6)
(n= 5) (n=17) (n= 6)
Increase net benef (Kshs)
237 77
-123
146 199
-43
in
it Variable costs (Kshs)
236 465 674
475 637 921
Marginal net benefit
(Kshs)
237
# #
146 53
#
Marginal costs (Kshs)
236
# #
475 162
#
Marginal
rate of return (%)
100
# #
31 33
# #= level dominated by another with higher benefits at lower costs; n= number of observations.
Table 9.8 shows that most of the applied fertilizer levels had unacceptable rates of return for local farmers (< 100%). At Bugengi fertilizer application rates were clearly too high; at Angoromo the addition of N to the fertilizer already rendered applications uneconomic at low levels. Consequently, other fertilizer types as well as more precise application methods should be recommended.
9.5 CONCLUSIONS AND RECOMMENDATIONS
From a technical point of view, any local sorghum extension programme based on scattered demonstration sites is likely to fail. Contrary to maize, such a programme for sorghum is threatened by bird damage.
From a social point of view, the demonstration site approach is an inappropriate method to developing mutual respect and trust between farmers, extensionists and
232
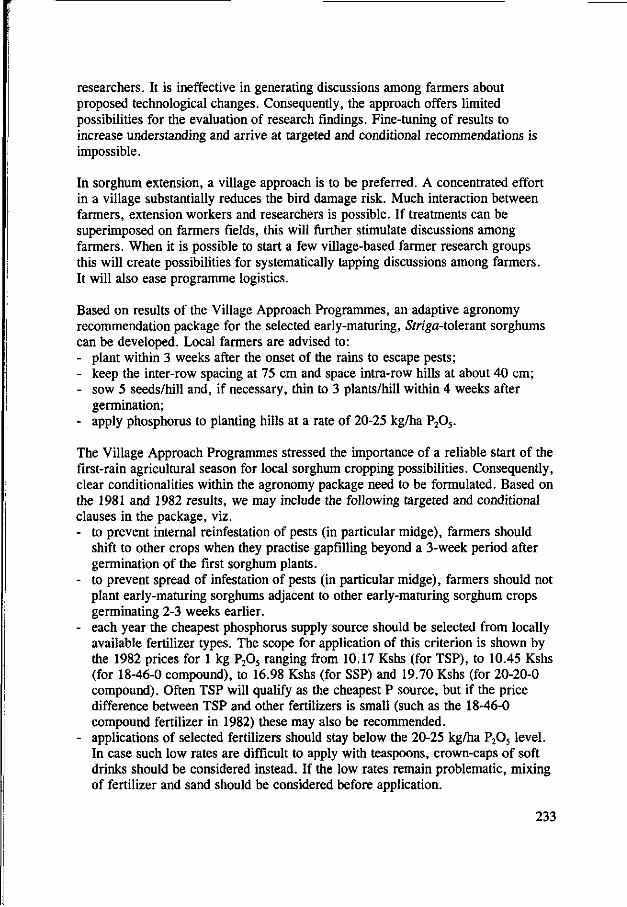
researchers. It is ineffective in generating discussions among farmers about proposed technological changes. Consequently, the approach offers limited possibilities for the evaluation of research findings. Fine-tuning of results to increase understanding and arrive at targeted and conditional recommendations is impossible.
In sorghum extension, a village approach is to be preferred. A concentrated effort in a village substantially reduces the bird damage risk. Much interaction between farmers, extension workers and researchers is possible. If treatments can be superimposed on farmers fields, this will further stimulate discussions among farmers. When it is possible to start a few village-based farmer research groups this will create possibilities for systematically tapping discussions among farmers. It will also ease programme logistics.
Based on results of the Village Approach Programmes, an adaptive agronomy recommendation package for the selected early-maturing, S?riga-tolerant sorghums can be developed. Local farmers are advised to: - plant within 3 weeks after the onset of the rains to escape pests; - keep the inter-row spacing at 75 cm and space intra-row hills at about 40 cm; - sow 5 seeds/hill and, if necessary, thin to 3 plants/hill within 4 weeks after
germination; - apply phosphorus to planting hills at a rate of 20-25 kg/ha P205.
The Village Approach Programmes stressed the importance of a reliable start of the first-rain agricultural season for local sorghum cropping possibilities. Consequently, clear conditionalities within the agronomy package need to be formulated. Based on the 1981 and 1982 results, we may include the following targeted and conditional clauses in the package, viz. - to prevent internal reinfestation of pests (in particular midge), farmers should
shift to other crops when they practise gapfilling beyond a 3-week period after germination of the first sorghum plants.
- to prevent spread of infestation of pests (in particular midge), farmers should not plant early-maturing sorghums adjacent to other early-maturing sorghum crops germinating 2-3 weeks earlier.
- each year the cheapest phosphorus supply source should be selected from locally available fertilizer types. The scope for application of this criterion is shown by the 1982 prices for 1 kg P205 ranging from 10.17 Kshs (for TSP), to 10.45 Kshs (for 18-46-0 compound), to 16.98 Kshs (for SSP) and 19.70 Kshs (for 20-20-0 compound). Often TSP will qualify as the cheapest P source, but if the price difference between TSP and other fertilizers is small (such as the 18-46-0 compound fertilizer in 1982) these may also be recommended.
- applications of selected fertilizers should stay below the 20-25 kg/ha P2Os level. In case such low rates are difficult to apply with teaspoons, crown-caps of soft drinks should be considered instead. If the low rates remain problematic, mixing of fertilizer and sand should be considered before application.
233

10. TOWARD ADAPTIVE RESEARCH PROGRAMMES AND FARMER RECOMMENDATIONS - A SYNTHESIS
10.1 INSTITUTIONAL CONSD3ERATIONS
10.1.1 Research capacity to plan adaptive programmes
Eastern and Southern Africa
Before 1980, little system-based adaptive research was conducted in the Eastern and Southern African Region. Partly due to CIMMYT's efforts, this type of research expanded rapidly in the 1980s. Many young national graduates were trained and many commodity and discipline-oriented scientists were retrained.
The CIMMYT approach (Annex 1) is rather unique in that it grew from the Centre's narrow commodity focus and active involvement in many national maize and wheat programmes. It often focuses on a particular target area, usually part of a mandate area of a national or local crop improvement programme. Consequently, the approach is particularly useful in sharply defined crop commodity programmes that focus on developing adaptive technologies. The approach is practical, field-oriented, and well documented. Its training programme and manuals have been useful to many researchers in Africa.
Initial efforts were aimed at introducing a systems perspective into existing commodity research programmes. Difficulties in incorporating this approach into the 'strongly compartmentalized research establishment' in Kenya (by posting young economists to research stations) were described by Collinson (1982), CIMMYT (1985b) and Anandajayasekeram et al. (1991).
The lessons from Kenya were used in the reorganization and strengthening of agricultural research institutes in other countries. In most cases Farming Systems Research teams (e.g. Tanzania; Enserink et al., 1994a) or Adaptive Research Planning teams (e.g. Zambia; Vierstra and Ndiyoi, 1994) were established at representative research stations in addition to the already existing commodity research teams. It was hoped that this would reduce tension caused by posting young socio-economists in already established commodity teams dominated by senior technical scientists.
Unfortunately, problems were also created by the establishment of administratively independent Farming Systems Research (FSR) teams (Mutsaers, 1994). Donor funding often favoured FSR team activities. Competition and friction instead of collaboration between FSR and commodity teams were frequently observed. Planning a joint research agenda continued to cause difficulties. FSR was labelled as a new discipline instead of an approach improving the efficiency of research in designing technologies appropriate to the need of small farmers. As frequently no close links were maintained between FSR and commodity teams, research activities were less effective and their quality sub-optimal.
235

When the Training and Visit (T&V) programme was introduced in countries of the Eastern and Southern African Region in the 1980s, new groups (e.g. Extension Divisions) became interested in on-farm experimentation for the development of locally relevant messages. The T&V system began to make demands on researchers to train subject matter specialists and assist in designing and interpreting on-farm trials. It gradually became evident that few adaptive recommendations had been put forward. Existing recommendations were too general ('blanket') or out-dated. Although many FSR teams had undertaken diagnostic work, results were having little impact on the priority setting of various commodity research programmes. Communication at station level was not very effective, and national priorities of commodity research programmes often overruled those established locally. Although many of these programmes had been inadequately funded for many years, a lack of clear policy guidance on the role and place of on-farm research within the research process and research structure is also important in explaining the low level of efficiency in research efforts.
Increasingly it was argued that FSR teams were not very efficient and cost effective. Consequently, FSR activities started attracting less donor funding. The wisdom of having two independent teams at the same station became questionable. At present a trend is foreseen in which FSR is again incorporated as an approach to adaptive research programmes. Some people may say that this is 'back to the drawing-board'. However, many feel that one has come full circle. They argue that the in-between period was necessary for young scientists to gain experience in planning and priority setting of experimental programmes that use a farming systems perspective.
Kenya
As explained before no separate FSR teams were established at research station level. Although young economists posted at various research stations tried to carry out diagnostic work on local farming systems circumstances, they largely depended on the willingness and facilities of collaborating commodity researchers. No clear and generally accepted policy existed on the nature of their activities. Therefore, it was difficult to plan and set priorities properly; interdisciplinary team efforts were difficult to get off the ground. Many commodity researchers adhered to their own programmes without becoming fully involved in diagnostic work and report writing. Consequently, the quality and impact of diagnostic activities remained low. Many economists left their stations prematurely.
From 1981 the policy environment had become less favourable for developing new adaptive research oriented initiatives in Kenya. The place of on-farm research and relationships with the extension service remained submerged under the larger issue of the restructuring of agricultural research, particularly the role of the Kenya Agricultural Research Institute (KARI), and the search for donor support to solve the substantial funding problems. During the 1980s little progress was therefore made in expanding the adaptive research capacity.
236
After KARI had become firmly established, it undertook a comprehensive review of all research conducted at its centres. New priorities were set to direct KARI's efforts during the 1990s (KARI, 1991b). Besides research on Soil and Water Management, Crops and Livestock, KARI intended to strengthen its research capacity in Socio-Economics. Research on Socio-Economics would include: (1) the establishment of reliable baseline data for planning, programme formulation and technology transfer; (2) an assessment of technology transfer, and (3) incorporation of socio-economic farmer considerations into adaptive research. As KARI's socio-economics capacity is still being developed, it is too early to evaluate its performance. However, every effort should be made to ensure multi and interdisciplinary working methods. Pitfalls of the past are too well-known.
In the early 1990s a remarkable effort was made to revive the farming systems perspective within research and extension programmes. Extension Divisions of the Ministries of Agriculture and Livestock Development, assisted by SIDA and FAO, attempted to collaborate with KARI to establish some pilot District Farming Systems Teams (DFSTs). Through diagnostic surveys and resulting on-farm experimentation, efforts were made to develop locally relevant extension messages. These DFSTs drew their participating members from both extension and research.
West Kenya
Researchers in West Kenya were grateful for CIMMYT's stimulating role in incorporating a farming systems perspective into their commodity oriented programmes (e.g. sorghum, finger millet, maize). For instance, CIMMYT's report on planning an adaptive agricultural research programme for the Siaya District (CIMMYT, 1977a) helped us to formulate our sorghum research hypothesis. Similarly, the two studies in Vihiga (Lihanda, 1978) and Busia (Rop, 1981) Districts supported by CIMMYT, helped us in the process of target zone formulation.
Unfortunately, in 1982 the economist posted at Kakamega left the station (WARS) prematurely. Simultaneously, CIMMYT directed more efforts towards maintaining the existing formal workshop and training commitments in the Eastern and Southern African Region. As CIMMYT also tried to raise the quality of the survey and experimental work undertaken by some national FSR-oriented programmes, less time and fewer funds were available to become directly involved in activities in West Kenya. As also the policy environment was not conducive to the Farming Systems Approach, it was difficult to develop new adaptive research initiatives.
In the early 1990s the Regional Research Centre (RRC) Kakamega (formerly called the Western Agricultural Research Station) was selected as one of the pilot collaborating stations for District Farming Systems Teams (DFSTs). The West Kenya DFSTs carried out some valuable diagnostic work (Kibisu et al., 1992; Mulamula, 1992) but lack of funds crippled further efforts in 1993.
237

issues required a longer period to crystallize. Common goals and objectives between research and extension needed to be identified and an organizational mechanism for joint planning had to be developed, in which research, extension and farmers fully participated. To institutionalize adaptive Regional Research Programmes at RRC level, the development of comprehensive annual work programmes (including budgets) and approval mechanisms was essential. In the early 1990s funding of interdisciplinary activities continued to pose problems. Although funds could be allocated through an Adaptive Research Fund, selection was based on the quality of individual research proposals. This approach led to ad-hoc competitive bidding, rather than to comprehensive adaptive Regional Research Programmes.
However, since 1993, progress has been made with institutionalizing adaptive Regional Research Programmes. A memo of understanding was signed between KARI (belonging to the Ministry of Research, Science and Technology) and the Extension Service (belonging to the Ministry of Agriculture, Livestock Development and Marketing) on research-extension linkages and their funding. In the meantime Regional Research Extension Advisory Committees (RREACs) have become operational. The office of KARI's Assistant Director responsible for RRC programme development, has been strengthened and is capable of providing formal training courses in FSA-RET. Recently KARI succeeded in interesting some donors (Government of the Netherlands, Overseas Development Administration and the World Bank) to assist in further developing adaptive Regional Research Programmes. In 1994 the Government of the Netherlands agreed to strengthen programme development of the three Regional Research Centres at Kakamega, Katumani and Mtwapa (KARI/KIT, 1994). Support is focused on strengthening the RRC programme development capacity, the annual workplan formulation process (planning and priority setting) and the development of human resources (leadership role; critical mass).
Based on past experiences, KARI addresses regional research activities through a set of interdisciplinary activities. All sections (e.g. maize, sorghum, soil, socio-economy) are responsible for contributing to the development and implementation of these regional programmes. Their success will depend on how effectively scientists of various disciplines will work together. Coordination (leadership role) and commitment are crucial. A management tool to ensure effective planning and regional programme implementation is the development of annual workplans specifying each activity and elaborating on their relationships. Therefore, many donors currently base their funding of activities on annual workplans and budgets. Approval of these workplans by the Regional Research Extension Advisory Committee is a precondition.
Although RRCs may have sufficient staff to participate in the diagnostic surveys of the District Farming Systems Teams, a practical compromise must be elaborated between extension (organized according to administrative district units) and RRC
244

research (organized according to agro-ecological zones often cutting across several districts). For the implementation of on-farm interventions it should be taken into account that research is the smaller organization. To maintain proper linkages and rationalize staff time and financial resources, due considerations must be given to the agro-ecological concept during the implementation of on-farm interventions. When the major agro-ecological zones are taken as the basic unit of planning and analysis, differences in socio-economic and cultural environment may easily be superimposed to delineate major farm production systems. Once these are identified, interventions can be better targeted to address specific farmers constraints. Clustering of interventions in a few representative villages per farm production system is recommended to improve efficiency (Mutsaers, 1986).
10.2 TOWARD TARGETED AND CONDITIONAL SORGHUM RECOMMENDATIONS
The adaptive research process must be dynamic and iterative. Linkages between farmers, researchers and extension workers are essential. Although initial research priorities may be set on the basis of survey results, on-farm work (e.g. experiments, in-depth surveys) will continuously add to the 'body of knowledge'. Understanding of how farmers are managing their systems will increase annually. As farming systems also evolve over time, and some may even be in constant flux (Maxwell, 1986), continuous updating is required. Consequently, it should be recognized that adaptive research priority setting and targeting must be critically reviewed and regularly adjusted.
On the basis of increased knowledge of sorghum production systems in the Busia-Siaya area we will now critically verify our initial research hypothesis. Based on the available 'body of knowledge' in 1978 (CIMMYT, 1977a) we hypothesized (Chapter 5.1) that introduction of early-maturing sorghums would considerably increase farmers management flexibility in the Busia-Siaya area. This would be even further enhanced if the new sorghums showed a good ratooning potential.
Our research results revealed that this hypothesis was based on an oversimplification of reality. The initial 'body of knowledge' of effects of sorghum pests and Striga was clearly insufficient. Methods of rainfall analysis and models for crop moisture availability commonly used in Kenya (e.g. CIMMYT's (1977a) diagnostic survey in Siaya) were highly inadequate to quantify variability. In West Kenya quantification of variability in rainfall and moisture availability was essential to understanding farmers ways of organizing their cropping systems.
Through our programme results, the 'body of knowledge' of sorghum production in West Kenya has increased substantially. Based on this new information we will now review if and when early-maturing sorghums are actually increasing farmers management flexibility. In addition to formulating targeted and conditional recommendations on the use of varieties (Chapter 10.2.1), the review will also include some recommendations for optional agronomy practices (Chapter 10.2.2). Some topics requiring further research are also described.
245

10.2.1 Choice of variety, type of agricultural season and sorghum pests
Initially it was anticipated that early-maturing sorghums would increase farmers flexibility in time of planting. With delayed planting these varieties would stand a better chance of maturing before the end of the rainy season. However, it has now become clear that the observed drop in sorghum yields with delay in planting is not only determined by the length of the remaining growing season. Two additional factors are also important viz. shoot fly and midge damage. As all three factors are strongly related to developments within the agricultural season, we identified three types of agricultural seasons during the January-July period (first rains) and one during the August-December period (second rains; Chapter 3.1.3).
First rains - Type 1 agricultural season In this season grass rains bring enough rain and last long enough to permit successful early January-February sowings. Long growing periods are available for crop production and many households plant their sorghum early. Distances between sorghum fields are small. Spread of shoot fly and midge infestations from surrounding fields will occur. Early rains and sorghum plantings cause shoot fly and midge populations to build up rapidly rendering successful March plantings almost impossible. An interaction effect of pests on grain yields is frequently observed. High shoot fly damage to late planted crops creates favourable conditions for internal reinfestations of midge resulting in exceptionally high damage levels. This may be the reason for farmers to plant sorghum first and maize later.
In this season availability of early-maturing sorghum cultivars will not substantially increase farmers flexibility. A long growing period is available in which late-maturing local sorghums may also do well. When sorghum plantings are delayed, early-maturing cultivars are the obvious choice. Research results reveal (Chapter 7.2.1) that these crops should be planted within 3-6 weeks after the first sorghum fields are planted otherwise shoot fly will destroy the later planted crops. However, flowering of early and late planted crops should be synchronized (less than 2-3 weeks difference) otherwise midge will destroy the later flowering crop (Chapter 7.2.2). In case a field shows much variation in flowering (e.g. due to Striga incidence, waterlogging, anthills, soil fertility) synchronization of flowering with adjacent fields is even more important to prevent internal midge reinfestations. Further delay in sorghum plantings is not recommended; maize plantings are to be preferred. The remaining season is long enough for a 120-day maize variety.
If farmers are in need of an early food crop they may be tempted to plant early-maturing cultivars at the onset of the grass rains. This will create no problems with shoot fly, but may cause serious problems with midge. Flowering periods of early-maturing cultivars and late-maturing local sorghums are not synchronized. Favourable conditions are created for midge multiplication. However, if distances between fields are large (> 100 m) spread of midge infestations will be minimized. Theoretically this seems to be a fair
246

recommendation, but we doubt whether this will hold in practice. The concept should be further tested in collaboration with farmers research groups.
First rains - Type 2 agricultural season During this season grass rains start promising but do not last long enough. Although farmers will try to plant their sorghum fields early, failures in crop establishment will occur. Resowing and gapfilling are often required. Depending on the establishment date this results either in long or in short growing periods. Conditions are favourable for a rapid pest build-up. As distances between sorghum fields are limited, spread of shoot fly and midge infestations occurs frequently. Gapfilling creates favourable conditions for internal reinfestations. Farmers regard these seasons as most difficult to manage. This is confirmed by the 1982 Village Approach Programme results (Chapter 9.4).
In this season availability of early-maturing cultivars will, to a certain extent, increase farmers flexibility. In addition to options described for the Type 1 season, these cultivars also increase the chance of gapfilled crops producing satisfactorily. In case late-maturing local sorghum crops are poorly established, early cultivars may be used for gapfilling within 3-6 weeks. Flowering is then more synchronized, hence creating less favourable conditions for internal midge reinfestations. If, however, gapfilling can only be practised after 6 weeks it is recommended to plant other crop species (e.g. maize). Shoot fly damage to later sown cultivars will be too high, resulting in favourable conditions for internal midge reinfestations. The remaining season is long enough for 120- or 100-day maize varieties.
First rains - Type 3 agricultural season During this season grass rains are absent or very weak. No early crops can be sown and resulting growing periods are short. As pest population build-up is also restricted, sorghum crops planted in March will not be damaged. However, as the rains frequently stop at the end of May, the growing season is too short for late-maturing local varieties. Farmers complain that end of season droughts severely affect these crops.
In this season availability of early-maturing sorghum cultivars will substantially increase farmers flexibility. Households food security is at stake. Farmers cannot spread crop plantings over a long period; the growing period is too short. Due to a limited spread of plantings, midge and shoot fly are incapable of building up and damaging crops. However, end of season droughts may occur, seriously affecting grain filling. Maize is more sensitive to drought than sorghum. In this season food quantity (sorghum) takes priority over food preferences (maize) and early-maturing cultivars are preferred to late-maturing local types. This is fully confirmed by the 1981 Village Approach Programme results (Chapter 9.3).
Second-rain agricultural season Rainfall analysis (Chapter 3.1.3) reveals that this season usually starts in August. Its quality is extremely variable. The length of the growing period for cereal crops is 120 days or less. Due to its drought
247

resistance sorghum is a better option. As the second rains are not much used for cropping (Table 4.2) and the climate permits cropping of early-maturing sorghums (Table 3.8), great opportunities seem to exist for introducing these new cultivars. Sorghum crops in the second rains can either be ratoon or newly planted crops. Ratoon crops of 120-day cultivars mature in 100 days. Ratoon crops are preferred over planted crops as their establishment needs less labour.
If early-maturing sorghum cultivars can be successfully ratooned in the second rains, their availability will substantially increase farmers flexibility. However, research results (Chapter 8.4) reveal that the ratoon policy is not as promising as originally anticipated. Frequently ratoon crops of selected early-maturing cultivars are not successful. Establishment is a problem due to low survival rates. Only in the case of high survival rates may ratooning be recommended. As ratoon crops grow fast once the rains have started, shoot fly damage levels are low. Selective thinning of ratoon tillers and early stem borer treatments will sufficiently control shoot fly (Chapter 6.3.2).
Due to the ratooning policy's limited scope, attention was focused on newly planted crops in the second rains. However, research results of seasonal fluctuations in shoot fly damage (Chapter 7.2.1) reveal that such crops will always face high shoot fly damage levels (60% or above). Ratoon crops on which shoot fly is multiplying are always established earlier than newly planted crops. As seedlings are not growing as fast as young ratoon tillers either, they may be damaged while still young. Unfortunately, these damaged seedlings are not strong enough to produce side tillers and selective thinning and early stem borer treatments are unpractical to control shoot fly as plants and whorls are still too small.
Other control methods (Chapter 3.3.2) are either too expensive (carbofuran granules in planting furrows) or far less effective (foliar insecticide sprays). As successful cropping of early-maturing sorghums in the second rains seems to be the key to a major shift in the local cereal cropping system resulting in more management flexibility (Chapters 5.2.1 and 5.2.2), the importance of finding a solution to the shoot fly threat must be recognized. Consequently, further research into the control of shoot fly by seed treatments and cultural methods is required.
10.2.2 Farmers constraints and flexibility of agronomy recommendations
Most of the working capital for farming in the target area is spent on hiring labour and ox-plough units for land preparation and weeding. The remainder is spent on purchasing fertilizers and maize hybrid seed. Due to an urgent need for alternative means of fertility maintenance it is expected that more fertilizer will be used in future. Flexible and integrated solutions optimizing the effects of improved management and purchased inputs are required to address and alleviate farmers problems. For instance, crop commodity researchers must learn to recognize that the problem of low yields of maize, sorghum or cotton crops is not solved by developing recommendations on fertilizer use for each individual crop. As farmers
248

try to optimize their cropping and fanning systems rather than yields of individual crops, their problem is of an entirely different hierarchical level e.g. maintenance of soil fertility levels. With decreasing fallow periods and limited availability of manure and working capital creative and integrated solutions must be sought. When crop commodity researchers (e.g. agronomists) take their job seriously, it is inevitable that their focus will shift from individual crops to a higher level of integration (either cropping or farming system). Interdisciplinary working relationships should lead to developing integrated solutions. Research mandates have to evolve accordingly. In strongly compartmentalized research establishments this often causes serious problems. Creation of interdisciplinary Regional Research Programmes may solve some of these problems, leading to creative collaboration and sufficient critical mass.
The search for integrated solutions inevitably leads to compromises. Researchers must work within the boundaries of what farmers regard as valuable options. Based on this principle we tried to develop some adaptive sorghum husbandry practices. The principle's value is best illustrated by the following example.
In our search for the best method of planting we experienced farmers reluctance to practise continuous row-sowing. They suggested the 'row-hill planting' method as this would better fit within their current management practices. Once we adjusted the temporary recommendation accordingly, collaboration became more intensive. Together we were capable of further developing an integrated husbandry package for 'row-hill planted' sorghum crops. In its development the following considerations (based on an analysis of local constraints) played a major role. The recommended 'row-hill planting method (3 plants/hill)' does not only facilitate rapid weeding but also permits placement of phosphate fertilizer. Better weeding practices will not only increase crop yields but may also reduce build-up of Striga infestations. Compared to broadcasting, placement of P fertilizer not only substantially increased its effectiveness and reliability, it also permitted an additional management option to handhoe farmers. Substantial residual effects of P fertilizer are observed when farmers practise 'strip hoeing' as a land preparation method for a subsequent crop planted in the second rains.
Although we believe that a valuable adaptive agronomy package for early-maturing sorghums had been developed (for details see Chapter 9,5), its relative importance should be stressed. This can best be illustrated by two examples.
In the near future the Maize Programme may succeed in developing some new early-maturing maize hybrids for West Kenya with sufficient Striga resistance. Subsequently, it is expected that sorghum production in the first-rain cropping season will further decline in West Kenya. If this happens when pricing policies and marketing conditions still favour maize over sorghum, a situation will be created in which few farmers will apply phosphate fertilizers to sorghum crops. Obviously, fertilizer applications to maize crops will then be preferred.
If the cotton pricing and marketing system is not improved, we foresee a further decline in cotton production during the second-rain cropping season. Increasing
249

population pressure will induce more farmers to intensify their food production systems. Increasingly they will be tempted to grow cereal crops during the second rains. Due to its drought resistance sorghum is then an obvious choice; the climate permits cropping of early-maturing sorghums (Table 3.8). A major shift in cereal production systems may occur when we succeed in developing adaptive recommendations to successfully control pest damage to sorghum crops planted in the second rains. Once this is possible new cropping systems may develop and new research topics will emerge. For instance the effects of fertilizer application on early-maturing maize crops in the first rains should be studied in combination with its residual effects on early-maturing sorghum crops planted in the second rains. Our research efforts indicate that the efficiency of phosphate fertilizer applications will increase substantially if the introduction of the system of double cropping is accompanied by a specific land preparation method for the second-rain crop.
As such developments must be taken into account the need for a flexible research approach must be stressed. We are not dealing with a static situation but we should continuously try to develop adaptive recommendations for 'a moving target'. Some issues may change rather slowly over time (e.g. soil deficiency in phosphorus), others may change overnight (e.g. the purchase price for fertilizer and insecticides). Although quality commodity research is essential, it should be recognized that its perspective is equally important. As the farmer is the client, we believe that applied and adaptive research programmes always require a strong farming systems perspective to be cost effective and efficient.
To develop relevant adaptive research programmes sufficient critical mass is required. As each commodity programme at RRC level comprises few researchers, sufficient critical mass at this level can only be provided by developing adaptive Regional Research Programmes in an integrated and interdisciplinary manner.
250
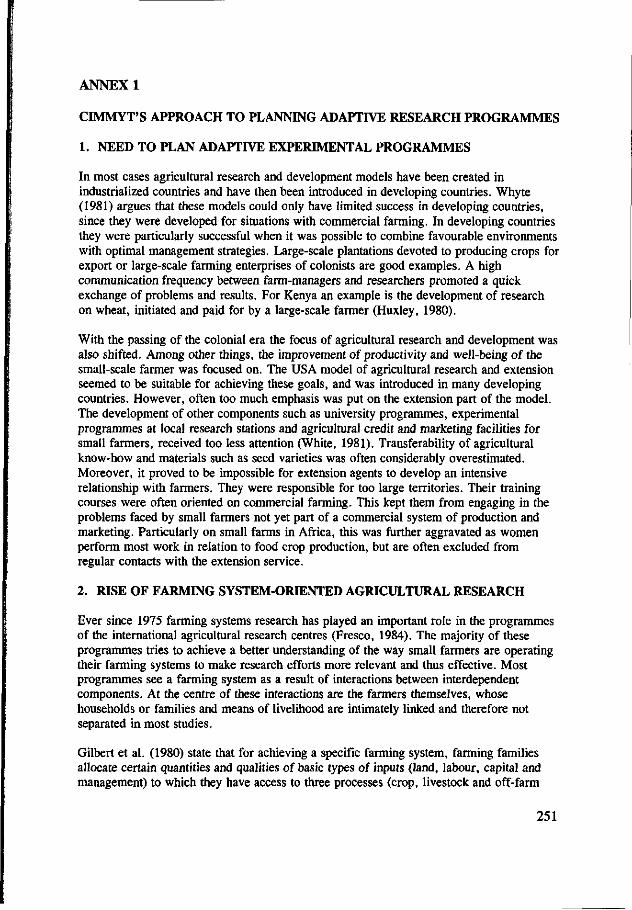
ANNEX 1
CIMMYT'S APPROACH TO PLANNING ADAPTIVE RESEARCH PROGRAMMES
1. NEED TO PLAN ADAPTIVE EXPERIMENTAL PROGRAMMES
In most cases agricultural research and development models have been created in industrialized countries and have then been introduced in developing countries. Whyte (1981) argues that these models could only have limited success in developing countries, since they were developed for situations with commercial farming. In developing countries they were particularly successful when it was possible to combine favourable environments with optimal management strategies. Large-scale plantations devoted to producing crops for export or large-scale farming enterprises of colonists are good examples. A high communication frequency between farm-managers and researchers promoted a quick exchange of problems and results. For Kenya an example is the development of research on wheat, initiated and paid for by a large-scale farmer (Huxley, 1980).
With the passing of the colonial era the focus of agricultural research and development was also shifted. Among other things, the improvement of productivity and well-being of the small-scale farmer was focused on. The USA model of agricultural research and extension seemed to be suitable for achieving these goals, and was introduced in many developing countries. However, often too much emphasis was put on the extension part of the model. The development of other components such as university programmes, experimental programmes at local research stations and agricultural credit and marketing facilities for small farmers, received too less attention (White, 1981). Transferability of agricultural know-how and materials such as seed varieties was often considerably overestimated. Moreover, it proved to be impossible for extension agents to develop an intensive relationship with farmers. They were responsible for too large territories. Their training courses were often oriented on commercial farming. This kept them from engaging in the problems faced by small fanners not yet part of a commercial system of production and marketing. Particularly on small farms in Africa, this was further aggravated as women perform most work in relation to food crop production, but are often excluded from regular contacts with the extension service.
2. RISE OF FARMING SYSTEM-ORffiNTED AGRICULTURAL RESEARCH
Ever since 1975 farming systems research has played an important role in the programmes of the international agricultural research centres (Fresco, 1984). The majority of these programmes tries to achieve a better understanding of the way small farmers are operating their farming systems to make research efforts more relevant and thus effective. Most programmes see a farming system as a result of interactions between interdependent components. At the centre of these interactions are the farmers themselves, whose households or families and means of livelihood are intimately linked and therefore not separated in most studies.
Gilbert et al. (1980) state that for achieving a specific farming system, farming families allocate certain quantities and qualities of basic types of inputs (land, labour, capital and management) to which they have access to three processes (crop, livestock and off-farm
251

enterprises) in a manner which, given the knowledge they possess, will maximize attainment of their goals. The same authors divide the 'total' environment in which the farming household is operating into a technical and a human element.
The technical element reflects what the potential farming system can be and provides an insight how physical and biological conditions are to be manipulated to reach this potential. Physical conditions are e.g. water, soil, solar radiation, temperature. Biological conditions are e.g. crop physiology, diseases, insect attack. Scientists have been able to modify the technical element to a certain extent (irrigation, fertilizer, breeding varieties with disease resistance). However, whether such recommended changes in conditions can be followed up by small farmers mainly depends on the other element of the 'total' environment.
The human element is divided into an exogenous and an endogenous component. The exogenous component (social, economic and political environment in which the household operates) is largely out of control of the individual household, but will influence what its members are able to do. Norman et al. (1981) divide this component into: - community structures, norms and beliefs (e.g. division of tasks according to gender); - external institutions or support systems (e.g. extension, credit, input distribution,
marketing, transport); - miscellaneous influences (e.g. location, population density).
The endogenous component is more under control of individual farmers. They can use the resources (land, labour, capital and management) to develop a system consistent with their goals within the boundaries laid down by the technical element and the exogenous component. Availability of and access to inputs vary among households and regions and influence the farming system's performance and potential. However, it is important to recognize that farmer's goals and motivations are the motor driving the entire system. This gives the system its dynamic dimension. In situations where farmers have options, the nature of the farming system may be affected by individual goals and motivations.
The human element, particularly important in the subsistence agricultural sector, has often been neglected in traditional agricultural research approaches to development of improved technologies. As a result recommended technologies are rejected or, at best, adopted with modifications which may result in an inequitable distribution of benefits. To improve the relevancy of technologies some institutions recently adopted a systems approach to planning the contents of their research programmes.
3. CONCEPTS AND TESTING OF CIMMYT'S APPROACH IN EAST AFRICA
CIMMYT developed a low cost approach to understanding small farmers in an effort to improve the relevancy of the technologies emerging from experimental work (Byerlee and Collinson, 1980). The approach seeks to understand the farming system and the way in which the resource requirements of the system as a whole necessarily compromise both present management and potential management improvements for a target crop (Collinson, 1981). The focus on a pre-specified target crop reduces the investigations and is consistent with the commodity orientation of many National (in the Project's case: sorghum) and International Agricultural Research Organizations (in CIMMYT's case: maize and wheat).
CIMMYT's analysis is diagnostic in nature, focusing on groups of farmers operating a similar system. The design reflects the argument that a thorough understanding of what small farmers do and why they do what they do (called a farming systems perspective) is
252

the most relevant basis for formulating adaptive agricultural research programmes. The methodology does not cover hundreds of households as is the case in an evaluation or bench mark survey. It rather focuses on an in-depth exploration of a limited number of households. The analysis is not aimed at producing statistical data on age, sex, land use, livestock, and ownership. It rather contains an explanatory analysis attempting to clarify what determines household's behaviour in relation to the selected target crop.
Such a systems perspective to identify researchable problems and opportunities among small farm populations can be brought to bear without a detailed manipulation of numbers in a modelling format. Understanding is, in fact, a prerequisite for building useful models, which, at best, can improve that understanding (Collinson, 1981). Applying a systems perspective by a low cost, almost anthropological, approach allows an initial understanding. The direct and opportunity costs of efforts to improve on the initial understanding are high. The benefits from better understanding one target population have to be set against those from an initial understanding of perhaps four other target populations. At this stage of farming systems research in East Africa the benefits from wide coverage of small farmer populations dramatically outweigh those from a more intensive, numerate approach with much narrower coverage (Collinson, 1981).
The concepts were crystallized in 1975, and a methodology was outlined to allow the approach's implementation. The methodology was refined in the course of demonstrations of the approach to interested National Agricultural Research Programmes by CIMMYT's Eastern Africa Economics Programme. Demonstrations occurred in: - Kenya; Siaya District, Nyanza Province (CIMMYT, 1977a); - Tanzania; Morogoro and Kilosa Districts (CIMMYT, 1977b); - Zambia; Serenje District, Central Province (CIMMYT, 1978); - Zambia; Central Province (CIMMYT, 1979); - Zimbabwe; Chibi District (CIMMYT, 1982).
4. CIMMYT'S METHODOLOGY IN EAST AFRICA
4.1 Grouping of farmers in preliminary recommendation domains
When a large study area must be covered, a preliminary framework for the ordering of priorities and focusing of research efforts is a necessity. Inevitably, a compromise has to be reached between research for an individual farmer (too expensive) and for the heterogeneous circumstances of the target area as a whole (too generalized). To create such a framework farmers are grouped into relatively homogeneous populations on the basis of their present farming system. CIMMYT calls these target population groups 'preliminary or tentative recommendation domains' (Harrington, 1982b). The farming system as a criterion for this grouping has the following justifications (Collinson, 1981 and 1982): - the existing system is a manifestation of a weighted interaction between cultural, natural
and economic factors and the farmer's own priorities and resource capabilities. It reflects, better than any single criterion, the balance of factors important to identifying homogeneous groups;
- farmers operating a similar farming system have, generally speaking, the same priorities and resource endowments and thus similar problems and development opportunities;
- the existing farming system is the starting point for development; the foundation on which productivity improvements have to be constructed.
253

area. Interaction between the economist and agronomist identifies new management practices which would better exploit biological potential and help farmers meet their priorities from within their resource endowments.
In addition to field notes towards the end of the field period the team prepares a 'scenario' of the local fanning system. It emphasizes trends in the system and reasons for the choice of products and management practices (Collinson, 1981). The scenario constitutes a basis for hypothesis formulation on causatives in the system. This interpretative stage is the centre of the methodology. Formulation of hypotheses on reasons for farmers practices and promising changes in management strategies and production techniques is most important. They will be tested in the following stages of diagnostic and experimental research. Results will form the basis onto which future interventions must be grafted.
Verification Survey
The exploratory survey is followed by a verification (or formal) survey. It verifies if the picture obtained from discussions with a group of farmers is indeed valid for the target population as a whole. Hence, survey questions cover the variables by which the domain has been specified and demarcated. On the basis of tabulated results showing the sample distribution across the variables, it is decided whether a domain redefinition is required.
The formal survey further verifies the system's descriptive features, the farmers preferences and priorities and their problems such as resource constraints and hazards. It may also be used to obtain a better understanding of particular aspects of the system and may measure those parameters crucial to the planning or interpretation of experiments. In addition the survey has three other objectives (Collinson, 1981): - testing of hypotheses on the importance of observed priorities, resource constraints and
hazards in dictating management strategies and production techniques; - examining farmers who succeeded in alleviating resource constraints or offsetting
hazards by modification of strategies or techniques; - testing of farmers attitudes to changes in management strategies and production
techniques, which are hypothesized as promising on the basis of the exploratory survey.
A single visit survey covering some 60 target group farmers is conducted for verification and hypothesis testing. The survey's questionnaire is developed from the output of the exploratory survey and is therefore entirely location-specific; its content is highly selective. Using trained enumerators, the questionnaire will take about two hours to complete on each farm. Important parameters may be estimated or measured if the feasible collection technique is consistent with a single visit and a relative short period on the farm. Each enumerator will cover 2 farms a day and the field survey is usually completed in 10 days.
4.3 Designing relevant experimental programmes
In the design stage a range of strategies and technologies is identified and pre-screened, thought to be relevant in dealing with farmers constraints, which were delineated during the diagnostic stage. As experimentation is the most costly part of the methodology, it is necessary to think as carefully as possible about the most important problems that merit experimentation. During the planning stage researchers become committed to a set of on-farm and on-station experiments that will absorb a major part of their time and budget.
256

Although it may be argued that this is the most critical stage in the methodology, it took CIMMYT many years before the first official publication was issued on the procedural steps to be followed in the planning process (Tripp and Woolley, 1989). The following steps are suggested: - identify problems limiting the farming system's productivity; - rank the problems; - identify the causes of the problems; - analyze interrelations among problems and causes; - identify possible solutions to the problems; - evaluate possible solutions on e.g. farming system's compatibility, research cost,
profitability, risk, need for institutional support; - list the experimental treatments and make suggestions for longer term research and
additional data collection.
Results of the planning procedure are summarized in four lists (Tripp and Woolley, 1989). The first presents all factors considered for on-farm experimentation (including exploratory factors yielding additional information on problems and causes) as well as possible solutions to well-defined problems. The second list suggests additional diagnostic activities on problems and causes. The third includes proposals for longer term research on potential solutions, and the fourth contains proposals to ensure that institutional support is available for suggested solutions.
No fixed rules govern the number of problems to be selected for possible on-farm experimentation. Some will be eliminated in later steps if no immediate solutions are evident or are eliminated by limited availability of resources. Usually, if more than ten problems remain after the selection of priority problems, additional screening is required.
During designing, attention should not only be paid to the selection of the experimental variables with treatment levels compatible with farmers circumstances, but also to the management of the non-experimental variables and selection of representative sites. In traditional on-station experiments, non-experimental variables are often fixed at levels which will not inhibit the effects of the experimental variables (e.g. complete insect control, complete control of weeds in a variety selection experiment). Clearly, these levels may be irrelevant to the situation of target group farmers.
On-farm experimentation must reveal if productivity increases due to changes in experimental variables can be maintained under farmers management regimes (Collinson, 1983). Thus, non-experimental variables and the control treatment in such experiments should be as close as possible to farmers existing management levels, they are the only relevant baselines from which to measure improvements in performance. The results of the verification survey will help to identify representative levels of non-experimental variables and representative on-farm locations.
4.4 Testing promising strategies and technologies
Production specialists within commodity-oriented research programmes may use two types of environments for testing: - on-station research. Experimental stations are used for research requiring controlled
conditions (e.g. in basic research) and/or constant attention (e.g. in crop improvement);
257

- on-farm research. This is conducted either to better characterize farmers production problems or to expose promising management strategies and production technologies to farmers conditions.
On-farm experiments
Although on-farm experiments are classified into three categories, interactions and the need for efficient trial designs may cause an experiment to contain variables belonging to different categories. The following categories are distinguished (CIMMYT, 1985a): - exploratory experiments. This type of trial seeks to better define and characterize
production problems at farm level. In agronomy programmes such trials are often used to identify a minimum number of critical agronomic factors having major effects on yields and being associated with attractive marginal rates of return. Their order of priority and interactions are considered. Multiple factor experiments are conducted, in which each of the various factors is compared at two levels (2"-trials or 'Yes-No'-trials). The levels normally used are: the current farmer-practice level and a higher input level that appears to be possible for target group farmers.
- determinative experiments. This type of trial tests possible solutions to a production problem that is well understood. In agronomy programmes such trials are often used to quantify crop response to each important management factor ('Levels'- or 'How-Much'-trials). Factors expected to show significant interactions are often included. Results will help to determine levels at which income-seeking, risk-averting farmers might want to use inputs or practices detected as promising in the exploratory trials. As evidence suggests that farmers adopt technologies in small pieces, attention is focused on a small number of factors with the highest pay-offs.
- verification experiments. This type of trial is conducted when strategies or technologies have been identified, which have shown considerable potential in the earlier stages of on-farm testing. The value of such alternatives must be verified in large-sized plots at more locations to quickly obtain more farmers reactions.
Exploratory and determinative experiments involve many treatments (usually 6-20) and replications (usually 2-6); individual plots are therefore small (15-25 m2) (Palmer et al., 1982). Exploratory and determinative experiments are repeated at few sites in each recommendation domain. The exact number of sites should depend on the variability within the domain, but often available research resources cripple such an approach.
Verification experiments are using large-sized plots (100-500 m2) at more locations. They usually contain 2-6 treatments and are unreplicated at each individual site.
Economic analysis of results
Results of on-farm experiments should be carefully assessed. Data from the sites within a recommendation domain may be pooled for analysis for each type of experiment. Three analyses are usually needed (Harrington, 1982b): - a statistical analysis. Are observed responses real or due to random chance? - an economic analysis. What alternatives are profitable to farmers? - an agronomic analysis. Can observed responses be explained in terms of biological and
physical processes?
258

Procedures for an economic analysis are contained in a manual 'From Agronomic Data to Farmer Recommendations' (Perrin et al., 1976). A revised version was published in 1988 (CIMMYT, 1988).
The procedure is based on a partial budget analysis. With such an analysis one is able to quickly examine the consequences of small changes in management of only a limited part of the farming enterprise. In such cases the only data required are those referring to that particular part of the farming enterprise; a 'with-without' comparison is made. When the partial budget is drawn up the extra costs and lost benefits are listed on the one side; the extra benefits and saved costs are listed on the other.
The procedure for the economic analysis of data is subdivided into three steps (Perrin et al., 1976). In the first step average net benefits for each treatment are calculated, by: - estimation of benefits for each treatment, involving:
(1) calculation of average yields. Adjustments can be made for differences in research and farmer management levels (0-50%) and for harvest and storage losses (10%); (2) estimation of field price of produce. When produce is sold, the field price is at least 10% lower than the local market price (due to harvest, storage, and marketing costs); (3) calculation of the gross field benefit. The adjusted average yield is multiplied by the field price of produce;
- estimation of variable costs for each treatment, involving: (1) identification and quantification of the variable inputs; (2) estimation of field price of inputs based on either retail price and transport cost or opportunity cost (labour); (3) calculation of the total variable costs;
- calculation of the net benefit for each treatment by subtraction of total variable costs from gross field benefit.
The second step includes the selection of the treatment to be recommended using marginal analysis, through: - listing of treatments from high to low net benefits followed by the elimination of
dominated treatments. Dominated treatments have lower net benefits and higher variable costs compared to undominated treatments. For the undominated treatments the rate of return to each increment in capital is calculated;
- selection of the treatment to be recommended. This treatment should offer the highest net benefit and a marginal rate of return of at least 40% on the last increment of capital. However, the marginal rate of return should be placed much higher (e.g. at 100%) in cases where capital is very scarce or when risks are high.
The third step checks the suitability of the selected treatment, through: - application of a minimum return analysis. A comparison is made between the worst
and/or the worst 25% of the results for each treatment to check on treatment's riskiness; - application of a sensitivity analysis. A comparison is made to determine if the
recommendation is sensitive to changes in produce and input prices.
Harrington (1982a) suggests some improvements in case multiple factor experiments are analyzed. The 'treatment by treatment' economic analysis of these experiments is complex as many treatments are often involved (e.g. for a 24-trial, 16 treatments need to be analyzed). Moreover, the 'treatment by treatment' analysis can be misleading, as
259

conclusions are based on only a part of the available information. This is due to the statistical trial design.
The suggested alternative economic analysis makes full use of all available information because data are pooled based on the results of the statistical analysis. Therefore the pooling of data to obtain the main effects of factors is only allowed if no significant interactions are present. Otherwise further disaggregation is needed. Thus, instead of one large single budget with many treatments, there may be several smaller budgets with more interesting and meaningful comparisons. However, the exact form of the budgets depends on the statistical analysis results.
4.5 Extension of successful strategies and technologies
The technology transfer process to farmers starts with the implementation of verification experiments. Normally, extension specialists are in charge of this last phase of experimental testing. They are backed by the support of research personnel. Distribution of trials in the recommendation domain and farmers participation in management need careful consideration. Once results of verification experiments indicate acceptance by farmers, the next stage in the technology transfer process can be initiated: the implementation of a programme with crop production plots.
These field-scale plots give the most realistic evaluation of the technology under farmers conditions (Palmer et al., 1982) as, system's compatibility is tested. Again primary management responsibility lies with the extension personnel and farmers supported by researchers. In certain circumstances these plots may constitute the basis for rapid multiplication of new open-pollinated varieties of crops such as sorghum and maize. When recommended technologies prove acceptable to farmers, the extension service may start organizing a programme for widespread diffusion of the technology.
The above describes the role of the extension service as disseminating new technologies. However, it is emphasized that its role is not restricted to disseminating only. One of the strengths of an on-farm research programme is that it draws local extensionists back into the technology development process. Shaner et al. (1982) presented a review of the extensionists participation in all phases of the technology development process.
By involving research and extension personnel and farmers in a joint strategy of technology development and transfer, it is anticipated that the 'top-down' information flow system (from research via extension to farmers) can be altered. On-farm research as a team effort is seen as a 'lever' to restore the 'bottom-up' flow of information to guide research.
260

ANNEX 2
FINGER MILLET AND ITS CHANGING PLACE IN LOCAL ECONOMIES
All local ethnic groups grew finger millet. Nowadays it is only widely grown by the Teso. The question arises what factors induced the development of different cereal cropping systems among local groups. Listing of differences between sorghum, maize and finger millet may provide the answers:
ecological requirements Maize and finger millet require more reliable rainfall than sorghum. In the early growth stages sorghum and finger millet are more drought-resistant than maize.
yield potential Finger millet has a lower yield potential than either maize or sorghum. Maize may outyield sorghum in wet environments, but sorghum outyields maize in dry environments. Under wet conditions less grain deterioration occurs in maize as its cobs are protected by husks.
seedbed preparation Finger millet requires a much finer seedbed than either sorghum or maize. After broadcasting its small seeds need to be covered by a very thin soil layer. Due to its slow youth growth, weed control in the early growth stages is important; a thorough seedbed preparation reduces such weed competition. Dry or early sowing on the 'grass rains' is often practised to ensure that finger millet is put into a favourable position to compete with germinating weeds. Grass rains are therefore called 'wimbi rains' (finger millet rains) by the Uganda Teso (Uchendu and Anthony, 1975). For successful cropping, farmers flexibility in the management of finger millet is much more restricted than that of sorghum or maize.
weeding, harvesting and threshing Crops of finger millet require more labour than those of maize or sorghum. As finger millet is broadcast and the required plant population is high, weeding is time-consuming. Sorghum is broadcast or hill-planted. Maize is mostly hill-planted. When broadcast, sorghum is more difficult to weed than maize.
bird resistance Maize is more resistant to bird attack than either finger millet or sorghum. White sorghums are more favoured by birds than brown sorghums or finger millet. Bird scaring may be necessary for sorghum and finger millet adding to the cost of production of these two crops.
early availability of grain Grain shortage often occurs in May-June, locally named 'the children wait for food' period. Local finger millet varieties mature before those of sorghum and maize. When sown in January they are harvested in May. Their grain provides early food, fetches high prices on local markets, and is used for beer brewing to invite neighbours for harvesting of sorghum and maize or planting and weeding of cotton.
storage Finger millet grain stores much better than that of maize or sorghum. Its seeds are small and dry quickly. Storage insects cannot live inside its seeds. Storage for as long as 10 years has been recorded without use of insecticides. For local farmers this is probably the greatest advantage of finger millet over maize or sorghum (Acland, 1973).
261

Safe storage of the larger grains of maize and sorghum is difficult in humid areas. With unthreshed grain, the major pest is the angoumois grain moth (Sitotroga cerealella); all varieties of maize and sorghum are susceptible (Doggett, 1970). With threshed grain, other pests are important (rice weevil/flour beetle-pest complex); the amount of corneous endosperm in the kernel greatly influences damage levels (Chapter 2.3.2). Grain moth damage can be kept to a minimum by maintaining the grain moisture level below 12% (Teetes et al., 1983). Redrying of grain is frequently required. Mixing with ash of burned cow-dung or wood to keep grain moisture levels low, is practised by local farmers.
The list points out a number of important disadvantages of finger millet over maize and sorghum. Finger millet appears to be a labour-intensive, low yielding crop; its management is difficult with a low degree of flexibility. It is not surprising at all that finger millet has become less important in the Abaluyia and Luo economies; it is rather surprising that it is still important in the Teso economy. The question can therefore be rephrased as to why Teso households still prefer finger millet and how they manage this crop in view of the many constraints. To answer these questions the developments in the Teso economy have to be examined using a historical farming systems perspective. As the fanning system of the Teso in Kenya bears (at least until recently) close resemblance to that of the Teso in Uganda, much can be learnt from surveys conducted in the Teso District of Uganda in 1965-75. Table A-2.1 presents a comparative overview.
Table A-2.1. Percentage of annually cultivated land under various crops of farmers living in the traditional areas of the Teso within the Busia (Kenya) and Teso (Uganda) Districts.
district: country:
maize sorghum finger millet maize-bean mixtures beans, cowpeas, pigeon peas cassava
sweet potatoes cotton groundnuts sunflower others (tobacco; mixtures; simsim)
Busia Kenya
23 .9
0.5 14.9
7.6 0.5
10.6
-23.9
-14.8
3 .2
District
(1) Teso District Uganda (2)
0.8 12.6 26.6
-8.1 9.6 8.9
24.1 8.4
-0.9
Notes: (1)= based on the Small Farm Survey of 1977 (Jaetzold and Schmidt, 1982), for which a sample of 30 farmers was drawn from the members register of the local cooperative society; due to the sampling method, results may only be used to indicate certain trends; (2)= based on district crop area totals of 1965 (Uchendu and Anthony, 1975).
At the turn of the century the Teso were pastoralists and kept large herds of cattle. Although subsistence crops were grown (mainly by women) cattle herding was their main occupation. The introduction of cotton and cassava changed the traditional cropping pattern. Cotton became the opening crop instead of finger millet. Cassava as the last crop in the rotation, was incorporated in the fallow system. Table A-2.2 shows that rapid adoption of cotton went hand in hand with rapid diffusion of the ox-plough. The fact that many Teso owned cattle reduced the heavy initial capital investment that would have been a constraint on adopting the ox-plough.
262
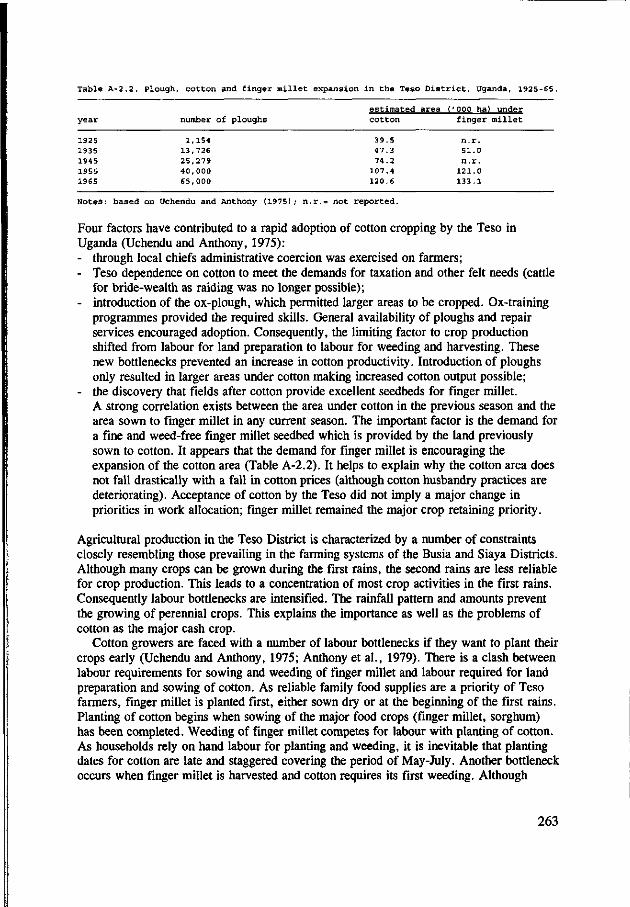
Table A-2.2. Plough, cotton and finger millet expansion in the Teso District, Uganda, 1925-65.
year number of ploughs estimated area ('000 ha) under cotton finger millet
1925 1935 1945 1955 1965
1,154 13,726
25,279 40,000 65,000
39.5 47.3 74.2
107.4 120.6
121.0 133.1
Notes: based on Uchendu and Anthony (1975); n.r.= not reported.
Four factors have contributed to a rapid adoption of cotton cropping by the Teso in Uganda (Uchendu and Anthony, 1975): - through local chiefs administrative coercion was exercised on farmers; - Teso dependence on cotton to meet the demands for taxation and other felt needs (cattle
for bride-wealth as raiding was no longer possible); - introduction of the ox-plough, which permitted larger areas to be cropped. Ox-training
programmes provided the required skills. General availability of ploughs and repair services encouraged adoption. Consequently, the limiting factor to crop production shifted from labour for land preparation to labour for weeding and harvesting. These new bottlenecks prevented an increase in cotton productivity. Introduction of ploughs only resulted in larger areas under cotton making increased cotton output possible;
- the discovery that fields after cotton provide excellent seedbeds for finger millet. A strong correlation exists between the area under cotton in the previous season and the area sown to finger millet in any current season. The important factor is the demand for a fine and weed-free finger millet seedbed which is provided by the land previously sown to cotton. It appears that the demand for finger millet is encouraging the expansion of the cotton area (Table A-2.2). It helps to explain why the cotton area does not fall drastically with a fall in cotton prices (although cotton husbandry practices are deteriorating). Acceptance of cotton by the Teso did not imply a major change in priorities in work allocation; finger millet remained the major crop retaining priority.
Agricultural production in the Teso District is characterized by a number of constraints closely resembling those prevailing in the farming systems of the Busia and Siaya Districts. Although many crops can be grown during the first rains, the second rains are less reliable for crop production. This leads to a concentration of most crop activities in the first rains. Consequently labour bottlenecks are intensified. The rainfall pattern and amounts prevent the growing of perennial crops. This explains the importance as well as the problems of cotton as the major cash crop.
Cotton growers are faced with a number of labour bottlenecks if they want to plant their crops early (Uchendu and Anthony, 1975; Anthony et al., 1979). There is a clash between labour requirements for sowing and weeding of finger millet and labour required for land preparation and sowing of cotton. As reliable family food supplies are a priority of Teso farmers, finger millet is planted first, either sown dry or at the beginning of the first rains. Planting of cotton begins when sowing of the major food crops (finger millet, sorghum) has been completed. Weeding of finger millet competes for labour with planting of cotton. As households rely on hand labour for planting and weeding, it is inevitable that planting dates for cotton are late and staggered covering the period of May-July. Another bottleneck occurs when finger millet is harvested and cotton requires its first weeding. Although
263

cotton is often classified as a first-rain crop, classification as a second-rain crop appears more appropriate. Due to late plantings rainfall in the second rains mainly determines cotton yields.
The Teso District was one of the first areas in tropical Africa to adopt the ox-plough. Although the total area under cotton and other crops was expanded, little else happened to improve agriculture. In the 1960s the cumulative impact of the cotton/plough innovations on the Teso economy had been lost (Anthony et al., 1979). No serious attempts had been made to solve the labour constraints during weeding and sowing which the plough had helped to create. The heavy labour input required for hand weeding of broadcast-planted finger millet imposed a severe constraint on the achievement of early sowing of cotton, which is critical for high yields. This remains one of the major problems in Teso agriculture.
Some suggestions and attempts have been made to lessen the impact of these labour constraints during weeding and planting, viz.: - the use of ox-drawn seeders and weeders. Planting in rows instead of broadcasting
facilitates hand weeding or permits the use of ox-drawn weeders. Until the 1960s no serious attempts were made to introduce and encourage the widespread use of ox-drawn implements other than the plough. However, adoption was limited by low availability and technical deficiencies of implements;
- to change the composition of Teso farm output. By creating a demand for less labour-intensive, higher yielding cereals the demand for finger millet can be reduced. Introduction of early-maturing maize and sorghum cultivars will increase farmers flexibility. Maize can be grown during the first rains. Sorghum can be grown in both seasons either before or after other crops. Experiences in Kisii (Kenya) and Mazabuku (Zambia) indicate that dietary preferences for finger millet can be altered quickly, when market forces, rather than local food preferences, dictate what crops are to be grown (Anthony et al., 1979).
However, in the 1960s maize and sorghum were not encouraged in Uganda because of the limited internal demand and apparent lack of an external market. Maize had also been officially discouraged in cotton growing areas in Uganda as it harbours cotton pests, especially the American bollworm (Acland, 1973).
According to Anthony et al. (1979) major stimuli to the Teso economy include: - the creation of an external demand for maize and sorghum; - the organization of seed production and distribution to make improved cultivars of
maize and sorghum available to farmers. These authors expect that these measures would trigger off a reallocation of the enormous resources of labour (and land) devoted to finger millet.
When studying the present cropping systems of the Teso living in the northern part of the Kenya Busia District (Tables 4.2 and A-2.1) the potential value of these measures is highlighted. Some major agricultural changes have occurred in this area in the past 25 years. Contrary to Uganda, major stimuli to change the Teso farm output composition were present in Kenya:
264

- a strong national market for maize, reflected in satisfactorily guaranteed maize producer prices;
- a well organized chain for production (breeding and multiplication) and distribution of seeds of improved cultivars of maize;
- intensive extension campaigns to introduce new maize hybrids to farmers.
Within 20 years maize had become the most important cereal for the Teso in Kenya. Although at the beginning of maize cropping Teso farmers mainly regarded maize as a cash crop to be sold immediately after harvest, recent surveys (e.g. Rop, 1981) indicate that a change in dietary habits has also occurred. Maize has been accepted as a food by the Teso; it now competes with finger millet for the first place in preference ranking of local foods.
Introduction of new sorghum varieties (e.g. Serena) did not have such an impact. In Kenya sorghum had neither a strong external market nor a well organized chain for seed production and distribution. These factors, in combination with the locally deep soils reducing the need for drought-resistant crops, are mainly responsible for the disappearance of sorghum from the cropping systems of the Teso living in the northern part of the Busia-Siaya target area.
265

REFERENCES
Acland, J.D., 1973. East African Crops. FAO/Longman Group, Rome/London, 252 pp. Adams, M. E., 1982. Agricultural extension in developing countries; Intermediate
Tropical Agriculture Series. Longman Group Ltd., Harlow, United Kingdom, 108 pp. Adesiyun, A.A., 1981. Seasonal abundance of shootflies infesting sorghum and their
natural enemies in Samara, Nigeria. Insect Science and its Application 2: 49-53. Agrawal, B.L. and L.R. House, 1982. Breeding for pest resistance in sorghum.
In: Sorghum in the eighties, Volume 1. ICRISAT, India, pp. 435-446. Ahn, P.M., 1970. West African Soils. Oxford University Press, London, 332 pp. Allan, A.Y., 1972. The influence of agronomic factors on maize yields in Western Kenya
with special reference to time of planting. Ph.D. thesis, University of East Africa. Anandajayasekeram, P., G. Durr and G. Karanja, 1989. Challenges of the Regional
Research Centres in the generation, testing and dissemination of appropriate technologies to small holder farmers in Kenya. In: KARI, Agricultural research in Kenya: achievements, challenges and prospects. KARI, Nairobi, pp. 55-62.
Anandajayasekeram, P., J.B.W. Matata, G.N. Angwenyi, M.W. Ogemma and E.O. Wandera, 1991. National guidelines - Farming Systems Approach to Research, Extension and Training (FSA-RET). Ministry of Agriculture, Nairobi, 40 pp.
Anonymous, 1970. National Atlas of Kenya (third edition). Survey of Kenya, Kenya Government, Nairobi, 103 pp.
Anonymous, 1981. Projects submitted: funds needed for government programme. Business and Finance Column, August 14, 1981. The Weekly Review, Nairobi, pp. 34.
Anthony, K.R.M., B.F. Johnston, W.O. Jones and V.C. Uchendu, 1979. Agricultural change in tropical Africa. Cornell University Press, Ithaca, 326 pp.
Arkel, H. van, 1980. The forage and grain yield of cold-tolerant sorghum and maize as affected by time of planting in the highlands of Kenya. Netherlands Journal of Agricultural Science 28: 63-77.
Arkel, H. van, 1982. The identification and introduction of a new crop in the highlands of Kenya. Ph.D. thesis, Wageningen Agricultural University, 58 pp. and 5 papers.
Arnon, I., 1972. Crop production in dry regions, Volume 1: background and principles. Leonard Hill, London, 650 pp.
Axtell, J.D., Gebisa Ejeta and L. Munck, 1982. Sorghum nutritional quality: progress and prospects. In: Sorghum in the eighties, Volume 2. ICRISAT, India, pp. 589-603.
Ba, A.T., 1983. Evidence of enzyme activities in the haustorium of Striga gesnerioides (Scrophulariaceae). In: Proceedings of the Second International Workshop on Striga (Ouagadougou, Upper Volta, 1981). ICRISAT, India, pp. 39-42.
Bebawi, F.F., 1981. Response of sorghum cultivars and Striga population to nitrogen fertilization. Plant and Soil 59: 261-267.
Birch, H.F., 1960. Nitrification in soils after different periods of dryness. Plant and Soil 12: 81-96.
Bogdan, A.V., 1958. A revised list of Kenya Grasses (with keys for identification). Government Printer, Nairobi, 73 pp.
Bogdan, A.V., 1977. Tropical pasture and fodder plants (grasses and legumes); Tropical Agriculture Series. Longman, London, 475 pp.
Bowden, J., 1965. Sorghum midge, Contarinia sorghicola (Coq.), and other causes of grain-sorghum loss in Ghana. Bulletin of Entomological Research 56: 169-189.
269

Elliot, C.C.H., 1986. An overview of Quelea control strategies. In: Proceedings of the fourth Regional Workshop on Sorghum and Millet Improvement in Eastern Africa (Soroti, Uganda, 1985). SAFGRAD/ICRISAT, Nairobi, pp. 340-361.
Enserink, H.J. and J.K. Rutto, 1979. Results of trials during the 1979 Long and Short Rains; Progress report 1979, Western Kenya. Field document KEN/78/016. Sorghum and Millet Development Project, Busia, 16 tables.
Enserink, H.J., J.K. Rutto, B.S. Rana and N. Ochanda, 1980. Results of trials during the 1980 Long and Short Rains; Progress report 1980, Western Kenya. Field document KEN/78/016. Sorghum and Millet Development Project, Busia, 63 tables.
Enserink, H.J. and E.S. Njeru, 1981. Results and discussion of trials during the 1981 Long and Short Rains. Progress report 1981, Western Kenya. Field document KEN/78/016. Sorghum and Millet Development Project, Busia, 52 pp. text, 121 tables.
Enserink, H.J. and E.S. Njeru, 1982. Results and discussion of trials during the 1982 Long and Short Rains. Progress report 1982, Western Kenya. Field document KEN/78/016. Sorghum and Millet Development Project, Busia, 22 pp. text, 30 tables.
Enserink, H.J., 1982. How knowledge of farmers circumstances can be useful for planning experimental content in agronomy. Occasional Paper 10. CIMMYT Eastern Africa Economics Programme, Nairobi, 16 pp.
Enserink, H.J., 1986. Using a farming systems perspective to plan a sorghum and millet development policy in Tanzania. RTI (Amsterdam) and FAO (Rome), 91 pp.
Enserink, D., K. Bunyecha, C. Bosch, B. Meertens, K. Tamminga and P. Penninkhoff, 1994a. From theme to on-farm experimentation: Lake Zone, Tanzania. In: J.D. Meindertsma (Ed), Setting research priorities - Towards effective farmer-oriented research. Royal Tropical Institute, Amsterdam, pp. 126-146.
Enserink, H.J., K.F. Bunyecha, H.C.C. Meertens, G.J. Kajiru and F. Bagarama, 1994b. From farming systems research and extension to zonal strategies: Rice research in Sukumaland, Tanzania. In: Systems-oriented research in agriculture and rural development. International symposium (Montpellier, France, 1994). CIRAD-SAR, Montpellier, France, pp. 86-91.
Eplee, R.E., 1983. Progress in control of Striga asiatica in the United States. In: Proceedings of the Second International Workshop on Striga (Ouagadougou, Upper Volta, 1981). ICRISAT, India, pp. 99-102.
Eponou, T., 1994. Linking research to technology dissemination. In: J.D. Meindertsma (Ed), Setting research priorities - Towards effective farmer-oriented research. Royal Tropical Institute, Amsterdam, pp. 77-93.
Escalada, R.G. and D.L. Plucknett, 1975. Ratoon cropping of sorghum: I. Origin, time of appearance, and fate of tillers. Agronomy Journal 67: 473-478.
Escalada, R.G. and D.L. Plucknett, 1977. Ratoon cropping of sorghum. III. Effect of nitrogen and cutting height on ratoon performance. Agronomy Journal 69: 341-346.
Evans, A.C., 1955. A study of crop production in relation to rainfall reliability. East African Agricultural Journal 20: 263-267.
FAO-UNESCO, 1974. Soil map of the world (scale 1: 5,000,000). Volume I: Legend. Unesco, Paris, 59 pp.
FAO, 1979. Project document: Sorghum and Millet Development - Phase II, Kenya. FAO/UNDP/GK, Nairobi, 40 pp.
Faris, M.A., M. de A. Lira and A.F. de S. Leao Veiga, 1979. Stability of sorghum midge resistance. Crop Science 19: 577-580.
272

Feldstein, U.S. and J. Jiggens (Eds), 1994. Tools for the field - Methodologies handbook for gender analysis in agriculture. Kumarian Press, West Hartford, Connecticut, USA, 270 pp.
Fresco, L.O., 1984. Issues in farming systems research. Netherlands Journal of Agricultural Science 32: 253-261.
Geering, Q.A., 1954. The sorghum midge, Contarinia sorghicola (Coq.) in East Africa. Bulletin of Entomological Research 44: 363-366.
Gelens, H.F. and G. Ngari, 1973. Report of a site evaluation of the proposed location of Alupe substation. Site evaluation no. 4. Kenya Soil Survey, Nairobi, 7 pp.
Geus, J.G. de, 1973. Fertilizer guide for the tropics and subtropics (second edition). Centre d'Etude de l'Azote, Zurich, 774 pp.
Gilbert, E.H., D.W. Norman and F.E. Winch, 1980. Farming systems research: a critical appraisal. MSU Rural Development Paper 6. Michigan State University, East Lansing, 135 pp.
Glover, J., 1957. The relationship between total seasonal rainfall and yield of maize in the Kenya Highlands. Journal of Agricultural Science, Cambridge 49: 285-290.
Harrington, L.W., 1982a. Economic analysis of 2" factorial agronomic experiments. Farming Systems Newsletter 8: 11-20. CIMMYT Eastern Africa Economics Programme, Nairobi.
Harrington, L.W., 1982b. Recommendation domains: a framework for organizing on-farm research. First Draft. Economics Program, CIMMYT, Mexico, 40 pp.
Harris, K.M., 1961. The sorghum midge, Contarinia sorghicola (Coq.), in Nigeria. Bulletin of Entomological Research 52: 129-146.
Harris, K.M., 1976. The sorghum midge. Annals of Applied Biology 84: 114-118. Hay, R.K.M., 1981. Timely planting of maize: a case-history from the Lilongwe Plain.
Tropical Agriculture (Trinidad) 58: 147-155. Hawkins, R.C., 1979. Maize growth and temperature in the Kenya Highlands.
Ph.D. thesis. University of Nottingham, 137 pp. Hawkins, R.C. and P.J.M. Cooper, 1981. Growth, development and grain yield of maize.
Experimental Agriculture 17: 203-207. Hemingway, J.S., 1955. Effects of Puccinia polysora rust on yield of maize. East African
Agricultural Journal 20: 191-194. Huddleston, E.W., D. Ashdown, B. Maunder, C.R. Ward, G. Wilde and C.E. Forehand,
1972. Biology and control of the sorghum midge. 1. Chemical and cultural control studies in West Texas. Journal of Economic Entomology 65: 851-855.
Huxley, E., 1972. European agriculture 1923-1939: developments in European agriculture. In: L. Winston Cone and J.F. Lipscomb, The history of Kenya agriculture. University Press of Africa, Nairobi, pp. 71-73.
Huxley, E., 1980. White man's country: Lord Delamere and the making of Kenya. Volume I: 1870-1914. Chatto and Windus, London, 315 pp.
Heyer, J. and J.K. Waweru, 1976. The development of the small farm areas. In: J. Heyer, J.K. Maitha and W.M. Senga (Eds), Agricultural development in Kenya. Oxford University Press, Nairobi, pp. 187-221.
Huijsman, B. and J.D. Meindertsma, 1994. Getting results: an overview and future agenda. In: J.D. Meindertsma (Ed), Setting research priorities - Towards effective farmer-oriented research. Royal Tropical Institute, Amsterdam, pp. 244-260.
ICIPE, 1978. Review of the sorghum shootfly project by a scientific working group. Crop borers and sorghum shootfly research programme. ICIPE, Nairobi, 20 pp.
273

ICRISAT, 1984. Sorghum root and stalk rots - a critical review. ICRISAT, India, 267 pp. Ivens, G.W., 1975. East African weeds and their control. Oxford University Press,
Nairobi, 250 pp. Jaetzold, R. and H. Schmidt, 1982. Farm management handbook of Kenya: natural
conditions and farm management information. Volume II/A: West Kenya. Ministry of Agriculture, Nairobi, 397 pp.
James, A.W., 1982. Processing of sorghum and millet, Kenya. Consultant Report, AG:DP/KEN/78/016. FAO, Rome, 55 pp.
Johnson, S.L., 1979. Changing patterns of maize utilization in Western Kenya. Changing Agricultural Studies in Africa; Studies in Third World Societies 8: 37-56.
Jotwani, M.G., 1972. Seed treatment of sorghum for the control of shoot fly. In: M.G. Jotwani and W.R. Young (Eds), Control of sorghum shoot fly. Oxford and IBH Publishing Co., New Delhi, pp. 262-273.
Jotwani, M.G., T.R. Sukhani and Santokh Singh, 1971. Seed treatment of sorghum with carbofuran for the control of shootfly. Pesticides 5 (4): 13-14.
Jotwani, M.G., T.R. Sukhani and Santokh Singh, 1972. Further studies on seed treatment of sorghum for the control of shoot fly. Pesticides 6 (3): 16-18.
Jotwani, M.G., 1981a. Integrated approach to the control of the sorghum shootfly. Insect Science and its Application 2: 123-127.
Jotwani, M.G., 1981b. Insect resistance in sorghum plants. Insect Science and its Application 2: 93-98.
Judy, W.H. and H.I. Zuberi, 1972. Cereal trials in Tanzania. In: Record of research, Annual Report 1972. EAAFRO, Nairobi, pp. 98-104.
Judy, W.H., I. Mussa, M. Yillabanu and H.I. Zuberi, 1973. Cereal trials in Tanzania. In: Record of research, Annual Report 1973. EAAFRO, Nairobi, pp. 125-142.
KARI, 1990. Annual report 1990. KARI, Nairobi, 476 pp. KARI, 1991a. Annual report 1991. KARI, Nairobi, 224 pp. KARI, 1991b. Kenya's agricultural research priorities to the year 2000 (first edition).
KARI, Nairobi, 110 pp. KARI/KIT, 1994. Revised plan of operations for the Netherlands support to the National
Agricultural Research Project Phase II (1994-1999). KARI (Nairobi) and RTI (Amsterdam), 114 pp.
Keefer, G.D., 1981. Irrigated sorghum at Emerald. Queensland Agricultural Journal 107: 155-161.
Kenworthy, J.M. and J. Glover, 1958. The reliability of the main rains in Kenya. East African Agricultural Journal 23: 267-272.
Keulen, H. van and H.D.J, van Heemst, 1982. Crop response to the supply of macronutrients. Agricultural Research Reports 916. Centre for Agricultural Publishing and Documentation, Wageningen, 46 pp.
Kibisu, L.W., B.O. Alela, H.M. Obiero, S.B. Muhindi, J.O. Odhiambo, W.K. Karanu and F.H. Kiriro, 1992. Exploratory survey report for Emuhaya and Shinyalu Divisions. Kakamega District Farming Systems Team, RRC Kakamega, Kakamega, Kenya, 12 pp.
Kulkarni, K. A. and M.G. Jotwani, 1978. Control of sorghum shootfly by carbofuran seed treatment. Annals of Arid Zone 17 (2): 184-191.
Kulkarni, K.A. and M.G. Jotwani, 1979. Efficacy of isofenfos for sorghum shootfly (Atherigona soccata Rondani) control. Rajasthan Journal of Pesticides 6 (1): 1-4.
Law, R., 1974. Investigations of the important growth stages of maize. Contribution to the fifth Eastern African Cereals Research Conference (Malawi, 1974), 16 pp.
274

Law, R. and P.J.M. Cooper, 1976. The effect and importance of soil temperature in determining the early growth rate and final grain yields of maize in Western Kenya. East African Agricultural and Forestry Journal 41: 189-200.
Leonard, W.H. and J.H. Martin, 1963. Cereal Crops. The Macmillan Company, New York, pp. 679-739.
Lihanda, F.C.L.M., 1978. Adaptive research planning: a case study - Vihiga Division, Kakamega District, Western Province, Kenya. CIMMYT Eastern Africa Economics Programme, Nairobi, 45 pp.
Mackenzie, D.H., J.J. Basinski and D.B. Parbery, 1970. The effect of varieties, nitrogen and stubble treatments on successive cycles of grain and forage sorghums in the Ord River valley. Australian Journal of Experimental Agriculture and Animal Husbandry 10: 111-117.
MacQuillan, M.J., A.R. Badley and P.J. Hodgson, 1975. Control of sorghum midge with chlorpyrifos in Australia. Journal of Economic Entomology 68: 713-715.
Maiti, R.K., K.V. Ramaiah, S.S. Bisen and V.L. Chidley, 1984. A comparative study of the haustorial development of Striga asiatica (L.) Kuntze on sorghum cultivars. Annals of Botany 54: 447-457.
Manning, H.L., 1956. The statistical assessment of rainfall probability and its application in Uganda agriculture. Proceedings of the Royal Society of London, Series B 144: 460-480.
Majisu, B.N. and H. Doggett, 1972. The yield stability of sorghum varieties and hybrids in East African environments. East African Agricultural and Forestry Journal 38: 179-192.
Maxwell, S., 1986. Farming Systems Research: hitting a moving target. World Development 14: 65-77.
McBee, G.G., R.M. Waskom, III, F.R. Miller and R.A. Creelman, 1983. Effect of senescence and nonsenescence on carbohydrates in sorghum during late kernel maturity stages. Crop Science 23: 372-376
Merwine, N.C., L.M. Gourley and K.H. Blackwell, 1981. Inheritance of papery glume and cleistogamy in sorghum. Crop Science 21: 953-956.
Michieka, D.O. and J.R. Rachilo, 1984. Soils of the Busia area. Report No. R8. Kenya Soil Survey, Nairobi.
Mugambi, J.R., 1975. Fertilizer application methods in maize. In: Report on the FAO/NORAD Seminar on Fertilizer Use Development (Kitale, Kenya, 1973). FAO, Rome, pp. 42-45.
Mukuru, S.Z., V. Makumbi, B.W. Khizzah and R.E. Okello, 1974. Sorghum and millet breeding: sorghum. In: Record of research, Annual Report 1974. EAAFRO, Nairobi, pp. 95-104.
Mukuru, S.Z., V. Makumbi, B.W. Khizzah and P.A. Ajau, 1975. Sorghum and millets: sorghum breeding. In: Record of research, Annual Report 1975. EAAFRO, Nairobi, pp. 86-95.
Mukuru, S.Z., V. Makumbi, B.W. Khizzah and B.A. Opolot, 1976. Sorghum breeding. In: Record of research, Annual Report 1976. EAAFRO, Nairobi, pp. 95-108.
Mulamula, H.H.A., 1992. Pilot Farming Systems Approach Project; Kakamega-Nandi Districts - Supervision report (RRC/KIS/RES/14/51). Consultant report, RRC Kisii, Kisii, Kenya, 14 pp.
Munck, L., K.E. Bach Knudsen and J.D. Axtell, 1982. Industrial milling of sorghum for the 1980s. In: Sorghum in the eighties, Volume 2. ICRISAT, India, pp. 565-570.
275

Mutsaers, H.J.W., 1986. On-farm research models and their implementation in some African countries. West African Farming Systems Research Network Bulletin 1 (2): 22-26
Mutsaers, H.J.W., 1994. Analyse van DGIS-gefinancierde Farming Systems Research projecten in Afrika. Internationaal Agrarisch Centrum, Wageningen, 67 pp.
Neeley, D., J. Matata and F. Kisyombe, 1991. Statistical techniques for the analysis of on-farm crop trials. CIMMYT Eastern Africa Regional Office, Nairobi, 197 pp.
Njeru, E.S. and H.J. Enserink, 1982. The 1982 sorghum research and extension village approach programme in Western Kenya. Farming Systems Newsletter 10: 16-27. CIMMYT Eastern Africa Economics Programme, Nairobi.
Norman, D.W., M.D. Newman and I. Ouedraogo, 1981. Farm and village production systems in the semi-arid tropics of West Africa: an interpretive review of research. Research Bulletin 4 (1). ICRISAT, India, 94 pp.
Norris, R.S. and R.E. Eplee, 1983. Effect of stimulant plus herbicide on Striga germination. In: Proceedings of the Second International Workshop on Striga (Ouagadougou, Upper Volta, 1981). ICRISAT, India, pp. 43-46.
Nye, I.W.B., 1960. The insect pests of Graminaceous crops in East Africa. Colonial Research Studies 31. Her Majesty's Stationery Office, London, 48 pp.
Obilana, A.T., 1983. Striga studies and control in Nigeria. In: Proceedings of the Second International Workshop on Striga (Ouagadougou, Upper Volta, 1981). ICRISAT, India, pp. 87-98.
Ochieng', W.R., 1974. An outline history of Nyanza up to 1914. East African Literature Bureau, Nairobi, 104 pp.
Ochanda, N.W., 1986. A review of sorghum and millet research in western Kenya during 1984. In: Sorghum and millet improvement in Eastern Africa; proceedings of the fourth Regional Workshop (Soroti, Uganda, 1985). SAFGRAD/ICRISAT, Nairobi, pp. 126-140.
Ogborn, J., 1972. The control of Striga hermonthica in peasant farming. In: Proceedings of the eleventh British Weed Control Conference (Brighton, England, 1972). British Crop Protection Council, London, pp. 1068-1077.
Ogwaro, K., 1978. Ovipositional behaviour and host-plant preference of the sorghum shoot fly, Atherigona soccata (Diptera; Anthomyiidae). Entomologia Experimentalis et Applicata23: 189-199.
Ogwaro, K., 1979. Seasonal activity of the sorghum shootfly Atherigona soccata (Diptera: Anthomyiidae). Entomologia Experimentalis et Applicata 26: 74-79.
Oizumi, H., 1977. Role of organic reserves upon regrowth of forage plants: I. Elongation of tiller buds of sorgo (Sorghum bicolor Moench) plants after cutting as influenced by levels of organic reserves. Technical Bulletin of Faculty of Horticulture, Chiba University, Japan 25: 55-62.
Osogo, J., 1966. A history of the Baluyia. Oxford University Press, Nairobi, 162 pp. Overman, J.L. and CD . Muhwana, 1972. Cereals entomology. In: Record of research,
Annual Report 1972. EAAFRO, Nairobi, pp. 87-97. Page, F.D., 1979. Resistance to sorghum midge (Contarinia sorghicola Coquillet) in grain
sorghum. Australian Journal of Experimental Agriculture and Animal Husbandry 19: 97-101.
Palmer, A.F.E., A.D. Violic and F. Kocher, 1982. Relationship between research and extension services and the mutuality of their interests in agricultural development. CIMMYT, Mexico, 22 pp.
276

Parker, C , 1983. Factors influencing Striga seed germination and host-parasite specificity. In: Proceedings of the Second International Workshop on Striga (Ouagadougou, Upper Volta, 1981). ICRISAT, India, pp. 31-35.
Parrott, M., G. Arnold, V. Brittain and G. Morrison, 1978. Kenya - 1978: mapping the future after a president's death. A Special Report - September, 1978. International Herald Tribune, Zurich, pp. 1S-6S.
Passlow, T., 1965. Bionomics of sorghum midge (Contarinia sorghicola (Coq.)) in Queensland, with particular reference to diapause. Queensland Journal of Agricultural and Animal Sciences 22: 149-167.
Penning de Vries, F.W.T., J.M. Krul and H. van Keulen, 1978. Productivity of Sahelian rangelands in relation to the availability of nitrogen and phosphorus from the soil. Contribution to the workshop Nitrogen Cycling in West African Ecosystems (IITA, Nigeria, 1978). Department of Theoretical Production Ecology, Wageningen Agricultural University, 26 pp.
Peters, H., 1984. The importance of time of planting on youth growth and final yields of sorghum, maize and finger millet in the Lake Basin Area, Kenya. M.Sc. thesis, Department of Agronomy, Wageningen Agricultural University, 40 pp.
Perrin, R.K., D.L. Winkelmann, E.R. Moscardi and J.R. Anderson, 1976. From agronomic data to farmer recommendations: an economics training manual. CIMMYT, Mexico, 51 pp.
Pesch, C , A.H. Pieterse and W.A. Stoop, 1983. Inhibition of germination in Striga by means of urea. In: Proceedings of the Second International Workshop on Striga (Ouagadougou, Upper Volta, 1981). ICRISAT, India, pp. 37-38.
Pinto, F.F., 1982. Draft terminal report of KEN/78/016 Project - Phase II. Kenya Sorghum and Millet Development Project, Machakos, 128 pp.
Plucknett, D.L., J.P. Evenson and W.G. Sanford, 1970. Ratoon cropping. Advances in Agronomy 22: 285-330.
Plucknett, D.L., R.G. Escalada and R.S. de la Pena, 1981. Ratoon cropping of rice and sorghum: recent advances. Madras Agricultural Journal 68 (11/12): 31-39.
Pollard, S., 1981. Report on the Karateng/West Kisumu farming systems study. Agricultural Mechanisation Station, Nakuru, Kenya, 45 pp.
Pury, J.M.S. de, 1978. Crop pests of East Africa. Oxford University Press, Nairobi, 227 pp.
Rai, S., M.G. Jotwani and D. Jha, 1978a. Methodology for estimating shootfly damage and grain yield relationship in sorghum. Indian Journal of Entomology 40: 121-125.
Rai, S., M.G. Jotwani and D. Jha, 1978b. Economic injury level of shootfly, Atherigona soccata (Rondani) on sorghum. Indian Journal of Entomology 40: 126-133.
Raina, A.K., 1981a. Movement, feeding behaviour and growth of larvae of the sorghum shootfly, Atherigona soccata. Insect Science and its Application 2: 77-81.
Raina, A.K., 1981b. Deterrence of repeated oviposition in sorghum shootfly, Atherigona soccata. Journal of Chemical Ecology 7: 785-790.
Raina, A.K., 1982. Fecundity and oviposition behaviour of the sorghum shootfly, Atherigona soccata. Entomologia Experimental et Applicata 31: 381-385.
Ramaiah, K.V. and C. Parker, 1982. Striga and other weeds in sorghum. In: Sorghum in the eighties, Volume 1. ICRISAT, India, pp. 291-302.
Ramaiah, K.V., 1983. Striga research at ICRISAT Upper Volta Center. In: Proceedings of the Second International Workshop on Striga (Ouagadougou, Upper Volta, 1981). ICRISAT, India, pp. 53-60.
277

Ramaiah, K.V., C. Parker, M.J. Vasudeva Rao and L.J. Musselman, 1983. Striga identification and control handbook. Information Bulletin 15. ICRISAT, India, 52 pp.
Rana, B.S., H.J. Enserink, J.K. Rutto and N. Ochanda, 1980. Progress report 1980 Long Rains. Field document 6, KEN/78/016. Kenya Sorghum and Millet Development Project, Busia, 136 pp.
Rana, B.S., M.G. Jotwani and N.G.P. Rao, 1981. Inheritance of host plant resistance to the sorghum shootfly. Insect Science and its Application 2: 105-109.
Rao, N.G.P., 1982. Transforming traditional sorghums in India. In: Sorghum in the eighties, Volume 1. ICRISAT, India, pp. 39-59.
Reichert, R.D., 1982. Sorghum dry milling. In: Sorghum in the eighties, Volume 2. ICRISAT, India, pp. 547-563.
Rooney, L.W. and D.S. Murty, 1982. Evaluation of sorghum food quality. In: Sorghum in the eighties, Volume 2. ICRISAT, India, pp. 571-588.
Rop, I.K.A., 1981. Potential for expanding sorghum and millet production in Western Kenya: the case of Busia District. Preliminary Report. Western Agricultural Research Station, Kakamega, 35 pp.
Roth, J.P. and H.N. Pitre, 1975. Seasonal incidence and host plant relationships of the sorghum midge in Mississippi. Annals of the Entomological Society of America 68: 654-658.
Ruthenberg, H., 1976. Farming systems in the tropics (second edition). Oxford University Press, Oxford, England, 366 pp.
Rutto, J.K, 1986. Sorghum and millet research and development in Kenya - constraints, strategies, priorities and potentials. Contribution to the International Drought Symposium (Nairobi, Kenya, 1986). Programme for Research and Improvement of Sorghum and Millets (PRISM), Western ARS, Kakamega, Kenya, 17 pp.
Rutto, J.K., 1990. KARI's experience on the institutionalization of Farming Systems Approach to research in Kenya and its implications. Contribution to the OFR-Orientation Workshop (Arusha, Tanzania, 1990). KARI, Nairobi, 15 pp.
Schreurs, W.J.H., 1984. Ratooning van graansorghum in de tropen. M.Sc. thesis. Department of Agronomy, Wageningen Agricultural University, 46 pp.
Senga, W.M., 1976. Kenya's agricultural sector. In: J. Heyer, J.K. Maitha and W.M. Senga (Eds), Agricultural development in Kenya. Oxford University Press, Nairobi, pp. 69-110.
Seshu Reddy, K.V., 1982. Pest management in sorghum - II. In: Sorghum in the eighties, Volume 1. ICRISAT, India, pp. 237-246.
Shaner, W.W., P.F. Philipp and W.R. Schmehl, 1982. Farming systems research and development: guidelines for developing countries. Westview Press, Boulder, Colorado, 414 pp.
Siderius, W. and F.N. Muchena, 1977. Soils and environmental conditions of agricultural research stations in Kenya. Miscellaneous Soil Paper M5. KSS, Nairobi, 132 pp.
Siderius, W., 1978. Simplified soil maps of some districts in Kenya. Miscellaneous Soil Paper M19. Kenya Soil Survey, Nairobi, 28 pp.
Smaling, E.M.A., A. Stein and P.H.M. Sloot, 1991. A statistical analysis of the influence of Striga hermonthica on maize yields in fertilizer trials in Southwestern Kenya. Plant and Soil 138: 1-8.
Snedecor, G.W. and W.G. Cochran, 1967. Statistical methods (sixth edition). The Iowa State University Press, Ames, Iowa, USA, 593 pp.
278

Sombroek, W.G. (and other staff of the Kenya Soil Survey), 1982. Exploratory soil map of Kenya, 1980 (scale 1: 1,000,000); Appendix 1 to Report El. KSS, Nairobi.
Stanford, R.L., E.W. Huddleston and C.R. Ward, 1972. Biology and control of the sorghum midge. 3. Importance of stage of bloom and effective residual of selected insecticides. Journal of Economic Entomology 65: 796-799.
Staudt, K., 1985. Agricultural policy implementation: a case study from Western Kenya. Kumarian Press, West Hartford, 68 pp.
Steel, R.G.D. and J.H. Torrie, 1960. Principles and procedures of statistics. McGraw-Hill Book Company, Inc., London, 481 pp.
Steenhuijsen Piters, C.B. de, 1995. Diversity of fields and farmers; Explaining yield variations in northern Cameroon. Ph.D. thesis, Wageningen Agricultural University, 227 pp.
Stern, R.D., M.D. Dennett and I.C. Dale, 1982. Analysing daily rainfall measurements to give agronomically useful results. Part I: Direct methods. Experimental Agriculture 18: 223-236.
Stoop, W.A., H. Lanting and K.V. Ramaiah, 1983. Occurrence of Striga and its possible control in cropping systems in northern Ghana. In: Proceedings of the Second International Workshop on Striga (Ouagadougou, Upper Volta, 1981). ICRISAT, India, pp. 103-107.
Sukhani, T.R. and M.G. Jotwani, 1979. Effect of site of oviposition on shootfly damage to different growth stages of sorghum seedlings. Indian Journal of Entomology 41: 366-370.
Summers, C.G., 1975. Daily adult emergence in the sorghum midge, Contarinia sorghicola. Environmental Entomology 4: 495-498.
Swaine, G. and C.A. Wyatt, 1954. Observations on the sorghum shoot fly. East African Agricultural Journal 20: 45-48.
Taksdal, G. and C.W. Baliddawa, 1975. Studies of the biology of sorghum shoot flies, Atherigona spp. (Muscidae: Diptera), and shoot fly-sorghum host plant relationships. Zeitschrift fur Angewandte Entomologie 79: 239-249.
Taley, Y.M., B.P. Deore and K.R. Thakare, 1971. Bionomics of Contarinia sorghicola Coquillet (Diptera: Cecidomyiidae). Indian Journal of Entomology 33: 202-208.
Teetes, G.L., 1982. Sorghum insect pest management - 1 . In: Sorghum in the eighties, Volume 1. ICRISAT, India, pp. 225-235.
Teetes, G.L., K.V. Seshu Reddy, K. Leuschner and L.R. House, 1983. Sorghum insect identification handbook. Information bulletin 12. ICRISAT, India, 124 pp.
Terry, P.J., 1984. A guide to weed control in East African crops. Kenya Literature Bureau, Nairobi, 186 pp.
Terry, P.J. and R.W. Michieka, 1987. Common weeds of East Africa / Magugu ya Afrika Mashariki. FAO, Rome, 184 pp.
Tripp, R. and J. Woolley, 1989. The planning stage of on-farm research: identifying factors for experimentation. CIMMYT (Mexico) and CI AT (Columbia), 85 pp.
Tveitnes, S. and O. Nyaas-Aakerbakken, 1975. Fertilizer experiments on small cotton farms in Kenya 1968-1971. In: Report on the FAO/NORAD Seminar on Fertilizer Use Development (Kitale, Kenya, 1973). FAO, Rome, pp. 76-96.
Uchendu, V.C. and K.R.M. Anthony, 1975. Agricultural change in Teso district, Uganda. East African Literature Bureau, Nairobi, 115 pp.
279

Vasudeva Rao, M.J., V.L. Chidley, K.V. Ramaiah and L.R. House, 1983. Breeding sorghum with resistance to Striga asiatica (L.) Kuntze at ICRISAT Center. In: Proceedings of the Second International Workshop on Striga (Ouagadougou, Upper Volta, 1981). ICRISAT, India, pp. 61-76.
Vierstra, G. and M. Ndiyoi, 1994. Planning research in an interdisciplinary team: ARPT Western Province, Zambia. In: J.D. Meindertsma (Ed), Setting research priorities -Towards effective farmer-oriented research. RTI, Amsterdam, pp. 160-181.
Virmani, S.M., M.V.K. Siva Kumar and S.J. Reddy, 1982. Rainfall probability estimates for selected locations of semi-arid India. Research Bulletin 1 (second edition). ICRISAT, India, 170 pp.
Walker, J.T. and D.A. Rijks, 1967. A computer programme for the calculation of confidence limits of expected rainfall. Experimental Agriculture 3: 337-341.
Walter, E.V., 1941. The biology and control of the sorghum midge. Technical Bulletin 778. United States Department of Agriculture (Washington, D.C.), 26 pp.
Webster, J.B., D.H. Okalany, C.P. Emudong and N. Egimu-Okuda, 1973. The Iteso during the Asonya. East African Publishing House, Nairobi, 189 pp.
Were, G.S., 1967a. A history of the Abaluyia of Western Kenya, c. 1500-1930. East African Publishing House, Nairobi, 206 pp.
Were, G.S., 1967b. Western Kenya, historical texts; Abaluyia, Teso and Elgon Kalenjin. East African Literature Bureau, Nairobi, 196 pp.
Whiteman, P., 1981a. An agronomist's testimony: changing outlooks towards experimental work. Farming Systems Newsletter 5: 5-12. CIMMYT Eastern Africa Economics Programme, Nairobi.
Whiteman, P., 1981b. Sorghum and millet agronomy investigations in Eastern Province; results and discussion of trials: 1980 Long and Short Rains and 1981 Long Rains. Technical Report AG:DP/KEN/78/016. Kenya Sorghum and Millet Development Project, Machakos, 163 pp.
Whyte, W.F., 1981. Participatory approaches to agricultural research and development: a state-of-the-art paper. Rural Development Committee, Cornell University, Ithaca, New York, 111 pp.
Wielemaker, W.G. and H.W. Boxem (Eds), 1982. Soils of the Kisii area, Kenya. Agricultural Research Reports 922. Centre for Agricultural Publishing and Documentation, Wageningen, 208 pp.
Winston Cone, L. and J.F. Lipscomb, 1972. The history of Kenya agriculture. University Press of Africa, Nairobi, 160 pp.
Wiseman, B.R., N.W. Widstrom and W.W. McMillian, 1972. Flight movements and color preference of the sorghum midge. Journal of Economic Entomology 65: 767-770.
Wiseman, B.R., H.R. Gross, Jr., and W.W. McMillian, 1978. Seasonal distribution of the sorghum midge and its hymenopterous parasites, 1975-77. Environmental Entomology 7: 820-822.
Worman, F., D. Norman and J. Ware-Snyder (Eds), 1990. Farming systems research handbook for Botswana. Agricultural Technology Improvement Project RP 3. Department of Agricultural Research, Gabarone, Botswana, 306 pp.
Young, W.R., 1981. Fifty-five years of research on the sorghum shootfly. Insect Science and its Application 2: 3-9.
Zartman, R.E. and R.T. Woyewodzic, 1979. Root distribution patterns of two hybrid grain sorghums under field conditions. Agronomy Journal 71: 325-328.
280
SUMMARY
This study reports on the methodology, contents and results of a sorghum agronomy research programme in the Busia and Siaya Districts of West Kenya. As a production-oriented programme (1979-82), it was part of the Kenya Sorghum and Millet Development Project. In the target area sorghum is produced as a traditional staple crop on small subsistence holdings. Local farming systems are characterized by a high level of 'insurance cropping'. Hence, appreciation of farmers total circumstances as well as identification of major local problems related to sorghum cropping were required to develop a relevant research programme.
The Project's strategy for sorghum research and development efforts in Kenya in general and in West Kenya in particular is described in Chapter 2. The strategy and experiences of a former sorghum programme implemented by the East African Agriculture and Forestry Research Organization are taken into account. Local sorghum varieties produce coarse brown grains which are high in tannin content. Although the bitter taste increases brewing qualities and bird resistance, it lowers the food quality. It is argued that for the development of commercial sorghum food products for urban and rural markets, high quality sorghum grain from varieties producing either hard white seeds or hard brown seeds, whose tannin-rich seedcoats can easily be removed by mechanical processing, is required.
However, the husbandry of quality sorghum crops differs from that of local varieties. The bird damage risk for quality sorghums often becomes so high that bird scaring is required. It is argued that farmers will not consider growing quality sorghums unless a realistic pricing policy is established. Only then can the trend to substitute sorghum for maize be reversed especially in areas with less reliable rainfall. An integrated long-term strategy to solve these problems is advocated.
However, in the Busia-Siaya area, additional factors at farm level are playing a major role in shaping local farming and cereal cropping systems. Their impact called for an immediate action-oriented sorghum programme within two out of the three identified agro-climatic target zones in West Kenya. The Project developed a short-term strategy on the basis of which a production-oriented research and extension programme was planned and implemented. This thesis focuses on the implementation and results of this production-oriented programme.
Detailed agro-environmental and socio-economic studies (Chapters 3 and 4) show that household management flexibility to assure a reliable food supply during the first-rain cropping season has decreased substantially over the past decennia. Access to ox-plough units has become more difficult due to a decline in numbers of cattle and ploughs. Constraints on seedbed preparation are faced by many households. This has resulted in later plantings and lower crop yields during the first rains. With delayed plantings the actual growing period for crops has shortened. It is argued that local late-maturing varieties of sorghum are less adapted to these changed circumstances. Although an increasing number of farmers attempt to shift part of their cereal crop production to the less reliable second-rain cropping
281

season, currently available local brown-seeded sorghum varieties are not suitable as they take too long to mature. Hence, many farmers plant maize but risk of failure is high; drought-resistant crops are clearly to be preferred.
Based on other farming systems surveys and farm management studies, it is hypothesized (Chapter 5) that introduction of early-maturing sorghum cultivars in both cropping seasons would increase farmers management flexibility, especially for the group of handhoe farmers. This would be even further enhanced if these new sorghums also show good potential for ratoon cropping. The objective of the accompanying agronomy research programme was twofold: (1) to investigate the response of new sorghums to delayed plantings and identify the major factors responsible for possible 'time of planting' effects; (2) to develop an adaptive husbandry package taking the current socio-economic circumstances of local farmers into account. As shortage of labour and capital as well as soil fertility depletion are playing a role, an integrated approach was required.
Chapter 6 reports on the implementation and results of a variety testing programme. Based on results of a multi-locational on-farm trial programme a group of promising brown and white early-maturing sorghum cultivars was identified. These cultivars outyield the local sorghum varieties in both target zones. They also outyield the recommended maize hybrids, especially in the drier target zone. Current hybrids of maize and sorghum are also too sensitive to Striga hermonthica. Among the group of promising early-maturing sorghums, brown cultivars consistently produce better yields than white cultivars. This is due to better adaptation with respect to Striga hermonthica and leaf blight incidence.
Ratoon cropping results show that ratoon survival rates for local late-maturing sorghums are usually higher than for the new early-maturing sorghums. Especially, when post-flowering moisture stress occurs, ratoon survival rates of new sorghums are low. However, the higher survival rates do not always result in higher ratoon grain yields. Due to the short growing season grain filling for local sorghum ratoon crops is more at risk, especially in the drier target zone. Ratooning of early-maturing sorghums may only be recommended when survival rates are high.
When plantings of early-maturing crops are delayed until March, their level of success bears a strong relationship with developments within the agricultural season. This level is not only determined by the length of the remaining growing season, but also by the incidence of pests. Results show that shoot fly and midge damage levels are strongly related to the occurrence and reliability of showers in January-February ('grass rains') and the subsequent onset date of the 'first rains'.
Chapter 7 specifies the factors responsible for the substantial 'time of planting (TOP)' effect for maize and sorghum crops when plantings are delayed. Contrary to the high altitude areas in Kenya, differences in youth growth do not occur when maize and sorghum plantings in the target area are delayed. The TOP effect for maize is strongly related to the length of the remaining growing season. The TOP effect for sorghum results from a process with three different variables viz. length
282

of remaining growing season, shoot fly incidence, and midge incidence. Depending on developments within the agricultural season, three types of seasons for sorghum cropping may be distinguished. In seasons with good grass rains (Type 1) arid moderately to weak grass rains (Type 2) shoot fly and midge populations can build up fast and are mainly responsible for decreased sorghum yields when plantings are delayed. However, in seasons with absent grass rains (Type 3) pest build-up is slow and the length of the remaining growing season is mainly responsible for the TOP effect. Hence, the level of success for late planted crops of early-maturing sorghums (either sown directly or used in gapfilling) may vary greatly between years. Since farmers must play each season by ear, the need for conditional and targeted recommendations on variety use became apparent.
Research on plant population and distribution patterns is described in Chapter 8.1. From a systems perspective populations between 83,000 and 110,000 pl/ha are preferred for grain production of early-maturing cultivars. Depending on farmers objectives spacing between rows may vary from 50 to 90 cm without a substantial effect on grain production. The intra-row planting pattern had no substantial effect on grain production. To reduce labour required for planting and weeding the 'row-hill planting' method with 3 plants/hill is much preferred. It also increases the efficiency of any fertilizer use.
Research on fertilizer use is discussed in Chapter 8.2. Results show that phosphorus (P) is the nutrient mainly limiting sorghum production in the Busia area. Reliability and effectiveness of P fertilizers are substantially increased if they are applied to planting furrows or hills. Current socio-economic conditions restrict P application levels to 20 kg/ha P2Os. Only this level combines stability with acceptable rates of return. However, levels may be raised to 40 kg/ha P205 if farmers adopt a particular land preparation method for second-rain crops. Through 'strip hoeing' the substantial residual effects of P fertilizers are optimized. Application of Nitrogen (N) frequently results in negative effects. Observations on crop flowering indicate that P/N ratios may play a role. In practice, farmers are advised to buy P fertilizer first before any N fertilizer is considered.
Results of weed control and weed composition studies (Chapter 8.3) show that biomass production levels and weed compositions on local fields are strongly related to rotational system practices. The cropping pattern of these fields (e.g. intercropping with beans, relay-cropping with cotton, start and length of fallow period) is mainly determined by soil fertility issues. Phosphorus depletion plays a key role. After some years of intensive cropping, a decrease in soil fertility will induce farmers to shift to more extensive cultivation techniques. The number of weedings are reduced and second-rain crops are no longer grown. This favours a rapid build-up of Striga hermonthica infestation levels. As compatibility of herbicides with current cropping patterns proved to be low, attention focused on handhoe weeding practices. The 'row-hill planting' method was introduced to facilitate rapid weeding and placement of P fertilizer.
Research results on ratooning are presented in Chapter 8.4. They stress that for a satisfactory ratoon performance of new sorghums sufficiently high ratoon plant
283

populations and adequate levels of soil fertility are required. Particularly site conditions favouring post-flowering moisture stress are causing low ratoon survival rates. Efficiency in carbohydrate redistribution plays a key role. When moisture stress occurs, reserves for survival and regrowth are depleted. Management practices such as fertilizer use, time of harvesting, cutting height and ratoon tiller thinning are only of minor importance. The conditionality of ratooning is stressed.
Crops planted in the second rains will face high shoot fly damage levels. Since successful cropping of early-maturing sorghums in the second rains may be the key to a major shift in the local cropping system, attention was focused on introducing cheap methods of shoot fly control. Seed treatments tested (Chapter 8.5) yielded inconclusive results. Some issues need clarification and further research is required.
Chapter 9 describes experiences and results of extension programmes. Two different approaches were used to expose some selected early-maturing sorghum varieties and adaptive husbandry practices to farmers and village extension staff. Results show the ineffectiveness of the on-farm demonstration approach and the effectiveness of the village approach into stimulating farmer participation in the technology development process. Results also confirm most of the on-farm research findings and stress the importance of a reliable start of the first-rain agricultural season for local sorghum cropping possibilities. However, due to the extreme variability in grass rains farmers are forced to play each season by ear. Farmers opinions and crop-cut sampling results and pest incidence observations were used to arrive at suitable recommendations for variety use and husbandry practices as well as to fine-tune their accompanying targeted and conditional clauses.
Attempts to institutionalize system-based adaptive research programmes in the Eastern and Southern Africa region are reviewed in Chapter 10.1. The strengths and weaknesses of the approach to establishing independent Farming Systems Research teams, is discussed. Contrary to other countries in the region, this approach was never adopted in Kenya. Hence, its research establishment remained strongly compartmentalized and little progress was made in expanding the adaptive research capacity. However, recently the Kenya research structure was reorganized. The establishment of Regional Research Centres mandated to conduct integrated and interdisciplinary adapted research programmes provides great opportunities for system-based technology development. The Farming Systems Approach to Research, Extension and Training has been adopted to ensure that research efforts become more demand-driven and farmer-oriented.
Adaptive research programmes must be dynamic and iterative. The need for such a process is stressed (Chapter 10.2) and illustrated by examples and experiences from the West Kenya sorghum programme. Based on the current 'body of knowledge' on sorghum production in Busia-Siaya, a targeted and conditional recommendation package on the use of varieties and optional husbandry practices, is presented. Although it is believed that a valuable package has been developed, it is also believed that the 'target is moving'. Hence, continuous updating and sufficient critical mass are required to develop relevant research programmes.
284

SAMENVATTING
Dit proefschrift handelt over de methodologie, inhoud en resultaten van een landbouwkundig onderzoeksprogramma met sorghum dat uitgevoerd werd in de Busia en Siaya Districten van West Kenia. Dit programma (1979-82) was onderdeel van het 'Kenya Sorghum and Millet Development Project'. In het studiegebied wordt sorghum als een traditioneel stapelgewas geteeld op kleine, op zelfvoorziening gerichte, boerenbedrijven. In de lokale landbouwbedrijfssystemen heeft het veiligstellen van de voedselvoorziening, door middel van de teelt van gewassen met laag risico, prioriteit. Voor de ontwikkeling van een relevant onderzoeksprogramma was het nodig zowel de boerenproblematiek in haar totaliteit als de specifieke problemen in de sorghumteelt te analyseren.
De sorghumonderzoeks- en ontwikkelingsstrategie voor Kenia in het algemeen en voor West Kenia in het bijzonder, wordt beschreven in Hoofdstuk 2. Met de strategic en ervaringen van een voorafgaand sorghumprogramma door de 'East African Agriculture and Forestry Organization' werd sterk rekening gehouden. Lokale sorghumrassen produceren bruin graan van lage kwaliteit en met een hoog tanninegehalte. Alhoewel de bittere smaak de bierbrouwkwaliteit en de vogelresistentie verhoogt, wordt de voedselkwaliteit erdoor verlaagd. Voor de ontwikkeling van commerciele voedselprodukten is graan van hoge kwaliteit nodig. Alleen graanrassen met harde witte korrels of met harde bruine korrels, waarvan de tannine-rijke zaadhuid mechanisch gemakkelijk verwijderd kan worden, kunnen deze kwaliteit leveren.
De teelt van rassen met een hoge graankwaliteit is echter moeilijker dan die van de lokale sorghumrassen. Het risico op vogelschade bij de teelt van deze rassen is vaak zo hoog, dat vogelverschrikken noodzakelijk wordt. Boeren zullen deze teelt dan ook alleen overwegen indien een realistische prijspolitiek gevoerd wordt. Alleen dan kan de trend, om sorghum door mai's te vervangen, omgebogen worden met name in gebieden met onbetrouwbare regenval. Om deze problematiek het hoofd te bieden wordt een gei'ntegreerde, lange-termijn strategic bepleit.
In Busia en Siaya spelen echter additionele factoren op bedrijfsniveau een grote rol. Deze factoren blijken bepalend te zijn voor de huidige inrichting van lokale landbouwbedrijfs- en graanproduktiesystemen. Hun invloed rechtvaardigde de onmiddellijke uitvoering van een actiegericht sorghumonderzoeksprogramma in twee van de drie gei'dentificeerde agro-ecologische zones in West Kenia. Het Project formuleerde een korte-termijn strategic Op basis hiervan werd een produktiegericht onderzoeks- en voorlichtingsprogramma ontwikkeld. Dit proefschrift concentreert zich op de uitvoering en resultaten van dit programma.
Gedetailleerde agro-ecologische en sociaal-economische studies (Hoofdstukken 3 en 4) tonen aan dat, gedurende de laatste decennia, de managementflexibiliteit van huishoudens, om zich te verzekeren van een betrouwbare voedselvoorziening gedurende het eerste regenseizoen, aanzienlijk is afgenomen. Vanwege de afname in aantallen ossen en ploegen is de toegang tot osseploegeenheden moeilijker
285

geworden. Daardoor kennen vele boeren knelpunten gedurende de fase van zaaibedpreparatie. Dit verlaat de inzaai, verkort de beschikbare groeiperiode en resulteert in lagere gewasopbrengsten gedurende het eerste regenseizoen. De lokale, laatrijpende sorghumrassen zijn niet goed aangepast aan deze veranderde omstandigheden. Alhoewel een toenemend aantal boeren graan tracht te produceren in het onbetrouwbare tweede regenseizoen, zijn lokale laatrijpende sorghumrassen ongeschikt vanwege hun te lange groeiduur. Mede hierdoor zaaien vele boeren mai's, alhoewel de kans op mislukking hoog is. Droogteresistente gewassen verdienen duidelijk de voorkeur.
Op basis van onderzoek elders met betrekking tot lokale landbouwsystemen en wijzen van bedrijfsvoering, werd een onderzoekshypothese geformuleerd (Hoofdstuk 5). Deze luidde dat de introductie van vroegrijpende sorghumrassen in beide regenseizoenen de managementflexibiliteit van boeren aanzienlijk zou verhogen, met name voor de groep boeren die aangewezen is op de handhak. Deze flexibiliteit zou nog meer verbeteren indien de nieuwe sorghumrassen ook een goede potentie zouden bezitten voor ratoonteelt. De doelstelling van het daaropvolgende landbouwkundige onderzoeksprogramma was tweeledig: (1) onderzoek naar de gevoeligheid van de nieuwe sorghumrassen voor verlate inzaai en het identificeren van factoren die verantwoordelijk zijn voor mogelijke 'zaaitijd' effecten; (2) ontwikkeling van een pakket aan toegepaste teeltmaatregelen, rekening houdende met de huidige sociaal-economische omstandigheden. Omdat zowel tekorten aan arbeid en kapitaal als uitputting van bodemvruchtbaarheid een rol spelen, was een ge'mtegreerde aanpak noodzakelijk.
Hoofdstuk 6 beschrijft het uitgevoerde rassenonderzoek. Op basis van de vele proefveldresultaten op boerenakkers worden enkele veelbelovende bruine en witte vroegrijpende sorghumrassen geselecteerd. In beide agro-ecologische zones geven zij een hogere graanopbrengst dan de lokale sorghumrassen. Hun opbrengsten zijn ook hoger dan die van de aanbevolen hybride mai'srassen, met name in de drogere zone. De huidige hybride mai's- en sorghumrassen zijn te gevoelig voor het parasitaire onkruid Striga hermonthica. Binnen de groep van geselecteerde vroegrijpende sorghumrassen, produceren de bruine rassen systematisch meer graan dan de witte rassen. Dit komt door hun hogere tolerantie voor Striga hermonthica en de bladziekte Helminthosporium turcicum.
Ratoonteeltonderzoek toont aan dat de stoppeloverlevingskans voor lokale laatrijpende sorghumrassen vaak hoger is dan die voor de geselecteerde vroegrijpende rassen. Met name vochtgebrek na de bloei, verlaagt de kans op overleving van de stoppel bij de nieuwe rassen sterk. De hogere ratoonplantdichtheid van lokale rassen resulteert echter niet altijd in hogere graanopbrengsten. Vanwege het korte tweede regenseizoen en hun langere groeiduur loopt hun korrelvulling meer gevaar met name in de drogere zone. Ratoonteelt voor de nieuwe rassen kan alleen geadviseerd worden als bij het afsnijden van hun Stengels blijkt dat er nog voldoende stoppels in leven zijn.
286

Als de inzaai van vroegrijpende rassen tot maart verlaat wordt, dan wordt hun graanopbrengst sterk bei'nvloed door seizoensafhankelijke factoren. Het blijkt dan dat het opbrengstniveau niet alleen bepaald wordt door de lengte van het resterende regenseizoen, maar dat tevens twee plagen een belangrijke rol kunnen gaan spelen. De kans op schade ten gevolge van Atherigona soccata ('shoot fly') en Contarinia sorghicola ('midge') hangt echter nauw samen met de kans op regenbuien in januari en februari ('gras-regens') en de betrouwbaarheid van het daaropvolgende begin van het eerste regenseizoen.
Hoofdstuk 7 specificeert de factoren, die verantwoordelijk zijn voor het grote zaaitijdeffect dat optreedt wanneer mai's- en sorghumgewassen verlaat ingezaaid worden. In tegenstelling tot de hooglanden van Kenia, blijkt er geen verschil in jeugdgroei op te treden wanneer de inzaai van mai's- en sorghumgewassen in het studiegebied verlaat wordt. Het zaaitijdeffect voor mai's is sterk gerelateerd aan de lengte van het resterende regenseizoen. Het zaaitijdeffect voor sorghum is echter het gevolg van een proces met drie verschillende variabelen: de lengte van het resterende regenseizoen, en de verspreiding van de plagen shoot fly en midge. Afhankelijk van seizoensgebonden factoren, kunnen drie seizoentypes voor sorghumteelt onderscheiden worden. In seizoenen met goede gras-regens (Type 1) en met middelmatige tot slechte gras-regens (Type 2) kunnen shoot fly en midge populaties snel opbouwen. Schade door deze plagen is dan vooral verantwoordelijk voor de enorme daling in graanopbrengst die optreedt als de inzaai verlaat wordt. In seizoenen zonder gras-regens (Type 3), komt de plaagopbouw veel trager op gang. Indien dan verlate inzaai plaatsvindt, wordt de graanopbrengst voornamelijk bepaald door de lengte van het resterende regenseizoen en niet door plaagschade. Door al deze verschillende factoren varieert het jaarlijks succes van laat ingezaaide gewassen aanzienlijk. Aangezien boeren elk seizoen moeten nemen zoals het komt, ontstond er een duidelijke behoefte aan meer gerichte en voorwaardelijke adviezen voor het gebruik van de nieuwe rassen.
Het plantdichtheids- en plantverbandonderzoek wordt beschreven in Hoofdstuk 8.1. Vanuit een systeemperspectief verdienen dichtheden tussen de 83.000 en 110.000 planten/ha voor vroegrijpende graangewassen de voorkeur. Afhankelijk van zijn doelstelling kan de boer de rijafstand varieren tussen de 50 en de 90 cm zonder dat dit de graanopbrengst significant bei'nvloedt. Tevens is het effect van het plantverband in de rij klein. Het dibbelen in rijen verdient echter de voorkeur aangezien dit een arbeidsbesparing oplevert bij het zaaien en wieden. Het aanbevolen plantverband 3 planten/dibbel staat tevens een gemakkelijke toediening van meststoffen toe.
Hoofdstuk 8.2 beschrijft het sorghumbemestingsonderzoek. De resultaten tonen aan dat fosfaat de limiterende factor is in de minerale voeding van lokale gewassen. De betrouwbaarheid en effectiviteit van P-meststoffen worden aanzienlijk verbeterd, wanneer zij toegediend worden in de zaaigeul of dibbel. Door de huidige sociaal-economische omstandigheden moeten P-meststofgiften boven de 20 kg/ha P205
afgeraden worden. Alleen met lage giften zijn stabiliteit en economische
287

rentabiliteit gegarandeerd. Hogere giften (tot 40 kg/ha P205) kunnen alleen aanbevolen worden aan boeren, die grondbewerking in stroken (met behulp van de handhak) toepassen ten behoeve van de verbouw van een gewas in het tweede regenseizoen op dezelfde akker. Hierdoor wordt het residueffect van P-meststoffen beter benut. Toediening van stikstofmeststoffen heeft vaak een negatieve respons tot gevolg. Gewasbloeiwaarnemingen wekken de indruk dat P/N verhoudingen een rol spelen. In de praktijk wordt boeren geadviseerd alleen P-meststoffen te kopen.
Studies op het gebied van onkruidbestrijding en de botanische samenstelling van onkruidpopulaties op lokale akkers (Hoofdstuk 8.3) laten zien dat de totale biomassaproduktie en onkruidsamenstelling op lokale akkers sterk samenhangt met de plaatselijke gebruiken voor rotatie en vruchtwisseling. Het rotatieschema van akkers (bv. tussenteelt van bonen, estafette-teelt van katoen, begin en lengte van de braak periode) wordt vooral bepaald door bodemvruchtbaarheidskwesties. Fosfaatuitputting speelt hierbij de hoofdrol. Na enige jaren van intensieve gewasteelt, dwingt de bodemvruchtbaarheidsafname boeren ertoe om over te gaan op meer extensieve teeltwijzen. Geteelde gewassen worden dan nog maar eenmaal gewied en inzaai in het tweede regenseizoen vindt niet meer plaats. Hierdoor wordt een snelle populatieopbouw van Striga hermonthica mogelijk gemaakt. Omdat de inpassing van herbiciden in huidige teeltsystemen moeilijk bleek te zijn, werd meer aandacht besteed aan het verbeteren van de effectiviteit van het wieden met de lokale handhak. Mede hierdoor werd de dibbelzaaimethode ontwikkeld en gei'ntroduceerd. De methode vergemakkelijkt het wieden van een sorghumgewas aanzienlijk en maakt een gerichte plaatsing van P-meststoffen mogelijk.
Het ratoonteeltonderzoek voor de nieuwe sorghumrassen wordt beschreven in Hoofdstuk 8.4. Ratoonteelt blijkt alleen lonend te zijn, indien er voldoende hergroei optreedt (bevredigende plantdichtheid) en de bodemvruchtbaarheid toereikend is. Opnieuw werd gevonden dat vochtgebrek gedurende de korrelvulling van het gezaaide gewas de overlevingskans van stoppels aanzienlijk vermindert. Alhoewel de nieuwe rassen een grote efficientie kennen bij de translocatie van koolhydraten uit andere weefsels naar de korrels, putten zij bij vochtgebrek ook hun koolhydraatreserves uit, die bestemd zijn voor stoppeloverleving en hergroei. Teeltmaatregelen zoals kunstmestgebruik, keuze van oogsttijdstip, afsnijhoogte, en het uitdunnen van ratoonspruiten, zijn dan van ondergeschikt belang.
Gewassen, die in het tweede regenseizoen ingezaaid worden, zullen altijd veel schade door shoot fly ondervinden. Omdat succesvolle teelt van vroegrijpende sorghumgewassen in het tweede regenseizoen zou kunnen leiden tot een belangrijke verschuiving in het lokale teeltsysteem, werd onderzoek verricht naar introductie van goedkope shoot fly bestrijdingsmethoden. De geteste zaaizaadbehandelingen gaven echter geen eenduidig resultaat. Sommige kwesties vragen om verdere opheldering en nader onderzoek is dus gewenst.
In Hoofdstuk 9 worden de ervaringen en resultaten uit de verschillende voorlichtingsprogramma's gepresenteerd. Twee verschillende methoden werden gebruikt om boeren en dorpsvoorlichters ervaring te laten opdoen met enkele geselecteerde vroegrijpende sorghumrassen en teelttechnieken. De benadering met
288

individuele demonstratievelden bleek een ineffectieve methode te zijn om boeren te betrekken bij het ontwikkelingsproces van nieuwe sorghumtechnologie. De dorpsgerichte benadering daarentegen was een effectieve methode. De resultaten bevestigen de meeste conclusies uit het onderzoeksprogramma en benadrukken het belang van een betrouwbaar begin van het eerste regenseizoen voor de lokale sorghumteelt. De enorme variabiliteit in gras-regens dwingt boeren echter tot seizoensafhankelijke beslissingen. Om hen daarbij te helpen werden op basis van interviews, gewasbemonsteringen en plaagobservaties, meer gedetailleerde adviezen ontwikkeld voor het gebruik van de nieuwe sorghumrassen en ontwikkelde teelttechnieken. Met name de doelgerichtheid en voorwaardelijkheid van de verschillende aanbevelingen werden aangescherpt.
Hoofdstuk 10.1 geeft een overzicht van pogingen in Oost- en Zuid-Afrika om systeem-gerichte toegepaste onderzoeksprogramma's te institutionaliseren. De sterke en zwakke punten van de aanpak om aparte teams te stichten voor landbouwbedrijfssysteemonderzoek, worden besproken. In tegenstelling tot de buurlanden koos men in Kenia nooit voor deze aanpak. Mede daardoor kon de sterke onderverdeling van de landbouwkundige onderzoeksdienst voortduren en werd er weinig voortgang geboekt met de uitbreiding van de toegepaste onderzoekscapaciteit. Onlangs echter werd deze dienst geherstructureerd. De oprichting van Regionale Onderzoek Centra (RRCs), met de specifieke opdracht om op een gei'ntegreerde en interdisciplinaire wijze toegepaste onderzoeksprogramma's uit te voeren, biedt mogelijkheden voor de ontwikkeling van systeem-gerichte technologic De gekozen landbouwbedrijfssysteembenadering voor onderzoek, voorlichting en training, moet er voor zorgen dat meer doelgroep-gerichte onderzoeksinspanningen plaats gaan vinden.
Toegepaste landbouwkundige onderzoeksprogramma's dienen dynamisch en iteratief te zijn. De noodzaak voor deze eigenschappen wordt beschreven in Hoofdstuk 10.2 en geillustreerd met voorbeelden en ervaringen uit West Kenia. Met behulp van de nieuw verkregen inzichten omtrent de lokale sorghumteelt, wordt een doelgericht en voorwaardelijk adviespakket geformuleerd betreffende het gebruik van de nieuwe rassen en ontwikkelde teelttechnieken. Alhoewel dit pakket op zich waardevol is, moet niet vergeten worden dat dit pakket ontwikkeld is voor een 'bewegend doel'. Voldoende kritische massa en regelmatige bijstelling zijn voorwaarden om de relevantie van toegepaste onderzoeksprogramma's te garanderen.
289

CURRICULUM VITAE
Hendrikus Johannes Enserink was born in Eefde, the Netherlands in 1952. He received his secondary education at the 'Baudartius College' in Zutphen and obtained the HBS-B Certificate in 1970. In 1978 he graduated from the Wageningen Agricultural University, the Netherlands, with a major in tropical crop science and minors in grassland husbandry, animal nutrition and tropical animal production. During his studies he spent one year in Kenya and two months in Tunisia to do his MSc research.
After graduating in 1978, he became an associate expert to the UNDP/FAO/Kenya Sorghum and Millet Development Project. Until 1982, he was in charge of a sorghum agronomy programme in West Kenya. In 1983, he joined the Department of Tropical Crop Science of the Wageningen Agricultural University as a research fellow. Besides his PhD work, he developed a short course on Farming Systems Research and Development for MSc students. In 1984, he joined the Wageningen International Agricultural Centre, as a secretary of scientific working group on low-external input agriculture.
Since 1985, he works as an agronomist for the Department of Agriculture and Enterprise Development of the Royal Tropical Institute (KIT), Amsterdam. His main duties comprise: (1) research and consultancies in tropical crop production and farming systems research and development; (2) identification, formulation, implementation and evaluation of agricultural research and development projects.
During this period he worked as a short-term consultant for several international organizations. He was, for instance, involved in an Adaptive Research Planning Team evaluation in Western Province, Zambia (1986, DGIS). He also formulated a sorghum and millet development policy for the Tanzania Government (1986, FAO). From 1988-1992, he was teamleader for the Tanzania/Netherlands Lake Zone Farming Systems Research Project, in Mwanza, Tanzania. Currently, he is a core member of a KIT-team coordinating the support of the Netherlands Government to the National Agricultural Research Project (NARP) of the Kenya Agricultural Research Institute (KARI).
291