2018_AR_S2.pdf - Agronomy Research
268
Agronomy Research Established in 2003 by the Faculty of Agronomy, Estonian Agricultural University Aims and Scope: Agronomy Research is a peer-reviewed international Journal intended for publication of broad- spectrum original articles, reviews and short communications on actual problems of modern biosystems engineering incl. crop and animal science, genetics, economics, farm- and production engineering, environmental aspects, agro-ecology, renewable energy and bioenergy etc. in the temperate regions of the world. Copyright: Copyright 2009 by Estonian University of Life Sciences, Latvia University of Life Sciences and Technologies, Aleksandras Stulginskis University, Lithuanian Research Centre for Agriculture and Forestry. No part of this publication may be reproduced or transmitted in any form, or by any means, electronic or mechanical, incl. photocopying, electronic recording, or otherwise without the prior written permission from the Estonian University of Life Sciences, Latvia University of Life Sciences and Technologies, Aleksandras Stulginskis University, Lithuanian Research Centre for Agriculture and Forestry. Agronomy Research online: Agronomy Research is available online at: http://agronomy.emu.ee/ Acknowledgement to Referees: The Editors of Agronomy Research would like to thank the many scientists who gave so generously of their time and expertise to referee papers submitted to the Journal. Abstracted and indexed: SCOPUS, EBSCO, CABI Full Paper and Thompson Scientific database: (Zoological Records, Biological Abstracts and Biosis Previews, AGRIS, ISPI, CAB Abstracts, AGRICOLA (NAL; USA), VINITI, INIST-PASCAL.) Subscription information: Institute of Technology, EULS St. Kreutzwaldi 56, 51014 Tartu, ESTONIA E-mail: [email protected] Journal Policies: Estonian University of Life Sciences, Estonian Research Institute of Agriculture, Latvia University of Life Sciences and Technologies, Aleksandras Stulginskis University, Lithuanian Institute of Agriculture and Lithuanian Institute of Horticulture and Editors of Agronomy Research assume no responsibility for views, statements and opinions expressed by contributors. Any reference to a pesticide, fertiliser, cultivar or other commercial or proprietary product does not constitute a recommendation or an endorsement of its use by the author(s), their institution or any person connected with preparation, publication or distribution of this Journal. ISSN 1406-894X
-
Upload
khangminh22 -
Category
Documents
-
view
1 -
download
0
Transcript of 2018_AR_S2.pdf - Agronomy Research
Agronomy Research
Established in 2003 by the Faculty of Agronomy, Estonian Agricultural University
Aims and Scope: Agronomy Research is a peer-reviewed international Journal intended for publication of broad-
spectrum original articles, reviews and short communications on actual problems of modern
biosystems engineering incl. crop and animal science, genetics, economics, farm- and production
engineering, environmental aspects, agro-ecology, renewable energy and bioenergy etc. in the
temperate regions of the world.
Copyright: Copyright 2009 by Estonian University of Life Sciences, Latvia University of Life Sciences and
Technologies, Aleksandras Stulginskis University, Lithuanian Research Centre for Agriculture
and Forestry. No part of this publication may be reproduced or transmitted in any form, or by any
means, electronic or mechanical, incl. photocopying, electronic recording, or otherwise without
the prior written permission from the Estonian University of Life Sciences, Latvia University of
Life Sciences and Technologies, Aleksandras Stulginskis University, Lithuanian Research Centre
for Agriculture and Forestry.
Agronomy Research online: Agronomy Research is available online at: http://agronomy.emu.ee/
Acknowledgement to Referees: The Editors of Agronomy Research would like to thank the many scientists who gave so
generously of their time and expertise to referee papers submitted to the Journal.
Abstracted and indexed: SCOPUS, EBSCO, CABI Full Paper and Thompson Scientific database: (Zoological Records,
Biological Abstracts and Biosis Previews, AGRIS, ISPI, CAB Abstracts, AGRICOLA (NAL;
USA), VINITI, INIST-PASCAL.)
Subscription information: Institute of Technology, EULS
St. Kreutzwaldi 56, 51014 Tartu, ESTONIA
E-mail: [email protected]
Journal Policies:
Estonian University of Life Sciences, Estonian Research Institute of Agriculture, Latvia
University of Life Sciences and Technologies, Aleksandras Stulginskis University, Lithuanian
Institute of Agriculture and Lithuanian Institute of Horticulture and Editors of Agronomy
Research assume no responsibility for views, statements and opinions expressed by contributors.
Any reference to a pesticide, fertiliser, cultivar or other commercial or proprietary product does
not constitute a recommendation or an endorsement of its use by the author(s), their institution or
any person connected with preparation, publication or distribution of this Journal.
ISSN 1406-894X

1298
CONTENTS
A. Aboltins, T. Rubina and J. Palabinskis
Shrinkage effect on diffusion coefficient during carrot drying ............................. 1301
P. Adadi, E.G. Kovaleva, T.V. Glukhareva and N.V. Barakova
Production and investigations of antioxidant rich beverage: utilizing Monascus
purpureus IHEM LY2014-0696 and various malts .............................................. 1312
I. Augšpole, M. Dūma and B. Ozola Bioactive compounds in herbal infusions ............................................................. 1322
I. Beitane, G. Krumina–Zemture and M. Sabovics
Effect of germination and extrusion on the phenolic content and antioxidant
activity of raw buckwheat (Fagopyrum esculentum Moench) .............................. 1331
L. Chladek, P. Vaculik and A. Vagova
The measurement of energy consumption during milling different cereals
using the sieve analyses ........................................................................................ 1341
B. Dalecka and L. Mezule
Study of potential PCR inhibitors in drinking water for Escherichia coli
identification ......................................................................................................... 1351
N. Dubrovskaya, O. Savkina, L. Kuznetsova and O. Parakhina
The development of gluten-free sourdough bread technology with rowan
powder ................................................................................................................... 1360
A. Hejtmánková, J. Táborský, V. Kudelová and K. Kratochvílová
Contents of tocols in different types of dry shell fruits ......................................... 1373
D. Herak, C. Mizera, P. Hrabe and A. Kabutey
3D image analysis of the shapes and dimensions of several tropical fruits .......... 1383
T. Kince, E. Straumite, D. Klava, Z. Kruma, K. Abelniece and A. Balgalve
Effects of processing conditions on physical parameters of triticale flakes .......... 1388
O. Krasulya, I. Potoroko, L. Tsirulnichenko, S. Khmelev, V. Bogush and
S. Anandan
Sonochemical effects on food emulsions ............................................................... 1396

1299
Z. Kruma, R. Galoburda, L. Tomsone, I. Gramatina, S. Senhofa, E. Straumite,
D. Klava, T. Kince, I. Cinkmanis, J. Zagorska and D. Kunkulberga
Changes in the nutritional value of breakfast cereals containing germinated
spring grain flakes during storage ......................................................................... 1405
Z. Kruma, E. Straumite, T. Kince, D. Klava, K. Abelniece and A. Balgalve
Influence of technological parameters on chemical composition of triticale
flakes ..................................................................................................................... 1417
G. Krumina–Zemture, I. Beitane and I. Cinkmanis
Flavonoids and total phenolic content in extruded buckwheat products with
sweet and salty taste .............................................................................................. 1425
M.V. Lugova and T.P. Arseneva
Development of the composition and technology of the frozen dessert without
sugar, using sesame flour ...................................................................................... 1435
L. Nilova and S. Malyutenkova
The possibility of using powdered sea-buckthorn in the development of bakery
products with antioxidant properties ..................................................................... 1444
D. Nsengumuremyi, N.V. Barakova, V.A. Romanov, A.S. Mityukov and
A.V. Guzeva
The effect of sapropel extracts on microflora and physicochemical parameters
of Dried Distillers’ Grain ...................................................................................... 1457
А.А. Sabirov, N.V. Barakova and Е.А. Samodelkin
Effect of impact-activating-disintegration treatment on grain protein fraction
of autumn rye ........................................................................................................ 1466
I. Sepelevs and G.A. Reineccius
Encapsulation of Gallic acid in solid lipid core surrounded with maltodextrin
shell ....................................................................................................................... 1475
A. Smejtkova and P. Vaculik
Comparison of power consumption of a two-roll mill and a disc mill ................. 1486
K. Spalvins, K. Ivanovs and D. Blumberga
Single cell protein production from waste biomass: review of various
agricultural by-products ........................................................................................ 1493

1300
J. Táborský, A. Hejtmánková, E. Hlavatá and L. Chládek
A study of dynamics of bitter acids and xanthohumol in hop pellets during
storage ................................................................................................................... 1509
S. Vasiljeva, G. Smirnova, N. Basova and D. Babarykin
Cadmium-induced oxidative damage and protective action of fractioned red
beet (Beta vulgaris) root juice in chickens ............................................................ 1517
J. Vecvagars, D. Bārzdiņa and D. Kairiša
Meat chemical composition of pasture pure lambs and crossbreeds ..................... 1527
R. Zarins, Z. Kruma and I. Skrabule
Optimisation of biologically active compounds ultrasound assisted extraction
from potatoes using response surface methodology ............................................. 1534
R. Zarins, Z. Kruma, L. Tomsone, S. Kampuse, I. Skrabule and I.H. Konosonoka
Comparison of phenolic compounds and antioxidant activity of fresh and
freeze-dried potatoes ............................................................................................. 1546
K. Žolnere, I. Ciproviča, A. Ķirse and I. Cinkmanis
A study of commercial β-galactosidase stability under simulated in vitro
gastric conditions .................................................................................................. 1555

1301
Agronomy Research 16(S2), 1301–1311, 2018
https://doi.org/10.15159/AR.18.112
Shrinkage effect on diffusion coefficient during carrot drying
A. Aboltins1, T. Rubina2,* and J. Palabinskis1
1Latvia University of Life Sciences and Technologies, Faculty of Engineering, Institute
of Agricultural Machinery, J.Cakstes Blv 5, LV-3001 Jelgava, Latvia 2Latvia University of Life Sciences and Technologies, Faculty of Information
Technologies, Department of Computer Systems, Liela 2, LV-3001 Jelgava, Latvia *Correspondence: [email protected]
Abstract. Many studies have been previously carried out on the carrot drying and the undergoing
processes. The developed mathematical models provide an opportunity to gain an understanding
of this complex process and its dynamics. But they are simplified and based on a number of
assumptions, including calculation of diffusion coefficient values. In one of the previous studies,
the authors of this study determined that the diffusion coefficient is linearly dependent on the
moisture concentration with the assumption that the sample's geometric shape does not change.
The aim of this study is to determine the dependence of the diffusion coefficient on the moisture
concentration taking into account the change in sample thickness during the drying experiment.
The experiments were carried out with carrot slices of three different thicknesses: 5 mm, 10 mm
and 15 mm thickness on the film infrared dryer at temperature 40 °C. During the experiments,
measurements of the weight and thickness of the slices were performed. Using the experimental
data the average thickness and diffusion coefficient of slices was calculated depending on the
moisture concentration. Obtained results show that thickness depends linearly on the moisture
concentration. Using experimental data and obtained average values of samples thickness, the
values of diffusion coefficient was calculated. The results indicate that diffusion coefficient value
depend linearly on moisture concentration. Their values are close and tend to zero when the
concentration decreases if the thickness changes are taken into account during the experiment.
Key words: carrot, diffusion coefficient, drying, thickness.
INTRODUCTION
Vegetables are very important for human nutrition. For example, carrot contains
high amount of vitamin, fibre and other valuable nutrients. The importance of carrot is
reflected by its global production. Accordingly to the data available on the World Carrot
Museum website (2018) and MapsOfWorld (2018) the leading producers of carrot are
China, Russia, United States of America, Uzbekistan and Poland. As argue the statistical
office of EU Eurostat (2018) in 2016 the total production of vegetables in the EU was
63.9 million tonnes and the vegetable sector was a key sector in EU agriculture,
weighting 13.7% of EU agricultural output. The most important producers were Spain
(24.1%) and Italy (17.4%). But a year earlier in 2015 the leading supplier of carrots was
Israel (56.8%) in EU (Cicco, 2016). Tomatoes, carrots and onions were the most

1302
important vegetables in 2016. There were produced 5.6 million tonnes of carrots,
including Latvia with its contribution 14.8 thousand tonnes.
Vegetables contain large quantities of water in proportion to their weight that has
important effect on the storage period length (Bastin & Henken, 1997; Rashidi et al.,
2010). Drying is one of most popular food preservation methods that causes moisture
evaporation in the product. Drying provides safety of product longer time in better
quality for consumers and additional economic opportunity for producers.
Many studies have been previously carried out on the food drying (Togrul, 2006;
Srikiatden & Roberts, 2008; Aboltins & Upitis, 2011; Aboltins, 2013; Guinē & Barocca,
2013; Aboltins et al., 2017) and the undergoing processes with the main goal to foster
optimum utilization of financial, physical and human resources. Without knowledge of
drying mechanisms there is no way to predict methods for the improving product quality
(Margaris & Ghiaus, 2007). There are various aspects that must be considered when
drying small fruits and vegetables, whether for the food or nutraceutical and functional
food industries. A system which minimizes exposure to oxidations, light and heat may
help conserve quality of product (Ahmed et al., 2013).
Several studies have been carried out using various types of drying. For example,
Monghanaki et al. (2013) have compared the advantages of microwave drying with
convectional drying methods. While Ahmed with colleagues (2013) has focused upon
conventional and new drying technologies and pre-treatment methods based upon drying
efficiency, quality preservation, and cost effectiveness. But Daymaz & Kucuk (2017)
have investigated drying characteristics of peas in a cabinet dryer at three different
temperatures 55, 65 and 75 °C and constant air velocity of 2 m s-1. They have calculated
the values of effective diffusivity of the pre-treated and control samples.
Research results focused on drying kinetics investigation have shown that drying
rate has strong relationship with drying temperature and drying air velocity (Ndukwu,
2009; Putr & Ajiwiguna, 2017). Drying rate increased with drying temperature and air
velocity, but decrease with drying time at the same drying temperature. In addition Putr
& Ajiwiguna (2017) have concluded that evaporation process needs more energy when
moisture content in the object is low.
The developed mathematical models provide an opportunity to gain an
understanding of complex drying process and its dynamics. Most popular are the models
of thin layer drying. These models allow many physical variables consider as constants
(Aboltins, 2013; Onwude et al., 2016). But they are simplified and based on a number
of assumptions, including calculation of diffusion coefficient values. Several studies
were focused on the influence of shrinkage investigation on drying kinetics. For
example, Dissa et al. (2008) have experimentally established and simulated drying
kinetics and bulk shrinkage of the Amelie mangoes.
Researchers group with Botelho (2011) have verified the effective diffusion
coefficients at temperatures ranged from 50 °C to 100 °C for carrot slices, but Lamharrar
et al. (2017) for Urtica dioica leaves at three temperatures 40, 50, 60 °C. But Aboltins et
al. (2017) have shown that the diffusion coefficient is linearly dependent on the moisture
concentration with the assumption that the sample's geometric shape does not change.
Study results show that the diffusion coefficient increases when the moisture
concentration decreases. It was concluded that for approximate calculation of the
diffusion coefficient value a simplified formula (Hassini et al., 2004) can be used. But

1303
for highest precision, a series formula with a larger number of terms (at least 15 terms)
should be used at small experiment times (Aboltins et al., 2017).
The aim of this study is to determine the dependence of the diffusion coefficient on
the moisture concentration taking into account the change in sample thickness during the
drying experiment.
MATERIALS AND METHODS
Vegetables materials
The research object of current study is fresh carrots (Daucus Carota Sativus) that
were purchased from a local market in Jelgava, Latvia. Before the experiment carrots
were washed under running water, wiped, prepared with a diameter 25 mm and cut into
slices (Fig. 1, a) with three different thicknesses: 5 mm, 10 mm and 15 mm thickness.
Carrots were not peeled and blanched. Each sample contains carrot slices that were
uniformly placed in a single layer on individual tray with a network base.
Experimental procedure and equipment
In order to obtain experimental data carrot samples were dried in the film infrared
dryer (IR) approximately 24 hours at temperature 40 °C (Fig. 1).
The dryer consist of a drying chamber (80 × 50 × 30 cm) with a heat source IR film
(South Korea EXCEL) with total area 0.8 m2 mounted on the top and bottom of the
chamber. The drying temperature of dryer is not more than 40–45 °C with IR film power
140 W m-2.
The experiments were performed with the fan with a total maximum capacity of
100 m3 h-1 and power 15 W, which is placed on the top of the side wall of the equipment,
the air intake holes located on the bottom of the opposite side wall (Fig. 1).
Figure 1. Schematic view of IR dryer: 1 – Body of dryer; 2 – Dryer shelves; 3 – IR drying film;
4 – Fan.
In each experiment, 4 material trays were used for each thickness (Fig. 2), which
were placed in the dryer both shelves.
The drying chamber Memmert was used for the determination of dry matter. After
experiment carrot samples were dried at temperature 105 °C during the remainder of the
experiment until they did not change the weight during the hour in order to obtain dry
1304
matter. During drying process free ventilation was performed. Each tray was weighed
before inserting it in dryer.
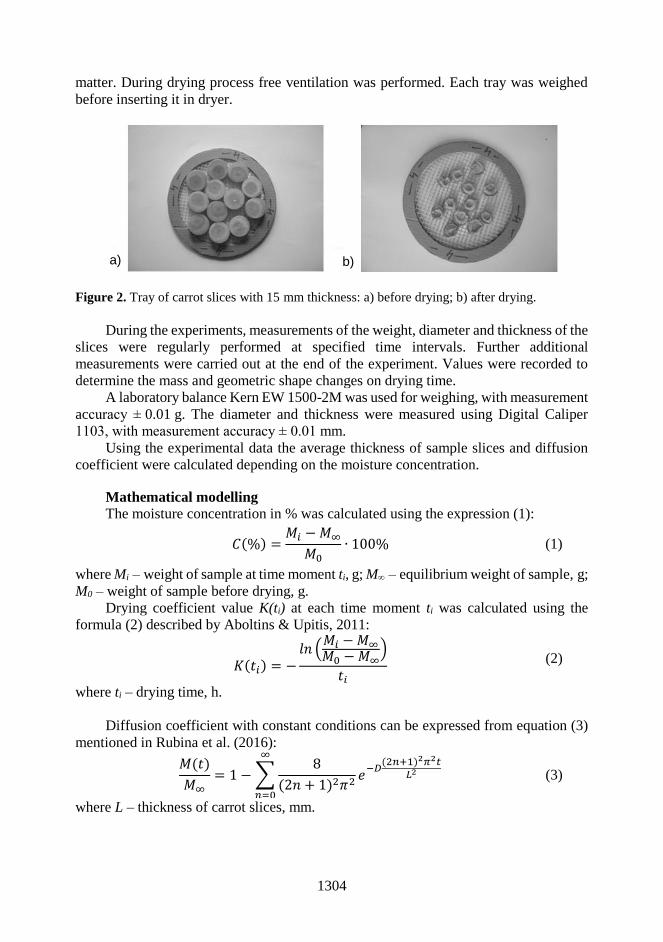
Figure 2. Tray of carrot slices with 15 mm thickness: a) before drying; b) after drying.
During the experiments, measurements of the weight, diameter and thickness of the
slices were regularly performed at specified time intervals. Further additional
measurements were carried out at the end of the experiment. Values were recorded to
determine the mass and geometric shape changes on drying time.
A laboratory balance Kern EW 1500-2M was used for weighing, with measurement
accuracy ± 0.01 g. The diameter and thickness were measured using Digital Caliper
1103, with measurement accuracy ± 0.01 mm.
Using the experimental data the average thickness of sample slices and diffusion
coefficient were calculated depending on the moisture concentration.
Mathematical modelling
The moisture concentration in % was calculated using the expression (1):
𝐶(%) =𝑀𝑖 −𝑀∞
𝑀0∙ 100% (1)
where Mi – weight of sample at time moment ti, g; M∞ – equilibrium weight of sample, g;
M0 – weight of sample before drying, g.
Drying coefficient value K(ti) at each time moment ti was calculated using the
formula (2) described by Aboltins & Upitis, 2011:
𝐾(𝑡𝑖) = −𝑙𝑛 (
𝑀𝑖 −𝑀∞𝑀0 −𝑀∞
)
𝑡𝑖
(2)
where ti – drying time, h.
Diffusion coefficient with constant conditions can be expressed from equation (3)
mentioned in Rubina et al. (2016):
𝑀(𝑡)
𝑀∞= 1 −∑
8
(2𝑛 + 1)2𝜋2
∞
𝑛=0
𝑒−𝐷
(2𝑛+1)2𝜋2𝑡𝐿2 (3)
where L – thickness of carrot slices, mm.
a) b)

1305
Taking the first member of sum (3) (next will be more that 10 time less) and making
simplifications of the obtained expression based on assumption can receive the formula
(4). It can be used to calculate diffusion coefficient value D(ti) at certain moment in time
ti in hours:
𝐷(𝑡𝑖) =𝐾(𝑡𝑖)𝐿
2
𝜋2 (4)
where K(ti) – drying coefficient at time moment ti, h-1; L – thickness of carrot slices, mm.
The area ration was calculated for drying dynamics determination:
𝜆 =𝑆1𝑆2
=2𝜋𝑅2
2𝜋𝑅𝐻=𝑅
𝐻 (5)
where S1 – sum of top and bottom area of sample, mm2; S2 – area of side surface of
sample, mm2; R – half of carrot slices diameter, mm; H – thickness of carrot slices, mm.
Using the experimental data and performing regression analysis the average
thickness of sample slices and diffusion coefficient dependence on the moisture
concentration were determined, as well as moisture concentration C(t,) dependence on
the drying time and area ratio.
Linear and exponential regression equations and coefficient of determination (R2)
were determined using Microsoft Excel. In order to perform nonlinear multivariable
regression analysis and represent analysis results mathematical packages MathCad and
Matlab were used.
RESULTS AND DISCUSSION
Three series of measurements concerning the drying of carrot slices were taken:
one with 5 mm thick sliced carrots, second with 10 mm thick and third with 15 mm thick
sliced carrots with an average diameter of 25 mm ± 0.5 mm.
The evolution of weight for 15 mm thick slices during the drying process is given
in Fig. 3. The scattered points show the values of weight of four trays.
Figure 3. Experimental data of 15 mm thick slices.
1306
Obtained results show that average initial moisture concentration was 94.3% for
5 mm thick carrot slices, 88.3% for 10 mm thick carrot slices and 93.0% for 15 mm thick
carrot slices. During the drying experiment after first 4 hours average moisture
concentration decreases down to 45.4% ± 9.3, 55.5% ± 5.2 and 67.5% ± 4.6 (P = 95%)
accordingly. But after a drying period of 20 hours it reached 4.9% ± 0.6, 7.0% ± 2.5 and
28.9% ± 1.9 in slices with the above mentioned thicknesses appropriately.
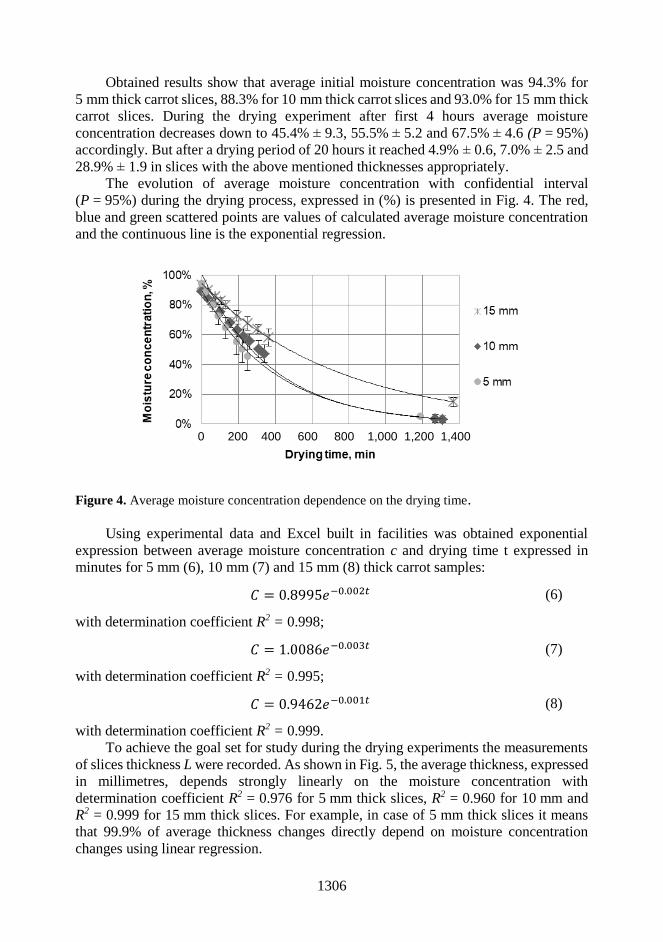
The evolution of average moisture concentration with confidential interval
(P = 95%) during the drying process, expressed in (%) is presented in Fig. 4. The red,
blue and green scattered points are values of calculated average moisture concentration
and the continuous line is the exponential regression.
Figure 4. Average moisture concentration dependence on the drying time.
Using experimental data and Excel built in facilities was obtained exponential
expression between average moisture concentration c and drying time t expressed in
minutes for 5 mm (6), 10 mm (7) and 15 mm (8) thick carrot samples:
𝐶 = 0.8995𝑒−0.002𝑡 (6)
with determination coefficient R2 = 0.998;
𝐶 = 1.0086𝑒−0.003𝑡 (7)
with determination coefficient R2 = 0.995;
𝐶 = 0.9462𝑒−0.001𝑡 (8)
with determination coefficient R2 = 0.999.
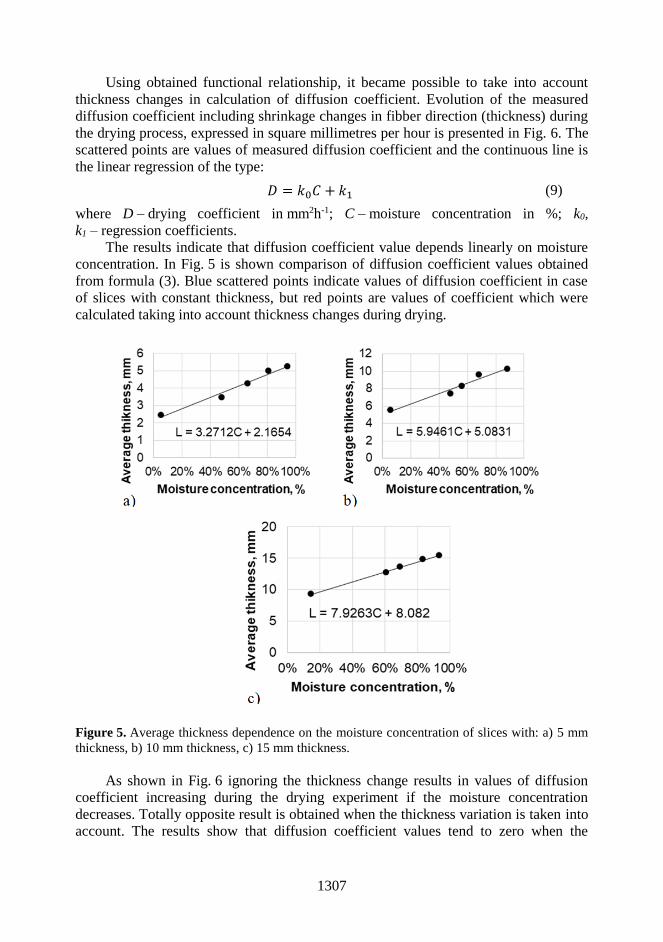
To achieve the goal set for study during the drying experiments the measurements
of slices thickness L were recorded. As shown in Fig. 5, the average thickness, expressed
in millimetres, depends strongly linearly on the moisture concentration with
determination coefficient R2 = 0.976 for 5 mm thick slices, R2 = 0.960 for 10 mm and
R2 = 0.999 for 15 mm thick slices. For example, in case of 5 mm thick slices it means
that 99.9% of average thickness changes directly depend on moisture concentration
changes using linear regression.
0 200 400 600 800 1,000 1,200 1,400
1307
Using obtained functional relationship, it became possible to take into account
thickness changes in calculation of diffusion coefficient. Evolution of the measured
diffusion coefficient including shrinkage changes in fibber direction (thickness) during
the drying process, expressed in square millimetres per hour is presented in Fig. 6. The
scattered points are values of measured diffusion coefficient and the continuous line is
the linear regression of the type:
𝐷 = 𝑘0𝐶 + 𝑘1 (9)
where D – drying coefficient in mm2h-1; C – moisture concentration in %; k0,
k1 – regression coefficients.
The results indicate that diffusion coefficient value depends linearly on moisture
concentration. In Fig. 5 is shown comparison of diffusion coefficient values obtained
from formula (3). Blue scattered points indicate values of diffusion coefficient in case
of slices with constant thickness, but red points are values of coefficient which were
calculated taking into account thickness changes during drying.
Figure 5. Average thickness dependence on the moisture concentration of slices with: a) 5 mm
thickness, b) 10 mm thickness, c) 15 mm thickness.
As shown in Fig. 6 ignoring the thickness change results in values of diffusion
coefficient increasing during the drying experiment if the moisture concentration
decreases. Totally opposite result is obtained when the thickness variation is taken into
account. The results show that diffusion coefficient values tend to zero when the

1308
concentration decreases if the material thickness changes are taken into account during
the experiment.
Figure 6. Diffusion coefficient dependence on the moisture concentration of slices taking and
not taking into account the change in thickness during drying with: a) 5 mm thickness, b) 10 mm
thickness, c) 15 mm thickness.
Taking into account thickness changes it is became possible to describe more
precisely diffusion process and its dependence on moisture concentration. Moreover
during drying not only shrinkage changes in fibre direction takes place, but also changes
in side direction. It means that surface area influences diffusion process. In order to take
into consideration the effect of surface area on the moisture concentration changes
during drying the area ratio coefficient was introduced. Area ratio describes ratio
between sum of basic surface area and area of side surface (4).

1309
Using experimental data and mathematical packages MathCad and Matlab
capabilities was obtained nonlinear multivariable expression between moisture
concentration C(t,), drying time t (hours) and carrot samples area ratio (10) at drying
temp erature 40 C:
𝐶(𝑡, 𝜆) = 106.3 − 3.43𝑡 + 0.014𝑡2 − 27.7𝜆 + 7.41𝜆2 − 0.5𝑡𝜆 (10)
with determination coefficient R2 = 0.93.
Graphically, this relationship is presented in Fig. 6. It can be seen that at given
situation, removal of moisture occurs most rapid if the thickness of the samples is close
to the diameter of the sample. It is interesting because the minimum surface of the
cylinder at a certain volume is in a situation where its height is equal to the diameter
Figure 6. Moisture concentration dependence on the drying time and area ratio.
CONCLUSIONS
Study have shown that, in theoretical description, modelling of the drying process
must take into account the dimensional changes in the product itself during the drying
process. As the product (carrot cylinder) thickness increases, the effect of its moisture
on the thickness changes in the drying process increases: from 3.2 to 5 mm thick to 7.9
to 15 mm thick. Using the obtained results it is possible to determine more precisely the
variability of the product's diffusion coefficient, which depends on the moisture content
of the product. Since weighing results in a common change in moisture, then the precise
study of the diffusion problem requires the effect of the surface of the product on the
Drying time, h Moisture , %
Are
a r
ati
o
0 2 4 6 8 10 120.5
1
1.5
2
2.5
3
30
40
50
60
70
80
1310
drying process, especially if the diffusion in the direction of the fibres (top and bottom)
is not the same in the perpendicular direction (side of cylinder).
REFERENCES
Margaris, D. & Ghiaus, A-G. 2008. Fruits and Vegetables dehydration in tray dryers. In: New
food engineering research trends. New York, pp. 45–101.
Aboltins, A. 2013. Theoretical study of material drying coefficient. Proceedings of International
Scientific Conference Engineering for Rural Development, Latvia University of
Agriculture, Jelgava, Latvia, pp. 153–158.
Aboltins, A., Rubina, T. & Jotautiene, E. 2017. Diffusion coefficient estimation difficulties at the
beginning of drying experiment. Proceedings of International Scientific Conference
Engineering for Rural Development, Latvia University of Agriculture, Jelgava, Latvia,
pp. 153–158.
Aboltins, A. & Upitis, A. 2011. The mathematical model of carrot slices drying. Scientific
journal: Agricultural Engineering 36(2), 69–75.
Ahmed, N., Singh, J., Chauhan, H., Gupta, P., Anjum, A. & Kour, H. 2013. Different drying
methods: their applications and recent advances. International Journal of food nutrition and
safety 4(1), 34–42.
Agricultural production – crops. 2017. http://ec.europa.eu/eurostat/statistics-
explained/index.php?title=Agricultural_production_-_crops&oldid =366 258. Accessed
27.01.2018.
Bastin, S. & Henken, K. 1997. Water content of fruits and vegetables. University of Kentucky:
Colleague of Agriculture, 1 p.
Botelho, F., Correa, P., Goneli, A., Martins, M., Magalhaes, F. & Camoos, S. 2011. Periods of
constant and falling-rate for infrared drying of carrot slices. Rev. bras. agric. Ambient.
15(8), 845–852.
Cicco, A. 2016. The fruit and vegetable sector in the EU - a statistical overview.
http://ec.europa.eu/eurostat/statistics-explained/index.php/The_fruit_and_vegetable_
sector_in_the_EU_-_a_statistical_overview. Accessed 27.01.2018.
Dissa, A., Desmorieux, H., Bathiebo, J. & Koulidiati, J. 2008. Convective drying characteristics
of Amelie mango (Mangifera Indica L. cv. ‘Amelie’) with correction for shrinkage. Journal
of Food Engineering 88, 429–437.
Daymaz, I. & Kucuk, I. 2017. Pretreatments and temperature effects on the drying kinetics of
peas. Bulgarian Chemical Communications 49(1), 90–97.
Guinē, R. & Barocca, M. 2013. Estimation of the Diffusivities and Mass transfer Coefficients for
the Drying of D.Joaguina Pears. Proceedings of the World Congress on Engineering,
London, U.K., July 3–5, 2, 1–4.
Hassini, L., Azzouz, S. & Belghith, A. 2004. Estimation of the moisture diffusion coefficient of
potato during hot-air drying. Proceedings of the 14th International Drying Symposium (IDS
2004), São Paulo, Brazil, Vol. B, 22–25 August, pp. 1488–1495.
Lamharrar, A., Idlimam, A., Alouani, A. & Kouhila, M. 2017. Modelling of thin layer solar
drying kinetics and effective diffusivity of Urtica dioica leaves. Journal of Engineering
Science and Technology 12(8), 2141–2153.
Moghanaki, S., Khoshandam, B. & Mirhal, M. 2013. Calculation of moisture content and drying
rate during microwave drying. Applied Mechanics and Materials 423–426, 746–749.
Ndukwu, M. 2009. Effect of drying temperature and drying air velocity on the drying rate and
drying constant of cocoa bean. Agricultural Engineering International: the CIGR Ejournal
11, 1–7.
1311
Onwude, D., Norhashila, H., Rimfiel, J., Nawi, N. & Khalina, A. 2016. Modeling the thin-layer
drying of fruits and vegetables: A review, Comprehensive reviews in food science and food
safety 15, 1327–1332.
Putr, R. & Ajiwiguna, T. 2017. Influence of air temperature and velocity for drying process.
Procedia Engineering 170, 516–519.
Rashidi, M., Ranjbar, I., Gholami, M. & Abbassi, S. 2010. Prediction of Carrot Firmness Based
on Carrot Water Content. American-Eurasian J. Agric. & Environ. Sci. 7(4), 402–405.
Rubina, T., Aboltins, A., Palabinskis, J. & Jasinskas, A. 2016. Potatoes drying dynamics research.
Proceedings of International Scientific Conference Engineering for Rural Development,
Latvia University of Agriculture, Jelgava, Latvia, pp. 187–192.
Srikiatden, J. & Roberts, J.S. 2008. Predicting moisture profiles in potato and carrot during
convective hot air drying using isothermally measured effective diffusivity. Journal of Food
Engineering 84, 516–525.
Togrul, H. 2006. Suitable drying model for infrared drying of carrot. Journal of Food Engineering
77(93), 610–619.
Top 10 Carrot Producing Countries. https://www.mapsofworld.com/world-top-ten/carrot-
producing-countries.html. Accessed 31.01.2018.
World carrot production statistics on the World Carrot Museum website. 2013.
http://www.carrotmuseum.co.uk/worldcarrots.html. Accessed 30.01.2018.
1312
Agronomy Research 16(S2), 1312–1321, 2018
https://doi.org/10.15159/AR.18.028
Production and investigations of antioxidant rich beverage:
utilizing Monascus purpureus IHEM LY2014-0696 and
various malts
P. Adadi1,*, E.G. Kovaleva2, T.V. Glukhareva2 and N.V. Barakova1 1Department of Food Biotechnology for Plant Origin Products, Faculty of Food
Biotechnologies and Engineering, ITMO University, Lomonosova street 9, RU191002,
St. Petersburg, Russia 2Department of Technology for Organic Synthesis, Institute of Chemical Engineering,
Ural Federal University, Mira street 19, RU620002 Yekaterinburg, Russia *Correspondence: [email protected]
Abstract. Antioxidant evokes numerous health benefits to the consumer as well as stabilisation
of the beverages flavours. Therefore, this paper provides detailed information on the application
of Monascus purpureus IHEM LY2014-0696 in combination with various malts in brewing
antioxidant rich beverage (ARB). Starter culture Angkak was prepared by solid state
bioprocessing (SSB). Single infusion method of mashing was used. Physicochemical parameters,
volatile compounds, DPPH (2, 2-diphenyl-1-picrylhydrazyl) radical scavenging activity and
fermentability of the wort were evaluated. Distillation procedure based on pycnometry technique
was use to quantify the alcohol content (%ABV). Fermentability of the wort was found to be
97.6 ± 0.46% whilst %ABV was equal to 5.42 ± 0.03. It was observed that ARB showed a
strong DPPH radical scavenging activity of 1.00 × 10⁻⁴ mol × equ (R2 = 0.91) whereas
3.43 × 10⁻⁵ mol × equ (R2 = 0.81) for wort. The strong antioxidant activity (AOA) is thought to
be caused by pigments produced by M. purpureus IHEM LY2014-0696 and other compounds
originated from the malts and hops utilised in brewing ARB. A total of 4 volatile compounds
were identified in the present study. Incidence of microbial load ranged from 2.14 ± 0.04 × 10⁷
and 0.8 ± 0.1 × 10⁵ for M. purpureus IHEM LY2014-0696 and bacterial respectively was
observed in the ARB. This study contradicts some previous ones, as the ARB brewed did not take
the red pigment produced by the M. purpureus. Panellists generally expressed their acceptance
for the ARB as they assessed it as a new product, moreover, taking account its health benefits.
Key words: Volatile compounds, Fermentability, Angkak, Solid state bioprocessing, Pigments
INTRODUCTION
The genus Monascus, subdivided into four species: M. pilosus, M. purpureus,
M. ruber and M. floridanus, belongs to the family Monascaceae, the order Eurotiales,
the class Ascomycetes, the phylum Ascomycota, and the kingdom Fungi (Hawksworth
& Pitt, 1983; Barnard & Cannon, 1987; Lin et al., 2005), can be cultured on a substrate
containing starch. These starches are broken into different metabolites. The pigments
from which any product fermented with Monascus species derives its distinctive red
1313
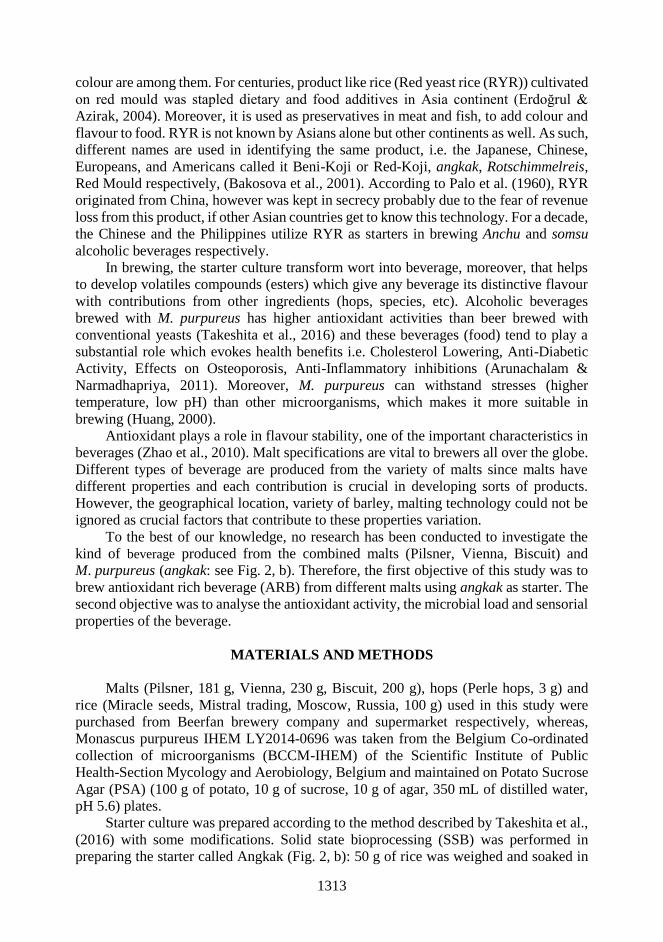
colour are among them. For centuries, product like rice (Red yeast rice (RYR)) cultivated
on red mould was stapled dietary and food additives in Asia continent (Erdoğrul &
Azirak, 2004). Moreover, it is used as preservatives in meat and fish, to add colour and
flavour to food. RYR is not known by Asians alone but other continents as well. As such,
different names are used in identifying the same product, i.e. the Japanese, Chinese,
Europeans, and Americans called it Beni-Koji or Red-Koji, angkak, Rotschimmelreis,
Red Mould respectively, (Bakosova et al., 2001). According to Palo et al. (1960), RYR
originated from China, however was kept in secrecy probably due to the fear of revenue
loss from this product, if other Asian countries get to know this technology. For a decade,
the Chinese and the Philippines utilize RYR as starters in brewing Anchu and somsu
alcoholic beverages respectively.
In brewing, the starter culture transform wort into beverage, moreover, that helps
to develop volatiles compounds (esters) which give any beverage its distinctive flavour
with contributions from other ingredients (hops, species, etc). Alcoholic beverages
brewed with M. purpureus has higher antioxidant activities than beer brewed with
conventional yeasts (Takeshita et al., 2016) and these beverages (food) tend to play a
substantial role which evokes health benefits i.e. Cholesterol Lowering, Anti-Diabetic
Activity, Effects on Osteoporosis, Anti-Inflammatory inhibitions (Arunachalam &
Narmadhapriya, 2011). Moreover, M. purpureus can withstand stresses (higher
temperature, low pH) than other microorganisms, which makes it more suitable in
brewing (Huang, 2000).
Antioxidant plays a role in flavour stability, one of the important characteristics in
beverages (Zhao et al., 2010). Malt specifications are vital to brewers all over the globe.
Different types of beverage are produced from the variety of malts since malts have
different properties and each contribution is crucial in developing sorts of products.
However, the geographical location, variety of barley, malting technology could not be
ignored as crucial factors that contribute to these properties variation.
To the best of our knowledge, no research has been conducted to investigate the
kind of beverage produced from the combined malts (Pilsner, Vienna, Biscuit) and
M. purpureus (angkak: see Fig. 2, b). Therefore, the first objective of this study was to
brew antioxidant rich beverage (ARB) from different malts using angkak as starter. The
second objective was to analyse the antioxidant activity, the microbial load and sensorial
properties of the beverage.
MATERIALS AND METHODS
Malts (Pilsner, 181 g, Vienna, 230 g, Biscuit, 200 g), hops (Perle hops, 3 g) and
rice (Miracle seeds, Mistral trading, Moscow, Russia, 100 g) used in this study were
purchased from Beerfan brewery company and supermarket respectively, whereas,
Monascus purpureus IHEM LY2014-0696 was taken from the Belgium Co-ordinated
collection of microorganisms (BCCM-IHEM) of the Scientific Institute of Public
Health-Section Mycology and Aerobiology, Belgium and maintained on Potato Sucrose
Agar (PSA) (100 g of potato, 10 g of sucrose, 10 g of agar, 350 mL of distilled water,
pH 5.6) plates.
Starter culture was prepared according to the method described by Takeshita et al.,
(2016) with some modifications. Solid state bioprocessing (SSB) was performed in
preparing the starter called Angkak (Fig. 2, b): 50 g of rice was weighed and soaked in
1314
200 mL distilled water in a 300 mL Erlenmeyer flask for 1 hour. It was then, drained,
and autoclaved at 121 °C for 15 min. Autoclaved rice was cooled to ambient temperature
and transferred into a plastic Petri dish (Fig. 2, a). M. purpureus IHEM LY2014-0696
(0.2 g) colonies on the PSA plate was cut off with the aid of using a sterile knife and
inoculate onto the autoclave rice, and incubated at 30 °C for 6 days to prepare the angkak
seed. Again, 50 g of rice was weighed and soaked in 200 mL distilled water for 1 hour
then drained, and autoclaved at 121 °C for 15 min. Autoclave rice was once again cooled
to an ambient temperature and transferred into plastic Petri dish. 10 g of angkak seed
was uniformly mixed with the steam rice with the aid of sterile spatula under lamina
flow hood. The mixture was then incubated at 32 °C with 90% humidity for 5 days. The
resulting red rice (angkak) was then soaked in 100 mL distilled water for 3 days at room
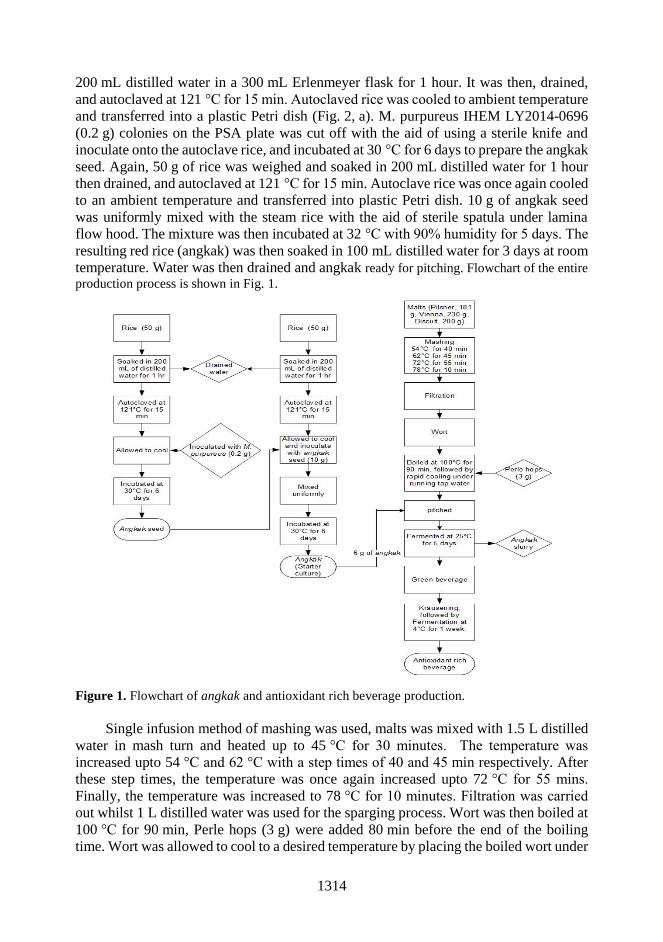
temperature. Water was then drained and angkak ready for pitching. Flowchart of the entire
production process is shown in Fig. 1.
Figure 1. Flowchart of angkak and antioxidant rich beverage production.
Single infusion method of mashing was used, malts was mixed with 1.5 L distilled
water in mash turn and heated up to 45 °C for 30 minutes. The temperature was
increased upto 54 °C and 62 °C with a step times of 40 and 45 min respectively. After
these step times, the temperature was once again increased upto 72 °C for 55 mins.
Finally, the temperature was increased to 78 °C for 10 minutes. Filtration was carried
out whilst 1 L distilled water was used for the sparging process. Wort was then boiled at
100 °C for 90 min, Perle hops (3 g) were added 80 min before the end of the boiling
time. Wort was allowed to cool to a desired temperature by placing the boiled wort under

1315
running cold water. Wort was then transferred into 5 L sterilized improvised fermenter
(Fig. 3) equipped with airlock bubbler. The entire processes of ARB production is shown
in Fig. 1 as well.
Figure 2. Autoclaved rice (a) and rice cultured with M. purpureus IHEM LY2014-0696
(angkak) (b).
Angkak (6 g) was measured under
lamina flow hood, pitched and mixed
thoroughly with the wort. Fermentation was
carried out at a temperature of 25 °C for 5
days. Filtration was performed to separate
green beverage from the fermented angkak.
Kräusening was practice to carbonate the
green beverage, where 2 mL of sterile wort
was added to green beverage and ferment at
4 °C for 1 week. The matured beverage was
termed antioxidant rich beverage (ARB).
Physicochemical parameters (oBrix,
Titratable acidity (TA), colour), volatile
compounds composition and DPPH (2, 2-
diphenyl-1-picrylhydrazyl) radical scavenging
activity were evaluated according to the
method described by Adadi et al. (2017b).
Alcohol content (%ABV) was quantified by
Figure 3. Hand-made fermenter for
fermentation of wort pitched with
angkak.
distillation technique using pycnometry method (GOST, 2011). Fermentability of the
wort was determined according to formula stated by (Briggs et al., 2004).
Serial dilution was performed mixing 1 mL of ARB with 9 mL of sterile peptone
physiological saline solution (5 g peptone, 8.5 g NaCl, and 1,000 mL distilled water,
pH = 7.0) and homogenized with the help of pipette. Decimal dilutions were plated.
Aerobic mesophiles were enumerated by pour plate on nutrient agar (15 g peptone, 3 g
yeast extract, 6 g NaCl, 1 g dextrose and 12 g agar, pH = 7.5) and brain heart infusion
agar (HiMedia, Vadhani, India) incubated (Memmert GmbH, model 30-1060, Germany)
at 30 °C for 3 days. M. purpureus IHEM LY2014-0696 was enumerated by spread plate
on PSA and incubated at 25 °C for 5 days. Plates with countable colonies (30–300 colony
a) b)

1316
forming units (cfu)) were removed and counted according to the method describe by
Adadi & Obeng (2017). Sensorial analysis was performed according to previous method
use in Adadi et al. (2017a) and Adadi et al. (2017b).
The data were statistically analyzed by Origin statistical software (version 8.1).
Values were presented as mean ± standard deviation (S.D.). One-way ANOVA and
Fisher test were conducted to test the means results for sensory analysis at 5%
significance.
RESULTS AND DISCUSSION
Changes in physiochemical parameters (pH, titratable acidity, oBrix, colour,
fermentability and ABV) of the wort and final beverage are shown in Table 1. There was
a gradual decrease in average pH value from 5.53 ± 0.06 to 4.57 ± 0.06 for wort and final
beverage respectively. TA increased from 0.83 ± 0.01 to 1.88 ± 0.02% for wort and
beverage. Substance in wort and beer can affect their buffering abilities, notable the
residue of proteins like aspartate and glutamate (Bamforth, 2001). According to Adadi
et al. (2017b), utilisation of substrate in wort and accumulation of metabolites is
responsible for fluctuations in TA.
Table 1. Physicochemical characteristics of wort and antioxidant rich beverage
Parameters Wort beverage
pH 5.53 ± 0.06 4.57 ± 0.06
Titratable acidity (%) 0.83 ± 0.01 1.88 ± 0.02 oBrix 13.8 ± 0.17 0.33 ± 0.58
Colour (EBC units) 47.7 ± 0.13 33.5 ± 0.24
Alcohol (% ABV) N.A 5.42 ± 0.03
Fermentability (%) 97.6 ± 0.46 N.A
N.A-not applicable, (n = 3).
The enzyme GOX in M. purpureus IHEM LY2014-0696 could produce gluconic
acid, which might affect the pH and subsequently TA. Dimerumic and γ-aminobutyric
acids found in M. purpureus fermented products could contribute to the fluctuation of
both the pH and TA (Aniya et al., 2000; Su et al., 2003).
According to Briggs et al. (2004) starter culture (angkak) transforms simple sugars
in wort to alcohol. oBrix measures amount of sugar in wort and since starters utilize these
sugars a decrease was observed from 13.8 ± 0.17 to 0.33 ± 0.58 for wort and final beer
respectively.
It was observed during the fermentation that; the fermenting wort was hazy due to
the activity of M. purpureus IHEM LY2014-0696. Furthermore, a thick-light layer was
seen covering the surface of the fermenting wort after 24 hours of fermentation time,
which probably might be the mycelium of the M. purpureus IHEM LY2014-0696. In
our previous works (Adadi et al., 2017a; Adadi et al., 2017b), we did not observed any
layer, when we were working with conventional starters (S. cerevisiae and Kölsch
Yeast). The mycelium could alter the colour of the fermenting wort. There was a change
in colour from 47.7 ± 0.13 to 33.5 ± 0.24 EBC units for wort and beverage respectively
which differs averagely (P < 0.05). After the end of primary fermentation, it was
observed that, angkak settled at the bottom of the fermenter.
1317
The alcohol content (% ABV) 5.42 ± 0.03 was measured in the present study.
Takeshita and his colleagues, also measured alcohol (% v v-1) 8, 7.9 and 8.6 when they
brewed their alcoholic beverages using polished rice, wild rice and black rice
respectively (Takeshita et al., 2016). It was noted that, the kind of starting raw material,
affected the ethanol content of the final beer. Variety of starters (yeast, bacteria or fungi)
utilizes nutrients in wort to support growth, generate energy (Boulton & Quain, 2007) in
other to transform wort to beverage.
Fermentability of the wort was found to be 97.6 ± 0.46% in this study (Table 1).
This percentage indicates that not all the sugar in the wort was consumed by the
M. purpureus IHEM LY2014-0696. Inability of conventional yeasts to ferment wort
100% was report by MacWilliam (1968) when various wort from different countries
were used in his work. The procedure and material used to produce wort make it
inexorable that is complex was not well characterised. Sugar spectra in these wort differs
(Hoekstra, 1974), likewise their fermentability. Fraction of unfermentable sugars
(dextrins) accounts roughly 25% in wort. However, it involves both mono (arabinose,
xylose and ribose) and trisaccharides (panose and isopanose and β-glucans).
Unfermented substances are inevitable in brewing process as majority of α-(1 -6)
linkages of malt amylopectin survive wort production intact (Enevoldsen & Schmidt,
1974).
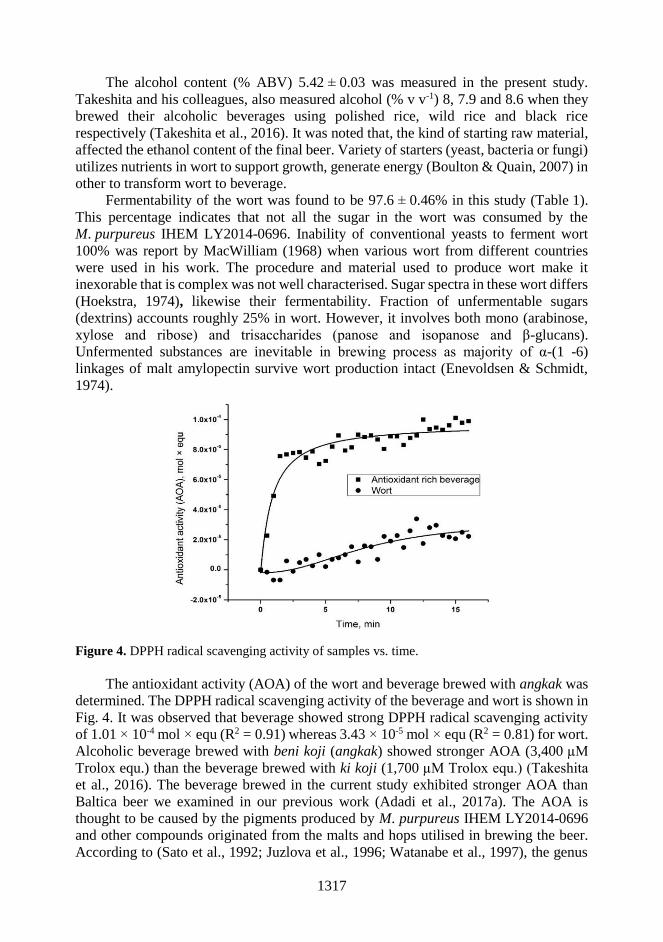
Figure 4. DPPH radical scavenging activity of samples vs. time.
The antioxidant activity (AOA) of the wort and beverage brewed with angkak was
determined. The DPPH radical scavenging activity of the beverage and wort is shown in
Fig. 4. It was observed that beverage showed strong DPPH radical scavenging activity
of 1.01 × 10⁻⁴ mol × equ (R2 = 0.91) whereas 3.43 × 10⁻⁵ mol × equ (R2 = 0.81) for wort.
Alcoholic beverage brewed with beni koji (angkak) showed stronger AOA (3,400 µM
Trolox equ.) than the beverage brewed with ki koji (1,700 µM Trolox equ.) (Takeshita
et al., 2016). The beverage brewed in the current study exhibited stronger AOA than
Baltica beer we examined in our previous work (Adadi et al., 2017a). The AOA is
thought to be caused by the pigments produced by M. purpureus IHEM LY2014-0696
and other compounds originated from the malts and hops utilised in brewing the beer.
According to (Sato et al., 1992; Juzlova et al., 1996; Watanabe et al., 1997), the genus
1318
Monascus produced six pigments (rubropunctatin, monascorubrin, rubropunctamine,
monascorubramine, monascin and ankaflavin) of polyketide origin which are grouped
into 3 major categories.
Monacolin K, γ-aminobutyric acid (GABA), and dimerumic acid (antioxidant)
were found in food fermented by M. purpureus (Aniya et al., 2000; Su et al., 2003) and
are thought to have AOA. Antioxidants are related with the prevention of cardiovascular,
neurological diseases, cancer and oxidative stress dysfunction (Bolck, 1992; Diplock,
1995). AOA of beverage decreases as the storage time increases and this phenomenon
was observed by Ditrych et al. (2015).
A total of 4 volatile compounds were identified in the presented study (Table 2).
Among the volatiles identified 3 were alcohols and 1 ester. These compounds are thought
to contribute to flavour of beverage and their availability depends on raw material,
mashing style, and fermentation conditions under which the beverage is produced (Adadi
et al., 2017a; Adadi et al., 2017b).
Table 2. Volatile compounds identified from antioxidant rich beverage
No Volatile compounds Retention time (min) Formular
1 Ethanol 1.51 C2H6O
2 2-Methyl-1-propanol 2.27 C4H10O
3 Ethyl Acetate 2.31 C4H8O2
4 3-methyl-1-Butanol 3.27 C5H12O
According to Briggs et al. (2004) yeast metabolites, which contribute to beverage
flavour, are diversed chemically and consisted of organic acids, medium chain-length
aliphatic alcohols (‘fusel alcohols’), aromatic alcohols, esters, carbonyls and various
sulphur-containing compounds. It could be obvious that the metabolites produced by
M. purpureus IHEM LY2014-0696 during fermentation turned to have an inhibitory
effect on the formation of these volatiles. Moreover, we practiced Kräusening during the
carbonation, this can be another factors why we identified 4 volatiles in this study.
Bottles lacks the ability to hold all the gases and volatiles formed during the secondary
fermentation as keg, hence the volatiles formed ended up escaping from the bottle (due
to pressure built up by the gases formed). In our previous works, 32 volatile were
identified in Kölch fruit beer (KFB), (Adadi et al., 2017b) whereas 11 in low alcoholic
beer and, 22 sorghum beer (Adadi et al., 2017a) which were all carbonated using kegs.
The incidence of microbial load ranged from 2.14 ± 0.04 × 10⁷ and 0.8 ± 0.1 × 10⁵
CFU mL-1 for M. purpureus IHEM LY2014-0696 and bacterial respectively (Table 3) in
the ARB. The incidence of M. purpureus IHEM LY2014-0696 was shown to be higher
than the bacterial load but theren’t significantly difference (P > 0.05). M. purpureus
IHEM LY2014-0696 was the sole starter culture use in this study, and after the secondary
fermentation there were still viable and capable of fermenting another sterilized wort
hence the higher load on the ARB. However, conventional yeast are usually weakened
by the alcohol content after secondary fermentation unlike M. purpureus which are able
to withstand these higher ethanol content and other stressful factors (Huang, 2000).
According to Hill (2009) and Suzuki (2011) beer has been recognized as a
microbiologically stable beverage due to it range of antimicrobial hindrance that, under
most circumstances, prevents the growth of pathogenic microorganisms. Other factors
like presence of alcohol, bitter compounds in hops, low pH, played a vital role in keeping
1319
beer safe from microbial contamination. Nevertheless, microbiological contamination
sporadically occurs in beverages. Pasteurization was not performed in this study and this
might be the reason for the incidence of growth we observed on the plated Petri dishes.
We noticed, in our previous work that, the observation strict hygienic protocol could
curb the incidence of microbial contaminations (Adadi et al., 2017b).
Table 3. Frequency of microbial load on ARB (Mean ± S.D × CFU mL-1)
Microorganisms Mean SD CFU mL-1
Bacteria 0.8 0.1 105
M. purpureus 2.14 0.044 107
Incidences of bacterial contamination were also observed by Elio (2013), in all beer
brewed (young beer; centrifuged beer; beer with priming; bottle beer; bottle conditioned
beer) excepting the wort. The presence of bacteria in our study assumed that, the
contamination could have happened during the carbonation stage after the primary
fermentation as we practiced Kräusening. Hygienic management in brewery and
disinfection using hydrogen peroxide, peroxacetic acid and quaternary ammonium
compounds (Praeckel, 2009) could help in dealing with the menace of contaminations.
Food acceptance by consumers goes in hand with the impressions of the five human
senses. Beverage acceptance by consumers has a role to play by the impression of the
human senses i.e sight, hearing etc. Raw materials, technological procedures and storage
could positively or negatively influenced the sensorial of beverage. The variables
accessed were different statistically (P < 0.05) and are tabulated in Table 4.
Transparency was not good as the score 1.57 ± 0.53 tells it all. Poor filtration of wort
and green beverage might be the reason for the poor feedback from the assessors. Colour
was somehow satisfactory with mean scores of 2.14 ± 1.07. Colour and transparency go
together as transparent beverage could definitely receive positive responses from
panellists. The colour was like conventional beer (brewed from S. cerevisiae), did not
take the colour (red) of the pigments produced by the M. purpureus. Flavour of the ARB
was good (2.57 ± 0.98) and this could be attributed to contribution from the hops, malt,
and some metabolites produced by M. purpureus.
Table 4. Scores of sensory properties of
antioxidant rich beverage
Parameters Mean ± S.D
Transparency 1.57 ± 0.53
Colour 2.14 ± 1.07
Flavour 2.57 ± 0.98
Taste 3.14 ± 1.35
Hops bitterness 4.29 ± 0.49
Foaminess 4.45 ± 0.98
Overall acceptance 3.86 ± 0.89
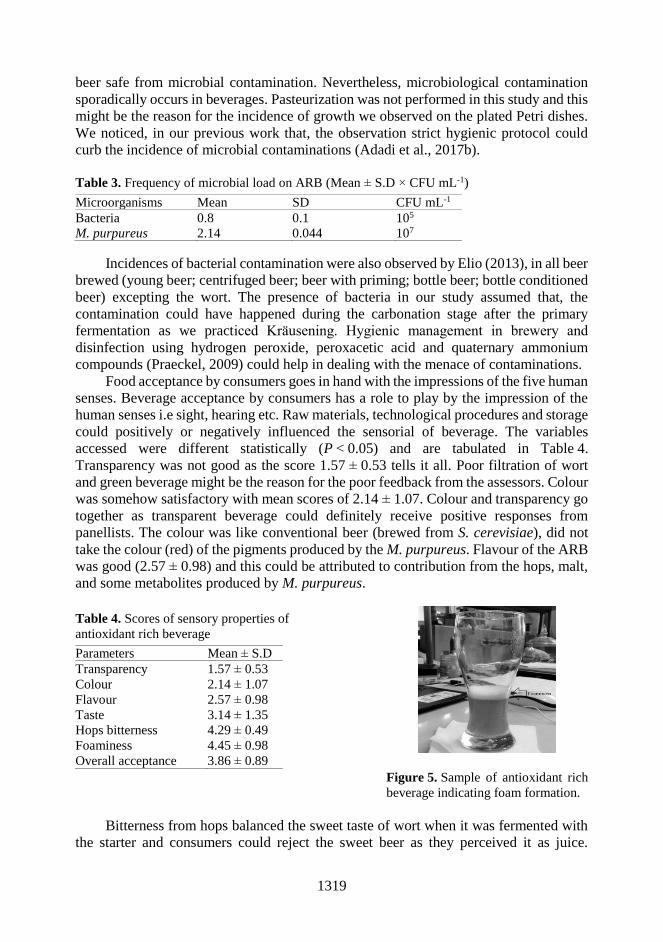
Figure 5. Sample of antioxidant rich
beverage indicating foam formation.
Bitterness from hops balanced the sweet taste of wort when it was fermented with
the starter and consumers could reject the sweet beer as they perceived it as juice.

1320
Bittering compounds from hops is thought to play a vital role in stability of the beverage
from microbial staling. Kräusening method of carbonation was excellent in this study,
judging from the average scored of the beverage foaminess (4.45 ± 0.98). The image of
the glass after pouring ARB with massive foam formation is shown in Fig. 5. Foaminess
plays a vital role in acceptability of beverage and consumers might reject beverage with
poor foaminess. Panellists generally expressed their acceptance for the beverage as they
considered it a new product taking into account the health benefit (AOA potential).
Flavour of the product also played a role in the acceptability of the beverage studied.
CONCLUSION
Antioxidant rich beverage was brewed from various malts and traditional Asian
fungus M. purpureus IHEM LY2014-0696. However, the beverage did not take the
colour (red) of the angkak (Monascus pigments) and this contradicts previous work
(Takeshita et al., 2016). A thick-light layer was observed covering the surface of the
fermenting wort during the 24 hours of fermentation time. It was experimentally
established that beer brewed showed a strong DPPH radical scavenging activity when
compared with the wort. Incidence of microbial load was recorded in this study and this
could be attributed to many factors. The beverage was accepted taking into account the
health benefits and flavour.
ACKOWLEDGEMENTS. The work was carried out with the financial support of the Ministry
of Education of the Russian Federation within the framework of the basic part of the state task,
Project No. 4.9514.2017 / 8.9
REFERENCES
Adadi, P. & Obeng, A.B. 2017. Assessment of bacterial quality of honey produced in Tamale
metropolis (Ghana). J. Food. Drug. Anal. 25, 369–373.
Adadi, P., Kovaleva, E.G., Glukhareva, T.V. & Shatunova, S.A. 2017a. Biotechnological
production of non-traditional beer. In: Valeeva A.A & Volkovich, V.A. (ed.) Physics,
Technologies and Innovation (PTI-2017): IV International Young Researchers Conference,
AIP Conference Proceedings, Melville, USA, pp. 1–13.
Adadi, P., Kovaleva, E.G., Glukhareva, T.V., Shatunova, S.A. & Petrov, A.S. 2017b. Production
and analysis of non-traditional beer supplemented with sea buckthorn. Agronomy Research
15(5), 1831–1845.
Aniya, Y., Ohtani, I.I., Higa, T., Miyagi, C., Gibo, H., Shimabukuro, M., Nakanishi, H. &
Taira, J. 2000. Dimerumic acid as an antioxidant of the mold, Monascus anka. Free. Radic.
Biol. Med. 28, 999–1004.
Arunachalam, C. & Narmadhapriya, D. 2011. Monascus fermented rice and its beneficial aspects:
a new review. Asian. J. Pharm. Clin. Res. 4, 29–31.
Bakosova, A., Mate, D., Laciakova, A. & Pipova, M. 2001.Utilization of Monascus purpureus in
the production of foods of animal origin. Bull. Vet. Inst. Pulawy. 45, 111–116.
Bamforth, C.W. 2001. pH in brewing: an overview. Tech Q Master Brew. Assoc. Am. 38, 1–9.
Barnard, E.L. & Cannon, P.F. 1987. A new species of Monascus from pine tissues in Florida.
Mycologia. 79, 479–484.
Bolck, G. 1992. The data support a role of antioxidants in reducing cancer risks. Nutr. Rev. 50,
207–213.

1321
Boulton, C. & Quain, D. 2007. Brewing yeast and fermentation. Blackwell Science, New Jessy,
p. 660.
Briggs, D.E., Boulton, C.A., Brookes, P.A. & Stevens, R. 2004. Metabolism of Wort by Yeast:
Brewing Science and Practice. CRC Press, New York.
Diplock, A. 1995. Antioxidant nutrients-efficacy in disease prevention and safety. Biochem. 17,
16–18.
Ditrych, M., Kordialik-Bogacka, E. & Czyżowska, A. 2015 Antiradical and Reducing Potential
of Commercial Beers. Czech J. Food Sci. 33, 261–266.
Elio, M. 2013. Development of guidelines for microbiological control in microbrewer. PhD
Thesis, University of Perugia.
Enevoldsen, B.S. & Schmidt, F. 1974. Dextrins in brewing. J. Inst. Brew. 80, 520–533.
Erdoğrul, O. & Azirak, S. 2004. Review of the studies on the red yeast rice (Monascus
purpureus). Turkish. Electro. J. Biotechnol. 2, 37–49.
GOST 12787-81. Beer: method of measuring beer actual extract and calculation of dry matter in
the initial wort. (Moscow standard inform, Moscow, 2011), p. 11 [in Russian].
Hawksworth, D.L. & Pitt, J.I. 1983. A new taxonomy for Monascus species based on cultural and
microscopical characters. Aust J Bot. 31, 51–51.
Hill, A.E. 2009. Microbiological stability of beer. In C. Bamforth (ed.), Beer a quality
perspective. Academic Press, Cambridge, p.163–184.
Hoekstra, S.F. 1974. Fermentable sugars in wort, brewed with adjuncts and fermented with
bottom yeast. Proceedings of the European Brewery Convention Symposium Monograph
1, Ziest. p. 189–97.
Huang, H.T. 2000. Biology and Biological Technology, Part V: Fermentations and Food Science,
Science and Civilisation in China (Needham, J., ed.). Cambridge University Press,
Cambridge, 741 pp.
Jůzlová, P., Martínková, L. & Křen, V. 1996. Secondary metabolites of the fungus Monascus: A
review. J. Ind. Microbiol. 16, 163–170.
Lin, C.C., Li, T.C. & Lai, M.M. 2005. Efficacy and safety of Monascus purpureus Went rice in
subjects with hyperlipidemia. Eur. J. Endocrinol. 153, 679–686.
MacWilliam, I.C. 1968. Wort composition - a review. J. Inst. Brew.74, 38–54.
Palo, M.A., Vidal-Adeva, L. & Maceda, L.M. 1960. A study on ang-kak and its production.
Philippine. J. Sci. 89, 1–19.
Praeckel, U. 2009. Cleaning and Disinfecting. In: H. M. Eßlinger (ed.) Handbook of Brewing:
Process, Technology, Markets. Wiley-VCH Verlag GmbH, Weinheim, p. 477–490.
Sato, K., Iwakami, S., Goda, Y., Okuyama, E., Yoshihara, K., Ichi, T., Odake, Y., Noguchi, H.
& Sankawa, U. 1992. Novel natural colorants from Monascus anka U-1. Heterocycles. 34,
2057–2060.
Su, Y.C., Wang, J.J., Lin, T.T. & Pan, T.M. 2003. Production of the secondary metabolites γ-
aminobutyric acid and monacolin K by Monascus. J. Ind. Microbiol. Biotechnol. 30, 40–46.
Suzuki, K. 2011. 125th Anniversary Review: Microbiological Instability of Beer caused by
Spoilage Bacteria. J. Inst. Brew. 117, 131–155.
Takeshita, R., Saigusa, N. & Teramoto, Y. 2016. Production and antioxidant activity of alcoholic
beverages made from various cereal grains using Monascus purpureus NBRC 5965. J. Inst.
Brew. 122, 350–354.
Watanabe, T., Yamamoto, A., Nagai, S. & Terabe, S. 1997. Separation and determination of
Monascus yellow pigments for food by micellar electrokinetic chromatography. Anal. Sci.
13, 571–575.
Zhao, H., Chen, W., Lu, J. & Zhao, M. 2010. Phenolic profiles and antioxidant activities of
commercial beers. Food. Chem. 119, 1150–1158.

1322
Agronomy Research 16(S2), 1322–1330, 2018
https://doi.org/10.15159/AR.18.013
Bioactive compounds in herbal infusions
I. Augšpole*, M. Dūma and B. Ozola
Latvia University of Life Sciences and Technologies, Faculty of Food Technology,
Department of Chemistry, Liela iela 2, LV-3000, Jelgava, Latvia *Correspondence: [email protected] Abstract. Herbal teas are very popular and known as important source of biologically active
compounds. Some of popular Latvian herbal teas: Calendula (Calendula officinalis L.),
Matricaria chamomilla (Matricaria chamomilla), Lady's-mantle (Alchemilla vulgaris L.),
Jasmine (Jasminum officinale L.), Yarrow (Achillea millefolium L.) and Linden flowers
(Tilia spp.) were selected for analysis. This study was carried out with the aim to investigate the
effect of extraction time (10, 15, 20 min) on the content of total flavonoids and total phenols as
well as antioxidant activity of herbal tea extracts. The infusions were prepared by usual domestic
preparation technique using ground air-dried plant materials and boiling deionized water
(0.055 µS cm-1) for extraction. Content of total flavonoids, total phenols and antioxidant activity
was determined spectrophotometrically. Dry matter content was determined in lyophilized herbal
infusions. The obtained results indicated that extraction time did not affected the content of
biologically active compounds in the herbal infusions significantly (P > 0.05). The highest level
of flavonoids was found in Jasmine and Lady's-mantle infusions (average
104.98 ± 9.21 mg quercetin equivalent 100 g-1 and 115.28 ± 5.25 QE mg 100 g-1 respectivelly),
while the lowest was determined in Matricaria chamomilla extract – (average
70.10 ± 4.68 QE mg 100 g-1). Lady's-mantle tea contained the largest amount of total phenols
(average 4126.62 ± 26.24 mg gallic acid equivalents 100g-1), the lowest – Calendula tea
1828.04 ± 10.37 mg GAE 100 g-1). Data analysis showed a close linear positive correlation
between the content of total flavonoids and total phenols in herbal infusions (R2 = 0.872;
r = 0.934) with the probability of 99%. In general, all samples tested in this study, demonstrated
high level of antioxidant activity (from 75.04 to 91.54 mmol Trolox equivalents 100 g-1). Results
of the present experiments demonstrated that content of dry matter in analysed herbal teas was
significantly different (P < 0.05).
Key words: herbal infusion, phenols, flavonoids, antioxidant activity.
INTRODUCTION
Herbal teas are known as beverages throughout the world. Herbs are mainly used
in form of infusion of dried herbs in hot water. Leafy herbal teas are widely known to
contain a variety of active phytochemicals with biological properties that promote
human health and help reduce the risk of chronic diseases such as allergies, insomnia,
headaches, anxiety, intestinal disorders, depression, and high blood pressure (Craig,
1999). Their beneficial effects could be partly attributed to polyphenolic compounds,
which are known to possess antioxidant and antimicrobial properties (Miguel, 2010;

1323
Cushnie & Lamb, 2011). There are known many herbal teas in Latvia. Most common
are chamomilla, calendula, lady’s-mantle, yarrow and linden flowers. Chamomilla
contains several classes of biologically active compounds including essential oils,
coumarins and several polyphenols, primarily the flavonoids (Avula et al., 2014).
Calendula accumulates large amounts of carotenoids in its flowers. Carotenoids are
known as biologically active compounds with multiple applications in therapy. It is
important to humans as precursors of vitamin A and retinoids. The plant of lady’s-mantle
is rich in tannins, flavonoids, salicylic acid, essential oil, bitter substances and
phytosterols. It also contains vitamin C and numerous minerals. The most medicinally
active part of the yarrow is the flowering tops. Yarrow contains flavonoids (apigenin,
luteolin, quercitin) that increase saliva and stomach acid, helping to improve digestion.
Yarrow may also relax smooth muscle in the intestine and uterus, which can relieve
stomach and menstrual cramps (Lakshmi et al., 2011). Linden flowers contain sugar,
tannin, mucilaginous matter, fatty substance, wax, yellow coloring matter, and a volatile
oil, to which their fragrant odor is due. The main constituents of linden flower tea are
flavonoids (quercetin glycosides, kaempferol glycosides, tiliroside), phenolic acids,
essential oils, phytosterols, organic acids, tannins, mucilage, minerals, niacin, and
vitamin C. These antioxidants help to prevent and repair DNA damage. Its
pharmacological activity is in feverish colds, infectious diseases, and bronchitis, but it
also has sedative and diuretic actions (Sroka & Bełz, 2009). Jasmine flower tea is very
popular in Asia countries. Phytochemical analysis revealed that the jasmine flower
contains antioxidants, coumarins, cardiac glycosides, essential oils, flavonoids,
phenolics, saponins, and steroids (Kunhachan et al., 2012).
Antioxidants are molecules that neutralize harmful reactive oxygen species (ROS)
by inhibiting oxidative chain reaction, preventing lipid peroxidation, reducing free
radical concentration and chelating metal ions (Zhou & Yu, 2004). Reactive oxygen
species, produced during aerobic metabolism, are essential mediators of important
functions. Studies have demonstrated the involvement of ROS in a number of disorders
including Alzheimer, atherosclerosis, diabetes, inflammation, and neurodegenerative
and cardiovascular diseases. ROS also plays a key role in certain types of cancers and
the ageing process (Salganik, 2001). Free radicals are reactive oxygen species produced
in the body as by-products of cellular aerobic respiration and lead to oxidative stress
(Yanai et al., 2008). Antioxidant activity is defined as an inhibition of the oxidation of
lipids, proteins, DNA or other molecules that occurs by blocking thepropagation step in
oxidative chain reactions (Huang et al., 2005).
Primary antioxidants directly scavenge free radicals, while secondary antioxidants
indirectly prevent the formation of free radicals through Fenton’s reaction.
(Chan et al., 2010).
The antioxidant ability of phenolic components occurs mainly through a redox
mechanism and allows the components to act as reducing agents, hydrogen donors,
singlet oxygen quenchers and metal chelators (Rice Evans et al., 1997).
Flavonoids are phenolic substances isolated from a wide range of vascular plants,
with over 8,000 individual compounds known. They act in plants as antioxidants,
antimicrobials, photoreceptors, visual attractors, feeding repellants, and for light
screening. Many studies have suggested that flavonoids exhibit biological activities,
including antiallergenic, antiviral, antiinflammatory, and vasodilating actions. However,

1324
most interest has been devoted to the antioxidant activity of flavonoids, which is due to
their ability to reduce free radical formation and to scavenge free radicals (Pietta, 2000).
Polyphenols are a group of compounds synthesized exclusively by plants,
especially for the protection against UV-radiation and activity of pathogens. About 8,000
plant polyphenol compounds have been identified so far whereas only some hundred
occur in edible plants. They are present in fruits, flowers, leafs, roots, and woody parts
of plants, whereas external tissues include bigger amounts of these components (Manach
et al., 2004).
Therefore the aim of current research was to evaluate the effect of extraction time
(10, 15, 20 min) on the content of total flavonoids and total phenols as well as antioxidant
activity of herbal tea extracts.
MATERIALS AND METHODS
Investigations were carried out at the Latvia University of Life Sciences and
Technologies, Department of Chemistry.
Chemicals and spectral measurements
All the reagents used were with the analytical grade from Sigma Aldrich, Germany.
JENWAY 630 Spectrophotometer was used for the absorbance measurements.
Plant materials
Plants of Calendula (Calendula officinalis L.), Matricaria chamomilla (Matricaria
chamomilla), Lady's-mantle (Alchemilla vulgaris L.), Jasmine (Jasminum officinale L.),
Yarrow (Achillea millefolium L.) and Linden flowers (Tilia spp.) were grown in Latvia,
Jelgava region (the GPS-coordinates: 56° 39' 3.992" N 23° 43' 16.874" E), collected
during the flowering period in May till July 2017 and were dried at room temperature in
a dark place.
Preparation of herbal infusions
Infusions were prepared in triplicate from the selected plants by usual domestic
preparation technique. For this purpose 0.5 ± 0.0001 g of finely ground air-dried plant
material were extracted in 50 mL of boiling distilled water (0.055 µS cm-1) and stirred
gently on a magnetic stirrer at room temperature for 10, 15 or 20 min. Each extract was
then filtered through paper filter (11 μm, Whatman Inc., Clifton, NJ, USA). The
supernatant was used for all determinations.
Analytical methods
Dry matter
The tea infusions were lyophilized (lyophilizator ALPHA 1-2 Ld plus CHRIST,
Germany, 72 hours, -56 °C, 0.027 mBar vacuum) to determine the yield of extracted
compounds (dried weight) in each of them. The results were expressed as g freeze-dried
infusion l00 g-1 tea sample.
Total phenolic compound content
The total phenolics of the tea infusions were analyzed spectrometrically according
to the Folin-Ciocalteu (Singleton et al., 1999, Dewanto et al., 2002). Briefly, 2.5 mL of
Folin–Ciocalteu reagent (diluted 10 times with distilled water) was added to 0.5 mL of

1325
infusion. The mixture was then incubated for 3 min, after which 2 mL of sodium
carbonate (Na2CO3) (7.5 g 100 g-1) was added and well mixed. The control sample
contained all the reaction reagents except the extract. After standing for 30 min at
20 ± 1 °C in dark place for color development, absorbance was measured at 760 nm
using JENWAY 630 Spectrophotometer. Results were expressed as mg gallic acid
equivalents (GAE) 100 g-1 dry-matter of herbal tea and analysis were carried out in
triplicate for each herbal infusion.
Total flavonoid content
The content was quantified using aluminium chloride method (Xu & Chang, 2007)
with some modifications. To 500 µL of tea infusion 2 mL of distilled H2O was added,
then mixed with 150 µL of 5% sodium nitrite NaNO2. After 5 min, 150 µL of 10%
aluminium chloride AlCl3 solution was added. The mixture was allowed to stand for
another 5 min, and then 1 mL of the 1M sodium hydroxide NaOH was added. The
reaction solution was mixed well and incubated at 20 ± 1 °C in dark place for 15 min.
The control sample contained all the reaction reagents except the extract. The absorbance
was measured at 415 nm using JENWAY 630 Spectrophotometer. Results were
expressed as milligram quercetin equivalent 100 g-1 in dry weight (mg QE 100 g-1 DW).
Antiradical activity
The antiradical activity of tea extracts was determined according to Afify (2012)
with some modifications. Method is based on the radical scavenging ability in reacting
with stable 2.2-diphenil-1-picrylhydrazyl (DPPH) free radical. 3.5 mL of DPPH solution
(4 mg of DPPH reagent dissolved in 100 mL pure ethanol) was added to 0.5 mL sample
extract. Solution was well mixed and stand in dark place at 20 ± 1 °C for 30 min.
Absorbance was measured at 517 nm using JENWAY 630 Spectrophotometer. The
antiradical activity was expressed as TROLOX (6-hydroxy-2.5.7.8-tertamethylchroman-
2-carboxylic acid) equivalent antiradical activity (mmoL TE 100 g-1 DW).
Mathematical data processing
The results are the means and standard deviation for three replicates. Means were
compared by analysis of variance (ANOVA) and correlation analysis. Significance was
defined at P ˂ 0.05. Statistical analysis was carried out by Microsoft Excel 2010 version
software.
RESULTS AND DISCUSSION
Generally, the chemical properties of herbal tea depend on the applied temperature
and time, as well as the extraction technique (Ong, 2004).
Based on the absorbance values after reaction with Folin–Ciocalteu reagent, results
of the spectrophotometric analysis are given in Fig. 1. The total phenolics content (TPC)
in the investigated herbal tea infusions ranged from 1,824.1 ± 9.08 to
4,350.3 ± 13.01 mg GAE 100 g-1 (Fig. 1). Lady's-mantle infusions were the most
abundant in the total phenols (15 min extraction 4,350.3 ± 13.01 GAE 100 g-1 and
20 min extraction 4,226.4 ± 10.32 mg GAE 100 g-1), while the lowest amounts were
determined in Calendula tea infusions (in average 1,829.9 ± 9.65 mg GAE 100 g-1). The
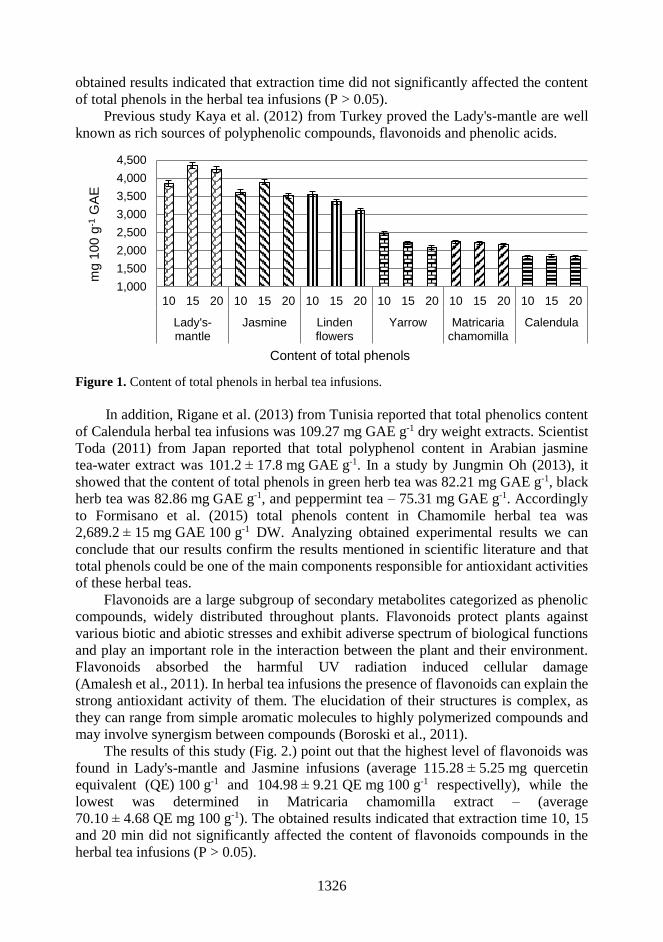
1326
obtained results indicated that extraction time did not significantly affected the content
of total phenols in the herbal tea infusions (P > 0.05).
Previous study Kaya et al. (2012) from Turkey proved the Lady's-mantle are well
known as rich sources of polyphenolic compounds, flavonoids and phenolic acids.
Figure 1. Content of total phenols in herbal tea infusions.
In addition, Rigane et al. (2013) from Tunisia reported that total phenolics content
of Calendula herbal tea infusions was 109.27 mg GAE g-1 dry weight extracts. Scientist
Toda (2011) from Japan reported that total polyphenol content in Arabian jasmine
tea-water extract was 101.2 ± 17.8 mg GAE g-1. In a study by Jungmin Oh (2013), it
showed that the content of total phenols in green herb tea was 82.21 mg GAE g-1, black
herb tea was 82.86 mg GAE g-1, and peppermint tea – 75.31 mg GAE g-1. Accordingly
to Formisano et al. (2015) total phenols content in Chamomile herbal tea was
2,689.2 ± 15 mg GAE 100 g-1 DW. Analyzing obtained experimental results we can
conclude that our results confirm the results mentioned in scientific literature and that
total phenols could be one of the main components responsible for antioxidant activities
of these herbal teas.
Flavonoids are a large subgroup of secondary metabolites categorized as phenolic
compounds, widely distributed throughout plants. Flavonoids protect plants against
various biotic and abiotic stresses and exhibit adiverse spectrum of biological functions
and play an important role in the interaction between the plant and their environment.
Flavonoids absorbed the harmful UV radiation induced cellular damage
(Amalesh et al., 2011). In herbal tea infusions the presence of flavonoids can explain the
strong antioxidant activity of them. The elucidation of their structures is complex, as
they can range from simple aromatic molecules to highly polymerized compounds and
may involve synergism between compounds (Boroski et al., 2011).
The results of this study (Fig. 2.) point out that the highest level of flavonoids was
found in Lady's-mantle and Jasmine infusions (average 115.28 ± 5.25 mg quercetin
equivalent (QE) 100 g-1 and 104.98 ± 9.21 QE mg 100 g-1 respectivelly), while the
lowest was determined in Matricaria chamomilla extract – (average
70.10 ± 4.68 QE mg 100 g-1). The obtained results indicated that extraction time 10, 15
and 20 min did not significantly affected the content of flavonoids compounds in the
herbal tea infusions (P > 0.05).
1,000
1,500
2,000
2,500
3,000
3,500
4,000
4,500
10 15 20 10 15 20 10 15 20 10 15 20 10 15 20 10 15 20
Lady's-mantle
Jasmine Lindenflowers
Yarrow Matricariachamomilla
Calendula
mg 1
00 g
-1G
AE
Content of total phenols
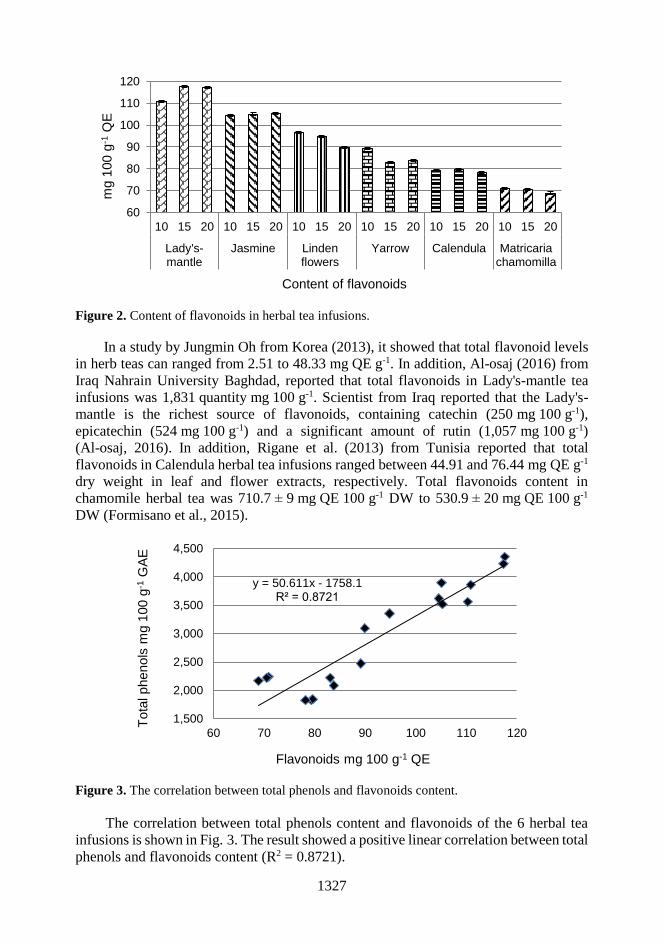
1327
Figure 2. Content of flavonoids in herbal tea infusions.
In a study by Jungmin Oh from Korea (2013), it showed that total flavonoid levels
in herb teas can ranged from 2.51 to 48.33 mg QE g-1. In addition, Al-osaj (2016) from
Iraq Nahrain University Baghdad, reported that total flavonoids in Lady's-mantle tea
infusions was 1,831 quantity mg 100 g-1. Scientist from Iraq reported that the Lady's-
mantle is the richest source of flavonoids, containing catechin (250 mg 100 g-1),
epicatechin (524 mg 100 g-1) and a significant amount of rutin (1,057 mg 100 g-1)
(Al-osaj, 2016). In addition, Rigane et al. (2013) from Tunisia reported that total
flavonoids in Calendula herbal tea infusions ranged between 44.91 and 76.44 mg QE g-1
dry weight in leaf and flower extracts, respectively. Total flavonoids content in
chamomile herbal tea was 710.7 ± 9 mg QE 100 g-1 DW to 530.9 ± 20 mg QE 100 g-1
DW (Formisano et al., 2015).
Figure 3. The correlation between total phenols and flavonoids content.
The correlation between total phenols content and flavonoids of the 6 herbal tea
infusions is shown in Fig. 3. The result showed a positive linear correlation between total
phenols and flavonoids content (R2 = 0.8721).
60
70
80
90
100
110
120
10 15 20 10 15 20 10 15 20 10 15 20 10 15 20 10 15 20
Lady's-mantle
Jasmine Lindenflowers
Yarrow Calendula Matricariachamomilla
mg 1
00 g
-1Q
E
Content of flavonoids
y = 50.611x - 1758.1R² = 0.8721
1,500
2,000
2,500
3,000
3,500
4,000
4,500
60 70 80 90 100 110 120
Tota
l phenols
mg 1
00 g
-1G
AE
Flavonoids mg 100 g-1 QE

1328
The DPPH method is an efficient procedure commonly used to determine
antioxidant activity (Scherer et al., 2009). The antioxidant capacity of the herbal tea
infusions were studied through the evaluation of their free radical scavenging effect on
the 1.1-diphenyl-2-picrylhydrazyl (DPPH) radical. The results were expressed as
µM Trolox ekv 100 g-1.
The content of antioxidant activity, mmol Trolox eq. 100 g-1 is shown in Table 1.
For the herbal tea infusions, the antioxidant activity varied from
75.04 ± 1.15 mmol Trolox eq. 100 g-1 to 91.54 ± 2.62 mmol Trolox eq. 100 g-1. The
highest antioxidant activity was observed for Linden flowers infusion: 91.19 ± 2.54
mmol Trolox eq. 100 g-1 with extraction time 10 min and 91.54 ± 2.62 mmol Trolox eq.
100 g-1 (extraction time 15 min), followed by Matricaria chamomilla 90.46 ± 2.66 mmol
Trolox eq. 100 g-1 (extraction time 15 min).
Calendula had the lowest antioxidant activity – in average 80.08 ± 1.52 mmol
Trolox eq. 100 g-1. Extraction time did not have statistically significant influence
(P > 0.05) on antioxidant activity.
Table 1. Antioxidant activity in herbal tea infusions
Herbal
tea infusions
Antioxidant activity, mmol Trolox equivalents 100 g-1
Extraction time
10 min 15 min 20 min
Calendula 75.04 ± 1.15 83.58 ± 2.02 81.60 ± 1.41
Matricaria chamomilla 89.03 ± 2.62 90.46 ± 2.66 89.13 ± 2.27
Jasmine 86.87 ± 1.64 87.54 ± 1.84 87.69 ± 2.06
Lady's-mantle 82.68 ± 1.35 87.05 ± 1.32 85.32 ± 1.33
Linden flowers 91.19 ± 2.54 91.54 ± 2.62 89.77 ± 2.36
Yarrow 89.50 ± 2.11 90.83 ± 2.21 86.30 ± 1.74
Antioxidant activity, mmol Trolox eq. 100 g-1 of the Herbal tea infusions value was expressed as the
mean ± standard error (SD).
In addition, Rigane et al. (2013) from Tunisia reported that antioxidant activities of
Calendula officinalis extracts was 0.35 ± 0.02 DPPH (IC50 mg mL-1) or 28.37 ± 0.12
FRAP (mmol eq. of Trolox). In turn scientist Toda (2011) from Japan proved that
antioxidant activity of Arabian Jasmin herb tea water extract was
144.0 ± 1.4 mmol L-1 PAO, but Chamomile herbal tea antioxidant activity was
238.2 ± 4 to 811.4 ± 1 mol TE 100 g-1 DW (Formisano et al., 2015).
The antioxidant capacities of samples may be influenced by lots of factors, such as
cultivation, production, storage conditions and test systems, and cannot be fully
described by one single method (Yashin et al., 2011). Most natural antioxidants are
multifunctional. A reliable antioxidant evaluation protocol requires different antioxidant
activity assessments to be performed to take into account various mechanisms of
antioxidant action (Wong et al., 2006).
The obtained results indicated that extraction time did not significantly affected the
content of dry matter in the herbal infusions (P > 0.05), but it depends on plants type.
The highest content of dry matter was determined in Jasmine herbal tea extract
(53.37 ± 0.27 g 100 g-1), but the lowest in in Linden flowers and Yarrow herbal tea
extracts, respectively 20.64 ± 0.10 g 100 g-1 and 20.57 ± 0.14 g 100 g-1.

1329
CONCLUSIONS
In summary, the present paper investigates the possibilities for obtaining herbal tea
infusions with high values of bioactive compounds, using in Latvia well known and
popular herbs. The obtained results indicated that extraction time (10, 15 or 20 min) did
not affect the content of biologically active compounds, as well as antioxidant activity
in the herbal infusions significantly, but content of tea`s dry matter was significantly
different. The highest level of flavonoids was found in Jasmine and Lady's-mantle
infusions, while the lowest (about two times) was determined in Matricaria chamomilla
extract. Lady's-mantle tea also contained the highest amount of total phenols – in average
4126.62 ± 26.24 mg GAE 100g-1. Calendula and Matricaria chamomilla tea infusions
are the poorest regarding these compounds. Data analysis showed a close linear positive
correlation between the content of total flavonoids and total phenols in herbal infusions
(R2 = 0.872; r = 0.934). Due to higher content of bioactive compounds in tea infusions,
all samples demonstrated high level of antioxidant activity (from 75.04 to 91.54 mmol
Trolox equivalents 100 g-1).
REFERENCES
Afify, A.El-M.MR., El-Beltagi, H.S., Abd El-Salam, S.M. & Omran, A.A. 2012. Biochemical
changes in phenols, flavonoids, tannins, vitamin E, β-carotene and antioxidant activity
during soaking of three white sorghum varieties. Asian Pacific Journal of Tropical
Biomedicine, 203–209.
Al-osaj, S.L. 2016. Cytotoxic Evaluation of Alchemilla vulgaris Flavonoids in Normal Blood
Lymphocytes. A thesis. Al-Nahrain University as a partial fulfillment of the requirement for
the Degree, 73 pp.
Amalesh, S, Gouranga, D. & Sanjoy, K.D. 2011. Roles of flavonoids in plants. International
Journal of Pharmacy and Pharmaceutical Sciences 6(1), 12–35.
Avula, B., Wang, Y.-H., Wang, M., Avonto, C., Zhao, J., Smillie, T.J., Rua, D. & Khan, I.A.
2014. Quantitative determination of phenolic compounds by UHPLC-UV–MS and use of
partial least-square discriminant analysis to differentiate chemo-types of
chamomile/chrysanthemum flower heads. Journal of Pharmaceutical and Biomedical
Analysis 88, 278–288.
Boroski, M., Aguiar, A.C., Boeing, J.S., Rotta, E.M., Wibby, C.L., Bonafé, E.G., Souza, N.E. &
Visentainer, J.V. 2011. Enhancement of pasta antioxidant activity with oregano and carrot
leaf. Food Chemistry 125, 696–700.
Chan, E.W.C., Lim, Y.Y., Chong, K.L., Tan, J.B.L. & Wong, S.K. 2010. Antioxidant properties of
tropical and temperate herbal teas. Journal of Food Composition and Analysis 23(2), 185–189.
Craig, W.J. 1999. Health-promoting properties of common herbs. American Journal of Clinical
Nutrition 70(3), 491–499.
Cushnie, T.P.T. & Lamb, A.J. 2011. Recent advances in understanding theantibacterial properties
of flavonoids. International Journal of Antimicrobial Agents 38, 99–107.
Dewanto, V., Wu, X., Adom, K.K. & Liu, R.H. 2002. Thermal processing enhances the
nutritional value of tomatoes by increasing total antioxidant activity. Journal of
Agricultural and Food Chemistry 50(10), 3010–3014.
Formisanoa, C., Delfineb, S., Olivieroa, F., Tenorea, G.C., Riganoa, D. & Senatorea, F. 2015.
Correlation among environmental factors, chemical composition andantioxidative
properties of essential oil and extracts of chamomile (Matricaria chamomilla L.) collected
in Molise (South-central Italy). Industrial Crops and Products 63, 256–263.

1330
Huang, D., Ou, B. & Prior, R.L. 2005. The chemistry behind antioxidant capacity assays. Journal
of Agricultural and Food Chemistry 53(6), 1841–1856.
Jungmin, O., Heonjoo, J., Ah Reum, C., Sung-Jin, K. & Jaejoon, H. 2013. Antioxidant and
antimicrobial activities of various leafy herbal teas. Food Control 31(2), 403–409.
Kaya, B., Menemen, Y. & Saltan, F.Z. 2012. Flavonoids in the endemic species of Alchemilla
L., (Section Alchemilla L. Subsection Calycanthum rothm. ser. Elatae rothm.) from
north-east black sea region in Turkey. Pakistan Journal of Botany 44(2), 595–597.
Kunhachan, P., Banchonglikitkul, C., Kajsongkram, T., Khayungarnnawee, A. &
Leelamanit, W. 2012. Chemical Composition, Toxicity and Vasodilatation Effect of the
Flowers Extract of Jasminum sambac (L.) Ait. ‘G. Duke of Tuscany’. Evidence-Based
Complementary and Alternative Medicine, Article ID 471312, 7 pp.
Lakshmi, T., Geetha, R.V., Roy, A. & Kumar, S.A. 2011. Yarrow (Achillea Millefolium Linn.)
a herbal medicinal plant with broad therapeutic use – a review. International Journal of
Pharmaceutical Sciences Review and Research 9(2), 22–26.
Manach, C., Scalbert, A., Morand, Ch., Remesy, Ch. & Jimenez, L. 2004. Polyphenols: Food
sources and bioavailability. The American Journal of Clinical Nutrition 5, 727–747.
Miguel, M.G. 2010. Antioxidant activity of medicinal and aromatic plants. Areview. Flavour and
Fragrance Journal 25, 291–312.
Ong, E.S. 2004, Extraction methods and chemical standardization of botanicals and herbal
preparations. Journal of Chromatography B 812(1), 23–33.
Pietta, P.-G. 2000. Flavanoids as antioxidants. Journal of Natural Products 63(7), 1035–1042.
Rice Evans, C.A., Miller, N.J. & Paganga, G. 1997. Antioxidant properties of phenolic
compounds. Trends in Plant Science 2(4), 304–309.
Rigane, G., Younes, B., Ghazghazi, S.H. & Salem, B.R 2013. Investigation into the biological
activities and chemical composition of Calendula officinalis L. growing in Tunisia.
International Food Research Journal 20(6), 3001–3007.
Salganik, R.I. 2001. The benefits and hazards of antioxidants: controlling apoptosis and other
protective mechanisms in cancer patients and the human population. Journal of the
American College of Nutrition 20, 464–472.
Scherer, R. & Godoy, H.T. 2009. Antioxidant activity index (AAI) by the 2,2-diphenyl-1-
picrylhydrazyl method. Food Chemistry 112(3), 654–658.
Singleton, V.L., Orthofer, R. & Lamuela-Raventos, R.M. 1999. Analysis of total phenols and
other oxidation substrates and antioxidants by means of Folin-Ciocalteu reagent. Methods
in Enzymology 29, 152–178.
Sroka, Z. & Belz, J. 2009. Antioxidant activity of hydrolyzed and non-hydrolyzed extracts of the
inflorescence of linden (Tiliae inflorescentia). Advances in Clinical and Experimental
Medicine 18(4), 329–335.
Toda, S. 2011. Polyphenol Content and Antioxidant Effects in Herb Teas. Chinese Medicine 2,
29–31.
Wong, S.P., Leong, L.P. & Koh, J.H.W. 2006, Antioxidant activities of aqueous extracts of
selected plants. Food Chemistry 99, 775–783.
Xu, B.J. & Chang, S.K.C. 2007. A comparative study on phenolic profiles and antioxidant activities
of legumes as affected by extraction solvents. Journal of Food Science 72(2), 159–166.
Yanai, N., Shiotani, S., Hagiwara, S., Nabetani, H. & Nakajima, M. 2008. Antioxidant
combination inhibits reactive oxygen species mediated damage. Bioscience, Biotechnology,
and Biochemistry 72(12), 3100–3106.
Yashin, A., Yashin, Y. & Nemzer, B. 2011. Determination of Antioxidant Activity in Tea
Extracts, and Their Total Antioxidant Content. American Journal of Biomedical Sciences
3(4), 322–335.
Zhou, K. & Yu, L. 2004. Effects of extraction solvent on wheat bran antioxidant activity
estimation. LWT — Food Science and Technology 37, 717–721.

1331
Agronomy Research 16(S2), 1331–1340, 2018
https://doi.org/10.15159/AR.18.005
Effect of germination and extrusion on the phenolic
content and antioxidant activity of raw buckwheat
(Fagopyrum esculentum Moench)
I. Beitane1,*, G. Krumina–Zemture1 and M. Sabovics2
1Latvia University of Life Sciences and Technologies, Faculty of Food Technology,
Department of Nutrition, Riga street 22, LV–3004 Jelgava, Latvia 2Latvia University of Life Sciences and Technologies, Faculty of Food Technology,
Department of Food Technology, Riga street 22, LV–3004 Jelgava, Latvia *Correspondence: [email protected]
Abstract. The aim of the research was to determine the total phenolic content, antioxidant activity
and phenolic compounds in raw and germinated common buckwheat grain and their extruded
products in order to estimate the effect of germination and extrusion on the total phenolic content,
antioxidant activity and phenolic compounds in buckwheat. A total of 10 buckwheat samples
were analysed, where the raw buckwheat grain was the control sample, four samples were
germinated and then extruded. The total phenolic content was determined using the Folin–
Ciocalteu assay. The antioxidant activity was determined using a micro plate assay and phenolic
compounds with Liquid Chromatography – Time of Flight Mass Spectrometer method.
The results showed that germination of buckwheat significantly affected the total phenolic
content, antioxidant activity, radical scavenging activity and content of phenolic compounds. The
decrease of the total phenolic content, antioxidant activity, radical scavenging activity and the
content of some phenolic compounds depended on germination time – 48 h of germination
provided greater concentrations at the end of a 24 h germination period, whereas the content of
some phenolic compounds like rutin, quercetin and vitexin increased substantially after
germination, besides, the increase of phenolic compounds depended on the germination time. In
total 26 different phenolic compounds were detected in raw and germinated buckwheat samples
and only one compound with an m/z value 385.1282 was unidentified. The data of extrusion
revealed a significant decrease of total phenolic content, antioxidant activity, radical scavenging
activity and phenolic compounds content in buckwheat samples (P < 0.05). In the extruded
buckwheat samples novel phenolic compounds like 4–hydroxybenzoic acid, homovanillic acid,
catechin, ferulic acid, and hyperoside were detected.
Key words: buckwheat, germination, extrusion, phenolics, antioxidant activity.
INTRODUCTION
Buckwheat grain is a pseudo–cereal which is characterized as functional food due
to its components with biological activity and healing properties like flavonoids,
phenolic acids, phytosterols, etc. (Christa & Soral–Smietana, 2008; Filipcev et al., 2011;
Torbica et al., 2012; Zhang et al., 2012). Rutin and quercetin compose the major part of
bioactive compounds in buckwheat with antioxidant, antimicrobial and anti–

1332
inflammatory activities (Halosava et al., 2002; Cai et al., 2004; Lin et al., 2009; Torbica
et al., 2012; Wronkowska et al., 2015). The quantified phenolic compounds in
buckwheat are caffeic acid, rutin, vitexin, quercitrin, quercetin and kaempferol (Peng et
al., 2017). Zhang et al. (2015) identified 11 phenolic compounds in buckwheat: orientin,
isoorientin, vitexin, isovitexin, rutin, kamperol–3–rutinoside, quercitrin, myricetin,
luteolin, quercetin and kampferol. It is known that phenolic compounds like rutin,
quercetin, etc. cannot be produced in human body, therefore it is important to take them
with food. Wang et al. (2009) observed the reduction of chronic diseases risk by using
buckwheat bran extract in vivo. Kawa et al. (2003) reported the reduction of serum
glucose level by feeding buckwheat to rats. Lu et al. (2002) concluded that regular intake
of buckwheat can reduce the blood glucose concentration and the risk of diabetes
mellitus in humans.
Germination of seeds and grain is characterized as a process with added value
because it allows one to improve the nutritional and biological value of product. Kim et
al. (2004) observed an increase of phenolic compounds like rutin and quercitrin in
buckwheat during germination, whereas Yiming et al. (2015) concluded that germination
could be a good way of accumulating rutin in buckwheat grain. Some studies reported
that an increase of phenolic compounds concentrations in buckwheat depended on
germination time: the longer the time, the faster the increase (Yiming et al., 2015; Zhang
et al., 2015).
Total phenolic content, content of phenolic compounds and antioxidant activity
could be affected by the processing of buckwheat. A reduction of content of phenolic
compounds was observed in buckwheat during heating at a temperature of 150 °C, the
loss increased by the prolongation of time (Dietrych–Szostak & Oleszek, 1999). Sensoy
et al. (2006) reported that the optimization of temperature and time during processing
(roasting or extrusion) could provide the maintenance of phenolic compounds in
buckwheat. Jozinovic et al. (2012) concluded that the extrusion of corn meal with
buckwheat flour caused the decrease of total phenolic content and antioxidant activity.
Zielinska et al. (2007) reported similar observation about the reduction of antioxidant
capacity in buckwheat after roasting. In summary, the germination of buckwheat grain
provided an improvement of biological value, but there is no information about the
extrusion effect on phenolic content and antioxidant activity in germinated buckwheat
grain. Therefore, the aim of the current research was to determine the total phenolic
content, antioxidant activity and phenolic compounds in raw and germinated buckwheat
grain and their extruded products in order to estimate the effect of germination and
extrusion on the total phenolic content, antioxidant activity and phenolic compounds in
buckwheat. The germination of buckwheat grain was carried out to increase the
biological value, to improve the digestibility and the advanced grain will be used for
production of flour or new functional products. The extrusion of raw and germinated
buckwheat grains was used for production of new products like snacks, which could
provide the consumption of buckwheat among the inhabitants of Latvia.

1333
MATERIALS AND METHODS
Materials
Buckwheat (Fagopyrum esculentum Moench) grain was purchased from the
organic farm ‘Bebri’ (Saldus area, Latvia).
Germination of buckwheat grain was performed in two time lengths (24 h or 48 h)
in the climate control chamber (Memmert, ICH110, Germany). Subsequent drying took
place at two different temperatures (40 °C or 60 °C) in the universal oven (Memmert,
UF160, Germany).(Fig. 1).
Drying after germination was performed to provide the storage of buckwheat grain
and to produce germinated buckwheat flour, which was used further for production of
extruded germinated buckwheat products. The selected time of drying was 4 hours till
the moisture content in germinated buckwheat grain reached 13–14%.
Extrusion of raw and germinated buckwheat grain was performed with the food
extruder (PCE Extrusiometer L–Serie, Göttfert, Germany; Fig. 2). The extruded raw and
germinated buckwheat grain were dried in the convective–rotary oven (SVEBA
DAHLAN, Sweden).
Figure 1. The process of obtaining germinated
buckwheat grain.
Figure 2. Technological process of
obtaining extruded raw and germinated
buckwheat products.
Methods
The total phenolic content (TPC) was determined by the Folin–Ciocalteu assay
using the high–throughput 96–well plate method as described by Herald et al. (2012)
with slight modifications. The measurement was conducted by mixing Folin–Ciocalteu
solution (1:1 with water), sodium bicarbonate and ethanolic extract. The absorbance was
measured after 90 min of incubation at 765 nm, along with the blank. TPC was expressed
Raw buckwheat grain
Washing
Soaking (10 h, 21 ± 2 °C)
Washing
Germination (24 h or 48 h, 25 ± 2 °C)
Drying (4 h, 40 ± 2 °C or 60 ± 2 °C)
Raw and germinated buckwheat grain
Milling
Mixing with water for obtaining dough
Extrusion with temperature profile 75/90/100 °C
Drying (25 min, 140 ± 2 °C)
Cooling (21 ± 2 °C)

1334
as gallic acid equivalents (GAE mg 100 g-1 DW), based on the gallic acid (GA)
calibration curve (range 0.025–0.20 mg mL-1, R2 = 0.9997). Analyses were performed
with the Infinite M200 PRO (Tecan Group Ltd., Männedorf, Switzerland) instrument in
triplicate. The bandwidth was 9 mm and temperature 24 °C.
Characterisation of antioxidant activity using micro plate assay. The DPPH method
is based on the ability to stabilize the free radical 2.2–diphenyl–picrylhydrasyl (DPPH)
to react with hydrogen donors. Antiradical activity (ARA) was determined using the
DPPH assay using the high–throughput 96–well plate method as described by Herald et
al. (2012) with slight modifications. The measurements of buckwheat extracts were done
by mixing a 150 µM DPPH solution in ethanol with an extract or standard samples. The
absorbance was measured at 517 nm, along with the blank. ARA was expressed as
ascorbic acid equivalents (AAE mg 100 g-1 DW), based on the calibration curve
(0.03–0.09 mg mL-1, R2 = 0.998). The analyses were performed on the Infinite M200
PRO (Tecan Group Ltd., Männedorf, Switzerland) instrument in triplicate. The
bandwidth was 9 mm, temperature 26.4 °C. The percentage of radical scavenging
activity of all extracts was calculated using the following formula (1):
%𝑠𝑐𝑎𝑣𝑒𝑛𝑔𝑖𝑛𝑔[𝐷𝑃𝑃𝐻] = [(𝐴0 − 𝐴1/𝐴0)] ∙ 100 (1)
where A0 – the absorbance of the blank; A1 – the absorbance in the presence of
buckwheat extract.
The content of phenolic compounds was determined with the Liquid
Chromatography –Time of Flight Mass Spectrometer (LC–TOF–MS) according to the
description offered by Klavina et al. (2015).
During LC–MS analysis, each sample produces its own base peak chromatogram
(BPC). In the positive ionization mode each compound can add a proton and can produce
its own [M+H]+ mass spectra or stay in a positively charged state as M+ molecule. Each
compound has its own chemical formula and molar mass. This chemical formula using
Mass Hunter Qualitative Analyses B.07.00 software can be used for the calculation of
[M+H]+/[M]+ which is used for the extraction of compounds from the base peak
chromatogram. Both values can be compared and the difference (Δ) between them
should not be higher than 0.0030. HRMS experiments ensure accurate mass
measurements resulting in the removal of background signals of complex matrix
interferences. It is useful for non–targeted or retrospective post–targeted identification
of unknown compounds by the processing of raw data obtained in different scan modes,
including full scan in defined m/z windows. The experimental data were handled using
the MassHunter version B07.00 software (Agilent Technologies).
All analyses were performed in triplicate.
Preparation of buckwheat extracts was carried as previously described (Carvalho et
al. 2015).
Abbreviation of buckwheat samples
In total, ten buckwheat sample types were prepared and analysed, and they were
encrypted with specific abbreviations (Table 1).

1335
Table 1. Abbreviation of buckwheat samples
Abbreviations Sample description
RB Raw buckwheat
GB–24/40 Germinated buckwheat (germination time 24 h, drying temperature 40 °C)
GB–24/60 Germinated buckwheat (germination time 24 h, drying temperature 60 °C)
GB–48/40 Germinated buckwheat (germination time 48 h, drying temperature 40 °C)
GB–48/60 Germinated buckwheat (germination time 48 h, drying temperature 60 °C)
E–RB Extruded raw buckwheat
E–GB–24/40 Extruded germinated buckwheat (germination time 24 h, drying temperature
40 °C)
E–GB–24/60 Extruded germinated buckwheat (germination time 24 h, drying temperature
60 °C)
E–GB–48/40 Extruded germinated buckwheat (germination time 48 h, drying temperature
40 °C)
E–GB–48/60 Extruded germinated buckwheat (germination time 48 h, drying temperature
60 °C)
Data processing
The data processing was performed using mathematical and statistical methods
with statistical software Microsoft Office Excel 14.0. The results of the research were
expressed as a mean ± standard deviation and analysed using the analyses of variance
(ANOVA). T–test was applied to compare the mean values and P–value at 0.05 was used
to determine the significant differences.
RESULTS AND DISCUSSION
In literature the given total phenolic content (TPC) differed depending on the
buckwheat varieties and extractions method used (Inglett et al., 2010). In research of
Vollmannova et al. (2013) TPC of five buckwheat varieties varied between
138.10–286.99 GAE mg 100 g-1 DW, whereas Mikulajova et al. (2016) evaluated 22
cultivars of buckwheat, and TPC ranged from 89.7 to 145.6 GAE mg 100 g-1 DW. Unal
et al. (2017) reported significant differences between commercial buckwheat and Güneş
variety (207.12 ± 2.67 GAE mg 100 g-1 DW and 329.83 ± 3.88 GAE mg 100 g-1 DW,
respectively). Comparing the literature data with the results of this study about raw
buckwheat (Table 2) similar or lower total phenolic content was determined where the
differences could be explained by various determination methods used. Analysing the
influence of germination on TPC, a significant decrease in TPC of buckwheat samples
(P < 0.05) was observed. Furthermore, the decrease of TPC depended on the
germination time (48 h of germination provided a greater concentration of TPC) and
drying temperature after germination (a lower temperature provided a lower decrease of
TPC). The greatest concentration of TPC among the germinated buckwheat samples was
observed in GB–48/40. The rapid decrease of TPC during germination of first 24 h could
be explained by a high demand of energy at the beginning of germination (Jia et al.,
2015), whereas a greater TPC after 48 h of germination could be associated with single
phenolic compounds increase during germination according to literature (Yiming et al.,
2015; Zhang et al., 2015).

1336
Table 2. Total phenolic content, antiradical activity and radical scavenging activity of raw and
germinated buckwheat and their extruded products
Samples TPC
GAE mg 100 g-1 DW
ARA
AAE mg 100g-1 DW
DPPH
%
RB 132.85 ± 1.03a 90.56 ± 0.51a 94.76 ± 0.48a
GB–24/40 74.13 ± 2.05c 48.39 ± 0.06c 55.03 ± 0.06c
GB–24/60 66.44 ± 1.41c 39.49 ± 0.54d 44.43 ± 0.48d
GB–48/40 96.92 ± 1.18b 64.88 ± 0.59b 71.81 ± 0.56b
GB–48/60 90.81 ± 1.80b 49.73 ± 1.31c 54.79 ± 1.19c
E–RB 34.14 ± 0.70d 12.48 ± 0.09e 21.20 ± 0.08e
E–GB–24/40 28.13 ± 0.11d 10.90 ± 0.60e 19.85 ± 0.55e
E–GB–24/60 30.90 ± 0.84d 9.62 ± 0.05e 18.66 ± 0.05e
E–GB–48/40 31.62 ± 1.08d 13.89 ± 0.01e 22.70 ± 0.01e
E–GB–48/60 28.99 ± 0.65d 9.76 ± 0.09e 18.66 ± 0.08e
Different letters indicate statistically significant difference between buckwheat samples (P < 0.05).
After extrusion of raw and germinated buckwheat samples, a significant decrease
of TPC (P < 0.05) was observed which was in concordance with literature (Jozinovic et
al., 2012). Similar conclusions were reported by Hes et al. (2014) stating that TPC was
affected by the boiling of buckwheat groats where the temperature was close to the
maximum temperature of extrusion in this study and by Wronkowska et al. (2015) that
after roasting buckwheat TPC was two times lower. In this research the losses of total
phenolic content after extrusion composed 74.3% in E–RB and 53.49–68.08% in E–GB
samples.
Similar trends were observed for antiradical activity (ARA) and radical scavenging
activity (DPPH) of raw and germinated buckwheat grain and their extruded products.
The highest ARA and DPPH were determined for raw buckwheat grain (P < 0.05).
Germination and extrusion processes significantly affected the decrease of ARA and
DPPH in buckwheat samples (P < 0.05). The decrease of ARA in buckwheat was 1.89
or 2.29 times by 24 h germination and 1.40 or 1.82 times by 48 h germination, whereas
the extrusion decreased ARA 7.26 times in raw buckwheat and 4.10–5.09 times in
germinated buckwheat samples. The decrease of DPPH was close to the results of ARA
in germinated buckwheat samples but not so critical as the results of ARA in extruded
buckwheat products. In literature there are reports about an increase of radical
scavenging activity in buckwheat during germination, and there are indications that
germination for 72 h showed the highest DPPH (Zhang et al., 2015). These conclusions
have not been confirmed in the current research. The differences could be explained by
different germination methods: in this research germinated buckwheat was dried, while
in the research of Zhang et al. (2015) it was lyophilized.
In total, 26 different phenolic compounds were separated from raw and germinated
buckwheat samples: catechin hydrate, chlorogenic acid, vanillic acid, caffeic acid,
epicatechin, syringic acid, vanillin, p–coumaric acid, sinapic acid, 2–OHcinnamic acid,
rutin, quercetin, 2–hydroxy–3–O–b–D-glucopyranosyl–benzoic acid, caffeic acid
hexose, swertiamacroside, flavonol–glycosides, catechin–glucosides, epicatechin
gallate, (epi)afzelchin–(epi) catechin isomer, vitexin, epiafzelchin–epicatechin–O–
methylgallate, (–)epicatechin–O–3.4-dimethyl–gallate, epiafzelchin–epicatechin–O–
dimethylgallate, procyanidin B2–dimethylgallate, and epiafzelchin–epiafzelchin–
epicatechin. Only one compound with m/z value 385.1282 was unidentified.

1337
The main phenolic compounds of buckwheat samples are given in Table 3. The
research data confirmed the conclusions found in literature that buckwheat grain contains
high level of flavonoids, especially rutin.
Table 3. Phenolic compounds of raw and germinated buckwheat grain and their extruded
products, mg 100 g-1 DW
Sam
ple
s
Ep
icat
ech
in
C1
5H
14
O6
Ru
tin
C2
7H
30
O1
6
Qu
erce
tin
C1
5H
10
O7
Cat
ech
in–
glu
cosi
des
C2
1H
24
O1
1
Vit
exin
C2
1H
20
O1
0
Ep
iafz
elch
in–
epic
atec
hin
–O
–
dim
eth
ylg
alla
te
C3
9H
34
O1
5
RB 39.13a 16.38b 3.84b 165.93a 1.44cd 59.89a
GB–24/40 19.89b 19.59b 4.96b 95.88b 2.25c 20.64b
GB–24/60 14.14b 18.91b 4.79b 91.18b 2.28c 14.44c
GB–48/40 38.34a 32.44a 9.71a 81.84c 63.26a 18.74b
GB–48/60 41.18a 31.21a 8.95a 92.39b 63.34a 15.50c
E–RB 7.36c 5.51c 1.48c n.d. 2.44c 5.50d
E–GB–24/40 4.79c 3.98c 0.95c n.d. 1.13cd 3.25e
E–GB–24/60 4.38c 3.59c 0.96c n.d. 0.95d 2.55e
E–GB–48/40 4.37c 3.48c 0.82c n.d. 6.36b 2.29e
E–GB–48/60 4.35c 3.91c 1.04c n.d. 8.09b 2.05e
n.d. – not detected;
Different letters indicate statistically significant difference between buckwheat samples (P < 0.05).
Comparing the rutin content of raw buckwheat grain in this research with the data
from literature, similar or lower levels of rutin were established. For example, Qin et al.
(2010) reported that rutin content in 18 cultivars of common buckwheat ranged between
15.0 and 16.8 mg 100 g-1 DW. In the study of Kiprovski et al. (2015) it was indicated
that rutin content in buckwheat seeds was from 3.29 to 151.45 mg 100 g-1 DW.
Vollmannova et al. (2013) revealed that rutin content of 5 cultivars of buckwheat was
between 30.99 and 50.77 mg 100 g-1 DW. It confirmed the conclusions of literature that
rutin content depends on the cultivars, species – common or tartary, and growth
conditions (Qin et al., 2010; Mikulajova et al., 2016).
High amounts of epicatechin, catechin-glucosides and epiafzelchin–epicatechin–
O–dimethylgallate were determined in raw buckwheat grain. Quercetin content in raw
buckwheat grain was lower compared to other phenolic compounds, except vitexin, but
high enough compared to literature data where quercetin content in raw common
buckwheat groats was reported to be 0.167 mg 100 g-1 DW (Hes et al., 2014).
Furthermore, in the study of Qin et al. (2010) quercetin was determined only in two
cultivars among 18 common buckwheat samples.
After the germination of raw buckwheat grain a significant increase of rutin,
quercetin and vitexin was observed. It confirmed the conclusions arrived at in literature
that during germination the content of rutin and quercitrin increased gradually (Kim et
al., 2004) or that the content of orientin, isoorientin, vitexin, isovitexin, rutin, kamperol–
3–rutinoside, quercitrin and kaempferol increased during germination but quercetin was
detected only in 24 h of germination (Zhang et al., 2015). Yiming et al. (2015) did not
observe regular changes of rutin and quercetin content during germination, though the

1338
total flavonoid content was greater in buckwheat after germination. Similar observation
was with regard to epicatechin content of germinated buckwheat grain in this research.
The content of catechin-glucosides and epiafzelchin–epicatechin–O–dimethylgallate in
raw buckwheat grain decreased after germination. The increase or decrease of phenolic
compounds was affected by the germination time – 48 h of germination provided a
substantial increase of rutin (approximately 1.9 times), quercetin (approximately
2.5 times) and vitexin (approximately 44.0 times). The other phenolic compounds the
content of which increased after 48 h of germination were catechin hydrate, vanillic acid,
vanillin, p-coumaric acid, sinapic acid, caffeic acid hexose, and flavonol–glycosides.
Similar results regarding the effect of germination time on the content of rutin, quercetin
and vitexin had been obtained by Zhang et al. (2015).
The data of extrusion revealed a significant decrease of phenolic compounds in
buckwheat samples (P < 0.05) which could be a consequence of high temperatures and
heating time. The decrease of rutin concentration in E–RB was 66.36% and in E–GB
samples – 79.68–89.27% comparing to RB and GB samples, respectively. The losses of
quercetin were 2.59 times higher in E–RB than in RB samples and 4.99–11.84 times
higher in E–GB samples compared to GB samples. Wronkowska et al. (2015) also
reported a decrease of rutin in roasted buckwheat groats, but it was 23% and the losses
of phenolic compounds were twofold, whereas Choy et al. (2013) reported about a
substantial drop of rutin in instant noodles with buckwheat flour during the cooking
process.
In addition, in certain extruded buckwheat samples novel phenolic compounds
were detected, such as 4–hydroxybenzoic acid (1.51 mg 100 g-1 DW in E–RB, 0.725–
0.785 mg 100 g-1 DW in E–GB samples), homovanillic acid (0.13 mg 100 g-1 DW in
E–RB, 0.277–0.962 mg 100 g-1 DW in E–GB samples), catechin (3.97 mg 100 g-1 DW
in E–RB, 2.599–3.190 mg 100 g-1 DW in E–GB samples), ferulic acid
(7.42 mg 100 g-1 DW in E–RB, 1.253–3.595 mg 100 g-1 DW in E–GB samples), and
hyperoside (0.900 mg 100 g-1 DW in E–RB, 0.521–0.694 mg 100 g-1 DW in E–GB
samples), but vanillic acid, swertiamacroside, and catechin–glucosides were not
detected. Consequently, they were not included in Table 3, because only some extruded
products contained them.
CONCLUSIONS
By selecting the optimum germination time of raw buckwheat it is possible to
increase the content of rutin, quercetin and vitexin. In further studies the germination
time of buckwheat should be prolonged to 72 h in order to retain a higher content of
phenolic compounds after extrusion. Extrusion had a negative effect on the content of
phenolic compounds and their antioxidant activity. There is a need for more profound
research to be carried out regarding the possibilities of decreasing the negative effect of
extrusion on phenolic compounds in buckwheat by changing the temperature profile
during extrusion.
ACKNOWLEDGEMENTS. This research was supported by National Research Programme
AgroBioRes (2014–2017) and the project ‘Strengthening Research Capacity in the Latvia
University of Life Sciences and Technologies’.

1339
REFERENCES
Cai, Y.Z., Corke, H. & Li, W.D. 2004. Buckwheat. In Wrigley, C.W., Corke, H. & Walker, C.E.
(eds.): The Encyclopedia of Grain Science. Vol. 1, Elsiever Academic Press, Oxford UK,
pp.120–128.
Carvalho, D.O., Curto, A.F. & Guido, L.F. 2015. Determination of phenolic content in different
barley varieties and corresponding malts by liquid chromatography-diode array detection –
electrospray ionization tandem mass spectrometry. Antioxidants 4, 563–576.
Choy, A.L., Morrison, P.D., Hughes, J.G., Marriott, P.J. & Small, D.M. 2013. Quality and
antioxidant properties of instant noodles enhanced with common buckwheat flour. Journal
of Cereal Science 57, 281–287.
Christa, K. & Soral-Smietana, M. 2008. Buckwheat grains and buckwheat products – nutritional
and prophylactic value of their components – a Review. Czech Journal of Food Sciences
26, 153–162.
Dietrych-Szostak, D. & Oleszek, W. 1999. Effect of processing on the flavonoid content in
buckwheat (Fagopyrum esculentum Moench) grain. Journal of Agricultural and Food
Chemistry 47, 4384–4387.
Filipcev, B., Simurina, O., Bodroza-Solarov, M. & Vujakovic, M. 2011. Evaluation of physical,
textural and microstructural properties of dough and honey biscuits enriched with
buckwheat and rye. Chemical Industry & Chemical Engineering Quarterly 17, 291–298.
Halosava, M., Fiedlerova, V., Smrcinova, H., Orsak, M., Lachman, L. & Vavreinova, S. 2002.
Buckwheat – the source of antioxidant activity in functional foods. Food Research
International 35, 207–211.
Herald, T.J., Gadgil, P. & Tilley, M. 2012. High-throughput micro plate assays for screening
flavonoid content and DPPH-scavenging activity in sorghum bran and flour. Journal of the
Science of Food and Agriculture 92, 2326–2331.
Hes, M., Dziedzic, K., Gorecka, D., Drozdzynska, A. & Gujska, E. 2014. Effect of boiling in
water of barley and buckwheat groats on the antioxidant properties and dietary fiber
composition. Plant Foods for Human Nutrition 69, 276–282.
Inglett, G.E., Rose, D.J., Chen, D., Stevenson, D.G. & Biswas, A. 2010. Phenolic content and
antioxidant activity of extracts from whole buckwheat (Fagopyrum esculentum Moench)
with or without microwave irradiation. Food Chemistry 119, 1216–1219.
Jia, C.F., Hu, W.H., Chang, Z. & Gao, H.L. 2015. Acid α-galactosidase is involved in D–chiro–
inositol accumulation during tartary buckwheat germination. Acta Societatis Botanicorum
Poloniae 84, 53–58.
Jozinovic, A., Subaric, D., Ackar, D., Babic, J., Klaric, I., Kopjar, M. & Lendic, K.V. 2012.
Influence of buckwheat and chestnut flour addition on properties of corn extrudates.
Croatian Journal of Food Science and Technology 4, 26–33.
Kawa, J.M., Taylor, C.G. & Przybylski, R. 2003. Buckwheat concentrate reduces serum glucose
in streptozotocin–diabetic rats. Journal of Agricultural and Food Chemistry 51, 7287–7291.
Kim, S.L., Kim, S.K. & Park, C.H. 2004. Introduction and nutritional evaluation of buckwheat
sprouts as a new vegetable. Food Research International 37, 319–327.
Kiprovski, B., Mikulic–Petkovsek, M., Slatnar, A., Veberic, R., Stampar, F., Malencic, D. &
Latkovic, D. 2015. Comparison of phenolic profiles and antioxidant properties of European
Fagopyrum esculentum cultivars. Food Chemistry 185, 41–47.
Klavina, L., Springe, G., Nikolajeva, V., Martsinkevich, I., Nakurte, I., Dzabijeva, D.,
Steinberga, I. 2015. Chemical composition of analysis, antimicrobial activity and
cytotoxicity screening of moss extracts (Moss phytochemistry). Molecules 20(9), 17221–
17243.
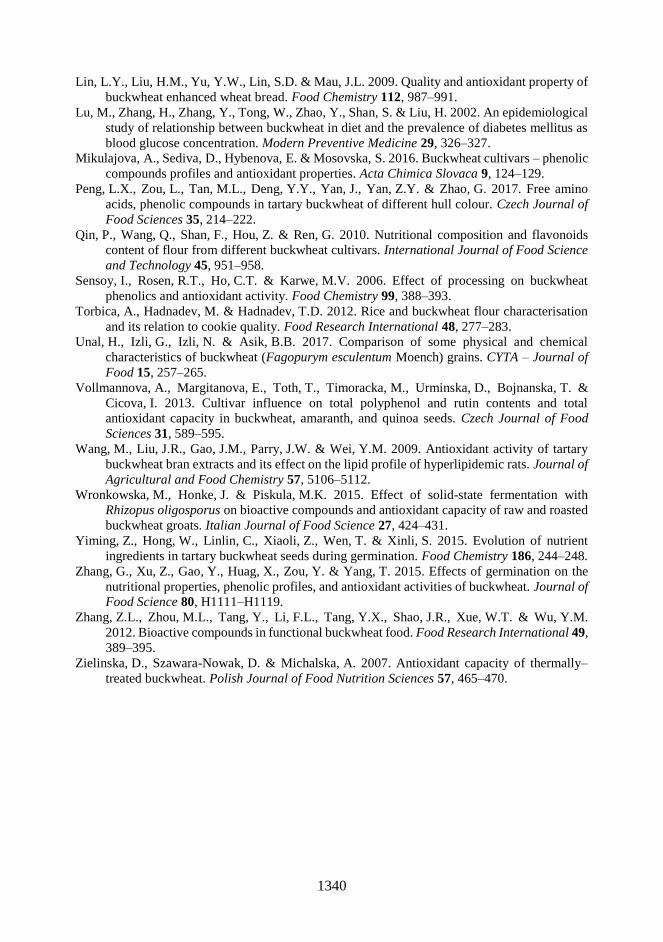
1340
Lin, L.Y., Liu, H.M., Yu, Y.W., Lin, S.D. & Mau, J.L. 2009. Quality and antioxidant property of
buckwheat enhanced wheat bread. Food Chemistry 112, 987–991.
Lu, M., Zhang, H., Zhang, Y., Tong, W., Zhao, Y., Shan, S. & Liu, H. 2002. An epidemiological
study of relationship between buckwheat in diet and the prevalence of diabetes mellitus as
blood glucose concentration. Modern Preventive Medicine 29, 326–327.
Mikulajova, A., Sediva, D., Hybenova, E. & Mosovska, S. 2016. Buckwheat cultivars – phenolic
compounds profiles and antioxidant properties. Acta Chimica Slovaca 9, 124–129.
Peng, L.X., Zou, L., Tan, M.L., Deng, Y.Y., Yan, J., Yan, Z.Y. & Zhao, G. 2017. Free amino
acids, phenolic compounds in tartary buckwheat of different hull colour. Czech Journal of
Food Sciences 35, 214–222.
Qin, P., Wang, Q., Shan, F., Hou, Z. & Ren, G. 2010. Nutritional composition and flavonoids
content of flour from different buckwheat cultivars. International Journal of Food Science
and Technology 45, 951–958.
Sensoy, I., Rosen, R.T., Ho, C.T. & Karwe, M.V. 2006. Effect of processing on buckwheat
phenolics and antioxidant activity. Food Chemistry 99, 388–393.
Torbica, A., Hadnadev, M. & Hadnadev, T.D. 2012. Rice and buckwheat flour characterisation
and its relation to cookie quality. Food Research International 48, 277–283.
Unal, H., Izli, G., Izli, N. & Asik, B.B. 2017. Comparison of some physical and chemical
characteristics of buckwheat (Fagopurym esculentum Moench) grains. CYTA – Journal of
Food 15, 257–265.
Vollmannova, A., Margitanova, E., Toth, T., Timoracka, M., Urminska, D., Bojnanska, T. &
Cicova, I. 2013. Cultivar influence on total polyphenol and rutin contents and total
antioxidant capacity in buckwheat, amaranth, and quinoa seeds. Czech Journal of Food
Sciences 31, 589–595.
Wang, M., Liu, J.R., Gao, J.M., Parry, J.W. & Wei, Y.M. 2009. Antioxidant activity of tartary
buckwheat bran extracts and its effect on the lipid profile of hyperlipidemic rats. Journal of
Agricultural and Food Chemistry 57, 5106–5112.
Wronkowska, M., Honke, J. & Piskula, M.K. 2015. Effect of solid-state fermentation with
Rhizopus oligosporus on bioactive compounds and antioxidant capacity of raw and roasted
buckwheat groats. Italian Journal of Food Science 27, 424–431.
Yiming, Z., Hong, W., Linlin, C., Xiaoli, Z., Wen, T. & Xinli, S. 2015. Evolution of nutrient
ingredients in tartary buckwheat seeds during germination. Food Chemistry 186, 244–248.
Zhang, G., Xu, Z., Gao, Y., Huag, X., Zou, Y. & Yang, T. 2015. Effects of germination on the
nutritional properties, phenolic profiles, and antioxidant activities of buckwheat. Journal of
Food Science 80, H1111–H1119.
Zhang, Z.L., Zhou, M.L., Tang, Y., Li, F.L., Tang, Y.X., Shao, J.R., Xue, W.T. & Wu, Y.M.
2012. Bioactive compounds in functional buckwheat food. Food Research International 49,
389–395.
Zielinska, D., Szawara-Nowak, D. & Michalska, A. 2007. Antioxidant capacity of thermally–
treated buckwheat. Polish Journal of Food Nutrition Sciences 57, 465–470.

1341
Agronomy Research 16(S2), 1341–1350, 2018
https://doi.org/10.15159/AR.18.136
The measurement of energy consumption during milling
different cereals using the sieve analyses
L. Chladek*, P. Vaculik and A. Vagova
Czech University of Life Sciences Prague, Faculty of Engineering, Department
of Technological Equipment of Buildings, Kamýcká 129, CZ165 21 Prague 6 - Suchdol,
Czech Republic *Correspondence: [email protected]
Abstract. This paper deals with the measurement of energy consumption required for disintegration of different cereals depending on the desired fineness of obtained grist. The energy consumption necessary for milling was compared with the results of a sieve analysis before and after the disintegration process. The obtained results were compared with energy expended during the disintegration of cereals and were analysed to determine the coefficients of the ratio of fineness of milling/energy consumption. They was found to have good conformity. Special attention was paid to the RRSB distribution for determination of statistic average particle size and specific area of malt grist. Specific area of grist particles from different cereals was determined by calculation of the limited area and x axis in diagrams, this effort is necessary for optimisation of the disintegration process with impact on the quality of final food.
Key words: cereals, two roller mill, hammer mill, sieve analysis, electric energy consumption.
INTRODUCTION
Milling in food processing is the mechanical process of grain disintegration of
different cereals in order to increase the surface area of cereal kernels for easier access of enzymes, water or other liquids, and biochemical processes, for example the transfer of starch into simple sugar or heat and mass transfer and so on (Chládek, 1976; Hardwick, 1995; Kunze, 2010). Milling can be either dry or wet. In the agricultural and food industry, two-, four-, five- and six-roller mills, hammer mills, and different disintegrators (dispersion milling) are frequently used for dry milling. For wet milling, only two-roller mills are suitable. The experimental activities involving those these types of equipment are meant to determine electric energy consumption during disintegration (Chládek, 2007; Basařová et al., 2010; Vaculík et al., 2013). In prehistoric times, the barley and husked wheat (Triticum dicoccum) used for human food were dehusked by pounding the grain in mortars. The invention of rotary grain mills, for grinding ordinary bread wheats (T. aestivum), is attributed to the Romans in the second century B.C. Thereafter, until the development of the rollermill in the mid-nineteenth century, wheat was ground by stone-milling. Today, even in industrial countries, some stone milling is carried out to meet special demands. A stone mill consists of two discs of hard, abrasive stone, approximately 1.20 m in diameter, arranged on a vertical axis. The types of stone used include French burr from La Ferté-sous-Jouarre, Seine-et-Marte, millstone
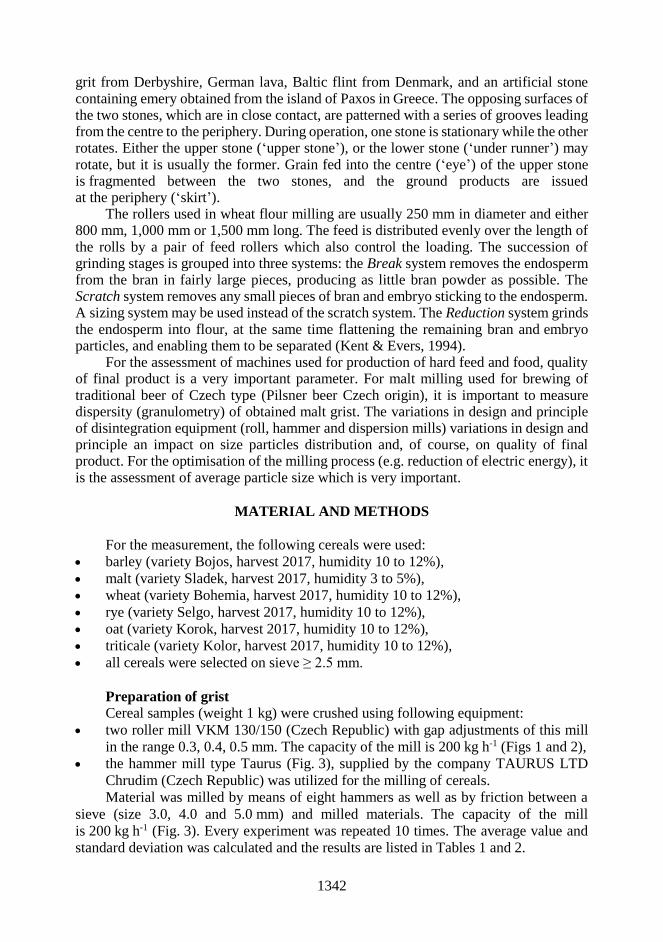
1342
grit from Derbyshire, German lava, Baltic flint from Denmark, and an artificial stone containing emery obtained from the island of Paxos in Greece. The opposing surfaces of the two stones, which are in close contact, are patterned with a series of grooves leading from the centre to the periphery. During operation, one stone is stationary while the other rotates. Either the upper stone (‘upper stone’), or the lower stone (‘under runner’) may rotate, but it is usually the former. Grain fed into the centre (‘eye’) of the upper stone is fragmented between the two stones, and the ground products are issued at the periphery (‘skirt’).
The rollers used in wheat flour milling are usually 250 mm in diameter and either 800 mm, 1,000 mm or 1,500 mm long. The feed is distributed evenly over the length of the rolls by a pair of feed rollers which also control the loading. The succession of grinding stages is grouped into three systems: the Break system removes the endosperm from the bran in fairly large pieces, producing as little bran powder as possible. The Scratch system removes any small pieces of bran and embryo sticking to the endosperm. A sizing system may be used instead of the scratch system. The Reduction system grinds the endosperm into flour, at the same time flattening the remaining bran and embryo particles, and enabling them to be separated (Kent & Evers, 1994).
For the assessment of machines used for production of hard feed and food, quality of final product is a very important parameter. For malt milling used for brewing of traditional beer of Czech type (Pilsner beer Czech origin), it is important to measure dispersity (granulometry) of obtained malt grist. The variations in design and principle of disintegration equipment (roll, hammer and dispersion mills) variations in design and principle an impact on size particles distribution and, of course, on quality of final product. For the optimisation of the milling process (e.g. reduction of electric energy), it is the assessment of average particle size which is very important.
MATERIAL AND METHODS
For the measurement, the following cereals were used:
barley (variety Bojos, harvest 2017, humidity 10 to 12%),
malt (variety Sladek, harvest 2017, humidity 3 to 5%),
wheat (variety Bohemia, harvest 2017, humidity 10 to 12%),
rye (variety Selgo, harvest 2017, humidity 10 to 12%),
oat (variety Korok, harvest 2017, humidity 10 to 12%),
triticale (variety Kolor, harvest 2017, humidity 10 to 12%),
all cereals were selected on sieve ≥ 2.5 mm.
Preparation of grist Cereal samples (weight 1 kg) were crushed using following equipment:
two roller mill VKM 130/150 (Czech Republic) with gap adjustments of this mill
in the range 0.3, 0.4, 0.5 mm. The capacity of the mill is 200 kg h-1 (Figs 1 and 2),
the hammer mill type Taurus (Fig. 3), supplied by the company TAURUS LTD
Chrudim (Czech Republic) was utilized for the milling of cereals.
Material was milled by means of eight hammers as well as by friction between a
sieve (size 3.0, 4.0 and 5.0 mm) and milled materials. The capacity of the mill
is 200 kg h-1 (Fig. 3). Every experiment was repeated 10 times. The average value and
standard deviation was calculated and the results are listed in Tables 1 and 2.

1343
Figure 1. Two roller
mill VKM 130/150.
Figure 2. Two rollers
(view from below).
Figure 3. Hammer mill Taurus.
Sieve analysis of grist For the determination of crushed malt dispersity, a test sieve shaker (sieve analyzer)
HAVER EML 200 digital plus T (Germany) (Fig. 4). The experiment used a test sieve
shaker 2.50, 2.00, 1.60, 1.40, 1.25, 1.00, 0.80, 0.63, 0.50, 0.40, 0.315, 0.25, 0.20, 0.16,
0.125, 0.09 and 0.063 mm (17 pcs) including the bottom. For the measurement of oat
grist, 19 sieves were used (because of extremely big oat particles sieves of 3.15 mm and
4.0 mm were added). For the weighing of malt and other cereals samples (1,000 g) and
fractions from test sieves, a digital laboratory scale KERN PEJ 2200 – 2M (Germany)
(Fig. 5), weighing range 0 to 2,200 g, weighing accuracy +/- 0.01 g was used.
Figure 4. The test sieve shaker (sieve
analyzation).
Figure 5. Digital laboratory scale KERN PEJ
HAVER EML 200 digital plus T 2 200 – 2M.
The method of evaluation of the test sieving data This method is described by Maloun (2001). The data obtained from the sieve
analysis is relatively difficult to evaluate in a reproducible way. Therefore, a graphical
interpretation of the data is often used as it helps in more easily imagining the analytical
form of the function (which describes the granulometric composition of the sample).
From the analytical form of the function, it is possible to obtain the essential
characteristics of the bulk materials. There are important characteristics such as,
‘the co-efficient of polydispersity’ and the mean statistical size of the particle x which
determines the precision of milling.

1344
This non-symmetry does not allow for the standard distribution. RRSB
distribution – an exponential relation by Rosin, Rammler and Sperling – was invented
for the fine grained materials. According to Bennett modification of this relation, it is
possible to express the proportional evaluation of the relative residue on the sieve as
(Maloun, 2001):
n
x
xR exp100 [%] (1)
where R – the relative residue on the sieve (%); x – the dimension of separate particle
(mm); x – is the main statistical size of the particle (mm); n – the material constant.
Because the shape of the curve is not suitable for graphical expression,
the distribution function can be linearized:
n
x
x
Rexp
100[%] (2)
and yields the relation:
CxnR
log
100loglog (3)
where xneC logloglog
which in turn givesY and X values:
RY
100loglog ; xX log (4)
The x value is defined by the inflexion point of the distribution function curve,
which is given by the particular value of the cumulative relative residue. This is possible
to obtain from the equation:
0)( Rf
that means from:
0100
loglog
Ry (5)
If the calculated second derivative is set equal to zero, the value of the relative
residue corresponding to the point of inflexion is obtained:
𝑅 =100
𝑒= 36.79 [%] (6)
For the calculated value there is given x = x . It is possible to locate the x value
from the diagram (Maloun, 2001; Chládek et al., 2013; Smejtková et al., 2016).
On the base of results obtained from different cereals, diagrams were constructed
in which the axis x represents the sizes of sieve holes and the axis y is the mass of the
fractions curves on the sieves (log log (100/R)).
The resulting area between the measured points and the x axis was measured
and compared to the electricity input (log x); the obtained results are listed in tables 1
and 2 and discussed in the ‘Results and discussion’ section.

1345
Determination of electric energy consumption during milling of different
cereals For exact determination of electric energy consumption during milling of different
cereals, the three-phase power quality analyzer C.A 8332 device (Fig. 6), supplied by
the French company Chauvin, was used. This compact device, shock resistant, with
graphic representation, enables an instant image of network´s principal characteristics to
be obtained and of their variation over a period of time to be monitored.
Figure 6. Three-phase power quality analyzer C.A 8332 for electric energy consumption
measurement.
The multi-task measurement system simultaneously handles all the measurement
functions of various magnitudes, detection, and continuous recording without any
constraints. The device is designed for the following activities: measurements of AC rms
voltages up to 480 V (phase to neutral) or 830 V (phase to phase); measurements of AC
up to 3,000 A. Measurements of the frequency 50 and 60 Hz and other parameters.
Using the above mentioned RRSB theory, the middle particle size and area between
the curve and axle x both parameters were compared, and good agreement was observed.
RESULTS AND DISCUSSION
Results of sieve analysis of different cereal grist were evaluated and expressed in
following ways:
as a size of surface area limited by the distribution curve and axle x (Fig. 7),
as a statistical average size of the particle and standard deviation.
Those figures, depending on gap /sieve) size, type of cereals and measured
electricity inputs are listed in Tables 1 and 2. The size of this area corresponds to the average size of particle. For evaluation, this
parameter was divided by initial size of particle 2.5 mm. At the start of measurement, the electricity consumption of roller and hammer mills during idling was determined and the measured value was calculated.
For cereals (the weight of every sample was 1.0 kg, size ≥ 2.5 mm, measured 10 times), durations of crushing of every sample were in the range 16 to 18 seconds.
Durations of sieve analysis of every sample were in the range 120 to 200 minutes. The calculated average size of grist particle and standard deviation were obtained from these results. All experimental data are shown in Tables 1 and 2.

1346
Figure 7. The determination example of the area size limited by the distribution curve and x-axis
for malt grist.
Table 1. Two-roller mill - the dependence of power on the middle size of grist particles and
different gap size
No Cereals Gap
Area
beneath
curve
Average
size of
particle
Standard
deviation
Initial
dimension/
standard
deviation
Input
Input/
middle
size
mm mm2 mm mm mm kW kW mm-1
Two-roller mill – gap 0.3 mm
1.0 Idling 0.3 - - - - 0.52 -
1.1 Barley grist 0.3 9,965 1.09 0.18 2.29 1.26 1.15
1.2 Malt grist 0.3 9,442 0.89 0.25 2.81 0.81 0.91
1.3 Wheat grist 0.3 8,362 1.56 0.27 1.60 1.36 0.87
1.4 Rye grist 0.3 10,220 1.47 0.14 1.70 1.72 1.17
1.5 Oat grist 0.3 6,002 1.96 0.21 1.28 0.92 0.46
1.6 Triticale grist 0.3 8,149 1.53 0.19 1.63 1.21 0.79
Two-roller mill – gap 0.4 mm
2.0 Idling 0.4 - - - - 0.52 -
2.1 Barley grist 0.4 9,572 1.29 0.15 1.94 1.20 0.93
2.2 Malt grist 0.4 9,085 1.01 0.19 2.48 0.74 0.73
2.3 Wheat grist 0.4 8,029 1.78 0.28 1.40 1.25 0.70
2.4 Rye grist 0.4 9,794 1.68 0.26 1.49 1.60 0.95
2.5 Oat grist 0.4 5,720 2.20 0.11 1.14 0.82 0.37
2.6 Triticale grist 0.4 7,947 1.62 0.21 1,54 0.97 0.59
Two-roller mill – gap 0.5 mm
3.0 Idling 0.5 - - - - 0.52 -
3.1 Barley grist 0.5 8,529 2.21 0.08 1.13 1.06 0.47
3.2 Malt grist 0.5 8,237 1.20 0.15 2.08 0.71 0.59
3.3 Wheat grist 0.5 7,005 2.12 0.11 1.18 1.16 0.54
3.4 Rye grist 0.5 8,739 2.08 0.30 1.20 1.47 0.70
3.5 Oat grist 0.5 5,198 2.15 0.19 0.86 0.71 0.26
3.6 Triticale grist 0.5 7,361 1.79 0.24 1.57 0.87 0.48

1347
Table 2. Hammer mill - the dependence of power on the middle size of grist particles and
different size of sieve
No Cereals Sieve
Area
beneath
curve
Average
size of
particle
Standard
deviation
Initial
dimension/
standard
deviation
Input
Input/
middle
size
mm mm2 mm mm mm kW kW mm-1
Hammer mill – sieve 3.0 mm
4.0 Idling 3.0 - - - - 0.76 -
4.1 Barley grist 3.0 9,178 0.93 0.16 2.69 2.90 3.12
4.2 Malt grist 3.0 11,421 0.59 0.11 4.24 1.80 3.05
4.3 Wheat grist 3.0 10,514 0.84 0.14 2.98 3.20 3.80
4.4 Rye grist 3.0 9,261 1.04 0.19 2.40 4.30 4.13
4.5 Oat grist 3.0 9,612 0.89 0.22 2.81 4.90 5.50
4.6 Triticale grist 3.0 9,815 0.88 0.25 2.85 3.70 4.20
Hammer mill – sieve 4.0 mm
5.0 Idling 4.0 - - - - 0.76 -
5.1 Barley grist 4.0 8,437 0.96 0.14 2.60 2.69 2.80
5.2 Malt grist 4.0 10,426 0.63 0.19 3.97 1.71 2.71
5.3 Wheat grist 4.0 9,763 0.93 0.24 2.69 2.98 3.20
5.4 Rye grist 4.0 8,259 1.07 0.24 2.34 4.06 3.74
5.5 Oat grist 4.0 8,487 1.05 0.28 2.38 4.58 4.36
5.6 Triticale grist 4.0 9,294 0.89 0.19 2.81 3.49 3.92
Hammer mill – sieve 5.0 mm
6.0 Idling 5.0 - - - - 0.76 -
6.1 Barley grist 5.0 8,155 1.02 0.11 2.45 2.55 2.50
6.2 Malt grist 5.0 10,095 0.68 0.21 3.68 1.68 2.47
6.3 Wheat grist 5.0 9,258 1.07 0.27 2.34 2.45 2.29
6.4 Rye grist 5.0 8,014 1.11 0.15 2.25 3.98 3.59
6.5 Oat grist 5.0 8,298 1.13 0.29 2.21 4.49 3.97
6.6 Triticale grist 5.0 8,928 0.91 0.16 2.75 3.38 3.71
The following figures (Figs 8, 9 and 10) illustrate the area, limited by curve and
x-axis, average size of particle and electricity input depending on cereals, type of milling
equipment, and gap and sieve size.
Figure 8. The results - the area limited by the distribution curve and x-axis.
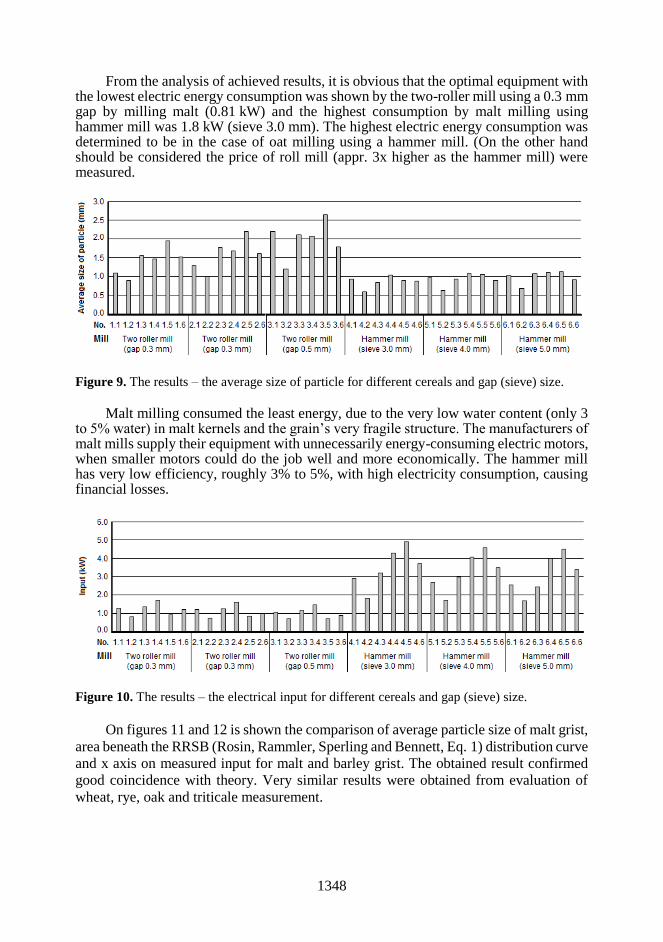
1348
From the analysis of achieved results, it is obvious that the optimal equipment with the lowest electric energy consumption was shown by the two-roller mill using a 0.3 mm gap by milling malt (0.81 kW) and the highest consumption by malt milling using hammer mill was 1.8 kW (sieve 3.0 mm). The highest electric energy consumption was determined to be in the case of oat milling using a hammer mill. (On the other hand should be considered the price of roll mill (appr. 3x higher as the hammer mill) were measured.
Figure 9. The results – the average size of particle for different cereals and gap (sieve) size.
Malt milling consumed the least energy, due to the very low water content (only 3
to 5% water) in malt kernels and the grain’s very fragile structure. The manufacturers of malt mills supply their equipment with unnecessarily energy-consuming electric motors, when smaller motors could do the job well and more economically. The hammer mill has very low efficiency, roughly 3% to 5%, with high electricity consumption, causing financial losses.
Figure 10. The results – the electrical input for different cereals and gap (sieve) size.
On figures 11 and 12 is shown the comparison of average particle size of malt grist,
area beneath the RRSB (Rosin, Rammler, Sperling and Bennett, Eq. 1) distribution curve
and x axis on measured input for malt and barley grist. The obtained result confirmed
good coincidence with theory. Very similar results were obtained from evaluation of
wheat, rye, oak and triticale measurement.

1349
Figure 11. The comparison of impact of average size of grist and area beneath the curve on input
for malt grist.
Figure 12. The comparison of impact of average size of grist and area limited by the curve and
x-axis on electric input for barley grist.
CONCLUSIONS
All results obtained from sieve analysis and measurement of electricity input are in
close agreement and can be used for optimization of electricity consumption during
disintegration processes used for feed and food industry.
ACKNOWLEDGEMENTS. The authors have the honor to thank their colleagues J. Volf, J. Frýdl
and M. Křížek, from the Department of Electrical Engineering and Automation, Faculty of
Engineering, Czech University of Life Sciences Prague for helping to measure power
consumption during experimental activities.
REFERENCES
Hardwick, W.A. 1995. Handbook of Brewing. Marcel Dekker, Inc., New York. 714 pp.
Basařová, G., Šavel, J., Basař, P. & Lejsek, T. 2010. Pivovarství: teorie a praxe výroby piva.
Vydavatelství VŠCHT, Prague, 863 pp. (in Czech).

1350
Chládek, L. 1976. Studium parametrů vyslazovacího procesu (The study of Lautering proces
parameters) (Doctor Theses). Czech Technical University in Prague, Prague, 176 pp.
(in Czech).
Chládek, L. 2007. Pivovarnictví (Breewing industry). Grada, Prague, 207 pp. (in Czech).
Chládek, L., Vaculík, P., Přikryl, M., Vaculík, M. & Holomková, M. 2013. Impact of malt
granulometry on lauter proces. 5th International Conference on Trends in Agricultural
Engineering 2013, TAE 2013 03.09.2013, Prague. Czech University of Life Sciences
Prague, Prague, 244–248.
Kent, N.L. & Evers, A.D. 1994. Kent´s technology of cereals: an introduction for students of food
science and agriculture. Pergamon, Elsevier Science Ltd., 334 pp.
Kunze, W. 2010. Technology Brewing and Malting. Versuchs- und Lehranstalt für Brauerei
in Berlin (VLB), Berlin, 1047 pp.
Maloun, J. 2001. Technologická zařízení a hlavní procesy při výrobě krmiv (Technological
equipment and main processes in cattle feed production). Czech University of Life Sciences
Prague, Prague, 201 pp. (in Czech).
Smejtková, A., Vaculík, P., Přikryl, M. & Pastorek, Z. 2016. Rating of malt grist fineness with
respect to the used grinding equipment. Research in Agricultural Engineering (Zemědělská
technika) 62(3), 141–146.
Vaculík, P., Maloun, J., Chládek, L. & Přikryl, M. 2013. Disintegration process in disc crushers.
Research in Agricultural Engineering (Zemědělská technika) 59(3), 98–104.

1351
Agronomy Research 16(S2), 1351–1359, 2018
https://doi.org/10.15159/AR.18.118
Study of potential PCR inhibitors in drinking water for
Escherichia coli identification
B. Dalecka* and L. Mezule
Riga Technical University, Faculty of Civil Engineering, Water Research laboratory,
Kipsalas 6A-263, LV-1048 Riga, Latvia *Correspondence: [email protected]
Abstract. In the last few decades, the polymerase chain reaction (PCR) has become one of the
most powerful molecular biological tools. However, the PCR is an enzymatic reaction and
therefore sensitive to inhibitors which may occur in drinking water samples. In this work, the
possible inhibition effect of chlorine, humic acids, and iron for real-time PCR (qPCR) efficiency
was studied and the environmental sample from drinking water treatment system before iron
removal was selected and analysed. The results demonstrated that the highest concentrations of
humic acids (5 mg L-1 and 1 mg L-1) and iron (4 mg L-1) inhibited the PCR reaction while no effect
of chlorine was observed. The analysis of the environmental sample with spiked Escherichia coli
cells demonstrated reduction efficiency of the average threshold cycle (Ct) values compared with
control dilution series determining the possible inhibition for qPCR assay.
Key words: Polymerase chain reaction, inhibitors, chlorine, humic acids, iron, Escherichia coli.
INTRODUCTION
While most microorganisms play an important role in nature, certain potentially
harmful bacteria can contaminate food and water, and cause infectious diseases in both
humans and animals (Leonard et al., 2003). Depending on the type of microorganism,
conventional identification can take anything from a day to several weeks (Rossen et al.,
1992). Therefore, the limitations of culture-based assays (e.g., inability to detect
unculturable cells, time consumption) in analysis of microorganisms from oligotrophic
environments, such as drinking water, have facilitated the introduction of molecular
methods in routine tests for more relevant, rapid and ‘real-time’ identification (Kim et
al., 2013; Fatemeh et al., 2014).
Quantitative real-time PCR (qPCR) has been recommended as a powerful
alternative diagnostic tool due to its high sensitivity and specificity (Schriewer et al.,
2011). Nevertheless, environmental samples may contain a high concentration of organic
and inorganic substances like phenolic compounds, heavy metals and humic acids which
may inhibit enzymatic reactions leading to the production of biased results and impact
the sensitivity of both conventional and quantitative PCR (Green & Field, 2012;
Schrader, 2012; Sidstedt et al., 2015). For instance, PCR inhibition for E. coli
identification from water samples has been linked with the presence of inhibiotory
substances (Walker et al., 2017).

1352
Typical concentrations of dissolved iron in groundwater that is the primary source
of drinking water in Nordic countries range from 0.5 to 10 mg L-1 (Klove et al., 2016)
while other sources, mainly surface water, can be rich in humic substances (Juhna &
Klavins, 2001). A major component of naturally occurring organic carbon in water is
humic acid, as it can represent up to 90% of dissolved organic carbon in water
(Sounthararajah et al., 2015). For instance, Tihomirova et al. (2010) have demonstrated
that often the amount of organics directly after water treatment can exceed 5 mg L-1.
Finally, the disinfection of drinking water often involves the use of reactive chemical
agents such as chlorine. For effective disinfection, the average concentration of free
chlorine in the final treatment step might vary from 0.2 to 1 mg L-1 (World Health
Organization, 2011). Thus, the application of molecular tests, e.g., PCR, in
environmental sample, e.g., source waters, and drinking water analyses must be
performed with caution to exclude the possibility of inhibition.
Traditionally, to determine the inhibitory effect of the PCR reaction, it has been
suggested to carry out the control reactions (Schrader et al., 2012). For instance, serial
dilution with variable concentration of possible inhibitors in analysed control samples
might provide an excellent mean to determine inhibiting effects when a gene target is
present in high copy numbers (Kontanis & Reed, 2006; Schriewer et al., 2011).
Therefore, inhibition of qPCR can be measured as the increase in threshold cycle (Ct)
relative to an uninhibited control (Huggett et al., 2008). Moreover, the analysis of the
PCR product is possible through a measurement of the melt characteristics of the
amplicons where the change in the melt curve demonstrates the modification of the PCR
product (Opel et al., 2009).
The aim of this study was to estimate if qPCR could be applied for the analysis of
drinking water, which is rich in organic and inorganic compounds. The possible
inhibition of chlorine, iron and humic acids was examined and evaluated in artificial and
water samples. Escherichia coli was selected as a test organism because it is the most
widely used faecal indicatororganism in microbiology analyses. The research included
tests with real-time PCR assay and the results of the threshold cycle (Ct) values were
compared in-between the standard curves constructed for E. coli.
MATERIALS AND METHODS
Bacterial strain and DNA extraction
Escherichia coli strain (ATCC®25922TM) was grown aerobically at 37 °C for 24 h
in Tryptone soya broth (Oxoid, UK). The commercial kit GeneJET Genomic DNA
Purification Kit (Thermo Scientific, Lithuania) was used according to manufacturer’s
instructions for DNA extraction and preparation of control dilution series and water
sample analyses.
Sample preparation
Inhibitor stock solutions were prepared and serially diluted to obtain final
concentrations of 4, 0.8, 0.08 mg L-1 of chlorine (from NaClO, Sigma-Aldrich,
Germany); 5, 1, 0.3 mg L-1 of humic acid (Sigma-Aldrich, Germany), and 4, 0.2,
0.1 mg L-1 of iron (FeCO3, Sigma-Aldrich, Germany). All subsequent dilutions were
prepared in water.
1353
The water sample of 1 L was collected from a drinking water treatment plant
(Dobele, Latvia) during iron removal process (iron concentration > 0.5 mg L-1) in sterile
glass bottle, stored at +4 °C and transported to the testing laboratory for further use. For
the investigation of possible PCR inhibition from the water sample, a positive control
(dilution series of E. coli), and negative control (water sample without E. coli) was
prepared and compared in-between the water sample with spiked E. coli with the same
DNA concentration as control dilution series. The water sample was analysed with real-
time PCR (see below) and tested in triplicates.
Real-time PCR analysis of inhibitors
The amplification was performed in 7300 Real Time PCR System (Applied
Biosystems, USA). PCR reaction mixture of 25 µl contained 5 µl template DNA, 12.5 µl
SYBR Green/ROX qPCR Master Mix (2x) (Thermo Scientific, Lithuania), 0.5 µl of
primer pair EC5 (5’-AAAGCCGTGGCACAGGCAAGCGT-3’) and EC8c2
(5’-TCAATTTGTTATCGCTATCCAGTTGG-3’) (Spierings, 1993) and the required
amount of PCR-nuclease free water (Thermo Scientific, Lithuania). To enhance the
effect of the chlorine, humic acids and iron, the required concentration of inhibitor was
added at the end to reach a final reaction volume of 25 µl. Control (without inhibitors)
dilution series was performed using the same protocol, with an equivalent volume of
PCR water used in place of the inhibitor.
In order to evaluate and compare the success and effectiveness of PCR inhibition,
MS Excel 2013 was used for Ct average value and t-test statistical calculations. Each
sample was tested in triplicates.
RESULTS AND DISCUSSION
Real-time PCR is becoming the method of choice for the detection of pathogenic
microorganisms and other target organisms in the environmental samples (Schriewer et
al., 2011). Although qPCR can provide more specific and accurate quantification than
other molecular techniques, it does have limitations that must be considered when
applying it in practice (Kim et al., 2013). Previous research has already demonstrated
that water sample analyses with real-time PCR might be inhibited by organic compounds
like polyphenol, fulmic and humic acids, metal ions and chlorine (Schrader et al., 2012).
However, besides the substance class, there has not been much research on the
relationship between the inhibitor concentration and effect caused to the qPCR
efficiency. Therefore, within this study, the inhibition of qPCR was investigated and
compared with uninhibited control as the increase in the threshold cycle (Ct), which
represents the number of cycles required for the fluorescent signal to cross the threshold
of background level.
Chlorine effect on qPCR
The treatment of drinking water typically involves a final disinfection process to
prevent the discharge of pathogens. For instance, in Latvia, the drinking water treatment
process is based on chlorination and the average concentration of free chlorine in the
final treatment step might vary from 0.5 to 3 mg L-1 (Nescerecka et al., 2014). Based on
these observations, three different concentrations (4, 0.8 and 0.08 mg L-1) were
investigated in this study.

1354
The results showed that there was no significant difference (P > 0.05) in the
average crossing threshold (Ct) values of the inhibitors when compared to the control
dilution series (Table 1).
Table 1. The comparison of different chlorine concentrations based on the average crossing
threshold (Ct) values
Dilution series Ct
Control 4 mg L-1 0.8 mg L-1 0.08 mg L-1
10^1 12.61 ( 0.13) 12.39 ( 0.03) 12.50 ( 0.22) 12.32 ( 0.20)
10^2 16.11 ( 0.07) 16.05 ( 0.12) 15.83 ( 0.10) 15.89 ( 0.06)
10^3 19.57 ( 0.06) 19.53 ( 0.22) 19.46 ( 0.11) 19.59 ( 0.16)
10^4 23.19 ( 0.06) 23.82 ( 1.35) 23.03 ( 0.05) 23.05 ( 0.04)
10^5 nd 26.69 ( 0.14) nd nd
nd – Ct was not detected; () standard deviation of the average values from 3 replicates.
Previous research (Aken & Lin, 2011) showed that high concentrations of the
disinfecting agent, e.g., chlorine, UV, and silver, significantly inhibited the amplification
of DNA for E. coli bacteria. Furthermore, Delgado-Viscogliosi et al. (2009)
demonstrated that the doses of tested chlorine concentration above 0.5 mg L-1 are able
to bind to DNA molecules, resulting in the inhibition of qPCR. However, here the
chlorine did not demonstrate any effect on PCR efficiency. This could be linked to the
fact that the incubation time was too short to destruct the DNA molecule and
amplification process. Nevertheless, the sensitivity of the qPCR method can depend on
the volume of analysed water affecting the final concentration of free chlorine. For
instance, the cell number of the target microorganism in drinking water may be small
and DNA could be detected by PCR amplification only after concentration of large
volumes of drinking water. Thus, the internal controls could be used in order to avoid
false-negative results due to chlorine inhibitory effect.
Humic acid effect on real-time PCR
Humic substances are the most commonly reported group of PCR inhibitors in the
environmental samples (Filion, 2012). Tihomirova et al. (2010) have indicated that even
after drinking water treatment the concentration of humic substances can exceed
5 mg L-1, therefore, great suspicion on possible inhibition of PCR reaction arise.
According to this, three different concentrations, 5, 1 and 0.3 mg L-1, of humic acid were
evaluated.
The inhibition by humic acids was observed at two concentrations – 5 mg L-1 and
1 mg L-1 (P < 0.05). The efficiency of the average crossing threshold (Ct) values for each
dilution series decreased when compared to control, 65% and 16%, respectively. At the
same time, no significant change was observed at 0.3 mg L-1 humic acid (P > 0.05)
(Table 2).

1355
Table 2. The comparison of different humic acid concentrations based on the average crossing
threshold (Ct) values
Dilution series Ct
Control 5 mg L-1 1 mg L-1 0.3 mg L-1
10^1 12.22 ( 0.03) 19.66 ( 0.07) 14.29 ( 0.43) 12.36 ( 0.14)
10^2 15.68 ( 0.02) 23.16 ( 0.43) 17.45 ( 0.05) 15.90 ( 0.11)
10^3 19.68 ( 0.14) 27.60 ( 0.38) 21.41 ( 0.05) 19.90 ( 0.19)
10^4 23.44 ( 0.02) 31.68 ( 0.28) 25.32 ( 0.10) 23.60 ( 0.02)
10^5 27.24 ( 0.09) 36.33 ( 0.57) 29.41 ( 0.24) 27.53 ( 0.06)
nd – Ct was not detected; () standard deviation of the average values from 3 replicates.
Additionally, the same results of PCR inhibition were presented at amplification
plot curves with 5 and 1 mg L-1 concentrations of humic acids. All inhibitor dilution
series did not coincide with non-ihibitory amplification plots (Fig. 1) and demonstrated
the influence of humic acids on the PCR efficacy.
Figure 1. Investigation of humic acid inhibitory properties in real-time PCR amplification with
E. coli standard curves. A) Amplification plot curves from 1 mg L-1 chlorine dilution series (red
marks at threshold (Ct) point) when compared with control dilution series; B) Amplification plot
curves from 5 mg L-1 chlorine dilution series (marked as x at threshold (Ct) point) when compared
with control dilution series.
Sidstedt et al. (2015) demonstrated that humic acids from environmental samples
are very potent inhibitors that can quench the fluorescence signal of double-stranded
DNA binding dyes, including SYBR Green. Furthermore, humic acids have been found
to directly disturb the DNA polymerase and form colloids in water and complexes with
iron ions, meaning that they could affect the ion content in PCR, for example, by
chelating magnesium ions (Sidstedt et al., 2015). As humic substances are amorphous,
dark-colored organic compounds, which are relatively resistant to chemical and
biological degradation, it is difficult to remove using standard DNA purification
procedures (Watson & Blackwell, 2000). Therefore, the most common method used to
overcome PCR inhibition by humic substances is to dilute the extract. By diluting the
extract the concentration of the inhibitory compounds is reduced to a level where
inhibition no longer occurs (Matheson et al., 2010). The results in this paper also
indicated that by decreasing the concentration of humic acids from 5 mg L-1 to
A)
Cycle Number
Delta Rn vs Cycle
Cycle Number
Delta Rn vs Cycle B)
Delta R
n
Delta R
n

1356
0.3 mg L-1, increased the efficiency of qPCR. However, dilution of the sample also
reduced the concentration of DNA, which can decrease the efficiency of PCR
amplification (Filion, 2012). Therefore, Schriewer et al. (2011) have demonstrated
absorbent DAX-8 technology to remove humic acids permanently from nucleic acid
extracts. This method has a potential to significantly increase the reliability of reported
non-detects and measured results obtained by qPCR in environmental monitoring.
Iron effect on real-time PCR
Another group of inhibitors include heavy metals. Generally, the mechanisms of
PCR inhibition by heavy metals are still not very well understood. However, one possible
explanation could be the variable resistance of DNA polymerases to heavy metal ions
(Filion, 2012). The inhibition is attributed to various metals, like mercury, zinc, lead,
and also iron (Filion, 2012; Chowdhury et al., 2016) that is often found in water sources.
Groundwater can contain > 3 mg L-1 iron and not always it is removed sufficiently
during the water treatment process. According to the World Health Organization, the
concentrations of iron in drinking water is normally below 0.3 mg L-1 but may be higher
in places where various iron salts are used as coagulating agents in drinking water
treatment plants and where iron pipes are used for water distribution (World Health
Organization, 2008). The results of the Ct data from 4 mg L-1 samples showed a 100%
reduction of qPCR efficiency when compared to the control indicating no DNA
amplification. At the same time no significant change was observed for 0.2 and
0.1 mg L-1 samples (P > 0.05) (Table 3).
Table 3. Comparison of different iron concentrations based on the average crossing threshold
(Ct) values
Dilution series Ct
Control 4 mg L-1 0.2 mg L-1 0.1 mg L-1
10^1 12.07 ( 0.07) nd 12.09 ( 0.19) 11.97 ( 0.09)
10^3 19.97 ( 0.14) nd 20.10 ( 0.01) 20.06 ( 0.03)
10^5 28.17 ( 0.12) nd 28.30 ( 0.12) 28.34 ( 0.38)
nd – Ct was not detected; () standard deviation of the average values from 3 replicates.
The results of this study apparently demonstrated that elevated concentration of
iron above 4 mg L-1 inhibited the PCR reaction, therefore when analysing the
groundwater samples directly, first the inhibition should be tested.
The water sample from drinking water treatment plant was taken in the middle of
iron treatment step with iron concentration > 5 mg L-1 and analysed for possible PCR
inhibition. The results demonstrated no detectable E. coli. Meanwhile, the significant
difference in the average crossing threshold values in-between E. coli control dilution
series and the water sample with the same concentration of spiked E. coli DNA was
observed (Table 4). The results of the water sample with E. coli DNA indicated on higher
Ct values (14%) when compared to control determining the possible inhibition of
uncovered environmental compounds, e.g., iron from DNA extraction.

1357
Table 4. The comparison of control E. coli dilution series with the water sample with/without E.
coli based on the average crossing threshold (Ct) values
Ct
Dilution series Control Environmental sample
with E. coli
Environmental sample
without E. coli
10^7 12.97 ( 0.09) 14.64 ( 0.06) nd
10^6 16.57 ( 0.12) 18.41 ( 0.03) nd
10^5 20.35 ( 0.08) 22.24 ( 0.14) nd
nd – Ct was not detected; () standard deviation of the average values from 3 replicates.
According to these investigations, real-time PCR assays must be carefully
designed, conducted, and validated with an understanding of the methods limitations and
possible inhibitors. Several approaches have attempted to reduce the inhibitory impact
of sample quantification with qPCR. For instance, nucleic acid extraction methods that
increase DNA yield while removing most qPCR inhibitors have been developed
specifically for troublesome water samples (Green & Field, 2012). However, it cannot
be guaranteed that the preparations will extract DNA free of PCR inhibitors. Therefore,
further analysis of environmental samples should include a pretreatment step before/after
the DNA extraction to remove possible inhibitory compounds, e.g., iron, and all
reactions should be analysed for the presence of inhibitory effects.
CONCLUSIONS
Three possible inhibitors were examined for the efficiency of drinking water
sample analyses with qPCR. The results indicated that humic acids at concentration of 5
and 1 mg L-1 reduced the PCR reaction efficiency for 65% and 16%, respectively, while
concentration of 4 mg L-1 from iron fully inhibited amplification of DNA. The analysis
of the environmental sample with spiked E. coli cells demonstrated the reduction
efficiency of the average Ct values for 14% compared with the control dilution series
determining the possible inhibition for qPCR assay. The findings of the research
demonstrate that prior PCR analyses, the evaluation of potential inhibitors must be
performed.
ACKNOWLEDGEMENTS. This work has been supported by Riga Technical University funding
for doctoral students and National Research Programme No. 2014.10-4/VPP-3/21
‘MultIfunctional Materials and composItes, photonicS and nanotechnology (IMIS2)’, Project No.
4 ‘Nanomaterials and nanotechnologies for medical applications’, Subproject No. 4.7. (2014–
2017). The authors gratefully acknowledge Kristina Tihomirova and Viktorija Denisova for their
assistance in humic acid and chlorine concentration measurements.
REFERENCES
Aken, B.V. & Lin, L.S. 2011. Effect of the disinfection agents chlorine, UV irradiation, silver
ions, and TiO2 nanoparticles/near-UV on DNA molecules. Water Science & Technology
64, 1226–1230.
Chowdhury, S., Mazumder, J.A.M., Al-Attas, O., Husain, T. 2016. Heavy metals in drinking
water: Occurences, implications, and future needs in developing countries. Science in the
Total Environments 569, 476–488.

1358
Delgado-Viscogliosi, P., Solignac, L. & Delattre, J.M. 2009. Viability PCR, a culture –
independent method of rapid and selective quantification of viable Legionella pneumophila
cells in environmental water samples. Applied and Environmental Microbiology 75,
3502–3512.
Fatemeh, D., Reza, Z.M., Mohammad, A., Solemeh, K., Reza, A.G., Hossein, S., Maryam, S.,
Azam, A., Mana, S., Negin, N., Reza, K.A. & Saeed, F. 2014. Rapid detection of coliforms
in drinking water of Arak city using multiplex PCR method in comparison with the standard
method of culture (Most probably number). Asian Pacific Journal of Tropical Biomedicine
4, 404–409.
Filion, M. 2012. Quantitative real-time PCR in applied microbiology. Caister Academic Press,
93–94.
Green, H.C. & Field, K.G. 2012. Sensitive detection of sample interference in environmental
qPCR. Water Research 46, 3251–3260.
Huggett, J.F., Novak, T., Garson, J.A., Green, C., Morris-Jones, S.D., Miller, R.F. & Zumla, A.
2008. Differential susceptibility of PCR reactions to inhibitors: an important and
unrecognised phenomenon. BMC Research Notes 1, 1–9.
Kim, J., Lim, J. & Lee, C. 2013. Quantitative real-time PCR approaches for microbial community
studies in wastewater treatment systems: Applications and considerations. Biotechnology
Advances 31, 1358–1373.
Juhna, T. & Klavins, M. 2001. Water-quality changes in Latvia and Riga 1980-2000: Possibilities
and problems. Royal Swedish Academy of Science 30, 306–314.
Klove, B., Kvitsand, H.M.L., Pitkanen, T., Gunnarsdottir, M.J., Gaut, S., Gardarsson, M.J.,
Rossi, P.M. & Miettinen, I. 2016. Overview of groundwater sources and water – supply
systems, and associated microbial pollution, in Finnland, Norway and Iceland.
Hydrogeology and Human Health 25, 1033–1044.
Kontanis, E.J. & Reed, F.A. 2006. Evaluation of real-time PCR amplification efficiencies to
detect PCR inhibitors. American Academy of Forensic Science 51, 795–804.
Leonard, P., Hearty, S., Brennan, J., Dunne, L., Quinn, J., Chakraborty, T. & O’Kennedy, R.
2003. Advances in biosensors for detection of pathogens in food and water. Enzyme and
Microbial Technology 32, 3–13.
Matheson, C.D., Gurney, C., Esau, N. & Lehto, R. 2010. Assessing PCR inhibition from humic
substances. The Open Enzyme Inhibition Journal 3, 38–45.
Nescerecka, A., Rubulis, J., Vital, M., Juhna, T. & Hammes, F. 2014. Biological instability in
chlorinated drinking water distribution network. Plus One 9, 1–11.
Opel, K.L., Chung, D. & McCord, B.M. 2009. A Study of PCR inhibition mechanisms using
realtime PCR. Journal of Forensic Science 10, 1–8.
Rossen, L., Norskov, P., Holmstrom, K. & Rasmussen, O.F. 1992. Inhibition of PCR by
components of food samples, microbial diagnostic assays and DNA-extraction solutions.
International Journal of Food Microbiology 17, 37–45.
Schrader, C., Schielke, A., Ellerbroek, L. & Johne, R. 2012. PCR inhibitors – occurrence,
properties and removal. Journal of Applied Microbiology 113, 1014–1026.
Schriewer, A., Wehlmann, A. & Wuertz, S. 2011. Improving qPCR efficiency in environmental
samples by selective removal of humic acids with DAX-8. Journal of Microbiological
Methods 85, 16–21.
Sidstedt, M., Jansson, L., Nilsson, E., Noppa, L., Forsman, M., Radstrom, P. & Hedman, J. 2015.
Humic substances cause fluorescence inhibition in real-time polymerase chain reaction.
Analytical Biochemistry 487, 30–37.
Sounthararajah, D.P., Loganathan, P., Kandasamy, J. & Vigneswaran, S. 2015. Effects of humic
acid and suspended solids on the removal of heavy metals from water by adsorption onto
granular activated carbon. International Journal of Environmental Research and Public
health 12, 10475–10489.

1359
Spierings, G., Ockhuijsen, C., Hofstra, H. & Tommassen, J. 1993. Polymerase chain reaction for
the specific detection of Escherichia coli/Shigella. Res. Microbiology 144, 557–564.
Tihomirova, K., Rubulis, J. & Juhna, T. 2010. Changes of NOM fractions during conventional
drinking water treatment process in Riga, Latvia. Water Science and Technology: Water
Supply 10, 157–163.
Walker, D.J., McQuillan, J., Taiwo, M., Parks, R., Stenton, C., Morgan, H., Mowlem, M.C. &
Lees, N.D. 2017. A highly specific Escherichia coli qPCR and it comparison with existing
methods for environmental waters. Water Research 126, 101–110.
Watson, R.J. & Blackwell, B. 2000. Purification and characterization of a common soil
component which inhibits the polymerase chain reaction. Can. J. Microbiology 46, 633–
642.
World Health Organization 2008. Iron in drinking water. Guidelines for drinking-water quality.
WHO/SDE/WSH/03.04.08, pp. 1–2 (in English).
World Health Organization 2011. Guidelines for drinking-water quality – 4th edition 141,
pp. 333–334 (in English).

1360
Agronomy Research 16(S2), 1360–1372, 2018
https://doi.org/10.15159/AR.18.044
The development of gluten-free sourdough bread technology
with rowan powder
N. Dubrovskaya1, O. Savkina2,*, L. Kuznetsova2 and O. Parakhina3
1Peter the Great Saint Petersburg Polytechnic University, Polytechnicheskaya street 29,
RU195251 St. Petersburg, Russia 2Saint Petersburg Branch, State Research Institute of the Baking Industry, Podbelskogo
Highway 7, RU196608 St. Petersburg, Pushkin, Russia 3Institute of Refrigeration and Biotechnologies, ITMO University, Lomonosova street 9,
RU191002 St. Petersburg, Russia *Correspondence: [email protected]
Abstract. A new form of technology was developed which focussed on gluten-free bread with
gluten-free sourdough and rowan powder (from the botanical species Sorbus aucuparia). This
new form of technology allows organoleptic characteristics to be improved, along with structure,
texture, microbial spoilage resistance, and the shelf life of gluten-free bread. The gluten-free dry
microbial composition with lactic acid bacteria was developed as a starter for sourdough. The
lactic acid bacteria, L. brevis E38, was experimentally selected for dry microbial composition on
the basis of its antagonistic activity against ropy bread disease pathogens (B. subtilis and B.
licheniformis). The dependence was revealed of the accumulation of acetic acid and lactic acid in
the sourdough on the microbial composition during fermentation. A gluten-free sourdough
technology was developed which involved a new starter, rice, and soy flour at a ratio of 0.2:2:1.
It was shown that the use of soy protein slows down the fermentation process in the sourdough.
An increase – in acidity levels of between 7.5–9.5 times higher in the dough with sourdough and
rowan powder when compared to dough without sourdough. Sourdough usage allowed
compressibility of the crumb to be increased by between 1.8–2 times, with a specific volume of
19.0% and a porosity of 9.8% and 11.5%, and for the sensory characteristics to be improved as
perceived by consumers. It was proved that microbial composition with a lactic acid bacteria,
L. brevis E38, inhibits ropy disease and mould development in bread. The results of the present
study showed that the addition of sourdough and rowan powder can be used to improve the quality
of gluten-free bread.
Key words: gluten-free bread, lactic acid bacteria, dry microbial composition, rowan powder,
quality, mould, ropy disease.
INTRODUCTION
The increased demand for gluten-free products proves that celiac disease is one of
those food intolerances which is clearly prevalent across the world. However, the
absence of gluten, which is necessary for the construction of the protein structure and
crumb texture, makes it difficult to produce gluten-free bread. In addition, gluten-free

1361
bread is easily subjected to microbial spoilage. Therefore, obtaining high-quality gluten-
free bread is an important technological task.
Recent scientific studies are increasingly focusing on improving the formulation
and technology of gluten-free bread. Many researchers have tried to improve the gluten-
free quality of bread using gluten-free flour mixtures and starch (Clerici et al., 2009;
Torbica et al., 2010; Sakac et al., 2011; Milde et al., 2012; Ozol et al., 2012; Ziobro et
al., 2012; Korus et al., 2015), or additives such as hydrocolloids, gums, fibre, emulsifiers,
or enzymes (Renzetti et al., 2008; Sciarini et al., 2010; Phimolsiripol et al., 2012;
Tsatsaragkou et al., 2014; Różyło et al., 2017).
In traditional technology, the use of sourdough improves the traditional texture of
bread, along with its flavour and shelf life. The use of sourdough in technology relating
to gluten-free bread is of great interest. The amount of research being carried out on the
use of gluten-free sourdough in bakery production has increased in recent years.
Sourdough was developed using buckwheat, oat, quinoa, sorghum, teff, and wheat
flour along with the heterofermentative lactic acid bacteria, Lactobacillus plantarum
FST 1.7 (Wolter et al., 2014). But the studies did not provide any satisfactory results.
Shelf life for sourdough breads was not prolonged by the addition of sourdough. The
inferior aroma of bread that had been prepared using gluten-free flour was also not
improved by the addition of sourdough. It can be assumed that the absence of a positive
effect on the taste of gluten-free bread is associated with the use of a facultatively
heterofermentative lactic acid bacteria strain which generally only produces lactic acid
under normal conditions. Therefore, in this study we propose the use not only of
facultatively heterofermentative strains but also of obligatory heterofermentative strains
and their mixture with a homofermentative strain.
Recent studies also have confirmed the positive effects of adopting sourdough
technology in gluten-free breadmaking (Mariotti et al., 2017). The sourdough was
created using a stable association between Lactobacillus sanfranciscensis (an obligatory
heterofermenatative strain) and Candida humilis.
Bender et al. (2017) have evaluated the performances of different Lactobacillus
spp. strains which were applied in the fermentation of millet and buckwheat sourdoughs.
They have established that the combination of four strains could be used as potential
starter cultures for millet or buckwheat sourdough bread. They have shown that
Lactobacillus pentosus and Lactobacillus hammesii positively influenced the crumb
firmness of buckwheat and millet bread respectively, while Lactobacillus
paralimentarius enhanced this property in both bread types. But in this research only
one of the two Lactobacillus sanfranciscencis strains was able to improve all functional
properties in both gluten-free breads (Bender et al., 2017).
The aim of this study was to investigate different strains of lactic acid bacteria, to
create a new starter composition, and to develop gluten-free sourdough bread technology
using rowan powder which would improve the quality and microbial stability of bread.
MATERIALS AND METHODS
A characterisation of the ingredients
In this study, the lactic acid bacteria strains Lactobacillus paracasei/Lactobacillus
casei, Lactobacillus paracasei E3, Lactobacillus plantarum E4, Lactobacillus
plantarum E5, Lactobacillus plantarum E36, Lactobacillus parabuchneri E7,

1362
Lactobacillus fermentum E28, and Lactobacillus brevis E38 were used. The strains were
taken from the collection at the St. Petersburg Branch of the State Research Institute of
the Baking Industry.
The dry microbial composition was made by drying a mixture of gluten-free raw
materials and pure cultures of lactic acid bacteria strains. A dry microbial composition
was used as a starter for sourdough.
The powder from the fruit of the ordinary rowan (the botanical species Sorbus
aucuparia) was used as an enriching additive.
The pathogen strains of Bacillus subtilis, Bacillus licheniformis, and Penicillium
chrysogenum were taken from the collections of the St. Petersburg Branch of the State
Research Institute of the Baking Industry, and were used to infect bread when testing
microbiological stability.
The study of lactic acid bacteria strains Strains were cultured in standard liquid medium MRS (BioMerieux, France). Lactic
acid bacteria from the St Petersburg collection was inoculated into a liquid medium at
the ratio of 1:100, and kept at 37 °C for forty-eight hours. An assessment of
microbiological parameters was carried out by examining the following properties: the
number of cells in the culture was determined by counting the colonies that had been
grown on the MRS with agar, acidity levels were determined using a 0.1 n. solution of
NaOH (Afanasjeva, 2003).
Antagonistic activity. lactic acid bacteria’s antagonistic activity against ropy bread
disease pathogens B. subtilis and B. licheniformis was investigated. A concentration of
0.1 cm3 of the pathogen suspension with a cell content of 106 cells mL-1 was applied to
the meat-peptone agar surface in Petri dishes and was distributed over the surface with
a spatula, before being covered and left to undergo diffusion for thirty minutes. Then
holes with a diameter of 7 mm were cut on the surface of inoculated meat-peptone agar
by means of a sterile metal cylinder. A lactic acid bacteria culture of 0.1 cm3 was
inoculated into the holes with the contents of cells at 109 cells mL-1. The Petri dishes
were kept at 37 °C for twenty-four hours. After that the diameters of the pathogen were
measured and no growth zones around the holes were found (Savkina et al., 2015).
Dried microbial composition preparation
A mixture of rice flour and soy protein isolate at a ratio of 2:1 was used to prepare
a dry microbial composition. Lactic acid bacteria was grown as follows: a liquid medium
of MRS was inoculated by means of lactic acid bacteria from the St Petersburg collection
at a ratio of 100:1, and was kept at 37 °C for forty-eight hours. A culture fluid of strains
L. paracasei/L. casei, L. paracasei, L. plantarum (starter 1), and L. brevis E38 (starter 2)
were mixed with the rice flour and soy protein isolate at a ratio of 1:1. The resulting
mixture was granulated through a sieve with a mesh size of 1.5mm and dried in an IR
drier (LOIP LЗ-120/300-VG1, Russia) at a temperature of no higher than 50 °C for
between 60–90 minutes to a moisture content of not more than 14.0%.
Sourdough preparation
To prepare the sourdough, the rice flour and soy protein isolate or rice and soy flour
at a ratio of 2:1 for both were mixed in a kneading machine, the Kitchen Aid KSM45
(USA), at a speed of 120 revolutions per minute for three minutes with water at a

1363
humidity of 65 ± 0.5%. A dry microbial composition was added to an amount of 2.0%
by weight of the mixture. The mixture was mixed and was held at a temperature of
between 29–31 °C for between 18–20 hours.
Bread-making procedure
The gluten-free bread formulations used in this study are presented in Table 1.
Percentages of ingredients were based on 100 g of gluten-free mixture amount, which
include flour, salt, and sugar.
Table 1. Formulations used to prepare different gluten-free bread types
Ingredients, g Control Sample 1 Sample 2
Corn starch 57.8 47.5 51.5
Extrusion corn starch 10.0 10.0 -
Soy protein isolate, kg 9.7 9.7 9.7
Rice flour 19.7 - -
Salt 0.8 0.8 0.8
Sugar 2.0 2.0 2.0
Rowan powder - - 6.0
Vegetable oil 3.8 3.8 3.8
Yeast 2.5 2.5 2.5
Sourdough - 73.0 73.0
Water until dough humidity achieved of 52% or 49%
All of the components were mixed in a kneading machine, the Kitchen Aid KSM45
(USA), at a speed of 120 revolutions a minute for seven minutes. After mixing, the dough
samples were shaped into 250 g loaves, placed in baking forms, and leavened at 30 °C
until the volume was twice that of the initial volume. The leavened dough samples were
cooked in an oven, a SvebaDahlen (Sweden), at a temperature of 210 °С for eighteen
minutes.
The dry microbial composition and sourdough assessment
The mass proportion of moisture in the dry microbial composition and in the
sourdough was determined by drying it at a temperature of 130 °C for forty minutes in a
drier, the SHS-1M (Russia). Acidity levels were determined by means of titration, using
an 0.1 n. solution of NaOH (State Standard of the Russian Federation, 1996). The lactic
acid bacterial cell count was determined by growth on MRS with agar.
The content of acetic and lactic acid in the sourdough were studied using liquid
chromatography on a chromatograph Shimadzu LC-10, Japan (State Standard of the
Russian Federation, 2014).
An assessment of baked bread
An assessment of quality. An assessment was carried out on bread quality levels
in relation to the following properties: organoleptic – appearance (shape, surface, crumb
colour), condition of crumb (porosity and texture), and taste and smell; physical and
physico-chemical - the mass proportion of moisture was determined by drying out at a
temperature of 130 °C for 45 minutes in a drier (the SHS-1M, Russia), and acidity levels
were determined by means of titration, using a 0.1 n. solution of NaOH (State Standard
of the Russian Federation, 1996); porosity – this being determined as the ratio of pore

1364
volume to the total volume of products; pore volume - the difference between the volume
of the product and the volume of the non-porous mass; specific volume - as the ratio of
product volume to 100 g of bread, with compressibility being determined on the
automatic penetrometer, Labor (Hungary).
The content of gluten in bread was evaluated by means of an enzyme-linked
immunosorbent assay.
Ropy disease assessment
In order to determine the effects of the starter on microbial resistance, the bread
was infected with the bacteria, B. subtilis and B. licheniformis. To contaminate the bread,
bread crumbs with spores were prepared in the following way: spore-forming bacteria
on meat-peptone medium was added to the surface of the sliced gluten-free bread and
cultured at a temperature of 37 °C for 96 hours or until signs of disease became apparent.
Diseased bread was dried in an oven at a temperature of 50 ± 2 °C and milled to obtain
crumbs. A total of 1% of infected crumbs were added while kneading the dough for
gluten-free bread. The ready bread was stored at 37 °C prior to any appearance of
symptoms of ropy disease (Afanasjeva, 2003).
Moulds spoilage assessment
The impact was investigated in terms of the sourdough and rowan powder and its
relation to mould disease in bread. The model experiments with the contamination of
sterile bread slices from a pure culture of the mould Penicillium chrysogenum were
carried out. Penicillium chrysogenum was used because the Penicillium species are by
far the most common for bread. This strain was previously isolated from diseased gluten-
free bread and was identified with the species according to cultural and biochemical
characteristics. In addition it was contained in the St. Petersburg collection.
Immediately after baking in the oven opening, the loaves were packed into sterile
paper, placed in a sterile room, and cooled to a temperature of between 25–28 °C. After
cooling the bread was cut in a sterile environment, with slices being taken at a size of
3.5×6.5 cm and at a thickness of 0.3–0.4 cm. The slices were placed in sterile Petri
dishes.
An aqueous suspension of a pure culture of the mould, Penicillium chrysogenum,
was prepared for the infection of slices of bread. The biomaterial of Penicillium
chrysogenum was transferred from a tube containing a pure culture of mould grown on
malt agar to 1ml of sterile water using ‘Tween-80’ and was thoroughly suspended. The
suspension was inoculated into each slice of bread in three shots using a microbiological
needle. Petri dishes with infected slices were incubated at a temperature of 25 ± 1 °C
until the first signs appeared of a growth of mould colonies.
Statistical analysis of the data All of the experiments were carried out a total of five times. The accuracy of the
experimental data was evaluated by using mathematical statistical methods in Microsoft
Excel (2010 version) at a theoretical frequency of 0.95. Results were given as mean ±
standard deviation.

1365
RESULTS AND DISCUSSION
Gluten-free bread is easily exposed to microbial damage (ropy disease and mould
growth). The use of 6–10% rowan powder in the formulation for making gluten-free
bread allows mould spoilage to be slowed down (Dubrovskaya et al., 2017). To inhibit
ropy bread disease, it was suggested that a sourdough starter with lactic acid bacteria be
developed, which has an increased level of antagonistic activity against ropy disease’s
causative agent.
The antagonistic activity of lactobacilli against Bacillus subtilis and Bacillus
licheniformis was studied (Fig. 1). This showed that L. brevis E38 suppressed the
Bacillus growth more than other strains. The strains L. paracasei/L. casei, L. paracasei
E3, and L. plantarum E4 showed slightly worse results, but also had rather high levels
of antagonistic activity.
Figure 1. Antagonistic activity by lactic acid bacteria against B. licheniformis and B. subtilis.
All of the strains are obligatory heterofermentatives or facultatively
heterofermentatives, so that they are able to produce organic acid (whether lactic or
acetic), thereby having an antimicrobial effect. But investigated lactic acid bacteria had
different levels of antagonistic activity. It was found that the species L. brevis, L.
paracasei/L. species casei, L. paracasei, and L. plantarum had antagonistic activity
which were between 30–46% higher than the L. fermentum and L. parabuchneri species.
Thanks to this, the production of organic acids is not the only one mechanism of
providing antagonism. Antimicrobial and antibiotic-like compounds – bacteriocins
(lactocins) – can also play an important role (Reis et al., 2012).
The antagonistic activity of the mixture of strains (L. paracasei/L. casei,
L. paracasei E3, and L. plantarum E4) was higher, being comparable to L. brevis E38
(data not shown). The increasing in antagonistic activity may be due to synergic action.
Therefore, this symbiosis was used to develop the dry microbial composition.

1366
Two types of dry microbial composition were created. L. paracasei/L. casei,
L. paracasei E, and L. plantarum E4 (starter 1), along with L. brevis E38 (starter 2) were
mixed with the rice flour and soy protein isolate at a ratio of 1:1 and these were
subsequently dried.
Biotechnological indicators for two types of dry microbial composition are
presented in Table 2. It was found that the number of cells of lactic acid bacteria in starter
2 were 4.85 times higher than in starter 1, although they had practically the same acidity
levels. This may be due to competition for food between L. paracasei/L. casei,
L. paracasei, and L. plantarum.
Table 2. Biotechnological indicators for two types of dry microbial composition
Biotechnological indicators Starter 1 Starter 2
Mass proportion of moisture, % 14.0 ± 0.2 13.8 ± 0.2
Acidity, degrees N 9.0 ± 0.4 9.4 ± 0.4
Number of lactobacilli cells, CUFF g-1 (0.26 ± 0.01) ×109 (1.26 ± 0.01)×109
The number of cells in the starter is of great importance because this reflects an
ability to develop in sourdough. That is why starter 1 was selected for further research.
During the sourdough development process, acid accumulation was studied within
36 hours at a temperature of 29–31 °C in two 65% moisture mixtures. This moisture
content was chosen based on previous studies which are not listed here. One sourdough
sample consisted of rice flour and soy protein isolate, and the other consisted of rice and
soy flour at a ratio of 2:1. Rice and soy flour and soy protein isolate were taken from the
basic recipe (Dubrovskaya et al., 2017). Starch was not used in the sourdough technology
because it is less of a nutrient medium for lactic acid bacteria growth than the flour and
the protein.
Besides this, L. brevis E38 is an obligatory heterofermentative micro-organism,
which ferments hexose into lactic acid, acetic acid (ethanol), and CO2. Pentoses are
fermented by them into lactic acid and acetic acid through the pentose-phosphate
pathway. Therefore, not only were the acidity levels studied in the sourdoughs, but so
was the content of lactic acid and acetic acid.
It was found that acidity accumulation was higher by between 25–48% in
sourdough with soy flour than in sourdough with soy protein isolate (Fig. 2). This shows
that soy flour is more nutritious for the development and life activity of lactic acid
bacteria than soy protein.
As for the metabolite concentration found in the sourdoughs (Table 3), a higher
lactic acid amount was produced in sourdough with soy protein isolate. The content of
acetic acid was 2.7 times higher in sourdough with soy flour when compared to
sourdough with soy protein isolate (Table 3). Higher acidity levels and a higher content
of acetic acid can positively influence the taste of bread and increase its microbiological
stability during storage.

1367
Figure 2. Acidity in two types of sourdough.
Therefore the use of a dry microbial composition with L. brevis E38, rice, and soy
flour, at a ratio of 2:1 and with water to a moisture content of 65% may be recommended
when it comes to preparing gluten-free sourdough.
Table 3 .Biotechnological indicators for two types of sourdough
Indicators Sourdough with rice flour
and soy protein isolate
Sourdough with rice
and soy flour
Mass proportion of moisture, % 65.0 ± 1 65.0 ± 1
Acidity, degrees N 13.5 ± 0.5 14.5 ± 0.5
Temperature, °С 30 ± 1 30 ± 1
Duration of fermentation, hour 19 ± 1 19 ± 1
Lactic acid, g kg-1 13.5 ± 2.7 9.7 ± 1.9
Acetic acid, g kg-1 0.70 ± 0.14 1.90 ± 0.38
An investigation was carried out in terms of the influence exhibited by the
sourdough on dough and bread quality. It was found that a sourdough and dough
combination increases dilution and reduces viscosity (Fig. 3). The diluting effect of the
sourdough may be related to the effect of lactic acid bacteria enzymes on the dough
biopolymers. This permitted dough humidity to be reduced by 3% (from 52.0% to 49%).
When the bread moisture content is reduced, gluten-free bread resistance to
microbiological spoilage (mould) may be increased.
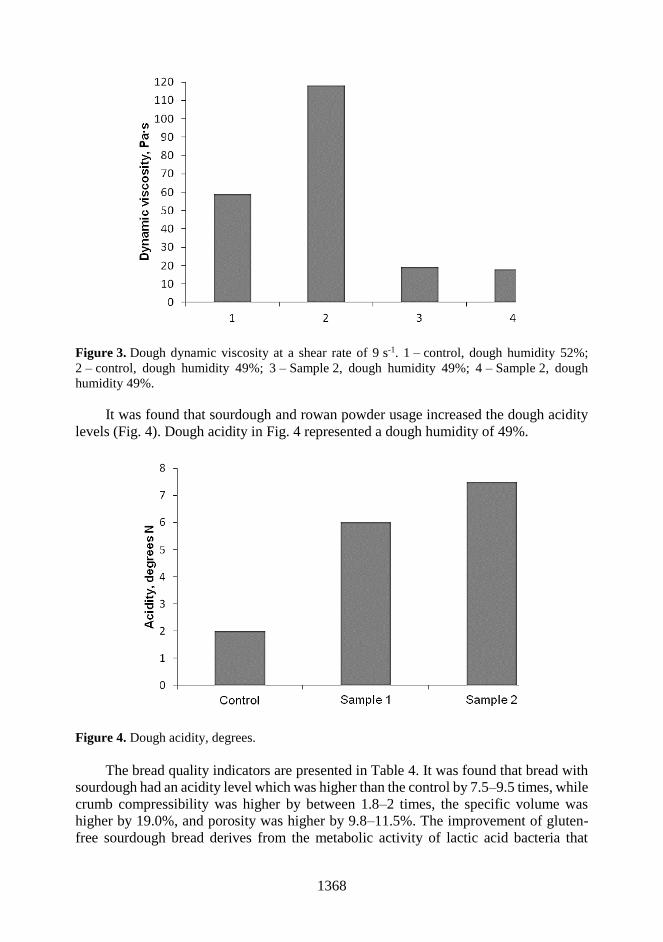
1368
Figure 3. Dough dynamic viscosity at a shear rate of 9 s-1. 1 – control, dough humidity 52%;
2 – control, dough humidity 49%; 3 – Sample 2, dough humidity 49%; 4 – Sample 2, dough
humidity 49%.
It was found that sourdough and rowan powder usage increased the dough acidity
levels (Fig. 4). Dough acidity in Fig. 4 represented a dough humidity of 49%.
Figure 4. Dough acidity, degrees.
The bread quality indicators are presented in Table 4. It was found that bread with
sourdough had an acidity level which was higher than the control by 7.5–9.5 times, while
crumb compressibility was higher by between 1.8–2 times, the specific volume was
higher by 19.0%, and porosity was higher by 9.8–11.5%. The improvement of gluten-
free sourdough bread derives from the metabolic activity of lactic acid bacteria that
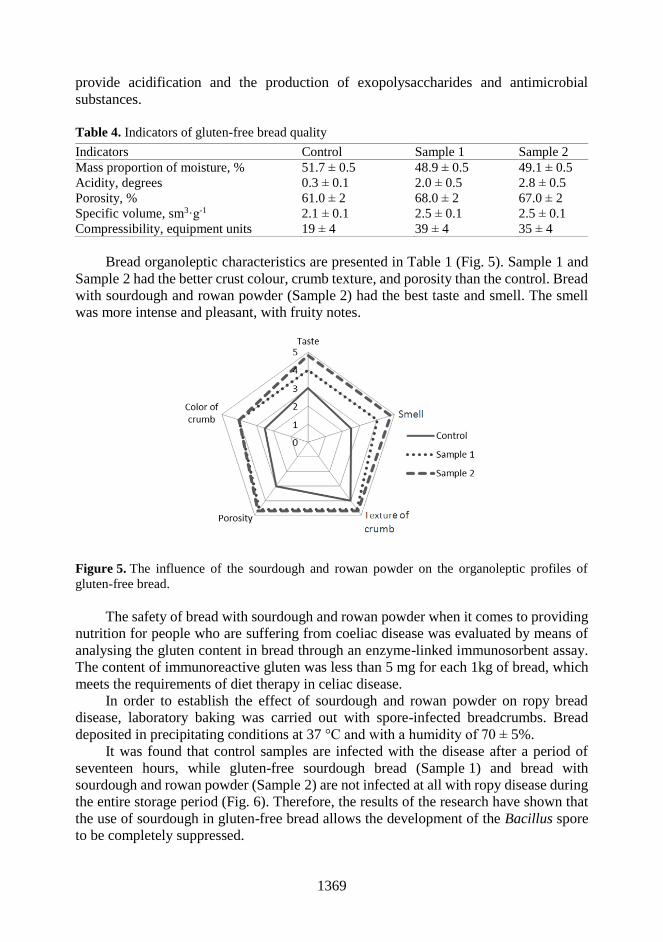
1369
provide acidification and the production of exopolysaccharides and antimicrobial
substances.
Table 4. Indicators of gluten-free bread quality
Indicators Control Sample 1 Sample 2
Mass proportion of moisture, % 51.7 ± 0.5 48.9 ± 0.5 49.1 ± 0.5
Acidity, degrees 0.3 ± 0.1 2.0 ± 0.5 2.8 ± 0.5
Porosity, % 61.0 ± 2 68.0 ± 2 67.0 ± 2
Specific volume, sm3·g-1 2.1 ± 0.1 2.5 ± 0.1 2.5 ± 0.1
Compressibility, equipment units 19 ± 4 39 ± 4 35 ± 4
Bread organoleptic characteristics are presented in Table 1 (Fig. 5). Sample 1 and
Sample 2 had the better crust colour, crumb texture, and porosity than the control. Bread
with sourdough and rowan powder (Sample 2) had the best taste and smell. The smell
was more intense and pleasant, with fruity notes.
Figure 5. The influence of the sourdough and rowan powder on the organoleptic profiles of
gluten-free bread.
The safety of bread with sourdough and rowan powder when it comes to providing
nutrition for people who are suffering from coeliac disease was evaluated by means of
analysing the gluten content in bread through an enzyme-linked immunosorbent assay.
The content of immunoreactive gluten was less than 5 mg for each 1kg of bread, which
meets the requirements of diet therapy in celiac disease.
In order to establish the effect of sourdough and rowan powder on ropy bread
disease, laboratory baking was carried out with spore-infected breadcrumbs. Bread
deposited in precipitating conditions at 37 °C and with a humidity of 70 ± 5%.
It was found that control samples are infected with the disease after a period of
seventeen hours, while gluten-free sourdough bread (Sample 1) and bread with
sourdough and rowan powder (Sample 2) are not infected at all with ropy disease during
the entire storage period (Fig. 6). Therefore, the results of the research have shown that
the use of sourdough in gluten-free bread allows the development of the Bacillus spore
to be completely suppressed.
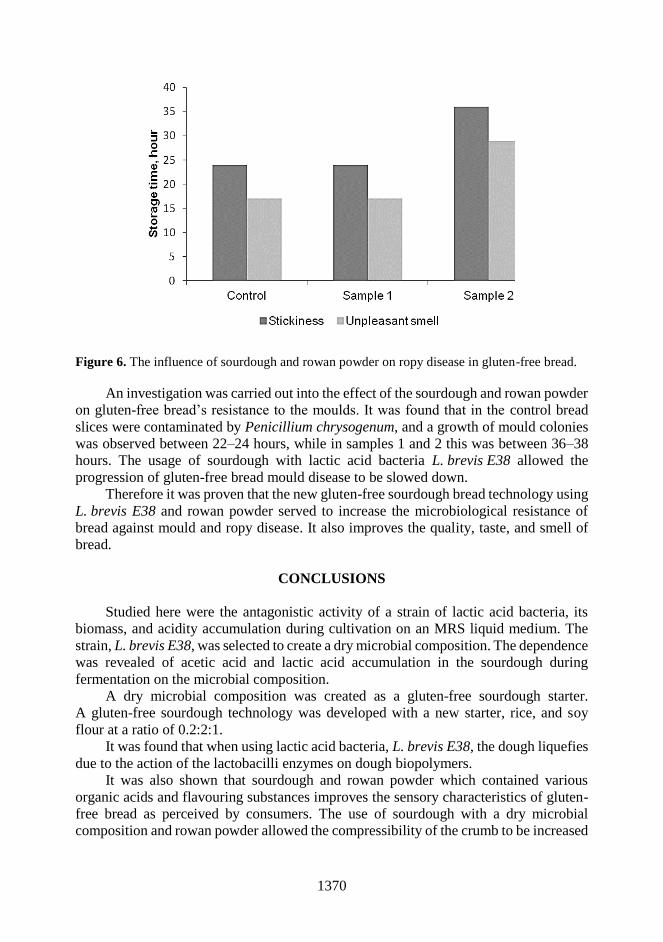
1370
Figure 6. The influence of sourdough and rowan powder on ropy disease in gluten-free bread.
An investigation was carried out into the effect of the sourdough and rowan powder
on gluten-free bread’s resistance to the moulds. It was found that in the control bread
slices were contaminated by Penicillium chrysogenum, and a growth of mould colonies
was observed between 22–24 hours, while in samples 1 and 2 this was between 36–38
hours. The usage of sourdough with lactic acid bacteria L. brevis E38 allowed the
progression of gluten-free bread mould disease to be slowed down.
Therefore it was proven that the new gluten-free sourdough bread technology using
L. brevis E38 and rowan powder served to increase the microbiological resistance of
bread against mould and ropy disease. It also improves the quality, taste, and smell of
bread.
CONCLUSIONS
Studied here were the antagonistic activity of a strain of lactic acid bacteria, its
biomass, and acidity accumulation during cultivation on an MRS liquid medium. The
strain, L. brevis E38, was selected to create a dry microbial composition. The dependence
was revealed of acetic acid and lactic acid accumulation in the sourdough during
fermentation on the microbial composition.
A dry microbial composition was created as a gluten-free sourdough starter.
A gluten-free sourdough technology was developed with a new starter, rice, and soy
flour at a ratio of 0.2:2:1.
It was found that when using lactic acid bacteria, L. brevis E38, the dough liquefies
due to the action of the lactobacilli enzymes on dough biopolymers.
It was also shown that sourdough and rowan powder which contained various
organic acids and flavouring substances improves the sensory characteristics of gluten-
free bread as perceived by consumers. The use of sourdough with a dry microbial
composition and rowan powder allowed the compressibility of the crumb to be increased
1371
by between 1.8–2 times, the specific volume by 19.0%, and the porosity by 9.8% and
11.5%.
It was found that sourdough which contained a large volume of lactic acid bacteria
(3.6·109), lactic acid (9.7 g kg-1), and acetic acid (1.9 g kg-1), helped to slow down the
onset of spore-forming bacteria and mould growth in bread during storage.
REFERENCES
Afanasjeva, O. 2003. Microbiology of bakery production.Beresta,Saint-Peterburg, pp. 217
(in Russian).
Bender, D., Fraberger, V., Szepasvári, P., D’Amico, S., Tömösközi, S., Cavazzi, G., Jäger, H.,
Domig, K.J. & Schoenlechner, R. 2017. Effects of selected lactobacilli on the functional
properties and stability of gluten-free sourdough bread. https://doi.org/10.1007/s00217-
017-3020-1. Accessed 15.03.2018.
Clerici, M.T.P.S., Airoldi, C. & El-Dash, A. 2009. Production of acidic extruded rice flour and
its in fluence on the qualities of gluten-free bread. Food Science and Technology 42,
618–623.
Dubrovskaya, N., Savkina, O., Kuznetsova, L. & Parakhina, O. 2017. Development of gluten-
free bread with unconventional raw ingredients of high nutritional value and antimicrobial
activity. Agronomy Research 15(2), 1276–1286.
Korus, J., Witczak, M., Ziobro, R. & Juszczak, L. 2015. The influence of acorn flour on
rheological properties of gluten-free dough and physical characteristics of the bread.
European Food Research and Technology 240(6), 1135–1143.
Mariotti, M., Cappa, C., Picozzi, C., Tedesco, B., Fongaro, L. & Lucisano, M. 2017. Compressed
Yeast and Type I Gluten-Free Sourdough in Gluten-Free Breadmaking. Food and
Bioprocess Technology 10(5), 62–97.
Milde, L.B., Ramallo, L.A. & Puppo, M.C. 2012. Gluten-free bread based on tapioca starch:
texture and sensory studies. Food and Bioprocess Technology 5(3), 888–896.
Ozola, L., Straumite, E., Galoburda, R. & Klava, D. 2012. Application of extruded maize flour
in gluten-free bread formulations. World Academy of Science, Engineering and Technology
64, 883–888.
Phimolsiripol, Y., Mukprasirt, A. & Schoenlechner, R. 2012. Quality improvement of rice-based
gluten-free bread using different dietary fibre fractions of rice bran. Journal of Cereal
Science 56, 389–395.
Reis, J.A., Paula, A.T., Casarotti, S.N. & Penna, A.L.B. 2012. Lactic Acid Bacteria Antimicrobial
Compounds: Characteristics and Applications. Food Engineering Reviews 4(2), 124–140.
Renzetti, S., Dal Bello, F. & Arendt, E.K. 2008. Microstructure, fundamental rheology and
baking characteristics of batters and bread from different gluten-free flours treated
with a microbial transglutaminase. Journal of Cereal Science 48, 33–45. Różyło, R., Dziki, D., Gawlik-Dziki, U., Biernacka, B., Wójcik, M. & Ziemichód, A. 2017.
Physical and antioxidant properties of gluten-free bread enriched with carob fibre.
International Agrophysics 31, 411–418.
Sakac, M., Torbica, A., Sedej, I. & Hadnadev, M. 2011. Influence of breadmaking on antioxidant
capacity of gluten free breads based on rice and buckwheat flours. Food Research
International 44(9), 2806–2813.
Savkina, O., Kuznetsova, L., Krasnikova, L., Dubrovskaya, N., Parakhina, O. 2015. Influence of
microflora gluten free raw materials and Rowan powder on the development of ropy bread
disease. Bakery of Russia 6, pp. 31–33 (in Russian).
1372
Sciarini, L.S., Ribotta, P.D., Leon, A.E. & Perez, G.T. 2010. Effect of hydrocolloids on gluten-
free batter properties and bread quality. International Journal of Food Science and
Technology 45, 2306–2312.
State Standard of the Russian Federation 2014. Fodder plants silage. General specifications.
GOST R 55986-2014, 12 pp. (in Russian).
State Standard of the Russian Federation. 1996. Bread, rolls and buns. Methods for determination
of acidity. GOST 5670-96, 5 pp. (in Russian).
Torbica, A., Hadnadev, M. & Dapčevic, T. 2010. Rheological, textural and sensory properties of
gluten-free bread formulations based on rice and buckwheat flour. Food Hydrocolloids 24,
626–632.
Tsatsaragkou, K., Gounaropoulos, G. & Mandala, I. 2014. Development of gluten free bread
containing carob flour and resistant starch. LWT – Food Science and Technology 58,
124–129.
Wolter, A., Hager, A.-S., Zannini, E. & Elke K., Arendt. 2014. Impact of sourdough fermented
with Lactobacillus plantarum FST 1.7 on baking and sensory properties of gluten-free
breads. European Food Research and Technology 239(1), 1–12.
Ziobro, R., Korus, J., Witczak, M. & Juszczak, L. 2012. Influence of modified starches on
properties of gluten-free dough and bread. Part II: Quality and staling of gluten-free bread.
Food Hydrocolloids 29, 68–74.
1373
Agronomy Research 16(S2), 1373–1382, 2018
https://doi.org/10.15159/AR.18.148
Contents of tocols in different types of dry shell fruits
A. Hejtmánková*, J. Táborský, V. Kudelová and K. Kratochvílová
Czech University of Life Sciences Prague, Faculty of Agrobiology, Food and Natural
Resources, Department of Chemistry, Kamýcká 129, CZ165 00, Prague, Czech Republic *Correspondence: [email protected]
Abstract. The aim of this study was to identify all forms of vitamin E in different kinds of dry
shell fruits (generally called ‘nuts’) obtained from different sources and to perform their mutual
comparison. All tocols were determined by reversed phase HPLC using isocratic elution with
fluorescence detection. Almonds were evaluated as the most important source of α-tocopherol
(average value 1,132 mg kg-1), β-tocopherol was present in all samples as a minor component, its
maximum content was found in hazelnuts (9.6 mg kg-1). γ-Tocopherol was found in all kinds of
nuts and the highest content was found in pistachios (584 mg kg-1), very high amount of
δ-tocopherol was contained in Brazil nuts (2,298 mg kg-1). Tocotrienols were found in a smaller
number of nut kinds than tocopherols. α-Tocotrienol was found only in three kinds of nuts - Brazil
nuts, which contained the highest amount (399 mg kg-1), pine nuts and hazelnuts grown in the
Czech Republic, which were analyzed soon after harvest. Similarly, γ-tocotrienol was determined
only in four kinds of nuts (pistachios, macadamias, cashew and walnuts grown in the Czech
Republic), which were analyzed soon after harvest; the most significant amount was found in
pistachios (34.8 mg kg-1), β- and γ-tocotrienols were below the detection limit. In the Czech
Republic, walnuts and hazelnuts are the most widely cultivated and consumed nuts. While in
walnuts the most important form is γ-tocopherol (459 ± 40 mg kg-1), in hazelnuts it is α-
tocopherol (863 ± 10 mg kg-1).
Key words: nuts, tocopherols, tocotrienols, storage, HPLC.
INTRODUCTION
Dry shell fruits (generally called ‘nuts’) together with the other kinds of fruits and
vegetable play an important role in human nutrition, in particular as a source of vitamins,
minerals and fiber (Kader et al., 2001; Brufau et al., 2006; Tošić et al., 2015). The ideal
recommended daily intake of dry nuts to protect human health is 30 g per day
(Kornsteiner et al., 2006).
Vegetable fat is included among the most important macronutrients, its content in
nuts is 46–76%. The fats represent about 20 to 30 kJ g-1, depending on the species. Nuts
belong to the most important sources of vegetable fats due to its composition, in which
the unsaturated fatty acids are predominant. The unsaturated fatty acids have a positive
influence on a variety of lifestyle diseases (Ros & Mataix, 2006). The low ratio of
n-6/n-3 fatty acids in macadamia nuts, walnuts, chestnuts and almonds is also important
(Freitas & Naves, 2010). High content of vegetable fat in dry nuts is associated with a
significant content of vitamin E (Wagner et al., 2004); therefore dry nuts are one of the
1374
most important sources of vitamin E (tocopherols and tocotrienols) from all foods that
form a usual part of the human diet. The tocopherols, which have antioxidant properties,
provide protection against oxidation of unsaturated fatty acids at the same time
(Amaral et al., 2005). Antioxidant activity of vitamin E consists mainly in the prevention
of free radicals formation, leading to disabling of lipid peroxidation and thereby reducing
the content of LDL cholesterol (Brigelius-Flohe & Traber, 1999). Similarly as in the case
of fats, it was found that different types of nuts are fundamentally different both in
content and in the composition of the various forms of vitamin E (Kornsteiner et al.,
2006). Mainly almonds are a rich source of α-tocopherol, which is the most active form
of vitamin E, while walnuts contain a significant amount of its isomeric form that is
γ-tocopherol (Ros, 2015).
Kornsteiner et al. (2006) dealt with the content of tocopherols (α-, β-, γ-, and δ) in
oils pressed from 10 different kinds of nuts. The highest content of α-tocopherol showed
almond (31.4 mg in 100 g of extracted oil) and hazelnuts (24.2 mg in 100 g of extracted
oil). The relatively high amount of β- and γ-tocopherols, determined together, contained
pistachios, Brazil nuts, cashew nuts, peanuts, pecans, pine nuts and walnuts. Average
values in 100 g of extracted oil moved in the range from 5.1 mg (cashew nuts) to 29.3 mg
(pistachio). Traces of δ-tocopherol (< 4 mg in 100 g of extracted oil) were determined in
the cashew nuts, hazel nuts, peanuts, pecan nuts, pine nuts, walnuts, pistachios, and also
in the walnuts.
A significant advantage of nuts compared with the other fruits is their good
preservation and stability which was appreciated especially in the past
(Fraser et al., 1992). The nuts are quite predisposed to mildew, above all in areas with
high rainfall and humidity. The main risk factors are aflatoxins that are produced by the
fungus Aspergillus flavus (Macrae et al., 1993). The risk associated with contamination
by mycotoxins may be reduced by correct pre-harvest procedures, proper drying in an
adequate time after the harvest and safe storage at the right temperature and humidity
(Macrae et al., 1993; Ozilgen & Ozdemir, 2001).
Changes in the contents of tocopherols in peanuts during storage were studied by
Silva et al. (2010). According to them the contents of all forms of tocopherols decreased
during storage. In contrast, the indicators of lipid oxidation, such as peroxide number
and intensity of the oxidized and cardboard taste increased during storage. At the same
time a strong negative correlations were evaluated between the content of tocopherols
and peroxide number. Chun et al. (2005) came to the conclusion that tocopherols
decrease exponentially during storage with the current increase of peroxide number
describes. According to the cited authors the contents of tocopherols could be used as an
indicator of oxidative state in peanut products. According to Tsantili et al. (2011) the
stability and total antioxidant capacity of nuts, which is made up by vitamin E as well,
can have been influenced in addition to the external conditions also by selected cultivar.
The goal of this study was to determine the contents of various forms of vitamin E
(tocols and tocotrienols) in different kinds of dry nuts purchased at different locations in
the Czech Republic or grown and harvested in the Czech Republic and their mutual
comparison.

1375
MATERIALS AND METHODS
Analyzed nuts
Various types of nuts, namely walnuts (Juglans regia L.), hazelnuts (Corylus
avellana L.), almonds (Prunus dulcis (Mill.) D. A. Webb), cashew nuts (Anacardium
occidentale L.), pistachios (Pistacia vera L.), Brazil nuts (Bertholletia excelsa
Humb. & Bonpl.), macadamia nuts (Macadamia integrifolia Maiden & Betche), pecans
(Carya illinoinensis (Wangenh.) K. Koch), pine nuts (Pinus pinea L.) and peanuts
(Arachis hypogaea L.) of unknown origin were purchased at two different locations in
the Czech Republic market network. In addition, three samples of walnuts and one
sample of hazelnuts grown and harvested in different locations of the Czech Republic
were collected. All samples of nuts were purchased or harvested in October 2015.
Chemicals
For the preparation of analytical samples the following standards and chemicals
were used: DL-α-tocopherol, 98.2% (CALBIOCHEM, Canada), tocopherol set
(CALBIOCHEM, Canada), propan-2-ol (Lachner, Czech Republic), methanol super
gradient, content min. 99.9% (Lachner, Czech Republic), and treated distilled water
(Milipore, France).
Sample preparation
The nuts were shelled and afterwards homogenized in a laboratory grinder.
Approximatwly 0.3 g of homogenized sample was weighed into a plastic test tube with
a plastic stopper (Falcon type). 10 mL of propan-2-ol was added. The tube was slightly
shaken and then placed for 10 minutes into an ultrasound bath. Subsequently, the sample
was centrifuged for 5 minutes (Eppendorf 5810R, 20 °C at 11.5 rpm) and the supernatant
was decanted. The extraction was 3 times repeated. After that the supernatants were
collected and refilled up to 50 mL. Afterwards the tubes were placed for 2 hours into a
freezer box (-20 °C) to separate fat layer. Final supernatant was transferred through a
syringe filter (nylon, 0.22 μm) into a dark vial for HPLC analysis. All steps were carried
out at low light intensity (the windows were darkened with blinds with no direct lighting
into the lab). The efficiency of extraction of all vitamers was checked by analyses of all
the following extracts of the identical extracted samples. The content of all individual
vitamers was close to the limit of detection in the fourth extract, and therefore three
consecutive extractions have been evaluated as sufficient approaching to
100% efficiency. Extractions of all analyzed samples were performed in 3 replicates.
Tocopherol and tocotrienol chromatographic determination
HPLC-FD analyses were performed under the following conditions: analytical column
Develosil® 5 μ RP-Aqueous (250 × 4.5 mm), (Phenomenex, Torrance, CA, USA), mobile
phase H2O : methanol (3 : 97, v/v), flow 1.0 mL min−1, column temperature 30 °C,
injection volume 10.0 μL, time of analysis 30 min. Conditions of detection: fluorescence
detector, excitation wavelength λ = 292 nm, emission wavelength λ = 330 nm. The
contents of analytes in the samples were evaluated by an external standard method.
Calibration curve of all tocols was linear in the range from 0.05 to 10 μg mL-1. Limits of
detection (LODs), expressed as a ratio of three times the value of the signal-to-noise
ratio, for individual tocols δ-T3, γ-T3, β-T3, α-T3, δ-T, γ-T, β-T and α-T were 0.056,

1376
0.111, 0.111, 0.167, 0.056, 0.111, 0.111, and 0.167 μg g-1, respectively. The results were
processed with chromatography software Chromeleon and MS Excel. Examples of
chromatograms of are given in the Figs 1–3.
Figure 1. Chromatogram of tocols in walnuts.
Figure 2. Chromatogram of tocols in hazelnuts.
Figure 3. Chromatogram of tocols in almonds.
Statistical evaluation
Statistical analysis was done in Statistica Version 12.0 (Statsoft). The measured
values were processed by the analysis of one-way variance method (ANOVA), using
post-hoc Scheffé’s test for more detailed evaluation, considering α = 0.05 and the level
of significance P < 0.05 as significant.
RESULTS AND DISCUSSION
Contents of tocols in different type of nuts The determination of individual forms of vitamin E was done in 10 selected types
of nuts purchased at 2 different markets (Table 1). Only 6 different forms of vitamin
E were determined, β-tocotrienol and δ-tocotrienol in all analyzed types of nuts were
below the limit of detection (LOD = 3.33 mg kg-1 and 1.67 mg kg-1, resp.) but the
composition and contents of the other particular forms of vitamin E in analyzed types of
nuts were statistically very different.

1377
Table 1. The contents of individual tocols (mg kg-1) in different types of nuts
Nuts α-TcP β-TcP γ-TcP δ-TcP α-TcT γ-TcT
Walnuts 1 32.7 ± 4.6 < 3.33 432 ± 6.5 44.8 ± 2.3 < 5.00 < 3.33
Walnuts 2 51.8 ± 4.1 < 3.33 453 ± 6.8 59.9 ± 1.3 < 5.00 < 3.33
Mean 42.2 ± 13.5 < 3.33 442 ± 14.7 52.4 ± 10.7 < 5.00 < 3.33
Hazelnuts 1 838 ± 6 7.22 ± 0.1 31.7 ± 0.8 3.12 ± 1.3 < 5.00 < 3.33
Hazelnuts 2 769 ± 26 9.56 ± 0.8 31.3 ± 2.4 < 1.7 < 5.00 < 3.33
Mean 803 ± 34 8.39 ± 1.16 31.5 ± 1.4 2.39 ± 1.1 < 5.00 < 3.33
Almonds 1 1,125 ± 52 4.74±0.2 12.2 ± 0.7 < 1.67 < 5.00 < 3.33
Almonds 2 1,139 ± 7.4 < 3.33 30.6 ± 2 < 1.67 < 5.00 < 3.33
Mean 1,132 ± 10 4.04 ± 1 21.4 ± 13 < 1.67 < 5.00 < 3.33
Cashew 1 < 5.00 < 3.33 116 ± 1.9 6.32 ± 0.5 < 5.00 3.72 ± 0.6
Cashew 2 < 5.00 < 3.33 75.3 ± 5.6 6.60 ± 0.3 < 5.00 < 3.33
Mean < 5.00 < 3.33 95.5 ± 28.7 6.46 ± 0.2 < 5.00 3.52 ± 0.3
Pistachios 1 42.2 ± 6.4 < 3.33 590 ± 4.8 11.1 ± 1.4 < 5.00 36.3 ± 0.9
Pistachios 2 < 5.00 < 3.33 579 ± 8.4 10.0 ± 1.1 < 5.00 33.3 ± 1.7
Mean 23.6 ± 26 < 3.33 585 ± 8.1 10.6 ± 0.8 < 5.00 34.7 ± 2.2
Brazil nuts 1 175 ± 26 < 3.33 472 ± 11.3 2,932 ± 167 391 ± 39.3 < 3.33
Brazil nuts 2 149 ± 3.7 < 3.33 381 ± 12.8 1,664 ± 154 < 5.00 < 3.33
Mean 162 ± 18 < 3.33 427 ± 64.1 2,298 ± 897 202 ± 279 < 3.33
Macadamia 1 464 ± 22 < 3.33 187 ± 8.46 6.96 ± 0.61 < 5.00 14.0 ± 1.13
Macadamia 2 406 ± 13 < 3.33 < 3.33 < 1.67 < 5.00 < 3.33
Mean 435 ± 41 < 3.33 95.1 ± 129 4.31 ± 3.74 < 5.00 8.67 ± 7.54
Pecans 1 32.5 ± 0.76 < 3.33 586 ± 9.96 39.9 ± 0.71 < 5.00 < 3.33
Pecans 2 97.3 ± 24.3 < 3.33 188 ± 1.28 16.1 ± 0.36 < 5.00 < 3.33
Mean 64.9 ± 46 < 3.33 387 ± 282 28.0 ± 16.8 < 5.00 < 3.33
Pine nuts 1 < 5.00 < 3.33 < 3.33 < 1.67 78.9 ± 7.21 < 3.33
Pine nuts 2 26.7 ± 1.0 < 3.33 67.5 ± 1.27 < 1.67 < 5.00 < 3.33
Mean 15.8 ± 15 < 3.33 35.4 ± 45.4 < 1.67 41.9 ± 52.2 < 3.33
Peanuts 1 267 ± 2.9 < 3.33 124 ± 1.32 5.83 ± 0.52 < 5.00 < 3.33
Peanuts 2 281 ± 6.8 < 3.33 99.8 ± 1.61 6.72 ± 0.53 < 5.00 < 3.33
Mean 274 ± 10 < 3.33 112 ± 17.4 6.27 ± 0.63 < 5.00 < 3.33
TcP – tocopherol, TcT – tocotrienol.
The variability in the content of individual tocols between 2 groups of samples of
the same type (purchased in different locations of the Czech Republic) was strongly
divergent and ranged from 0.08% (almonds, α-tocopherol) to 138% (Brazil nuts,
α-tocotrienol). In general, the highest differences were determined in the content of
α-tocotrienol, which was found only in Brazil nuts and pine nuts. In comparison, the
average variability of parallel determination of the same sample was 5.10% and only
exceptionally (in two cases) was close to 20% (Table 2). According to Tsantili
et al. (2011) external conditions during growing play an important role in the content of
individual substances. The origin of purchased samples is not known and may be
different.
The most contained forms of vitamin E, which are represented in most of the
analysed species of dry nuts were α-tocopherol and γ-tocopherol (Table 1). The content
of α-tocopherol ranged from 26.7 to 1,139 mg kg-1 depending on the type of dry nuts.
The highest average amount of α-tocopherol was found in almonds (1,132 ± 10) mg kg1
and hazelnuts (863 ± 109) mg kg-1; these two kinds of dry nuts were the most important

1378
source of α-tocopherol also in studies by Maguire et al (2004) and Kornsteiner et al.
(2006).
In contrast, the lowest content of α-tocopherol was found in cashew nuts and in one
sample of pine nuts, where the presence of α-tocopherol was below the limit of detection
(5 µg g-1). These findings are in agreement with the analysis of Kornsteiner et al. (2006)
again.
The presence of γ-tocopherol was found in all of the analyzed species of dry nuts
(Table 1). Contents of γ-tocopherol ranged between 2.23–590.4 mg kg-1 depending on
the kind of nuts. The highest amount of γ-tocopherol was found in pistachio
(584.7 ± 8.1 mg kg-1) and next to in the samples of walnuts, Brazil nuts and pecan nuts,
which is in good accordance with the study by Kornsteiner et al. (2006), where the
amount of γ-tocopherol was found in the same descending order in different samples of
nuts.
Miraliakbari & Shahidi (2008) reported that the highest amount of γ-tocopherol
contained in pecan nuts was 440.2–472.9 mg kg-1. In this study various values of
γ-tocopherol in pecan nuts were established in two analyzed samples (586 ±
9.96) mg kg-1 and (188 ± 1.28) mg kg-1, resp. It means that other nuts, especially
pistachios, have been found as more significant resources of γ-tocopherol.
β-Tocopherol above the limit of detection has been found in only one sample of
almonds (4,744 mg kg-1), and in one sample of hazelnuts (9,556 mg kg-1). It can
therefore be stated that β-tocopherol is a minor form of vitamin E. This statement is in
agreement with the work by Miraliakbari & Shahidi (2008), where β-tocopherol has been
found only in samples of almonds and pine nuts. The founded content was in the range
10.9–22.6 mg kg-1.
The highest levels of δ-tocopherol were contained in Brazil nuts
(2297 ± 89) mg kg-1. The differences in the content of this vitamer among the various
type of nuts were the biggest, because the content of the δ-tocopherol in some next
analyzed samples was very low and sometimes even below the limit of detection
(< 1.67 g g-1). In contrary only small amount of δ-tocopherol in 10 different kinds of
nuts were detected by Kornsteiner et al. (2006) that found the biggest content 3.8 mg in
100 g extracted oil from walnuts.
A significant higher amount of this form of vitamin E contained also walnuts
(52.4 ± 10.7) mg kg-1, which is more than twice higher value than determined
Miraliakbari & Shahidi (2008) in their study. According to this authors the content of
δ-tocopherol in walnuts is ranging from 19.8–23.4 mg kg-1. This difference could
probably be in consequence of different origin and varieties of nuts, or different period
of storage before analysis.
In general, the contents of tocotrienols in comparison with tocopherols were found
in significantly lower quantities in all dry nut types. Brazil nuts were evaluated as the
most important source of α-tocotrienol; in one sample of these nuts the content
(399.1 ± 37) mg kg-1 was found. α-Tocotrienol was also determined in only one sample
of pinenuts (78.9 ± 6.3) mg kg-1. The content of α-tocotrienol in all next analyzed
samples was below the limit of detection (< 5.00 g g-1).
The other vitamer of vitamin E from the tocotrienols group, γ-tocotrienol, was
found only in three types of purchased nuts namely cashew, pistachios and macadamia
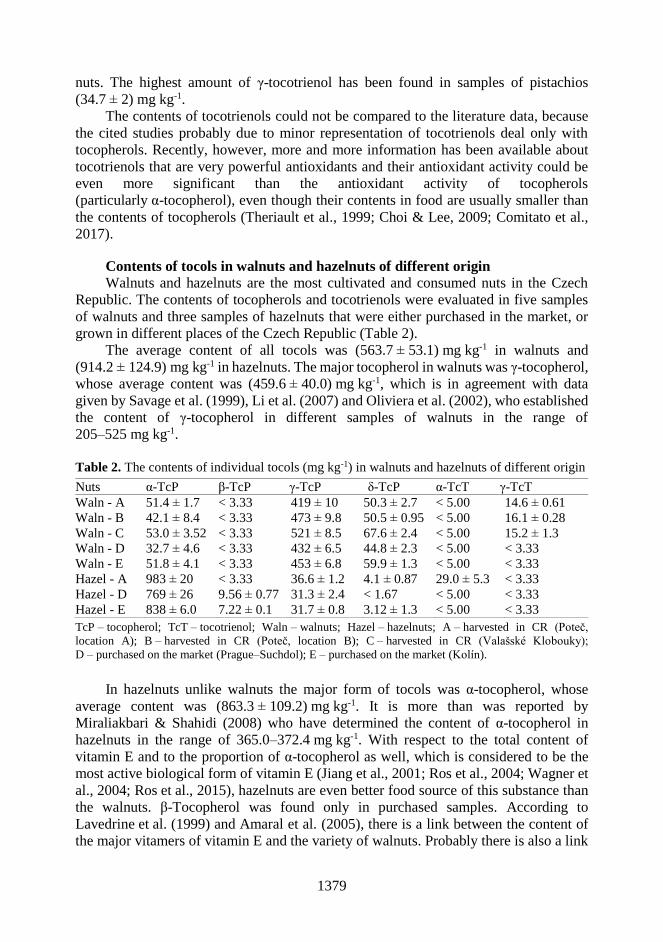
1379
nuts. The highest amount of γ-tocotrienol has been found in samples of pistachios
(34.7 ± 2) mg kg-1.
The contents of tocotrienols could not be compared to the literature data, because
the cited studies probably due to minor representation of tocotrienols deal only with
tocopherols. Recently, however, more and more information has been available about
tocotrienols that are very powerful antioxidants and their antioxidant activity could be
even more significant than the antioxidant activity of tocopherols
(particularly α-tocopherol), even though their contents in food are usually smaller than
the contents of tocopherols (Theriault et al., 1999; Choi & Lee, 2009; Comitato et al.,
2017).
Contents of tocols in walnuts and hazelnuts of different origin
Walnuts and hazelnuts are the most cultivated and consumed nuts in the Czech
Republic. The contents of tocopherols and tocotrienols were evaluated in five samples
of walnuts and three samples of hazelnuts that were either purchased in the market, or
grown in different places of the Czech Republic (Table 2).
The average content of all tocols was (563.7 ± 53.1) mg kg-1 in walnuts and
(914.2 ± 124.9) mg kg-1 in hazelnuts. The major tocopherol in walnuts was γ-tocopherol,
whose average content was (459.6 ± 40.0) mg kg-1, which is in agreement with data
given by Savage et al. (1999), Li et al. (2007) and Oliviera et al. (2002), who established
the content of γ-tocopherol in different samples of walnuts in the range of
205–525 mg kg-1.
Table 2. The contents of individual tocols (mg kg-1) in walnuts and hazelnuts of different origin
Nuts α-TcP β-TcP γ-TcP δ-TcP α-TcT γ-TcT
Waln - A 51.4 ± 1.7 < 3.33 419 ± 10 50.3 ± 2.7 < 5.00 14.6 ± 0.61
Waln - B 42.1 ± 8.4 < 3.33 473 ± 9.8 50.5 ± 0.95 < 5.00 16.1 ± 0.28
Waln - C 53.0 ± 3.52 < 3.33 521 ± 8.5 67.6 ± 2.4 < 5.00 15.2 ± 1.3
Waln - D 32.7 ± 4.6 < 3.33 432 ± 6.5 44.8 ± 2.3 < 5.00 < 3.33
Waln - E 51.8 ± 4.1 < 3.33 453 ± 6.8 59.9 ± 1.3 < 5.00 < 3.33
Hazel - A 983 ± 20 < 3.33 36.6 ± 1.2 4.1 ± 0.87 29.0 ± 5.3 < 3.33
Hazel - D 769 ± 26 9.56 ± 0.77 31.3 ± 2.4 < 1.67 < 5.00 < 3.33
Hazel - E 838 ± 6.0 7.22 ± 0.1 31.7 ± 0.8 3.12 ± 1.3 < 5.00 < 3.33
TcP – tocopherol; TcT – tocotrienol; Waln – walnuts; Hazel – hazelnuts; A – harvested in CR (Poteč,
location A); B – harvested in CR (Poteč, location B); C – harvested in CR (Valašské Klobouky);
D – purchased on the market (Prague–Suchdol); E – purchased on the market (Kolín).
In hazelnuts unlike walnuts the major form of tocols was α-tocopherol, whose
average content was (863.3 ± 109.2) mg kg-1. It is more than was reported by
Miraliakbari & Shahidi (2008) who have determined the content of α-tocopherol in
hazelnuts in the range of 365.0–372.4 mg kg-1. With respect to the total content of
vitamin E and to the proportion of α-tocopherol as well, which is considered to be the
most active biological form of vitamin E (Jiang et al., 2001; Ros et al., 2004; Wagner et
al., 2004; Ros et al., 2015), hazelnuts are even better food source of this substance than
the walnuts. β-Tocopherol was found only in purchased samples. According to
Lavedrine et al. (1999) and Amaral et al. (2005), there is a link between the content of
the major vitamers of vitamin E and the variety of walnuts. Probably there is also a link

1380
between the content of other vitamers of vitamin E and the variety of other types of dry
nuts. Unfortunately, nothing is known about the varieties of analyzed hazelnuts.
In samples of walnuts and hazelnuts grown and harvested in the different localities
of the Czech Republic have been also determined tocotrienols but in significantly smaller
quantities than tocopherols. In sample of hazelnut the most important and the only one
detected form of tocotrienols was α-tocotrienol (29.0 ± 5.3) mg kg-1. On the contrary, in
all samples of walnuts the most important and the only one detected form of tocotrienols
was γ-tocotrienol whose average content was 5.32 ± 0.75 mg kg-1. In the purchased
samples these vitamers were below the limit of detection. β-and γ-tocotrienols were
below the limit of detection even in all samples of both walnuts and hazelnuts.
It seems likely that the duration and way of storage of nuts has a significant
influence on the content of various forms of vitamin E, because the nuts grown in the
Czech Republic were analyzed immediately after harvest. Nothing is known about the
time of harvest and the way of storage of the purchased nuts. Silva et al. (2010) and
Chun et al. (2005) came to the same conclusion that the contents of various forms of
vitamin E depend on the duration of nuts storage.
On the basis of statistical analysis it was shown that in five tested samples of
walnuts and three tested samples of hazelnuts differing in the place of origin, a
statistically significant difference was found between the various forms of vitamin E,
both between the purchased samples on the market and samples originating from the
home production, as well as among the samples inside each group.
While statistically the highest content of majority form α-tocopherol was set in
hazelnut nuts grown in the Czech Republic, in samples of walnuts both statistically the
highest and the lowest content of majority form γ-tocopherol were always established in
samples of nuts grown in the Czech Republic. According to Lavedrine et al. (1999) and
Amaral et al. (2005), there is a link between the content of the major vitamers of vitamin
E and the variety of walnuts. In addition to the different geographic origin of nuts this
fact could also be the cause of the differentiation in the content of tocols in different
samples of walnut and hazelnut.
CONCLUSIONS
Significant differences in the content and composition of the various forms of
vitamin E among the 10 kinds of dry nuts were detected. The most important and the
most represented vitamers of this lipophilic vitamin have been found α-tocopherol
(almonds) and γ-tocopherol (pistachios). High amount of δ-tocopherol contained Brazil
nuts. Tocotrienols (α and γ) were found only in a few selected species of dry nuts and
γ- and δ-tocotrienols have been in all the samples below the limit of detection.
In the Czech Republic are the most cultivated and consumed walnuts and hazelnuts.
Statistically significant differences were found in the content of the various forms of
vitamin E among samples of walnut and hazelnut, which came from different
geographical areas or were purchased in different location in the Czech Republic.
α-and γ-tocotrienols have been also represented in walnuts and hazelnuts in minority
quantity, but only in samples of nuts grown and harvested in the Czech Republic and
analysed soon after harvest.
1381
In conclusion it can be stated that dry nuts are an excellent source of vitamin E in
human diet, but the content and mutual ratio of individual vitamers varies considerably
according to the type of nut.
ACKNOWLEDGEMENTS. This work was supported by a S grant of the Ministry of Education,
Youth and Sports of the Czech Republic.
REFERENCES
Amaral, J.S., Alves, M.R., Seabra, R.M. & Oliveira, B.P.P. 2005. Vitamin E composition of
walnut (Juglans regia L.): A 3-year comparative study of different cultivars. Journal of
Agricultural and Food Chemistry 53, 5467–5472.
Brigelius-Flohe, R. & Traber, M.G. 1999. Vitamin E: function and metabolism. Faseb Journal
13, 1145–1155.
Brufau, G., Boatella, J. & Rafecas, M. 2006. Nuts: source of energy and macronutrients. British
Journal of Nutrition 96, 24–28.
Choi, Y. & Lee, J. 2009. Antioxidant and antiproliferative properties of α-tocotrienol -
rich fraction. Food Chemistry 114, 1386–1390.
Comitato, R., Ambra, R. & Virgili, F. 2017. Tocotrienols: A Family of Molecules with Specific
Biological Activities. Antioxidants 6, Article Number 93.
Chun, J., Lee, J. & Eitenmiller, R.R. 2005. Vitamin E and oxidative stability during storage of
raw and dry roasted peanuts packaged under air and vacuum. Journal of Food Science 70,
292–297.
Fraser, G.E., Sabate, J., Beesen, W.L. & Strahan, T.M. 1992. A possible protective effect of nut
consumption on risk of coronary heart-disease - the adventist health study. Archives of
Internal Medicine 152, 1416–1424.
Freitas, J.B. & Naves, M.M.V. 2010. Chemical composition of nuts and edible seeds and their
relation to nutrition and health. Revista De Nutricao-Brazilian Journal of Nutrition 23,
269–279.
Jiang, Q., Christen, S., Shigenaga, M.K. & Ames, B.N. 2001. Gamma-Tocopherol, the major
form of vitamin E in the US diet, deserves more attention. American Journal of Clinical
Nutrition 74, 714–722.
Kader, A. 2001. Importance of Fruits, Nuts, and Vegetables in Human Nutrition and Health.
Perishables Handling Quarterly 106, 4–6.
Kornsteiner, M., Wagner, K.H. & Elmadfa, I. 2006. Tocopherols and total phenolics in 10
different nut types. Food Chemistry 98, 381–387.
Lavedrine, F., Zmirou, D., Ravel, A., Balducci, F. & Blood, A.J. 1999. Cholesterol and walnut
consumption: a cross-sectional survey in France. Preventive Medicine 28, 333–339.
Li, L., Tsao, R., Yang, R., Kramer, J.K.G. & Hernandez, M. 2007. Fatty acid profiles, tocopherol
contents, and antioxidant activities of heartnut (Juglans ailanthifolia var. Cordiformis) and
persian walnut (Juglans regia L.). Journal of Agricultural and Food Chemistry 55,
1164–1169. Macrae, R., Robinson, R.K. & Sadler, M.J. 1993. Encyclopaedia of Food Science, Food
Technology and Nutrition. 1st ed. Academic Press, London, Volume 1, 5365 pp.
Maguire, L.S., O'sullivan, S.M., Galvin, K., O'connor, T.P., O'brien, N.M., Fallico, B.,
Ballistreri, G., Arena, E. & Tokuşoğlu, Ö. 2004. Fatty acid profile, tocopherol, squalene
and phytosterol content of walnuts, almonds, peanuts, hazelnuts and the macadamia nut.
International Journal of Food Sciences and Nutrition 55, 185–212.
Miraliakbari, H. & Shahidi, F. 2008. Lipid class compositions, tocopherols and sterols of tree nut
oils extracted with different solvents. Journal of Food Lipids 15, 81–96.

1382
Oliveira, R., Rodrigues, M. & Bernardo-Gil, M. 2002. Characterization and supercritical carbon
dioxide extraction of walnut oil. Journal of the American Oil Chemists’ Society 79,
225–230.
Ozilgen, M. & Ozdemir, M. 2001. A review on grain and nut deterioration and design of the
dryers for safe storage with special reference to Turkish hazelnuts. Critical Reviews in Food
Science and Nutrition 41, 95–132.
Ros, E., Nunez, I., Perez-Heras, A., Serra, M., Gilabert, R., Casals, E. & Deulofeu, R. 2004.
A walnut diet improves endothelial function in hypercholesterolemic subjects: a
randomized crossover trial. Circulation 109, 1609–1614.
Ros, E. & Mataix, J. 2006. Fatty acid composition of nuts - implications for cardiovascular health.
British Journal of Nutrition 96, S29–S35.
Ros, E. 2015. Nuts and CVD. British Journal of Nutrition 113, S111-S120.
Savage, G. P., Dutta, P.C. & McNeil, D.L. 1999. Fatty acid and tocopherol contents and oxidative
stability of walnut oils. Journal of the American Oil Chemists Society 76, 1059–1063.
Silva, M.P., Martinez, M.J., Casini, C. & Grosso, N.R. 2010. Tocopherol content, peroxide value
and sensory attributes in roasted peanuts during storage. International Journal of Food
Science and Technology 45, 1499–1504.
Theriault, A., Chao, J.T., Wang, Q., Gapor, A. & Adeli, K. 1999. Tocotrienol: A review of its
therapeutic potential. Clinical Biochemistry 32, 309–319.
Tošić, S.B., Mitić, S.S., Velimirović, D.S., Stojanović, G.S., Pavlović, A.N. & Pecev-
Marinković, E.T. 2015. Elemental composition of edible nuts: fast optimization and
validation procedure of an ICP - OES method. Journal of the Science of Food and
Agriculture 95, 2271–2278.
Tsantili, E., Konstantinidis, K., Christopoulos, M.V. & Roussos, P.A. 2011. Total phenolics and
flavonoids and total antioxidant capacity in pistachio (Pistachia vera L.) nuts in relation to
cultivars and storage conditions. Scientia Horticulturae 129, 694–701.
Wagner, K.H., Kamal-Eldin, A. & Elmadfa, I.U. 2004. Gamma-tocopherol - An underestimated
vitamin? Annals of Nutrition and Metabolism 48, 169–188.

1383
Agronomy Research 16(S2), 1383–1387, 2018
https://doi.org/10.15159/AR.18.030
3D image analysis of the shapes and dimensions of several
tropical fruits
D. Herak1,*, C. Mizera1, P. Hrabe2 and A. Kabutey1
1Czech University of Life Science Prague, Faculty of Engineering, Department of
Mechanical Engineering, Kamycka 129, CZ16521 Prague, Czech Republic 2Czech University of Life Science Prague, Faculty of Engineering, Department of
Mechanical Engineering, Kamycka 129, CZ16521 Prague, Czech Republic *Correspondence: [email protected]
Abstract. Three dimension virtual models of Avocado (Persea americana), Salak (Salacca
zalacca), Dragon fruit (Hylocereus undatus), Mango (Mangifera indica), Coconut (Cocos
nucifera) using 3D scanner Intel RealSense were determined. Calculated models based on
arithmetic and geometric diameter were also determined. From statistically analysis implies that
virtual models on significance level 0.05 are significantly different with calculated values based
on arithmetic or geometric diameter.
Key words: virtual, model, scanner, physical properties.
INTRODUCTION
Accurately understanding to the shapes and dimensions of fruits is one of the key
factors which is important for creating mathematical models of their mechanical
behaviour (Petrů et al., 2012; Petrů et al., 2014; Herák, 2016). Nowadays with the advent
of new progressive technologies the construction process of food processing
technologies increasingly utilize 3D virtual models as tools for describing mechanical
behaviour of individual fruits as well as bulk fruits (Lizhang et al., 2013; Zhan et al.,
2013). These 3D models are usually used in modern simulation processes such are for
instance systems based on finite element method (Petrů et al., 2012; Petrů et al., 2014).
Tropical fruits such are Avocado (Persea americana), Salak (Salacca zalacca),
Dragon fruit (Hylocereus undatus), Mango (Mangifera indica), Coconut (Cocos
nucifera) are one of the main agricultural products of Southest Asia and they are of great
interest to food processors using virtual models to appropriately design the entire food
processing chain with respect to high level quality of final products. In previous studies,
they were published several 3D models of apple, banana, orange and pear (Barnea et al.,
2016). However, the 3D virtual models of tropical fruits which are examined in this study
were not described yet in professional literature.
Thus the aim of this research is to determine the three dimension virtual models of
Avocado, Salak, Dragon fruit, Mango, Coconut and these virtual models to verify and to
compare with real fruits.
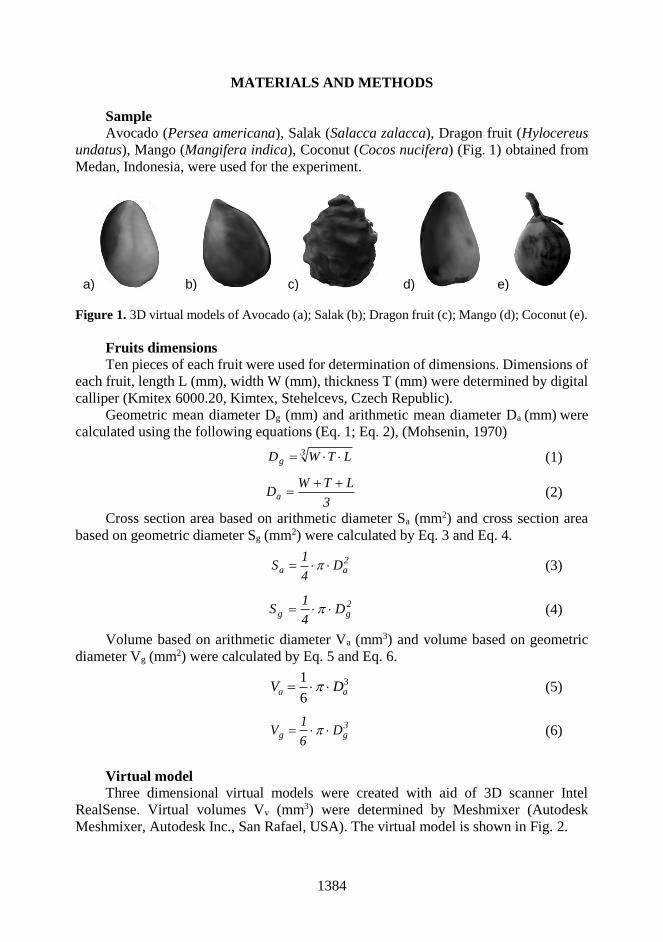
1384
MATERIALS AND METHODS
Sample
Avocado (Persea americana), Salak (Salacca zalacca), Dragon fruit (Hylocereus
undatus), Mango (Mangifera indica), Coconut (Cocos nucifera) (Fig. 1) obtained from
Medan, Indonesia, were used for the experiment.
a) b) c) d) e)
Figure 1. 3D virtual models of Avocado (a); Salak (b); Dragon fruit (c); Mango (d); Coconut (e).
Fruits dimensions
Ten pieces of each fruit were used for determination of dimensions. Dimensions of
each fruit, length L (mm), width W (mm), thickness T (mm) were determined by digital
calliper (Kmitex 6000.20, Kimtex, Stehelcevs, Czech Republic).
Geometric mean diameter Dg (mm) and arithmetic mean diameter Da (mm) were
calculated using the following equations (Eq. 1; Eq. 2), (Mohsenin, 1970)
3g LTWD (1)
3
LTWDa
(2)
Cross section area based on arithmetic diameter Sa (mm2) and cross section area
based on geometric diameter Sg (mm2) were calculated by Eq. 3 and Eq. 4.
2aa D
4
1S (3)
2gg D
4
1S (4)
Volume based on arithmetic diameter Va (mm3) and volume based on geometric
diameter Vg (mm2) were calculated by Eq. 5 and Eq. 6.
3
6
1aa DV (5)
3gg D
6
1V (6)
Virtual model
Three dimensional virtual models were created with aid of 3D scanner Intel
RealSense. Virtual volumes Vv (mm3) were determined by Meshmixer (Autodesk
Meshmixer, Autodesk Inc., San Rafael, USA). The virtual model is shown in Fig. 2.

1385
Figure 2. View a virtual model in Meshmixer software.
RESULTS AND DISCUSSION
Measured and calculated dimensions for individual fruits are presented in Table 1.
Calculated diameters, volumes and areas are shown in Table 2. From statistical analysis
(Table 3) it is evident that determined volumes of virtual models are significantly
different on the level of significance 0.05 than calculated models based on arithmetic or
geometric diameter. This statement is also clear from the ratio between calculated
volumes and virtual volumes such is presented in Table 2.
Table 1. Measured dimensions and calculated diameters, volumes and areas
Fruit L, mm W, mm T, mm Vv, mm3
Avocado (SD) 98 (2) 111 (3) 99 (4) 508,049 (16,171)
Salak (SD) 116 (8) 134 (29) 115 (3) 794,008 (174,283)
Dragon fruit (SD) 54 (2) 66 (5) 51 (4) 81,576 (16,750)
Mango (SD) 88 (1) 127 (1) 86 (7) 483,310 (19,745)
Coconut (SD) 160 (4) 242 (43) 164 (10) 2,475,240 (130,480)
Based on measured data (Table 1 and 2), it is evident that 3D models can provide
more accurate information about the true geometric properties of the fruit. From these
models (Fig. 1) imply that the shapes of the virtual model are similar to shapes of the
real fruits and that they can accurately describe surface structures. From determined
amounts (Table 1 and 2) it follows that volume standard deviations of analysed fruits
except Salak are around fifteen percent which is usual for agricultural products
(Mohsenin, 1970). However volume standard deviation of Salak is higher than standard
deviation of other analysed fruits that is given by varied and complicated shape which is
also evident from Fig. 1c and Fig. 2 (Ismail & Bakar, 2018).

1386
Table 2. Calculated diameters, volumes and areas
Fruit Da,
mm
Dg,
mm
Sa,
mm2
Sg,
mm2
Va,
mm3
Vg,
mm3 Va/V Vg/V
Avocado
(SD)
103
(1)
102
(1)
8,263
(178)
8,236
(205)
565,245
(18,234)
562,418
(21,047)
1.11
(0.07)
1.11
(0.08)
Salak
(SD)
122
(13)
121
(13)
11,658
(2,554)
11,581
(2,411)
951,446
(311,044)
941,526
(292,756)
1.20
(0.65)
1.19
(0.63)
Dragon fruit
(SD)
57
(4)
57
(4)
2,555
(319)
2,520
(312)
97,303
(18,178)
95,308
(17,677)
1.19
(0.47)
1.17
(0.46)
Mango
(SD)
100
(1)
98
(1)
7,871
(179)
7,596
(175)
525,481
(17,946)
498,131
(17202)
1.09
(0.08)
1.03
(0.08)
Coconut
(SD)
189
(10)
185
(6)
28,005
(2,836)
26,891
(1,620)
3,529,675
(535,592)
3,319,168
(299,898)
1.43
(0.29)
1.34
(0.19)
From already published studies as well as from this conducted study follows that
these determined 3D virtual models can be used as tools in modern simulation processes
such are for instance systems based on finite element method (Petrů et al., 2012; Lizhang
et al., 2013; Zhan et al., 2013; Petrů et al., 2014). The benefit in using these models is
mainly for accurate simulation of processing, storage and transportation of fruits (Barnea
et al., 2016).
Table 3. Statistical analysis measured values with models’ values
Compared amount Va /Vv Vg/Vv
T test value Avocado 9.740 7.803
Salak 2.296 2.233
Dragon fruit 2.860 2.539
Mango 10.752 6.121
Coconut 4.259 6.630
T test critical value 1.833 1.833
CONCLUSIONS
The three dimension virtual models of Avocado, Salak, Dragon fruit, Mango,
Coconut were determined and compared with real fruits. The measured values using
standard methods were compared with the values from the models. From statistically
analysis implies that this model on significance level 0.05 are significantly different with
calculated values based on arithmetic or geometric diameter. Based on measured data,
it is evident that 3D models can provide more accurate information about the true
geometric properties of the fruit. They can be used, for example, in the construction of
machines and equipment for harvesting fruit.
ACKNOWLEDGEMENTS. This paper has been supported by Internal Grant Agency of Faculty
of Engineering – Czech University of Life Sciences Prague – IGA 2017: 31130/1312/3111.

1387
REFERENCES
Barnea, E., Mairon, R. & Ben-Shahar, O. 2016. Colour-agnostic shape-based 3D fruit detection
for crop harvesting robots. Biosystems Engineering 146, 57–70.
Herák, D. 2016. Image analysis of the shapes and dimensions of Teff seeds (Eragrostis tef).
Agronomy Research 14, 1299–1305.
Ismail, N. A. & Bakar, M.F.A. 2018. Salak-Salacca zalacca. In Exotic Fruits. pp. 383–390.
Mohsenin, N. 1970. Physical properties of plant and animial materials. Vol. 1. Structure,
physical characterisitics and mechanical properties. Physical properties of plant and
animial materials. New York, Gordon and Breach Science Publishers, 742 pp.
Petrů, M., Novák, O., Herák, D. & Simanjuntak, S. 2012. Finite element method model of the
mechanical behaviour of Jatropha curcas L. seed under compression loading. Biosystems
Engineering 111, 412–421.
Petrů, M., Novák, O., Herák, D., Mašín, I., Lepšík, P. & Hrabě, P. 2014. Finite element method
model of the mechanical behaviour of Jatropha curcas L. bulk seeds under compression
loading: Study and 2D modelling of the damage to seeds. Biosystems Engineering 127,
50–66.
Lizhang, X., Yaoming, L., Zheng, M., Zhan, Z. & Chenghong, W. 2013. Theoretical analysis and
finite element simulation of a rice kernel obliquely impacted by a threshing tooth.
Biosystems Engineering 114, 146–156.
Zhan, Z., Yaoming, L., Zhenwei, L. & Zhiqiang, G. 2013. DEM simulation and physical testing
of rice seed impact against a grain loss sensor. Biosystems Engineering 116, 410–419.

1388
Agronomy Research 16(S2), 1388–1395, 2018
https://doi.org/10.15159/AR.18.139
Effects of processing conditions on physical parameters of
triticale flakes
T. Kince1, E. Straumite1,*, D. Klava1, Z. Kruma1, K. Abelniece2 and
A. Balgalve2
1Latvia University of Life Sciences and Technologies, Faculty of Food Technology,
Department of Food Technology, Rigas iela 22, LV-3004 Jelgava, Latvia 2Ltd Felici, Rigas gatve 8, LV-2164 Adazi, Adazu novads, Latvia *Correspondence: [email protected]
Abstract. Consumer interest in breakfast cereal flakes has increased during the last few years.
Various technologies, used to produce flakes, significantly influence their quality parameters and
shelf-life stability. The main purpose of the present research was to investigate how different
processing methods affect the physical parameters of triticale flakes. For obtaining the flakes,
cleaned whole triticale grains were treated using the following technologies: dry processing (hot
air), steam processing and soaking with subsequent steaming. For preparing the flakes different
kilning methods and traditional flaking rolls were used. Traditionally made rolled and dried
whole grain triticale flakes were analysed as a control sample. Using standard methods, the
flakes’ moisture content, water activity, microstructure, swelling capacity and colour changes
were analysed. The gap settings of flake rollers do not influence significantly (P < 0.05) changes
of starch during processing. However, the starch granules were fully transformed into sugars in
the flake samples with greater thickness. Non-significant (P < 0.05) steaming and hot air drying
(toasting) conditions’ effects were observed on the changes of the starch granules during
processing. Strong correlation was determined during the analysis of water activity and moisture
content. The moisture content of the ready- to-eat flakes varied from 2.54% to 10.66%, and the
water activity value was from 0.108 to 0.494. Compared with traditionally processed flakes
(control sample) the colour of the flakes prepared using other technologies changed significantly,
the E values varied from 9.587 to 18.554. The colour of the soaked-steamed-rolled-hot air dried
samples was similar but those significantly differed from the colour of soaked-dried-rolled-hot
air dried flake samples. The soaked-dried-rolled-hot air dried flakes were darker compared with
other analysed flake samples.
Key words: triticale flakes, technology, quality.
INTRODUCTION
Nowadays, breakfast cereals are one of the basic elements in the human diet
(Mathebula et al., 2017). In general, breakfast cereals are processed grains for human
consumption, typically ready-to-eat. However, ready-to-eat cereals are produced by a
variation of several technological operations such as cooking, shape forming, finish
drying, flavouring, sweetening, enrichment with vitamins and minerals
(Caldwell et al., 2016). Breakfast cereal products historically have been used as milled
1389
grains of wheat and oats, that required further cooking at home prior to consumption.
Nowadays, due to the efforts to reduce in-home preparation time, breakfast cereal
technology has evolved from a simple procedure to the manufacturing of ready-to-eat
products that are convenient and quickly prepared (Mbaeyi-Nwaoha, 2016). Most
ready-to-eat cereals may be grouped into several general categories regarding their
manufacturing processes: flaked cereals (corn flakes, wheat flakes, and rice flakes),
including extruded flakes, gun-puffed whole grains, extruded gun-puffed cereals,
shredded whole grains, extruded and other shredded cereals, oven-puffed cereals,
granola cereals, extruded expanded cereals, baked cereals, compressed flake biscuits,
muesli-type products, and filled bite-size shredded wheat (Fast, 2000). The basic flake
making process includes the following main processing stages: starch gelatinisation,
browning reaction, interrupting the enzymatic process, sugars dextrinization,
caramelisation and moisture reduction (Matz, 1991).
Traditionally, in the world flaked, puffed, shredded, and cooked ready-to-eat
cereals are made from whole grains or parts of grains of corn, wheat, rice, or oat
(Caldwell et al., 2016). Nowadays, the manufacturers are paying more and more
attention to use untraditional cereals in flake production like triticale. For example,
triticale flakes should be used as one of the compounds in flake mixtures obtaining a
ready-to-consume product with elevated nutritive value, good sensory properties and
appropriate shelf-life (Kince et al., 2017).
In general, triticale (× Triticosecale Wittmack) was developed by crossing rye and
wheat (McGoverin et al., 2011). The results presented in a review by Zhu (2018)
conclude, that world production of triticale has been increased during the last few years
because triticale has higher starch, arabinoxylans, β-glucans, fructans, lignins, proteins
(including α-amylase), alkylresorcinols, vitamins, and polyphenols contents. However,
Fraś et al. (2016) indicate, that triticale varieties with a favourable chemical composition
from a nutritional and technological perspective can be a good material for flour and
bread production. Arendt & Zannini (2013) indicate, that triticale offers a better amino
acid balance, mainly due to the high lysine content, resulting a greater biological value
than wheat protein.
The main purpose of the present research was to investigate how different
processing methods affect the physical parameters of triticale flakes.
MATERIALS AND METHODS
Flake sample preparation
In the present experiment three different technologies for flake production
were used: commercially processed flakes (control sample) - purchased ready-made
triticale whole grain flakes (mixture of several cultivars) from JSC Dobeles dzirnavnieks
(Latvia). The processing technology includes cleaned triticale grain steaming, rolling
and drying.
Samples with the first code 1 (cooking technology 1) - cooked triticale flakes were
obtained by 1 min steaming, and applying pressure 0.5 ± 0.1 bar for 10 min and at
different flaking roll gap settings (respectively, sample 1/3/1 - 0.06 ± 0.01 mm and
sample 1/4/1 - 0.04 ± 0.01 mm). Processed triticale flakes were transferred for drying
into Mitchell Bach Dryer (GmbH Baker Perkins, UK) for 35 ± 5 min at 80 ± 1 °C.
Samples with the first code 2 (cooking technology 2) - triticale grains were transferred

1390
into Rotary Cereal Cooker (GmbH Baker Perkins, UK) with adding of extra water
20 ± 3% from grains total amount, after that samples were 5 min steamed and cooked
30 ± 5 min at pressure 1.2 bar. Samples 2/1/2/1, 2/1/3/1, 2/1/4/1 differed by flaking roll
gap settings, respectively, 0.10 ± 0.01, 0.06 ± 0.01 and 0.04 ± 0.01 mm gap. Processed
triticale flakes were transferred for drying into Mitchell Bach Dryer (GmbH Baker
Perkins, UK) at 80 ± 1 °C for 30 ± 5 min. Toasting procedure was performed in decreasing temperatures under 200 ± 10 °C
for less than one minute in the toaster New Thermoglide Toaster Rig (GmbH Baker
Perkins, UK).
Moisture content
Moisture content of triticale flakes was determined using air-oven method
(AACC Method 44-15.02) by drying of 5.00 ± 0.05 g sample in the oven Memmert
(GmbH Memmert, Germany) - for 1 hour at 110 ± 5 C temperature. The analyses of
moisture content were done in triplicate.
Water activity (aw)
Water activity (aw) was determined using LabSwift-aw (AG Novasina,
Switzerland) equipment. Ground flakes were used for the determination of water
activity. The analyses of water activity were done in triplicate.
Colour
The colour of triticale flakes was determined using ColorTec-PCM/PSM (Accuracy
Inc., USA) in the colour system CIEL*a*b* (L*0 = black, 100 = white, a* + value = red,
a* - value = green, b* + value = yellow, b* - value = blue). Ground flakes were used for
the determination of colour. Ten readings for each sample determined the colour, and
the total colour difference (ΔE) was calculated using Minolta equations
(Chakrborty et al., 2011).
Starch microstructure
Starch microstructure was determined using the method described by
Rakcejeva et al. (2016) using triocular microscope ‘Leica DM 2500 LED HD’ (Leica
Microsystems, Germany); via 10 20 magnification of the microscope.
Statistical analysis
Microsoft Excel 2013 software was used for mathematical data processing. The
hypothesis of the thesis was verified with P-value method, and factors were evaluated
as significant if P < 0.05. For the interpretation of the results it was accepted, that
= 0.05 with 95% confidence. Tukey’s test was used to determine differences among
the samples.
RESULTS AND DISCUSSION
Moisture content and water activity. Moisture content influences not only the
shelf-life of foodstuffs but also their taste, texture, weight and appearance. Usually, a
slight deviation from a defined necessary value has significant impact on the physical
properties of a food product. On the other hand, water activity (aw) of the food product
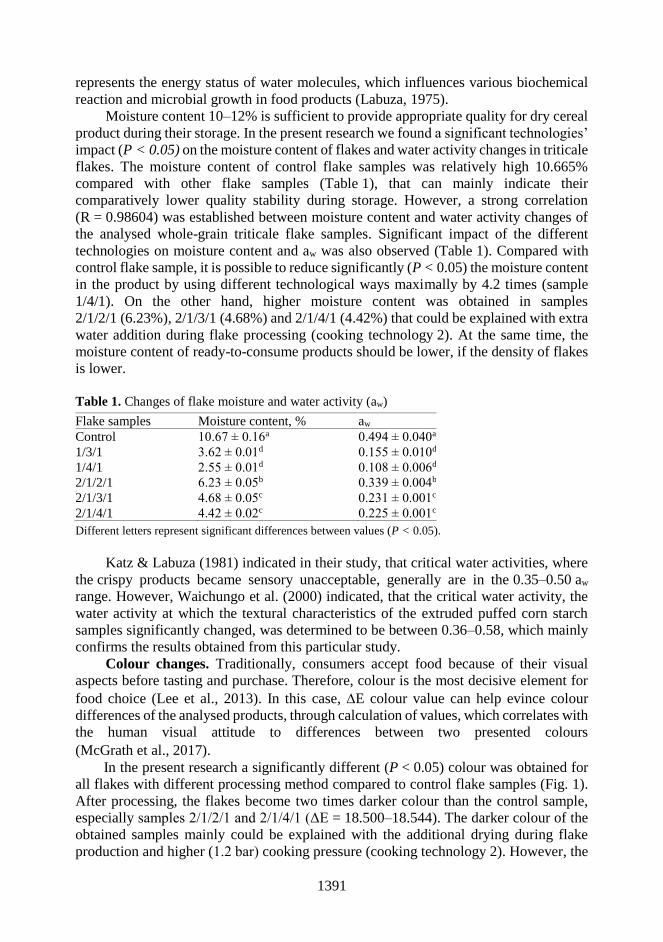
1391
represents the energy status of water molecules, which influences various biochemical
reaction and microbial growth in food products (Labuza, 1975).
Moisture content 10–12% is sufficient to provide appropriate quality for dry cereal
product during their storage. In the present research we found a significant technologies’
impact (P < 0.05) on the moisture content of flakes and water activity changes in triticale
flakes. The moisture content of control flake samples was relatively high 10.665%
compared with other flake samples (Table 1), that can mainly indicate their
comparatively lower quality stability during storage. However, a strong correlation
(R = 0.98604) was established between moisture content and water activity changes of
the analysed whole-grain triticale flake samples. Significant impact of the different
technologies on moisture content and aw was also observed (Table 1). Compared with
control flake sample, it is possible to reduce significantly (P < 0.05) the moisture content
in the product by using different technological ways maximally by 4.2 times (sample
1/4/1). On the other hand, higher moisture content was obtained in samples
2/1/2/1 (6.23%), 2/1/3/1 (4.68%) and 2/1/4/1 (4.42%) that could be explained with extra
water addition during flake processing (cooking technology 2). At the same time, the
moisture content of ready-to-consume products should be lower, if the density of flakes
is lower.
Table 1. Changes of flake moisture and water activity (aw)
Flake samples Moisture content, % aw
Control 10.67 ± 0.16a 0.494 ± 0.040a
1/3/1 3.62 ± 0.01d 0.155 ± 0.010d
1/4/1 2.55 ± 0.01d 0.108 ± 0.006d
2/1/2/1 6.23 ± 0.05b 0.339 ± 0.004b
2/1/3/1 4.68 ± 0.05c 0.231 ± 0.001c
2/1/4/1 4.42 ± 0.02c 0.225 ± 0.001c
Different letters represent significant differences between values (P < 0.05).
Katz & Labuza (1981) indicated in their study, that critical water activities, where
the crispy products became sensory unacceptable, generally are in the 0.35–0.50 aw
range. However, Waichungo et al. (2000) indicated, that the critical water activity, the
water activity at which the textural characteristics of the extruded puffed corn starch
samples significantly changed, was determined to be between 0.36–0.58, which mainly
confirms the results obtained from this particular study.
Colour changes. Traditionally, consumers accept food because of their visual
aspects before tasting and purchase. Therefore, colour is the most decisive element for
food choice (Lee et al., 2013). In this case, E colour value can help evince colour
differences of the analysed products, through calculation of values, which correlates with
the human visual attitude to differences between two presented colours
(McGrath et al., 2017).
In the present research a significantly different (P < 0.05) colour was obtained for
all flakes with different processing method compared to control flake samples (Fig. 1).
After processing, the flakes become two times darker colour than the control sample,
especially samples 2/1/2/1 and 2/1/4/1 (ΔE = 18.500–18.544). The darker colour of the
obtained samples mainly could be explained with the additional drying during flake
production and higher (1.2 bar) cooking pressure (cooking technology 2). However, the
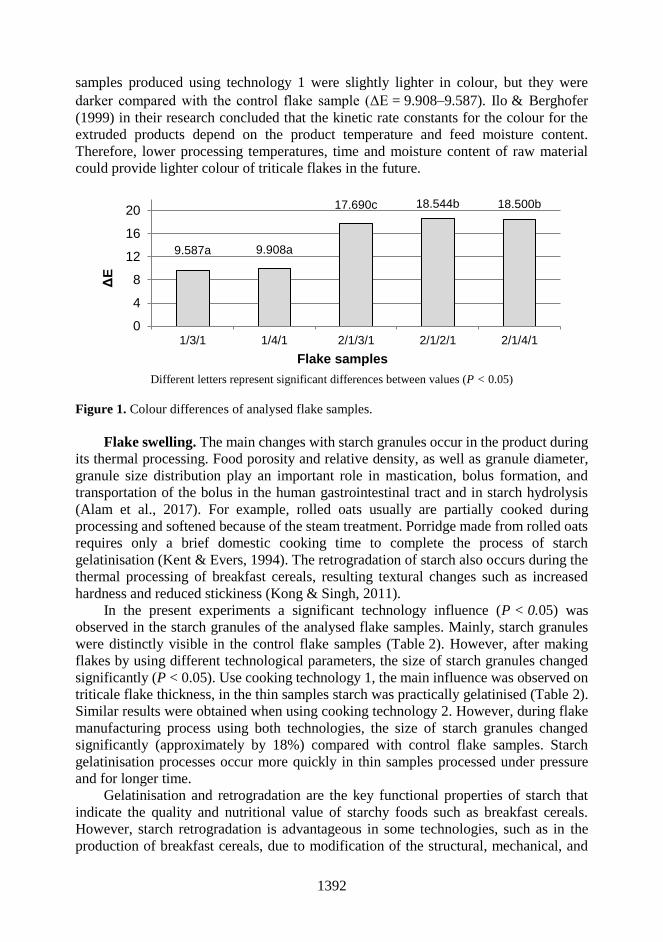
1392
samples produced using technology 1 were slightly lighter in colour, but they were
darker compared with the control flake sample (ΔE = 9.908–9.587). Ilo & Berghofer
(1999) in their research concluded that the kinetic rate constants for the colour for the
extruded products depend on the product temperature and feed moisture content.
Therefore, lower processing temperatures, time and moisture content of raw material
could provide lighter colour of triticale flakes in the future.
Different letters represent significant differences between values (P < 0.05)
Figure 1. Colour differences of analysed flake samples.
Flake swelling. The main changes with starch granules occur in the product during
its thermal processing. Food porosity and relative density, as well as granule diameter,
granule size distribution play an important role in mastication, bolus formation, and
transportation of the bolus in the human gastrointestinal tract and in starch hydrolysis
(Alam et al., 2017). For example, rolled oats usually are partially cooked during
processing and softened because of the steam treatment. Porridge made from rolled oats
requires only a brief domestic cooking time to complete the process of starch
gelatinisation (Kent & Evers, 1994). The retrogradation of starch also occurs during the
thermal processing of breakfast cereals, resulting textural changes such as increased
hardness and reduced stickiness (Kong & Singh, 2011).
In the present experiments a significant technology influence (P < 0.05) was
observed in the starch granules of the analysed flake samples. Mainly, starch granules
were distinctly visible in the control flake samples (Table 2). However, after making
flakes by using different technological parameters, the size of starch granules changed
significantly (P < 0.05). Use cooking technology 1, the main influence was observed on
triticale flake thickness, in the thin samples starch was practically gelatinised (Table 2).
Similar results were obtained when using cooking technology 2. However, during flake
manufacturing process using both technologies, the size of starch granules changed
significantly (approximately by 18%) compared with control flake samples. Starch
gelatinisation processes occur more quickly in thin samples processed under pressure
and for longer time.
Gelatinisation and retrogradation are the key functional properties of starch that
indicate the quality and nutritional value of starchy foods such as breakfast cereals.
However, starch retrogradation is advantageous in some technologies, such as in the
production of breakfast cereals, due to modification of the structural, mechanical, and
9.587a 9.908a
17.690c 18.544b 18.500b
0
4
8
12
16
20
1/3/1 1/4/1 2/1/3/1 2/1/2/1 2/1/4/1
ΔE
Flake samples

1393
sensory properties of ready-to-eat products (Wang et al., 2015). For example, beans that
had been pressure cooked have significantly increased rapidly digestible starch and
slowly digestible starch, and decreased resistant starch. But the increased digestibility of
rice starch is associated with lower amylose content (Toutounji, 2015).
In the present research for visual appearance of cereal flakes the water absorption
capacity of breakfast cereals was determined using method described by
Kince et al. (2017) with modifications. Starch granule degradation observed with
microscope (Table 2) had strong visual correlation with unacceptable appearance of
flakes, soaked in water. The samples with malted starch granules were similar to
porridge. However, flake samples with visible starch granules (18.19 µm and 18.32 µm)
had better consistency and apperance (samples 1/3/1 and 2/1/2/1). However, it should be
noted, that the control flakes practically had not changed their appearance after soaking,
which mainly could indicate their inconvenient mastication during their future use in
human diet.
Table 2. Microstructure and appearance of cereal flakes
Flake sample Control 1/3/1 1/4/1 2/1/2/1 2/1/3/1 2/1/4/1
Appearance
of cereal
flakes
Overview of
starch
granules Equivalent
diameter of
starch
granules, µm
22.04 ± 8.03 18.19 ± 4.38 gelatinised
starch* 18.32 ± 2.65
gelatinised
starch
gelatinised
starch
*gelatinised starch – starch granules were completely dissolved.
The changes in pressure and temperature during flake processing increase the
content of damaged starch up to 80% and induce deep structural modifications of the
starch granules which become no longer identifiable - starch is gelatinised. These
physical changes may affect starch digestibility too, because the damaged starch is more
exposed to amylolytic enzymes than native starch (Cattaneo et al., 2015).
CONCLUSIONS
1. The results of the present research demonstrate significant influence of
technology (P < 0.05) on the physical properties (moisture content, water activity,
colour and swelling capacity) of ready-to-eat flakes.
2. As a result, it is possible to achieve better ready-to-eat product quality by
variation of flake thickness and extra water addition during processing - the physical
parameters of thicker (0.10 ± 0.01 mm gap) sample changed less than those of the thinner
ones.
3. It is possible to significantly influence the starch gelatinisation process resulting
increased digestibility.
1394
ACKNOWLEDGEMENTS. The present research
leading to these results in accordance with the
contract No. 1.2.1.1/16/A/004 between ‘Latvian
Food Competence Centre’ Ltd. and the Central
Finance and Contracting Agency (11.11.2016), has been conducted by ‘Felici’ Ltd. with the
support from the European Regional Development Fund (ERDF) within the framework of the
project ‘Latvian Food Industry Competence Centre’.
REFERENCES
Alam, S.A., Pentikäinen, S., Närväinen, J., Holopainen-Mantila, U., Poutanen, K. & Sozer, N.
2017. Effects of structural and textural properties of brittle cereal foams on mechanisms of
oral breakdown and in vitro starch digestibility. Food Research International 96, 1–11.
Arendt, E.K. & Zannini, E. 2013. Triticale. In: Cereal grains for the food and beverage
industries. Woodhead Publishing Series in Food Science, Technology and Nutrition. pp.
201–219.
Caldwell, E.F., McKeehen, J.D. & Kadan, R.S. 2016. Cereals: Breakfast Cereals. In:
Encyclopedia of Food Grains. Second Edition, pp. 262–267.
Cattaneo, S., Hidalgo, A., Masotti, F., Stuknytė, M., Brandolini, A. & De Noni, I. 2015. Heat
damage and in vitro starch digestibility of puffed wheat kernels. Food Chemistry 188(1),
286–293.
Chakrborty, R., Bera, M., Mukhopadhyay, P. & Bhattacharya, P. 2011. Prediction of optimal
conditions of infrared assisted freeze-drying of aloe vera (Aloe barbadensis) using response
surface methodology. Separation and Purification Technology 80(2), 375–384.
Fast, R.B. 2000. Chapter 2: Manufacturing Technology of Ready-to-Eat Cereals. In: Breakfast
Cereals and How They Are Made. Second Edition. pp. 17–54.
Fraś, A., Gołębiewska, K., Gołębiewski, D., Mańkowski, D.R., Boros, D. & Szecówka, P. 2016.
Variability in the chemical composition of triticale grain, flour and bread. Journal of Cereal
Science 71, 66–72.
Ilo, S. & Berghofer, E. 1999. Kinetics of colour changes during extrusion cooking of maize grits.
Journal of Food Engineering 39(1), 73–80.
Katz, E.E. & Labuza, T.P. 1981. Effect of water activity on the sensory crispness and mechanical
deformation of snack food products. Journal of Food Science 46(2), 403–409.
Kent, N.L. & Evers, A.D. 1994. Technology of cereals. Elsevier Science Ltd. pp. 244–245.
Kince, T., Galoburda, R., Klava, D., Tomsone, L., Senhofa, S., Straumite, E., Kerch, G.,
Kronberga, A., Sturite, I., Kunkulberga, D. & Blija, A. 2017. Breakfast cereals with
germinated cereal flakes: changes in selected physical, microbiological, and
sensory characteristics during storage. European Food Research and Technology 243(9),
1497–1506.
Kong, F. & Singh, R.P. 2011. Chemical deterioration and physical instability of foods and
beverages. In. Food and Beverage Stability and Shelf Life. pp. 29–62.
Labuza, T.P. 1975. Sorption phenomena in foods: Theoretical and practical aspects. In: Theory,
determination and control of physical properties of food materials. Springer Netherlands,
Dordrecht. pp. 197–219.
Lee, S.-M., Lee, K.-T., Lee, S.-H. & Song, J.-K. 2013. Origin of human colour preference for
food. Journal of Food Engineering 119(3), 508–515.
Mathebula, M.W., Mandiwana, K. & Panichev, N. 2017. Speciation of chromium in bread and
breakfast cereals. Food Chemistry 217(15), 655–659.
Matz, S.A. 1991. Processing ready-t-eat breakfast cereals. In: The chemistry and technology of
cereals as food and feed. Second edition, pp. 654–655.

1395
Mbaeyi-Nwaoha, I.E. & Uchendu, N.O. 2016. Production and evaluation of breakfast cereals
from blends of acha and fermented soybean paste (okara). Journal of Food Science and
Technology 53(1), 50–70.
McGoverin, C.M., Snyders, F., Muller, N., Botes, W., Fox, G. & Manley, M. 2011. A review of
triticale uses and the effect of growth environment on grain quality. Journal of the Science
of Food and Agriculture 9(7), 1155–1165.
McGrath, J.R., Matthew, M.B. & Jr, E.H. 2017. Replicating Red: Analysis of ceramic slip colour
with CIELAB colour data. Journal of Archaeological Science 14, 432–438.
Rakcejeva, T., Klava, D., Cinkmanis, I., Galoburda, R., Straumite, E. & Kronberga, A. 2016.
Starch breakdown and formation of sugars during triticale grains germination. In:
Proceedings of 8th International Congress FLOUR-BREAD '15 & 10th Croatian Congress
of Cereal Technologists. pp. 188–200.
Toutounji, M.R. 2015. Molecular characterisation of breakfast cereals and rice to understand
their digestibility. A thesis submitted in fulfilment of the requirement of Master of Science
(Honours). University of Western Sydney, Australia, 220 pp.
Waichungo, W.W., Heymann, H. & Heldman, D.R. 2000. Using descriptive analysis to
characterize the effects of moisture sorption on the texture of low moisture foods. Journal
of Sensory Studies 15(1), 35–46.
Wang, S., Li, C., Copeland, L., Niu, Q. & Wang, S. 2015. Starch retrogradation:
A comprehensive review. Food Science and Food Safety 14, 568–585.
Zhu, F. 2018. Triticale: Nutritional composition and food uses. Food Chemistry 241(15).
468–479.
1396
Agronomy Research 16(S2), 1396–1404, 2018
https://doi.org/10.15159/AR.18.101
Sonochemical effects on food emulsions
O. Krasulya1, I. Potoroko2, L. Tsirulnichenko2,*, S. Khmelev3, V. Bogush1 and
S. Anandan4 1Moscow State University of Technologies and Management named after
K.G. Razumovskiy, Department of Regulation of roar of food products and examination
of goods, 73, Zemlyanoy Val., RU109004 Moscow, Russia 2South Ural State University, Higher School of Medicine and Biology, Department of
Food and Biotechnology, 85 Lenin Avenue, RU454080 Chelyabinsk, Russia 3Altai Technical University, Lenin Avenue, 46, RU656038 Biysk, Russia 4Nanomaterials and Solar Energy Conversion Lab, Department of Chemistry, National
Institute of Technology, Tiruchirappalli, IN620 015, India *Correspondence: [email protected]
Abstract. Acoustic cavitation of food emulsions is widely applied as the main processing method to
improve the quality of a finished product and its organoleptic characteristics, as well as to increase
production performance. To identify the optimal modes of ultrasonic emulsification, we propose a
model of emulsion droplet breakup in an acoustic cavitation field, which allows us to determine
the dependence of emulsion droplets’ diameter on exposure time and intensity of action. The
developed models enabled us to pioneer complex research of the dependence of emulsion
droplets’ diameter on time given the maximum radius of cavitation bubbles and physical
properties of liquid phases in the emulsion composition. We carried out the first complex
theoretical and practical research of how shapes and positions of absolutely fixed boundaries
influence the propagation of oscillations in a activating liquid medium (food emulsion). To verify
the adequacy of the obtained theoretical models, we studied the dependence of emulsion droplets’
breakup rate (by the example of a model water/oil emulsion) on the exposure time and the
intensity of ultrasonic action. The calculation results revealed that the results of a series of
experiments and the results obtained with the use of the developed mathematical model are
consistent. Based on the theoretical data obtained, we designed an industrial flow- type acoustic
cavitation device aimed at acting on food emulsions; it differs from analogous devices in that it
has within it a cylindrical wave acting through solid walls of the tunnel for transmitting processed
liquid.
Key words: ultrasound, cavitation, model, food emulsion, sonochemistry.
INTRODUCTION
Emulsification processes are one of the most important foundations of the modern food
industry (Taylor, 1963; Khmelev, 2012). Acoustic cavitation is one of the most promising
means of forming emulsions, since it has a low energy intensity, the possibility of obtaining
fine emulsions (up to fractions of 3 μm and less), and high productivity (Álvarez et al., 2007;
Khmelev et al., 2014; Krasuly, et al., 2016).

1397
To form a cavitation zone with maximum possible energy effect in liquid media of
different properties by means of secondary effects (shock and capillary waves), it is necessary
to set certain modes according to the intensity of introduced ultrasonic oscillations, and to
ensure certain conditions the volume of a processed medium, the form of a technological
volume, the exposure time, etc. (Khmelev, 2007).
The industrial application of ultrasonic devices in modern food production necessitates
searching for and providing the most effective (optimal) modes of action on food media
(Brotchie et al., 2009; Krasulya, 2013). Setting and maintenance of optimal ultrasonic mode
is possible only by knowing the implementation mechanisms of ultrasonic processes and
identifying and continuously monitoring the processing media parameters which characterize
the change in their properties (Chandrapala, et al., 2012).
Having generalized theoretical and practical results on the research topic, we established
that most of the existing theories which describe the process of emulsification under the action
of cavitation are aimed at study the behavior of a single cavitation bubble and its interaction
with emulsion droplets (Kentish et al., 2008; Patista & Bates, 2008; Krasulya et al., 2014;
Shanmugam & Ashokkumar, 2015). However, in real processes involving ultrasonic
cavitation of liquid food media, their cavitation zone is generated, as it is practically
impossible to obtain a single cavity. Therefore, it is obvious that the efficiency of ultrasonic
will be determined by the macroscopic characteristics of the activating medium as a whole
(wave impedance, volume content of bubbles or cavitation index, etc.) (Truhaut, 1991).
The purpose of this work is to identify the optimal modes of exposure and the
conditions for the propagation of oscillations to create a uniform ultrasonic field throughout a
mixture of two mutually insoluble fluids and to obtain emulsions with given dispersion
characteristics.
MATERIALS AND METHODS
To study the effects of acoustic cavitation emulsification, we developed a laboratory
reactor where the source of ultrasonic treatment is an ultrasonic device, consisting of an
electronic generator and a radiator with an immiscible titanium waveguide, which has a
mushroom-shaped running end. The device allows for vertical shifting of the working
body in order to carry out different modes of exposure.
Since, according to the generalization of the results of theoretical and practical
studies, the maximum efficiency of cavitation is ensured at a frequency of 20–25 kHz, we
focused special attention on detecting the intensity of ultrasonic oscillations necessary to
obtain emulsion droplets of the required diameter in a specific frequency range.
We used ‘vegetable oil/water’ food emulsions as objects for the research. Sunflower-
seed oil (deodorized, refined with a 99.9% fat content) was used as vegetable oil. The
vegetable oil used had the following chemical and physical characteristics of crude
vegetable oil: Relative density (at 20 °C) – 0.9 ± 0.02 C/water, Refractive index – 1.464 ±
0.002 (ND 40 °C), Saponification Value – 191 ± 0.5 mg KOH g-1 oil, Iodine value –
119 ± 0.5. The tap water used had the following quantitative characteristics: hydrogen
index 6.5, total hardness – 6.8 mg L-1, phenol index – 0.20 mg L-1. To conduct the
experiment, we used food emulsions with a different ratio of ingredients:
– the first option – 30% vegetable oil + 70% water;
– the second option – 50% vegetable oil + 50% water;
– the third option – 5% vegetable oil + 95% water;
1398
– the fourth option – 30% vegetable oil + 70% water.
For the preparation of reference samples, we used technological device an RKU-
type with a piezoceramic radiator (Russia). Ultrasound details: frequency mechanical
oscillations – 22 ± 1.5 kHz, the maximum power consumption – 1,000 W. The time of
ultrasound exposure varied from 20 to 40 minutes, and the power of sonication varied
from 500 W to 1,000 W:
– mode №1 – 20 min, 700 W;
– mode №2 – 20 min, 1,000 W;
– mode №3 – 20 min, 500 W;
– mode №4 – 40 min, 500 W.
The temperature of the food emulsion before its exposure to ultrasound was 15 °C.
The distribution of fat globules in food emulsion according to its concentration and
processing time was photographed with the help of an optical microscope.
The software package Altami Studio was used to process the obtained fat globule
images.
Mathematical measurement processing was carried out by conventional statistics
methods and expressed as the arithmetic mean (M) and it’s standard error (m). We used
the Mann – Whitney test (U) to determine the statistically significant differences
between the test and reference groups. Differences were considered significant at
P < 0.05. Statistical interrelations were studied using nonparametric correlation analysis
by calculating the Spearman correlation coefficients (Rs). Results were obtained using
generally accepted methods of statistical analysis and expressed as an arithmetical
average and its standard deviation. Differences were deemed significant where P < 0.05.
RESULTS AND DISCUSSION
To identify the optimal ultrasonic emulsification modes, we developed a model of
emulsion droplet breakup in an acoustic cavitation field. The model is based on droplet
deformation Eq. (1) proposed by foreign researchers:
dxkxFmx (1)
where m is the mass of the droplet, kg; F is the external force acting on the droplet from
the direction of fluid flow, N; k is the coefficient of elasticity of the droplet, N m-1; and
d is the damping ratio of the droplet, kg s-1 (Taylor, 1963).
According to this equation, the droplet wall is regarded as a load of mass m on a
spring (equivalent to the surface tension forces) with a damper (equivalent to the
viscosity of a disperse phase).
The coefficient of elasticity of a droplet is determined by formula 2:
RC
m
d
d
d3
(2)
where Cd is the coefficient of proportionality, which depends on the droplet deformation
mode; σ is the surface tension in the interface between the carrier phase and the dispersed
phase, N m-1; and ρd is the density of the dispersed phase, kg m-3.
1399
The damping ratio of a droplet is determined by formula 3:
RC
m
d
d
dd
2
(3)
where Cd is the coefficient of proportionality, which depends on the mode of droplet
deformation and μd is the viscosity of the dispersed phase, Pa∙s.
The external force F under acoustic cavitation is proportional to the amplitude of
the shock wave pressure in its front when a cavitation bubble collapses.
The solution of differential Eq. (1) enables us to find the maximum value of droplet
deformation and determine the possibility of its breakup. According to Taylor (1963), if
the maximum droplet deformation is greater than a quarter of its diameter d, the droplet
breaks up into 2 identical droplets of the diameter 𝑑
√23 .
Therefore, the dependence of the droplet diameter on time is defined by differential
Eq. 4:
3 2
1lnddt
t
dbu
(4)
where tbu(d) is the dependence of the breakup time of a single droplet on its diameter.
The dependence of the breakup time of a single droplet on its diameter is
determined as follows. According to Eq. (1), the maximum value of droplet deformation
is proportional to the external force acting on the droplet from the direction of fluid flow.
This force is proportional to the amplitude of the shock wave pressure as it reaches the
droplet walls. Since a droplet breaks up if and only if its maximum deformation exceeds
half the radius, accordingly, the breakup will occur when the amplitude of the shock
wave pressure near the droplet walls exceeds a certain threshold value.
This means that a droplet will break up by force of the action of cavitation bubbles
formed in its neighborhood due to shock wave scattering.
Based on this information, the droplet breakup time is determined by the interval
when at least one cavitation bubble forms in the zone Vb.
The time interval for the formation of bubbles leading to the droplet breakup is
determined on the basis of the probabilistic approach in accordance with obtained
expression 5:
bnV
Tt (5)
where n is the concentration of cavitation bubbles determined according to (Khmelev et
al., 2014), m-3; T is the period of bubble collapse, s; and Vb is the volume of the zone of
bubble collapse leading to the droplet breakup, m3.
We obtained the dependences of the droplet breakup time, represented by a graph
and shown in Fig. 1.
As follows from the dependences obtained (Fig. 1), the greatest breakup time is
required for droplets of small diameter (the breakup time of 20 μm droplets three times
exceeds the breakup time of 100 μm droplets). The reason for this is the small volume
of the neighborhood of a droplet, where collapsing bubbles lead to droplet breakup.
Therefore, in order to effectively carry out the process of obtaining an emulsion with
dispersed phase particles of a small diameter, it is necessary to increase the radius of
cavitation bubbles, and, consequently, to increase the intensity of ultrasound.

1400
Figure 1. Dependences of the droplet breakup time on the maximum radius of the cavitation
bubble depending on its various diameters and surface tensions in the interface between the carrier
phase and the dispersed phase.
There is a certain threshold radius for each droplet size, from which decrease in the
breakup time of the droplet ceases. For example, the minimum breakup time of 20 μm
droplets is achieved when the radius of cavitation bubbles is 250 μm. And for the breakup
0
500
1,000
1,500
2,000
2,500
10 40 70 100 130 160 190 220 250 280
Dro
ple
t bre
akup tim
e,s
Maximum radius of the cavitation bubble, μm
20 mkm
40 μm
60 μm
100 μm
0
500
1,000
1,500
2,000
10 40 70 100 130 160 190 220 250 280
Dro
ple
t bre
akup tim
e. s
Maximum radius of the cavitation bubble, μm
20 μm
40 μm
60 μm
100 μm
0
200
400
600
800
1,000
1,200
1,400
1,600
10 40 70 100 130 160 190 220 250 280
Dro
ple
t bre
akup tim
e. s
Maximum radius of the cavitation bubble, μm
20 mkm
40 μm
60 μm
100 μm
a) surface tension in the interface
between the carrier phase and
the dispersed phase 70 mN m-1
b) surface tension in the interface
between the carrier phase and
the dispersed phase 40 mN m-1
c) surface tension in the interface
between the carrier phase and
the dispersed phase 10 mN m-1

1401
of 100 μm droplets, the bubble radius should be 130 μm. Exceeding the threshold radius
of cavitation bubbles will not lead to an increase in the efficiency of emulsification;
moreover, if the bubble radius exceeds 300 μm, according to (Khmelev, 2012), a
degenerate cavitation will form, and the emulsification process might stop.
The obtained droplet breakup time allows us to find the dependence of the droplet
diameter on time (Fig. 2) when emulsifying sunflower oil in water.
As follows from the presented dependence, under the action with the intensity of
1.5 W cm-2, even after a 20-minute exposure, the droplet diameter still exceeds 20 μm,
which is insufficient for a number of technological processes.
Action with the intensity of 3 W cm-2 allows for emulsions with a droplet diameter
of 15 μm within 20 minutes, while action with the intensity of 9 W cm-2 and more allows
obtaining emulsion droplets with a diameter of less than 7–10 μm within just 20 minutes
of exposure time.
Figure 2. Dependence of emulsion droplets’ diameter on time under the action of different
intensity.
To verify the adequacy of the obtained theoretical models, we studied the
dependences of the breakup rate of emulsion droplets (by the example of a model
emulsion of water/oil type) on time and intensity of ultrasound (Fig. 3).
Figure 3. Photos of the model emulsion (magnification × 1,600): left – before the processing,
right – after the processing (US 700 W, 20 min).
0
20
40
60
80
100
120
0 5 10 15 20 25 30
Dia
mete
r of
the d
rop,
mN
m-1
Time, min
1.5 W cmˉ²
3 W cmˉ²
6 W cmˉ²
9 W cm⁻²
Globules size: 10% – ≤ 6 μm 12% – 8 μm 20% – 10 μm 12% – 12 μm 8% – 14 μm 38% - 16 μm
Globules size: g% – 2 μm 18% – 4 μm 24% – 6 μm 28% – 8 μm 12% – 10 μm 12% – ≥12 μm
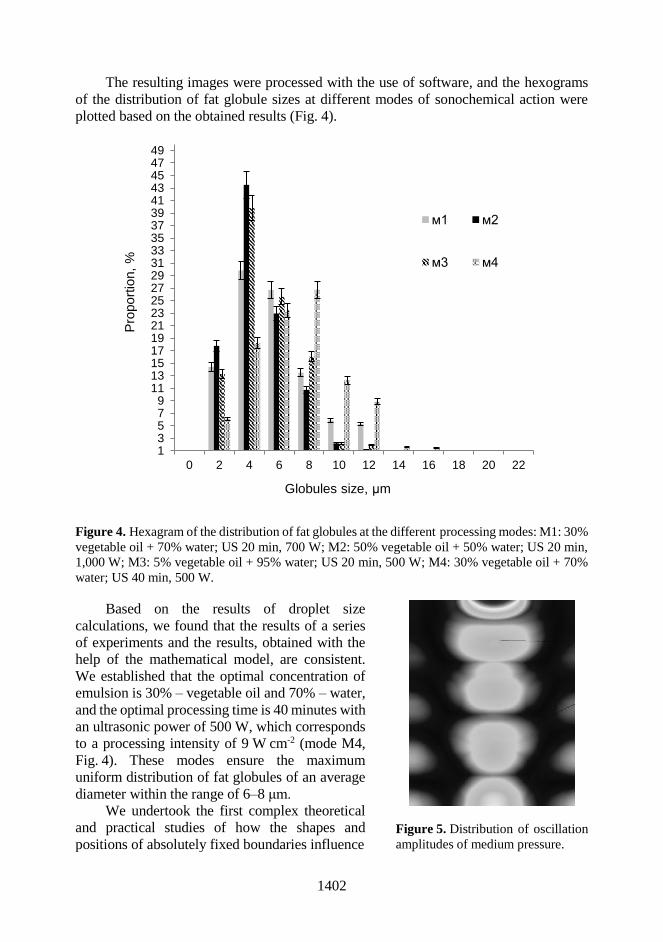
1402
The resulting images were processed with the use of software, and the hexograms
of the distribution of fat globule sizes at different modes of sonochemical action were
plotted based on the obtained results (Fig. 4).
Figure 4. Hexagram of the distribution of fat globules at the different processing modes: M1: 30%
vegetable oil + 70% water; US 20 min, 700 W; M2: 50% vegetable oil + 50% water; US 20 min,
1,000 W; M3: 5% vegetable oil + 95% water; US 20 min, 500 W; M4: 30% vegetable oil + 70%
water; US 40 min, 500 W.
Based on the results of droplet size
calculations, we found that the results of a series
of experiments and the results, obtained with the
help of the mathematical model, are consistent.
We established that the optimal concentration of
emulsion is 30% – vegetable oil and 70% – water,
and the optimal processing time is 40 minutes with
an ultrasonic power of 500 W, which corresponds
to a processing intensity of 9 W cm-2 (mode M4,
Fig. 4). These modes ensure the maximum
uniform distribution of fat globules of an average
diameter within the range of 6–8 μm.
We undertook the first complex theoretical
and practical studies of how the shapes and
positions of absolutely fixed boundaries influence
Figure 5. Distribution of oscillation
amplitudes of medium pressure.
13579
1113151719212325272931333537394143454749
0 2 4 6 8 10 12 14 16 18 20 22
Pro
port
ion,
%
Globules size, μm
м1 м2
м3 м4
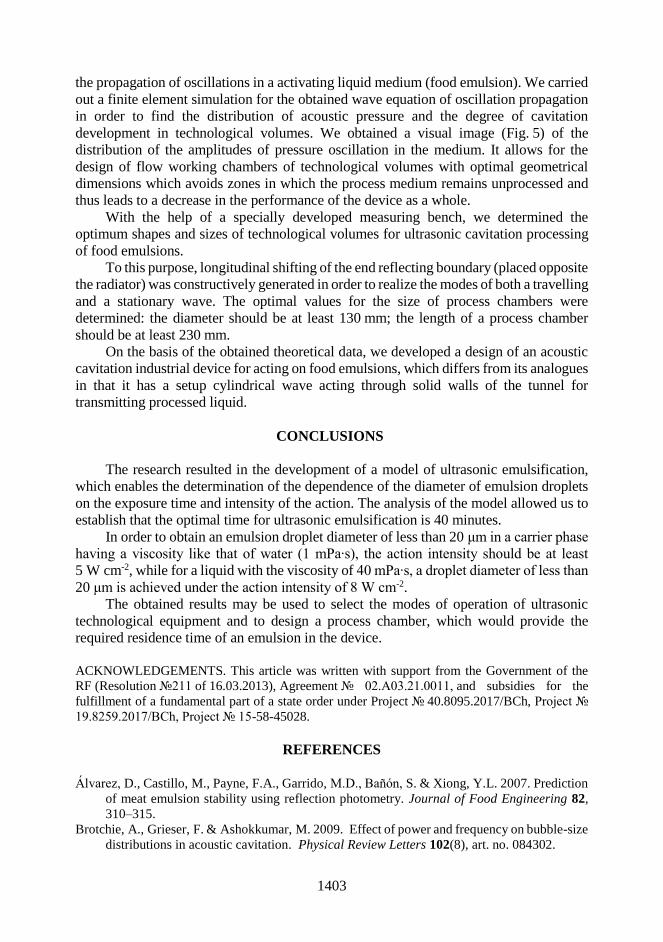
1403
the propagation of oscillations in a activating liquid medium (food emulsion). We carried
out a finite element simulation for the obtained wave equation of oscillation propagation
in order to find the distribution of acoustic pressure and the degree of cavitation
development in technological volumes. We obtained a visual image (Fig. 5) of the
distribution of the amplitudes of pressure oscillation in the medium. It allows for the
design of flow working chambers of technological volumes with optimal geometrical
dimensions which avoids zones in which the process medium remains unprocessed and
thus leads to a decrease in the performance of the device as a whole.
With the help of a specially developed measuring bench, we determined the
optimum shapes and sizes of technological volumes for ultrasonic cavitation processing
of food emulsions.
To this purpose, longitudinal shifting of the end reflecting boundary (placed opposite
the radiator) was constructively generated in order to realize the modes of both a travelling
and a stationary wave. The optimal values for the size of process chambers were
determined: the diameter should be at least 130 mm; the length of a process chamber
should be at least 230 mm.
On the basis of the obtained theoretical data, we developed a design of an acoustic
cavitation industrial device for acting on food emulsions, which differs from its analogues in that it has a setup cylindrical wave acting through solid walls of the tunnel for
transmitting processed liquid.
CONCLUSIONS
The research resulted in the development of a model of ultrasonic emulsification,
which enables the determination of the dependence of the diameter of emulsion droplets
on the exposure time and intensity of the action. The analysis of the model allowed us to
establish that the optimal time for ultrasonic emulsification is 40 minutes.
In order to obtain an emulsion droplet diameter of less than 20 μm in a carrier phase
having a viscosity like that of water (1 mPa∙s), the action intensity should be at least
5 W cm-2, while for a liquid with the viscosity of 40 mPa∙s, a droplet diameter of less than
20 μm is achieved under the action intensity of 8 W cm-2.
The obtained results may be used to select the modes of operation of ultrasonic
technological equipment and to design a process chamber, which would provide the
required residence time of an emulsion in the device.
ACKNOWLEDGEMENTS. This article was written with support from the Government of the
RF (Resolution №211 of 16.03.2013), Agreement № 02.A03.21.0011, and subsidies for the
fulfillment of a fundamental part of a state order under Project № 40.8095.2017/BCh, Project №
19.8259.2017/BCh, Project № 15-58-45028.
REFERENCES
Álvarez, D., Castillo, M., Payne, F.A., Garrido, M.D., Bañón, S. & Xiong, Y.L. 2007. Prediction
of meat emulsion stability using reflection photometry. Journal of Food Engineering 82,
310–315.
Brotchie, A., Grieser, F. & Ashokkumar, M. 2009. Effect of power and frequency on bubble-size
distributions in acoustic cavitation. Physical Review Letters 102(8), art. no. 084302.

1404
Chandrapala, J., Oliver, C., Kentish, S. & Ashokkumar, M. 2012. Ultrasonics in food
processing. Ultrasonics Sonochemistry 19(5), 975–983.
Khmelev, V.N. 2007. Ultrasonic multifunctional and specialized devices for the intensification
of technological processes in industry, agriculture and household. Barnaul, 400 pp.
(in Russian).
Khmelev, V.N., Golykh, R.N. & Shalunov, A.V. 2012. Optimization of these modes and
conditions of ultrasonic influence on various technological mediums by mathematical
modeling International Conference and Seminar on Micro/Nanotechnologies and Electron
Devices. In: Conference Proceedings NSTU, Novosibirsk, pp. 124–134 (in Russian).
Khmelev, V.N., Golykh, R.N., Shalunov, A.V., Khmelev, S.S. & Karzakova, K.A. 2014.
Determination of Ultrasonic Effect Mode Providing Formation of Cavitation Area in High-
Viscous and Non-Newtonian Liquids. In: 15th International Conference of Young
Specialist on Micro/Nanotechnologies and Electron Devices EDM 2014. NSTU,
Novosibirsk, pp. 203–207 (in Russian).
Kentish, S., Wooster, T.J., Ashokkumar, M., Balachandran, S., Mawson, R. & Simons, L.
2008. The use of ultrasonics for nanoemulsion preparation. Innovative Food Science and
Emerging Technologies 9(2), 170–175.
Krasulya, O., Bogush, V., Khmelev, S.S., Potoroko, Yu.I., Tsirulnichenko, L.A., Kanina, K.A.,
Yuzhina, E.A. & Anandan, S. 2017. Sonochemical Effects on Food Emulsions. Bulletin of
the South Ural State University, series Food and Biotechnology 5(2), 38–46.
Krasulya, O.N, Bogush, V.I, Trishina, V., Potoroko, I., Khmelev, S., Sivashanmugam, P. &
Anandan, S. 2016. Impact of acoustic cavitation on food emulsions. Ultrasonics
Sonochemistry 30, 98–102.
Krasulya, O.N., Bogush, V.I., Dolgova, O.A. & Misharina, T.A. 2013. Use of sonochemistry at
production of cooked sausage products. J. Meat Ind. 7, 20–24.
Krasulya, O., Shestakov, S., Bogush, V., Potoroko, I., Cherepanov, P. & Krasulya, B. 2014.
Applications of sonochemistry in Russian food processing industry. Ultrasonics
Sonochemistry 21(6), 2112–2116.
Patista, A. & Bates, D. 2008. Ultrasonic innovations in the food industry: From the laboratory to
commercial production. Innovative Food Science and Emerging Technologies 9(2), 147–154.
Shanmugam, A. & Ashokkumar, M. 2015. Characterization of Ultrasonically Prepared Flaxseed
oil Enriched Beverage/Carrot Juice Emulsions and Process-Induced Changes to the
Functional Properties of Carrot Juice. Food and Bioprocess Technology 8(6), 1258–1266.
Taylor, G.I. 1963. The Shape and Acceleration of a Drop in a High Speed Air Stream. in: Batchelor
GK, The Scientific Papers of GI Taylor. University Press, Cambridge 3, pp. 457–464.
Truhaut, R. 1991. Toxicology, social science and the humanitarian. Bulletin de l'Academie
Nationale de Medecine 175(9), 1385–1402.

1405
Agronomy Research 16(S2), 1405–1416, 2018
https://doi.org/10.15159/AR.18.130
Changes in the nutritional value of breakfast cereals containing
germinated spring grain flakes during storage
Z. Kruma*, R. Galoburda, L. Tomsone, I. Gramatina, S. Senhofa, E. Straumite,
D. Klava, T. Kince, I. Cinkmanis, J. Zagorska and D. Kunkulberga
Latvia University of Life Sciences and Technologies, Faculty of Food Technology,
Department of Food Technology, Rigas iela 22, LV-3004 Jelgava, Latvia *Correspondence: [email protected]
Abstract. The aim of current research was to assess the nutritional value of breakfast cereals
containing germinated spring grain flakes and its changes after 6 month storage. Three types of
breakfast cereals were prepared and packaged in two types of Standup pouches –
Pap50g/Alu7/Pe60 (AL), Pap40g/PELD20/PE40 (PE). For the accelerated shelf life test the
samples were stored at 35 ± 2 °C and dietary fibre, protein, fat, B-group vitamins, sugars, total
phenol content and DPPH, ABTS+ radical scavenging activity were determined. Developed
breakfast cereals have high nutritional value and all are high in fibre and thiamine. Additionally,
sample S2 is source of protein, riboflavin, niacin, and S3 – is source of riboflavin and high in
niacin. Comparing total phenolic content and antioxidant capacity of tested samples S3 showed
the highest values. Storage and selected packaging influenced stability of nutrients, and for S1
and S2 AL showed better results whereas for S3 – PE.
Key words: breakfast cereals, nutritional value, germination, spring cereals, packaging, storage.
INTRODUCTION
Breakfast cereals are popular food product and different approaches are developed
to improve their nutrition quality by use of whole grain cereals, cereals not widely used
in similar products like germinated cereals, triticale (further – non-traditional cereals),
specific ingredients or processes with beneficial effect to final product. Whole grain
products are increasingly being used in food, due to their beneficial composition –
increased content of fibre, vitamins, minerals and phytochemicals, including phenolics,
carotenoids, vitamin E, lignans, β-glucan, inulin, resistant starch, sterols, and phytates
(Lafiandra et al., 2014; Oliveira et al., 2015; Sumczynski et al., 2015; Bucsella et al.,
2016). Non-traditional types of cereals contain significant amounts of biologically active
compounds and can be assumed that breakfast flakes and muesli products made from
non-traditional cereals will have higher nutritional properties (Sumczynski et al., 2015).
Cereal consumption as part of a healthy lifestyle may play a role in maintaining
adequate nutrient intake all day long and the study about selection of breakfast cereals
in diet, showed that the main parameters determining the beneficial effects in the body
is increased amount of fibre, protein, calcium and reduced fat content (Barton et al.,
2005; Albertson et al., 2008). Dietary fibre is important for a healthy diet and can lower

1406
risk factors for cardiovascular disease and type 2 diabetes mellitus (Lafiandra et al.,
2014). Also, cereals contain various essential nutrients including B-group vitamins
(Capozzi et al., 2012). Human body does not accumulate B-group vitamins and that is
why, in order to comply with daily recommended intake, products enriched in B-group
vitamins should be included in every meal (Lebiedzińska & Szefer, 2006).
For development of breakfast cereals it is important to combine different raw
materials to obtain products with the target composition. Barley is a desirable food
ingredient, with health benefits provided by a β-glucan fibre fraction (Škrbić et al.,
2009). Hull-less barley flakes have better nutritional value than hulled ones and they
contain more proteins, lipids and soluble dietary fibre (Soares et al., 2007). Oat flakes
are the main commercial oat products around the world (Hu et al., 2014). β-glucan is the
major form of soluble dietary fibre in oat, and it is known for its effectiveness in lowering
blood cholesterol (Kapica, 2001). Rye grain contributes significant quantities of energy,
protein, selected micronutrients and non-nutrients to a human diet (Edge et al., 2005)
Wheat is one of the oldest food crops, which has achieved a central role as a staple food
and contains different classes of bioactive compounds as phenolic acids, carotenoids,
tocopherols, alkylresorcinols, etc. (Luthria et al., 2015). Triticale is a hybrid crop
developed by crossing wheat (Triticum) and rye (Secale cereale). Comparing to wheat
triticale has similar content of protein (Fraś et al., 2016), with a slightly higher amount
of lysine (0.33–0.71%) and also similar content of fibre, but with a higher amount of
soluble fraction, especially water-extractable arabinoxylans (Rakha et al., 2011).
Germination is a complex process causing physical, chemical, and structural
changes in grains, and has been identified as an inexpensive and effective technology for
improving cereal quality (Wu et al., 2013). During the germination process a significant
changes in the biochemical, nutritional, and sensory characteristics of cereals occur due
to degradation of reserve materials used for respiration and synthesis of new cell
constituents for developing embryo in the seed. As compared to un-germinated seed,
germinated seeds contain high protein, vitamin, low unsaturated fatty acids, low
carbohydrate content (Sharma et al., 2016).
For preserving quality of food products an optimum package design should balance
the packaging material properties, product protection requirements, environmental and
transport conditions, and cost (Macedo et al., 2013). Breakfast cereals are traditionally
packed in different paper pouches, and for packaging of breakfast cereal products a paper
or polymer package, with particular emphasis on the moisture permeability must be
selected.
Development of breakfast cereals should result in high fibres and B group vitamins,
formulation made using hull-less grains and germinated samples from barley, oat, rye
and wheat to prepare nutritionally enriched breakfast cereals.
The aim of current research was to assess the nutritional value of breakfast cereals
containing germinated spring grain flakes and its changes after 6 month storage.
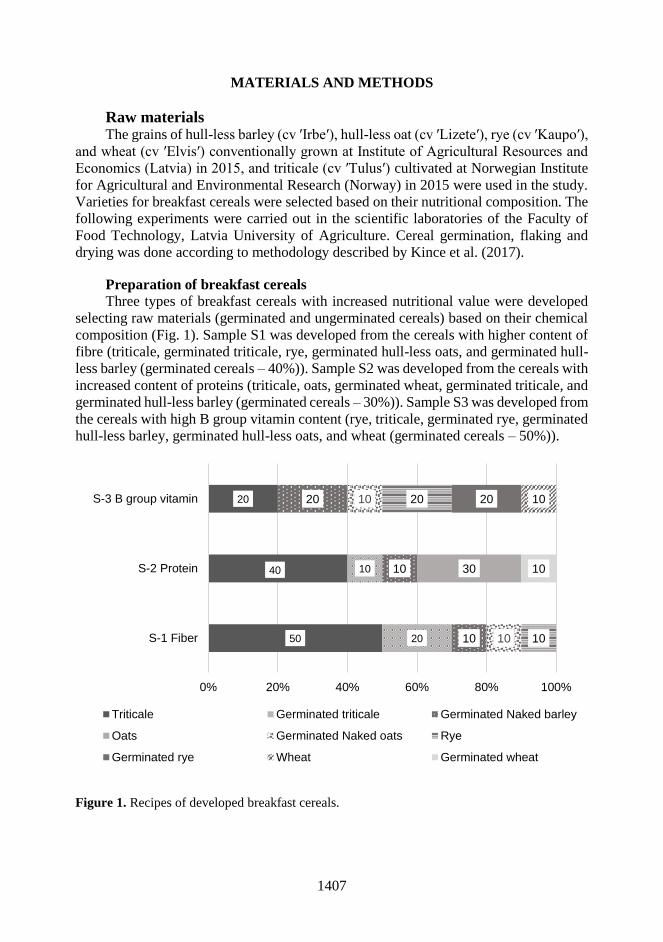
1407
MATERIALS AND METHODS
Raw materials The grains of hull-less barley (cv ′Irbe′), hull-less oat (cv ′Lizete′), rye (cv ′Kaupo′),
and wheat (cv ′Elvis′) conventionally grown at Institute of Agricultural Resources and
Economics (Latvia) in 2015, and triticale (cv ′Tulus′) cultivated at Norwegian Institute
for Agricultural and Environmental Research (Norway) in 2015 were used in the study.
Varieties for breakfast cereals were selected based on their nutritional composition. The
following experiments were carried out in the scientific laboratories of the Faculty of
Food Technology, Latvia University of Agriculture. Cereal germination, flaking and
drying was done according to methodology described by Kince et al. (2017).
Preparation of breakfast cereals
Three types of breakfast cereals with increased nutritional value were developed
selecting raw materials (germinated and ungerminated cereals) based on their chemical
composition (Fig. 1). Sample S1 was developed from the cereals with higher content of
fibre (triticale, germinated triticale, rye, germinated hull-less oats, and germinated hull-
less barley (germinated cereals – 40%)). Sample S2 was developed from the cereals with
increased content of proteins (triticale, oats, germinated wheat, germinated triticale, and
germinated hull-less barley (germinated cereals – 30%)). Sample S3 was developed from
the cereals with high B group vitamin content (rye, triticale, germinated rye, germinated
hull-less barley, germinated hull-less oats, and wheat (germinated cereals – 50%)).
Figure 1. Recipes of developed breakfast cereals.
50
40
20
20
10
10
10
20
30
10
10
10
20 20 10
10
0% 20% 40% 60% 80% 100%
S-1 Fiber
S-2 Protein
S-3 B group vitamin
Triticale Germinated triticale Germinated Naked barley
Oats Germinated Naked oats Rye
Germinated rye Wheat Germinated wheat
1408
Packaging and storage of breakfast cereals
Breakfast cereals samples were packaged in Doypack (stand up pouches) made
from Pap50g/Alu7/Pe60 (Pap/Alu/PE) and stand up pouches Fibrecote® HB MG 40/60
(PE/EvOH/Pap). The size of Doypack was 110 × 65 × 185 mm, volume – 250 mL, the
amount of breakfast cereals in each package was 200 ± 5 g. Samples were stored for 6
months at temperature t = 35 2 C and relative air humidity φ = 55 3%. Abbreviations
of the samples stored for 6 month in Doypack made from Pap/Alu/PE are as follows:
S1-Pap/Alu/PE, S2- Pap/Alu/PE, S3- Pap/Alu/PE, and for samples stored in
PE/EvOH/Pap: S1- PE/EvOH/Pap, S2- PE/EvOH/Pap, S3- PE/EvOH/Pap.
Analytical methods
Total protein content was determined by Kjeldahl; standard method AACC 46-20.
Total fat content was determined by the standard method ISO 6492. Dietary fibre was
determined according to the standard method AOAC No 985.29 using Fibertec E System
(Foss, Sweden). Sugars were determined by HPLC as described by Senhofa et al. (2016).
B-group vitamins were determined by the following methods: vitamin B1 (thiamine) –
AOAC Official Method 986.27, vitamin B2 (riboflavin) – AOAC Official Method
970.65, vitamin B3 (niacin) – AOAC Official Method 961.14., vitamin B₅ (pantothenic
acid) – AOAC Official Method 992.07, vitamin B₆ – AOAC Official Method 985.32.
Total phenol content and antioxidant activity
Extraction for determination of total phenol content and antioxidant activity of
breakfast cereals were performed as described in previous experiments about germinated
grains (Kruma et al., 2016). The total phenolic content (TPC) of the grain extracts was
determined according to the Folin-Ciocalteu spectrophotometric method (Singleton et
al., 1999). Total phenols were expressed as the gallic acid equivalents (GAE) 100 g-1 dry
weight (DW) of grain material. Antioxidant activity of the breakfast cereal extracts was
measured on the basis of scavenging activities of the stable 2,2-diphenyl-1-
picrylhydraziyl (DPPH) radical as outlined by (Yu et al., 2003). The absorbance was
measured at 517 nm. The cation scavenging activity of extract was measured by
2,2′-azino-bis(3-ethylbenz-thiazoline-6-sulfonic) acid (ABTS+) radical cation assay (Re
et al., 1999). The radical scavenging activity was expressed as Trolox equivalents (TE)
100 g-1 DW of plant material.
Statistical analysis
Experimental results are presented as means of three parallel measurements and
were analysed by Microsoft Excel 2010 and SPSS 17.00. Analysis of variance
(ANOVA) and Tukey test were used to determine differences among samples. A linear
correlation analysis was performed in order to determine relationship between TPC,
antioxidant activity such as DPPH ̇, ABTS+. Differences were considered as significant
at P < 0.05.
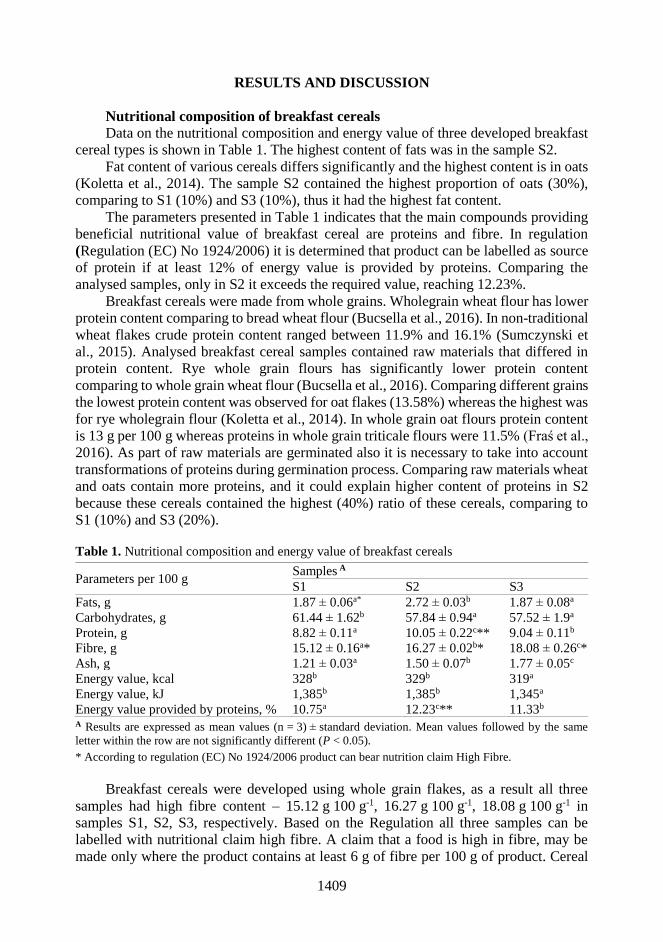
1409
RESULTS AND DISCUSSION
Nutritional composition of breakfast cereals
Data on the nutritional composition and energy value of three developed breakfast
cereal types is shown in Table 1. The highest content of fats was in the sample S2.
Fat content of various cereals differs significantly and the highest content is in oats
(Koletta et al., 2014). The sample S2 contained the highest proportion of oats (30%),
comparing to S1 (10%) and S3 (10%), thus it had the highest fat content.
The parameters presented in Table 1 indicates that the main compounds providing
beneficial nutritional value of breakfast cereal are proteins and fibre. In regulation
(Regulation (EC) No 1924/2006) it is determined that product can be labelled as source
of protein if at least 12% of energy value is provided by proteins. Comparing the
analysed samples, only in S2 it exceeds the required value, reaching 12.23%.
Breakfast cereals were made from whole grains. Wholegrain wheat flour has lower
protein content comparing to bread wheat flour (Bucsella et al., 2016). In non-traditional
wheat flakes crude protein content ranged between 11.9% and 16.1% (Sumczynski et
al., 2015). Analysed breakfast cereal samples contained raw materials that differed in
protein content. Rye whole grain flours has significantly lower protein content
comparing to whole grain wheat flour (Bucsella et al., 2016). Comparing different grains
the lowest protein content was observed for oat flakes (13.58%) whereas the highest was
for rye wholegrain flour (Koletta et al., 2014). In whole grain oat flours protein content
is 13 g per 100 g whereas proteins in whole grain triticale flours were 11.5% (Fraś et al.,
2016). As part of raw materials are germinated also it is necessary to take into account
transformations of proteins during germination process. Comparing raw materials wheat
and oats contain more proteins, and it could explain higher content of proteins in S2
because these cereals contained the highest (40%) ratio of these cereals, comparing to
S1 (10%) and S3 (20%).
Table 1. Nutritional composition and energy value of breakfast cereals
Parameters per 100 g Samples A
S1 S2 S3
Fats, g 1.87 ± 0.06a* 2.72 ± 0.03b 1.87 ± 0.08a
Carbohydrates, g 61.44 ± 1.62b 57.84 ± 0.94a 57.52 ± 1.9a
Protein, g 8.82 ± 0.11a 10.05 ± 0.22c** 9.04 ± 0.11b
Fibre, g 15.12 ± 0.16a* 16.27 ± 0.02b* 18.08 ± 0.26c*
Ash, g 1.21 ± 0.03a 1.50 ± 0.07b 1.77 ± 0.05c
Energy value, kcal 328b 329b 319a
Energy value, kJ 1,385b 1,385b 1,345a
Energy value provided by proteins, % 10.75a 12.23c** 11.33b A Results are expressed as mean values (n = 3) ± standard deviation. Mean values followed by the same
letter within the row are not significantly different (P < 0.05).
* According to regulation (EC) No 1924/2006 product can bear nutrition claim High Fibre.
Breakfast cereals were developed using whole grain flakes, as a result all three
samples had high fibre content – 15.12 g 100 g-1, 16.27 g 100 g-1, 18.08 g 100 g-1 in
samples S1, S2, S3, respectively. Based on the Regulation all three samples can be
labelled with nutritional claim high fibre. A claim that a food is high in fibre, may be
made only where the product contains at least 6 g of fibre per 100 g of product. Cereal
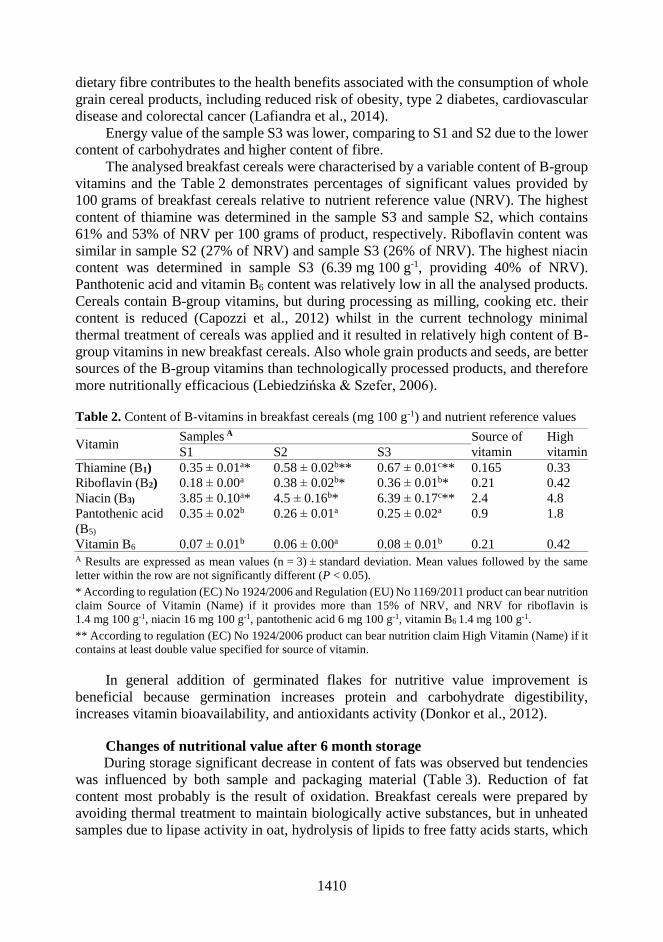
1410
dietary fibre contributes to the health benefits associated with the consumption of whole
grain cereal products, including reduced risk of obesity, type 2 diabetes, cardiovascular
disease and colorectal cancer (Lafiandra et al., 2014).
Energy value of the sample S3 was lower, comparing to S1 and S2 due to the lower
content of carbohydrates and higher content of fibre.
The analysed breakfast cereals were characterised by a variable content of B-group
vitamins and the Table 2 demonstrates percentages of significant values provided by
100 grams of breakfast cereals relative to nutrient reference value (NRV). The highest
content of thiamine was determined in the sample S3 and sample S2, which contains
61% and 53% of NRV per 100 grams of product, respectively. Riboflavin content was
similar in sample S2 (27% of NRV) and sample S3 (26% of NRV). The highest niacin
content was determined in sample S3 (6.39 mg 100 g-1, providing 40% of NRV).
Panthotenic acid and vitamin B6 content was relatively low in all the analysed products.
Cereals contain B-group vitamins, but during processing as milling, cooking etc. their
content is reduced (Capozzi et al., 2012) whilst in the current technology minimal
thermal treatment of cereals was applied and it resulted in relatively high content of B-
group vitamins in new breakfast cereals. Also whole grain products and seeds, are better
sources of the B-group vitamins than technologically processed products, and therefore
more nutritionally efficacious (Lebiedzińska & Szefer, 2006).
Table 2. Content of B-vitamins in breakfast cereals (mg 100 g-1) and nutrient reference values
Vitamin Samples A Source of
vitamin
High
vitamin S1 S2 S3
Thiamine (B1) 0.35 ± 0.01a* 0.58 ± 0.02b** 0.67 ± 0.01c** 0.165 0.33
Riboflavin (B2) 0.18 ± 0.00a 0.38 ± 0.02b* 0.36 ± 0.01b* 0.21 0.42
Niacin (B3) 3.85 ± 0.10a* 4.5 ± 0.16b* 6.39 ± 0.17c** 2.4 4.8
Pantothenic acid
(B5)
0.35 ± 0.02b 0.26 ± 0.01a 0.25 ± 0.02a 0.9 1.8
Vitamin B6 0.07 ± 0.01b 0.06 ± 0.00a 0.08 ± 0.01b 0.21 0.42 A Results are expressed as mean values (n = 3) ± standard deviation. Mean values followed by the same
letter within the row are not significantly different (P < 0.05).
* According to regulation (EC) No 1924/2006 and Regulation (EU) No 1169/2011 product can bear nutrition
claim Source of Vitamin (Name) if it provides more than 15% of NRV, and NRV for riboflavin is
1.4 mg 100 g-1, niacin 16 mg 100 g-1, pantothenic acid 6 mg 100 g-1, vitamin B6 1.4 mg 100 g-1.
** According to regulation (EC) No 1924/2006 product can bear nutrition claim High Vitamin (Name) if it
contains at least double value specified for source of vitamin.
In general addition of germinated flakes for nutritive value improvement is
beneficial because germination increases protein and carbohydrate digestibility,
increases vitamin bioavailability, and antioxidants activity (Donkor et al., 2012).
Changes of nutritional value after 6 month storage
During storage significant decrease in content of fats was observed but tendencies
was influenced by both sample and packaging material (Table 3). Reduction of fat
content most probably is the result of oxidation. Breakfast cereals were prepared by
avoiding thermal treatment to maintain biologically active substances, but in unheated
samples due to lipase activity in oat, hydrolysis of lipids to free fatty acids starts, which

1411
furthermore may promote lipid oxidation during storage (Lampi et al., 2015).
No significant changes in total protein content during storage were observed.
Table 3. Content of total fat and protein content of breakfast cereals
Samples Fats, g 100 g-1 DW A Proteins, g 100 g-1 DW A
S1 2.11 ± 0.07c 9.99 ± 0.12a
S1-Pap/Alu/PE 1.68 ± 0.01b 10.23 ± 0.15a
S1-PE/EvOH/Pap 1.23 ± 0.05a 10.05 ± 0.13a
S2 3.08 ± 0.03b 11.37 ± 0.25a
S2-Pap/Alu/PE 3.04 ± 0.08b 11.35 ± 0.03a
S2-PE/EvOH/Pap 2.42 ± 0.06a 11.38 ± 0.08a
S3 2.12 ± 0.09b 10.24 ± 0.12a
S3-Pap/Alu/PE 0.88 ± 0.04a 10.26 ± 0.06a
S3-PE/EvOH/Pap 2.05 ± 0.07b 10.21 ± 0.08a A Results are expressed as mean values (n = 3) ± standard deviation. Mean values followed by the same
letter within the column for the each sample group separately are not significantly different (P < 0.05).
Changes of fibre content during storage was significant and decrease of insoluble
and soluble fibre was observed. Insoluble fibre content decreased less, reaching 13% in
S3-PE/EvOH/Pap, whereas soluble fibre was more unstable and the highest decrease
reached 65% in S2-PE/EvOH/Pap (Table 4).
Table 4. Fibre in breakfast cereals (g 100 g-1 DW) A
Samples Insoluble fibre Soluble fibre Ratio soluble:
insoluble Total fibre
S1 13.92 ± 0.33a 3.18 ± 0.13b 1:4 17.09 ± 0.18b
S1-Pap/Alu/PE 13.74 ± 0.62a 2.46 ± 0.10a 1:6 16.19 ± 0.05a
S1-PE/EvOH/Pap 15.21 ± 0.17a 2.69 ± 0.18a 1:5 17.91 ± 0.15c
S2 16.28 ± 0.35b 2.13 ± 0.16c 1:8 18.41 ± 0.03c
S2-Pap/Alu/PE 14.51 ± 0.53a 1.42 ± 0.14b 1:10 15.93 ± 0.02a
S2-PE/EvOH/Pap 16.28 ± 0.26b 0.73 ± 0.08a 1:22 17.01 ± 0.03b
S3 17.19 ± 0.78c 4.43 ± 0.33b 1:4 20.48 ± 0.30c
S3-Pap/Alu/PE 16.22 ± 0.09b 2.02 ± 0.26a 1:8 18.24 ± 0.03a
S3-PE/EvOH/Pap 14.91 ± 0.14a 4.12 ± 0.14b 1:4 19.03 ± 0.06b
A Results are expressed as mean values (n = 3) ± standard deviation. Mean values followed by the same
letter within the column for the each sample group separately are not significantly different (P < 0.05).
For tested samples the lowest proportion of soluble fibre was found in S2 and
during storage it decreased significantly, reaching ratio 1:22 in S2-PE/EvOH/Pap. In this
sample was the highest proportion of oats (30%), and oat grain is rich in dietary fibre
(10–12%) with the soluble component accounting for about 55% of the total fibre (Singh
et al., 2013). Sugars during storage also changed significantly and for monosaccharides as
fructose and glucose significant increase was observed, whereas content of disaccharide
– sucrose decreased significantly, and maltose was not detected in any of the samples
after storage (Table 5).

1412
Table 5. Sugars in breakfast cereals (g 100 g-1 DW) A
Sample Fructose Glycose Sucrose Maltose
Sum of
identifie
d sugars
S1 0.08 ± 0.00a 0.15 ± 0.00a 0.55 ± 0.02b 0.75 ± 0.03 1.53
S1-Pap/Alu/PE 0.55 ± 0.02b 0.92 ± 0.02b 0.24 ± 0.01a n.d. 1.71
S1-PE/EvOH/Pap 0.64 ± 0.02c 0.87 ± 0.02b 0.22 ± 0.01a n.d. 1.73
S2 0.28 ± 0.02a 0.15 ± 0.01a 0.73 ± 0.02c 0.54 ± 0.04 1.7
S2-Pap/Alu/PE 0.68 ± 0.02b 0.80 ± 0.02b 0.24 ± 0.01b n.d. 1.72
S2-PE/EvOH/Pap 0.89 ± 0.02c 0.84 ± 0.02b 0.16 ± 0.01a n.d. 1.89
S3 0.10 ± 0.00a 0.19 ± 0.01a 0.77 ± 0.04c 1.18 ± 0.02 2.24
S3-Pap/Alu/PE 0.36 ± 0.02b 1.07 ± 0.03b 0.07 ± 0.01a n.d. 2.2
S3- PE/EvOH/Pap 0.70 ± 0.02c 1.20 ± 0.04b 0.26 ± 0.02b n.d. 2.16 A Results are expressed as mean values (n = 3) ± standard deviation. Mean values followed by the same
letter within the column for the each sample group separately are not significantly different (P < 0.05).
One of the reasons for increase of simple sugars could be breakage of starch by
enzymes that are activated during germination. During the germination, the most
significant changes occur in starch, which is broken to simpler sugars by amylases.
Starch degradation changes during the sprouting process directly affects grain
germination temperature, germination time, relative humidity, moisture content, culture
media, steeping time and light (López-Amorós et al., 2006; Kruma et al., 2016).
TPC in breakfast cereals differed significantly and the highest content was observed
in sample S3 (Table 6).
Table 6. Phenolic compounds and antioxidant activity
Samples TPC,
mg 100 g-1 DW A
DPPH,
mM 100 g-1 DW A
ABTS,
mM 100 g-1 DW A
S1 47.79 ± 1.79c 2.63 ± 0.05a 4.40 ± 0.15a
S1-Pap/Alu/PE 43.01 ± 0.81a 3.76 ± 0.07b 5.57 ± 0.27b
S1-PE/EvOH/Pap 45.11 ± 0.54b 3.6 ± 0.17b 5.69 ± 0.18b
S2 47.02 ± 0.48b 2.74 ± 0.03a 5.98 ± 0.13a
S2-Pap/Alu/PE 35.38 ± 0.56a 3.28 ± 0.09b 6.27 ± 0.14b
S2-PE/EvOH/Pap 35.63 ± 2.12a 3.38 ± 0.05b 6.62 ± 0.23b
S3 57.01 ± 2.17c 3.42 ± 0.13a 6.23 ± 0.18b
S3-Pap/Alu/PE 48.40 ± 0.54b 3.96 ± 0.16b 7.27 ± 0.43c
S3-PE/EvOH/Pap 41.29 ± 1.88a 3.79 ± 0.16b 5.28 ± 0.08a A Results are expressed as mean values (n = 3) ± standard deviation. Mean values followed by the same
letter within the column for the each sample group separately are not significantly different (P < 0.05).
This sample contained the highest proportion of hull-less barley, followed by rye
and wheat and previous results showed that these cereals has higher TPC (Kruma et al.,
2016). During storage TPC significantly decreased in all tested samples. The highest
decrease was detected in sample S2, and it was similar for both S2- Pap/Alu/PE and
S2- PE/EvOH/Pap, 24.75%, 24.22%, respectively. Packaging material influenced TPC
in sample S3.
1413
DPPH and ABTS scavenging activity during storage significantly increased, except
sample S3- PE/EvOH/Pap. The highest increase of 29.32% was observed in
S1- PE/EvOH/Pap. For S3 sample contrary results were found, in S3- Pap/Alu/PE
increase for 16.7% whereas for S3-PE/EvOH/Pap 15.2% decrease was observed. Radical
scavenging activity, analysed by both assays in S1 and S2 was significantly higher.
Contrary to phenolic compounds, scavenging activity during storage increased in all
three tested samples.
To understand the role of phenolic compounds in antioxidant activity of flakes,
correlation analyses were performed. No correlation between TPC and DPPH
scavenging activity (r = 0.08) and TPC and ABTS scavenging activity (r = 0.05) was
observed. Only between both tested antioxidant assays moderate correlation (r = 0.47)
was determined. The cereals with high TPC are not efficient for DPPH inhibition and it
could be explained by ferulic acid, the main phenolic acid in cereal grains, which showed
a weak antiradical effect in experiments with the DPPH radical, which may explain the
discrepancies (Đorđević et al., 2010). Also it could be explained by the contribution of
other compounds to antioxidant activity.
Phenolic compounds have been investigated due to their diverse health benefits as
antioxidants both in food and in human body. Thereby for selection of packaging
material it is also important to select material for the best presevation of phenolic
compounds. In current experiment accelerated storage test was performed, and it could
also influence changes of phenolic compounds and antioxidant acitivity. But results
about processing of sorghum with dry heat did not affect the total phenolic compounds
and antioxidant activity, whereas the wet heat decreased total phenolic compounds and
antioxidant activity (Cardoso et al., 2014). Also in the sorghum TPC reduced after
storage for 180 days at a temperature of 40°C, the retentions of these compounds were
high, 87.6% in flour and 93% in grains (Oliveira et al., 2017).
The permeability of packaging materials to water vapour and oxygen as well as
light transmittance are critical factors determining the quality and bio-chemical stability
of dried products during storage. Aluminum polyethylene pouches, with a greater
protective barrier, better preserved TPC and the antioxidant compared to
polyamide/polyethylene pouches (Udomkun et al., 2016). Our results showed that
breakfast cereal composition also is critical factor and in the current research the highest
decrease of TPC in S3 was detected and it could be explained by the highest proportion
of germinated grains. These samples were microwave vacuum dried at low temperature
and still some enzymatic activity may remain resulting in oxidation of phenolic
compounds.
As different whole grains have different composition and health benefits,
technologies should be developed to allow the use of versatile grain raw materials, also
multigrain products and new product concepts. More varied use of raw materials and
ingredients would also diversify the taste of cereal foods’ (Poutanen et al., 2014).
Developed breakfast cereals are multigrain products, with additional value of germinated
cereals, but it also can cause problems in stability of product during its storage.

1414
CONCLUSIONS
Breakfast cereals containing germinated grains has high nutritional value. All
developed samples are high in fibre and thiamine (vitamin B1). Additionally S2 is a
source of protein, riboflavin (vitamin B2) and niacin (vitamin B3); S3 – is a source of
riboflavin (vitamin B2) and high in niacin (vitamin B3). Comparing TPC and antioxidant
capacity of tested samples S3 showed the highest values. Storage and selected packaging
material influenced stability of nutrients, except proteins. During storage fat content and
TPC reduced, whereas antioxidant activity increased. For better preserving of samples
nutrition value for S1 and S2 Pap50g/Alu7/Pe60 (AL) but for S3 Pap40g/PELD20/PE40
(PE) should be selected.
ACKNOWLEDGEMENTS. The research leading to these results has received funding from the
Norwegian Financial Mechanism 2009–2014 under Project Innovative approach to hull-less
spring cereals and triticale use from human health perspective (NFI/R/2014/011).
REFERENCES
Albertson, A.M., Thompson, D., Franko, D.L., Kleinman, R.E., Barton, B.A. & Crockett, S.J.
2008. Consumption of breakfast cereal is associated with positive health outcomes:
evidence from the National Heart, Lung, and Blood Institute Growth and Health Study.
Nutrition Research 28,744–752.
Barton, B.A., Eldridge, A.L., Thompson, D., Affenito, S.G., Striegel-Moore, R.H., Franko, D.L.,
Albertson, A.M. & Crockett, S.J. 2005. The relationship of breakfast and cereal
consumption to nutrient intake and body mass index. Journal of the American Dietetic
Association 105, 1383–1389.
Bucsella, B., Molnár, D., Harasztos, A.H. & Tömösközi, S. 2016. Comparison of the rheological
and end-product properties of an industrial aleurone-rich wheat flour, whole grain wheat
and rye flour. Journal of Cereal Science 69, 40–48.
Capozzi, V., Russo, P., Dueñas, M.T., López, P. & Spano, G. 2012. Lactic acid bacteria
producing B-group vitamins: A great potential for functional cereals products. Applied
Microbiology and Biotechnology 96, 1383–1394.
Cardoso, L. de M., Montini, T.A., Pinheiro, S.S., Pinheiro-Sant’Ana, H.M., Martino, H.S.D. &
Moreira, A.V.B. 2014. Effects of processing with dry heat and wet heat on the antioxidant
profile of sorghum. Food Chemistry 152, 210–217.
Donkor, O.N., Stojanovska, L., Ginn, P., Ashton, J. & Vasiljevic, T. 2012. Germinated grains –
Sources of bioactive compounds. Food Chemistry 135, 950–959.
Đorđević, T.M., Šiler-Marinković, S.S. & Dimitrijević-Branković, S.I. (2010). Effect of
fermentation on antioxidant properties of some cereals and pseudo cereals. Food Chemistry
119, 957–963.
Edge, M.S., Jones, J.M. & Marquart, L. 2005. A New Life for Whole Grains. Journal of the
American Dietetic Association 105, 1856–1860.
Fraś, A., Gołębiewska, K., Gołębiewski, D., Mańkowski, D.R., Boros, D. & Szecówka, P.
(2016). Variability in the chemical composition of triticale grain, flour and bread. Journal
of Cereal Science 71, 66–72.
Hu, X.-Z., Zheng, J.-M., Li, X., Xu, C. & Zhao, Q. 2014. Chemical composition and sensory
characteristics of oat flakes: A comparative study of naked oat flakes from China and hulled
oat flakes from western countries. Journal of Cereal Science 60, 297–301.
Kapica, C. 2001. Oats-Nature’s Functional Food. Nutrition Today 36, 56–60.

1415
Kince, T., Galoburda, R., Klava, D., Tomsone, L., Senhofa, S., Straumite, E., Kerch, G.,
Kronberga, A., Sturite, I., Kunkulberga, D. & Blija, A. 2017. Breakfast cereals with
germinated cereal flakes: changes in selected physical, microbiological, and sensory
characteristics during storage. European Journal of Food Research and Technology 243,
1497–1506.
Koletta, P., Irakli, M., Papageorgiou, M. & Skendi, A. 2014. Physicochemical and technological
properties of highly enriched wheat breads with wholegrain non wheat flours. Journal of
Cereal Science 60, 561–568.
Kruma, Z., Tomsone, L., Ķince, T., Galoburda, R. & Senhofa, S. 2016. Effects of germination on
total phenolic compounds and radical scavenging activity in hull-less spring cereals and
triticale. Agronomy Research 14, 1372–1383.
Lafiandra, D., Riccardi, G. & Shewry, P.R. 2014. Improving cereal grain carbohydrates for diet
and health. Journal of Cereal Science 59, 312–326.
Lampi, A.-M., Damerau, A., Li, J., Moisio, T., Partanen, R., Forssell, P. & Piironen, V. 2015.
Changes in lipids and volatile compounds of oat flours and extrudates during processing
and storage. Journal of Cereal Science 62, 102–109.
Lebiedzińska, A. & Szefer, P. 2006. Vitamins B in grain and cereal-grain food, soy-products and
seeds. Food Chemistry 95, 116–122.
López-Amorós, M.L., Hernández, T. & Estrella, I. 2006. Effect of germination on legume
phenolic compounds and their antioxidant activity. Journal of Food Composition and
Analysis 19, 277–283.
Luthria, D.L., Lu, Y. & John, K.M.M. 2015. Bioactive phytochemicals in wheat: Extraction,
analysis, processing, and functional properties. Journal of Functional Foods 18, 910–925.
Macedo, I.S.M., Sousa-Gallagher, M.J., Oliveira, J.C. & Byrne, E.P. 2013. Quality by design for
packaging of granola breakfast product. Food Control 29, 438–443.
Oliveira, L.C., Rosell, C.M. & Steel, C.J. 2015. Effect of the addition of whole-grain wheat flour
and of extrusion process parameters on dietary fibre content, starch transformation and
mechanical properties of a ready-to-eat breakfast cereal. International Journal of Food
Science and Technology 50, 1504–1514.
Oliveira, K.G. de, Queiroz, V.A.V., Carlos, L. de A., Cardoso, L.D.M., Pinheiro-
Sant’Ana, H.M., Anunciação, P.C., Menezes, C.B., Silva, E.C.D. & Barros, F. 2017. Effect
of the storage time and temperature on phenolic compounds of sorghum grain and flour.
Food Chemistry 216, 390–398.
Poutanen, K., Sozer, N. & Della Valle, G. 2014. How can technology help to deliver more of
grain in cereal foods for a healthy diet? Journal of Cereal Science 59, 327–336.
Rakha, A., Åman, P. & Andersson, R. 2011. Dietary fiber in triticale grain: Variation in content,
composition, and molecular weight distribution of extractable components. Journal of
Cereal Science 54, 324–331.
Re, R., Pellegrini, N., Proteggente, A., Pannala, A., Yang, M. & Rice-Evans, C. 1999.
Antioxidant activity applying an improved ABTS radical cation decolorization assay. Free
Radical Biology and Medicine 26, 1231–1237.
Senhofa, S., Ķince, T., Galoburda, R., Cinkmanis, I., Sabovics, M. & Sturite, I. 2016. Effects of
germination on chemical composition of hull - less spring cereals. In: Procedings of
Research for Rural Development. p. 91–97.
Sharma, S., Saxena, D.C. & Riar, C.S. 2016. Analysing the effect of germination on phenolics,
dietary fibres, minerals and γ-amino butyric acid contents of barnyard millet (Echinochloa
frumentaceae). Food Bioscience 13, 60–68.
Singh, R., De, S. & Belkheir, A. 2013. Avena sativa (Oat), a potential neutraceutical and
therapeutic agent: an overview. Critical Reviews in Food Science and Nutrition 53,
126–144.

1416
Singleton, V.L., Orthofer, R. & Lamuela-Raventos, R.M. 1999. Analysis of Total Phenols and
Other Oxidation Substrates and Antioxidants by Means of Folin-Ciocalteu Reagent.
Methods in Enzymology 119, 152–178.
Škrbić, B., Milovac, S., Dodig, D. & Filipčev, B. 2009. Effects of hull-less barley flour and flakes
on bread nutritional composition and sensory properties. Food Chemistry 115, 982–988.
Soares, R.M.D., De Francisco, A., Rayas-Duarte, P. & Soldi, V. 2007. Brazilian hull-less and
malting barley genotypes: I. chemical composition and partial characterization. Journal of
Food Quality 30, 357–371.
Sumczynski, D., Bubelova, Z., Sneyd, J., Erb-Weber, S. & Mlcek, J. 2015. Total phenolics,
flavonoids, antioxidant activity, crude fibre and digestibility in non-traditional wheat flakes
and muesli. Food Chemistry 174, 319–325.
Udomkun, P., Nagle, M., Argyropoulos, D., Mahayothee, B., Latif, S. & Müller, J. 2016.
Compositional and functional dynamics of dried papaya as affected by storage time and
packaging material. Food Chemistry 196, 712–719.
Wu, F., Yang, N., Touré, A., Jin, Z. & Xu, X. 2013. Germinated Brown Rice and Its Role in
Human Health. Critical Reviews in Food Science and Nutrition 53, 451–453.
Yu, L., Perret, J., Harris, M., Wilson, J. & Haley, S. 2003. Antioxidant properties of bran extracts
from ‘Akron’ wheat grown at different locations. Journal of Agricultural and Food
Chemistry 51, 1566–1570.

1417
Agronomy Research 16(S2), 1417–1424, 2018
https://doi.org/10.15159/AR.18.109
Influence of technological parameters on chemical composition
of triticale flakes
Z. Kruma1,*, E. Straumite1, T. Kince1, D. Klava1, K. Abelniece2 and
A. Balgalve2
1Latvia University of Life Sciences and Technologies, Faculty of Food Technology,
Department of Food Technology, Rigas iela 22, LV-3001, Jelgava, Latvia 2Ltd Felici, Rigas gatve 8, LV-2164, Adazi, Adazu novads, Latvia *Correspondence: [email protected]
Abstract. Triticale is hybrid crop developed by crossing wheat (Triticum) and rye (Secale) and
in last years it become more popular for food applications, including flake production. Different
approaches are developed to improve flakes technology by applying different cooking, rolling,
toasting parameters resulting in high quality products. All these technologies influence also
nutrition quality of product due to the different stability of these compounds during mechanical
and thermal treatment. The aim of current experiment was to investigate the influence of
technological parameters on chemical composition of triticale flakes. In current experiment
triticale grains and triticale flakes obtained by different technologies was tested. For evaluation
of the influence of technological parameters, different flaking and rolling parameters were tested.
For all samples were determined composition of basic nutrients (fats, proteins, fibres, sugars,
ash), minerals (Ca, Mg, K, Zn, P), vitamins, total phenolics and antioxidant activity. Triticale has
high nutritional quality, containing significant amounts of protein, fibres, vitamins and minerals.
Technological processes significantly influence cereals composition, but it depends on
parameters tested. Control sample showed lower results and hierarchical cluster analyses showed
that samples 1/3/1, 2/1/2/1, 2/1/3/1, 2/1/4/1 are similar in composition of bioactive compounds.
Results showed that for selection of the best method for flaking physical and/or sensory properties
should be taken in account.
Key words: triticale, flakes, technology, chemical composition.
INTRODUCTION
The health benefits of cereal products and consumer's acceptance should be
prioritised (Fardet, 2014). Cereal consumption is significant factor influencing healthful
lifestyle that helps to maintain healthful body mass index (Barton et al., 2005). Different
trends become popular in last years to improve the nutrient composition of cereals, often
in response to public health concerns and consumer demands, for example decrease of
sugar and sodium, increase level of fiber level, use of whole grain, fruit powders
(Oliveira et al., 2018), legumes etc. (Thomas et al., 2013). Part of consumers prefer use
of traditional flakes for not only making of porridge but also consuming with milk or
yogurt. Cereal flakes traditionaly are produced by steaming to certain moisture content
followed by flaking, but for consumption without hot water treatment harder structure

1418
remains. Different approaches is developed to improve flakes production technology by
using reduced or high pressure treatment, selected rolling and toasting parameters
resulting in high quality products. One of the property that could be influenced by these
techniques is bulk density and improved sensory properties of products. Volume of flakes
is very important because consumer researchs shows influence of volume to selection of
portion size and results about breakfast cereals showed that by reducing flake size,
panelists took smaller volume of sample, but still they took more energy value (Rolls et
al., 2014). Technology used in current experiemnts could increase bulk density and could
result in lower consumption of food.
Triticale is hybrid crop developed by crossing wheat (Triticum) and rye (Secale
cereale) and in last years it become more popular for food applications, including muesli
production (Senhofa et al., 2015). Comparing to wheat triticale has similar content of
protein, with a slightly higher amount of lysine (0.33–0.71%) (Fraś et al., 2016) and also
similar content of fibre, but with a higher amount of soluble fraction, especially water-
extractable arabinoxylans (Rakha et al., 2011). Technologies applied influence also
nutrition quality of product due to the different stability of these compounds during
mechanical and thermal treatment (Fraś et al., 2016).
The aim of current experiment was to investigate the influence of technological
parameters on chemical composition of triticale flakes.
MATERIALS AND METHODS
Triticale flakes samples preparation
In the present experiment three different technologies for flakes production were
used: traditionally commercially processed flakes (control sample) – purchased ready-
made triticale whole grain flakes from JSC Dobeles dzirnavnieks (Latvia). Processing
technology includes purified triticale grains steaming, rolling and drying.
Samples numbered with first code 1 (cooking method 1)– cooked triticale flakes
obtained by 1 min steaming and 0.5 ± 0.1 bar pressure 10 min and different flaking rolls
gap settings (respectively, sample 1/3/1 – 0.06 ± 0.01 mm and sample 1/4/1 –
0.04 ± 0.01 mm). Processed triticale flakes were transferred for drying in the Mitchell
Bach Dryer (GmbH Baker Perkins, UK) for 35 ± 5 min at 80 ± 1 °C. Samples numbered
with first code 2 (cooking method 2) – triticale grains were transferred in the Rotary
Cereal Cooker (GmbH Baker Perkins, UK) with adding of extra water 20 ± 3% from
grains total amount, after that samples were 5 min steamed and cooked 30 ± 5 min at 1.2
bar pressure. Samples 2/1/2/1, 2/1/3/1, 2/1/4/1 differing by flaking rolls gap settings,
respectively, 0.10 ± 0.01, 0.06 ± 0.01 and 0.04 ± 0.01 mm gap. Processed triticale flakes
were transferred for drying in the Mitchell Bach Dryer (GmbH Baker Perkins, UK) at
80 ± 1 °C for 30 ± 5 min. Toasting procedure was performed in falling temperatures under 200 ± 10 °C for
less than one minute in the toaster New Thermoglide Toaster Rig (GmbH Baker Perkins,
UK).
Methods
Basic nutrients were determined by following methods: fat – § 64 LFGB L
20.01/02-5, fatty acids – § 64 LFGB L 13.00-26/-27/20, carbohydrates (calculated by
difference), sugars (fructose, glucose, sucrose, maltose, lactose) – § 64 LFGB L 00.00-
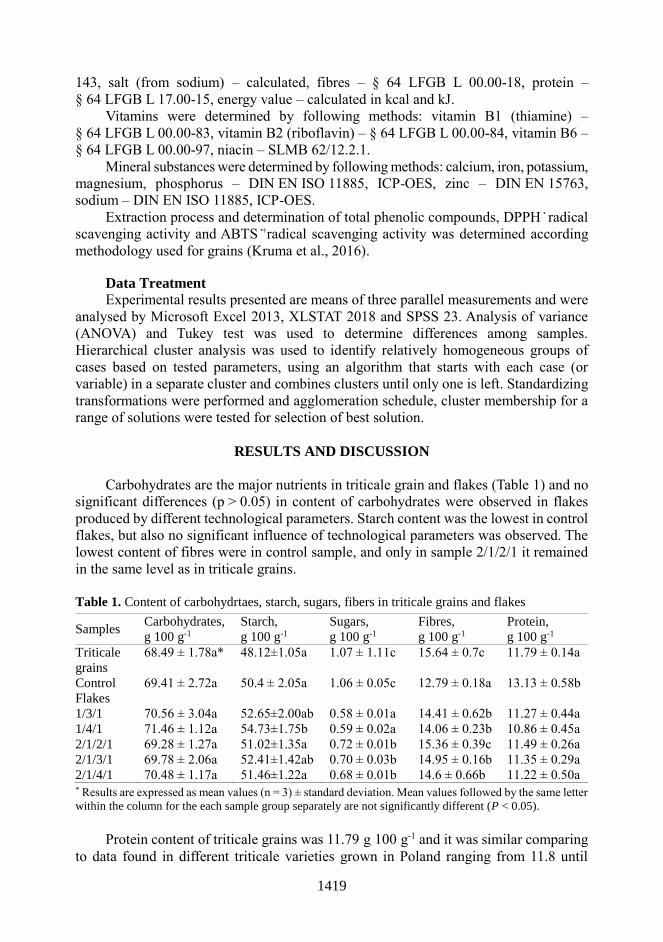
1419
143, salt (from sodium) – calculated, fibres – § 64 LFGB L 00.00-18, protein –
§ 64 LFGB L 17.00-15, energy value – calculated in kcal and kJ.
Vitamins were determined by following methods: vitamin B1 (thiamine) –
§ 64 LFGB L 00.00-83, vitamin B2 (riboflavin) – § 64 LFGB L 00.00-84, vitamin B6 –
§ 64 LFGB L 00.00-97, niacin – SLMB 62/12.2.1.
Mineral substances were determined by following methods: calcium, iron, potassium,
magnesium, phosphorus – DIN EN ISO 11885, ICP-OES, zinc – DIN EN 15763,
sodium – DIN EN ISO 11885, ICP-OES.
Extraction process and determination of total phenolic compounds, DPPH ̇ radical
scavenging activity and ABTS ̇+radical scavenging activity was determined according
methodology used for grains (Kruma et al., 2016).
Data Treatment
Experimental results presented are means of three parallel measurements and were
analysed by Microsoft Excel 2013, XLSTAT 2018 and SPSS 23. Analysis of variance
(ANOVA) and Tukey test was used to determine differences among samples.
Hierarchical cluster analysis was used to identify relatively homogeneous groups of
cases based on tested parameters, using an algorithm that starts with each case (or
variable) in a separate cluster and combines clusters until only one is left. Standardizing
transformations were performed and agglomeration schedule, cluster membership for a
range of solutions were tested for selection of best solution.
RESULTS AND DISCUSSION
Carbohydrates are the major nutrients in triticale grain and flakes (Table 1) and no
significant differences (p > 0.05) in content of carbohydrates were observed in flakes
produced by different technological parameters. Starch content was the lowest in control
flakes, but also no significant influence of technological parameters was observed. The
lowest content of fibres were in control sample, and only in sample 2/1/2/1 it remained
in the same level as in triticale grains.
Table 1. Content of carbohydrtaes, starch, sugars, fibers in triticale grains and flakes
Samples Carbohydrates,
g 100 g-1
Starch,
g 100 g-1
Sugars,
g 100 g-1
Fibres,
g 100 g-1
Protein,
g 100 g-1
Triticale
grains
68.49 ± 1.78a* 48.12±1.05a 1.07 ± 1.11c 15.64 ± 0.7c 11.79 ± 0.14a
Control
Flakes
69.41 ± 2.72a 50.4 ± 2.05a 1.06 ± 0.05c 12.79 ± 0.18a 13.13 ± 0.58b
1/3/1 70.56 ± 3.04a 52.65±2.00ab 0.58 ± 0.01a 14.41 ± 0.62b 11.27 ± 0.44a
1/4/1 71.46 ± 1.12a 54.73±1.75b 0.59 ± 0.02a 14.06 ± 0.23b 10.86 ± 0.45a
2/1/2/1 69.28 ± 1.27a 51.02±1.35a 0.72 ± 0.01b 15.36 ± 0.39c 11.49 ± 0.26a
2/1/3/1 69.78 ± 2.06a 52.41±1.42ab 0.70 ± 0.03b 14.95 ± 0.16b 11.35 ± 0.29a
2/1/4/1 70.48 ± 1.17a 51.46±1.22a 0.68 ± 0.01b 14.6 ± 0.66b 11.22 ± 0.50a * Results are expressed as mean values (n = 3) ± standard deviation. Mean values followed by the same letter
within the column for the each sample group separately are not significantly different (P < 0.05).
Protein content of triticale grains was 11.79 g 100 g-1 and it was similar comparing
to data found in different triticale varieties grown in Poland ranging from 11.8 until
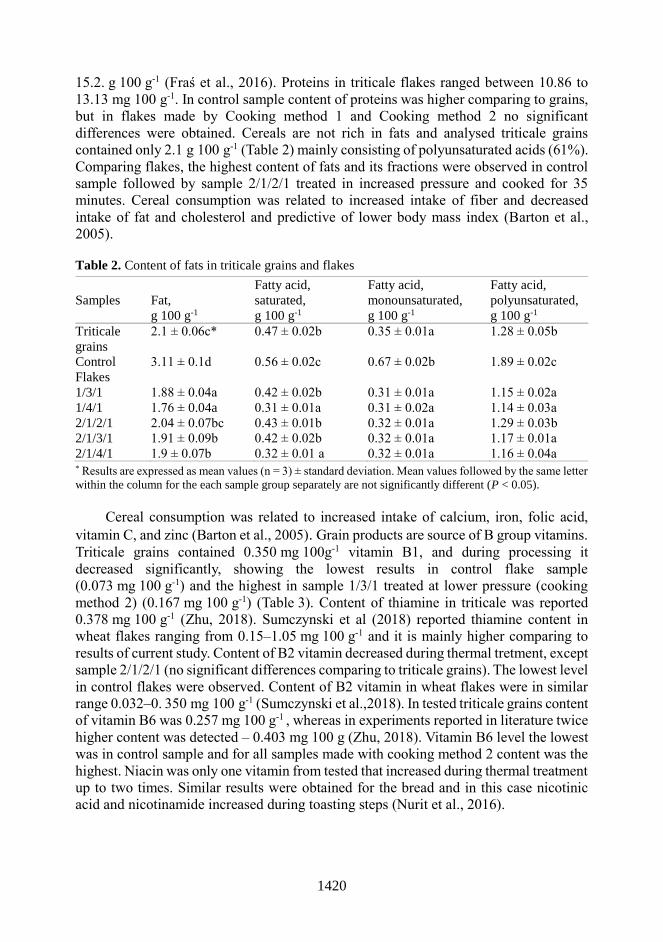
1420
15.2. g 100 g-1 (Fraś et al., 2016). Proteins in triticale flakes ranged between 10.86 to
13.13 mg 100 g-1. In control sample content of proteins was higher comparing to grains,
but in flakes made by Cooking method 1 and Cooking method 2 no significant
differences were obtained. Cereals are not rich in fats and analysed triticale grains
contained only 2.1 g 100 g-1 (Table 2) mainly consisting of polyunsaturated acids (61%).
Comparing flakes, the highest content of fats and its fractions were observed in control
sample followed by sample 2/1/2/1 treated in increased pressure and cooked for 35
minutes. Cereal consumption was related to increased intake of fiber and decreased
intake of fat and cholesterol and predictive of lower body mass index (Barton et al.,
2005).
Table 2. Content of fats in triticale grains and flakes
Samples Fat,
g 100 g-1
Fatty acid,
saturated,
g 100 g-1
Fatty acid,
monounsaturated,
g 100 g-1
Fatty acid,
polyunsaturated,
g 100 g-1
Triticale
grains
2.1 ± 0.06c* 0.47 ± 0.02b 0.35 ± 0.01a 1.28 ± 0.05b
Control
Flakes
3.11 ± 0.1d 0.56 ± 0.02c 0.67 ± 0.02b 1.89 ± 0.02c
1/3/1 1.88 ± 0.04a 0.42 ± 0.02b 0.31 ± 0.01a 1.15 ± 0.02a
1/4/1 1.76 ± 0.04a 0.31 ± 0.01a 0.31 ± 0.02a 1.14 ± 0.03a
2/1/2/1 2.04 ± 0.07bc 0.43 ± 0.01b 0.32 ± 0.01a 1.29 ± 0.03b
2/1/3/1 1.91 ± 0.09b 0.42 ± 0.02b 0.32 ± 0.01a 1.17 ± 0.01a
2/1/4/1 1.9 ± 0.07b 0.32 ± 0.01 a 0.32 ± 0.01a 1.16 ± 0.04a * Results are expressed as mean values (n = 3) ± standard deviation. Mean values followed by the same letter
within the column for the each sample group separately are not significantly different (P < 0.05).
Cereal consumption was related to increased intake of calcium, iron, folic acid,
vitamin C, and zinc (Barton et al., 2005). Grain products are source of B group vitamins.
Triticale grains contained 0.350 mg 100g-1 vitamin B1, and during processing it
decreased significantly, showing the lowest results in control flake sample
(0.073 mg 100 g-1) and the highest in sample 1/3/1 treated at lower pressure (cooking
method 2) (0.167 mg 100 g-1) (Table 3). Content of thiamine in triticale was reported
0.378 mg 100 g-1 (Zhu, 2018). Sumczynski et al (2018) reported thiamine content in
wheat flakes ranging from 0.15–1.05 mg 100 g-1 and it is mainly higher comparing to
results of current study. Content of B2 vitamin decreased during thermal tretment, except
sample 2/1/2/1 (no significant differences comparing to triticale grains). The lowest level
in control flakes were observed. Content of B2 vitamin in wheat flakes were in similar
range 0.032–0. 350 mg 100 g-1 (Sumczynski et al.,2018). In tested triticale grains content
of vitamin B6 was 0.257 mg 100 g-1 , whereas in experiments reported in literature twice
higher content was detected – 0.403 mg 100 g (Zhu, 2018). Vitamin B6 level the lowest
was in control sample and for all samples made with cooking method 2 content was the
highest. Niacin was only one vitamin from tested that increased during thermal treatment
up to two times. Similar results were obtained for the bread and in this case nicotinic
acid and nicotinamide increased during toasting steps (Nurit et al., 2016).

1421
Table 3. Content of vitamins in triticale grains and flakes
Samples Vitamin B1,
mg 100 g-1
Vitamin B2,
mg 100 g-1
Vitamin B6,
mg 100 g-1
Niacin,
mg 100 g-1
Triticale
grains
0.350 ± 0.011f* 0.096 ± 0.003c 0.257 ± 0.004d 0.548 ± 0.019a
Control
flakes
0.073 ± 0.001a 0.040 ± 0.002a 0.110 ± 0.005a 0.667 ± 0.027b
1/3/1 0.167 ± 0.008e 0.085 ± 0.002b 0.219 ± 0.008b 0.877 ± 0.026c
1/4/1 0.134 ± 0.004d 0.082 ± 0.001b 0.217 ± 0.007b 0.869 ± 0.011c
2/1/2/1 0.107 ± 0.004c 0.093 ± 0.003c 0.236 ± 0.010c 1.182 ± 0.040d
2/1/3/1 0.098 ± 0.005c 0.085 ± 0.001b 0.223 ± 0.009bc 1.273 ± 0.019d
2/1/4/1 0.087 ± 0.001b 0.088 ± 0.002bc 0.222 ± 0.008bc 1.270 ± 0.051d * Results are expressed as mean values (n = 3) ± standard deviation. Mean values followed by the same letter
within the column for the each sample group separately are not significantly different (P < 0.05).
Content of total phenolic compounds in triticale grain was 34.22 mg 100 g-1
(Table 4) and comparing to literature it is similar – 295.02 μg g-1 (29.5 mg 100 g-1) range
(Irakli et al., 2012). In samples made by cooking method 2 and also 1/3/1/ significant
TPC increase were determined. DPPH antioxidant activity in flakes was significantly
higher compared to grains, and similar trend for ABTS antioxidant activity was
observed. Exception was sample 2/1/4/1 were significant lower activity was observed.
For both antioxidant assays higher results for Cooking method 2 was observed.
Processing of sorghum with dry heat did not affect the total phenolic compounds and
antioxidant activity, whereas the wet heat decreased total phenolic compounds and
antioxidant activity (Cardoso et al., 2014). In our experiment wet treatment was used but
decrease of antioxidant activity for two samples was not observed (1/4/1 and 2/1/3/1).
Table 4. Content of total phenolics and antioxidant activity of triticale grain and flakes
Samples TPC, mg 100 g-1 DPPH, mM TE 100g-1 ABTS, mM TE 100g-1
Triticale grains 34.22 ± 0.97c* 1.15 ± 0.44a 7.05 ± 0.22b
Control Flakes 26.96 ± 1.36a 1.79 ± 0.22b 8.45 ± 0.29c
1/3/1 36.15 ± 1.42c 2.31 ± 0.03c 6.97 ± 0.21b
1/4/1 29.8 ± 0.86b 2.35 ± 0.05c 9.21 ± 0.33d
2/1/2/1 38.15 ± 0.59d 2.83 ± 0.02d 10.11 ± 0.27e
2/1/3/1 42.89 ± 0.47e 2.78 ± 0.04d 12.35 ± 0.11f
2/1/4/1 42.74 ± 1.35e 2.86 ± 0.08d 6.3 ± 0.26a * Results are expressed as mean values (n = 3) ± standard deviation. Mean values followed by the same letter
within the column for the each sample group separately are not significantly different (P < 0.05).
For antioxidant activity even increase was observed and mainly it could be
explained by transformation of some bound antioxidants to free form with higher
activity. Oat-based breakfast cereals, irrespective of brand, variety or cost, are a
significant source of polyphenols and antioxidant compounds (Ryan et al., 2011) and use
of triticle could also be perspective source of phenolics.
The main mineral substances were determined in triticale grain and flakes. The
highest content of zinc, phosphorus, magnesium and potasiums were in triticale grains,
whereas iron was in higher concentration in flakes made by cooking method 1 and
cooking method 2 (Table 5 and 6). It is possible to conclude that tendencies of changes
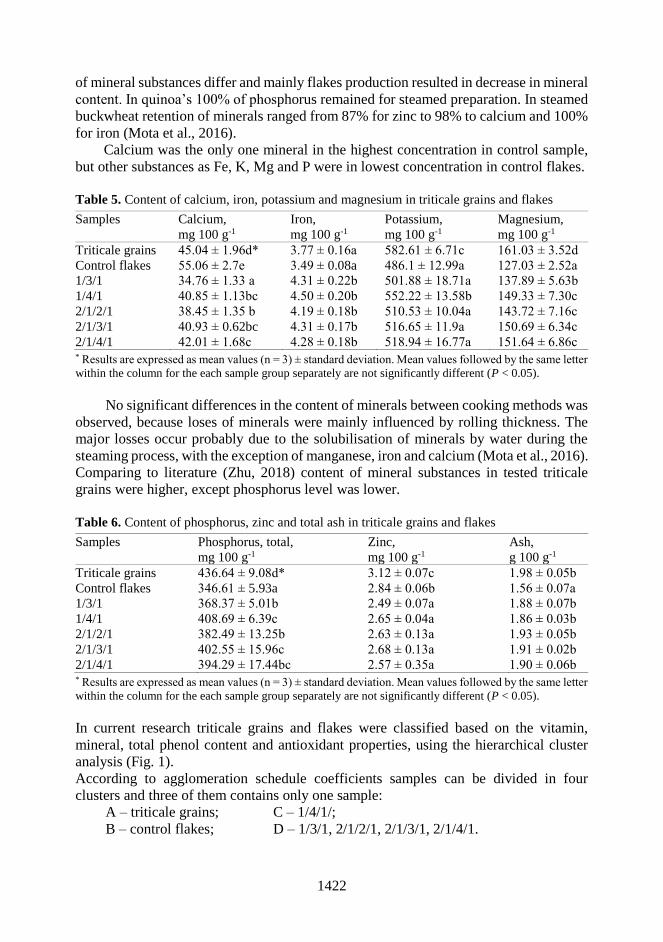
1422
of mineral substances differ and mainly flakes production resulted in decrease in mineral
content. In quinoa’s 100% of phosphorus remained for steamed preparation. In steamed
buckwheat retention of minerals ranged from 87% for zinc to 98% to calcium and 100%
for iron (Mota et al., 2016).
Calcium was the only one mineral in the highest concentration in control sample,
but other substances as Fe, K, Mg and P were in lowest concentration in control flakes.
Table 5. Content of calcium, iron, potassium and magnesium in triticale grains and flakes
Samples Calcium,
mg 100 g-1
Iron,
mg 100 g-1
Potassium,
mg 100 g-1
Magnesium,
mg 100 g-1
Triticale grains 45.04 ± 1.96d* 3.77 ± 0.16a 582.61 ± 6.71c 161.03 ± 3.52d
Control flakes 55.06 ± 2.7e 3.49 ± 0.08a 486.1 ± 12.99a 127.03 ± 2.52a
1/3/1 34.76 ± 1.33 a 4.31 ± 0.22b 501.88 ± 18.71a 137.89 ± 5.63b
1/4/1 40.85 ± 1.13bc 4.50 ± 0.20b 552.22 ± 13.58b 149.33 ± 7.30c
2/1/2/1 38.45 ± 1.35 b 4.19 ± 0.18b 510.53 ± 10.04a 143.72 ± 7.16c
2/1/3/1 40.93 ± 0.62bc 4.31 ± 0.17b 516.65 ± 11.9a 150.69 ± 6.34c
2/1/4/1 42.01 ± 1.68c 4.28 ± 0.18b 518.94 ± 16.77a 151.64 ± 6.86c * Results are expressed as mean values (n = 3) ± standard deviation. Mean values followed by the same letter
within the column for the each sample group separately are not significantly different (P < 0.05).
No significant differences in the content of minerals between cooking methods was
observed, because loses of minerals were mainly influenced by rolling thickness. The
major losses occur probably due to the solubilisation of minerals by water during the
steaming process, with the exception of manganese, iron and calcium (Mota et al., 2016).
Comparing to literature (Zhu, 2018) content of mineral substances in tested triticale
grains were higher, except phosphorus level was lower.
Table 6. Content of phosphorus, zinc and total ash in triticale grains and flakes
Samples Phosphorus, total,
mg 100 g-1
Zinc,
mg 100 g-1
Ash,
g 100 g-1
Triticale grains 436.64 ± 9.08d* 3.12 ± 0.07c 1.98 ± 0.05b
Control flakes 346.61 ± 5.93a 2.84 ± 0.06b 1.56 ± 0.07a
1/3/1 368.37 ± 5.01b 2.49 ± 0.07a 1.88 ± 0.07b
1/4/1 408.69 ± 6.39c 2.65 ± 0.04a 1.86 ± 0.03b
2/1/2/1 382.49 ± 13.25b 2.63 ± 0.13a 1.93 ± 0.05b
2/1/3/1 402.55 ± 15.96c 2.68 ± 0.13a 1.91 ± 0.02b
2/1/4/1 394.29 ± 17.44bc 2.57 ± 0.35a 1.90 ± 0.06b * Results are expressed as mean values (n = 3) ± standard deviation. Mean values followed by the same letter
within the column for the each sample group separately are not significantly different (P < 0.05).
In current research triticale grains and flakes were classified based on the vitamin,
mineral, total phenol content and antioxidant properties, using the hierarchical cluster
analysis (Fig. 1).
According to agglomeration schedule coefficients samples can be divided in four
clusters and three of them contains only one sample:
A – triticale grains;
B – control flakes;
C – 1/4/1/;
D – 1/3/1, 2/1/2/1, 2/1/3/1, 2/1/4/1.
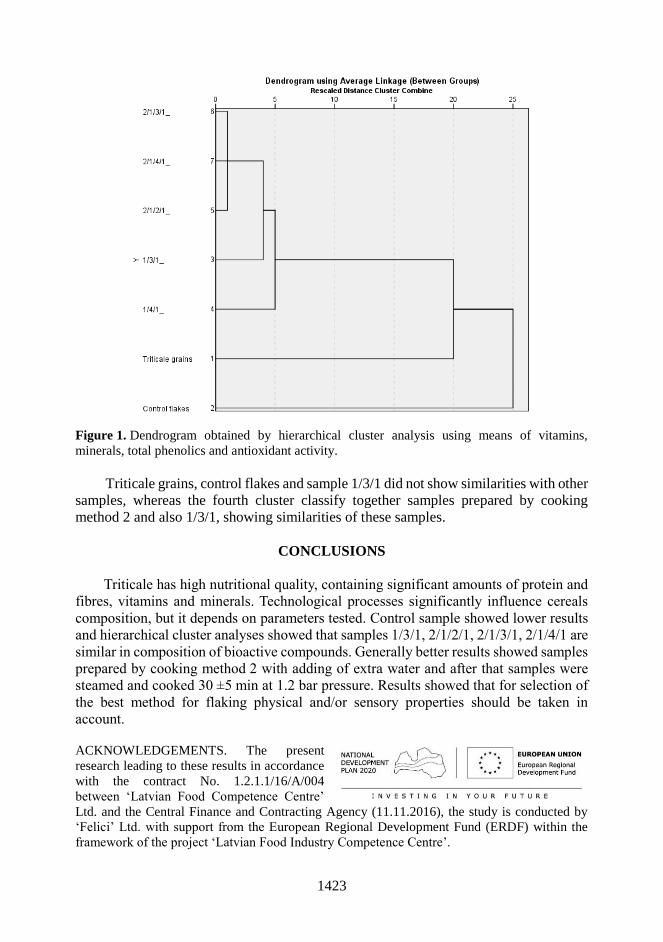
1423
Figure 1. Dendrogram obtained by hierarchical cluster analysis using means of vitamins,
minerals, total phenolics and antioxidant activity.
Triticale grains, control flakes and sample 1/3/1 did not show similarities with other
samples, whereas the fourth cluster classify together samples prepared by cooking
method 2 and also 1/3/1, showing similarities of these samples.
CONCLUSIONS
Triticale has high nutritional quality, containing significant amounts of protein and
fibres, vitamins and minerals. Technological processes significantly influence cereals
composition, but it depends on parameters tested. Control sample showed lower results
and hierarchical cluster analyses showed that samples 1/3/1, 2/1/2/1, 2/1/3/1, 2/1/4/1 are
similar in composition of bioactive compounds. Generally better results showed samples
prepared by cooking method 2 with adding of extra water and after that samples were
steamed and cooked 30 ±5 min at 1.2 bar pressure. Results showed that for selection of
the best method for flaking physical and/or sensory properties should be taken in
account.
ACKNOWLEDGEMENTS. The present
research leading to these results in accordance
with the contract No. 1.2.1.1/16/A/004
between ‘Latvian Food Competence Centre’
Ltd. and the Central Finance and Contracting Agency (11.11.2016), the study is conducted by
‘Felici’ Ltd. with support from the European Regional Development Fund (ERDF) within the
framework of the project ‘Latvian Food Industry Competence Centre’.

1424
REFERENCES
Barton, B.A., Eldridge, A.L., Thompson, D., Affenito, S.G. & Striegel-Moore, R.H.,
Franko, D.L., Albertson, A.M. & Crockett, S.J. 2005. The relationship of breakfast and
cereal consumption to nutrient intake and body mass index. Journal of the American
Dietetic Association 105(9), 1383–1389.
Cardoso, L. de M., Montini, T.A., Pinheiro, S.S., Pinheiro-Sant’Ana, H.M., Martino, H.S.D. &
Moreira, A.V.B. 2014. Effects of processing with dry heat and wet heat on the antioxidant
profile of sorghum. Food Chemistry 152, 210–217.
Fardet, A. 2014. How can both the health potential and sustainability of cereal products be
improved? A French perspective. Journal of Cereal Science 60(3), 540–548.
Fraś, A., Gołębiewska, K., Gołębiewski, D., Mańkowski, D.R., Boros, D. & Szecówka, P. 2016.
Variability in the chemical composition of triticale grain, flour and bread. Journal of Cereal
Science 71, 66–72.
Irakli, M.N., Samanidou, V.F., Biliaderis, C.G. & Papadoyannis, I.N. 2012. Development and
validation of an HPLC-method for determination of free and bound phenolic acids in
cereals after solid-phase extraction. Food Chemistry 134(3), 1624–1632.
Kruma, Z., Tomsone, L., Kince, T., Galoburda, R., Senhofa, S., Sabovics, M. & Sturite, I. 2016.
Effects of germination on total phenolic compounds and radical scavenging activity in hull-
less spring cereals and triticale. Agronomy Research 14(S2), 1372–1383.
Mota, C., Cláudia, A., Santos, M., Delgado, I., Coelho, I., Rego, A. & Castanheira, I. 2016. The
effect of cooking methods on the mineral content of quinoa (Chenopodium quinoa),
amaranth (Amaranthus sp.) and buckwheat (Fagopyrum esculentum), Journal of Food
Composition and Analysis 49, 57–64.
Nurit, E., Lyan, B. & Pujos-Guillot, E. 2016. Change in B and E vitamin and lutein, β -sitosterol
contents in industrial milling fractions and during toasted bread production, Journal of
Cereal Science 69, 290–296.
Oliveira, L.C., Alencar, N.M.M. & Steel, C.J. 2018. Improvement of sensorial and technological
characteristics of extruded breakfast cereals enriched with whole grain wheat fl our and
jabuticaba (Myrciaria cauli flora) peel. LWT - Food Science and Technology 90, 207–214.
Rakha, A., Åman, P. & Andersson, R. 2011. Dietary fiber in triticale grain: Variation in content,
composition, and molecular weight distribution of extractable components. Journal of
Cereal Science 54(3), 324–331.
Ryan, L., Thondre, P.S. & Henry, C.J.K. 2011. Oat-based breakfast cereals are a rich source of
polyphenols and high in antioxidant potential. Journal of Food Composition and Analysis
24(7), 929–934.
Rolls, B.J., Meengs, J.S. & Roe, L.S. 2014. Variations in cereal volume affect the amount
selected and eaten for breakfast. Journal of the Academy of Nutrition and Dietetics 114(9),
1411–1416.
Senhofa, S., Straumite, E., Sabovics, M., Klava, D., Galoburda, R. & Rakcejeva, T. 2015. The
effect of packaging type on quality of cereal muesli during storage. Agronomy Research
13(4), 1064–1073.
Sumczynski, D., Koubová, E., Sneyd, J., Erb-weber, S. & Orsavová, J. 2018. Preparation of non-
traditional Dickkopf and Richard wheat flakes: Phenolic and vitamin profiles and
antioxidant activity. LWT - Food Science and Technology 90, 31–37.
Thomas, R.G., Pehrsson, P.R., Ahuja, J.K.C., Smieja, E. & Miller, K.B. 2013. Recent trends in
rReady-to-eat breakfast cereals in the U.S. Procedia Food Science 2, 20–26.
Zhu, F. 2018. Triticale : Nutritional composition and food uses, Food Chemistry 241, 468–479.

1425
Agronomy Research 16(S2), 1425–1434, 2018
https://doi.org/10.15159/AR.18.042
Flavonoids and total phenolic content in extruded buckwheat
products with sweet and salty taste
G. Krumina–Zemture1,*, I. Beitane1 and I. Cinkmanis2
1Latvia University of Life Sciences and Technologies, Faculty of Food Technology,
Department of Nutrition, Riga street 22, LV–3004, Jelgava, Latvia 2Latvia University of Life Sciences and Technologies, Faculty of Food Technology,
Department of Chemistry, Liela street 2, LV–3001, Jelgava, Latvia *Correspondence: [email protected]
Abstract. The aim of research was to evaluate the effect of added ingredients used for taste
improvement on flavonoids and total phenolic content in extruded buckwheat products. The
added ingredients were – sugar, vanilla sugar, stevia, agave syrup, cinnamon, caraway, garlic
powder, sweet pepper powder and salt. Six extruded buckwheat products were analysed, where
an extruded buckwheat product without added ingredients was a control sample, two extruded
buckwheat products were with sweet taste and three products with salty taste. Total phenolic
content was determined using the modified Folin–Ciocalteu method but flavonoid content
according to LC-TOF-MS method.
The highest total phenolic content (p < 0.05) was determined in extruded buckwheat product with
vanilla sugar + stevia (91.17 ± 0.67 GAE mg 100g-1DW). It was almost three times higher than
in the control sample. The significant differences were observed in extruded buckwheat products
with caraway + salt + agave syrup (41.5 ± 0.12 GAE mg 100g-1DW) and sweet pepper powder +
salt + agave syrup (42.39 ± 0.80 GAE mg 100g-1DW) comparing to other extruded products
(p < 0.05). The highest content of rutin and quercetin (p < 0.05) was established in extruded
buckwheat product with garlic powder + salt + agave syrup, whereas the highest content of
catechin and epicatechin – in extruded buckwheat product with vanilla sugar + stevia. The
extruded buckwheat product with caraway + salt + agave syrup in addition contained luteolin,
kaempferol and isoquercitrin. The results of research showed that some added ingredients used
for taste improvement can significantly influence the total phenolic content and flavonoid content.
Key words: buckwheat, extrusion, flavonoids, total phenolic content.
INTRODUCTION
Buckwheat is an alternative crop with high consumption in countries like China,
Japan and Taiwan due to its functional food properties and biological value – great
concentration of bio–active compounds such as phenols and flavonoids (Lin et al., 2009;
Inglett et al., 2010; Qin et al., 2010; Zhang et al., 2012; Vollmannova et al., 2013). The
diverse total phenolic content of buckwheat is reported in literature, the differences of
results establish buckwheat species: common (Fagopyrum esculentum Moench) or
tartary (Fagopyrum tataricum Gaertn); cultivars, growth conditions and technological
production process. Mikulajeva et al. (2016) analysed 22 common buckwheat cultivars,
1426
which total phenolic content ranged between 0.897 and 4.226 mg GAE g-1 DW. Unal et
al. (2017) reported about significant differences of total phenolic content between
commercial buckwheat (produced in Kazakhstan) and Günes variety (produced in
Turkey) – 207.12 ± 2.67 and 329.83 ± 3.88 mg GAE 100 g-1, respectively. The diverse
results about flavonoids content like rutin can be found in literature, too. Mikulajova et
al. (2016) established rutin content in common buckwheat cultivars between
59.93 ± 2.16 and 304.45 ± 5.45 µg g-1 DW, whereas Vollmannova et al. (2013) –
between 309.97 ± 10.84 and 507.78 ± 17.11 mg kg-1 DW.
The increase of buckwheat consumption in Latvia could be possible by production
of new buckwheat products. In Asian countries and Italy there are buckwheat noodles,
in Latvia there could be some buckwheat snacks using extrusion. There is not a single
view about the effect of processing on phenolic and flavonoid content in buckwheat.
Zielinska et al. (2007) and Wronkowska et al. (2015) concluded significant differences
of phenolic compounds in raw and roasted buckwheat groats, whereas Hes et al. (2014)
did not establish any negative effect on the nutritional properties in buckwheat groats
after 30 min boiling in water. Sensoy et al. (2006) determined insignificant decrease of
total phenolic content in dark buckwheat flour after roasting (200 °C, 10 min), whereas
antioxidant activity was significantly lower in roasted dark buckwheat flour comparing
to raw dark buckwheat flour. Our previous research (Beitane et al., 2018) showed
significant decrease of total phenolic content, antiradical activity, radical scavenging
activity and phenolic compounds concentration in buckwheat after extrusion.
In production of new products their taste has got important role, which could be
improved with several ingredients. Furthermore the added ingredients used for taste
improvement can affect the nutritional and biological value of the final product. In this
research the added ingredients for taste improvement of extruded buckwheat products
were sugar, vanilla sugar, stevia, agave syrup, cinnamon, caraway, garlic powder, sweet
pepper powder and salt. The brief description of used ingredients and their importance
in food product production is given below.
Vanillin is the most used flavour in the food industry with antimicrobial and
antioxidant properties (Zabkova et al., 2006).
Stevia rebaudiana or steviol glycosides are thermally stable and natural sweeteners
with high sweetening potential, which are successfully used in cocoa and chocolate
products, in chewing gums, flour or starch–based snacks etc. to reduce sugar
consumption in the industrialized countries (Olsson et al., 2016; Shannon et al., 2016).
Agave syrup is a natural sweet product with functional properties due to biological
active compounds, prebiotic molecules and antioxidant content, which is used as sugar
replacement due to low glycaemic index (Foster–Powell et al., 2002; Phillips et al., 2009;
Mellado–Mojica & Lopez, 2015, Muniz–Marquez et al., 2015).
Cinnamon is a culinary spice with anti–oxidant properties and free radical
scavenging activity, which is used in traditional Chinese medicine and which has
beneficial effects on serum glucose, triglyceride and total cholesterol level in diabetic
patients (Parkash et al., 2007; Crawford, 2009; Otto, 2010; Adisakwattana et al., 2011).
Caraway is the most cultivated spice in Europe with wide use in folk medicine
(Ghoneem et al., 2016; Kluz et al., 2016). Particular attention in scientific researches is
paid to caraway essential oil with the main components – carvone and limonene
(Ghoneem et al., 2016).

1427
Garlic is a vegetable, which is known worldwide, with anti–bacterial and anti–
fungal properties, high flavonoids content, especially quercetin, and antioxidant capacity
(Griffiths et al., 2002; Beato et al., 2011; Onyeoziri et al., 2016).
Sweet pepper is a vegetable with high content of vitamins, carotenoids and phenols,
which could be included in daily diet or used as additive in food production or in
traditional medicine (Marti et al., 2011; Hernandez–Ortega et al., 2012; Sharma et al.,
2016; Raybaudi–Massilia et al., 2017)
The aim of research was to evaluate the effect of added ingredients used for taste
improvement on flavonoids and total phenolic content in extruded buckwheat products.
MATERIALS AND METHODS
Materials Raw common buckwheat (Fagopyrum esculentum Moench) grown in Latvia in
2017, was produced by the organic farm ‘Bebri’.
The added ingredients for taste improvement of extruded buckwheat products were
purchased in grocery: sugar (Dan Sukker, Denmark), vanilla sugar produced from sugar
and flavouring material vanillin (Mood, Lithuania), stevia (Canderel, The Czech
Republic), agave syrup (Super Garden, Mexico), cinnamon (Santa Maria, Estonia),
caraway (Santa Maria, Estonia), garlic powder (Kotanyi, Austria), sweet pepper powder
(Santa Maria, Estonia) and salt (Artiomosol, Ukraine).
Dough preparation for extrusion
Raw buckwheat grain was milled using Mühle 2 (Hawo’s, Germany) to obtain
whole grain flour. Buckwheat flour with added ingredients and water was mixed with
Sirman Planetary Mixers, model Pluton 10 (Minneapolis, Italy). The added ingredients
for taste improvement of extruded buckwheat products were sugar, vanilla sugar, stevia,
agave syrup, cinnamon, caraway, garlic powder, sweet pepper powder and salt. Six
different doughs were prepared (Table 1), where buckwheat dough without added
ingredients was prepared as control, two doughs were with sweet taste (vanilla sugar +
stevia; sugar + cinnamon) and three – with salty taste (caraway + salt + agave syrup;
garlic powder + salt + agave syrup; sweet pepper powder + salt + agave syrup).
Table 1. The formation of dough and abbreviations in buckwheat products
Control B+VS B+SC B+CSA B+GSA B+PSA
Buckwheat flour, g 100 100 100 100 100 100
Water, mL 75 75 75 75 75 75
Sugar, g – – 5 – – –
Vanilla sugar, g – 5 – – – –
Stevia, g – 4 – – – –
Agave syrup, g – – – 5 5 5
Cinnamon, g – – 3 – – –
Caraway, g (milled) – – – 5 – –
Garlic powder, g – – – – 1.5 –
Sweet pepper powder, g – – – – – 5
Salt, g – – – 1.5 1.5 1.5

1428
Extrusion
The prepared buckwheat doughs with different tastes were extruded with the food
extruder PCE Extrusiometer L–Serie (Göttfert, Germany) by temperature profile
75/90/100 °C. After extrusion the products were cut in squares of 1 cm, dried in the
convective–rotary oven (SVEBA DAHLAN, Sweden) at the temperature 140 ± 2 °C for
25 min and cooled to room temperature. Afterwards, six acquired extruded buckwheat
products were used for further analysis.
Methods
Total phenolic content (TPC) of added ingredients for taste improvement and
extruded buckwheat products was determined using the modified Folin–Ciocalteu
method as described by Herald et al. (2012). The measurement was conducted by mixing
Folin–Ciocalteu solution (1:1 with water), sodium bicarbonate and ethanolic extract. The
absorbance was measured after 90 min of incubation at 765 nm againts a blank. TPC
was expressed as gallic acid equivalents (GAE mg 100 g-1 DW), based on the gallic acid
(GA) calibration curve (range 0.025–0.20 mg mL-1, R2 = 0.9997). Analyses were
performed with the Infinite M200 PRO (Tecan Group Ltd., Männedorf, Switzerland)
instrument in triplicate. The bandwidth was 9 mm and temperature 24 °C.
Determination of flavonoid content in extruded buckwheat products was made with
the Liquid Chromatography – Time of Flight Mass Spectrometer (LC–TOF–MS) as
described by Klavina et al. (2015). During LC–MS analysis, each sample produces its
own base peak chromatogram (BPC). In the positive ionization mode each compound
can add a proton and can produce its own [M+H]+ mass spectra or stay in a positively
charged state as M+ molecule. Each compound has its own chemical formula and molar
mass. This chemical formula using Mass Hunter Qualitative Analyses B.07.00 software
can be used for the calculation of [M+H]+/[M]+ which is used for the extraction of
compounds from the base peak chromatogram. Both values can be compared and the
difference (Δ) between them should not be higher than 0.0030. HRMS experiments
ensure accurate mass measurements resulting in the removal of background signals of
complex matrix interferences. It is useful for non–targeted or retrospective post–targeted
identification of unknown compounds by the processing of raw data obtained in different
scan modes, including full scan in defined m/z windows. The experimental data were
handled using the MassHunter version B07.00 software (Agilent Technologies).
The extruded buckwheat products were analysed in three replications.
Data processing
The data of research were analysed using mathematical and statistical methods of
Microsoft Office Excel 14.0. To determine the significant differences between the mean
values were used the analyses of variance (ANOVA), T–test and P–value at 0.05.
RESULTS AND DISCUSSION
The total phenolic content (TPC) of ingredients used for taste improvement in
extruded buckwheat products is given in Table 2.
The obtained data allows better to understand and explain the results of current
research.

1429
Table 2. Total phenolic content in extruded buckwheat products with different taste
Ingredients for taste improvement TPC, GAE mg 100 g-1
Sugar n.d.
Vanilla sugar 125.86 ± 6.09
Stevia n.d.
Agave syrup 26.68 ± 2.17
Cinnamon, g 1,534.07 ± 34.18
Caraway 202.62 ± 7.39
Garlic powder 51.60 ± 1.78
Sweet pepper powder 285.47 ± 8.01
Salt n.d.
n.d. – not detected.
The extruded buckwheat products with sweet and salty taste displayed higher TPC
as control sample (Fig. 1). It means that in generally the added ingredients for taste
improvement of extruded buckwheat products had favourable effect on TPC. However
statistically significant differences were observed between control and extruded
buckwheat products with vanilla sugar + stevia; caraway + salt + agave syrup and sweet
pepper powder + salt + agave syrup.
Figure 1. Total phenolic content in extruded buckwheat products with different taste. Used letters (a, b, c) point to statistically significant difference between buckwheat products (P < 0.05).
The highest TPC (P < 0.05) was determined in extruded buckwheat product with
vanilla sugar + stevia (91.17 ± 0.67 GAE mg 100 g-1 DW). The impressive increase of
TPC in extruded buckwheat product with vanilla sugar + stevia could be explained with
added vanilla sugar. The results of current research (Table 2) showed, that vanilla sugar
had a high total phenolic content (125.86 ± 6.09 GAE mg 100 g-1), whereas in stevia it
was not detected at all. There are not researches in literature about content of possible
phenolic compounds in vanilla sugar. Only Burri et al. (1989) concluded that vanillin
34.14c
91.17a
35.06c
41.50b
35.16c
42.39b
0 10 20 30 40 50 60 70 80 90 100
Control
B+VS
B+SC
B+CSA
B+GSA
B+PSA
GAE mg 100 g-1 DW

1430
acts as an antioxidant in products of cereals. There are necessary profound researches
about vanilla sugar, but it could be concluded, that the addition of vanilla sugar to
extruded buckwheat product provided significant increase of TPC.
The great TPC (P < 0.05) in comparison to control was determined in extruded
buckwheat products with caraway + salt + agave syrup and sweet pepper powder + salt
+ agave syrup, too. The increase of TPC in extruded buckwheat products could be based
on addition of caraway and sweet pepper powder, because both presented great TPC
(202.62 and 285.47 GAE mg 100 g-1, respectively). Sharma et al. (2016) reported about
high total phenolic content in red sweet pepper, which varied between 488.81 ± 8.18 and
977.63 ± 25.40 µg GAE g-1 FW (fresh weight). It is known that production process of
sweet pepper powder can markedly affect the total phenolic and flavonoid content,
however it is rich source of phenols. Shotorban et al. (2012) indicated that different
processing techniques can significantly affect the content of bioactive compounds like
polyphenols. Therefore the increase of TPC in extruded buckwheat product with sweet
pepper powder + salt + agave syrup was not so marked. The other reason for increase of
TPC in extruded buckwheat products with salty taste could be related with addition of
agave syrup. Agave syrup is produced from agave plant and it rightly pointed to the
presence of TPC in agave syrup (26.68 GAE mg 100 g-1). Unfortunately, the few
researches in literature about agave syrup chemical composition are focused on sugar
composition.
The extruded buckwheat products with added sugar + cinnamon and garlic powder
+ salt + agave syrup did not provide expected increase of TPC, though cinnamon had the
greatest total phenolic content among the added ingredients for taste improvement. It
could be explained with the small amount of added cinnamon to dough, and extrusion,
which had adverse effects on total phenolic content according to previous research
(Beitane et al., 2018).
Extruded buckwheat product with garlic powder + salt + agave syrup had
significantly greater concentration of rutin and quercetin (P<0.05) comparing to other
products (Table 3).
Table 3. Flavonoids content in extruded buckwheat products with different taste, mg 100 g-1 DW
Rutin Quercetin Catechin Epicatechin
Control 5.51 ± 0.72b 1.48 ± 0.13b 3.97 ± 0.23a 7.36 ± 0.62a
B+VS 6.75 ± 0.81b 1.68 ± 0.12b 4.45 ± 0.26a 8.02 ± 0.69a
B+SC 6.72 ± 0.77b 1.59 ± 0.19b 4.01 ± 0.20a 6.24 ± 0.48b
B+CSA 5.35 ± 0.90b 1.28 ± 0.21b 2.20 ± 0.18b 4.20 ± 0.33c
B+GSA 8.99 ± 0.69a 2.27 ± 0.17a 2.47 ± 0.17b 7.26 ± 0.52a
B+PSA 5.90 ± 0.72b 1.52 ± 0.11b 2.65 ± 0.22b 5.07 ± 0.66c
Mean values with different letters (a, b, c) within a column point to statistically significant difference
between buckwheat products (P < 0.05).
The increase of quercetin concentration in extruded buckwheat product with garlic
powder + salt + agave syrup could be based on literature, where Griffiths et al. (2002)
reported about high content of flavonoids, especially, quercetin and its conjugates in
garlic; Miean & Mohamed (2001) determined relatively high content of quercetin –
47.0 mg kg-1 DW, myricetin – 693.0 mg kg-1 DW and apigenin – 217.0 mg kg-1 DW in
garlic. The extruded buckwheat products with garlic powder + salt + agave syrup
1431
contained great concentration of rutin in the present study. It could be due to the presence
of added garlic powder and agave syrup, because both presented the content of phenols.
Scientific reports about flavonoids composition in garlic did not provide any information
about rutin concentration. However the conclusions of researches about flavonoids
content in garlic are contrary, for example Beato et al. (2011) did not detect myricetin,
quercetin, kaempferol and apigenin in garlic. Therefore it cannot exclude the possibility
that the addition of garlic powder provided the increase of rutin content in extruded
buckwheat product with garlic powder + salt + agave syrup. The aim of current research
was not to evaluate the flavonoid content of added ingredients, therefore it could be
investigate in the following research. It was positive that all products except extruded
buckwheat product with caraway + salt + agave syrup had rutin and quercetin
concentration higher than control sample.
The greatest concentration of catechin and epicatechin was observed in extruded
buckwheat product with vanilla sugar + stevia. Product which had the highest TPC, too.
Catechin concentration among extruded buckwheat product with vanilla sugar + stevia,
control sample and extruded buckwheat product with sugar + cinnamon was
insignificant (P > 0.05) as well as epicatechin concentration was insignificant among
extruded buckwheat product with vanilla sugar + stevia, control sample and extruded
buckwheat product with garlic powder + salt + agave syrup (P > 0.05).
The extruded buckwheat product with caraway + salt + agave syrup in addition
contained luteolin – 0.24 mg 100 g-1 DW, kaempferol – 0.46 mg 100 g-1 DW and
isoquercitrin – 1.55 mg 100 g-1 DW. Isoquercitrin was detected in extruded buckwheat
products with garlic powder + salt + agave syrup and sweet pepper powder + salt + agave
syrup (0.22 and 0.35 mg 100 g-1 DW, respectively).
The extruded buckwheat product with sugar + cinnamon showed insignificant
results about TPC, rutin, quercetin and catechin content comparing to control sample,
except epicatechin content, which was significantly lower. The addition of cinnamon did
not give the expected result, though Adisakwattana et al. (2011) reported that in
cinnamon extract the TPC varied between 0.17–0.21 g GAE g-1 and flavonoids content
– between 48.85–65.52 mg QE g-1.
CONCLUSIONS
The aim to produce new buckwheat product with increased nutritional value was
achieved, because some added ingredients used for taste improvement can significantly
influence the total phenolic content and flavonoid content. However there is a need for
further researches to understand and explain how and why the added ingredients
affected/not affected the total phenolic and flavonoid content in extruded buckwheat
products.
ACKNOWLEDGEMENTS. This research was supported by National Research Programme
AgroBioRes (2014–2017) and the project ‘Strengthening Research Capacity in the Latvia
University of Agriculture’.

1432
REFERENCES
Adisakwattana, S., Lerdsuwankij, O., Poputtachai, U., Minipun, A. & Suparpprom, C. 2011.
Inhibitory activity of cinnamon bark species and their combination effect with acarbose
against intestinal α–glucosidase and pancreatic α–amylase. Plant Foods for Human
Nutrition 66, 143–148.
Beato, V.M., Orgaz, F., Mansilla, F. & Montano, A. 2011. Changes in phenolic compounds in
garlic (Allium sativum L.) owing to the cultivar and location of growth. Plant Foods for
Human Nutrition 66, 218–223.
Beitane, I., Krumina–Zemture, G & Sabovics, M. 2018. Effect of germination and extrusion on
the phenolic content and antioxidant activity of raw buckwheat (Fagopyrum esculentum
M.). Journal Agronomy Research 16. (Accepted for publication)
Burri, J., Graf, M., Lambelet, P. & Loliger, J. 1989. Vanillin – more than a flavouring agent – a
potent antioxidant. Journal of the Science of Food and Agriculture 48, 49–56.
Crawford, P. 2009. Effectiveness of cinnamon for lowering haemoglobin A1C in patients with
type 2 diabetes: A randomized, controlled trial. The Journal of the American Board of
Family Medicine 22, 507–512.
Foster–Powell, K., Holt, S.H.A. & Brand–Miller, J.C. 2002. International table of glycemic index
and glycemic load values: 2002. The American Journal of Clinical Nutrition 76, 5–56.
Ghoneem, K.M., Saber, W.I.A., El–Awady, A.A., Rashad, Y.M. & Al–Askar, A.A. 2016.
Alternative preservation method against Sclerotium tuber rot of Jerusalem artichoke using
natural essential oils. Phytoparasitica 44, 341–352.
Griffiths, G.F., Trueman, C.T., Thomas, B.M. & Smith, B.M. 2002. Onions, a global benefits to
health. Phytotherapy Research 16, 603–615.
Herald, T.J., Gadgil, P. & Tilley, M. 2012. High-throughput micro plate assays for screening
flavonoid content and DPPH-scavenging activity in sorghum bran and flour. Journal of the
Science of Food and Agriculture 92, 2326–2331.
Hernandez–Ortega, M., Ortiz–Moreno, A., Hernandez–Navarro, M.D., Chamorro–Cevallos, G.,
Dorantes–Alvarez, L. & Necoechea–Mondragon, H. 2012. Antioxidant, antinociceptive,
and anti–inflammatory effects of carotenoids extracted from dried pepper (Capsicum
annuum L.). Journal of Biomedicine and Biotechnology, 1–10. DOI:10.1155/2012/524019
Hes, M., Dziedzic, K., Gorecka, D., Drozdzynska, A. & Gujska, E. 2014. Effect of boiling in
water of barley and buckwheat groats on the antioxidant properties and dietary fiber
composition. Plant Foods for Human Nutrition 69, 276–282.
Inglett, G.E., Rose, D.J., Chen, D., Stevenson, D.G. & Biswas, A. 2010. Phenolic content and
antioxidant activity of extracts from whole buckwheat (Fagopyrum esculentum Moench)
with or without microwave irradiation. Food Chemistry 119, 1216–1219.
Klavina, L., Springe, G., Nikolajeva, V., Martsinkevich, I., Nakurte, I., Dzabijeva, D.,
Steinberga, I. 2015. Chemical composition of analysis, antimicrobial activity and
cytotoxicity screening of moss extracts (Moss phytochemistry). Molecules 20(9), 17221–
17243.
Kluz, M., Terentjeva, M., Puchalski, C., Hutkova, J., Kantor, A., Petrova, J., Mellen, M.,
Cubon, J., Hascik, P., Kordiaka, R., Kunova, S. & Kacaniova, M. 2016. The extension of
shelf–life of chicken meat after application of caraway and anise essential oils and vacuum
packaging. Potravinarstvo 10(1), 132–138.
Lin, L.Y., Liu, H.M., Yu, Y.W., Lin, S.D. & Mau, J.L. 2009. Quality and antioxidant property of
buckwheat enhanced wheat bread. Food Chemistry 112, 987–991.
1433
Marti, M.C., Camejo, D., Vallejo, F., Romojaro, F., Bacarizo, S., Palma, J.M., Sevilla, F. &
Jimenez, A. 2011. Influence of fruit ripening stage and harvest period on the antioxidant
content of sweet pepper cultivars. Plant Foods for Human Nutrition 66, 416–423.
Mellado–Mojica, E. & Lopez, M. 2015. Identification, classification, and discrimination of agave
syrups from natural sweeteners by infrared spectroscopy and HPAEC–PAD. Food
Chemistry 167, 349–357.
Miean, K.H. & Mohamed, S. 2001. Flovonoid (myricetin, quercetin, kaempferol, luteolin, and
apigenin) content of edible tropical plants. Journal of Agricultural and Food Chemistry 49,
3106–3112.
Mikulajova, A., Sediva, D., Hybenova, E. & Mosovska, S. 2016. Buckwheat cultivars – phenolic
compounds profiles and antioxidant properties. Acta Chimica Slovaca 9, 124–129.
Muniz–Marquez, D.B., Contreras, J.C., Rodriguez, R., Mussatto, S.I., Wong–Paz, J.E.,
Teixeira, J.A. & Aguilar, C.N. 2015. Influence of thermal effect on sugars composition of
Mexican Agave syrup. Journal of Food 13, 607–612. Olsson, K., Carlsen, S., Semmler, A., Simon, E., Mikkelsen, M.D. & Moller, B.L. 2016.
Microbial production of next-generation stevia sweeteners. Microbial Cell Factories
15(207), 1–14. DOI 10.1186/s12934–016-0609–1
Onyeoziri, U.P., Romanus, E.N. & Onyekachukwu, U.I. 2016. Assessment of antioxidant
capacities and phenolic contents of Nigerian cultivars of onions (Allium cepa L.) and garlic
(Allium sativum L.). Pakistan Journal of Pharmaceutical Sciences 29, 1183–1188.
Otto, A.D. 2010. Cinnamon as a supplemental treatment for impaired glucose tolerance and type
2 diabetes. Current Diabetes Reports 10, 170–172.
Parkash, D., Suri, S., Upadhyay, G. & Singh, B.N. 2007. Total phenol, antioxidant and free
radical scavenging activities of some medicinal plants. International Journal of Food
Sciences and Nutrition 58, 18–28.
Phillips, K.M., Carlsen, M.H. & Blomhoff, R. 2009. Total antioxidant content of alternatives to
refined sugar. Journal of the American Dieteric Association 109, 64–71.
Qin, P., Wang, Q., Shan, F., Hou, Z. & Ren, G. 2010. Nutritional composition and flavonoids
content of flour from different buckwheat cultivars. International Journal of Food Science
and Technology 45, 951–958.
Raybaudi–Massilia, R., Suarez, A.I., Arvelo, F., Zambrano, A., Sojo, F., Calderon–
Gabaldon, M.I. & Mosqueda–Melgar, J. 2017. Cytotoxic, antioxidant and antimicrobial
properties of red sweet pepper (Capsicum Annuum L. var. Llaneron) Extracts: In vitro study.
International Journal of Food Studies 6, 222–231.
Sensoy, I., Rosen, R.T., Ho, C.T. & Karwe, M.V. 2006. Effect of processing on buckwheat
phenolics and antioxidant activity. Food Chemistry 99, 388–393.
Shannon, M., Rehfeld, A., Frizzell, C., Livingstone, C., McGonagle, C., Skakkebaek, N.E.,
Wielogorska, E. & Connolly, L. 2016. In vitro bioassay investigations of the endocrine
disrupting potential of steviol glycosides and their metabolite steviol, components of the
natural sweetener Stevia. Molecular and Cellular Endocrinology 427, 65–72.
Sharma, V.K., Chandel, C., Kumar, R., Meena, R.D. & Mawliya, M. 2016. Influence of planting
time and fruit maturity stage on antioxidant activity, phenols and anthocyanin contents in
sweet pepper. Research on Crops 17, 360–368.
Shotorban, N.I.Y., Jamei, R. & Heidari, R. 2012. Antioxidant activities of two sweet pepper
Capsicum annuum L. varieties phenolic extracts and the effects of thermal treatment.
Avicenna Journal of Phytomedicine 3, 25–34.
Unal, H., Izli, G., Izli, N. & Asik, B.B. 2017. Comparison of some physical and chemical
characteristics of buckwheat (Fagopurym esculentum Moench) grains. CYTA – Journal of
Food 15, 257–265.

1434
Vollmannova, A., Margitanova, E., Toth, T., Timoracka, M., Urminska, D., Bojnanska, T. &
Cicova, I. 2013. Cultivar influence on total polyphenol and rutin contents and total
antioxidant capacity in buckwheat, amaranth, and quinoa seeds. Czech Journal of Food
Sciences 31, 589–595.
Wronkowska, M., Honke, J. & Piskula, M.K. 2015. Effect of solid-state fermentation with
Rhizopus oligosporus on bioactive compounds and antioxidant capacity of raw and roasted
buckwheat groats. Italian Journal of Food Science 27, 424–431.
Zabkova, M., Otero, M., Minceva, M., Zabka, M. & Rodrigues A.E. 2006. Separation of
synthetic vanillin at different pH onto polymeric adsorbent Sephabeads SP206. Chemical
Engineering and Processing 45, 598–607.
Zhang, Z.L., Zhou, M.L., Tang, Y., Li, F.L., Tang, Y.X., Shao, J.R., Xue, W.T. & Wu, Y.M.
2012. Bioactive compounds in functional buckwheat food. Food Research International 49,
389–395.
Zielinska, D., Szawara–Nowak, D. & Zielinski, H. 2007. Comparison of spectrophotometric and
electrochemical methods for the evaluation of the antioxidant capacity of buckwheat
products after hydrothermal treatment. Journal of Agricultural and Food Chemistry 55,
6124–6131.
1435
Agronomy Research 16(S2), 1435–1443, 2018
https://doi.org/10.15159/AR.18.048
Development of the composition and technology of the frozen
dessert without sugar, using sesame flour
M.V. Lugova and T.P. Arseneva*
Saint Petersburg National Research University of Information Technologies, Mechanics
and Optics, Department of Applied Biotechnology, Lomonosova street 9, RU191002
St. Petersburg, Russia *Correspondence: [email protected]
Abstract. The article presents the results of the analysis of the entry dose of stevioside,
topinambur syrup, sesame flour and the type of stabilizer added to the milk ice cream formula,
theoretically calculated, using solids according to GOST 31457-2012 for development of a
functionally oriented dessert with low content of fat and without sugar. It has been established
that the entry dose of the stevioside and the topinambur syrup in an amount of 0.03 and 5%
respectively to the mixture mass of the frozen dessert allows us to get the product with pleasant
flavor and scent. The use of the PGX-1 stabilizer (Germany) with an entry dose of 0.4 to the
mixture mass allows us to get the product with the best indicators for whipping, thawing
resistance, density and uniformity of consistency. It has been determined that the entry dose of
sesame flour added to the mixture mass varies from 1.5 to 2%. It is expedient to put it into the
normalize mixture after the process of homogenization before milling, pre-brewing with water in
the ratio of 1:10 for 15–20 minutes to humidity (80 ± 1) %. It has been found that the expiration
date of the frozen dessert without sugar with the use of sesame flour is 6 months at a temperature
of – 18 °C.
Key words: frozen dessert, topinambur syrup, stevioside, stabilizer, sesame flour, prophylactic
and functional products.
INTRODUCTION
A hot topic in the food industry is the creation of dietary, therapeutic food products
of functional orientation with low content of fat, without sugar, with innovative useful
additives to prevent the diseases connected with malnutrition of children and adults and
to protect and promote the health of the population. The problem of diabetes is
alarmingly increasing (Saad et al., 2013). According to preliminary data, there were
4,418,305 patients with diabetes in the Russian Federation in 2015 and every year the
number increases. For this reason, the development of the technology of the frozen low-
fat desserts without sugar, without sugar, with sesame flour for diabetics and people with
obesity and calcium deficiency is a relevant and timely aim.
Stevioside is a glycoside from an extract of Stevia plants. In comparison with
sucrose, stevioside is 250–300 times more sweet. As a result of a patent and information
search, stevioside and topinambur syrup were chosen as a sugar substitute (Erashova &
1436
Pavlova, 1997; Arseneva & Yakovleva, 2012; Ozdemir et al., 2015). Stevia extract
contains over 70 chemical elements, providing its unique therapeutic and prophylactic
properties, flavonoids, soluble chlorophyll and xanthophyll, oxycinnamic acids (coffee,
chlorogenic, etc.), neutral water-soluble oligosaccharides, free sugar, 17 amino acids
(including 8, which are indispensable), fiber, tannins, essential oil (containing 53
components), mineral compounds, vitamins A, B, C, D, E, K, P, PP, trace elements: iron,
zinc, phosphorus, potassium, magnesium, calcium, selenium, sodium, iodine, emulsified
fat, saponins and other components, including silver (0.0006 mg mL-1), which ensures
the antimicrobial properties of the Stevia extract (Arseneva, 2011a).
Stevioside is a harmless natural sugar substitute of low energy value without
mutagenic and carcinogenic features, non-toxic, heat-resistant, stable in acid and alkalis.
It does not require a large dosage and is harmless with a long-term use. Stevioside is
used for the prevention and treatment of type 1 and type 2 diabetes.
Topinambur syrup has a sweet taste due to the fructans of rare polymers, which act
on humans differently than glucose and fructose than usual glucose. Fructans are
contained in a very small amount of plants. Tubers of topinambur are the absolute leaders
in their concentration (Arseneva & Yakovleva, 2011). Polysaccharide inulin, which is
contained in topinambur syrup, improves metabolism, maintains normal intestine
microflora, reduces cholesterol; pectin and fiber clear toxins and wastes from the body;
vitamins C, B1, B2 and PP and trace elements, especially biogenic silicon, iron,
magnesium, potassium, etc. strengthen joints, bones, heart, contribute to the maintenance
of immunity and health in general. Topinambur syrup glycemic index is only 13–16 gl,
which is the lowest indicator among all known sweeteners. The natural topinambur
syrup, obtained from the topinambur tubers, contains about 40% of the plant fiber, where
the sweet polymer is concentrated. This fiber gives a lasting sense of saturation, because
it does not decompose in stomach. The process of glucose releasing, so necessary for the
full brain and other body organs function, begins only in intestine (Arsenyeva, 2002;
Arsenyeva, 2011b).
In dietotherapy topinambur is recommended for diabetics, as it has a sugar-reducing
property, a beneficial effect on the pancreas. It also reduces blood pressure and increases
hemoglobin (Vozhdaeva & Sorochkina, 2000; Suhas et al., 2015). Topinambur syrup
contains prebiotics, specific substances necessary for nutrition and healthy activity of
intestinal cultures (probiotics). Biologically active topinambur substances also stimulate
heart, reduce blood pressure and level of ‘bad’ cholesterol in blood (Yakovleva, 2012).
The benefit of sesame flour is primarily due to the vitamin-mineral product
structure, which contains a wide amount of calcium and other useful compounds of
natural origin. Percent of consumption (based on 100 g of sesame per day): Food fiber –
28%; Vitamin B1 (thiamin) – 80%; Vitamin B2 – 20%; Vitamin E – 15%; Vitamin PP
– 55%; Potassium – 20%; Calcium – 140%; Magnesium – 135%; Phosphorus – 90%;
Iron – 90%. Sesame helps to strengthen the entire bone system. It contributes to the blood
vessels purification (including brain), relieves spasms, cramps and muscle pain. It also
strengthens immunity, removes toxins and gently cleanses intestine. Sesame is
recommended in case of high cholesterol level (Zhukovsky, 1997).

1437
MATERIALS AND METHODS
In this research the entry dose of stevioside, topinambur syrup, sesame flour and
the type of stabilizer added to the milk ice cream formula, theoretically calculated using
solids according to GOST 31457-2012 was determined in order to obtain a sugar-free
ice cream formula using sesame flour(Onopriyko et al., 2004; Arseneva, 2009).
The experimental samples of the frozen dessert mixture were prepared in a
laboratory in the following way: pre-mixed dry components were added to water heated
to a temperature of 35−40 °C, and were mixed until their almost complete dissolution.
The mixture was subjected to a thermal treatment at a temperature of 85 °C with
60 second extract time. Homogenization was carried out at the same temperature, the
homogenization pressure was about 10–12 MPa (Olenev et al., 2004).
Sesame flour was added to the
homogenized mixture, cooled to a
temperature of 4−6 °C, and left in a
freezer for ripening the mixture for
4−12 hours. A batch freezer was used
without forced air supplying for
freezing. Upon the completion of this
process, the temperature of the frozen
dessert was about -4−-6 °C.
Standard techniques were used in
this research to determine physico-
chemical parameters, and a score
system of the organoleptic parameters
presented in Tables 1, 2 and 3 was
developed.
The characteristics of the
sweetness and scent of the frozen
dessert are presented in Table 1 in
points.
Table 2 shows the characteristics
of organoleptic indicators (sweetness
and color) of the frozen dessert samples
in points.
Table 1. The characteristics of the sweetness
and scent of the frozen dessert
Sweetnes and scent characteristics Number
of points
Unsweetened, without stevia scent 1
Lack of sweetness, without stevia
scent
2
Not enough sweetened, stevia scent 3
Excessively sweetened, stevia scent 4
Sweetened, stevia scent 5
Table 2. The characteristics of organoleptic
indicators (sweetness and color) of the frozen
dessert samples in points
Flavor and color characteristics Number
of points
Excessively sweetened, coffee color 1
Highly sweetened, light coffee color 2
Sugary, beige color 3
Not sweetened enough, milk color 4
Pleasantly sweetened, milk color 5
The characteristic of the quality indicators was developed according to the 5-point
scale to make an organoleptic assessment of the frozen dessert samples (Table 3).
Table 3. The characteristic of the quality indicators was developed according to the 5-point scale
to make an organoleptic assessment of the frozen dessert samples
Indicator Product organoleptic characteristics Points
Consistency Homogeneous, moderately dense 5
Homogeneous, not dense 4
Heterogeneous, slightly liquid 3
Heterogeneous, excessively dense 2
Heterogeneous throughout the mass, excessively liquid 1
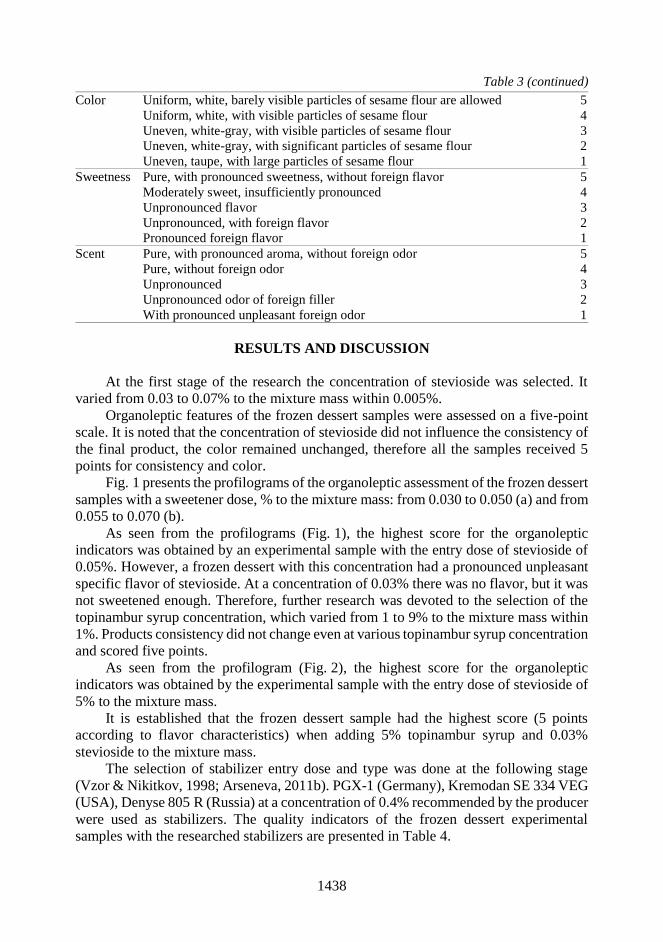
1438
Table 3 (continued)
Color Uniform, white, barely visible particles of sesame flour are allowed 5
Uniform, white, with visible particles of sesame flour 4
Uneven, white-gray, with visible particles of sesame flour 3
Uneven, white-gray, with significant particles of sesame flour 2
Uneven, taupe, with large particles of sesame flour 1
Sweetness Pure, with pronounced sweetness, without foreign flavor 5
Moderately sweet, insufficiently pronounced 4
Unpronounced flavor 3
Unpronounced, with foreign flavor 2
Pronounced foreign flavor 1
Scent Pure, with pronounced aroma, without foreign odor 5
Pure, without foreign odor 4
Unpronounced 3
Unpronounced odor of foreign filler 2
With pronounced unpleasant foreign odor 1
RESULTS AND DISCUSSION
At the first stage of the research the concentration of stevioside was selected. It
varied from 0.03 to 0.07% to the mixture mass within 0.005%.
Organoleptic features of the frozen dessert samples were assessed on a five-point
scale. It is noted that the concentration of stevioside did not influence the consistency of
the final product, the color remained unchanged, therefore all the samples received 5
points for consistency and color.
Fig. 1 presents the profilograms of the organoleptic assessment of the frozen dessert
samples with a sweetener dose, % to the mixture mass: from 0.030 to 0.050 (a) and from
0.055 to 0.070 (b).
As seen from the profilograms (Fig. 1), the highest score for the organoleptic
indicators was obtained by an experimental sample with the entry dose of stevioside of
0.05%. However, a frozen dessert with this concentration had a pronounced unpleasant
specific flavor of stevioside. At a concentration of 0.03% there was no flavor, but it was
not sweetened enough. Therefore, further research was devoted to the selection of the
topinambur syrup concentration, which varied from 1 to 9% to the mixture mass within
1%. Products consistency did not change even at various topinambur syrup concentration
and scored five points.
As seen from the profilogram (Fig. 2), the highest score for the organoleptic
indicators was obtained by the experimental sample with the entry dose of stevioside of
5% to the mixture mass.
It is established that the frozen dessert sample had the highest score (5 points
according to flavor characteristics) when adding 5% topinambur syrup and 0.03%
stevioside to the mixture mass.
The selection of stabilizer entry dose and type was done at the following stage
(Vzor & Nikitkov, 1998; Arseneva, 2011b). PGX-1 (Germany), Kremodan SE 334 VEG
(USA), Denyse 805 R (Russia) at a concentration of 0.4% recommended by the producer
were used as stabilizers. The quality indicators of the frozen dessert experimental
samples with the researched stabilizers are presented in Table 4.

1439
Figure 1. profilograms of the organoleptic assessment of the frozen dessert samples with a
sweetener dose, % to the mixture mass: from 0.030 to 0.050 (a) and from 0.055 to 0.070 (b).
Figure 2. The profilogram of organoleptic assessment of the frozen dessert samples with various
concentration of topinambur syrup in points.
0
1
2
3
4
50.030%
0.035%
0.40%0.045%
0.050%Consistency
Color
Scent
Sweetness
0
1
2
3
4
50.055%
0.060%
0.065%
0.070%
Consistency
Color
Scent
Sweetness
0
1
2
3
4
51%
2%
3%
4%
5%6%
7%
8%
9%
Color
Sweetness
Scent
Consistency
a)
b)

1440
As seen from the data presented in Table 4, the experimental samples, regardless
of the stabilizer entry, had a creamy, sweet flavor, sufficiently dense, homogeneous
consistency without any visible ice crystals, according to the organoleptic
characteristics. When using the PGX-1 stabilizer, the experimental samples had higher
whipping and thawing resistance indicators, therefore the PGX-1 stabilizer was used in
further research.
Table 4. The quality indicators of the frozen dessert experimental samples with the researched
stabilizers
It is generally accepted that it is recommended to use no more than 7 g sesame flour
per day. A portion of the final product weighing 100 g corresponds to 7% of frozen
dessert mixture mass. In this proportion, the consistency became excessively thick when
adding sesame flour to the mixture. Therefore, the amount of flour varied from 1 to 5%
to the mixture mass within 0.5%.
For an organoleptic assessment which results are presented in Table 5, 9 frozen
dessert samples with various dosage of sesame flour, % to the mixture mass (sample
1–1; 2–1.5; 3–2; 4–2.5; 5–3; 6–3.5; 7–4; 8–4.5; 9–5), were offered to a group of 8 people
aged 23–26 (graduate students in the 1st and 2nd years of studies).
Table 5. Results of organoleptic assessment of 9 frozen dessert samples with various dosage of
sesame flour, % to the mixture mass (sample 1–1; 2–1.5; 3–2; 4–2.5; 5–3; 6–3.5; 7–4; 8–4.5; 9–5)
Sample
number
Assessment (points) Points in total
Color Scent Consistency Flavor
№ 1 4.9 4.8 4.8 4.9 19.4
№ 2 4.9 5.0 4.9 4.9 19.7
№ 3 4.9 4.9 4.9 5 19.7
№ 4 4.8 4.8 4.5 4.8 18.9
№ 5 4.8 4.8 4.3 4.8 18.7
№ 6 4.8 4.0 4.3 4.8 17.9
№ 7 4.6 4.0 3.5 4.3 16.4
№ 8 4.6 4.0 3.4 4.3 16.3
№ 9 4.5 4.0 3.4 4.3 16.2
Indicators
Stabilizer entry type
PGX-1 (Germany) Kremodan SE 334 VEG
(USA)
Denyse 805 R
(Russia)
Organoleptic:
Sweetness
Scent
Consistency
Creamy
Sweet
Gentle and moderately
dense consistency,
homogeneous without
any visible ice crystals
Creamy
Sweet
Sufficiently dense
consistency, homogeneous
without any visible ice
crystals
Creamy
Sweet
Moderately dense
consistency,
homogeneous without
any visible ice crystals
Whipping, % 36 ± 2 34 ± 2 32 ± 2
Thawing
resistance, min
43 ± 2 40 ± 1 40 ± 1
Temperature after
freezing, °С
-4…-6 -4…-6 -4…-6
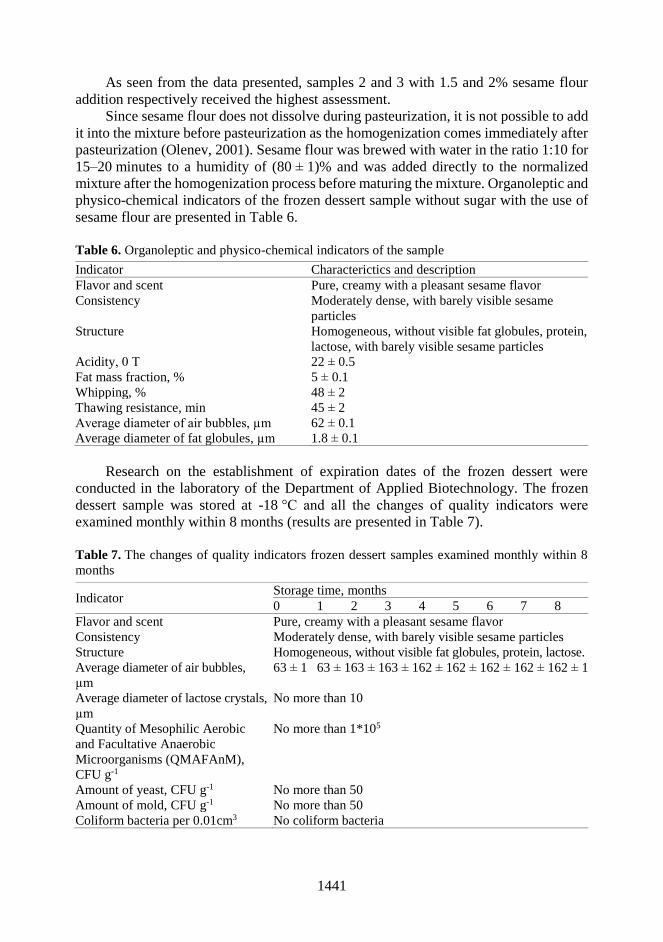
1441
As seen from the data presented, samples 2 and 3 with 1.5 and 2% sesame flour
addition respectively received the highest assessment.
Since sesame flour does not dissolve during pasteurization, it is not possible to add
it into the mixture before pasteurization as the homogenization comes immediately after
pasteurization (Olenev, 2001). Sesame flour was brewed with water in the ratio 1:10 for
15–20 minutes to a humidity of (80 ± 1)% and was added directly to the normalized
mixture after the homogenization process before maturing the mixture. Organoleptic and
physico-chemical indicators of the frozen dessert sample without sugar with the use of
sesame flour are presented in Table 6.
Table 6. Organoleptic and physico-chemical indicators of the sample
Indicator Characterictics and description
Flavor and scent Pure, creamy with a pleasant sesame flavor
Consistency Moderately dense, with barely visible sesame
particles
Structure Homogeneous, without visible fat globules, protein,
lactose, with barely visible sesame particles
Acidity, 0 Т 22 ± 0.5
Fat mass fraction, % 5 ± 0.1
Whipping, % 48 ± 2
Thawing resistance, min 45 ± 2
Average diameter of air bubbles, µm 62 ± 0.1
Average diameter of fat globules, µm 1.8 ± 0.1
Research on the establishment of expiration dates of the frozen dessert were
conducted in the laboratory of the Department of Applied Biotechnology. The frozen
dessert sample was stored at -18 °C and all the changes of quality indicators were
examined monthly within 8 months (results are presented in Table 7).
Table 7. The changes of quality indicators frozen dessert samples examined monthly within 8
months
Indicator Storage time, months
0 1 2 3 4 5 6 7 8
Flavor and scent Pure, creamy with a pleasant sesame flavor
Consistency Moderately dense, with barely visible sesame particles
Structure Homogeneous, without visible fat globules, protein, lactose.
Average diameter of air bubbles,
µm
63 ± 1 63 ± 1 63 ± 1 63 ± 1 62 ± 1 62 ± 1 62 ± 1 62 ± 1 62 ± 1
Average diameter of lactose crystals,
µm
No more than 10
Quantity of Mesophilic Aerobic
and Facultative Anaerobic
Microorganisms (QMAFAnM),
CFU g-1
No more than 1*105
Amount of yeast, CFU g-1 No more than 50
Amount of mold, CFU g-1 No more than 50
Coliform bacteria per 0.01cm3 No coliform bacteria

1442
The results of the research show that during the storage period there were no
changes in quality indicators in the sample of frozen dessert with sesame flour. However,
according to the technique (Gapparov et al., 1999), an expiration date for the products is
6 months.
CONCLUSIONS
1. The entry dose of the stevioside and the topinambur syrup in an amount of 0.03
and 5% respectively added to the mixture mass of the frozen dessert allows us to get the
product with pleasant flavor and scent.
2. The frozen dessert samples were got with the best indicators for whipping,
thawing resistance, density and uniformity of consistency when using the PGX-1
stabilizer with an entry dose of 0.4 to the mixture mass.
3. The entry dose of sesame flour that is needed to be pre-brewed with water in the
ratio 1:10 for 15–20 minutes to a humidity of (80 ± 1)%, varies from 1.5% to 2% to the
mixture mass.
4. It is expedient to add brewed sesame flour before freezing.
5. An expiration date of the frozen dessert without sugar with the use of sesame
flour is 6 months at a temperature of – 18 °C.
REFERENCES
Arsenyeva, T.P. 2002. Handbook of the technologist of dairy production. Technology and
recipes, GIORD, SPb., pp. 180 (in Russian).
Arseneva, T.P. 2011a. Selection of components of plant origin for diabetic ice cream. The science
176, 50–52 (in Russian).
Arsenyeva, T.P. 2011b. Development of ice cream with plant components for diabetic nutrition.
Low-Temperature and Food Technologies in the 21st Century: Sat. scientific works of the
V international. scientific-practical. Conf. 425, 304–305 (in Russian).
Arseneva, T.P. 2009 Development of theoretical bases and elaboration of technologies low-
lactose dairy products and adjustable fatty acid composition, Pishchevaya tekhnologiya
192, 22–31 (in Russian).
Arseneva, T.P. & Yakovleva, Y.A. 2012. Formulation of ice cream with plant ingredients.
Pishchevaya tekhnologiya 215, 75–78 (in Russian).
Arseneva, T.P. & Yakovleva, Y.A. 2011. Jerusalem artichoke as a means of treating the
prevention of various diseases. Processes and devices of food production 86, 1–6
(in Russian).
Erashova, L.D. & Pavlova, G.N. 1997. Source of natural sweetener food. Food industry 98, 9
(in Russian).
Gapparov, M.M., Panchenko, S.N. & Ugreninov, V.G. 1999. Natural products - food of the 21st
century. Food industry 85, pp. 12 (in Russian).
Olenev, Y.A., Tvorogova, A.A., Kazakova, N.V & Soloveva, L.N. 2004. Reference book on
production of ice cream. DeLiprint, Moscow, 798 pp. (in Russian).
Olenev, Y.A. 2001 Technology and equipment for production of ice cream, DeLi, Moscow,
323 pp. (in Russian).
Onopriyko, A.V., Khramtsov, A.G. & Onopriyko, V.A. 2004. Production of dairy products.
March, Rostov-on-Don, 411 pp. (in Russian).
Ozdemir, C., Arslaner, A., Ozdemir, S. & Allahuari, M. 2015. The production of ice cream using
stevia as a sweetener. J. Food Sci. Technol. 842, 246–264.

1443
Saad, N., Delattre, C., Urdaci, M., Schmitter, J. & Bressollier, P. 2013. An overview of the last
advances in probiotic and prebiotic field. LWT – Food Science and Technology 50, 1–16.
Suhas, M.G., Preeti, M. & Rahul, R.G. 2015. Analytical hierarchy process to recommend an ice
cream to a diabetic patient based on sugar content in it, Procedia Computer Science 264,
64–72.
Vozhdaeva, L.I. & Sorochkina, I.G. 2000. About the functional properties of Jerusalem artichoke.
Problems and prospects of healthy food 197, p. 43 (in Russian).
Vzor, A.L. & Nikitkov, V.A. 1998. The use of stabilizers and emulsifiers in modern ice cream
production. Food industry 118, 40–43 (in Russian).
Yakovleva, Y.A. 2012. Development of the composition and technology of low-lactose cream
ice cream for people suffering from diabetes mellitus Collected works of young scientists.
Part I: Proceedings of the Conference (65th\\Student Scientific and Practical Conference)
222, 22–24 (in Russian).
Zhukovsky, P.M, 1997. Cultivated plants and their relatives. VNIIMSa, Uglich, 751 pp.
(in Russian).

1444
Agronomy Research 16(S2), 1444–1456, 2018
https://doi.org/10.15159/AR.18.055
The possibility of using powdered sea-buckthorn in the
development of bakery products with antioxidant properties
L. Nilova* and S. Malyutenkova
Peter the Great St. Petersburg Polytechnic University, Institute of Industrial
Management, Economics, and Trade, Graduate School of Commodity and Service,
Novorossiyskaya street 50, U194021 St. Petersburg, Russia *Correspondence: [email protected]
Abstract. The article examines ways of increasing the antioxidant capacity of bakery products
(referred to here as BP) by adding powdered peel, powdered seeds, and powdered marc produced
from sea-buckthorn berries. Three different versions of BP were developed with the maximum
addition of the following powders: from the peel (3%), from the marc (5%) with a sugar content
of 14.5%; and from seeds (5%) with a sugar content of 5%, and with a potato flake content of
5%. BPs with the addition of sea-buckthorn powders were baked at two temperature regimes:
200°C and 220 °C. The content of phenolic compounds, flavonoids, and ascorbic acid were
determined for the sea-buckthorn powder, for the crust of BP, and in BP crumbs. The antioxidant
activity of BP was determined by the use of two methods: by chemiluminescence, and by their
reaction to the DPPH-radical. Cyclic amides (lactams) were determined in BP crusts and crumbs
with the use of the IR spectroscopy method. The AOA of powdered sea buckthorn depended upon
the volume of phenolic compounds and ascorbic acid in them: peel > marc > seeds. The
antioxidant properties of BPs decreased in the following order and were aligned the following
way: BP with marc > BP with peel > BP with seeds. They displayed higher AOA levels than was
calculated in theoretical tests, depending upon the volume of powders in the recipe. An increase
of the baking temperature led to a loss of phenolic compounds and vitamin C, as well as to the
formation of poly lactams. BP baked at the temperature regime of 200 °C displayed the greatest
AOA levels.
Key words: sea buckthorn, peel, seed, marc, bakery products, antioxidant activity, lactams.
INTRODUCTION
Most bread and bakery products (BP) are made of low-yield wheat flour, or what
is generally known as refined flour. Such flour has good baking properties, but contains
almost no vitamins, minerals, or dietary fibres (Pashchenko & Zharkova, 2006; Akhtar
et al., 2011; Nechaev, 2013). In human nutrition, bread and BP which is made of low-
yield wheat flour serve only as a source of energy. Besides this, melanoidins which are
formed during the baking process may cause a pro-oxidative effect in the absence of
natural antioxidants, thereby damaging human health (Putilina et al., 2006; Nilova &
Pilipenko, 2016).
The development of alimentary products, including bread and BP which has been
enriched with natural antioxidants (AO) is a popular direction when it comes to
1445
functional nutrition. Natural raw materials containing water-soluble AO – fruit and
vegetable powders, juices, and extracts (Belyavskaya & Rodicheva, 2013; Dziki et al.,
2014; Jaisanthi & Banu, 2014; Karrar, 2014; Nilova et al., 2015) – or lipid-soluble AO
such as vegetable oils (Caponio et al., 2013; Nilova et al., 2017) are used as the source
of natural AO. A valuable source of water-soluble and lipid-soluble AO is sea-buckthorn
(Hippóphae rhamnoídes L.).
The composition of biologically active substances (BAS) in sea-buckthorn – its
berries, seeds, and leaves – has been studied by a good many researchers (Bal et al.,
2011; Chaman et al., 2011; Kant et al., 2012; Saikia & Handique, 2013; Fatima et al.,
2015). Berries and seeds from sea-buckthorn contain phenolic compounds, ascorbic
acid, tocochromanols, carotenoids, and phytosterols. They effectively combat free
radicals (Zeb, 2006; Chaman et al., 2011; Kant et al., 2012; Ursache et al., 2017). It is
impossible to precisely affirm which parts of sea-buckthorn contain more AO as the
quantitative composition can be influenced by the botanical breed of sea-buckthorn, the
area of its cultivation, or the method of research being used to study it (Jalakas et al.,
2003; Bal et al., 2011). The peel and the pulp contain a lot of ascorbic acid, carotenoids,
and phytosterols, while the seeds are rich in cochromanol and lignans (Li et al., 2007;
Christaki, 2012; Smeds et al., 2012). Phenolic compounds can dominate in the pulp and
the peel of berries or seeds (Saikia & Handique, 2013), while flavonoids (with a
predominance of rutin and quercetin) are concentrated mostly in the leaves of sea-
buckthorn (Fatima et al., 2015). The amount of lipid-soluble AO in processed sea-
buckthorn products depends upon the amount of fat that remains in them after the
extraction of sea-buckthorn oil has taken place.
Due to their valuable biochemical composition, sea-buckthorn berries are
recommended for use in nutrition in their natural form or as part of food products (Bal
et al., 2011). Sea-buckthorn is used mostly for making products such as oil, squash, and
juices (Zeb, 2004; Cenkowski et al., 2006; Lipowski et al., 2009). The remaining marc
could be used as an enriching supplement for BP, but the high percentage of ascorbic
acid in the marc strengthens gluten and can reduce the quality of the BP.
This work is aimed at the development of BP which is made from wheat flour with
AO properties due to the use of sea-buckthorn powders in the recipe.
MATERIALS AND METHODS
Preparing sea-buckthorn powders
Sea-buckthorn berries were harvested in the Leningrad region of Russia. The marc
left over after squeezing out the juice was dried at 50–55 °C for six hours. Three types
of powder were obtained: from the marc, from the seeds, and from the peel. The powder
was ground down immediately before any research or BP baking took place. The ground-
down powder was then sifted in order to obtain powder with a particle size less than
150 mm. The larger fractions of the powder were milled repeatedly.
The bakery product recipe and baking process
The following ingredients were used in the BP recipe: wheat flour (gluten 28.9%,
ash content 0.55) produced by St Petersburg Mill Plant OJSC; refined and deodorised
sunflower oil produced by EFCO FOODS PLC, Russia; sugar (99.8% sucrose) by JSC
‘Lebedyansky Sugar Plant’, Russia; pressed bakery yeast by JSC ‘Food Factory’, Russia;

1446
and salt and potato flakes (carbohydrates 83%, proteins 7%, fats 1%) by JSC Hercules
Plus, Russia.
The BP were produced by using a straight dough method according to three recipes
presented in Table 1.
Table 1. Basic and experimental recipes for bakery products
Ingredient, g
Basic recipes Experimental recipes
Recipe 1
(R1)
Recipe 2
(R2)
Recipe 3
(R3)
with seed
powder
(based on R2)
with marc
powder
(based on R3)
with peel
powder
(based on R3)
Wheat flour 1,000 1,000 1,000 900 950 970
Seed powder - - - 50 - -
Marc powder - - - - 50 -
Peel powder - - - - - 30
Potato flakes - - - 50 - -
Sugar - 50 145 50 145 145
Vegetable oil - 40 145 40 145 145
Yeast 20 20 20 20 20 20
Salt 15 15 15 15 15 15
Water, mL 620 570 490 570 490 490
The amount of water in the dough was determined through calculations and
depended upon the moisture and gluten content of the flour and its additional ingredients
(Pashchenko & Zharkova, 2006).
To optimise the amount of sea-buckthorn powder in BP recipes, part of the wheat
flour was replaced by sea-buckthorn powders: the first one made from marc; another one
made from seeds; and the final one made from peel, to the amount of 1–7%.
The entire dough mass was prepared according to the recipe, from flour and water,
being first kneaded for seven minutes and then left to ferment for 150 minutes at 30 °C;
the dough was punched down after ninety minutes from the beginning of the
fermentation period. Baking the BP which weighed 100g was done at two temperature
regimes: at 200 °C for 25 minutes and at 220 °C for twenty minutes. The crust and the
crumb were separated after cooling the BP and were dried separately at 40 °C, to reach
a constant mass.
Methods for researching the quality of BP The assessment of BP quality was carried out according to the following
parameters:
the sensory parameters – appearance (shape, surface, and colour of the crust),
crumb condition (porosity and texture), and taste and flavour;
the physico-chemical and physical parameters – the mass proportion of moisture
was determined by drying at a temperature of 130 °C for forty minutes; the acidity by
use of the titration method 0.1 with a normal NaOH solution; the porosity by determining
the ratio of the volume of pores to the total product volume; the pore volume as the
difference between the product volume and the volume of the non-porous mass; the
specific volume by determining the ratio of product volume to that of 100 g of flour. The
quality of experimental BP samples which were produced with the addition of sea-
buckthorn powders was compared with control BP samples which had been produced
1447
using the same recipe but without having any of the supplements added (Shevchenko et
al., 2009).
Methods of researching individual antioxidants The goal was to determine individual AO levels in sea-buckthorn powders, as well
as in the crust and the crumb of the developed BP.
A determination of ascorbic acid was carried out by use of the titrimetric method,
using a 2.6-dichlorophenolindophenolate sodium solution. The extraction of ascorbic
acid from the raw materials was carried out with the use of 2% hydrochloric acid. A total
of 5 g of the powder was mixed with 5 mL of 2% hydrochloric acid solution, 20 g of
crust or crumb were mixed with 20 mL of a 2% solution of hydrochloric acid, infused
for ten minutes and then filtered. The ascorbic acid was determined in extracts without
any delay (Shevchenko et al., 2009).
Total phenol assay by Folin-Ciocalteau reagent. Ethanol extracts of sea-buckthorn
powder, as well as the crust and the crumb powders from CBS, were kept in the dark
with Folin-Ciocalteau reagent for thirty minutes at room temperature (1 g of powder in
50 mL of 80% ethanol) with periodic shaking. After the incubation period all samples
were centrifuged at 3,500 rpm for ten minutes. The optical density was measured using
a SHIMADZU 1240 spectrophotometer (SHIMADZU, Japan) at a wavelength of
735 nm. The results obtained were expressed in mg of gallic acid (Rogozhin &
Rogozhina, 2015).
The total content of flavonoids was determined spectrophotometrically by reaction
with aluminium chloride. The extraction of flavonoids was carried out with 60% ethyl
alcohol. The optical density was measured after thirty minutes on a SHIMADZU 1240
spectrophotometer (SHIMADZU, Japan) at a wavelength of 420 nm. The results
obtained were expressed in mg of routine (Rogozhin & Rogozhina, 2015).
Methods for assessing overall antioxidant activity
The antioxidant activity (AOA) of aqueous extracts from sea-buckthorn powders,
along with the crust and crumb of BP, was determined by use of the chemiluminescent
method using the BCL-06M biochemiluminometer (Nizhny Novgorod, Russia) in a
model system which contained riboflavin, hydrogen peroxide, and ferrous iron (Putilina
et al., 2006). The extraction was carried out using distilled water, and was centrifuged
for ten minutes at 3,500 rpm. Measurements were taken for luminescence in volts (I50)
at room temperature for fifty seconds. The information obtained from I50 of water
extracts was used in making up the charts. The charts were used to determine the
concentration of the substance, which reduced the intensity of chemiluminescence by
50%. Trolox 97% (Acros organics, USA) was used as the standard.
A determination of AOA of BP was carried out by use of the Glavind method
(Rogozhin & Rogozhina, 2015). The hydro-alcoholic extracts of sea-buckthorn, and the
crumb and the crust powder samples, were prepared in the same manner as described
above, but extraction was carried out with the use of a 50% ethanol solution. The DPPH
solution was prepared by dissolving a 5 mg test sample in 5 mL of 16.4M (96%) ethanol
which was heated on a bain-marie until dissolved. A total of 0.2 mL of the extract was
added to 2 mL of DPPH solution. The resulting solution was incubated in the dark for
thirty minutes, after which the absorbance levels of the resulting solution were measured
at a wavelength of 517 nm using a SHIMADZU 1240 spectrophotometer (SHIMADZU,
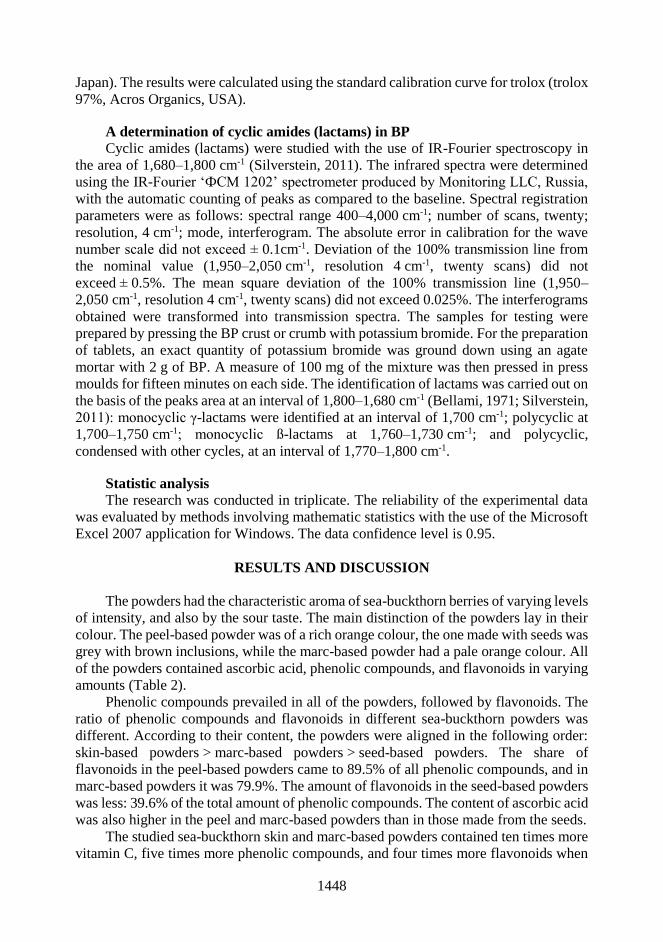
1448
Japan). The results were calculated using the standard calibration curve for trolox (trolox
97%, Acros Organics, USA).
A determination of cyclic amides (lactams) in BP Cyclic amides (lactams) were studied with the use of IR-Fourier spectroscopy in
the area of 1,680–1,800 cm-1 (Silverstein, 2011). The infrared spectra were determined
using the IR-Fourier ‘ФСМ 1202’ spectrometer produced by Monitoring LLC, Russia,
with the automatic counting of peaks as compared to the baseline. Spectral registration
parameters were as follows: spectral range 400–4,000 cm-1; number of scans, twenty;
resolution, 4 cm-1; mode, interferogram. The absolute error in calibration for the wave
number scale did not exceed ± 0.1cm-1. Deviation of the 100% transmission line from
the nominal value (1,950–2,050 cm-1, resolution 4 cm-1, twenty scans) did not
exceed ± 0.5%. The mean square deviation of the 100% transmission line (1,950–
2,050 cm-1, resolution 4 cm-1, twenty scans) did not exceed 0.025%. The interferograms
obtained were transformed into transmission spectra. The samples for testing were
prepared by pressing the BP crust or crumb with potassium bromide. For the preparation
of tablets, an exact quantity of potassium bromide was ground down using an agate
mortar with 2 g of BP. A measure of 100 mg of the mixture was then pressed in press
moulds for fifteen minutes on each side. The identification of lactams was carried out on
the basis of the peaks area at an interval of 1,800–1,680 cm-1 (Bellami, 1971; Silverstein,
2011): monocyclic γ-lactams were identified at an interval of 1,700 cm-1; polycyclic at
1,700–1,750 cm-1; monocyclic ß-lactams at 1,760–1,730 cm-1; and polycyclic,
condensed with other cycles, at an interval of 1,770–1,800 cm-1.
Statistic analysis The research was conducted in triplicate. The reliability of the experimental data
was evaluated by methods involving mathematic statistics with the use of the Microsoft
Excel 2007 application for Windows. The data confidence level is 0.95.
RESULTS AND DISCUSSION
The powders had the characteristic aroma of sea-buckthorn berries of varying levels
of intensity, and also by the sour taste. The main distinction of the powders lay in their
colour. The peel-based powder was of a rich orange colour, the one made with seeds was
grey with brown inclusions, while the marc-based powder had a pale orange colour. All
of the powders contained ascorbic acid, phenolic compounds, and flavonoids in varying
amounts (Table 2).
Phenolic compounds prevailed in all of the powders, followed by flavonoids. The
ratio of phenolic compounds and flavonoids in different sea-buckthorn powders was
different. According to their content, the powders were aligned in the following order:
skin-based powders > marc-based powders > seed-based powders. The share of
flavonoids in the peel-based powders came to 89.5% of all phenolic compounds, and in
marc-based powders it was 79.9%. The amount of flavonoids in the seed-based powders
was less: 39.6% of the total amount of phenolic compounds. The content of ascorbic acid
was also higher in the peel and marc-based powders than in those made from the seeds.
The studied sea-buckthorn skin and marc-based powders contained ten times more
vitamin C, five times more phenolic compounds, and four times more flavonoids when

1449
compared to those powders that were obtained after oil extraction (Zolotareva et al.,
2005; Nikulina & Ivanova 2006), but less vitamin C than in fruit juice powder (Hussain
et al., 2010; Selvamuthukumaran & Khanum, 2014). The content of phenolic compounds
is almost the same as in powder that was based on sea-buckthorn berries (Roidaki et al.,
2015). Differences in the composition of biologically active substances are associated
both with the method of obtaining the powders (Guan et al., 2005), and with the botanical
variety of sea-buckthorn types and their region of growth. The content of vitamin C in
various sea buckthorn types can differ from two to fifteen times, while the content of
phenolic compounds and flavonoids can differ between eight to ten times (Ercisli et al.,
2007; Ershova, 2009; Wani et al., 2016). The higher amount of biologically active
substances increases the AOA of the berries and other sea buckthorn products (Kant et
al., 2012; Zeb & Hussain, 2014; Fatima et al., 2015).
The content of individual AO had an impact on the results of studies of AOA in
sea-buckthorn powders. The more AO the powder contained, the higher was its AOA:
sea-buckthorn peel > sea-buckthorn marc > sea-buckthorn seeds. The AOA of water
extracts was lower than that of hydro-alcoholic extracts in the peel powders. In seed
powders, on the other hand, the AOA of the aqueous extract was higher than that of the
hydro-alcoholic extract, probably because of the inclusion of phenolic compounds.
To assess the possibility of being able to use sea-buckthorn powders in the
production of BP from wheat flour, three standard recipes were used, where a certain
proportion of the flour was replaced by sea-buckthorn powder. Recipe 1 did not provide
for the use of a sugar and fat component. With addition of 1% of any sea-buckthorn
powder, the BP acquired a sour taste, while the fragrance of sea-buckthorn was not felt.
The specific volume of BP increased by 4% when applying the marc powder, and by 3%
after adding powder which was based on the peel or seeds. The further increase in
concentration of powders in Recipe 1 engendered a pronounced sour taste and a decrease
in the specific volume of BP. The sea-buckthorn aroma became apparent only with
addition of sea-buckthorn powder to the amount of 3%. Recipe 1 cannot be used for BP
which is enriched with sea-buckthorn powders.
Table 2. The content of antioxidants and the total antioxidant activity of sea-buckthorn powders,
± standard deviation
Powdered
form
The content of antioxidants, mg per g DM АОА, µg Trolox per g DM
Ascorbic
acid
Total phenolic
content
Total flavonoids
content
DPPH-
radical assay
Chemi-
lumnescence
Marc 2.52 ± 0.08 8.61 ± 0.20 6.88 ± 0.28 45.10 ± 1.50 40.20 ± 1.30
Seeds 0.65 ± 0.02 6.95 ± 0.22 2.75 ± 0.16 12.32 ± 0.50 15.40 ± 0.60
Peel 3.21 ± 0.05 9.16 ± 0.20 8.20 ± 0.22 58.62 ± 1.51 51.80 ± 1.80
Recipe 2 provided for the use of 4% vegetable oil and 5% sugar. The gradual
increase in the amount of powder in the BP content led to the appearance of a sour taste,
confirmed by the values of titratable acidity of BP (Fig. 1). The sour taste was noticed
when applying 2% of the peel and the marc powders, and 3% of the seed powder. At the
same time, the sea-buckthorn smell was practically indistinguishable.
The main factor which served to inhibit the increase in the number of sea-buckthorn
powders in BP recipes was the high content of ascorbic acid in the powders. The ascorbic
acid tightens gluten, thereby restraining the increase in the specific volume of BP

1450
(Pashchenko & Zharkova, 2006). As a result, the maximum specific volume of BP was
achieved only when using 2% of the peel-based powder and 3% of powder which used
the marc or seeds (Fig. 1). Increasing the extent of powders in Recipe 2 resulted in a
decrease in the BP-specific volume.
а) Change in acidity, deg. b) Change in specific volume, cm3 100g-1
Figure 1. The effect of sea-buckthorn-based powders on the acidity (a) and specific volume (b)
of BP (Recipe 2).
BP with seed-based powder acquired a sea-buckthorn aroma only with the addition
of 5% powder. The crumb colour was grey. Therefore the use of powder from the seeds
in Recipe 3 is not appropriate. In order to increase the BP-specific volume in Recipe 2,
it was necessary to use ingredients which prevent gluten from thickening. Potato flakes
were chosen as such an ingredient. Potato flakes to the amount of 3%, 5%, and 7% were
added to Recipe 2 with the further addition of 5% of the seed-based powder. BP quality
was controlled according to specific volume (Fig. 2).
The introduction of 3% of potato flakes increased the specific volume of BP by
1.2% with the addition of 5% of seed-based powder; while the introduction of 5% of
potato flakes increased it by 2.7%, which almost reached the specific volume of BP with
the addition of 3% of the seed-based powder. The values were only 1% lower. However,
a further increase of the proportion of potato flakes resulted in an excessive relaxation
of gluten and a decrease of the specific volume. Therefore, powder which was obtained
from seeds can be used to the amount of 5% in Recipe 2 for BP, but only in combination
with potato flakes to the amount of 5% (Table 1).
In order to relax gluten, one can use a significant amount of sugar in BP recipes
(Pashchenko & Zharkova, 2006). For this purpose, Recipe 3 was used to increase the
proportion of peel-based and marc-based powders (Fig. 3). The high content of ascorbic
acid in the peel-based powder (Table 1) did not allow us to increase its quantity in BP
above 3%, but the BP acquired a specific sea-buckthorn aroma, a nice orange tinged
crumb colour, and a sweet-and-sour taste. Due to the reduced amount of ascorbic acid in
the marc powder, its optimal amount in Recipe 3 for BP was 5%. The further increase in
the amount of the peel and marc-based powders in Recipe 3 for BP led to a reduction of
the specific volume of BP (Fig. 3), the appearance of a pronounced acidic taste, and also
an excessive colour.
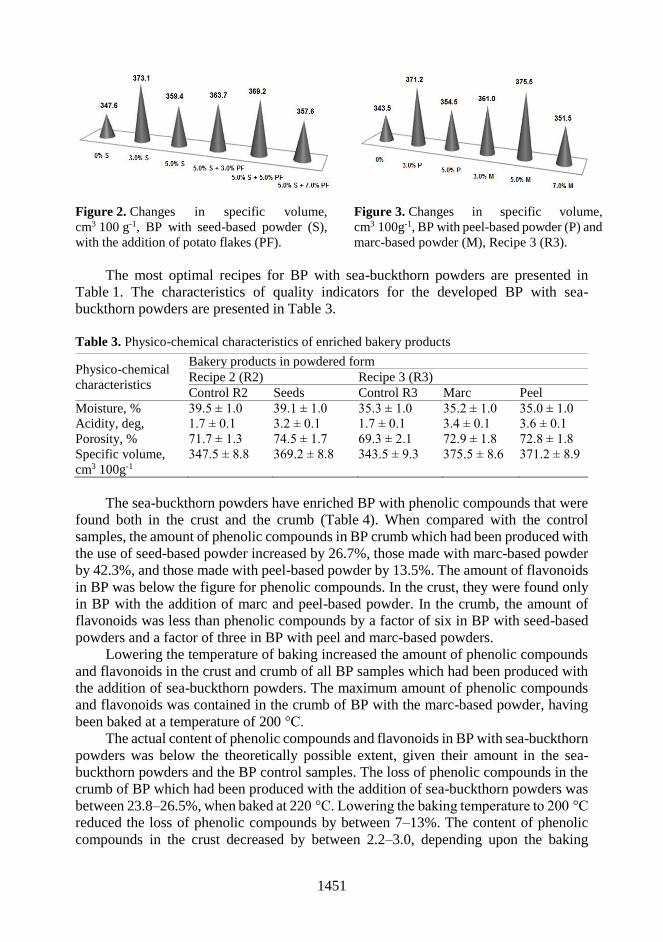
1451
Figure 2. Changes in specific volume,
cm3 100 g-1, BP with seed-based powder (S),
with the addition of potato flakes (PF).
Figure 3. Changes in specific volume,
cm3 100g-1, BP with peel-based powder (P) and
marc-based powder (M), Recipe 3 (R3).
The most optimal recipes for BP with sea-buckthorn powders are presented in
Table 1. The characteristics of quality indicators for the developed BP with sea-
buckthorn powders are presented in Table 3.
Table 3. Physico-chemical characteristics of enriched bakery products
Physico-chemical
characteristics
Bakery products in powdered form
Recipe 2 (R2) Recipe 3 (R3)
Control R2 Seeds Control R3 Marc Peel
Moisture, % 39.5 ± 1.0 39.1 ± 1.0 35.3 ± 1.0 35.2 ± 1.0 35.0 ± 1.0
Acidity, deg, 1.7 ± 0.1 3.2 ± 0.1 1.7 ± 0.1 3.4 ± 0.1 3.6 ± 0.1
Porosity, % 71.7 ± 1.3 74.5 ± 1.7 69.3 ± 2.1 72.9 ± 1.8 72.8 ± 1.8
Specific volume,
cm3 100g-1
347.5 ± 8.8 369.2 ± 8.8 343.5 ± 9.3 375.5 ± 8.6 371.2 ± 8.9
The sea-buckthorn powders have enriched BP with phenolic compounds that were
found both in the crust and the crumb (Table 4). When compared with the control
samples, the amount of phenolic compounds in BP crumb which had been produced with
the use of seed-based powder increased by 26.7%, those made with marc-based powder
by 42.3%, and those made with peel-based powder by 13.5%. The amount of flavonoids
in BP was below the figure for phenolic compounds. In the crust, they were found only
in BP with the addition of marc and peel-based powder. In the crumb, the amount of
flavonoids was less than phenolic compounds by a factor of six in BP with seed-based
powders and a factor of three in BP with peel and marc-based powders.
Lowering the temperature of baking increased the amount of phenolic compounds
and flavonoids in the crust and crumb of all BP samples which had been produced with
the addition of sea-buckthorn powders. The maximum amount of phenolic compounds
and flavonoids was contained in the crumb of BP with the marc-based powder, having
been baked at a temperature of 200 °C.
The actual content of phenolic compounds and flavonoids in BP with sea-buckthorn
powders was below the theoretically possible extent, given their amount in the sea-
buckthorn powders and the BP control samples. The loss of phenolic compounds in the
crumb of BP which had been produced with the addition of sea-buckthorn powders was
between 23.8–26.5%, when baked at 220 °C. Lowering the baking temperature to 200 °C
reduced the loss of phenolic compounds by between 7–13%. The content of phenolic
compounds in the crust decreased by between 2.2–3.0, depending upon the baking

1452
temperature and the BP recipe. The loss of flavonoids during baking was more
significant.
Table 4. The content of ascorbic acid, phenolic compounds, and flavonoids in the crust and
crumb of bakery products, per g DM (mean ± standard deviation)
Bakery
products
Ascorbic acid Total phenolic content Total flavonoids content
Crust Crumb Crust Crumb Crust Crumb
Baking at 220 °С
Control R2 nd nd 0.05 ± 0.01 0.45 ± 0.03 nd nd
With seeds nd nd 0.08 ± 0.01 0.57 ± 0.02 nd 0.09 ± 0.01
Control R3 nd nd 0.08 ± 0.01 0.52 ± 0.01 nd nd
With marc nd 0.021 ± 0.001 0.18 ± 0.02 0.74 ± 0.01 0.05 ± 0.01 0.24 ± 0.01
With peel nd 0.015 ± 0.001 0.15 ± 0.01 0.59 ± 0.01 0.06 ± 0.00 0.18 ± 0.01
Baking at 200 °С
Control R2 nd nd 0.10 ± 0.01 0.52 ± 0.02 nd nd
With seeds nd nd 0.18 ± 0.01 0.72 ± 0.01 nd 0.11 ± 0.01
Control R3 nd nd 0.12 ± 0.02 0.66 ± 0.01 nd nd
With marc nd 0.032 ± 0.001 0.25 ± 0.02 0.95 ± 0.02 0.12 ± 0.01 0.28 ± 0.01
With peel nd 0.025 ± 0.002 0.20 ± 0.01 0.76 ± 0.02 0.10 ± 0.01 0.20 ± 0.01
nd – not detected.
The high baking temperatures completely destroyed the ascorbic acid in all BP
crusts. Ascorbic acid was found only in the crumb of BP which had been produced with
the addition of sea-buckthorn marc and peel-based powders. Its quantity was up to 30%
of the theoretically possible extent, depending upon the recipe used to produce the BP.
Baking at the lower temperature of 200 °C made it possible to preserve the ascorbic acid
by 50% more, when compared with baking at a temperature of 220 °C.
The presence of individual AO in BP led to an increase in their AOA (Table 5).
The AOA of BP with sea-buckthorn powders depended upon the amount and type of the
powder: BP with sea-buckthorn marc-based powder > BP with sea-buckthorn peel-
based powder > BP with sea-buckthorn seed-based powder.
Table 5. The antioxidant activity of bakery products, µg Trolox per g DM (mean ± standard
deviation)
Bakery products DPPH-radical assay Chemiluminescence
Crust Crumb Crust Crumb
Baking at 220 °С
Control R2 3.19 ± 0.06 4.54 ± 0.08 7.10 ± 0.08 10.50 ± 0.10
With seeds 4.10 ± 0.15 6.10 ± 0.02 8.80 ± 0.18 12.90 ± 0.20
Control R3 4.48 ± 0.10 6.35 ± 0.12 9.10 ± 0.08 12.88 ± 0.14
With marc 7.50 ± 0.12 10.48 ± 0.15 14.70 ± 0.10 20.02 ± 0.22
With peel 6.25 ± 0.12 8.95 ± 0.16 11.00 ± 0.16 15.28 ± 0.02
Baking at 200 °С
Control R2 3.45 ± 0.06 5.10 ± 0.09 7.75 ± 0.10 11.10 ± 0.18
With seeds 4.45 ± 0.10 6.55 ± 0.15 9.50 ± 0.22 12.96 ± 0.12
Control R3 4.80 ± 0.04 6.82 ± 0.10 9.62 ± 0.20 13.26 ± 0.00
With marc 8.00 ± 0.10 11.45 ± 0.20 16.10 ± 0.05 22.40 ± 0.20
With peel 6.81 ± 0.10 9.60 ± 0.05 11.70 ± 0.10 17.00 ± 0.25

1453
The experimentally determined AOA of BP was higher than the one that had been
calculated theoretically. Therefore, the crumb of BP with a marc-based powder
theoretically should have the AOA of 8.55 μg g-1 DM and 8.36 μg g-1 DM, as determined
by DPPH and chemiluminescence methods respectively. But the experimental values of
AOA of BP crumb using a marc-based powder (determined according to the DPPH and
chemiluminescence methods) were higher by 22.6% and 20.02% respectively. An even
greater difference in AOA was recorded for BP which had been produced with the
addition of seed-based powder: 24.5% and 28.3% respectively. This tendency is traced
not only in the crumb, but also in the crust, irrespective of the baking temperature. But
in case of baking at a lower temperature (200 °C), the AOA figures were higher, both
for the crumb and the crust. BP crumb had an AOA level that was higher than that of the
crust when using two temperature profiles during baking.
Biologically active compounds such as tocopherols and carotenoids which are
found in sea-buckthorn powders, something that was not considered in the present study,
can also contribute to the AOA of BP, as can melanoidins that are formed during baking
(Martins et al., 2001; Nilova et al., 2015).
Melanoidins include mono- and polycyclic lactams – δ-(six-membered ring),
γ-(five-membered ring) and ß-(four-membered ring). Their AO properties are
determined by the system of conjugated double bonds in heterocyclic and quinoid chains
(Selemenev et al., 2008). The IR-spectroscopy method makes it possible to identify
lactams by intensity of absorption bands of the carbonyl group in the area of 1,680–
1,800 cm-1, which is characteristic of mono- and polycyclic γ- and β-lactams. The
decrease in the number of members in the ring leads to a shift of bands towards higher
frequencies. For a quantitative interpretation of the data obtained, peak areas were used
which characterised oscillations in the selected space. The results are shown in Table 6.
Table 6. The characteristics of mono- and polycyclic lactams (β- and γ-forms) of the crust and
the crumb of bakery products, relative standard units, ± standard deviation
Bakery products
Lactams
Mono β- & γ-lactams Poly β- & γ-lactams
Crust Crumb Crust Crumb
Baking at 220 °С
Control R2 49.32 ± 0.36 73.09 ± 0.44 77.37 ± 0.60 110.72 ± 0.68
With seeds 27.49 ± 0.40 40.98 ± 0.40 42.88 ± 0.72 61.52 ± 0.70
Control R3 54.18 ± 0.70 81.20 ± 0.35 86.82 ± 0.80 120.55 ± 0.70
With marc 2.35 ± 0.45 38.25 ± 0.60 42.72 ± 0.82 61.46 ± 0.65
With peel 28.19 ± 0.50 41.50 ± 0.40 46.01 ± 0.45 63.72 ± 0.49
Baking at 200 °С
Control R2 50.08 ± 0.30 75.10 ± 0.55 75.85 ± 0.58 105.40 ± 0.60
With seeds 28.81 ± 0.55 41.96 ± 0.35 41.20 ± 0.65 57.94 ± 0.45
Control R3 55.90 ± 0.38 81.91 ± 0.30 83.62 ± 0.72 116.89 ± 0.70
With marc 28.75 ± 0.42 42.47 ± 0.65 39.45 ± 0.75 57.23 ± 0.50
With peel 29.80 ± 0.50 44.00 ± 0.56 43.70 ± 0.60 61.06 ± 0.62
The explored areas of IR spectra for the crust and the crumb of BP had a similar
number of bands with different levels of intensity. The intensity of the bands depended
upon the recipe and added ingredients, as well as the baking temperature. The different
intensity of the bands resulted in a change in the aggregate area of peaks for mono- and

1454
polycyclic lactams. A common pattern was noted for all infrared spectra of BP samples:
the total number of lactams was greater in the crumb than in the crust by 1.5 times on
average; the predominating elements in the crust and the crumb were polycyclic lactams
(60–62%); the share of polycyclic lactams in the crumb was less than that in the crust by
between 1–2%. The use of sea-buckthorn powders inhibited formation of cyclic lactams
in BP by between 1.8–2 times. The decrease in baking temperature led to the increased
intensity of infrared spectra bandwidths of BP, which were characteristic of monocyclic
lactams, as concerns the crust and the crumb.
CONCLUSIONS
Powders made from various parts of sea-buckthorn berries (from the marc, seeds,
or peel) display AOA that depends upon the content of particular AO. Regardless of the
part that is used for preparing such powders, the AOA increased in the following order:
seeds < marc < peel.
When using sea-buckthorn powders in the production of BP, it is necessary to
consider the high levels of acidity in the powders, something that has an impact on the
taste of the products; as well as the high content of ascorbic acid that has a tightening
effect on gluten (and a decrease in the specific volume of BP). The maximum usage of
powders from sea-buckthorn are best as follows: peel-based powder, 3%; marc-based
powder, 5%, with a sugar content of 14.5%; seed-based powder, 5%, with a sugar content
of 5%; and potato flakes with a content of 5%.
The use of sea-buckthorn powders in the production of BP increases the amount of
AO in them – in other words those phenolic compounds and flavonoids which number
less than the theoretically possible extent by between 23.8–26.5%. Ascorbic acid
disintegrates under the influence of the high baking temperature; therefore it is absent in
the crust of BP, but it is found in the crumb of BP where these have been produced with
the addition of peel-based and marc-based powders, to a volume of up to 30% of the
theoretical value.
It was established that BP with sea-buckthorn powders have a greater AOA than
the control samples. The AOA of BP which use sea-buckthorn powders increases in the
following order: BP with seed-based powder < BP with peel-based powder < BP with
marc-based powder. The formation of AOA depends not only on the type and amount of
sea-buckthorn powders in the BP recipe, but also on the baking temperature. A decrease
in the baking temperature results in a reduction of losses specific to biologically active
substances, as well as in formation of monocyclic lactams that have an impact on the
AOA of BP.
REFERENCES
Akhtar, S., Anjum, F.M. & Anjum, M.A.A. 2011. Micronutrient fortification of wheat flour:
recent development and strategies. Food Research International 44, 652–659.
Bal, L.M., Meda, V., Naik, S.N. & Satya, S. 2011. Sea buckthorn berries: A potential source of
valuable nutrients for nutraceuticals and cosmoceuticals. Food Research International
44(7), 1718–1727.
Bellami, L. 1971. New data on IR spectrums of difficult molecules. Word, Moscow, 318 pp.,
(in Russian, transl. from English).
1455
Belyavskaya, I.G. & Rodicheva, N.V. 2013. Determination of antioxidant capacity of bakery
products vegetables processing. Khleboproducty 11, 52–53, (in Russian, English abstr.)
Caponio, F., Giarnetti, C., Summo, C., Paradiso, V.M., Cosmai, L. & Gomes, T. 2013.
A comparative study on oxidative and hydrolytic stability of monovarietal extra virgin olive
oil in bakery products. Food Research International 54(2), 1995–2000.
Chaman, S., Syed, N.H., Danish, Z. & Khan, F.Z. 2011. Phytochemical analysis, antioxidant and
antibacterial effects of sea buckthorn berries. Pak. J. Pharm. Sci. 24(3), 345–351.
Cenkowski, S., Yakimishen, R., Przybylski, R. & Muir, W.E. 2006. Quality of extracted sea
buckthorn seed and pulp oil. Canadian biosystems engineering 48(3), 9–16.
Christaki, E. 2012. Hippophae Rhamnoides L. (Sea Buckthorn): a Potential Source of
Nutraceuticals. Food and Public Health 2(3), 69–72.
Dziki, D., Różyło, R., Gawlik-Dziki, U. & Świeca, M. 2014. Current trends in the enhancement
of antioxidant activity of wheat bread by the addition of plant materials rich in phenolic
compounds. Trends in Food Science & Technology 40(1), 48–61.
Ercisli, S., Orhan, E. & Ozdemir, O. 2007. The genotypic effects on the chemical composition
and antioxidant activity of sea buckthorn (Hippophae rhamnoides L.) berries grown in
Turkey. Scientia Horticulturae 115(1), 27–33.
Ershova, I.V. 2009. Estimation of Altai varieties and sea buckthorn hybrids according to the
biochemical composition of fruits. Achievements of Science and Technology of AICis. 7,
11–12.
Fatima, T., Kesari, V., Watt, Ia., Wishart, D., Todd, J.F., Schroeder, W.R., Paliyath, G. &
Krishna, P. 2015. Metabolite profiling and expression analysis of flavonoid, vitamin C and
tocopherol biosynthesis genes in the antioxidant-rich sea buckthorn (Hippophae
rhamnoides L.). Phytochemistry 118, 181–191.
Guan, T.T.Y., Cenkowski, S. & Hydamaka, A. 2005. Effect of drying on the nutraceutical quality
of sea buckthorn (Hippophae rhamnoides L. ssp. sinensis) Leaves. Journal of Food Science
70(9), 514–518.
Hussain, A., Abid, H., Ali, G. & Ullah, Sh. 2010. Studies on the preparation of Sea buckthorn
(Hippophae rhamnoides L.) powder drink and its nutritional evaluation. J. Chem. Soc. Pak.
32(4), 519–524.
Jaisanthi, J. & Banu, T.A. 2014. Phytonutrient composition, antioxidant activity and acceptability
of baked product incorporated with grape seed extract. Journal of Human Nutrition & Food
Science 2(6), 1049–1054.
Jalakas, M., Kelt, K. & Karp, K. 2003. The yield and fruit quality of sea buckthorn (Hippóphae
rhamnoídes L.) after rejuvenation cutting. Agronomy Research 1, 31–36.
Kant, V., Mehta, M. & Varshneya, C. 2012. Antioxidant potential and total phenolic contents of
seabuckthorn (Hippophae rhamnoides) pomace. Free Radicals and Antioxidants 2(4), 79–86.
Karrar, E.M. 2014. A Review on: Antioxidant and its impact during the bread making process.
International Journal of Nutrition and Food Sciences 3(6), 592–596.
Li, T.S.C., Beveridge, T.H.J. & Drover, J.C.G. 2007. Phytosterol content of sea buckthorn
(Hippophae rhamnoides L.) seed oil: Extraction and identification. Food Chemistry 101,
1633–1639.
Lipowski, J., Marszałek, K. & Skąpska, S. 2009. Sea Buckthorn – an innovative raw material for
the fruit and vegetable processing industry. Journal of Fruit and Ornamental Plant
Research 17(2), 121–126.
Martins, S., Jongen, W. & Martinus, A. 2001. A review of Maillard reaction in food and
implications to kinetic modeling. Food science and technology 11, 364–373.
Nechaev, A.P. 2013. Food ingredients in production of bakery products. Deli plus, Moscow,
527 pp. (in Russian).
Nikulina, O. & Ivanova, G. 2006. Sea-buckthorn meal for bakery and macaroni products.
Khleboproducty 5, 40–46, (in Russian, English abstr.).

1456
Nilova, L., Orlova, O. & Nasonova, J. 2015. The role cyclic amides in the formation of
antioxidant capacity of bakery products. Agronomy Research 13(4), 1020–1030.
Nilova, L.P. & Pilipenko, T.V. 2016. Evaluation antioxidant properties enriched bakery products
in experiment on laboratory animals. Problems of Nutrition 85(6), 39–47, (in Russian,
English abstract).
Nilova, L., Pilipenko, T. & Malyutenkova, S. 2017. An investigation into the effects of bioactive
substances from vegetable oils on the antioxidant properties of bakery products. Agronomy
Research 15(S2), 1399–1410.
Pashchenko, L.P. & Zharkova, I.M. 2006. Technology of bakery products. Publishing house
«Colossus», Moscow, 389 pp. (in Russian).
Putilina, Ph.E., Galkina, O.V., Eschenko, I.D., Digi, G.P., Krasovskaya, I.E. &
Prokopenko, V.M. 2006. Workshop on free radical oxidation. St.Peterburg state University,
St. Peterburg, 82–83 (in Russian).
Roidaki, A., Zoumpoulakis, P.G. & Proestos, C. 2015. Comparison of Extraction Methods for the
Determination of Antioxidant Activity in Extracts of Hippophae Rhamnoides L. and Lippia
Citriodora. The Effect of Seasonal Collection. Austin J. Nutri Food Sci. 3(1), 1057–1065.
Rogozhin, V.V. & Rogozhina, T.V. 2015. Workshop on biochemistry of agricultural production.
GIORD. St. Petersburg, 480 рр. (in Russian).
Saikia, M. & Handique, P.J. 2013. Antioxidant and antibacterial activity of leaf, bark, pulp and
seed extracts of seabuckthorn (Hippophae salicifolia D. Don) of Sikkim Himalayas. Journal
of Medicinal Plants Research 7(19), 1330–1338.
Selvamuthukumaran, M. & Khanum, F. 2014. Effect of modified atmosphere packaging on
physicochemical, sensory and microbiological properties of spray-dried Sea Buckthorn fruit
juice powder. Journal of Food Quality 37, 149–156.
Shevchenko, V.V., Vytovtov, A.A., Nilova, L.P. & Karaseva, E.N. 2009. Measuring methods for
monitoring the quality and safety of food. Vegetable products. Publishing House «Troitsky
Bridge», St. Petersburg, 304 pp. (in Russian).
Selemenev, V.F., Rudakov, O.B., Slavinskaya, G.I. & Drozdova, N.V. 2008. Pigments of food
productions. DeLi print, Moscow, 246 pp. (in Russian)
Silverstein, P. 2011. Spectrophotometric identification of organic compounds. Binom.
Laboratoriya znaniy, Moscow. 557 pp., (in Russian, transl. from English).
Smeds, A.I., Eklund, P.C. & Willfor, S.M. 2012. Content, composition, and stereochemical
characterisation of lignans in berries and seeds. Food Chemistry 134, 1991–1998.
Ursache, F.M., Ghinea, I.O., Turturică, M., Aprodu, I., Râpeanu, G. & Stănciuc, N. 2017.
Phytochemicals content and antioxidant properties of sea buckthorn (Hippophae
rhamnoides L.) as affected by heat treatment – Quantitative spectroscopic and kinetic
approaches. Food Chemistry 233, 442–449.
Wani, T.A., Wani, S.M., Ahmad, M., Ahmad, M., Gani, A. & Masoodi, F.A. 2016. Bioactive
profile, health benefits and safety evaluation of sea buckthorn (Hippophae rhamnoides L.):
A review. Cogent Food and Agriculture 2(1).
http://www.tandfonline.com/doi/full/10.1080/23311932.2015.1128519
Zeb, A. 2006. Anticarcinogenic Potential of Lipids from Hippophae – Evidence from the Recent
Literature. Asian Pacific Journal of Cancer Prevention 7, 32–35.
Zeb, A. 2004. Chemical and Nutritional Constituents of Sea Buckthorn Juice. Pakistan Journal
of Nutrition 3(2), 99–106.
Zeb, A. & Hussain, Sh. 2014. Sea Buckthorn Seed Powder Provides Protection in the Oxidative
Stress Produced by Thermally Oxidized Sunflower Oil in Rabbits. Food Biochemistry
38(5), 498–508.
Zolotareva, A.M., Gabanova, G.V. & Chirkina, T.F. 2005. Seeds of sea-buckthorn as a food
source of biologically active substances. Storage and processing of farm products 1,
30–31, (in Russian, English abstract).

1457
Agronomy Research 16(S2), 1457–1465, 2018
https://doi.org/10.15159/AR.18.096
The effect of sapropel extracts on microflora and
physicochemical parameters of Dried Distillers’ Grain
D. Nsengumuremyi1,*, N.V. Barakova1, V.A. Romanov1, A.S. Mityukov2 and
A.V. Guzeva2
1Saint Petersburg National Research University of Information Technology, Mechanics,
and Optics, Department of Food Biotechnology (Vegetable stock), Lomonosova street 9,
RU191002 St. Petersburg, Russia 2Federal State-funded Scientific Establishment, ‘Russian Academy of Sciences (RAS)
Limnology Institute’ (INOZ RAN), Syevasťyanova street 9, RU196105 St. Petersburg,
Russia *Correspondence: [email protected]
Abstract. This article is devoted to the effect of ultradispersed humate sapropel extracts, obtained
from air-dry samples of sapropel, from Seryodka deposit (Pskov region, Russia) by alkaline
extraction under the action of ultrasonic radiation, on microbial and physicochemical parameters
of Distillers’ grain (DG) during storage. At the end of the distillation, wet DG was divided and
treated with sapropel extract. The untreated sample served as a control. Both (treated and
untreated) were then dried to 10% moisture content. Microbial and physicochemical parameters
(moisture content, pH, titrable acidity (TA), acid value (AV) of fats) were assessed before storage
of dried DG. A similar experiment was repeated after one week of storage but on microbial load.
The microbial counts ranged from 2.3 × 10⁴ CFU g-1 (untreated) to 1.77 × 10⁴ CFU g-1 (treated)
before storage while 2.5 × 10⁴ CFU g-1to 2.18 × 10⁴ CFU g-1 accounted for after a week of
storage. The pH had increased from 4.5 ± 0.1 to 6.1 ± 0.1 before and after treatment respectively.
TA likewise decreased from 3.2 ± 0.4 to 2.03 ± 0.06%. The results showed that sapropel extracts
had effects on microflora and physicochemical parameters of DDG.
Keywords: Grains, pH, Acid Value, microflora, humic acid, fungicidal properties.
INTRODUCTION
Distillers’ grains (DG) are primary fermentation by-products obtained after the
fermentation of cereal grains by yeast into alcohol (Clark et al., 1987). It is valuable
secondary by-product after ethanol production but due to its high moisture content pose
a challenge in storing it. Wet DG approximately contains 77–81% of moisture (Aliyu &
Bala, 2011). High moisture, the residue of fermentable sugars and other nutrients make
DG a niche for microorganisms resulting in rapid degradation (Russ et al., 2005).
To curtail this menace (microbial instability), multi-stage separation and drying of DG
were adapted. Drying is an alternative for DG preservation with the additional merit of
reduced DG volume, hence decreased transport and storage costs (Santos et al., 2003).

1458
According to GOST 31809-2012, the shelf life of the dried DG is 6 months.
However, improper storage of DG can lead to the development of foreign microflora,
which results in excretion of mycotoxins. These mycotoxins can interfere with the
immune system of livestock’s predisposing them to diseases (Emtsev, 2006).
DG has been designated as high-protein-energy substitutes for feeding livestock.
Series of research has been carried out concerning the feeding (nutritional) value of DG.
With respect to energy, DG possesses equal to slightly greater feeding value in
comparison to corn. Nevertheless, vital research has suggested that DG could be
employed as a protein source, which is equivalent to soybean and other protein base
feeds utilized in feeding cattle (Coupe et al., 2008). The sort of grain utilized, technology
and drying procedure can significantly impact the end product of DG, thus varies in
chemical composition (pH, proteins, reducing sugar, amino acids, total acidity, an acid
value of fat, etc.) and physical parameters (moisture content, odour, colour, and
lightness) (Cromwell et al., 1993).
According to Emeis & Weissert (2009), sapropel is the term used to describe
‘organic-rich fine-grained sediments deposited in lake and oceans’ water. Also,
Avdeyeva et al. (2009) defined sapropel as dark-colour sediments that are rich in organic
matter, formed under anaerobic conditions from a dead organic matter of anhydrobiotic
microflora and microfauna.
It has been noted that three vital constituents of sapropel interact with each other:
biologically active, organic and mineral (Kireycheva & Khokhlova, 1998). Our previous
work has shown the fungicidal potentials of ultradispersed humic sapropel suspensions.
Sapropel extracts have proven to have significant fungicidal properties depending on
volume applied, even in small doses (Barakova et al., 2017).
The important role of sapropel on the stored Dried DG (DDG) cannot be ignored
since it alters the chemical composition and physical parameters due to the humic acid
contained in it. The biological effects of humic substances are based on the diversity of
their reaction groups, which enable them to participate in a variety of biochemical
transformations (Perminova, 2008; Savchenko, 2015). The presence of carboxyl groups
allows participation in ion exchange, hydroxyl reactions, carbonyl in oxidation-
reduction reactions, etc. (Perminova, 2008).
Sapropel extracts treatment of animal feed has reported improving livestock
productivity (Kireycheva & Khokhlova, 2000). Sapropel is a unique organic feed, which
is promising to use in various sectors of industry, agriculture, livestock farming,
medicine and balneology (Plaksin & Krivonos, 2007).
The aim of the present study is to show the effect of sapropel extract on microflora,
chemical composition and physical parameters of DDG obtained after production of
ethanol from barley grains.
MATERIALS AND METHOD
The objects of the study were ultradispersed humic sapropel suspensions obtained
in RAS Limnology Institute with alkaline extraction and ultrasound treatment of air-dry
sapropel from Seryodka deposit (Pskov region, Russia). Sapropel extracts used was
obtained from hot method extraction at 40 °C.

1459
Analysis and optimization of sapropel extracts A rotary evaporator EV 130 (LabTech) was used to increase the concentration of
sapropel extracts. The sapropel obtained from hot method extraction had 3.5% of dry
matter and the evaporation was carried out to increase the concentration to 20%.
Automatic Titrator 848 Titrino Plus (Metrohm) was used for determination of
sapropel extracts pH. The device operates in two modes: titration with automatic
endpoint determination and pH measurement. The latter was used in the experiments.
Time of assay was no less than 5 minutes, and sometimes more in case of decimals other
than the last digit being unstable.
Refractometer PTR 46 (Index Instruments) was used for measurement of the
concentration of dry matter in sapropel extracts.
Determination of moisture and starch content of barley
Moisture analyser MOC-120H (Shimadzu) was used for assessment of all barley
grains and flour moisture content according to ISO/TC 34 (ISO/TC 34, 2009).
The barley used in this experiment was harvested in Russia within the 2016 season.
The starch content of the barley was determined by using Polarimeter (PolAA
FF55). The determination of the starch content of barley was conducted according to
ISO/TC 93- Ewers polarimetric method (ISO/TC 93, 1997).
Production of ethanol
Barley grains (10 kg) were weighted and milled in a milling machine (SINBO
SCM-2929). Mashing, fermentation and distillation were carried out in Dr Guber factory.
The milled barley was then mixed with 35 L of warm water (50 °C). An amount of
alpha amylase (13.6 mL) and xylanase (13.7 mL) was then pipetted into the solution, for
a rest period of 30 minutes. The temperature was then increased to 70 °C, for a rest
period of 4 hours.
A sample of wort was taken at 30 min intervals and the concentration of dry matter
(°Brix) was measured using a refractometer. The final wort was allowed to cool down
to a temperature of 30 °C. Saccharomyces cerevisiæ (8.4 g) was reactivated, 10 min
before pitching. Glucoamylase (5.6 mL) was then added to the pitched wort. All
enzymes used are from Erbslöh (Germany).
Fermentation was then carried out at a temperature of 30 °C for 72 hrs. After the
72 hrs of fermentation, a distillation of the fermented wash was then performed.
Distiller’s grain collection and treatment
After distillation, Wet distillers’ grains was then collected and centrifuged at
4,600 rpm for 10 minutes and stored in the freezer before their analysis (Fig. 1).
An amount of 20 mL of sapropel extracts (20% of dry matter and pH 7) (Fig. 2)
was sprinkled on 100 g of distillers’ grain followed by uniform mixing. The mixture was
allowed for a 30 minutes rest period (undisturbed). A control sample of the same mass
(untreated) was also observed (Fig. 3). Samples (treated and untreated distillers’ grains)
were then dried in cabinet dryer (ES-4610) at a temperature of 100 °C.

1460
Figure 1. Wet Distiller’s grain in plastic packet before drying and analysis.
Figure 2. Sapropel extracts (20% of dry matter and pH 7) before sprinkling on wet distillers’
grain.
Figure 3. Dried DG 10% of moisture content, treated sample (left) and untreated (right).
Microbiological analysis of DDG
For microbiological analysis, 10 g of each sample (treated and untreated) of DDG,
was taken and mixed with 100 mL sterilized distilled water in the different conical flask
and the latter was shaken for 10 minutes. Quantification of the microbial load was then
carried out according to the method described by Adadi and Obeng (2017). The

1461
remaining DDG was stored in a thermostat TS-1/80 SPU at 37 °C for further microbial
investigation after one week.
Physicochemical parameters determination
After microbiological analysis, physicochemical parameters (Moisture content, pH,
Titratable acid (TA) and Acid value (AV) of fat) were then determined.
The moisture content of Dried Distiller’s grains was measured according to ISO/TC
34 (ISO/TC 34, 2009).
The titratable or total acidity (TA) of DDG was determined according to GOST
13496.12-98 (GOST 13496.12, 1998).
Fat Acid Value (AV) was determined according to GOST 13496.18-85. In our
research, the potentiometric titration method written in GOST 13496.18-85 was used to
determine AV. The essence of this method consists in potentiometric titration of fatty
acids extracted from the product by extraction with a mixture of chloroform and ethyl
alcohol (GOST 13496.18, 1986).
Data generated were subjected to analysis of variance (ANOVA) using Origin
statistical software (version 8.1) at 5% significance. All measurements were made at
least in triplicate. Results were reported as means ± standard deviations.
RESULTS AND DISCUSSION
The moisture and starch content of the raw barley grains determination
The moisture and starch content of the raw barley grains were determined in the
present study and results are reported in Table 1.
The determination of the amount of
moisture is one of the most fundamental
and important analytical procedures that
can be performed on a food product
(Aurand et al., 1987). In brewing and
whiskey ventures, starch content of the raw
material is very crucial. This has a
significant impact on the concentration of
ethanol and composition of dried DG.
Variation of the concentration of
dry matter during mashing process
The concentration of dry matter was
measured and results were recorded in
Table 2.
Wort samples were taken at 30 min
interval until the mashing was over
(270 min) which allowed for the
concentration of solids (°Brix) to be plotted
against time (Fig. 4).
Table 1. Starch and moisture content of
barley
Parameters Concentration
(%)
Moisture content 8.53 ± 0.07
Starch content 52.05 ± 0.05
Table 2. Variation of the concentration of
dry matter (°Brix) during mashing process
Time (min) Concentration of dry
matter (°Brix)
30
60
90
120
150
180
210
240
270
3.7 ± 0.3
12.3 ± 0.4
14.1 ± 0.5
16.2 ± 0.1
16.9 ± 0.1
17.6 ± 0.2
17.7 ± 0.1
17.9 ± 0.1
18.2 ± 0.1

1462
Figure 4. Variation of the concentration of dry matter (°Brix) during mashing process.
Amylase enzymes involved in the transformation of starch into fermentable sugars
is temperature dependent, so as the mashing proceeds heat also increase aiding the
activations of the enzymes. The increase in concentration of dry matter (°Brix) cannot
remain persistent due to the deactivation of the enzymes at high temperature. Adadi et
al. (2017) studied the concentration of dry matter (°Brix) kinetic during fermentation of
beer supplemented with Hippophae rhamnoides.
The effect of sapropel on DDG’s microflora
Microbiological analysis of DDG was carried out and after incubation, colonies
were counted manually and the results were reported in Table 3.
Table 3. Microbiological results of un- and treated dried distillers’ grain before and after one
week of storage at 37 °C
Treatment Before storage (CFU g-1) After storage (CFU g-1)
Untreated DDG
Treated DDG
2.3×10⁴
1.77×10⁴
2.5×10⁴
2.18×10⁴
CFU - colony forming unit; g- gram of dried distillers ‘grain.
In the present study, sapropel inhibited the growth of microflora on treated DDG.
However, there was an inhibition of the untreated DDG, which could be a result of
environmental effects (temperature, pressure, pH etc.). According to Adadi & Obeng
(2017), pH is very important and has a major influence on microbial growth. Moreover,
the antibacterial and antifungal properties of sapropel have been reported. Barakova et
al. (2017) showed the fungicidal potency of sapropel extracts. However, these properties
depend on the quantity utilized. Bactericidal properties of sapropel have also been
elucidated by Buzlama & Chernov (2010), which are due to humates and humic
substances (humic acids in humic acids group). These compounds could inhibit the
proliferation of some groups of bacteria. Russell & Diez-Gonzalez (1998) explained how
coupling mechanism is altered by acids transported across the cell membrane. This
blocks the production of ATP thereby arresting the ability of anabolism.

1463
The effect of sapropel extracts on physicochemical parameters of DDG
Physicochemical parameters of DDG were determined during this experiment and
recorded in Table 4.
Chemical parameters of DDG were undoubtedly changed due to the application of
sapropel extract. The chemical and physical characteristics of DDG were determined
routinely as part of quality management. According to GOST 31809-2012, the moisture
content of DG feed should be not less than 5 and not more than 10. DDG (treated and
untreated) in the present study were in range: 5 < 9.96 < 10 (Table 4).
Table 4. Physicochemical parameters of un- and treated dried distillers grain
Physicochemical parameters Untreated DDG Treated DDG
Moisture content (%) 9.96 ± 0.06 9.96 ± 0.06
pH 4.5 ± 0.1 6.1 ± 0.1
Titratable acidity (TA) (%) 3.2 ± 0.4 2.03 ± 0.06
Acid Value (AV) (mg g-1) 2.89 ± 0.04 1.26 ± 0.01
The pH had increased from 4.5 ± 0.1 to 6.1 ± 0.1 before and after treatment
respectively. TA likewise decreased from 3.2 ± 0.4 to 2.03 ± 0.06%. Prior to the
treatment, DDG was more acidic than after treatment. pH is important to assess the
ability of a microorganism to grow in a specific environment. According to Adadi et al.
(2017a) and Adadi (2017b), the lower a pH value, the higher TA.
The role in acidulation is influenced by inorganic acids like carbonic acid and
phosphoric acid from carbon and phosphorus elements respectively whereas organic
acids affect flavour, colour, microbial stability and keeping the quality of feed (Tyl &
Sadler, 2017). Sapropel is not rich in inorganic acids but it could affect the TA of DDG
due to its organic-rich sediments. A decrease (from 2.89 ± 0.04 to 1.26 ± 0.01 mg g-1) in
acid value (AV) was also observed. AV was expressed in milligrams of potassium
hydroxide per gram of fat (Table 4).
CONCLUSION
In this study, sapropel extracts have shown its effect on microflora and physical
parameters and chemical composition on DG. Sapropel extracts could be of great help
to the food industries and other grain-related fields due to its unique organic acids. The
potency of sapropel extracts depends on the amount used, its pH and concentration of
dry matter hence these parameters should always be monitored for optimal results.
Sapropel could aid to reduce the quantity of microorganisms in DG after treatment. On
the other hand, sapropel can increase the growth rate of microorganisms during storage.
Further research is needed in order to get better understanding of these relations.
REFERENCES
Adadi, P. & Obeng, A.K. 2017. Assessment of bacterial quality of honey produced in Tamale
metropolis (Ghana). J. Food. Drug.Anal. 25, 369–373.

1464
Adadi, P., Kovaleva, E.G., Glukhareva, T.V. & Shatunova, S.A. 2017a. Biotechnological
production of non-traditional beer. In: Valeeva A.A & Volkovich, V.A. (ed.) Physics,
Technologies and Innovation (PTI-2017): IV International Young Researchers Conference,
AIP Conference Proceedings, Melville, USA, pp. 1–13.
Adadi, P., Kovaleva, E.G., Glukhareva, T.V., Shatunova, S.A. & Petrov, A.S. 2017b. Production
and analysis of non-traditional beer supplemented with sea buckthorn. Agronomy Research
15, 1831–1845.
Aliyu, S. & Bala, M. 2011. Brewer’s spent grain: a review of its potentials and applications Afr.
J. Biotechnol. 10, 324–331.
Aurand, L.W. & Woods, A.E. & Wells, M.R. 1987. Food composition and analysis. Van
Nostrand Reinhold, New York, 19–34, 178–230 pp.
Avdeyeva, L.N., Kovalenko, T.A., Krivonos, O.I., Plaksin, G.V. & Strunina, N.N. 2009.
Determination of sapropel chemical composition. Chemistry and Chem. Eng. 52, 121–123
(in Russian).
Barakova, N.V., Sharova, N.Y., Juskauskajte, A.R., Mityukov, A.S., Romanov, V.A. &
Nsengumuremyi, D. 2017. Fungicidal activity of ultradispersed humic sapropel
suspensions. Agronomy Research 15, 639–648.
Buzlama, A.V & Chernov, Yu.N. 2010. Analysis of pharmacological properties, mechanisms of
action and prospects for the use of humic substances in medicine. Experimental and clinical
pharmacology 73, 43–48.
Clark, P., Givens, D.I. & Brunnen, J.M. 1987. The chemical composition, digestibility, and
energy value of fodder-beet roots. Anim. Feed Sci. Technol. 18, 225–231.
Coupe, L.R., Lardy, G.P., Meyer, A.M., Neville, B.W., Leupp, J.L. & Canton, J.S. 2008. Effects
of corn condensed distillers solubles supplementation on performance and dry matter intake
of beef cows consuming forage – based diets. J. Anim Sci. 59, 346–349.
Cromwell, G.L., Herkelmad, K.L. & Stah, T.S. 1993. Physical, Chemical, and Nutritional
Characteristics of Distillers Dried Grains with Solubles for Chicks and Pigs. J. him. Sci. 71,
679–686.
Emeis, K.C. & Weissert, H. 2009.Tethyan-Mediterranean organic carbon-rich sediments from
Mesozoic black shales to sapropels. Sedimentology 56, 247–266.
Emtsev, V.T. & Mishustin, E.N. 2006. Microbiology: a textbook for universities- 6thed. Drofa,
Moscow, 444 pp. (in Russian).
GOST 13496.12-98 (Interstate Standard), 1998. Mixed fodders, mixed fodder raw materials:
Method for determination of total acidity. http://internet-law.ru/gosts/gost/8879 updated:
04.04.2015 (in Russian).
GOST 13496.18-85 (Interstate Standard). 1986. Mixed fodder and fodder raw stuff. Methods for
determination of fat acid value. http://internet-law.ru/gosts/gost/20120 updated:
21.12.2017 (in Russian).
ISO/TC 34.(International Organization for Standardization Technical Committee 34). 2009.
ISO 712: 2009 Cereals and cereal products – Determination of moisture content.
https://www.iso.org/obp/ui/#!iso:std:44807:en. Reviewed in 2014.
ISO⁄TC 93 (International Organization for Standardization Technical Committee 93),
1997.ISO10520:1997 Native starch – Determination of starch content – Ewers polarimetric
method. https://www.iso.org/obp/ui/#iso:std:iso:10520:ed-1:v1:en. Accessed: 03.31.2017.
Kireycheva, L.V. & Khokhlova, O.B. 2000. Elemental composition of humic substances in
sapropel deposits. RAAS Newsletter 4, 59–62 (in Russian).
Kireycheva, L.V., Khokhlova, О.B. 1998. Sapropels: composition, properties, application. M.
Science. 124 pp. (in Russian).
Perminova, I.V. 2008. Humic substances – a challenge to chemists of the XXI century. Chem.
Life 1, 50–55 (in Russian).

1465
Plaksin, G.V. & Krivonos, O.I. 2007. Thermochemical processing of lake sapropels: composition
and properties of products. Russian Chemical Journal 4, 140–147 (in Russian).
Russ, W., Mortel, H. & Meyer-Pittroff, R. 2005.Application of spent grains to increase porosity
in bricks. Adv. Chem. Eng. Sci. 4, 117–126.
Russell, J.B. & Diez-Gonzalez, F. 1998.The effects of fermentation acids on bacterial growth.
AdvMicrob Physiol. 39, 205–234.
Santos, J.E.P., Villaseñor, M., Robinson, P.H., DePeters, E.J. & Holmberg, C.A. 2003. Type of
cottonseed and level of gossypol in diets of lactating dairy cows: plasma gossypol, health,
and reproductive performance. J. Dairy Sci. 86(3), 892–905.
Savchenko, I.A. 2015. Chemical and pharmaceutical research of humic substances of sapropel
of Lake Gorchakov. Dissertation of the candidate of Pharmaceutical Sciences, Ulan-Ude,
22 pp. (in Russian).
Tyl, C. & Sadler, G.D. 2017. pH and Titratable Acidity. Food Analysis, 5th Ed. Food Science
Text Series. Springer, Cham. pp. 389–406.

1466
Agronomy Research 16(S2), 1466–1474, 2018
https://doi.org/10.15159/AR.18.053
Effect of impact-activating-disintegration treatment on grain
protein fraction of autumn rye
А.А. Sabirov1,*, N.V. Barakova1 and Е.А. Samodelkin2
1Saint Petersburg National Research University of Information Technologies,
Mechanics and Optics (ITMO University), Lomonosov street 9, RU191002,
St. Petersburg, Russia 2Research Institution Research Center 'Kurchatov Institute'- Central Research Institute
for Engineering Materials ̒Prometheus̕, Shpalernaya street 49, RU191015 St. Petersburg,
Russia *Correspondence: [email protected]
Abstract. This paper studies the distribution of rye protein fractions according to their mass and
amino acid composition while milling by machines with different work tools. The research was
conducted on the autumn rye of harvest year 2017 with kernel moisture content of 8%. Cereals
were milled in the machine of an impact-activating-disintegrating type DEZI-15 with three-row
and five-row rotors which rotate at 120 s-1, and in the laboratory mill with a knife-rotor work tool.
The milling grain size was determined by a diffraction-type grain analyser Malvern Mastersizer
2000. The average grain size obtained from three-row disintegrating rotor was 167 µm, from the
five-row rotor 158.1 µm, and from the laboratory knife-rotor mill 384 µm, respectively. The free
amino acids composition in flour samples was investigated using the size exclusion
chromatography method (SEC-method). The polypeptide composition of total grain protein has
been determined by One-dimensional SDS-acrylamide gel electrophoresis. According to the
electropherogram results obtained from all the the content of high-protein fraction of 200 kDa.
The glutelin fraction with molecular weight of 116.25 kDa is definitely observed in the sample
obtained from the three-row disintegrating rotor. Whereby the lowest glutelin content has been
detected in the flour sample obtained from the five-row disintegrating rotor. Fractions with
molecular weight of 60–75 kDa – globulin fractions – come up frequently in the sample obtained
from the three-row disintegrating rotor. Prolamine fractions of 45–47 kDa are clearly observed
in the flour sample obtained from the laboratory knife-rotor mill. The albumin fraction with
molecular weight of 17–28 kDa are mostly observed in the samples obtained by three-row and
five-row disintegrating rotors. Few LMW fractions (from 6.5 to 15 kDa) are found in samples
obtained using the impact-activating-disintegrating technique, mostly in the sample milled in the
laboratory knife-rotor mill. Based on the data of free amino acid content in sample investigated
it can be concluded that the impact-activating-disintegrating techniques does not cause reduction
in protein biological value. The albumin rich flour milled in the disintegrator can be used for
production of functional food. Due to the low content of glutelin protein fraction the flour
obtained from the five-row disintegrating rotor offers the greatest promise for production of
gluten-free foods.
Key words: impact-activating-disintegrating technique, autumn rye, protein fractions, amino
acid composition, biological value foods.

1467
INTRODUCTION
Cereal products constitute an important part of everyday diet. They provide 21% of
calories, 38% of carbohydrates and 20% of protein in human nutrition in protein being
the second only to meat products (Bulgakov, 1976).
The promising raw material for food production is rye. Having enhanced root
system this crop is one of the most cold-resistant with no demand of soil fertility.
Moreover, rye protein is better balanced in composition of essential amino acids (8–
16%) compared to wheat and barley protein because of high content of lysine (up to
0.619 g 100 g-1), valine, threonine and methionine. Rye contains antioxidants, especially
phenolic acid and polyphenols that protect body tissues from oxidative stress and cell
death and prevent chronic diseases such as cardiovascular, nervous degenerative
disorders and carcinomata. The merits of rye are rich vitamin composition, especially B
group, and the content of macro- and microelements such as potassium, phosphorus,
magnesium, manganese, iron, copper, zinc, selenium and others (Bakhitov et al. 2008).
The rye protein consists of the following fractions. Concentration of water-soluble
proteins – albumins – is usually 5–15% of the total amount, but can be up to 30%.
Salt-soluble proteins – globulins in the rye grain are about 15–25%, alcohol-soluble
proteins – prolamines – account for 15–25%, alkali-soluble proteins – glutelins are about
30–40%.
The rye grain contains also other nitrogen compounds in small amounts: free amino
acids and their amides, peptides, basic nitrogen and nucleotides, nucleic acids, etc. They
account for 5–10% of the total amount of grain nitrogenous matter. Mostly they are
found in the kernel and aleurone layer.
The rye protein fractions vary in amino acid composition as well as in the content
of essential amino acids which determine the biological value of proteins. Albumins are
of the greatest biological value, they contain the best ratio of all the essential amino
acids, with some deficit in the content of methionine. Globulins are also characterized
by a well balanced amino acid composition, although their content of some essential
amino acids is lower compared to albumin (methionine, tryptophan, leucine).
Rye glutelins are characterized by a rather strong deficit of lysine, tryptophan and
methionine. Prolamins have the lowest biological value. They are distinguished by a
very low content of essential amino acids such as lysine, tryptophan, methionine, and a
high concentration of glutamic acid and proline which accounts for up to 40–55% of the
mass of these proteins (Rybakova & Glebova, 2012).
In food production technology the presence of different protein fractions of raw
material plays an essential role. In the zymurgy the greater presence of free amino acids
and LMW protein fractions intensify the output of ethyl alcohol due to consumption of
α- amine nitrogen by yeasts (Rimareva et al.; 2008, Rimareva, 2010). In starch and grain
syrup production and brewing reduction in content of HMW proteins facilitates the
processes of filtration and clarification of wort, as well stabilizes the fobbing (Tretiak,
2009; Donkova & Donkov, 2014; Danina & Ivanchenko, 2015; Sergeeva, 2016). Thus,
the main task of most food production technologies based on grain raw materials is to
destruct the protein matrix into LMW components that increase their solubility
(Maltseva, 1999; Sereda et al., 2010; Shakir et al., 2017). Additionally, the degradation
of protein frame may lead to greater availability of other valuable components of grain

1468
raw materials such as starch (Stepanov et al., 2007; Alekseeva et al., 2011; Amelyakina
et al., 2011).
Currently, the following machines can be employed for fine grain milling: mills –
ball mills, vibration mills, ball electromagnetic mills, disintegrators and dismembrators,
roll-oscillating mills, jet mills, ultrasonic mills, devices with velocity layer of
ferromagnetic particle etc. (Kalinina et al., 2002: Sotnikov et al., 2002; Smirnova &
Krechetnikova, 2005; Likhtenberg et al., 2007; Barakova & Ustinova, 2010; Oshkordin
et al., 2011; O. Lomovsky & I. Lomovsky, 2011; Romanyuk et al., 2013).
The latest methods of grain handling also include the extrusion technology. The
application of extrusion devices allows to produce new products from the vegetable
feedstock as well as to enhance the current processes such as production of wort with
high content of dry solids weight ratio up to 36 percent, usage of raw materials with high
content of no starch polysaccharides, etc. (Nachetova & Barakova, 2013).
The deep grain destruction can be conducted by infrared grain handling (infrared
radiation). Since the fluence rate of infrared radiation is high enough, the moisture
concentrates in the grain which is heated up to 110–115 °C causing rapid increase of the
vapour pressure and decrease of grain strength properties (Krikunova et al.; 2004,
Andrienko et al., 2007).
However, we have the evidence that the employment of rough grain processing
methods, such as extrusion and micronization (IR-treatment), reduces the biological
value of processed grain. As a result the main amino acids of the grain milled are limited
with the total amount of α-amine nitrogen reduction (Martirosyan & Malkina, 2010;
Bikchantaev et al., 2016).
Another way of deep grain processing techniques of special interest is the impact
devices such as disintegrators. One of the most important features of disintegrators is
that the material processed is subjected to mechanical activation. The activation of
particles applying high mechanical energy is the new advanced type of improvement of
technological processes in various industries (Boldyrev, 2006; Sabirov et al., 2017a).
Disintegrators are the devices which function is based on the free impact principle
(that's why the device name includes the term impact). In the 1980s, the specialists of
the design and technology bureau ‘isintegrator ̕ (Tallinn, Estonia) developed the
advanced design of disintegrators allowing to obtain fine milled mixtures. The material
being milled is continuously fed into the mixing chamber in the middle between two
high-speed counterrotating rotors. Impact tools are located on each rotor along the
concentric circles. Rotors run into each other in such a way that the concentric circles
with pins of one rotor come into the concentric circles with pins of another one.
The advantage of such disintegrators compared to other milling units is the rapidity
of milling processes when the material processed therein within 10 s-1 receives 2 to 7
high-intensity impacts (Alimova et al., 2014; Sabirov et al., 2017b).
Research in the field provides the evidence of deep mechanochemical destruction
of grain components on the example of winter wheat grains subjected to the impact-
activating-disintegrating technique. As the electron microscopy method shows in the
case of the impact-activating-disintegrating treatment the grain endosperm is deeply
destructed. The starch grain of the endosperm takes an oval-round and lenticular shape,
its size ranges from 25 to 40 μm. The protein matrices after the impact-activating-
disintegrating treatment have more developed surface, the interspace protein can be
separated much easier releasing more starch grains and partially leaving the starch grains

1469
in the protein matrix provided that the interspace protein of glassy endosperm is
destructed during milling together with the firmly linked starch kernel.
Using the gas chromatography method it was found that during the impact-
activating-disintegrating treatment of grain we observe the following: glucose (percent)
– 1.41 (three-row rotor), 1.48 (five-row rotor), as well as maltose (percent) – 2.05 (three-
row rotor), 1.84 (five-row rotor) while in the case of the rotor milling (close to treatment
by rolls) the glucose content in the sample is 1.21 percent. In this case we observe the
total absence of maltose. This fact indicates that during the impact-activating-
disintegrating treatment of grain starch is destructed without an enzymatic process
(Barakova & Tishin, 2010).
It is worth mentioning that today scientific literature in the field provides no
information on size distribution of grain proteins processed by a disintegrator. Thus, the
paper studies the change in the size distribution of proteins as well as free amino acids
of winter rye after the impact-activating-disintegrating treatment.
MATERIALS AND METHODS
This paper studies rye flour samples milled by machines with different work tools.
The research was conducted on the first class rye of harvest year 2017. The moisture and
starch content of test kernels were found to be 8 and 65% respectively. The rye grain
moisture content was detected with Shimadzu МОС-120Н. The amount of highly
soluble carbohydrates was determined with the polarimeter AA-55 by Optical Activity.
For the experimental purposes cereals were milled in the machine of an impact-
activating-disintegrating type DEZI-15 with three-row and five-row rotors (Central
research institute for engineering materials ̒Prometheus̕, Saint Petersburg). The reference
sample was the grain milled in a laboratory mill with a knife-rotor work tool. The milling
grain size was determined by diffraction-type grain analyzer MalvernMastersizer 2000.
The average grain size obtained from three-row disintegrating rotor was 167 µm, from
the five-row rotor – 158.1 µm, and from the laboratory knife-rotor mill – 384 µm,
respectively.
The free amino acids composition in flour samples was investigated using the size
exclusion chromatography method (SEC-method). In order to determine the quantitative
composition of free amino acids in flour the sample was put into 1n hydrochloric acid,
then trichloracetic acid was added for sedimentation of non-hydrolized proteins. The
sample was kept during 30 minutes, then centrifuged. The supernatant (filter cake) was
used for the analysis of free amino acids applying the SEC-method. The analytical
tolerance is 0.5% or less.
The polypeptide composition of total grain protein was determined by One-
dimensional SDS-acrylamide gel electrophoresis of acrylamide concentration gradient
10–20% in a separating gel (рН = 8.8) and 6% acrylamide in a stacking gel (рН 6.8).
The running buffer was tris-glycine buffer (рН = 8.3) containing 0.1% SDS.
Electrophoresis was conducted at constant current (25–30 mА) within 6–7 h at 4–60 °С.
RESULTS AND DISCUSSION
Analysis of protein fractions of rye flour samples studied is shown in Fig. 1.
According to the electropherogram obtained all samples showed the content of high-

1470
protein fraction of 200 kDa. 116.25 kDa fraction is definitely observed in the sample
obtained from the three-row disintegrating rotor – this is a glutelin fraction. The lowest
content of glutelins can be found in the flour samples obtained from the five-row
disintegrating rotor.
Figure 1. Electropherograms of protein fractions of rye flour samples. М – marker;
1 – electropherogram of the rye flour sample obtained in the laboratory mill with a knife-rotor
work tool; 3 – electropherogram of the rye flour sample obtained from the three-row
disintegrating rotor; 5 – electropherogram of the rye flour sample obtained from the five-row
disintegrating rotor.
Fractions with molecular weight of 60–75 kDa – globulin fractions – are frequently
found in the sample obtained from the three-row disintegrating rotor. Prolamine fractions
of 45–47 kDa are clearly observed in the flour sample obtained from the laboratory
knife-rotor mill. The albumin fraction with molecular weight of 17–28 kDa are mostly
observed in the samples obtained by the three-row and five-row disintegrating rotors.
Few LMW fractions (from 6.5 to 15 kDa) are found in samples obtained using the
impact-activating-disintegrating technique, mostly – in the sample milled in the
laboratory knife-rotor mill.
Thus, the flour milled by the three-row disintegrating rotor is richer in the glutelin
protein fraction and hence is more suitable for bakery product production. The glutelin
fraction present in flour comprises of two proteins gliadine and glutenin plays role for
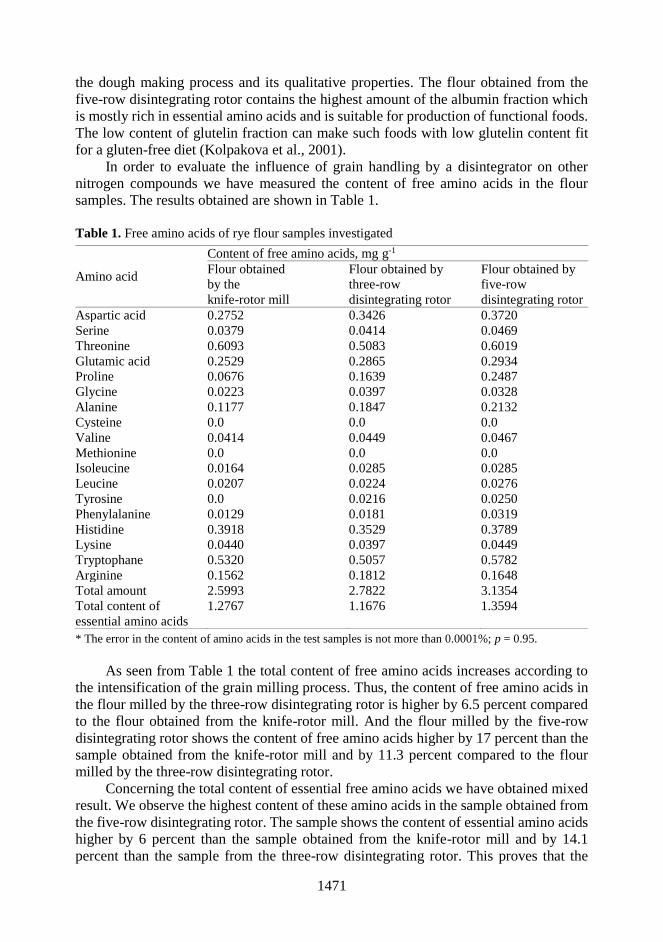
1471
the dough making process and its qualitative properties. The flour obtained from the
five-row disintegrating rotor contains the highest amount of the albumin fraction which
is mostly rich in essential amino acids and is suitable for production of functional foods.
The low content of glutelin fraction can make such foods with low glutelin content fit
for a gluten-free diet (Kolpakova et al., 2001).
In order to evaluate the influence of grain handling by a disintegrator on other
nitrogen compounds we have measured the content of free amino acids in the flour
samples. The results obtained are shown in Table 1.
Table 1. Free amino acids of rye flour samples investigated
Amino acid
Content of free amino acids, mg g-1
Flour obtained
by the
knife-rotor mill
Flour obtained by
three-row
disintegrating rotor
Flour obtained by
five-row
disintegrating rotor
Aspartic acid 0.2752 0.3426 0.3720
Serine 0.0379 0.0414 0.0469
Threonine 0.6093 0.5083 0.6019
Glutamic acid 0.2529 0.2865 0.2934
Proline 0.0676 0.1639 0.2487
Glycine 0.0223 0.0397 0.0328
Alanine 0.1177 0.1847 0.2132
Cysteine 0.0 0.0 0.0
Valine 0.0414 0.0449 0.0467
Methionine 0.0 0.0 0.0
Isoleucine 0.0164 0.0285 0.0285
Leucine 0.0207 0.0224 0.0276
Tyrosine 0.0 0.0216 0.0250
Phenylalanine 0.0129 0.0181 0.0319
Histidine 0.3918 0.3529 0.3789
Lysine 0.0440 0.0397 0.0449
Tryptophane 0.5320 0.5057 0.5782
Arginine 0.1562 0.1812 0.1648
Total amount 2.5993 2.7822 3.1354
Total content of
essential amino acids
1.2767 1.1676 1.3594
* The error in the content of amino acids in the test samples is not more than 0.0001%; p = 0.95.
As seen from Table 1 the total content of free amino acids increases according to
the intensification of the grain milling process. Thus, the content of free amino acids in
the flour milled by the three-row disintegrating rotor is higher by 6.5 percent compared
to the flour obtained from the knife-rotor mill. And the flour milled by the five-row
disintegrating rotor shows the content of free amino acids higher by 17 percent than the
sample obtained from the knife-rotor mill and by 11.3 percent compared to the flour
milled by the three-row disintegrating rotor.
Concerning the total content of essential free amino acids we have obtained mixed
result. We observe the highest content of these amino acids in the sample obtained from
the five-row disintegrating rotor. The sample shows the content of essential amino acids
higher by 6 percent than the sample obtained from the knife-rotor mill and by 14.1
percent than the sample from the three-row disintegrating rotor. This proves that the

1472
three-row disintegrating rotor has less mechanochemical effect on the raw material
milled. Amino acids such as arginine and histidine, which are essential for a child's body,
are totally the same in all three flour samples investigated (Soboleva et al., 2015).
Based on the data proven we can assume that grain milling by the disintegrator shall
changes the mechanochemical structure of the raw materials handled causing the
increase of the diffusion properties of LMW components. Moreover, the impact-
activating-disintegrating technique does not reduce the biological value of proteins
compared to such methods as the extrusion or micronization.
CONCLUSIONS
The paper shows that the impact-activating-disintegrating technique for rye milling
allows to obtain a fine milled grain with the high biological value compared to the
techniques and devices employed today because:
the total content of water-soluble protein particles is higher in flour samples
obtained by disintegrator;
the total content of free amino acids is also higher in flour samples obtained from
rye treated by the impact-activating-disintegrating technique.
The albumin rich flour milled in the disintegrator can be used for the production of
functional food. Due to the low content of glutelin protein fraction the flour obtained
from the five-row disintegrating rotor is likely to be the most promising for the
production of gluten-free foods.
REFERENCES
Alekseeva, N., Faradzheva, E. & Chusova, A. 2011. Development of comprehensive grain to
alcohol processing technology with partial separation of starch. Production of alcohol and
liqueurs and spirits 1, 7–8 (in Russian).
Alimova, D., Barakova, N., Nachetova, М. & Samodelkin, Е. 2014. Water-heat treatment of rye
mashes with a reduced hydromodule and preservation of activity of native alpha-amylase.
Storage and processing of agri supplie 11, 18–21 (in Russian).
Amelyakina, M., Sharikov, A. & Stepanov, V. 2011. Innovation production technology of
ethanol and protein concentrate based on the integrated processes of grain single stage. In:
Scientific papers of the 5th Conference of young scientists and specialists of the Department
for storage and processing of agricultural products of the Russian Agricultural Academy,
pp. 28–30 (in Russian).
Andrienko, T., Polyakov, V. & Krikunova, L. 2007. Production of saccharified wort from
IR-processed rye grain. Storage and processing of agree supplies 7, 59–62 (in Russian).
Bakhitov, T., Chelnokova, E., Zaitseva, L. & Kolpakova, V. 2008. Resource efficient rye grain
processing techniques. News of Higher Educational Institutions. Food technology 5(6),
49–51 (in Russian).
Barakova, N. & Tishin, V. 2010. Investigation of the influence of enzyme preparations on the
viscosity of high-concentrated barley mashes in the production of ethyl alcohol. Production
of alcohol and liqueurs and spirits 4, 24–26 (in Russian).
Barakova, N. & Ustinova, A. 2010. Study of the influence of grain dispersion degree on
technological parameters in the production of alcohol from wheat. Technologies and
equipment of chemical, biotechnological and food industries: collection of research papers.
Biysk, pp. 220–224 (in Russian).
1473
Bikchantaev, I., Shakirov, S., Yagund, E. & Yakhin, R. 2016. Analysis of changes in the IR
spectra of winter rye seeds subjected to different types of moisture-thermal treatment.
Chemistry of plant products 1, 135–141 (in Russian).
Boldyrev, V. 2006. Mechanical chemistry and mechanochemical activation of solids. Advances
in Chemistry 75, 203–212 (in Russian).
Bulgakov, N. 1976. Biochemistry of malt and beer, Moscow, Food industry, 278 pp. (in Russian).
Danina, M. & Ivanchenko, O. 2015. Usage of extruded wheat in the breeding. Bulletin of the
International Academy of refrigeration 2, 18–22 (in Russian).
Donkova, N. & Donkov, S. 2014. Biotechnology of sugar production from grain raw materials.
Bulletin of the Krasnoyarsk state Agrarian University 6, 211–213 (in Russian).
Kalinina, O., Ledenev, V. & Krikunova, L. 2002. Development of high-performance, low-waste
technology of ethanol from rye grain based on the mechanical and cavitational processing,
1st stage of mash production. Storage and processing of agri supplies 6, 35–40 (in Russian).
Kolpakova, V., Krikunova, L. & Kononenko, V. 2001. Research of the possibility of obtaining
protein preparations from differentiated fractions of grain of rye and barley. News of higher
educational institutions. Food technology 5(6), 35–39 (in Russian).
Krikunova, L., Omisova, O. & Zhurba, O. 2004. IR processing of raw materials in alcohol
production. News of Higher Educational Institutions 4, 46–49 (in Russian).
Likhtenberg, L., Plyanitsa, A., Alekseeva, L., Fedoseev, V. & Parfennikova, N. 2007.
Implementation of wort production lines with hydrodynamic machining of grain mash at
alcohol plants. Production of alcohol and liqueurs and spirits 4, 13–18 (in Russian).
Lomovsky, O. & Lomovsky, I. 2011. Mechanochemically Assisted Extraction. Enhancing
Extraction Processes in the Food Industry. NY – London, CRC Press, pр. 361–398
(in Russian).
Maltseva, B. 1999. Resources-saving production technologies of lysine protein feed \supplements
based on the bioconversion of plant wastes from processing agrarian business. Ecological
Compliance in the agrarian business. Abstract journal 3, 724 pp. (in Russian).
Martirosyan, V. & Malkina, V. 2010. Change in the amino acid composition of cereal crops after
extrusion treatment. Basics of the state policy in the area of production of healthy foods:
technological aspects, pp. 51–53 (in Russian).
Nachetova, M. & Barakova, N. 2013. Choice and verification of the temperature of water-heat
treatment of mash from extruded wheat. Production of alcohol and liqueurs and spirits 3,
29–32 (in Russian).
Oshkordin, A., Lavrov, L. & Usov, G. 2011. Kinetics and dynamics of milling of plant raw
materials for food production. Polzunovsky Bulletin 2, 202–206 (in Russian).
Rimareva, L. 2010. Theoretic and realistic basis of yeast biotechnology. DeLi Print, 252 pp.
(in Russian).
Rimareva, L., Overchenko, M., Ignatova, N. & Abramova, L. 2008. Theoretic and realistic basis
of enzyme catalysis of polymers of grain raw materials in the alcohol production.
Production of alcohol and liqueurs and spirits 3, 5–9 (in Russian).
Romanyuk, T., Chusova, A. & Agafonov, G. 2013. Production of clarified wort from rye grain
and its fermentation to ethanol. Production of alcohol and liqueurs and spirits 4, 13–16.
Rybakova, T. & Glebova, S. 2012. Changes in protein content and amino acid composition of rye
and barley in flaking. Bulletin of Novosibirsk State Agrarian University 1, 93–97
(in Russian).
Sabirov, A., Barakova, N. & Samodelkin, E. 2017a. Influence of the impact-activating-
disintegrating technique on the technological parameters of hydrolyzates from rye.
Academic journal of ITMO University. Series: Food production processes and plants 3,
43–52 (in Russian).
1474
Sabirov, A., Barakova, N. & Samodelkin, E. 2017b. Reasons to employ the impact-activating-
disintegrating technique in the sirup production technologies from starch-containing
products. Bulletin of the South Ural State University. Series: Food and biotechnologies 2,
60–66 (in Russian).
Sereda, A., Kostyleva, E. & Smirnova, I. 2010. Application of enzyme preparations of serine
proteases at hydrolysis of toasted and extruded soybean meal. Storage and processing of
agri supplies 10, 5–8 (in Russian).
Sergeeva, I. 2016. Classification of turbidity components of plant-based beverages. Food
processing and techniques 42(3), 70–76 (in Russian).
Shakir, I., Grosheva, V., Karetkin, B., Baurin, D. & Panfilov, D. 2017. Cоmprehensive
processing of renewable vegetable feedstock obtaining the high-protein and probiotic feed
stuff. Butlerov’s reports 50(5), 73–80 (in Russian).
Smirnova, I. & Krechetnikova, A. 2005. Influence of ultrasound processing on components of
wheat chemical composition in the alcohol production. Production of alcohol and liqueurs
and spirits 3, 27–29 (in Russian).
Soboleva, O., Kondratenko, E. & Vityaz, S. 2015. Influence of the electromagnetic field on the
amino acid composition and biological value of the grain of a new winter crop. Bulletin of
the Altai State Agrarian University 11, 58–64 (in Russian).
Sotnikov, V., Fedorov, А., Gamayurova, V., Kotelnikova, N. & Kotelnikov, М. 2002. Low-
temperature cooking method of starch-containing raw materials for alcohol production.
Production of alcohol and liqueurs and spirits 1, 13–15 (in Russian).
Stepanov, V., Rimareva, L., Ivanov, V. & Sharikov, A. 2007. Processing methods of starch-
containing raw materials at production of concentrated grain wort. Production of ethyl
alcohol and liqueurs and spirits 3, 16–17 (in Russian).
Tretiak, L. 2009. Transformation of malt proteins in the brewing technology. Industry of
beverages 4, 16–18 (in Russian).
1475
Agronomy Research 16(S2), 1475–1485, 2018
https://doi.org/10.15159/AR.18.052
Encapsulation of Gallic acid in solid lipid core surrounded with
maltodextrin shell
I. Sepelevs1,* and G.A. Reineccius2
1Latvia University of Life Sciences and Technologies, Faculty of Food Technology,
Rigas street 22, LV-3004 Jelgava, Latvia 2University of Minnesota, Department of Food Science and Nutrition, 1334 Eckles Ave,
MN 55108, St. Paul, USA *Correspondence: [email protected]
Abstract. Multiple phase capsules had been prepared in a single spray drying process. The main
goal of the present study was to investigate whether the conversion of a portion of the modified
starch (wall material used in spray drying) to resistant starch (RS) would offer added protection
of encapsulated material. To achieve this, dry gallic acid (GA; a model water soluble phenol
compound used in the present study) was initially dispersed in palm oil and stabilized with
Polyglycerol Polyricinoleate (PGPR 4175) as an emulsifier. This dispersion was homogenized
with a modified starch (MS, dextrose equivalent of 15) solution, that was previously treated with
high pressure and increased temperature to achieve starch retrogradation, and then spray dried. It
was possible to produce only small amounts of RS from modified starch, varying from 0.1 to
0.2% of total carbohydrate content. GA content in the lipid phase of the capsule was determined
by lipid droplet size in the O/W emulsion (the feeding solution), as smaller droplets results in the
significantly bigger surface area, and more intensive GA diffusion from O to W phase.
Maltodextrin shell wall was able to prevent leaking of the melted palm oil form the capsule core
to the surface during seating tests, preventing agglomeration of capsules. This could be very
important for the storage/transportation of capsules in the uncontrolled temperature conditions.
Key words: gallic acid, spray drying, encapsulation, resistant starch.
INTRODUCTION
Protection of sensitive bioactive compounds is an important aspect of modern food
industry in order to provide high nutritional value added food products. Alternatively,
there are many compounds that cannot be incorporated into food systems in their regular
form due to specific taste, biochemical activity, and physical properties. In this situation,
encapsulation steps in as a possible solution. It is a process of entrapping a specific
component (‘active compound’ or core material) within a protective matrix
(‘encapsulant’, wall or matrix material) (Garti & McClements, 2012). Present work is focused on encapsulation of a water soluble phenol compound -
gallic acid (GA). Phenolics are an extremely heterogeneous class of secondary plant
metabolites. They protect plant against biotic (caused by herbivores, insects, and
pathogens) and abiotic (caused by free radical) stresses (Schieber & Saldana, 2009). In
human diet, phenolics are the most common antioxidants (Friedman, 1997; Lima et al.,
1476
2014). Their preservation and application in food production can offer added nutritional
value for human nutrition, and provide antioxidative protection for the food product
itself.
In food industry, an efficient encapsulation system for protection of biologically
active compound must be formulated using only food grade compounds, which were
manufactured with solvent-free production methods (McClements et al., 2007; Acosta,
2009). This system should have minimum interaction with the encapsulated compound,
provide high physicochemical stability (McClements et al., 2007; Donsi et al., 2011),
and shield active compound from interaction with another food ingredients and
environment factors such as temperature, pH, oxygen, and light (McClements et al.,
2007). Additionally, this system should maximize the uptake of encapsulated
compounds upon consumption (Acosta, 2009; Dordevic et al., 2015) and ensure
controlled release in response to a specific stimulus in the environment (McClements et
al., 2007). From technical point of view, it should be scalable to industrial production
(Desai & Park, 2005; Donsi et al., 2010a; Donsi et al., 2010b).
There are many different encapsulation techniques, and spray drying is a most often
used in food industry. It is cost-effective, flexible (drying parameters are easily
controllable), and can be operated continuously (Desai & Park, 2005; Fang & Bhandari,
2010; Anandharamakrishnan & Padma Ishwarya, 2015). In short, core and wall materials
are homogenised, fed into a spray dryer, and atomized with a nozzle or spinning wheel.
Water is evaporated by the hot air stream that contacts the atomized material. During the
drying process, droplets shrink and form round capsules, which are than collected (Gibbs
et al., 1999). Most common wall materials for spray drying encapsulation are gum arabic,
maltodextrin and modified starch (MS) (Munin & Edwards-Levy, 2011). For
encapsulation of phenolic compounds, maltodextrins are frequently chosen as wall
material. They can wary in dextrose equivalents (DE, a measurement of the amount of
reducing sugars in the product), depending on the final product application (Ersus &
Yurdagel, 2007; Krishnaiah et al., 2012; Kaderides et al., 2015; Pasrija et al., 2015;
Saikia et al., 2015). Most phenolics possess bad sensory properties and maltodextrins
had been successfully applied in spray drying processes to stabilize phenolics and mask
their unpleasant bitter taste (Sansone et al., 2011). In addition, maltodextrin is able to
provide good thermal protection, and was able to preserve the integrity of the
anthocyanins during their encapsulation (Ersus & Yurdagel, 2007; Robert et al., 2010).
Unfortunately, maltodextrin doesn’t possess good enough emulsifying properties for
lipophilic material encapsulation. As a result, it should be modified by adjusting a
hydrophobic part to its molecule, forming a material called modified starches (MS). MS
is a good choice for hydrophilic material encapsulation in the hydrophilic matric, and it
will be used in present study for oil-in-water emulsion formation.
Despite good overall encapsulation properties, capsules and shells made from
maltodextrin and MS are not stable against enzymatic digestion. It was shown that
stability to enzymatic digestion of coatings (prepared form high amylose corn starch)
can be improved by addition of resistant starch (RS) (Dimantov et al., 2004b). RS is a
physiologically important indigestible starch fraction in human diet. It is usually present
in relatively low amounts in food products. RS is enzyme resistant and is not digestible
in the small intestine, but can be fermented by microorganisms in the large intestine
(Eerlingen et al., 1993). Incorporation of 20% RS in the wall material, made of high
amylose corn starch, is suitable for achieving targeted release of encapsulated active
1477
compound in the colon (Dimantov et al., 2004a). Increased concentrations of RS
considerably improve the stability of the coatings to enzymatic digestion, although
resulting in the crack on the capsule surface (Dimantov et al., 2004b).
Alternatively, to ensure capsule stability in the hydrophilic media and against non-
lipid digestible enzymes, active compounds can be encapsulated in the solid
hydrogenated lipids (Mukherjee, 2009; Eltayeb et al., 2013; Wolfe et al., 2015). Resulted
capsule particles possess a great water barrier, but their thermal stability is highly
dependent on the melting point of the chosen lipid phase. For additional protection,
hydrophilic (modified starch) and hydrophobic (solid lipids) systems can be combined
to produce multiple layered capsules. In this case, solid lipid core usually is surrounded
by MS shell by using fluidized bed technology (Arshadey, 1999). In this process, solid
particles are moved in the air in fluidized bed reactor and simultaneously sprayed with a
liquid coating material, which is solidifying due to the temperature and humidity control
system. It is a two-step process consistent of preparation of solid core and coating it with
shell material.
In present study, multiple phase capsules (consistent of solid lipid core and
modified starch shell) will be prepared in a single spray drying process for water soluble
phenolic compound encapsulation. The aim of the present study is to investigate whether
the conversion of a portion of the modified starch (wall material, used in spray drying)
to resistant starch (RS) would offer added protection of encapsulated material (water
soluble phenolics).
MATERIALS AND METHODS
Chemicals and Reagents
Modified starch ‘Capsul®’ was provided by Ingredion, Inc. (Westchester, USA);
Calcium Chloride dihydrate, Gallic acid, Glacial Acetic acid, Potassium Hydroxide,
Sodium Azide, Sodium Carbonate, Maleic acid, and Sodium Hydroxide were purchased
from Sigma-Aldrich (St. Louis, USA); Ethanol (200 proof, anhydrous 99.5%) was
purchased from Pharmco-Aaper (Brookfield ,USA); Folin-Ciocalteu phenol reagent
purchased from VWR International (Radnor, USA); Palm Oil kernels were purchased
form Bulk Apothecary (Aurora, USA); Polyglycerol Polyricinoleate (PGPR 4175) was
provided by Palsgaard, Inc. (Morris Plains, USA).
Preparation of the wall material
To produce resistant starch (RS), Eerlingen et al. (1993) method was used. MS was
dispersed in distilled water in ratio 1:2, and autoclaved at 120 °C for 1 h. in AMSCO,
American Sterilizer (Erie, USA). When temperature and pressure dropped to the safe
limit, samples were immediately transferred to baths at 22 ± 2, 68 ± 2 and 100 ± 2 °C
for 24 h. Control sample, without autoclave treatment, was incubated under magnetic
stirring at 80 °C for 30 min to ensure full MS gelatinization. Prepared solutions were
used for further oil-in-water (O/W) emulsion preparation, forming W phase (shell wall
material).

1478
Resistant starch content determination
RS content was determined by using Megazyme RS analyse kit K-RSTAR 10/15,
AOAC method 2002.02, AACC method 32-40.01 (Mccleary et al., 2002; AACC 32-
40.01).
Sample preparation Capsule core had been made as a suspension of GA in the melted lipids, forming a
O phase for the further O/W emulsion preparation. To achieve this, palm oil kernels were
melted (with melting point at ≈50 °C) at 50 °C and GA was added in proportion 4:1, and
0.1% of PGPR (w/w) was added as stabiliser. PGPR is broadly used in chocolate
production water-in-oil emulsifier, and had been chosen for the present research as it is
food grade (E 476), not carcinogenic, 98% digestible in rats, and is utilized in the body
as a source of energy superior to starch (Wilsona et al., 1998). Mixture was homogenized
by magnetic stirring at 600 rpm for 5 min. Obtained dispersion was added to the prepared
wall material solution at a proportion 1:2, and homogenized by high shear mixer for 30
sec, obtaining O/W emulsion. Mixture was immediately fed to Buchi Mini Spray Dryer
B-290 (New Castle, USA). Drying parameters were set as followed: inlet and outlet
temperatures – 170 and 75 °C, respectively; sample feed rate – 15 mL min-1; spray gas
flow – 667 L h-1. Feed solution had been kept on the hot plate at 60 °C under constant
intensive stirring to prevent oil solidification. Collected samples were stored in double
plastic bags at -20 °C. Whole experiment was repeated three times.
Gallic acid extraction from different capsule parts
All samples were divided in three parts. First part was used to determine total GA
content (TGA): 0.5 g of sample was mixed with 5 ml of 70% ethanol and magnetically
stirred for 30 min at 50 °C, and filtered through a paper filter Nr.3. Second part was used
for the surface GA content determination (SGA): 0.5 g of sample material was washed
with 5 mL ethanol and filtered through the paper filter. Third part was used for GA
content determination in the wall material: 0.5 g of sample was mixed with 5 mL of 70%
ethanol and magnetically stirred for 30 min at room temperature to dilute wall material,
and filtered through the paper filter.
All filtrates were collected and used for the GA content determination in different
parts of produced capsules.
GA content determination
For the GA content determination in the filtrates, Ragazzi & Veronese (1973) Folic-
Ciocalteu method with slight modifications. Briefly, 200 µL of the sample were mixed
with 1 mL of distilled water and 100 µL of Folin-Ciocalteu phenol reagent (preciously
diluted with distilled water 1:1, v/v). After 5 min, 2 mL of the 10% sodium carbonate
solution was added. Acquired mixture was allowed to stand at room temperature for
60 min. The absorbance was measured at 725 nm by laboratory spectrophotometer
UV-1800 (Shimadzu, Japan).
Encapsulation efficiency Encapsulation efficiency (EE) was calculated by the following equation:
TGA
SGAEE 1100 (1)

1479
Heat stability and optical microscopy
Heat stability was analysed visually. 0.5 g of each sample were placed in the oven
on the filter paper for 30 min at 100 °C. Sample optical microscopy was prepared by
using BX40 (Olympus, United States) microscope.
Particle size distribution
Particle size distribution was analysed using laser diffraction particle size analyser
LA 960 (HORIBA, Japan).
Moisture content determination
Moisture content was determined using HTF 2000 Moisture analyser (DSC, United
States). Data was used for GA content recalculations on dry weight.
Statistical analysis
One-way ANOVA (P ≤ 0.05) and Tukey’s test were applied for the statistical
analysis of the distribution of GA in the different capsule fractions.
RESULTS AND DISCUSSION
In present study, three phase encapsulation system (solid lipid core, containing
water soluble phenolic compound, surrounded with modified starch shell wall) had been
developed in a single spray drying process.
Based on the fact that RS fractions can be obtained by hydrothermal treatment and
retrogradation of starches (Herman & Remon, 1989; Sievert & Pomeranz, 1989;
Eerlingen et al., 1993), wall material previously was autoclaved at 121 °C in excess
water with further incubation at 22 °C, 68 °C, and 100 °C (Eerlingen et al., 1993).
Unfortunately, it was possible to produce only small amounts of RS in the chosen MS
material: 0.12% in samples incubated at 22 °C and 68 °C, and 0.19% in samples
incubated at 100 °C, against 0.10% for control sample. Achieved concentrations are not
enough to ensure enzymatic resistance of the shell, as RS is not a chemically reactive
substance in present conditions and will not influence physical or chemical properties of
the capsule shell at present concentrations. It can be seen that increase in the incubation
temperature directly influence RS formation, and incubation at 100 °C results almost in
double amounts of RS in comparison to incubation at 22 and 68 °C. This fact matches
previously reported data by Eerlingen et al. (1993). No correlation had been detected
between RS concentration in the wall material and GA content in the lipid core of
produced capsules (Fig. 1). It was expected that (at the sufficient concentrations) higher
increase in RS content could influence GA diffusion from the lipid core into the coating
material, or from the coating to the surface (as both GA and MS are water soluble, GA
is evenly distributed inside the coating matrix, and GA content on the surface is
dependent on the volume-to-surface ratios of the coating itself). At the same time, too
high RS concentrations can cause cracking in the MS coating due to reduced
intermolecular interactions, caused by the nature of RS (Dimantov et al., 2004b). This
cracking results in lower integrity of the shell and could be a reason for further additional
GA losses, due to the more intensive water evaporation during the spray drying process.
Alternatively, high RS content could result in bigger amount of free water in the W phase

1480
of the O/W solution that could increase GA diffusion from the lipid core phase or capsule
surface into the wall material phase.
Figure 1. Gallic acid content in the produced capsules depending on the resistant starch
concentration. Where, Inc. – incubation.
In the produced capsules, GA was approximately evenly distributed between core
and shell fractions, with little remains on the capsule surface (Fig. 2). It is a result of GA
diffusion during O/W emulsion preparation, when O phase was mixed with W right
before mixture feeding into the spray dryer. It is possible that increase in PGPR
concentration or addition of another emulsifier could cause better system stabilization
and decrease diffusion and increase GA content in the lipid phase. In this case, bigger
portion of lipid phase would be concentrated on the O/W phase surface, blocking GA
migration by stronger hydrophilic polarity.
Figure 2. Distribution of gallic acid in different capsule fractions. The data is presented as a mean
(n = 9); similar uppercase letters indicate no significant difference among samples of the same
fraction (P ≤ 0.05). Where, GA – gallic acid; Inc. – incubation.
y = -89.638x + 58.599R² = 0.2038
20
40
60
80
0.08 0.13 0.18 0.23Galli
c a
cid
conte
nt
in t
he lip
id
core
phase,
% o
f to
tal G
alli
c a
cid
conte
nt
Resistant starch content in the wall material, % of total carbohydrates
Control
Inc. at 22°C
Inc. at 68°C
Inc. at 100°C
0
20
40
60
80
GA on the surface GA in the shell GA in the core
Galli
c a
cid
conte
nt, %
Control
Inc. at 22°C
Inc. at 68°C
Inc. at 100°C
A AB B
ABC
ABC
AB
AC
ABC
ABCAB
AC50%

1481
Holser (2013) showed that ferulic acid, another phenolic compound with
antioxidative properties, encapsulated in lipid matrix capsules was stable during 3
months storage at ambient conditions. In another study, lipid nanoparticles placed in
water were able to stabilize (-)-epigallocatechin-3-gallate during 4 weeks period while
(-)-epigallocatechin-3-gallate solubilized in water exhibited 100% degradation within 4
hours period (Barras et al., 2009). Solid lipid fraction, used in present study, had a
melting point approximately of ≈50 °C. This allows to conclude that GA in produced
capsules is well protected from environmental factors. It is not only encapsulated in the
hydrophobic core, but also surrounded by additional MS shell that should protect melted
lipids from leakage and capsule agglomeration, in case of capsule storage at temperature
that exceeds 50 °C.
Fig. 2 shows that big part of total encapsulated GA had been diffused into the water
phase during sample preparation period and was fixed in the MS matrix. In present study
used commercial MS is known for its great encapsulation properties and ability to mask
undesirable odours and flavours of encapsulated substance, including phenolics (Spinelli
et al., 2016). This means that GA in the shell can be considered as shielded, till capsule
will come in contact with aqueous phase that will dilute shell wall material or cause GA
diffusion from MS phase into the surrounding aqueous phase.
Based on discussed factors, it can be assumed that produced capsules could be
added to different types of food products (ground meat or fish, or dough) in order to
release phenolics from the shell wall to the surrounding media. Released phenolics could
serve as antioxidants for the food product itself. If there will be no temperature rises
combined with intensive mixing that would break integrity of lipid core (as in sausage
production), lipid phase phenolics will remain fixed in the lipid phase and protected till
will come into the human digestive system. Wada & Fang (1992) had shown that
phenolics are able to inhibit polyunsaturated fatty acid oxidation in frozen-crushed
bonito meat. In whole and ground meat products, phenolics were effective in retarding
rancid odour and flavour, and colour changes (Shah et al., 2014). Better retention of
colour and protection of lipids against peroxidation due to the addition of phenols had
been observed also in irradiated meats (Kanatt et al., 2005). Similar results were acquired
for minced horse mackerel (Sabeena Farvin et al., 2012). In case of human nutrition,
phenolics are known to have multiple positive effects on the health by alleviating
oxidative stress (Singh & Rajini, 2004; Singh & Rajini, 2008).
Only small percentage of total GA had been exposed on the capsule surface:
2.4 ± 0.5% for samples incubated at 22 °C, 2.3 ± 0.2% for samples incubated at 68 °C,
3.8 ± 0.6% for samples incubated at 100 °C, against 3.3 ± 0.5% for control sample. This
amounts can be considered as permanent loses, bringing the total encapsulation
efficiency to 97.1 ± 0.4%. In present study, particles with mean size form 23.1 ± 0.5 to
30.7 ± 2.1 µm were produced (Table 1), resulting in fine white powder that should not
be visible and sensible in case of adding it to the ground meat/fish products or dough.
Table 1. Particle size and distribution of microcapsules incubated at different temperatures
Parameter Control 22 °C 68 °C 100 °C
Median, µm 18.7 ± 1.4 21.4 ± 0.8 22.3 ± 1.0 20.2 ± 1.6
Mean, µm 23.1 ± 0.5 27.7 ± 1.9 30.7 ± 2.1 26.5 ± 3.3
Variance, µm2 306.9 ± 168.8 615.51 ± 184.6 947.9 ± 105.6 597.5 ± 250.9
Mode, µm 18.6 ± 2.5 21.2 ± 0.0 21.3 ± 0.1 19.5 ± 1.6
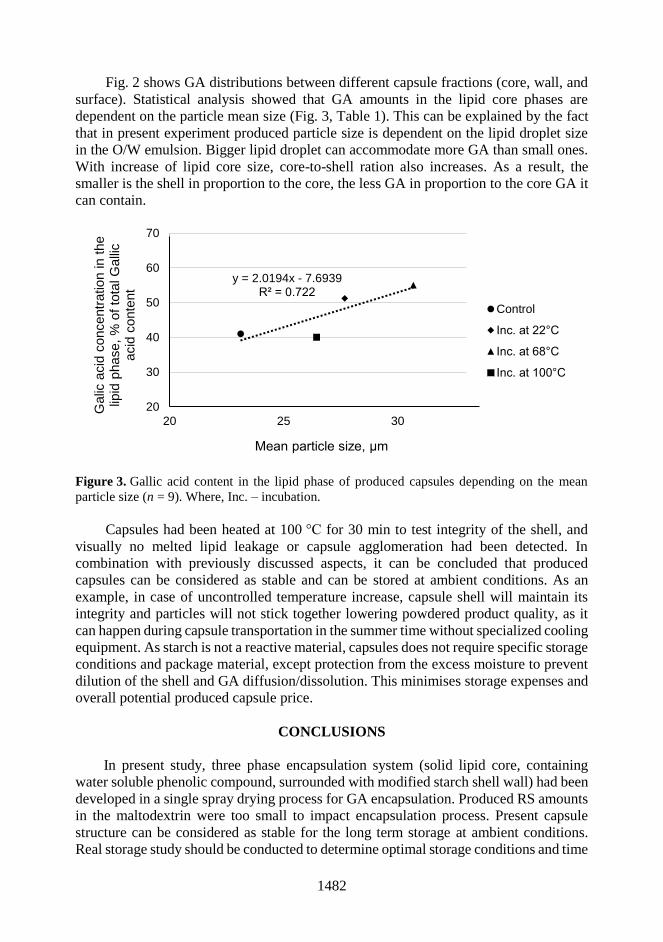
1482
Fig. 2 shows GA distributions between different capsule fractions (core, wall, and
surface). Statistical analysis showed that GA amounts in the lipid core phases are
dependent on the particle mean size (Fig. 3, Table 1). This can be explained by the fact
that in present experiment produced particle size is dependent on the lipid droplet size
in the O/W emulsion. Bigger lipid droplet can accommodate more GA than small ones.
With increase of lipid core size, core-to-shell ration also increases. As a result, the
smaller is the shell in proportion to the core, the less GA in proportion to the core GA it
can contain.
Figure 3. Gallic acid content in the lipid phase of produced capsules depending on the mean
particle size (n = 9). Where, Inc. – incubation.
Capsules had been heated at 100 °C for 30 min to test integrity of the shell, and
visually no melted lipid leakage or capsule agglomeration had been detected. In
combination with previously discussed aspects, it can be concluded that produced
capsules can be considered as stable and can be stored at ambient conditions. As an
example, in case of uncontrolled temperature increase, capsule shell will maintain its
integrity and particles will not stick together lowering powdered product quality, as it
can happen during capsule transportation in the summer time without specialized cooling
equipment. As starch is not a reactive material, capsules does not require specific storage
conditions and package material, except protection from the excess moisture to prevent
dilution of the shell and GA diffusion/dissolution. This minimises storage expenses and
overall potential produced capsule price.
CONCLUSIONS
In present study, three phase encapsulation system (solid lipid core, containing
water soluble phenolic compound, surrounded with modified starch shell wall) had been
developed in a single spray drying process for GA encapsulation. Produced RS amounts
in the maltodextrin were too small to impact encapsulation process. Present capsule
structure can be considered as stable for the long term storage at ambient conditions.
Real storage study should be conducted to determine optimal storage conditions and time
y = 2.0194x - 7.6939R² = 0.722
20
30
40
50
60
70
20 25 30
Galic
acid
concentr
ation in t
he
lipid
phase,
% o
f to
tal G
alli
c
acid
conte
nt
Mean particle size, µm
Control
Inc. at 22°C
Inc. at 68°C
Inc. at 100°C
1483
limits. Due to diffusion processes during capsule formation, GA was evenly distributed
between core and shell wall materials. Depending on the capsule application, this fact
can be considered as negative (if GA content in the shell wall is considered as loses) or
as positive (assuming that shell wall GA can be released in the surrounding media in
order to provide antioxidative and antiradical protection for the mentioned media).
Produced capsules have a great potential for application in food production, as GA can
be replaced with any another water or oil soluble biologically active compound to
produce stable encapsulation system for protection of the active compound and masking
its possible undesirable sensory properties. In case of hydrophilic compound
encapsulation, it is assumed that chosen compound will be evenly distributed between
capsule phases and, after adding capsules to the moisture rich food system, will partially
participate in the antioxidative protection of the chosen food system. Remaining active
compound could remain protected till it will reach digestive system. Present work makes
a basis for future studies on natural plant phenolic compound encapsulation and
application in food industry.
REFERENCES
Acosta, E. 2009. Bioavailability of nanoparticles in nutrient and nutraceutical delivery. Current
Opinion in Colloid & Interface Science 14, 3–15.
Anandharamakrishnan, C. & Padma Ishwarya, S. 2015. Spray drying techniques for food
ingredient encapsulation. John Wiley & Sons, Chichester, 294 pp.
Arshadey, R. 1999. Microspheres, microcapsules and liposomes. United Kingdom, London:
Citus Books (v.1), 550 pp.
Barras, A., Mezzetti, A., Richard, A., Lazzaroni, S., Roux, S., Melnyk, P., Betbeder, D. &
Monfilliette-Dupont, N. 2009. Formulation and characterization of polyphenol-loaded lipid
nanocapsules. International Journal of Pharmaceutics 379, 270–277.
Desai, K.G.H. & Park, H.J. 2005. Recent developments in microencapsulation of food
ingredients. Drying Technology 23, 1361–1394.
Dimantov, A., Kesselman, E. & Shimoni, E. 2004a. Surface characterization and dissolution
properties of high amylose corn starch-pectin coatings. Food Hydrocolloids 18, 29–37.
Dimantov, A., Greenberg, M., Kesselman, E. & Shimoni, E. 2004b. Study of high amylose corn
starch as food grade enteric coating in a microcapsule model system. Innovative Food
Science and Emerging Technologies 5, 93–100.
Donsi, F., Annunziata, M., Sessa, M. & Ferrari, G. 2011. Nanoencapsulation of essential oils to
enhance their antimicrobial activity in foods. LWT- Food Science and Technology 44,
1908–1914.
Donsi, F., Senatore, B., Huang, Q. & Ferrari, G. 2010a. Development of novel pea protein-based
nanoemulsions for delivery of nutraceuticals. Journal of Agricultural and Food Chemistry
58, 10653–10660.
Donsi, F., Sessa, M. & Ferrari, G. 2010b. Nanoencapsulation of essential oils to enhance their
antimicrobial activity in foods. Journal of Biotechnology 150, S67–S67.
Dordevic, V., Balanc, B., Belscak-Cvitanovic, A., Levic, S., Trifkovic, K., Kalusevic, A.,
Kostic, I., Komes, D., Bugarski, B. & Nedovic, V. 2015. Trends in encapsulation
technologies for delivery of food bioactive compounds. Food Engineering Reviews 7,
452–490.
Eerlingen, R.C., Crombez, M. & Delcour, J.A. 1993. Enzyme-Resistant Starch. I. Quantitative
and qualitative influence of incubation time and temperature of autoclaved starch on
resistant starch formation. Cereal Chemistry 70, 339–344.

1484
Eltayeb, M., Bakhshi, P.K., Stride, E. & Edirisinghe, M. 2013. Preparation of solid lipid
nanoparticles containing active compound by electrohydrodynamic spraying. Food
Research International 53, 88–95.
Ersus, S. & Yurdagel, U. 2007. Microencapsulation of anthocyanin pigments of black carrot
(Daucus carota L.) by spray drier. Journal of Food Engineering 80, 805–812.
Fang, Z. & Bhandari, B. 2010. Encapsulation of polyphenols – a review. Trends in Food Science
& Technology 21, 510–523.
Sabeena Farvin, K.H., Grehsen, H.D. & Jacobsen, C. 2012. Potato peel extract as a natural
antioxidant in chilled storage of minced horse mackerel (Trachurus trachurus): Effect on
lipid and protein oxidation. Food Chemistry 131, 843–851.
Friedman, M. 1997. Chemistry, biochemistry, and dietary role of potato polyphenols. A review.
Journal of Agriculture and Food Chemistry 45, 1523–1540.
Gibbs, B.F., Kermasha, S., Alli, I. & Mulligan, C.N. 1999 Encapsulation in the food industry: a
review. International Journal of Food Science and Nutrition 50, 213–224.
Garti, N. & McClements, J. 2012. Encapsulation technologies and delivery systems for food
ingredients and nutraceuticals. Woodhead Publishing, Oxford, 612 pp.
Herman, J. & Remon, J.P. 1989. Modified starches as hydrophilic matrices for controlled oral
delivery. II. In-vitro drug-release evaluation of thermally modified starches. International
Journal of Pharmaceutics 56, 65–70.
Holser, R. 2013. Stability of lipid encapsulated phenolic acid particles. Recent Research
Developments in Lipids 9, 47–52.
Kaderides, K., Goula, A.M. & Adamopoulos, K.G. 2015. A process for turning pomegranate
peels into a valuable food ingredient using ultrasound-assisted extraction and encapsulation.
Innovative Food Science and Emerging Technologies 31, 204–215.
Kanatt, S.R., Chander, R., Radhakrishna, P. & Sharma, A. 2005. Potato peel extract – a natural
antioxidant for retarding lipid peroxidation in radiation processed lamb meat. Journal of
Agriculture and Food Chemistry 53, 1499–1504.
Krishnaiah, D., Bono, A., Sarbatly, R., Nithyanandam, R. & Anisuzzaman, S.M. 2012.
Optimisation of spray drying operating conditions of Morinda citrifolia L. fruit extract
using response surface methodology. Journal of King Saud University – Engineering
Sciences 27, 26–36.
Lima, G.P.P., Vianello, F., Correa, C.R., da Silva Campos, R.A. & Borguini, M.G. 2014.
Polyphenols in fruits and vegetables and its effect on human health. Food and Nutrition
Science 5, 1065–1082.
Mccleary, B.V., Mcnally, M., Monaghan, D. & Mugford, D.C. 2002. Measurement of a-Amylase
Activity in White Wheat Flour, Milled Malt, and Microbial Enzyme Preparations, Using
the Ceralpha Assay: Collaborative Study. Journal of AOAC International 85, 1096–1102.
McClements, D.J., Decker, E.A. & Weiss, J. 2007. Emulsion-based delivery systems for
lipophilic bioactive components. Journal of Food Science 72, 109–124.
Mukherjee, S., Ray, S. & Thakur, R.S. 2009. Solid lipid nanoparticles: a modern formulation
approach in drug delivery system. Indian Journal of Pharmaceutical Science 71, 349–358.
Munin, A. & Edwards-Levy, F. 2011. Encapsulation of natural polsyphenolic compounds; a
review. Pharmaceuticals 3, 793–829.
Pasrija, D., Ezhilarasi, P.N., Indrani, D. & Anandharamakrishnan, C. 2015. Microencapsulation
of green tea polyphenols and its effect on incorporated bread quality. LWT - Food Science
and Technology 64, 289–296.
Ragazzi, E. & Veronese, G. 1973. Quantitative analysis of phenolic compounds after thin layer
chromatography. Journal of Chromatography 77, 369–375.
Resistant starch in starch samples and plant materials: AACC method 32-40.01. (2002) Available
at: http://methods.aaccnet.org/summaries/32-40-01.aspx, 22 March 2018.

1485
Robert, P., Gorena, T., Romero, N., Sepulveda, E., Chavez, J. & Saenz, C. 2010. Encapsulation
of polyphenols and anthocyanins from pomegranate (Punica granatum) by spray drying.
International Journal of Food Science and Technology 45, 1386–1384.
Saikia, S., Mahnot, N.K. & Mahanta, C.L. 2015. Optimisation of phenolic extraction from
Averrhoa carambola pomace by response surface methodology and its microencapsulation
by spray and freeze drying. Food Chemistry 171, 144–152.
Sansone, F., Mencherini, T., Picerno, P., D’Amore, M., Aquino, R.P. & Lauro, M.R. 2011.
Maltodextrin/pectin microparticles by spray drying as carrier for nutraceutical extracts.
Journal of Food Engineering 105, 468–476.
Shah, M., Bosco, S. & Mir, S. 2014. Plant extracts as natural antioxidants in meat and meat
products. Meat science 98, 21–33.
Shieber, A. & Saldana, M.D.A. 2009. Potato peels: a source of nutritionally and
pharmacologically interesting compounds – a review. Food S3, 23–29.
Sievert, D. & Pomeranz, Y. 1989. Enzyme-resistant starch. I. Characterization and evaluation by
enzymic, thermosanalytical, and microscopic methods. Cereal Chemistry 66, 342–347.
Singh, N. & Rajini, P.S. 2004. Free radical scavenging activity of an aqueous extract of potato
peel. Food Chemistry 85, 611–616.
Singh, N. & Rajini, P.S. 2008. Antioxidant-mediated protective effect of potato peel extract in
erythrocytes against oxidative damage. Chemico-Biological Interactions 173, 97–104.
Spinelli, S., Conte, A. & Del Nobile, M.A. 2016. Microencapsulation of extracted bioactive
compounds from brewer’s spent grain to enrich fish-burgers. Food and Bioproducts
Processing 100, 450–456.
Wada, S. & Fang, X. 1992. The synergistic antioxidant effect of rosemary extract and α-
tocopherol in sardine oil model system and frozen-crushed fish meat. Journal of Food
Processing and Preservation 16, 263–274.
Wilsona, R., van Schieb, B.J. & Howesa, D. 1998. Overview of the preparation, use and
biological studies on polyglycerol polyricinoleate (PGPR). Food and Chemical Toxicology
36(9–10), 711–718.
Wolfe, L.A., Roberts, R.F. & Coupland, J.N. 2015. Encapsulation of aqueous components in
solid fat beads: studies of a model dye and a probiotic culture. Journal of the American Oil
Chemists’ Society 92, 87–94.
1486
Agronomy Research 16(S2), 1486–1492, 2018
https://doi.org/10.15159/AR.18.017
Comparison of power consumption of a two-roll mill
and a disc mill
A. Smejtkova* and P. Vaculik
Czech University of Life Sciences Prague, Faculty of Engineering, Department
of Technological Equipment of Buildings, Kamýcká 129, CZ165 21 Prague 6 – Suchdol,
Czech Republic *Correspondence: [email protected]
Abstract. Grinding or milling is often used process, for example in the production of feed,
grinding of malt in beer production, grinding of cereals on flour, etc. In order to optimize the
energy intensity of the whole production process, it is necessary to know the energy consumption
of individual processes. The grinding of malt influences the mashing process, the drawing-off
and the boiling yield. Correct grain grinding makes the endosperm available for enzyme and
physicochemical reactions during wort production. Husks affect the drawing-off process. Two-,
four- or six-roll mills, in some cases a hammer mill or disc mill, are most commonly used for
grinding of malt. Power consumption was monitored when light, Munich, caramel and coloring
malt were grinding. A two-roll mill and a disc mill with engine speeds of 1,500 rpm and
2,800 rpm were used for grinding. The gap between the mill rollers and the mill disks was set to
0.4 mm. The fineness of the grinding was evaluated for all types of malt on all used equipment.
The energy intensity of the grinding was correlated on 1.0 kg of malt and then compared.
Key words: malt, grinder, dispersant, electrical power, mechanical power.
INTRODUCTION
At present, the process of production or processing also tracks the energy intensity
of processes, as it is one of the ways to reduce production costs (Kunze, 2010; Chládek
et al., 2013).
Traditional procedures may not always be the least energy consuming, and it may
sometimes be appropriate to adjust the production process with respect to energy
consumption while maintaining the other requirements.
Beer production is demanding energy consumption. Throughout the manufacturing
process, there are a number of energy-intensive technological processes - malting,
malting, boiling, cooling and more. The energy intensity of breweries depends on their
size, equipment level and the introduction of austerity measures. As has been said, one
of the processes that consume energy is malting.
Malt grinding is a mechanical and seemingly simple process that fundamentally
influences the process of mashing, drawing-off and the brewing yield. Mechanical
breakdown of malt grain is necessary to make extractive substances available and
accelerate their dissolution.
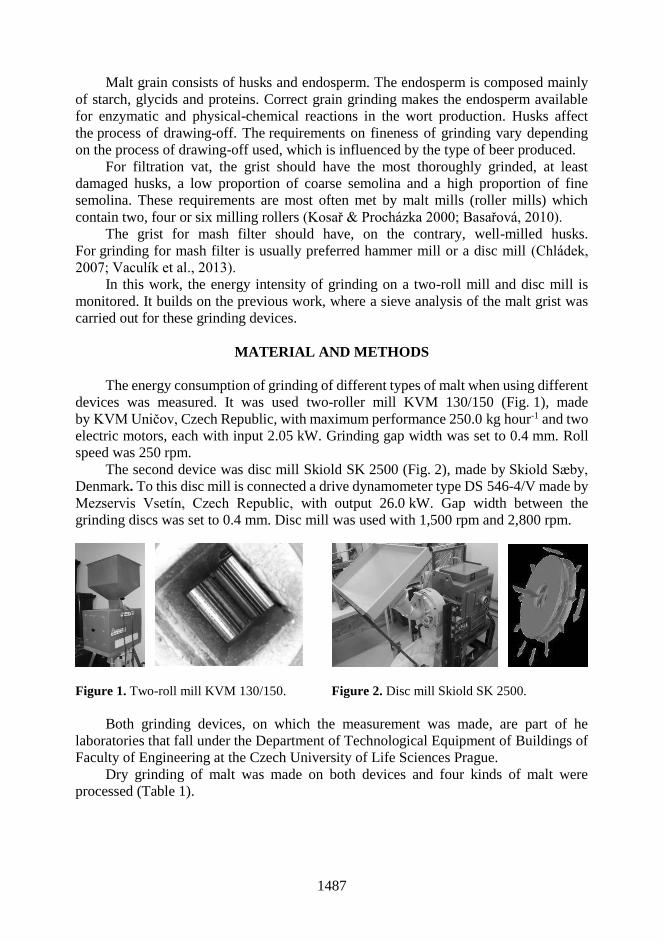
1487
Malt grain consists of husks and endosperm. The endosperm is composed mainly
of starch, glycids and proteins. Correct grain grinding makes the endosperm available
for enzymatic and physical-chemical reactions in the wort production. Husks affect
the process of drawing-off. The requirements on fineness of grinding vary depending
on the process of drawing-off used, which is influenced by the type of beer produced.
For filtration vat, the grist should have the most thoroughly grinded, at least
damaged husks, a low proportion of coarse semolina and a high proportion of fine
semolina. These requirements are most often met by malt mills (roller mills) which
contain two, four or six milling rollers (Kosař & Procházka 2000; Basařová, 2010).
The grist for mash filter should have, on the contrary, well-milled husks.
For grinding for mash filter is usually preferred hammer mill or a disc mill (Chládek,
2007; Vaculík et al., 2013).
In this work, the energy intensity of grinding on a two-roll mill and disc mill is
monitored. It builds on the previous work, where a sieve analysis of the malt grist was
carried out for these grinding devices.
MATERIAL AND METHODS
The energy consumption of grinding of different types of malt when using different
devices was measured. It was used two-roller mill KVM 130/150 (Fig. 1), made
by KVM Uničov, Czech Republic, with maximum performance 250.0 kg hour-1 and two
electric motors, each with input 2.05 kW. Grinding gap width was set to 0.4 mm. Roll
speed was 250 rpm.
The second device was disc mill Skiold SK 2500 (Fig. 2), made by Skiold Sæby,
Denmark. To this disc mill is connected a drive dynamometer type DS 546-4/V made by
Mezservis Vsetín, Czech Republic, with output 26.0 kW. Gap width between the
grinding discs was set to 0.4 mm. Disc mill was used with 1,500 rpm and 2,800 rpm.
Figure 1. Two-roll mill KVM 130/150.
Figure 2. Disc mill Skiold SK 2500.
Both grinding devices, on which the measurement was made, are part of he
laboratories that fall under the Department of Technological Equipment of Buildings of
Faculty of Engineering at the Czech University of Life Sciences Prague.
Dry grinding of malt was made on both devices and four kinds of malt were
processed (Table 1).

1488
Table 1. Basic properties of malt
Malt type Producer Malt colour
(EBC)
Humidity
(%)
Light barley malt
(pilsner type)
Soufflet, Hodonice, Czech Republic 3–4 5.1
Barley malt called
Munich
Heinz Weyermann, Bamberg, Germany 15 4.8
Barley malt called
colouring
Heinz Weyermann, Bamberg, Germany 1,100–1,300 4.1
Barley malt called
caramel
Heinz Weyermann, Bamberg, Germany 150–200 4.5
Two-roll mill
Samples of malt weighing 3.0 kg were used for individual measurements.
The Nanovip Plus network analyzer was used to measure the values.
The first measurement took place idling speed and then was open a flap blocking
the supply of malt between the cylinders. Values were recorded at two second intervals.
From the measured values of current, voltage and power factor, the electrical power
is calculated using the following formula (Pokorný, 2003; Feynman et al., 2011).
cos IUPe (1)
where Pe – electrical power (W); U – voltage (V); I – current (A); cos φ – power
factor (-).
Disc mill
Samples of 3.0 kg malt were used for individual measurements. A computer with
original software from MEZ Vsetín was used to measure the values. Due to the fact that
the device allows changing the engine speed, two values were chosen for the given
measurements, namely 1,500 rpm and 2,800 rpm.
The first measurement took place idling speed and then was open a flap blocking
the supply of malt between the discs.
From the measured speed and torque values, the mechanical power is calculated
using the following formula (Čadil, 1976; Feynman et al., 2011).
602
nMPm (2)
where Pm – mechanical power (W); M – torque (N.m); n – speed (rpm).
RESULTS AND DISCUSSION
All obtained samples of malt grist were categorized on Pfungstadt sifter. Using
a roller mill, the obtained grist was the coarsest for all types of malt, the finest grist was
obtained using a dispersant at 2,800 rpm (Vaculík et al., 2010; Smejtková et al., 2016). The course of power in dependence on time for individual devices and malt samples
is shown in the Figs 3–6.

1489
Fig. 3 illustrates the energy consumption over time when grinding a light malt using
a two-roll mill, disc mill 1.500 rpm and disc mill 2.800 rpm. The highest values of
energy consumption were achieved for the disc mill 2.800 rpm, but grinding took off the
shortest time.
Figure 3. The course of power when grinding light malt.
Fig. 4 illustrates the energy consumption over time when grinding Munich malt.
Compared to the light malt grinding, the disc mill 2.800 rpm has a lower power
consumption, but the highest between used equipment.
Figure 4. The course of power when grinding Munich malt.
Figure 5. The course of power when grinding colouring malt.

1490
Fig. 5 illustrates the energy consumption over time when grinding coloring malt.
Energy consumption is the lowest when grinding coloring malt, especially when using a
disc mill 2,800 rpm. This is because the coloring malt is very fragile.
Fig. 6 illustrates the energy consumption over time when grinding caramel malt.
Compared to the previous measurement, the energy consumption increased while using
the disc mill 1,500 rpm.
Figure 6. The course of power when grinding caramel malt.
The results obtained correspond to those of other authors (Boehm et al., 2015;
Salonitis, 2015). Also, when using similar grinding equipment and grinding other
materials, the results are comparable (Chohan et al., 2009; Mohd Rozalli et al., 2015).
In the Fig. 7 is shown energy consumption per 1.0 kg of malt for all used devices.
From average power needed to grinding, power idling speed was subtracted. This value
was multiplied by the time needed to grinding of each sample and related to 1.0 kg
of sample.
Figure 7. Energy consumption per 1 kg of malt.
Idling speed, for the two-roll grinder is electrical power 321 W, for the disc mill
1,500 rpm is mechanical power 220 W and for the disc mill 2,800 rpm is mechanical
power 425 W.
The most energy consumption of the compared devices has the disc mill with
2,800 rpm for all types of malt. The least demanding is the two-roll grinder. Of the used
malt, the highest demand on energy consumption of grinding has caramel malt, followed
by light malt, Munich malt and the least demanding coloring malt.

1491
Used grinding devices also differed in the speed of grinding. Fig. 8 shows a
comparison of the time needed to grinding of 1.0 kg of malt. For the disc mill, the time
required for grinding is decreasing as the number of revolutions increases.
Figure 8. Grinding time of 1 kg of malt.
From these values, we can approximately determine the capacity of individual
grinding devices for each type of malt (Table 2).
Table 2. Capacity of the grinding device
Efficiency
Malt Two-roll mill Disc mill (1,500 rpm) Disc mill (2,800 rpm)
(kg hour-1) (kg hour-1) (kg hour-1)
Light malt 214 327 514
Munich malt 200 349 514
Coloring malt 200 434 571
Caramel malt 214 349 600
CONCLUSION
The paper presents the results of the measurement of the required power of a two-
roll mill and a disc mill 1,500 rpm and 2,800 rpm for the grinding of light, Munich,
caramel and coloring malt.
The rotational speed of the disc mill influences the fineness of grinding, energy
consumption and grinding time. The higher the speed, the shorter the grinding time and
the finer the grist, but the higher the energy consumption. Regardless of the speed used,
the disc mill has a higher energy consumption than a two-roll mill, but the grinding time
is shorter and the malt finer.
Regardless of the use of the grinding device, the highest energy consumption is
used to grind caramel malt, followed by light malt, Munich malt, and the least demanding
is coloring malt.
Due to the short period of grinding of small malt samples, the performance values
expressed in kg h-1 should be considered as indicative only. A small inaccuracy in the
measurement is a larger deviation when referring to time 1.0 hour.
For a two-roll mill, the performance in grinding different types of malt is not much
different and is significantly lower compared to the disc mill. For the disc mill
1,500 rpm, the highest performance was achieved when the coloring malt was grinded.

1492
Disc mill 2,800 rpm has the highest performance of the monitored devices, the
performance of grinding of caramel malt is higher than that of other malt.
The subject of the next measurement will be the monitoring of the energy
consumption of the four-roll and six-roll grinders and the comparison of the obtained
results with the results of this work. Based on the evaluation of all measured quantities,
it will be possible to select a suitable type of grinder, taking into account its energy
consumption.
REFERENCES
Boehm, A., Meissner, P. & Plochberger, T. 2015. An energy based comparison of vertical roller
mills and tumbling mills. International Journal of Mineral Processing 136, 37–41.
Basařová, G. 2010. Pivovarství: teorie a praxe výroby piva. 1st edition. Publisher: Vydavatelství
VŠCHT. Prague. 863 pp. (in Czech).
Čadil, F. 1976. Elektrické pohony: učebnice pro elektrotechn. fak. 1st edition. Publisher: SNTL
(Mír 1). Prague. 558 pp. (in Czech).
Chládek, L. 2007. Pivovarnictví. 1st edition. Publisher: Grada. Prague. 207 pp. (in Czech).
Chládek, L., Vaculík, P., Přikryl, M., Vaculík, M. & Holomková, M. 2013. Impact of malt
granulometry on lauter proces. In 5th International Conference on Trends in Agricultural
Engineering 2013, TAE 2013 03.09.2013, Prague. Prague: Czech University of Life
Sciences Prague, pp. 244–248.
Chohan, P. & Garson, C.A. 2009. Performance of a tandem of Bundaberg two-roll mills.
International Sugar Journal 111(1330), 650–655.
Feynman, R.P., Leighton, B.R. & Sands, M. 2011. The Feynman Lectures on Physics, boxed set:
The New Millennium Edition. 1st edition. Publisher: Basic Books. 1552 pp.
Kosař, K. & Procházka, S. 2000. Technologie výroby sladu a piva. 1st edition. Publisher:
Výzkumný ústav pivovarský a sladařský, Prague. 398 pp. (in Czech).
Kunze, W. 2010. Technology Brewing and Malting. 4th updated English Edition. Berlin:
Versuchs- und Lehranstalt für Brauerei in Berlin (VLB), 1047 pp. (in German).
Pokorný, K. 2003. Elektrotechnika I. 1st edition. Publisher: Česká zemědělská univerzita v Praze,
Technická fakulta, NAROMA. Prague. 172 pp. (in Czech).
Mohd Rozalli, N.H., Chin, N.L. & Yusof, Y.A. 2015. Grinding characteristics of Asian
originated peanuts (Arachishypogaea L.) and specific energy consumption during ultra-
high speed grinding for natural peanut butter production. Journal of Food Engineering 152.
pp 1–7.
Salonitis, K. 2015. Energy efficiency assessment of grinding strategy. International Journal of
Energy Sector Management 9(1), pp. 20–37.
Smejtková, A., Vaculík, P., Přikryl, M. & Pastorek, Z. 2016. Rating of malt grist fineness with
respect to the used grinding equipment. Research in Agricultural Engineering (Zemědělská
technika) 62(3), 141–146.
Vaculík, P., Malaťák, J. & Chládek, L. 2010. Recent trends in the processing of construction and
demolition waste. In 4th International Conference on Trends in Agricultural Engineering
2010, TAE 07.09.2010, Prague. Prague: Czech University of Life Sciences Prague,
pp. 619–622.
Vaculík, P., Maloun, J., Chládek, L. & Přikryl, M. 2013. Disintegration process in disc crushers.
Research in Agricultural Engineering (Zemědělská technika) 59(3), 98–104.

1493
Agronomy Research 16(S2), 1493–1508, 2018
https://doi.org/10.15159/AR.18.129
Single cell protein production from waste biomass: review of
various agricultural by-products
K. Spalvins*, K. Ivanovs and D. Blumberga
Riga Technical University, Institute of Energy Systems and Environment, Azenes street
12/1, LV 1048, Riga, Latvia *Correspondence: [email protected]
Abstract. Agricultural waste constitutes for most of the manmade waste streams. Processing of
biodegradable waste materials ensures the treatment of harmful substances and allows to reduce
environmental pollution. In addition, conversion of these waste materials in value-added products
makes these recycling methods more economically viable. Single-cell protein is one of the value-
added products that can be produced by microbial fermentation of waste materials. In this review
various biodegradable agricultural by-products as substrates for production of SCP are
categorized and compared.
Key words: single cell protein, waste biomass, agricultural by-products, resource availability,
aquaculture, fish feed, fish meal.
INTRODUCTION
The recycling of biodegradable waste into environmentally harmless compounds is
one of the bases for waste management. However, simply treating biodegradable waste
is no longer considered efficient waste management practice. Depending on the type of
waste used, nowadays it is possible to produce a range of value added products that make
waste management not only an environmentally friendly endeavour, but also a promising
business activity. However, a large proportion of biodegradable waste is currently being
processed into products with a relatively low added value, such as biogas (Kost et al.,
2013), bioenergy and biofuels (Lipinsky, 1981; Browne et al., 2011). Thanks to the
development of various waste recycling technologies, an increasing number of
technological solutions are emerging today that provide the opportunity to extract high
value-added products such as enzymes (El-Bakry et al., 2015), single-cell oil (Finco et
al., 2016), building block chemicals (Werpy & Petersen, 2004; FitzPatrick et al., 2010)
and others. One such high-value added product is single-cell protein (SCP).
SCPs are known as dietary single-cell microorganisms whose biomass or protein
extracts are derived from pure or mixed microscopic algae, yeasts, mushrooms or
bacterial cultures (Anupama & Ravindra, 2000). These microorganisms can be used as
protein-rich foods or food ingredients or dietary supplements (Ritala et al., 2017), but
they are mainly used as food for human and animal consumption (Ugalde & Castrillo,
2002). SCPs are a good alternative to replacing protein of agricultural origin, since SCP
production is not characterized by high water consumption (Mekonnen & Howkstra,
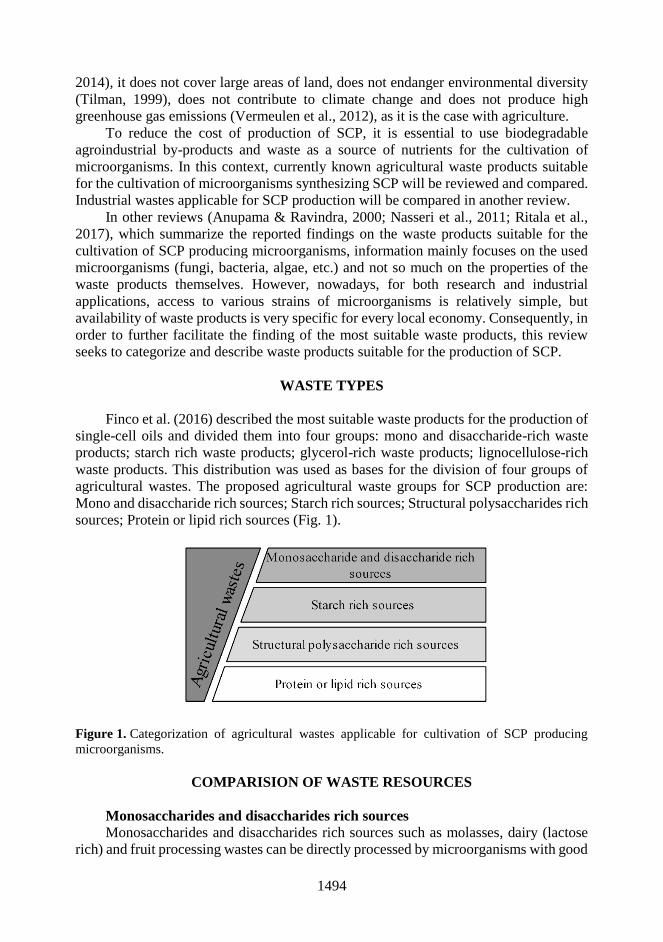
1494
2014), it does not cover large areas of land, does not endanger environmental diversity
(Tilman, 1999), does not contribute to climate change and does not produce high
greenhouse gas emissions (Vermeulen et al., 2012), as it is the case with agriculture.
To reduce the cost of production of SCP, it is essential to use biodegradable
agroindustrial by-products and waste as a source of nutrients for the cultivation of
microorganisms. In this context, currently known agricultural waste products suitable
for the cultivation of microorganisms synthesizing SCP will be reviewed and compared.
Industrial wastes applicable for SCP production will be compared in another review.
In other reviews (Anupama & Ravindra, 2000; Nasseri et al., 2011; Ritala et al.,
2017), which summarize the reported findings on the waste products suitable for the
cultivation of SCP producing microorganisms, information mainly focuses on the used
microorganisms (fungi, bacteria, algae, etc.) and not so much on the properties of the
waste products themselves. However, nowadays, for both research and industrial
applications, access to various strains of microorganisms is relatively simple, but
availability of waste products is very specific for every local economy. Consequently, in
order to further facilitate the finding of the most suitable waste products, this review
seeks to categorize and describe waste products suitable for the production of SCP.
WASTE TYPES
Finco et al. (2016) described the most suitable waste products for the production of
single-cell oils and divided them into four groups: mono and disaccharide-rich waste
products; starch rich waste products; glycerol-rich waste products; lignocellulose-rich
waste products. This distribution was used as bases for the division of four groups of
agricultural wastes. The proposed agricultural waste groups for SCP production are:
Mono and disaccharide rich sources; Starch rich sources; Structural polysaccharides rich
sources; Protein or lipid rich sources (Fig. 1).
Figure 1. Categorization of agricultural wastes applicable for cultivation of SCP producing
microorganisms.
COMPARISION OF WASTE RESOURCES
Monosaccharides and disaccharides rich sources
Monosaccharides and disaccharides rich sources such as molasses, dairy (lactose
rich) and fruit processing wastes can be directly processed by microorganisms with good

1495
SCP yields. Consequently, this waste group requires much less pre-treatment prior to its
use in the cultivation of microorganisms, which significantly reduces the overall SCP
production costs.
Molasses
Molasses is a rich source of carbohydrates suitable for the cultivation of various
microorganisms without the need for pre-treatment of the waste material (Kopsahelis et
al., 2007; Aggelopoulos et al., 2014). Molasses are mainly a by-product of the production
of sugar from sugar cane and sugar beet or by-product from soy protein concentrate
production. From all potential sources soy molasses, a by-product of soy protein
concentrate (SPC) production, has become more accessible in recent years due to rapid
increase in the production of SPC (Deak & Johnson, 2006; Gao et al., 2012). Depending
on the extraction method, plant species and plant age, molasses usually contain about
45–60% fermentable carbohydrates, 10% nitrogen compounds, 20% fat and 10%
minerals (Kinney, 2003; Gao et al., 2012). The use of molasses in SCP production is
determined by its availability, price, composition, and whether it contains impurities of
fermentation inhibitors and toxic compounds that could be transferred from culture
medium to the final SCP product (Bekatorou et al., 2006; Aggelopoulos et al., 2014).
Dairy waste
Whey and other dairy wastes have high levels of chemical oxygen demand (COD)
and biological oxygen demand (BOD), as well as high concentrations of oils and fats
and nitrogen and phosphorus compounds (Braio & Taveres, 2007; Singh et al., 2011),
which can lead to ecological problems if such wastes enter local environments without
prior treatment. From cheese production alone, the global dairy industry generates
around 139 million tonnes of whey every year (Ghaly et al., 2007; Yadav et al., 2013;
Yadav et al., 2014), of which about 50% are simply dumped in sewage systems or in
local water bodies (Ghaly et al., 2007; Yadav et al., 2014). Consequently, the dairy
industry needs to develop effective solutions for the processing of whey and other waste
products, in order to remove organic and nitrogen compounds from the wastes.
Depending on the technology used in milk processing, dairy waste can have high levels
of either lactose or protein (Kim & Lebeault, 1981; Singh et al., 2011; Aggelopoulos et
al., 2014), therefore whey can be categorized as monosaccharides and disaccharides rich
source or protein or lipid rich source (see Tables 1, 4). If dairy waste is high in lactose,
these by-products can be used as suitable substrate for SCP production using
microorganisms capable of fermenting lactose (Singh et al., 2011).
Fruit waste (simple sugar rich)
The content of fruit processing waste is highly dependent on the type of fruit and
the part of the fruit that forms the main mass of the waste. If the waste is mainly whole
fruit, then a large amount of monosaccharides and disaccharides will be available in the
waste, as it is in the case with banana wastes, where 5 to 30% of harvested bananas are
discarded as waste due to export regulations (Baldensperger et al., 1985). A similar
situation exists for figs where, due to incorrect transport, storage and market changes,
large quantities of figs are not realized, and they need to be disposed of when they begin
to deteriorate (Hashem et al., 2014).

1496
Table 1. Monosaccharides and disaccharides rich sources. Recent reports of protein content
(% of biomass after fermentation) from mono and disaccharide rich wastes
Mono and disaccharides
rich sources Microorganisms
Protein
content (%) References
Molasses Kluyveromyces marxianus 50.5 Anderson et al., 1988
Soy molasses Candida tropicalis 56.4 Gao et al., 2012
Sugarcane juice Phaffia rhodozyma - Fontana et al., 1996
Whey (lactose rich) Penicillium cycloplum 54 Kim & Lebeault, 1981
Cheese whey Kluyveromyces marxianus,
Candida krusei
43.4 Yadav et al., 2014
kefir microorganisms 53.9 Paraskevopoulou et al., 2003
Cheese whey filtrate Trichoderma harzianum 34.2 Sisman et al., 2013
Banana wastes Aspergillus niger 18 Baldensperger et al., 1985
Spoiled date palm fruits Hanseniaspora uvarum,
Zygosaccharomyces rouxii
48.9 Hashem et al., 2014
Table 2. Starch rich sources. Recent reports of protein content (% of biomass after fermentation)
from starch rich wastes
Starch rich sources Microorganisms Protein
content (%) References
Sorghum hydrolysate Candida krusei 47.5 Konlani et al., 1996
Wheat bran Rhodopseudomonas
gelatinosa
66.7 Shipman et al., 1975
Rice bran Aspergillus flavus 11.5 Valentino et al. 2016
Starch hydrolysate Fusarium graminearum - Anupama & Ravindra, 2000
Starch Schwanniomyces alluvius 52.8 Calleja et al., 1986
Schwanniomyces
occidentali
- Deibel et al., 1988
Leaf juice Saccharomyces cerevisiae 45.6 Chanda & Chakrabarti, 1996
Torula utilis 54.3
Candida lipolytica 50.5
If fruit processing waste mainly consists of outer and inner shells, peels and seeds,
as it is the case with juice producing wastes (Bhalla & Joshi, 1994; Scerra et al., 1999;
De Gregorio et al., 2002), then there will be more fibres and hence the waste can be
categorized as structural polysaccharides rich sources (see subsection 3.3.4. and
Table 3).
Starch rich sources
Starch rich waste products, such as grains and tuber residues, account for a large
proportion of agricultural waste. Starch rich substrates need to be hydrolysed to
monosaccharides prior to use them in cultivation, which may increase the cost of
production of SCP, if microorganisms that are capable of dissolving and metabolising
starch are not used in fermentation. However, expenses can be reduced if associative
fermentation is ensured, where amylolytic microorganisms with SCP synthesizing
microorganisms are used in tandem (Calleja et al., 1986; Deibel et al., 1988). In this way
amylolytic microorganisms digest starch and provide SCP producing microorganisms
with the simple carbohydrates they require.
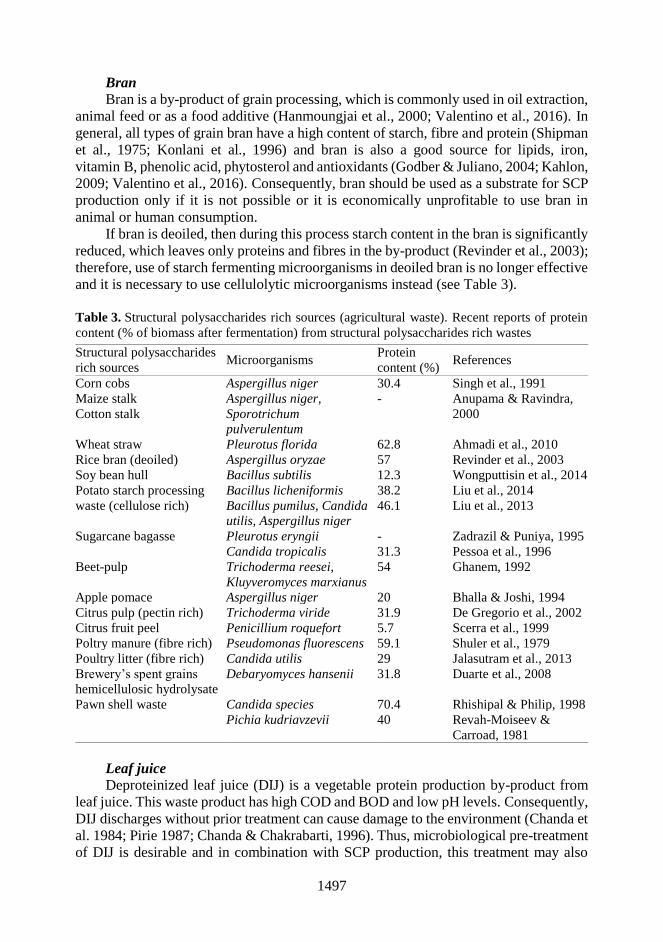
1497
Bran
Bran is a by-product of grain processing, which is commonly used in oil extraction,
animal feed or as a food additive (Hanmoungjai et al., 2000; Valentino et al., 2016). In
general, all types of grain bran have a high content of starch, fibre and protein (Shipman
et al., 1975; Konlani et al., 1996) and bran is also a good source for lipids, iron,
vitamin B, phenolic acid, phytosterol and antioxidants (Godber & Juliano, 2004; Kahlon,
2009; Valentino et al., 2016). Consequently, bran should be used as a substrate for SCP
production only if it is not possible or it is economically unprofitable to use bran in
animal or human consumption.
If bran is deoiled, then during this process starch content in the bran is significantly
reduced, which leaves only proteins and fibres in the by-product (Revinder et al., 2003);
therefore, use of starch fermenting microorganisms in deoiled bran is no longer effective
and it is necessary to use cellulolytic microorganisms instead (see Table 3).
Table 3. Structural polysaccharides rich sources (agricultural waste). Recent reports of protein
content (% of biomass after fermentation) from structural polysaccharides rich wastes
Leaf juice
Deproteinized leaf juice (DIJ) is a vegetable protein production by-product from
leaf juice. This waste product has high COD and BOD and low pH levels. Consequently,
DIJ discharges without prior treatment can cause damage to the environment (Chanda et
al. 1984; Pirie 1987; Chanda & Chakrabarti, 1996). Thus, microbiological pre-treatment
of DIJ is desirable and in combination with SCP production, this treatment may also
Structural polysaccharides
rich sources Microorganisms
Protein
content (%) References
Corn cobs Aspergillus niger 30.4 Singh et al., 1991
Maize stalk Aspergillus niger,
Sporotrichum
pulverulentum
- Anupama & Ravindra,
2000 Cotton stalk
Wheat straw Pleurotus florida 62.8 Ahmadi et al., 2010
Rice bran (deoiled) Aspergillus oryzae 57 Revinder et al., 2003
Soy bean hull Bacillus subtilis 12.3 Wongputtisin et al., 2014
Potato starch processing
waste (cellulose rich)
Bacillus licheniformis 38.2 Liu et al., 2014
Bacillus pumilus, Candida
utilis, Aspergillus niger
46.1 Liu et al., 2013
Sugarcane bagasse Pleurotus eryngii - Zadrazil & Puniya, 1995
Candida tropicalis 31.3 Pessoa et al., 1996
Beet-pulp Trichoderma reesei,
Kluyveromyces marxianus
54 Ghanem, 1992
Apple pomace Aspergillus niger 20 Bhalla & Joshi, 1994
Citrus pulp (pectin rich) Trichoderma viride 31.9 De Gregorio et al., 2002
Citrus fruit peel Penicillium roquefort 5.7 Scerra et al., 1999
Poltry manure (fibre rich) Pseudomonas fluorescens 59.1 Shuler et al., 1979
Poultry litter (fibre rich) Candida utilis 29 Jalasutram et al., 2013
Brewery’s spent grains
hemicellulosic hydrolysate
Debaryomyces hansenii 31.8 Duarte et al., 2008
Pawn shell waste Candida species 70.4 Rhishipal & Philip, 1998
Pichia kudriavzevii 40 Revah-Moiseev &
Carroad, 1981

1498
serve as a good business perspective, since SCP yields reported so far on using DIJ as
substrate are high (see Table 2). The amount of starch and other substances in DIJ are
affected mostly by used plant species and applied extraction methods for production of
vegetable protein. The starch content in leaves of legumes, peas and beans
(Papilionoideae family) is high (Pirie, 1987), but in general, other carbohydrates (both
monosaccharides and polysaccharides), amino acids, fats, vitamins and minerals are
found in the DIJ as well (Pirie, 1987; Chanda & Chakrabarti, 1996; Choi & Chung,
2003).
Structural polysaccharides rich sources (agricultural waste) Lignocellulosic agricultural waste is the most widely available waste in the world.
According to the International Grains Council, in 2015, 737 million tonnes of wheat, 984
million tonnes of maize and 474 million tonnes of rice (IGC, 2018) were harvested
globally. Rice, wheat and corn straw-to-grain ratio varies from 0.7 to 1.7 (Skidmore,
1988; Nelson, 2002; NLA, 2013), which means that straw and stover volumes are usually
equal or greater than actual produced grain volumes. This alone indicates that cereal
straws are available in enormous quantities in virtually all regions of the world where
crops are grown. Consequently, the use of these residues in the production of SCP is
highly desirable, both economically and ecologically. However, the use of
lignocellulosic agricultural waste is much more complicated than using starch or simple
sugar-rich waste because lignocellulose is more difficult to process, and lignocellulosic
substrates need to be subjected to extensive mechanical and chemical or biochemical
pre-treatments, which greatly increase the total cost of production.
Lignocellulose essentially consists of 30–56% cellulose, 3–30% lignin, 10–24%
hemicellulose and 3–7.2% protein, but its applicability, for example in animal feed, is
limited due to low digestibility and low protein content (Ahmadi et al., 2010).
In order to reduce the costs associated with the use of straw, researchers have
explored the possibilities of using cellulolytic microorganisms that are able to delignify
and ferment lignocellulose-rich waste materials (Singh et al., 1991; Valmaseda et al.,
1991; Vares et al., 1995; Agosin et al., 1999; Ahmadi et al., 2010; Brijwani & Vadlani,
2011).
Soybean hull
Soybean hull (SBH) is an agricultural by-product from the extraction of soybean
oil and production of soybean meal (Zervas et al., 1998). SBH accounts for about 8–10%
of the total soybean mass (Wongputtisin et al., 2014), and given the fact that around
350 million tonnes of soybeans (IGC, 2018) are harvested annually globally, then the
amount of available SBH is significant. In small amounts, SBH is used to regulate the
protein content of soy bean meal used as animal feed (Wongputtisin et al., 2014). SBH
is suitable and also used as a source of fibre for ruminants, but unprocessed SBH cannot
be used as feed for monogastric animals as they cannot digest cellulose and
hemicellulose compounds (Zervas et al., 1998). In general, SBH contains about 36%
fibres, about 12% protein and 3% fat (Wongputtisin et al., 2014). So far, SBH
fermentation studies have succeeded in increasing simple sugar and protein content and
reducing fibre concentrations, but the overall increase in protein concentration has been
relatively small (Wongputtisin et al., 2014).

1499
Starch and sugar processing waste
Similarly, as for other previously described by-products, also liquid wastes from
starch and sugar production have high COD and BOD values, therefore these
wastewaters have potential of being harmful to environment if released into natural water
bodies (Lettinga et al., 1980; Frostell, 1983; Rajeshwari et al., 2000). Environmentally
friendly starch and sugar refineries are too expensive; therefore, they need to be
combined with the production of other products (Cibis et al., 2006; Krzywonos et al.,
2009; Lasik et al., 2010; Lui et al., 2014). Multiple studies have been carried out on the
use of potato starch processing residues using microbial fermentation in the production
of biologically active compounds and animal feeds (Suzuki et al 2010; Wang et al 2010;
Lui et al., 2013; Lui et al., 2014). Studies have also been carried out on how to obtain
high-quality SCP from sugarcane bagasse and beet pulp (Ghanem, 1992; Zadrazil &
Puniya, 1995; Pessoa et al., 1996). Additionally, sugarcane bagasse and beet and potato
pulp can be used in limited amounts as feed additive for ruminants (Zadrazil & Puniya,
1995; Wang et al., 2010). Despite being a by-product of starch or sugar processing,
potato starch processing waste, sugarcane bagasse and sugar beet pulp itself are low in
starch and sugar and other non-structural carbohydrates, but high in energy and fibre.
These residues, similarly as cereal straws, contain large amounts of cellulose and
hemicellulose, which is the reason why potato, sugarcane and sugar beet wastes need to
be pre-treated before SCP producing fermentation stage. Fermentation process can be
divided in two stages, where in the first stage cellulolytic microorganisms are used for
pre-treatment of the substrate and SCP synthesizing microorganisms are used in the
second stage (Ghanem, 1992; Lui et al., 2013; Lui et al., 2014). By doing so it is possible
to ensure a good SCP yields, while at the same time limiting the pollution created by
sugar and starch industries.
Fruit waste (fibre rich)
Similarly, as for sugar and starch production waste, also fruit processing residues
can be used as feed for cattle, however, this is often not possible, or the transportation of
the residues is too expensive (Bhalla & Joshi, 1994; Scerra et al., 1999; De Gregorio et
al., 2002). Consequently, in order to reduce the production costs, usually the waste from
fruit processing is simply discarded (Upadhyay & Sohi 1988, De Gregorio et al., 2002).
Mainly dietary fibre rich fruit processing wastes come from juice and essential oil
production factories (De Gregorio et al., 2002). Pomace and juice pulps make up to about
25 to 65% of the total fruit volume used for juicing (Walter & Sherman, 1976; Bhalla &
Joshi, 1994; Scerra et al., 1999). Considering that about 25% of the harvested fruits are
used in industrial processing (Bhalla & Joshi, 1994), the global annual amount of
pomace and juice pulp produced from apples and citrus fruits is estimated at around 15
million tonnes (FAO, 2018a). From a nutritional point of view, fruit remnants are not
suitable for monogastric animal feeds because of their low digestibility and low protein
content (Bhalla & Joshi, 1994). Due to the large amount of generated waste and the
limited use of it, researchers have looked at ways to improve the nutritional value of
fibrous fruit wastes by using them as substrates for the production of SCP (Bhalla &
Joshi, 1994; Scerra et al., 1999; De Gregorio et al., 2002; Aggelopoulos et al., 2014).
1500
Poultry waste
Disposal of poultry waste has always been problematic because of the price of this
waste is too low to be used as a cost-effective fertilizer, and its direct use without
destroying pathogens is potentially dangerous for public health (Shuler et al., 1979;
Jalasutram et al., 2013). Consequently, SCP production is a good alternative to the
processing of poultry wastes because of the relatively high concentrations of micro and
macroelements and the high composition of organic compounds compared with other
animal wastes (Mitchell & Tub, 2003; Stanely et al., 2004; Kargi et al., 2005; Jalasutram
et al., 2013). In general, poultry waste has a high content of nitrogen compounds (5–7%
of which 60–70% is uric acid nitrogen, 10–15% is protein nitrogen, 10% is ammonia
nitrogen) (Shuler et al., 1979) and fibre, thus appropriate pre-treatment needs to be
performed, which hydrolyses polysaccharides and eliminates potential pathogens
(Jalasutram et al., 2013). Microorganisms such as Candida, Saccharomyces and
Rhodotorula spp. are suitable for the conversion of nitrogen-rich materials into SCP
(El-Deek et al., 2009; Jalasutram et al., 2013).
Spent grains
The composition of brewery's spent grains (BSG) can be very different from one
beverage plant to the other, and the composition can also vary within a single production
unit, depending on which type of beverage is being brewed at that moment (Duarte et
al., 2008). Consequently, before using the BSG in the fermentation of microorganisms,
it is necessary to find out the concentrations of simple sugars, polysaccharides and
proteins in order to choose the most suitable pre-treatments and microorganisms. Usually
BSG has high concentration of hemicellulose, lignin and proteins (Duarte et al., 2008),
and BSG can be rich in various minerals and vitamins (Mussatto et al., 2006), which
makes BSG a potentially complete culture for the cultivation of microorganisms. By
hydrolysing BSG, it is possible to significantly increase the concentrations of simple
sugars such as xylose and glucose (Duarte et al., 2008).
Pawn shell waste
According to FAO, in 2015, crustacean production from aquaculture and wild
capture was 13.9 million tonnes (FAO, 2018b), of which 70–80% constitutes as
processing waste (Mauldin & Szabo, 1975; Anderson et al., 1978; Revah-Moiseev &
Carroad, 1981). Consequently, the amount of crustacean processing waste is huge. Those
wastes that cannot be fed to aquaculture or farm animals are simply dumped into the
ocean, burned or landfilled (Revah-Moiseev & Carroad, 1981). These are generally
environmentally unfriendly solutions, that considerably increase overall production
expenses due to transportation of the waste materials (Kreag & Smith, 1975). In
crustacean processing waste chitin content ranges from 13–27% of the dry mass
(Ashford et al., 1977; Revah-Moiseev & Carroad, 1981). Chitin is a structural
polysaccharide that is a glucose derivate. The high concentration of chitin in crustacean
waste limits its options for recycling if economically sound and environmentally friendly
operation principles are considered (Revah-Moiseev & Carroad, 1981). Hydrolysis of
chitin results in the production of carbohydrates available to SCP synthesizing
microorganisms, therefore it is possible to utilize the already developed enzymatic
lignocellulose hydrolysis technologies for pre-treating of crustacean processing wastes
(Revah-Moiseev & Carroad, 1981). By using hydrolysed crustacean waste as source of
1501
nutrients for SCP production, it is possible to obtain very high protein concentrations in
microbial biomass (Rhishipal & Philip, 1998).
Protein or lipid rich sources
By using protein-rich waste products in the production of SCP, it is possible to
obtain very high protein concentrations in the final biomass (Table 4). In order to break
down the fibrous protein compounds in the waste, they need to be hydrolysed using
enzymes from proteolytic microorganisms. The hydrolysis of proteins usually
complicates and raises the cost of the SCP production. If it is possible to hydrolyse the
waste products by providing associative fermentations (Atalo & Gashe, 1993), then
protein-rich waste products can become one of the most suitable waste products for the
production of SCP due to their high protein yields.
Wastewaters (protein rich)
Protein rich wastewaters usually have high levels of COD and BOD, therefore
expensive waste treatment is required to ensure that it will not cause serious pollution
(Kam et al., 2012).
Stickwater
Stickwater is a liquid by-product from fish feed production (Kam et al., 2012). The
volume of fish feed production has been relatively constant since the 1980s (6–7 million
tonnes a year) (Stickney & McVey, 2002). In comparison, soybean protein production,
which produces soy whey wastewater as by-product, has increased in production
volumes more than 4-fold in the same time period (Wang et al., 2013; FAO, 2018a).
Therefore, there has been no ecological or economical pressure to look for solutions to
stickwater treatment and the use of stickwater in the production of SCP was first
described relatively recently (Kam et al., 2012). In general, stickwater, as a substrate,
can provide high protein concentrations in microbial biomass (Kam et al., 2012).
Stickwater has high concentrations of protein, phosphorus and calcium (Kam et al.,
2012).
Waste liquor from glutamic acid factory
Approximately 4 tonnes of wastewater are produced from each tonne of
L-glutamate (Chiou et al., 2001). Around 1.5 million tons of L-glutamate per year are
produced globally (Perosa & Zecchini, 2007), therefore L-glutamate industry generates
a huge amount of wastewaters. Solid particles of the waste liquor are rich in protein
(around 20%) (Chiou et al., 2001), and therefore this by-product can be used in pig and
ruminant nutrition (Yang & Lee, 1982; Chen et al., 1983). However, so far studies on
the use of L-glutamate production wastes in animal nutrition have shown that the use of
these wastes should be limited in order to avoid metabolic disorders (Yang & Lee, 1982;
Chen et al., 1983). Therefore, use of glutamic acid rich wastewaters in SCP production
is a promising alternative that can improve the nutritional quality of the waste products
and treat created wastewaters at the same time.
Waste capsicum powder
Paprika oleoresin is a natural pigment that is usually obtained from plants of
Capsicum genus (Uquiche et al., 2004). This pigment is widely used in the food industry
and annually around 1,400 tonnes of paprika oleoresin are produced globally
(Buckenhusks, 2001; Topuz & Ozdemir, 2003). Waste capsicum powder is a by-product
of pigment extraction (Zhao et al., 2010). Approximately 98.6% of the used peppers turn
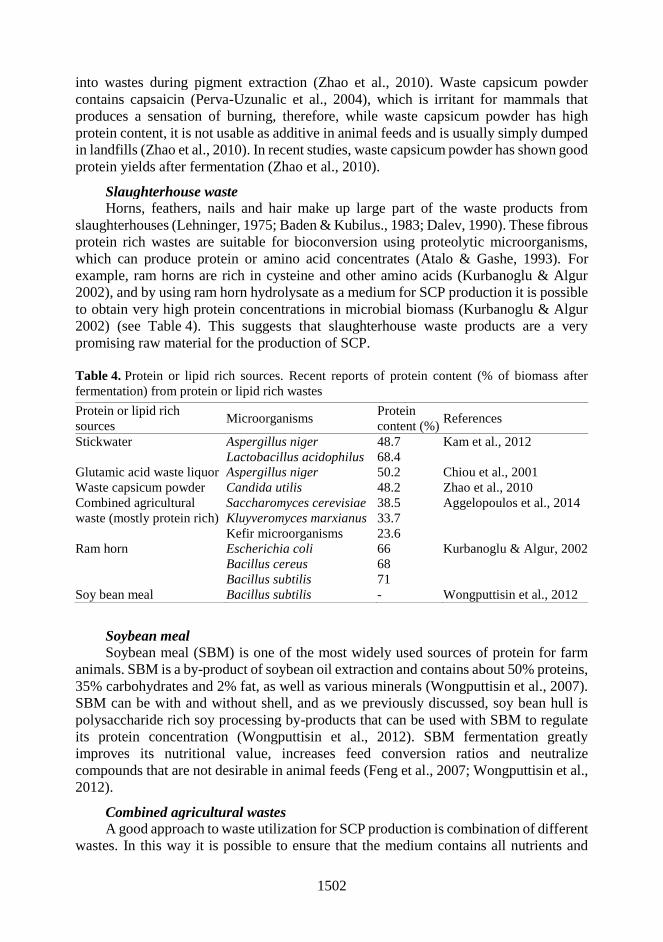
1502
into wastes during pigment extraction (Zhao et al., 2010). Waste capsicum powder
contains capsaicin (Perva-Uzunalic et al., 2004), which is irritant for mammals that
produces a sensation of burning, therefore, while waste capsicum powder has high
protein content, it is not usable as additive in animal feeds and is usually simply dumped
in landfills (Zhao et al., 2010). In recent studies, waste capsicum powder has shown good
protein yields after fermentation (Zhao et al., 2010).
Slaughterhouse waste
Horns, feathers, nails and hair make up large part of the waste products from
slaughterhouses (Lehninger, 1975; Baden & Kubilus., 1983; Dalev, 1990). These fibrous
protein rich wastes are suitable for bioconversion using proteolytic microorganisms,
which can produce protein or amino acid concentrates (Atalo & Gashe, 1993). For
example, ram horns are rich in cysteine and other amino acids (Kurbanoglu & Algur
2002), and by using ram horn hydrolysate as a medium for SCP production it is possible
to obtain very high protein concentrations in microbial biomass (Kurbanoglu & Algur
2002) (see Table 4). This suggests that slaughterhouse waste products are a very
promising raw material for the production of SCP.
Table 4. Protein or lipid rich sources. Recent reports of protein content (% of biomass after
fermentation) from protein or lipid rich wastes
Protein or lipid rich
sources Microorganisms
Protein
content (%) References
Stickwater Aspergillus niger 48.7 Kam et al., 2012
Lactobacillus acidophilus 68.4
Glutamic acid waste liquor Aspergillus niger 50.2 Chiou et al., 2001
Waste capsicum powder Candida utilis 48.2 Zhao et al., 2010
Combined agricultural
waste (mostly protein rich)
Saccharomyces cerevisiae 38.5 Aggelopoulos et al., 2014
Kluyveromyces marxianus 33.7
Kefir microorganisms 23.6
Ram horn Escherichia coli 66 Kurbanoglu & Algur, 2002
Bacillus cereus 68
Bacillus subtilis 71
Soy bean meal Bacillus subtilis - Wongputtisin et al., 2012
Soybean meal
Soybean meal (SBM) is one of the most widely used sources of protein for farm
animals. SBM is a by-product of soybean oil extraction and contains about 50% proteins,
35% carbohydrates and 2% fat, as well as various minerals (Wongputtisin et al., 2007). SBM can be with and without shell, and as we previously discussed, soy bean hull is
polysaccharide rich soy processing by-products that can be used with SBM to regulate
its protein concentration (Wongputtisin et al., 2012). SBM fermentation greatly
improves its nutritional value, increases feed conversion ratios and neutralize
compounds that are not desirable in animal feeds (Feng et al., 2007; Wongputtisin et al.,
2012).
Combined agricultural wastes
A good approach to waste utilization for SCP production is combination of different
wastes. In this way it is possible to ensure that the medium contains all nutrients and

1503
elements necessary for the cultivation of microorganisms. Aggelopoulos et al. (2014)
managed to produce good SCP yields by using a combination of agricultural waste
feedstocks containing simple sugars-rich molasses, fibre-rich orange and potato pulps,
and protein-rich brewer’s spent grains, whey and malt spent rootlets.
CONCLUSIONS
In this review, most of the agricultural wastes that can be used in the production of
SCP have been categorized and discussed more closely. Each agricultural waste group
has its own advantages and disadvantages if used as substrate for SCP production.
Monosaccharides and disaccharides rich sources require minimal pre-treatment,
which give these wastes distinct technological and economical advantage over other
waste types, since simpler bioreactor designs can be used, and no sophisticated pre-
treatment processes are required.
Fermentation of polysaccharides, protein or lipid rich sources improve the overall
digestibility of these by-products, which makes them more applicable as animal feeds.
More extensive pre-treatment of these wastes can result in higher SCP yields, but cost
effectiveness of applied pre-treatments needs to be considered in order to justify the
expenses.
Structural polysaccharides rich wastes are available in huge quantities all over the
world; therefore, using these wastes have limited competition with other industries
which use waste as resource for production of other value-added products. In
comparison, competition over monosaccharides, disaccharides and starch rich sources is
greater, since those wastes are not so abundant and are more easily used. If other waste
types have limited local availability and efficient and economically reasonable pre-
treatment process can be used for hydrolysis, structural polysaccharides rich wastes can
be used extensively for production of SCP.
In general, the key considerations for choosing the most suitable waste product for
SCP production are: (1) local availability of the particular waste product; (2) pre-
treatment costs of the waste product before using it in fermentation; (3) the costs of
transportation of the waste product; (4) SCP concentrations in the final microbial
biomass after fermentation.
In the future, it is also necessary to thoroughly review and compare the different
industrial wastes in regard to their use as substrates for SCP production.
REFERENCES
Aggelopoulos, T., Katsieris, K., Bekatorou, A., Pandey, A., Banat, I.M. & Koutinas, A.A. 2014.
Solid state fermentation of food waste mixtures for single cell protein, aroma volatiles and
fat production. Food Chemistry 145, 710–716.
Agosin, E., Monties, B. & Odier, E. 1999. Structural changes in wheat straw components during
decay by lignin-degrading white-rot fungi in relation to improvement of digestibility for
ruminants. J. Sci. Food Agric. 36, 925–935.
Ahmadi, A.R., Ghoorchian, H., Hajihosaini, R. & Khanifar, J. 2010. Determination of the
Amount of Protein and Amino Acids Extracted from the Microbial Protein (SCP) of
Lignocellulosic Wastes. Pakistan Journal of Biological Sciences 13(8), 355–361.

1504
Anderson, C.G., DePablo, N. & Romo, D.R. 1978. Antartic krill (Euphasia superba) as a source
of chitin and chitosan. Proceedings of the First International Conference on Chitinl
Chitosan, R.A.A. Muzzarelli, and E.R. Pariser, Eds., M.I.T. Sea Grant Report MITSG 78–
7 (M.I.T., Cambridge, MA, 1978), pp, 54–63.
Anderson, P.J., McNeil, K.E. & Watson, K. 1988. Thermotolerant single cell protein production
by Kluyveromyces marxianus var. marxianus. Journal of Industrial Microbiology 3, 9–14.
Anupama & Ravindra, P. 2000. Value-added food: single cell protein. Biotech. Adv. 18, 459–479.
Ashford, N.A., Hattis, D. & Murray, A.E. 1977. Industrial prospects for chitin and protein from
shellfish wastes, M.I.T. Sea Grant Program, 77–3 (M.I.T., Cambridge, MA, 1977).
Atalo, K. & Gashe, B.A. 1993. Protease production by a thermophilus Bacillus species which
degrades various kinds of fibrous proteins. Biotechnol. Lett. 15, 1151–1156.
Baden, H. & Kubilus, J. 1983. Fibrous proteins of bovine hoof. J. Invest. Dermatol. 81, 220–224.
Baldensperger, J., Le Mer, J., Hannibal, L. & Quinto, P.J. 1985. Solid State Fermentation of
Banana Wastes. Biotechnology Letters 7(10), 743–748.
Bekatorou, A., Psarianos, C. & Koutinas, A.A. 2006. Production of food grade yeasts. Food
Technology and Biotechnology 44, 407–415.
Bhalla, T.C. & Joshi, M. 1994. Protein enrichment of apple pomace by co-culture of cellulolytic
moulds and yeasts. World Journal of Microbiology & Biotechnology 10, 116–117.
Braio, V.B. & Taveres, C.R. 2007. Effluent generation by the dairy industry: preventive attitude
and opportunities. J. Chem. Eng. 24(4), 487–497.
Brijwani, K. & Vadlani, P. 2011. Solid state fermentation of soybean hulls for cellulolytic
enzymes production. In Soybean – Applications and Technology ed. Ng, T.-B. pp. 305–322.
Browne, J., Nizami, A.S., Thamsiriroj, T. & Murphy, JD. 2011. Assessing the cost of biofuel
production with increasing penetration of the transport fuel market: A case study of gaseous
biomethane in Ireland. Renewable and Sustainable Energy Reviews 15, 4537–4547.
Buckenhuskes, H.J. 2001. Actual requirements on paprika powder for the food industry. Presented
at the 9th Meeting on Genetics and Breeding of Capsicum and Eggplant, Antalya, Turkey.
Calleja, G.B., Yaguchi, M., Levy-Rick, S., Segun, J.R.H., Roy, C. & Lusena, C.V. 1986. Single-
Cell Protein Production from Potato Starch by the Yeast Schwanniomyces alluvius.
J. Ferment. Teehnol. 64(1), 71–75.
Chanda, S. & Chakrabarti, S. 1996. Plant origin liquid waste: A resource for single cell protein
production by yeast. Biores. Technol. 57, 51–4.
Chanda, S., Chakrabarti, S. & Matai, S. 1984. Whey as the medium for production of microbial
metabolites and biomass. Current Trends in Life Sciences 9, 377–389.
Chen, M.C., Shiao, T.F., Lee, C.F., Huang, C.Y., Chen, C.P. & Shien, Y.S. 1983. Studies on the
utilization of glutamate mother liquor as a feed for cattle. Chin. Agric. Soc. 124, 98–115.
Chiou, P.W.S., Chiu, S.W. & Chen, C.R. 2001. Value of Aspergillus niger fermentation product as
a dietary ingredient for broiler chickens. Animal Feed Science and Technology 91, 171–182.
Choi, S. & Chung, M.H. 2003. A Review on the Relationship Between Aloe vera Components
and Their Biologic Effects. Seminars in Integrative Medicine 1(1), 53–62.
Cibis, E., Krzywonos, M. & Miskiewicz, T. 2006. Aerobic biodegradation of potato slops under
moderate thermophilic conditions: effect of pollution load. Bioresour. Technol. 97(4),
679–685.
Dalev, P. 1990. An enzyme-alkaline hydrolysis of feather keratin for obtaining a protein
concentrate for fodder. Biotechnol. Lett. 12, 71–72.
De Gregorio, A., Mandalari, G., Arena, N., Nucita F., Tripodo M.M. & Lo Curto, R.B. 2002.
SCP and crude pectinase production by slurry-state fermentation of lemon pulps.
Bioresource Technology 83, 89–94.
Deak, N.A. & Johnson, L.A. 2006. Functional properties of protein ingredients prepared from
high-sucrose/low-stachyose soybeans. J. Am. Oil Chem. Soc. 83, 811–818.

1505
Deibel, M.R.J., Hiebsch, R.R. & Klein, R.D. 1988. Secreted amylolytic enzymes from
Schwanniomyces occidentalis: purification by fast protein liquid chromatography (FPLC)
and preliminary characterization. Preparative biochemistry 19(1), 77–120.
Duarte, L.C., Carvalheiro, F., Lopes, S., Neves, I. & Girio, F.M. 2008. Yeast biomass production in
brewery’s spent grains hemicellulosic hydrolyzate. Appl. Biochem. Biotech. 148, 119–129.
El-Bakry, M., Abraham, J., Cerda, A., Barrena, R., Ponsa, S. & Gea, T. 2015. From Wastes to
High Value Added Products: Novel Aspects of SSF in the Production of Enzymes. Journal
Critical Reviews in Environmental Science and Technology 45, 18.
El-Deek, A.A., Ghonem, K.M., Saffa, M.H., Aser, M.A., Fahad, M.A. & Osman, M.M. 2009.
Producing single cell protein from poultry manure and evaluation for broiler chickens diets.
Int. J. Poult. Sci. 8, 1062–1077.
Feng, J., Liu, X., Liu, Y.Y. & Lu, Y.P. 2007. The effect of Aspergillus oryzae fermented soybean
meal on growth performance, digestibility of dietary components and activities of intestinal
enzymes in weaned piglets. Anim. Feed Sci. Technol. 134, 295–303.
Finco, A.M.O., Mamani, L.D.G., Carvalho, J.C., Pereira, G.V.M., Soccol, V.T. & Soccol, C.R.
2017. Technological trends and market perspectives for production of microbial oils rich in
omega-3. Critical Reviews in Biotechnology 37(5), 656–671.
FitzPatrick, M., Champagne, P., Cunningham, M.F. & Whitney, R.A. 2010. A biorefinery
processing perspective: Treatment of lignocellulosic materials for the production of value-
added products. Bioresource Technology 101, 8915–8922.
Fontana, J.D., Czeczuga, B., Bonfim, T.M.B., Chociai, M.B., Oliveira, B.H., Guimaraes, M.F. &
Baron, M. 1996. Bioproduction of carotenoids: the comparative use of raw sugarcane juice
and depolymerized bagasse by Phaffia rhodozyma. Bioresource Technology 58, 121–125.
Food and Agricultural Organization of United Nations (FAO). 2018b. Global statistical
collections: global capture production and global aquaculture production.
http://www.fao.org/fishery/statistics/. Accessed 21.2.2018.
Food and Agricultural Organization of United Nations (FAO). FAOSTAT. 2018a.
http://www.fao.org/faostat/en/#data/QC. Accessed 21.2.2018.
Frostell, B. 1983. Anaerobic–aerobic biological treatment of starch industry waste waters.
Starch-Stärke 35, 185–189.
Gao, Y., Li, D. & Liu, Y. 2012. Production of single cell protein from soy molasses using
Candida tropicalis. Ann. Microbiol. 62, 1165–1172.
Ghaly, A.E., Mahmoud, N.S., Rushton, D.G. & Arab, F. 2007. Potential environmental and
health impacts of high land application of cheese whey. Am. J. Agric. Biol. Sci. 2, 106–117.
Ghanem, K.M. 1992. Single cell protein production from beet pulp by mixed culture. Qatar Univ.
Sci. J. 12, 85–88.
Godber, J. & Juliano, B. 2004. Rice lipids. In E.T. Champagne (Ed.), Rice: Chemistry and
technology. Minnesota: American Association of Cereal Chemists Inc., 163–190.
Hanmoungjai, P., Pyle, D.L. & Niranjan, K. 2000. Extraction of rice bran oil using aqueous
media. J. Chem. Technol. Biotechnol. 75, 348–352.
Hashem, M., Hesham, A.E.L., Almari, S.A. & Alrumman, S.A. 2014. Production of single-cell
protein from wasted date fruits by Hanseniaspora uvarum KKUY-0084 and
Zygosaccharomyces rouxii KKUY-0157. Ann. Microbiol. 64, 1505–1511.
International Grains Council. 2018. International Grains Council Market Report.
http://www.igc.int/downloads/gmrsummary/gmrsumme.pdf. Accessed 21.2.2018.
Jalasutram, V., Kataram, S., Gandu, B. & Anupoju, G.R. 2013. Single cell protein production from
digested and undigested poultry litter by Candida utilis: optimization of process parameters
using response surface methodology. Clean Techn. Environ. Policy 15, 265–273.
Kahlon, T.S. 2009. Rice Bran: Production, Composition, Functionality and Food Applications,
Physiological Benefits. In: Choo SS PS, editor. Fiber Ingredients: Food Applications and
Health benefits 305–321.

1506
Kam, S., Kenari, A.A. & Younesi, H. 2012. Production of Single Cell Protein in Stickwater by
Lactobacillus acidophilus and Aspergillus niger. J. of Aqua. Food Prod. Tech. 21, 403–417.
Kargi, F., Shuler, M.L., Vashon, R., Seeley, H.W., Henry, A. & Austic, R.E. 2000. Continuos
aerobic conversion of poultry waste into single cell protein using a single reactor: kinetic
analysis and determination of optimal conditions. Biotechnol. Bioeng. 22, 1567–1600.
Kim, J.H. & Lebeault, J.M. 1981. Protein Production from Whey Using Penicillium cyclopium;
Growth Parameters and Cellular Composition. European J. Appl. Microbiol. Biotechnol. 13,
151–154.
Kinney, A.J. 2003. Engineering soybeans for food and health. Ag. Bio. Forum 6, 18–22.
Konlani, S., Delgenes, J.P., Moletta, R., Traore, A. & Doh, A. 1996. Optimization of cell yield
of Candida krusei SO1 and Saccharomyces spp. LK3G cultured in sorghum hydrolysate.
Bioresource Technology 57, 275–281.
Kopsahelis, N., Agouridis, N., Bekatorou, A. & Kanellaki, M. 2007. Comparative study of
delignified and non-delignified brewer’s spent grains as yeast immobilization supports for
alcohol production from molasses. Bioresource Technology 98, 1440–1447.
Kost, C., Mayer, J.N., Thomsen, J., Hartmann, N., Senkpiel, C., Philipps, S., Nold, S., Lude, S.,
Saad, N. & Schlegl, T. 2013. Levelized cost of electricity renewable energy technologies.
Fraunhofer ISE https://www.ise.fraunhofer.de/content/dam/ise/en/documents/publications/
studies/FraunhoferISE_LCOE_Renewable_Energy_technologies.pdf. Accessed 21.2.2018.
Kreag, R. & Smith, F. 1975. Seafood solid waste in Oregon: disposal or recovery? Oregon State
University Extension Marine Advisory Program Report 395.
Krzywonos, M., Cibis, E., Lasik, M., Nowak, J. & Miskiewicz, T. 2009. Thermo- and mesophilic
aerobic batch biodegradation of high-strength distillery wastewater (potato stillage)-
utilisation of main carbon sources. Bioresour. Technol. 100(9), 2507–2514.
Kurbanoglu, E.B. & Algur, O.F. 2002. Single-cell protein production from ram horn hydrolysate
by bacteria. Bioresource Technology 85, 125–129.
Lasik, M., Nowak, J., Krzywonos, M. & Cibis, E. 2010. Impact of batch, repeated-batch (with
cell recycle and medium replacement) and continuous processes on the course and
efficiency of aerobic thermophilic biodegradation of potato processing wastewater.
Bioresour. Technol. 101(10), 3444–3451.
Lehninger, A.L. 1975. Biochemistry, second ed. Worth Publishers, 444 Park Avenue South, New
York, 1104 pp.
Lettinga, G., van Velsen, A.F.M., Hobma, S.W., de Zeeuw, W. & Klapqijk, A. 1980. Use of the
upflow sludge blanket (USB) reactor concept for biological wastewater treatment,
especially for anaerobic treatment. Biotechnology and Bioengineering 12, 699–734.
Lipinsky, E.S. 1981. Chemicals from biomass: petrochemical substitution options. Science 212,
1465–1471.
Liu, B., Li, Y., Song, J., Zhang, L., Dong, J. & Yang, Q. 2014. Production of single-cell protein
with two-step fermentation for treatment of potato starch processing waste. Cellulose 21,
3637–3645.
Liu, B., Song, J., Li, Y., Niu, J., Wang, Z. & Yang, Q. 2013. Towards Industrially Feasible
Treatment of Potato Starch Processing Waste by Mixed Cultures. Appl. Biochem.
Biotechnol. 171, 1001–1010.
Mauldin, A.F. & Szabo, A.J. 1975. Shrimp canning waste treatment study,” Environmental
Protection Agency Publication 2, 74–061.
Mekonnen, M.M. & Howkstra, A.Y. 2014. Water footprint benchmarks for crop production:
A first global assessment. Ecological Indicators 46, 214–223.
Mitchell, C.C. & Tub, S. 2003. Long-term evaluation of poultry litter as a source of nitrogen for
cotton and corn. Agron. J. 97, 399–407.
Mussatto, S.I., Dragone, G. & Roberto, I.C. 2006. Brewers’ spent grain: generation,
characteristics and potential applications. Journal of Cereal Science 43, 1–14.
1507
Nasseri, A.T., Sasoul-Amini, S., Morowvat, M.H. & Ghasemi, Y. 2011. Single Cell Protein:
Production and Process. American Journal of Food Technology 6(2), 103–116.
Nelson, R.G. 2002. Resource assessment and removal analysis for corn stover and wheat straw
in the Eastern and Midwestern United States - rainfall and wind-induced soil erosion
methodology. Biomass and Bioenergy 22, 349–363.
NL Agency. 2013. Rice straw and Wheat straw. Potential feedstocks for the Biobased Economy.
Netherlands Ministry of Economic Affairs. https://english.rvo.nl/sites/default/files/2013/
12/Straw%20report%20AgNL% 20June%202013.pdf. Accessed 21.2.2018.
Paraskevopoulou, A., Athanasiadis, I., Kanellaki, M., Bekatourou, A., Blekas, G. &
Kiosseoglou, V. 2003. Functional properties of sigle cell protein produced by kefir
microflora. Food Res. Int. 36, 431–438.
Perosa, A. & Zecchini, F. 2007. Methods and Reagents for Green Chemistry: An Introduction.
John Wiley & Sons. 25 pp.
Pessoa, A.J., Mancilha, I.M. & Sato, S. 1996. Cultivation of Candida tropicalis in sugar cane
hemicellulosic hydrolyzate for microbial protein production. J. of Biotech. 51, 83–88.
Pirie, N.W. 1987. Leaf Protein: And Its By-products in Human and Animal Nutrition. Cambridge
University Press, 209 pp.
Rajeshwari, K.V., Balakrishnan, M., Kansal, A., Lata, K. & Kishore, V.V.N. 2000. State-of-the-
art of anaerobic digestion technology for industrial wastewater treatment. Renewable and
Sustainable Energy Reviews 4(2), 135–156.
Revah-Moiseev, S. & Carroad, P.A. 1981. Conversion of the Enzymatic Hydrolysate of Shellfish
Waste Chitin to Single-Cell Protein. Biotechnology and Bioengineering 23, 1067–1078.
Rhishipal, R. & Philip, R. 1998. selection of marine yeasts for the generation of single cell protein
from prawn-shell waste. Bioresource Technology 65, 255–256.
Ritala, A., Hakkinen, S.T., Toivari, M. & Wiebe, M.G. 2017. Single Cell Protein—State-of-the-
Art, Industrial Landscape and Patents 2001–2016. Front. Microbiol. 8, 2009.
Scerra, V., Caridi, A., Foti, F. & Sinatra, M.C. 1999. Influence of dairy Penicillium spp. on
nutrient content of citrus fruit peel. Animal Feed Science and Technology 78, 169–176.
Shipman, R.H., Kao, I.C. & Fan, L.T. 1975. Single-cell protein production by photosynthetic
bacteria cultivation in agricultural by-products. Biotech. and Bioeng. 17, 1561–1570.
Shuler, M.L., Roberts, E.D., Mitchell, D.W., Kargi, F., Austic, R.E., Henry, A., Vashon, R. &
Seeley, H.W.J. 1979. Process for the aerobic conversion of poultry manure into high-protein
feedstuff. Biotechnology and Bioengineering 21, 19–38.
Singh, A., Abidi, A.B., Agrawal, A.K. & Darmwal, N.S. 1991. Single cell protein production by
aspergillus niger and its evaluation. Zentralbl. Mikrobiol. 146, 181–184.
Singh, J.K., Meshram, R.L. & Ramteke, D.S. 2011. Production of Single cell protein and removal
of ‘COD’ from dairy waste water. European Journal of Experimental Biology 1(3), 209–215.
Sisman, T., Özlem, G., Dogan, N., Özdal, M., Algur, Ö.F. & Ergon, T. 2013. Single-cell protein
as an alternative food for zebrafish, Danio rerio: a toxicological assessment. Toxicol. Ind.
Health 29, 792–799.
Skidmore, E.L. Wind erosion. In: Soil erosion research methods. Anakeny, IA: Soil and Water
Conservation Society, 1988.
Stanely, V.G., Gray, C., Daley, M., Krueger, W.F. & Sefton, A. 2004. An alternative to antibiotic
based drugs in feed for enhancing performance of broilers grown on Eimeria spp. infected
litter. Poult. Sci. 83, 39–44.
Stickney, R.R. & McVey, J.P. 2002. Responsible Marine Aquaculture. CABI, 391 pp.
Suzuki, S., Fukuoka, M., Tada, S., Matsushita-Morita, M., Hattori, R., Kitamoto, N. &
Kusumoto, K.I. 2010 Production of polygalacturonase by recombinant Aspergillus oryzae
in solid-state fermentation using potato pulp. Food Sci. Technol. Res. 16(5), 517–521.
Zadrazil, F. & Puniya, A.K. 1995. studies on the effet of particle size on solid-state fermentation
of sugarcane bagasse into animal feed using white-rot fungi. Biores. Technol. 54, 85–87.

1508
Zervas, G., Fegeros, K., Koytsotolis, K., Goulas, C. & Mantzios, A. 1998. Soy hulls as a
replacement for maize in lactating dairy ewe diets with or without dietary fat supplements.
Anim. Feed Sci. Technol. 76, 65–75.
Zhao, G., Zhang, W. & Zhang, G. 2010. Production of single cell protein using waste capsicum
powder produced during capsanthin extraction. Letters in Applied Microbiol. 50, 187–191.
Tilman, D. 1999. Global environmental impacts of agricultural expansion: the needfor
sustainable and efficient practices. Proc. Natl. Acad. Sci. 96(11), 5995–6000.
Topuz, A. & Ozdemir, F. 2003. Influences of γ-Irradiation and Storage on the Carotenoids of
Sun-Dried and Dehydrated Paprika. J. Agric. Food Chem. 51, 4972–4977.
Ugalde, U.O. & Castrillo, JI. 2002. Applied mycology and biotechnology. Agriculture and food
production 2, 123–149.
Upadhyay, R.C. & Sohi, H.S. 1988. Apple pomace - a good substrate for the cultivation of edible
mushrooms. Current Science 57, 1189–1190.
Valentino, M.J.G., Ganado, L.S. & Undan, J.R. 2016. Single cell protein potential of endophytic
fungi associated with bamboo using rice bran as substrate. Adv. in Appl. Sci. Res. 7(3), 68–72.
Valmaseda, M., Almendrs, G. & Martinez, A.T. 1991. Chemical transformation of wheat straw
constituents after solid state fermentation with selected lignocellulose-degrading fungi.
Biomass Bioenergy 1, 261–266.
Walter, R.C. & Sherman, R.M. 1976. Fuel value of grape and apple processing wastes. Journal
of Agricultural and Food Chemistry 24, 1244–1245.
Wang, L., Wu, Z., Zhao, B., Liu, W. & Gao, Y. 2013. Enhancing the adsorption of the proteins
in the soy whey wastewater using foam separation column fitted with internal baffles.
Journal of Food Engineering 119(2), 377–384.
Wang, T.Y., Wu, Y.H., Jiang, C.Y. & Liu, Y. 2010. Solid state fermented potato pulp can be used
as poultry feed. Br. Poult. Sci. 51(2), 229–234.
Vares, T., Kalsi, M. & Hatakka, A. 1995. Lignin peroxidases and other ligninolytic enzymes by
Phlebia radiate during solid-state fermentation of wheat straw. Environ. Microbiol. 61,
3515–3520.
Vermeulen, S.J., Campbell, B.M. & Ingram, J.S.I. 2012. Climate change and food systems.
Annual Review of Environment and Resources 37, 195–222.
Werpy, T. & Petersen, G. 2004. Top value added chemicals from biomass. Volume I - results of
screening for potential candidates from sugars and synthesis gas, U.S.D. o. Energy.
https://www.nrel.gov/docs/fy04osti/35523.pdf. Accessed 21.2.2018.
Wongputtisin, P., Khanongnuch, C., Kongbuntad, W., Niamsup, P. & Lumyong, S. 2012.
Screening and selection of Bacillus spp. for fermented corticate soybean meal production.
Journal of Applied Microbiology 113, 798–806.
Wongputtisin, P., Khanongnuch, C., Kongbuntad, W., Niamsup, P., Lumyong, S. & Sarkar, P.K.
2014. Use of Bacillus subtilis isolates from Tea-nao towards nutritional improvement of
soya bean hull for monogastric feed application. Letr. in Appl. Microbiol. 59, 328–333.
Wongputtisin, P., Khanongnuch, C., Pongpiachan, P. & Lumyong, S. 2007. Antioxidant activity
improvement of soybean meal by microbial fermentation. Res. J. Microbiol. 2, 577–583.
Yadav, J.S.S., Bezawada, J., Ajila, C.M., Yan, S., Tyagi, R.D. & Surampalli, R.Y. 2014. Mixed
culture of Kluyveromyces marxianus and Candida krusei for single-cell protein production
and organic load removal from whey. Bioresource Technology 164, 119–127.
Yadav, J.S.S., Bezawada, J., Elharche, S., Yan, S., Tyagi, R.D. & Surampalli, R.Y. 2013.
Simultaneous single-cell protein production and COD removal with characterization of
residual protein. Bioprocess Biosyst. Eng. 37(6), 1017–1029. http://dx.doi.org/10.1007/s00449-013-1072-6.
Yang, Y.F. & Lee, P.K. 1982. Can molasses and glutamate fermentation end liquor as feed
ingredients on growth and feed efficiency on growing fattening pigs. Taiwan Livest. Res.
15(1), 9–16.

1509
Agronomy Research 16(S2), 1509–1516, 2018
https://doi.org/10.15159/AR.18.097
A study of dynamics of bitter acids and xanthohumol in hop
pellets during storage
J. Táborský1,*, A. Hejtmánková1, E. Hlavatá1 and L. Chládek2 1Czech University of Life Sciences, Faculty of Agrobiology, Food and Natural
Resources, Department of Chemistry, Kamýcká 129, CZ165 00 Prague 6, Czech Republic 2Czech University of Life Sciences, Faculty of Engineering, Department of
Technological Equipment of Buildings, Kamýcká 129, CZ165 00 Prague 6, Czech
Republic *Correspondence: [email protected]
Abstract. Eight varieties of hop pellets were analyzed for the contents of α-acids, ß-acids and
xanthohumol according to the EBC 7.7 analytical method. The pellets were extracted with
acidified mixture methanol - diethylether and analyzed using HPLC with a diode-array detector
and a Nova-Pak column C18. Four series of analyses were performed: immediately after the
unpacking of the pellets and then after five, seven and nine months of storage at 4 °C. According
to the first series of analyses, the contents were assayed as following (α-acids, ß-acids,
xanthohumol resp., all in weight % in pellets): Galaxy (13.4, 8.0, 0.74), Citra (11.1, 3.0, 0.48),
Tradition (8.2, 8.0, 0.58), Cascade (4.5, 5.2, 0.25), Northern Brewer (4.0, 2.9, 0.37), Sládek (3.5,
4.0, 0.48), Saaz (2.0, 3.4, 0.24), and Triskel (1.7, 3.6, 0.18). According to these results, variety
Galaxy was found as the richest in all three parameters. After nine months of storage at 4 °C, the
weight loss of α-acids ranged from 4.1% (Citra and Triskel) to 66.4% (Galaxy). The losses of β-
acids and xanthohumol were less distinctive (from zero to 31.3% and 25.7%, resp.) and indicated
good long storage possibilities of these compounds at convenient conditions (darkness, low
temperature, elimination of direct influence of oxygen).
Key words: hop pellets, hop varieties, storage, α-acids, ß-acids, xanthohumol, HPLC.
INTRODUCTION
Hop growing at the territory of the present-day Czech Republic has a long tradition;
the first news concerning hop growing come already from the 8th and 9th centuries.
Thanks to the specific soil and climatic conditions, the best results in the quality of hops
have been achieved in Žatec (Saaz) region. Several important hop varieties exported to
many foreign countries originate from this region, e.g. Saaz semi-early red-bine hop,
Saaz Late or Sládek (Nesvadba, 2013).
From the chemical point of view, the most important criteria of hop quality are the
contents of hop resins (especially α-acids and β-acids), hop polyphenols (xanthohumol
and related compounds), and the total contents and composition of essential oils
(European Brewery Convention, 2013). The main constituents of α-acids are humulone,
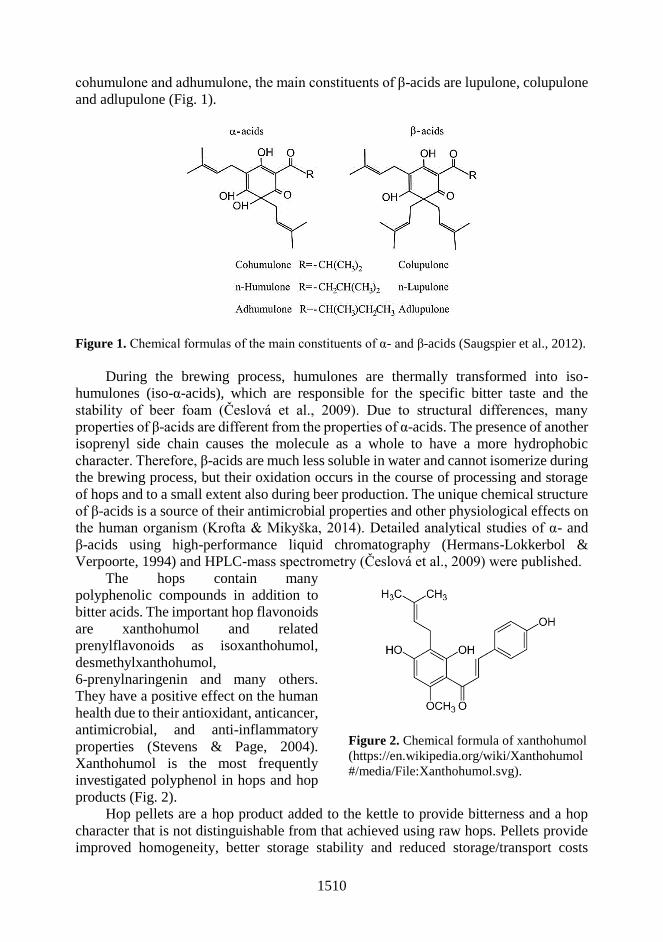
1510
cohumulone and adhumulone, the main constituents of β-acids are lupulone, colupulone
and adlupulone (Fig. 1).
Figure 1. Chemical formulas of the main constituents of α- and β-acids (Saugspier et al., 2012).
During the brewing process, humulones are thermally transformed into iso-
humulones (iso-α-acids), which are responsible for the specific bitter taste and the
stability of beer foam (Česlová et al., 2009). Due to structural differences, many
properties of β-acids are different from the properties of α-acids. The presence of another
isoprenyl side chain causes the molecule as a whole to have a more hydrophobic
character. Therefore, β-acids are much less soluble in water and cannot isomerize during
the brewing process, but their oxidation occurs in the course of processing and storage
of hops and to a small extent also during beer production. The unique chemical structure
of β-acids is a source of their antimicrobial properties and other physiological effects on
the human organism (Krofta & Mikyška, 2014). Detailed analytical studies of α- and
β-acids using high-performance liquid chromatography (Hermans-Lokkerbol &
Verpoorte, 1994) and HPLC-mass spectrometry (Česlová et al., 2009) were published.
The hops contain many
polyphenolic compounds in addition to
bitter acids. The important hop flavonoids
are xanthohumol and related
prenylflavonoids as isoxanthohumol,
desmethylxanthohumol,
6-prenylnaringenin and many others.
They have a positive effect on the human
health due to their antioxidant, anticancer,
antimicrobial, and anti-inflammatory
properties (Stevens & Page, 2004).
Xanthohumol is the most frequently
investigated polyphenol in hops and hop
products (Fig. 2).
Figure 2. Chemical formula of xanthohumol
(https://en.wikipedia.org/wiki/Xanthohumol
#/media/File:Xanthohumol.svg).
Hop pellets are a hop product added to the kettle to provide bitterness and a hop
character that is not distinguishable from that achieved using raw hops. Pellets provide
improved homogeneity, better storage stability and reduced storage/transport costs

1511
compared to raw hops. Their chemical composition and the demands for their quality
assessment are similar as for the raw hops. Hop pellets are usually packed in laminated
foils with an aluminium layer as a barrier against diffusion of oxygen and they can be
shipped for long distances (Barth & Schönberger, 2014). Thus, the using of hop pellets
made of miscellaneous hop varieties is typical for contemporary brewery practice
including breweries in the Czech Republic, where the use of traditional Czech varieties
predominated in past years (Nesvadba, 2013).
Because the quality of input raw materials is very important, we decided to arrange
an analytical study including the determination of α-acids, β-acids and xanthohumol in
eight varieties of hop pellets being frequently used in the Czech Republic. The main goal
of this study was to evaluate the influence of storage on the quality of hop pellets and to
compare the properties of analyzed hop varieties with data from literature.
MATERIALS AND METHODS
Hop pellets
Hop pellets manufactured from eight miscellaneous hop varieties were studied
(country of origin is given in brackets): Cascade (USA), Citra (USA), Galaxy
(Australia), Northern Brewer (Germany), Saaz (Czech Republic), Sládek (Czech
Republic), Tradition (Germany), and Triskel (France). All pellets were type 90,
cylindrical shape with diameter about 6 mm, packed in laminated aluminium foils
per 5 kg, year of harvest 2015 (only Cascade 2014, weight of package 10 kg).
All samples were obtained in cooperation with a medium-size brewery located in
East Bohemia (beer production ca. 130 000 hl per year). Most of analyzed hop pellets
were supplied by Joh. Barth & Sohn Gmbh & Co. KG (Nuremberg, Germany), only the
Saaz variety was supplied by a Czech company Chmel Polepská blata, Ltd., Polepy. All
other identification data (batch numbers, delivery sheets etc.) are available at the authors.
Sampling and storage
About 100 g of hop pellets was taken from each batch delivered into the brewery
immediately after packing foil opening and placed into a zip reclosable plastic bag.
Before closing the bag, the access of air was removed carefully and tightly closed bags
were stored in a refrigerator at 4 °C. The first series of analyses was performed up to
48 hours from sampling, the next series of analyses were performed after five, seven,
and nine months of storage in the refrigerator at the same conditions.
Extraction of pellets
Extraction of pellets was performed according to the EBC 7.7 analytical method
(Krofta, 2008; European Brewery Convention, 2013). 10 g of hop pellets were blended
and poured into a 250 mL glass jar with a screw cap. 20 mL of methanol, 100 mL of
diethyl ether, and 40 mL of hydrochloric acid (c = 0.1 mol L-1) were added. Tightly
closed jars were shaken for 40 minutes in a laboratory shaker and then left to stand for
10 minutes at least (to let liquid phases to separate). 5 mL of the clear upper layer were
pipetted into a 50 mL volumetric flask, filled up with methanol and homogenized
carefully. About 2 mL of this solution were taken into a plastic syringe and transferred
through a syringe filter into a glass vial for the HPLC analysis. For each sample of
pellets, two parallel extractions were made.
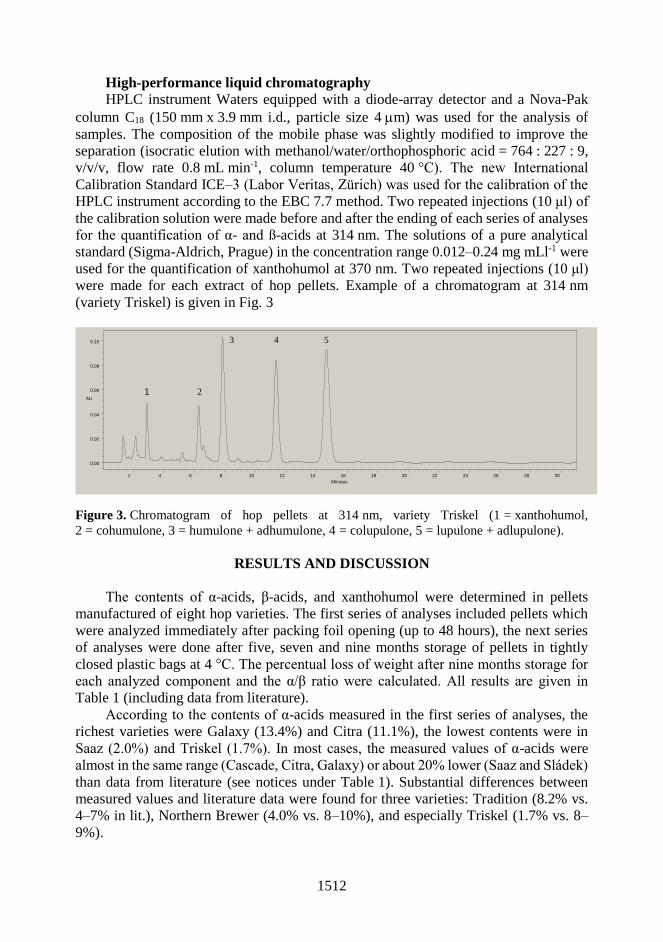
1512
High-performance liquid chromatography HPLC instrument Waters equipped with a diode-array detector and a Nova-Pak
column C18 (150 mm x 3.9 mm i.d., particle size 4 m) was used for the analysis of
samples. The composition of the mobile phase was slightly modified to improve the
separation (isocratic elution with methanol/water/orthophosphoric acid = 764 : 227 : 9,
v/v/v, flow rate 0.8 mL min-1, column temperature 40 °C). The new International
Calibration Standard ICE–3 (Labor Veritas, Zürich) was used for the calibration of the
HPLC instrument according to the EBC 7.7 method. Two repeated injections (10 μl) of
the calibration solution were made before and after the ending of each series of analyses
for the quantification of α- and ß-acids at 314 nm. The solutions of a pure analytical
standard (Sigma-Aldrich, Prague) in the concentration range 0.012–0.24 mg mLl-1 were
used for the quantification of xanthohumol at 370 nm. Two repeated injections (10 μl)
were made for each extract of hop pellets. Example of a chromatogram at 314 nm
(variety Triskel) is given in Fig. 3
Figure 3. Chromatogram of hop pellets at 314 nm, variety Triskel (1 = xanthohumol,
2 = cohumulone, 3 = humulone + adhumulone, 4 = colupulone, 5 = lupulone + adlupulone).
RESULTS AND DISCUSSION
The contents of α-acids, β-acids, and xanthohumol were determined in pellets
manufactured of eight hop varieties. The first series of analyses included pellets which
were analyzed immediately after packing foil opening (up to 48 hours), the next series
of analyses were done after five, seven and nine months storage of pellets in tightly
closed plastic bags at 4 °C. The percentual loss of weight after nine months storage for
each analyzed component and the α/β ratio were calculated. All results are given in
Table 1 (including data from literature).
According to the contents of α-acids measured in the first series of analyses, the
richest varieties were Galaxy (13.4%) and Citra (11.1%), the lowest contents were in
Saaz (2.0%) and Triskel (1.7%). In most cases, the measured values of α-acids were
almost in the same range (Cascade, Citra, Galaxy) or about 20% lower (Saaz and Sládek)
than data from literature (see notices under Table 1). Substantial differences between
measured values and literature data were found for three varieties: Tradition (8.2% vs.
4–7% in lit.), Northern Brewer (4.0% vs. 8–10%), and especially Triskel (1.7% vs. 8–
9%).
3 4 5
1 2
AU
0.00
0.02
0.04
0.06
0.08
0.10
Minutes 2 4 6 8 10 12 14 16 18 20 22 24 26 28 30
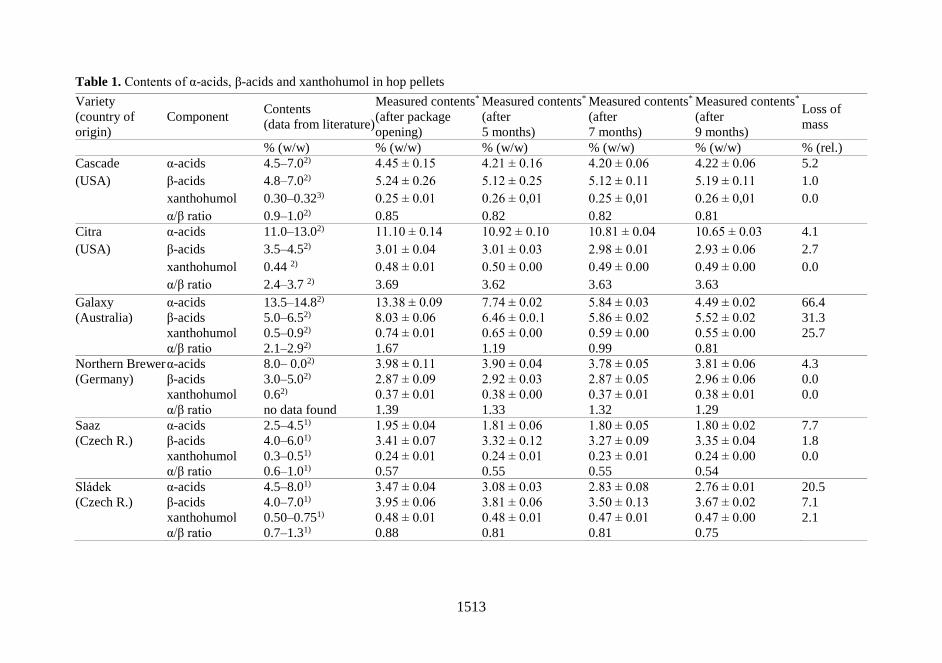
1513
Table 1. Contents of α-acids, β-acids and xanthohumol in hop pellets
Variety
(country of
origin)
Component Contents
(data from literature)
Measured contents*
(after package
opening)
Measured contents*
(after
5 months)
Measured contents*
(after
7 months)
Measured contents*
(after
9 months)
Loss of
mass
% (w/w) % (w/w) % (w/w) % (w/w) % (w/w) % (rel.)
Cascade α-acids 4.5–7.02) 4.45 ± 0.15 4.21 ± 0.16 4.20 ± 0.06 4.22 ± 0.06 5.2
(USA) β-acids 4.8–7.02) 5.24 ± 0.26 5.12 ± 0.25 5.12 ± 0.11 5.19 ± 0.11 1.0
xanthohumol 0.30–0.323) 0.25 ± 0.01 0.26 ± 0,01 0.25 ± 0,01 0.26 ± 0,01 0.0
α/β ratio 0.9–1.02) 0.85 0.82 0.82 0.81
Citra α-acids 11.0–13.02) 11.10 ± 0.14 10.92 ± 0.10 10.81 ± 0.04 10.65 ± 0.03 4.1
(USA) β-acids 3.5–4.52) 3.01 ± 0.04 3.01 ± 0.03 2.98 ± 0.01 2.93 ± 0.06 2.7
xanthohumol 0.44 2) 0.48 ± 0.01 0.50 ± 0.00 0.49 ± 0.00 0.49 ± 0.00 0.0
α/β ratio 2.4–3.7 2) 3.69 3.62 3.63 3.63
Galaxy α-acids 13.5–14.82) 13.38 ± 0.09 7.74 ± 0.02 5.84 ± 0.03 4.49 ± 0.02 66.4
(Australia) β-acids 5.0–6.52) 8.03 ± 0.06 6.46 ± 0.0.1 5.86 ± 0.02 5.52 ± 0.02 31.3
xanthohumol 0.5–0.92) 0.74 ± 0.01 0.65 ± 0.00 0.59 ± 0.00 0.55 ± 0.00 25.7
α/β ratio 2.1–2.92) 1.67 1.19 0.99 0.81
Northern Brewer α-acids 8.0– 0.02) 3.98 ± 0.11 3.90 ± 0.04 3.78 ± 0.05 3.81 ± 0.06 4.3
(Germany) β-acids 3.0–5.02) 2.87 ± 0.09 2.92 ± 0.03 2.87 ± 0.05 2.96 ± 0.06 0.0
xanthohumol 0.62) 0.37 ± 0.01 0.38 ± 0.00 0.37 ± 0.01 0.38 ± 0.01 0.0
α/β ratio no data found 1.39 1.33 1.32 1.29
Saaz α-acids 2.5–4.51) 1.95 ± 0.04 1.81 ± 0.06 1.80 ± 0.05 1.80 ± 0.02 7.7
(Czech R.) β-acids 4.0–6.01) 3.41 ± 0.07 3.32 ± 0.12 3.27 ± 0.09 3.35 ± 0.04 1.8
xanthohumol 0.3–0.51) 0.24 ± 0.01 0.24 ± 0.01 0.23 ± 0.01 0.24 ± 0.00 0.0
α/β ratio 0.6–1.01) 0.57 0.55 0.55 0.54
Sládek α-acids 4.5–8.01) 3.47 ± 0.04 3.08 ± 0.03 2.83 ± 0.08 2.76 ± 0.01 20.5
(Czech R.) β-acids 4.0–7.01) 3.95 ± 0.06 3.81 ± 0.06 3.50 ± 0.13 3.67 ± 0.02 7.1
xanthohumol 0.50–0.751) 0.48 ± 0.01 0.48 ± 0.01 0.47 ± 0.01 0.47 ± 0.00 2.1
α/β ratio 0.7–1.31) 0.88 0.81 0.81 0.75
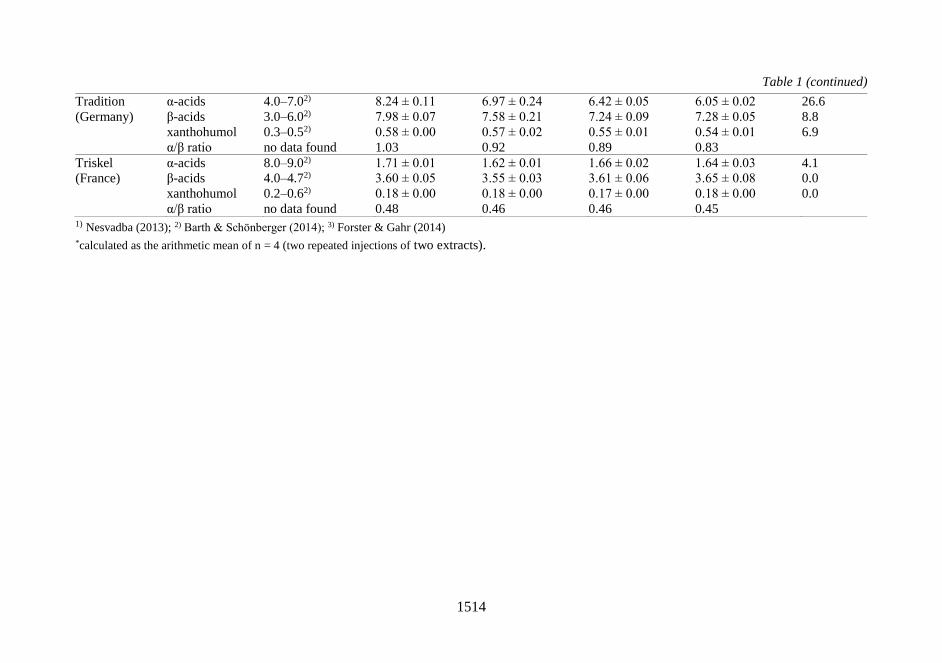
1514
Table 1 (continued)
Tradition α-acids 4.0–7.02) 8.24 ± 0.11 6.97 ± 0.24 6.42 ± 0.05 6.05 ± 0.02 26.6
(Germany) β-acids 3.0–6.02) 7.98 ± 0.07 7.58 ± 0.21 7.24 ± 0.09 7.28 ± 0.05 8.8
xanthohumol 0.3–0.52) 0.58 ± 0.00 0.57 ± 0.02 0.55 ± 0.01 0.54 ± 0.01 6.9
α/β ratio no data found 1.03 0.92 0.89 0.83
Triskel α-acids 8.0–9.02) 1.71 ± 0.01 1.62 ± 0.01 1.66 ± 0.02 1.64 ± 0.03 4.1
(France) β-acids 4.0–4.72) 3.60 ± 0.05 3.55 ± 0.03 3.61 ± 0.06 3.65 ± 0.08 0.0
xanthohumol 0.2–0.62) 0.18 ± 0.00 0.18 ± 0.00 0.17 ± 0.00 0.18 ± 0.00 0.0
α/β ratio no data found 0.48 0.46 0.46 0.45 1) Nesvadba (2013); 2) Barth & Schönberger (2014); 3) Forster & Gahr (2014)
*calculated as the arithmetic mean of n = 4 (two repeated injections of two extracts).
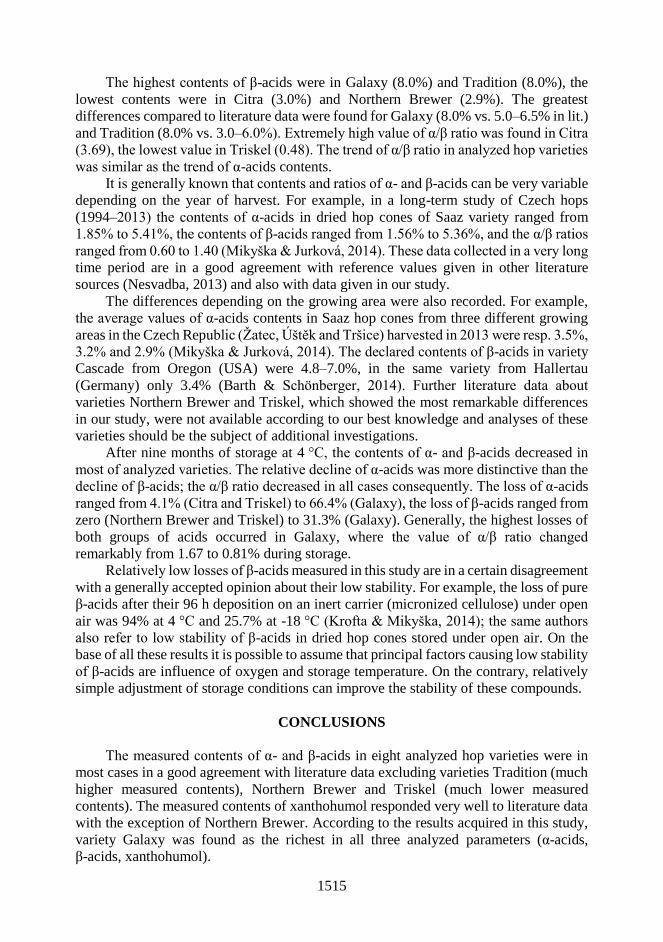
1515
The highest contents of β-acids were in Galaxy (8.0%) and Tradition (8.0%), the
lowest contents were in Citra (3.0%) and Northern Brewer (2.9%). The greatest
differences compared to literature data were found for Galaxy (8.0% vs. 5.0–6.5% in lit.)
and Tradition (8.0% vs. 3.0–6.0%). Extremely high value of α/β ratio was found in Citra
(3.69), the lowest value in Triskel (0.48). The trend of α/β ratio in analyzed hop varieties
was similar as the trend of α-acids contents.
It is generally known that contents and ratios of α- and β-acids can be very variable
depending on the year of harvest. For example, in a long-term study of Czech hops
(1994–2013) the contents of α-acids in dried hop cones of Saaz variety ranged from
1.85% to 5.41%, the contents of β-acids ranged from 1.56% to 5.36%, and the α/β ratios
ranged from 0.60 to 1.40 (Mikyška & Jurková, 2014). These data collected in a very long
time period are in a good agreement with reference values given in other literature
sources (Nesvadba, 2013) and also with data given in our study.
The differences depending on the growing area were also recorded. For example,
the average values of α-acids contents in Saaz hop cones from three different growing
areas in the Czech Republic (Žatec, Úštěk and Tršice) harvested in 2013 were resp. 3.5%,
3.2% and 2.9% (Mikyška & Jurková, 2014). The declared contents of β-acids in variety
Cascade from Oregon (USA) were 4.8–7.0%, in the same variety from Hallertau
(Germany) only 3.4% (Barth & Schönberger, 2014). Further literature data about
varieties Northern Brewer and Triskel, which showed the most remarkable differences
in our study, were not available according to our best knowledge and analyses of these
varieties should be the subject of additional investigations.
After nine months of storage at 4 °C, the contents of α- and β-acids decreased in
most of analyzed varieties. The relative decline of α-acids was more distinctive than the
decline of β-acids; the α/β ratio decreased in all cases consequently. The loss of α-acids
ranged from 4.1% (Citra and Triskel) to 66.4% (Galaxy), the loss of β-acids ranged from
zero (Northern Brewer and Triskel) to 31.3% (Galaxy). Generally, the highest losses of
both groups of acids occurred in Galaxy, where the value of α/β ratio changed
remarkably from 1.67 to 0.81% during storage.
Relatively low losses of β-acids measured in this study are in a certain disagreement
with a generally accepted opinion about their low stability. For example, the loss of pure
β-acids after their 96 h deposition on an inert carrier (micronized cellulose) under open
air was 94% at 4 °C and 25.7% at -18 °C (Krofta & Mikyška, 2014); the same authors
also refer to low stability of β-acids in dried hop cones stored under open air. On the
base of all these results it is possible to assume that principal factors causing low stability
of β-acids are influence of oxygen and storage temperature. On the contrary, relatively
simple adjustment of storage conditions can improve the stability of these compounds.
CONCLUSIONS
The measured contents of α- and β-acids in eight analyzed hop varieties were in
most cases in a good agreement with literature data excluding varieties Tradition (much
higher measured contents), Northern Brewer and Triskel (much lower measured
contents). The measured contents of xanthohumol responded very well to literature data
with the exception of Northern Brewer. According to the results acquired in this study,
variety Galaxy was found as the richest in all three analyzed parameters (α-acids,
β-acids, xanthohumol).

1516
After nine months of storage at 4 °C, considerable decline of α-acids was observed,
but substantial differences among analyzed varieties were recorded. The losses of
β-acids and xanthohumol were less distinctive and indicated good long storage
possibilities of these compounds at convenient conditions (low temperature, elimination
of direct oxygen influence).
ACKNOWLEDGEMENTS. The work was supported by the SGS Grant Agency of Faculty of
Agrobiology, Food and Natural Resources, CULS Prague.
REFERENCES
Barth, S. & Schönberger, C. (Eds.). 2014. The Hop Aroma Compendium. A Flavour Guide.
Volume 1–3. Fachverlag Hans Carl, Nuremberg, 270 pp.
Česlová, L., Holčapek, M., Fidler, M., Drštičková, J. & Lísa, M. 2009. Characterization of
prenylflavonoids and hop bitter acids in various classes of Czech beers and hop extracts
using high performance liquid chromatography-mass spectrometry. Journal of
Chromatography. A 1216, 7249–7257.
European Brewery Convention. 2013. Analytica-EBC (on-line version): Hops and Hop Products.
http://www.analytica-ebc.com
Forster, A. & Gahr, A. 2014. A comparison of the analytical and brewing characteristics of
Cascade and Comet hop varieties as grown in Yakima (USA) and Hallertau (Germany).
BrewingScience 67, 137–148.
Hermans-Lokkerbol, A.C.J. & Verpoorte, R. 1994. Development and validation of a high-
performance liquid chromatography system for the analysis of hop bitter acids. Journal of
Chromatography A 669, 65–73.
Krofta, K. 2008. Evaluation of hops quality. Hop Research Institute, Co., Ltd., Žatec, Czech
Republic, 52 pp. (in Czech).
Krofta, K. & Mikyška, A. 2014. Hop beta-acids: Properties, significance and utilization. Kvasny
Prum. 60, 96–105.
Mikyška, A. & Jurková, M. 2014. Evaluation of bitter acids and polyphenols content in Czech
hops harvest in 2013 – I: Contents of α- and β-bitter acids. Kvasny Prum. 60, 88–95.
Nesvadba, V. (Ed.). 2013. Development and Tradition of Czech Hop Varieties. Hop Research
Institute, Co., Ltd., Žatec, Czech Republic, 104 pp.
Saugspier, M., Dorn, C., Czech, B., Gehrig, M., Heilmann, J. & Hellerbrand, C. 2012. Hop bitter
acids inhibit tumorigenicity of hepatocellular carcinoma cells in vitro. Oncol. Rep. 28,
1423–1428
Stevens, J.F. & Page, J.E. 2004. Xanthohumol and related prenylflavonoids from hops and beer:
to your good health! Phytochemistry 65, 1317–1330.

1517
Agronomy Research 16(S2), 1517–1526, 2018
https://doi.org/10.15159/AR.18.117
Cadmium-induced oxidative damage and protective action of
fractioned red beet (Beta vulgaris) root juice in chickens
S. Vasiljeva1,*, G. Smirnova1,2, N. Basova1 and D. Babarykin2
1University of Latvia, Institute of Biology, 3 Miera Str., LV-2169 Salaspils, Latvia 2Institute of Innovative Biomedical Technology Ltd, 2 Inchukalna Str., LV-1014 Riga,
Latvia *Correspondence: [email protected]
Abstract. Cadmium (Cd) is one of the most dangerous environmental bioaccumulative pollutants
that affects many organs in humans and animals. Present investigation was conducted to evaluate
the protective effect of fractioned red beetroot juice on Cd-induced oxidative stress in chickens.
The named red beetroot juice fraction (BJF) was received by juice ultrafiltration. Per oral
administration of BJF for 10 days followed by dietary Cd exposure (50 mg kg-1 of diet) was
evaluated in the in vivo experiments in chickens. The prominent increase of Cd concentration in
blood plasma, liver and kidney provoked the rise of oxidative processes activity in organs. BJF
treatment attenuated the Cd-induced oxidative stress. The changes of oxidative stress markers -
the reduction of hepatic and kidney malondialdehyde amount, the increase of
glutathionperoxidase level in liver and blood catalase activity indicated the possible antioxidative
influence of BJF. Chickens exposed to Cd showed no evidence of clinical toxicity, but exhibited
some features of adverse action of this heavy metal. The increase of uric acid concentration in
blood serum is associated with protein catabolic processes intensified by Cd affect. Suppressive
effect of Cd on the immune response in chickens manifested in alteration of cell and humoral
immunity parameters. The data of the most investigated oxidative stress markers, biochemical
and immunological indices in Cd-exposed chickens were almost back to the values, when
received BJF per os during 10 days. Administration of fractioned red beetroot juice to Cd-treated
chickens prevented the oxidative impact of this heavy metal and provided immunomodulating
effect.
Key words: oxidative stress, cadmium, red beetroot juice, antioxidative effect, chickens.
INTRODUCTION
Heavy metal cadmium (Cd) is a naturally occurring element that is present
everywhere in the environment – in almost all soils, surface waters, plants and wildlife.
In comparison with other heavy metals, Cd possesses high mobility in soil and is taken
up by plants in various degrees (Kah et al., 2012; Brzóska et al., 2016). Cd content in the
environment is increasing, because this element is continuously released from its natural
sources (the Earth's crust), and introduced through various human activities, including
industrial processes, it does not undergo biodegradation (Moulis & Thévenod, 2010).
Cd intake by humans mainly occurs via the food chain and this heavy metal is
considered one of the most dangerous occupational and environmental poisons. Hazards

1518
from Cd are associated with its high bioaccumulative capacity. Adverse human, animal
and plant physiological effects of Cd are numerous (Bernhoft, 2013). At the cellular
level, the pro-oxidative Cd action results in oxidative damage to the cellular
macromolecules and cellular structures (Curcic et al., 2014; Rahman et al., 2017).
Disbalanced antioxidant system and developed oxidative stress produce injury to healthy
tissues and immune cells by free radicals, which results in compromised immune
functions in chickens (Vasiljeva, Berzina & Remeza, 2011). Cd is among the
immunosuppressive agents, it excessive and even low doses in daily food can cause
diverse physiological and immunological disturbances in human, animals and poultry
(Bokori & Fekete, 1995; El-Boshy et al., 2015).
Since Cd-induced damage in an organism is believed to be irreversible, the question
of primary prevention is of great importance. Efficient beneficial results may be achieved
by addition of nutrients with antioxidative properties to the diet (Nair et al., 2013).
Antioxidants are known to play a vital role in the health due to cell protection from
damage induced by oxidative stress (Surai, 2003; Brzóska & Rogalska, 2013).
Cultivated forms of red beet (Beta vulgaris L.) have been used for medical purposes
since ancient times. In recent years, interest in the biological activity of red beets and its
potential utility as a functional nutrition and disease prevention has been growing. Red
beetroot juice is also considered to promote therapeutic treatment in a number of clinical
pathologies associated with oxidative stress and inflammation (Clifford et al., 2015; Cho
et al., 2017).
Red beet contains betalain pigments belonging to the group of cationic antioxidants.
Betalains are divided into two groups: red betacyanins (predominantly betanin) and
yellow betaxanthins (vulgaxanthine I and vulgaxanthine II). Red betanin is primarily
responsible for the antioxidant ability of red beets (Czapski et al., 2009). Betanin is both
a free radical scavenger and an inducer of an antioxidant defense mechanism in cells. Its
effect is dose dependent (Esatbeyoglu, 2014). Attempts to concentrate the fraction of
juice betalains by gel filtration on Sephadex using juice extracts in water or ethanol were
unsuccessful (Lee et al., 2005). Despite the failure of mentioned experiment the idea of
red beetroot fractionation seems prospective. Recently, using the modern method of
membrane separation (diafiltration) (Mereddy et al., 2017), as well as ultrafiltration
(Krumina et al., 2016), allowed to obtain more concentrated pigment fractions of beet
juice. In these cases, freshly squeezed beet juice was used. Ultrafiltration is more suitable
for industrial use in comparison with chromatography. Ultrafiltration as industrial
technology has several advantages over chromatography. Ultrafiltration use is cheaper,
has higher productivity and provides possibility to prepare natural compounds product
with more accurate parameters (i.e. cut off point).
Present investigation was conducted to evaluate the protective effect of red beetroot
juice fraction (BJF) in chickens exposed to Cd.
MATERIALS AND METHODS
Ethics statement
All experimental procedures were approved by the Animal Ethics Committee of
the Food and Veterinary Service (Riga, Latvia, authorisation reference number 13,
December 22, 2008).

1519
Animals and experimental design
35-day-old male Lohmann brown chickens were obtained from SIA BALTICOVO
(Iecava, Latvia) and used for the laboratory investigations. Chickens were divided into
four groups of 7 heads each. Food and water were provided ad libitum for 10 days.
Group 1 (Control) received the fool-fed basal diet without any supplements. Group 2
(+Cd) was given the same diet with addition of Cd 50 mg kg-1 (as CdCl2, Sigma, EU).
Group 3 (+BJF) received the basal diet without any supplements and each chicken was
administered by 1 mL of BJF per os daily. Group 4 (+Cd+BJF) was fed the same diet
supplemented with Cd as group 2 and administered by 1 mL of BJF per os daily. The
chosen high experimental level of dietary Cd exposure was based on our previous
unpublished experimental data and had hazard effect for 35–45-days old chickens. It
allows investigate a risk of health damage by this heavy metal. In accord with our
previous study the best administered dose of BJF for chicken was 1 mL per one head
(Smirnova et al., 2017). Red beet (Beta vulgaris) root juice fraction (BJF) was produced
using the laboratory equipment. The red beetroots were washed, skinned, shredded, and
the juice was extracted mechanically by juice press. The juice was deproteinized using
heating at 85ºC for 10 min followed by centrifugation. The supernatant was fractionated
with ultrafiltration using ultrafilter membrane with cut-off-point 150 KDa. 100 mL of
the obtained fraction was contained: 65.80 mg of betanin, 40.10 mg of vulgaxanthine-I,
7.80 g of sucrose, 11.00 mg of ascorbic acid, 1.20 mg of lysozyme and 0.20 mg of iron.
Obtained ultrafiltrate BJF was used in the experiment.
At the end of experiment, chickens were weighed and sacrificed by decapitation in
accordance with the Recommendation for Experimental Animals of the European
Convention (Close et al., 1997). Whole blood, blood plasma, liver, kidneys of chickens
were collected and used for analyses.
Biochemical assays
Cd determination of the tissue samples was performed after dry ashing in atomic
absorption spectrophotometer Perkin-Elmer (model AAnalyst 700), according to the
procedures of the AOAC (1999). The antioxidant status was evaluated by measuring the
level of lipid peroxidation product malondialdehyde (MDA) in liver and kidney
homogenates by the thiobarbituric acid reaction (Surai et al., 1996). Activity of
glutathionperoxidase (GSH-Px) in liver homogenate was measured based on the method
described by Pinto and Bartley (Pinto & Bartley, 1969) with some modifications.
Catalase (CAT) activity in blood was estimated by the method of Aebi (Aebi, 1984). The
determination of uric acid in blood serum was performed enzymatically (Trivedi et al.,
1978). Hemoglobin (Hb) level was estimated by cyanohemoglobin method with
commercial kit (SIA ‘Divi Dent’, Latvia). Total protein concentration in blood plasma
was determined spectrophotometrically by the biuret method, using a commercial kit
(Boehringer, Germany).
Immunological analyses
Immune cell T- and B- populations were estimated as responses to T- and
B-markers: sheep erythrocytes for T-cells and zymozan (C3 complexes) for B-cells.
Serum lysozyme content was evaluated by nefelometric assay (Shugar, 1952) with some
modification, by absorptiometric determination of the decrease in turbidity of a
suspension of Micrococcus lysodeicticus. Nonspecific circulating immune complexes

1520
(CIC) in serum were estimated spectrophotometrically using precipitation with
polyethylenglycol (Riha et al., 1979).
Statistical analysis
All statistics were performed using the software Statistica 7. Results of Cd content
and biochemical parameters are presented as mean ± SE. Multiple group comparision
was done using one-way ANOVA and Post-hoc Tukey HSD test.
RESULTS AND DISCUSSION
In general, the variance analysis revealed that there was a statistically significant
difference between the treatment groups of the experiment for most of analyzed
parameters, except MDA level in chicken liver (Table 1).
Table 1. Results of multiple group comparison with one-way ANOVA, analysing Cd content and
biochemical parameters in chickens under Cd exposure and administration with red beetroot juice
fraction (BJF) (in bold – significant P values, P < 0.05, n = 28, df = 3)
Parameter F*, stated P-value F, critical
Cd, blood plasma 250.097 3.12346E-18 3.009
Cd, liver 1899.165 1.19352E-28 3.009
Cd, kidney 703.131 1.64691E-23 3.009
MDA, liver 2.174 0.11734499 3.009
MDA, kidney 51.925 1.20918E-10 3.009
GSH-px 27.599 5.95067E-08 3.009
Catalase 5.994 0.003371862 3.009
Hemoglobin 34.762 6.73753E-09 3.009
Total protein 45.681 4.49054E-10 3.009
Uric acid 29.528 3.18001E-08 3.009
T- lymphocytes 64.860 1.17286E-11 3.009
B(C3)- lymphocytes 10.276 0.000153855 3.009
Lysozyme 22.609 3.56601E-07 3.009
CIC 28.842 3.95871E-08 3.009
* Fisher’s value.
The Cd content in blood plasma, liver and kidney of chickens did not differ between
the control group and the 3rd group, which received BJF (Table 2). Additional Cd
administration provided a significant increase of this heavy metal concentration in
chickens: by 2.3 times in blood plasma, 80 times and 93 times in liver and in kidney,
respectively, compared to the control. After additional per oral intake of BJF reduced Cd
accumulation in chickens of the 4th group was found: in blood and liver by 1.3 times and
by 1.2 times, respectively. On contrary, there was a slight increase in Cd content by 1.1
times in kidney of the group 4 compared to the single Cd treatment (group 2). The
observed increase of Cd concentration in kidneys can be associated with the growing
intensity of removing of this heavy metal from organism (Zabulyte et al., 2007).
A marked increase of Cd concentration in blood plasma, liver and kidneys of
chickens is accompanied by enhance of oxidative processes in organs (Erdogan et al.,
2005; Berzina et al., 2007). MDA is one of the final products polyunsaturated fatty acids
peroxidation in cells. This is the final product of lipid peroxidation. An increase in free
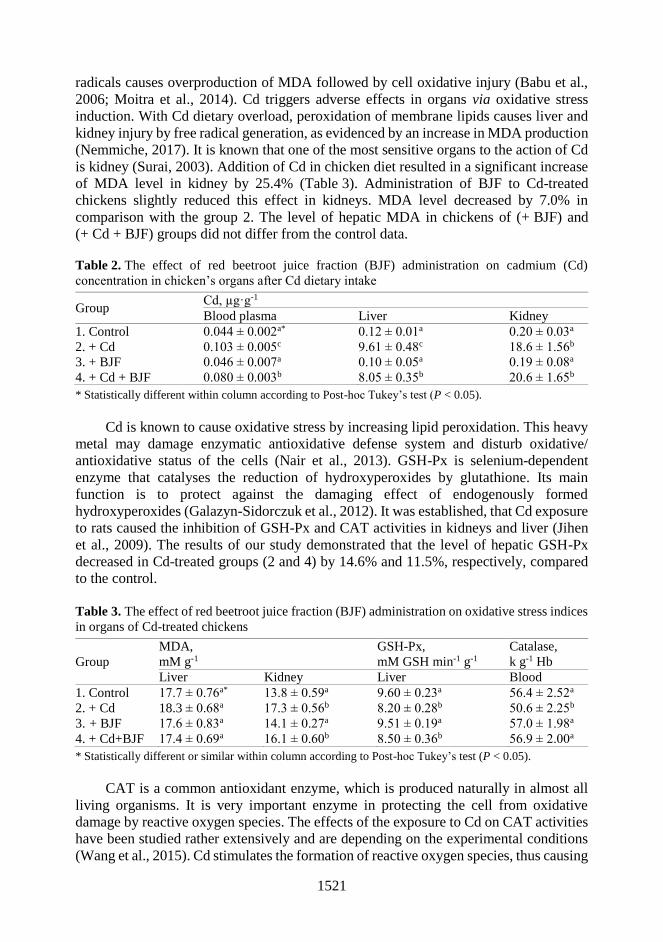
1521
radicals causes overproduction of MDA followed by cell oxidative injury (Babu et al.,
2006; Moitra et al., 2014). Cd triggers adverse effects in organs via oxidative stress
induction. With Cd dietary overload, peroxidation of membrane lipids causes liver and
kidney injury by free radical generation, as evidenced by an increase in MDA production
(Nemmiche, 2017). It is known that one of the most sensitive organs to the action of Cd
is kidney (Surai, 2003). Addition of Cd in chicken diet resulted in a significant increase
of MDA level in kidney by 25.4% (Table 3). Administration of BJF to Cd-treated
chickens slightly reduced this effect in kidneys. MDA level decreased by 7.0% in
comparison with the group 2. The level of hepatic MDA in chickens of (+ BJF) and
(+ Cd + BJF) groups did not differ from the control data.
Table 2. The effect of red beetroot juice fraction (BJF) administration on cadmium (Cd)
concentration in chicken’s organs after Cd dietary intake
Group Cd, µg·g-1
Blood plasma Liver Kidney
1. Control 0.044 ± 0.002a* 0.12 ± 0.01a 0.20 ± 0.03a
2. + Cd 0.103 ± 0.005c 9.61 ± 0.48c 18.6 ± 1.56b
3. + BJF 0.046 ± 0.007a 0.10 ± 0.05a 0.19 ± 0.08a
4. + Cd + BJF 0.080 ± 0.003b 8.05 ± 0.35b 20.6 ± 1.65b
* Statistically different within column according to Post-hoc Tukey’s test (P < 0.05).
Cd is known to cause oxidative stress by increasing lipid peroxidation. This heavy
metal may damage enzymatic antioxidative defense system and disturb oxidative/
antioxidative status of the cells (Nair et al., 2013). GSH-Px is selenium-dependent
enzyme that catalyses the reduction of hydroxyperoxides by glutathione. Its main
function is to protect against the damaging effect of endogenously formed
hydroxyperoxides (Galazyn-Sidorczuk et al., 2012). It was established, that Cd exposure
to rats caused the inhibition of GSH-Px and CAT activities in kidneys and liver (Jihen
et al., 2009). The results of our study demonstrated that the level of hepatic GSH-Px
decreased in Cd-treated groups (2 and 4) by 14.6% and 11.5%, respectively, compared
to the control.
Table 3. The effect of red beetroot juice fraction (BJF) administration on oxidative stress indices
in organs of Cd-treated chickens
Group
MDA,
mM g-1
GSH-Px,
mM GSH min-1 g-1
Catalase,
k g-1 Hb
Liver Kidney Liver Blood
1. Control 17.7 ± 0.76a* 13.8 ± 0.59a 9.60 ± 0.23a 56.4 ± 2.52a
2. + Cd 18.3 ± 0.68a 17.3 ± 0.56b 8.20 ± 0.28b 50.6 ± 2.25b
3. + BJF 17.6 ± 0.83a 14.1 ± 0.27a 9.51 ± 0.19a 57.0 ± 1.98a
4. + Cd+BJF 17.4 ± 0.69a 16.1 ± 0.60b 8.50 ± 0.36b 56.9 ± 2.00a
* Statistically different or similar within column according to Post-hoc Tukey’s test (P < 0.05).
CAT is a common antioxidant enzyme, which is produced naturally in almost all
living organisms. It is very important enzyme in protecting the cell from oxidative
damage by reactive oxygen species. The effects of the exposure to Cd on CAT activities
have been studied rather extensively and are depending on the experimental conditions
(Wang et al., 2015). Cd stimulates the formation of reactive oxygen species, thus causing
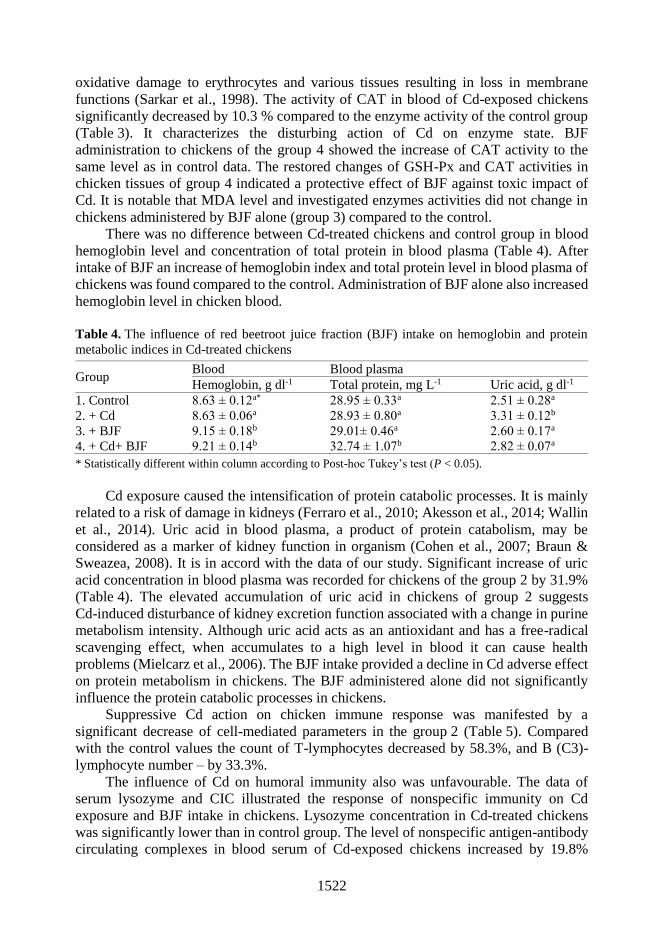
1522
oxidative damage to erythrocytes and various tissues resulting in loss in membrane
functions (Sarkar et al., 1998). The activity of CAT in blood of Cd-exposed chickens
significantly decreased by 10.3 % compared to the enzyme activity of the control group
(Table 3). It characterizes the disturbing action of Cd on enzyme state. BJF
administration to chickens of the group 4 showed the increase of CAT activity to the
same level as in control data. The restored changes of GSH-Px and CAT activities in
chicken tissues of group 4 indicated a protective effect of BJF against toxic impact of
Cd. It is notable that MDA level and investigated enzymes activities did not change in
chickens administered by BJF alone (group 3) compared to the control.
There was no difference between Cd-treated chickens and control group in blood
hemoglobin level and concentration of total protein in blood plasma (Table 4). After
intake of BJF an increase of hemoglobin index and total protein level in blood plasma of
chickens was found compared to the control. Administration of BJF alone also increased
hemoglobin level in chicken blood.
Table 4. The influence of red beetroot juice fraction (BJF) intake on hemoglobin and protein
metabolic indices in Cd-treated chickens
Group Blood Blood plasma
Hemoglobin, g dl-1 Total protein, mg L-1 Uric acid, g dl-1
1. Control 8.63 ± 0.12a* 28.95 ± 0.33a 2.51 ± 0.28a
2. + Cd 8.63 ± 0.06a 28.93 ± 0.80a 3.31 ± 0.12b
3. + BJF 9.15 ± 0.18b 29.01± 0.46a 2.60 ± 0.17a
4. + Cd+ BJF 9.21 ± 0.14b 32.74 ± 1.07b 2.82 ± 0.07a
* Statistically different within column according to Post-hoc Tukey’s test (P < 0.05).
Cd exposure caused the intensification of protein catabolic processes. It is mainly
related to a risk of damage in kidneys (Ferraro et al., 2010; Akesson et al., 2014; Wallin
et al., 2014). Uric acid in blood plasma, a product of protein catabolism, may be
considered as a marker of kidney function in organism (Cohen et al., 2007; Braun &
Sweazea, 2008). It is in accord with the data of our study. Significant increase of uric
acid concentration in blood plasma was recorded for chickens of the group 2 by 31.9%
(Table 4). The elevated accumulation of uric acid in chickens of group 2 suggests
Cd-induced disturbance of kidney excretion function associated with a change in purine
metabolism intensity. Although uric acid acts as an antioxidant and has a free-radical
scavenging effect, when accumulates to a high level in blood it can cause health
problems (Mielcarz et al., 2006). The BJF intake provided a decline in Cd adverse effect
on protein metabolism in chickens. The BJF administered alone did not significantly
influence the protein catabolic processes in chickens.
Suppressive Cd action on chicken immune response was manifested by a
significant decrease of cell-mediated parameters in the group 2 (Table 5). Compared
with the control values the count of T-lymphocytes decreased by 58.3%, and B (C3)-
lymphocyte number – by 33.3%.
The influence of Cd on humoral immunity also was unfavourable. The data of
serum lysozyme and CIC illustrated the response of nonspecific immunity on Cd
exposure and BJF intake in chickens. Lysozyme concentration in Cd-treated chickens
was significantly lower than in control group. The level of nonspecific antigen-antibody
circulating complexes in blood serum of Cd-exposed chickens increased by 19.8%

1523
compared to the control. The results of immunological studies showed that intake of BJF
eliminated a Cd immunosuppressive impact in chickens, but it was not notably effective
when administered alone.
Table 5. Cd-induced immunological changes and the effect of red beetroot juice fraction (BJF)
administration in chickens
Group
Blood Blood serum
T-lymphocytes,
%
B(C3)-lymphocytes,
%
Lysozyme,
µg mL-1
Circulating immune
complexes (CIC),
extinction x 100
1. Control 36.0 ± 3.0a* 15.0 ± 1.8a 8.0 ± 1.23a 3.1 ± 0.11a
2. + Cd 15.0 ± 4.0b 10.0 ± 2.1b 4.7 ± 0.88b 3.7 ± 0.14c
3. + BJF 34.0 ± 2.0a 16.0 ± 3.0a 7.8 ± 1.08a 3.2 ± 0.15ab
4. + Cd+ BJF 31.0 ± 3.2a 12.0 ± 2.0b 5.0 ± 0.76b 3.3 ± 0.12b
* Statistically different within column according to Post-hoc Tukey’s test (P < 0.05).
The results of biochemical and immunological studies are in accordance with
chicken growth parameters. Chickens exposed to Cd showed no evidence of clinical
toxicity. After 10 days of Cd treatment, chickens body weight did not differ from the
control data. Chicken body weight of the control and Cd-treated groups was 475.4
± 24.5 g and 474.4 ± 60.2 g, correspondingly. BJF administration had a positive
influence on the chicken body weight both of the 3rd (485.3 ± 51.2 g) and the 4th
Cd-exposed (484.1 ± 39.9 g) groups.
The observed suppressive action of Cd supplementation in chicken diet during 10
days was expressed by an increase of Cd accumulation in kidneys, liver and blood
plasma; development of oxidative stress in organs; disturbance of protein metabolic
processes; decrease of cell-mediated and humoral immune response.
Administration of 1 mL BJF per os daily alone had no significant effect on the
investigated parameters, but prevented the Cd-induced damage in chickens.
Experimental betalain rich fraction from red beetroot juice was obtained using
ultrafiltration. Antioxidative capacities of BJF provide pigments of betalain group,
including betanin. Betanin is both a free radical scavenger and an inducer of antioxidant
defense mechanism in cells (Esatbeyoglu et al., 2014). The similar protective effect of
plant extract (Fragaria ananassa) against Cd adverse impact also was observed in rats,
because of its polyphenolic composition, described by Elkhadragy et al. (2018).
CONCLUSION
Administration of red beetroot (Beta vulgaris) juice fraction to Cd-treated chickens
during 10 days protected against Cd-induced oxidative damage and provided
immunomodulating effect.
REFERENCES
Aebi, H. Catalase in vitro. 1984. Methods Enzymology 105, 121–126.
AOAC. 9.1.09 Official Method. 1999. https://www.scribd.com/document/357719355/9-1-09-
AOAC-Official-Method-999-11-Determination-of-Lead-Cadmium-pdf.

1524
Akesson, A., Barregard, L., Bergdahl, I.A., Nordberg, G.F., Nordberg, M. & Skerfving, S. 2014.
Non-renal effects and the risk assessment of environmental cadmium exposure.
Environmental Health Perspectives 122, 431–438.
Babu, K.R., Rajmohan, H.R. Rajan, B.K. & Kumar, K.M. 2006. Plasma lipid peroxidation and
erythrocyte antioxidant enzymes status in workers exposed to cadmium. Toxicology &
Industrial Health 22, 329–335.
Bernhoft, R.A. 2013. Cadmium toxicity and treatment. Scientific World Journal. Article ID
394652, 7pp. http://dx.doi.org/10.1155/2013/394652.
Berzina, N., Markovs, J., Isajevs, S., Apsite, M. & Smirnova, G. 2007. Cadmium-induced
enteropathy: biochemical and histological study. Basic & Clinical & Pharmacology &
Toxicology 101(1), 29–34.
Bokori, J. & Fekete, S. 1995. Complex study of the physiological role of cadmium. 1. Cadmium
and its physiological role. Acta Veterinaria Hungarica 43(1), 3–43.
Braun, E.J. & Sweazea, K.L. 2008. Glucose regulation in birds. Comparative Biochemistry and
Physiology - Part B: Biochemistry & Molecular Biology 151, 1–9.
Brzóska, M., Borowska, S. & Tomczyk, M. 2016. Antioxidants as a potential preventive and
therapeutic strategy for cadmium. Current Drug Targets 17, 1350–1384.
Brzóska, M. & Rogalska, J. 2013. Protective effect of zinc supplementation against cadmium-
induced oxidative stress and the RANK/RANKL/OPG system imbalance in the bone tissue
of rats. Toxicology and Applied Pharmacology 272, 208–220.
Cho, J., Bing, S.J., Kim, A., Lee, N.H., Byen, S.H., Kim, G.O. & Jee, Y. 2017. Beetroot (Beta
vulgaris) rescues mice from gamma-ray irradiation by accelerating hematopoiesis and
curtailing immunosuppression. Pharmaceutical Biology 55, 306–316.
Clifford, T., Howatson, G., West, D.J. & Stevenson, E.J. 2015. The potential benefits of red
beetroot supplementation in health and disease. Nutrients 7(4), 2801–2822.
Close, B., Banister, K., Baumans, V., Bernoth, E.M., Bromage, N., Bunyan, J., Gregory, N.,
Hackbarth, H., Morton, D. & Warwick, C. 1997. Recommendation for euthanasia of
experimental animals. Part 2. DGXT of the European Commission. Laboratory Animals 31,
1–32.
Cohen, A., Klasing, K. & Ricklefs, R. 2007. Measuring circulating antioxidants in wild birds.
Comparative Biochemistry and Physiology - Part B: Biochemistry & Molecular Biology
147, 110–121.
Curcic, M., Durgo, K., Kopjar, N., Ancic, M., Vucinic, S. & Antonijevic, B. 2014. Cadmium and
decabrominated diphenyl ether mixture: In vitro evaluation of cytotoxic, prooxidative and
genotoxic effects. Environmental Toxicology and Pharmacology 38(2), 663–671.
Czapski, J., Mikołajczyk, K. & Kaczmarek, M. 2009. Relationship between antioxidant capacity
of red beet juice and contents of its betalain pigments. Polish Journal of Food and Nutrition
Sciences 59(2), 119–122.
El-Boshy, M.E., Risha, E.F., Abdelhamid, F.M., Mubarak, M.S. & Hadda, T.B. 2015. Protective
effects of selenium against cadmium induced hematological disturbances,
immunosuppressive, oxidative stress and hepatorenal damage in rats. Journal of Trace
Elements in Medicine and Biology 29, 104–110.
Elkhadragy, M., Al-Olayan, E., Al-Amiery, A. & Moneim, A. 2018. Protective effects of
Fragaria ananassa extract against cadmium chloride-Induced acute renal toxicity in rats.
Biological Trace Element Research 181(2), 378–387.
Erdogan, Z., Erdogan, S., Celik, S. & Unlu, A. 2005. Effects of ascorbic acid on cadmium –
induced oxidative stress and performance of broilers. Biological Trace Element Research
104(1), 19–32.

1525
Esatbeyoglu, T., Wagner, A.E., Motafakkerazad, R., Nakajima, Y., Matsugo, S. & Rimbach, G.
2014. Free radical scavenging and antioxidant activity of betanin: electron spin resonance
spectroscopy studies and studies in cultured cells. Food and Chemical Toxicology 73,
119–126.
Ferraro, P.M., Costanzi, S., Naticchia, A., Sturniolo, A. & Gambaro, G. 2010. Low level
exposure to cadmium increases the risk of chronic kidney disease: analyses of the NHANES
1999-2006. BMC Public Health 10, pp. 304.
Galazyn-Sidorczuk, M., Brzóska, M., Rogalska, J., Roszczenko, A. & Jurczuk, M. 2012. Effect
of zinc supplementation on glutathione peroxidase activity and selenium concentration in
the serum, liver and kidney of rats chronically exposed to cadmium. Journal of Trace
Elements in Medicine and Biology 26, 46–52.
Jihen, E., Imed, M., Fatima, H. & Abdelhamid, K. 2009. Protective effects of selenium (Se) and
zinc (Zn) on cadmium (Cd) toxicity in the liver of the rat: Effects on the oxidative stress.
Ecotoxicology and Environmental Safety 72(5), 1559–1564.
Kah, M., Levy, L. & Brown, C. 2012. Potential for effects of land contamination on human. 1.
The case of cadmium. Journal of Toxicology and Environmental Health Part B 15,
348–363.
Krumina, G., Babarykin, D., Smirnova, G., Vasiljeva, S., Basova, N., Krumina, Z.,
Babarykina, A. & Markov, J. 2016. Red beet (beta vulgaris) root juice membrane
ultrafiltration use to modify product’s functionality. In Jakobsone, I. (ed): 2nd International
Conference Nutrition and Health, Conference Program and Book of Abstracts, Rīga,
University of Latvia Press, pp. 66.
Lee, C.H, Wettasinghe, M, Bolling, B.W, Ji, L.L. & Parkin, K.L. 2005. Betalains, phase II
enzyme-inducing components from red beetroot (Beta vulgaris L.) extracts. Nutrition and
Cancer 53(1), 91–103.
Mereddy, R., Chan, A., Fanning, K., Nirmal, N. & Sultanbawa, Y. 2017. Betalain rich functional
extract with reduced salts and nitrate content from red beetroot (Beta vulgaris L.) using
membrane separation technology. Food Chemistry 215, 311–317.
Mielcardz, G., Linke, K., Barinow-Wojewodzki, A. & Morawska-Staszak, K. 2006. Effect of
creatine supplementation on selenium, copper and zinc status in patients with chronic liver
disease. In Anke, M., Flachovsky, G., Kisters, K., Shafer, U., Schekel, H., Seifert, M. &
Stoeppler, M. (eds): Macro and Trace elements, 23. Workshop, September 27. Friedrich
Schiller University Jena, pp. 632–634.
Moitra, S., Brashier, B. & Sahu, S. 2014. Occupational cadmium exposure associated oxidative
stress and erythrocyte fragility among jewelry workers in India. American Journal of
Industrial Medicine 57, 1064–1072.
Moulis, J-M. & Thévenod, F. 2010. New perspectives in cadmium toxicity: and introduction.
BioMetals 23(5), 763–768.
Nair, A.R., De Gheselle, O., Smeets, K., Van Kerkhove, E. & Cuypers, A. 2013. Cadmium-
induced pathologies: where is the oxidative balance lost (or not)? The International Journal
of Molecular Sciences 14, 6116–6143.
Nemmiche, S. 2017. Oxidative signaling response to cadmium exposure. Toxicological Sciences
156(1), 4–10.
Pinto, R.E. & Bartley, W. 1969. The effect of age and sex on glutathione reductase and
glutathione peroxidase activities and on aerobic glutathione oxidation in rat liver
homogenates. Biochemical Journal 112(1), 109–115.
Rahman, M., Ukiana, J., Uson-Lopez, R., Sikder, M.T., Saito, T. & Kurasaki, M. 2017.
Cytotoxic effects of cadmium and zinc co-exposure in PC12 cells and the underlying
mechanism. Chemico-Biological Interactions 269, 41–49.
Riha, I., Haskova, V., Kaslik, J., Maierova, M. & Stransky, J. 1979. The use of polyethylene
glycol for immune complex detection in human sera. Molecular Immunology 16, 489–493.

1526
Sarkar, S., Yadav, P. & Bhatnagar, D. 1998. Lipid peroxidation damage on cadmium exposure
and alterations in antioxidant system in rat erythrocytes: a study with relation to time.
BioMetals 11(2), 153-157.
Shugar, D. 1952. The measurement of lysozyme activity and the ultra-violet inactivation of
lysozyme. Biochimica et Biophysica Acta 8(3), 302–309.
Smirnova, G.Ju., Vasiljeva, S.V., Basova, N.A., Babarykin, D.A. & Krumina, G.G. 2017. Effect
of betain – rich fraction of beet root juice under high dietary level of cadmium. Russian
Journal of Gastroenterology, Hepatology, Coloproctology 27(5), Suppl. 50, pp. 89
(in Russian).
Surai, P., Noble, R. & Speake, B. 1996. Tissue-specific differences in antioxidant distribution
and susceptibility to lipid peroxidation during development of the chick embryo.
Biochimica et Biophysica Acta 1304, 1–10.
Surai, P. 2003. Natural antioxidants in avian nutrition and reproduction. Nottingham University
Press, Nottingham, England. 651 pp.
Trivedi, R.C., Rebar, L., Berta, E. & Stong, L. 1978. New enzymatic method for serum uric acid
at 500 nm. Clinical Chemistry 24(11), 1908–1911.
Vasiljeva, S., Berzina, N. & Remeza, I. 2011. Dietary modulation of immune responses by
ascorbic acid in healthy and cadmium-induced immunocompromised chickens.
Proceedings of the Latvian Academy of Sciences 65(3/4), 110–116.
Wallin, M., Sallsten, G., Lundh, T. & Barregard, L. 2014. Low-level cadmium exposure and
effects on kidney function. Occupational and Environmental Medicine 71, 848–854.
Wang, J., Zhang, H. & Zhang, T. 2015. Molecular mechanism on cadmium-induced activity
changes of catalase and superoxide dismutase. International Journal of Biological
Macromolecules 77, 59–67.
Zabulyte, D., Paltanaviciene, A., Uleckiene, S., Kalibatas, J., Juozulynas, A., Jascaninienė, N.,
Sąlyga, J. & Stosik, M. 2007. Cadmium accumulation in the kidneys and its excretion with
urine, and possible influence of PAH's on these processes in rats. Bulletin of the Veterinary
Institute in Pulawy 51(2), 257–260.

1527
Agronomy Research 16(S2), 1527–1533, 2018
https://doi.org/10.15159/AR.18.090
Meat chemical composition of pasture pure lambs and
crossbreeds
J. Vecvagars, D. Bārzdiņa and D. Kairiša*
Latvia University of Life Sciences and Technologies, Faculty of Agriculture,
Institute of Agrobiotechnology, Liela street 2, LV – 3001 Jelgava, Latvia *Correspondence: [email protected]
Abstract. Increased customer interest of safe, healthy and environmentally friendly food
consumption promote development of sheep farming industry in Latvia. Aim of the paper –
explain of different pasture-fattened sheep breed and their crosses lamb meat composition traits.
A study of pasture fattened lamb meat chemical composition was carried out from year 2013 to
2017. Fattening lambs were kept in breeding rams control station ‘Klimpas’ (57°50’58.8’’N
25°19’39.6’’E) pasture array. Lambs were slaughtered in a certified slaughterhouse, but analysis
of meat chemical composition were conducted in laboratory of Institute of Food Safety, Animal
Health and Environment (BIOR). For the analysis of the meat chemical composition were used
up to 1 kg heavy Quadriceps femoris muscle samples. In meat were analysed following elements
of its chemical composition: dry matter, protein, fat, minerals, pH, cholesterol and unsaturated
fatty acids. Data analysis shows that the lambs before slaughter ranged in age from 5 to 8 months.
Lamb meat obtained from the study groups had a significantly different total amount of dry matter
and fat. The lowest total fat, but the highest ash content was obtained in the lamb meat of the
extensive breed group. The lowest total fat and the highest ash content were obtained in the lamb
meat from the extensive breed group. In meat obtained a small (in individual samples < 0.10%)
cis-10-pentadecenoic acid, cis-11-eicosenoic acid and myristoleic acid content. Of unsaturated
fatty acids in lamb meat were represented higher amount of oleic acid, linoleic acid and elaidic
acid.
Key words: breeds, lamb, pasture, meat, composition.
INTRODUCTION
Rapidly growing consumers interest of safe and healthy food in their diet are
encouraging development of sheep husbandry. In particular, this refers to the products
of animal origin derived in environmentally friendly farming conditions.
Feeding ruminants with grass-based feed provides cheap and high quality
production.
In suckling period lamb diet main nutrients provides milk, after weaning different
feedstuffs, for example, meadow hay and concentrates (Scerra, et al., 2007).
Research studies in different animal species meat composition were repeated by
Strazdiņa (2014); less studied was the chemical composition of small ruminants.

1528
Latvia Darkhead and crossbreed lamb fattening results in 2005 showed that 10
month old lambs meat contain 25.7% dry matter and in dry matter were 18% protein,
6.6% fat and 1.3% ash (Kairiša, 2005).
Studies of sheep meat chemical composition and its influencing factors are
important for farmers and consumers.
It is common practice to make crossbreed lambs by using local breed sheep and
different meat type breeds to improve their adaptation to different environmental
conditions.
The main focus of scientists in context of meat composition and quality is
concerning their age and sex, various feedstuffs and the influence of lamb fattening
technologies on their meet quality (Tejeda et al., 2008; Abdullah et al., 2009; Jandasek,
2013).
The aim of study – explain meat chemical composition of pasture fattened pure
breed and crossbreed lambs.
MATERIALS AND METHODS
Study was carried out from 2014 to 2017 in Jeri parish, Rujiena region, Latvia.
Lambs were kept in pasture all day in one group with unlimited access to hay, mineral
licks and water.
Hay contained 869.5 g kg-1 of consumed dry matter with 96.6 g kg-1 crude protein
and 9.72 MJ kg-1 metabolizable energy.
Quality of pasture grass varied depending of month. Dry matter in 1 kg grass were
in range from 177 g on May to 205.8 g on September, protein in 1 kg dry matter were
from 134.9 g on September to 162.5 g on May. Good quality high yielding grass fodder
contained, high quality botanical composition and good chemical composition. Grass
productivity depends on various factors suchas climate, soil, botanical composition,
country and grazing patterns (Priolo et al., 2002; Beyene & Mlambo, 2011; El-Shesheny
et al., 2014).
Lamb meat samples used in of Latvia Darkhead, four meat type breeds and most
popular crossbreeds among Latvia sheep breeders (Table 1).
Table 1. Study materials
Trial group Breed (abbreviation) Number of meat samples
Local sheep breed Latvia Darkhead (LT) 5
Meat type sheep breeds Charollais (SA) 4
Ile de France (IF) 3
German Merino Local (VMV) 4
Oxforddown (OX) 5
Latvia Darkhead × meat
type sheep crossbreeds
LT × T (Texel) 4
LT × S (Suffolk) 6
LT × VMV 5
LT × Dorper (DOR) 3
Lambs were slaughtered in certified slaughterhouse when reached 40 kg body
weight. Analysis of meat chemical composition tested in science centre BIOR
laboratory. Quadriceps femoris muscles samples were used for chemical content

1529
analysis. In meat established various nutrients: moisture (%), protein (%), crude fat (%),
ash (%), pH, cholesterol (mg g-1) and several unsaturated fatty acids (Table 2).
Table 2. The used methods in meat chemical analysis
Meat chemical composition, % Methods
Moisture LVS ISO 1442:1997
Protein LVS ISO 937:1998
Crude fat LVS ISO 1443:1973
Ash ISO 936:1998
Cholesterol BIOR-T-012-132-2011*
Unsaturated fatty acids, %
Alpha-linolenic acid [C18:3 n3] BIOR-T-012-131-2011** (fatty acid composition in
fats) Arachidonic acid [C20:4 n6]
Linolenic acid [C18:2 n6c]
Oleic acid [C18:1 n9c]
Palmitoleic acid [C16:1 n9c]
* Method of gas chromatography; analysed choresterol composition in sample; ** Accredited method of
gas chromatography; analysed fatty acid composition in fats.
Data of study was analysed by using mathematical methods. Data obtained from
analysis in laboratory were converted to g kg-1. We calculated trait values – mean,
standard error and coefficient of variation. Significantly difference between mean values
determined by t-test and signed with lowercase Latin letters a, b, c (P ≤ 0.05), also
calculated correlation of results.
RESULTS AND DISCUSSION
Average age of lambs before slaughtering was 191 days or little more than 6
months. In meat samples in average 730.2 g kg-1 were water, 195.6 g kg-1 protein,
67.3 g kg-1 crude fat and 10.5 g kg-1 ash (Table 3). The chemical composition of Polish
Lowlands breed lamb meat samples (taken from Musculus adductor) was similar that
the present study, it contained 25.55% dry matter, 19.28% protein, 4.15% fat and 1.05%
ash (Niedziółka & Pieniak-Lendzion, 2006). Similar nutrient composition in different
region lamb meat was shows a similarity of lamb fattening technologies.
Table 3. Meat chemical composition (g kg-1) and pH value in different sheep breed feeding
with pasture grass
Trait LT SA IF OX VMV
mean ± standard error
Age, days 211 ± 12.0 175 ± 17.5 186 ± 14.5 199 ± 12.1 192 ± 4.5
Water, g kg-1 721.4 ± 7.5 753.5 ± 7.1 740.3 ± 9.3 709.2 ± 23.9 728.3 ± 20.8
Dry matter, g kg-1 278.4 ± 7.8 246.5 ± 7.1 259.7 ± 9.3 292.0 ± 24.3 274.3 ± 20
Protein, g kg-1 194.0 ± 3 200.5 ± 2.5 206.0 ± 1.2 195.0 ± 6.6 193.3 ± 3.4
Crude fat, g kg-1 75.6 ± 9.1a 38.3 ± 9.7b 45.7 ± 11.7a 87.4 ± 30.8a 73.3 ± 23.6a
Ash, g kg-1 10.4 ± 0 11.3 ± 0.2 11.1 ± 0.2 10.1 ± 0.4 10.3 ± 0.3
pH, at 20°C 5.70 ± 0.1 5.67 ± 0. 5.77 ± 0.1 5.75 ± 0.1 5.72 ± 0.1
Cholesterol, mg 100 g-1 88.0 ± 10.4a 63.7 ± 5.4b 61.4 ± 3.8b 77.0 ± 12.5ab 88.8 ± 15.5ab a, b – different letter represent significantly different between meat traits results (P ≤ 0.05); LT – Latvia
Darkhead; SA – Charollais; IF – Il de France; OX – Oxforddown; VMV – German Merino Local.

1530
Age of lambs before slaughtering was in range from 175 days or 5.5 months for
Charollais lambs up to 211 days (7 months) for Latvia Darkhead lambs. In end of
fattening were recorded large age difference of SA lambs. Age difference of age between
SA and LT group lambs was 36 days which did not different significantly.
The maximal protein (206.0 g kg-1 IF, 200.5 g kg-1 SA) and minimal crude fat
(45.7 g kg-1 IF and 38.3 g kg-1 SA) content in meat were obtained from France origin
sheep breeds (Table 4).
Table 4. Chemical content and pH value of crossbreed lamb meat samples
Traits LT × T LT × S LT × DOR LT × VMV
mean ± standard error
Age, days 192 ± 9.8 196 ± 5.7 170 ± 10.7 201 ± 9.1
Water, g kg-1 736.0 ± 16 738.5 ± 14.9 703.3 ± 30.6 730.80 ± 12.5
Dry matter, g kg-1 276.0 ± 12.3 262.5 ± 14.6 296.7 ± 30.5 272.9 ± 12.5
Protein, g kg-1 188.0 ± 2.7 192.8 ± 3.1 190.0 ± 7.8 199.6 ± 5.5
Crude fat, g kg-1 78.5 ± 10.1 60.2 ± 16.4 97.7 ± 38.2 65.2 ± 16.7
Ash, g kg-1 10.0 ± 0.2 10.2 ± 0.3 10.7 ± 0.4 10.5 ± 0.3
pH, at 20°C 5.82 ± 0 5.76 ± 0 5.69 ± 0 5.94 ± 1.6
Cholesterol, mg 100 g-1 66.0 ± 5.6a 75.8 ± 8.2ac 53.2 ± 4.3b 89.5 ± 7c a, b, c – Different letter represent significantly differences between meat traits results (P ≤ 0.05).
Less protein was from LT and VMV lamb meat samples 193.3–194 g. SA and IF
lamb meat contained 63.7 mg g-1 and 61.4 mg g-1. In a study where used the father breeds
as Oxforddown, Texel, Charollais or Suffolk, but as a mother breed German Merino
Local in meat had significantly different pH values, protein amount and meat juiciness
post mortem 24 hours and 48 hours (P < 0.05). Charollais × German Merino Local
crossbreed lamb meat had the best quality, meat contained more protein, intramuscular
fats, less juice loss and better juiciness and texture (Jandasek et al., 2013).
The amount of cholesterol in different animal meat compared with other food
products was low, because it correlated to amount of muscle fibre and its composition.
In comparison hen eggs may containe 380 mg g-1 and beef, pork and lamb meat
60–70 mg 100 g-1 cholesterol (Chizzolini et al., 1999). The youngest lamb in the present
study were LT × DOR crossbreed, lamb meat had increased fat and decreased cholesterol
(53.2 g mg-1) amount, meat had pH 5.59 as an average.
The pH value of lamb meat varied from 5.5 to 5.9 in an average, 3–4 month of age.
Chilled meat from heaviest lambs (19–24 kg body weight) had bigger pH value
compared to smaller lambs (P < 0.01). Heaviest carcass meat has a stronger taste and
aroma (Teixeira et al., 2005).
Most meat food have similar ratio of saturated to unsaturated fatty acid amount, but
ruminant meat contained less polyunsaturated fatty acids. Stearic acid (30% of saturated
acid amount) have neutral effect to plasma cholesterol synthesis (Bonanome & Grundy,
1988).
The studied meat samples contained 495 g kg-1 to 580 g kg-1 of unsaturated fatty
acids (Table 5).

1531
Table 5. Unsaturated fatty acid amount in purebreds lamb meat samples, g
Unsaturated
fatty acid
LT SA IF OX VMV
mean ± standard error
C18:1 n9c 369.5 ± 11.3 347.0 ± 13.2 397.3 ± 26.1 386.8 ± 14.5 360.0 ± 24.5
C18:2 n6c 33.5 ± 3.5a 57.0 ± 10ab 49.7 ± 3b 36.6 ± 4.9ab 36.5 ± 4.5ab
C18:3 n3 11.9 ± 1.9a 24.8 ± 4.2b 21.0 ± 6.7ab 17.0 ± 2.4ab 15.8 ± 1.2ab
C16:1 n9c 17.7 ± 2.6 13.0 ± 1.2 14.7 ± 2.7 17.4 ± 0.9 15.3 ± 3.4
C20:4 n6 2.9 ± 0.1 8.0 ± 3.8 5.7 ± 1.5 5.0 ± 1.6 5.0 ± 2.1 a, b – Different letter represent significantly differences between unsaturated fatty acid traits results
(P ≤ 0.05).
From unsaturated fatty acids profile biggest part of lamb fat took oleic acid [C18:1
n9c] (from 347 g kg-1 SA lambs to 397.3 g kg-1 IF lambs). Similar results were obtained
in Ricardo et al. (2015) and Santos-Silva et al. (2002) studies. In lamb fat linolenic acid
[C18:2 n6c] took largest part of omega 6 fatty acids, for example, in SA lamb fat linoleic
acid was 57.0 g kg-1, but in LT lamb fats less 33.5 g kg-1.
LT 11.9 g kg-1 and SA 24.8 g kg-1 breed lamb fat contained significantly different
amount of alpha-linolenic acid [C18:3 n3] (P < 0.05).
Fatty acid profile between purebreds and crossbreed lamb fat was similar (Table 6).
Table 6. Fatty acids composition (percentage of total fatty acids) of intramuscular fat
(m. Longissimus dorsi) from lambs fed with grass
Fatty acids LT × T LT × S LT × DOR LT × VMV
mean ± standard error
C18:1 n9c 405.0 ± 4.6a 369.8 ± 15b 377.0 ± 8b 356.8 ± 16.6b
C18:2 n6c 36.3 ± 3.5 40.3 ± 2.9 41.3 ± 3 33.0 ± 2.5
C18:3 n3 16.3 ± 5 17.8 ± 2.5 25.0 ± 3 16.7 ± 2.7
C16:1 n9c 21.3 ± 3.6 16.3 ± 1.4 15.0 ± 0 16.6 ± 2.5
C20:4 n6 2.7 ± 0.9 4.4 ± 0.9 4.0 ± 1.5 5.0 ± 2 a, b – Different letter represent significantly differences between unsaturated fatty acid results (P ≤ 0.05).
The amount of unsaturated acids do not significantly different between breeds, only
LT × T crossbreed lamb meat contained more oleic acid 405 g kg-1.
Correlation coefficients among meat chemical composition (Table 7) show that
meat moisture was related to protein (r = -0.61), crude fat (r = -0.96) and ash (r = 0.62).
Positive correlation was found between protein, protein to ash (r = 0.71), but
negative correlation between protein and crude fat (r = 0.72).
Correlations between cholesterol and unsaturated fatty acids were negative and
moderate by related, for example cholesterol to alpha-linoleic acid (r = -0.45),
cholesterol to linoleic acid (r = -0.48) and positive related choresterol content were to
palmitolenic acid (r = 0.39).
Correlations of unsaturated fatty acids are moderate-close related (Table 8). Ratio
alpha-linolenic acid to arachidonic acid had moderately positive correlation (r = 0.47),
correlation to linoleic acid (r = 0.77), but alpha-linolenic to palmitoleinic acid had
negative correlation (r = -0.48).
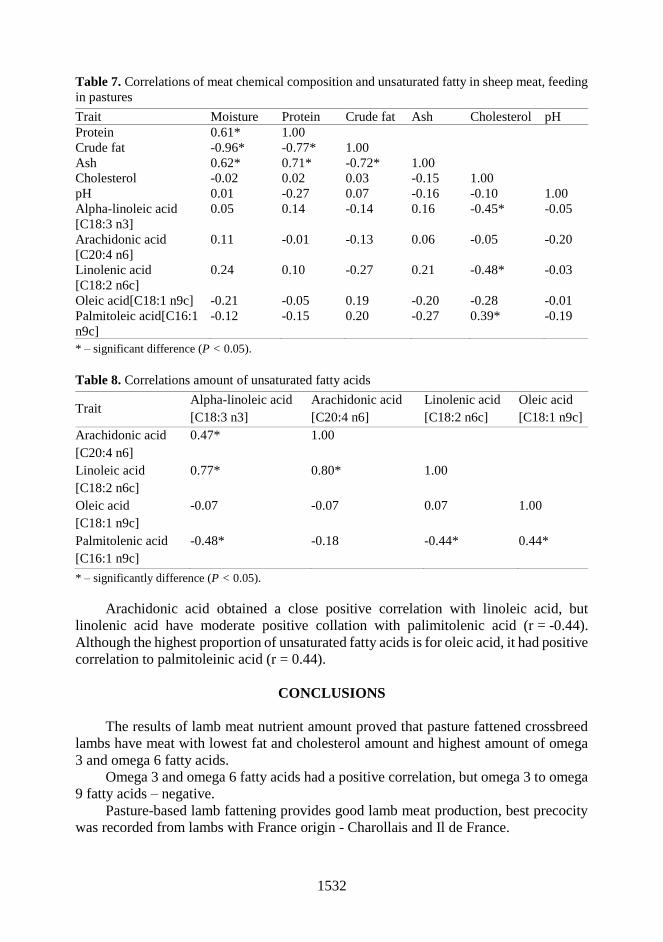
1532
Table 7. Correlations of meat chemical composition and unsaturated fatty in sheep meat, feeding
in pastures
Trait Moisture Protein Crude fat Ash Cholesterol pH
Protein 0.61* 1.00
Crude fat -0.96* -0.77* 1.00
Ash 0.62* 0.71* -0.72* 1.00
Cholesterol -0.02 0.02 0.03 -0.15 1.00
pH 0.01 -0.27 0.07 -0.16 -0.10 1.00
Alpha-linoleic acid
[C18:3 n3]
0.05 0.14 -0.14 0.16 -0.45* -0.05
Arachidonic acid
[C20:4 n6]
0.11 -0.01 -0.13 0.06 -0.05 -0.20
Linolenic acid
[C18:2 n6c]
0.24 0.10 -0.27 0.21 -0.48* -0.03
Oleic acid[C18:1 n9c] -0.21 -0.05 0.19 -0.20 -0.28 -0.01
Palmitoleic acid[C16:1
n9c]
-0.12 -0.15 0.20 -0.27 0.39* -0.19
* – significant difference (P < 0.05).
Table 8. Correlations amount of unsaturated fatty acids
Trait Alpha-linoleic acid
[C18:3 n3]
Arachidonic acid
[C20:4 n6]
Linolenic acid
[C18:2 n6c]
Oleic acid
[C18:1 n9c]
Arachidonic acid
[C20:4 n6]
0.47* 1.00
Linoleic acid
[C18:2 n6c]
0.77* 0.80* 1.00
Oleic acid
[C18:1 n9c]
-0.07 -0.07 0.07 1.00
Palmitolenic acid
[C16:1 n9c]
-0.48* -0.18 -0.44* 0.44*
* – significantly difference (P < 0.05).
Arachidonic acid obtained a close positive correlation with linoleic acid, but
linolenic acid have moderate positive collation with palimitolenic acid (r = -0.44).
Although the highest proportion of unsaturated fatty acids is for oleic acid, it had positive
correlation to palmitoleinic acid (r = 0.44).
CONCLUSIONS
The results of lamb meat nutrient amount proved that pasture fattened crossbreed
lambs have meat with lowest fat and cholesterol amount and highest amount of omega
3 and omega 6 fatty acids.
Omega 3 and omega 6 fatty acids had a positive correlation, but omega 3 to omega
9 fatty acids – negative.
Pasture-based lamb fattening provides good lamb meat production, best precocity
was recorded from lambs with France origin - Charollais and Il de France.

1533
Meat type ram crossbreeding with local breed ewes had a positive effect on amount
of nutrient and unsaturated fatty acids in crossbreed lamb meat.
ACKNOWLEDGEMENTS. Latvia Republic Ministry of Agriculture founded study ‘Different
sheep breed and their crossbreed suitability to quality carcass and lamb meat production’.
REFERENCES
Abdullah, A. & Qudsieh, R. 2009. Effect of slaughter weight and time on the quality of meat
from Awassi ram lambs. Meat Science 82, 309–316.
Beyene, S.T. & Mlambo, V. 2011. Botanical and chemical composition of common grass species
around dip–tank areas in semi–arid communal rangelands of swaziland. Tropical and
Subtropical Agroecosystems 14, 1–10.
Bonanome, A. & Grundy, S.M. 1988. Effect of dietary stearic acid on plasma cholesterol and
lipoprotein levels. New England Journal of Medicine 318, 1244–1248.
Chizzolini, R., Zanardi, E. & Derigoni, V. 1999. Calorific value and cholesterol content of
normal and low-fat meat and meat products. Trends in Food Science and Technology 10,
119–128.
El-Shesheny, M.A., Hendawy, S.H. & Ahmed, K.M. 2014. Assessment of productivity, botanical
composition and nutritive value of some plant communities at Sidi-Barrani in North
Western Coast of Egypt. Annals of Agricultural Science 59(2), 155–163.
Jandasek, J., Milersik, M. & Lichovnikova, M. 2013. Effect of sire breed on physio-chemical and
sensory characteristics of lamb meat. Meat Science 96, 88–93.
Kairiša, D. 2005. Scientifical purposes of lambs meat production in Latvia: summary of Doctoral
Thesis of Dr. agr. Scientific degree. Jelgava: LLU, 58 pp. (in Latvian).
Niedziółka, R. & Pieniak-Lendzion, K. 2006. Chemical composition of meat (M. Adductor) and
fatty acids in intramuscular fat of goat kids and ram lambs. Slovak Journal of Animal
Science 39 (4), 197–200.
Priolo, A., Micola, D., Agabriela, J., Prachea, S. & Dransfieldb, E. 2002. Effect of grass or
concentrate feeding systems on lamb carcass and meat quality. Meat Science 62, 179–185.
Ricardo, H.A., Fernandes, A.R.M., Mendes, L.C.N., Oliveira, M.A.G., Protes, V.M.,
Scatenac, E.M., Roc, R.O., Athaydef, N.B., Girãog, L.V.C. & Alves, L.G.C. 2015. Carcass
traits and meat quality differences between a traditional and an intensive production model
of market lambs in Brazil: Preliminary investigation. Small Ruminant Research 130,
141–145.
Santos-Silva, J., Bessa, R.J.B. & Santos-Silva, F. 2002. The effect of genotype, feeding system
and slaughter weight on the quality of light lambs 2. Fatty acid composition of meat.
Livestock Production Science 77, 187–194.
Scerra, M., Caparra, P., Foti, F., Galofaro, V., Sinatra, M.C. & Scerra, V. 2007. Influence of ewe
feeding systems on fatty acid composition of suckling lambs Meat Science 76, 390–394.
Strazdiņa, V. 2014. Biochemical evaluation of game meat in Latvia: summary of Doctoral Thesis
for the Academic Degree in Engineering and Food Sciences (Dr.sc.ing) Latvia University
of Agriculture, 66 pp. (in Latvian).
Teixeira, A., Batista, S., Delfa, R. & Cadavez, V. 2005. Lamb meat quality of two breeds with
protected origin designation. Influence of breed, sex and live weight. Meat Science 71,
530–536.
Tejeda, J., Pena, R. & Andres, A. 2008. Effect of live weight and sex on physio chemical and
sensorial characteristics of Merino lamb meat. Meat science 80, 1061–1067.
1534
Agronomy Research 16(S2), 1534–1545, 2018
https://doi.org/10.15159/AR.18.116
Optimisation of biologically active compounds ultrasound
assisted extraction from potatoes using response surface
methodology
R. Zarins1, Z. Kruma1 and I. Skrabule2 1Latvia University of Life Sciences and Technologies, Faculty of Food Technology,
Department of Food Technology, Rigas iela 22, LV-3004 Jelgava, Latvia 2Institute of Agricultural Resources and Economics, Zinātne iela 2, Priekuli, Priekuli
municipality, LV-4126 Latvia *Correspondence: [email protected]
Abstract. Potato (Solanum tuberosum L.) is source of phenolic compounds and from plant
matrixes can be extracted by several methods. In recent years ultrasound assisted extraction has
become more popular due to its efficiency for recovery of phenolic compounds and antioxidants
and response surface methodology is an effective tool for optimisation of extraction procedure
by evaluating different variables and their interaction. The aim of the current research was to
optimize ultrasound assisted extraction of biologically active compounds from potatoes by
response surface methodology. For experiment purple-flesh potato variety ‘Blue Congo’ was
selected. Control sample was extracted by stirring for 1 hour. Box-Behnken design was used for
optimization of extraction conditions from fresh potatoes and as variables were selected: ethanol
concentration (% v/v), hydrochloric acid concentration (molarity) and time (min). For extracts as
responses total phenolic, total flavonoid, total anthocyanin content and antioxidant activity
(DPPH, ABTS+ scavenging activity) were determined using a spectrophotometric methods.
Significant models were obtained for antocyanins, total phenols and DPPH radical scavenging
activity. Optimisation of extraction showed that for maximising all responses optimal HCl
concentration is 2.5M, ethanol concentration 79.4% and extraction time 60 minutes, resulting in
following responses: 57.41 mg 100 g-1 of anthocyanins, 238.52 mg 100 g-1 of TPC, 24.58 mM
TE 100 g-1 of DPPH scavenging activity and 12.99 mM TE 100 g-1 of ABTS scavenging activity.
Conventional extraction method showed significantly lower results. It could be concluded that
ultrasound assisted extraction is effective method for recovery of phenolic compounds and
solvents and extraction time is significant parameter influencing efficiency.
Key words: purple-flesh potatoes, phenolics, ultrasound assisted extraction, response surface
methodology, Box-Behnken design.
INTRODUCTION
Potato (Solanum tuberosum L.) is widely grown and consumed crop and it contains
many vitally important elements that can benefit human diet (Leo et al., 2008).
Significant and valuable nutrient group in potatoes are phenolics which are
secondary metabolites with health promoting effect (Velioglu et al., 1998; Espin et al.,
2000; Manach et al., 2004). Potatoes are so important source of phenolics that they range
1535
as a third consumed crop right after apples and oranges which are good source of
phenolics as well (Chun et al., 2005).
Phenolics show antioxidant, anticarcinogenic, antibacterial, anti-inflammatory,
antiglycemic, antiviral and vasodilatory qualities (Duthie et al., 2000; Cai et al., 2004;
Reyes et al., 2005; Tsao & Deng, 2005; Mattila & Hellstrom, 2006; Leo et al., 2008;
Berghe, 2012; Kazeem et al., 2012; Konaté et al., 2012; Lolayekar & Shanbhag, 2012).
They also present a positive impact on human longevity, ocular organs, mental health as
well as cardiovascular system (Parr & Bolwell, 2000; Manach et al., 2004; Scalbert et
al., 2005), and phenolics usage in human diet protects from degenerative diseases
(Pourcel et al., 2007; Im et al., 2008). Studies show that in terms of safety as natural
antioxidant in form of extract phenolics are not mutagenic (Sotillo et al., 2007).
Analysis of potatoes have shown significant correlation between existence of
phenolics and total antioxidant level lighting up the fact that higher phenolics amount
bring higher antioxidant levels (Andre et al., 2007).
While all potatoes contain phenolics, the amounts differ in varieties, i.e., red and
purple flesh potatoes might contain approximately twice as much total phenolics
compared to white flesh potatoes (Ezekiel et al., 2013). It may be explained with high
amount of anthocyanins that are pigments in those varieties (Im et al., 2008; Al-Weshahy
& Rao, 2009). Preparation process for different coloured potatoes for consumption
purposes also affects level of phenolics in different ways (Reyes & Zevallos, 2003;
Brown et al., 2005). The phenolics appear in the whole tuber in potatoes, still the skin
has highest level of phenolics (Lewis et al., 1999; Nara et al., 2006).
Phenolics extraction optimisation is important to reach most accurate analysis,
therefore response surface methodology can be used as an effective tool for this purpose.
It is used as an alternative to classical optimization methods, and is more time saving,
cheaper and helps in data evaluation process (Myers et al., 2004; Amado et al., 2014).
This methodology may help to evaluate the effect of the variables and their interactions
(Wettasinghe & Shahidi, 1999; Farris & Piergiovanni, 2009; Asfaram et al., 2015).
Methanol and ethanol are one of the most widely used solvents for phenolics extraction
from potatoes (Singh & Rajini, 2004; Mohdaly et al., 2010; Amado et al., 2014).
Conventional way of phytochemical extraction includes maceration and Soxhlet
extraction, and these methods have quite high organic solvent consumption which limits
bioactive extract usage range because of solvent toxicity, as well as time required for
extraction is long and consumed energy in the process is high (Da Porto et al., 2012).
The alternative and modern method, called ultrasound assisted extraction, has recently
gained more and more popularity (Bendicho et al., 2012) which shortens the time and
energy spent on the process and it also limits final costs. This technology is sustainable
as it protects the environment and consumers health as well as saves time and money
(Armenta et al., 2015).
The aim of the current study was to optimize ultrasound assisted extraction of
biologically active compounds from potatoes by response surface methodology.

1536
MATERIALS AND METHODS
Plant material
Purple-flesh potato variety ‘Blue Congo’, grown at the test fields of Institute of
Agricultural Resources and Economics, was selected for the experiment. Harvested
tubers were kept in the storage facility at 4 °C and at 80 ± 5% relative air humidity until
analysis. Potatoes were homogenized before extraction experiment.
Extraction of phenolic compounds
The homogenized potato samples (2.0 g) were extracted with 20 mL solvent
(according to optimisation model described in experimental design) in an ultrasonic bath
YJ5120-1 (Oubo Dental, USA) at 35 kHz for certain time (according to optimisation
model described below).
Extraction solvent was acidified ethanol (ethanol: HCl solution 85:15 (v/v)).
Ethanol concentration and molarity of HCl were varied in the experiment. The extracts
were then centrifuged in a centrifuge CM-6MT (Elmi Ltd., Latvia) at 3,500.00 rpm for
5 min.
For comparison, extraction methodology used in previous studies was tested
(Kampuse et al., 2016). Phenolic compounds extraction from potatoes - the homogenized
samples were extracted with ethanol (80/20 w/w) in a conical flask with a magnetic
stirrer (magnet 4.0 cm × 0.5 cm) at 700 rpm for 1 h at room temperature (20 ± 1 °C).
The extracts were then filtered (paper No.89).
Experimental design
A response surface methodology using Box-Behnken design (Design Expert) was
used for optimization of extraction conditions of anthocyanins, total phenols and
antioxidants from fresh potatoes and variables were selected as follows: ethanol
concentration (% v/v), hydrochloric acid concentration (molarity) and time (min) (Table 1).
Table 1. Independent variables, their levels and responses
Run
order
A
HCl, M
B
Ethanol, %
C
Time, min
Anthocyanin,
mg 100g-1
TPC,
mg 100g-1
DPPH,
mM TE 100g-1
ABTS,
mM TE 100g-1
1 0.5 50 40 29.55 218.36 13.46 20.96
2 2.5 50 40 44.76 218.99 20.99 14.01
3 0.5 90 40 28.35 189.24 14.64 14.79
4 2.5 90 40 34.95 175.70 24.92 17.76
5 0.5 70 20 42.38 258.84 15.04 20.26
6 2.5 70 20 49.75 243.06 22.16 13.97
7 0.5 70 60 42.73 263.07 14.97 21.01
8 2.5 70 60 58.27 256.88 22.52 13.70
9 1.5 50 20 54.76 243.06 15.31 20.06
10 1.5 90 20 32.78 205.01 20.69 25.02
11 1.5 50 60 31.16 178.84 18.56 18.20
12 1.5 90 60 44.08 204.09 22.15 12.88
13 1.5 70 40 29.77 248.22 18.70 15.89
14 1.5 70 40 29.97 248.68 18.76 15.36
15 1.5 70 40 30.70 248.22 18.95 16.13
1537
Experiment was performed by 15 runs with three replicates of central run.
Estimation of error was performed by 3 runs of central points. Optimisation process was
based on evaluation of responses of samples designed according to model. Coefficients
of response function was calculated, predicting response of fitting model. Statistical
significance was examined by analysis of variance (Anova), lack of fit, pure error,
adeq.precision was tested to check models adequacy.
Optimisation was made by both numerical and graphic analysis using contour
curves and desirability functions. In current experiment different maximum response
variable values were obtained.
Analytical methods
The total phenolic content (TPC) of the potato extracts was determined according
to the Folin-Ciocalteu spectrophotometric method (Singleton et al., 1999). The
absorbance was measured at 765 nm and total phenols were expressed as the gallic acid
equivalents (GAE) 100 g-1 dry weight (DW) of plant material. The TFC was measured
by a spectrophotometric method (Kim et al., 2003).
The absorbance was measured at 415 nm and total flavonoids were expressed as
catehin equivalents (CE) 100 g-1 DW of the sample. Antioxidant activity of the plant
extracts was measured on the basis of scavenging activities of the stable 2,2-diphenyl-1-
picrylhydraziyl (DPPH˙) radical as outlined by Yu et al. (2003) and 2,2′-azino-bis(3-
ethylbenz-thiazoline-6-sulfonic) acid (ABTS˙+) radical cation assay (Re et al., 1999).
Antioxidant activity was expressed as TE 100 g-1 DW of plant material. Total
anthocyanins were determined by method described by Mane et al. (2015). The pH shift
method (pH 0.6 and pH 3.5) for determination of anthocyanins in potatoes extracts were
used based on the absorbance at 700 nm and 520 nm. Results were calculated as pigment
cyanindin-3-glucoside equivalents and expressed to dry matter.
RESULTS AND DISCUSSION
The response surface methodology using Box-Behnken is widely used for
optimisation of extraction (Espada-Bellido et al., 2017). Extraction variables were HCl
molarity (A), ethanol concentration (B) and time (C). Results of analysis of variance for
the quadratic model of responses are shown in Table 2 for total anthocyanins, in Table 3
for total phenols, in Table 4 for DPPH radical scavenging activity and Table 5 for ABTS
scavenging activity. Models for response were significant for anthocyanins (P = 0.0310),
total phenols (P = 0.0231), DPPH radical scavenging activity (P = 0.0018) but not for
ABTS scavenging activity (P = 0.1274). Coefficient of variation ranged between
5.2 until 8.4.
The second order polynomial equation express relationship between tested factors
their interaction and anthocyanins fitted model is:
Anthocyanins = 30.15 + 3.54A - 0.46B - 0.43C + 1.95AB + 2.04AC + 8.72BC + 3.87A2 -
3.72B2 + 14.72C2
Current equation could be used for prediction of responses in the range of tested factors.
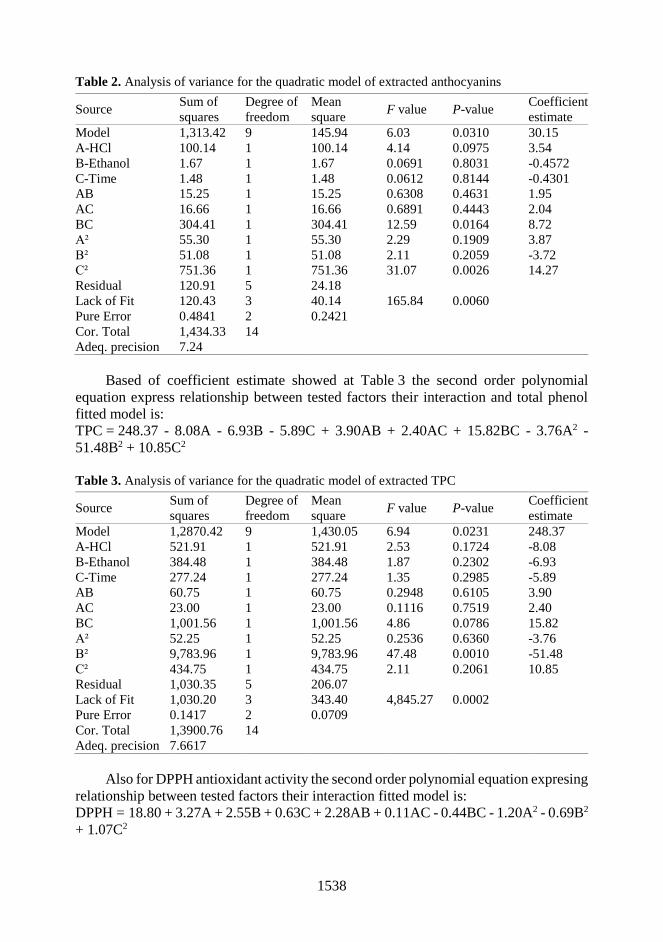
1538
Table 2. Analysis of variance for the quadratic model of extracted anthocyanins
Source Sum of
squares
Degree of
freedom
Mean
square F value P-value
Coefficient
estimate
Model 1,313.42 9 145.94 6.03 0.0310 30.15
A-HCl 100.14 1 100.14 4.14 0.0975 3.54
B-Ethanol 1.67 1 1.67 0.0691 0.8031 -0.4572
C-Time 1.48 1 1.48 0.0612 0.8144 -0.4301
AB 15.25 1 15.25 0.6308 0.4631 1.95
AC 16.66 1 16.66 0.6891 0.4443 2.04
BC 304.41 1 304.41 12.59 0.0164 8.72
A² 55.30 1 55.30 2.29 0.1909 3.87
B² 51.08 1 51.08 2.11 0.2059 -3.72
C² 751.36 1 751.36 31.07 0.0026 14.27
Residual 120.91 5 24.18
Lack of Fit 120.43 3 40.14 165.84 0.0060
Pure Error 0.4841 2 0.2421
Cor. Total 1,434.33 14
Adeq. precision 7.24
Based of coefficient estimate showed at Table 3 the second order polynomial
equation express relationship between tested factors their interaction and total phenol
fitted model is:
TPC = 248.37 - 8.08A - 6.93B - 5.89C + 3.90AB + 2.40AC + 15.82BC - 3.76A2 -
51.48B2 + 10.85C2
Table 3. Analysis of variance for the quadratic model of extracted TPC
Source Sum of
squares
Degree of
freedom
Mean
square F value P-value
Coefficient
estimate
Model 1,2870.42 9 1,430.05 6.94 0.0231 248.37
A-HCl 521.91 1 521.91 2.53 0.1724 -8.08
B-Ethanol 384.48 1 384.48 1.87 0.2302 -6.93
C-Time 277.24 1 277.24 1.35 0.2985 -5.89
AB 60.75 1 60.75 0.2948 0.6105 3.90
AC 23.00 1 23.00 0.1116 0.7519 2.40
BC 1,001.56 1 1,001.56 4.86 0.0786 15.82
A² 52.25 1 52.25 0.2536 0.6360 -3.76
B² 9,783.96 1 9,783.96 47.48 0.0010 -51.48
C² 434.75 1 434.75 2.11 0.2061 10.85
Residual 1,030.35 5 206.07
Lack of Fit 1,030.20 3 343.40 4,845.27 0.0002
Pure Error 0.1417 2 0.0709
Cor. Total 1,3900.76 14
Adeq. precision 7.6617
Also for DPPH antioxidant activity the second order polynomial equation expresing
relationship between tested factors their interaction fitted model is:
DPPH = 18.80 + 3.27A + 2.55B + 0.63C + 2.28AB + 0.11AC - 0.44BC - 1.20A2 - 0.69B2
+ 1.07C2

1539
For ABTS antioxidant activity developed model was not significant it was not used
for optimisation procedure.
Table 4. Analysis of variance for the quadratic model of extracted DPPH
Source Sum of
squares
Degree of
freedom
Mean
square F value P-value
Coefficient
estimate
Model 174.15 9 19.35 21.34 0.0018 18.80
A-HCl 85.31 1 85.31 94.08 0.0002 3.27
B-Ethanol 52.16 1 52.16 57.52 0.0006 2.55
C-Time 3.13 1 3.13 3.45 0.1224 0.6254
AB 20.70 1 20.70 22.83 0.0050 2.28
AC 0.0467 1 0.0467 0.0515 0.8295 0.1080
BC 0.7916 1 0.7916 0.8730 0.3930 -0.4449
A² 5.29 1 5.29 5.84 0.0604 -1.20
B² 1.77 1 1.77 1.96 0.2209 -0.6929
C² 4.19 1 4.19 4.62 0.0842 1.07
Residual 4.53 5 0.9068
Lack of Fit 4.50 3 1.50 87.16 0.0114
Pure Error 0.0344 2 0.0172
Cor. Total 178.69 14
Adeq. precision 14.9679
Table 5. Analysis of variance for the quadratic model of extracted ABTS
Source Sum of
squares
Degree of
freedom
Mean
square F value P-value
Model 107.27 6 17.88 2.38 0.1274 No
significant A-HCl 35.26 1 35.26 4.70 0.0621
B-Ethanol 1.59 1 1.59 0.2116 0.6578
C-Time 22.87 1 22.87 3.05 0.1191
AB 20.90 1 20.90 2.78 0.1338
AC 0.2625 1 0.2625 0.0350 0.8563
BC 26.40 1 26.40 3.52 0.0976
Residual 60.07 8 7.51
Lack of Fit 59.76 6 9.96 65.11 0.0152
Pure Error 0.3060 2 0.1530
Cor. Total 167.35 14
Adeq. precision 5.0943
Results are visualized in nine response surface graphs which provide visual
representation of the relationship between responses and levels of each variable and the
type of interactions between two test variables in each case. Circular or elliptical form
of the contour plots show significance level of the interactions between the variables
(Fig.1).

1540
Figure 1. Response surface 3D plots (A (Anthocyanins), F (TPC), H (DPPH)) presenting the effect
of extraction time and extraction ethanol concentration; (B (Anthocyanins), E (TPC), G (DPPH))
extraction ethanol and HCI concentration; (C (Anthocyanins), D (TPC), I (DPPH)) extraction time
and HCI concentration.
Anth
ocyanin
s (
mg 1
00 g
-1)
Anth
ocyanin
s (
mg 1
00 g
-1)
DP
PH
(m
M T
E 1
00 g
-1)
Anth
ocyanin
s (
mg 1
00 g
-1)
TP
C (
mg G
AE
100 g
-1)
TP
C (
mg G
AE
100 g
-1)
TP
C (
mg G
AE
100 g
-1)
DP
PH
(m
M T
E 1
00 g
-1)
DP
PH
(m
M T
E 1
00 g
-1)
C: Time (min)
C: Time (min) C: Time (min)
C: Time (min)
C: Time (min)
C: Time (min)
B: Ethanol (%) B: Ethanol (%)
B: Ethanol (%)
B: Ethanol (%) B: Ethanol (%)
A: HCI (M)
A: HCI (M)
A: HCI (M)
A: HCI (M)
A: HCI (M)
A: HCI (M)
B: Ethanol (%)
60 60
60
50 50
40 40
50
30 30
20 20
20
30
40
280
260
240
220
200
180
160
280
260
240
220
200
180
160
280
260
240
220
200
180
160
26
24 22
20 18 16
14 12
26 24 22
20 18 16 14 12
28
26
24 22 20 18 16 14 12
28
1 0.5
0 -0.5
-1 -1 -0.5
0 0.5
1 1 0.5
0 -0.5
-1 -1 -0.5
0 0.5
1
1 0.5
0 -0.5
-1 -1 -0.5
0 0.5
1
1
0.5 0
-0.5 -1 -1
-0.5 0
0.5 1 1
0.5 0
-0.5 -1 -1
-0.5 0
0.5 1
1 0.5
0 -0.5
-1 -1 -0.5
0 0.5
1
1 0.5
0 -0.5 -1 -1
-0.5
0 0.5
1
1 0.5
0 -0.5 -1 -1
-0.5
0 0.5
1
1 0.5
0 -0.5 -1 -1
-0.5
0 0.5
1
1541
For extraction of anthocyanins the best conditions are with higher concentration of
ethanol and longer extraction time (Fig. 1, A), and also with higher concentration of HCl
and ethanol (Fig. 1, B). Analysis of purple sweet potatoes showed that significant factors
influencing anthocyanins extractability are temperature, ethanol concentration and
ultrasound power, but time is not significant that is opposite to results obtained in current
experiment (Cai et al., 2016). It is confirmed that anthocyanins are not stable in alkaline
and neutral environment, and for improvement of their stability and extractability
hydrochloric acid addition is beneficial to reduce pH up to 2 til 2.3 (He et al., 2016).
Anthocyanins extraction yield and composition of sweet potatoes are also dependent on
extraction method and ultrasound assisted extraction could result in higher impurities of
other phenolics (Cai et al., 2016). In current experiment it is not disadvantage because
coextraction is tested.
Analysing tendencies for extraction of TPC, higher values wereobtained extracting
shorter time, and with lower concentration of HCl as solvent (Fig. 1, D), ethanol
concentration and HCl interaction showed that higher values were obtained by medium
ethanol concentration and the result was not dependent on HCl concentration (Fig. 1, E).
For extraction of phenolics from potatoe peels, use of acidified ethanol resulted in pure
and stable extracts avoiding side reactions (Maldonado et al., 2014). Extraction of
phenolic compounds from eggplant showed that acidified solvent gave better yield, and
it decreased by the increase of pH (Ferarsa et al., 2018). Whereas analysing interaction
of time and ethanol, higher results were obtained by medium concentration of ethanol
and shorter time (Fig. 1, F). Extraction efficiency of phenolics from eggplants increased
by increasing water content in ethanol up to 50% (Ferarsa et al., 2018). It could be
explained by polarity of solvents and addition of water to organic solvent enhances
extract separation efficiency (Ferarsa et al., 2018). Comparing the two extracts (in water
and ethanol), water was less effective than ethanol for the extraction of phenolic
compounds. This difference can be explained by the polarity of both solvents. It can also
be seen that the yields of aqueous ethanol extracts (50 and 75%) are higher than those of
pure ethanol (100%) and pure water (0%). These results indicate that adding water to the
organic solvent enhances extraction yield (Ferarsa et al., 2018). For DPPH activity the
maximal values analysing ethanol and HCl concentration was obtained using highest
concentrations tested (Fig. 1, G), higher activity was observed with higher concentration
of HCl (Fig.1.H), and ethanol (Fig. 1, I), and in both cases time was not significant
factor. Ultrasound assisted extraction of sweet potatoes resulted in samples with high
radical scavenging activity (Cai et al., 2016).
Box Behnken methodology gives possibility to analyse interaction of different
factors for obtaining desirable results. In current experiment possibility to make one
extraction for testing all responses were tested. If all responses were maximised then
optimal parameters for extraction were following: HCl concentration 2.5M, ethanol
concentration 79.4% and extraction time 60 minutes, and as a result can be obtained
57.41 mg 100 g-1 of anthocyanins, 238.52 mg 100 g-1 of TPC, 24.58 mM TE 100 g-1 of
DPPH scavenging activity and 12.99 mM TE 100 g-1 of ABTS scavenging activity. It is
also possible to optimise one parameter and if content of anthocyanins is maximised then
optimal HCl concentration is 2.42M, ethanol concentration 88.8% and extraction time
59.8 min, as a result can be obtained 58.31 mg 100 g-1 of anthocyanins, but results of
other parameters are lower – 210.57 mg 100 g-1 of TPC, 25.91 mM TE 100 g-1 of DPPH
scavenging activity and 12.69 mM TE 100 g-1 of ABTS scavenging activity. For

1542
extraction of antocyanins from mulberries were 76% MeOH in water at pH 3 (Espada-
Bellido et al., 2017) that is according to our results that higher concentration of HCl
gives better results. Whereas for extraction of anthocyanins from purple sweet potatoes
maximal yield was obtained at 50 °C, 45 minutes using 90% (v/v) ethanol as the solvent
(Cai et al., 2016).
For maximal TPC extraction the optimal HCl concentration is 0.82M, ethanol
concentration is 68.2% and extraction time is 27.2 min, as a result 37.87 mg 100 g-1 of
anthocyanins, 263.58 mg 100 g-1 of TPC, 15.52 mM TE 100 g-1 of DPPH scavenging
activity and 20.03 mM TE 100 g-1 of ABTS scavenging activity can be obtained. The
optimum conditions for extraction of total phenolic compounds from berries were 61%
MeOH in water at pH 7 (Espada-Bellido et al., 2017), that is also in accordance with our
results showing that lower concentration of acid gives higher TPC.
To maximise DPPH antioxidant activity, the optimal HCl concentration would be
2.46M, ethanol concentration 89.2% and extraction time 48.4 minutes, as a result
41.92 mg 100 g-1 of anthocyanins, 192.90 mg 100 g-1 of TPC, 25.10 mM TE 100 g-1 of
DPPH scavenging activity and 15.17 mM TE 100 g-1 of ABTS scavenging activity can
be obtained.
For comparison of results, conventional extraction by stirring for one hour was
tested and results obtained were significantly lower, namely, TPC 200.56 mg 100g-1,
DPPH scavenging activity 6.27 mM TE 100g-1, ABTS 12.77 mM TE 100g-1. Obtained
results are in accordance with results reported in literature showing efficiency of
ultrasound for extraction for anthocyanins (Mane et al., 2015; Espada-Bellido et al.,
2017) and phenolic compounds (Espada-Bellido et al., 2017).
CONCLUSIONS
In current experiment coextraction of total phenols, anthocyanins and antioxidants
characterised by antiradical activity were tested. Significant models were obtained for
antocyanins, total phenols and DPPH radical scavenging activity. Optimisation of
extraction showed that for maximising all responses, the optimal HCl concentration is
2.5M, ethanol concentration 79.4% and extraction time 60 minutes, resulting in
following responses: 57.41 mg 100 g-1 of anthocyanins, 238.52 mg 100 g-1 of TPC,
24.58 mM TE 100 g-1 of DPPH scavenging activity and 12.99 mM TE 100 g-1 of ABTS
scavenging activity. Results of conventional extraction showed significantly lower
results. If one of the responses are maximised, content of others reduces significantly.
For extraction of anthocyanins, the optimal HCl concentration is 2.42M, ethanol
concentration is 88.8% and extraction time is 59.8 minutes, whereas for TPC optimal
HCl concentration is 0.82M, ethanol concentration is 68.2% and extraction time is 27.2
minutes. For obtaining extracts with higher DPPH activity optimal HCl concentration is
2.46M, ethanol concentration is 89.2% and extraction time is 48.4 minutes. It could be
concluded that ultrasound assisted extraction is effective method for recovery of
phenolic compounds and solvents and extraction time is significant parameter
influencing efficiency.

1543
ACKNOWLEDGEMENTS. Present research has been supported by the program ‘Strengthening
Research Capacity in the Latvia University of Life Sciences and Technologies’ project ‘Effect of
storage conditions and processing technology on dynamics of secondary metabolites in potatoes
tubers’ (Z16).
REFERENCES
Al-Weshahy, A. & Rao, V.A. 2009. Isolation and characterization of functional components from
peel samples of six potatoes varieties growing in Ontario. Food Research International
42(8), 1062–1066.
Amado, I.R, Franco, D, Sánchez, M. & Vázquez, J.A. 2014. Optimisation of antioxidant
extraction from Solanum tuberosum potato peel waste by surface response methodology.
Food Chemistry 165, 290–299.
Andre, C.M., Ghislain, M., Bertin, P., Oufir, M., Herrera, M.R., Hoffmann, L., Hausman, J.F.,
Larondelle, Y. & Evers, D. 2007. Andean potato cultivars (Solanum tuberosum L.) as a
source of antioxidant and mineral micronutrients. Journal of Agricultural and Food
Chemistry 55(2), 366–378.
Armenta, S., Garrigues, S. & De Guardia, M. 2015. The role of green extraction techniques in
Green Analytical Chemistry. Trends in Analytical Chemistry 71, 2–8.
Asfaram, A., Ghaedi, M., Goudarzi, A., Soylak, M. & Langroodi, S.M. 2015. Magnetic
nanoparticle based dispersive micro-solid-phase extraction for the determination of
malachite green in water samples: optimized experimental design. New Journal of
Chemistry 39(12), 9813–9823.
Bendicho, C., De La Calle, I., Pena, F., Costas, M., Cabaleiro, N. & Lavilla, I. 2012. Ultrasound-
assisted pretreatment of solid samples in the context of green analytical chemistry. TrAC
Trends in Analytical Chemistry 31(8), 50–60.
Berghe, W.V. 2012. Epigenetic Impact of Dietary Polyphenols in Cancer Chemoprevention:
Lifelong Remodeling of Our Epigenomes. Pharmacological Research 65(6), 565–576.
Brown, C.R., Wrolstad, R., Durst, R., Yang, C.P. & Clevidence, B. 2005. Breeding studies in
potatoes containing high concentrations of anthocyanins. American Journal of Potato
Research 80(4), 241–249.
Cai, Y., Luo, Q., Sun, M. & Corke, H. 2004. Antioxidant activity and phenolic compounds of
112 traditional Chinese medicinal plants associated with anticancer. Life Sciences 74(17),
2157–2184.
Cai, Z., Qu, Z., Lan, Y., Zhao, S., Ma, Z., Wan, Q., Jing, P. & Li, P. 2016. Conventional,
ultrasound-assisted, and accelerated-solvent extractions of anthocyanins from purple sweet
potatoes. Food Chemistry 197(A), 266–272.
Chun, O.K., Kim, D.O., Smith, N., Schroeder, D., Han, J.T. & Lee, C.Y. 2005. Daily
consumption of phenolics and total antioxidant capacity from fruit and vegetables in the
American diet. Journal of the Science of Food and Agriculture 85(10), 1715–1724.
Da Porto, C., Porretto, E. & Decorti, D. 2012. Comparison of ultrasound-assisted extraction with
conventional extraction methods of oil and polyphenols from grape (Vitis vinifera L.) seeds.
Ultrasonics Sonochemistry 20(4), 1076–1080.
Duthie, G., Duthie, S. & Kyle, J. 2000. Plant polyphenols in cancer and heart disease:
implications as nutritional antioxidants. Nutrition Research Reviews 13(1), 79–106.
Espada-Bellido, E., Ferreiro-González, M., Carrera, C., Palma, M., Barroso, C.G. &
Barbero, G.F. 2017. Optimization of the ultrasound-assisted extraction of anthocyanins and
total phenolic compounds in mulberry (Morus nigra) pulp. Food Chemistry 219, 23–32.
Espin, J.C, Rivas, C.S., Wichers, H.J. & Viguera, C.G. 2000. Anthocyanin based natural
colorants: a new source of antiradical activity for foodstuff. Journal of Agricultural and
Food Chemistry 48(5), 1588–1592.
1544
Ezekiel, R., Singh, N., Sharma, S. & Kaur, A. 2013. Beneficial phytochemicals in potato – a
review. Food Research International 50(2), 487–496.
Farris, S. & Piergiovanni, L. 2009. Optimization of manufacture of almond paste cookies using
response surface methodology. Journal of Food Process Engineering 32(1), 64–87.
Ferarsa, S., Zhang, W., Moulai-Mostefa, N., Ding, L., Jaffrin, M.Y. & Grimi, N. 2018. Recovery
of anthocyanins and other phenolic compounds from purple eggplant peels and pulps using
ultrasonic-assisted extraction. Food and Bioproducts Processing 109, 19–28.
He, B., Zhang, L., Yue, X., Liang, J., Jiang, J., Gao, X. & Yue, P. 2016. Optimization of
Ultrasound-Assisted Extraction of phenolic compounds and anthocyanins from blueberry
(Vaccinium ashei) wine pomace. Food Chemistry 204, 70–76.
Im, H.W., Suh, B.S., Lee, S.U., Kozukue, N., Ohnisi-Kameyama, M., Levin, C.E. &
Friedman, M. 2008. Analysis of phenolic compounds by high-performance liquid
chromatography and liquid chromatography/mass spectrometry in potato plant flowers,
leaves, stems, and tubers and in home-processed potatoes. Journal of Agricultural and Food
Chemistry 56(9), 3341–3349.
Kampuse, S., Tomsone, L., Krūma, Z., Šabovics, M. & Skrabule, I. 2016. Effect of lovage
phenolics to formation of acrylamide in French fries. Agronomy Research 14(S2), 1315–
1327.
Kazeem, M.I., Akanji, M.A., Hafizur, R.M. & Choudhary, M.I. 2012. Antiglycation, Antioxidant
and Toxicological Potential of Polyphenol Extracts of Alligator Pepper, Ginger and Nutmeg
from Nigeria. Asian Pacific Journal of Tropical Biomedicine 2(9), 727–732.
Kim, D., Jeong, S.W. & Lee, C.Y. 2003. Antioxidant capacity of phenolic phytochemicals from
various cultivars of plums. Food Chemistry 81(3), 321–326.
Konaté, K., Hilou, A., Mavoungou, J.F., Lepengué, A.N., Souza, A., Barro, N., Datté, J.Y.,
M’Batchi, B. & Nacoulma, O.G. 2012. Antimicrobial Activity of Polyphenol-Rich
Fractions from Sida alba L. (Malvaceae) against Cotrimoxazol-Resistant Bacteria Strains.
Annals of Clinical Microbiology and Antimicrobials 11(1), 1–6.
Leo, L., Leone, A., Longo, C., Lombardi, D.A., Raimo, F. & Zacheo, G. 2008. Antioxidant
compounds and antioxidant activity in early potatoes. Journal of Agricultural and Food
Chemistry 56(11), 4154–4163.
Lewis, C.E., Walker, J.R.L. & Lancaster, J.E. 1999. Changes in anthocyanin, flavonoid and
phenolic acid concentrations during development and storage of coloured potato (Solanum
tuberosum L.) tubers. Journal of the Science of Food and Agriculture 79(2), 311–316.
Lolayekar, N. & Shanbhag, C. 2012. Polyphenols and Oral Health. RSBO 9(1), 74–84.
Maldonado, A.F.S., Mudge, E., Gänzle, M.G. & Schieber, A. 2014. Extraction and fractionation
of phenolic acids and glycoalkaloids from potato peels using acidified water/ethanol-based
solvents. Food Research International 65(A), 27–34.
Manach, C., Scalbert, A., Morand, C., Remesy, C. & Jimenez, L. 2004. Polyphenols: food
sources and bioavailability. American Journal of Clinical Nutrition 79(5), 727–747.
Mane, S., Bremner, D.H., Tziboula-Clarke, A. & Lemos, M.A. 2015. Effect of ultrasound on the
extraction of total anthocyanins from Purple Majesty potato. Ultrasonics Sonochemistry 27,
509–514.
Mattila, P. & Hellstrom, J. 2006. Phenolic acids in potatoes, vegetables, and some of their
products. Journal of Food Composition and Analysis 20(3–4), 152–160.
Mohdaly, A.A.A., Sarhan, M.A., Smetanska, I. & Mahmoud, A. 2010. Antioxidant properties of
various solvent extracts of potato peel, sugar beet pulp and sesame cake. Journal of the
Science of Food and Agriculture 90(2), 218–226.
Myers, R.H., Montgomery, D.C., Vining, G.G. & Borror, C. 2004. Response surface
methodology: a retrospective and literature survey. Journal of Quality Technology 36(1),
53–78.

1545
Nara, K., Miyoshi, T., Honma, T. & Koga, H. 2006. Antioxidative activity of bound form
phenolics in potato peel. Bioscience, Biotechnology, and Biochemistry 70(6), 1489–1491.
Parr, A.J. & Bolwell, G.P. 2000. Phenols in the plant and in man. The potential for possible
nutritional enhancement of the diet by modifying the phenols content or profile. Journal of
the Science of Food and Agriculture 80(7), 985–1012.
Pourcel, L., Routaboul, J.M., Cheynier, V., Lepiniec, L. & Debeaujon, I. 2007. Flavonoid
oxidation in plants: from biochemical properties to physiological functions. Trends in Plant
Science 12(1), 29–36.
Re, R., Pellegrini, N., Proteggente, A., Pannala, A., Yang, M. & Rice-Evans, C. 1999.
Antioxidant activity applying an improved ABTS radical cation decolorization assay. Free
Radical Biology and Medicine 26(9–10), 1231–1237.
Reyes, L.F. & Zevallos, L.C. 2003. Wounding stress increases the phenolic content and
antioxidant capacity of purple-flesh potatoes (Solanum tuberosum L.). Journal of
Agricultural and Food Chemistry 51(18), 5296–5300.
Reyes, L.F., Miller, J.C. & Zevallos, L.C. 2005. Antioxidant capacity, anthocyanins and total
phenolics in purple and red fleshed potato (Solanunm tuberosum L.) genotypes. American
Journal of Potato Research 82(4), 271–277.
Scalbert, A., Manach, C., Morand, C., Remesy, C. & Jimenez, L. 2005. Dietary polyphenols and
the prevention of diseases. Critical Reviews in Food Science and Nutrition 45(4), 287–306.
Singh, N. & Rajini, P. 2004. Free radical scavenging activity of an aqueous extract of potato peel.
Food Chemistry 85(4), 611–616.
Singleton, V.L., Orthofer, R. & Lamuela-Raventos, R.M. 1999. Analysis of Total Phenols and
Other Oxidation Substrates and Antioxidants by Means of Folin-Ciocalteu Reagent.
Methods Enzymology 299C(1), 152–178.
Sotillo, D.R., Hadley, M. & Wolf-Hall, C. 2007. Potato peel extract a nonmutagenic antioxidant
with potential antimicrobial activity. Journal of Food Science 63(5), 907–910.
Tsao, R. & Deng, Z. 2005. Separation procedures for naturally occurring antioxidant
phytochemicals. Journal of Chromatography B 812(1–2), 85–99.
Velioglu, Y.S, Mazza, G., Gao, L. & Oomah, B.D. 1998. Antioxidant activity and total phenolics
in selected fruits, vegetables, and grain products. Journal of Agricultural and Food
Chemistry 46(10), 4113–4117.
Wettasinghe, M. & Shahidi, F. 1999. Evening primrose meal: A source of natural antioxidants
and scavenger of hydrogen peroxide and oxygen-derived free radicals. Journal of
Agricultural and Food Chemistry 47(5), 1801–1812.
Yu, L., Perret, J., Harris, M., Wilson, J. & Haley, S. 2003. Antioxidant properties of bran extracts
from ‘Akron’ wheat grown at different locations. Journal of Agricultural and Food
Chemistry 51(6), 1566–1570.
1546
Agronomy Research 16(S2), 1546–1554, 2018
https://doi.org/10.15159/AR.18.006
Comparison of phenolic compounds and antioxidant activity of
fresh and freeze-dried potatoes
R. Zarins1,*, Z. Kruma1, L. Tomsone1, S. Kampuse1, I. Skrabule2 and
I.H. Konosonoka2
1Latvia University of Life Sciences and Technologies, Faculty of Food Technology,
Department of Food Technology, Rigas iela 22, LV-3004 Jelgava, Latvia 2Institute of Agricultural Resources and Economics, Zinātne iela 2, Priekuli,
Priekuli municipality, LV-4126 Latvia *Correspondence: [email protected]
Abstract. Potatoes (Solanum tuberosum L.) contain a wide range of compounds with health
benefits, and different techniques have been developed for the determination of these compounds.
Freeze-drying is a common method for the preservation and preparation of samples for the
analyses of bioactive compounds, but it is well known that drying influences the composition of
food products. The aim of the current study was to compare phenolic compounds and antioxidant
activity of fresh and freeze-dried potatoes. In the experiment 11 cultivar potatoes grown in
experimental fields of the Institute of Agricultural Resources and Economics in 2016 were
analysed. Potatoes were freeze-dried. Homogenized fresh and freeze-dried samples were
extracted with an ethanol/water (80/20 w/w) solution. Total phenolic content (TPC) was
determined using the Folin-Ciocalteu method, and the antioxidant activity was evaluated using
2,2-diphenyl-1-picrylhydrazyl (DPPH˙) and 2,2'-azino-bis(3-ethylbenzothiazoline-6-sulphonic
acid) (ABTS) assays. The highest TPC and radical scavenging activity were determined in
cultivars ‘Peru Purple’ and ‘Blue Congo’ potatoes. Freeze-drying influenced all the tested
parameters but more significantly the TPC, and for certain cultivars a reduction of more than 30%
was observed. A strong correlation between TPC, DPPH and ABTS in fresh and freeze-dried
samples was observed, r = 0.81, r=0.93, r = 0.92, respectively. It could be concluded that the
effect of freeze-drying on TPC and antioxidant activity is cultivar dependent.
Key words: potatoes, phenolic compounds, antioxidant activity, freeze-drying.
INTRODUCTION
Potato (Solanum tuberosum L.) is one of the most widely grown and consumed
crop in the world that contains many dietary valuable compounds (Leo et al., 2008).
Potatoes are a source of carbohydrates, proteins and minerals which makes them a vital
part of the human diet (Casanas et al., 2002). They are highly recommended as a part of
everyday diet because many of the potatoes’ compounds have a beneficial effect on
human health (Bravo, 1998; Katan & Roos, 2004). In addition, potatoes also contain
secondary metabolites phenolic compounds which are highly beneficial for health
(Velioglu et al., 1998; Espin et al., 2000; Manach et al., 2004). They are valuable
phytochemicals which present antioxidant, anticarcinogenic, antibacterial, anti-
1547
inflammatory, antiglycemic, antiviral and vasodilatory properties (Duthie, Duthie &
Kyle, 2000; Reyes, Miller & Zevallos, 2005; Mattila & Hellstrom, 2006; Leo et al.,
2008).
Phenolic compounds are a group that consists of thousands of different compounds
and some of which, in addition to the above listed qualities; also have a positive effect
on longevity, mental health, cardiovascular system and ocular organs (Parr & Bolwell,
2000; Manach et al., 2004; Scalbert et al., 2005). A high correlation has been found
between the presence of phenolic compounds in potatoes and the total antioxidant
capacity (Andre et al., 2007). Potatoes as a phenolic compound source are the third
consumed crop after apples and oranges (Chun et al., 2005). Total phenolic content in
potatoes is significantly higher ranging from approximately 530 to 1,770 mg 1 kg-1 fresh
weight (Al Saikhan, Howard & Miller, 1995), that is why the studies on the phenolic
compound and antioxidant properties in context of potatoes are highly important.
Phenolic compounds can be found in potatoes’ flesh and skin, although the skin contains
the highest concentration (Lewis, Walker & Lancaster, 1999; Nara et al., 2006). All
potato cultivars have phenolic compounds, but some of them contain different total
amounts, for example, red and purple flesh potato cultivars have twice as much total
phenolic content compared to white flesh potatoes (Ezekiel et al., 2013), and also the
technological process affects potatoes with different colour flesh differently (Brown et
al., 2005; Reyes & Zevallos, 2003). For example, freeze-drying of purple flesh potatoes
neither significantly affects total phenolic neither content nor total antioxidant content
(Nayak, 2011). Although potatoes are naturally rich in phenolic compounds having high
antioxidant activity, this factor can change based on conditions (storage, wounding,
technological processes) to which potatoes are exposed.
The aim of this study was to evaluate and compare phenolic compound and
antioxidant activity changes of fresh and technologically affected (freeze-drying)
potatoes.
MATERIALS AND METHODS
Raw materials
The potatoes were planted in the middle of May and harvested in the last ten days
of August or first days of September in 2016. The soil type in the field was sod-podzolic
(PVv), sandy loam, pHKCl 5.3, organic matter 1.8%, contained P2O5 120 mg kg-1,
K2O 143 mg kg-1. Pre-crop – winter cereals, applied fertilisers before planting
NPK 60:55:90 kg ha-1 herbicides, insecticides and fungicides were applied according to
conventional growing technology. Harvested tubers were kept in the storage facility at
an air temperature of 4 °C and at a relative air humidity of 80 ± 5%. In the experiment
eleven potato (Solanum tuberosum L.) cultivars with white, yellow and purple coloured
flesh were evaluated (Table 1).
For the experiment a total of 10 kg (around 50–60 potato tubers) of table potato
tubers per cultivar were selected into small piles, from ten different wooden boxes (the
size of the box: 90 cm (l) ×50 cm (w) × 40 cm (h)). Five potatoes were selected from
several location points of each box.

1548
Table 1. Description of potato cultivars
Cultivar Breeder / country Earliness Tuber
shape
Colour
of skin
Colour
of flesh
Imanta AREI / Latvia medium
late
long oval yellow with
pink eyes
white
S 01085-21 AREI / Latvia early oval light yellow light yellow
S 04009-37 AREI / Latvia medium late oval purple white
Brasla AREI / Latvia medium late round yellow yellow
Lady
Claire
Meijer Research BV /
The Netherlands
medium early oval cream light yellow
Lenora AREI / Latvia medium early round oval yellow yellow
Gundega AREI / Latvia medium late round pink yellow
2000-49.82 AREI / Latvia medium late round yellow light yellow
19514.20 AREI / Latvia medium late round oval purple white
Blue Congo late oval dark purple purple
Peru Purple late oval dark purple purple
Cut potato tuber cubes (1 x 1 cm) were placed in a horizontal freezer (Zanussi,
Pordenone, Italy) at a temperature of minus 18 °C before freeze-drying. Frozen potatoes
were transferred to a freeze drier (CHRIST Alpha 2-4 LD plus, Osterode am Harz,
Germany), which operates at the following conditions: temperature in a sample
chamber – 83 ± 2 °C, vacuum – 1.0 mbar; freezing time – 34 hours.
Chemical analysis
Extraction of phenolic compounds from potatoes – the homogenized samples were
extracted with ethanol (80/20 w/w) in a conical flask with a magnetic stirrer (magnet
4.0 cm × 0.5 cm) at 700 rpm for 1 h at room temperature (20 ± 1 °C). The extracts were
then filtered (paper No.89). The extraction process was done in triplicate.
Determination of total phenolic content (TPC) – the TPC of potato extracts was
determined according to the Folin-Ciocalteu spectrophotometric method (Singleton et
al., 1999) with some modifications. The absorbance was measured at 765 nm and total
phenolics were expressed as the gallic acid equivalents (GAE) 100 g-1 dry weight (DW)
of plant material.
Determination of antioxidant activity – antioxidant activity of potato extracts was
measured on the basis of scavenging activities of the stable 2,2-diphenyl-1-
picrylhydrazyl (DPPH˙) radical as outlined by Yu et al. (2003). The absorbance was
measured at 517 nm. The radical scavenging activity (RSA) of extracts was also
measured by 2,2'-azino-bis(3-ethylbenzothiazoline-6-sulphonic acid) (ABTS˙+) radical
cation assay (Re et al., 1999). For the assessment of extracts, the ABTS˙+ solution was
diluted with a phosphate buffer solution to obtain the absorbance of 0.800 ± 0.030 at
734 nm. The RSA was expressed as TE 100 g-1 DW of plant material. The higher the
Trolox equivalent antioxidant capacity (TEAC) of a sample, the stronger is the
antioxidant activity.
Statistical analysis
Experimental results are means of three replications and were analyzed by
Microsoft Excel 2010 (descriptive statistics) and SPSS 17.00 (ANOVA and correlation
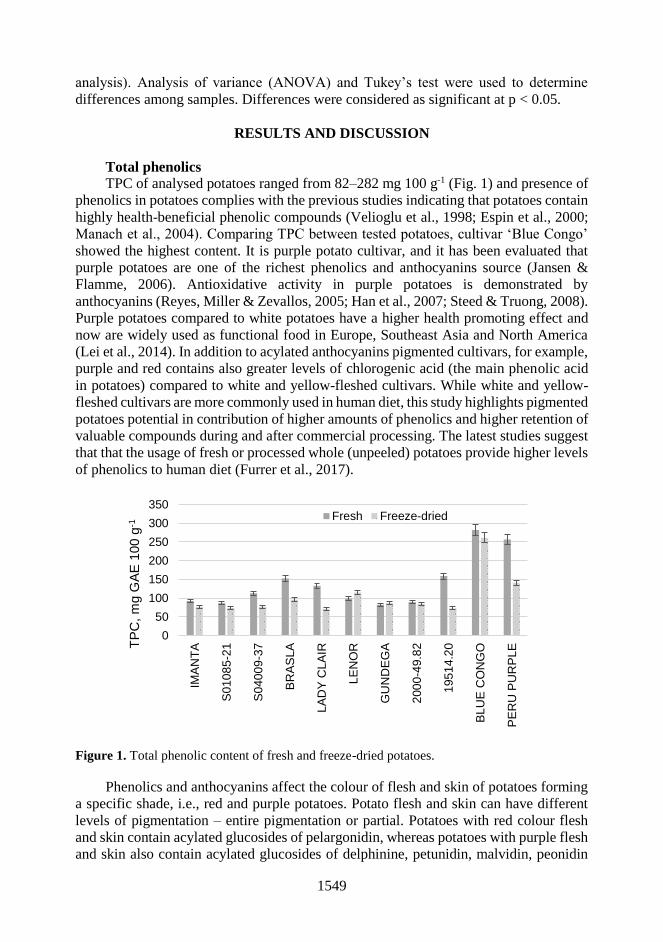
1549
analysis). Analysis of variance (ANOVA) and Tukey’s test were used to determine
differences among samples. Differences were considered as significant at p < 0.05.
RESULTS AND DISCUSSION
Total phenolics
TPC of analysed potatoes ranged from 82–282 mg 100 g-1 (Fig. 1) and presence of
phenolics in potatoes complies with the previous studies indicating that potatoes contain
highly health-beneficial phenolic compounds (Velioglu et al., 1998; Espin et al., 2000;
Manach et al., 2004). Comparing TPC between tested potatoes, cultivar ‘Blue Congo’
showed the highest content. It is purple potato cultivar, and it has been evaluated that
purple potatoes are one of the richest phenolics and anthocyanins source (Jansen &
Flamme, 2006). Antioxidative activity in purple potatoes is demonstrated by
anthocyanins (Reyes, Miller & Zevallos, 2005; Han et al., 2007; Steed & Truong, 2008).
Purple potatoes compared to white potatoes have a higher health promoting effect and
now are widely used as functional food in Europe, Southeast Asia and North America
(Lei et al., 2014). In addition to acylated anthocyanins pigmented cultivars, for example,
purple and red contains also greater levels of chlorogenic acid (the main phenolic acid
in potatoes) compared to white and yellow-fleshed cultivars. While white and yellow-
fleshed cultivars are more commonly used in human diet, this study highlights pigmented
potatoes potential in contribution of higher amounts of phenolics and higher retention of
valuable compounds during and after commercial processing. The latest studies suggest
that that the usage of fresh or processed whole (unpeeled) potatoes provide higher levels
of phenolics to human diet (Furrer et al., 2017).
Figure 1. Total phenolic content of fresh and freeze-dried potatoes.
Phenolics and anthocyanins affect the colour of flesh and skin of potatoes forming
a specific shade, i.e., red and purple potatoes. Potato flesh and skin can have different
levels of pigmentation – entire pigmentation or partial. Potatoes with red colour flesh
and skin contain acylated glucosides of pelargonidin, whereas potatoes with purple flesh
and skin also contain acylated glucosides of delphinine, petunidin, malvidin, peonidin
0
50
100
150
200
250
300
350
IMA
NT
A
S0
10
85
-21
S0
40
09
-37
BR
AS
LA
LA
DY
CLA
IR
LE
NO
R
GU
ND
EG
A
200
0-4
9.8
2
195
14
.20
BL
UE
CO
NG
O
PE
RU
PU
RP
LET
PC
, m
g G
AE
100 g
-1
Fresh Freeze-dried

1550
(Brown, 2005). The availability of phytonutrients in potatoes nowadays is a highly
important factor for consumers due to the increased focus on human health and a
healthier diet which works as a developing force for future cultivar. Studies have
indicated some potato cultivars that have significantly higher phytonutrients level
compared to most widely used potato cultivars, also suggesting that focusing on potato
selection with higher phytonutrients amount can raise the level of phytonutrients even
more than it is now on average, for example, already identified are white-flesh potatoes
with higher phenolics level compared to the average amount of phenolics in this colour
potatoes, which proves that selection works well in the case of higher phytonutrients
level (Navarre et al., 2011).
Technological processes, for example freeze-drying, affect the chemical content of
plants (Angela & Meireles, 2009) so it is important that any kind of technological
treatment is done using as low temperature as possible helping to retain as high
biologically active compound levels as possible.
In all potato cultivars TPC after treatment was significantly lower compared to
fresh samples and reduction was up till 45%.
Antioxidant activity
Antioxidant activity is closely linked to total phenolics and total anthocyanins
(Reyes, Miller & Zevallos, 2005; Leo et al., 2008). In the current study 2,2-diphenyl-1-
picrylhydrazyl (DPPH) scavenging activity ranged from 4.6–12.2 mM 100g-1 with the
highest activity in potatoes ‘Blue Congo’ and ‘Peru Purple’ (Fig. 2). It also corresponds
to other studies that state that antioxidant activity of fresh purple and red-fleshed potatoes
is high (Cevallos-Casals & Cisneros-Zevallos, 2003).
Figure 2. DPPH scavenging activity of fresh and freeze-dried potatoes.
Antioxidant activity is the ability of redox molecules in potatoes to encompass free
radicals and taking into account the health promoting influence of all potatoes
antioxidants it is important to study health-beneficial compounds (Puchau et al., 2010).
Potatoes are considered to be a good source of antioxidants since they contain, for
0
2
4
6
8
10
12
14
IMA
NT
A
S0
10
85
-21
S0
40
09
-37
BR
AS
LA
LA
DY
CLA
IR
LE
NO
R
GU
ND
EG
A
200
0-4
9.8
2
195
14
.20
BL
UE
CO
NG
O
PE
RU
PU
RP
LED
PP
H,
mM
TE
100 g
-1
Fresh Freeze-dried
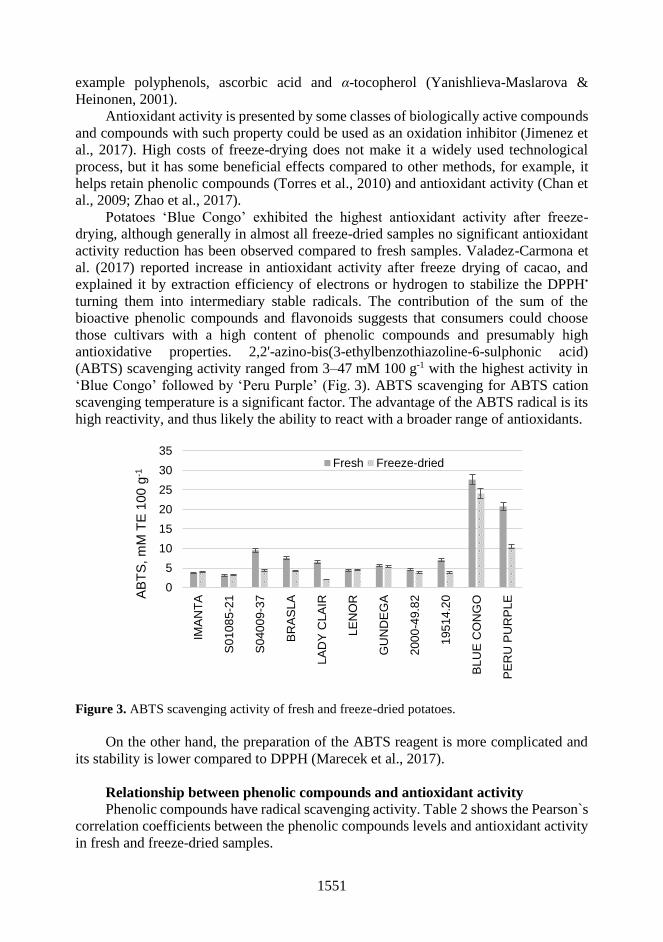
1551
example polyphenols, ascorbic acid and α-tocopherol (Yanishlieva-Maslarova &
Heinonen, 2001).
Antioxidant activity is presented by some classes of biologically active compounds
and compounds with such property could be used as an oxidation inhibitor (Jimenez et
al., 2017). High costs of freeze-drying does not make it a widely used technological
process, but it has some beneficial effects compared to other methods, for example, it
helps retain phenolic compounds (Torres et al., 2010) and antioxidant activity (Chan et
al., 2009; Zhao et al., 2017).
Potatoes ‘Blue Congo’ exhibited the highest antioxidant activity after freeze-
drying, although generally in almost all freeze-dried samples no significant antioxidant
activity reduction has been observed compared to fresh samples. Valadez-Carmona et
al. (2017) reported increase in antioxidant activity after freeze drying of cacao, and
explained it by extraction efficiency of electrons or hydrogen to stabilize the DPPH•
turning them into intermediary stable radicals. The contribution of the sum of the
bioactive phenolic compounds and flavonoids suggests that consumers could choose
those cultivars with a high content of phenolic compounds and presumably high
antioxidative properties. 2,2'-azino-bis(3-ethylbenzothiazoline-6-sulphonic acid)
(ABTS) scavenging activity ranged from 3–47 mM 100 g-1 with the highest activity in
‘Blue Congo’ followed by ‘Peru Purple’ (Fig. 3). ABTS scavenging for ABTS cation
scavenging temperature is a significant factor. The advantage of the ABTS radical is its
high reactivity, and thus likely the ability to react with a broader range of antioxidants.
Figure 3. ABTS scavenging activity of fresh and freeze-dried potatoes.
On the other hand, the preparation of the ABTS reagent is more complicated and
its stability is lower compared to DPPH (Marecek et al., 2017).
Relationship between phenolic compounds and antioxidant activity
Phenolic compounds have radical scavenging activity. Table 2 shows the Pearson`s
correlation coefficients between the phenolic compounds levels and antioxidant activity
in fresh and freeze-dried samples.
0
5
10
15
20
25
30
35
IMA
NT
A
S0
10
85
-21
S0
40
09
-37
BR
AS
LA
LA
DY
CLA
IR
LE
NO
R
GU
ND
EG
A
200
0-4
9.8
2
195
14
.20
BL
UE
CO
NG
O
PE
RU
PU
RP
LEA
BT
S,
mM
TE
100 g
-1
Fresh Freeze-dried
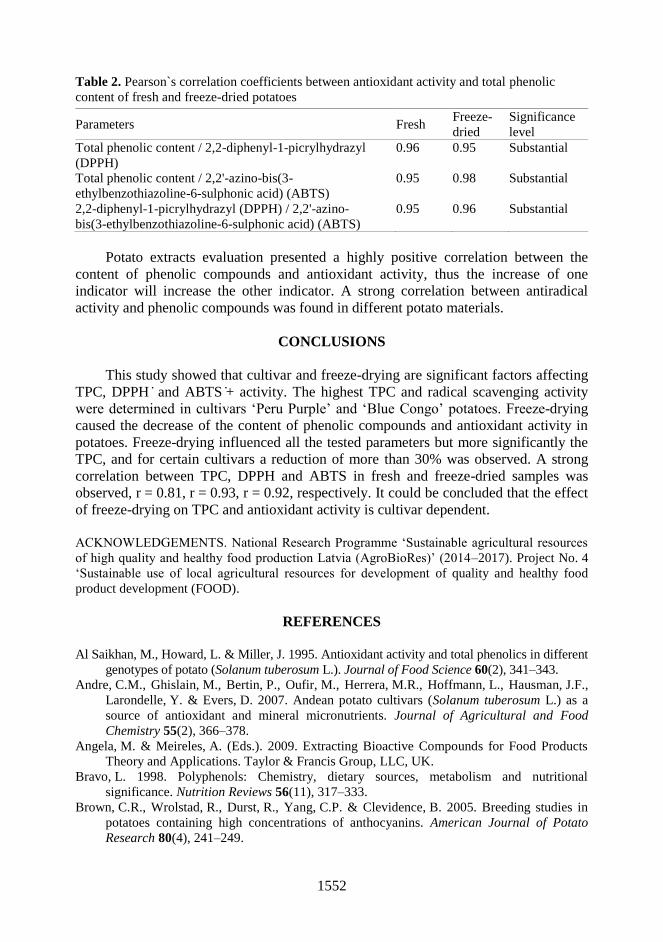
1552
Table 2. Pearson`s correlation coefficients between antioxidant activity and total phenolic
content of fresh and freeze-dried potatoes
Parameters Fresh Freeze-
dried
Significance
level
Total phenolic content / 2,2-diphenyl-1-picrylhydrazyl
(DPPH)
0.96 0.95 Substantial
Total phenolic content / 2,2'-azino-bis(3-
ethylbenzothiazoline-6-sulphonic acid) (ABTS)
0.95 0.98 Substantial
2,2-diphenyl-1-picrylhydrazyl (DPPH) / 2,2'-azino-
bis(3-ethylbenzothiazoline-6-sulphonic acid) (ABTS)
0.95 0.96 Substantial
Potato extracts evaluation presented a highly positive correlation between the
content of phenolic compounds and antioxidant activity, thus the increase of one
indicator will increase the other indicator. A strong correlation between antiradical
activity and phenolic compounds was found in different potato materials.
CONCLUSIONS
This study showed that cultivar and freeze-drying are significant factors affecting
TPC, DPPH ̇ and ABTS ̇+ activity. The highest TPC and radical scavenging activity
were determined in cultivars ‘Peru Purple’ and ‘Blue Congo’ potatoes. Freeze-drying
caused the decrease of the content of phenolic compounds and antioxidant activity in
potatoes. Freeze-drying influenced all the tested parameters but more significantly the
TPC, and for certain cultivars a reduction of more than 30% was observed. A strong
correlation between TPC, DPPH and ABTS in fresh and freeze-dried samples was
observed, r = 0.81, r = 0.93, r = 0.92, respectively. It could be concluded that the effect
of freeze-drying on TPC and antioxidant activity is cultivar dependent.
ACKNOWLEDGEMENTS. National Research Programme ‘Sustainable agricultural resources
of high quality and healthy food production Latvia (AgroBioRes)’ (2014–2017). Project No. 4
‘Sustainable use of local agricultural resources for development of quality and healthy food
product development (FOOD).
REFERENCES
Al Saikhan, M., Howard, L. & Miller, J. 1995. Antioxidant activity and total phenolics in different
genotypes of potato (Solanum tuberosum L.). Journal of Food Science 60(2), 341–343.
Andre, C.M., Ghislain, M., Bertin, P., Oufir, M., Herrera, M.R., Hoffmann, L., Hausman, J.F.,
Larondelle, Y. & Evers, D. 2007. Andean potato cultivars (Solanum tuberosum L.) as a
source of antioxidant and mineral micronutrients. Journal of Agricultural and Food
Chemistry 55(2), 366–378.
Angela, M. & Meireles, A. (Eds.). 2009. Extracting Bioactive Compounds for Food Products
Theory and Applications. Taylor & Francis Group, LLC, UK.
Bravo, L. 1998. Polyphenols: Chemistry, dietary sources, metabolism and nutritional
significance. Nutrition Reviews 56(11), 317–333.
Brown, C.R., Wrolstad, R., Durst, R., Yang, C.P. & Clevidence, B. 2005. Breeding studies in
potatoes containing high concentrations of anthocyanins. American Journal of Potato
Research 80(4), 241–249.

1553
Casanas, R., Gonzalez, M., Rodriguez, E., Marrero, A. & Diaz, C. 2002. Chemometric Studies of
Chemical Compounds in Five Cultivars of Potatoes from Tenerife. Journal of Agricultural
and Food Chemistry 50(7), 2076–2082.
Cevallos-Casals, B. & Cisneros-Zevallos, L. 2003. Stoichiometric and kinetic studies of phenolic
antioxidants from Andean purple corn and red-fleshed sweet potato. Journal of Agricultural
and Food Chemistry 51(11), 3313–3319.
Chan, E.W.C., Lim, Y.Y., Wong, S.K., Lim, K.K. & Yong, M.Y. 2009. Effects of different
drying methods on the antioxidant properties of leaves and tea of ginger species. Food
Chemistry 113, 166–172.
Chun, O.K., Kim, D.O., Smith, N., Schroeder, D., Han, J.T. & Lee, C.Y. 2005. Daily
consumption of phenolics and total antioxidant capacity from fruit and vegetables in the
American diet. Journal of the Science of Food and Agriculture 85(10), 1715–1724.
Duthie, G., Duthie, S. & Kyle, J. 2000. Plant polyphenols in cancer and heart disease:
implications as nutritional antioxidants. Nutrition Research Reviews 13(1), 79–106.
Espin, J.C, Rivas, C.S., Wichers, H.J. & Viguera, C.G. 2000. Anthocyanin based natural
colorants: a new source of antiradical activity for foodstuff. Journal of Agricultural and
Food Chemistry 48(5), 1588–1592.
Ezekiel, R., Singh, N., Sharma, S. & Kaur, A. 2013. Beneficial phytochemicals in potato – a
review. Food Research International 50(2), 487–496.
Furrer, A., Cladis, D.P., Kurilich, A., Manoharan, R. & Ferruzzi, M.G. 2017. Changes in
phenolic content of commercial potato varieties through industrial processing and fresh
preparation. Food Chemistry 218, 47–55.
Han, K.H., Matsumoto, A., Shimada, K., Sekikawa, M. & Fukushima, M. 2007. Effects of
anthocyanin-rich purple potato flakes on antioxidant status in F344 rats fed a cholesterol-
rich diet. British Journal of Nutrition 98(5), 914–921.
Jansen, G. & Flamme, W. 2006. Coloured potatoes (Solanum tuberosum L.) – anthocyanin
content and tuber quality. Genetic Research and Crop Evolution 53(7), 1321–1331.
Jiménez, P., García, P., Bustamante, A., Barriga, A. & Robert, P. 2017. Thermal stability of oils
added with avocado (Persea americana cv. Hass) or olive (Olea europaea cv. Arbequina)
leaf extracts during the French potatoes frying. Food Chemistry 221, 123–129.
Katan, M.B. & Roos, N.M. 2004. Promises and problems of functional foods. Critical Reviews
in Food Science and Nutrition 44(5), 369–377.
Lei, C., Ma, Q., Tang, Q.Y., Ai, X.R., Zhou, Z., Yao, L., Wang, Y., Wang, Q. & Dong, J.Z. 2014.
Sodium selenite regulates phenolics accumulation and tuber development of purple
potatoes. Scientia Horticulturae 165, 142–147.
Leo, L., Leone, A., Longo, C., Lombardi, D.A., Raimo, F. & Zacheo, G. 2008. Antioxidant
compounds and antioxidant activity in early potatoes. Journal of Agricultural and Food
Chemistry 56(11), 4154–4163.
Lewis, C.E., Walker, J.R.L. & Lancaster, J.E. 1999. Changes in anthocyanin, flavonoid and
phenolic acid concentrations during development and storage of coloured potato (Solanum
tuberosum L.) tubers. Journal of the Science of Food and Agriculture 79(2), 311–316.
Manach, C., Scalbert, A., Morand, C., Remesy, C. & Jimenez, L. 2004. Polyphenols: food
sources and bioavailability. American Journal of Clinical Nutrition 79(5), 727–747.
Marecek, V., Mikyska, A., Hampel, D., Cejka, P., Neuwirthova, J., Malachova, A., Cerkal, A.
2017. ABTS and DPPH methods as a tool for studying antioxidant capacity of spring barley
and malt. Journal of Cereal Science 73, 40–45.
Mattila, P. & Hellstrom, J. 2006. Phenolic acids in potatoes, vegetables, and some of their
products. Journal of Food Composition and Analysis 20(3–4), 152–160.
Nara, K., Miyoshi, T., Honma, T. & Koga, H. 2006. Antioxidative activity of bound form
phenolics in potato peel. Bioscience, Biotechnology, and Biochemistry 70(6), 1489–1491.

1554
Navarre, D.A., Pillai, S.S., Shakya, R. & Holden, M.J. 2011. HPLC profiling of phenolics in
diverse potato genotypes. Food Chemistry 127(1), 34–41.
Nayak, B. 2011. Effect of thermal processing on the phenolic antioxidants of colored potatoes.
Doctoral dissertation, Washington State University, Washington, USA.
Parr, A.J. & Bolwell, G.P. 2000. Phenols in the plant and in man. The potential for possible
nutritional enhancement of the diet by modifying the phenols content or profile. Journal of
the Science of Food and Agriculture 80(7), 985–1012.
Puchau, B., Zulet, M.A., Echavarri, A.G., Hermsdorff, H.H.M. & Martínez, J.A. 2010. Dietary
total antioxidant capacity is negatively associated with some metabolic syndrome features
in healthy young adults. Nutrition 26(5), 534–541.
Re, R., Pellegrini, N., Proteggente, A., Pannala, A., Yang, M. & Rice-Evans, C. 1999.
Antioxidant activity applying an improved ABTS radical cation decolorization assay. Free
Radical Biology and Medicine 26(9–10), 1231–1237.
Reyes, L.F. & Zevallos, L.C. 2003. Wounding stress increases the phenolic content and
antioxidant capacity of purple-flesh potatoes (Solanum tuberosum L.). Journal of
Agricultural and Food Chemistry 51(18), 5296–5300.
Reyes, L.F., Miller, J.C. & Zevallos, L.C. 2005. Antioxidant capacity, anthocyanins and total
phenolics in purple and red fleshed potato (Solanunm tuberosum L.) genotypes. American
Journal of Potato Research 82(4), 271–277.
Scalbert, A., Manach, C., Morand, C., Remesy, C. & Jimenez, L. 2005. Dietary polyphenols and
the prevention of diseases. Critical Reviews in Food Science and Nutrition 45(4), 287–306.
Singleton, V.L., Orthofer, R., Lamuela-Raventos, R.M., 1999. Analysis of Total Phenols and
Other Oxidation Substrates and Antioxidants by Means of Folin-Ciocalteu Reagent.
Methods Enzymology 119, 152–178.
Steed, L. & Truong, V.D. 2008. Anthocyanin content, antioxidant activity, and selected physical
properties of flowable purple-fleshed sweetpotato purees. Journal of Food Science 73(5),
215–221.
Torres, C., Díaz-Maroto, M.C., Hermosín-Gutiérrez, I. & Pérez-Coello, M.S. 2010. Effect of
freeze-drying and oven-drying on volatiles and phenolics composition of grape skin.
Analytica Chimica Acta 660(1–2), 177–182.
Valadez-Carmona, L., Plazola-Jacinto, C.P., Hernández-Ortega, M., Hernández-Navarro, M.D.,
Villarreal, F., Necoechea-Mondragón, H., Ortiz-Moreno, A. & Ceballos-Reyes, G. 2017.
Effects of microwaves, hot air and freeze-drying on the phenolic compounds, antioxidant
capacity, enzyme activity and microstructure of cacao pod husks (Theobroma cacao L.)
Innovative Food Science & Emerging Technologies 41, 378–386.
Velioglu, Y.S, Mazza, G., Gao, L. & Oomah, B.D. 1998. Antioxidant activity and total phenolics
in selected fruits, vegetables, and grain products. Journal of Agricultural and Food
Chemistry 46(10), 4113–4117.
Yanishlieva-Maslarova, N.V. & Heinonen, I.M. 2001. Sources of natural antioxidants:
vegetables, fruits, herbs, spices and teas. In J. Pokorny, N. Yanishlieva & M. Gordon (Eds.),
Antioxidants in food: Practical applications, pp. 210–266. UK: Woodhead Publishing.
Yu, L., Perret, J., Harris, M., Wilson, J. & Haley, S. 2003. Antioxidant properties of bran extracts
from ‘Akron’ wheat grown at different locations. Journal of Agricultural and Food
Chemistry 51(6), 1566–1570.
Zhao, G., Zhang, R., Liu, L., Deng, Y., Wei, Z., Zhang, Y., Ma, Y. & Zhang, M. 2017. Different
thermal drying methods affect the phenolic profiles, their bioaccessibility and antioxidant
activity in Rhodomyrtus tomentosa (Ait.) Hassk berries. LWT – Food Science and
Technology 79, 260–266.
1555
Agronomy Research 16(S2), 1555–1562, 2018
https://doi.org/10.15159/AR.18.075
A study of commercial β-galactosidase stability under simulated
in vitro gastric conditions
K. Žolnere1,*, I. Ciproviča1, A. Ķirse1 and I. Cinkmanis2
1Latvia University of Life Sciences and Technologies, Faculty of Food Technology,
Department of Food Technology, Rīgas iela 22, LV–3004 Jelgava, Latvia 2Latvia University of Life Sciences and Technologies, Faculty of Food Technology,
Department of Chemistry, Lielā iela 2, LV–3001 Jelgava, Latvia *Correspondence: [email protected]
Abstract. β-Galactosidase activity in milk may be affected by several factors, such as
temperature, pH, milk composition, and metal ions. It is important to note that digestive proteases
and gastrointestinal pH can affect enzyme activity during transit through the gastrointestinal tract.
For the investigation of commercial β-galactosidase stability in human and animal gastric tracts,
human gastrointestinal tract (GIT) models were employed, enabling prediction of enzyme activity
under in vivo conditions. The aim of this study was to analyse and compare commercial β-
galactosidase stability under simulated in vitro gastric conditions. Commercial enzymes
(Ha Lactase 5200 produced by Kluyveromyces lactis and NOLA™Fit5500 produced by
Bifidobacterium bifidum expressed in Bacillus licheniformis, Chr. Hansen, Hørsholm, Denmark;
GODO-YNL2 produced by Kluyveromyces lactis, Danisco, Copenhagen, Denmark) were used
for this study. Commercial enzymes were added to GIT models at 1 and 5 mL L–1. The enzyme
activity was assessed as the percentage of lactose hydrolysis by the enzymes from Kluyveromyces
lactis and Bacillus licheniformis using HPLC after digestion. β-Galactosidase extracted from
yeast (Kluyveromyces lactis) and bacteria (Bacillus licheniformis) was found to be effective as a
strategy for improving lactose tolerance.
Key words: β-galactosidase, simulated gastric conditions, lactose hydrolysis.
INTRODUCTION
Lactose is the major disaccharide in milk and can be hydrolysed into glucose and
galactose by β-galactosidase (Gambelli, 2017). Lactose is digested in vivo by a
membrane-bound enzyme of the small intestinal epithelial cells in the human body
(O’Connell & Walsh, 2010). Lactose is hydrolysed most slowly out of all of the dietary
sugars. The hydrolysis of lactose occurs at only half the rate of sucrose hydrolysis.
Generally, carbohydrates increase intestinal calcium absorption, and lactose, which is
predominantly present in dairy products, is the most effective calcium absorbing
carbohydrate (Pérez et al., 2008). Consumption of lactose-containing dairy products
should be minimised for individuals with lactose intolerance (Dutra Rosolen et al.,
2015). Certain ethnic and racial groups have increased propensity for β-galactosidase
deficiency in the digestive tract. Most Asians (more than 90%), Africans (80–100%),
Native Americans (more than 90%) and Southern Europeans (more than 80%) are

1556
reported to be lactose intolerant (Mlichová & Rosenberg, 2006), mainly due to a low
level of β-galactosidase in the intestinal walls.
One potential solution to the lack of this enzyme is a strategy of oral consumption
of β-galactosidase for deficient individuals whilst consuming products containing
lactose (Bosso et al., 2015). The market offers a great variety of caplets, chewable
tablets, or soft gel capsules which contain β-galactosidase that improve gastrointestinal
digestion of lactose and eliminate the symptoms caused by β-galactosidase deficiency.
The ability of β-galactosidase preparations in the gastrointestinal tract depends upon
degradation and enzyme activity under physiological conditions (Wang et al., 2009).
There are several factors which can affect activity of β-galactosidase, such as
temperature, pH, gastric enzymes, and bile acids. Furthermore, depending upon the
source of β-galactosidase extraction, the enzyme may display diverse properties in a
variety of applications (Bosso et al., 2016). Enzymes which need to be released in the
intestine, such as β-galactosidase, necessarily have to pass intact through the stomach
and need to be resistant to acidic pH in the range of 1.0 to 3.0 (Bosso et al., 2015).
Therefore, most supplemental β-galactosidase preparations are coated to prevent gastric
inactivation, and become activated in the intestine (Wang et al., 2009).
Bosso et al. (2015) have shown that A. oryzae and K. lactis β-galactosidases are
inactivated under simulated gastrointestinal digestive conditions. The enzyme from
A. oryzae was less effective for lactose hydrolysis than the enzyme from K. lactis. These
authors determined that lactose hydrolysis was over 90% with the highest concentration
of the enzyme from K. lactis at 40 °C. The highest levels of hydrolysis were at 37 °C
and at enzyme concentrations of 3 and 5 mL L–1 (Bosso et al., 2015). The principal
objective of this study was to analyse and compare commercial β-galactosidase stability
under simulated in vitro gastric condition at different concentrations.
MATERIALS AND METHODS
Β-Galactosidase resistance to inactivation was evaluated under simulated human
stomach and small intestine digestive conditions.
Chemicals
All chemicals KCl, KH2PO4, NaHCO3, NaCl, MgCl2(H2O)6, (NH4)2CO3, NaOH,
HCl, CaCl2, bile salt, porcine pepsin (EC 3.4.23.1), porcine trypsin (EC 3.4.21.4), bovine
chymotrypsin (EC 3.4.21.1), porcine pancreatic α-amylase (EC 3.2.1.1), porcine
pancreatic lipase (EC 3.1.1.3), porcine pancreatic colipase and D-lactose monohydrate,
D-(+)-glucose, D-(+)-galactose (> 98%, HPLC) were purchased from Sigma-Aldrich
(Riga, Latvia).
Commercial enzymes
Three commercial β-galactosidase preparations were used in this study:
NOLA™Fit5500 and Ha-Lactase 5200 (Chr. Hansen, Hørsholm, Denmark) and
GODO YNL2 (Danisco, Copenhagen, Denmark). NOLA™Fit5500 is a Bifidobacterium
bifidum ß-galactosidase (lactase) produced by submerged fermentation on a vegetable
substrate using a selected strain of Bacillus licheniformis kept under contained
conditions and not present in the final product (NOLA™Fit5500 Product Information,
2017). The other two enzymes are of Kluyveromyces lactis origin, GODO-YNL2 and

1557
Ha-Lactase 5200 are active at neutral condition pH 6.5–8.0 (Ha-Lactase 5200 Product
Information, 2014). NOLA™Fit5500 enzyme is active under acidic conditions
(optimum pH 5.0–7.0) according to the manufacturers’ data. GODO-YNL2 and Ha-
Lactase 5200 enzymes have an activity of 5,000 NLU (neutral lactase units) mL–1 and
5,200 NLU mL–1, respectively, and NOLA™Fit5500 has an activity of 5,500 BLU
(bifido lactase units) mL–1. All enzymes remained fully active throughout the study.
In vitro digestion of commercial β-galactosidase
Three experiments were carried out to determine the effect of simulated
gastrointestinal tract conditions on commercial GODO-YNL2 and Ha-Lactase 5200
(Kluyveromyces lactis) and NOLA™Fit5500 (Bacillus licheniformis). The modified
method of Minekus et al. (2014) for gastrointestinal incubation of β-galactosidase was
used in order to determine enzyme activity. Concentrations of gastric (SGF) and
intestinal (SIF) electrolyte stock solutions, as well as gastrointestinal enzyme activities
(U ml–1 digesta) were calculated according to the international consensus reported by
Minekus et al. (2014).
In all experiments, the enzyme concentrations were 1 and 5 mL L–1, calculated as
5,000 and 25,000 NLU mL–1 for GODO-YNL2 enzyme, 5,200 and 26,000 NLU mL–1
for Ha-Lactase 5200 enzyme, and 5,500 and 27,500 BLU mL–1 for NOLA™Fit5500
enzyme (Fig. 1).
Figure 1. Diagram of a simulated in vitro digestion system. The GIT system (static
gastrointestinal tract simulator) comprised of a single stirred tank reactor (Labfors 5, INFORS
HT, Bottmingen, Switzerland) connected to the computer and controlled by bioprocess
monitoring and control software ‘Iris 6’ (INFORS HT).
Each phase concentration/dosage of stock solution and enzyme activity were
prepared according to Minekus et al. (2014).
Gastric phase
SGF + pepsin + commercial β-galactosidase
2 h, pH 3
Intestinal phase
SIF + bile + intestinal enzymes (trypsin, chymotrypsin, pancreatic α-amylase, colipase and lipase)
2 h, pH 7
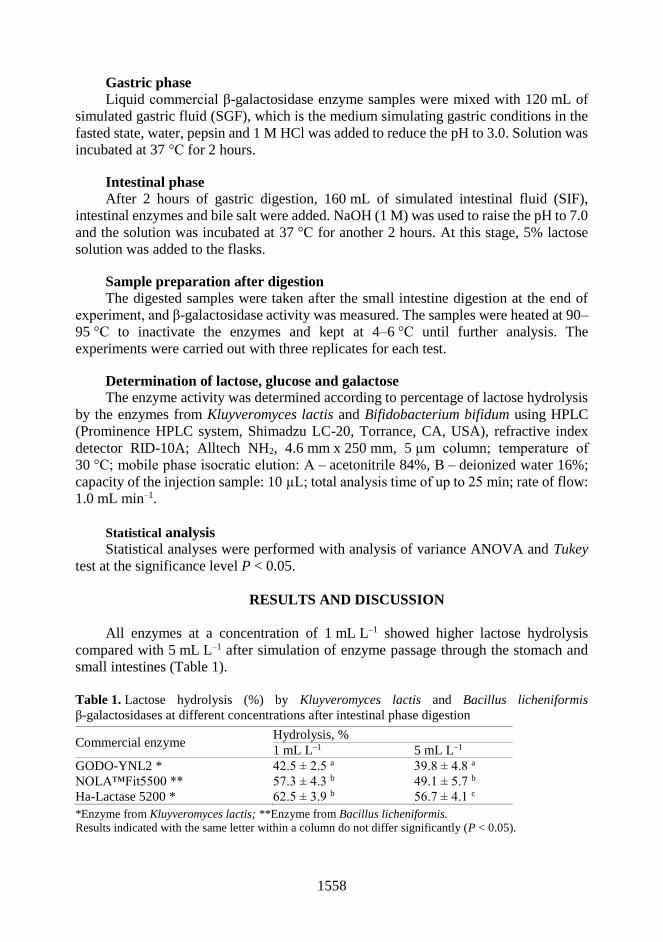
1558
Gastric phase
Liquid commercial β-galactosidase enzyme samples were mixed with 120 mL of
simulated gastric fluid (SGF), which is the medium simulating gastric conditions in the
fasted state, water, pepsin and 1 M HCl was added to reduce the pH to 3.0. Solution was
incubated at 37 °C for 2 hours.
Intestinal phase
After 2 hours of gastric digestion, 160 mL of simulated intestinal fluid (SIF),
intestinal enzymes and bile salt were added. NaOH (1 M) was used to raise the pH to 7.0
and the solution was incubated at 37 °C for another 2 hours. At this stage, 5% lactose
solution was added to the flasks.
Sample preparation after digestion
The digested samples were taken after the small intestine digestion at the end of
experiment, and β-galactosidase activity was measured. The samples were heated at 90–
95 °C to inactivate the enzymes and kept at 4–6 °C until further analysis. The
experiments were carried out with three replicates for each test.
Determination of lactose, glucose and galactose
The enzyme activity was determined according to percentage of lactose hydrolysis
by the enzymes from Kluyveromyces lactis and Bifidobacterium bifidum using HPLC
(Prominence HPLC system, Shimadzu LC-20, Torrance, CA, USA), refractive index
detector RID-10A; Alltech NH2, 4.6 mm x 250 mm, 5 µm column; temperature of
30 °C; mobile phase isocratic elution: A – acetonitrile 84%, B – deionized water 16%;
capacity of the injection sample: 10 µL; total analysis time of up to 25 min; rate of flow:
1.0 mL min–1.
Statistical analysis
Statistical analyses were performed with analysis of variance ANOVA and Tukey
test at the significance level P < 0.05.
RESULTS AND DISCUSSION
All enzymes at a concentration of 1 mL L–1 showed higher lactose hydrolysis
compared with 5 mL L–1 after simulation of enzyme passage through the stomach and
small intestines (Table 1).
Table 1. Lactose hydrolysis (%) by Kluyveromyces lactis and Bacillus licheniformis
β-galactosidases at different concentrations after intestinal phase digestion
Commercial enzyme Hydrolysis, %
1 mL L–1 5 mL L–1
GODO-YNL2 * 42.5 ± 2.5 a 39.8 ± 4.8 a
NOLA™Fit5500 ** 57.3 ± 4.3 b 49.1 ± 5.7 b
Ha-Lactase 5200 * 62.5 ± 3.9 b 56.7 ± 4.1 c
*Enzyme from Kluyveromyces lactis; **Enzyme from Bacillus licheniformis.
Results indicated with the same letter within a column do not differ significantly (P < 0.05).

1559
Results showed that there is no significant difference between commercial enzyme
concentrations (F = 11.8, P > 0.05), but in turn a significant difference between
commercial enzyme preparates within each concentration was noticed (F = 44.5,
P < 0.05).
Lactose hydrolysis was observed for all enzymes, however Ha-Lactase 5200
β-galactosidase showed greater hydrolysis for all concentrations studied. Contrary to
yeast neutral lactase, acid lactase continues to hydrolyse lactose to approximately pH 4.5
and remains active in the presence of digestive enzymes and bile acids (Selvarajan &
Mohanasrinivasan, 2015). This result can be explained by the findings of Vrese et al.
(2001) where the effect was substantiated, largely due to digestion of lactose by the
probiotic lactase activity, effectively performing the functions of a defective human
enzyme, and also due to a slower transit time of the product.
Kwak (2001) evaluated the enzyme activity of microencapsulated β-galactosidase
from K. lactis in a simulated human intestinal system (pH 7–8) and found 60.8 to 68.8%
hydrolysis after 60 min of testing. The percentages are higher than the results found in
the present study, where lactose hydrolysis up to 42.5% was obtained for GODO-YNL2
K. lactis β-galactosidase at 37 °C. However, lactose hydrolysis up to 62.5% was obtained
for Ha-Lactase 5200 K. lactis β-galactosidase indicating a stronger resistance to
digestion and higher activity of this enzyme. Lower lactose hydrolysis rates can be
explained by the temperature. A temperature of 37 °C used in the GIT is lower than the
optimal temperature of GODO-YNL2 enzyme (40 °C), but for NOLA™Fit5500 (35–
50 °C) and Ha-Lactase 5200 (35–45 °C), is within the optimal range. Furthermore,
Vidya et al. (2014) pointed out that the enzyme activity can be affected by the type of
strain, cultivation conditions (temperature, pH, aeration, agitation and incubation time)
and the growth media composition (particularly carbon and nitrogen sources). This leads
to the conclusion that commercial β-galactosidase preparations produced from the same
species, but using a different method which includes cultivation conditions and the
growth medium composition, can impact enzyme physical properties.
Kotz et al. (1994) analysed β-galactosidase activity in conventional yoghurt and
high lactase (HL) yoghurt during 60 min incubation at 37 °C and pH 3.5. The
β-galactosidase in HL yoghurt was much less acid resistant than was the β-galactosidase
in conventional yoghurt, likely due to the deactivation of β-galactosidase in the human
gastrointestinal system. The authors assumed that β-galactosidase at high concentrations
and at low pH is more sensitive to denaturation, and the dose of the enzyme is one of the
factors which can impact degree of hydrolysis.
The results show that the highest degree of hydrolysis can be obtained using a β–
galactosidase concentration of 1 mL L–1 (Fig. 2), rather than 5 mL L–1 (Fig. 3). The
method used in this study was based on the proportions between the intake of food,
digestive enzymes, and stock solution. This indicates that low concentrations of enzymes
have a greater chance of maintaining activity by dissolving in a fermentable
environment.
Metal ions can affect enzyme activity. For the yeast β-galactosidase which is
isolated from Kluyveromyces lactis K+ and Mg2+ worked as activators, whereas Ca2+ and
Na+ worked as inhibitors; for β-galactosidase from Bacillus licheniformis Ca2+, Mn2+, and
Mg2+ were activators, while Cu2+, Zn2+, and Fe2+ were inhibitors (Zolnere, Liepins, &
Ciprovica, 2017). For preparation of stock solutions according to Minekus (2014) a
variety of salts were added (KCl; KH2PO4; NaHCO3; NaCl; MgCl2(H2O)6; (NH4)2CO3;

1560
CaCl2) in different concentrations. This can also impact the amount of hydrolysed lactose
(Adalberto et al., 2010).
Studying kinetic parameters of β-galactosidase from Kluyveromyces lactis Mateo
et al., 2004 found that galactose was competitive and glucose noncompetitive inhibitor.
Juajun et al. 2011 analysed bioconversion of lactose using β-galactosidase from Bacillus
licheniformis, and the results showed that mainly D-galactose is an inhibitor.
Transgalactosylation is the reaction by which the enzyme β-galactosidase
hydrolyzes lactose and transfers galactose to another carbohydrate, forming
galactooligosaccharides (Otieno, 2010). Such reactions may explain why glucose and
galactose concentrations are not equal upon lactose hydrolysis (Figs 2, 3).
Figure 2. Sugars remaining after hydrolysis of an initial amount of 12.50 g in the GIT by
Kluyveromyces lactis and Bacillus licheniformis commercial β-galactosidases at a concentration
of 1 mL L–1.
Figure 3. Sugars remaining after hydrolysis of an initial amount of 12.50 g in the GIT by
Kluyveromyces lactis and Bacillus licheniformis commercial β-galactosidases at a concentration
of 5 mL L–1.
0
1
2
3
4
5
6
7
8
9
GODO-YNL2 NOLA™Fit5500 Ha-Lactase 5200
g L
-1
Lactose Glucose Galactose
0
1
2
3
4
5
6
7
8
9
GODO-YNL2 NOLA™Fit5500 Ha-Lactase 5200
g L
-1
Lactose Glucose Galactose
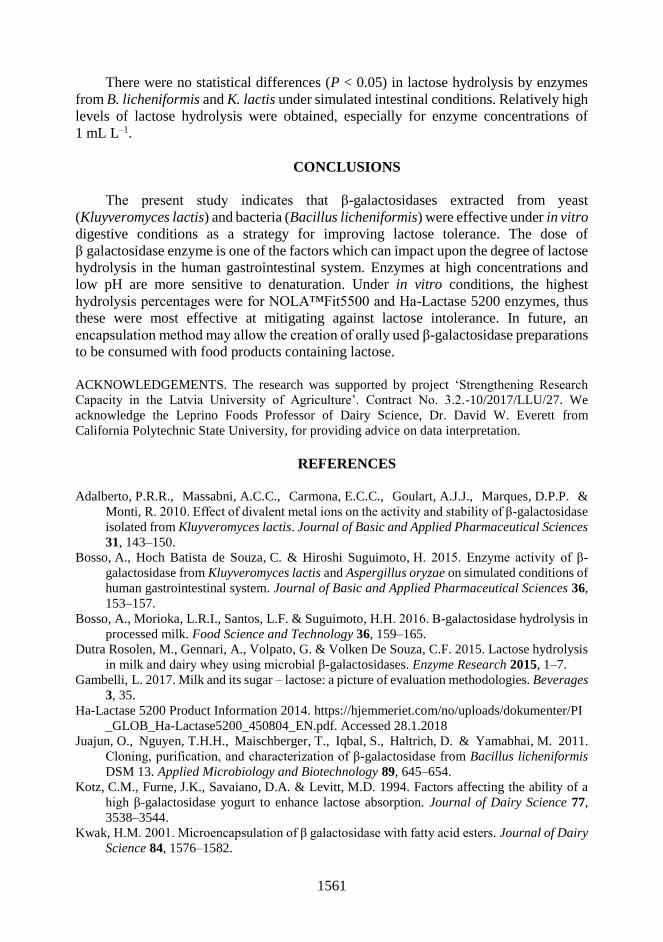
1561
There were no statistical differences (P < 0.05) in lactose hydrolysis by enzymes
from B. licheniformis and K. lactis under simulated intestinal conditions. Relatively high
levels of lactose hydrolysis were obtained, especially for enzyme concentrations of
1 mL L–1.
CONCLUSIONS
The present study indicates that β-galactosidases extracted from yeast
(Kluyveromyces lactis) and bacteria (Bacillus licheniformis) were effective under in vitro
digestive conditions as a strategy for improving lactose tolerance. The dose of
β galactosidase enzyme is one of the factors which can impact upon the degree of lactose
hydrolysis in the human gastrointestinal system. Enzymes at high concentrations and
low pH are more sensitive to denaturation. Under in vitro conditions, the highest
hydrolysis percentages were for NOLA™Fit5500 and Ha-Lactase 5200 enzymes, thus
these were most effective at mitigating against lactose intolerance. In future, an
encapsulation method may allow the creation of orally used β-galactosidase preparations
to be consumed with food products containing lactose.
ACKNOWLEDGEMENTS. The research was supported by project ‘Strengthening Research
Capacity in the Latvia University of Agriculture’. Contract No. 3.2.-10/2017/LLU/27. We
acknowledge the Leprino Foods Professor of Dairy Science, Dr. David W. Everett from
California Polytechnic State University, for providing advice on data interpretation.
REFERENCES
Adalberto, P.R.R., Massabni, A.C.C., Carmona, E.C.C., Goulart, A.J.J., Marques, D.P.P. &
Monti, R. 2010. Effect of divalent metal ions on the activity and stability of β-galactosidase
isolated from Kluyveromyces lactis. Journal of Basic and Applied Pharmaceutical Sciences
31, 143–150.
Bosso, A., Hoch Batista de Souza, C. & Hiroshi Suguimoto, H. 2015. Enzyme activity of β-
galactosidase from Kluyveromyces lactis and Aspergillus oryzae on simulated conditions of
human gastrointestinal system. Journal of Basic and Applied Pharmaceutical Sciences 36,
153–157.
Bosso, A., Morioka, L.R.I., Santos, L.F. & Suguimoto, H.H. 2016. Β-galactosidase hydrolysis in
processed milk. Food Science and Technology 36, 159–165.
Dutra Rosolen, M., Gennari, A., Volpato, G. & Volken De Souza, C.F. 2015. Lactose hydrolysis
in milk and dairy whey using microbial β-galactosidases. Enzyme Research 2015, 1–7.
Gambelli, L. 2017. Milk and its sugar – lactose: a picture of evaluation methodologies. Beverages
3, 35.
Ha-Lactase 5200 Product Information 2014. https://hjemmeriet.com/no/uploads/dokumenter/PI
_GLOB_Ha-Lactase5200_450804_EN.pdf. Accessed 28.1.2018
Juajun, O., Nguyen, T.H.H., Maischberger, T., Iqbal, S., Haltrich, D. & Yamabhai, M. 2011.
Cloning, purification, and characterization of β-galactosidase from Bacillus licheniformis
DSM 13. Applied Microbiology and Biotechnology 89, 645–654.
Kotz, C.M., Furne, J.K., Savaiano, D.A. & Levitt, M.D. 1994. Factors affecting the ability of a
high β-galactosidase yogurt to enhance lactose absorption. Journal of Dairy Science 77,
3538–3544.
Kwak, H.M. 2001. Microencapsulation of β galactosidase with fatty acid esters. Journal of Dairy
Science 84, 1576–1582.

1562
Mateo, C., Monti, R., Pessela, B.C.C., Fuentes, M., Torres, R., Guisan, J.M. & Fernandez-
Lafuente, R. 2004. Immobilization of lactase from Kluyveromyces lactis greatly reduces the
inhibition promoted by glucose. Full Hydrolysis of Lactose in Milk. Biotechnology
Progress 20, 1259–1262.
Minekus, M., Alminger, M., Alvito, P, Balance, S., Bohn, T., Bourlieu, C., Carrière, F.,
Boutrou, R., Corredig, M., Dupont, D., Dufour, C., Egger, L., Golding, M., Karakaya, S.,
Kirkhus, B., Le Feunteun, S., Lesmes, U., Macierzanka, A., Mackie, A., Marze, S.,
McClements, D.J., Ménard, O., Recio, I., Santos, C.N., Singh, R.P., Vegarud, G.E.,
Wickham, M.S., Weitschies, W. & Brodkorb, A. 2014. A standardised static in vitro
digestion method suitable for food – an international consensus. Food and Function 5,
1113–1124.
Mlichová, Z. & Rosenberg, M. 2006. Current trends of β-galactosidase application in food
technology. Journal of Food and Nutrition Research 45, 47–54.
NOLA™Fit5500 Product Information 2017. https://hjemmeriet.com/da/ChrHansen/Products/N
OLA-Fit/PI_GLOB_NOLA_Fit5500_350502_EN.pdf. Accessed 28.1.2018
O’Connell, S. & Walsh, G. 2010. A novel acid-stable, acid-active β-galactosidase potentially
suited to the alleviation of lactose intolerance. Applied Microbiology and Biotechnology 86,
517–524.
Otieno, D.O. 2010. Synthesis of β-Galactooligosaccharides from Lactose Using Microbial
β-Galactosidases. Comprehensive Reviews in Food Science and Food Safety 9, 471–482.
Pérez, A.V., Picotto, G., Carpentieri, A.R., Rivoira, M.A., Peralta, L.M.E. & Tolosa de
Talamoni, N.G. 2008. Minireview on regulation of intestinal calcium absorption. Digestion
77, 22–34.
Selvarajan, E. & Mohanasrinivasan, V. 2015. Kinetic studies on exploring lactose hydrolysis
potential of β galactosidase extracted from Lactobacillus plantarum HF571129. Journal of
Food Science and Technology 52, 6206–6217.
Vrese, M., Stegelmann, A., Richter, B., Fenselau, S., Laue, C. & Schrezenmeir, J. 2001.
Probiotics – compensation for lactase insufficiency. American Journal of Clinical Nutrition
73, 421–429.
Wang, H., Luo, H., Bai, Y., Wang, Y., Yang, P., Shi, P. & Fan, Y. 2009. An acidophilic
β-galactosidase from Bispora sp. MEY–1 with high lactose hydrolytic activity under
simulated gastric conditions. Journal of Agricultural and Food Chemistry 57, 5535–5541.
Vidya, B., Palaniswamy, M. & Gopalakrishnan, V.K. 2014. Screening and optimization of
β-galactosidase from fungal strains by using agro residues. World Journal of Pharmacy and
Pharmaceutical Sciences 3, 1809–1821.
Zolnere, K., Liepins, J. & Ciprovica, I. 2017. The impact of calcium ions on commercially
available β-galactosidase. In E. Straumite (Ed.), 11th Baltic Conference on Food Science
and Technology ‘Food science and technology in a changing world’ FOODBALT 2017
Conference, Jelgava, pp. 27–30.
1563
INSTRUCTIONS TO AUTHORS
Papers must be in English (British spelling). English will be revised by a proofreader, but authors
are strongly urged to have their manuscripts reviewed linguistically prior to submission.
Contributions should be sent electronically. Papers are considered by referees before acceptance.
The manuscript should follow the instructions below.
Structure: Title, Authors (initials & surname; an asterisk indicates the corresponding author),
Authors’ affiliation with postal address (each on a separate line) and e-mail of the corresponding
author, Abstract (up to 250 words), Key words (not repeating words in the title), Introduction,
Materials and methods, Results and discussion, Conclusions, Acknowledgements (optional),
References.
Layout, page size and font
Use preferably the latest version of Microsoft Word, doc., docx. format.
Set page size to B5 Envelope or ISO B5 (17.6 x 25 cm), all margins at 2 cm.
Use single line spacing and justify the text. Do not use page numbering. Use indent 0.8 cm
(do not use tab or spaces instead).
Use font Times New Roman, point size for the title of article 14 (Bold), author's names
12, core text 11; Abstract, Key words, Acknowledgements, References, tables and figure
captions 10.
Use italics for Latin biological names, mathematical variables and statistical terms.
Use single (‘…’) instead of double quotation marks (“…”).
Tables
All tables must be referred to in the text (Table 1; Tables 1, 3; Tables 2–3).
Use font Times New Roman, regular, 10 pt. Insert tables by Word's ‘Insert’ menu.
Do not use vertical lines as dividers; only horizontal lines (1/2 pt) are allowed. Primary
column and row headings should start with an initial capital.
Figures
All figures must be referred to in the text (Fig. 1; Fig. 1 A; Figs 1, 3; Figs 1–3). Use only
black and white or greyscale for figures. Avoid 3D charts, background shading, gridlines
and excessive symbols. Use font Arial within the figures. Make sure that thickness of the
lines is greater than 0.3 pt.
Do not put caption in the frame of the figure.
The preferred graphic format is EPS; for half-tones please use TIFF. MS Office files are
also acceptable. Please include these files in your submission.
Check and double-check spelling in figures and graphs. Proof-readers may not be able to
change mistakes in a different program.
References
Within the text
In case of two authors, use ‘&’, if more than two authors, provide first author ‘et al.’:
Smith & Jones (1996); (Smith & Jones, 1996);
Brown et al. (1997); (Brown et al., 1997)
1564
When referring to more than one publication, arrange them by following keys: 1. year of
publication (ascending), 2. alphabetical order for the same year of publication:
(Smith & Jones, 1996; Brown et al., 1997; Adams, 1998; Smith, 1998)
For whole books
Name(s) and initials of the author(s). Year of publication. Title of the book (in italics). Publisher,
place of publication, number of pages.
Shiyatov, S.G. 1986. Dendrochronology of the upper timberline in the Urals. Nauka, Moscow,
350 pp. (in Russian).
For articles in a journal
Name(s) and initials of the author(s). Year of publication. Title of the article.
Abbreviated journal title (in italic) volume (in bold), page numbers.
Titles of papers published in languages other than English, German, French, Italian,
Spanish, and Portuguese should be replaced by an English translation, with an explanatory note
at the end, e.g., (in Russian, English abstr.).
Karube, I. & Tamiyra, M.Y. 1987. Biosensors for environmental control. Pure Appl. Chem. 59,
545–554.
Frey, R. 1958. Zur Kenntnis der Diptera brachycera p.p. der Kapverdischen Inseln.
Commentat.Biol. 18(4), 1–61.
Danielyan, S.G. & Nabaldiyan, K.M. 1971. The causal agents of meloids in bees. Veterinariya 8,
64–65 (in Russian).
For articles in collections:
Name(s) and initials of the author(s). Year of publication. Title of the article. Name(s) and initials
of the editor(s) (preceded by In:) Title of the collection (in italics), publisher, place of publication,
page numbers.
Yurtsev, B.A., Tolmachev, A.I. & Rebristaya, O.V. 1978. The floristic delimitation and
subdivisions of the Arctic. In: Yurtsev, B. A. (ed.) The Arctic Floristic Region. Nauka,
Leningrad, pp. 9–104 (in Russian).
For conference proceedings:
Name(s) and initials of the author(s). Year of publication. Name(s) and initials of the editor(s)
(preceded by In:) Proceedings name (in italics), publisher, place of publishing, page numbers.
Ritchie, M.E. & Olff, H. 1999. Herbivore diversity and plant dynamics: compensatory and
additive effects. In: Olff, H., Brown, V.K. & Drent R.H. (eds) Herbivores between plants
and predators. Proc. Int. Conf. The 38th Symposium of the British Ecological Society,
Blackwell Science, Oxford, UK, pp. 175–204.
Please note
Use ‘.’ (not ‘,’) for decimal point: 0.6 0.2; Use ‘,’ for thousands – 1,230.4;
Use ‘–’ (not ‘-’) and without space: pp. 27–36, 1998–2000, 4–6 min, 3–5 kg
With spaces: 5 h, 5 kg, 5 m, 5°C, C : D = 0.6 0.2; p < 0.001
Without space: 55°, 5% (not 55 °, 5 %)
Use ‘kg ha–1’ (not ‘kg/ha’);
Use degree sign ‘ ° ’ : 5 °C (not 5 O C).