Petrou2012.pdf - Edinburgh Research Archive
151
This thesis has been submitted in fulfilment of the requirements for a postgraduate degree (e.g. PhD, MPhil, DClinPsychol) at the University of Edinburgh. Please note the following terms and conditions of use: • This work is protected by copyright and other intellectual property rights, which are retained by the thesis author, unless otherwise stated. • A copy can be downloaded for personal non-commercial research or study, without prior permission or charge. • This thesis cannot be reproduced or quoted extensively from without first obtaining permission in writing from the author. • The content must not be changed in any way or sold commercially in any format or medium without the formal permission of the author. • When referring to this work, full bibliographic details including the author, title, awarding institution and date of the thesis must be given.
-
Upload
khangminh22 -
Category
Documents
-
view
1 -
download
0
Transcript of Petrou2012.pdf - Edinburgh Research Archive

This thesis has been submitted in fulfilment of the requirements for a postgraduate degree
(e.g. PhD, MPhil, DClinPsychol) at the University of Edinburgh. Please note the following
terms and conditions of use:
• This work is protected by copyright and other intellectual property rights, which are
retained by the thesis author, unless otherwise stated.
• A copy can be downloaded for personal non-commercial research or study, without
prior permission or charge.
• This thesis cannot be reproduced or quoted extensively from without first obtaining
permission in writing from the author.
• The content must not be changed in any way or sold commercially in any format or
medium without the formal permission of the author.
• When referring to this work, full bibliographic details including the author, title,
awarding institution and date of the thesis must be given.

Kinematics of Cricket Phonotaxis
Georgios PetrouT
HE
U N I V E RS
IT
Y
OF
ED I N B U
RG
H
Doctor of Philosophy
Institute of Perception, Action and Behaviour
School of Informatics
University of Edinburgh
2012


Abstract
Male crickets produce a species specific song to attract females which in response
move towards the sound source. This behaviour, termed phonotaxis, has been the sub-
ject of many morphological, neurophysiological and behavioural studies making it one
of the most well studied examples of acoustic communicationin the animal kingdom.
Despite this fact, the precise leg movements during this behaviour is unknown. This
is of specific interest as the cricket’s ears are located on their front legs, meaning that
the perception of the sound input might change as the insect moves. This dissertation
describes a methodology and an analysis that fills this knowledge gap.
I developed a semi-automated tracking system for insect motion based on com-
mercially available high-speed video cameras and freely available software. I used it
to collect detailed three dimensional kinematic information from female crickets per-
forming free walking phonotaxis towards a calling song stimulus. I marked the insect’s
joints with small dots of paint and recorded the movements from underneath with a pair
of cameras following the insect as it walks on the transparent floor of an arena. Track-
ing is done offline, utilizing a kinematic model to constrainthe processing. I obtained,
for the first time, the positions and angles of all joints of all legs and six additional
body joints, synchronised with stance-swing transitions and the sound pattern, at a 300
Hz frame rate.
I then analysed this data based on four categories: The single leg motion analysis
revealed the importance of the thoraco-coxal (ThC) and body joints in the movement
of the insect. Furthermore the inside middle leg’s tibio-tarsal (TiTa) joint was the cen-
tre of the rotation during turning. Certain joints appear to be the most crucial ones for
the transition from straight walking to turning. The leg coordination analysis revealed
the patterns followed during straight walking and turning.Furthermore, some leg com-
binations cannot be explained by current coordination rules. The angles relative to the
active speaker revealed the deviation of the crickets as they followed a meandering
course towards it. The estimation of ears’ input revealed the differences between the
two sides as the insect performed phonotaxis by using a simple algorithm. In general,
the results reveal both similarities and differences with other cricket studies and other
insects such as cockroaches and stick insects.
The work presented herein advances the current knowledge oncricket phonotactic
behaviour and will be used in the further development of models of neural control of
phonotaxis.
iii

AcknowledgementsFirst and foremost, I would like to thank my supervisor Barbara Webb for her guid-
ance, support and encouragement throughout this project. Iwould like to thank her
especially for her patience and understanding during the last months of my studies
and for letting me work on the stick insect robot. I would alsolike to thank my sec-
ond supervisor Berthold Hedwig for valuable comments and helpful suggestions. My
visit to his lab during my first year has inspired many of the ideas presented herein.
I would like to thank the third member of my committee Subramanian Ramamoorthy
for always asking the right questions.
I would like to thank my examiners Jeremy Niven and Taku Komura for their sug-
gestions and comments to improve this thesis.
I would like to thank the Informatics technicians Hugh Cameron, Douglas Howie,
Gilbert Inkster and Robert MacGregor for constructing most parts of the experimental
setup and for all their help to make the rest of my crazy ideas come true. Addition-
ally, I would like to thank Robert for our collaboration on theIntelligent Autonomous
Robotics course and the stick insect project.
I would like to thank John Bender and Ty Hedrick for sharing their tracking soft-
ware. Even though I ended up using neither of them they helpedme improve my own
approach. I would like to thank OpenCV developers and community for such a great
library. I would like to thank Sergey Bochkanov the main developer of ALGLIB for
his help and for sharing his library.
I would like to thank Stefan Schoneich and Mark Payne for showing me how to
prepare the crickets for experiments.
I would like to thank Michael Mangan for proofreading this document.
I would like to thank my office mates, fellow PhD students, IPAB members for
our everyday interactions and especially iPub members for our Friday evening pub
meetings.
On a more personal note, I would like to thank my friends in Edinburgh and back
home for making these years a pleasant experience.
Finally, I would like to thank my sister Julie for taking careof our home while I
was away and my parents Ioannis and Foteini for their unconditional love and support
throughout these years.
My research was funded by the University of Edinburgh, EPSRC, the University
of Edinburgh Development Trust and was supported by the freecoffee machines in the
Informatics Forum.
iv

P.S.I feel that I should apologize for all the horrible things I did to the crickets.
Nevertheless, it was all in the name of science.
v

To my family
vi

“We hope that, when the insects take over the world, they willremember with gratitude
how we took them along on all our picnics.”
–Bill Vaughan
And forget about the experiments we did to them, I would add.
vii

Declaration
I declare that this thesis was composed by myself, that the work contained herein is
my own except where explicitly stated otherwise in the text,and that this work has not
been submitted for any other degree or professional qualification except as specified.
I confirm that the work submitted is my own, except where work which has formed
part of jointly-authored publications has been included. My contribution and the other
authors to this work has been explicitly indicated below. I confirm that appropriate
credit has been given within the thesis where reference has been made to the work of
others.
(Georgios Petrou)
Chapter 3 is based on work from the following jointly-authored publication:
Petrou, G., Webb, B., Detailed tracking of body and leg movements of a freely walk-
ing female cricket during phonotaxis. Journal of Neuroscience Methods, 203(1):56-68.
I conceived, designed and performed the experiments, wrotethe software and analysed
the data. Most of the technical work was done by Hugh Cameron, Douglas Howie,
Gilbert Inkster and Robert MacGregor and the rest by me. I wrote the paper with
Barbara Webb and we corrected it based on recommendations from two anonymous
reviewers.
viii
Table of Contents
1 Introduction 1
1.1 Research Aims . . . . . . . . . . . . . . . . . . . . . . . . . . . . . 2
1.2 Thesis Outline . . . . . . . . . . . . . . . . . . . . . . . . . . . . . . 3
2 Background 5
2.1 Introduction . . . . . . . . . . . . . . . . . . . . . . . . . . . . . . . 5
2.2 Cricket Behavioural Ecology . . . . . . . . . . . . . . . . . . . . . . 5
2.2.1 Phonotaxis . . . . . . . . . . . . . . . . . . . . . . . . . . . 6
2.2.2 Calling Song . . . . . . . . . . . . . . . . . . . . . . . . . . 7
2.3 Morphology . . . . . . . . . . . . . . . . . . . . . . . . . . . . . . . 8
2.3.1 Motor System . . . . . . . . . . . . . . . . . . . . . . . . . . 9
2.3.2 Sensors . . . . . . . . . . . . . . . . . . . . . . . . . . . . . 9
2.4 Experimental Strategies . . . . . . . . . . . . . . . . . . . . . . . . . 12
2.4.1 Walking . . . . . . . . . . . . . . . . . . . . . . . . . . . . . 12
2.4.2 Phonotaxis . . . . . . . . . . . . . . . . . . . . . . . . . . . 14
2.5 Behavioural Studies . . . . . . . . . . . . . . . . . . . . . . . . . . . 15
2.5.1 Walking . . . . . . . . . . . . . . . . . . . . . . . . . . . . . 15
2.5.2 Walking During Phonotaxis . . . . . . . . . . . . . . . . . . 18
2.6 Neurophysiology . . . . . . . . . . . . . . . . . . . . . . . . . . . . 19
2.6.1 Nervous System . . . . . . . . . . . . . . . . . . . . . . . . 19
2.6.2 Local and Ascending Thoracic Auditory Neurons . . . . . .. 20
2.6.3 Local Brain Neurons . . . . . . . . . . . . . . . . . . . . . . 21
2.6.4 Descending Brain Neurons . . . . . . . . . . . . . . . . . . . 22
2.6.5 Motor neurons and Walking Interneurons . . . . . . . . . . . 23
2.7 Models and Robots . . . . . . . . . . . . . . . . . . . . . . . . . . . 25
2.7.1 Walking . . . . . . . . . . . . . . . . . . . . . . . . . . . . . 25
2.7.2 Phonotaxis . . . . . . . . . . . . . . . . . . . . . . . . . . . 29
ix

2.8 Open Questions . . . . . . . . . . . . . . . . . . . . . . . . . . . . . 30
3 Methodology 33
3.1 Introduction . . . . . . . . . . . . . . . . . . . . . . . . . . . . . . . 33
3.2 Materials and methods . . . . . . . . . . . . . . . . . . . . . . . . . 34
3.2.1 Arena . . . . . . . . . . . . . . . . . . . . . . . . . . . . . . 34
3.2.2 Animal Preparation and Experimental Protocol . . . . . .. . 36
3.2.3 Acoustic Stimulation . . . . . . . . . . . . . . . . . . . . . . 37
3.3 Software . . . . . . . . . . . . . . . . . . . . . . . . . . . . . . . . . 38
3.3.1 Calibration . . . . . . . . . . . . . . . . . . . . . . . . . . . 38
3.3.2 Kinematic Model (“Skeleton”) . . . . . . . . . . . . . . . . . 38
3.3.3 Tracker . . . . . . . . . . . . . . . . . . . . . . . . . . . . . 41
3.3.4 Grid . . . . . . . . . . . . . . . . . . . . . . . . . . . . . . . 43
3.3.5 Sound . . . . . . . . . . . . . . . . . . . . . . . . . . . . . . 44
3.3.6 Stance-Swing . . . . . . . . . . . . . . . . . . . . . . . . . . 46
3.3.7 Player . . . . . . . . . . . . . . . . . . . . . . . . . . . . . . 47
3.4 Results . . . . . . . . . . . . . . . . . . . . . . . . . . . . . . . . . . 48
4 Analysis 59
4.1 Introduction . . . . . . . . . . . . . . . . . . . . . . . . . . . . . . . 59
4.2 Single Leg and Body Angles . . . . . . . . . . . . . . . . . . . . . . 62
4.3 Leg Coordination . . . . . . . . . . . . . . . . . . . . . . . . . . . . 82
4.4 Angles Relative to Speaker . . . . . . . . . . . . . . . . . . . . . . . 85
4.5 Ears’ Input Estimation . . . . . . . . . . . . . . . . . . . . . . . . . 92
5 Discussion 103
5.1 Introduction . . . . . . . . . . . . . . . . . . . . . . . . . . . . . . . 103
5.2 Contributions . . . . . . . . . . . . . . . . . . . . . . . . . . . . . . 103
5.3 Future Research . . . . . . . . . . . . . . . . . . . . . . . . . . . . . 106
5.3.1 Experiments . . . . . . . . . . . . . . . . . . . . . . . . . . 106
5.3.2 Software . . . . . . . . . . . . . . . . . . . . . . . . . . . . 108
5.3.3 Modelling . . . . . . . . . . . . . . . . . . . . . . . . . . . . 108
5.3.4 Robot Implementation . . . . . . . . . . . . . . . . . . . . . 110
5.4 Conclusion . . . . . . . . . . . . . . . . . . . . . . . . . . . . . . . 110
Bibliography 111
x
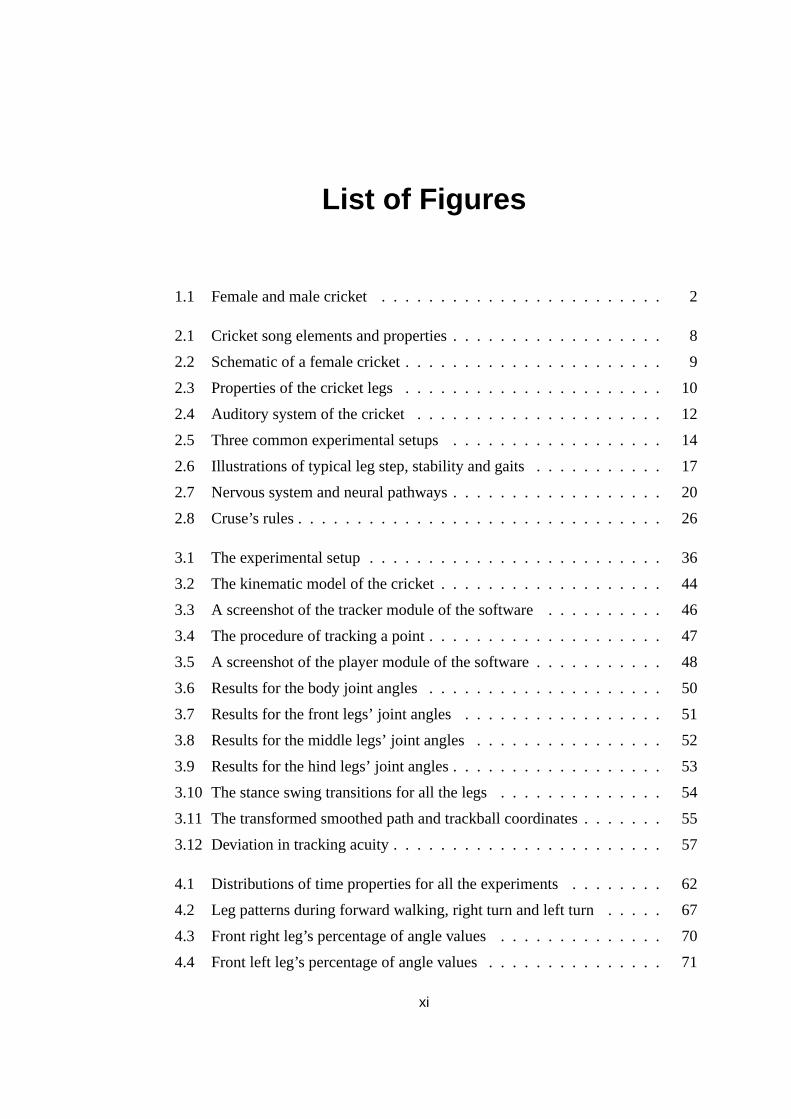
List of Figures
1.1 Female and male cricket . . . . . . . . . . . . . . . . . . . . . . . . 2
2.1 Cricket song elements and properties . . . . . . . . . . . . . . . . .. 8
2.2 Schematic of a female cricket . . . . . . . . . . . . . . . . . . . . . . 9
2.3 Properties of the cricket legs . . . . . . . . . . . . . . . . . . . . . .10
2.4 Auditory system of the cricket . . . . . . . . . . . . . . . . . . . . . 12
2.5 Three common experimental setups . . . . . . . . . . . . . . . . . . 14
2.6 Illustrations of typical leg step, stability and gaits .. . . . . . . . . . 17
2.7 Nervous system and neural pathways . . . . . . . . . . . . . . . . . .20
2.8 Cruse’s rules . . . . . . . . . . . . . . . . . . . . . . . . . . . . . . . 26
3.1 The experimental setup . . . . . . . . . . . . . . . . . . . . . . . . . 36
3.2 The kinematic model of the cricket . . . . . . . . . . . . . . . . . . .44
3.3 A screenshot of the tracker module of the software . . . . . .. . . . 46
3.4 The procedure of tracking a point . . . . . . . . . . . . . . . . . . . .47
3.5 A screenshot of the player module of the software . . . . . . .. . . . 48
3.6 Results for the body joint angles . . . . . . . . . . . . . . . . . . . . 50
3.7 Results for the front legs’ joint angles . . . . . . . . . . . . . . .. . 51
3.8 Results for the middle legs’ joint angles . . . . . . . . . . . . . .. . 52
3.9 Results for the hind legs’ joint angles . . . . . . . . . . . . . . . .. . 53
3.10 The stance swing transitions for all the legs . . . . . . . . .. . . . . 54
3.11 The transformed smoothed path and trackball coordinates . . . . . . . 55
3.12 Deviation in tracking acuity . . . . . . . . . . . . . . . . . . . . . .. 57
4.1 Distributions of time properties for all the experiments . . . . . . . . 62
4.2 Leg patterns during forward walking, right turn and leftturn . . . . . 67
4.3 Front right leg’s percentage of angle values . . . . . . . . . .. . . . 70
4.4 Front left leg’s percentage of angle values . . . . . . . . . . .. . . . 71
xi

4.5 Middle right leg’s percentage of angle values . . . . . . . . .. . . . 72
4.6 Middle left leg’s percentage of angle values . . . . . . . . . .. . . . 73
4.7 Hind right leg’s percentage of angle values . . . . . . . . . . .. . . . 74
4.8 Hind left leg’s percentage of angle values . . . . . . . . . . . .. . . 75
4.9 Front right leg’s percentage of body’s angle values . . . .. . . . . . 76
4.10 Front left leg’s percentage of body’s angle values . . . .. . . . . . . 77
4.11 Front right leg joints’ inside and outside turns contributions. . . . . . 79
4.12 Middle right leg joints’ inside and outside turns contributions. . . . . 80
4.13 Hind right leg joints’ inside and outside turns contributions. . . . . . . 81
4.14 Stepping combinations during forward walking, right turn and left turn 83
4.15 Examples of angles between the ears and the speakers . . .. . . . . . 89
4.16 Summary of the angles of interest relative to the speakers . . . . . . . 90
4.17 Angles before change of direction during forward walking . . . . . . 91
4.18 Simulation of sound directionality for a stationary cricket . . . . . . . 96
4.19 Single step cycle decibel difference . . . . . . . . . . . . . . .. . . . 97
4.20 Single step cycle decibel difference . . . . . . . . . . . . . . .. . . . 98
4.21 Examples of ear’s input estimation . . . . . . . . . . . . . . . . .. . 99
4.22 Example of ear’s input estimation during turn . . . . . . . .. . . . . 100
4.23 Decibel values in the angles peaks before change of direction during
forward walking . . . . . . . . . . . . . . . . . . . . . . . . . . . . . 101
xii

List of Tables
3.1 Model joint and segments with parameters and limits . . . .. . . . . 45
4.1 Time properties for all the experiments . . . . . . . . . . . . . .. . . 61
4.2 Step distances covered during swing . . . . . . . . . . . . . . . . .. 64
4.3 Step distances covered during swing in trackball . . . . . .. . . . . . 64
4.4 Number of swings, mean values and standard deviations ofswing du-
ration . . . . . . . . . . . . . . . . . . . . . . . . . . . . . . . . . . 65
4.5 Ratio of protraction / retraction . . . . . . . . . . . . . . . . . . . .. 65
4.6 Total number and probability of next steps during forward walking . . 84
4.7 Total number and probability of next steps during right turn . . . . . . 84
4.8 Total number and probability of next steps during left turn . . . . . . 85
4.9 Angles properties for all the experiments . . . . . . . . . . . .. . . . 88
4.10 Average lengths of body and leg segments . . . . . . . . . . . . .. . 93
4.11 Stationary cricket joints and segment parameter values . . . . . . . . 94
4.12 Transmission gains and internal delays of the four sound inputs . . . . 94
xiii

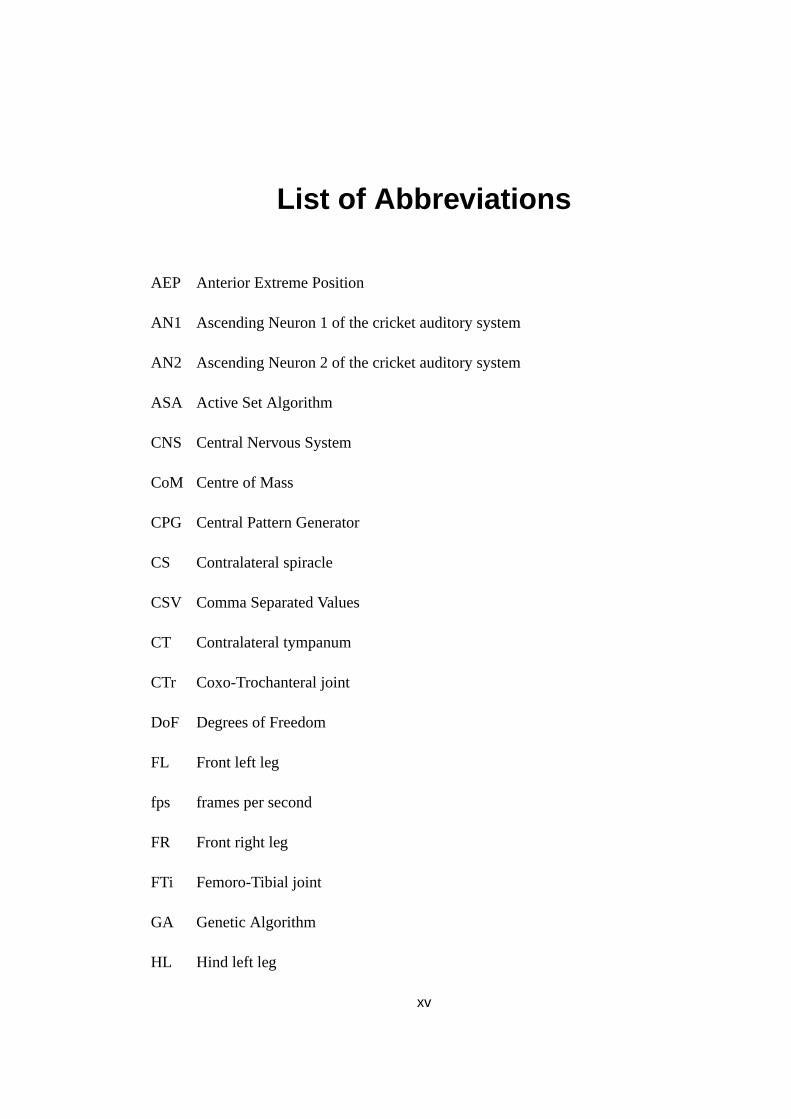
List of Abbreviations
AEP Anterior Extreme Position
AN1 Ascending Neuron 1 of the cricket auditory system
AN2 Ascending Neuron 2 of the cricket auditory system
ASA Active Set Algorithm
CNS Central Nervous System
CoM Centre of Mass
CPG Central Pattern Generator
CS Contralateral spiracle
CSV Comma Separated Values
CT Contralateral tympanum
CTr Coxo-Trochanteral joint
DoF Degrees of Freedom
FL Front left leg
fps frames per second
FR Front right leg
FTi Femoro-Tibial joint
GA Genetic Algorithm
HL Hind left leg
xv

HR Hind right leg
IS Ipsilateral spiracle
IT Ipsilateral tympanum
LED Light Emitting Diode
MDF Medium density fibreboard
ML Middle left leg
MR Middle right leg
ON1 Omega Neuron 1 of the cricket auditory system
ON2 Omega Neuron 2 of the cricket auditory system
PEP Posterior Extreme Position
RMS Root mean square
SD Standard Deviation
SRI Syllable Repetition Interval
ThC Thoraco-Coxal joint
TiTa Tibio-Tarsal joint
TrF Trochanteral-Femoro joint
XML Extensible Markup Language
xvi
Chapter 1
Introduction
Insects combine remarkable locomotion abilities with a variety of exceptional sens-
ing capabilities. Think for example of the speed of a runningcockroach (Delcomyn,
1971), the height and distance a locust jumps (Bennet-Clark, 1975), the moth’s sense
of smell (Kennedy and Marsh, 1974) and the visual response offlies (Autrum, 1958).
With less than one million neurons (compared to billions of neurons in mammals) in-
sects exhibit a wide variety of behaviours such as communication (Von Frisch, 1967),
nest building (Franks et al., 1992) and prey pursuit (Olberget al., 2000). Their com-
paratively small nervous system allows the identification of specific neurons related to
a behaviour and model entire circuits. Additionally, they have more stereotyped be-
haviours than vertebrates, making experiments easier to reproduce (Maye et al., 2007).
Finally, techniques such as amputations can be employed, which are considered uneth-
ical on other animals.
All these features have attracted the attention of scientists from different fields such
as biologists and engineers. Some insects are more specialised in particular behaviours
and therefore are preferred for the relevant studies. For instance, ants and bees in navi-
gation (Wehner, 2003; Srinivasan et al., 2000), crickets for sound communication (Hu-
ber and Thorson, 1985), cockroaches and stick insects for walking (Mu and Ritzmann,
2005; Cruse and Bartling, 1995) and locusts for jumping (Heitler and Burrows, 1977).
Studies usually focus either on the sensor processing or themotor output. But how
does an insect convert a sensory input to motor output in order to produce a specific
behaviour? And how does the motor output affect the sensor input in return? These
two fundamental questions are the main motivation behind this study. To address these
questions I conducted a behavioural investigation on the acoustic communication of
crickets (figure 1.1), in which the precise details of leg andbody motion in response to
1

2 Chapter 1. Introduction
sound were tracked.
It has been almost a century since Regen (1913) by using a telephone, proved that
the auditory communication between a male and a female cricket is independent of
visual, olfactory and tactile stimulus. Female crickets are able to recognise the singing
patterns of conspecific males and move towards them. This behaviour is one of the
most well studied processes of auditory communication in the animal kingdom, in-
cluding behavioural experimentse.g. Bailey and Thomson (1977), neuron recordings
e.g. Boyan (1980) or bothe.g. Staudacher and Schildberger (1998). Most research
has focused on the sound processing and the walking direction but not the movements
of the legs. Yet leg movement is doubly interesting in this behaviour, not only as
the mechanism by which directional changes are actuated, but also as the location of
the cricket’s auditory organs on their forelegs, the perception of sound is directly in-
fluenced by walking. Current information available about theleg movements during
phonotaxis is limited to the description of the walking patterns (Murphey and Zaret-
sky, 1972), limited joint movement information (Baden and Hedwig, 2008) and tarsi
positions (Witney and Hedwig, 2011).
Figure 1.1: Female (left) and male (right) cricket. Photo taken by Hugh Pastoll.
1.1 Research Aims
Current information on cricket’s leg movements during phonotaxis is far from com-
plete. The purpose of this work is to contribute towards the understanding of the in-
teraction between auditory perception and motor action in crickets and the phonotactic

1.2. Thesis Outline 3
behaviour in general. More specifically the goals of this dissertation are:
• To conduct behavioural experiments on female crickets while they perform free
walking phonotaxis and obtain more detailed kinematic information. For this
purpose a new tracking methodology is devised, implementedand assessed.
• Analyse the data obtained for the individual joint, leg and body movements of
the insect. Compare the results with previous studies and other insects.
• Estimate the auditory input that the insect receives duringphonotaxis.
1.2 Thesis Outline
The rest of this dissertation is divided into four chapters:
Chapter 2 surveys the current literature by incorporating the current knowledge on
the morphology, methodology, neurophysiology and modelling aspects of phonotactic
and walking behaviour, mainly for the crickets but also other insects.
Chapter 3 describes the methodology followed to investigatethe auditory-motor
interaction. A new type of arena was created along with custom made circuitry aug-
menting commercially available high speed cameras.
Chapter 4 presents an analysis based on collected data following the proposed
methodology. The analysis covers joint, leg and body movements, leg coordination,
angles relative to the sound source and an estimation of the ears input and the effect on
the movements of the insects.
Chapter 5 concludes the thesis by summarizing the results andpresenting future
work aspects regarding improvements on the methodology, further experimentation
and modelling of the behaviour in simulations and robotic platforms.

Chapter 2
Background
2.1 Introduction
In the previous chapter, I briefly introduced the subject andthe goals of this disser-
tation. In this chapter, I review the relevant background information to this study,
with a particular focus on the cricket literature. When necessary, I will incorporate
knowledge from other insects, especially regarding walking. I begin by introducing
the cricket species I will concentrate on, its key features and explain basic concepts of
phonotactic behaviour including information about the song used for communication
(section 2.2). Then, I describe the basic morphology of the insect incorporating its
motor system and various sensors, including its auditory system (section 2.3). Next,
I present the different experimental strategies used to study walking and phonotaxis
(section 2.4) and I include the current knowledge of the aforementioned behaviours
(section 2.5). Then, I summarize the basic neurophysiologyinformation with respect
to the location and function of the neurons (section 2.6). Next, I refer to models and
robots based on insect walking and phonotaxis (section 2.7). Finally, I conclude this
chapter by summarising the open questions derived from the current literature (section
2.8).
2.2 Cricket Behavioural Ecology
Crickets belong to the order of Orthopteran insects, which also encompasses katydids,
grasshoppers and locusts. There are more than 2600 species,many of them nocturnal,
living in a variety of habitats (Walker and Masaki, 1989). For instance, field crickets
live on the ground, under rocks and burrows and mole cricketslive underground in
5

6 Chapter 2. Background
tunnels that they construct. In contrast to locusts they prefer to walk rather than jump
and despite the fact that they have wings, most of them are notable to fly.
Many species of Orthoptera, including crickets, have the ability to generate sounds
by rubbing together certain hard body parts. This process ofsound production is
termed stridulation. Male crickets produce sounds by rubbing their two forewings
which contain rows of corrugated bumps. Only few cricket species have been investi-
gated in depth. Most of them belong to the families of field crickets, bush crickets and
mole crickets.
Adult females of the speciesGryllus bimacullatus(de Geer), which belongs to the
family of the field crickets, will be used in this study.Gryllus bimacullatus, from now
on referred to simply as the cricket, unless otherwise specified, has been the subject
of numerous behavioural and neural studies related to auditory communication (Popov
and Shuvalov, 1977; Popov et al., 1978; Selverston et al., 1985; Huber and Thorson,
1985; Stabel et al., 1989; Wendler, 1990; Michelsen et al., 1994; Poulet and Hedwig,
2005). There is also a significant amount of literature regarding behavioural and neural
data associated with walking (Laurent and Richard, 1986a,b;Bohm and Schildberger,
1992; Nishino, 2003; Witney and Hedwig, 2011), making this species a suitable organ-
ism to investigate the auditory and walking behaviour interaction.
2.2.1 Phonotaxis
Taxis is a behaviour that involves the responsive movement of an organism towards
or away from an external stimulus source (Fraenkel and Gunn,1940). Organisms that
have a paired set of sensors and move towards the most strongly stimulated side pro-
duce positive taxis. If they turn towards the less stimulated sensor they produce nega-
tive taxis. Organisms that have only one sensor, can still produce taxes by turning left
and right and measuring the different stimulus intensities. Taxes depend on a frequent
signal from the stimulus source, but they are robust compared to accurately identifying
the source and planning a path towards or away from it and alsocan deal with changes
in the position and orientation of the source. Examples of taxes include phototaxis
which involves movement in response to light stimulation, chemotaxis which involves
movement in response to chemical stimulation and thermotaxis which involves move-
ment in reponse to temprerature gradient.
The ability of an organism to approach a sound source is called positive phonotaxis
or simply phonotaxis. Female crickets approach to the male calling song is one of the

2.2. Cricket Behavioural Ecology 7
most well studied behaviours in acoustic communication andit requires pattern recog-
nition and sound localisation. Many studies have focused onaspects of this behaviour.
For example, the nervous system’s generation and control ofthe song (Kutsch and Hu-
ber, 1989), the physics of sound production (Bennet-Clark, 1989) and the tracking of
the song by the female (Weber and Thorson, 1989).
2.2.2 Calling Song
Males of most species can produce more than one type of song. These are mainly the
calling song, which is used to attract the females from a longdistance, a courtship song
which is used when the female is in a close proximity (when other kind of cues such
as tactile, vision and chemosensory stimuli play an important role) and an aggressive
song used to establish territory and signal possible combatwith other males. The
calling song is the most studied and the one of interest to this study.
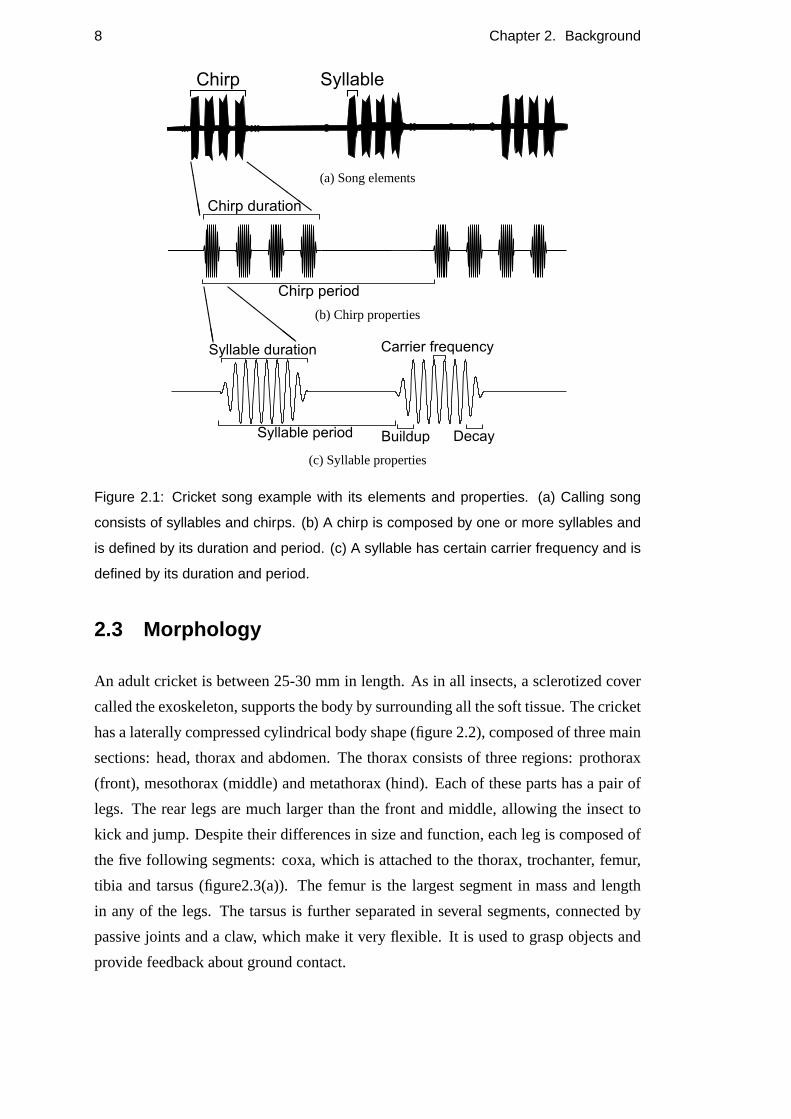
A typical pattern of the calling song is illustrated in figure2.1(a). It consists of short
sound pulses called syllables (figure 2.1(c)). Each syllable is produced when the male
closes its forewings, is around 16–20 ms long and has a frequency between 4.5–5.0
kHz. A group of syllables separated by a short pause is calleda chirp (figure 2.1(b)).
Every chirp contains 3–5 syllables and has 350-400 ms duration (Huber, 1960), al-
though there are significant differences between individuals of about 100 ms (Doherty,
1985). The syllable repetition interval (SRI) within a chirpis around 45 ms (Doherty,
1985). A chirp that has no pauses between syllables and continues for a prolonged
period is called a trill. Environmental factors such as temperature affect the production
of sound and therefore properties of the song. The temperature for the aforementioned
properties values was between 20-21◦C. Doherty (1985) found that the syllable period
and the chirp period are affected by temperature changes. Incontrast, the number of
syllables, the syllable period and the carrier frequency were relatively unaffected.
Crickets do not live isolated in their environments. Sounds from other insects and
other species are present in their daily lives. In order to beable to successfully locate
the males of their species, the females must recognise the unique properties of their
calling song. Some of the parameters of the song are crucial for this process. The
syllable period has been found to be the most important (Thorson et al., 1982). Other
parameters such as the syllable duration, the chirp interval and the number of syllables
contribute to the attractiveness of the song (Popov and Shuvalov, 1977; Doherty, 1985;
Stout and McGhee, 1988).
8 Chapter 2. Background
EEEEE
ZZZ
ZZ
(a) Song elements
EEEEE
cccc
cc
(b) Chirp properties
(c) Syllable properties
Figure 2.1: Cricket song example with its elements and properties. (a) Calling song
consists of syllables and chirps. (b) A chirp is composed by one or more syllables and
is defined by its duration and period. (c) A syllable has certain carrier frequency and is
defined by its duration and period.
2.3 Morphology
An adult cricket is between 25-30 mm in length. As in all insects, a sclerotized cover
called the exoskeleton, supports the body by surrounding all the soft tissue. The cricket
has a laterally compressed cylindrical body shape (figure 2.2), composed of three main
sections: head, thorax and abdomen. The thorax consists of three regions: prothorax
(front), mesothorax (middle) and metathorax (hind). Each of these parts has a pair of
legs. The rear legs are much larger than the front and middle,allowing the insect to
kick and jump. Despite their differences in size and function, each leg is composed of
the five following segments: coxa, which is attached to the thorax, trochanter, femur,
tibia and tarsus (figure2.3(a)). The femur is the largest segment in mass and length
in any of the legs. The tarsus is further separated in severalsegments, connected by
passive joints and a claw, which make it very flexible. It is used to grasp objects and
provide feedback about ground contact.

2.3. Morphology 9
Figure 2.2: Schematic of a female cricket with main parts identified. Insects have ser-
sors such as compound eyes, antennae and cerci to gather information from the envi-
ronment. Additionally to the males, the females have an ovipositor to lay eggs in the
soil.
2.3.1 Motor System
Each segment is moved by one or more pairs of antagonistic muscle groups, located in
the previous leg segment (figure 2.3(c)). Every one of these muscles is attached on one
side to a cuticular ingrowth (apodeme) and the other to the exoskeleton. The thoraco-
coxal (ThC) joint is a 3 degrees of freedom (DoF) connection, controlled by three pairs
of muscle groups (promotor-remotor, abductor-reductor and anterior-posterior rotator).
The front leg ThC joints have larger range of motion than the other regions, allowing
the insect to perform actions such as cleaning the eyes and the antennae (Laurent and
Richard, 1986a). The coxo-trochanteral (CTr - controlled by levator-depressor muscle
groups), trochanteral-femoro (TrF), femoro-tibial (FTi -controlled by extensor-flexor
muscle groups) and tibio-tarsal (TiTa) joints have 1 DOF each in every leg. As in
most insects, the TrF joint has little movement and therefore coxo-trochanteral-femoro
is considered as one joint. The coxal segments of the front legs are moving almost
vertical relative to the ground, while the coxae of the hind legs are moving almost
parallel to the ground and the coxae of the middle legs are moving somewhere in
between (see figure 2.2).
2.3.2 Sensors
In order to monitor the state of their body and appendages andobtain information from
their environment, insects have various types of mechanosensors. Positionally, they
are distinguished into cuticular mechanoreceptors that are situated on the exosceleton

10 Chapter 2. Background
(a) (b)
(c)
Figure 2.3: Properties of the cricket legs. (a) Front leg with segments identified. (b)
Front leg with the main joints and their angular variables. The tarsus segments are not
included. (c) Femur muscles and apodemes of the metathoracic leg.
and internal mechanoreceptors that are located inside the exosceleton, mostly near
articulations. Functionally, they are separated into exteroceptors which are sensitive to
outside stimuli such as air flow or touch and proprioceptors which respond to internal
movements such as joint movement. The latter can be positionsensors such as hair
plates and chordotonal organs; and load sensors such as campaniform sensillae, strand
and tension receptors.
2.3.2.1 Mechanosensors Involved in Walking
Various mechanosensors involved in walking have been identified in parts of the main
body and legs of the crickets. One dorsal hair plate is located in each trochanter
(Gnatzy and Hustert, 1989) and is used to estimate the angle between two joints. The
chordotonal organs sense velocity, acceleration and position in each joint (stick insect;
Hofmann et al., 1985). They have been studied for their neural morphology (Nishino
and Sakai, 1997; Nishino, 2000) and function (Acheta domesticus; Nowel et al., 1995).
In total 30 of them are located in the thorax. The campaniformsensilla measure the
increase and decrease of the forces caused by the motion of the legs. There are 4-5
groups of them, in each Trochanter (Gnatzy and Hustert, 1989) and a group of 14-15

2.3. Morphology 11
in each Tibia (Eibl, 1978). The strand receptors function quite similarly to the chor-
dotonal organs. The tension receptors are located in some ofthe muscles and signal
the force generated by the muscle. Crickets have also gravityreceptors (Horn and
Bischof, 1983; Horn and Foller, 1985). All these sensors can act in parallel and possi-
bly influence each other (stick insect; Cruse et al., 1984). For a detailed table of sensor
distribution in crickets see (Gnatzy and Hustert, 1989).
2.3.2.2 Auditory System
The ears are the most well studied sensors of the cricket. They evolved from proprio-
ceptive chordotonal organs (Boyan, 1998) linked to a pair of tympanic membranes, on
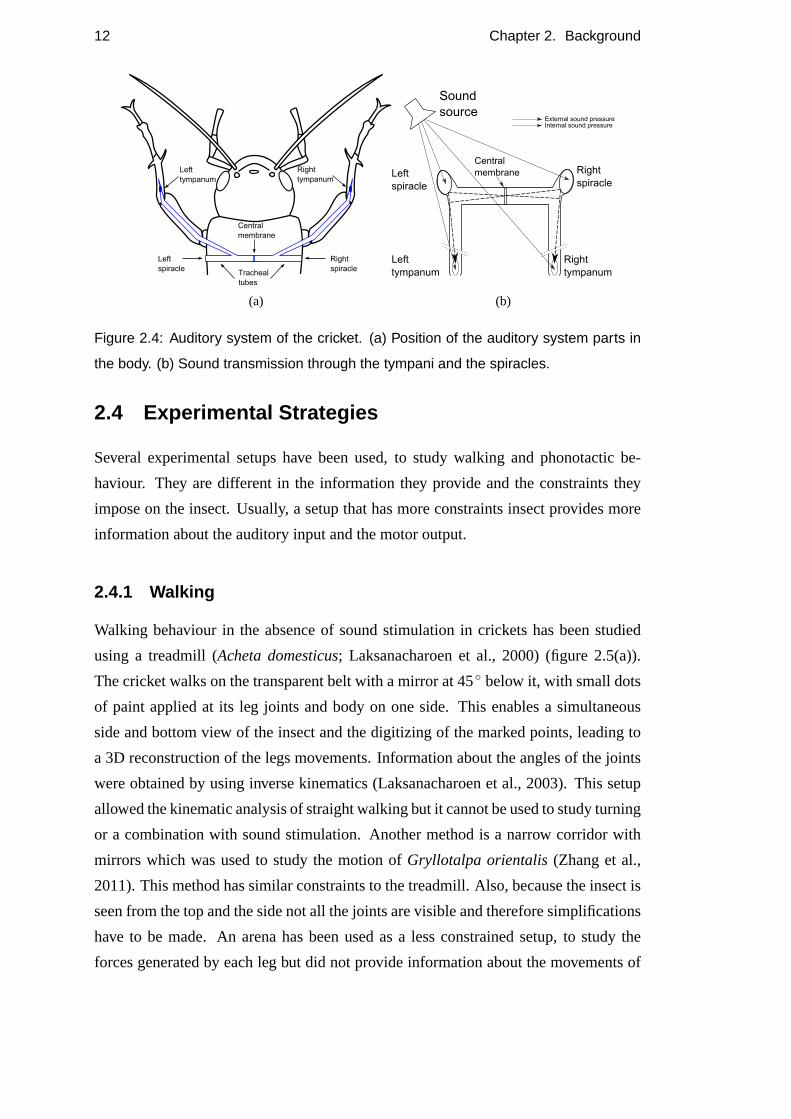
each foreleg, placed in the upper part of the tibia (figure 2.4(a)). Each pair consists of
a large tympanum on the back of the leg and a smaller and less important tympanum
on the front (Larsen, 1987). Tracheal tubes connect tympanito each other and to a
pair of spiracles located in the front of the body, forming anH-shaped internal struc-
ture. A double central membrane separates the two sides (themedial septum). The
lower branches of this structure end at the tympani and the upper branches end in the
spiracles. For a complete description of the structure of those organs see (Ball et al.,
1989).
The difference in the amplitude of the sound signal in the left and the right tympani
is very low, because of the small distance of the ears (∼1.5 cm) relative to the wave-
length of the sound signal (∼7 cm) and the distance of the sound source. Besides the
direct route, where the sound waves reach each tympanum fromthe outside, there is a
second indirect route thought the spiracles. As a result, the sound waves can pressure
each tympanum both from inside and outside (Huber and Thorson, 1985), making the
ear a pressure-difference receiver (Michelsen et al. 1994,Carew 2000, figure 2.4(b)).
The two tympani will have a difference in the amplitude of their summed signals (from
the four inputs), relative to the signal frequency, sound direction and diffraction. Con-
sequently, the female, turns towards the side with the loudest sound and moves towards
the sound source. For a detailed description of the sound perception in crickets see
(Larsen et al., 1989).
12 Chapter 2. Background
(a) (b)
Figure 2.4: Auditory system of the cricket. (a) Position of the auditory system parts in
the body. (b) Sound transmission through the tympani and the spiracles.
2.4 Experimental Strategies
Several experimental setups have been used, to study walking and phonotactic be-
haviour. They are different in the information they provideand the constraints they
impose on the insect. Usually, a setup that has more constraints insect provides more
information about the auditory input and the motor output.
2.4.1 Walking
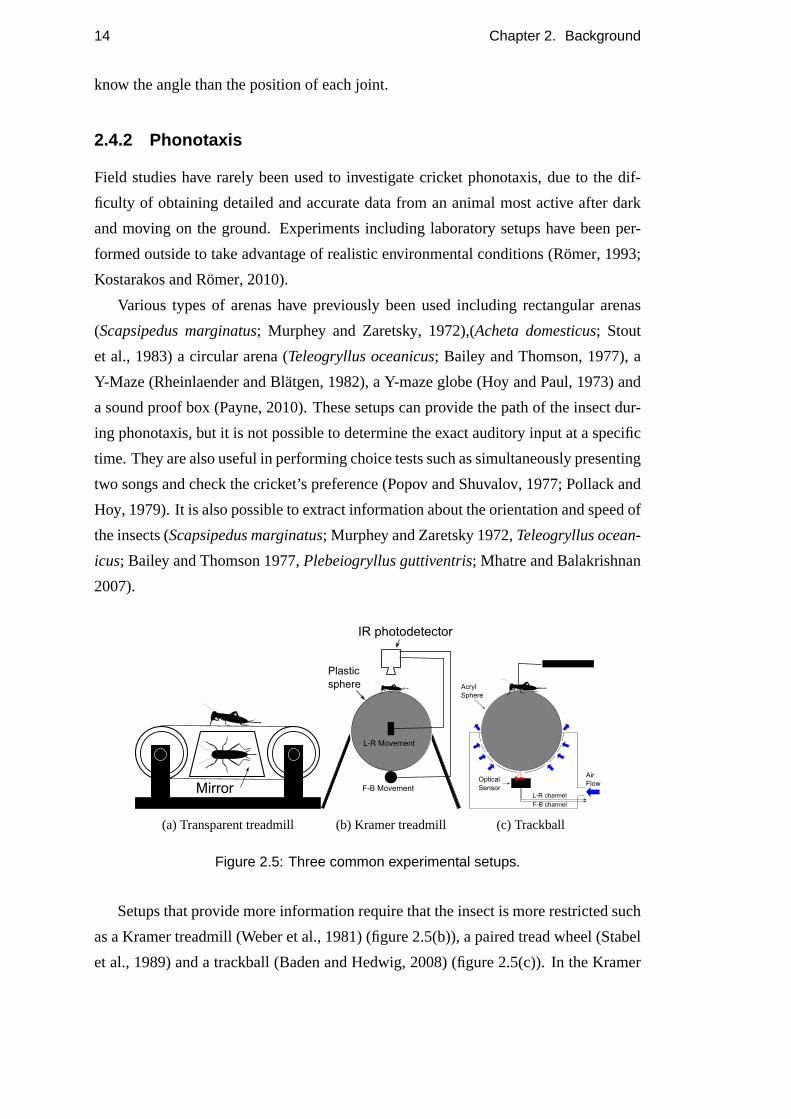
Walking behaviour in the absence of sound stimulation in crickets has been studied
using a treadmill (Acheta domesticus; Laksanacharoen et al., 2000) (figure 2.5(a)).
The cricket walks on the transparent belt with a mirror at 45◦ below it, with small dots
of paint applied at its leg joints and body on one side. This enables a simultaneous
side and bottom view of the insect and the digitizing of the marked points, leading to
a 3D reconstruction of the legs movements. Information about the angles of the joints
were obtained by using inverse kinematics (Laksanacharoenet al., 2003). This setup
allowed the kinematic analysis of straight walking but it cannot be used to study turning
or a combination with sound stimulation. Another method is anarrow corridor with
mirrors which was used to study the motion ofGryllotalpa orientalis(Zhang et al.,
2011). This method has similar constraints to the treadmill. Also, because the insect is
seen from the top and the side not all the joints are visible and therefore simplifications
have to be made. An arena has been used as a less constrained setup, to study the
forces generated by each leg but did not provide informationabout the movements of

2.4. Experimental Strategies 13
each joint (Harris and Ghiradella, 1980).
For other insects, data has been obtained for turning behaviours during free walk-
ing, e.g., for ants (Zollikofer, 1994), bees (Zolotov et al., 1975), cockroaches (Franklin
et al., 1981; Camhi and Levy, 1988; Jindrich and Full, 1999), flies (Strauss and Heisen-
berg, 1990; Mason et al., 2005), and stick insects (Cruse, 1976; Rosano and Webb,
2007). However, these generally report only the tarsus positions or foot-touchdown
locations and the body orientation; in some cases forces exerted by the legs were also
measured. More detailed three dimensional kinematic data has sometimes been ob-
tained for free walking insects,e.g. for stick insects (Durr, 2001) and cockroaches
(Kram et al., 1997; Watson et al., 2002) but these are usuallyin situations where the
animal is restricted from turning (the insect is walking on abeam or treadmill, or
in a channel). These studies also required hand-digitisation to extract the joint posi-
tions from every frame. Joint angles have been estimated by using inverse kinematics
calculations (Cruse and Bartling, 1995). Comparable kinematic detail that includes
turning responses has otherwise been obtained only using animals that are restricted
by tethering above a trackball or a slippery surface,e.g., in beetles (Frantsevich and
Mokrushov, 1980), cockroaches (Bell and Kramer, 1979; Nye and Ritzmann, 1992;
Mu and Ritzmann, 2005; Ridgel et al., 2007; Bender et al., 2010),and stick insects
(Durr and Ebeling, 2005; Gruhn et al., 2009). In this type of study, some methods have
been developed for at least partially automating the extraction of data from high speed
videos. This usually involves marking of the joints,e.g., with reflective paint (Larsen
et al., 1995). Commercial motion capture systems such as WinAnalyze (Mikromak,
Erlangen, Germany) have been used with such markers (Gruhn et al., 2006). Most
recently Bender et al. (2010) have used image filtering and brightest point detection
within a region near the expected marker location in an automated tracking algorithm
to follow 26 marked points on cockroach legs, using two high-speed cameras to obtain
three dimensional position data. A method that is widely used in human motion track-
ing is to constrain the tracking problem by defining a kinematic model that is fitted
to the tracked points in the image (Aggarwal and Cai, 2002). This approach has been
successfully applied to tracking a stick insect by Zakotniket al. (2004). In fact, this
approach is particularly appropriate, as instead of treating the the problem as one of
tracking an arbitrary set of points (raw joint positions) inspace, it assumes the points
belong to a specific kind of articulated body. Indeed, the control problem for the insect
is to use its muscles to change the angle(s) of each joint, in acoordinated fashion that
propels it in a desired direction; thus to analyse the kinematics it is more useful to
14 Chapter 2. Background
know the angle than the position of each joint.
2.4.2 Phonotaxis
Field studies have rarely been used to investigate cricket phonotaxis, due to the dif-
ficulty of obtaining detailed and accurate data from an animal most active after dark
and moving on the ground. Experiments including laboratorysetups have been per-
formed outside to take advantage of realistic environmental conditions (Romer, 1993;
Kostarakos and Romer, 2010).
Various types of arenas have previously been used includingrectangular arenas
(Scapsipedus marginatus; Murphey and Zaretsky, 1972),(Acheta domesticus; Stout
et al., 1983) a circular arena (Teleogryllus oceanicus; Bailey and Thomson, 1977), a
Y-Maze (Rheinlaender and Blatgen, 1982), a Y-maze globe (Hoy and Paul, 1973) and
a sound proof box (Payne, 2010). These setups can provide thepath of the insect dur-
ing phonotaxis, but it is not possible to determine the exactauditory input at a specific
time. They are also useful in performing choice tests such assimultaneously presenting
two songs and check the cricket’s preference (Popov and Shuvalov, 1977; Pollack and
Hoy, 1979). It is also possible to extract information aboutthe orientation and speed of
the insects (Scapsipedus marginatus; Murphey and Zaretsky 1972,Teleogryllus ocean-
icus; Bailey and Thomson 1977,Plebeiogryllus guttiventris; Mhatre and Balakrishnan
2007).
(a) Transparent treadmill (b) Kramer treadmill (c) Trackball
Figure 2.5: Three common experimental setups.
Setups that provide more information require that the insect is more restricted such
as a Kramer treadmill (Weber et al., 1981) (figure 2.5(b)), a paired tread wheel (Stabel
et al., 1989) and a trackball (Baden and Hedwig, 2008) (figure 2.5(c)). In the Kramer

2.5. Behavioural Studies 15
treadmill the cricket is placed on top of a plastic sphere, with a small disk of reflective
foil attached to her back. An infrared photodetector from the top senses the location of
the insect and corrects the forward-backward and left-right position of the sphere, plac-
ing the cricket on the top. Although this setup does not recreate the exact conditions of
the insect’s natural environment, it allows the reconstruction of the insect path as if it
had walked on the ground. In the trackball setup the cricket is attached by a restraining
arm, which holds it on the top of an air-suspended sphere. An optical sensor then de-
tects the left-right and forward-backward movements of theball. This setup allows the
measurement of the insect turning tendencies and has much faster time resolution than
the Kramer treadmill. More recently it was used to obtain information of tarsi, head
and abdomen positions (Witney and Hedwig, 2011). Some of these methods impose
constraints on the insect movement which may make either tracking or interpretation
of body and leg positions difficult. For instance, the insect’s dynamics are altered if
it is fixed on top of a trackball: propelling its own weight forward is not equivalent
to propelling a ball backward (Poulet and Hedwig, 2005). Additionally, the spatial
relation of the insect to external stimuli is held constant,which, whilst’ providing suit-
able experimental control, does not reflect the normal phonotaxis situation. Some leg
segments may not be visible from the available views of an animal on a trackball.
2.5 Behavioural Studies
2.5.1 Walking
Walking behaviour in insects has been mostly studied for thecockroach (Tryba and
Ritzmann, 2000), the stick insect (Cruse, 1976; Epstein and Graham, 1983; Bassler and
Buschges, 1998) and the locust (Burrows, 1996b). Walking is a task that requires for
its maintenance translation of parameters, such as direction and velocity into actions
and overcoming or avoiding obstacles. Typically, the control of walking in insects can
be divided in two main tasks: The control of the movement of the single leg and the
coordination of all the legs.
In order to produce successful movements, each joint in every leg, has to be in
harmony with the movement of the other joints in the same leg.For the crickets, the
ThC and CTr joints mainly determine the mobility of the whole leg and the amplitude
of the step, while the FTi and TiTa joints allow an increase ofthe arc determined by the
tarsus (Laurent and Richard, 1986a). As a result of the differences in the morphology

16 Chapter 2. Background
of the crickets legs, in each pair of legs the segments are moved in a different way than
the others.
Thoracic differences have been noted in other insects (cockroach; Watson and Ritz-
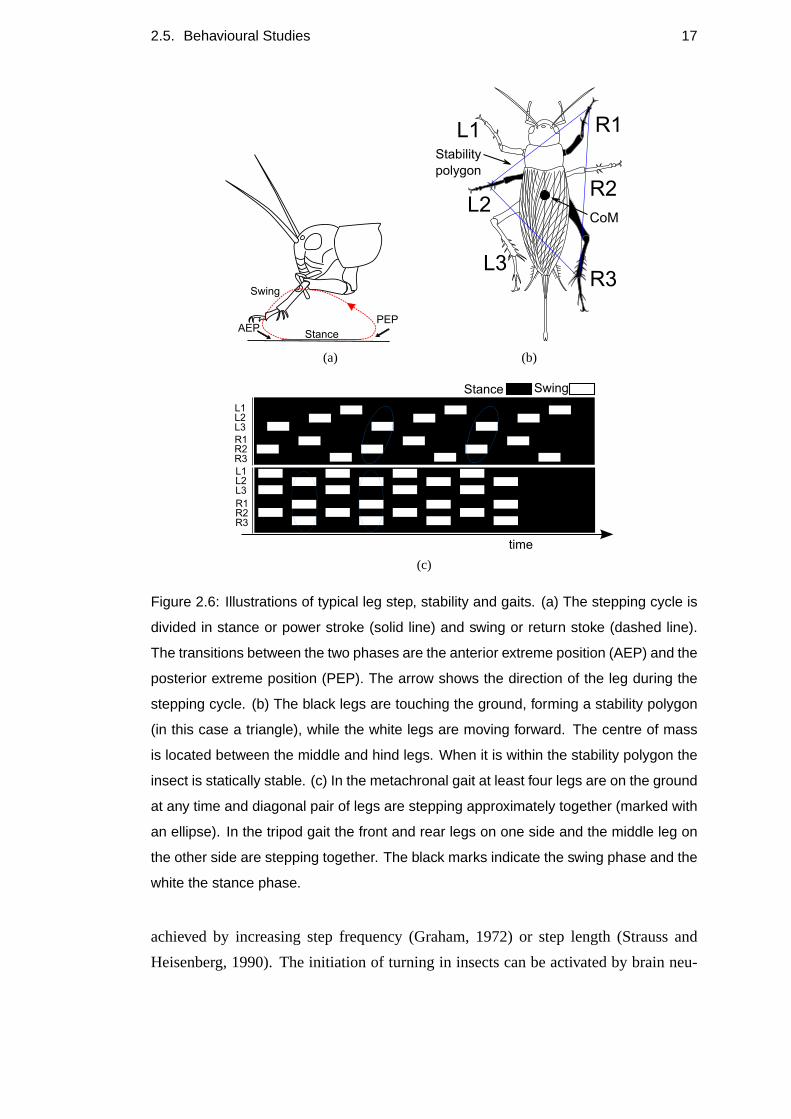
mann, 1997), (locust; Burns, 1973). The stepping cycle of thesingle leg consists of two
phases: stance (power stroke) and swing (return stroke) (figure 2.6(a)). Stance is the
phase when the leg is touching the ground, supports the body and pushes it forward.
Swing is the phase when the leg is lifted off the ground and moves forward until it
reaches a reliable foothold on the ground. These two phases have major differences in
their control requirements. During swing the leg does not require mechanical coupling
with the other legs until it reaches the ground and thereforecontrol is simpler, while in
stance there is mutual mechanical coupling through the ground with the other legs, so
as to support the body. Consequently, the transition events between the two phases are
critical for the successful movement of the leg. The anterior extreme position (AEP)
is where the leg touches the ground and the posterior extremeposition (PEP) is where
the leg lifts off the ground. The two phases and critical positions have been extensively
studied for the stick insect (Cruse, 1985a,b).
The coordination of all six legs is essential for the successful movement of the body.
Therefore, each one of them needs to communicate with at minimum the neighbouring
ipsilateral and contralateral legs, so that they produce a stable gait. To have a statically
stable gait, the centre of mass (CoM) must be within the polygon spanned by the legs
on the ground (figure 2.6(b)). If the CoM projects outside of the stability polygon, the
body is pulled by gravity and the insect falls. Insects typically walk utilising a tripod
(used for high speed, with three legs touching the ground) ormetachronal (used for
slow speed and at least four legs touch the ground) gait (figure 2.6(c)). In the tripod
gait, the front and rear leg of one side and the middle leg of the other side, perform
their swing movements at the same time, while the other threelegs support the animal.
In the metachronal gait there is a sequence of stance-swing transitions on ipsilateral
legs that is not in phase with contralateral legs. Cockroaches exhibit different walking
speeds: A slow speed(<10 cm/sec) and a faster (∼30 cm/sec) when tested on an arena
(Bender et al., 2011). According to Harris and Ghiradella (1980) crickets of the species
Acheta domesticus, have gaits similar to cockroaches, with tripod gaits at high speeds
and metachronal gaits at lower speeds.
Insects can turn in various degrees (cockroach; Comer and Dowd, 1987), on the
spot (Simmons, 1990), while walking (cockroach; Watson andRitzmann, 1997) or
while running (cockroach; Jindrich and Full, 1999). Duringwalking, turning can be
2.5. Behavioural Studies 17
(a) (b)
(c)
Figure 2.6: Illustrations of typical leg step, stability and gaits. (a) The stepping cycle is
divided in stance or power stroke (solid line) and swing or return stoke (dashed line).
The transitions between the two phases are the anterior extreme position (AEP) and the
posterior extreme position (PEP). The arrow shows the direction of the leg during the
stepping cycle. (b) The black legs are touching the ground, forming a stability polygon
(in this case a triangle), while the white legs are moving forward. The centre of mass
is located between the middle and hind legs. When it is within the stability polygon the
insect is statically stable. (c) In the metachronal gait at least four legs are on the ground
at any time and diagonal pair of legs are stepping approximately together (marked with
an ellipse). In the tripod gait the front and rear legs on one side and the middle leg on
the other side are stepping together. The black marks indicate the swing phase and the
white the stance phase.
achieved by increasing step frequency (Graham, 1972) or step length (Strauss and
Heisenberg, 1990). The initiation of turning in insects canbe activated by brain neu-

18 Chapter 2. Background
rons (Ridgel et al., 2007) or reflex pathways that bypass the brain (Camhi and Johnson,
1999).
The small size of the leg segments makes it extremely difficult to study all the
degrees of freedom in insects. Consequently most experiments focus on three DoF.
The ThC which moves the leg forward and backwards, the CTr which moves the femur
up and down and the FTi which moves the tibia closer or furtherfrom the femur.
Laksanacharoen et al. (2000) analysed the forward walking on a treadmill ofAcheta
domesticus. In this research the complex movement of the coxae was determined for all
the thoracic segments, indicating that only the front ThC joints use more than 1 DoF.
There are obvious differences in the movements of the legs that belong to different
thoracic segments. For instance the hind legs move almost vertical relative to the
ground, while the front legs extend far forward.
2.5.2 Walking During Phonotaxis
Crickets approach the sound source in a series of consecutiveruns and pauses follow-
ing a meandering path (Weber and Thorson, 1989). The existing knowledge on phono-
tactic walking involves mostly turning tendencies measurements, such as direction,
pathway and translational and rotational velocity (Weber et al., 1981; Schildberger,
1988; Stabel et al., 1989; Doherty, 1991).
Murphey and Zaretsky (1972) found that there is a correlation between the walk-
ing bouts and the stops inScapsipedus marginatus. This however might be because the
calling song of this species occurs less that one per second.Instead,Gryllus campestris
had number of stops independent of the presence of the calling song (Schmitz et al.,
1982). Earlier studies suggested that turns are followed bya stop and that the rest
of the walking is not affected by the sound direction (Murphey and ZaretskyScap-
sipedus marginatus; 1972, Bailey and ThomsonTeleogryllus oceanicus; 1977). More
recent studies on different species suggest that changes inwalking angles occur during
walking (Plebeiogryllus guttiventris; Mhatre and Balakrishnan, 2007).
Earlier experiments on a Kramer treadmill showed that the crickets were deviating
by 30◦-60◦ with respect to the animal’s frontal midline. Recently, the accuracy of the
directionality of the cricket was tested with the sound source present±30◦ in front of
the insect (Schoneich and Hedwig, 2010). It was found that it could move towards the
correct direction even if the sound was placed 1◦ relative to the cricket’s length axis.
Hedwig and Poulet (2004), using a highly sensitive trackball system, were able to

2.6. Neurophysiology 19
measure more precisely the movements of the females. The results showed that they
make rapid steering movements in response to each sound pulse of a communication
signal, independent of the species specific song. This observation indicates that phono-
tactic turning is initiated by a combination of reactive movements and brain neurons
commands. Furthermore, Baden and Hedwig (2008) recorded themovements of the
front legs using the same experimental setup. The up-down movements of the leg were
not altered by the sound direction. In contrast, the left-right movements were clearly
dependent on the sound direction, making larger movements towards the contralateral
speaker and smaller towards the ipsilateral speaker.
Witney and Hedwig (2011) used one camera to record cricket movements from
the top using the same experimental setup. This provided mainly information about
the foot positions of each leg but due to the setup limitations I discussed previously,
this did not allow precise information about each joint contribution and especially the
ThC joints. The front and middle legs on both sides adjusted their movements during
turning, but the altering of the hind legs’ movements was small compared to forward
walking.
2.6 Neurophysiology
In the next paragraphs, I present the different groups of neurons that participate in
the phonotactic turning behaviour and their contribution.The summary begins with
the overall structure of the nervous system and continues with the local and ascending
thoracic auditory neurons, the local brain neurons, the descending brain neurons and
the motor neurons and the walking interneurons. The terminology for the neurons
presented herein is not uniform, so I will include the names given by the authors in the
citations.
2.6.1 Nervous System
The central nervous system (CNS) of insects is composed of a series of ganglia (a col-
lection of neurons), which are linked by intersegmental connectives, allowing signals
to travel up and down this chain (figure 2.7(a)). The front ganglion is the brain, fol-
lowed by the subesophageal ganglion, three thoracic ganglia and finally several abdom-
inal ganglia. The highest concentration of neurons is located in the brain (∼300K neu-
ron cells in crickets (Schildberger et al., 1989), 100 timesgreater than any of the other

20 Chapter 2. Background
ganglia), which is responsible for learning (Matsumoto andMizunami, 2002), process-
ing of visual, olfactory (Schildberger, 1984a) and antennal (Gebhardt and Honegger,
2001) input and the overall control of the behaviours. The role of the subesophageal
ganglion in locomotion is unclear, although evidence suggests it participates in main-
taining normal walking (Altman and Kien, 1987). A thoracic ganglion is located in
each one of the pro-, meso- and meta- thoracic segments and controls the muscles of
the front, middle and hind legs respectively, as well as processing sensory input from
these segments including auditory.
(a)
(b)
Figure 2.7: Nervous system and neural pathways. (a) Position of the ganglia in the
cricket body. (b) Basic information flow between different regions of the body.
2.6.2 Local and Ascending Thoracic Auditory Neurons
There are∼60 primary auditory afferents in each auditory organ (Michel, 1974). Their
axons project to the auditory neuropil in the prothoracic ganglion (Eibl, 1978), trans-
mitting information to local and ascending thoracic interneurons. Two pairs of ascend-
ing auditory neurons are well characterized (Gryllus campestris, AN1 AN2; Wohlers
and Huber, 1982), (HF1AN; Popov and Markovich, 1982), (Schildberger, 1988; Schild-
berger and Horner, 1988), (Hennig, 1988,Teleogryllus commodus; STU, LAU), (Stabel
et al., 1989), (TH1-AC1, TH1-AC2 Zorovic and Hedwig, 2011). Each AN1 receives

2.6. Neurophysiology 21
excitatory input from the ear contralateral to the cell body(Horseman and Huber,
1994). The AN1 pair is tuned to the calling song frequency andits hyperpolariza-
tion leads to the change of walking direction. Each AN2 receives input from both ears.
The AN2 pair responds to higher frequencies and evidence suggest that is involved
in bat avoidance (Schildberger, 1984b). Other identified neurons in the prothoracic
ganglion in different cricket species are the descending neuron DN1 which receives
excitatory input from the contralateral ear and responds tothe calling song like AN1
neurons; and a T-shaped neuron TN1 which receives excitatory input from both ears
(Wohlers and Huber, 1982,Gryllus campestris). However, the functional role of these
neurons during phonotaxis is not clearly characterized.
All the identified auditory cell types in the thorax have their bodies located within
the ganglion and each cell type has a mirror image (Wohlers and Huber, 1978). There
are two well known bilateral pairs of mutually inhibitory omega neurons (Selverston
et al., 1985), participating in phonotactic behaviour (Teleogryllus Oceanicus, Interneu-
rons 1 and 2; Casaday and Hoy, 1977), (Wohlers and Huber, 1982,Gryllus campestris,
ON1 ON2;), (LSAN; Popov and Markovich, 1982), (Wiese, 1981). ON1 is sharply
tuned to the frequency of the song. Some studies suggest thatthese neurons do not
participate in the temporal filtering of the song pattern (Wohlers and Huber, 1982;
Schildberger et al., 1989), while others had evidence for low-level temporal filtering
(Wiese and Eilts, 1985; Stabel et al., 1989). More recently,(Nabatiyan et al., 2003;
Baden and Hedwig, 2007), it was proposed that the ON1 acts as a low-pass filter for
the syllable patterns and that its instantaneous spike ratematches the tuning of phono-
tactic behaviour. Furthermore, the sound localization is activated independent of pat-
tern recognition. Therefore, the pattern recognition is not directly involved in the rapid
steering responses (Poulet and Hedwig, 2005).
2.6.3 Local Brain Neurons
Some local brain neurons have been associated with the recognition of the calling
song. Schildberger identified two neuron classes with auditory responses (Schild-
berger, 1984b). The first, BNC1 gets direct input from the thoracic AN1 neurons
(examined in the next section). Then it provides input to thesecond class the BNC2.
The neurons belonging to both classes have different responses to the pattern of sound,
acting as low- and high- pass filters. Similar neurons have been identified in other
studies (UABN, PABN1, PABN2; Boyan, 1980), (Acheta domesticus, HBB1; Atkins

22 Chapter 2. Background
et al., 1988). Additionally, Bohm and Schildberger (1992) mention one local neuron
that responded to the calling song with a latency of 25-30ms,but they do not clarify if
it is one of the already identified neurons. This neuron acteddifferently in the standing
and walking animal. When standing, often only the first syllable elicited spikes, while
in walking there was a response to each syllable.
Schildberger’s theory that high and low pass filtering result in band pass selectivity
for syllable rate remains the most popularly accepted modelfor the recognition of the
calling song. Other theories have been proposed that involve template matching (Hoy,
1978) or cross correlation analysis (Teleogryllus; Hennig, 2003). However, Hedwig
(2006) suggests that these models require at least two pulses of the song syllables
to produce turning. This fact indicates that these models are valid as a recognition
mechanism but are too slow to be directly involved with phonotactic steering.
2.6.4 Descending Brain Neurons
The contribution of the brain to the walking behaviour through descending neurons is
not entirely clear. Decapitated insects respond to external stimulation, but do not pro-
duce the same coordinated movements as they normally do (Zill, 1986, cockroach;).
According to Staudacher (1998), there are about 200 pairs ofdescending neurons to-
wards the thoracic motor centres. This number is small relatively to the total number of
brain cells. The initiation of some behaviours has been associated with these neurons,
for instance in cricket singing (Hedwig, 2000) and stridulation (grasshopper; Hedwig,
1994). For the walking behaviour, one pair of neurons was found (Bohm and Schild-
berger, 1992), that fitted the description of a command neuron. A command neuron can
trigger a complex sequence of neural activity, such as stridulation or walking (Kupfer-
mann and Weiss, 1978). The specific neuron had weak response to auditory, visual
and tactile stimulation, but when walking began it increased its discharge rate. Addi-
tionally, when it was activated the cricket began walking during the discharge of the
neuron.
Furthermore, there are some other descending neurons that have been associated
with the walking and the phonotactic response. In older studies, groups of cells were
active and directly correlated to a parameter of walking, such as translational (Bohm
and Schildberger, 1992) and rotational (Staudacher and Schildberger, 1998) velocity.
Moreover, in (Bohm and Schildberger, 1992) two neurons were found that responded
to auditory stimulation. One of them was a unimodal neuron that exhibited sensitivity

2.6. Neurophysiology 23
to the direction of the sound. Besides sound stimulation, theother neuron responded
to visual input. However this neuron only responded in the beginning of the calling
song and almost stopped responding after a few chirps. Boyan and Williams (1981)
found two neurons (IDBN and CDBN) that responded to auditory stimulation. The
IDBN neuron is believed to belong to cluster i5 (Staudacher and Schildberger, 1998).
Staudacher (2001) found that the majority of the descendingneurons belonging to
Group II had various responses to calling songs of 5 and 20 kHz.
Based on the above results from crickets and studies in locusts (Kien, 1983, 1990a,b),
Heinrich (2002) proposed that the brain is not only responsible for the initiation and
maintenance of walking, but there is a population of descending neurons controlling
parameters of walking behaviour. Each neuron is responsible for a specific subtask,
such as intra- and inter- leg coordination and contributes with fine tuned adjustments
of walking patterns. This agrees with Baden and Hedwig (2008)who suggest that
the steering commands are integrated with the networks thatcontrol for walking, by
modulating the amplitude of the steering response.
2.6.5 Motor neurons and Walking Interneurons
The ganglia control leg muscles through excitatory and inhibitory motor neurons (Nishino,
2003), (locust; Watson et al., 1985; Siegler and Pousman, 1990), (cockroach; Cohen
and Jacklet, 1967). The number of motor neurons in each ganglion is relatively small.
For example, in the cricket prothorax, coxa, trochanter andfemur in each leg are con-
trolled by 50 motor neurons (1 unpaired and 49 paired) (Laurent and Richard, 1986a).
Each thoracic ganglion generates rhythmic motor patterns which alternate the con-
traction of antagonistic muscles, producing movements of the segments of the individ-
ual leg (locust; Ryckebusch and Laurent, 1993; Burrows, 1996a). The neural networks
that generate these rhythmic patterns are described as “central pattern generators”
(CPGs). Rhythmic motor patterns can be generated without sensory input (cockroach;
Delcomyn, 1980). In stick insects, evidence suggest that they have separate pattern
generator for each joint (Bassler, 1993; Buschges, 1995; Bassler and Buschges, 1998).
The coordination of the leg joints is accomplished through interactions of the modules
that control the joints. However, other results in the stickinsects show that leg joints
do not have strict coordinated motion (Cruse and Bartling, 1995), but are coupled by
sensory information.
In insects, spiking and nonspiking interneurons are responsible for the control of

24 Chapter 2. Background
motor neurons. The difference between the two categories isthat spiking neurons gen-
erate action potentials in order to transmit information (“digital” transmission), while
nonspiking neurons function without generating action potentials (“analog” transmis-
sion). Spiking interneurons main role is to receive and distribute information from
sensory neurons (stick insect; Hess and Buschges, 1999) and possibly contribute to the
control of leg movement (locust; Wolf and Laurent, 1994). For instance, they process
information from the femoral chordotonal organ (fCO) (stickinsect; Buchges, 1994),
(locust; Burrows, 1987). Instead, the nonspiking interneurons main responsibilities are
to receive input from the spiking neurons, control the relevant motor neurons (cock-
roach; Pearson and Fourtner, 1975), (stick insect; Busghes, 1990), (locust; Burrows,
1980; Laurent and Burrows, 1989), posture (locust; Siegler,1981) and modulate the
gain of leg reflexes (stick insect; Buschges et al., 1994). The sensory information plays
a greater role in insects that move slowly (i.e. stick insect) than the ones that move in
greater speeds (i.e. cockroach) (Delcomyn, 2004).
Besides the processing of information in each thoracic ganglion, the communica-
tion between the segments of the CNS is also important for the control of locomotion,
through intersegmental interneurons (cockroach; Pearsonand Iles, 1973). This com-
munication is essential for the coordination of the movements of all the legs. The
influences between ipsilateral legs are stronger than between contralateral legs (stick
insect; Brunn and Dean, 1994). Additionally, the shared information between con-
tralateral legs differs between the three thoracic ganglia(stick insect; Dean, 1989).
Experiments in reduced leg preparations show that leg coordination is affected by the
interaction of interleg and intraleg sensory feedback (Ludwar et al., 2005; Borgmann
et al., 2007).
Baden and Hedwig (2008) performed recordings of the front legs tibial motor neu-
rons activity during phonotaxis, revealing that the auditory input is indirectly integrated
with the walking networks. There are currently two hypotheses for this connection. Ei-
ther there are local thoracic interneurons connecting the thoracic auditory interneurons
to motor neurons or that there is a connection through the ascending and descending
brain neurons. Therefore, besides the modulation by the legsensors, walking can be
modulated by the auditory response.

2.7. Models and Robots 25
2.7 Models and Robots
2.7.1 Walking
Most insect-inspired hexapod models are based on either thestick insect (Carausius
morosus) or the cockroach (Periplaneta americana, Blaberus discoidalis). Therefore
this section will contain more information about these insects and not crickets. There
are two main categories of controllers: reflex-based and pattern-based. The former
use the sensory input to produce leg movements and coordination, while the latter use
pre-programmed patterns (mostly CPG), which might be modulated by sensor input.
As a result of extensive behavioural and neural experimentson stick insects, Cruse
et al. (1991) proposed a set of rules for leg coordination (figure 2.8) and a “step pattern
generator” for the single leg, capable of changing between stance and swing using
load, position and velocity signals. The rules are the following:
1. The swing movement of a posterior leg inhibits the swing movement of an ante-
rior leg.
2. The start of stance movement of a posterior leg excites theswing movement of
an anterior leg.
3. A backward shift of an anterior leg’s PEP will create an earlier swing movement
and a forward shift of the posterior leg.
4. The posterior leg swing is targeted towards the position of the anterior leg.
5. Increased resistance increases force and increased loadprolongs stance
6. The posterior leg will briefly step backwards when it treads on the anterior leg.
The proposed rules can be applied to forward walking situations. However, during
crossing large gaps or turning the rules have to be adjusted (Blasing and Cruse, 2004;
Durr, 2005). This model produced and maintained stick-insect-like tetrapod and tri-
pod gaits in a simple kinematics simulation. A later version(Cruse et al., 1995), was
based on a neural network architecture and transitioned between stance and swing us-
ing threshold values. The networks were trained with data from real insects. Cruse
et al. (1998) proposed the successor of these models, WalkNet. This network consists
of several subnetworks, of which the most important are the swing-net and the stance-
net controlling swing and stance respectively and the selector-net which controls which

26 Chapter 2. Background
of the two networks is in control of the leg. There are three DoF per leg (α, β, γ). The
network outputs velocities for each joint. A more recent version of the WalkNet model
(Schilling et al., 2007) can function with leg amputations and the selector net is modi-
fied to accept an analogue signal for the load of the leg. This model has been tested in a
dynamic simulation. Although these rules are based on stickinsect locomotion, some
of them or their variations could be applied to other insectssince they have similar
gait patterns. However, insects like cockroaches, locustsand crickets have also greater
differences between the three leg pairs and higher speeds relative to the stick insect.
Figure 2.8: Cruse’s rules that describe the information exchanged between neighbour-
ing legs and the stance-swing transitions they generate.
A different solution regarding the control of stance in stick insects is the idea that
the insect could use the elastic properties of each joint as apositive feedback (Bassler,
1988). Schneider et al. (2005) investigated this approach by using a local positive ve-
locity feedback (LPVF) which can switch from positive feedback to compliant motion
depending on the mechanical power produced by the joint (positive or negative). This
model was tested on a two joint manipulator and a dynamic simulation of a leg Schnei-
der et al. (2006). Rosano and Webb (2007) used LPVF principle in a model for turning,
introducing the thoracic differences observed in the insect.
Although there are indications of central oscillators, even in each leg joint (Bassler,
1988), Walknet does not use any central oscillators to produce rhythmic motor output.
Each bi-stable circuit flexes or extends the associated joint. Cruse (2002) proposed
a simple network for the movement of each joint, where there are two antagonistic
muscles channels of sensor input and motor output. Buschges et al. (1995) and Hess

2.7. Models and Robots 27
and Buschges (1997) investigated which sensory signals could affect each of the three
joint oscillators. This means that instead of using simple pattern generators, the joints
movements are influenced by input from their neighbouring joints such as load and
angle information. Akay et al. (2004) proposed a reflex chainfor the generation of the
forward stepping pattern of the middle leg, using three non-centrally coupled oscilla-
tors which are being coordinated by sensory signals. This model has been tested in a
dynamic simulation (Ekeberg et al., 2004) and produced coordinated stepping move-
ments of a middle leg and with some modifications the movements of a front and hind
leg.
Some of the robots mentioned in the upcoming discussion havethe primary goal
of investigating biological systems, while others aim to improve robot performance.
Since all the underlying mechanisms are not fully understood for any insect, neuro-
logical and physiological data are combined with engineering techniques for the con-
struction of robots. Furthermore, the existing robot components are bigger, heavier,
slower, have less power and consume a lot of energy. In contrast to the nervous sys-
tem of an insect that does parallel computations, computerstypically work serially.
Consequently, the walking performance of robots is expectedto be worse than the real
insects.
Most hexapod robots, apart from the fact that they use legs, are not based on biolog-
ical principles,e.g. Yoneda and Ota (2003); Barai and Nonami (2007). Furthermore,
there are robots that are based on insect walking but do not use similar leg structure
or maintain a mechanical coupling for the intra- and inter-leg coordination. Some ex-
amples include a cricket microrobot (Birch et al., 2000), RHex(Saranli et al., 2001),
Whegs (Allen et al., 2003) and MechaRoach (Boggess et al., 2004).
Although WalkNet has only been tested in simulations, the decentralised archi-
tecture and some of Cruse’s rules for leg coordination have been successfully imple-
mented in robots with 3 DoF per leg (Espenschied et al., 1996;Lewinger and Quinn,
2008). The rules are used to adjust each leg’s position at which is lifted off the ground
(PEP) based on the positions of its neighbouring legs. When a leg reaches its PEP it
is lifted off the ground and moves forward. When it reaches itsAEP it moves down
and returns to its stance phase. The PEP of each leg is calculated at each time step.
There are three major mechanisms, that correspond to coordination rules 1, 2 and 5.
The first mechanism makes a leg that is in swing phase preventing the other leg from
swinging by repositioning backwards the PEP of that leg by a small value. The second
mechanism makes a leg that just entered its stance phase encouraging the other leg to

28 Chapter 2. Background
enter its swing phase by moving the PEP of that leg forward by asmall value. The
third mechanism makes a leg that is in stance phase encouragethe other leg to enter its
swing phase by moving the PEP forward by an increasing value.A genetic algorithm
(GA) is usually used for tuning the parameters of the coordination procedure.
The TUM robot (Weidemann et al., 1994) used a single leg controller (SLC) and
a global leg coordination module (LCM), where each leg notified its neighbours of its
state. A mathematical model (Weidemann et al., 1993), divided into four states based
on state machines was used to control the individual leg. This robot was able to gen-
erate trajectories similar to the stick insect whilst avoiding obstacles. Tarry II used an
inverse kinematics model to train a neural network to produce stepping patterns (Frik
et al., 1998). Robot II was also able to create a continuous range of insect-like gaits
(Espenschied et al., 1996). It was able to have reflexes such as searching for foothold,
stepping reflexes, levator reflexes. Rough terrain navigation is accomplished by inte-
grating insect-like reflexes with the gait controller. An elevator reflex is implemented
to surmount large objects, and a searching reflex allows the robot to find a foot support
on uneven or missing terrain. LAURON used a learning approach (Berns et al., 1994)
with coordination signals such as velocity (Ilg and Berns, 1995) to perform insect gaits.
A later version of this robot, LAURON III (Gassmann et al., 2001) used pre-calculated
leg trajectories and replaced the coordination rules with acentralized architecture.
The development of stick-insect-inspired robots focuses on the leg movements and
their coordination, while the cockroach-inspired robots aim towards the morphology
of the insect and its speed. Robots such as sprawlita (Cham et al., 2002) do not have
an insect-like structure but use kinematic features of a cockroach and incorporates
the spring-loaded inverted pendulum leg movements of the insect into its walking,
achieving great speeds. There are also robots the follow predefined trajectories based
on kinematic data from the real insect such as protobot (Delcomyn and Nelson, 2000).
Quinn and colleagues have constructed a series of robots based on the cockroach.
Initially they developed a distributed neural network (Beeret al., 1989) for the control
of walking based on Pearson’s pacemaker model (Pearson and Iles, 1973). Robot I
(Beer et al., 1992) had 2 DoF on each leg and used this neural network as a controller.
A CPG was used to generate the stance and swing transitions foreach leg. It was able
to walk in a straight line, on flat terrain and generate a rangeof cockroach gaits. Robot
III (Quinn and Ritzmann, 1998) is a hexapod with kinematics based on studies of the
Blaberus discoidalis(Watson and Ritzmann, 1997). It has a total of 24 degrees of
freedom with 5 for each front leg, 4 for the middle legs and 3 for the rear legs moved

2.7. Models and Robots 29
by air cylinders. The robot uses a distributed hierarchicalcontroller. Robot IV used
passive stiffness joints to store energy during a step cycle. Robot V (Choi et al., 2005)
is able to control not only joint position, but also joint stiffness. These robots are able
to imitate the cockroach posture but not to walk yet, as they are dependent on external
power and air supply.
Some robots are great examples of incorporating the leg structure of real insects
into a robot (cockroach; Delcomyn and Nelson, 2000; Choi et al., 2005), (stick insect;
Pfeiffer et al., 1995). Despite the fact that the robots thatuse artificial muscles are
closer to the biological muscles, they are difficult to control. Furthermore, they rely on
external resources that complicates their performance.
Although robots such as TUM use a decentralised architecture for the coordination
of their legs, each individual leg follows specific trajectories. Additionally, most of the
aforementioned robots do not turn at all or they do not make turns similar to an insect.
Finally, they do not implement the thoracic differences observed in the real insect.
Most robots use sensors related to walking, such as ground orload sensors, but
do not use environmental sensors found on a real insect. For instance, Tarry II uses
an ultrasound sensor for navigation. An antenna tactile sensor mounted on a robot
(Cowan et al., 2005) is a good example of how turning is guided by external sensory
cues. However, this sensor is mounted on a sprawl robot that cannot move the leg
segments in the same manner as the cockroach.
Following the work of (Ekeberg et al., 2004), Lewinger et al.(2006) implemented
the idea of sensory coupled oscillators on a single leg and two front legs. Additional
sensory pathways for elevator reflex (step over a raised obstacle) and searching re-
flex (step over a gap) that are biologically plausible were added on a hexapod robot
(Lewinger and Quinn, 2009). There is also a neural network implementation on an-
other robotic platform that only deals with forward walking(von Twickel et al., 2011,
2012). More recently, a 4 DoF robotic leg based on cockroach middle leg could transi-
tion from forward walking to inside and outside turning by altering the sensory effect
pathways (Rutter et al., 2011).
2.7.2 Phonotaxis
Webb and colleagues have developed successive robots whichmodel the phonotactic
behaviour of crickets, using Schildberger’s (Schildberger, 1984b) low- and high- pass
filter approach. The first model (Webb, 1995) was implementedon a LEGO robot. The

30 Chapter 2. Background
algorithm passes the auditory input from both sides througha phase cancelling process,
lateralizing the sound of the species song frequency. Whenever the ear input value of
one side reaches a threshold value, a turn in the appropriatedirection is initiated. The
first robot was only capable of reacting to slow syllable rates and therefore the model
was transferred to a Khepera robot (Lund et al., 1997), capable of executing the model
at cricket speed. The next model (Webb and Scutt, 2000) reimplemented the first model
using spiking neurons. The most recent model (Reeve and Webb,2003) approaches
the internal structure of the insect neurophysiology, by including some of the identified
auditory neurons (ON1, AN1, BNC1, BNC2) and the connections between them, as
described in section 2.6. All the models were tested in a lab environment. The last
model was used in outdoor experiments, using a Whegs robot (Horchler et al., 2004)
with the ears mounted in the front part. Although the size of the robot prevented
comparisons with the real crickets, it could reproduce the sound localisation of the
insect when tested in a noisy environment, show preference for the species pattern of
the song and distinct between competing sound sources.
In both robot implementations the distance between the two ears is fixed, while
in the real cricket the distance between them relative to theears changes while the
insect moves. None of the aforementioned models has ever been tested on a multi-
segmented legged robot, which could solve the Whegs sharp turns problem. Webb
(2006) proposed a new modification to the current model inspired by the the more
recent experiments on phonotaxis (Poulet and Hedwig, 2005). The key modification is
a direct connection from the AN1 neurons to the motor control, which is modulated by
the BN1 and BN2 neurons. This model has yet to be tested on a robot.
2.8 Open Questions
The current literature review reveals the lack of information in several aspects of the
phonotactic behaviour and is summarized in the following questions:
From section 2.4:
• Can there be an alternative methodology to investigate the phonotactic behaviour,
that allows detailed information about the body and leg movements of the cricket
along with precise auditory input to be obtained while the insect is freely walk-
ing?
From section 2.5:
2.8. Open Questions 31
• What is the motion of each thoracic segment and body part during forward walk-
ing and turning?
• What is the motion of each individual leg joint during forwardwalking and turn-
ing?
• What are the similarities and differences with other insects?
• How do the legs coordinate during straight walking and turning?
• What is the speed of the cricket’s response?
• Are the turns proportional to the sound direction?
• What is the accuracy of the sound tracking and what deviation causes correc-
tions?
From section 2.6:
• What information might the cricket need to modulate its walking?
• What input might the motor neurons need?
From section 2.7:
• Does the cricket data resemble control mechanisms suggested for other insects
for straight walking and turning?
In order to address these questions, I created a new methodology inspired by the
limitations provided in section 2.4 and presented in the following chapter. The method
will allow detailed data about the movements of a female cricket to be gathered while
it performs phonotaxis. Further analysis presented in chapter 4, will allow the investi-
gation of the remaining questions posed above.


Chapter 3
Methodology
N.B.The data presented in this chapter also appears in (Petrou and Webb, 2012).
3.1 Introduction
I concluded the previous chapter by indicating the open questions derived from the
current literature. To address these questions I developeda method which is presented
in this chapter. The overall aim of this method is to track themovements of a female
cricket as it walks on a flat surface during orientation to sound under free walking con-
ditions. It is necessary to film from underneath because all the joints are only visible
from below the insect. Additionally, because of the insect’s speed the videos need to
be high-speed and two cameras have to be used that will allow 3D reconstruction of the
joints. Finally, the information about the joint movementsneeds to be synchronized
with the sound pattern.
The method I describe here generates joint angle data directly by incorporating an
optimization algorithm which fits a kinematic model of the insect to the detected joint
marker positions of each frame. This in turn supports more effective automation of
tracking of the marker positions, building on the image processing methods described
in Bradski and Kaehler (2008), Hedrick (2008) and Bender et al.(2010). This combi-
nation of methods enables tracking a cricket in a new experimental setup in which the
animal can walk freely. The floor of the arena is transparent and thus I can film the
animal from below, using two cameras to obtain three dimensional information about
all leg joints. Instead of using a slippery surface, which alters the forces, or a treadmill
in which the ground moves to keep the animal in the camera image, I instead move
the cameras to follow the animal. The video is then processedoffline by software that
33

34 Chapter 3. Methodology
automates the identification and tracking of joint markers,and reconstructs the motion.
I demonstrate the system by tracking all leg joints and six body joints, synchronised
with the sound pattern, for a cricket initiating a turn to sound from a standing start and
walking towards it.
First I describe the materials and the methods used during the experiments includ-
ing the arena, the preparation of the crickets, the experimental protocol and the acoustic
stimulation (section 3.2). Then I present the software and its modules I developed to
extract useful information from the video sequences (section 3.3). Finally, I present
results from one experiment and evaluate the method (section 3.4).
3.2 Materials and methods
3.2.1 Arena
The setup (figure 3.1) consisted of a wooden (MDF) rectangular box with a transparent
bottom made of acrylic plexiglass (3mm thick). The floor was slightly scratched with
a knife providing friction while the insect walks on it, but preventing significant loss of
image information during camera recordings. The walls and the ceiling were covered
with a sound absorbent material (Audio 90/125 Illtec, Illsonic, Illbruck, Germany) to
reduce sound reflections. Four fluorescent bulbs (75 W, Philips, Holland) provided the
necessary light for the high speed recordings. I found that fluorescent light produces
less flickering than ordinary bulbs, which is crucial for thetracking algorithms. Two
speakers (Samsung SMS-2200), positioned on the left and right side of the box, were
used to attract the insects, by alternately playing the calling song. The sound output
was controlled by a custom made circuit equipped with a switch to change the direction
of the song. In synchrony with the sound pattern this circuitflashed one of two LEDs,
located under the arena and not visible to the animal, depending on the sound direction
and status.
Two high speed colour cameras (Exilim EX-F1, Casio Co. Ltd., Tokyo, Japan;
used with aperture 2.7, shutter speed 1/1000 s, ISO 1600, zoom 36 mm lens, focus
(distance to animal) approximately 10 cm, resolution 512 X 384 pixels) were located
under the plexiglass floor. Each imaged the same floor area of approximately 10 cm
X 7 cm (a cricket covers an area around 4 X 2 cm) providing an effective resolution
of about 5 pixels/mm, and capturing both the movements of theinsect and the LED
signal corresponding to the sound pulses. It was not possible with the cameras used

3.2. Materials and methods 35
to obtain direct synchronisation between them, so the LED onset was also used to
synchronise the cameras. Thus, recording at 300 fps , there could be a maximum
difference of 3.33 ms between the left and right frames. In this worst case scenario,
i.e., the largest possible time gap between frames, I estimate from my data that the
fastest moving point on the cricket (the hind leg tarsus during swing) would change
position by no more than 1mm. I also verified that the potential delay does not add
significant inaccuracy in practice by selecting marked points from the left frame and
checking that the epipolar line in the right frame was over the corresponding point in
the right frame. This was done after the calibration procedure described in section
3.3.1.
The relative position of the cameras was fixed using an aluminium triangle frame-
work (35◦ degrees angle in the top of the triangle and 5 cm distance of the centre of the
cameras lenses from the transparent floor). The framework was placed on two rails,
one of them moving in the X-axis and the other in the Y-axis, and was moved by hand
to maintain the insect near the centre of the images as it walked in the arena. The
rails prevented rotation and translation around the Z-axisof the local coordinate sys-
tem, which simplified subsequent analysis. They also constrained the motion to slow
and steady movement—from the subsequent tracking I could calculate that movement
of the cameras almost never exceeded 0.2 m/s which is the speed at which the image
would be moved more than one pixel within one exposure at a shutter speed of 1/1000
s; consequently, this camera motion did not create significant blur. In order to construct
the global arena position from the local image position I marked the floor with a grid
of points, with 5 cm distance between neighbouring points. The points closest to the
edge of the arena were marked with a number which indicates the global position of
that point. Only one grid point is required for each frame to obtain the global position
as further explained in section 3.3.4.
The cameras produce RGB video files compressed in H.264 format. These were
first edited in Avidemux version 2.5 (http://fixounet.free.fr/avidemux/) to select the
frames of interest: from when the insect starts moving untilit hits the end of its tether
(see below) and the camera is moved towards the edge to find thecorresponding grid
number. I also changed the video container (from QuickTime to AVI) and rotated the
frames to represent left and right images for simplicity, before passing to the tracking
software described in 3.3.

36 Chapter 3. Methodology
(a)
(b) (c)
Figure 3.1: (a) The experimental setup with (b) top and (c) side schematics. Numbers in
(a) indicate (1) The left speaker position. (2) One of the fluorescent bulbs. (3) The circuit
and the switch that control the sound direction and LEDs. (4) Examples of planar and
non planar calibration objects. (5) The stereo camera system. (6) The LEDs mounted
on a thick metallic wire.
3.2.2 Animal Preparation and Experimental Protocol
Adult intact female crickets of the speciesGryllus bimaculatus(de Geer) were ob-
tained from a local supplier and separated into individual plastic cages, isolated from
the sound of male crickets, before their final moult, maintained on a 12h:12h L:D
photocycle and fed with dried dog food and water. Heat and light were provided by or-
dinary incandescent light bulbs. The experiments were performed at room temperature
(20 - 24◦C), and generally took place around the end of the light periodor beginning
of the dark period of the photocycle when the insect is most active (Loher et al., 1993).
Their age was between one and four weeks after the final moult.Prior to experiments,

3.2. Materials and methods 37
each insect was cold anaesthetized at 4-5◦C for approximately 15 minutes and then
placed on a block of Plasticine by restraining all legs with metal clamps. The two
top wings were removed and a light string was attached to the insect’s back, verti-
cally relative to the body, at the third thoracic tergite using a mixture of wax and resin
(50%−50%). The string was used as a tether to keep the animal in a restricted area in
the arena, so that it could not climb the walls. Small dots (approximately 1mm diam-
eter) of yellow paint (TexPen, Dykem, KS, USA) were applied on the leg joints and at
the centre of the thoracic segments.
The cricket was placed in the arena and the string attached tothe centre of the arena
ceiling. I gave the insect at least 1 hour to adjust to the new environment. A small twist
applied to the string when attaching it meant that it acted asa very soft spring, adopting
a helical shape to incorporate any additional length, and did not touch the ground or
interfere with the animal’s limbs. The recordings were started when the insect had
paused for some time near the middle of the arena, where the string is not stretched
and therefore did not affect its movements. In the example presented in section 3.4,
the sound was switched on from one speaker, and the cricket’smovements followed
until it reached the limit of its tether, after walking about35 centimetres. In most of
my recorded paths the insect first rotated on the spot in orderto orient itself relative to
the sound source and then walked almost directly towards thespeaker, usually without
stopping.
3.2.3 Acoustic Stimulation
An artificial calling song was used, modelled on maleGryllus bimaculatusat car-
rier frequency of 4.8 kHz, syllable duration of 21 ms including 2 ms rise and fall
time, syllable period of 42 ms, chirp duration of 252 ms and chirp period of 500 ms
(Thorson et al., 1982), generated by a MATLAB 7.7 (Mathworks, Natick, MA, USA)
script at 44.1 kHz sampling rate. The calling song was playedback by using Audacity
(http://audacity.sourceforge.net/) and presented by PC audio boards via the two active
speakers. Sound intensities were calibrated to 75± 1 dB at the centre of the arena
by using a sound level meter CEM DT-805 (Shenzhen Everbest Machinery Industry
Company Ltd., Shenzhen, China) angled towards the active speaker.

38 Chapter 3. Methodology
3.3 Software
The nature of my method requires the processing of a few thousand frames per exper-
iment. In order to avoid the manual digitization of multiplepoints in every frame, I
developed software to assist me in my effort.
The software package called CricketTracker was developed inC++.NET, using Vi-
sual C++ Express (Microsoft, Redmond, WA). The package integrates a GUI with
the OpenCV library version 2.2 (http://opencv.willowgarage.com), which I use for
the video processing as it offers many built-in image processing functions that I use
in my application. Most of the vision methods used in my system are described
in Bradski and Kaehler (2008). Furthermore, the software utilizes basic OpenGL
(http://www.opengl.org/) functions for depicting the 3D reconstruction of the tracked
data. My software includes modules for camera calibration,kinematic model defi-
nition, tracking of marked joints, tracking of grid points,tracking sound status and
direction, stance - swing transitions and playback. All thedifferent modules of the
software are explained in the following sections.
3.3.1 Calibration
The calibration module is used to calibrate the stereo camera system, using the Stere-
oCalibrate algorithm in OpenCV. The calibration can use either a planar chessboard or
a shape of known geometry and dimensions. In my case I used an object composed
of LEGOTMbuilding blocks (Lego, Denmark) marked with 60 points as thecalibration
object. The average RMS reconstruction error was 0.3586 millimetres, and average
RMS projection error 0.7856 pixels. Note this calibration takes into account cam-
era distortion, by fitting a polynomial transformation, andtherefore I can undistort
the video frames. During video recordings, the insect is usually near the centre of the
frames, but the grid points are sometimes near the edges where there is more distortion.
3.3.2 Kinematic Model (“Skeleton”)
In this module the user can define the kinematic model that will be used during the
tracking procedure. This consists of a definition of the joints and the segments, the
number of axes through which each segment can be rotated and thus the number of
angles defined for each joint, and the minimum and maximum possible values for each
of these angles (an angle can also be fixed at a constant value). The model has an
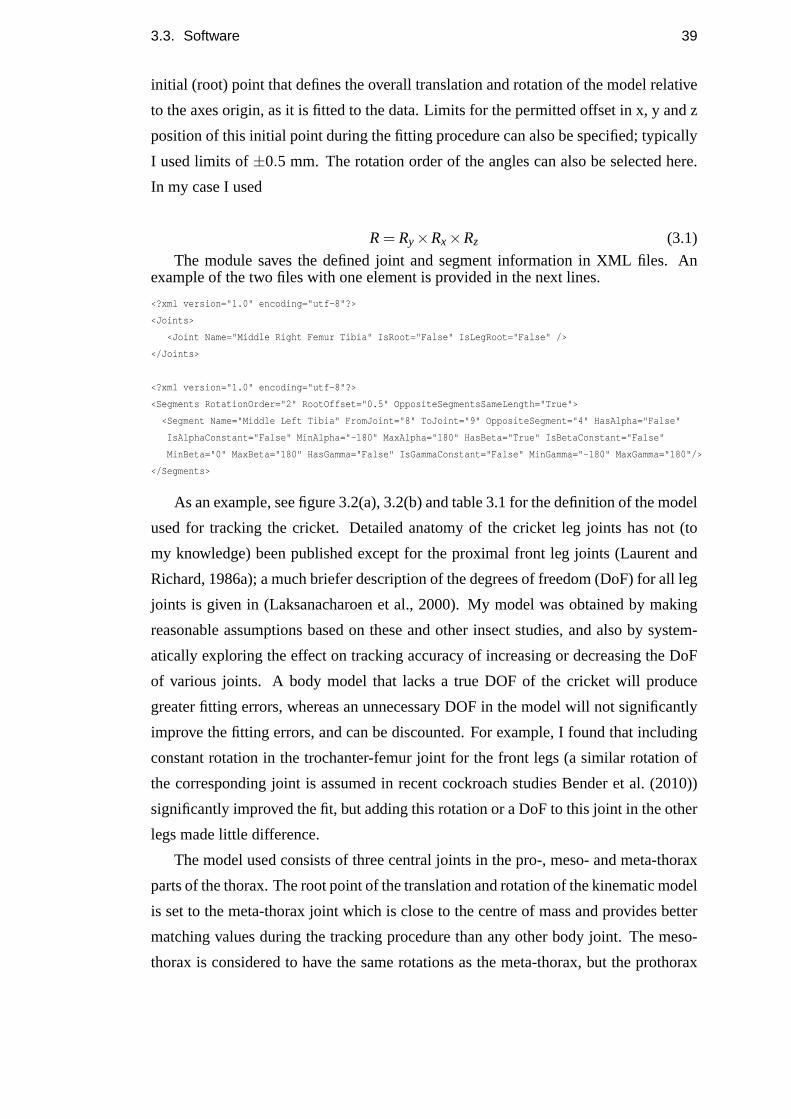
3.3. Software 39
initial (root) point that defines the overall translation and rotation of the model relative
to the axes origin, as it is fitted to the data. Limits for the permitted offset in x, y and z
position of this initial point during the fitting procedure can also be specified; typically
I used limits of±0.5 mm. The rotation order of the angles can also be selected here.
In my case I used
R= Ry×Rx×Rz (3.1)
The module saves the defined joint and segment information inXML files. Anexample of the two files with one element is provided in the next lines.
<?xml version="1.0" encoding="utf-8"?>
<Joints>
<Joint Name="Middle Right Femur Tibia" IsRoot="False" IsLegRoot="False" />
</Joints>
<?xml version="1.0" encoding="utf-8"?>
<Segments RotationOrder="2" RootOffset="0.5" OppositeSegmentsSameLength="True">
<Segment Name="Middle Left Tibia" FromJoint="8" ToJoint="9" OppositeSegment="4" HasAlpha="False"
IsAlphaConstant="False" MinAlpha="-180" MaxAlpha="180" HasBeta="True" IsBetaConstant="False"
MinBeta="0" MaxBeta="180" HasGamma="False" IsGammaConstant="False" MinGamma="-180" MaxGamma="180"/>
</Segments>
As an example, see figure 3.2(a), 3.2(b) and table 3.1 for the definition of the model
used for tracking the cricket. Detailed anatomy of the cricket leg joints has not (to
my knowledge) been published except for the proximal front leg joints (Laurent and
Richard, 1986a); a much briefer description of the degrees offreedom (DoF) for all leg
joints is given in (Laksanacharoen et al., 2000). My model was obtained by making
reasonable assumptions based on these and other insect studies, and also by system-
atically exploring the effect on tracking accuracy of increasing or decreasing the DoF
of various joints. A body model that lacks a true DOF of the cricket will produce
greater fitting errors, whereas an unnecessary DOF in the model will not significantly
improve the fitting errors, and can be discounted. For example, I found that including
constant rotation in the trochanter-femur joint for the front legs (a similar rotation of
the corresponding joint is assumed in recent cockroach studies Bender et al. (2010))
significantly improved the fit, but adding this rotation or a DoF to this joint in the other
legs made little difference.
The model used consists of three central joints in the pro-, meso- and meta-thorax
parts of the thorax. The root point of the translation and rotation of the kinematic model
is set to the meta-thorax joint which is close to the centre ofmass and provides better
matching values during the tracking procedure than any other body joint. The meso-
thorax is considered to have the same rotations as the meta-thorax, but the prothorax

40 Chapter 3. Methodology
has three DoF. The rest of the joints were introduced in chapter 2 in section 2.3.1. The
TiTa joint is marked but the rotation of the tarsus is not estimated; and a single marker
is tracked for the CTr and TrF joints, which jointly act to rotate the femur relative to
the coxa. The front legs (figure 3.2(e)) have three DoF in the ThC joint (Laurent and
Richard, 1986a), a one DoF hinge CTr joint, a constant 45◦ rotation of the TrF joint,
and a one DoF hinge FTi joint. The middle legs (figure 3.2(d)) have three DoF in the
ThC joint and one DoF hinge CTr and FTi joints; the TrF joint does not move. The
hind legs (figure 3.2(c)) similarly have three DoF in the ThC joint, a one DoF hinge
CTr joint and a one DoF hinge FTi joint.
Once the model has been defined, it needs to be initiated by theuser manually
selecting a point corresponding to each defined joint in the first frame of the tracking
data, for each camera. The selected points are then triangulated, using the calibration
information, to obtain the 3D positions. From this, the length of each segment can
be calculated. If the user selects the appropriate option the length of each segment is
derived by calculating the mean value of the left and right corresponding segments.
For instance, the front coxa length (FC) is calculated by using the front left (FLC) and
right (FRC) coxa length:
FC= (FLC+FRC)/2 (3.2)
The symmetrical values are used because I assumed both sideshave the same seg-
ment lengths and this simplifies subsequent analysis of the results. Alternatively the
user can allow the model to remain asymmetric,i.e., using the raw values for the FLC
and FRC respectively. The initial values of the angles of the kinematic model are de-
rived by taking the mean value of maximum and minimum permitted value for each
angle (see table 3.1) which have been set to very generous values at the limits of plau-
sible motion. For instance the average value of the front right FTi joint is derived by
the type:
FRFTi= (MaxFTi+MinFTi)/2 (3.3)
whereMaxFTi= 180◦ andMinFTi = 0◦. An initialised model for the cricket is
illustrated in figure 3.2b.
3.3. Software 41
3.3.3 Tracker
The tracker uses constrained nonlinear optimisation to fit the kinematic model to the
joint markers extracted from each image pair, where finding and identifying each joint
marker is based on an image matching process that uses the joint positions estimated in
the previous frame. The software interface is shown in figure3.3. For convenience of
explanation I will first describe the fitting procedure, assuming that a potential match
for each joint has been extracted from the current images andtriangulated to obtain an
x,y,z position estimate. The aim is to find the optimal estimate of the model angles to
minimise the deviation of the model joint positions from theimage estimates, given
the fixed distances between joints and limits of joint motionthat has been set in the
initialisation procedure described above.
I used an active set algorithm (ASA) for constrained nonlinear optimization as
described in Hager and Zhang (2006) and implemented in the ALGLIB version 3.2
(http://www.alglib.net) library to minimize the euclidean distance between the joints
of the kinematic model and the estimated positions from the images (Equation 3.4).
Active set algorithms are a group of methods used to solve optimization problems with
equality/inequality constraints. The name of the method isderived from the fact that
at a current point each constraint is either active or inactive. The algorithm reduces
the problem from an equality/inequality constrained problem to a sequence of equality
only subproblems that can then be solved and used as the basisof an iterative process.
During this procedure, the active constraints are treated as equality ones and the in-
active are ignored. The algorithm utilizes a conjugate gradient method (Hestenes and
Stiefel, 1952) internally for the optimization.
f (x) =n
∑n=1
wn
3
∑i=1
‖pi −qi‖2 (3.4)
wherepi is the position in the model,qi the estimate, andwn is the weight for each joint.
The weights reflect the output of the matching algorithm, described further below, such
that estimates based on good matches have a higher influence on the fitting procedure,
and poor matches will have less effect.
Because the algorithm I use is not gradient-free I used a four point centre formula
to estimate the gradient for every variable.
∇ f (c) = (∂ f∂q1
(c), . . . ,∂ f∂qn
(c)) (3.5)
42 Chapter 3. Methodology
∂ f∂qi
(c) = 112h( f (q1, . . . ,qi −2h, . . . ,qn)
−8 f (q1, . . . ,qi −h, . . . ,qn)
+8 f (q1, . . . ,qi +h, . . . ,qn)
− f (q1, . . . ,qi +2h, . . . ,qn))
(3.6)
wherec represents the kinematic model chain andq0,q1, . . . ,qn the parameters of
the model andh = 0.1. Computation of the gradient value for every parameter takes
place in a separate thread to increase speed.
For the first image pair, the estimated joint positions are simply those chosen by
the user during the initialisation process (and all the weights are set equal to one). The
initialised kinematic model (figure 3.2b) is optimally fitted to these estimates. The 3D
model co-ordinates are then used to define the template imageof 8 X 8 pixels and
the search region for each joint marker in the next frame pair, by reprojecting their
locations to each image, and defining a window of 20 x 20 pixelsaround them. A
Kalman filter (Kalman, 1960) is also initialised and is used to predict the position of
each marker in the next frame, assuming it maintains a constant velocity, in case a
particular joint marker cannot be located in a particular image, which is usually the
result of occlusion.
The marker is located within the window using either template matching by nor-
malized cross correlation, or colour histograms (figure 3.4). I used the standard algo-
rithms available in the OpenCV library (MatchTemplate with methods
CV TM CCORRNORMED and CalcBackProjectPatch; see http://opencv.itseez.com/).
This provides both a location estimate and a value for the goodness of the match (val-
ues range between zero and one with the latter providing a perfect match). If this value
is equal or greater than a threshold value (in my case 0.8), I have a positive match. The
weight to be used in optimisation is then derived by dividingthis marker’s match value
by the minimum template matching value of the current frame:
Wi =Vi/Vmin (3.7)
Additionally, the software can utilise image filters such asbackground subtraction,
contrast and brightness adjustment, colour filtering, binary thresholding, and smooth-
ing to enhance the matching procedure. The user can apply anyof these filters by
selecting them in a property grid. During tracking image filters are applied only within
the search regions to reduce computational cost.
If a point is not positively located by the matching procedure, then the Kalman

3.3. Software 43
prediction is used to indicate the missed point if it falls within the search region. The
weight value for the predicted point is equal to the value returned by the matching
procedure (between 0.4 and 0.8). If the match value is below half of the matching
threshold value (i.e.,in my case, 0.4), or the prediction of the Kalman filter fallsoutside
the search region, the algorithm stops and the user needs to select the missed point
from the current image. Typically the algorithm works uninterrupted (i.e. tracks all
27 points without violating the stopping criteria) for about 30-80 frames. The most
common problem that stops the algorithm is the failure to track the front ThC joints.
This happens because the front coxae are almost vertical relative to the body and thus
tend to occlude the ThC joints.
Once estimates for the positions for all the joints are obtained in the current image
pair, the kinematic model is fitted to the new data, as described above. Note that the
starting point for the optimisation in this case will be the model parameters fitted to
the previous frame. At high frame rates there should be minimal change in the angles,
making this fitting procedure efficient.
The final output of the tracking procedure is the set of positions and angles for
each joint for each frame in CSV (Comma Separated Values) file format. The soft-
ware allows the user to choose to apply three different techniques for smoothing of
the angles (cubic, hermite and penalized spline interpolation) as implemented in the
ALGLIB library. It can also smooth the root joint location (in this case the metathorax
joint) by using a moving average window formula used to reconstruct the translation
(see subsection 3.3.7).
3.3.4 Grid
The Grid module is used to track the grid points on the ground,which provides a ref-
erence frame to locate the kinematic model in real space (seesection 3.3.7). The user
gives the initial global position of each point visible in the image (X,Y,Z coordinates,
with the Z coordinate set to zero,i.e. the floor) and the range of frames that each
point is tracked. The global positions can be extrapolated from the final frames of the
sequence which always include an identified grid point on theedge of the arena (see
section 3.2.1). The tracking algorithm used is the same as the tracker module, except
in this case there is only one point tracked in each of the leftand right frames. The grid
coordinate positions are also smoothed by using a moving average window formula.

44 Chapter 3. Methodology
(a)
TiTa
TiTa
FTi
TiTa
FTi
CTr
CTr
FTi
ThC
CTr
ThC
ThC
ThC
ThC
ThC
CTr
FTi
CTr
CTr
TiTa
FTi
FTi
TiTa
TiTa
(b)
β
α
γ
β
β
(c)
β
α
γ
β
β
(d)
βα
β
β
γ
α
(e)
Figure 3.2: The kinematic model of the cricket. (a) The painted joints of the cricket’s
body and legs are indicated with yellow dots and the segments with cyan lines. See
table 3.1 for corresponding joint definitions. (b) shows the model with the initial angles
based on taking the midpoint of the defined limits of the angles for each segment. Each
joint potentially has three axes of rotation: roll α around the X axis (red); pitch β around
the Y axis (green); and yaw γ around the Z axis (blue). (c), (d), (e) show the joints of
the right hind, middle and front leg of the fitted model in the tracked data for a frame.
The purple lines indicate the tracked points and the blue lines the corresponding model.
Each leg has 3 DOF at the thoraco-coxal joint, and one DoF (β) at the coxo-trochanteral
and femoro-tibial joints; the front legs have an additional constant rotation (α) at the
trochanter-femur joint (co-located with the coxo-trochanteral joint).
3.3.5 Sound
The sound module is used to determine the sound state (on or off) and direction (which
end of the arena) by monitoring the LED indicators. In order to do that the user selects
the area in the image corresponding to each LED and gives a threshold for the colour.

3.3. Software 45
Joint Parameters Limits
Metathorax (0) x, y, z [x0−0.5 x0+0.5], [y0−0.5 y0+0.5], [z0−0.5 z0+0.5]
Segment Parameters Limits
Metathorax - mesothorax (0 - 1) α, β, γ [−30◦ 30◦], [−30◦ 30◦], [−180◦ 180◦]
Middle right coxa (2 - 3) α, β, γ (ThC) [−90◦ 90◦], [−30◦ 90◦], [−90◦ 90◦]
Middle right femur (3 - 4) β (CTr) [−180◦ 0◦]
Middle right tibia (4 - 5) β (FTi) [0◦ 180◦]
Middle left coxa (6 - 7) α, β, γ (ThC) [−90◦ 90◦], [−30◦ 90◦], [−90◦ 90◦]
Middle left femur (7 - 8) β (CTr) [−180◦ 0◦]
Middle left tibia (8 - 9) β (FTi) [0◦ 180◦]
Mesothorax - prothorax (1 - 10) α, β, γ [−30◦ 30◦], [−30◦ 30◦], [−30◦ 30◦]
Front right coxa (11 - 12) α, β, γ (ThC) [−90◦ 90◦], [−30◦ 160◦], [−90◦ 90◦]
Front right femur (12 - 13) α (TrF), β (CTr) 45◦, [−180◦ 0◦]
Front right tibia (13 - 14) β (FTi) [0◦ 180◦]
Front left coxa (15 - 16) α, β, γ (ThC) [−90◦ 90◦], [−30◦ 160◦], [−90◦ 90◦]
Front left femur (16 - 17) α (TrF), β (CTr) −45◦, [−180◦ 0◦]
Front left tibia (17 - 18) β (FTi) [0◦ 180◦]
Hind right coxa (19 - 20) α, β, γ (ThC) [−90◦ 90◦], [−90◦ 90◦], [−120◦ 0◦]
Hind right femur (20 - 21) β (CTr) [−180◦ 0◦]
Hind right tibia (21 - 22) β (FTi) [0◦ 180◦]
Hind left coxa (23 - 24) α, β, γ (ThC) [−90◦ 90◦], [−90◦ 90◦], [0◦ 120◦]
Hind left femur (24 - 25) β (CTr) [−180◦ 0◦]
Hind left tibia (25 - 26) β (FTi) [0◦ 180◦]
Table 3.1: The joints and segments of the model with parameters of the model and their
limits. The units for the joint limits are in millimetres and for the angles in degrees. I
used very generous limits due to the lack of prior information regarding the motion of
the cricket. For instance all the FTi joints can rotate from −180◦ to −0◦ which leads to
full flexion and extension of the tibia, which will never happen during the normal insect
walking patterns.
When the LED is on this means that the colour is brighter and therefore the algorithm
determines the sound as on. There is no significant delay between the sound output and
the LED flashing as the circuit controls both outputs at the same time. Note, however,
that as sound syllables are only 21 ms in duration, I may miss exact onset or offset by up
to 3.33 ms due to frame rate. I can solve this problem by resampling the sound output
as if it was every 1 ms and fitting the known pattern of the song by cross-correlating
the two patterns. Note that the LEDs are attached to the triangular frame holding the
cameras, and thus always stay in the same position in the image as the cameras are
moved to follow the animal. Thus no additional tracking is required. However, the
user needs to keep the camera frame positioned correctly around the animal to avoid
overlapping of cricket appendages by the LEDs.

46 Chapter 3. Methodology
Figure 3.3: A screenshot of the tracker module of the software. The two images show
the corresponding left and right frames containing the insect, the grid points and the
LEDs in the bottom. The user can save the data, fit the kinematic model in the selected
frame, begin tracking, save a video with the tracked points, reset settings and load the
appropriate help file by pressing the top buttons. The viewer tab shows the tracked
joints and segments in the OpenGL environment. The video buttons can be used to
play the video or move to a certain position. The current joint can be selected from the
combobox or by using the keyboard shortcuts. Information about the selected point co-
ordinates are also displayed. Each frame can be panned or zoomed by using the mouse
or the keyboard shortcuts. Undo-redo functions are also supported. Information about
each segment such as the length can be seen in the middle right area. The settings for
filtering the images and changing options for the algorithms and the appearance can
be set in the property grid in the bottom right corner.
3.3.6 Stance-Swing
The stance - swing module is used to output the stance - swing state of each leg. The
states for every leg can be determined by taking the Z coordinates of the TiTa joints
from the tracker data,i.e., swing is defined as whenever this joint has a Z value above
a threshold. In practice, the threshold Z-value for swing needs to be set separately for
each pair of legs (front, middle, or hind) due to the difference the leg geometries. Hind
leg TiTa joints touch the ground in stance, while front and middle leg TiTa joints do not
touch the ground. Typical values for the threshold were found experimentally (1.0 mm
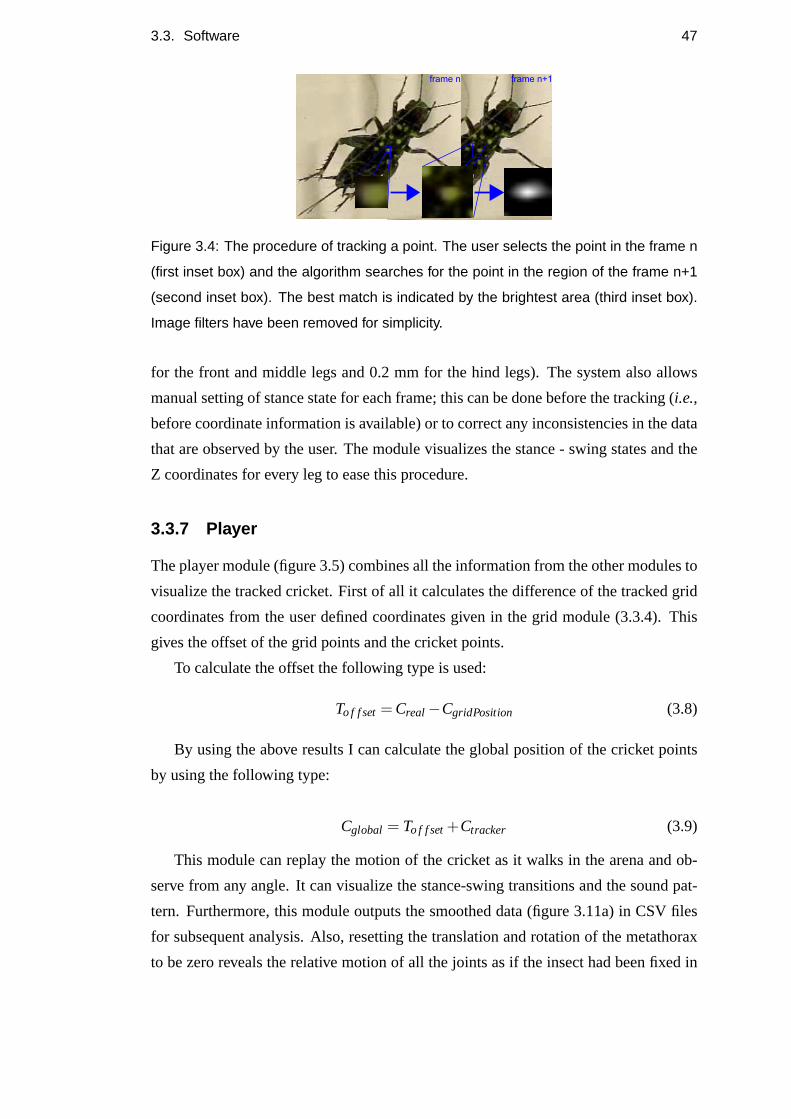
3.3. Software 47
Figure 3.4: The procedure of tracking a point. The user selects the point in the frame n
(first inset box) and the algorithm searches for the point in the region of the frame n+1
(second inset box). The best match is indicated by the brightest area (third inset box).
Image filters have been removed for simplicity.
for the front and middle legs and 0.2 mm for the hind legs). Thesystem also allows
manual setting of stance state for each frame; this can be done before the tracking (i.e.,
before coordinate information is available) or to correct any inconsistencies in the data
that are observed by the user. The module visualizes the stance - swing states and the
Z coordinates for every leg to ease this procedure.
3.3.7 Player
The player module (figure 3.5) combines all the information from the other modules to
visualize the tracked cricket. First of all it calculates the difference of the tracked grid
coordinates from the user defined coordinates given in the grid module (3.3.4). This
gives the offset of the grid points and the cricket points.
To calculate the offset the following type is used:
To f f set=Creal−CgridPosition (3.8)
By using the above results I can calculate the global positionof the cricket points
by using the following type:
Cglobal = To f f set+Ctracker (3.9)
This module can replay the motion of the cricket as it walks inthe arena and ob-
serve from any angle. It can visualize the stance-swing transitions and the sound pat-
tern. Furthermore, this module outputs the smoothed data (figure 3.11a) in CSV files
for subsequent analysis. Also, resetting the translation and rotation of the metathorax
to be zero reveals the relative motion of all the joints as if the insect had been fixed in

48 Chapter 3. Methodology
one position. This means the free walking data can be used forcomparison with sta-
tionary setups such as a cricket on a trackball turning (figure 3.11b) or forward walking
(figure 3.11c).
Figure 3.5: A screenshot of the player module of the software. The two boxes represent
the speakers. The right speaker is red to indicate that the sound is ON at the specific
frame. The player can show various properties of the data such as the path of the insect
(2), the stability polygon (3) and the legs that are in swing state (4).
3.4 Results
To illustrate the tracker output, I present results from onerecording sequence of the
insect. In this scenario the sound is played from the right speaker while the insect starts
facing towards the left speaker. When the sequence begins theinsect first turns almost
on the spot to face the right speaker and then starts walking towards the right speaker
until the string is stretched. I processed in total 27×2×6730+2×7887= 379,194 2D
points for the tracking of the insect and grid points, for these video sequences. I used
an HP 6735s laptop (AMD AthlonTMX2 DualCore QL-60 1.9 GHz processor, 4GB
RAM). The optimization time for the first frame takes about 20-25 secs and for the
subsequent frames 3-6 secs. The following figures show the data produced: the angles
of all the body joints (figure 3.6) and for the joints of the front (figure 3.7) , middle
(figure 3.8) and hind (figure 3.9) legs; a summary of the stance-swing transitions (figure

3.4. Results 49
3.10); and the reconstructed track and the motion of the feetrelative to the body (figure
3.11). From this a number of interesting features can be observed. More detailed
analysis of these and other features will be presented in thenext chapter.
There is clear movement of the mesothorax, including rhythmic bending of the
mesothorax-prothorax joint coupled to the stepping pattern in forward walking (figure
3.6). Both metathorax and mesothorax exhibit some roll into the turn. I should also
note that there is clear movement of the abdomen, neck and antennae in all the videos
but the monitoring of these movements is beyond the scope of the current experiments.
There are obvious differences between turning and forward walking. During for-
ward walking all body and leg joints follow a regular pattern, while in the case of turn-
ing there is much more variability in the values of the angles. However, it is evident
that all DoF are used in both forward walking and turning. Thedata are broadly con-
sistent with previous analyses of a cricket performing forward walking without sound
stimulus (Laksanacharoen et al., 2000), except that a clearer contribution of the ThC
joint to the hind-leg motion, and of the CTr joint to the front leg motion is observed.
In the approach to sound, there are at most two legs at a time inswing phase and
the insect never achieves a tripod gait (figure 3.10). There is no apparent coupling
between the chirp pattern and the onset of the stepping cycles (figure 3.10). From the
stance patterns, and in figure 3.8, it is obvious that the ipsilateral middle leg is not
stepping much during the turn, whereas the contralateral front and middle legs take
a higher number of steps, and both hind legs take fewer steps.This is in contrast to
experiments on a trackball (Witney and Hedwig, 2011). The ipsilateral hind leg also
makes smaller movements during turning. In figure 3.11 it is apparent that the front
and middle legs ipsilateral to the sound pull the body towards the speaker direction,
while the contralateral front and middle legs push the body.Similar contribution of
the middle legs has been observed in cockroaches (Mu and Ritzmann, 2005) and stick
insects (Gruhn et al., 2009).

50 Chapter 3. Methodology
Figure 3.6: Results for the body joint angles: red line is raw data and blue is smoothed
data. The green line indicates the end of a right turn by the insect and the beginning of
the forward walking towards the sound source. Each frame corresponds to 3.33 ms.

3.4. Results 51
Figure 3.7: Results for the front legs’ joint angles: red line is raw data and blue is
smoothed data. The green line indicates the end of a right turn by the insect and
the beginning of the forward walking towards the sound source. The grey rectangles
represent the swing phases for each leg. Each frame corresponds to 3.33 ms.

52 Chapter 3. Methodology
Figure 3.8: Results for the middle legs’ joint angles: red line is raw data and blue
is smoothed data. The green line indicates the end of a right turn by the insect and
the beginning of the forward walking towards the sound source.The grey rectangles
represent the swing phases for each leg. Each frame corresponds to 3.33 ms.

3.4. Results 53
Figure 3.9: Results for the hind legs’ joint angles: red line is raw data and blue is
smoothed data. The green line indicates the end of a right turn by the insect and
the beginning of the forward walking towards the sound source. The grey rectangles
represent the swing phases for each leg. Each frame corresponds to 3.33 ms.

54 Chapter 3. Methodology
(a)
(b)
Figure 3.10: The stance swing transitions for all the legs for (a) right turn and (b) forward
walking for the first and last 1800 frames (12 secs) for the same walking sequence as in
figures 3.6-3.9. Stance with sound off is marked with black and with sound on with red
colour. Swing with sound off is marked with white and swing with sound on is marked
with purple colour. From top to bottom, front right (FR), middle right (MR), hind right
(HR), front left (FL), middle left (ML) and hind left (HL). Notice in the turn the higher
number of swing transitions of the left side legs compared to the right legs and the
speed of the legs during swing phase in general. Each frame corresponds to 3.33 ms.

3.4. Results 55
(a)
(b) (c)
Figure 3.11: The transformed smoothed (a) path from the combination of tracking infor-
mation and the grid points, using the TiTa joints and the thorax joints. The cyan colour
indicates the stance phase of the legs, the purple colour the swing phase and the blue
colour the thorax position. I can also reconstruct the position of the insect as it would
be fixed in one position by simply resetting the translation and rotation of the metatho-
rax. These are the smoothed results taken from the walking sequence shown in (a) and
separated into the turning (b) and walking (c) component of the sequence. This allows
the comparison of the performance with trackball results such as those by Witney and
Hedwig (2011).

56 Chapter 3. Methodology
Finally, I compare the joint position and angle estimates resulting from the tracker
to the same points estimated by manual digitisation. I digitised every tenth frame
throughout the sequence, providing a total of 500 estimatesof the tracking ‘error’
for each joint. As shown in figure 3.12(a), the difference wasin general less than
0.5mm, with the largest differences occurring for the hind CTr joint still less than 1mm.
This compares favourably to the results in Bender et al. (2010) which fall between
0.5mm and 1.5mm. However, note that this could as well be interpreted as the size
of ‘human error’ relative to the automated tracking and model fitting as vice-versa; in
particular, fitting the model is essentially a method that corrects for any errors in precise
localisation of the marker. I then used the law of cosines to estimate the maximum
difference in estimates of angles that could be produced by the observed difference in
the position estimates (figure 3.12(b)).
arccos2×segmentLength2− jointDi f f erence
2×segmentLength2(3.10)
Note that for each joint this is done for one degree of freedom. Therefore for 3
DoF joints (ThC) I am estimating based on a ‘worst case’ scenario in which the error
is assumed to be entirely due to one of these DoF while the other two have zero error.
Not surprisingly, given that the coxa segments are quite small (for example hind coxa
is 1.6 mm), this methods results in a relatively large maximum error estimate for the
ThC joint angles.

3.4. Results 57
(a)
(b)
Figure 3.12: (a) Deviation in tracking acuity (in mm) by the tracking algorithm compared
to manual digitization for 500 frames. The difference is generally less than 0.5 mm.
(b) Estimated maximum error in joint angles (in degrees) that could result from the
observed deviation in tracking acuity.


Chapter 4
Analysis
4.1 Introduction
In the previous chapter I described a method to track the joints of a female cricket while
it performed phonotaxis. In this chapter I present an analysis based on the results
from all the videos I recorded when the crickets responded tothe sound signal. All
specimens were given up to 5 minutes to respond. These results are based on 16
different crickets. There are 2 experiments per cricket andtherefore 32 experiments in
total. Sound was presented 19 times from the right speaker and 13 from the left speaker.
There are 17 right turns and 15 left turns. There are four combinations of speaker -
turn direction (11 times right speaker - right turn, 8 times right speaker - left turn, 6
times left speaker - right turn and 7 times left speaker - leftturn). The first 8 crickets
were tracked for both turning and forward walking, while thelast 8 crickets were
tracked only for the initial turning, to gather more information and samples regarding
the turning behaviour. In total, 308,398 grid points and 4,902,768 tracker points were
obtained, giving a total of 5,211,166 2D points, resulting in 2,605,583 3D points, most
of which were tracked by the tracking software.
Table 4.1 presents a summary of the overall video processing. I define turn latency
as the period from the first sound pulse played by the speaker until the first anten-
nal movement. Only one cricket responded to the first chirp. Average turn latency
was 52.54±55.55 sec (mean±SD) with maximum latency 208.13 sec, minimum la-
tency 0.27 sec, median latency 34.84 sec and kurtosis 3.14 (for distributions see figure
4.1). Average turn duration was 3590.63±1636.09 ms with maximum duration 8570
ms, minimum duration 1636.09 ms, median duration 3815 ms andkurtosis 3.85 (for
distributions see figure 4.1). These values take into account periods when some of
59

60 Chapter 4. Analysis
the crickets had stopped during the turn. Most crickets did not stop after the turn
(N=27) but about half of them stopped at least one time duringturning or forward
walking (N=14). This is in contrast with earlier studies where there was no disconti-
nuity in the movement between the turn and subsequent forward walking (Scapsipedus
marginatus; Murphey and Zaretsky, 1972). I defined a stop as a period of atleast 90
frames (≈300 ms), a value within the stepping cycle reported in earlier studies (Lau-
rent and Richard, 1986b; Witney and Hedwig, 2011), where all the legs were touching
the ground and the rest of the body was not moving. These results include the crickets
that were tracked only during turning but the videos also include their forward walking
behaviour and therefore I was able to determine the number oftimes they had stopped.
Although not explicitly tracked, it was observed in the videos that the insects’
antennae are the first moving part and scan the area in front ofthe head. The time
taken from the first move of the antennae until the cricket lifted its first leg in order
to turn was between 10 and 1806 ms with a mean value 443.54±416.9 ms, median
value 346.67 ms and kurtosis 5.8 (for distributions see figure 4.1). Both antennae
turn towards the direction of turning when the cricket initiates its turn. Also, head
orientation is shifted towards the turning direction. Thislead response of the antennae
and the head has been observed before in stick insects (Durr and Ebeling, 2005).
In the following sections, I address specific questions thatwere posed in chapter
2. Note that a direct comparison with results from other studies on crickets or other
insects is not possible, since the methodologies followed either use more constraints
on the insect motion and therefore movements are not exactlysimilar to freely walking
conditions, or if the insect is walking freely the study doesnot provide the amount of
information gained with the method followed in this thesis.First I analyse the results
of the individual leg and body angles (section 4.2). Then I present the leg coordination
results (section 4.3). Furthermore, I analyse the angles ofthe thorax and the ears in the
front legs with respect to the centre of the speakers (section 4.4). Finally, I present an
estimation of the ears input while the cricket performs its phonotactic response (section
4.5).

4.1. Introduction 61
C E S TD TL TF FT TT TS SN AM
01 01 R R 13890 7944 6731 1801 0 0 106
01 02 L R 8003 6593 5251 431 0 0 103
02 01 L L 28927 6593 5641 1474 281 1 72
02 02 R L 31059 10040 9311 1051 0 2 338
03 01 R R 12898 5395 4901 621 0 1 53
03 02 L R 6681 4796 4311 583 0 1 10
04 01 R R 2928 3147 2561 480 0 0 3
04 02 L L 2447 4945 4301 852 941 1 105
05 01 R R 21692 5994 4091 1471 0 0 161
05 02 L L 19294 8092 7171 2571 0 1 542
06 01 R R 4116 5844 4201 1351 0 0 159
06 02 L L 4553 4496 2861 583 0 1 96
07 01 R L 1561 3746 3161 561 0 0 60
07 02 L R 384 3896 3091 1281 0 1 123
08 01 R R 311 3896 2751 1186 0 0 458
08 02 L R 489 3297 2271 582 0 1 17
09 01 L R 22262 2247 971 884 0 0 33
09 02 R L 39280 3296 1701 1680 0 0 69
10 01 L L 13012 3597 1841 1841 0 0 192
10 02 R R 26658 2397 911 911 0 0 61
11 01 R R 82 1799 861 861 0 0 106
11 02 R L 179 2247 1261 1232 0 0 234
12 01 R L 4649 9140 541 436 0 2 49
12 02 R L 31329 5850 1281 1148 881 2 84
13 01 L L 41469 2098 1191 1191 0 0 216
13 02 R L 16684 1348 671 620 0 0 41
14 01 R R 479 2847 1401 1374 0 0 12
14 02 R R 39628 4495 1391 1322 0 0 157
15 01 R L 44724 10039 1231 1231 0 2 231
15 02 L L 62439 9740 1211 1211 1235 2 205
16 01 L R 574 1648 581 508 0 0 11
16 02 R R 1718 2697 1141 1141 271 1 151
Table 4.1: Time properties for all the experiments. Cricket number (C), experiment
number (E), speaker(S), left (L), right (R), turn direction(TD), turn latency(TL), total
frames (TF), tracked frames (FT), turn time frames (TT), stop duration after turn in
frames (TS), number of stops (SN) and antennae and head movement frames before
first leg swing (AM). Each frame corresponds to 3.33 ms.

62 Chapter 4. Analysis
Figure 4.1: Distributions of time properties for all the experiments. Turn latency (top
left), turn duration (top right) and antennae movement (bottom).
4.2 Single Leg and Body Angles
In this section I address the following questions:
• What is the motion of each thoracic segment and body part during forward walk-
ing and turning?
• What is the motion of each individual leg joint during forwardwalking and turn-
ing?
• What are the similarities and differences with other insects?
I distinguish between the initial left and right turn when the crickets turn to orient
themselves towards the sound source and the rest of the walking behaviour which is
termed as forward walking. Note that the walking patterns produced are never perfectly
straight and each side of the insect does not produce exactlythe same body and leg joint

4.2. Single Leg and Body Angles 63
patterns. I define the beginning of turning as the time when the insect begins moving its
antennae and head. In order to determine the end of turning, Iinspected the videos and
the 3D reconstruction of the insect in the Player module, to find when the insect began
walking approximately forward after the initial turn. All the legs had completed their
step cycle before the defined end of the turn. In most turns thecrickets either turn on
the spot or produce a U-shaped turn pattern similar to previous results on honeybees’
turning behaviour (Zolotov et al., 1975). However, in contrast to the aforementioned
study and results from tethered stick insects (Gruhn et al.,2009) and freely walking
flies (Strauss and Heisenberg, 1990), it was observed that the ipsilateral middle leg
halted during turning rather than the ipsilateral hind leg.
I first gathered the periods where each leg was in swing mode. Then, based on
the coordinates of the TiTa joints at the beginning and at theend of swing I calculated
the average distance that each leg had travelled. The same procedure was also per-
formed for the trackball coordinates (i.e. distances relative to the cricket’s own body).
Furthermore, I calculated the number of swing transitions that each leg had made.
It is clear that during right turns the left legs from all the thoracic segments cover
longer distance than those on the right side (table 4.2) and correspondingly the oppo-
site case happens during left turns. This is in contrast withresults from stick insects
where the front contralateral to the turn leg had the same stride length as forward walk-
ing (Gruhn et al., 2009). Change in the step length on one side relative to the other has
been observed before in experiments in stick insects (Graham, 1972) and cockroaches
(Franklin et al., 1981) and on a trackball in crickets (Witney and Hedwig, 2011). Dur-
ing forward walking both sides cover the same distances. Thefront and the middle
legs cover similar distances, while the hind legs cover slightly longer distances. This is
easily explained by the length of the leg segments. However,the trajectory of the front
and middle legs is more like an arc and the hind legs’ is closerto a straight line (figure
4.2).
If the same properties are calculated for the converted trackball coordinates, they
produce similar results (table 4.3). The only difference isthat the legs cover smaller
distances. This is expected because if the insect is fixed on atrackball, its body is not
moving forward as the legs move.
The number of swings and the timing of the leg movements also reveals the con-
tribution of each leg to turning (table 4.4). The most clear difference with respect to
turning regards the middle legs. The middle leg ipsilateralto the turn is lifted off the
ground only a quarter to a half as many times as the contralateral middle leg, as the

64 Chapter 4. Analysis
L RT MV RT SD LT MV LT SD FW MV FW SD
FR 4.74 ±1.46 6.83 ±2.05 8.47 ±2.68
FL 7.21 ±2.47 4.76 ±1.82 8.50 ±2.98
MR 5.26 ±1.86 6.69 ±2.22 8.38 ±3.11
ML 7.49 ±2.13 4.65 ±1.98 8.26 ±3.07
HR 5.13 ±1.99 8.46 ±2.00 9.38 ±2.88
HL 9.78 ±2.57 5.37 ±2.22 9.64 ±2.79
Table 4.2: Mean values (MV) and standard deviations (SD) of swing distances for the
front right (FR), front left (FL), middle right (MR), middle left (ML), hind right (HR) and
hind left (HL) legs (L) in millimetres, during right turn (RT), left turn (LT) and forward
walking (FW). Note some variation is due to different size animals.
L RT MV RT SD LT MV LT SD FW MV FW SD
FR 3.74 ±1.25 5.63 ±1.62 5.81 ±1.61
FL 6.01 ±2.11 3.78 ±1.51 5.90 ±1.87
MR 4.45 ±1.51 5.30 ±1.80 5.73 ±2.02
ML 5.99 ±1.71 3.96 ±1.70 5.62 ±2.04
HR 4.32 ±1.69 7.10 ±1.83 6.87 ±2.11
HL 8.23 ±2.05 4.33 ±1.80 7.22 ±1.92
Table 4.3: Mean values (MV) and standard deviations (SD) of trackball swing distances
for the front right (FR), front left (FL), middle right (MR), middle left (ML), hind right (HR)
and hind left (HL) legs (L) in millimetres, during right turn (RT), left turn (LT) and forward
walking (S). Note some variation is due to different size animals.
insect turns to orient itself towards the speaker. This is incontrast with experiments
on a trackball (Witney and Hedwig, 2011) where no change in stepping frequency was
found. The front and the hind legs produce almost the same number of swings during
turning and forward walking, although with slightly less number of swings on the ip-
silateral to the turn side. Also the hind legs produce fewer swings compared to front
legs during turning.
In terms of timing, the front and the middle legs take a similar amount of time for
their swing during turning and the hind legs take more time. During forward walking
the front and the hind legs take the same amount of time to perform their swing while
the middle legs take less time. The ratio of protraction/retraction is significant lower for
the ipsilateral to the turn middle leg as expected (table 4.5). During forward walking

4.2. Single Leg and Body Angles 65
L RT N RT MV RT SD LT N LT MV LT SD FW N FW MV FW SD
FR 80 80.38 ±25.91 79 84.68 ±28.20 433 82.22 ±19.65
FL 87 77.97 ±26.09 73 92.92 ±33.60 450 82.26 ±19.52
MR 23 78.41 ±28.94 80 78.67 ±25.65 426 67.21 ±19.70
ML 76 78.33 ±28.71 39 74.19 ±21.04 432 65.88 ±18.06
HR 54 99.63 ±40.74 64 114.01 ±35.94 432 81.64 ±19.11
HL 63 114.07 ±40.41 55 114.42 ±50.17 427 81.52 ±20.66
Table 4.4: Number of swings (N), mean values (MV) and standard deviations (SD) of
swing duration for the front right (FR), front left (FL), middle right (MR), middle left (ML),
hind right (HR) and hind left (HL) legs in milliseconds, during right turn (RT), left turn
(LT) and forward walking (FW).
the ratio is similar for the front and hind legs. This in contrast with previous results in
crickets (Acheta domesticus; Harris and Ghiradella, 1980) and cockroaches (Delcomyn
and Usherwood, 1973) where the hind legs spend more time during forward walking
in swing than the front and middle legs. This might be explained by the fact that even
if the hind legs are longer, the front legs have larger range of movements. Also since
the percentage of each leg on the ground is very different forthe middle legs this is
in contrast with results in cockroaches (Franklin et al., 1981) where all six legs had
similar protraction/retraction rates during turning.
L RT MV RT STD LT MN LT STD FW MN FW STD
FR 0.22 ±0.17 0.19 ±0.10 0.32 ±0.17
FL 0.25 ±0.33 0.24 ±0.38 0.33 ±0.13
MR 0.07 ±0.04 0.25 ±0.49 0.25 ±0.16
ML 0.26 ±0.36 0.09 ±0.06 0.25 ±0.11
HR 0.20 ±0.29 0.26 ±0.25 0.31 ±0.10
HL 0.23 ±0.15 0.18 ±0.13 0.30 ±0.11
Table 4.5: Mean values (MV) and standard deviations (SD) of ratio of protraction /
retraction during right (RT) and left (LT) turns and forward walking (FW).
In order to calculate the change in angle of each joint duringeach stride I first
grouped all the samples of angles that are from the beginningof stance to the end of
swing for the left and right turns and forward walking. I did not take into account
the periods when the insects were stopped. Then, I used cubicspline interpolation

66 Chapter 4. Analysis
provided by the MATLAB’s spline function to resample the angle values into 100
values for each sample. Then I calculated the mean and standard deviation of these
samples. There are 180 figures in total (5 joints per leg× 6 legs× 3 types of walking
+ 5 body angles× 6 legs× 3 types of walking), most of which are provided in pages
70–77. I present three columns with figures for the forward walking in the left, right
turn in the middle and left turn in the right. Because each insect only made a few
steps during its initial turn, there are obviously fewer samples for the turns than for
the forward walking. This is especially salient for the inside middle legs during the
corresponding turn, since the leg is lifted off the ground very few times.
Many of the joint movements of the cricket are different between forward walk-
ing and turning. During forward walking the legs of each thoracic pair make similar
movements, while during turning there are obvious differences between all three pairs
of legs. This in contrast with experiments on a trackball (Witney and Hedwig, 2011)
and an arena (Scapsipedus marginatus; Murphey and Zaretsky, 1972) in crickets and
stick insects (Durr and Ebeling, 2005) where only the front and middle legs presented
changes. This can possibly be explained by the fact that the hind legs are the ones
affected most by the movement of the trackball. Also, the lowtemporal resolution of
the video recordings in earlier studies in an arena may have limited the accuracy of the
leg trajectory tracking.
The front leg ipsilateral to the turn direction increases its lateral movement while
it decreases its forward movement (figure 4.2). The front legcontralateral to the turn
direction increases its forward and lateral movement. The middle leg ipsilateral to the
turn is rarely lifted off the ground during turning and presents the smallest movement
of all the legs; decreasing its forward movement and increasing its lateral movement.
In contrast, the middle leg contralateral to the turn increases its forward and lateral
movement. The hind leg ipsilateral to the turn decreases itsforward movement and
increases its lateral movement. The hind leg contralateralto the turn increases its
forward and lateral movement. The prothorax moves towards the direction of the turn.
It is worth noting that during turns the ipsilateral to the turn middle leg’s TiTa joint is
the centre of a circle formed by the stance points. This fact suggests that a two-wheeled
robot that limits the movement or even stops one of its wheelsis actually a reasonable
approximation to the crickets turning behaviour.
The results of the individual joints show obvious differences during forward walk-
ing, left turn and right turn. I will refer to the differencesin the pattern in the right side
for every thoracic segment. This means that for the right turn this will be the inside leg

4.2. Single Leg and Body Angles 67
Figure 4.2: Top view of leg patterns during forward walking (top), right turn (bottom left)
and left turn (bottom right). Thorax is depicted with green colour, legs with blue and
trajectories with black. Note that the stance segments during turns appear to fall on a
circle with its centre to the ipsilateral to the turn middle leg’s TiTa joint.
and for the left turn the outside leg. The differences in the left side are similar, given
that some of the joints are expected to have the exact opposite pattern. For instance the

68 Chapter 4. Analysis
ThCα have opposite patterns in all the leg pairs. The results for the middle legs when
the leg is ipsilateral to the turn side are the noisiest ones since there are less samples
for the middle legs.
I will now briefly mention the effect of each joint DoF to the leg and body move-
ment, before presenting the results. ThCα rotates the coxa around its long axis. ThCβ
moves the coxa up or down. ThCγ moves the coxa forwards or backwards. CTrβ moves
the femur up or down. FTiβ moves the tibia in or out. Metathorax - mesothoraxα rotates
the metathorax - mesothorax segment around its long axis. Metathorax - mesothoraxβ
moves the metathorax - mesothorax segment up or down. Mesothorax - prothoraxα ro-
tates the mesothorax - prothorax segment around its long axis. Mesothorax - prothoraxβ
moves the mesothorax - prothorax segment up or down. Finally, the mesothorax -
prothoraxγ moves the mesothorax - prothorax segment right or left. See the first col-
umn of the figures in pages 70–77 for visualization.
The front right leg (figure 4.3), during forward walking stance phase increases
the ThCα, ThCβ and FTiβ angles and decreases the ThCγ and CTrβ angles. Then
during swing it decreases the ThCα, ThCβ and FTiβ angles and increases the ThCγ and
CTrβ angles. During right turn the ThCα angle remains the same throughout the step.
The ThCβ increases during stance and decreases during swing as before. The ThCγ
remains the same during stance until the last part when it increases and decreases
during swing. The CTrβ and FTiβ have similar pattern with forward walking. During
left turn the ThCα and ThCγ have similar pattern with forward walking. The ThCβ
is decreased during stance and increased during swing. The CTrβ remains the same
during stance and first decreases and then increases during swing. The FTiβ remains
constant throughout the step. This observation for the front leg contralateral to the turn
has been made before, although in less detail (Witney and Hedwig, 2011).
The middle right leg (figure 4.5), forward walking stance phase increases ThCα,
ThCβ and CTrβ angles while the ThCγ angle decreases and the FTiβ angle initialy
remains stable and then decreases. During swing the ThCα, ThCβ and CTrβ angles
decrease while the ThCγ and FTiβ angles increase. During right turn the ThCα and
ThCβ remain constant, while the ThCγ increases during stance and decreases during
swing. The obvious differences with forward walking is thatthe CTrβ decreases during
stance and increases during swing while the FTiβ follows the opposite pattern. This
has been observed before in cockroach escape response (Nye and Ritzmann, 1992).
During left turn all the joints have similar values with the forward walking. The FTiβ
has the opposite pattern than right turn.

4.2. Single Leg and Body Angles 69
The hind right leg (figure 4.7), forward walking stance phaseincreases ThCα and
CTrβ and decreases ThCγ and FTiβ. ThCβ remains constant throughout the step cycle.
During swing ThCα and CTrβ decrease and ThCγ and FTiβ increase. During right
turn ThCα remains constant while ThCγ increases during stance and decreases during
swing. ThCβ decreases during stance and increases during swing. CTrβ and FTiβ
angles have similar patterns with forward walking, but smaller range of values. During
left turn ThCα and ThCγ have similar values to forward walking. ThCβ increases
during stance and decreases during swing. CTrβ and FTiβ values are similar to the
right turn values.
In figures 4.9 - 4.10 I present the effect at the body angles relative to the step se-
quence of the front legs. The effect relative to middle and hind legs is similar. Metatho-
rax - mesothoraxα remains the same for forward walking and turning. Metathorax -
mesothoraxβ and Mesothorax - prothoraxβ slightly decrease during turning. Mesotho-
rax - prothoraxα and Mesothorax - prothoraxγ have similar patterns during forward
walking and turning but with different values, reflecting the bending of the body in
the direction of the turn. Therefore the bending of the prothorax contributes to the
positioning of the front legs as has been observed before on atrackball (Witney and
Hedwig, 2011).

70 Chapter 4. Analysis
Figure 4.3: Mean, standard deviation of angles values and number of samples (N) for
the front right leg during forward walking (left), right (middle) and left (right) turn. 0%
represents the start of stance and 100% the end of swing.
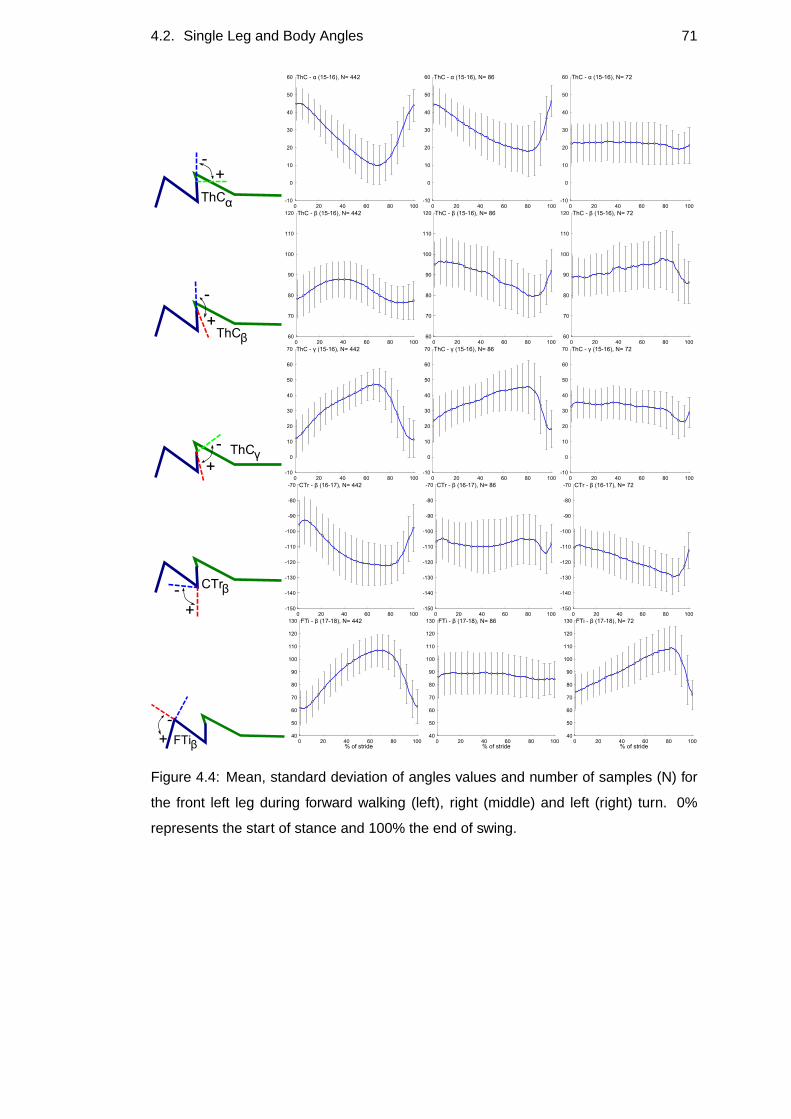
4.2. Single Leg and Body Angles 71
Figure 4.4: Mean, standard deviation of angles values and number of samples (N) for
the front left leg during forward walking (left), right (middle) and left (right) turn. 0%
represents the start of stance and 100% the end of swing.

72 Chapter 4. Analysis
Figure 4.5: Mean, standard deviation of angles values and number of samples (N) for
the middle right leg during forward walking (left), right (middle) and left (right) turn. 0%
represents the start of stance and 100% the end of swing.

4.2. Single Leg and Body Angles 73
Figure 4.6: Mean, standard deviation of angles values and number of samples (N) for
the middle left leg during forward walking (left), right (middle) and left (right) turn. 0%
represents the start of stance and 100% the end of swing.

74 Chapter 4. Analysis
Figure 4.7: Mean, standard deviation of angles values and number of samples (N) for
the hind right leg during forward walking (left), right (middle) and left (right) turn. 0%
represents the start of stance and 100% the end of swing.
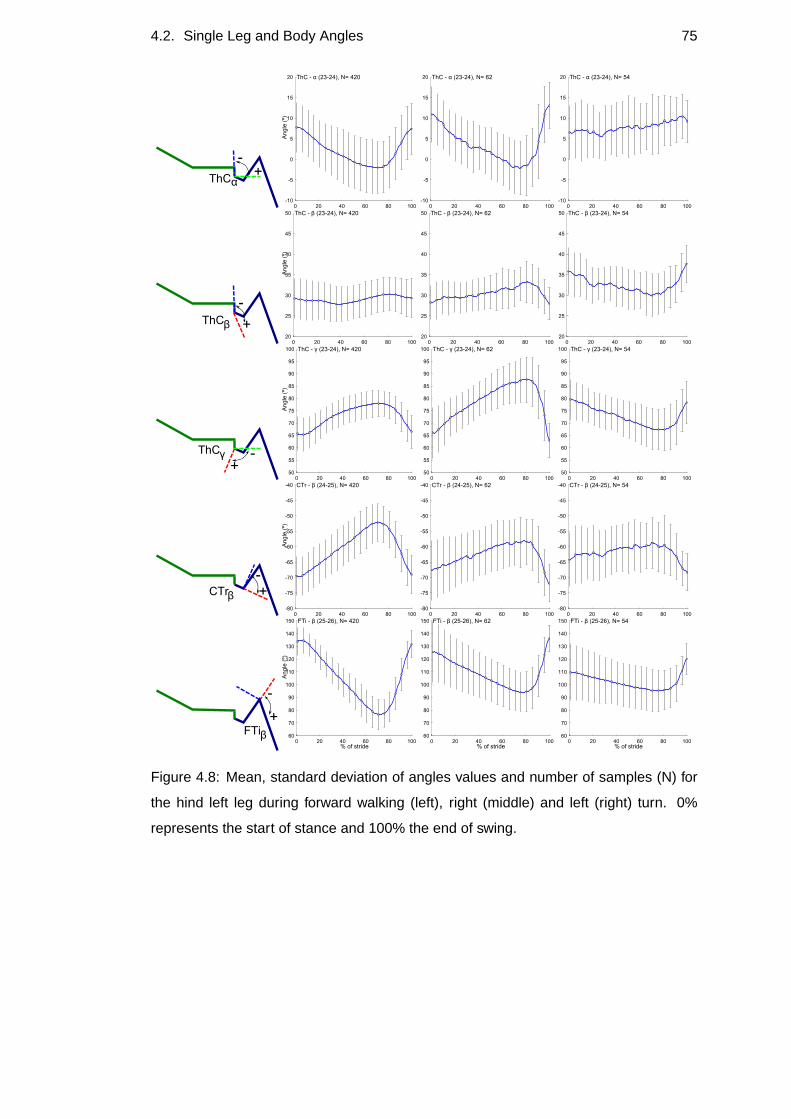
4.2. Single Leg and Body Angles 75
Figure 4.8: Mean, standard deviation of angles values and number of samples (N) for
the hind left leg during forward walking (left), right (middle) and left (right) turn. 0%
represents the start of stance and 100% the end of swing.

76 Chapter 4. Analysis
Figure 4.9: Mean, standard deviation of angles values for the thorax and number of
samples (N) relative to the stance-swing cycle of the front right leg during forward walk-
ing (left), right (middle) and left (right) turn. 0% represents the start of stance and 100%
the end of swing.

4.2. Single Leg and Body Angles 77
Figure 4.10: Mean, standard deviation of angles values for the thorax and number of
samples (N) relative to the stance-swing cycle of the front left leg during forward walking
(left), right (middle) and left (right) turn. 0% represents the start of stance and 100%
the end of swing.
78 Chapter 4. Analysis
In order to transition from forward walking to turning thereare some joints in each
leg that play a crucial role. For the front legs during contralateral turn the freezing of
the CTr and FTi joints are the most important, while for the ipsilateral turn reducing the
movement of all ThC joints produces inside leg motion (figure4.11). For the middle
legs reversing the movement of FTi and CTr joints and reducingthe movement of ThC
joints would produce ipsilateral turning, while for the contralateral turning the ThC
joints angles would slightly change (figure 4.12). The ThCγ would need to reverse
the movement to produce inside turning and have larger rangeof motion to produce
contralateral turning (figure 4.13).
Note here that the contribution of all three DoF in the ThC joint to the leg motion
make the results difficult to compare to standard models thatreduce this joint move-
ment to one DoF. Note also that crickets are making turns - or rather applying small
corrections to their heading direction - during forward walking. This is likely to in-
volve much more subtle changes to joint angles than sharp turns. Another general
observation is that the patterns of the angles are not sinusoidal and the change in direc-
tion is not necessarily aligned with stance - swing transition. I found no evidence that
the walking pattern or any leg angle variation is correlatedto sound pattern (results not
shown). This was also the result in previous studies using a trackball (Baden and Hed-
wig, 2008; Witney and Hedwig, 2011). Finally, because of themethodology I used, it
is difficult to separate the contribution of muscle activityand the mechanical structure
to the pattern of change. Slippery surface setups that decouple the legs between them
could provide supplementary data to this method (Gruhn et al., 2006; Bender et al.,
2010).
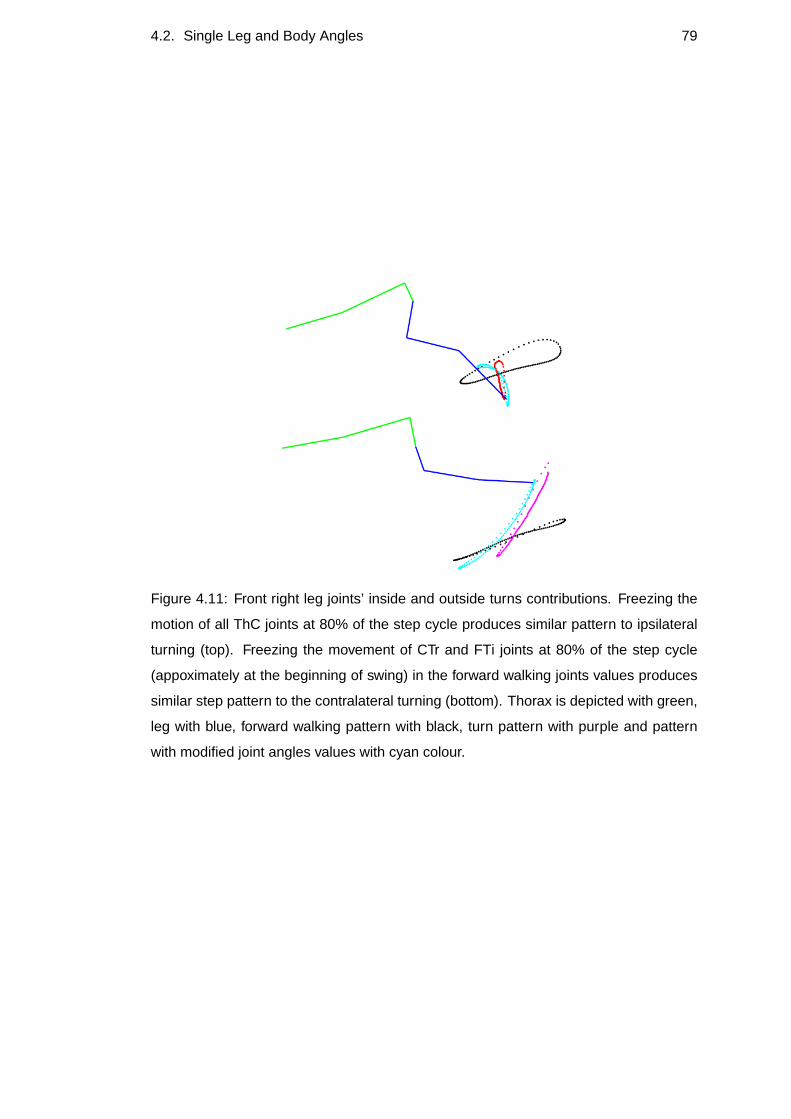
4.2. Single Leg and Body Angles 79
Figure 4.11: Front right leg joints’ inside and outside turns contributions. Freezing the
motion of all ThC joints at 80% of the step cycle produces similar pattern to ipsilateral
turning (top). Freezing the movement of CTr and FTi joints at 80% of the step cycle
(appoximately at the beginning of swing) in the forward walking joints values produces
similar step pattern to the contralateral turning (bottom). Thorax is depicted with green,
leg with blue, forward walking pattern with black, turn pattern with purple and pattern
with modified joint angles values with cyan colour.

80 Chapter 4. Analysis
Figure 4.12: Middle right leg joints’ inside and outside turns contributions. Freezing the
motion of all ThC joints at 80% of the step cycle and reversing the motion of CTr and
FTi joints produces similar pattern to ipsilateral turning (top). Freezing the movement
of CTr and FTi joints at 80% of the step cycle (appoximately at the beginning of swing)
in the forward walking joints values produces similar step pattern to the contralateral
turning (bottom). Thorax is depicted with green, leg with blue, forward walking pattern
with black, turn pattern with purple and pattern with modified joint angles values with
cyan colour.

4.2. Single Leg and Body Angles 81
Figure 4.13: Hind right leg joints’ inside and outside turns contributions. Altering the
movement of the Thγ joint generates smaller movement for the ipsilateral turn (top) and
larger movement for the contralateral turn (Bottom). Thorax is depicted with green, leg
with blue, forward walking pattern with black, turn pattern with purple and pattern with
modified joint angles values with cyan colour.
82 Chapter 4. Analysis
4.3 Leg Coordination
In this section I address the following questions:
• What is the coordination of leg swing during forward walking and both right and
left turns?
• Can the existing coordination rules (Cruse et al., 1991) explain the leg coordina-
tion results from the experiments?
During right turning the front left (6 times), middle left (5times) the hind left (3
times) and front right (3 times), are the first legs to lift offthe ground. During left
turning the front right leg (5 times), the middle right leg (4times), the hind right leg (3
times) and the front left (3 times). This is different from results in fliesOrmia ochracea
(Mason et al., 2005) where the ipsilateral front leg, the contralateral front leg and the
contralateral mesothoracic leg initiate turning for sounds presented at 90◦ and 180◦.
In order to summarize the steps combinations I gathered the occurrences where one,
two or three legs were simultaneously in the swing state (figure 4.14). Each occurrence
changed when a different leg combination appeared. It is important to note that in the
vast majority of cases two or three legs were never lifted offand touched the ground at
precisely the same time (cockroach; Hughes, 1952). Nevertheless, I considered these
cases as doublets or triplets.
In forward walking the majority of the stepping combinations occur in doublets,
with the following combinations: hind leg with opposite front leg, front leg with op-
posite middle leg and middle leg with opposite hind leg. In singlet combinations the
middle legs are most common. In triplets the front and hind legs of one side and the
middle leg of the other side represent the majority of cases.
During right and left turns there are only a few triplet combinations. Most cases
happened in singlets where the contralateral to the turn front and middle legs were
lifted off the ground. Most doublets represent successive opposite side leg combina-
tions as happened with the forward walking.
There are some step combinations that cannot be explained using the existing coor-
dination rules. For example ipsilateral neighbours shouldnot protract at the same time.
However this happened only once in forward walking and twiceduring turning. More
interestingly, contralateral neighbours were more often protracting at the same time.
For instance, there were 25 and 9 cases of both middle legs lift off the ground during
forward walking and turning, which also violates the standard coordination rules. In

4.3. Leg Coordination 83
Figure 4.14: Stepping combinations during forward walking (top), right turn (bottom left)
and left turn (bottom right). The dots in each case represent legs in swing state.
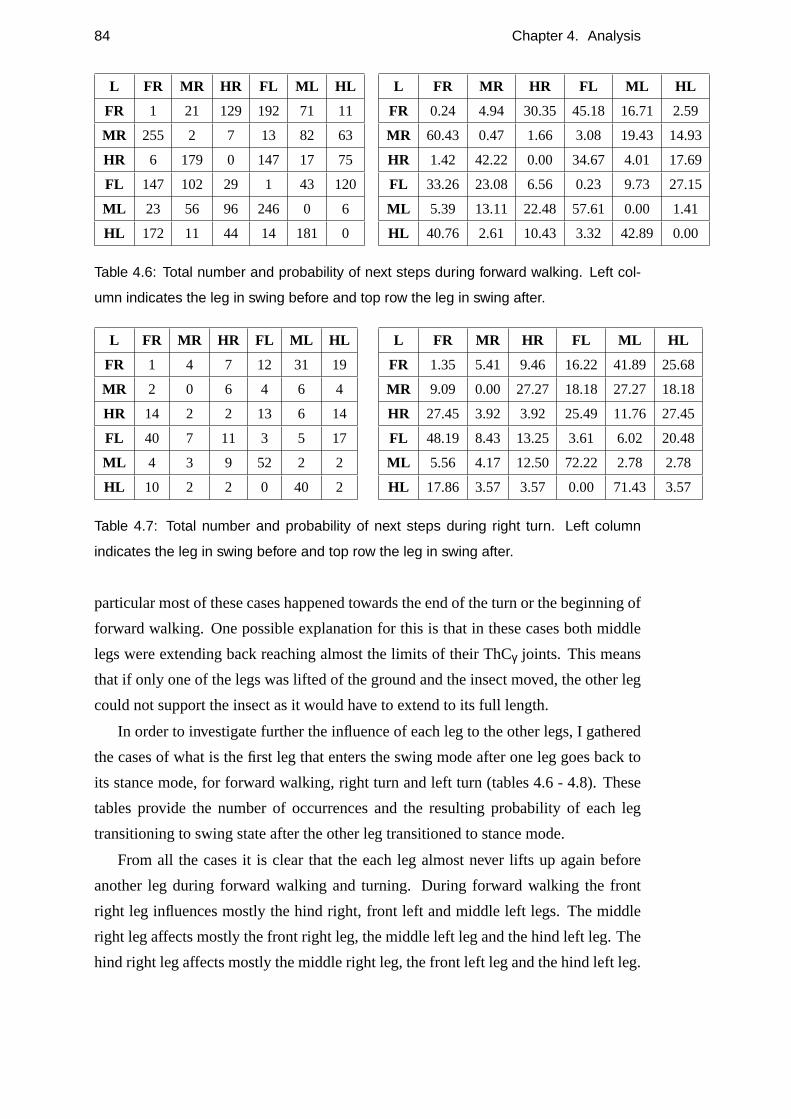
84 Chapter 4. Analysis
L FR MR HR FL ML HL
FR 1 21 129 192 71 11
MR 255 2 7 13 82 63
HR 6 179 0 147 17 75
FL 147 102 29 1 43 120
ML 23 56 96 246 0 6
HL 172 11 44 14 181 0
L FR MR HR FL ML HL
FR 0.24 4.94 30.35 45.18 16.71 2.59
MR 60.43 0.47 1.66 3.08 19.43 14.93
HR 1.42 42.22 0.00 34.67 4.01 17.69
FL 33.26 23.08 6.56 0.23 9.73 27.15
ML 5.39 13.11 22.48 57.61 0.00 1.41
HL 40.76 2.61 10.43 3.32 42.89 0.00
Table 4.6: Total number and probability of next steps during forward walking. Left col-
umn indicates the leg in swing before and top row the leg in swing after.
L FR MR HR FL ML HL
FR 1 4 7 12 31 19
MR 2 0 6 4 6 4
HR 14 2 2 13 6 14
FL 40 7 11 3 5 17
ML 4 3 9 52 2 2
HL 10 2 2 0 40 2
L FR MR HR FL ML HL
FR 1.35 5.41 9.46 16.22 41.89 25.68
MR 9.09 0.00 27.27 18.18 27.27 18.18
HR 27.45 3.92 3.92 25.49 11.76 27.45
FL 48.19 8.43 13.25 3.61 6.02 20.48
ML 5.56 4.17 12.50 72.22 2.78 2.78
HL 17.86 3.57 3.57 0.00 71.43 3.57
Table 4.7: Total number and probability of next steps during right turn. Left column
indicates the leg in swing before and top row the leg in swing after.
particular most of these cases happened towards the end of the turn or the beginning of
forward walking. One possible explanation for this is that in these cases both middle
legs were extending back reaching almost the limits of theirThCγ joints. This means
that if only one of the legs was lifted of the ground and the insect moved, the other leg
could not support the insect as it would have to extend to its full length.
In order to investigate further the influence of each leg to the other legs, I gathered
the cases of what is the first leg that enters the swing mode after one leg goes back to
its stance mode, for forward walking, right turn and left turn (tables 4.6 - 4.8). These
tables provide the number of occurrences and the resulting probability of each leg
transitioning to swing state after the other leg transitioned to stance mode.
From all the cases it is clear that the each leg almost never lifts up again before
another leg during forward walking and turning. During forward walking the front
right leg influences mostly the hind right, front left and middle left legs. The middle
right leg affects mostly the front right leg, the middle leftleg and the hind left leg. The
hind right leg affects mostly the middle right leg, the frontleft leg and the hind left leg.

4.4. Angles Relative to Speaker 85
L FR MR HR FL ML HL
FR 3 6 24 27 10 6
MR 41 2 4 5 5 17
HR 3 36 1 11 7 3
FL 8 31 13 1 7 10
ML 7 11 6 4 0 7
HL 16 7 16 8 6 0
L FR MR HR FL ML HL
FR 3.95 7.89 31.58 35.53 13.16 7.89
MR 55.41 2.70 5.41 6.76 6.76 22.97
HR 4.92 59.02 1.64 18.03 11.48 4.92
FL 11.43 44.29 18.57 1.43 10.00 14.29
ML 20.00 31.43 17.14 11.43 0.00 20.00
HL 30.19 13.21 30.19 15.09 11.32 0.00
Table 4.8: Total number and probability of next steps during left turn. Left column
indicates the leg in swing before and top row the leg in swing after.
The effect of the left legs is opposite as expected. During right turns the front right
leg influences mostly the front left, middle left and hind left legs. The middle right leg
influences mostly the hind right, front left, middle left andhind left legs. The hind right
leg influences mostly the front right, front left, middle left and hind left legs. Again
these results do not point towards simple coordination rules in which ground contact
of one leg causes transition to swing in a neighbouring leg.
4.4 Angles Relative to Speaker
In this section I address the following questions:
• What are the body and ear angles relative to the sound source?
• At what angle to the sound do crickets stop their initial turnand start walking
forward?
• What deviations during forward walking lead to corrections in turning?
Because it was impossible to track the position of the spiracles and the ears, even
by using hand digitization, I used a 150 mm digital calliper (Resolution 0.01 mm, Tool-
zone) to do the necessary measurements after the experiments. Firstly the cricket was
sacrificed after experimentation by placing it in a freezer for approximately 30 min-
utes. The cricket was then removed from the freezer and allowed regain environment
temperature. After that, I used the calliper to measure the distance of the ears from
the front FTi joints. This was measured as 1.0±0.1 mm for all 16 specimens. The
position of the spiracles was approximated by measuring thedistances of three succes-
sive rotations following the model order of rotations from the mesothorax joint. These

86 Chapter 4. Analysis
measurements were stored at a vector where x = 2.5 mm, y = 2.0 mmand z=0.5 mm,
where all the rotations are 90◦.
I calculated three types of angles relative to the speaker (figure 4.16). I took the
2D projection to the ground of the 3D coordinates of each point of interest. The first
is the angle between the metathorax, the mesothorax and the centre of the speaker.
The second is the angle between the mesothorax, the prothorax and the centre of the
speaker. For the third angle I created a segment connecting the two ears. I then calcu-
lated the centre of the segment and created a second segment vertical to the previous
one. Therefore the third angle I calculated is the one between the tip of the second
segment, the middle of the ears’s segment and the centre of the speaker (see figure
4.16). Note that this is actually the most relevant measure but almost never reported
in previous studies. 180◦ is the angle where the cricket is perfectly aligned with the
speaker. There are cases when the cricket turned to the otherdirection than it should
but eventually finished the turn oriented towards the speaker. Therefore there are cases
where the angle relative to the speaker are less than 0◦ or more than 360◦. Table 4.9
summarizes the results and figure 4.15 depicts the results ofthe ears - speaker angle
in two examples. In the first the cricket finished its turn veryprecisely while in the
other the insect continued turning after crossing the alignment with the speaker. Note
that these are two different specimens. Some of the cricketswere able to track the
sound source more accurately than others. Note also that theoscillations observed in
the angles are due to the stepping cycles of the front legs.
Maximum difference with the speaker alignment at the beginning of the turn was
224.48◦ for the metathorax-mesothorax-speaker angle, 217.77◦ for the mesothorax-
prothorax-speaker angle and 217.36◦ for the ears-speaker angle. Minimum difference
with the speaker alignment at the beginning of the turn was 32.69◦ for the metathorax-
mesothorax-speaker angle, 28.91◦ for the mesothorax-prothorax-speaker angle and
37.73◦ for the ears-speaker angle. Maximum difference with the speaker alignment at
the end of the turn was 73.07◦ for the metathorax-mesothorax-speaker angle, 67.12◦ for
the mesothorax-prothorax-speaker angle and 80.10◦ for the ears-speaker angle. Min-
imum difference with the speaker alignment at the beginningof the turn was 0.58◦
for the metathorax-mesothorax-speaker angle, 0.31◦ for the mesothorax-prothorax-
speaker angle and 0.49◦ for the ears-speaker angle. Mean difference with the speaker
alignment at the beginning of the turn was 132.89◦ ±43.85◦ for the metathorax-mesothorax-
speaker angle, 131.49◦ ±44.90◦ for the mesothorax-prothorax-speaker angle and 130.73◦
±43.80◦ for the ears-speaker angle. Mean difference with the speaker alignment at the

4.4. Angles Relative to Speaker 87
end of the turn was 17.31◦ ±17.37◦ for the metathorax-mesothorax-speaker angle,
17.07◦ ±17.47◦ for the mesothorax-prothorax-speaker angle and 19.91◦ ±19.45◦ for
the ears-speaker angle.
In order to investigate the change of direction during forward walking I gathered
the peaks of the angles relative to the speaker during forward walking from all the
16 experiments (figure 4.17). I used MATLAB’s findpeaks function with minimum
time difference between successive peaks equal to 1 second.Maximum value of an-
gle difference for the mesothorax-metathorax-speaker was53.49◦, for the mesothorax-
prothorax-speaker was 62.57◦ and for the ears-speaker was 82.86◦. Minimum value of
angle difference for the mesothorax-metathorax-speaker was 0.57◦, for the mesothorax-
prothorax-speaker was 0.26◦ and for the ears-speaker was 0.34◦. Mean value of angle
difference was 16.24◦ ±11.62◦ for mesothorax-metathorax-speaker, 18.34◦ ±13.54◦
for mesothorax-prothorax-speaker and 28.48◦ ±16.04◦ for the ears-speaker. The re-
sults were summarized by using histograms with a bin size of 5◦ (figure 4.17).
Overall the results show that the crickets after the initialturn approach the call-
ing song meandering around the straight target direction. Earlier studies on a Kramer
treadmill resulted in deviation from the straight path of the insect around 30◦-60◦ (We-
ber et al. 1981,Gryllus campestris; Schmitz et al. 1982). Here I showed that most
of these deviations were lower than 30◦. One possible reason for this is that forces
generated while walking on a Kramer treadmill are opposing the acceleration of the
insect, thus altering sensory feedback. More recently it was showed that crickets can
discriminate sound deviating by only 1◦ (Schoneich and Hedwig, 2010). However,
thosse experiments were conducted on a trackball where the moving animal did not
alter the orientation and direction towards the sound and sound was constantly per-
ceived under identical conditions. In noisier environments such as in the arena this
precision in tracking the sound is probably less accurate. Another difference with pre-
vious studies is that there is course correction while the cricket is moving in contrast
to results from other species (Scapsipedus marginatus; Murphey and Zaretsky 1972,
Teleogryllus oceanicus; Bailey and Thomson 1977) where there is course correction
after a stop.

88 Chapter 4. Analysis
C E S T MMSI MMSA MPSI MPSA VMSI VMSA
01 01 R R 331.04◦ 205.83◦ 330.35◦ 199.41◦ 335.33◦ 190.75◦
01 02 L R 212.71◦ 186.63◦ 207.81◦ 182.98◦ 217.02◦ 187.10◦
02 01 L L 23.68◦ 180.25◦ 19.86◦ 191.76◦ 20.41◦ 181.81◦
02 02 R L 38.52◦ 161.11◦ 49.24◦ 175.49◦ 45.75◦ 189.49◦
03 01 R R 259.38◦ 204.38◦ 261.22◦ 191.49◦ 249.80◦ 189.62◦
03 02 L R 252.81◦ 183.46◦ 253.65◦ 173.93◦ 256.82◦ 174.33◦
04 01 R R 282.41◦ 196.66◦ 265.57◦ 179.13◦ 263.38◦ 167.21◦
04 02 L L 97.75◦ 161.79◦ 92.03◦ 166.09◦ 89.23◦ 170.18◦
05 01 R R 365.33◦ 197.96◦ 365.57◦ 193.73◦ 353.21◦ 202.89◦
05 02 L L -12.39◦ 177.89◦ -17.57◦ 194.64◦ -8.96◦ 195.53◦
06 01 R R 351.13◦ 137.42◦ 356.51◦ 123.56◦ 355.09◦ 126.87◦
06 02 L L 56.52◦ 159.06◦ 66.86◦ 173.47◦ 74.86◦ 168.32◦
07 01 R L 22.46◦ 110.63◦ 33.12◦ 118.13◦ 27.40◦ 99.94◦
07 02 L R 282.30◦ 177.01◦ 279.43◦ 170.63◦ 279.98◦ 183.55◦
08 01 R R 346.29◦ 169.47◦ 354.31◦ 162.93◦ 361.91◦ 146.01◦
08 02 L R 337.23◦ 195.25◦ 337.97◦ 176.37◦ 332.04◦ 168.49◦
09 01 L R 328.70◦ 166.83◦ 332.55◦ 157.40◦ 327.59◦ 160.58◦
09 02 R L -4.21◦ 169.90◦ 2.76◦ 180.88◦ 0.48◦ 191.80◦
10 01 L L 81.97◦ 201.03◦ 91.83◦ 211.73◦ 95.61◦ 215.75◦
10 02 R R 295.60◦ 197.56◦ 282.96◦ 181.21◦ 289.58◦ 179.43◦
11 01 R R 324.84◦ 169.42◦ 328.72◦ 157.67◦ 332.16◦ 149.78◦
11 02 R L 9.28◦ 183.47◦ 11.18◦ 191.19◦ 11.54◦ 192.51◦
12 01 R L 98.90◦ 178.82◦ 98.33◦ 185.10◦ 87.77◦ 181.23◦
12 02 R L -5.73◦ 192.85◦ -0.41◦ 205.46◦ 1.94◦ 219.33◦
13 01 L L 17.88◦ 158.71◦ 16.16◦ 160.12◦ 22.11◦ 145.57◦
13 02 R L 76.81◦ 213.81◦ 80.57◦ 222.67◦ 80.46◦ 227.09◦
14 01 R R 335.74◦ 177.34◦ 345.09◦ 170.90◦ 345.48◦ 174.74◦
14 02 R R 404.25◦ 201.30◦ 397.72◦ 193.10◦ 397.26◦ 200.10◦
15 01 R L 81.62◦ 181.11◦ 74.32◦ 181.41◦ 89.22◦ 175.36◦
15 02 L L 48.94◦ 107.91◦ 48.97◦ 112.37◦ 55.26◦ 118.08◦
16 01 L R 277.41◦ 190.98◦ 278.59◦ 182.57◦ 274.51◦ 189.19◦
16 02 R R 255.55◦ 168.72◦ 254.58◦ 168.54◦ 263.80◦ 178.98◦
Table 4.9: Angles properties for all the experiments. Cricket number (C), experiment
number (E), speaker(S), left (L), right (R), turn(T), metathorax - mesothorax - speaker
initial angle (MMSI) and after turn(MMSA), mesothorax - prothorax - speaker initial an-
gle (MPSI) and after turn (MPSA), vertical line ears point - middle ears point - speaker
initial angle (VMSA) and after turn (VMSA) and antennae and head movement frames
before first leg swing (AM).

4.4. Angles Relative to Speaker 89
Figure 4.15: Examples of angles between the ears and the speakers (S). Top figure
shows results from a cricket that tracked the sound very precisely. Bottom figure shows
results from a cricket that continued turning but corrected its course. Green lines indi-
cate the end of turn. Dashed red lines indicate a stop.

90 Chapter 4. Analysis
Figure 4.16: Summary of the angles of interest relative to the speakers (S). Top figure
summarizes the angles between metathorax, mesothorax and the speaker. Middle fig-
ure summarizes the angles between mesothorax, prothorax and the speaker. Bottom
figure summarizes the angles between the ears’ lines and the speaker. Right turns are
marked with red colour and left turns are marked with blue colour.

4.4. Angles Relative to Speaker 91
Figure 4.17: Angles before change of direction during forward walking. Number of
peaks in the metathorax-mesothorax-speaker angles (Top). Number of peaks in the
mesothorax-prothorax-speaker angles (Middle). Number of peaks in the ears-speaker
angles (Bottom).

92 Chapter 4. Analysis
4.5 Ears’ Input Estimation
In this section I address the following question:
• What is the sound input from each side of the cricket during phonotaxis?
In order to test the parameters of the estimation algorithm Ifirst created a simulated
stationary cricket setup. This is similar to the setup that was used to calculate the delays
and gains of transmitting the sound to real crickets (Michelsen et al., 1994). The gains
represent the change of amplitude and the delays in the phaseangles from the entrance
of the tracheal system to the surface of the tympanum.
I placed a simulated cricket in the middle of a circular arenaand rotated the speaker
around the right tympanum one degree every one millisecond (figure 4.18). In the
original paper the speaker was moved every 30◦. The distance from the speaker in
my simulation was 400mm. The lengths of the cricket segmentsare based on the
mean values from the estimated lengths from all the cricketsthat were tracked (table
4.10). The angle values are based on the forward walking stride percentage results that
were depicted in section 4.2. The distance between the two tympani was 12.08 mm,
the distance between each spiracle and the contralateral tympanum was 9.85 mm, the
distance between the each spiracle and the ipsilateral ear was 6.98 mm and the distance
between the two spiracles was 4 mm. For the calculations I consider that there is only
one tympanum per side and it is placed in the line connecting the FTi with the TiTa
joints.
For the calculation of the ear input I used all four sound inputs. These are the
ipsilateral tympanum (IT), the ipsilateral spiracle (IS),the contralateral spiracle (CS)
and the contralateral tympanum (CT). According to Michelsenet al. (1994) at car-
rier frequency of 4.5 kHz the contribution of the CT input to the sound is not signif-
icant. However, at 4.8 kHz, which is the carrier frequency I used in my experiments,
the CT input affects significantly the directionality. This is supported by experiments
where the contralateral tympanum was blocked (Boyd and Lewis, 1983). This fact was
not taken into account in previous 2D simulations of the model (Reeve et al., 2007).
The internal delays and the sound gains for each spiracle andtympani are based on
(Michelsen et al., 1994) and data provided by Axel Michelsen(personal communi-
cation). These values are presented in table 4.12. Because ofthe way these values
were originally calculated, I had to convert them before using them in the algorithm.
Excluding the IT internal delay, which is zero by default, the other values had to be
transformed by subtracting them from 180◦. If the value is negative then an addition of

4.5. Ears’ Input Estimation 93
Segment MV SD
Metahorax - mesothorax (0 - 1) 3.05 ±0.23
Mesothorax - thorax-coxa (1 - 2, 1 - 6) 1.86 ±0.11
Middle coxa (2 - 3, 6 - 7) 1.59 ±0.17
Middle femur (3 - 4, 7 - 8) 5.29 ±0.32
Middle tibia (4 - 5, 8 - 9) 4.33 ±0.22
Mesothorax - prothorax (1 - 10) 3.58 ±0.31
Prothorax - thorax - coxa (10 - 11, 10 - 15)1.56 ±0.16
Front coxa (11 - 12, 15 - 16) 2.01 ±0.34
Front femur (12 - 13, 16 - 17) 5.50 ±0.30
Front tibia (13 - 14, 17 - 18) 3.54 ±0.24
Metathorax - thorax - coxa (0 - 19, 0 - 23) 1.68 ±0.14
Hind coxa (19 - 20, 23 - 24) 1.82 ±0.17
Hind femur (20 - 21, 24 - 25) 10.50 ±0.44
Hind tibia (21 - 22, 25 - 26) 7.98 ±0.38
Table 4.10: Mean values (MV) and standard deviations (SD) for the lengths of body and
leg segments in millimetres.
360◦ needed to be made to make the values positive. Note that I usedthe same values
for all the crickets. According to Michelsen et al. (1994) the diffraction and time de-
lays did not vary much between individuals. In contrast, thegains between individuals
showed substantial variation. Furthermore, differences in the gains between the two
sides in the same cricket were found.
I did not take into account diffractions of the sound, as thiswas not possible to
calculate. Michelsen et al. (1994) estimated a diffractionof 1-2 dB. As I wanted to
estimate the input from an analogue signal I used a sample rate of 8×10⁶ Hz instead of
44.1 kHz used in the experiments. By using this sample rate I then used the index of the
song to estimate the input by using the following procedure:first at every millisecond
the sound is broadcast at timet. Then the sound reaching each of the two tympani
and the spiracles must be at the timet − tp where thetp is the time taken to reach the
specific point from the sound source. To calculate this time Iused a speed of sound
time value of 344,384 m/s or mm/ms. This value is for an air temperature of 22◦C, the
average temperature during the arena experiments. Therefore the time taken for the
signal to travel was taken by the distance of the point from the sound source divided
by the speed of sound. Then, this value was added to the internal delays multiplied

94 Chapter 4. Analysis
Joint Parameters Values
Metathorax (0) x, y, z 0, 0, 0
Segment Parameters Values
Metahorax - mesothorax (0 - 1) α, β, γ 0◦, -10◦, 0◦
Middle right coxa (2 - 3) α, β, γ (ThC) -25◦, 30◦, 0◦
Middle right femur (3 - 4) β (CTr) -80◦
Middle right tibia (4 - 5) β (FTi) 95◦
Middle left coxa (6 - 7) α, β, γ (ThC) 25◦, 30◦, 0◦
Middle left femur (7 - 8) β (CTr) -80◦
Middle left tibia (8 - 9) β (FTi) 95◦
Mesothorax - prothorax (1 - 10) α, β, γ 0◦, -10◦, 0◦
Front right coxa (11 - 12) α, β, γ (ThC) -45◦, 80◦, -15◦
Front right femur (12 - 13) α (TrF), β (CTr) 45◦, -95
Front right tibia (13 - 14) β (FTi) 65
Front left coxa (15 - 16) α, β, γ (ThC) 45◦, 80◦, 15◦
Front left femur (16 - 17) α (TrF), β (CTr) −45◦, -95◦
Front left tibia (17 - 18) β (FTi) 65◦
Hind right coxa (19 - 20) α, β, γ (ThC) -8◦, 30◦, -65◦
Hind right femur (20 - 21) β (CTr) -70◦
Hind right tibia (21 - 22) β (FTi) 130◦
Hind left coxa (23 - 24) α, β, γ (ThC) 8◦, 30◦, 65◦
Hind left femur (24 - 25) β (CTr) -70◦
Hind left tibia (25 - 26) β (FTi) 130◦
Table 4.11: The joints and segments parameters values used in the stationary cricket
setup. The units for the joint limits are in millimetres and for the angles in degrees.
Input Gain Delay 180 - delay Final delay
IT 1.0 0◦ 0◦ 0◦
IS -1.44 135◦ 45◦ 45◦
CS -0.54 230◦ -50◦ 130◦
CT -0.23 270◦ -90◦ 90◦
Table 4.12: Transmission gains and internal delays of the four sound inputs. Ipsilat-
eral tympanum (IT), ipsilateral spiracle (IS), contralateral spiracle (CS) and contralateral
tympanum (CT). The internal delays represent the phase difference in the time of the
sound arrival as it travels inside the tracheal tubes.

4.5. Ears’ Input Estimation 95
by the degree of sound change which is given by 1360×carrierFrequency× 1000. Then
from all the samples I took the maximum value, which represents the size of tympanal
vibration. The results of this simulation are provided in figure 4.18 and show the clear
directionality of the sound for both sides as the speaker is rotated around the cricket.
Before applying the algorithm to the data I also investigatedthe estimation of the
ears input in the stationary setup while the insect is movingits front legs (figure 4.19).
For the simulation I used the data gathered for the step cycleas presented in section
4.2. Each frame corresponds to 3 ms. I chose the position of the speaker to be where
the maximum difference was observed in the previous experiment (270◦). Because
in this simulation the legs were moving, I placed the speakerat 270◦ relative to the
metathorax position. First, I calculated the difference between the two sides when the
simulated cricket walked forward. When the front right leg initially performs its swing
there is a decrease in the difference of the two sides and thenan increase as the leg
transitions to the stance and the front left leg to its swing.The next case was when
the legs performed a left turn and therefore moving away fromthe speaker. There
is a decrease in the difference as the front right leg is in swing, an increase before
decreasing again as the leg changes into stance and finally anincrease as the front
left leg enters its stance. The last case was when the legs would perform a right turn.
Initially, there would be an increase as the right leg would move closer to the sound
source and a decrease as it would go back to stance, coupled with an increase as the
front left leg would perform a swing and a decrease when it would finish its swing.
From all the above cases it is obvious that during a step cyclethe ears input on the two
sides is not constant but instead significantly changed. It important to note that only
the legs are moving at this situation and not the body, which means that this experiment
resembles more the case when the cricket is walking on a trackball.
If the sound is placed directly in front of the cricket there is smaller difference be-
tween the two sides (figure 4.20). During the swing phase of each leg the difference
reaches up to 3 dB, while during stance it reaches up to 4 dB. Thissuggests that the
cricket should ignore differences of 4 dB. Alternatively thecricket may be influenced
by the change of input during step,e.g it could detect that there is an increasing dif-
ference during ipsilateral swing if turning to the wrong way(figure 4.19 top, middle),
whereas during a turn towards the sound the difference decreases sharply during the
swing (figure 4.19 bottom).
In order to calculate the two sides input from the video recordings I first resampled
the metathorax coordinates and the angles of all joints from3.33 ms to 1 ms using

96 Chapter 4. Analysis
−3 dB
−8 dB
−13 dB
−18 dB
−23 dB
0°
30°
60°
90°
120°
150°180°
210°
240°
270°
300°
330°
Figure 4.18: Simulation of sound directionality for a stationary cricket. The artificial
cricket is placed in the middle of the arena (top). The sound source is rotated around
the right tympanum every 1◦. The algorithm calculates the values of the sound input for
the left (blue) and the right (red) ear. Directional pattern of ear values with respect to
the 0◦ value is presented (bottom).
cubic spline interpolation. Then, I regenerated the coordinates of all the joints, the
ears and the spiracles using the same rotation order that I used during the tracking
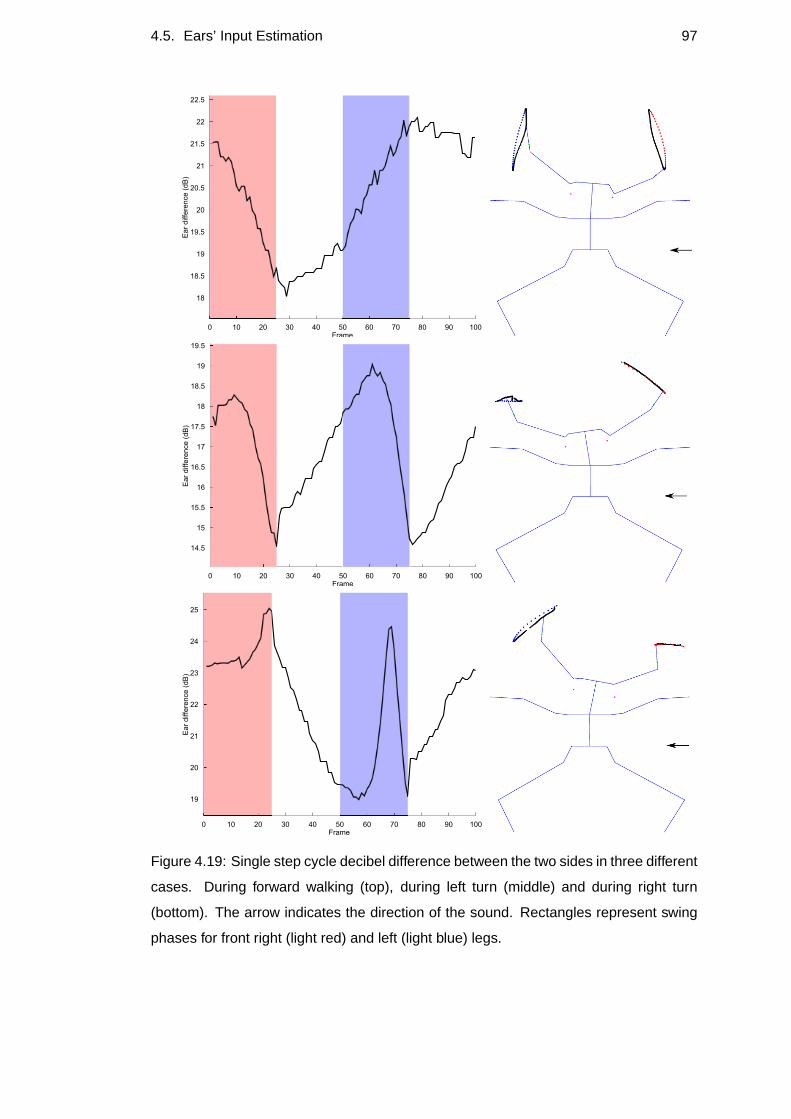
4.5. Ears’ Input Estimation 97
Figure 4.19: Single step cycle decibel difference between the two sides in three different
cases. During forward walking (top), during left turn (middle) and during right turn
(bottom). The arrow indicates the direction of the sound. Rectangles represent swing
phases for front right (light red) and left (light blue) legs.

98 Chapter 4. Analysis
Figure 4.20: Single step cycle decibel difference between the two sides during forward
walking. The arrow indicates the direction of the sound. Rectangles represent swing
phases for front right (light red) and left (light blue) legs.
procedure. Because the original results were based on 300 fpsvideo recordings, I had
to find the delay of the cricket song when the coordinates wereresampled. In order
to do that I cross correlated the two signals using the MATLABxcorr function. This
function outputs the delay between the two signals and therefore I was able to extract
the initial song position at the first frame. Then for every millisecond I calculated the
distance from the centre of the speaker. The centre of the left speaker was in X: 290
mm, Y: 1200 mm and Z: 100 mm and the right speaker at X: 290 mm, Y:0mm and
Z: 100 mm. These measurements were done by using a ruler. Figures 4.21 and 4.22
depict typical examples of the estimation of ears input.

4.5. Ears’ Input Estimation 99
Figure 4.21: Examples of ear’s input estimation. Top figure shows results from a cricket
that tracked the sound very precisely. Bottom figure shows results from a cricket that
continued turning but corrected its course.

100 Chapter 4. Analysis
Figure 4.22: Example of ear’s input estimation during turn. The cricket performed a left
turn towards the left speaker.
Finally, I summarized the results by calculating the maximum input value be-
fore the angles’ peaks presented in the previous section (figure 4.23). I used a pe-
riod of 300 ms based on the step cycle of the insect but shifted50 ms before the
peak as this is the estimated time that the cricket takes to process the sound input
through the brain (Baden and Hedwig, 2008). Maximum value of decibel difference
for the mesothorax-metathorax-speaker was 15.83 dB, for themesothorax-prothorax-
speaker was 22.21 dB and for the ears-speaker was 18.11 dB. Minimum value of angle
difference for the mesothorax-metathorax-speaker was 1.04 dB, for the mesothorax-
prothorax-speaker was 0.69 dB and for the ears-speaker was 0.53 dB. Mean value of
decibel difference was 6.06±3.39 dB for mesothorax-metathorax-speaker, 6.47±3.95
dB for mesothorax-prothorax-speaker and 5.85±3.54 dB for the ears-speaker. Maxi-
mum value of decibel difference before the transition from turning to forward walking
was 19.17 dB and minimum difference was 7.76 dB. Mean value of decibel difference
was 13.17 dB± 8.5 dB. These results suggest that the crickets require a difference
of 3-5 dB to cause a course correction, which is far from precise and that quite large
differences can be tolerated.

4.5. Ears’ Input Estimation 101
Figure 4.23: Decibel values in the angles peaks before change of direction during for-
ward walking. Number of peaks in the metathorax-mesothorax-speaker angles (Top).
Number of peaks in the mesothorax-prothorax-speaker angles (Middle). Number of
peaks in the ears-speaker angles (Bottom).


Chapter 5
Discussion
5.1 Introduction
Insect walking requires the coordination of multiple joints in a single leg to produce
various stepping patterns, the coordination of all the legsto produce various gaits and
the interaction of the motor output with various sensory inputs and commands from
the brain or the other ganglia. The work in this thesis was motivated by the possible
interactions between sensory input and motor output in insects. I chose to study cricket
phonotactic behaviour as such an example. Previous studieshad focused more on the
auditory input processing or provided partial informationabout the body and leg move-
ments. I posed questions derived from the current literature (chapter 2) and I created
new tools to obtain data about this behaviour (chapter 3). Furthermore, I provided new
information about single leg motion, leg coordination, body angles relative to a sound
source and an estimation of the ear’s input (chapter 4).
In this chapter, I complete my thesis by discussing the outcome. First, I summarize
the contributions I made, as presented in the chapters 3 and 4(section 5.2). I then
suggest some of the future work that could be based on my thesis (section 5.3). Finally,
I conclude my thesis with the closing remarks (section 5.4).
5.2 Contributions
• In chapter 3 I presented a new method for studying cricket phonotactic behaviour
that produces data on the complete kinematic motions of a freely walking cricket
responding to calling song. As well as being novel for crickets, the methods
presented here extend the state-of-the-art in insect kinematic analysis in several
103

104 Chapter 5. Discussion
ways. The level of detail (full 3D information on all leg joints) has previously
been obtained only for tethered animals, of a larger size, with body geometries
more amenable to viewing all joints. Moreover I obtain additional information
on body articulation, pitch and roll. This is produced by a semi-automated track-
ing system that compares favourably to that described in Bender et al. (2010)
both in terms of overall fitting error and in terms of the rate of user correction
required (1-2% of frames vs. 3-5% of frames reported in Benderet al. (2010)).
Furthermore, since I avoid using inverse kinematics, I needto mark fewer points
in the insect. Marking more points on the legs would be very difficult, if not
impossible. The total cost of the experimental setup, including the highspeed
cameras (but not the computer) totalled less than £2000. This method allowed
me to investigate further the role of each leg pair, each leg and each joint in the
walking activity.
• In section 4.2 I presented for the first time in detail the movements of most of
the leg and body joints during phonotaxis. Earlier studies provided information
either only for the forward walking in the absence of auditory stimulus (Lak-
sanacharoen et al., 2000) or limited information about kinematics in cases where
the animal is restricted (Baden and Hedwig, 2008; Witney and Hedwig, 2011).
Results from my study include the movement of each joint during right and left
turns and forward walking. Some joints contributed more to the change in the
patterns of step of each leg. For instance the ThC joints of the front legs play
an important role during contralateral turning, while the CTr and FTi joints con-
tribute more during ipsilateral turning. The middle leg’s TiTa position is used
as a centre for rotation for the insect. Furthermore, I showed that the 3 DoF
of the ThC joint and motion of body joints are important for the movement of
the cricket, which is something that existing models of insect walking generally
neglect in their implementation.
• In section 4.3 I presented for the first time the leg coordination results from the
crickets while they performed phonotaxis. Although most ofthe results agree
with existing coordination rules derived from stick insectwalking (Cruse et al.,
1991), there were some cases that cannot be explained and therefore modifica-
tion or an alternative methodology has to be followed. For example there were
cases when both middle legs were lifted off the ground. Furthermore, I found
which legs perform a swing after the transition to the stancephase of another

5.2. Contributions 105
leg. Context-dependent changes in leg coordination mechanisms have been sug-
gested previously for stick insects (Blasing and Cruse, 2004; Durr, 2005; Rosano
and Webb, 2007). For example coupling strength for certain rules between the
two sides might differ during turning for ipsilateral and contralateral to the turn
legs. Further analysis of the results using the methodologydiscussed in Durr
(2005) could provide more information about specific modifications of the rules.
• In section 4.4 I presented the analysis of the body angles relative to the speaker.
These show similar but somewhat smaller deviations from straight walking than
previous reports (Weber et al., 1981). For the first time I calculated the angles
between the speaker and the ears. This increases the effective angle to sound
by 10◦-15◦ compared to the other two body angles. The accuracy of the sound
source tracking differs compared to recent experiments on atrackball (Schoneich
and Hedwig, 2010). I should note here that the speed of the cricket in these
experiments was lower than the speed reported for experiments on a trackball.
Previous work has shown that there might be a rapid steering response in every
sound pulse when it is presented from alternate directions (Hedwig and Poulet,
2004). One possible reason for this is that depending on the speed of the cricket
the local connection between the auditory circuit and the front legs might change
its effect. For lower speeds the commands from the brain might play more im-
portant role in walking (for instance during initiation of turning, the antennae and
the head are the first to move). For higher speeds this local connection might af-
fect more the walking behaviour and therefore contribute tothis rapid steering
change with reduced involvement of the brain neurons.
• In section 4.5 I estimated for the first time the sound input onboth sides as the
insect performed phonotaxis, based on the precise positionof their ears in the
sound field. I also implemented a simulation to estimate the ears input as the
insect would walk on a trackball. The results show that the cricket could ex-
perience auditory inputs that differ by as much as 4 dB duringits step cycle
to sound ahead and by as much as 7-8 dB when turning to sound on one side.
Comparing ear inputs to corrections in heading suggests a difference of 3-5 dB
is needed to cause the animal to correct its course. For the above calculations I
used the same delay and gain values for the four sound inputs during the entire
walking sequence. Initial data from experiments on a trackball suggest that pos-
sible changes in the membrane of the spiracles as the cricketwalks might affect

106 Chapter 5. Discussion
the sound input (Kostarakos et al., 2009). Therefore a possible mechanical con-
nection between the spiracles and the front legs might affect the sound input on
the two sides. Another possibility is that there is a neural connection from the
sensors of the legs that inhibits the auditory circuit connection to the front legs
as described in Baden and Hedwig (2008). This could happen forexample in
some cases when during a step the sound difference initiallybecomes larger as
the insect moves one of the front legs (figure 4.21).
5.3 Future Research
5.3.1 Experiments
There are several possible improvements or extensions thatcould be made to this sys-
tem. During the experiments the cameras are moved manually to follow the insect.
It could be possible to motorise this movement, using a thirdcamera that does online
tracking of the body position (as one blob) of the insect in the arena. Such systems have
already been successfully implemented in our lab, for example, to track flies (Stewart
et al., 2010). However, this might cause additional noise and affect the insect’s be-
haviour. Currently the manual tracking needs to ensure the insect does not cover all
visible grid points. However, with a motorised system or using distance measuring
sensors attached to the cameras, their position could be obtained automatically, which
would avoid completely the need for grid marking and tracking. This would be also
useful with cameras that do not have large recording memory.
Although I have tried to make the visual environment fairly uniform (white sound
proofing, white covers on the speakers) nevertheless it is possible that the cricket in this
setup could be combining visual tracking or visual stabilisation with its phonotactic re-
sponse (Payne et al., 2010). Experiments with infrared light resulted in worse image
quality and made the tracking much less reliable. Although some previous reports
suggests visual stimuli strongly influence tracking behaviour on the Kramer treadmill
(Weber et al., 1981), recent results have not detected dramatic differences in arena
tracks produced in the light and the dark (Payne, 2010). It would nevertheless be inter-
esting in this setup to measure more precisely whether phonotaxis tracks are altered in
a high contrast visual environment, or if introducing a single visual object elicits visual
tracking in competition with tracking of the sound.
Other possible experiments could include the tracking of the abdomen and the end

5.3. Future Research 107
of the tarsus, since the middle section of the tarsus is the one actually touching the
ground in the front and middle legs as the insect moves. However, tracking the tar-
sus would probably need hand digitization because its smallsize does not allow it
to be painted. Furthermore, tracking the antennae positions through 3D space could
give more information about the movements of these sensors and the combination of
the two sensory modalities. I only presented sound from one direction in these ex-
periments but it would be interesting to observe the change in the movements of the
cricket as it changes its direction. Preliminary results showed that some crickets re-
sponded immediately to the change of sound direction, whileothers stopped when the
sound direction changed. Finally, experiments with one of the tympani blocked could
show the response or not of the cricket to the sound stimulation.
I only worked on behavioural experiments with the current setup, but in the future
it might be possible to combine it with electromyography (Delcomyn and Usherwood,
1973; Watson and Ritzmann, 1997; Sponberg and Full, 2008) or neuron recordings
(Pearson, 1972; Takeuchi and Shimoyama, 2004; Keller et al., 2007; Dupuy, 2009).
This will offer more insights in the internal functionalityof the insect, but may require
more precise synchronisation of the cameras. The results presented here indicate which
joint angles contribute most to changing leg motion during turns (see section 4.2).
Therefore, they suggest which muscles or motor neurons might be best for such a
paradigm. Some work towards this direction has been carriedout while the cricket
walked on a trackball (Baden and Hedwig, 2008).
Finally, it would be ideal to combine methods in order to givemore information
for each individual cricket. For instance a cricket could first be tested in the arena as
presented here, then on a slippery surface (Gruhn et al., 2006; Bender et al., 2010)
and a stationary setup for estimating the gains and the delays for the ears (Michelsen
et al., 1994). Doing experiments on these setups would give more information on each
individual cricket. A slippery surface setup could providemore information on single
leg movement, since it decouples the leg relative to the ground. Also, amputations and
neurophysiology experiments are easier to perform for a fixed animal. Furthermore,
when I estimated the ear’s input I assumed that the state of the spiracles remains un-
changed during a step cycle. However, the spiracles have a membrane in front of them
which is held open with wax during stationary experiments (Michelsen et al., 1994).
Maybe a camera zoomed in the specific region could show the state of the spiracle
before the insect starts moving and during walking (Kostarakos et al., 2009).

108 Chapter 5. Discussion
5.3.2 Software
Possible improvements of the software could include a cross-platform version, for ex-
ample by using the Qt libraries (http://qt.nokia.com/). Furthermore, the performance
(i.e. processing speed) of the tracking procedure would increaseif we integrate it with
more powerful graphics processor unit (GPU) functionality. The current version of
OpenCV includes an experimental GPU functionality. The use of an optimization al-
gorithm that runs in a GPU would also improve significantly the performance of the
model fitting procedure which is the most time-consuming.
Another approach to track the movements of a person has been recently developed
(Shotton et al., 2011). It takes into account the possible configurations of the joints of
a moving person and trains an algorithm to match each configuration to a given depth
map. Since now I know the possible values of the joint of an insect it could be possible
to follow a similar approach to track the insect. This would further ease the use of
electromyography because it would not be necessary anymoreto paint the points of
interest on the insect.
5.3.3 Modelling
Based on the results from this work it is possible to extend existing models of cricket
phonotaxis, which could be run on a simulated hexapod robot.In order to achieve
that the model would have to be able to control joint coordination in the single leg,
coordination between all six legs and integrate a neural circuit for auditory process-
ing. Implementations of the auditory circuit exist from previous studies (Webb, 2006,
2008).
First, I would start by modelling a single leg controller. Obviously there would be
differences between the three leg pairs. Since there is no detailed information about the
neural control of walking in crickets, I would have to base the modelling in current stick
insect and cockroach models of locomotion. One possible modelling approach of the
single leg controller is the use of individual pattern generators for each joint that are af-
fected by neighbouring joint properties such as the joint angle and load (Ekeberg et al.,
2004). Since neurophysiological information is very limited about crickets, I would
have to hypothesize possible neural connections between different joints. Parameters
to the model could be the angular speed, range of motion and load information. The leg
structure should represent as accurately as possible the cricket morphology and there-
fore include the dimensions of the body and leg segments of the real crickets provided

5.3. Future Research 109
in table 4.10. Previous models have used only 3 DoF in total for each leg. How-
ever, in section 4.2 I demonstrated that all 5 DoF are important for the leg movements.
Therefore, an extension of the models need to incorporate these changes. One recent
example of such extensions is a 4 DoF cockroach middle leg model (Doorly, 2011).
The simulation could be tested first in a kinematic simulation and later on a dynamic
simulator such as using Open Dynamics Engine (ODE - www.ode.org), that has been
used in earlier studies (Rosano and Webb, 2007). This approach could show the pos-
sible implications of the model interacting with the real world properties. The model
should not only generate stable walking patterns, but approximate the leg kinematics
of the crickets. The evaluation should include leg trajectories and joint angle values.
In order to alter the motion to produce inside or outside turning patterns a change in
the effects to the joints should be made. For instance the middle leg CTr joint alters its
direction of movements during stance and swing. In phonotaxis, these changes are the
output of the auditory processing circuit. It has been suggested from previous trackball
results that crickets make a rapid change in heading to everysound pulse (Hedwig and
Poulet, 2004). However, as there is no coordination of step cycle with sound pattern,
this would imply that the animal must make a very specific adjustment according to the
current position of the leg. The front leg effects shown in figure 4.11 are interesting in
this regard. If one assumed a sound pulse louder on one side inhibits the ipsilateral ThC
joints and contralateral CTr and FTi joints, this could produce the observed change in
step motion.
Variations of Cruse’s rules (Cruse et al., 1991) have been usedin many studies (Es-
penschied et al., 1993, 1996; Rosano and Webb, 2007; Lewingerand Quinn, 2008). It
might be possible to adjust some of the rules to generate gaits similar to the crickets.
However, as presented in section 4.2 stance-swing transitions might involve more than
FTi extension-flexion transitions. Recent studies regarding leg coordination in stick in-
sects have shown that the movement of one leg can affect the activity of the ThC joints
in other two ipsilateral legs (Borgmann et al., 2007, 2009, 2012). Initial simulations
have been recently published (Daun-Gruhn and Buschges, 2011; Daun-Gruhn et al.,
2012). This further extends the single leg controller I mentioned above to coordinating
the three ipsilateral legs. However, more studies will be needed to follow this approach
for all six-legs coordination.

110 Chapter 5. Discussion
5.3.4 Robot Implementation
A robotic model could be used to further understand this biological system (Webb,
2000, 2001, 2006). This will be a neuromechanical model of the cricket, which will
be based on a hardware model (physical structure) and a software model (control algo-
rithm). For this purpose, I would have to overcome several technical challenges.
The robot should be designed to represent as accurately as possible cricket mor-
phology, but would need to be on a different scale due to the size of the required mo-
tors. The motors should have position and current (load) feedback, such as Dynamixel
MX-28 and MX-64 servos (www.robotis.com). Initially, a single leg could be tested.
Making a 3 DoFe ThC joint that could handle the weight of the robot would be one of
the challenges of the project.
Then the two front legs with a circuit equipped with microphones that simulates
the cricket auditory system could be integrated. The noise from the motors would
probably affect the input of the microphone sensors. Also the distance between the
two FTi joints of the two front legs would be different than the real cricket. Therefore
placing microphones on each leg would not create the same system as in crickets. One
possible solution would be to place the circuit board responsible for phonotaxis in the
front part of the robot similar to (Horchler et al., 2004). However, this configuration
would not allow the ears to move as each of the two front legs moves. Alternatively, I
could use lower sound frequency for the calling song.
5.4 Conclusion
Clearly there remain a number of technical and algorithmic challenges to be solved
before a complete hexapod robot model of cricket phonotaxiscould be built. Never-
theless, this thesis provides essential information towards closing the loop between the
sensory inputs and motor outputs in this behaviour. By highlighting the key leg motion
changes involved in phonotactic turns it points the way for future experimental and
simulation work.

Bibliography
Aggarwal, J. K. and Cai, Q. (2002). Human motion analysis: A review. In Nonrigid
and Articulated Motion Workshop, 1997. Proceedings., IEEE, pages 90–102.
Akay, T., Haehn, S., Schmitz, J., and Buschges, A. (2004). Signals from load sensors
underlie interjoint coordination during stepping movements of the stick insect leg.
Journal of Neurophysiology, 92(1):42–51.
Allen, T. J., Quinn, R. D., Bachmann, R. J., and Ritzmann, R. E. (2003). Abstracted bi-
ological principles applied with reduced actuation improve mobility of legged vehi-
cles. In2003 IEEE/RSJ International Conference on Intelligent Robots and Systems,
2003. (IROS 2003). Proceedings, volume 2, pages 1370–1375.
Altman, J. and Kien, J. (1987). Functional organization of the subesophageal ganglion
in arthropods. In Gupta, A., editor,Arthropod brain: its evolution, development,
structure and function, pages 265–301. Wiley, New York.
Atkins, G., Chiba, A., Atkins, S., and Stout, J. F. (1988). Low-pass filtering of sound
signals by a high-frequency brain neuron and its input in thecricketAcheta domes-
tica l. Journal of Comparative Physiology A: Neuroethology, Sensory, Neural, and
Behavioral Physiology, 164(2):269–276.
Autrum, H. (1958). Electrophysiological analysis of the visual systems in insects.
Experimental Cell Research, 14(5):426–439.
Baden, T. and Hedwig, B. (2007). Neurite-specific Ca2+ dynamics underlying sound
processing in an auditory interneurone.Developmental Neurobiology, 67(1):68–80.
Baden, T. and Hedwig, B. (2008). Front leg movements and tibialmotoneurons un-
derlying auditory steering in the cricket(Gryllus bimaculatusde Geer).Journal of
Experimental Biology, 211(13):2123–2133.
111

112 Bibliography
Bailey, W. J. and Thomson, P. (1977). Acoustic orientation inthe cricketTeleogryllus
oceanicus(Le Guillou). Journal of Experimental Biology, 67(1):61–75.
Ball, E. E., Oldfield, B. P., and Rudolph, K. M. (1989). Auditory organ structure,
development, and function. In Huber, F., Moore, T., and Lohrer, W., editors,Cricket
Behavior and Neurobiology, pages 391–422. Cornel University Press, Ithaca, NY,
US.
Barai, R. K. and Nonami, K. (2007). Optimal two-degree-of-freedom fuzzy control for
locomotion control of a hydraulically actuated hexapod robot. Information Sciences,
177(8):1892–1915.
Bassler, U. (1988). Functional principles of pattern generation for walking movements
of stick insect forelegs: The role of the femoral chordotonal organ afferences.Jour-
nal of Experimental Biology, 136(1):125–147.
Bassler, U. (1993). The femur-tibia control system of stick insects – a model system for
the study of the neural basis of joint control.Brain Research Reviews, 18(2):207–
226.
Bassler, U. and Buschges, A. (1998). Pattern generation for stick insect walking
movements–multisensory control of a locomotor program.Brain Research. Brain
Research Reviews, 27(1):65–88.
Beer, R. D., Chiel, H. J., Quinn, R. D., Espenschied, K. S., and Larsson, P. (1992).
A distributed neural network architecture for hexapod robot locomotion. Neural
Computation, 4(3):356–365.
Beer, R. D., Chiel, H. J., and Sterling, L. S. (1989). Advances inneural information
processing systems 1. chapter Heterogeneous neural networks for adaptive behavior
in dynamic environments, pages 577–585.
Bell, W. J. and Kramer, E. (1979). Search and anemotactic orientation of cockroaches.
Journal of Insect Physiology, 25(8):631–640.
Bender, J. A., Simpson, E. M., and Ritzmann, R. E. (2010). Computer-assisted 3D
kinematic analysis of all leg joints in walking insects.PLoS ONE, 5(10):e13617.
Bender, J. A., Simpson, E. M., Tietz, B. R., Daltorio, K. A., Quinn, R. D., and Ritz-
mann, R. E. (2011). Kinematic and behavioral evidence for a distinction between
Bibliography 113
trotting and ambling gaits in the cockroachBlaberus discoidalis. Journal of Exper-
imental Biology, 214(12):2057–2064.
Bennet-Clark, H. (1989). Songs and the physics of sound production. In Huber, F.,
Moore, T., and Lohrer, W., editors,Cricket Behavior and Neurobiology, pages 227–
261. Cornel University Press, Ithaca, NY, US.
Bennet-Clark, H. C. (1975). The energetics of the jump of the locust schistocerca
gregaria.Journal of Experimental Biology, 63(1):53–83.
Berns, K., Cordes, S., and Ilg, W. (1994). Adaptive, neural control architecture for
the walking machine LAURON. InProceedings of the IEEE/RSJ/GI International
Conference on Intelligent Robots and Systems ’94. ’AdvancedRobotic Systems and
the Real World’, IROS ’94, volume 2, pages 1172–1177. IEEE.
Birch, M., Quinn, R., Hahm, G., Phillips, S., Drennan, B., Fife,A., Verma, H., and
Beer, R. (2000). Design of a cricket microrobot. InRobotics and Automation, 2000.
Proceedings. ICRA ’00. IEEE International Conference on, volume 2, pages 1109–
1114.
Blasing, B. and Cruse, H. (2004). Mechanisms of stick insect locomotion in a gap-
crossing paradigm.Journal of Comparative Physiology A: Sensory, Neural, and
Behavioral Physiology, 190(3):173–183.
Boggess, M. J., Schroer, R. T., Quinn, R. D., and Ritzmann, R. E. (2004). Mechanized
cockroach footpaths enable cockroach-like mobility. In2004 IEEE International
Conference on Robotics and Automation, 2004. Proceedings. ICRA ’04, volume 3,
pages 2871–2876.
Bohm, H. and Schildberger, K. (1992). Brain neurones involvedin the control of
walking in the cricketGryllus bimaculatus. Journal of Experimental Biology,
166(1):113–130.
Borgmann, A., Hooper, S. L., and Buschges, A. (2009). Sensory feedback induced by
front-leg stepping entrains the activity of central pattern generators in caudal seg-
ments of the stick insect walking system.The Journal of Neuroscience, 29(9):2972–
2983.

114 Bibliography
Borgmann, A., Scharstein, H., and Buschges, A. (2007). Intersegmental coordination:
Influence of a single walking leg on the neighboring segmentsin the stick insect
walking system.Journal of Neurophysiology, 98(3):1685–1696.
Borgmann, A., Toth, T. I., Gruhn, M., Daun-Gruhn, S., and Buschges, A. (2012).
Dominance of local sensory signals over inter-segmental effects in a motor system:
experiments.Biological cybernetics, pages 1–13.
Boyan, G. S. (1980). Auditory neurones in the brain of the cricketGryllus bimaculatus
(de Geer).Journal of Comparative Physiology A: Neuroethology, Sensory, Neural,
and Behavioral Physiology, 140(1):81–93.
Boyan, G. S. (1998). Development of the insect auditory system. In Hoy, R. R.,
Popper, A. N., Fay, R. R., Fay, R. R., and Popper, A. N., editors,Comparative
Hearing: Insects, volume 10 ofSpringer Handbook of Auditory Research, pages
97–138. Springer New York.
Boyan, G. S. and Williams, J. L. D. (1981). Descending interneurones in the brain
of the cricket. anatomy and responses to auditory stimuli.Naturwissenschaften,
68(9):486–487.
Boyd, P. and Lewis, B. (1983). Peripheral auditory directionality in the cricket (Gryllus
campestrisL. Teleogryllus oceanicusLe Guillou). Journal of Comparative Physiol-
ogy A: Sensory, Neural, and Behavioral Physiology, 153(4):523–532.
Bradski, G. and Kaehler, A. (2008).Learning OpenCV: Computer Vision with the
OpenCV Library. O’Reilly Media Inc, Sebastopol, CA, USA.
Brunn, D. E. and Dean, J. (1994). Intersegmental and local interneurons in the metatho-
rax of the stick insectCarausius morosusthat monitor middle leg position.Journal
of Neurophysiology, 72(3):1208–1219.
Buchges, A. (1994). The physiology of sensory cells in the ventral scoloparium
of the stick insect femoral chordotonal organ.Journal of Experimental Biology,
189(1):285–292.
Burns, M. D. (1973). The control of walking in orthoptera: I. leg movements in normal
walking. Journal of Experimental Biology, 58(1):45–58.

Bibliography 115
Burrows, M. (1980). The control of sets of motoneurones by local interneurones in the
locust.Journal of Physiology, 298(1):213–233.
Burrows, M. (1987). Parallel processing of proprioceptive signals by spiking local
interneurons and motor neurons in the locust.Journal of Neuroscience, 7(4):1064–
1080.
Burrows, M. (1996a). Components of the nervous system: motoneurons. InThe
neurobiology of an insect brain, pages 48–68. Oxford University Press, Oxford,
UK.
Burrows, M. (1996b).The neurobiology of an insect brain. Oxford University Press,
Oxford, UK.
Buschges, A. (1995). Role of local nonspiking interneurons inthe generation of rhyth-
mic motor activity in the stick insect.Journal of Neurobiology, 27(4):488–512.
Buschges, A., Kittmann, R., and Schmitz, J. (1994). Identifiednonspiking interneu-
rons in leg reflexes and during walking in the stick insect.Journal of Compar-
ative Physiology A: Neuroethology, Sensory, Neural, and Behavioral Physiology,
174(6):685–700.
Buschges, A., Schmitz, J., and Bassler, U. (1995). Rhythmic patterns in the thoracic
nerve cord of the stick insect induced by pilocarpine.Journal of Experimental Biol-
ogy, 198(2):435–456.
Busghes, A. (1990). Nonspiking pathways in a joint-control loop of the stick insect
Carausius Morosus. Journal of Experimental Biology, 151(1):133–160.
Camhi, J. and Johnson, E. (1999). High-frequency steering maneuvers mediated by
tactile cues: antennal wall-following in the cockroach.Journal of Experimental
Biology, 202(5):631–643.
Camhi, J. M. and Levy, A. (1988). Organization of a complex movement: fixed
and variable components of the cockroach escape behavior.Journal of Compar-
ative Physiology A: Neuroethology, Sensory, Neural, and Behavioral Physiology,
163(3):317–328.
Carew, T. (2000).Behavioral neurobiology: the cellular organization of natural be-
havior. Sinauer Associates Publishers, Sunderland, MA, USA.

116 Bibliography
Casaday, G. B. and Hoy, R. R. (1977). Auditory interneurons in thecricketTeleogryllus
oceanicus: Physiological and anatomical properties.Journal of Comparative Physi-
ology A: Neuroethology, Sensory, Neural, and Behavioral Physiology, 121(1):1–13.
Cham, J. G., Bailey, S. A., Clark, J. E., Full, R. J., and Cutkosky, M. R. (2002). Fast
and robust: Hexapedal robots via shape deposition manufacturing.The International
Journal of Robotics Research, 21(10-11):869–882.
Choi, J.-u., Rutter, B. L., Kingsley, D. A., Ritzmann, R. E., and Quinn, R. D. (2005).
A robot with cockroach inspired actuation and control. InProceedings, 2005
IEEE/ASME International Conference on Advanced Intelligent Mechatronics, pages
1569–1574. IEEE.
Cohen, M. J. and Jacklet, J. W. (1967). The functional organization of motor neurons
in an insect ganglion.Philosophical Transactions of the Royal Society of London.
Series B, Biological Sciences, 252(781):561 –569.
Comer, C. M. and Dowd, J. P. (1987). Escape turning behavior of the cockroach.Jour-
nal of Comparative Physiology A: Neuroethology, Sensory, Neural, and Behavioral
Physiology, 160:571–583.
Cowan, N., Ma, E., Cutkosky, M., and Full, R. (2005). A biologically inspired passive
antenna for steering control of a running robot.Robotics Research, pages 541–550.
Cruse, H. (1976). The function of the legs in the free walking stick insect,Carausius
morosus. Journal of Comparative Physiology A: Neuroethology, Sensory, Neural,
and Behavioral Physiology, 112(2):235–262.
Cruse, H. (1985a). Which parameters control the leg movement of a walking in-
sect?: I. velocity control during the stance phase.Journal of Experimental Biology,
116(1):343–355.
Cruse, H. (1985b). Which parameters control the leg movement of a walking insect?:
II. the start of the swing phase.Journal of Experimental Biology, 116(1):357–362.
Cruse, H. (2002). The functional sense of central oscillations in walking. Biological
Cybernetics, 86:271–280.
Cruse, H. and Bartling, C. (1995). Movement of joint angles in the legs of a walking
insect, carausius morosus.Journal of Insect Physiology, 41(9):761–771.

Bibliography 117
Cruse, H., Bartling, C., Cymbalyuk, G., Dean, J., and Dreifert, M. (1995). A modular
artificial neural net for controlling a six-legged walking system. Biological Cyber-
netics, 72:421–430.
Cruse, H., Dean, J., Muller, U., and Schmitz, J. (1991). The stick insect as a walking
robot. InFifth International Conference on Advanced Robotics, 1991.’Robots in
Unstructured Environments’, 91 ICAR, volume 2, pages 936–940. IEEE.
Cruse, H., Dean, J., and Suilmann, M. (1984). The contributions of diverse sense
organs to the control of leg movement by a walking insect.Journal of Compar-
ative Physiology A: Neuroethology, Sensory, Neural, and Behavioral Physiology,
154(5):695–705.
Cruse, H., Kindermann, T., Schumm, M., Dean, J., and Schmitz,J. (1998). Walknet–
a biologically inspired network to control six-legged walking. Neural Networks,
11(7-8):1435–1447.
Daun-Gruhn, S. and Buschges, A. (2011). From neuron to behavior: dynamic
equation-based prediction of biological processes in motor control. Biological Cy-
bernetics, 105(1):71–88.
Daun-Gruhn, S., Toth, T. I., and Borgmann, A. (2012). Dominance of local sensory
signals over inter-segmental effects in a motor system: modeling studies.Biological
cybernetics, pages 1–14.
Dean, J. (1989). Leg coordination in the stick insectCarausius Morosus: Effects of
cutting thoracic connectives.Journal of Experimental Biology, 145(1):103–131.
Delcomyn, F. (1971). The locomotion of the cockroach periplaneta americana.Journal
of Experimental Biology, 54(2):443–452.
Delcomyn, F. (1980). Neural basis of rhythmic behavior in animals. Science,
210(4469):492–498.
Delcomyn, F. (2004). Insect walking and robotics.Annual Review of Entomology,
49(1):51–70.
Delcomyn, F. and Nelson, M. E. (2000). Architectures for a biomimetic hexapod robot.
Robotics and Autonomous Systems, 30(1-2):5–15.
118 Bibliography
Delcomyn, F. and Usherwood, P. (1973). Motor activity during walking in the cock-
roachPeriplaneta americana. Journal of Experimental Biology, 59(3):629–642.
Doherty, J. A. (1985). Temperature coupling and “trade-off” phenomena in the acous-
tic communication system of the cricket,Gryllus bimaculatusde Geer (Gryllidae).
Journal of Experimental Biology, 114(1):17–35.
Doherty, J. A. (1991). Song recognition and localization inthe phonotaxis behavior of
the field cricket,Gryllus bimaculatus(Orthoptera: gryllidae).Journal of Compar-
ative Physiology A: Neuroethology, Sensory, Neural, and Behavioral Physiology,
168.
Doorly, N. C. (2011). A neuromechanical model for cockroach locomotion. Master’s
thesis, Case Western Reserve University.
Dupuy, F. (2009).La perception des mouvements d’air par le systeme cercal chez le
grillon des bois Nemobius sylvestris. PhD thesis, Universite Francois Rabelais -
Tours.
Durr, V. (2001). Stereotypic leg searching movements in the stick insect: Kinematic
analysis, behavioural context and simulation.Journal of Experimental Biology,
204(9):1589–1604.
Durr, V. (2005). Context-dependent changes in strength and efficacy of leg coordina-
tion mechanisms.Journal of Experimental Biology, 208(12):2253–2267.
Durr, V. and Ebeling, W. (2005). The behavioural transition from straight to curve
walking: kinetics of leg movement parameters and the initiation of turning.Journal
of Experimental Biology, 208(12):2237–2252.
Eibl, E. (1978). Morphology of the sense organs in the proximal parts of the tibiae of
Gryllus campestrisL. andGryllus bimaculatusde Geer (Insecta, Ensifera).Zoomor-
phologie, 89(3):185–205.
Ekeberg, O., Blumel, M., and Buschges, A. (2004). Dynamic simulation of insect
walking. Arthropod Structure & Development, 33(3):287–300.
Epstein, S. and Graham, D. (1983). Behaviour and motor outputof stick insects walk-
ing on a slippery surface: I. forward walking.Journal of Experimental Biology,
105(1):215–229.
Bibliography 119
Espenschied, K. S., Chiel, H. J., Quinn, R. D., and Beer, R. D. (1993). Leg coordina-
tion mechanisms in the stick insect applied to hexapod robotlocomotion.Adaptive
Behavior, 1(4):455–468.
Espenschied, K. S., Quinn, R. D., Beer, R. D., and Chiel, H. J. (1996). Biologically
based distributed control and local reflexes improve rough terrain locomotion in a
hexapod robot.Robotics and Autonomous Systems, 18(1-2):59–64.
Fraenkel, G. S. and Gunn, D. L. (1940).The orientation of animals: Kineses, taxes
and compass reactions. Oxford University Press, Oxford, UK.
Franklin, R., Bell, W. J., and Jander, R. (1981). Rotational locomotion by the cock-
roachBlattella germanica. Journal of Insect Physiology, 27(4):249–255.
Franks, N., Wilby, A., Silverman, B., and Tofts, C. (1992). Self-organizing nest con-
struction in ants: sophisticated building by blind bulldozing. Animal Behaviour, 44,
Part 2(0):357–375.
Frantsevich, L. I. and Mokrushov, P. A. (1980). Turning and righting in Geotrupes
(Coleoptera, Scarabaeidae).Journal of Comparative Physiology A: Neuroethology,
Sensory, Neural, and Behavioral Physiology, 136(4):279–289.
Frik, M., Guddat, M., Losch, D., and Karatas, M. (1998). Terrain adaptive control
of the walking machine Tarry II. InProc. European Mechanics Colloquium, Eu-
romech, volume 375, pages 108–115.
Gassmann, B., Scholl, K. U., and Berns, K. (2001). Locomotion of LAURON III in
rough terrain. In2001 IEEE/ASME International Conference on Advanced Intelli-
gent Mechatronics, 2001. Proceedings, volume 2, pages 959–964. IEEE.
Gebhardt, M. and Honegger, H. (2001). Physiological characterisation of antennal
mechanosensory descending interneurons in an insect (Gryllus bimaculatus, Gryllus
campestris) brain. Journal of Experimental Biology, 204(13):2265–2275.
Gnatzy, W. and Hustert, R. (1989). Mechanoreceptors in Behavior. In Huber, F.,
Moore, T., and Lohrer, W., editors,Cricket Behavior and Neurobiology, pages 198–
226. Cornel University Press, Ithaca, NY, US.
Graham, D. (1972). A behavioural analysis of the temporal organisation of walking
movements in the 1st instar and adult stick insect (Carausius morosus). Journal of

120 Bibliography
Comparative Physiology A: Neuroethology, Sensory, Neural, and Behavioral Phys-
iology, 81:23–52.
Gruhn, M., Hoffmann, O., Dubbert, M., Scharstein, H., and Buschges, A. (2006).
Tethered stick insect walking: A modified slippery surface setup with optomotor
stimulation and electrical monitoring of tarsal contact.Journal of Neuroscience
Methods, 158(2):195–206.
Gruhn, M., Zehl, L., and Buschges, A. (2009). Straight walking and turning on a
slippery surface.Journal of Experimental Biology, 212(2):194–209.
Hager, W. W. and Zhang, H. (2006). A new active set algorithm for box constrained
optimization.SIAM Journal on Optimization, 17(2):526–557.
Harris, J. and Ghiradella, H. (1980). The forces exerted on the substrate by walking
and stationary crickets.Journal of Experimental Biology, 85(1):263–279.
Hedrick, T. L. (2008). Software techniques for two- and three-dimensional kinematic
measurements of biological and biomimetic systems.Bioinspiration & Biomimetics,
3(3):034001.
Hedwig, B. (1994). A cephalothoracic command system controls stridulation in the
acridid grasshopper omocestus viridulus l.Journal of Neurophysiology, 72(4):2015–
2025.
Hedwig, B. (2000). Control of cricket stridulation by a command neuron: Efficacy
depends on the behavioral state.Journal of Neurophysiology, 83(2):712–722.
Hedwig, B. (2006). Pulses, patterns and paths: neurobiologyof acoustic behaviour
in crickets.Journal of Comparative Physiology A: Neuroethology, Sensory, Neural,
and Behavioral Physiology, 192(7):677–689.
Hedwig, B. and Poulet, J. F. A. (2004). Complex auditory behaviour emerges from
simple reactive steering.Nature, 430(7001):781–5.
Heinrich, R. (2002). Impact of descending brain neurons on the control of stridulation,
walking, and flight in orthoptera.Microscopy Research and Technique, 56(4):292–
301.
Heitler, W. J. and Burrows, M. (1977). The locust jump. i. the motor programme.
Journal of Experimental Biology, 66(1):203–219.

Bibliography 121
Hennig, R. M. (1988). Ascending auditory interneurons in thecricket Teleogryllus
commodus(Walker): comparative physiology and direct connections with afferents.
Journal of Comparative Physiology A: Neuroethology, Sensory, Neural, and Behav-
ioral Physiology, 163(1):135–143.
Hennig, R. M. (2003). Acoustic feature extraction by cross-correlation in crickets?
Journal of Comparative Physiology A: Neuroethology, Sensory, Neural, and Behav-
ioral Physiology, 189(8):589–598.
Hess, D. and Buschges, A. (1997). Sensorimotor pathways involved in interjoint reflex
action of an insect leg.Journal of Neurobiology, 33(7):891–913.
Hess, D. and Buschges, A. (1999). Role of proprioceptive signals from an insect femur-
tibia joint in patterning motoneuronal activity of an adjacent leg joint. Journal of
Neurophysiology, 81(4):1856–1865.
Hestenes, M. and Stiefel, E. (1952). Methods of conjugate gradients for solving linear
systems.ournal of Research of the National Bureau of Standards, 49:409–436.
Hofmann, T., Koch, U., and Bassler, U. (1985). Physiology of the femoral chordotonal
organ in the stick insect,Cuniculina impigra. Journal of Experimental Biology,
114(1):207–223.
Horchler, A. D., Reeve, R. E., Webb, B., and Quinn, R. D. (2004). Robot phonotaxis in
the wild: a biologically inspired approach to outdoor soundlocalization.Advanced
Robotics, 18(8):801–816.
Horn, E. and Bischof, H. (1983). Gravity reception in crickets: The influence of cereal
and antennal afferences on the head position.Journal of Comparative Physiology
A: Neuroethology, Sensory, Neural, and Behavioral Physiology, 150(1):93–98.
Horn, E. and Foller, W. (1985). Tonic and modulatory subsystems of the complex grav-
ity receptor system in crickets,Gryllus bimaculatus. Journal of Insect Physiology,
31(12):937–946.
Horseman, G. and Huber, F. (1994). Sound localisation in crickets. i. contralateral
inhibition of an ascending auditory interneuron (AN1) in the cricketGryllus bimac-
ulatus. Journal of Comparative Physiology A: Neuroethology, Sensory, Neural, and
Behavioral Physiology, 175(4):389–398.

122 Bibliography
Hoy, R. R. (1978). Acoustic communication in crickets: a modelsystem for the study
of feature detection.Federation Proceedings, 37(10):2316–2323.
Hoy, R. R. and Paul, R. C. (1973). Genetic control of song specificity in crickets.
Science, 180(4081):82–83.
Huber, F. (1960). Untersuchungenuber die funktion des zentralnervensystems und
insbesondere des gehirnes bei der fortbewegung und der lauterzeugung der grillen.
Zeitschrift fur Vergleichende Physiologie, 44(1):60–132.
Huber, F. and Thorson, J. (1985). Cricket auditory communication. Scientific Ameri-
can, 253(6):60–68.
Hughes, G. M. (1952). The Co-Ordination of insect movements ithe walking move-
ments of insects.Journal of Experimental Biology, 29(2):267–285.
Ilg, W. and Berns, K. (1995). A learning architecture based onreinforcement learning
for adaptive control of the walking machine LAURON.Robotics and Autonomous
Systems, 15(4):321–334.
Jindrich, D. and Full, R. (1999). Many-legged maneuverability: dynamics of turning
in hexapods.Journal of Experimental Biology, 202(12):1603–1623.
Kalman, R. E. (1960). A new approach to linear filtering and prediction problems.
Journal of Basic Engineering, 82(1):35–45.
Keller, B. R., Duke, E. R., Amer, A. S., and Zill, S. N. (2007). Tuning posture to body
load: decreases in load produce discrete sensory signals inthe legs of freely stand-
ing cockroaches.Journal of Comparative Physiology A: Neuroethology, Sensory,
Neural, and Behavioral Physiology, 193(8):881–891.
Kennedy, J. S. and Marsh, D. (1974). Pheromone-Regulated anemotaxis in flying
moths.Science, 184(4140):999–1001.
Kien, J. (1983). The initiation and maintenance of walking in the locust: An alternative
to the command concept.Proceedings of the Royal Society of London. Series B.
Biological Sciences, 219(1215):137–174.
Kien, J. (1990a). Neuronal activity during spontaneous walking–I. starting and stop-
ping. Comparative Biochemistry and Physiology Part A: Physiology, 95(4):607–
621.

Bibliography 123
Kien, J. (1990b). Neuronal activity during spontaneous walking–II. correlation
with stepping. Comparative Biochemistry and Physiology Part A: Physiology,
95(4):623–638.
Kostarakos, K., Hennig, M. R., and Romer, H. (2009). Two matched filters and the
evolution of mating signals in four species of cricket.Frontiers in Zoology, 6(1):1–
12.
Kostarakos, K. and Romer, H. (2010). Sound transmission and directional hearing in
field crickets: neurophysiological studies outdoors.Journal of Comparative Physi-
ology A: Neuroethology, Sensory, Neural, and Behavioral Physiology, 196:669–681.
Kram, R., Wong, B., and Full, R. J. (1997). Three-dimensional kinematics and
limb kinetic energy of running cockroaches.Journal of Experimental Biology,
200(13):1919–1929.
Kupfermann, I. and Weiss, K. R. (1978). The command neuron concept. Behavioral
and Brain Sciences, 1(1):3–10.
Kutsch, W. and Huber, F. (1989). Neural basis of song production. In Huber, F.,
Moore, T., and Lohrer, W., editors,Cricket Behavior and Neurobiology, pages 262–
309. Cornel University Press, Ithaca, NY, US.
Laksanacharoen, S., Pollack, A. J., Nelson, G. M., Quinn, R. D., and Ritzmann, R. E.
(2000). Biomechanics and simulation of cricket for microrobot design. InRobotics
and Automation, 2000. Proceedings. ICRA’00. IEEE International Conference on,
volume 2, pages 1088–1094.
Laksanacharoen, S., Quinn, R., and Ritzmann, R. (2003). Modeling of insect’s legs by
inverse kinematics analysis. InProceedings of the 2nd International Symposium on
Adaptive Motion of Animals and Machines, pages 4–8.
Larsen, G., Frazier, S., Fish, S., and Zill, S. (1995). Effects of load inversion in cock-
roach walking.Journal of Comparative Physiology A: Neuroethology, Sensory, Neu-
ral, and Behavioral Physiology, 176(2):229–238.
Larsen, O., Kleindienst, H., and Michelsen, A. (1989). Biophysical aspects of sound
reception. In Huber, F., Moore, T., and Lohrer, W., editors,Cricket Behavior and
Neurobiology, pages 364–390. Cornel University Press, Ithaca, NY, US.

124 Bibliography
Larsen, O. N. (1987). The cricket’s anterior tympanum revisited.Naturwissenschaften,
74(2):92–94.
Laurent, G. and Burrows, M. (1989). Distribution of intersegmental inputs to nonspik-
ing local interneurons and motor neurons in the locust.Journal of Neuroscience,
9(9):3019–3029.
Laurent, G. and Richard, D. (1986a). The organization and role during locomotion
of the proximal musculature of the cricket foreleg: I. Anatomy and innervation.
Journal of Experimental Biology, 123(1):255–283.
Laurent, G. and Richard, D. (1986b). The organization and role during locomotion
of the proximal musculature of the cricket foreleg: II. Electromyographic activity
during stepping patterns.Journal of Experimental Biology, 123(1):285–306.
Lewinger, W., Rutter, B., Blumel, M., Buschges, A., and Quinn, R. (2006). Sen-
sory coupled action switching modules (scasm) generate robust, adaptive stepping
in legged robots. InInternational Conference on Climbing and Walking Robots,
volume 2006, pages 661–671, Brussels, Belgium.
Lewinger, W. A. and Quinn, R. D. (2008). BILL-LEGS: low computation emergent
gait system for small mobile robots. InIEEE International Conference on Robotics
and Automation, 2008. ICRA 2008, pages 251–256. IEEE.
Lewinger, W. A. and Quinn, R. D. (2009). A small, autonomous, agile robot with
an on-board, neurobiologically-based control system. InIEEE/RSJ International
Conference on Intelligent Robots and Systems, 2009. IROS 2009, pages 412–413.
IEEE.
Loher, W., Weber, T., and Huber, F. (1993). The effect of mating on phonotactic
behaviour inGryllus bimaculatus(de Geer).Physiological Entomology, 18(1):57–
66.
Ludwar, B., Goritz, M. L., and Schmidt, J. (2005). Intersegmental coordination of
walking movements in stick insects.Journal of Neurophysiology, 93(3):1255–1265.
Lund, H. H., Webb, B., and Hallam, J. (1997). A robot attractedto the cricket species
Gryllus bimaculatus. In Proceedings of the Fourth European Conference on Artifi-
cial Life, pages 131–140.

Bibliography 125
Mason, A. C., Lee, N., and Oshinsky, M. L. (2005). The start of phonotactic walking
in the fly Ormia ochracea: a kinematic study.Journal of Experimental Biology,
208(24):4699–4708.
Matsumoto, Y. and Mizunami, M. (2002). Temporal determinants of long-term reten-
tion of olfactory memory in the cricketGryllus bimaculatus. Journal of Experimen-
tal Biology, 205(10):1429–1437.
Maye, A., Hsieh, C.-h., Sugihara, G., and Brembs, B. (2007). Order in spontaneous
behavior.PLoS ONE, 2(5):e443.
Mhatre, N. and Balakrishnan, R. (2007). Phonotactic walking paths of field crickets
in closed-loop conditions and their simulation using a stochastic model.Journal of
Experimental Biology, 210(20):3661–3676.
Michel, K. (1974). Das tympanalorgan vonGryllus bimaculatusdegeer (saltatoria,
gryllidae). Zeitschrift fur Morphologie der Tiere, 77:285–315.
Michelsen, A., Popov, A., and Lewis, B. (1994). Physics of directional hearing in the
cricketGryllus bimaculatus. Journal of Comparative Physiology A: Neuroethology,
Sensory, Neural, and Behavioral Physiology, 175(2):153–164.
Mu, L. and Ritzmann, R. E. (2005). Kinematics and motor activity during tethered
walking and turning in the cockroach,Blaberus discoidalis. Journal of Compar-
ative Physiology A: Neuroethology, Sensory, Neural, and Behavioral Physiology,
191(11):1037–1054.
Murphey, R. K. and Zaretsky, M. D. (1972). Orientation to calling song by female
crickets,Scapsipedus marginatus(Gryllidae). Journal of Experimental Biology,
56(2):335–352.
Nabatiyan, A., Poulet, J., de Polavieja, G. G., and Hedwig, B.(2003). Temporal pattern
recognition based on instantaneous spike rate coding in a simple auditory system.
Journal of Neurophysiology, 90(4):2484–2493.
Nishino, H. (2000). Topographic mapping of the axons of the femoral chordo-
tonal organ neurons in the cricketGryllus bimaculatus. Cell and Tissue Research,
299(1):145–157.

126 Bibliography
Nishino, H. (2003). Local innervation patterns of the metathoracic flexor and exten-
sor tibiae motor neurons in the cricketGryllus bimaculatus. Zoological Science,
20(6):697–707.
Nishino, H. and Sakai, M. (1997). Three neural groups in the femoral chordotonal
organ of the cricketGryllus bimaculatus: central projections and soma arrange-
ment and displacement during joint flexion.Journal of Experimental Biology,
200(20):2583–2595.
Nowel, M., Shelton, P., and Stephen, R. (1995). Functional organisation of the
metathoracic femoral chordotonal organ in the cricketAcheta domesticus. Journal
of Experimental Biology, 198(9):1977–1988.
Nye, S. W. and Ritzmann, R. E. (1992). Motion analysis of leg joints associated
with escape turns of the cockroach,Periplaneta americana. Journal of Compar-
ative Physiology A: Neuroethology, Sensory, Neural, and Behavioral Physiology,
171(2):183–194.
Olberg, R., Worthington, A., and Venator, K. (2000). Prey pursuit and interception in
dragonflies.Journal of Comparative Physiology A: Neuroethology, Sensory, Neural,
and Behavioral Physiology, 186(2):155–162.
Payne, M. (2010).Co-ordinating Behaviours in an Insect Biorobot. PhD thesis, Uni-
versity of Edinburgh.
Payne, M., Hedwig, B., and Webb, B. (2010). Multimodal predictive control in crick-
ets. In Doncieux, S., Girard, B., Guillot, A., Hallam, J., Meyer, J.-A., and Mouret,
J.-B., editors,From Animals to Animats 11, volume 6226 ofLecture Notes in Com-
puter Science, pages 167–177. Springer Berlin / Heidelberg.
Pearson, K. G. (1972). Central programming and reflex controlof walking in the
cockroach.Journal of Experimental Biology, 56(1):173–193.
Pearson, K. G. and Fourtner, C. R. (1975). Nonspiking interneurons in walking system
of the cockroach.Journal of Neurophysiology, 38(1):33–52.
Pearson, K. G. and Iles, J. F. (1973). Nervous mechanisms underlying intersegmen-
tal Co-Ordination of leg movements during walking in the cockroach. Journal of
Experimental Biology, 58(3):725–744.

Bibliography 127
Petrou, G. and Webb, B. (2012). Detailed tracking of body and leg movements of a
freely walking female cricket during phonotaxis.Journal of Neuroscience Methods,
203(1):56–68.
Pfeiffer, F., Eltze, J., and Weidemann, H. (1995). Six-legged technical walking consid-
ering biological principles.Robotics and Autonomous Systems, 14(2-3):223–232.
Pollack, G. S. and Hoy, R. R. (1979). Temporal pattern as a cue for species-specific
calling song recognition in crickets.Science, 204(4391):429–432.
Popov, A. V. and Markovich, A. M. (1982). Auditory interneurones in the prothoracic
ganglion of the cricket,Gryllus bimaculatus. Journal of Comparative Physiology A:
Neuroethology, Sensory, Neural, and Behavioral Physiology, 146(3):351–359.
Popov, A. V., Markovich, A. M., and Andjan, A. S. (1978). Auditory interneurons
in the prothoracic ganglion of the cricket,Gryllus bimaculatusDeGeer.Journal of
Comparative Physiology A: Neuroethology, Sensory, Neural, and Behavioral Phys-
iology, 126(2):183–192.
Popov, A. V. and Shuvalov, V. F. (1977). Phonotactic behavior of crickets.Journal of
Comparative Physiology A: Neuroethology, Sensory, Neural, and Behavioral Phys-
iology, 119(1):111–126.
Poulet, J. F. A. and Hedwig, B. (2005). Auditory orientation in crickets: Pattern recog-
nition controls reactive steering.Proceedings of the National Academy of Sciences
of the United States of America, 102(43):15665–15669.
Quinn, R. and Ritzmann, R. (1998). Construction of a hexapod robot with cockroach
kinematics benefits both robotics and biology.Connection Science, 10(3):239–254.
Reeve, R., Schaik, A. v., Jin, C., Hamilton, T., Torben-Nielsen, B., and Webb, B.
(2007). Directional hearing in a silicon cricket.BioSystems, 87(2-3):307–313.
Reeve, R. E. and Webb, B. H. (2003). New neural circuits for robotphonotaxis.Philo-
sophical Transactions of the Royal Society of London A, 361(1811):2245–2266.
Regen, J. (1913).Ueber die anlockung des weibchens vonGryllus campestrisdurch
telephonischeubertragung der stridulation des mannchens.Pflugers Archiv Euro-
pean Journal of Physiology, 155(1):193–200.

128 Bibliography
Rheinlaender, J. and Blatgen, G. (1982). The precision of auditory lateralizationin the
cricket,Gryllus bimaculatus. Physiological Entomology, 7(2):209–218.
Ridgel, A., Alexander, B., and Ritzmann, R. (2007). Descending control of turning
behavior in the cockroach,Blaberus discoidalis. Journal of Comparative Physiology
A: Neuroethology, Sensory, Neural, and Behavioral Physiology, 193(4):385–402.
Romer, H. (1993). Environmental and biological constraintsfor the evolution of Long-
Range signalling and hearing in acoustic insects.Royal Society of London Philo-
sophical Transactions Series B, 340:179–185.
Rosano, H. and Webb, B. (2007). A dynamic model of thoracic differentiation for the
control of turning in the stick insect.Biological Cybernetics, 97(3):229–246.
Rutter, B., Taylor, B., Bender, J., Blumel, M., Lewinger, W., Ritzmann, R., and Quinn,
R. (2011). Descending commands to an insect leg controller network cause smooth
behavioral transitions. InIntelligent Robots and Systems (IROS), 2011 IEEE/RSJ
International Conference on, pages 215–220.
Ryckebusch, S. and Laurent, G. (1993). Rhythmic patterns evoked in locust leg mo-
tor neurons by the muscarinic agonist pilocarpine.Journal of Neurophysiology,
69(5):1583–1595.
Saranli, U., Buehler, M., and Koditschek, D. E. (2001). RHex: asimple and highly
mobile hexapod robot.The International Journal of Robotics Research, 20(7):616–
631.
Schildberger, K. (1984a). Multimodal interneurons in the cricket brain: properties of
identified extrinsic mushroom body cells.Journal of Comparative Physiology A:
Neuroethology, Sensory, Neural, and Behavioral Physiology, 154(1):71–79.
Schildberger, K. (1984b). Temporal selectivity of identified auditory neurons in the
cricket brain.Journal of Comparative Physiology A: Neuroethology, Sensory, Neu-
ral, and Behavioral Physiology, 155(2):171–185.
Schildberger, K. (1988). Behavioral and neuronal mechanisms of cricket phonotaxis.
Cellular and Molecular Life Sciences (CMLS), 44(5):408–415.

Bibliography 129
Schildberger, K. and Horner, M. (1988). The function of auditory neurons in cricket
phonotaxis. I. influence of hyperpolarization of identifiedneurons on sound local-
ization.Journal of Comparative Physiology A: Neuroethology, Sensory, Neural, and
Behavioral Physiology, 163:621–631.
Schildberger, K., Huber, F., and Wohlers, D. W. (1989). Central auditory pathway:
neuronal correlates of phonotactic behavior. In Huber, F.,Moore, T., and Lohrer,
W., editors,Cricket Behavior and Neurobiology, pages 423–458. Cornel University
Press, Ithaca, NY, US.
Schilling, M., Cruse, H., and Arena, P. (2007). Hexapod walking: an expansion to
walknet dealing with leg amputations and force oscillations.Biological Cybernetics,
96:323–340.
Schmitz, B., Scharstein, H., and Wendler, G. (1982). Phonotaxis in Gryllus campestris
l. (orthoptera, gryllidae).Journal of Comparative Physiology A: Neuroethology,
Sensory, Neural, and Behavioral Physiology, 148:431–444.
Schneider, A., Cruse, H., and Schmitz, J. (2005). A biologically inspired active com-
pliant joint using local positive velocity feedback (LPVF). IEEE Transactions on
Systems, Man, and Cybernetics, Part B: Cybernetics, 35(6):1120–1130.
Schneider, A., Cruse, H., and Schmitz, J. (2006). Decentralized control of elastic
limbs in closed kinematic chains.The International Journal of Robotics Research,
25(9):913–930.
Schoneich, S. and Hedwig, B. (2010). Hyperacute directional hearing and phonotactic
steering in the cricket (Gryllus bimaculatusde geer).PLoS ONE, 5(12):e15141.
Selverston, A., Kleindienst, H., and Huber, F. (1985). Synaptic connectivity between
cricket auditory interneurons as studied by selective photoinactivation. Journal of
Neuroscience, 5(5):1283–1292.
Shotton, J., Fitzgibbon, A., Cook, M., Sharp, T., Finocchio,M., Moore, R., Kipman,
A., and Blake, A. (2011). Real-time human pose recognition in parts from single
depth images. InCVPR, volume 2, page 3.
Siegler, M. V. (1981). Postural changes alter synaptic interactions between nonspik-
ing interneurons and motor neurons of the locust.Journal of Neurophysiology,
46(2):310–323.

130 Bibliography
Siegler, M. V. S. and Pousman, C. A. (1990). Distribution of motor neurons into
anatomical groups in the grasshopper metathoracic ganglion. Journal of Compara-
tive Neurology, 297(2):313–327.
Simmons, L. (1990). Post-copulatory guarding, female choice and the levels of gre-
garine infections in the field cricket,Gryllus bimaculatus. Behavioral Ecology and
Sociobiology, 26:403–407.
Sponberg, S. and Full, R. (2008). Neuromechanical response of musculo-skeletal
structures in cockroaches during rapid running on rough terrain. Journal of Ex-
perimental Biology, 211(3):433–446.
Srinivasan, M., Zhang, S., Altwein, M., and Tautz, J. (2000). Honeybee navigation:
nature and calibration of the “odometer”.Science, 287(5454):851–853.
Stabel, J., Wendler, G., and Scharstein, H. (1989). Cricket phonotaxis: localization de-
pends on recognition of the calling song pattern.Journal of Comparative Physiology
A: Neuroethology, Sensory, Neural, and Behavioral Physiology, 165(2):165–177.
Staudacher, E. (1998). Distribution and morphology of descending brain neurons in
the cricketGryllus bimaculatus. Cell and Tissue Research, 294(1):187–202.
Staudacher, E. and Schildberger, K. (1998). Gating of sensory responses of descend-
ing brain neurones during walking in crickets.Journal of Experimental Biology,
201(4):559–572.
Staudacher, E. M. (2001). Sensory responses of descending brain neurons in the walk-
ing cricket,Gryllus bimaculatus. Journal of Comparative Physiology A: Neuroethol-
ogy, Sensory, Neural, and Behavioral Physiology, 187(1):1–17.
Stewart, F. J., Baker, D. A., and Webb, B. (2010). A model of visual-olfactory integra-
tion for odour localisation in free-flying fruit flies.Journal of Experimental Biology,
213(11):1886–1900.
Stout, J. F., DeHaan, C. H., and McGhee, R. W. (1983). Attractiveness of the male
Acheta domesticuscalling song to females. i. dependence on each of the callingsong
features. Journal of Comparative Physiology A: Neuroethology, Sensory, Neural,
and Behavioral Physiology, 153(4):509–521.

Bibliography 131
Stout, J. F. and McGhee, R. W. (1988). Attractiveness of the male Acheta domesticus
calling song to females. II. The relative importance of syllable period, intensity and
chirp rate.Journal of Comparative Physiology A: Neuroethology, Sensory, Neural,
and Behavioral Physiology, 164(4):277–287.
Strauss, R. and Heisenberg, M. (1990). Coordination of legs during straight walking
and turning inDrosophila melanogaster. Journal of Comparative Physiology A:
Neuroethology, Sensory, Neural, and Behavioral Physiology, 167(3):403–412.
Takeuchi, S. and Shimoyama, I. (2004). A radio-telemetry system with a shape mem-
ory alloy microelectrode for neural recording of freely moving insects.IEEE Trans-
actions on Biomedical Engineering, 51(1):133–137.
Thorson, J., Weber, T., and Huber, F. (1982). Auditory behavior of the cricket. II. Sim-
plicity if calling song recognition inGryllus, and anomalous phonotaxis at abnormal
carrier frequencies.Journal of Comparative Physiology A: Neuroethology, Sensory,
Neural, and Behavioral Physiology, 146:361–378.
Tryba, A. K. and Ritzmann, R. E. (2000). Multi-Joint coordination during walking and
foothold searching in theBlaberuscockroach. I. kinematics and electromyograms.
Journal of Neurophysiology, 83(6):3323–3336.
Von Frisch, K. (1967).The dance language and orientation of bees. Harvard University
Press, Cambridge, MA, US.
von Twickel, A., Buschges, A., and Pasemann, F. (2011). Deriving neural network
controllers from neuro-biological data: implementation of a single-leg stick insect
controller.Biological Cybernetics, 104(1-2):95–119.
von Twickel, A., Hild, M., Siedel, T., Patel, V., and Pasemann, F. (2012). Neural con-
trol of a modular multi-legged walking machine: Simulationand hardware.Robotics
and Autonomous Systems, 60(2):227–241.
Walker, T. J. and Masaki, S. (1989). Natural history. In Huber, F., Moore, T., and
Lohrer, W., editors,Cricket Behavior and Neurobiology, pages 1–42. Cornel Uni-
versity Press, Ithaca, NY, US.
Watson, A. H. D., Burrows, M., and Hale, J. P. (1985). The morphology and ultra-
structure of common inhibitory motor neurones in the thoraxof the locust.Journal
of Comparative Neurology, 239(3):341–359.

132 Bibliography
Watson, J. T. and Ritzmann, R. E. (1997). Leg kinematics and muscle activity during
treadmill running in the cockroach,Blaberus discoidalis: I. slow running. Jour-
nal of Comparative Physiology A: Neuroethology, Sensory, Neural, and Behavioral
Physiology, 182(1):11–22.
Watson, J. T., Ritzmann, R. E., Zill, S. N., and Pollack, A. J. (2002). Control of ob-
stacle climbing in the cockroach,Blaberus discoidalis. I. Kinematics. Journal of
Comparative Physiology A: Neuroethology, Sensory, Neural, and Behavioral Phys-
iology, 188(1):39–53.
Webb, B. (1995). Using robots to model animals: a cricket test. Robotics and Au-
tonomous Systems, 16(2-4):117–134.
Webb, B. (2000). What does robotics offer animal behaviour?Animal Behaviour,
60(5):545–558.
Webb, B. (2001). Can robots make good models of biological behaviour? Behavioral
and brain sciences, 24:1033–1050.
Webb, B. (2006). Validating biorobotic models.Journal of Neural Engineering,
3(3):R25–R35.
Webb, B. (2008). Spiking neuron controllers for a sound localising robot. In Arena, P.,
Pfeiffer, F., Rammerstorfer, F. G., Salenon, J., Schrefler, B., and Serafini, P., editors,
Dynamical Systems, Wave-Based Computation and Neuro-Inspired Robots, volume
500 ofCISM Courses and Lectures, pages 119–130. Springer Vienna.
Webb, B. and Scutt, T. (2000). A simple latency-dependent spiking-neuron model of
cricket phonotaxis.Biological Cybernetics, 82(3):247–269.
Weber, T. and Thorson, J. (1989). Phonotactic behavior of walking crickets. In Huber,
F., Moore, T., and Lohrer, W., editors,Cricket Behavior and Neurobiology, pages
310–339. Cornel University Press, Ithaca, NY, USA.
Weber, T., Thorson, J., and Huber, F. (1981). Auditory behavior of the cricket. I. Dy-
namics of compensated walking and discrimination paradigms on the kramer tread-
mill. Journal of Comparative Physiology A: Neuroethology, Sensory, Neural, and
Behavioral Physiology, 141(2):215–232.

Bibliography 133
Wehner, R. (2003). Desert ant navigation: how miniature brains solve complex tasks.
Journal of Comparative Physiology A: Sensory, Neural, and Behavioral Physiology,
189:579–588.
Weidemann, H. J., Pfeiffer, F., and Eltze, J. (1993). A design concept for legged robots
derived from the walking stick insect. InProceedings of the 1993 IEEE/RSJ Inter-
national Conference on Intelligent Robots and Systems ’93, IROS ’93, volume 1,
pages 545–552. IEEE.
Weidemann, H. J., Pfeiffer, F., and Eltze, J. (1994). The six-legged TUM walking
robot. InProceedings of the IEEE/RSJ/GI International Conference onIntelligent
Robots and Systems ’94. ’Advanced Robotic Systems and the Real World’, IROS ’94,
volume 2, pages 1026–1033. IEEE.
Wendler, G. (1990). Pattern recognition and localization in cricket phonotaxis. In Grib-
akin, G., Wiese, K., and Popov, A., editors,Sensory systems and communication in
arthropods, pages 387–394. Basel: Birkhauser.
Wiese, K. (1981). Influence of vibration on cricket hearing:Interaction of low fre-
quency vibration and acoustic stimuli in the omega neuron.Journal of Compar-
ative Physiology A: Neuroethology, Sensory, Neural, and Behavioral Physiology,
143(1):135–142.
Wiese, K. and Eilts, K. (1985). Evidence for matched frequency dependence of bi-
lateral inhibition in the auditory pathway ofGryllus bimaculatus. Zoologische
Jahrbucher, 89(2):181–201.
Witney, A. G. and Hedwig, B. (2011). Kinematics of phonotactic steering in the
walking cricketGryllus bimaculatus(de Geer).Journal of Experimental Biology,
214(1):69–79.
Wohlers, D. W. and Huber, F. (1978). Intracellular recording and staining of cricket
auditory interneuronsGryllus campestrisL., Gryllus bimaculatusDeGeer). Jour-
nal of Comparative Physiology A: Neuroethology, Sensory, Neural, and Behavioral
Physiology, 127(1):11–28.
Wohlers, D. W. and Huber, F. (1982). Processing of sound signals by six types of
neurons in the prothoracic ganglion of the cricketGryllus campestrisL. Journal of

134 Bibliography
Comparative Physiology A: Neuroethology, Sensory, Neural, and Behavioral Phys-
iology, 146(2):161–173.
Wolf, H. and Laurent, G. (1994). Rhythmic modulation of the responsiveness of lo-
cust sensory local interneurons by walking pattern generating networks.Journal of
Neurophysiology, 71(1):110–118.
Yoneda, K. and Ota, Y. (2003). Non-Bio-Mimetic walkers.The International Journal
of Robotics Research, 22(3-4):241–249.
Zakotnik, J., Matheson, T., and Durr, V. (2004). A posture optimization algorithm
for model-based motion capture of movement sequences.Journal of Neuroscience
Methods, 135(1-2):43–54.
Zhang, Y., Huang, H., Liu, X., and Ren, L. (2011). Kinematics of terrestrial locomotion
in mole cricketGryllotalpa orientalis. Journal of Bionic Engineering, 8(2):151–157.
Zill, S. N. (1986). A model of pattern generation of cockroach walking reconsidered.
Journal of Neurobiology, 17(4):317–328.
Zollikofer, C. P. E. (1994). Stepping patterns in ants. I. Influence of speed and curva-
ture. Journal of Experimental Biology, 192(1):95–106.
Zolotov, V., Frantsevich, L., and Falk, E. M. (1975). Kinematik der phototaktischen
drehung bei der honigbieneApis melliferaL. Journal of Comparative Physiology
A: Neuroethology, Sensory, Neural, and Behavioral Physiology, 97(4):339–353.
Zorovic, M. and Hedwig, B. (2011). Processing of species-specific auditory patterns
in the cricket brain by ascending, local, and descending neurons during standing and
walking. Journal of Neurophysiology, 105(5):2181–2194.