Some properties of a sequencing batch reactor system for removal of vat dyes
10
Some properties of a sequencing batch reactor system for removal of vat dyes Suntud Sirianuntapiboon a, * , Kanidta Chairattanawan b , Sawanya Jungphungsukpanich a a Department of Environmental Technology, School of Energy and Materials, King Mongkut’s University of Technology Thonburi (KMUTT), Bangkok 10140, Thailand b Department of Applied Science, Office of General Education, Sripatum University, Phahonyothin Road, Chatucak, Bangkok 10900, Thailand Received 6 March 2004; received in revised form 5 February 2005; accepted 5 February 2005 Available online 14 July 2005 Abstract Bio-sludge from a wastewater treatment plant could be used as an adsorbent of vat dye from textile wastewater. Resting bio- sludge gave a higher adsorption capacity than dead bio-sludge. The resting bio-sludge from a textile wastewater treatment plant gave relatively high COD, BOD 5 and dye adsorption capacity of 364.4 ± 4.3, 178.0 ± 9.0 and 50.5 ± 1.3 mg/g of bio-sludge, respec- tively, in synthetic textile wastewater containing 40 mg/l Vat Yellow 1. Another advantage of the bio-sludge was that, after washing with 0.1 N NaOH solution, it was reusable without any activity loss. Through treatment with a sequencing batch reactor (SBR) system, both organic and dye in STIWW could be removed. The maximum dye (Vat Yellow 1), COD, BOD 5 and TKN removal efficiencies of the SBR system under an MLSS of 2000 mg/l and an HRT of three days were 98.5 ± 1.0%, 96.9 ± 0.7%, 98.6 ± 0.1% and 93.4 ± 1.3%, respectively. Although, the dye and organic removal efficiencies of the SBR system with real textile wastewater were quite low, they could be increased by adding organic matters, especially glucose. The dye, COD, BOD 5 and TKN removal efficiencies of the SBR system with glucose (0.89 g/l) supplemented textile industrial wastewater were 75.12 ± 1.2%, 70.61 ± 3.4%, 96.7 ± 0.0%, and 63.2 ± 1.1%, respectively. Ó 2005 Elsevier Ltd. All rights reserved. Keywords: Sequencing batch reactor (SBR) system; Textile industry; Vat dye; Adsorption 1. Introduction Textile wastewater causes significant environmental pollution (Slokar and Marechal, 1998; Clarke and Steinle, 1995; Horning, 1978; Banat et al., 1996). Textile wastewater contains high concentrations of both organic matter and colorants (dyes) (Slokar and Marechal, 1998; Clarke and Steinle, 1995; Horning, 1978). Vat dyes are mainly used in textile industry for dying cellulose and silk materials according to resistant with sunlight and detergent (Hu, 1996; Slokar and Marechal, 1998; Wong and Yuen, 1996; Graca et al., 2001; Gupta et al., 1992). They are water insoluble dye, but they were dissolved in the water after reduction under alkaline condition. Chemical treatment processes such as oxidation, ion exchange, precipitation, coagula- tion and adsorption are commonly used to remove the colorants from textile wastewaters (Slokar and Mare- chal, 1998; Ramakrishna and Viraraghvan, 1997). How- ever, chemical treatment processes can be unsuitable due to the high chemical and operating costs and solid wastes generation. Conventional biological treatment processes such as activated sludge, oxidation ponds and aerated lagoons are also used in the textile industry. 0960-8524/$ - see front matter Ó 2005 Elsevier Ltd. All rights reserved. doi:10.1016/j.biortech.2005.02.052 * Corresponding author. Tel.: +66 2 470 8602; fax: +66 2 470 8660/ 427 9062. E-mail address: [email protected] (S. Sirianuntapiboon).
-
Upload
independent -
Category
Documents
-
view
5 -
download
0
Transcript of Some properties of a sequencing batch reactor system for removal of vat dyes
Some properties of a sequencing batch reactor systemfor removal of vat dyes
Suntud Sirianuntapiboon a,*, Kanidta Chairattanawan b,Sawanya Jungphungsukpanich a
a Department of Environmental Technology, School of Energy and Materials, King Mongkut’s University of Technology Thonburi (KMUTT),
Bangkok 10140, Thailandb Department of Applied Science, Office of General Education, Sripatum University, Phahonyothin Road, Chatucak, Bangkok 10900, Thailand
Received 6 March 2004; received in revised form 5 February 2005; accepted 5 February 2005Available online 14 July 2005
Abstract
Bio-sludge from a wastewater treatment plant could be used as an adsorbent of vat dye from textile wastewater. Resting bio-sludge gave a higher adsorption capacity than dead bio-sludge. The resting bio-sludge from a textile wastewater treatment plantgave relatively high COD, BOD5 and dye adsorption capacity of 364.4 ± 4.3, 178.0 ± 9.0 and 50.5 ± 1.3 mg/g of bio-sludge, respec-tively, in synthetic textile wastewater containing 40 mg/l Vat Yellow 1. Another advantage of the bio-sludge was that, after washingwith 0.1 N NaOH solution, it was reusable without any activity loss. Through treatment with a sequencing batch reactor (SBR)system, both organic and dye in STIWW could be removed. The maximum dye (Vat Yellow 1), COD, BOD5 and TKN removalefficiencies of the SBR system under an MLSS of 2000 mg/l and an HRT of three days were 98.5 ± 1.0%, 96.9 ± 0.7%,98.6 ± 0.1% and 93.4 ± 1.3%, respectively. Although, the dye and organic removal efficiencies of the SBR system with real textilewastewater were quite low, they could be increased by adding organic matters, especially glucose. The dye, COD, BOD5 and TKNremoval efficiencies of the SBR system with glucose (0.89 g/l) supplemented textile industrial wastewater were 75.12 ± 1.2%,70.61 ± 3.4%, 96.7 ± 0.0%, and 63.2 ± 1.1%, respectively.� 2005 Elsevier Ltd. All rights reserved.
Keywords: Sequencing batch reactor (SBR) system; Textile industry; Vat dye; Adsorption
1. Introduction
Textile wastewater causes significant environmentalpollution (Slokar and Marechal, 1998; Clarke andSteinle, 1995; Horning, 1978; Banat et al., 1996). Textilewastewater contains high concentrations of bothorganic matter and colorants (dyes) (Slokar andMarechal, 1998; Clarke and Steinle, 1995; Horning,1978). Vat dyes are mainly used in textile industry fordying cellulose and silk materials according to resistant
0960-8524/$ - see front matter � 2005 Elsevier Ltd. All rights reserved.doi:10.1016/j.biortech.2005.02.052
* Corresponding author. Tel.: +66 2 470 8602; fax: +66 2 470 8660/427 9062.
E-mail address: [email protected] (S. Sirianuntapiboon).
with sunlight and detergent (Hu, 1996; Slokar andMarechal, 1998; Wong and Yuen, 1996; Graca et al.,2001; Gupta et al., 1992). They are water insolubledye, but they were dissolved in the water after reductionunder alkaline condition. Chemical treatment processessuch as oxidation, ion exchange, precipitation, coagula-tion and adsorption are commonly used to remove thecolorants from textile wastewaters (Slokar and Mare-chal, 1998; Ramakrishna and Viraraghvan, 1997). How-ever, chemical treatment processes can be unsuitable dueto the high chemical and operating costs and solidwastes generation. Conventional biological treatmentprocesses such as activated sludge, oxidation pondsand aerated lagoons are also used in the textile industry.

The organic matter producing biochemical oxygen de-mand (BOD5) is easily removed by biological treatmentprocesses, but almost all of the colorants remain in thewastewater (being poorly biodegradable compounds)(Slokar and Marechal, 1998; Kim et al., 2002; Banat etal., 1996). This means that the effluent quality of con-ventionally treated biological wastewater, especially col-or intensity and chemical oxygen demand (COD), ishigher than the standard permitted by the Departmentof Industrial Works of Thailand (Department of Indus-trial Works, 1992). During the past 20 years, researchershave concentrated on the use of microorganisms forremoving colorants from textile industrial wastewater(Banat et al., 1996; Fu and Viraraghavan, 2001; Hu,1996; Slokar and Marechal, 1998; Aksu, 2001; Assadiand Jahangiri, 2001; Balan Doralice and Monteiro,2001; Kapdan et al., 2000). The ability to biologicallyremove color was found in both aerobic and anaerobicmicroorganisms (Slokar and Marechal, 1998). Colorantremoval mechanisms are based on either adsorption ordegradation or both (Slokar and Marechal, 1998; Fuand Viraraghavan, 2001; Hu, 1996; Zaoyan et al.,1992; Walker and Weatherley, 2000). Colorants suchas azo, diazo and reactive dyes could be adsorbed byboth dead and living microorganisms (Nigam et al.,1995; Wong and Yuen, 1996; Mitta and Gupta, 1996;Fu and Viraraghavan, 2001). Also, both gram-negativeand gram-positive bacteria in bio-sludge showed color-ant removal ability (Hu, 1996). However, all theseresearchers used single strains of microorganisms to re-move colorants from textile industrial wastewater. In thepresent study, bio-sludge from a biological wastewatertreatment plant was used to remove the colorants of tex-tile wastewater. Two types of bio-sludge namely waste-water treatment plant bio-sludge and textile industrialwastewater treatment plant bio-sludge were tested forcolorant removal efficiency, especially for vat dyes.
Table 1Types and sources of bio-sludgea
Type Source T
Bio-sludgetype A
Bangkok municipal centralwastewater treatment plant, Thailand
Es
Bio-sludgetype B
Textile wastewater treatment plant inSamuthpakarn province, Thailand
Cs
a Bio-sludge was collected from the bio-sludge storage tank of each wastew
Table 2Types and properties of vat dyes that used in the experiments
Scientific name Trade name Color index no.
Vat Black 25 Cibanone olive s. 69525Vat Yellow 1 Mikthrene yellow 70600– Industrial wastewatera –
a From textile factory in Samuthpakarn province, Thailand. The wastewat
The optimum conditions for resting and autoclavedbio-sludge to remove colorant from wastewater weredetermined and the most suitable solvents to elute colo-rants from colorant adsorbed-bio-sludge were investi-gated. The color removal efficiency of living bio-sludgewas tested in a sequencing batch reactor (SBR) systemunder various solid retention times (sludge age).
2. Methods
2.1. Bio-sludge
Two types of bio-sludge were used in this study: bio-sludge type A and bio-sludge type B. Bio-sludge type Awas collected from the Bangkok municipal centralwastewater treatment plant (Siphaya plant), Thailand.The bio-sludge type B was collected from an textile fac-tory wastewater treatment plant in Samuthpakarn prov-ince, Thailand. The characteristics of bio-sludges weredescribed in Table 1. Both types of bio-sludge were usedas resting bio-sludge after washing with 0.1 M acetatebuffer pH 6.0, and tested as autoclaved bio-sludge afterbeing autoclaved at 110 �C for 10 min.
2.2. Dyes
The two types of vat dyes, commonly used in the tex-tile industry were selected for use in this study: CibanoneOlive S (Vat Black 25) and Mikethrene (Vat Yellow 1)(Table 2).
2.3. Textile wastewater
Two kinds of wastewater were used in this study: tex-tile wastewater (TIWW) and synthetic textile wastewater(STIWW). TIWW was collected from a textile factory
reatment system Sludge age (SRT) (days)
xtended activatedludge system
28
onventional activatedludge system
17
ater treatment plant.
Color Wavelength of maximumabsorption (nm)
Dark blue 675Yellow 587Mixed color, dark color 404
er was contaminated with both Vat Black 25 and Vat Yellow 1.

Table 3Chemical properties of textile wastewater (TIWW) from factory inSamuthpakarn province
Chemical properties Concentration
TIWW TIWW + glucosea
COD, mg/l 1851 2638BOD5, mg/l 450 1200TKN, mg/l 21 21pH 2.33 7.0Color intensity (A404 nm), units/ml 0.86 0.86
a TIWW + glucose contained 0.89 g/l of glucose; the final BOD5 ofthe wastewater was about 1200 mg/l.
located in Samuthprakarn province, Thailand. Thechemical properties of TIWW were described in Table 3.STIWW was prepared according to the TIWW qualityabove. The STIWW contained BOD5 and Vat dye(Vat Black 25 and Vat Yellow 1) in the concentrationsof 1200 mg/l and 40 mg/l, respectively. The chemicalcomposition of STIWW is shown in Table 4.
2.4. Dye adsorption test
The adsorptions of dye by both resting and auto-claved bio-sludges were determined by the Jar test sys-tem (Rubin, 1978) using the STIWW containing twokinds of vat dye (Vat Black 25 and Vat Yellow 1). Thedye adsorption yields of both resting and autoclavedbio-sludge were measured using Freundlich�s adsorptionisotherm equation (Rubin, 1978).
2.5. Elution of dye from bio-sludge
Resting and autoclaved types A and B bio-sludge,were kept in both STIWW containing Vat Black 25and STIWW containing Vat Yellow 1 for 12 h (the opti-mal period for maximal dye adsorption, data notshown), were used in the experiment as dye adsorbedbio-sludge. The dye adsorbed bio-sludge samples weretreated with several solutions such as distilled water,0.1 M phosphate buffer pH 7.0, 0.1 N NaOH, 0.1 NHNO3 and 0.1 M EDTA solutions. The amount ofdye eluted in the supernatant was determined after cen-trifugation at 6000g.
Table 4Chemical composition and properties of STIWW
Chemical composition Chemica
Composition Concentration Properti
Glucose, mg/l 1875 COD, mUrea, mg/l 115 BOD5, mFeCl2, mg/l 3.5 TKN, mNaHCO3, mg/l 675 SS, mg/lKH2PO4, mg/l 55 Color inMgSO4 Æ 7H2O, mg/l 42.5 pHVat dyea, mg/l 40
a Two kinds of vat dye as shown in Table 2 were used in this experiment.
2.6. Acclimatization of bio-sludge for the SBR system
Bio-sludge from the Bangkok municipal centralwastewater treatment plant was used as an inoculumof the SBR system. Bio-sludge was acclimatized inSTIWW without vat dyes for one week before using inthe experiments.
2.7. Sequencing batch reactor system (SBR)
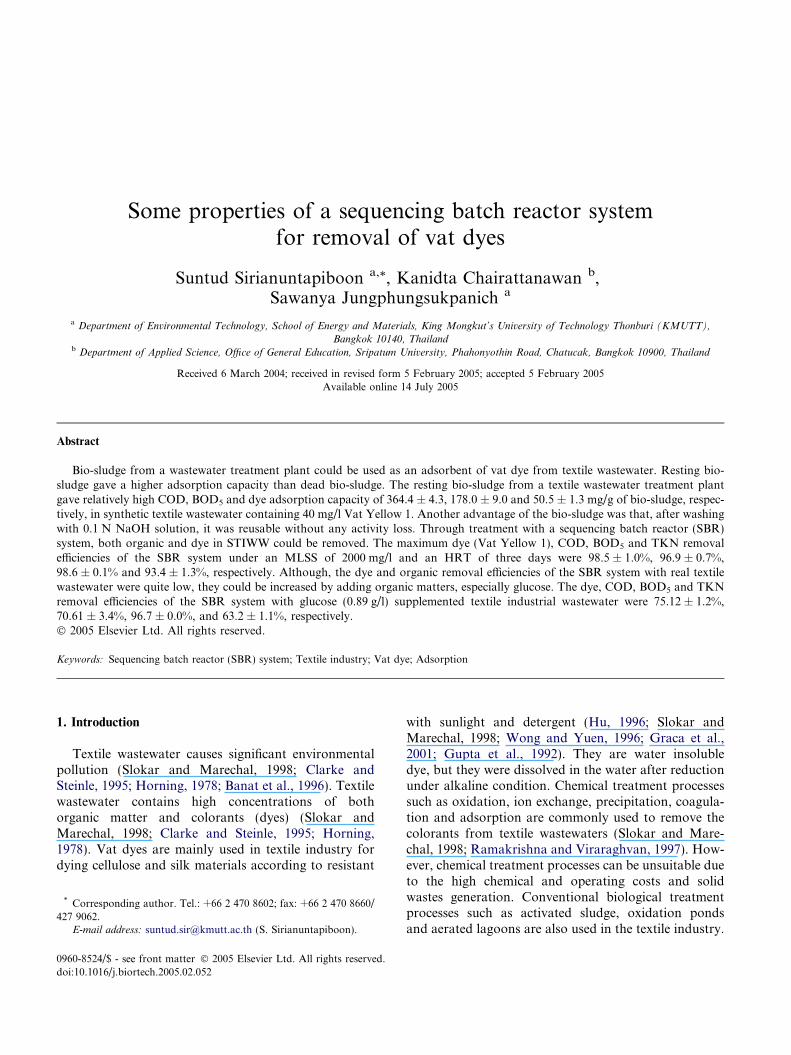
Six reactors (each of 10 l capacity) were made fromacrylic plastic (5 mm thick) as shown in Fig. 1. Thedimensions of the reactor were 18 cm in diameter and40 cm in height. The working volume was 7.5 l. A lowspeed gear motor, model P 630A-387, 100 V, 50/60 Hz,1.7/1.3 A (Japan Servo Co. Ltd., Japan) was used fordriving the paddle-shape impeller. The speed of theimpeller was adjusted to 60 rpm. One set of air pumps,model EK-8000, 6.0 W (President Co. Ltd., Thailand),was used for supplying air for two sets of reactors.
2.8. Operation of SBR system
A volume of 1.4 l of acclimatized sludge (10 g/l) wasinoculated in each reactor, and three types of textilewastewater (STIWW, TIWW and TIWW containing0.89 g/l glucose: TIWW + glucose) were added (finalvolume of 7.5 l) within 1 h. During feeding of the waste-water, the system was fully and continuously aerated for19 h. Aeration was then shut down for 3 h. After thesludge was fully settled, the supernatant had to be re-moved (the removed volume of the supernatant wasbased on the operation program (Table 5 or Table 6))within 0.5 h and the system was kept anoxic for 0.5.Then fresh wastewater was added to the reactor up to7.5 l, and the above operating was repeated. The oper-ation parameters of the SBR system with STIWW,TIWW and TIWW + glucose are given in Table 5.
2.9. Chemical analysis
The BOD5, COD, total kjeldahl nitrogen (TKN), sus-pended solids (SS) and color intensity (dye) of influents
l properties
es Concentration
g/l 2200g/l 1200
g/l 60–
tensity (A675 nm), units 0.217.2
Air diffuser
12cm2.5cm
18cm
Timer
Motor
Air pump
40cm
Fig. 1. The SBR system reactor.
Table 5The operating parameters of the SBR system used to treat STIWW, TIWW and TIWW + glucose
Parameters Types of wastewater
STIWW TIWW TIWW + glucosea
MLSS 1000 1500 2000 3000 4000 2000 2000HRT 3 3 3 3 3 3 3Flow rate 2500 2500 2500 2500 2500 2500 2500Hydraulic loading 0.33 0.33 0.33 0.33 0.33 0.33 0.33F/M ratio 0.40 0.27 0.20 0.13 0.10 0.11 0.20BOD5 loading 3.0 3.0 3.0 3.0 3.0 1.70 3.0Volumetric BOD5 loading 0.40 0.40 0.40 0.40 0.40 0.23 0.40Dye loading (g/d) 0.10 0.10 0.10 0.10 0.10 N/Ab N/Ab
Volumetric dye loading (kg/m3 d) 0.013 0.013 0.013 0.013 0.013 N/Ab N/Ab
a TIWW + glucose contained 0.89 g/l of glucose; the final BOD5 concentration was 1200 mg/l.b Cannot be calculated.
Table 6Maximum dye, COD and BOD5 adsorption yields of resting and autoclaved types A and B bio-sludge
Dye Bio-sludge Adsorbed dye (mg/g sludge)
Type Treatment Dye COD BOD5
Vat Black 25 A Resting 39.9 ± 0.9 363.5 ± 7.6 170.0 ± 8.6Autoclaved 21.7 ± 1.0 74.9 ± 2.5 33.3 ± 6.7
B Resting 41.2 ± 0.8 367.6 ± 5.7 180.0 ± 7.1Autoclaved 28.2 ± 1.2 96.0 ± 1.7 16.7 ± 7.5
Vat Yellow 1 A Resting 49.3 ± 1.7 361.6 ± 7.4 177.5 ± 9.2Autoclaved 22.9 ± 0.5 67.1 ± 8.0 33.3 ± 8.1
B Resting 50.48 ± 1.3 364.4 ± 4.3 178.0 ± 9.0Autoclaved 36.00 ± 1.0 119.1 ± 4.9 29.6 ± 4.4
and effluents and mixed-liquor suspended solids (MLSS)were determined by using Standard Methods (APHA,AWWA, WPCF, 1998). SV30 and sludge volume index
(SVI) were measured in imhoff cone. SV30 was definedas the sludge volume after 30 min of settling. SVI wasdefined as a ratio between the sludge volume after

30 min of settling and the sludge solid concentration.Solid retention time (SRT), or sludge age, was deter-mined by measuring the average residence time of thesuspended microorganisms (suspended bio-sludge) inthe system.
2.10. Statistical analysis method
Each experiment was repeated at least three times. Allthe data were subjected to two-way analysis of variance(ANOVA) using SAS Windows Version 6.12 (SAS Insti-tute, 1996). Statistical significance was tested using theleast significant difference (LSD) at the p < 0.05 leveland the results are shown as the mean ± the standarddeviation.
05
10152025
3035
1 2 3 4Replacement (times)
Ads
orpt
ion
capa
city
(mg/
g bi
o-sl
udge
)
Elute by 0.1MNaOH solution
Fig. 2. Adsorption capacities on successive dye adsorption with thereuse of bio-sludge. Symbols: (j) Resting bio-sludge, (m) autoclavedbio-sludge.
3. Results
3.1. The adsorption capacity of bio-sludge
The results are shown in Table 6. The Vat Yellow 1was more extensively adsorbed by the bio-sludge thanVat Black 25. The adsorption capacity of bio-sludgeon Vat Yellow 1 was about 20% higher than that onVat Black 25 and bio-sludge type A showed higherdye adsorption capacity than bio-sludge type B. Theadsorption capacity of resting bio-sludge on Vat Yellow1 was about 49.3 ± 1.7 mg/g bio-sludge while it was only39.9 ± 0.9 mg/g bio-sludge on Vat Black 25. For theadsorption of organics, neither bio-sludge type A norbio-sludge type B showed any difference. Also bothVat Yellow 1 and Vat Black 25 dyes produced no mea-surable effect on organic adsorption by the sludge. TheBOD5 and COD adsorption capacities of the restingbio-sludge in STIWW were about 175 and 360 mg/gbio-sludge, respectively. However, the adsorption capa-cities of the bio-sludge were decreased by autoclaving.The dye, COD and BOD5 adsorption capacities of auto-claved bio-sludge were about 50%, 80% and 80% lower,respectively than those of the resting bio-sludge asshown in Table 6.
Table 7Elution efficiency of several eluents
Type of vat dye Bio-sludge Percentage of dye eluted
Type Treatment Distilled water 0.1 M phobuffer (pH
Vat Black 25 A Resting 7.0 ± 0.06 1.10 ± 0.0Autoclaved 15.02 ± 0.06 5.62 ± 0.0
B Resting 4.88 ± 0.03 0.90 ± 0.0Autoclaved 8.63 ± 0.03 2.48 ± 0.0
Vat Yellow 1 A Resting 9.13 ± 0.07 2.29 ± 0.0Autoclaved 24.37 ± 0.06 13.69 ± 0.0
B Resting 6.85 ± 0.06 2.18 ± 0.0Autoclaved 12.53 ± 0.04 6.25 ± 0.0
3.2. Elution of adsorbed dye from bio-sludge
The results are shown in Table 7. The adsorbed dyewas largely retained by the bio-sludge. The 0.1 N NaOHsolution showed the highest Vat Black 25 elution yieldof 38.89 ± 0.04%, 21.12 ± 0.06% with autoclaved andresting bio-sludge type A, respectively.
3.3. Sequential replacement reaction
The dye adsorption yields in sequential replacementreactions with resting and autoclaved bio-sludge areshown in Fig. 2. Although the adsorption of the dyes de-creased as the replacement was repeated, they recoveredafter washing of both deteriorated bio-sludges with0.1 N NaOH solution. However, the adsorption abilityof washed bio-sludge was about 70% of the initial.
Autoclaved bio-sludge was used for testing the stabil-ity of dye adsorption yield after being washed with 0.1 NNaOH solution.
3.4. Stability of bio-sludge on dye adsorption ability
Both autoclaved bio-sludge types A and B were re-used for dye adsorption after being washed with 0.1 NNaOH solution. The results showed that the autoclavedbio-sludge could be reused after being washed with
sphate7.0)
0.1 N NaOH 0.1 N HNO3 0.1 M EDTA
1 21.12 ± 0.06 0.00 ± 0.00 0.95 ± 0.033 38.89 ± 0.04 0.46 ± 0.01 4.24 ± 0.011 15.25 ± 0.07 0.12 ± 0.01 0.78 ± 0.031 22.79 ± 0.06 0.78 ± 0.04 1.95 ± 0.04
6 16.31 ± 0.03 0.32 ± 0.01 1.97 ± 0.077 38.06 ± 0.04 1.53 ± 0.01 12.16 ± 0.067 11.83 ± 0.04 0.00 ± 0.00 2.16 ± 0.036 20.34 ± 0.04 0.78 ± 0.03 5.47 ± 0.03

Table 8Dye adsorption efficiency of autoclaved bio-sludge after re-washed with 0.1 N NaOH
Type of vatdye
Bio-sludgetype
Relative dye adsorption by sludge after repeated washed with 0.1 N NaOH
Raw bio-sludge(%)
First reusedbio-sludge (%)
Second reusedbio-sludge (%)
Third reusedbio-sludge (%)
Fourth reusedbio-sludge (%)
Vat Yellow 1 A 100 210.8 224.8 226.9 231.2B 100 200.1 199.1 216.5 220.2
Vat Black 25 A 100 225.2 241.7 256.5 257.9B 100 210.9 211.8 241.0 242.7
0.1 N NaOH solution (Table 8). The dye adsorptionof the bio-sludge did not decrease even after beingrewashed four times with 0.1 N NaOH solution. Theadsorption yield of the first reused bio-sludge was about100% higher than the raw autoclaved bio-sludge.
3.5. SBR system for treatment of both STIWW
and TIWW
The four types of wastewater as STIWW containingVat Black 25, STIWW containing Vat Yellow 1, TIWW
0.005
0.010
0.015
0.020
1 3 5 7 9 11 13
1 3 5 7 9 11 13
Time (d
Eff
luen
t co
lor
inte
nsit
y (A
675)
0
0
50
100
150
200
Time (da
Eff
luen
t C
OD
(m
g/l)
0
10
20
30
40
1 6 11 16 21 26
Time (days)
Eff
luen
t B
OD
5 (m
g/l)
Fig. 3. Effluent profiles of SBR system operated with STIWW containing2000 mg/l (m), 3000 mg/l (h) and 4000 mg/l (d).
and TIWW + glucose were used. The results are shownin Figs. 3 and 4, Tables 9 and 10.
3.5.1. STIWW
The SBR system showed stable dye and organic re-moval efficiencies with both STIWW containing VatBlack 25 and STIWW containing Vat Yellow 1 withMLSS of not more than 2000 mg/l (Figs. 3 and 4).The dye removal efficiencies were increased to up tomore than 98% under an optimal MLSS of 2000 mg/land the COD, BOD5 and TKN removal efficiencies
15 17 19 21 23 25 27
15 17 19 21 23 25 27
ays)
ys)
0
2
4
6
8
10
1 6 11 16 21 26Time (days)
Eff
luen
t T
KN
(m
g/l)
40 mg/l Vat Black 25 under MLSS of 1000 mg/l (�), 1500 mg/l (j),

0
0.002
0.004
0.006
0.008
0.010
1 3 5 7 9 11 13 15 17 19 21 23 25 27
1 3 5 7 9 11 13 15 17 19 21 23 25 27
Time (days)
Time (days)
Eff
luen
t co
lor
inte
nsit
y (A
587)
050
100150
200250300
Eff
luen
t C
OD
(m
g/l)
0
10
20
30
1 6 11 16 21 26Time (days)
Eff
luen
t B
OD
5 (m
g/l)
0
2
4
6
8
1 6 11 16 21 26Time (days)
Eff
luen
t T
KN
(m
g/l)
Fig. 4. Effluent profiles of SBR system operated with STIWW containing 40 mg/l Vat Yellow 1 under an MLSS of 1000 mg/l (�), 1500 mg/l (j),2000 mg/l (m), 3000 mg/l (h) and 4000 mg/l (d).
Table 9The bio-sludge qualities of SBR system operated with STIWW, TIWW and TIWW + glucoses
Types of wastewater Dye MLSS (mg/l) SV30 (ml/l) SVI (ml/g) Excess sludge (mg/d) SRT (d)
STIWW Vat Yellow 1 1000 45 ± 5 37 ± 2 1695 ± 150 5 ± 0.41500 60 ± 4 35 ± 2 1680 ± 160 7 ± 0.72000 80 ± 6 37 ± 2 1328 ± 120 12 ± 1.03000 110 ± 10 35 ± 1 1155 ± 100 20 ± 1.74000 150 ± 12 37 ± 2 938 ± 70 33 ± 2.5
Vat Black 25 1000 40 ± 4 34 ± 2 1800 ± 200 4 ± 0.41500 50 ± 5 29 ± 1 1605 ± 150 7 ± 0.72000 90 ± 7 42 ± 2 1365 ± 100 11 ± 0.83000 110 ± 11 35 ± 2 915 ± 60 25 ± 1.74000 150 ± 12 37 ± 2 810 ± 40 38 ± 1.8
TIWW Mixed dyes 2000 40 ± 4 40 ± 2 – –TIWW + glucosea Mixed dyes 2000 90 ± 6 42 ± 2 975 ± 100 16 ± 1.6
a TIWW + glucose contained 0.89 g/l of glucose, the final BOD5 of the wastewater was approximately 1200 mg/l.
were about 96%, 98% and 89%, respectively (Table 9).Also, the effluent SS increased with the increase ofMLSS of the system. The effluent SS of the systemwith both types of STIWW went higher than 80 mg/lunder a MLSS > 2000 mg/l. However, the effluent SSof the system under MLSS of 2000 mg/l was lower than
15 mg/l. The SBR system also showed the best quality(settleability) of bio-sludge (SVI of 37 ± 2 ml/l) withMLSS controlled at 2000 mg/l. The bio-sludge age(SRT: solid retention time) of the system underMLSS operation of 2000 mg/l was about 12 ± 1 days(Table 9).

Tab
le10
Effl
uen
tq
ual
itie
san
dre
mo
val
effici
enci
eso
fS
BR
syst
emw
ith
ST
IWW
,T
IWW
and
TIW
W+
glu
cose
s
Typ
eso
fw
aste
wat
erT
ypes
of
vat
dye
ML
SS
of
the
syst
em(m
g/l)
Ch
emic
alp
rop
erti
es
Co
lor
BO
D5
CO
DT
KN
SS
(mg/
l)
Effl
uen
t(u
nit
/ml)
a%
rem
ova
lE
fflu
ent
(mg/
l)%
rem
ova
lE
fflu
ent
(mg/
l)%
rem
ova
lE
fflu
ent
(mg/
l)%
rem
ova
l
ST
IWW
Vat
Yel
low
110
001.
07±
0.36
97.3
±0.
9318
.3±
0.2
98.5
±0.
189
±18
95.5
±0.
94.
8±
0.3
92.1
±0.
426
±1
1500
0.83
±0.
4097
.9±
1.03
17.7
±0.
498
.5±
0.1
80±
1295
.9±
0.6
4.6
±0.
492
.4±
1.2
24±
220
000.
60±
0.40
98.5
±1.
0017
.0±
0.7
98.6
±0.
161
±13
96.9
±0.
74.
0±
0.4
93.4
±1.
320
±2
3000
1.22
±0.
4597
.0±
1.10
20.9
±0.
498
.3±
0.1
114
±25
94.2
±1.
35.
5±
0.5
91.0
±0.
978
±6
4000
1.34
±0.
5396
.7±
1.29
25.3
±0.
897
.9±
0.1
135
±32
93.1
±1.
75.
8±
0.6
90.4
±1.
084
±5
Vat
Bla
ck25
1000
0.95
±0.
3897
.7±
1.11
17.1
±0.
698
.6±
0.1
81±
1696
.1±
0.7
7.2
±0.
588
.5±
0.7
20±
115
000.
74±
0.38
98.2
±0.
7315
.9±
1.0
98.7
±0.
174
±13
96.4
±0.
76.
9±
0.4
89.0
±0.
820
±2
2000
0.56
±0.
3098
.7±
0.72
14.5
±1.
098
.8±
0.2
64±
1296
.8±
0.6
6.4
±0.
689
.9±
1.0
19±
130
001.
34±
0.36
96.7
±0.
8717
.2±
0.5
98.6
±0.
192
±19
95.4
±1.
07.
4±
0.5
88.2
±0.
985
±4
4000
1.43
±0.
5596
.5±
1.28
19.2
±1.
098
.4±
0.1
107
±23
94.7
±1.
38.
5±
0.5
86.4
±0.
990
±6
TIW
WM
ixed
colo
ran
ts20
000.
698
±0.
0219
.1±
2.6
400
±12
11.1
±0.
116
19±
7212
.5±
7.2
19.0
±2.
111
.96
±0.
229
±2
TIW
W+
glu
cose
bM
ixed
colo
ran
ts20
000.
215
±0.
0175
.1±
1.2
40±
0.0
96.7
±0.
077
5±
9070
.6±
3.4
8.0
±0.
263
.2±
1.1
125
±7
aT
he
dye
con
cen
trat
ion
of
efflu
ent
was
rep
rese
nte
das
the
op
tica
ld
ensi
ty,
un
its/
ml.
Th
ew
avel
engt
hfo
rV
atY
ello
w1,
Vat
Bla
ckan
dT
IWW
wer
e67
5,58
7an
d40
4n
m.
bT
IWW
+gl
uco
seco
nta
ined
0.89
g/l
of
glu
cose
,th
efi
nal
BO
D5
of
the
was
tew
ater
was
app
roxi
mat
ely
1200
mg/
l.
3.5.2. TIWW
The effluent quality of the system with TIWW waspoor and fluctuated during operation, as shown in Fig.5. The organic and dye removal efficiencies were about11.1 ± 0.1% and 19.1 ± 0.1%, respectively (Table 9).However, effluent bio-treatment by the SBR system im-proved and became more stable when 0.89 mg/l glucosewas added to TIWW (TIWW + glucose). The dye,COD, BOD5 and TKN removal efficiencies of the sys-tem with TIWW + glucose under MLSS of 2000 mg/lwere 75.1 ± 1.2%, 70.6 ± 3.4%, 96.7 ± 0.0% and63.2 ± 1.1%, respectively.
4. Discussions and conclusions
Sludge from biological wastewater treatment plantscould be used as the adsorbent of both organic matterand dyes in textile wastewater. Bio-sludge from the tex-tile wastewater treatment plants showed a higher degreeof dye adsorption than the other types of bio-sludgetested. This may be explained by the dye adsorption abil-ity being induced by growth in presence of textile dye(Ohmomo et al., 1988; Sirianuntapiboon et al., 1991,1998). The dye adsorption capacity was dependent onthe type of the dye influenced by the structure of thedye (Sirianuntapiboon et al., 1998; Sirianuntapiboonand Chaiyasing, 2000). However, the organic and dyeadsorption abilities of bio-sludge were reduced by auto-claving (Sirianuntapiboon et al., 1991; Ohmomo et al.,1988) and the dilute acid and EDTA solutions elutedthe dye poorly. This shows the advantage of using ofbio-sludge as a dye adsorbent. Also, the dye adsorptionability of bio-sludge was quite stable, even if washed indilute alkaline solution. This phenomenon could be sim-ilar to that reported for the elution of melanoidin (darkbrown color of molasses) from the mycelia of Aspergillus
oryzae No. Y-2-32 (Ohmomo et al., 1988). On the repeat-ability of dye adsorption by the same sludge, the dyeadsorption gradually decreased with repeated replace-ment, and the deteriorated bio-sludge recovered itsadsorption ability on washing with a dilute alkaline solu-tion. This phenomenon showed that the adsorption sitesfor dye were filled, and that adsorbed dye was releasedupon the alkaline washing. This was also reported in mel-anoidin adsorption by fungi (Ohmomo et al., 1988). Andalso the dye adsorption capacity of the raw bio-sludgewas increased about 100% after washing with 0.1 NNaOH solution, because of the release of other impuri-ties from the adsorption site (Ohmomo et al., 1988).
On the treatment of STIWW with the SBR system,both organic matter and vat dyes could be rapidly re-moved with high efficiency. The system showed the sameremoval efficiency on both Vat Yellow 1 and Vat Black25, due to both the adsorption and degrading activitiesof living bio-sludge in the SBR system (Ohmomo et al.,

00.10.20.30.40.50.60.70.8
Time (days)
Eff
luen
t C
olor
inte
nsit
y (A
404)
0
500
1000
1500
2000
Time (days)
Eff
luen
t C
OD
(m
g/l)
0
100
200
300
400
1 6 11 16 21 26
Eff
luen
tB
OD
5 (m
g/l)
0
5
10
15
20
1 6 11 16 21 26
Time (days)Time (days)
Eff
luen
t T
KN
(m
g/l)
1 3 5 7 9 11 13 15 17 19 21 23 25 27
1 3 5 7 9 11 13 15 17 19 21 23 25 27
Fig. 5. Effluent profiles of SBR system operated with TIWW (m) and TIWW + glucose (j) under an MLSS of 2000 mg/l.
1988; Pala and Tokat, 2002; Wong and Yuen, 1996; Slo-kar and Marechal, 1998; Walker and Weatherley, 2000).The same two types of activity were recently reported fordecolorization of azo dyes by yeast and decolorization ofmelanoidin by fungi (Ohmomo et al., 1988; Sirianuntapi-boon et al., 1991). The removal efficiency of the SBR sys-tem was increased with the increase of MLSS up to2000 mg/l. The good quality of bio-sludge was indicatedby an SVI of less than 40 mg/g (Metcalf & Eddy Inc.,1991; Sirianuntapiboon and Chaiyasing, 2000; Pala andTokat, 2002). However, the efficiency of the system withreal TIWW was quite low due to low concentration ofBOD5 (450 mg/l) and the BOD5 of the real TIWW mightbe poorly biodegradable compounds (Sirianuntapiboonet al., 1991). To increase the efficiency of the system, glu-cose (simple and easily biodegradable compounds) wasadded into the TIWW which also resulted in an increasein BOD5 removal efficiency and growth of bio-sludge(Metcalf & Eddy Inc., 1991). The dye and BOD5 removalefficiencies of the system went up to 75.1 ± 1.2% and96.7 ± 0.0%, respectively.
From the above result, it could be suggested thatboth bio-sorption and biological degradation processescould be applied for the removal of dye from textile
industrial wastewater. Both resting and dead bio-sludgewere used as adsorbents in the bio-sorption process andthe bio-sludge could be reused several times after wash-ing in dilute alkaline solution. For the biological degra-dation process, the SBR system was more suitable dueto high organic and dye removal efficiencies.
Acknowledgements
We wish to express our thanks to the Department ofEnvironmental Technology, School of Energy andMaterials, King Mongkut�s University of TechnologyThonburi for providing the research materials and fund-ing. We deeply thank Dr. Sadahiro Ohmomo of theJapan International Research Center for AgriculturalSciences (JIRCAS), Ministry of Agriculture, Forestryand Fisheries, Tsukuba, Japan for his advice.
References
Aksu, Z., 2001. Biosorption of reactive dyes by dried activatedsludge: Equilibrium and kinetic modeling. Biochem. Eng. J. 7, 79–84.

APHA, AWWA, WPCF, 1998. Standard Methods for the Examina-tion of Water and Wastewater, 20th ed. American Public HealthAssociation, Washington, DC.
Assadi, M.M., Jahangiri, M.R., 2001. Textile wastewater treatment byAspergillus niger. Desalination 14, 1–6.
Balan Doralice, S.L., Monteiro, T.R., 2001. Decolorization of textileindigo dye by Ligninolytic fungi. J. Biotech. 89, 141–145.
Banat, I.M., Nigam, P., Singh, D., Marchant, R., 1996. Microbialdecolorization of textile-dye-containing effluent: A review. Bio-resour. Tech. 58, 217–227.
Clarke, E.A., Steinle, D., 1995. Health and environmental safetyaspects of organic colorants. Rev. Prog. Coloration 25, 1–10.
Department of Industrial Works, 1992. Standards of industrialeffluents quality due to Ministry of Industry�s regulations. Depart-ment of Industrial Works, Ministry of Industry, Bangkok, Thai-land, pp. 1–55.
Fu, Y., Viraraghavan, T., 2001. Fungal decolorization of dyewastewater: A review. Bioresour. Tech. 79, 251–262.
Graca, M.B., Costa, F.M., Pessoa, A.M.T., 2001. Decolorization of ananthraquinone-type dye using a laccase formulation. Bioresour.Tech. 79, 171–177.
Gupta, G.S., Prasad, G., Singh, V.N., 1992. China clay as anadsorbent for dye house wastewater. Environ. Tech. 13, 925–936.
Horning, R.H., 1978. Textile Dyeing Wastewaters: Characterizationand Treatment. American Dye Manufacturers Institute, NewYork, pp. 1992–2000.
Hu, T.L., 1996. Removal of reactive dyes from aqueous solution bydifferent bacterial genera. Water Sci. Technol. 34 (10), 89–95.
Kapdan, L.K., Kargi, F., McMullan, G., Marchant, R., 2000. Effect ofenvironmental conditions on biological decolorization of textiledyestuff by C. versicolor. Enzyme Microb. Tech. 26, 381–387.
Kim, T.H., Park, C., Lee, J., Eung-Bai, S., Kim, S., 2002. Pilot scaletreatment of textile wastewater by combined process (fluidized bio-film process-chemical coagulation-electrochemical oxidation).Water Res. 36, 3979–3988.
Metcalf & Eddy Inc., 1991. Wastewater Engineering TreatmentDisposal and Reuse, 3rd ed. McGraw-Hill. Singapore, pp. 197–567.
Mitta, A.K.l., Gupta, S.K., 1996. Biosorption of cationic dyes by deadmacro fungus Fomitopsis carnea: Batch studies. Water Sci. Tech-nol. 34 (10), 81–87.
Nigam, P., Banat, I.M., Singh, D., Marchant, R., 1995. Microbialprocess for the decolorization of textile effluent containing azo,diazo and reactive dyes. Proc. Biochem. 31 (5), 435–442.
Ohmomo, S., Kainuma, M., Kamimura, K., Sirianuntapiboon, S.,Aoshima, I., Atthasumpunna, P., 1988. Adsorption of melanoidinto the mycelium of Aspergillus oryzae. Agri. Biol. Chem. 52 (2),381–386.
Pala, A., Tokat, E., 2002. Color removal from textile industrywastewater in an activated sludge system with various additives.Water Res. 36, 2920–2925.
Ramakrishna, K.R., Viraraghvan, T., 1997. Dye removal using lowcost adsorbents. Water Sci. Technol. 36 (2–3), 189–198.
Rubin, A.J., 1978. Chemistry of Wastewater Technology. Ann ArborScience Publishers, Ann Arbor, MI, pp. 245–281.
SAS Institute, 1996. The SAS system for Windows, version 6.12.SASInst. Cary NC.
Sirianuntapiboon, S., Chaiyasing, P., 2000. Removal of organicmatters and heavy metals from wastewater by granular activatedcarbon-sequencing batch reactor system. Asian J. Energy Environ.1 (2), 125–142.
Sirianuntapiboon, S., Sihanonth, P., Somchai, P., Atthasumpunna, P.,Hayashida, S., 1991. Mechanism for melanoidin decolorizationby Rhizoctonia sp. D-90. Biosci. Biotech. Biochem. 59, 1185–1189.
Sirianuntapiboon, S., Chairattanawan, K., Ohmomo, S., 1998.Removal of color substance from molasses wastewater by biolog-ical treatment systems combined with chemical treatment. Jpn.Agric. Res. Quart. J. 32, 211–216.
Slokar, Y.M., Marechal, M.A., 1998. Methods of decolorization oftextile wastewater. Dyes and Pigments 37 (4), 335–356.
Walker, G.M., Weatherley, L.R., 2000. Biodegradation and bio-sorption of acid anthraquinone dye. Environ. Pollut. 108, 219–223.
Wong, P.K., Yuen, P.Y., 1996. Decolorization and biodegradation ofmethyl red by Klebsiella pneumoniae RS-13. Water Res. 30 (7),1736–1744.
Zaoyan, Y., Ke, S., Guangliang, S., Fan, Y., Jinshan, D., Huanian,M., 1992. Anaerobic–aerobic treatment of a dye wastewater bycombination of RBC with activated sludge. Water Sci. Technol. 26(9–11), 2093–2096.