Some First Results from the UAVSAR Instrument
7
Some First Results from the UAVSAR Instrument Cathleen Jones * , Scott Hensley * , Kevin Wheeler * , Greg Sadowy * , Scott Shaffer * , Howard Zebker † , Tim Miller * , Brandon Heavey * , Ernie Chuang * , Roger Chao * , Ken Vines * , Kouji Nishimoto * , Jack Prater * , Bruce Carrico * , Neil Chamberlain * , Joanne Shimada * , Marc Simard * , Bruce Chapman * , Ron Muellerschoen * , Charles Le * , Thierry Michel * , Gary Hamilton * , David Robison * , Greg Neumann * , Robert Meyer * , Phil Smith * , Jim Granger * , Paul Rosen * , Dennis Flower * and Robert Smith ‡ * Jet Propulsion Laboratory, California Institute of Technology, 4800 Oak Grove Drive, Pasadena, CA 91109 Email: [email protected] † Stanford University, Palo Alto, CA 94305 ‡ Goddard Space Flight Center, Greenbelt, MD 20771 ABSTRACT The UAVSAR instrument, which employs an L-band actively electronically scanned antenna, has begun collecting engineer- ing and science data after nearly three years of development. The radar system design was motivated by solid Earth appli- cations where repeat pass radar interferometry can be used to measure subtle deformation of the surface. However flexibility and extensibility to support other applications and different platforms were also major design drivers. By designing the radar to be housed in an external unpressurized pod, it has the potential to be readily ported to many platforms. Initial testing is being carried out with the NASA Gulfstream III aircraft, which has been modified to accommodate the radar pod and has been equipped with precision autopilot capability developed by NASA Dryden Flight Research Center, which allows control of the platform flight path to within a 10 m diameter tube on any specified trajectory necessary for repeat- pass radar interferometric applications. To maintain the re- quired pointing for repeat-pass interferometric applications we have employed an actively scanned antenna steered using INU measurement data. This paper presents a brief overview of the radar instrument and some of the first imagery obtained from the system. I. INTRODUCTION Earth science research often requires crustal deformation measurements at a variety of time scales, from seconds to decades. To meet these needs, the NASA Solid Earth Science Working Group has recommended an observational program that includes both airborne and spaceborne capabilities. Since many geophysical processes, such as volcanic eruptions and earthquake events, occur quickly and require near-immediate response by scientists and disaster managers alike, the goal is to provide Earth deformation measurements on an hourly basis with global access. While this objective is best supported by a spaceborne high-orbit (e.g. geosynchronous) constellation of repeat-pass interferometric SAR satellites, the recommended first step in this observational program is a low-earth-orbit deformation satellite with a repeat period of roughly one week. The sub-orbital radar program enters the Earth Science Enterprise plan as a key supplemental capability delivering the short time baseline observations, and providing repeat-pass measurements at time scales much smaller than one week, potentially as short as twenty minutes. Although satellites have been used for repeat-track interfer- ometric (RTI) SAR mapping for close to 20 years, repeat- track interferometry is much more difficult to implement from an airborne platform, [3]. Aircraft motion compensation methods have until recently not been sufficiently accurate to recover cm-scale deformations, and existing radar systems were designed without the necessary controls on flight position and antenna pointing to support repeat-pass InSAR. In fact, several organizations have acquired experimental airborne RTI data, but these lack the capability to routinely acquire signif- icant amounts of scientifically useful RTI data. The primary technical reasons for this state of affairs remain: 1) it is difficult to fly the same or nearly the same pass twice in the troposphere due to wind gusts, turbulence, etc.; and 2) it is difficult to maintain the same antenna pointing on repeated passes due to varying cross-winds that lead to varying yaw angles. The UAVSAR system is specifically designed to overcome these limitations and produce high-quality RTI maps routinely. The UAVSAR project will also serve as a technology test bed. As a modular instrument with numerous plug-and-play components, it will be possible to test new technologies for airborne and spaceborne applications with relatively little difficulty. Joint experiments with other radar instruments, for example, radars flying in formation with an active link between platforms, can also be accommodated without redesign of the system. The modular design also supports antennas at other radar frequencies. In fact, a Ka-band single-pass radar interferometer for making high precision topographic maps of ice sheets is being developed based to a large extent on components of the UAVSAR L-band radar. II. INSTRUMENT DESIGN Making robust repeat-pass radar interferometric measure- ments (RPI) at L-band to measure both natural and anthro- pogenically induced deformation of the Earth’s surface from
-
Upload
independent -
Category
Documents
-
view
2 -
download
0
Transcript of Some First Results from the UAVSAR Instrument
Some First Resultsfrom the UAVSAR Instrument
Cathleen Jones∗, Scott Hensley∗, Kevin Wheeler∗, Greg Sadowy∗, Scott Shaffer∗, Howard Zebker†, Tim Miller∗,Brandon Heavey∗, Ernie Chuang∗, Roger Chao∗, Ken Vines∗, Kouji Nishimoto∗, Jack Prater∗,
Bruce Carrico∗, Neil Chamberlain∗, Joanne Shimada∗, Marc Simard∗, Bruce Chapman∗, Ron Muellerschoen∗,Charles Le∗, Thierry Michel∗, Gary Hamilton∗, David Robison∗, Greg Neumann∗, Robert Meyer∗, Phil Smith∗,
Jim Granger∗, Paul Rosen∗, Dennis Flower∗ and Robert Smith‡∗ Jet Propulsion Laboratory, California Institute of Technology, 4800 Oak Grove Drive, Pasadena, CA 91109
Email: [email protected]†Stanford University, Palo Alto, CA 94305
‡Goddard Space Flight Center, Greenbelt, MD 20771
ABSTRACT
The UAVSAR instrument, which employs an L-band activelyelectronically scanned antenna, has begun collecting engineer-ing and science data after nearly three years of development.The radar system design was motivated by solid Earth appli-cations where repeat pass radar interferometry can be used tomeasure subtle deformation of the surface. However flexibilityand extensibility to support other applications and differentplatforms were also major design drivers. By designing theradar to be housed in an external unpressurized pod, it hasthe potential to be readily ported to many platforms. Initialtesting is being carried out with the NASA Gulfstream IIIaircraft, which has been modified to accommodate the radarpod and has been equipped with precision autopilot capabilitydeveloped by NASA Dryden Flight Research Center, whichallows control of the platform flight path to within a 10 mdiameter tube on any specified trajectory necessary for repeat-pass radar interferometric applications. To maintain the re-quired pointing for repeat-pass interferometric applications wehave employed an actively scanned antenna steered using INUmeasurement data. This paper presents a brief overview of theradar instrument and some of the first imagery obtained fromthe system.
I. INTRODUCTION
Earth science research often requires crustal deformationmeasurements at a variety of time scales, from seconds todecades. To meet these needs, the NASA Solid Earth ScienceWorking Group has recommended an observational programthat includes both airborne and spaceborne capabilities. Sincemany geophysical processes, such as volcanic eruptions andearthquake events, occur quickly and require near-immediateresponse by scientists and disaster managers alike, the goal isto provide Earth deformation measurements on an hourly basiswith global access. While this objective is best supported bya spaceborne high-orbit (e.g. geosynchronous) constellation ofrepeat-pass interferometric SAR satellites, the recommendedfirst step in this observational program is a low-earth-orbitdeformation satellite with a repeat period of roughly one
week. The sub-orbital radar program enters the Earth ScienceEnterprise plan as a key supplemental capability delivering theshort time baseline observations, and providing repeat-passmeasurements at time scales much smaller than one week,potentially as short as twenty minutes.
Although satellites have been used for repeat-track interfer-ometric (RTI) SAR mapping for close to 20 years, repeat-track interferometry is much more difficult to implementfrom an airborne platform, [3]. Aircraft motion compensationmethods have until recently not been sufficiently accurate torecover cm-scale deformations, and existing radar systemswere designed without the necessary controls on flight positionand antenna pointing to support repeat-pass InSAR. In fact,several organizations have acquired experimental airborne RTIdata, but these lack the capability to routinely acquire signif-icant amounts of scientifically useful RTI data. The primarytechnical reasons for this state of affairs remain: 1) it is difficultto fly the same or nearly the same pass twice in the tropospheredue to wind gusts, turbulence, etc.; and 2) it is difficult tomaintain the same antenna pointing on repeated passes dueto varying cross-winds that lead to varying yaw angles. TheUAVSAR system is specifically designed to overcome theselimitations and produce high-quality RTI maps routinely.
The UAVSAR project will also serve as a technology testbed. As a modular instrument with numerous plug-and-playcomponents, it will be possible to test new technologiesfor airborne and spaceborne applications with relatively littledifficulty. Joint experiments with other radar instruments, forexample, radars flying in formation with an active link betweenplatforms, can also be accommodated without redesign ofthe system. The modular design also supports antennas atother radar frequencies. In fact, a Ka-band single-pass radarinterferometer for making high precision topographic mapsof ice sheets is being developed based to a large extent oncomponents of the UAVSAR L-band radar.
II. INSTRUMENT DESIGN
Making robust repeat-pass radar interferometric measure-ments (RPI) at L-band to measure both natural and anthro-pogenically induced deformation of the Earth’s surface from

Fig. 1. Modified NASA Gulfstream III in early flight tests with the UAVSARpod attached to the underside of the aircraft. Photo courtesy of NASA DrydenFlight Research Center.
an airborne platform presents difficulties not found in space-borne observations due to the above mentioned navigation andpointing constraints. The UAVSAR radar is designed fromthe beginning as a miniaturized polarimetric L-band radarfor repeat-pass and single-pass interferometry with optionsfor along-track interferometry and additional frequencies ofoperation. Based on the science objectives and the platformcharacteristics, the key parameters of the radar design are givenin Table I.
The radar will be initially deployed on the NASA Gulf-stream III aircraft with the potential to be ported to otheraircraft such as the Predator or Global Hawk UAVs. Figure1 shows the instrument pod attached to the underside of theNASA Gulfstream III during early flight testing of the aircraftmodifications. Key measurements the system has been de-signed to make in support of various NASA science programsinclude:◦ Precision crustal deformation for monitoring earthquakes
both during and after a seismic event, for monitoringvolcanic activity and for monitoring human-induced sur-face change such as subsidence induced by oil or waterwithdrawal, or other displacements of the surface fromhuman activities.
◦ Polarimetric interferometry, which can provide measure-ments of forest structure and sub-canopy topography.
◦ Polarimetric tomography, mapping in detail the verticalstructure of a vegetated area.
Robust repeat-pass radar interferometric measurement needsimpose two observational constraints on the UAVSAR radarand system. First, it is necessary that on repeat observationsthe aircraft fly within a specified distance of its previous flighttrajectory. UAVSAR has a science-derived requirement forflight track repeatability of 10 m, hence NASA Dryden hasmodified the NASA Gulfstream III to include a Precision Au-topilot capability [2] to control aircraft position. The precisionautopilot uses input from the real-time DGPS (discussed inSection II-B) to generate signals that are used to drive theaircraft’s ILS landing system. Early flight tests indicate thatthis requirement will be met. Secondly, it is also essential thatthe antenna look directions are identical within a fraction of
TABLE IRADAR PARAMETERS
Parameter ValueFrequency 1.26 GHz (.2379 m)Bandwidth 80 MHzPulse Duration 5-50 µsPolarization Quad PolarizationRange Swath 16 kmLook Angle Range 25◦ − 65◦
Transmit Power 3.1 kWAntenna Size 0.5m × 1.6 mOperating Altitude Range 2000-18000 mGround Speed Range 100-250 m/s
the beamwidth. Because the wind can be substantially differentat different times, even if the platform is capable of accuratelyrepeating the desired track, the yaw angle of the aircraft canvary widely on different tracks due to different wind conditionsaloft. UAVSAR thus employs an electronically steered flushmounted antenna that is pointed in the desired direction basedon real-time attitude angle measurements.
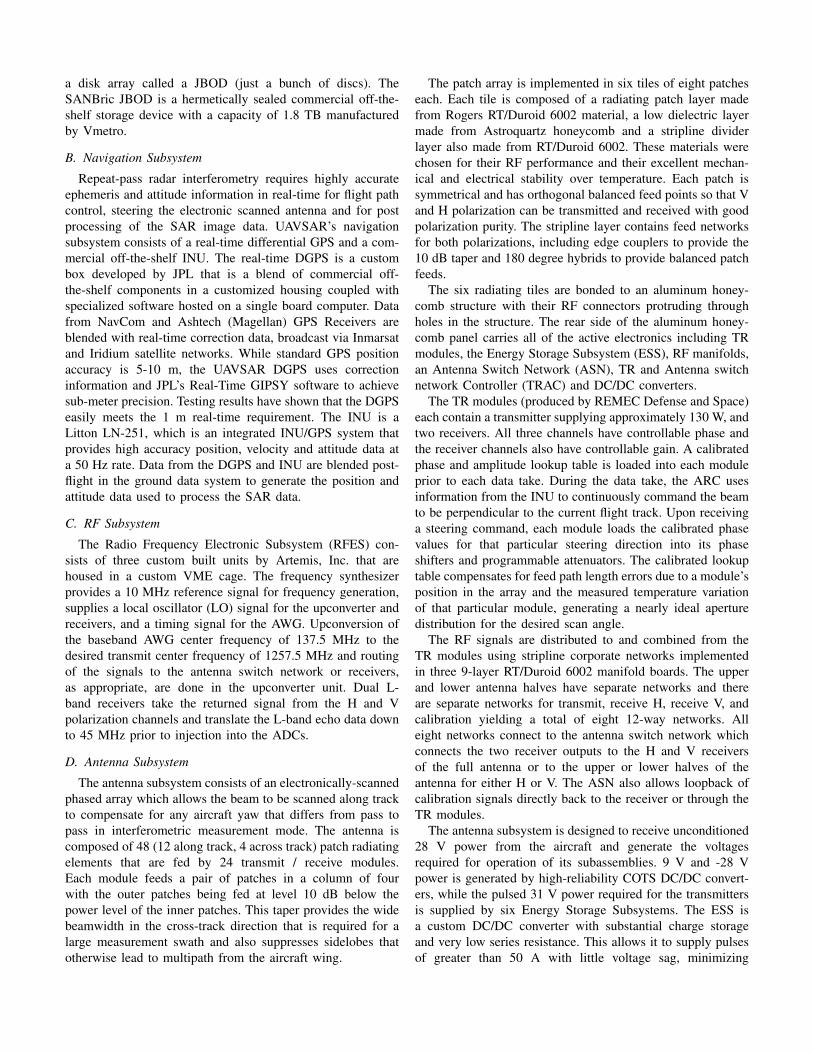
Figure 2 shows a block diagram of the UAVSAR radar. Aftera brief overview of the block diagram each of the subsystemsis discussed in further detail. The radar has been designedto minimize the number of interfaces with the aircraft forimproved portability. The aircraft provides 28 V DC power tothe radar via the Power Distribution Unit (PDU), which is alsoresponsible for maintaining the thermal environment in thepod, and the radar provides its real-time DGPS position datato the aircraft for use by the Precision Autopilot. Waypointsfor the desired flight paths are generated prior to flight by theFlight Planning Subsystem (FPS) and loaded into the PrecisionAutopilot and into the radar’s Automatic Radar Controller(ARC) along with radar command information for each way-point. The ARC is the main control computer for the radarand controls all major functions of the radar during flight. Itis designed to operate in a fully autonomous mode or to acceptcommands from the Radar Operator Workstation (ROW) eitherthrough an ethernet connection on crewed platforms or throughan Iridium modem for uncrewed platforms. The Control andTiming Unit (CTU) controls the timing of all the transmitand receive events in the radar timeline and thus interactswith many of the radar digital and radio frequency (RF)electronics. The active array antenna consists of 24 130 WL-band Transmit/Receive (TR) modules that feed 48 radiatingelements within the 0.5 m by 1.5 m array. Figure 3 illustrateshow the various electronic subsystems are arranged within thepod.
A. Digital Electronics Subsystem
The Digital Electronics Subsystem (DES) provides theoverall timing and control signals for the radar as well as thetelemetry and data acquisition functions. All the digital unitsare housed in a custom built VME card cage. Coordinationand control of all the radar subsystems is through the mastercomputer for the DES, the ARC. The ARC flight softwarecontrols the UAVSAR system for both attended and unattended
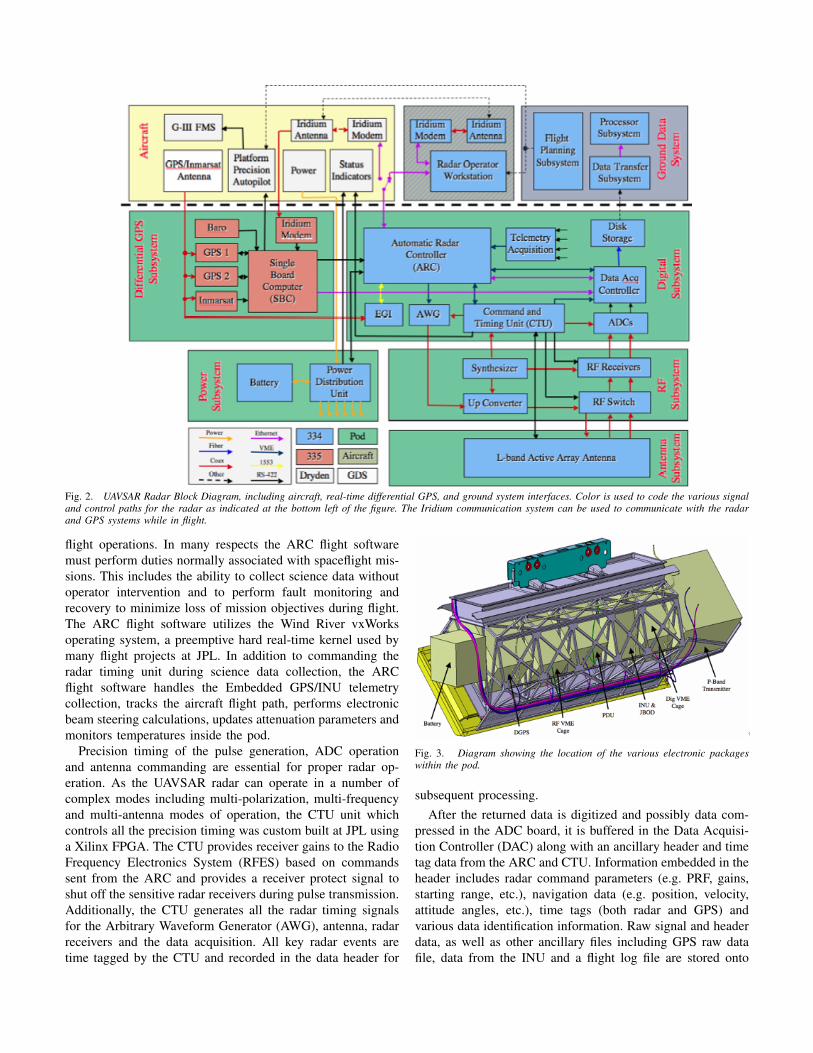
Fig. 2. UAVSAR Radar Block Diagram, including aircraft, real-time differential GPS, and ground system interfaces. Color is used to code the various signaland control paths for the radar as indicated at the bottom left of the figure. The Iridium communication system can be used to communicate with the radarand GPS systems while in flight.
flight operations. In many respects the ARC flight softwaremust perform duties normally associated with spaceflight mis-sions. This includes the ability to collect science data withoutoperator intervention and to perform fault monitoring andrecovery to minimize loss of mission objectives during flight.The ARC flight software utilizes the Wind River vxWorksoperating system, a preemptive hard real-time kernel used bymany flight projects at JPL. In addition to commanding theradar timing unit during science data collection, the ARCflight software handles the Embedded GPS/INU telemetrycollection, tracks the aircraft flight path, performs electronicbeam steering calculations, updates attenuation parameters andmonitors temperatures inside the pod.
Precision timing of the pulse generation, ADC operationand antenna commanding are essential for proper radar op-eration. As the UAVSAR radar can operate in a number ofcomplex modes including multi-polarization, multi-frequencyand multi-antenna modes of operation, the CTU unit whichcontrols all the precision timing was custom built at JPL usinga Xilinx FPGA. The CTU provides receiver gains to the RadioFrequency Electronics System (RFES) based on commandssent from the ARC and provides a receiver protect signal toshut off the sensitive radar receivers during pulse transmission.Additionally, the CTU generates all the radar timing signalsfor the Arbitrary Waveform Generator (AWG), antenna, radarreceivers and the data acquisition. All key radar events aretime tagged by the CTU and recorded in the data header for
Fig. 3. Diagram showing the location of the various electronic packageswithin the pod.
subsequent processing.After the returned data is digitized and possibly data com-
pressed in the ADC board, it is buffered in the Data Acquisi-tion Controller (DAC) along with an ancillary header and timetag data from the ARC and CTU. Information embedded in theheader includes radar command parameters (e.g. PRF, gains,starting range, etc.), navigation data (e.g. position, velocity,attitude angles, etc.), time tags (both radar and GPS) andvarious data identification information. Raw signal and headerdata, as well as other ancillary files including GPS raw datafile, data from the INU and a flight log file are stored onto
a disk array called a JBOD (just a bunch of discs). TheSANBric JBOD is a hermetically sealed commercial off-the-shelf storage device with a capacity of 1.8 TB manufacturedby Vmetro.
B. Navigation Subsystem
Repeat-pass radar interferometry requires highly accurateephemeris and attitude information in real-time for flight pathcontrol, steering the electronic scanned antenna and for postprocessing of the SAR image data. UAVSAR’s navigationsubsystem consists of a real-time differential GPS and a com-mercial off-the-shelf INU. The real-time DGPS is a custombox developed by JPL that is a blend of commercial off-the-shelf components in a customized housing coupled withspecialized software hosted on a single board computer. Datafrom NavCom and Ashtech (Magellan) GPS Receivers areblended with real-time correction data, broadcast via Inmarsatand Iridium satellite networks. While standard GPS positionaccuracy is 5-10 m, the UAVSAR DGPS uses correctioninformation and JPL’s Real-Time GIPSY software to achievesub-meter precision. Testing results have shown that the DGPSeasily meets the 1 m real-time requirement. The INU is aLitton LN-251, which is an integrated INU/GPS system thatprovides high accuracy position, velocity and attitude data ata 50 Hz rate. Data from the DGPS and INU are blended post-flight in the ground data system to generate the position andattitude data used to process the SAR data.
C. RF Subsystem
The Radio Frequency Electronic Subsystem (RFES) con-sists of three custom built units by Artemis, Inc. that arehoused in a custom VME cage. The frequency synthesizerprovides a 10 MHz reference signal for frequency generation,supplies a local oscillator (LO) signal for the upconverter andreceivers, and a timing signal for the AWG. Upconversion ofthe baseband AWG center frequency of 137.5 MHz to thedesired transmit center frequency of 1257.5 MHz and routingof the signals to the antenna switch network or receivers,as appropriate, are done in the upconverter unit. Dual L-band receivers take the returned signal from the H and Vpolarization channels and translate the L-band echo data downto 45 MHz prior to injection into the ADCs.
D. Antenna Subsystem
The antenna subsystem consists of an electronically-scannedphased array which allows the beam to be scanned along trackto compensate for any aircraft yaw that differs from pass topass in interferometric measurement mode. The antenna iscomposed of 48 (12 along track, 4 across track) patch radiatingelements that are fed by 24 transmit / receive modules.Each module feeds a pair of patches in a column of fourwith the outer patches being fed at level 10 dB below thepower level of the inner patches. This taper provides the widebeamwidth in the cross-track direction that is required for alarge measurement swath and also suppresses sidelobes thatotherwise lead to multipath from the aircraft wing.
The patch array is implemented in six tiles of eight patcheseach. Each tile is composed of a radiating patch layer madefrom Rogers RT/Duroid 6002 material, a low dielectric layermade from Astroquartz honeycomb and a stripline dividerlayer also made from RT/Duroid 6002. These materials werechosen for their RF performance and their excellent mechan-ical and electrical stability over temperature. Each patch issymmetrical and has orthogonal balanced feed points so that Vand H polarization can be transmitted and received with goodpolarization purity. The stripline layer contains feed networksfor both polarizations, including edge couplers to provide the10 dB taper and 180 degree hybrids to provide balanced patchfeeds.
The six radiating tiles are bonded to an aluminum honey-comb structure with their RF connectors protruding throughholes in the structure. The rear side of the aluminum honey-comb panel carries all of the active electronics including TRmodules, the Energy Storage Subsystem (ESS), RF manifolds,an Antenna Switch Network (ASN), TR and Antenna switchnetwork Controller (TRAC) and DC/DC converters.
The TR modules (produced by REMEC Defense and Space)each contain a transmitter supplying approximately 130 W, andtwo receivers. All three channels have controllable phase andthe receiver channels also have controllable gain. A calibratedphase and amplitude lookup table is loaded into each moduleprior to each data take. During the data take, the ARC usesinformation from the INU to continuously command the beamto be perpendicular to the current flight track. Upon receivinga steering command, each module loads the calibrated phasevalues for that particular steering direction into its phaseshifters and programmable attenuators. The calibrated lookuptable compensates for feed path length errors due to a module’sposition in the array and the measured temperature variationof that particular module, generating a nearly ideal aperturedistribution for the desired scan angle.
The RF signals are distributed to and combined from theTR modules using stripline corporate networks implementedin three 9-layer RT/Duroid 6002 manifold boards. The upperand lower antenna halves have separate networks and thereare separate networks for transmit, receive H, receive V, andcalibration yielding a total of eight 12-way networks. Alleight networks connect to the antenna switch network whichconnects the two receiver outputs to the H and V receiversof the full antenna or to the upper or lower halves of theantenna for either H or V. The ASN also allows loopback ofcalibration signals directly back to the receiver or through theTR modules.
The antenna subsystem is designed to receive unconditioned28 V power from the aircraft and generate the voltagesrequired for operation of its subassemblies. 9 V and -28 Vpower is generated by high-reliability COTS DC/DC convert-ers, while the pulsed 31 V power required for the transmittersis supplied by six Energy Storage Subsystems. The ESS isa custom DC/DC converter with substantial charge storageand very low series resistance. This allows it to supply pulsesof greater than 50 A with little voltage sag, minimizing
transmitter power droop over the pulse.
E. Power Distribution Unit
By electing to have a pod based radar sensor in an unpres-surized pod to facilitate future transition to other platforms,the sensor design incurred a more complicated thermal controlscenario. The power distribution unit is a custom JPL designthat includes a Complex Programmable Logic Device (CPLD)for the thermal control algorithm, as well as provisions fortaking the aircraft 28 V DC power and distributing to thevarious electronic subsystems. Temperature control for activearray and radar electronics is accomplished using a combi-nation of heaters and louvers that control the amount of airflowing through the cooling ducts.
F. Ground Data Subsystem
Repeat-pass airborne radar interferometry requires sophis-ticated processing algorithms to generate the desired defor-mation and associated science data products. The UAVSARGround Data System (GDS) consists of the hardware andsoftware necessary to process and archive UAVSAR rawscience data and the derived science products.
1) Image Formation, Interferometric and Science Process-ing: Generation of image and science data products fol-lows motion processing. After the motion processing stepis completed for a repeat-pass pair of images, a subsequentmotion alignment algorithm is employed to determine properprocessing parameters for the science data so that the imagerywill be co-aligned in both the along-track and cross-trackdirections. Also, a common coordinate system and referencepath based on the two trajectories is selected. Data for bothpasses are then processed through the image formation pro-cessor to generate single look complex (SLC) imagery. If theephemeris knowledge were perfect then the two images wouldbe co-registered precisely. However, even with the best postprocessing of the DGPS data, the expected relative positionaccuracy between the two passes is on the order of 2-3 cm, anorder of magnitude or more larger than the required accuracyto achieve the fraction of a pixel offset that is required forinterferometric applications. To achieve improved alignment,the relative position data, called the baseline, is refined basedon the SLC images themselves. Several methods exist forrecovering residual motion. These differ in implementationand accuracy, however, the basic idea is to use the mis-registration information between the SLC images to derivea baseline correction. After the residual baseline is estimatedthe improved ephemeris is used to reprocess the data. Theprocedure may be repeated until the two images are co-registered with sufficient accuracy.
An interferogram is formed by multiplying the complexvalue of a pixel in one image by the complex conjugate of thecorresponding pixel in the second image of the interferometricpair. It is the phase of the complex value in the interferogramthat contains the deformation signal. However, the interfer-ometric phase measurement suffers from two complicatingfactors that must be addressed before the deformation signal
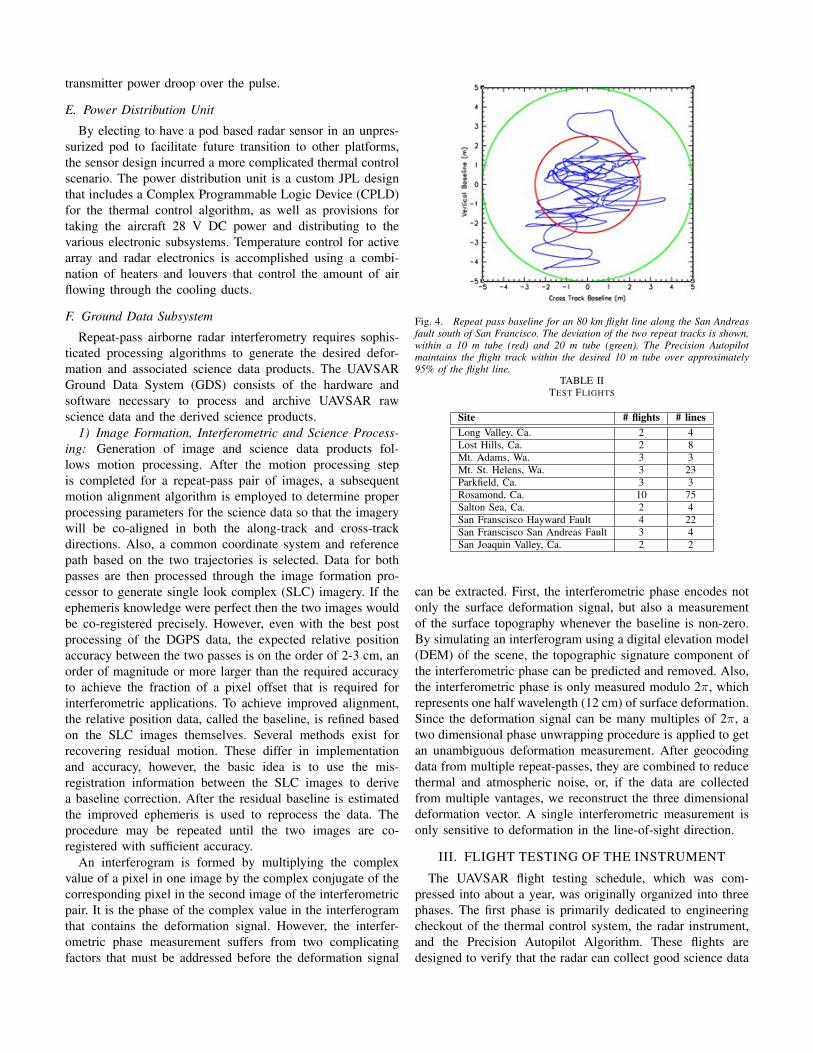
Fig. 4. Repeat pass baseline for an 80 km flight line along the San Andreasfault south of San Francisco. The deviation of the two repeat tracks is shown,within a 10 m tube (red) and 20 m tube (green). The Precision Autopilotmaintains the flight track within the desired 10 m tube over approximately95% of the flight line.
TABLE IITEST FLIGHTS
Site # flights # linesLong Valley, Ca. 2 4Lost Hills, Ca. 2 8Mt. Adams, Wa. 3 3Mt. St. Helens, Wa. 3 23Parkfield, Ca. 3 3Rosamond, Ca. 10 75Salton Sea, Ca. 2 4San Franscisco Hayward Fault 4 22San Franscisco San Andreas Fault 3 4San Joaquin Valley, Ca. 2 2
can be extracted. First, the interferometric phase encodes notonly the surface deformation signal, but also a measurementof the surface topography whenever the baseline is non-zero.By simulating an interferogram using a digital elevation model(DEM) of the scene, the topographic signature component ofthe interferometric phase can be predicted and removed. Also,the interferometric phase is only measured modulo 2π, whichrepresents one half wavelength (12 cm) of surface deformation.Since the deformation signal can be many multiples of 2π, atwo dimensional phase unwrapping procedure is applied to getan unambiguous deformation measurement. After geocodingdata from multiple repeat-passes, they are combined to reducethermal and atmospheric noise, or, if the data are collectedfrom multiple vantages, we reconstruct the three dimensionaldeformation vector. A single interferometric measurement isonly sensitive to deformation in the line-of-sight direction.
III. FLIGHT TESTING OF THE INSTRUMENT
The UAVSAR flight testing schedule, which was com-pressed into about a year, was originally organized into threephases. The first phase is primarily dedicated to engineeringcheckout of the thermal control system, the radar instrument,and the Precision Autopilot Algorithm. These flights aredesigned to verify that the radar can collect good science data
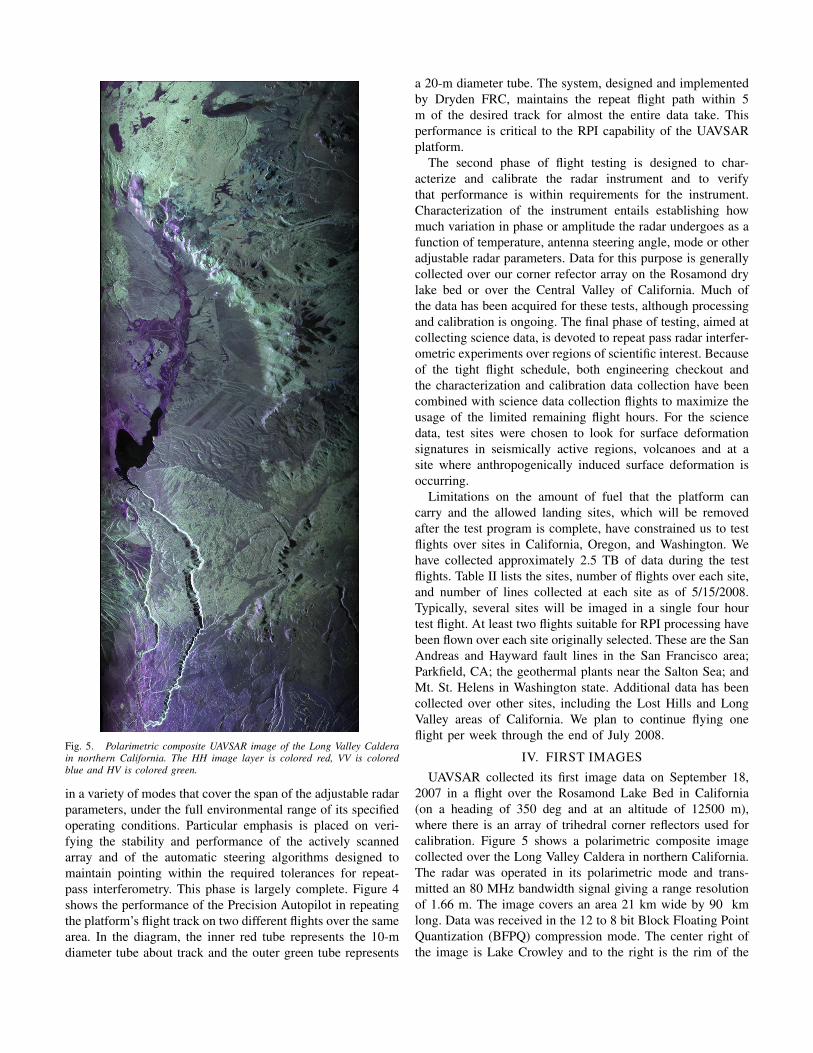
Fig. 5. Polarimetric composite UAVSAR image of the Long Valley Calderain northern California. The HH image layer is colored red, VV is coloredblue and HV is colored green.
in a variety of modes that cover the span of the adjustable radarparameters, under the full environmental range of its specifiedoperating conditions. Particular emphasis is placed on veri-fying the stability and performance of the actively scannedarray and of the automatic steering algorithms designed tomaintain pointing within the required tolerances for repeat-pass interferometry. This phase is largely complete. Figure 4shows the performance of the Precision Autopilot in repeatingthe platform’s flight track on two different flights over the samearea. In the diagram, the inner red tube represents the 10-mdiameter tube about track and the outer green tube represents
a 20-m diameter tube. The system, designed and implementedby Dryden FRC, maintains the repeat flight path within 5m of the desired track for almost the entire data take. Thisperformance is critical to the RPI capability of the UAVSARplatform.
The second phase of flight testing is designed to char-acterize and calibrate the radar instrument and to verifythat performance is within requirements for the instrument.Characterization of the instrument entails establishing howmuch variation in phase or amplitude the radar undergoes as afunction of temperature, antenna steering angle, mode or otheradjustable radar parameters. Data for this purpose is generallycollected over our corner refector array on the Rosamond drylake bed or over the Central Valley of California. Much ofthe data has been acquired for these tests, although processingand calibration is ongoing. The final phase of testing, aimed atcollecting science data, is devoted to repeat pass radar interfer-ometric experiments over regions of scientific interest. Becauseof the tight flight schedule, both engineering checkout andthe characterization and calibration data collection have beencombined with science data collection flights to maximize theusage of the limited remaining flight hours. For the sciencedata, test sites were chosen to look for surface deformationsignatures in seismically active regions, volcanoes and at asite where anthropogenically induced surface deformation isoccurring.
Limitations on the amount of fuel that the platform cancarry and the allowed landing sites, which will be removedafter the test program is complete, have constrained us to testflights over sites in California, Oregon, and Washington. Wehave collected approximately 2.5 TB of data during the testflights. Table II lists the sites, number of flights over each site,and number of lines collected at each site as of 5/15/2008.Typically, several sites will be imaged in a single four hourtest flight. At least two flights suitable for RPI processing havebeen flown over each site originally selected. These are the SanAndreas and Hayward fault lines in the San Francisco area;Parkfield, CA; the geothermal plants near the Salton Sea; andMt. St. Helens in Washington state. Additional data has beencollected over other sites, including the Lost Hills and LongValley areas of California. We plan to continue flying oneflight per week through the end of July 2008.
IV. FIRST IMAGES
UAVSAR collected its first image data on September 18,2007 in a flight over the Rosamond Lake Bed in California(on a heading of 350 deg and at an altitude of 12500 m),where there is an array of trihedral corner reflectors used forcalibration. Figure 5 shows a polarimetric composite imagecollected over the Long Valley Caldera in northern California.The radar was operated in its polarimetric mode and trans-mitted an 80 MHz bandwidth signal giving a range resolutionof 1.66 m. The image covers an area 21 km wide by 90 kmlong. Data was received in the 12 to 8 bit Block Floating PointQuantization (BFPQ) compression mode. The center right ofthe image is Lake Crowley and to the right is the rim of the
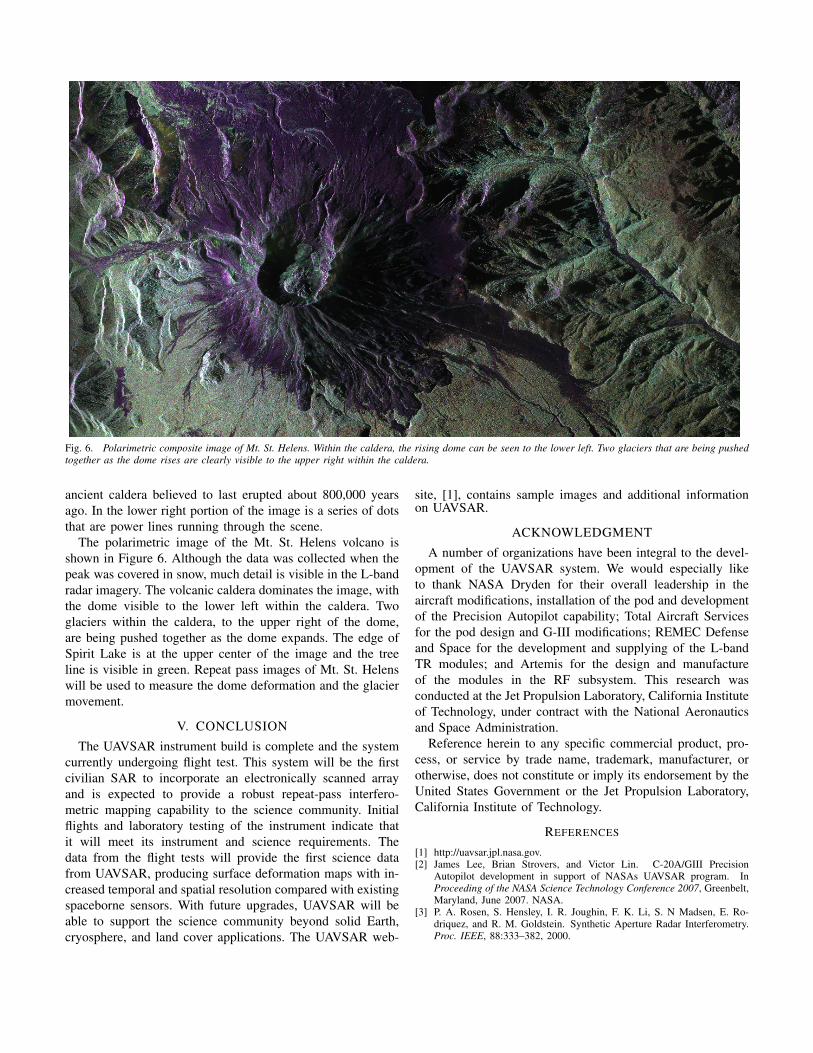
Fig. 6. Polarimetric composite image of Mt. St. Helens. Within the caldera, the rising dome can be seen to the lower left. Two glaciers that are being pushedtogether as the dome rises are clearly visible to the upper right within the caldera.
ancient caldera believed to last erupted about 800,000 yearsago. In the lower right portion of the image is a series of dotsthat are power lines running through the scene.
The polarimetric image of the Mt. St. Helens volcano isshown in Figure 6. Although the data was collected when thepeak was covered in snow, much detail is visible in the L-bandradar imagery. The volcanic caldera dominates the image, withthe dome visible to the lower left within the caldera. Twoglaciers within the caldera, to the upper right of the dome,are being pushed together as the dome expands. The edge ofSpirit Lake is at the upper center of the image and the treeline is visible in green. Repeat pass images of Mt. St. Helenswill be used to measure the dome deformation and the glaciermovement.
V. CONCLUSION
The UAVSAR instrument build is complete and the systemcurrently undergoing flight test. This system will be the firstcivilian SAR to incorporate an electronically scanned arrayand is expected to provide a robust repeat-pass interfero-metric mapping capability to the science community. Initialflights and laboratory testing of the instrument indicate thatit will meet its instrument and science requirements. Thedata from the flight tests will provide the first science datafrom UAVSAR, producing surface deformation maps with in-creased temporal and spatial resolution compared with existingspaceborne sensors. With future upgrades, UAVSAR will beable to support the science community beyond solid Earth,cryosphere, and land cover applications. The UAVSAR web-
site, [1], contains sample images and additional informationon UAVSAR.
ACKNOWLEDGMENT
A number of organizations have been integral to the devel-opment of the UAVSAR system. We would especially liketo thank NASA Dryden for their overall leadership in theaircraft modifications, installation of the pod and developmentof the Precision Autopilot capability; Total Aircraft Servicesfor the pod design and G-III modifications; REMEC Defenseand Space for the development and supplying of the L-bandTR modules; and Artemis for the design and manufactureof the modules in the RF subsystem. This research wasconducted at the Jet Propulsion Laboratory, California Instituteof Technology, under contract with the National Aeronauticsand Space Administration.
Reference herein to any specific commercial product, pro-cess, or service by trade name, trademark, manufacturer, orotherwise, does not constitute or imply its endorsement by theUnited States Government or the Jet Propulsion Laboratory,California Institute of Technology.
REFERENCES
[1] http://uavsar.jpl.nasa.gov.[2] James Lee, Brian Strovers, and Victor Lin. C-20A/GIII Precision
Autopilot development in support of NASAs UAVSAR program. InProceeding of the NASA Science Technology Conference 2007, Greenbelt,Maryland, June 2007. NASA.
[3] P. A. Rosen, S. Hensley, I. R. Joughin, F. K. Li, S. N Madsen, E. Ro-driquez, and R. M. Goldstein. Synthetic Aperture Radar Interferometry.Proc. IEEE, 88:333–382, 2000.