Role and tasks of safety professionals: some results from an ...
30
Role and tasks of safety professionals: some results from an international survey Hale, A.R 1 , Guldenmund F.G. Safety Science Group, Delft University of Technology, Netherlands. 1. INTRODUCTION In 2002 work was started under the auspices of the International Social Security Association (ISSA) Working Group on the Training of Health and Safety Professionals on the collection of data about the tasks which safety professionals actually do in practice. The work was later transferred to the European Network of Safety & Health Professional Organisations (ENSHPO), when ISSA changed its policy on the working group’s goals and activities. The survey was undertaken to collect data which can be used to compare the work actually done with the specifications given for safety professionals’ tasks in law, training courses and the literature of their professional associations. The focus was initially on European countries, but interest in the survey was shown by two non-European countries, Australia and Singapore, and the survey was subsequently conducted in both of those countries. Individual reports and papers have been presented on the national results of many of the participating countries [Bianchi 2004, Borys et al 2005, Dudka 2004, Jones 2004, Miguel et al. 2004, Lang 2004, Perttula & Saari 2004, Rillie 2005, Ytrehus 2003]. Some early results of the international comparisons were made in conference and journal papers [Hale et al 2005, Hale & Ytrehus 2004]. The majority of this material and other papers, data files and the questionnaire in the languages used in the survey are to be found on the website of ENSHPO at www.enshpo.org . The objectives of the survey, its historical context and the construction and distribution of the questionnaire are described in the papers mentioned above and will only be summarised here. 2. THE CONDUCT OF THE SURVEY AND PARTICIPATING COUNTRIES The survey grew out of the concern expressed in discussions in the ISSA Working Group that there was very little known about what safety professionals (SPs) actually do, rather than what the law and their professional associations prescribe or claim that that do. Discussions about harmonisation or mutual recognition of qualifications, sharing of training experiences, development of better training, etc. need a solid basis of knowledge about what SPs do in order to avoid misconceptions and miscommunications. It was decided to conduct a questionnaire survey of practitioners in as many countries associated with the original ISSA group, and later the ENSHPO network as possible. Since there was no central funding available for the work, each country had to find its own modus operandi and financing. This was generally forthcoming from a national grant, collaboration with the national professional associations(s), use of masters or other student projects and collaboration with interested universities. Much of the work was done on a voluntary basis by the country coordinators. Limitations in the availability of funds or participants able to devote such time prevented a number of originally interested countries from participating. To ensure the comparability of all of the surveys a working party of ISSA developed a central questionnaire and oversaw the translation of it into the languages of the participating countries. The questionnaire was prepared initially in English, to arrive at a 1 Corresponding author. +31 15 2781706. [email protected] . Postbus 5015, 2600 GA Delft,
-
Upload
khangminh22 -
Category
Documents
-
view
2 -
download
0
Transcript of Role and tasks of safety professionals: some results from an ...
Role and tasks of safety professionals: some results from an international survey Hale, A.R1, Guldenmund F.G.
Safety Science Group, Delft University of Technology, Netherlands.
1. INTRODUCTION In 2002 work was started under the auspices of the International Social Security Association (ISSA) Working Group on the Training of Health and Safety Professionals on the collection of data about the tasks which safety professionals actually do in practice. The work was later transferred to the European Network of Safety & Health Professional Organisations (ENSHPO), when ISSA changed its policy on the working group’s goals and activities. The survey was undertaken to collect data which can be used to compare the work actually done with the specifications given for safety professionals’ tasks in law, training courses and the literature of their professional associations. The focus was initially on European countries, but interest in the survey was shown by two non-European countries, Australia and Singapore, and the survey was subsequently conducted in both of those countries. Individual reports and papers have been presented on the national results of many of the participating countries [Bianchi 2004, Borys et al 2005, Dudka 2004, Jones 2004, Miguel et al. 2004, Lang 2004, Perttula & Saari 2004, Rillie 2005, Ytrehus 2003]. Some early results of the international comparisons were made in conference and journal papers [Hale et al 2005, Hale & Ytrehus 2004]. The majority of this material and other papers, data files and the questionnaire in the languages used in the survey are to be found on the website of ENSHPO at www.enshpo.org. The objectives of the survey, its historical context and the construction and distribution of the questionnaire are described in the papers mentioned above and will only be summarised here. 2. THE CONDUCT OF THE SURVEY AND PARTICIPATING COUNTRIES The survey grew out of the concern expressed in discussions in the ISSA Working Group that there was very little known about what safety professionals (SPs) actually do, rather than what the law and their professional associations prescribe or claim that that do. Discussions about harmonisation or mutual recognition of qualifications, sharing of training experiences, development of better training, etc. need a solid basis of knowledge about what SPs do in order to avoid misconceptions and miscommunications. It was decided to conduct a questionnaire survey of practitioners in as many countries associated with the original ISSA group, and later the ENSHPO network as possible. Since there was no central funding available for the work, each country had to find its own modus operandi and financing. This was generally forthcoming from a national grant, collaboration with the national professional associations(s), use of masters or other student projects and collaboration with interested universities. Much of the work was done on a voluntary basis by the country coordinators. Limitations in the availability of funds or participants able to devote such time prevented a number of originally interested countries from participating. To ensure the comparability of all of the surveys a working party of ISSA developed a central questionnaire and oversaw the translation of it into the languages of the participating countries. The questionnaire was prepared initially in English, to arrive at a
1 Corresponding author.
+31 15 2781706. [email protected]. Postbus 5015, 2600 GA Delft,
relevant list of questions, which would provide useful data without presenting the participants with too much work in filling in the information. The content of the questionnaire is briefly described in the next section. Up to now 13 countries have taken part in the survey. The questionnaire and instructions for the conduct of a national survey are to be found on the ENSHPO website (address given earlier), should other countries wish to add their results to the database. The countries and their participating safety professionals are presented briefly below. 2.1. The questionnaire. A questionnaire is always a compromise between completeness and practicability. The original plan was to ask about the tasks which safety professionals carried out in relation to a range of different hazards, in order to judge their depth of involvement and be able to compare that to the depth of other professional groups such as occupational hygienists, risk analysts and occupational physicians. The possibility of arranging common training across several professional groups lay behind this approach, which would also require that these other groups would complete comparable, overlapping questionnaires. This plan led to a matrix giving a total of almost 300 questions, when demographic questions and tasks related to other aspects of the job were also included. This would have been far too burdensome to complete. A compromise was therefore reached by splitting the questionnaire into three main content parts and two sections related to demographic information. The resulting questionnaire was still long, with an estimated completion time requirement of around an hour, but pilot testing led to the expectation that safety professionals would be enthusiastic enough to take this amount of time. The final structure of the questionnaire, with 169 questions, was as follows: 11 questions on where the respondent worked – industry, type of organisation,
multi-site, multinational, employees covered, work with other professionals 83 questions on the tasks performed and their frequency of performance. Tasks
were given under 8 headings, based on a problem solving cycle: o Problem identification and analysis, o Developing and implementing solutions, o Training, information and communication o Inspection and research o Emergency procedures & settlement of damage o Regulatory tasks o Knowledge management o Management and financial
31 questions on hazards dealt with and how frequently encountered 36 questions on contacts with different system actors inside and outside a company
and their frequency 8 demographic questions on age, gender, education and training, and membership of
professional associations Analysis of the questionnaire results led to the realisation that some questions had not worked as desired. In particular there were problems for respondents in allocating their workplace to an industry. The international NACE classification was used, but respondents were clearly not familiar enough with it to know where to code their company’s activity;
consultants working in several industries also had problems responding to this. This has meant that analyses comparing across industries have to be treated with great caution. As with all international surveys, it was also difficult to devise a classification of education levels which could equate education levels in an easily comprehensible way across all countries, given the very different structures per country. This question, and the ones about specific safety qualification training and professional association membership were left to each country to devise according to their own systems, with an obligation to report and explain the coding to the coordinators. In the analysis phase a classification of levels was made based on this information, enabling all countries to be compared on a roughly comparable basis. There was also some scope for minor changes in wording of a small number of other questions to adapt to the different legal systems and structure of professional associations in different countries. These are taken account of in the analyses reported. The translation process itself was an extremely enlightening activity, revealing may subtle but important differences in the use of health and safety concepts in different countries, even within the same language community. Discussion and back-translation were able to resolve much of these, but this was not possible in all cases and such differences must be borne in mind when trying to understand and interpret the results. 2.2. Participating countries and safety professional groups Netherlands The questionnaire was translated (Hale) and distributed to the 1,100 active members of the NVVK (the Dutch association of safety professionals), qualified at middle technical or higher education level in safety on prescribed and approved courses. Analysis was conducted at the Delft University of Technology (Ytrehus). Norway Norwegian questionnaires were sent to an address list which was specially compiled for the study. These addresses were obtained from five associations concerned with safety, NBLF (the federation of Norwegian fire officers), ESRA (The European Safety and Reliability Association), VSF (The society of cooperation between safety personnel), TSF (the Interdicipinary Safety Society) and an expert group on HSE within the Norwegian association for graduate engineers (NIF). From the contact network of the Norwegian University of Science and Technology (NTNU) and the Foundation for Scientific and Industrial Research (SINTEF) the participants at a yearly conference called the Safety Days were also selected. In total 1,300 questionnaires were sent out in Norway. Based on the preliminary analyses it was decided to use only the results for VSF members in this paper, as they are the most comparable with other countries’ professionals. The questionnaire was translated and analysed at the Norwegian University of Science & Technology in Trondheim (Ytrehus). Germany The questionnaire was distributed via VDSI, which is the German safety professional association, to the full membership of 2896 (Hameister). Questionnaires were analysed by the University of Wupperthal (Prof Helge Braunholz). Only aggregated data is available from Germany and it has not been possible to obtain the original database of individual responses to merge with the other countries data in making new analyses. Austria The German language questionnaire, slightly modified to fit to the Austrian situation was
sent out to the full membership of 1000 of VÖSI, the Austrian safety professional association. Analysis was arranged by the country coordinators (F. & G. Kaida) Switzerland The German questionnaire was adapted to the Swiss situation and was then translated into French and Italian to cover the three principal language communities. It was placed as a web-based questionnaire on the website of the Swiss coordinator (SUVA) and a link was sent to the 620 safety professionals with known e-mail addresses, out of the 1200 registered in Switzerland. Analysis was done by SUVA (Lang & Chivers). United Kingdom The British questionnaires were sent out by the Institution of Occupational Safety & Health, the British professional body (Jones). They were sent to all the UK-based registered safety professionals who were members, a total of 2700. This sample is a small fraction of the total IOSH membership, representing the more highly trained and qualified group, most of whom are graduates. No technician level members were included. Analysis was done by IOSH and the University of Leicester (Dr Vassie). Finland The Finnish questionnaire was sent to the members of four professional groups in Finland, the Finnish Ergonomics Society, Finnish Occupational Hygiene Society, Association of Finnish Safety Managers (Tyosuojelupaallikot) and the address list of the Centre for Occupational Safety. For the purposes of this paper only the results from the last two groups are presented, as their professional job coverage roughly equates to that of the other countries surveyed. 1250 questionnaires were sent out to these two groups. The Finnish Institute of Occupational Health carried out the translation and the analysis (Perttula & Saari). Italy The Italian questionnaire was distributed to the full membership of AIAS, the Italian professional body representing safety professionals (Bianchi). 4200 questionnaires were sent out. The translation was made and the data were analysed in collaboration between AIAS and the University of Genova. Poland The Polish questionnaire was translated and sent out by the Central Institute for Labour Protection (CIOP) to an address list established by the Institute through its training and advisory work (Koradecka). 600 questionnaires were sent out to the members of two Polish associations of safety professionals. Data was analysed by CIOP (Dudka). Portugal The questionnaire was translated and distributed by the University of Minho (Miguel & Arezes) and distributed to the alumni of safety professional courses at that university and the Technical University of Lisbon and a list of safety engineering specialists from the Professional Association of Engineers. 247 questionnaires were distributed. Analysis was also done at Minho (Lourinho). Cyprus The questionnaire was also distributed in Cyprus through the membership of the Cyprus Health & Safety Association (Charalambous). This is a very small society and only 7 responses were forthcoming, so it is not possible to include this country as a separate analysis in this paper.
Australia Following a presentation of preliminary results of the European survey in Australia in 2003, the Safety Institute of Australia expressed interest in carrying out the survey there also. A version of the UK questionnaire was adapted to the Australian scene and sent out to a sample of 1600 of the professional safety membership of the Institute (Pryor). Analysis was done at the University of Ballarat (Borys, Sawyer & Else) Singapore As a result of a direct approach from a masters student from the University of New South Wales (Rillie) it was agreed to use a version of the questionnaire adapted to the Singaporean situation. The questionnaire was sent out to 718 safety professionals through five channels: Ministry of Manpower (OHS division), Singapore Institution of Safety Officers, Occupational Environmental Health Society, Institution of Engineering, Singapore (Environmental Engineering, Health and Safety committee), National University of Singapore (OHS Department) and the Society of Loss Prevention. Analysis was conducted at the University of NSW (Rillie). 3. ANALYSIS OF RESULTS: 3.1. General issues The response rates in the different countries vary from only 5% in Italy to 60% in UK (see table 1 in the next section). In the countries with response rates less than 40% very great care needs to taken in interpreting the results, since it is almost certain that they will not be representative of the safety professional population of those countries. In the remaining countries the response rate is at, or around, the level which is normal for such surveys. The UK result of 60% is far higher than would normally be expected from a general survey of this type. All of the results should therefore be assessed in the light of these limitations in sampling. Having said this, we must point out that a survey containing 169 questions and taking an hour to complete places a very heavy burden on the respondents and it is a tribute to their concern to support this sort of research and clarify their role and tasks that so many made this effort. Apart from the results for Cyprus, which are excluded because of the limited total numbers, care must also be taken with the small total numbers in Portugal (30). Apart from the concerns about representativity, this makes the percentage figures quoted very sensitive to single respondent’s answers. In the results we compare the data from the 12 countries on a number of demographic variables and then on the tasks, hazards and contact networks which are dealt with by many or few professionals. We also present some cross-tabulations, but these are limited at present to relatively simple tables by level of education and courses followed. The data analysis is still on-going, delayed by the difficulty of allocating resources to this work without external funding. In a final section we present the first results of some factor analysis of the total and of the Dutch and Norwegian data and indicate further analyses which are planned. 3.2. Methods of analysis The data were coded into either SPSS or Excel files for tabulation of the data and production of the simple cross-tabulations. Each country provided this data to the central coordination point in the Delft University of Technology, where it was transferred to SAS format for ease of the more complex analyses. A major exercise in cleaning up the data and making it fully compatible was necessary (Guldenmund & Dua) to be able to merge all the
data sets, despite the great care in controlling the translation and distribution of the questionnaires. This process resulted in slightly different totals and distributions to the results published in earlier papers, because of the need to exclude some records and modify a small number of codings. The data used in this paper are these cleaned-up national data sets and the merged total. The German data could not be obtained in its original form for merging with the other data sets. New analyses of the total data set, going beyond what was available in the way of cross-tabulations in the original German report will therefore be only for a maximum of 11 countries. Where less than 12 countries form the basis of the analysis, this is indicated in the paper. The data have been grouped and reduced in complexity for this first analysis, in order to bring out the main features. The respondents gave their answers to the questions on tasks, hazards and contacts with other system actors in terms of the frequency with which they carried them out, or dealt with them. This scale gave them options of ‘weekly or more’, ‘monthly or quarterly’, ‘yearly or less’, ‘never yet, but is part of my job’ and ‘not part of my job’. For this paper we have grouped the responses in the first three categories together and in the last two categories together, to indicate tasks, hazards and contacts which have been dealt with at some time by a respondent and ones which have never been encountered. Our reasoning was that even those tasks done rarely need to feature in the training, if they are done by a large proportion of the respondents. They are still core competencies. We will return later to more detailed analysis of the frequency of tasks, hazards and contacts. We have then grouped the responses into bands of 0-19%, 20-39%, 40-59%, 60-79% and 80-100% to give a more general picture of the percentage of a sample carrying out a particular task, dealing with a given hazard, or contacting a given type of person. This gives an idea of the common core content of the job of the safety professional. A Principal Components Analysis was conducted by Ytrehus (2003) on the Dutch and Norwegian data independently. A varimax rotation was used and a number of factors identified for interpretation. These correspond to clusters of tasks or hazards, which are either carried out, or not carried out by a particular group of respondents. This analysis enables us to see whether there are interesting sub-groups within the total population, which tend to have different groupings of tasks or deal with different clusters of hazard types. A start has been made on factor analyses of the total sample, which can reveal similarities and differences between countries, and how the tasks, hazards and contacts cluster into groups, indicating different sub-groupings of the safety professionals’ work. 4. RESULTS AND DISCUSSION OF SIMPLE COMPARISONS 4.1.1 Demographic & employment data: results These results are given in table 1. The columns represent:
o The response rate in percentage, with the total number of respondents in brackets next to it. This is the number of respondents used in this paper. The total number of questionnaires sent out per country has been given in section 2.2 above.
o The percentage of respondents who are male o The percentage who have a full-time, as opposed to a part-time safety function o The percentages who are employed by one company as internal staff, as opposed to
working as an external consultant hired in by companies. The difference between the combined percentage of these two groups and 100% is taken up with a miscellaneous ‘other category’, consisting largely of regulators and those working for public bodies such as the fire service, but not in an advisory function. In the countries marked with an asterisk* this percentage is larger than 10% of the
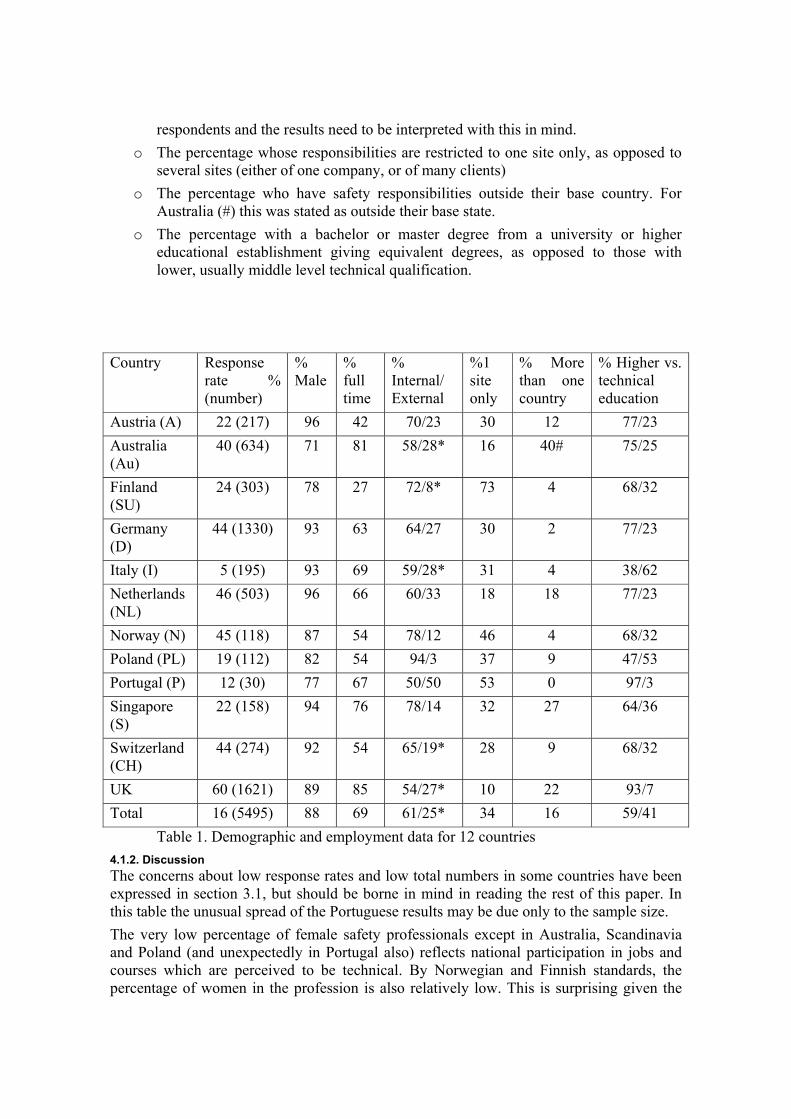
respondents and the results need to be interpreted with this in mind. o The percentage whose responsibilities are restricted to one site only, as opposed to
several sites (either of one company, or of many clients) o The percentage who have safety responsibilities outside their base country. For
Australia (#) this was stated as outside their base state. o The percentage with a bachelor or master degree from a university or higher
educational establishment giving equivalent degrees, as opposed to those with lower, usually middle level technical qualification.
Country Response
rate % (number)
% Male
% full time
% Internal/ External
%1 site only
% More than one country
% Higher vs. technical education
Austria (A) 22 (217) 96 42 70/23 30 12 77/23 Australia (Au)
40 (634) 71 81 58/28* 16 40# 75/25
Finland (SU)
24 (303) 78 27 72/8* 73 4 68/32
Germany (D)
44 (1330) 93 63 64/27 30 2 77/23
Italy (I) 5 (195) 93 69 59/28* 31 4 38/62 Netherlands (NL)
46 (503) 96 66 60/33 18 18 77/23
Norway (N) 45 (118) 87 54 78/12 46 4 68/32 Poland (PL) 19 (112) 82 54 94/3 37 9 47/53 Portugal (P) 12 (30) 77 67 50/50 53 0 97/3 Singapore (S)
22 (158) 94 76 78/14 32 27 64/36
Switzerland (CH)
44 (274) 92 54 65/19* 28 9 68/32
UK 60 (1621) 89 85 54/27* 10 22 93/7 Total 16 (5495) 88 69 61/25* 34 16 59/41
Table 1. Demographic and employment data for 12 countries 4.1.2. Discussion The concerns about low response rates and low total numbers in some countries have been expressed in section 3.1, but should be borne in mind in reading the rest of this paper. In this table the unusual spread of the Portuguese results may be due only to the sample size. The very low percentage of female safety professionals except in Australia, Scandinavia and Poland (and unexpectedly in Portugal also) reflects national participation in jobs and courses which are perceived to be technical. By Norwegian and Finnish standards, the percentage of women in the profession is also relatively low. This is surprising given the

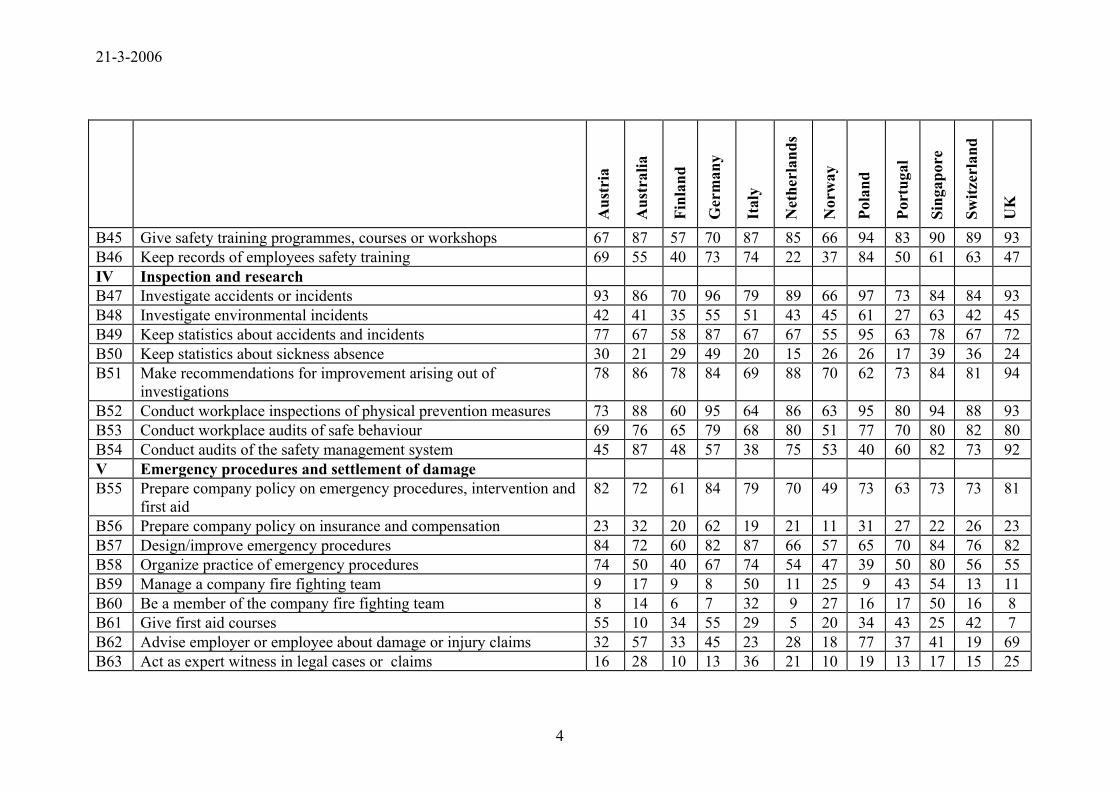
relatively high content of health related topics which form part of the job (see below). The population in Finland is clearly unusual compared to other countries, with many part-timers and few external to companies. This indicates a different approach to the safety expert task as a part-time, internal function. This is an extreme case, but there is a similar tendency in Norway, Poland and to a lesser extent Austria, Germany, Switzerland and the Netherlands. UK, Singapore and Australia, in contrast have more full-timers in the population. The low level of external consultants in Poland is a reflection of the law there, which requires an internal expert except in companies with less than 50 staff [Dudka 2004]. Elsewhere the ratio of internal to external staff is around two thirds to one third, with the highest percentage of externals in the Netherlands, which had at the time of the survey regulations framed in a way which encouraged outsourcing of professional advice to external working conditions services. Overall we can say that, despite the current tendency in industry to outsource many tasks, the safety professional is still an in-company position for the majority. The differences in international spread of the responsibilities of the respondents probably reflect partly the size of country (e.g. Singapore, with more working over the frontier) and partly the number of multinationals working in the different countries, with higher numbers with plants in the UK and the Netherlands. The Australian figure is inflated by the responses being out of state, rather than out of country. The extremely high level of graduates in the UK sample is a factor of the sampling, which concentrated on the registered professionals and not on the lower level qualifications. The reversed ratio of lower to higher qualifications in Italy, compared to almost all the other countries, is striking 4.2. Core tasks, Hazards and contacts: Results & discussion In this section we look at the tasks which are done, the hazards which are dealt with and the contacts made by either a high percentage of the respondents in a country, or a low percentage. The collapsing of the data into a dichotomy (done at least once a year vs. not [yet] done) was explained earlier. Later analyses will be made taking the frequency more into consideration. For now we have chosen to group the percentage of respondents in bands, each 20% wide. Tasks/hazards/contacts that are conducted/dealt with/made at some stage by more than 80% of the respondents are clearly the core of the profession, which the whole population needs to be trained to deal with, across one or several countries. Down to 60% still represent core issues for the whole professional group, but ones where we need to look to see if there are some more homogeneous sub-groups in which a higher percentage carry them out, so as to define application courses for sub-groups of a profession. In the mid range, where 20 – 60% of a group are concerned, tasks are more peripheral and we need to look for correlations either with sub-groups in a particular industry, at a particular point in their carrier development, or at a particular job level to explain the lower commonality, or we may be confronted with a non-homogeneous study population. Some analyses of these issues will be presented in this paper, but there is still much analysis to be done at a later stage. Where less than 20% of a population carries out a task, we are looking at clear specialisms, or very peripheral activities concerning only a few professionals. Differences across countries in where tasks/hazards/contacts fall in a band may indicate different national philosophies or regulatory regimes, or stages of development of industry or risk control. We present the data in a descending order of commonality; first the tasks where all countries score highly and then successively where less and less of the countries score so
highly. The reasoning is that the real core of the profession (if indeed safety is an international profession) will be what is common across most countries. We may then find that additional tasks done by many respondents in only some of the countries represent differentiation of the tasks, or shifting into new areas of work. We seem to see a reflection of the development of safety science from technical through human factors to organisational as we present this progression. The full tables for the three areas are contained in the appendix. 4.2.1. The hard core The following list shows the 22 (out of the total of 83) core tasks that are carried out by more than 60% and usually by more than 80% of the respondents in all 12 countries covered:
• Check compliance of policy & procedures with the law (>80% in all but PL & PT) • Workplace risk assessment (All countries >80%) • Job safety analyses (>80% except Su, N, NL) • Develop company policy on machinery, processes, workplace safety • Machinery, process or workplace safety (specify safeguards, make procedures, give
instructions, check compliance) (>80% in all but Su [all steps], and N, PL, CH for making procedures and giving instructions)
• Personal protective equipment (prepare policy, develop procedures, monitor use) • Inform/discuss with all levels in the company on risk (safety committee, employees,
supervisors, line managers, top management) (All >80% except NL for safety committees, Su for line and top management)
• Investigate accidents/incidents (All >70%) • Make recommendations after accidents (All but I, PL >70%) • Carry out physical inspections (All but A, I, Su above 80%) • Design safety training programmes • Carry out audits of workplace behaviour • Prepare policy on emergency situations
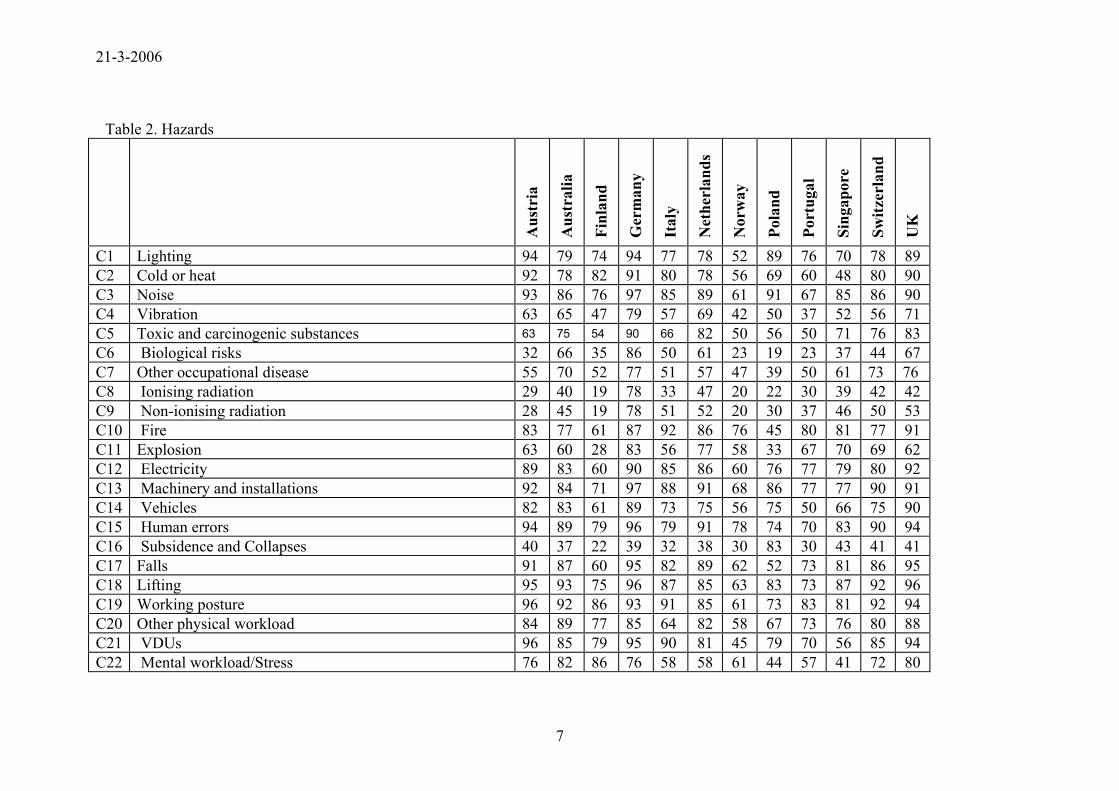
The list reflects a very conventional view of the technically oriented safety practitioner, which is not far removed from the picture of half a century ago [Hale & Ytrehus 2004]. The main tasks cluster around machinery, personal protective equipment, workplace analysis, physical inspection and behavioural influence and control, with intensive consultation with and attempts to support and persuade all levels of line management and employees. The law is the touchstone for the job and accidents are the feedback as to its success and the motor for its improvement. The picture is confirmed by the 7 (out of 31) common hazards and the 7 (out of 36) contacts dealt with by more than 60% of the population in all 12 countries:
• Machinery (>80% in all but Su, N, PL, PT) • Physical work • Lifting (>80% in all but Su, PT) • Working posture (>80% in all but PL) • Human error (>80% in all but Su, I, PL, PT)
• Noise (>80% in all but Su, PT) • Lighting • Contact with employees, line and top management (>80% in all countries and >90%
in most) • Contact with maintenance department (>80% in all but Su) • Contact with personnel department (>80% in all but Su, PT) • Contact with visitors • Contact with government inspectors (>80% in all except NL, PT, S)
The hazards are the ones related to machinery and workplaces, with a clear extension into the ergonomic and working environment hazards. The contacts are with the line and the technical services, although the latter does not extend to tasks related to planning and assessment of maintenance risks – see 4.2.4. below. The long arm of the law in the guise of the inspector is a frequent contact. The concern for human error, behavioural auditing and personnel policy is also clearly central. 4.2.2. Around the core The following list is of the 21 (of 83) tasks and 8 (of 31) hazards which are dealt with by more than 60% of professionals in between eight and eleven of the 12 countries. Apart from some additional tasks concerning the hard core areas presented in 4.2.1, we begin to see more human factors, policy and management related tasks emerging, but also more attention to dangerous materials: (the abbreviations in brackets indicate the country where less than 60% of respondents carries out the particular task).
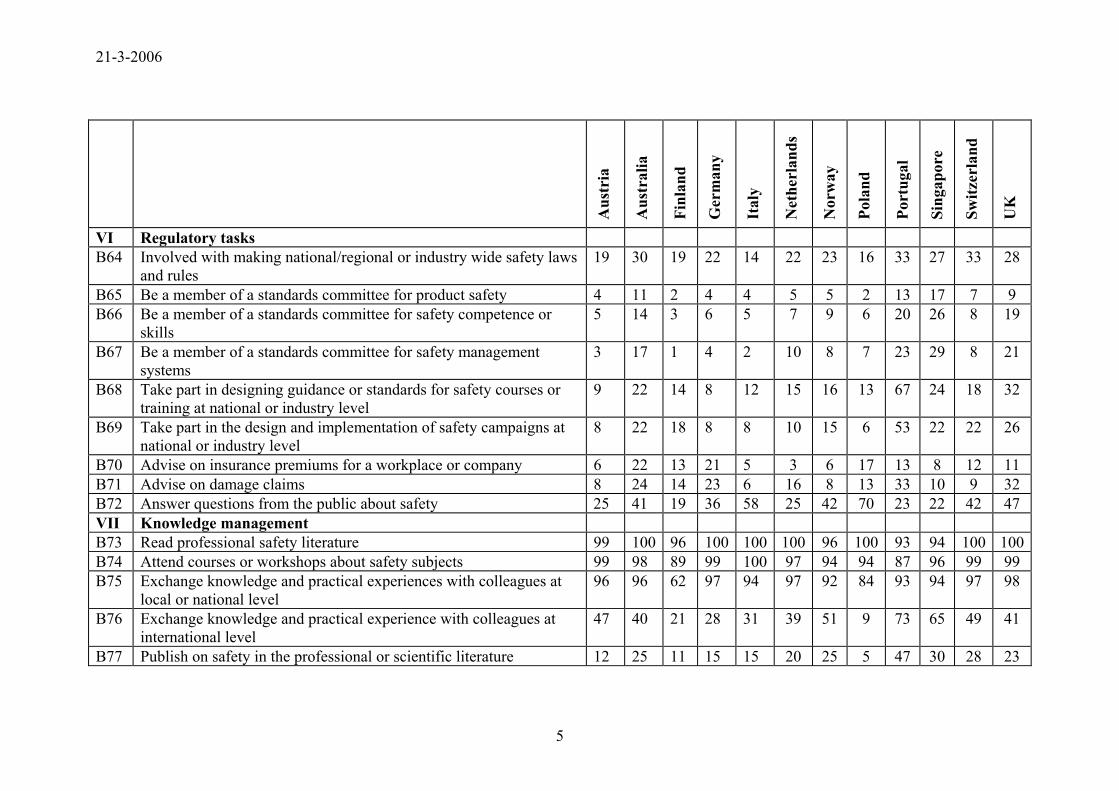
• Specify PPE to be purchased (Su) • Dangerous materials (specify policy) (I, PL, CH) • Dangerous materials (specify preventive measures/ procedures) (Su, PL) • Dangerous materials (check compliance) (PL) • Hazards from toxic or carcinogenic materials (PL, PT, Su) • Prepare policy on safety training (Su) • Give safety training (Su) • Publish/distribute information internally on safety (PL,Su) • Develop (Su) and carry out (NL,Su) safety campaigns • Keep accident statistics (Su) • Electrical hazards (N) • Fire (PL) and explosion (Su, I, N, PL) hazards • Fall hazards (PL) • Vehicle hazards (S) • Hazards in work with computers (S) • Hazards from cold/heat (S) • Develop safety management system (N, PL) • Propose improvements to safety management system (D, I, PL)
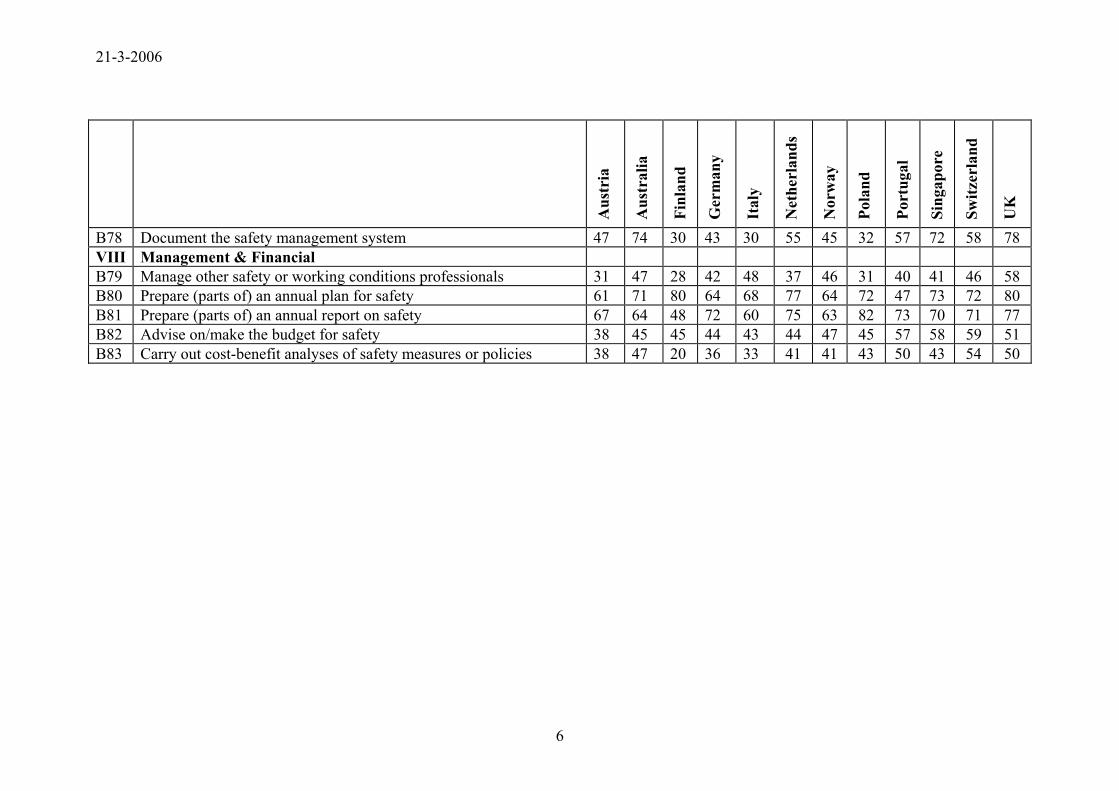
• Prepare policy on safety culture (D, PL, PT) • Assess safety culture (PL) • Propose improvements to safety culture (PL) • Advise on organisational change to improve safety performance (Su) • Emergency situations (make procedures) (N) • Prepare annual report on safety (Su) • Prepare annual safety plan (PT) • Make risk assessments of projects/designs (D, PL, Su)
As suggested in 4.1.1 in relation to the results on sample sizes and the demographic variables, Finland, Poland and Portugal tend to be most often the deviating countries. In particular the concepts of safety management systems and safety culture seem not to have penetrated yet to the former Eastern block, if Poland is typical of those countries. In that country dangerous materials, but also fire and explosion also seem to fall under the role of other professionals. The presence of safety culture improvement here may be a reflection of the current buzzword status of this term, which tends to have as many meanings as it has users [Hale 2000]. It is a matter of discussion whether we should interpret central attention for this issue as a sign of a modern approach to risk control, coupled to safety management systems, or a throwback to the ‘safe person’ strategies of accident proneness and blaming the victim. We also see that issues related more to health protection than acute injury begin to be more visible, namely the concern with dangerous materials. The countries in which all of these tasks and hazards, without exception, are part of the hard core are UK, Australia and Austria. The system actors with whom more than 60% of the respondents are in contact in 8-11 of the 12 countries (exceptions in brackets) are the following 8 (of 36):
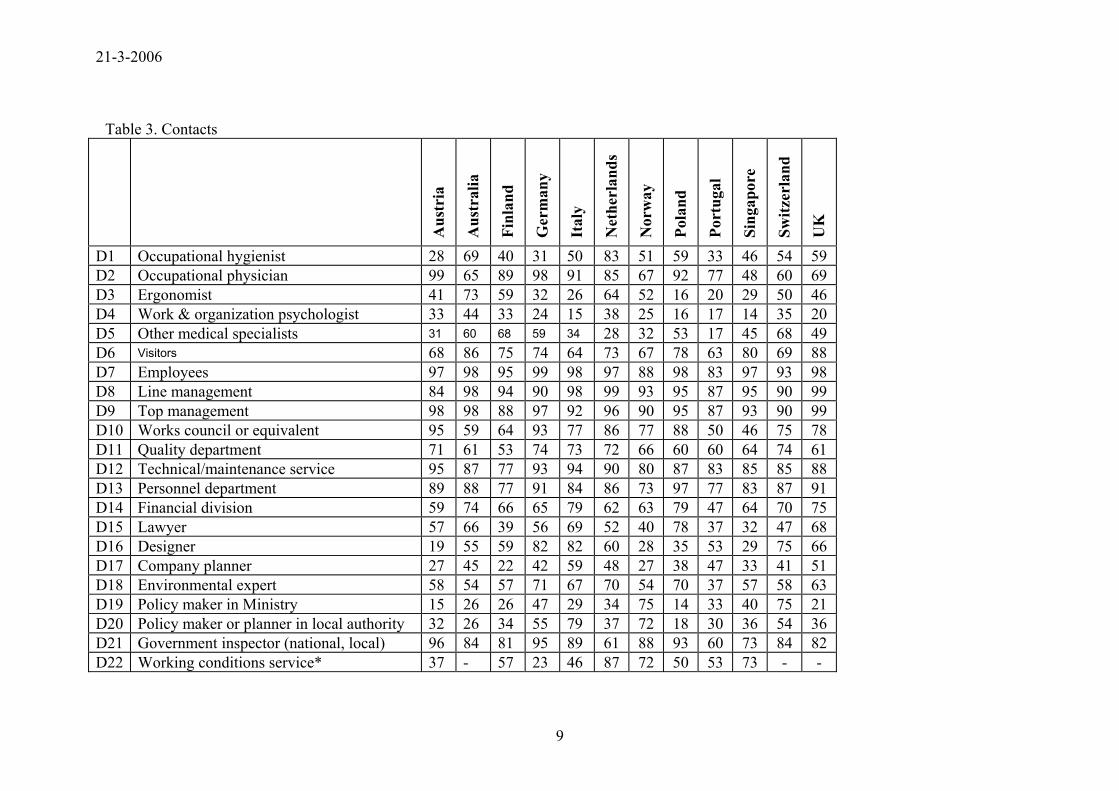
• Occupational physician (S) • Quality department (Su) • Finance department (A, PT) • Safety committee/representatives (A, CH) • Works council or equivalent (Au, PT, S) • Safety professionals of other organisations (A, Su) • Professional association (A, PL, PT, CH) • Local fire services (Au, NL, PT, CH)
We see the traditional professional colleague, the occupational physician emerge here, as well as the employee representation and the link to quality management. The intensive contact with colleague safety professionals as support and encouragement in what can be a lonely profession is also apparent. 4.2.3. Areas of differentiation. When we look at the tasks and hazards dealt with by 60% or more of the respondents in only three to seven of the 12 countries, we see a number of other areas emerging. In this list, in contrast to earlier ones, the countries given in round brackets are the ones where more than 60% of the respondents do carry out the tasks. Where many fewer
respondents deal with these tasks and hazards (less than 20-40%), this is indicated in square brackets.
• Member of design team (A, Au, D, I, PT, CH, UK) • Review design as external to design team (Au, I, NL, PT, UK) • Develop company policy on sustainable products (Au, D, NL, PT, S, CH, UK) • Monitor/audit safety management systems (Au, NL, PT, S, CH, UK + N for
auditing) • Develop safety performance indicators for SMS (Au, PT, S, CH, UK) [I, N, PL
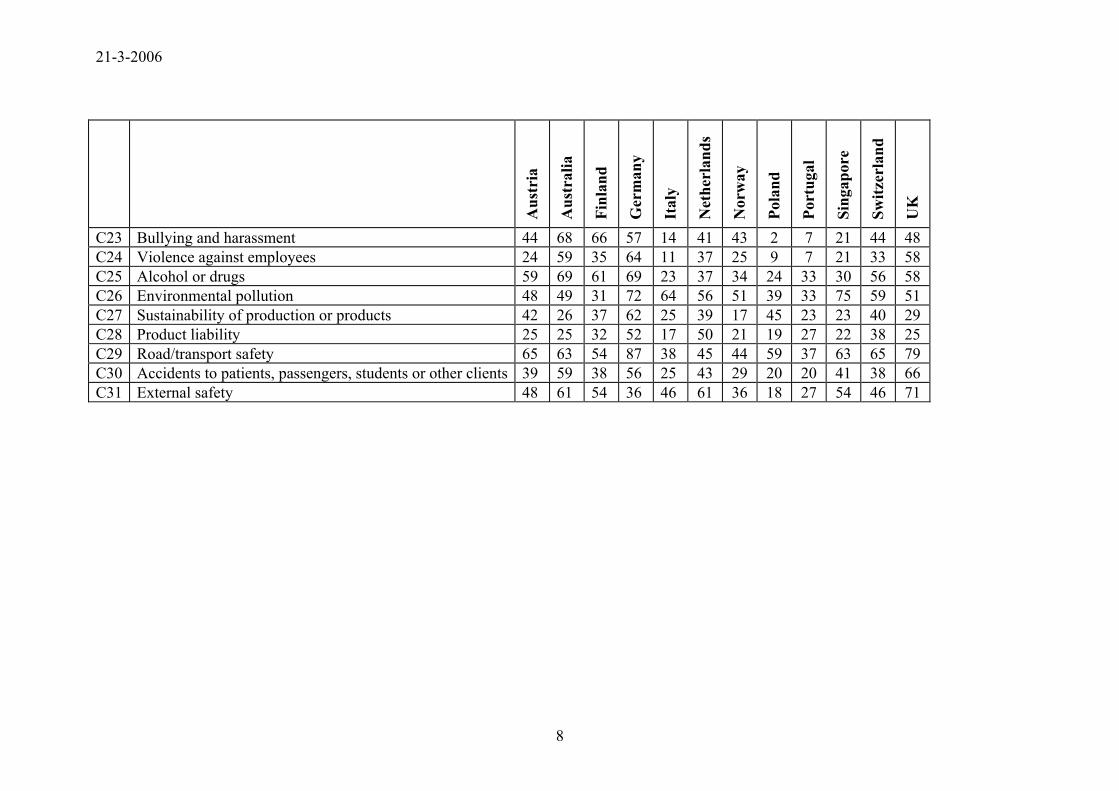
<40%] • Document safety management system (Au, S, UK) [Su, I, PL <40%] • Document safety training (A, D, I, PL, S, CH ) [Su, NL <40%] • Organise emergency drills (A, D, I, S) [PL <40%] • Monitor compliance with Permits-to-work (D, S, UK) [Su, I, N <40%] • Biological hazards (Au, D, NL, UK) [PL, PT <30%] • Vibration hazards (A, Au, D, UK) • Other occupational disease risks (Au, D, N, S, CH, UK) • Mental workload & stress risks (A, Au, D, Su, N, S, UK) • Bullying (Au, Su, N) [I, PL, PT <20%, + S <30%] • Alcohol & Drugs (Au, Su, D) [I, PL <30%] • Environmental risks (D, I, S) • External safety hazards (Au, NL, UK) [PL <20% + PT <30%] • Road & transport hazards (A, Au, D, S, CH, UK)
Here, and just creeping into the list of tasks in 4.2.2 we see, at last, involvement in the design process. Only Finland and Poland have less than 60% involvement in all three of the design related tasks. In Australia, Italy, Portugal and the UK more than 60% are involved in all three, whilst in the remaining countries involvement is more than 60% in at least one of the three. This is still a disappointing score, given the emphasis on design in the safety literature. We see the strong emphasis on some additional tasks in relation to the safety management system in Australia, Singapore and UK and to a lesser extent in Portugal and Switzerland, confirming the conclusions in 4.2.2 above. We see also the addition of tasks related to company policy on sustainability in 6 countries, which include all of the five just mentioned. In Austria, Germany, Italy and Singapore, in particular we see operational tasks, such as administration, practice drills and PTW being central (in Singapore the issuing of PTWs is also a task of more than 60% of the respondents). The spread of hazard types covered by the respondents as part of their core activities is highest in Australia. That country shares the attention shown in Scandinavian countries to stress and well-being, as well as that shown in UK for occupational diseases, external safety and transport safety. Portugal and Poland have a clearly narrower range of hazards covered and in the southern and eastern European countries the safety professionals are not
concerned with well being or external issues. The system actors who are the contacts of more than 60% of the respondents in 3 to 7 countries are the following:
• Educational establishment (A, Au, D, Su, N, CH, UK) • Safety consultant (Au, I, N, S, CH, UK) • Designers (D, I, NL, CH, UK) [<30% in A, N, S] • Environmental experts (D, I, NL, PL, UK) • Lawyers (Au, I, PL, UK) • Trades union officials (Au, Su, N, UK) • Occupational hygienists and ergonomists (Au, NL, N) • Working conditions services (N, NL, S) • Other medical specialists (Au, Su, CH)
The widespread contact network of the Australian respondents is striking here, though it does not, unfortunately extend so much to designers. The particular concern of the Anglo-Saxon countries for legal claims is seen here and in the next section and can be coupled with the contact with trades union officials. In the Scandinavian countries the same level of contact with the latter group can be better seen as an indicator of the importance of employee participation. The different place given to environmental issues across countries is reflected in the contact network here and the tasks in the next section. 4.2.4. Peripheral tasks There remain a range of tasks and hazards which are dealt with by between a quarter and a half of the respondents across countries, with the odd exception either to a higher (round brackets) or lower [square brackets] percentage. These are:
• Involved in devising selection criteria for employees (18- 56%) [A, I, NL <25%] • Develop policy on environment (N, S >60%) • Investigate environmental incidents (N, S >60%) • Answer questions from the public on safety (PL >60%) [Su, PT, S <25%] • Advise on damage or injury claims (PL, UK >60%) [I, N, CH <25%] • Prepare policy on insurance/compensation (D>60%) [A, Su, I, NL, N, S, UK <25%] • Advise on or set safety budget (All 38 – 59%) • Do cost benefit analysis (20 – 54%) [Su <25%] • Team member for planning maintenance/modification (21 – 56%) [I, NL <25%] • Assess plans for maintenance/modification (All 29 – 57%) • Radiation hazards (D >60%) [Su <20%] • Subsidence & collapse hazards (PL > 80%) [Su, N <25%] • Violence to employees (D >60%) [A, I, PL, PT, S <25%] • Sustainability issues (D >60%) [N, PT, S <25%] • Product hazards (17 – 52%) [I, N, PL, S <25%] • Hazards for patients, passengers, students, etc. (UK >60%) [N, PL, PT <25%]
It is significant that all of the financial, insurance and compensation tasks fall in this peripheral area, as do the links to environmental issues, to public information and, most surprisingly, to maintenance planning The last is a vital area both for ensuring safety an integrity and as an activity in which many accidents happen, so these results are disappointing. The particular attention paid in Germany to radiation, sustainability and violence may reflect national ‘green’ concerns. The lower range of hazards dealt with in Scandinavia and in southern and eastern Europe is confirmed here. The system actors falling into this band of contact are the following:
• Work psychologists (Only above 30% in the Scandinavian [N, Su] and central European countries [A, CH] and the Netherlands (where they are a required expert in approved working conditions services, but are still only a contact of 38% of the Dutch respondents)
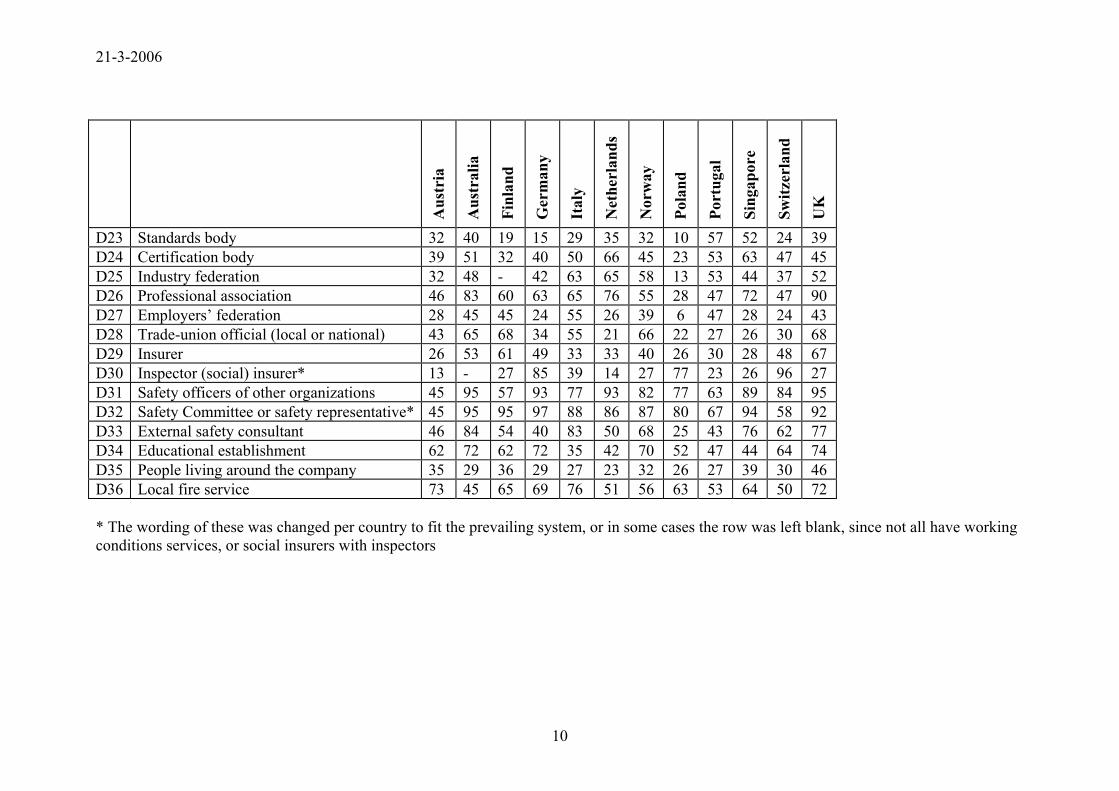
• Planners (22 – 59%) [Su <25%] • Policy makers at Ministries (N, CH >60%) [A, PL, UK <25%] • Policy makers at local/regional authorities (I, N, >60%) [PL <25%] • Standards bodies (10-57%) [Su, D, PL, CH <25%] • Certification bodies (NL, S >60%) [PL <25%] • Industry federations (I, NL >60%) [PL <25%] • Employers federations (6 – 55%) [PL, CH <25%] • Insurers (Su, UK >60%) • Social insurance inspectors (D, PL, CH >60%) [A, NL, PT <25%] • Local residents (23-46%) [NL <25%]
The predominance of different links per country reflect the different regulatory and insurance regimes at national level and the degree to which regulation has been decentralised from government. Australia is the only country of the 12 which does not fall outside the range of 25-59% contacts on any of these system actors. 4.2.5. Niche involvement If we turn to the other end of the spectrum and look at tasks which are done by less than 25% of the respondents in the majority of countries, we find the following list, in so far as they have not been mentioned in the sections above.
• Keep statistics about sickness absence (Highest D, 49%) • Head of company fire brigade (Highest I, 50% and S, 54%) • Member of company fire brigade (Highest S, 50%) • Give first aid courses (Highest A, D, 55%) • Act as expert witness (Highest I 36%) • Advise at national level on laws, regulations (Highest PT, CH 33%) • Sit on standards committees for products , competence, safety management, training
(Highest PT, S & to a lesser extent Au, UK) • Advise at national level on safety campaigns (Highest PT 53%)
The low involvement in national level activities is to be expected. There are not so many
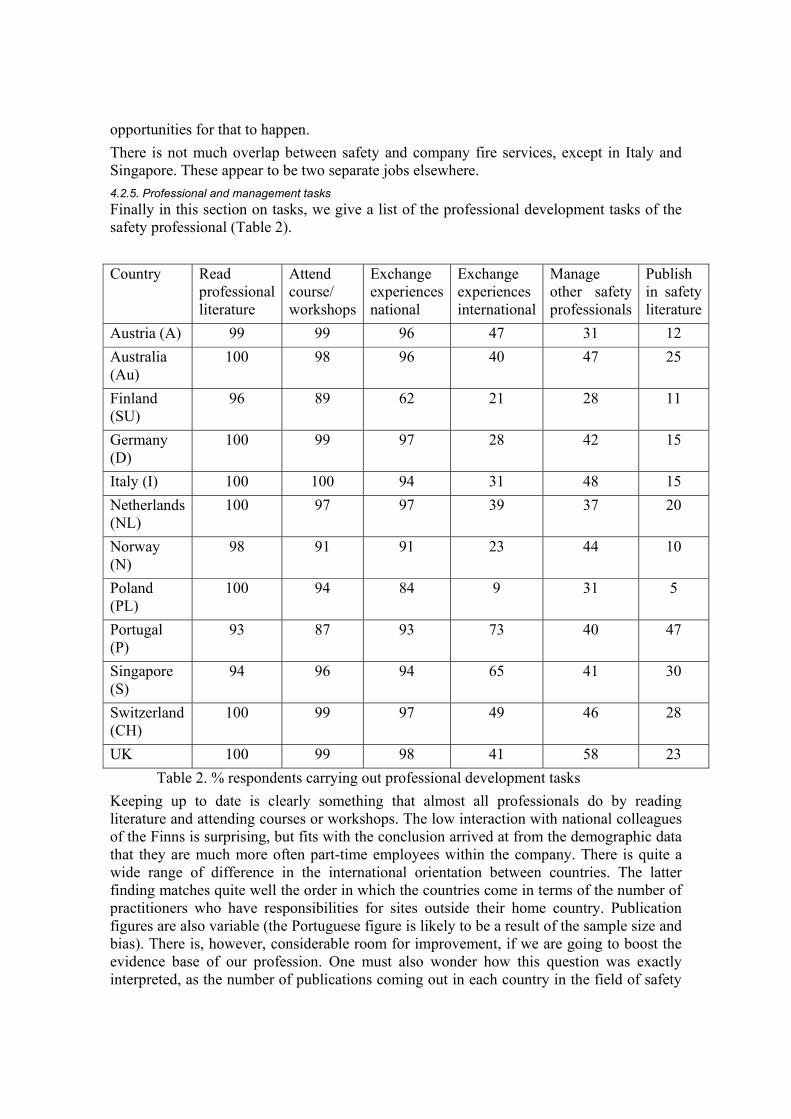
opportunities for that to happen. There is not much overlap between safety and company fire services, except in Italy and Singapore. These appear to be two separate jobs elsewhere. 4.2.5. Professional and management tasks Finally in this section on tasks, we give a list of the professional development tasks of the safety professional (Table 2). Country Read
professional literature
Attend course/ workshops
Exchange experiences national
Exchange experiences international
Manage other safety professionals
Publish in safety literature
Austria (A) 99 99 96 47 31 12 Australia (Au)
100 98 96 40 47 25
Finland (SU)
96 89 62 21 28 11
Germany (D)
100 99 97 28 42 15
Italy (I) 100 100 94 31 48 15 Netherlands (NL)
100 97 97 39 37 20
Norway (N)
98 91 91 23 44 10
Poland (PL)
100 94 84 9 31 5
Portugal (P)
93 87 93 73 40 47
Singapore (S)
94 96 94 65 41 30
Switzerland (CH)
100 99 97 49 46 28
UK 100 99 98 41 58 23 Table 2. % respondents carrying out professional development tasks
Keeping up to date is clearly something that almost all professionals do by reading literature and attending courses or workshops. The low interaction with national colleagues of the Finns is surprising, but fits with the conclusion arrived at from the demographic data that they are much more often part-time employees within the company. There is quite a wide range of difference in the international orientation between countries. The latter finding matches quite well the order in which the countries come in terms of the number of practitioners who have responsibilities for sites outside their home country. Publication figures are also variable (the Portuguese figure is likely to be a result of the sample size and bias). There is, however, considerable room for improvement, if we are going to boost the evidence base of our profession. One must also wonder how this question was exactly interpreted, as the number of publications coming out in each country in the field of safety
hardly matches the claims made, according to feedback from country coordinators. Perhaps respondents are interpreting presentations for workshops and meetings as ‘publications’. 4.4 Differential analysis, profiles and factor analysis Ongoing analysis is looking at the way in which the total populations break down in the different countries into groups with different task, hazard or contact profiles and whether there are sub-groups of countries, or respondents to be identified by factor and cluster analysis In early factor analyses on the Dutch and Norwegian data (Ytrehus 2003, Hale et al 2005), we were able to identify profiles in both countries with the following characteristics:
1. Higher level professionals, dealing with safety in design, policy making across different hazard areas, safety management and performance indicators, and who are involved in national and international networks; and
2. Technical level professionals, centred on procedures, instructions, workplace compliance checks, discussions with employees and supervisors, physical inspections and behavioural audits, accident statistics and emergency drills.
In the Dutch sample, these profiles are associated with two different levels of safety qualification and basic education level. In the Norwegian sample, somewhat similar splits could be discerned, but less clearly. The two profiles seem comparable to two of the profiles found in a Quebec survey by Brun and Loiselle [2002]. It was, however, clear that these differences within each sample were not as great as had been expected, given the considerable differences in training and education level of the different parts of the samples. In order to investigate this question further we have analysed the data of each country that has a large enough sample, cross-tabulating the tasks, hazards and contacts with education level. Since it was not possible easily to equate the level of safety training in each country, we have concentrated mainly on the highest education level reached. So far the analyses have been limited to comparisons of the total percentage of each group carrying out a task, etc., without taking any account of any possible differences in the frequency with which this occurred. The UK sample was only of the more highly qualified professionals, and has therefore not been included. The German data were only available aggregated and the country was also left out. Finland seemed to have a profile which was too different from other countries to be analysed and several countries did not have large enough samples to analyse meaningfully. We have ended up analysing the data in this way for Austria, Australia, Italy, Netherlands, Singapore and Switzerland We hypothesised that those with higher education levels would be more often involved in policy making tasks, with contact with top management, with budgeting and cost-benefit analysis, that they would be more concerned with tasks involving safety management and culture and organisational change, with design review and national standardisation, that they would publish more, have more links to international colleagues and be more likely to manage other safety staff. We also hypothesised that they would be less concerned with monitoring and compliance checking, operational tasks like record keeping, fire brigade membership, emergency drills, personal protective equipment (PPE) and communication at shop floor and first-line supervisor level. The analyses show that remarkably few of these hypotheses are confirmed. For Austria, Australia and Italy practically no statistically significant differences in profiles were found between higher (bachelors level or higher) and lower level professionals in their task
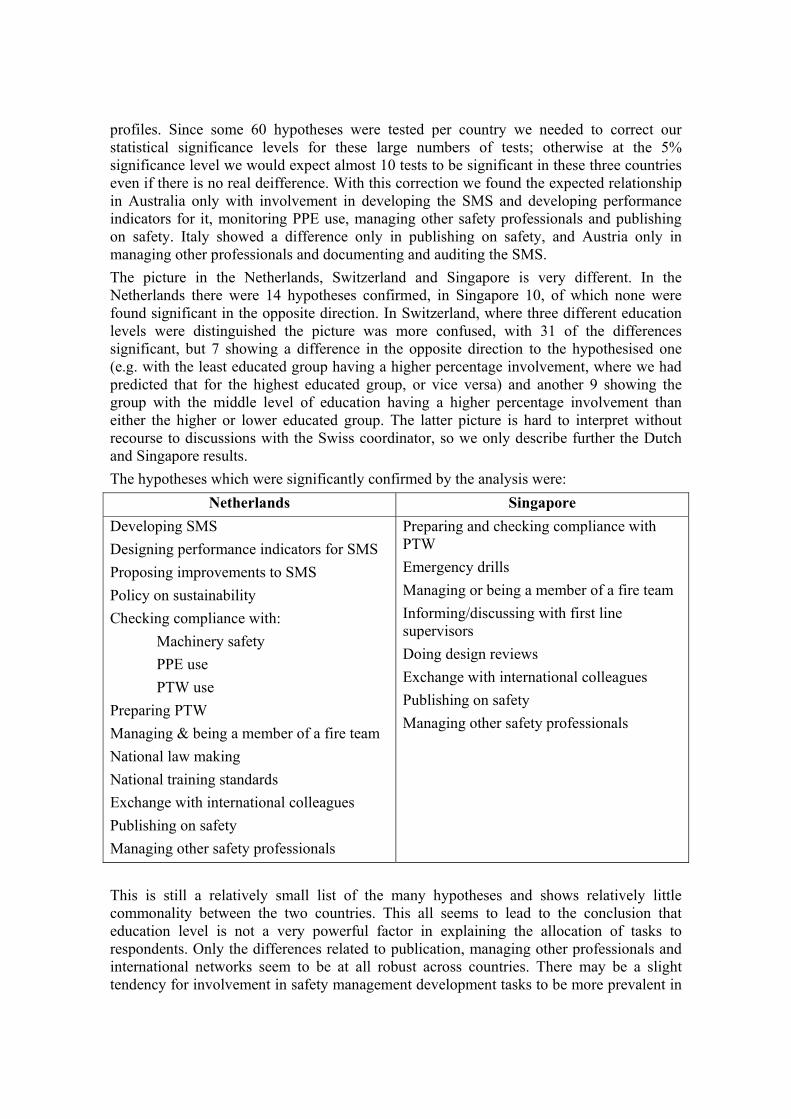
profiles. Since some 60 hypotheses were tested per country we needed to correct our statistical significance levels for these large numbers of tests; otherwise at the 5% significance level we would expect almost 10 tests to be significant in these three countries even if there is no real deifference. With this correction we found the expected relationship in Australia only with involvement in developing the SMS and developing performance indicators for it, monitoring PPE use, managing other safety professionals and publishing on safety. Italy showed a difference only in publishing on safety, and Austria only in managing other professionals and documenting and auditing the SMS. The picture in the Netherlands, Switzerland and Singapore is very different. In the Netherlands there were 14 hypotheses confirmed, in Singapore 10, of which none were found significant in the opposite direction. In Switzerland, where three different education levels were distinguished the picture was more confused, with 31 of the differences significant, but 7 showing a difference in the opposite direction to the hypothesised one (e.g. with the least educated group having a higher percentage involvement, where we had predicted that for the highest educated group, or vice versa) and another 9 showing the group with the middle level of education having a higher percentage involvement than either the higher or lower educated group. The latter picture is hard to interpret without recourse to discussions with the Swiss coordinator, so we only describe further the Dutch and Singapore results. The hypotheses which were significantly confirmed by the analysis were:
Netherlands Singapore Developing SMS Designing performance indicators for SMS Proposing improvements to SMS Policy on sustainability Checking compliance with:
Machinery safety PPE use PTW use
Preparing PTW Managing & being a member of a fire team National law making National training standards Exchange with international colleagues Publishing on safety Managing other safety professionals
Preparing and checking compliance with PTW Emergency drills Managing or being a member of a fire team Informing/discussing with first line supervisors Doing design reviews Exchange with international colleagues Publishing on safety Managing other safety professionals
This is still a relatively small list of the many hypotheses and shows relatively little commonality between the two countries. This all seems to lead to the conclusion that education level is not a very powerful factor in explaining the allocation of tasks to respondents. Only the differences related to publication, managing other professionals and international networks seem to be at all robust across countries. There may be a slight tendency for involvement in safety management development tasks to be more prevalent in
the higher educated group, but this is a weak relationship. When we look at the hazards and contacts we find a similar picture of few statistically significant differences in Italy and Austria, rather more in Australia and Singapore and many in the Netherlands and Switzerland (with the latter difficult to interpret). The differences are more in the contact network than in the hazards dealt with. A summary of the significant differences in contact network found in more than one country is as follows. Higher educated professionals have more contact with:
• Occupational hygienists (Au, CH, S) • Ergonomists (Au, NL) • Lawyers (AU, NL, CH, S) • Inspectors (CH, S) • National policy makers (Au, NL)
In Au, NL, CH and S the network of the higher educated is also significantly more extensive in total Again, this is not a rich harvest from the many hypotheses and confirms the conclusion above that education level does not seem to be a major determinant of roles and tasks. This is perhaps surprising for a professional group, since our picture of professions is that they are stratified by qualification level, or have a much narrow qualification range than is found in all of the countries surveyed The factor analysis of the data is only just beginning, Taking countries as units we can discern, as might be expected that the UK, Australia and Singapore, given their common regulatory history, seem to have a relatively close relationship and that the continental European countries cluster. Much more work is need to develop and interpret this part of the analysis and to carry out work looking at factors within the tasks, hazards and contacts. Even some simple cross-tabulation analysis remains to be looked at, e.g. by industry, internal vs. external appointment, size of company and age and experience of the professional. 5. CONCLUSIONS This international study of the tasks of the safety professional is now showing some interesting results. There is a clear core of tasks and hazards emerging, which is dealt with by safety professionals across all of the countries for which we have results. This is a clear indication that there is an international profession of safety. It has 43 tasks, 15 hazards and 15 contacts which are dealt with by more than 60% of respondents in eight or more of the 12 countries surveyed. Around this lie more potential core tasks in the list of those performed by more than 60% in three to seven of the countries. This core covers particularly the technical and mechanical hazards which stem from the origins of the safety profession. Human factors and safety management tasks have joined that core in most countries, but not (yet) all. Intensive contact with the workforce, line management and top management, but also with the government inspectorate is also found everywhere. The data also confirm earlier studies that many safety professionals deal with the areas of occupational hygiene and ergonomics as well as workplace safety. The presence in the core tasks of many related to human behaviour and human error and the influences on it underlines the importance of this topic to the safety professional. However it also raises the question as to how this topic is treated both in training and practice. We have had to grow away from the old tendency to blame the victim and look for shop-floor
behavioural change as the basis for safety improvement. The emphasis in the literature and philosophy the past decades has been on involvement with workplace improvement, design and management. A more recent step has been to concentrate again on the whole workforce, including managers in the form of cultural improvements, but predicated on the requirement that the safe workplace has already been achieved and behaviour is the final frontier. It is all too easy for the concern with safety culture to reflect the old tendencies and not the achievement of the second step and the move to the third. We see from this survey that the first development, towards design and safety management, has still to permeate fully into the international scene, particularly into Eastern Europe, but also into Southern Europe. It has come furthest in the Anglo-Saxon countries (Au, S, UK), but even here involvement with design, with maintenance, with cost-benefit is limited. The great emphasis on safety culture in the task profile therefore needs to be viewed with some scepticism as to whether it is correctly oriented. Our finding that education level is not a major determinant of job content is one which requires much further analysis and thought. It seems to sketch either a non-elitist profession, in which those from different education levels can carry out the same tasks, or a gap between training and function which needs addressing urgently. We shall concentrate future analysis on resolving this question. Another question in the minds of the developers of this survey was the extent to which safety professionals in practice are involved with related areas such as the external environment, insurance risk management, product safety and particularly the areas of the working environment often ranked under occupational hygiene, ergonomics and social and physical well-being. This survey shows that the first three areas are peripheral to most safety professionals in most countries. The last three, and particularly occupational hygiene and ergonomics are, however, core areas of concern in the lives of the vast majority of safety professionals, making them broad generalists and not narrow specialists. REFERENCES
Bianchi, G. 2004. The tasks of safety professionals in Italy. Paper to the 3rd International Conference on Occupational Risk Protection, Santiago de Compostela, 2-4 June 2004.
Borys D., Else D, Pryor P, Sawyer N. 2005. Profile of an OHS professional in Australia and implications for achievement of the National OHS Strategy 2002-2012. Safety Institute of Australia Report. Gladstone Park Victoria. June 2005 67pp.
Brun, J and Loiselle, C. 2002. The roles, functions and activities of safety practitioners: the current situation in Quebec. Safety Science 2002, 40: 519-536.
Dudka, G. 2004. The role and tasks of safety professionals in Poland. Paper to the 3rd International Conference on Occupational Risk Protection, Santiago de Compostela, 2-4 June 2004.
Hale A.R. 2000. Culture’s confusions. Editorial for the Special issue on safety culture and safety climate. Safety Science. 34. 1-14
Hale, A.R, Bianchi G,, Dudka, G., Hameister, W., Jones, R., Perttula, P. & Ytrehus I. 2005. Surveying the role of safety professionals: objectives, methods & early results. Safety Science Monitor. 9 (1). http://www.monash.edu.au/muarc/ipso/vol9/index.html.
Hale, AR, & Ytrehus, I. 2004. Changing requirements for the safety profession: roles and tasks. Australian & New Zealand Journal of Occupational Health & Safety 20 (1), 23-35.
Jones, R. 2004, The role and tasks of OSH practitioners in the UK. Paper to the 2nd International Conference of the Working on Safety Network, Dresden 31 August – 3 September 2004.
Lang, R. 2004. Swiss results of the international ISSA/ENSHPO survey. Paper to the 2nd International Conference of the Working on Safety Network, Dresden 31 August – 3 September 2004.
Miguel, S., Arezes, P. & Lourinho, N. 2004. Tasks in the emerging safety profession in Portugal. Paper to the 2nd International Conference of the Working on Safety Network, Dresden 31 August – 3 September 2004.
Perttula, P. & Saari, J. 2004. Safety Practitioners’ tasks in Finland. Paper to the 2nd International Conference of the Working on Safety Network, Dresden 31 August – 3 September 2004.
Rillie R. 2005. A review of tasks carried out bu OHS professionals in Singapore – as part of a multinational study. M.Sc. Thesis. University of New South Wales. Sydney. School of Safety Science.
Ytrehus. I. 2003. The role and tasks of safety professionals in Norway and the Netherlands: a comparative study. Masters thesis. Norwegian University of Science & Technology, Trondheim, Dept of Industrial Economics & Technology Management.
21-3-2006
1
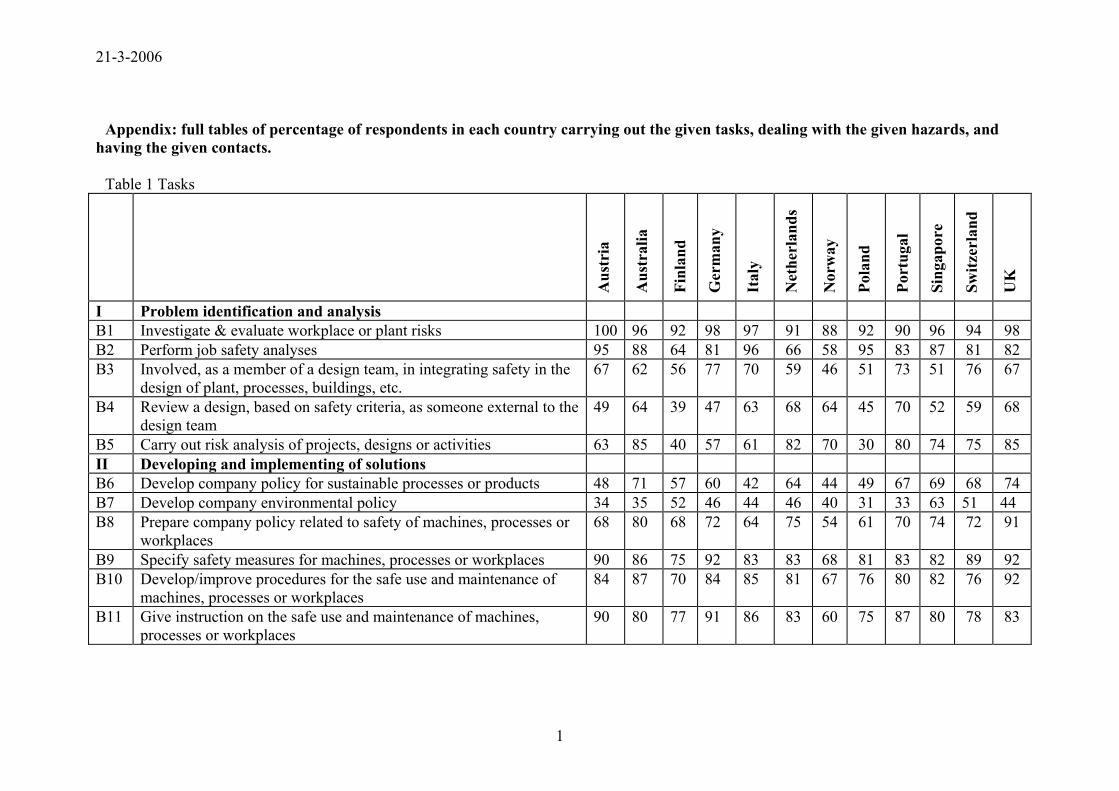
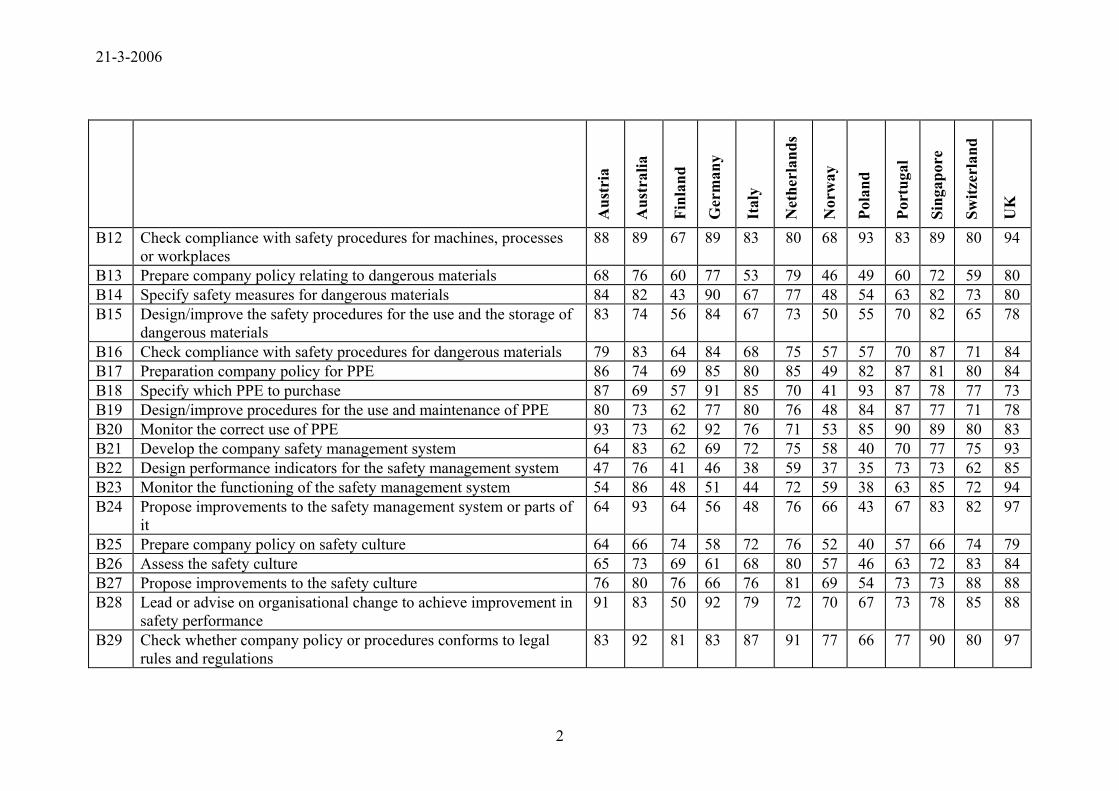
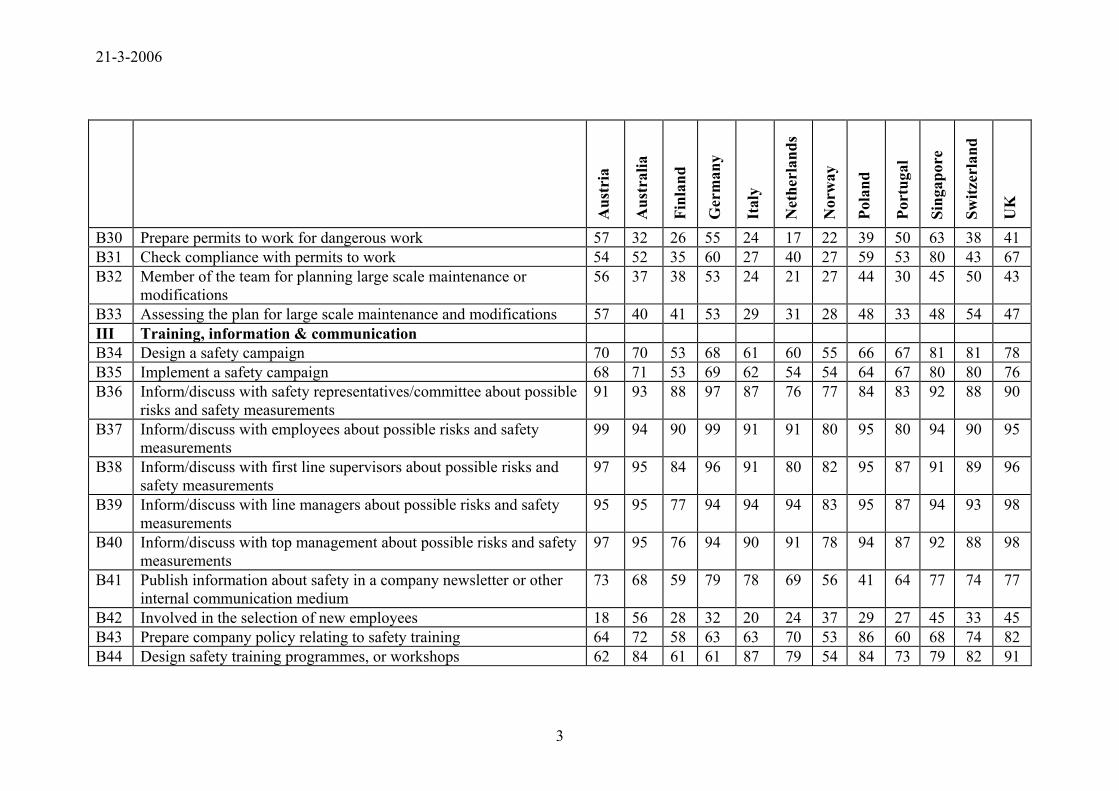
Appendix: full tables of percentage of respondents in each country carrying out the given tasks, dealing with the given hazards, and having the given contacts.
Table 1 Tasks
Aus
tria
Aus
tral
ia
Finl
and
Ger
man
y
Ital
y
Net
herl
ands
Nor
way
Pola
nd
Port
ugal
Sing
apor
e
Switz
erla
nd
UK
I Problem identification and analysis B1 Investigate & evaluate workplace or plant risks 100 96 92 98 97 91 88 92 90 96 94 98 B2 Perform job safety analyses 95 88 64 81 96 66 58 95 83 87 81 82 B3 Involved, as a member of a design team, in integrating safety in the
design of plant, processes, buildings, etc. 67 62 56 77 70 59 46 51 73 51 76 67
B4 Review a design, based on safety criteria, as someone external to the design team
49 64 39 47 63 68 64 45 70 52 59 68
B5 Carry out risk analysis of projects, designs or activities 63 85 40 57 61 82 70 30 80 74 75 85 II Developing and implementing of solutions B6 Develop company policy for sustainable processes or products 48 71 57 60 42 64 44 49 67 69 68 74 B7 Develop company environmental policy 34 35 52 46 44 46 40 31 33 63 51 44 B8 Prepare company policy related to safety of machines, processes or
workplaces 68 80 68 72 64 75 54 61 70 74 72 91
B9 Specify safety measures for machines, processes or workplaces 90 86 75 92 83 83 68 81 83 82 89 92 B10 Develop/improve procedures for the safe use and maintenance of
machines, processes or workplaces 84 87 70 84 85 81 67 76 80 82 76 92
B11 Give instruction on the safe use and maintenance of machines, processes or workplaces
90 80 77 91 86 83 60 75 87 80 78 83
21-3-2006
2
A
ustr
ia
Aus
tral
ia
Finl
and
Ger
man
y
Ital
y
Net
herl
ands
Nor
way
Pola
nd
Port
ugal
Sing
apor
e
Switz
erla
nd
UK
B12 Check compliance with safety procedures for machines, processes or workplaces
88 89 67 89 83 80 68 93 83 89 80 94
B13 Prepare company policy relating to dangerous materials 68 76 60 77 53 79 46 49 60 72 59 80 B14 Specify safety measures for dangerous materials 84 82 43 90 67 77 48 54 63 82 73 80 B15 Design/improve the safety procedures for the use and the storage of
dangerous materials 83 74 56 84 67 73 50 55 70 82 65 78
B16 Check compliance with safety procedures for dangerous materials 79 83 64 84 68 75 57 57 70 87 71 84 B17 Preparation company policy for PPE 86 74 69 85 80 85 49 82 87 81 80 84 B18 Specify which PPE to purchase 87 69 57 91 85 70 41 93 87 78 77 73 B19 Design/improve procedures for the use and maintenance of PPE 80 73 62 77 80 76 48 84 87 77 71 78 B20 Monitor the correct use of PPE 93 73 62 92 76 71 53 85 90 89 80 83 B21 Develop the company safety management system 64 83 62 69 72 75 58 40 70 77 75 93 B22 Design performance indicators for the safety management system 47 76 41 46 38 59 37 35 73 73 62 85 B23 Monitor the functioning of the safety management system 54 86 48 51 44 72 59 38 63 85 72 94 B24 Propose improvements to the safety management system or parts of
it 64 93 64 56 48 76 66 43 67 83 82 97
B25 Prepare company policy on safety culture 64 66 74 58 72 76 52 40 57 66 74 79 B26 Assess the safety culture 65 73 69 61 68 80 57 46 63 72 83 84 B27 Propose improvements to the safety culture 76 80 76 66 76 81 69 54 73 73 88 88 B28 Lead or advise on organisational change to achieve improvement in
safety performance 91 83 50 92 79 72 70 67 73 78 85 88
B29 Check whether company policy or procedures conforms to legal rules and regulations
83 92 81 83 87 91 77 66 77 90 80 97
21-3-2006
3
A
ustr
ia
Aus
tral
ia
Finl
and
Ger
man
y
Ital
y
Net
herl
ands
Nor
way
Pola
nd
Port
ugal
Sing
apor
e
Switz
erla
nd
UK
B30 Prepare permits to work for dangerous work 57 32 26 55 24 17 22 39 50 63 38 41 B31 Check compliance with permits to work 54 52 35 60 27 40 27 59 53 80 43 67 B32 Member of the team for planning large scale maintenance or
modifications 56 37 38 53 24 21 27 44 30 45 50 43
B33 Assessing the plan for large scale maintenance and modifications 57 40 41 53 29 31 28 48 33 48 54 47 III Training, information & communication B34 Design a safety campaign 70 70 53 68 61 60 55 66 67 81 81 78 B35 Implement a safety campaign 68 71 53 69 62 54 54 64 67 80 80 76 B36 Inform/discuss with safety representatives/committee about possible
risks and safety measurements 91 93 88 97 87 76 77 84 83 92 88 90
B37 Inform/discuss with employees about possible risks and safety measurements
99 94 90 99 91 91 80 95 80 94 90 95
B38 Inform/discuss with first line supervisors about possible risks and safety measurements
97 95 84 96 91 80 82 95 87 91 89 96
B39 Inform/discuss with line managers about possible risks and safety measurements
95 95 77 94 94 94 83 95 87 94 93 98
B40 Inform/discuss with top management about possible risks and safety measurements
97 95 76 94 90 91 78 94 87 92 88 98
B41 Publish information about safety in a company newsletter or other internal communication medium
73 68 59 79 78 69 56 41 64 77 74 77
B42 Involved in the selection of new employees 18 56 28 32 20 24 37 29 27 45 33 45 B43 Prepare company policy relating to safety training 64 72 58 63 63 70 53 86 60 68 74 82 B44 Design safety training programmes, or workshops 62 84 61 61 87 79 54 84 73 79 82 91
21-3-2006
4
A
ustr
ia
Aus
tral
ia
Finl
and
Ger
man
y
Ital
y
Net
herl
ands
Nor
way
Pola
nd
Port
ugal
Sing
apor
e
Switz
erla
nd
UK
B45 Give safety training programmes, courses or workshops 67 87 57 70 87 85 66 94 83 90 89 93 B46 Keep records of employees safety training 69 55 40 73 74 22 37 84 50 61 63 47 IV Inspection and research B47 Investigate accidents or incidents 93 86 70 96 79 89 66 97 73 84 84 93 B48 Investigate environmental incidents 42 41 35 55 51 43 45 61 27 63 42 45 B49 Keep statistics about accidents and incidents 77 67 58 87 67 67 55 95 63 78 67 72 B50 Keep statistics about sickness absence 30 21 29 49 20 15 26 26 17 39 36 24 B51 Make recommendations for improvement arising out of
investigations 78 86 78 84 69 88 70 62 73 84 81 94
B52 Conduct workplace inspections of physical prevention measures 73 88 60 95 64 86 63 95 80 94 88 93 B53 Conduct workplace audits of safe behaviour 69 76 65 79 68 80 51 77 70 80 82 80 B54 Conduct audits of the safety management system 45 87 48 57 38 75 53 40 60 82 73 92 V Emergency procedures and settlement of damage B55 Prepare company policy on emergency procedures, intervention and
first aid 82 72 61 84 79 70 49 73 63 73 73 81
B56 Prepare company policy on insurance and compensation 23 32 20 62 19 21 11 31 27 22 26 23 B57 Design/improve emergency procedures 84 72 60 82 87 66 57 65 70 84 76 82 B58 Organize practice of emergency procedures 74 50 40 67 74 54 47 39 50 80 56 55 B59 Manage a company fire fighting team 9 17 9 8 50 11 25 9 43 54 13 11 B60 Be a member of the company fire fighting team 8 14 6 7 32 9 27 16 17 50 16 8 B61 Give first aid courses 55 10 34 55 29 5 20 34 43 25 42 7 B62 Advise employer or employee about damage or injury claims 32 57 33 45 23 28 18 77 37 41 19 69 B63 Act as expert witness in legal cases or claims 16 28 10 13 36 21 10 19 13 17 15 25
21-3-2006
5
A
ustr
ia
Aus
tral
ia
Finl
and
Ger
man
y
Ital
y
Net
herl
ands
Nor
way
Pola
nd
Port
ugal
Sing
apor
e
Switz
erla
nd
UK
VI Regulatory tasks B64 Involved with making national/regional or industry wide safety laws
and rules 19 30 19 22 14 22 23 16 33 27 33 28
B65 Be a member of a standards committee for product safety 4 11 2 4 4 5 5 2 13 17 7 9 B66 Be a member of a standards committee for safety competence or
skills 5 14 3 6 5 7 9 6 20 26 8 19
B67 Be a member of a standards committee for safety management systems
3 17 1 4 2 10 8 7 23 29 8 21
B68 Take part in designing guidance or standards for safety courses or training at national or industry level
9 22 14 8 12 15 16 13 67 24 18 32
B69 Take part in the design and implementation of safety campaigns at national or industry level
8 22 18 8 8 10 15 6 53 22 22 26
B70 Advise on insurance premiums for a workplace or company 6 22 13 21 5 3 6 17 13 8 12 11 B71 Advise on damage claims 8 24 14 23 6 16 8 13 33 10 9 32 B72 Answer questions from the public about safety 25 41 19 36 58 25 42 70 23 22 42 47 VII Knowledge management B73 Read professional safety literature 99 100 96 100 100 100 96 100 93 94 100 100 B74 Attend courses or workshops about safety subjects 99 98 89 99 100 97 94 94 87 96 99 99 B75 Exchange knowledge and practical experiences with colleagues at
local or national level 96 96 62 97 94 97 92 84 93 94 97 98
B76 Exchange knowledge and practical experience with colleagues at international level
47 40 21 28 31 39 51 9 73 65 49 41
B77 Publish on safety in the professional or scientific literature 12 25 11 15 15 20 25 5 47 30 28 23
21-3-2006
6
A
ustr
ia
Aus
tral
ia
Finl
and
Ger
man
y
Ital
y
Net
herl
ands
Nor
way
Pola
nd
Port
ugal
Sing
apor
e
Switz
erla
nd
UK
B78 Document the safety management system 47 74 30 43 30 55 45 32 57 72 58 78 VIII Management & Financial B79 Manage other safety or working conditions professionals 31 47 28 42 48 37 46 31 40 41 46 58 B80 Prepare (parts of) an annual plan for safety 61 71 80 64 68 77 64 72 47 73 72 80 B81 Prepare (parts of) an annual report on safety 67 64 48 72 60 75 63 82 73 70 71 77 B82 Advise on/make the budget for safety 38 45 45 44 43 44 47 45 57 58 59 51 B83 Carry out cost-benefit analyses of safety measures or policies 38 47 20 36 33 41 41 43 50 43 54 50
21-3-2006
7
Table 2. Hazards
Aus
tria
Aus
tral
ia
Finl
and
Ger
man
y
Ital
y
Net
herl
ands
Nor
way
Pola
nd
Port
ugal
Sing
apor
e
Switz
erla
nd
UK
C1 Lighting 94 79 74 94 77 78 52 89 76 70 78 89 C2 Cold or heat 92 78 82 91 80 78 56 69 60 48 80 90 C3 Noise 93 86 76 97 85 89 61 91 67 85 86 90 C4 Vibration 63 65 47 79 57 69 42 50 37 52 56 71 C5 Toxic and carcinogenic substances 63 75 54 90 66 82 50 56 50 71 76 83 C6 Biological risks 32 66 35 86 50 61 23 19 23 37 44 67 C7 Other occupational disease 55 70 52 77 51 57 47 39 50 61 73 76 C8 Ionising radiation 29 40 19 78 33 47 20 22 30 39 42 42 C9 Non-ionising radiation 28 45 19 78 51 52 20 30 37 46 50 53 C10 Fire 83 77 61 87 92 86 76 45 80 81 77 91 C11 Explosion 63 60 28 83 56 77 58 33 67 70 69 62 C12 Electricity 89 83 60 90 85 86 60 76 77 79 80 92 C13 Machinery and installations 92 84 71 97 88 91 68 86 77 77 90 91 C14 Vehicles 82 83 61 89 73 75 56 75 50 66 75 90 C15 Human errors 94 89 79 96 79 91 78 74 70 83 90 94 C16 Subsidence and Collapses 40 37 22 39 32 38 30 83 30 43 41 41 C17 Falls 91 87 60 95 82 89 62 52 73 81 86 95 C18 Lifting 95 93 75 96 87 85 63 83 73 87 92 96 C19 Working posture 96 92 86 93 91 85 61 73 83 81 92 94 C20 Other physical workload 84 89 77 85 64 82 58 67 73 76 80 88 C21 VDUs 96 85 79 95 90 81 45 79 70 56 85 94 C22 Mental workload/Stress 76 82 86 76 58 58 61 44 57 41 72 80
21-3-2006
8
A
ustr
ia
Aus
tral
ia
Finl
and
Ger
man
y
Ital
y
Net
herl
ands
Nor
way
Pola
nd
Port
ugal
Sing
apor
e
Switz
erla
nd
UK
C23 Bullying and harassment 44 68 66 57 14 41 43 2 7 21 44 48 C24 Violence against employees 24 59 35 64 11 37 25 9 7 21 33 58 C25 Alcohol or drugs 59 69 61 69 23 37 34 24 33 30 56 58 C26 Environmental pollution 48 49 31 72 64 56 51 39 33 75 59 51 C27 Sustainability of production or products 42 26 37 62 25 39 17 45 23 23 40 29 C28 Product liability 25 25 32 52 17 50 21 19 27 22 38 25 C29 Road/transport safety 65 63 54 87 38 45 44 59 37 63 65 79 C30 Accidents to patients, passengers, students or other clients 39 59 38 56 25 43 29 20 20 41 38 66 C31 External safety 48 61 54 36 46 61 36 18 27 54 46 71
21-3-2006
9
Table 3. Contacts
Aus
tria
Aus
tral
ia
Finl
and
Ger
man
y
Ital
y
Net
herl
ands
Nor
way
Pola
nd
Port
ugal
Sing
apor
e
Switz
erla
nd
UK
D1 Occupational hygienist 28 69 40 31 50 83 51 59 33 46 54 59 D2 Occupational physician 99 65 89 98 91 85 67 92 77 48 60 69 D3 Ergonomist 41 73 59 32 26 64 52 16 20 29 50 46 D4 Work & organization psychologist 33 44 33 24 15 38 25 16 17 14 35 20 D5 Other medical specialists 31 60 68 59 34 28 32 53 17 45 68 49 D6 Visitors 68 86 75 74 64 73 67 78 63 80 69 88 D7 Employees 97 98 95 99 98 97 88 98 83 97 93 98 D8 Line management 84 98 94 90 98 99 93 95 87 95 90 99 D9 Top management 98 98 88 97 92 96 90 95 87 93 90 99 D10 Works council or equivalent 95 59 64 93 77 86 77 88 50 46 75 78 D11 Quality department 71 61 53 74 73 72 66 60 60 64 74 61 D12 Technical/maintenance service 95 87 77 93 94 90 80 87 83 85 85 88 D13 Personnel department 89 88 77 91 84 86 73 97 77 83 87 91 D14 Financial division 59 74 66 65 79 62 63 79 47 64 70 75 D15 Lawyer 57 66 39 56 69 52 40 78 37 32 47 68 D16 Designer 19 55 59 82 82 60 28 35 53 29 75 66 D17 Company planner 27 45 22 42 59 48 27 38 47 33 41 51 D18 Environmental expert 58 54 57 71 67 70 54 70 37 57 58 63 D19 Policy maker in Ministry 15 26 26 47 29 34 75 14 33 40 75 21 D20 Policy maker or planner in local authority 32 26 34 55 79 37 72 18 30 36 54 36 D21 Government inspector (national, local) 96 84 81 95 89 61 88 93 60 73 84 82 D22 Working conditions service* 37 - 57 23 46 87 72 50 53 73 - -
21-3-2006
10
A
ustr
ia
Aus
tral
ia
Finl
and
Ger
man
y
Ital
y
Net
herl
ands
Nor
way
Pola
nd
Port
ugal
Sing
apor
e
Switz
erla
nd
UK
D23 Standards body 32 40 19 15 29 35 32 10 57 52 24 39 D24 Certification body 39 51 32 40 50 66 45 23 53 63 47 45 D25 Industry federation 32 48 - 42 63 65 58 13 53 44 37 52 D26 Professional association 46 83 60 63 65 76 55 28 47 72 47 90 D27 Employers’ federation 28 45 45 24 55 26 39 6 47 28 24 43 D28 Trade-union official (local or national) 43 65 68 34 55 21 66 22 27 26 30 68 D29 Insurer 26 53 61 49 33 33 40 26 30 28 48 67 D30 Inspector (social) insurer* 13 - 27 85 39 14 27 77 23 26 96 27 D31 Safety officers of other organizations 45 95 57 93 77 93 82 77 63 89 84 95 D32 Safety Committee or safety representative* 45 95 95 97 88 86 87 80 67 94 58 92 D33 External safety consultant 46 84 54 40 83 50 68 25 43 76 62 77 D34 Educational establishment 62 72 62 72 35 42 70 52 47 44 64 74 D35 People living around the company 35 29 36 29 27 23 32 26 27 39 30 46 D36 Local fire service 73 45 65 69 76 51 56 63 53 64 50 72 * The wording of these was changed per country to fit the prevailing system, or in some cases the row was left blank, since not all have working conditions services, or social insurers with inspectors