
SOME FACTORS INFLUENCING THE TURBIDITY OF WATER ...
107
SOME FACTORS INFLUENCING THE TURBIDITY OF WATER COLLECTED BY RIVER INTAKES by William J. Cosgrove, B.Eng. A thesis submitted to the Faculty of Graduate Studies and Research in partial fulfilment of the requirements for the degree of Master of Engineering. Department of Civil Engineering, McGill University, Montrea.l. April 1962
-
Upload
khangminh22 -
Category
Documents
-
view
0 -
download
0
Transcript of SOME FACTORS INFLUENCING THE TURBIDITY OF WATER ...

SOME FACTORS INFLUENCING THE TURBIDITY OF
WATER COLLECTED BY RIVER INTAKES
by
William J. Cosgrove, B.Eng.
A thesis submitted to the Faculty of Graduate Studies and Research in partial fulfilment of the requirements for the degree of Master of Engineering.
Department of Civil Engineering, McGill University, Montrea.l. April 1962
TABLE OF CONTENTS
CHAPT ER 1 - PREVIOUS WORK... • • • • • . • • • • • • • • • • • • • • • • • 1
CHAPTER 11- OBJECT OF EXPERIMENT •••••.••••••••••••• 6
CHAPTER 111- APP ARA TUS • • • • • • • • • • • • • • • • • • • • • • • • • • • • • • 8
CHAPTER lV - PROCEDUR.E. • • • • • • • • • • • • • • • • • • • • • • • • • • • • • 20
CHAPTER V- OBSERVATIONS ••••••••••••••••••••••••••• 30
CHAPTER Vl- DISCUSSION OF RESULTS •••••••••••••••••• 70
CHAPTER Vll- CONCLUSIONS •••••••••••••••••••••••••• •. 99
APPENDIX -
( i)
PREFACE
The author wishes to express his sincere gratitude
to his Director of Research, Professer Andrejs Pakalnins,
Department of Civil Engineering and Applied Mechanics,McGill
University for his encouragement and helpful supervision;
to Professer V.W.G. Wilson, also of the Department of Civil
Engineering, for his advice on modifications to the apparatus
and for the assistance of his staff in the erection thereof;
to Mr. Curtis Meyer B.Agr.Eng., for his assistance in pre
paring the apparatus and throughout the sampling.
Montreal, Quebec.
April, 1962.
William J. Cosgrove
1
CHAPTER 1
PREVIOUS WORK
During the month of August, 1957, Mr. Robert J.
Lindsay, a graduate student of the Civil Engineering
Department at McGill University, carried out experimenta
with Model River Intakes. The resulta of the experimenta
were submitted as his thesis entitled "The Details of Water
Intakes- Their Effect on the Turbidity of Water",presented
to the Faculty of Graduate Studies and Research of McGill
University in August, 1960.
The summarized object of the experimenta was to
determine:
"Primarily
That irrespective of particle theory, a reduction
in turbidity can be obtained by preferential positioning of
the mouth of an intake in relation to the direction of the
approaching current, and,
"Secondarily
The extent to which the theory of discrete
particle movement is applicable to such an investigation."
As a result of the experimenta it was concluded
2
that:
"Where turbulent conditions of flow exist adjacent
to an intake, the position of the mouth of the intake in
relation to the direction of the approaching current can
affect a reduction in the turbidity of the water withdrawn
from the source provided that the ratio between the intake
velocities and the velocity of the current be substantially
lesa than unity.
"The reduction in turbidity affected is a function
of both intake position and the ratio of these velocities,
and not of intake position alone; therefore, if suitably
modified, the theory of discrete particle movement is
applicable to the present investigation."
"The reduction in turbidity affected is inversely
proportional to the ratio between the intake velocity and
approaching current velocity irrespective of the position of
the intake.n
"The reduction in turbidity affected by an upstream
or downstream positioning of the intake is about three times
more than that produced when the intake is pla.ced straight
out and at 90° to the approaching current."
The first of these conclusions would appear to con
tradict the findings of Vito A. Vanoni who stated in 1946
that "When the sampling velocity is lower than the local
stream velocity, the fluid streamlines curve away from the
3
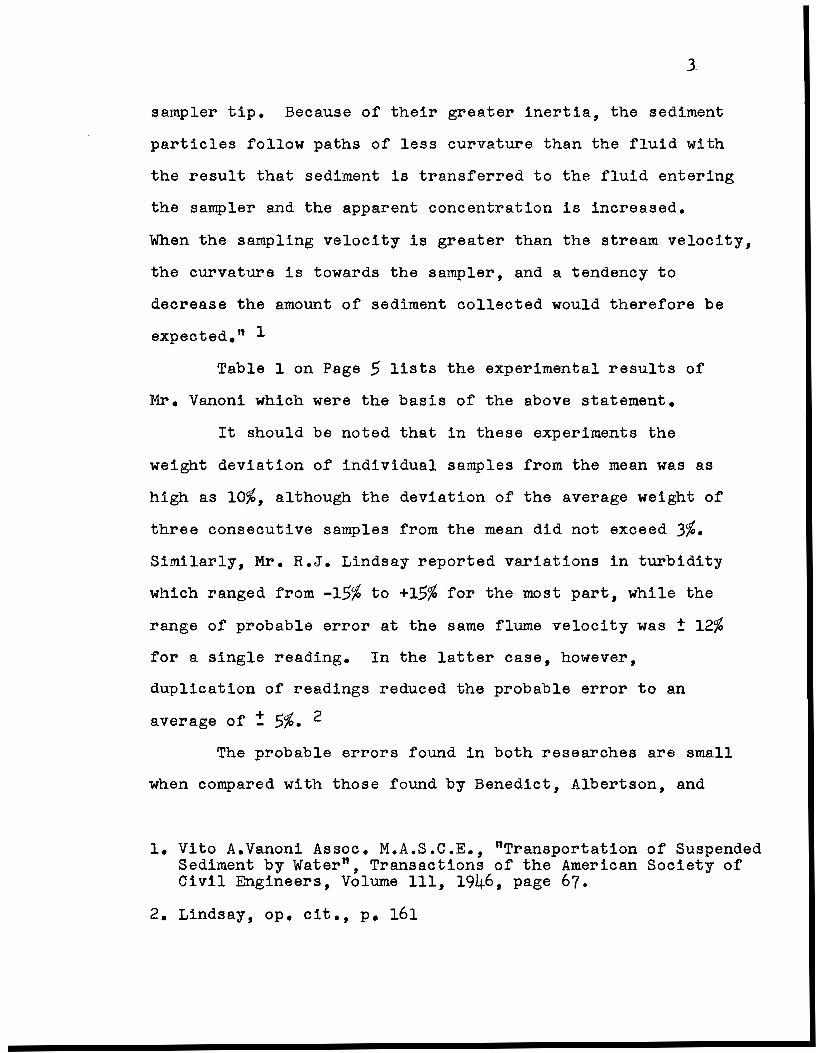
sampler tip. Because of their greater inertia, the sediment
particles follow paths of less curvature than the fluid with
the result that sediment is transferred to the fluid entering
the sampler and the apparent concentration is increased.
When the sampling velocity is greater than the stream velocity,
the curvature is towards the sampler, and a tendency to
decrease the amount of sediment collected would therefore be
expected.n 1
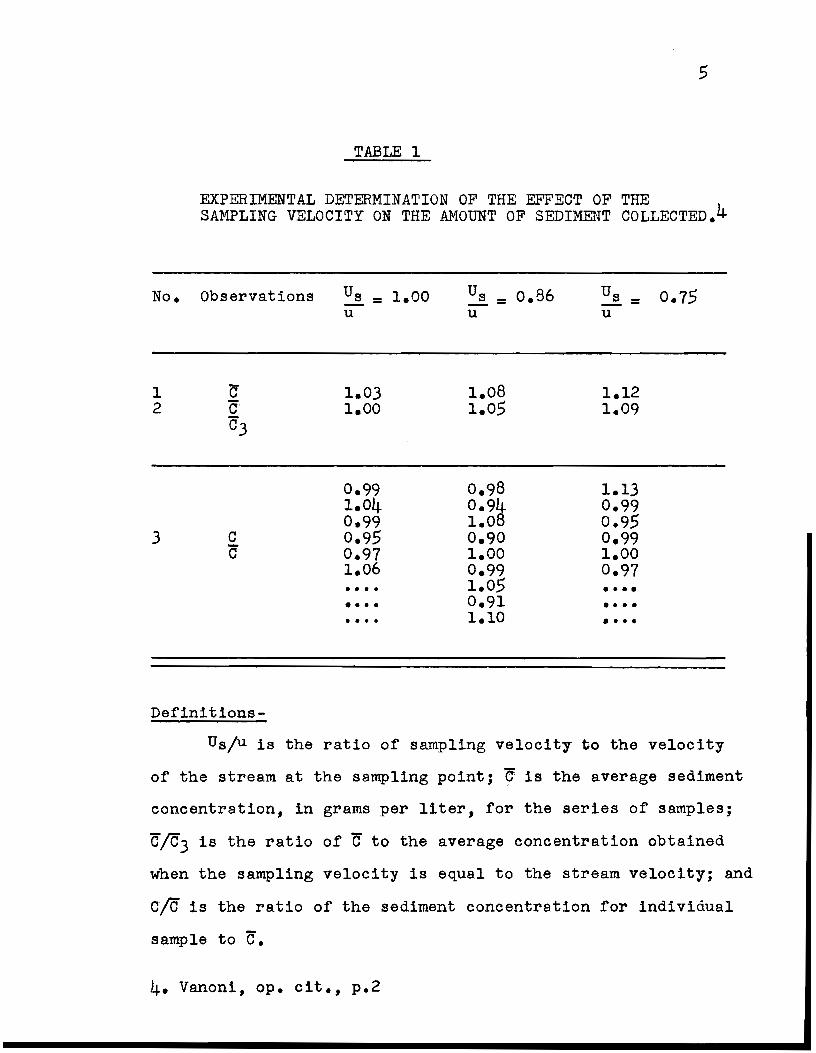
Table 1 on Page 5 lists the experimental resulta of
Mr. Vanoni which were the basis of the above statement.
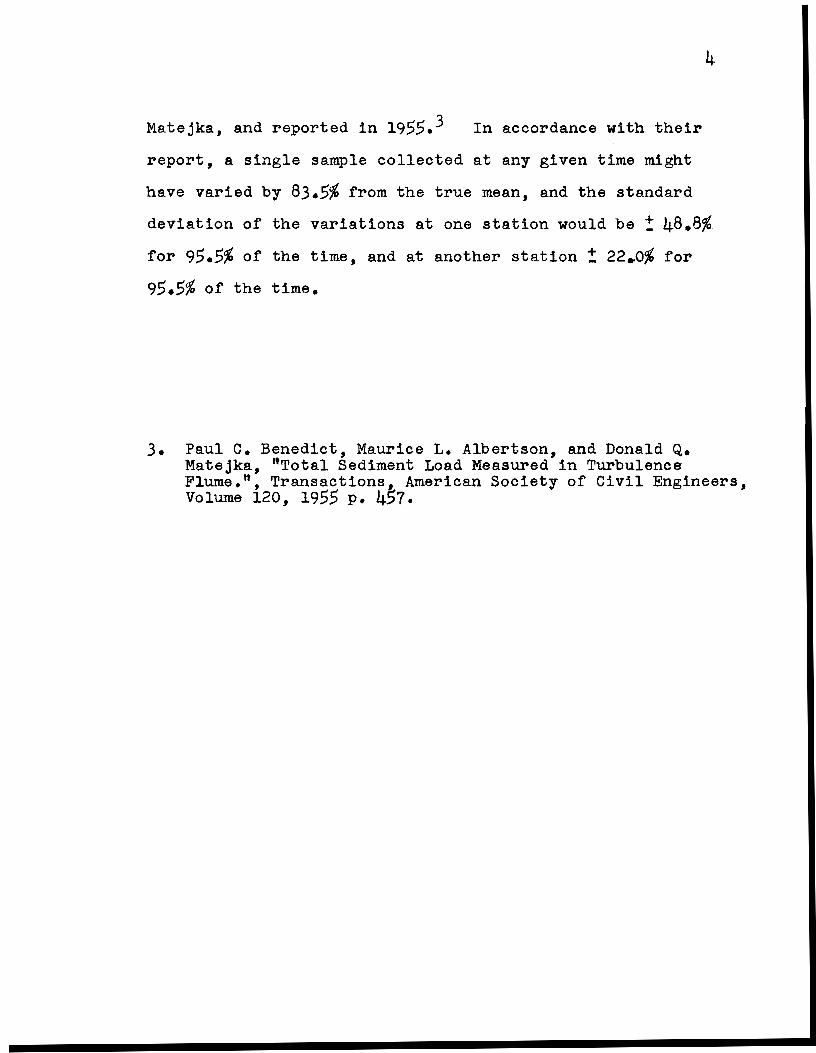
It should be noted that in these experimenta the
weight deviation of individual samples from the mean was as
high as 10%, although the deviation of the average weight of
three consecutive samples from the mean did not exceed 3%. Similarly, Mr. R.J. Lindsay reported variations in turbidity
which ranged from -15% to +15% for the most part, while the
range of probable error at the same flume velocity was ± 12% for a single reading. In the latter case, however,
duplication of readings reduced the probable error to an
average of ! 5%. 2
The probable errors found in both researches are small
when compared with those found by Benedict, Albertson, and
1. Vito A.Vanoni Assoc. M.A.S.C.E., "Transportation of Suspended Sediment by Water", Transactions of the American Society of Civil Engineers, Volume 111, 1946, page 67.
2. Lindsay, op. cit., P• 161
4
Matejka, and reported in 1955.3 In accordance with their
report, a single sample collected at any given time might
have varied by 83.5% from the true mean, and the standard
deviation of the variations at one station would be ! 48.8%
for 95.5% of the time, and at another station ! 22.0% for
95.5% of the time.
3. Paul c. Benedict, Maurice L. Albertson, and Donald Q. Matejka, "Total Sediment Load Measured in Turbulence Flume.", Transactions, American Society of Civil Engineers, Volume 120, 1955 p. 457.
5
TABLE 1
EXPERIMENTAL DETERMINATION OF THE ~~·~'ECT OF THE SAMPLING VELOCITY ON THE AMOUNT OF SEDIMENT COLLECTED.4
No. Observations
1 2
3 c ë
Definitions-
Us - 1.00 --u
0.99 1.04 0.99 0.95 0.97 1.06 •••• •••• • • • •
us - 0.86 --u
1.08 1.05
0.98 0.9~ 1.0 0.90 1.00 0.99 1.05 0.91 1.10
Us = 0.75 u
1.13 0.99 0.95 0.99 1.oo 0.97 • ••• • • • • ••••
Usju is the ratio of sampling velocity to the velocity
of the stream at the sampling point; ë is the average sediment
concentration, in grams per liter, for the series of samples;
cjë3 is the ratio of C to the average concentration obtained
when the sampling velocity is equal to the stream velocity; and
cjë is the ratio of the sediment concentration for individua1
sample to c.
4. Vanoni, op. cit., p.2
CHAPTER 11
OBJECT OF EXPERIMENT.
6
In view of the apparent confl.ict of the resulta obtained
by Messrs. R.J.Lindsay and V.A. Vanoni, and especially
taking into consideration the probable errors which are re
latively large when compared ta the variations in turbidity
determined, it wes concluded that future investigations
shauld be carried out in such a manner as ta reduce the pro
bable errors ta a minimum. Since the research of R.J.Lindsay
was directly concerned with water intakes, and since his
conclusions were based on a great many more observations than
those of Mr. Vanoni, it may be assumed that his conclusions
are more likely ta be correct for this specifie case, and an
attempt sbould be made ta verify them.
The intake mouthpiece used in the experiment of Mr.
Lindsay was of the same shape for all three positions in
vestigated. The intake mouthpiece had a port opening of an
area equal to 6.3 times the area of the int~ke conduit itself.
In arder ta determine whether the port velocity and the shape
of the mouthpiece itself influences the amount of turbidity
which is carried into the intake, a series of measurements
were made with a mouthpiece praviding a greatly reduced port
velocity.
7
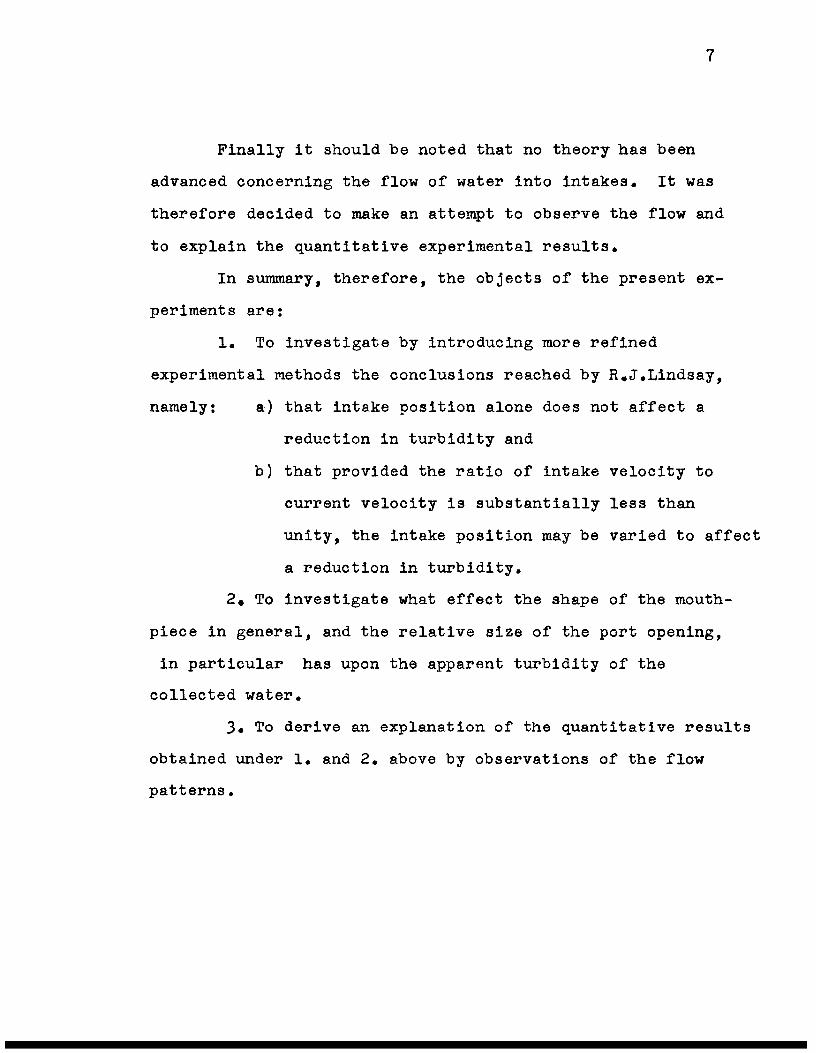
Finally it should be noted that no theory has been
advanced concerning the flow of water into intakes. It was
therefore decided to make an attempt to observe the flow and
to explain the quantitative experimental resulta.
In summary, therefore, the objecta of the present ex
perimenta are:
1. To investigate by introducing more refined
experimental methods the conclusions reached by R.J.Lindsay,
namely: a) that intake position alone does not affect a
reduction in turbidity and
b) that provided the ratio of intake velocity to
current velocity is substantially less than
unity, the intake position may be varied to affect
a reduction in turbidity.
2. To investigate what effect the shape of the mouth
piece in general, and the relative size of the port opening,
in particular has upon the apparent turbidity of the
collected water.
3. To derive an explanation of the quantitative results
obtained under 1. and 2. above by observations of the flow
patterns.
CHAPTER 111
APPARATUS
8
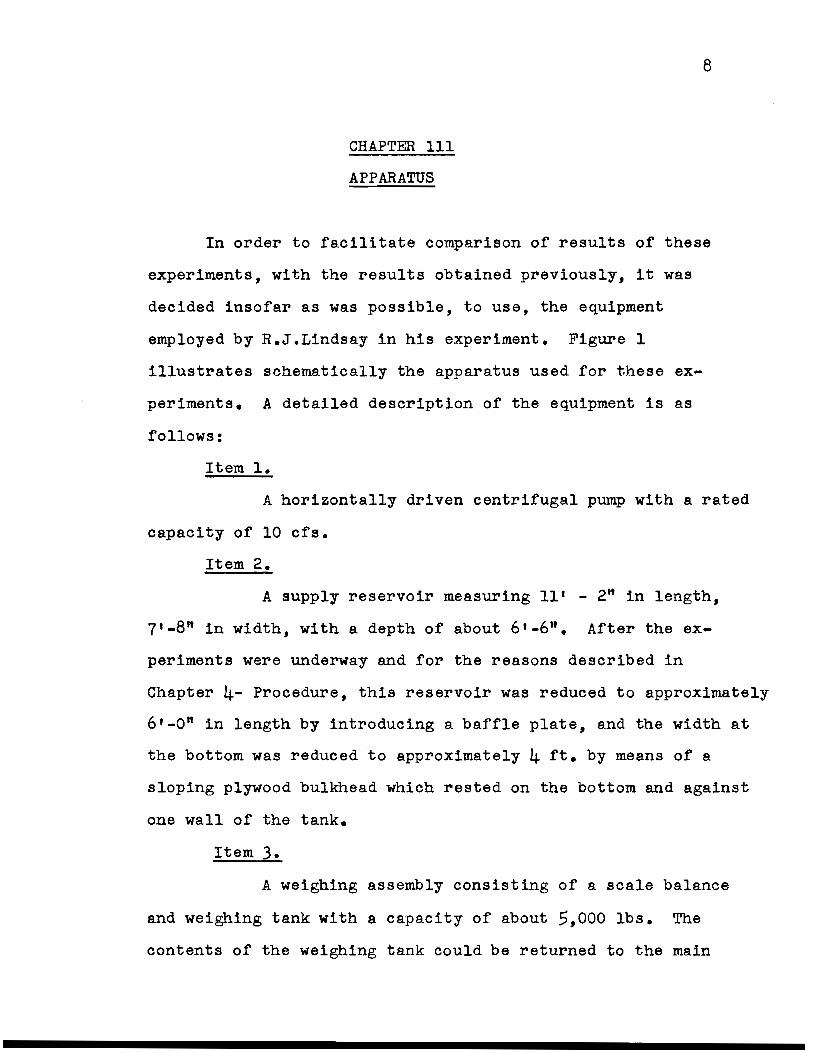
In order to facilitate comparison of resulta of these
experimenta, with the resulta obtained previously, it was
decided insofar as was possible, to use, the equipment
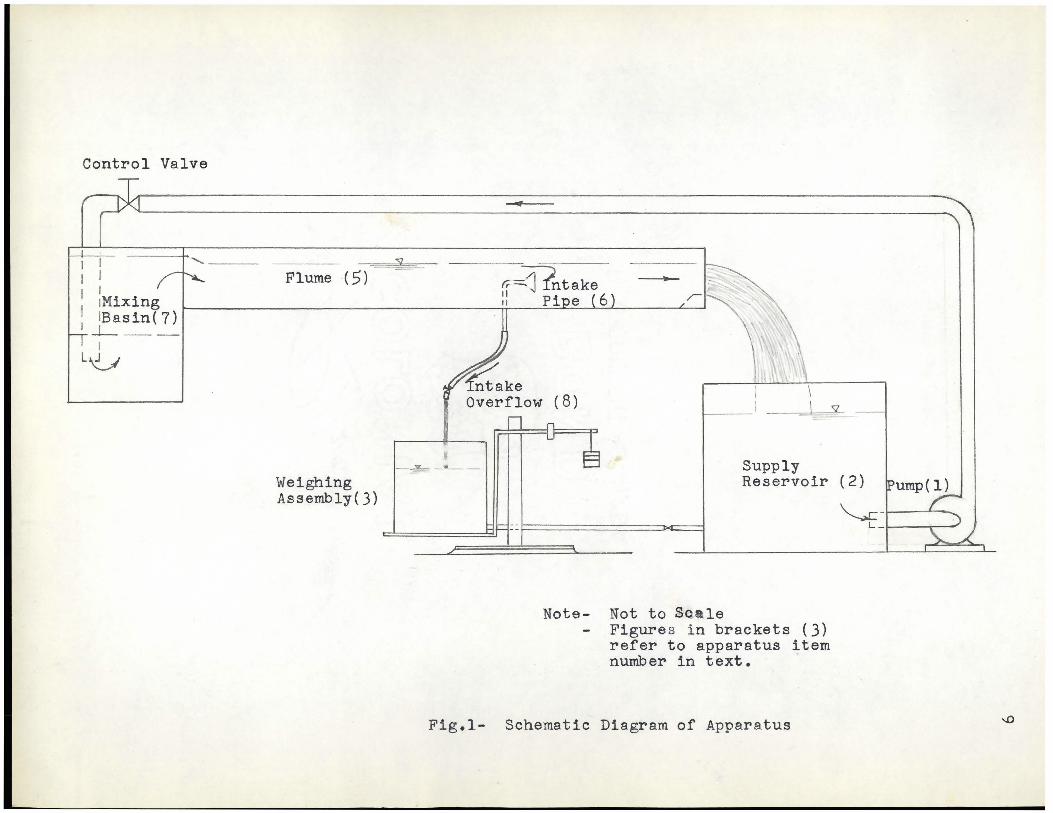
employed by R.J.Lindsay in his experiment. Figure 1
illustrates schematically the apparatus used for these ex
perimenta. A detailed description of the equipment ia as
followa:
Item 1.
A horizontally driven centrifugai pump with a rated
capacity of 10 cfa.
Item 2.
A aupply reservoir measuring 11 1 - 2" in length,
71 -8" in width, with a depth of about 6 1 -6". After the ex
perimenta were underway and for the reasons described in
Chapter 4- Procedure, this reservoir was reduced to approximately
61 -0" in length by introducing a baffle plate, and the width at
the bottom was reduced to approximately 4 ft. by means of a
sloping plywood bu1khead which rested on the bottom and against
one wall of the tank.
Item 3.
A weighing assembly consisting of a acale balance
and weighing tank with a capacity of about 5,000 lbs. The
contents of the weighing tank could be returned to the main
Control Valve
1 1Mixing IBasin( 7)
' ~--1 L~
......._ ___ _ Flume (5)
Weighing Assembly(3)
---"'-- -"'--
..
..
( 8)
~- . --1 ~
Supply ir (2) rump~ Reservo
L -
Note- Not to SQa le Figure s i n brackets (3) refer to apparatus item number in text.
Fig.l- Schematic Diagram of Apparatus ~
10
11
uJ l :J .J LL
12
reservoir through a connecting line.
Item 4. A steel-framed f1ume of rectangular cross section
which could be bulkheaded to form a receiving or mixing basin
of any desirable capacity and into which the effluent from the
overhead delivery line could be diverted. The steel flume,
being of very sturdy construction, could also be used to
support the test flume and receive any spillage therefrom
during the course of the experimenta.
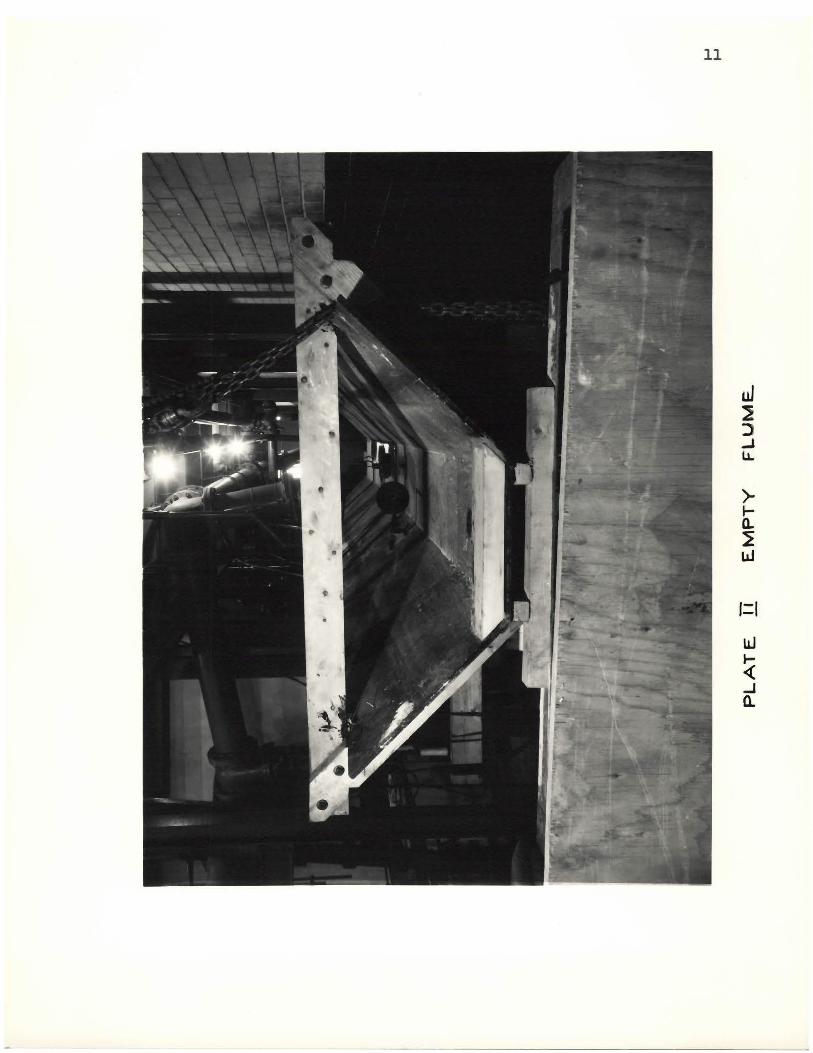
Item 5. Experimental flume. This was the same flume
which had been used by R. J. Lindsay in the experimenta pre
viously mentioned. This flume was of trapezoïdal cross
section having a bottom width of 1 1 - O", a top width of 3'-0"
and a depth of l'- O". It had originally been pre-fabricated
in two sections of 8 ft. lengths and assembled in the
laboratory. Afterwards, the flume was dismantled and stored
in the laboratory. It was re-assembled for the purpose of
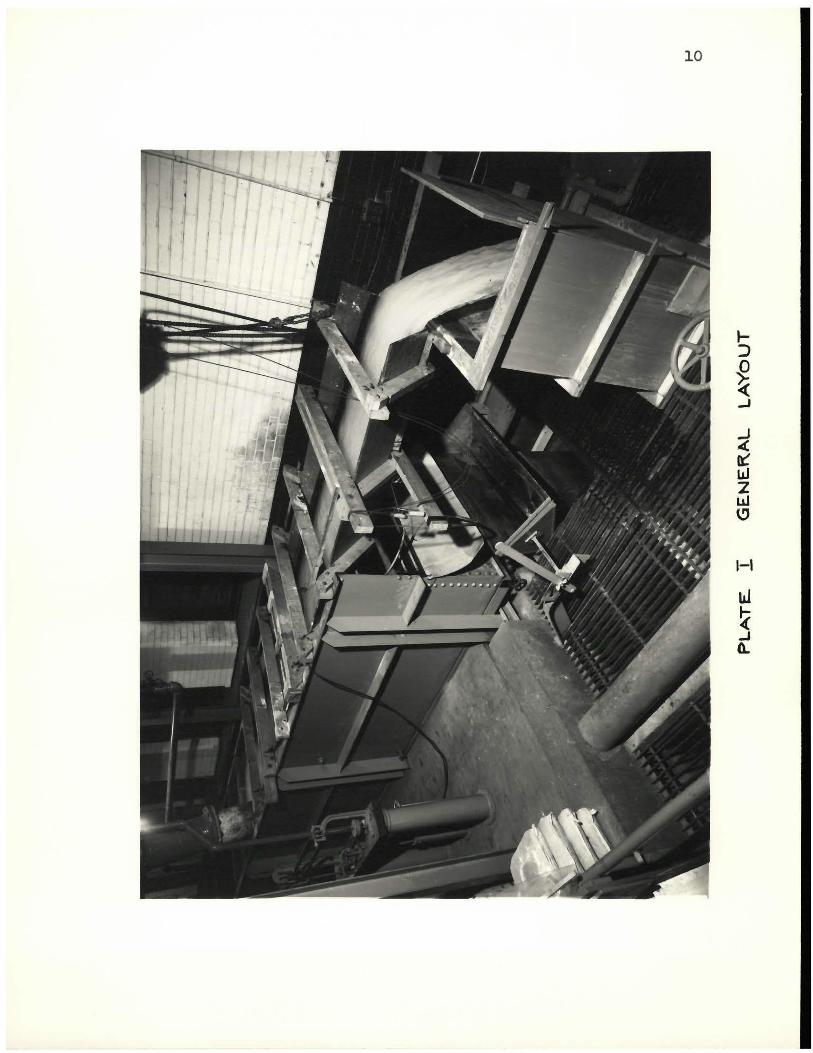
this experiment. Plates 1, 11 and lV illustrate various
aspects of the flume in position.
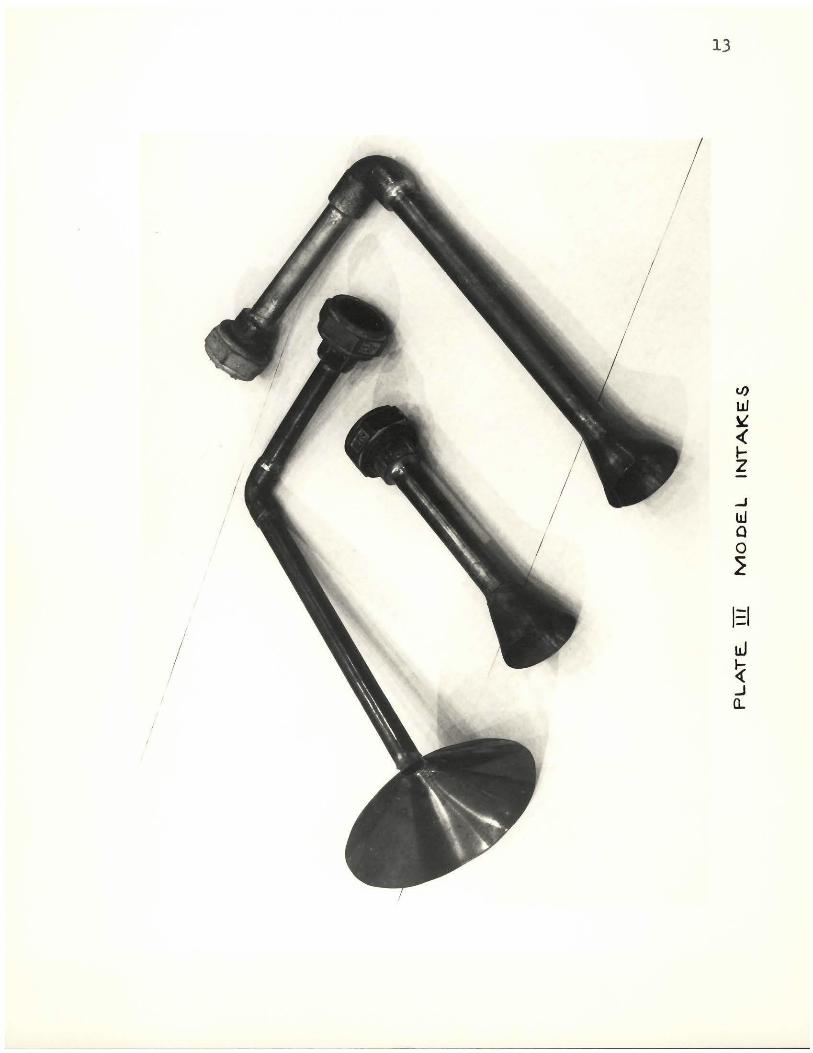
Item 6.
Intake pipes. The two intake pipes used by
R.J.Lindsay in his experiment, were made available for the
purposes of this experiment. Each was fitted with a bell·
mouth attachment 1~ ins. long having a port diameter of 1.813
in. The two pipes were identical in every respect except that
13
1

one provided a 90° bend for observations upstream and down
stream whereas the other was entirely straight. A third
mouthpiece was made with a bell-mouth attachment ll in. long
but having a port diameter of 5 in. The three mouthpieces
are illustrated on Plate 111.
Item 7.
Bulkheads for Steel Flume. The original bulk-
heads were manufactured of 1 in. marine plywood and later
stored in the laboratory. These were re-constructed in their
original position 4 ft. apart in a section of the steel flume
to provide the necessary receiving or mixing basin at the out
let from the de li very line. The plywood was fastened on 2'tby
4't studs, the two bulkheads wedged against the aides of the
steel flume and the joints caulked with plasticine and oakum.
The bulkheads were braced with 2n by 4n struts placed between
them and drawn up tight against these by six !" steel reinforc
ing rods with threaded ends which passed through each bulkhead
and were bolted on the outside of the supporting studs. As
the experiment progressed, and for reasons outlined in Chapter
4- Procedure,the mixing reservoir was divided into two basins
by means of a plywood baffle. This baffle was made reasonably
watertight in order to eliminate the carrying of sediment
into the outside portion of the basin, but it was not
attempted to eliminate all leaks. This baffle is illustrated
by Plate lV.

15
z -cil ( al
l!J z )(
16
Item 8.
Intake Overflow. In the previous experiment, an
overflow weir was used which required the vertical upward
flow of the sediment laden water before its discharge.
Although calculations had been very carefully done in arder to
insure that the upward velocity would always be sufficient to
carry the sediment, nevertheless it was decided for the
purpose of this experiment to eliminate the weir and to dis
charge the flow freely through the intake conduit. The
conduit was placed so that there was always a continuous dawn
ward slope from the intake itself to the discharge end of the
conduit and the flow regulated by means of a clamp. The model
intake conduit is shawn on Plate 1 and in colour on Plate V.
Item 9.
Receiving Flume. The original receiving flume
which consisted simply of an open-bottom box, was found to be
still in the laboratory although it had been somewhat modified
for the purposes of another experiment. Openings in this box
were closed up and it was placed in its original position where
it served to prevent splashing of the discharge from the flume
and to direct it into the storage reservoir. This discharge
flume is also shawn on Plate 1.
Item 10.
A Gurley Current Meter, (Priee Pattern) of the con
ventional bucket wheel type was used to measure flume
velocities.

PLATE V
Arrow indicates Intake Discharge.
PLATE Vl .5" Mouthpiece facing downstream, with current meter in position behind it.
17
18.
In Plates 11 and Vl, the current meter can be seen mounted in
position behind the 5" diameter mouthpiece which is facing
downstream.
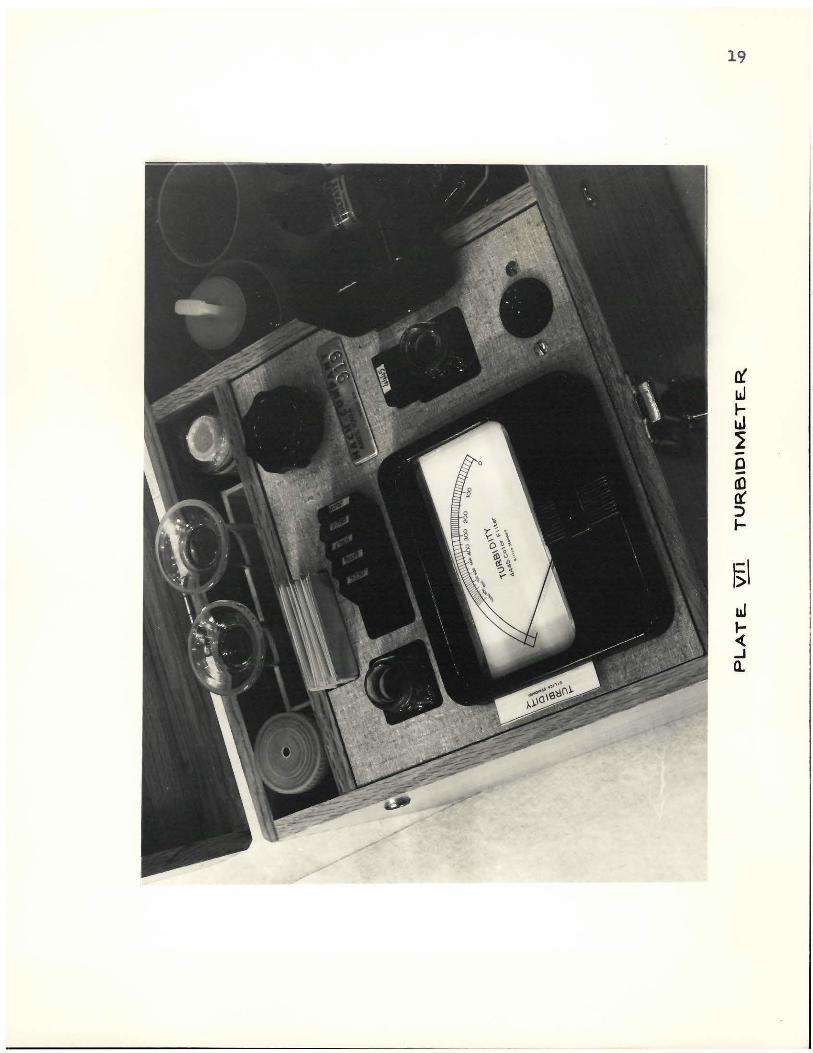
Item 11.
Turbidimeter: The turbidity was measured using
a Turbidimeter manufactured by the Hach Company of Ames,Iowa.
u.s.A. This instrument employa two photo-electric cells with
light sources. Through a comparison of the intensity of
light passing through the sample as compared with the light
passing through distilled water, it registers the turbidity on
a meter scale which is graduated to give turbidity directly in
accordance with the silica standard. This meter is shown in
Plate Vll.
19
CHAPTER FOUR
PROCEDURE
20
With the apparatus assembled as indicated in Plate 1,
the slope of the flume, the discharge of the pump and the
positioning of the gate valve which controlled the flow in
the supply piping were adjusted to minimize spillage, main
tain sufficient submergence of the intake pipe, and create
the desired flume velocity.
The velocity in the intake conduit was adjusted by
raising or lowering the discharge end of the conduit and by
opening or closing a clamp which was placed on the discharge
end of the conduit. For each position of the madel intake,
a series of readings was taken with five different ratios of
intake conduit velocity to flume velocity. In general these
ratios varied between 0.16 and 2.0. Five combinations of
intake and position were used; namely: 5" diameter mouthpiece
facing upstream and facing downstream; 1.813" mouthpiece
facing upstream, downstream and straight out. In most cases,
ten samples were taken, metered and averaged to produce a
reading for each combination of velocity ratio and intake
position.
Samples were collected in comroon galvanized steel pails.
The sample from the intake contained all of the sediment-bearing
water which was discharged from the intake during the period

21
of the observation. The corresponding sample from the flune,
consisted of two individual samples collected into one pail
by briefly intercepting a part of the discharge from the
flume in the pail a.t the beginning and the end of each period
of observation. The large samples in the pails were stirred
vigorously and a smaller sample taken which was placed in the
Turbidimeter and metered immediately.
At the beginning of ea.ch run an empty standard bottle
was filled with clea.r tap water and the empty sample bottle
was placed in the meter. The meter gwitch was then closed
and the meter current was varied by means of a. rheostat to
produce a zero reading on the silica scale. To obtain the
turbidity of a. sample, the sample bottle was filled with a
well-stirred sample from the sampling pail, the exterior of
the sample bottle was carefully dried, the bottle shaken and
inserted in position in the meter, and the meter switch closed
to give a turbidity reading directly from the scale.
As stated earlier, the flume velocity was measured
using a Gurley Current Meter. When placed in a flowing stream,
the buckets of this meter rotate at a speed which is pro
portional to the velocity of flow and every rotation (or
multiple thereof) transmits a signal to the headset worn by
the observer. By noting the frequency of the signal over a
known period of time the velocity of flow can be determined
from a calibration curve supplied by the manufacturer for each

22
instrument. During this experiment, the velocity was measured
at the beginning of each run and especially while the flow was
being adjusted, until it was constant at the desired figure,
and it was also measured at the end of each run. The meter was
removed from the flume while the sampling was being carried out.
The velocity of flow in the intake conduit was
determined by weighing the water which was discharged from the
conduit over a known period of time and dividing the equivalent
volume of water by the cross-sectional area of the intake con
duit. To save time, the weight of water which would have to be
discharged over a five-minute period, in order to create the
velocity of 1 ft. per second in the intake conduit, was cal
culated. By adjusting the discharge end of the intake conduit,
it was possible to arrive at multiples or fractions of this
weight and thereby set the intake discharge velocity at its pre
determined value. When the intake velocities were low, the
quantity of water actually discharged over the period of the
observation was measured, and the exact discharge velocity com
puted precisely.
Artificial turbidity of the water being circulated
through the system was created by the introduction of two
different types of sediment in the mixing basin. One of these
was magnesium silicate (talc) having a nominal particle aize of
149 microns. This was the same material as used by R.J.Lindsay
23
in his experiment. The actual particle aize variation for this
material before it was mixed with the water, was not determined.
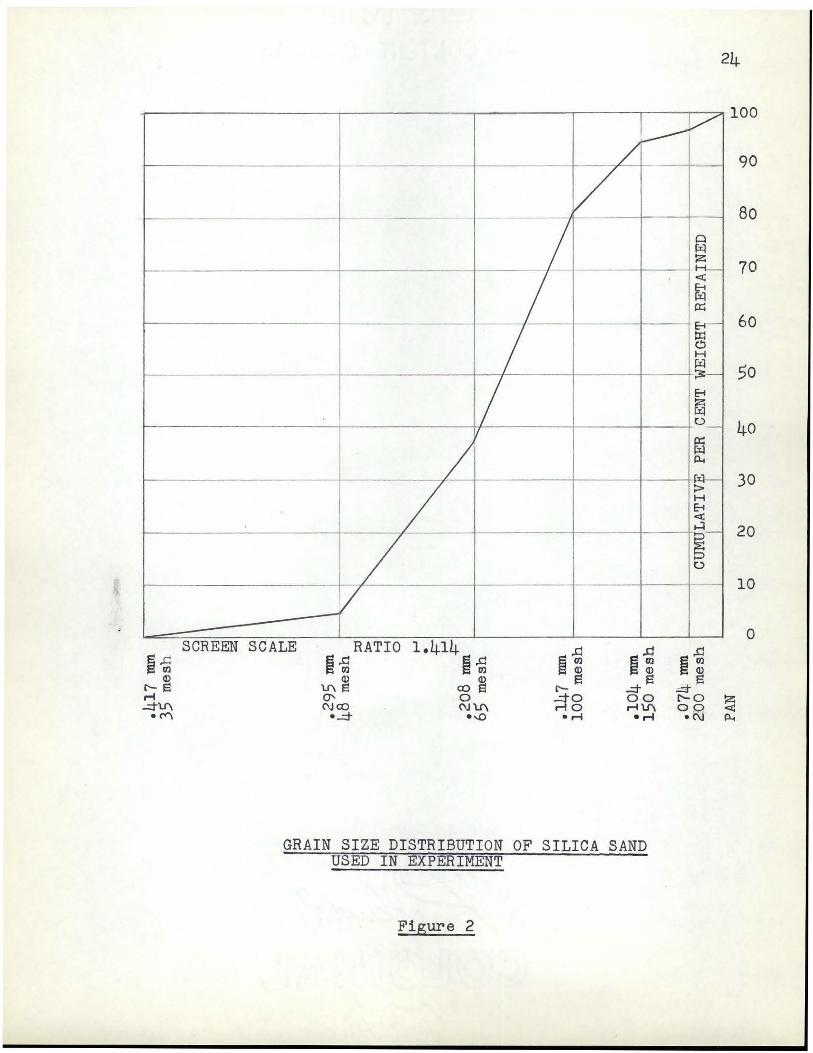
In addition to the talc, pure silica {sand) was also used in
this experiment. The particle aize distribution as determined
by the supplier (Dominion Silica) is shown in Figure 2.
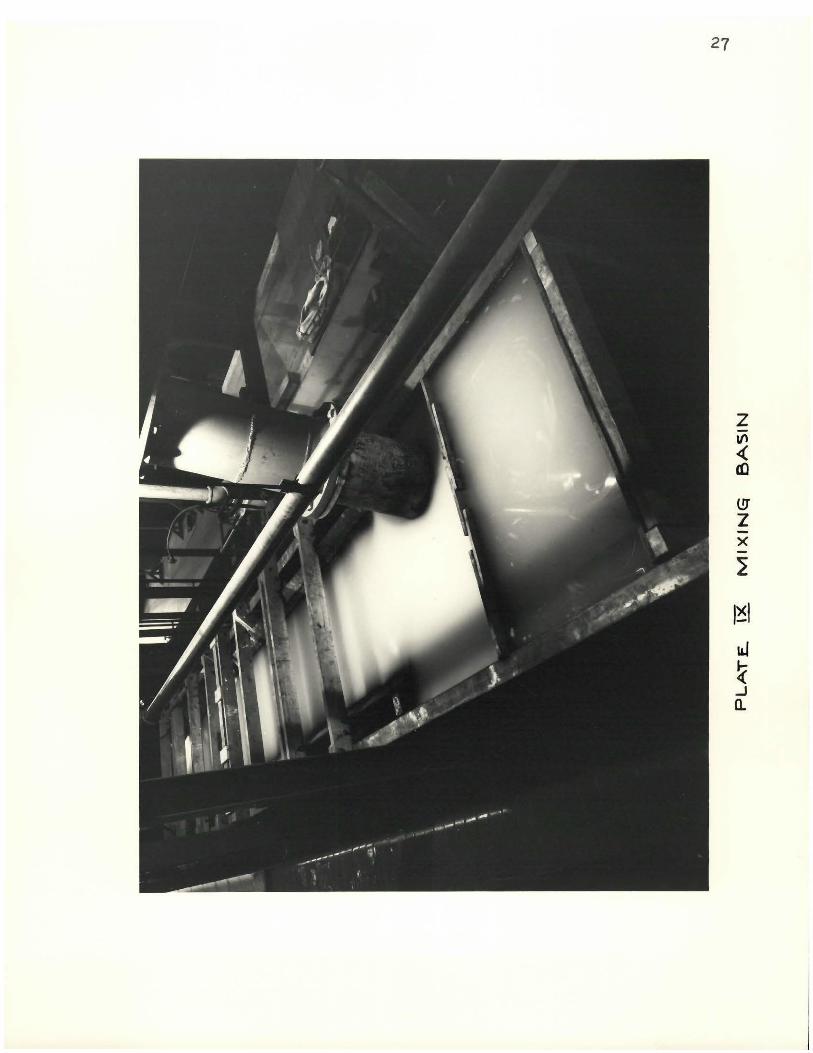
A sample of the suspension was analized in the soils
laboratory of the Department of Civil Engineering, McGill
University. The resulta of this analysis are shown in Table 2.
There was much deposition of sediment both in the mixing basin
and in the storage reservoir, and the resulta of the hydrometer
analysis indicated that it was the heavier fraction of the
sediment which was settling out. In an attempt to keep all of
the sediment in suspension and thus maintain uniform turbidity
in the flume, both the mixing basin and the storage reservoir
were reduced in aize through the introduction of baffles as
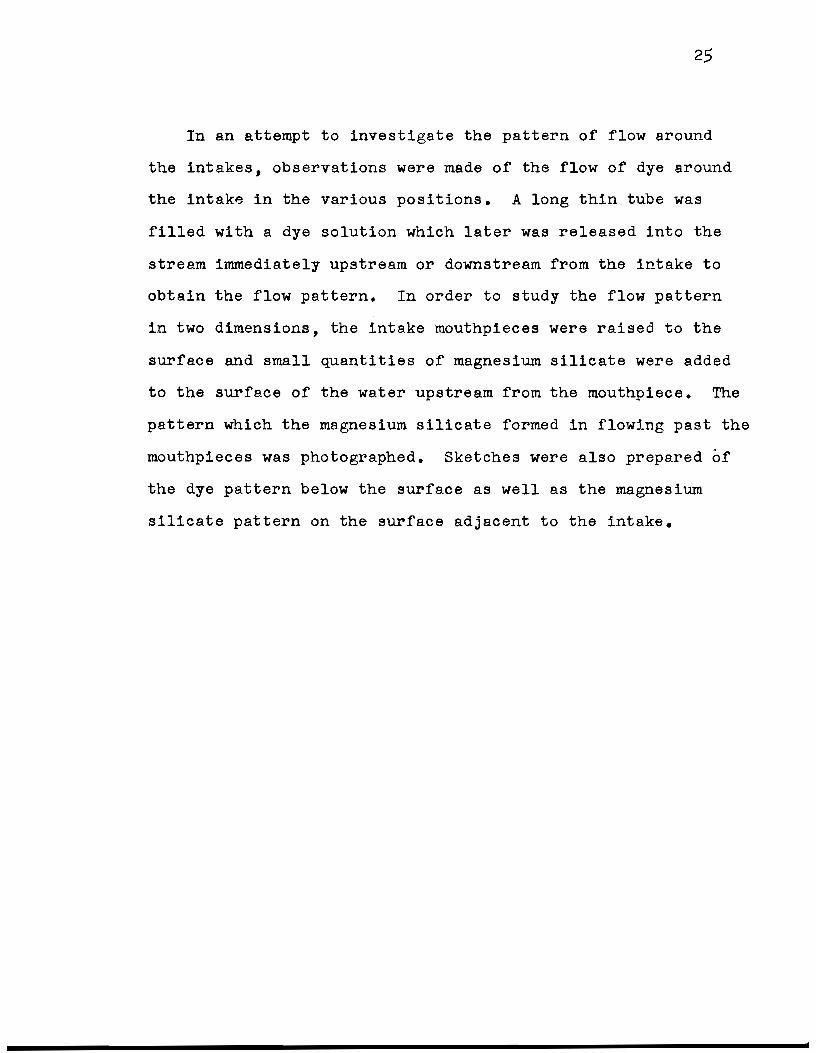
described in Chapter 3 - Apparatus. Plate Vlll indicates the
excellent degree of turbulence which was achieved in the storage
reservoir. Plate lX indicates the affect of placing the baffle
in the mixing basin and thereby reducing its effective volume
by one-half. At the end of the period of the experiment a
second hydrometer analysis was performed and the resulta thereof
are expressed in Table 3. It is to be noted that the improve
ments made in the two basins increased the diameter of the
largest aize particle in suspension from .04 to .19 milimeters.
r-
-
~.g Q)
c-S r-i ..::tV\
•CV"\
24
~ - i--- / - v ·-- -- -
1 0 r:il
·-r-- - ~ -- ~ cl;
+----E-1 rx:l 0:::
---- - ~·- E-1 -
~ H lïl
1 ·- ~-
E-1
~ o _
1 / ffi p.,
l ·~
/ H E-1 cl;
~-1 / ~ 1
l 0
-- - - ·-_y SCREEN SCALE RATIO 1.414
~~ ~~ ~.g ~.g ~.g Q) Q) ~ -.::t~ ~
V\S cos c- ==t 0' 0 -.::to 00 c-o C\JCO (\J'V\ r-iO r-i V\ ~Rl • -.::t •...o •r-i •r-i
GRAIN SIZE DISTRIBUTION OF SILICA SAND USED IN EXPERIMENT
Figure 2
100
90
80
70
60
50
40
30
20
10
0
z cl; p.,
25
In an attempt to investigate the pattern of flow around
the intakes, observations were made of the flow of dye around
the intake in the various positions. A long thin tube was
filled with a dye solution which later was released into the
stream immediately upstream or downstream from the intake to
obtain the flow pattern. In order to study the flow pattern
in two dimensions, the intake mouthpieces were raised to the
surface and small quantities of magnesium silicate were added
to the surface of the water upstream from the mouthpiece. The
pattern which the magnesium silicate formed in flowing past the
mouthpieces was photographed. Sketches were also prepared of
the dye pattern below the surface as well as the magnesium
silicate pattern on the surface adjacent to the intake.

26
z -
15l
27
(.!]'
z -x
TABLE 2
HYDROMETER ANALYSIS OF SUSPENDED SEDIMENT AT BEGINNING OF EXPERIMENT.
E1apsed time
2'
4'
10'
20 1
40'
8o•
Hyd. rdg.
1.0005
1.0002
1.0001
1.0
0.9999
0.9999
True Hyd. rdg.
1.001
1.0007
1.0006
1.0005
1.0004
1.0004
z: cm
16.8
16.88
16.90
16.93
16.96
16.96
Water temperature 19.5°0 Hydrometer correction +.0005
2.89
2.05
1.30
.921
.696
.498
Ana1ysis by S.J.Windich, Soi1s Laboratory McGi11 University, October )rd, 1961.
28
Dmm
.0416
.0295
.0187
.0133
.0100
.0071
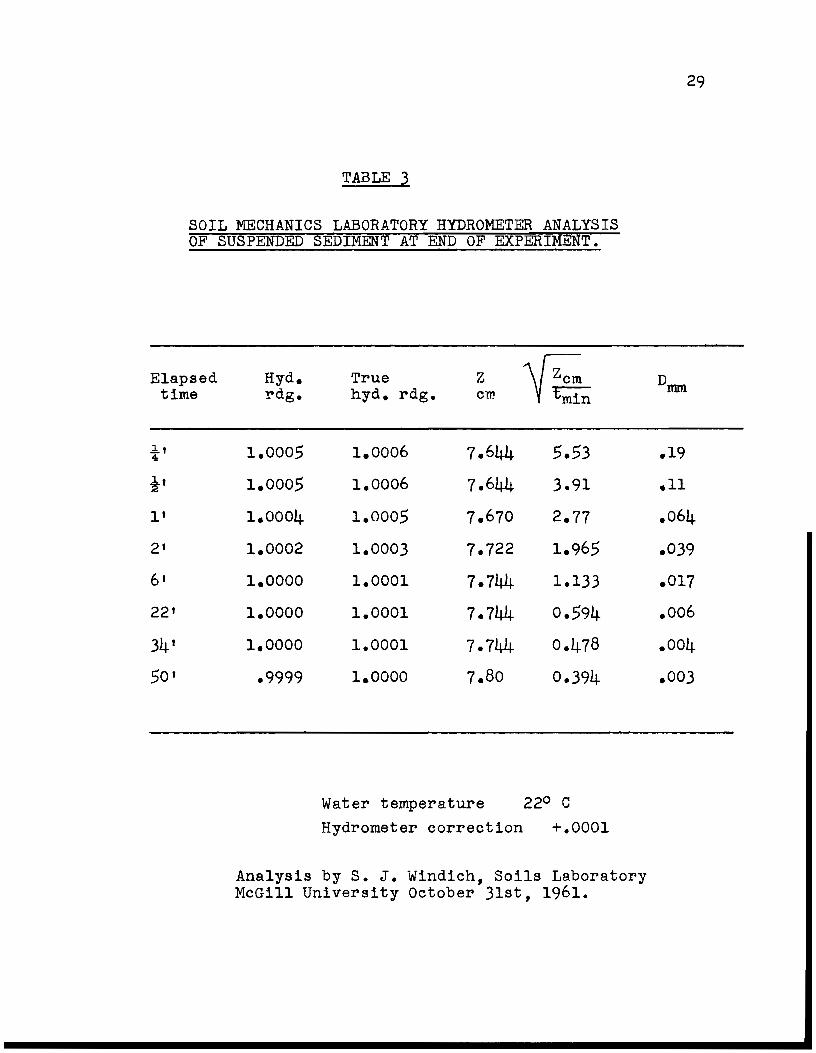
TABLE 3
SOIL MECHANICS LABORATORY HYDROMETER ANALYSIS OF SUSPENDED SEDIMENT AT END OF EXPERIMENT.
E1apsed time
l:..t 4:
t' l'
2•
6•
22 1
34'
50'
Hyd. True z ~ rdg. hyd. rdg. cm tmin
1.0005 1.0006 7.644 5.53 1.0005 1.0006 7.644 3.91
1.0004 1.0005 7.670 2.77
1.0002 1.0003 7.722 1.965
1.0000 1.0001 7.744 1.133
1.0000 1.0001 7.744 0.594
1.0000 1.0001 7.744 0.478
.9999 1.0000 7.80 0.394
Water temperature 22° C Hydrometer correction +.0001
Analysis by S. J. Windich, Soils Laboratory McGil1 University October 31st, 1961.
29
Dnnn
.19
.11
.064
.039
.017
.oo6
.004
,003
CHAPTER V
OBSERVATIONS
A. Flow Pattern Observations
30
On October 8th, 1961, beginning at about 1 p.m., a series
of observations were carried out in an attempt to observe the
pattern of flow around the mouthpiece. A mixture of bright
orange common household dye was prepared. This was sucked into
a thin glass tube approximately five feet in length and held
in the tube by sealing the upper end of the tube until the
lower end was positioned near the intake. The dye was then
allowed to flow out of the tube by gravity and the pattern which
it traced was noted.
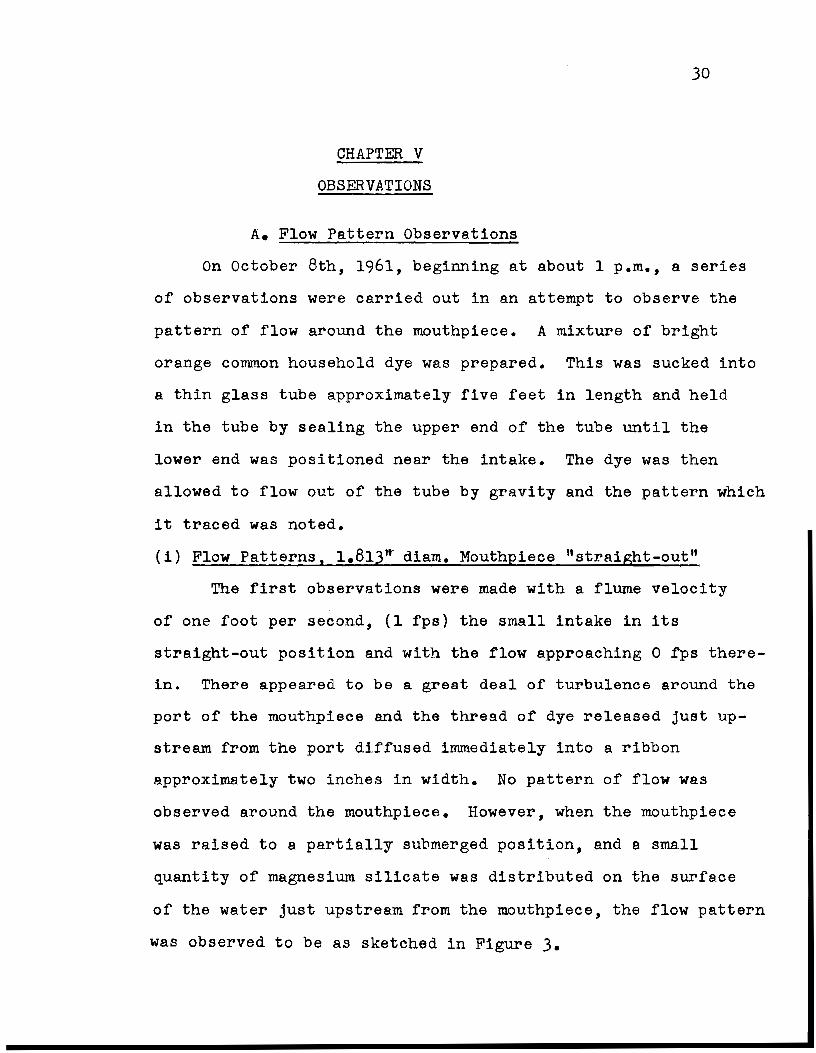
( i) Flow Patterns, 1.81.3" diam. Mouthpiece ttstraight-out••
The first observations were made with a flume velocity
of one foot per second, (1 fps) the small intake in its
straight-out position and with the flow approaching 0 fps thera
in. There appeared to be a great deal of turbulence around the
port of the mouthpiece and the thread of dye released just up
stream from the port diffused immediately into a ribbon
approximately two inches in width. No pattern of flow was
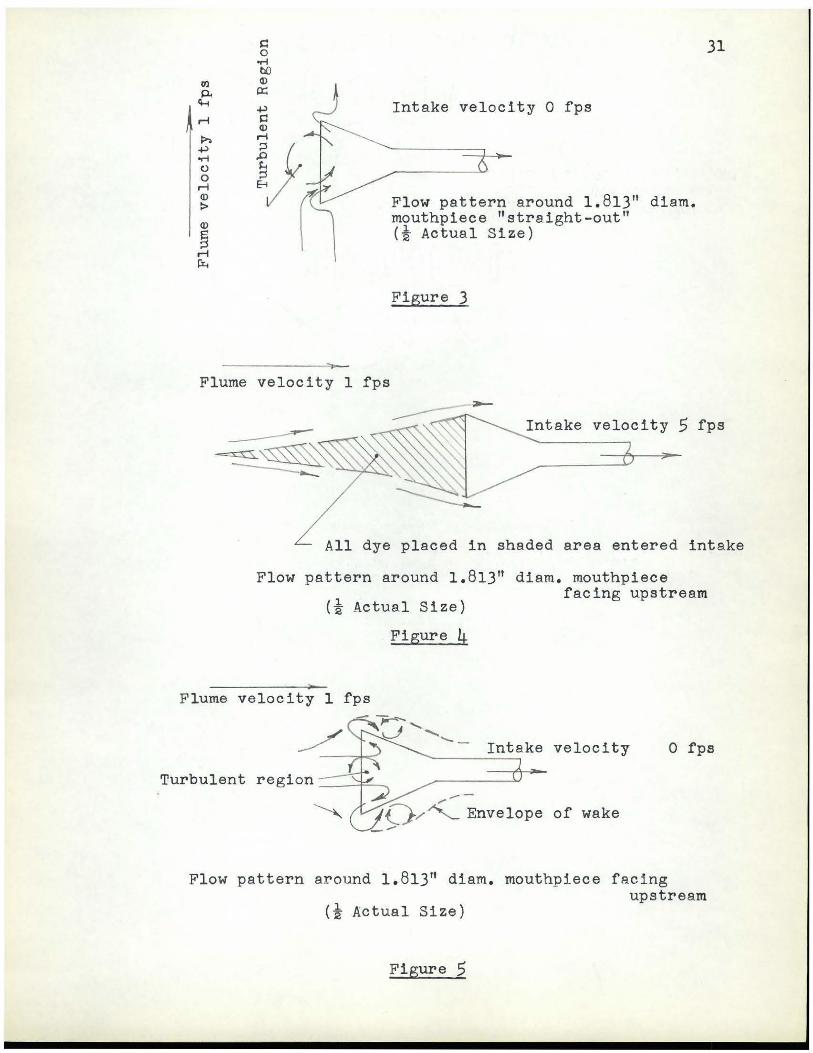
observed around the mouthpiece. However, when the mouthpiece
was raised to a partially submerged position, and a small
quantity of magnesium silicate was distributed on the surface
of the water just upstream from the mouthpiece, the flow pattern
was observed to be as sketched in Figure .3.
0)
p. G-t
r-i
1» +-) ..-i ()
0 r-i Q.)
:> Q.)
§ r-i rx...
~ 0
..-i tl() Q.)
0:::
- -------
Intake velocity 0 fps
Flow pattern around 1.813" diam. mouthpiece 11 straight-out" (i Actual Size)
Figure 3
31
Flume velocity 1 fps
Intake velocity 5 fps
All dye placed in shaded area entered intake
Flow pattern around 1.813 11 diam. mouthpiece
(i Actual Size) facing upstream
Figure 4
Flume velocity 1 fps
Intake velocity ......._ ____ ___, 0 fps
..--... 0/~ Envelope of wake --
Flow pattern around 1.813 11 diam. mouthpiece facing
(i Actual Size) upstream
Figure 5

PLATE · X
Showing dye-filled tube used to trace flow pattern below surface.
PLATE Xl
3la
Illustrating flow pattern around 1.81311 diam. mouthpiece facing upstream, flume velocity 1 fps, intake velocity 0 fps.
32
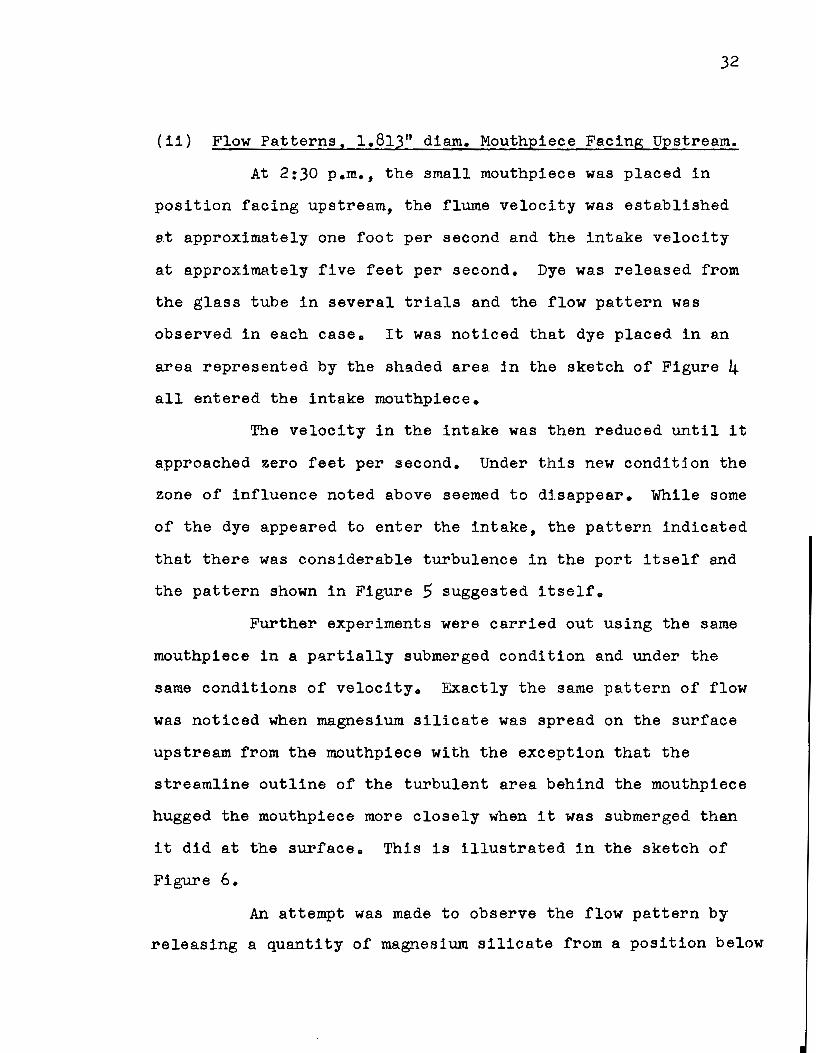
(ii} Flow Patterns, 1.813" diam. Mouthpiece Facing Upstream.
At 2:30p.m., the small mouthpiece was placed in
position facing upstream, the flume velocity was established
at approximately· one foot per second and the intake velocity
at approximately five feet per second. Dye was released from
the glass tube in several trials and the flow pattern was
observed in each case. It was noticed that dye placed in an
area represented by the shaded area in the sketch of Figure 4
all entered the intake mouthpiece.
The velocity in the intake was then reduced until it
approached zero feet per second. Under this new condition the
zone of influence noted above seemed to disappear. While some
of the dye appeared to enter the intake, the pattern indicated
that there was considerable turbulence in the port itself and
the pattern shown in Figure 5 suggested itself.
Further experimenta were carried out using the same
mouthpiece in a partially submerged condition and under the
same conditions of velocity. Exactly the same pattern of flow
was noticed when magnesium silicate was spread on the surface
upstream from the mouthpiece with the exception that the
streamline outline of the turbulent area behind the mouthpiece
hugged the mouthpiece more closely when it was submerged then
it did at the surface. This is illustrated in the sketch of
Figure 6.
An attempt was made to observe the flow pattern by
releasing a quantity of magnesium silicate from a position below

33
the surface of the water but this method was not successful.
Moreover, because the capacity of the glass tube was small,
the period of time during which the dye indicated the flow
pattern was very short and it appeared almost impossible to
photograph the pattern during such a short period of time.
Since it had been observed that the flow pattern on the surface
was very similar to the flow pattern of the submerged mouthpiece,
photographs were taken of the surface pattern when magnesium
silicate was spread on the surface of the water upstream from
the mouthpiece. These photographs are shown in Plates Xl to
XVll incl. on Pages 31a, 35a, 36 and 37.
(iii) Flow Patterns, 5" diam. Mouthpiece Facing Upstream
The five inch diameter mouthpiece was then substituted
for the smaller one and placed in the upstream position with the
intake velocity at five feet per second and the flume velocity
remaining at one foot per second. Dye was used to determine the
flow pattern. It was observed that all of the dye placed in the
cross-hatched area shown in Figure 7, entered the intake. Dye
placed outside of the hatched area mostly bypassed the intake
although, in some cases, very small quantities appeared to enter.
The intake velocity was reduced to almost zero feet per
second. The flow pattern around the mouthpiece changed and it
was observed that both dye and talc which was also applied in
the same manner were carried right into the mouthpiece where
there appeared to be a great deal of turbulence. When the mouth-

34
piece was raised to a partially submerged position and
magnesium silicate was added to the surface of the water up
stream from the mouthpiece, the talc was seen to collect inside
the mouthpiece as shawn in Figure 8.
(iv) Flow Pattern, .5n diam. Mouthpiece Facing Downstream.
The five inch diameter mouthpiece was then turned to its
downstream position. With an intake velocity of five feet per
second and a flume velocity of approximately one foot per second,
it was observed that none of the dye or at least no observable
quantity of the dye which was added upstream from the intake was
carried into the zone of influence downstream from the intake,
Dye which was added within the zone of influence (aee Figure 9)
flowed upatream to the intake where it was diffused, some of it
entering the intake, but the greater part of it entered into
the turbulent portion of the zone of influence, along the edgea
of which aome of it was returned to the flume flow. The same
pattern was observed when the intake velocity was reduced to
zero, except that the upstream velocity towards the intake within
the influence zone appeared to be reduced and diffusion took
place more quickly. It appeared that there was greater turbulence
within the zone of influence when the intake velocity approached
zero.
With the intake in the partially submerged position, and
the intake velocity approaching zero feet per second, talc was
added to the surface upstream from the inta.ke mouthpiece.

Flume velocity 1 fps ,/ 35 Flume velocity 1 fps
velocity ~----L-,fp s ___&{ ~Intake velocity
"- 0 fps Pool '~. >!'
of taï"C\j
Enve lope \!:::( , of wake ..........,-.......J
Flow patterns around partially submerged 1.813 11 diam. mouthpiece traced by floating talc. (! Actual size)
Figure 6
Flume velocity 1 fps
Intake velocity 5 fps
All dye placed in shaded area entered intake
Flow pattern around 5" diam. mouthpiece facing upstream. (i Actual size)
Figure 7
C' 1 __) Intake velocity Intake velocity
}
Flumë velbcity 1 fps
Intake submerged pattern traced with dye
fps
~ (_ \ Flume velocity 1 fps
Intake partially submerged pattern traced using talc
Flow pattern around 5" diam. mouthpiece
Figure 8
0 fps
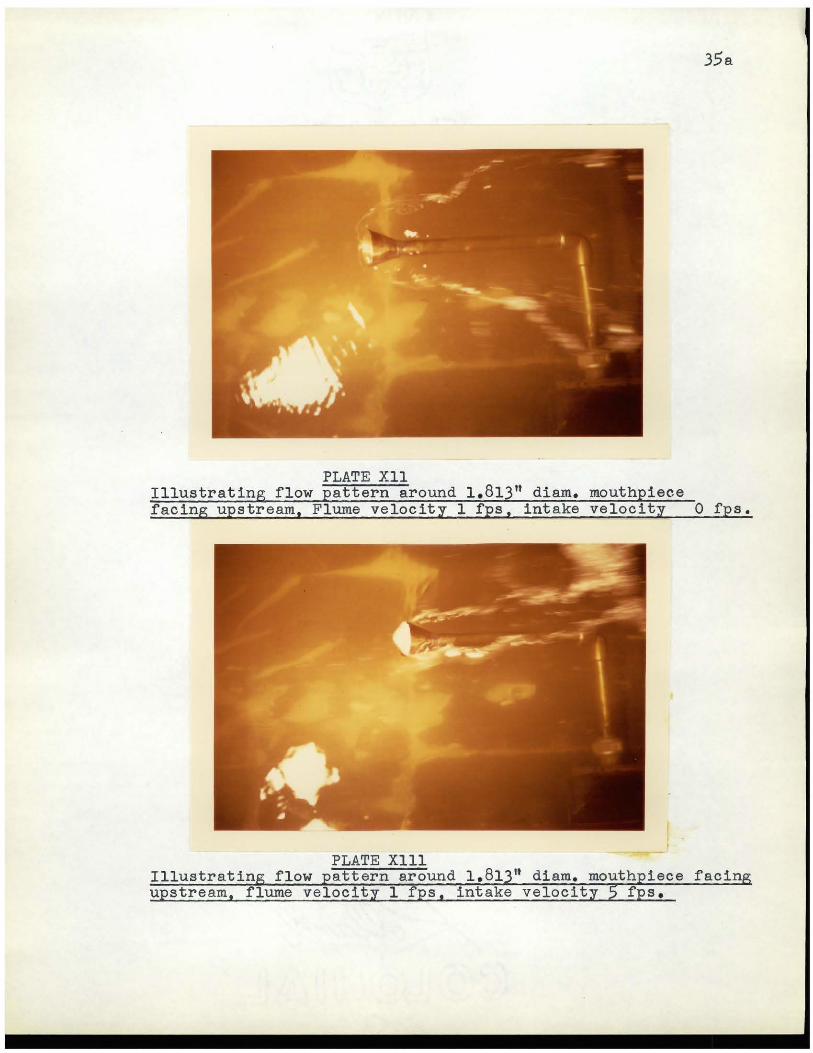
35a
PLATE Xll Illustrating flow pattern around 1.813" diam. mouthpiece facing upstream, Flume velocity 1 fps, intake velocity 0 fps.
Illustra tin facin

36
PLATE XlV Illustratin flow pattern with 1.813" diam. mouth upstream, f1ume ve1ocity 1 fps, intake ve1ocity
facin

37
Illustra tin downstream,
PLATE XVll attern around small mouth ieee facin down-

38
By far the greatest portion of the talc bypassed the
intake and the zone of influence behind it. However, the
small amount which was captured by the wake of the mouthpiece
remained within the zone of influence for a comparatively long
time (longer than one minute). Essentially the same pattern
was observed when the intake velocity was increased to five
feet per second, except that the flow towards the intake conduit
within the mouthpiece, was rouch better defined.
It was observed that the streamline along the contact edge
between the wake behind the mouthpiece and the flow in the
flume appeared to oscillate back and forth, that is to say that
a particle on the far side of the mouthpiece would flow upstream
along the stream line entering the cone, passing the center
thereof and then flow downstream on the near slde of the mouth
piece. This is illustrated in Figure 10.
(v) Flow Pattern, 1.81311 diam. Mouthpiece Facing Downstream.
The sma11 mouthpiece was then substituted for the
large facing in a downstream position and the flow pattern was
traced using dye for intake velocities of five feet per second
and approaching zero feet per second with the flume ve1ocity at
approximately one foot per second. The patterns observed were
similar to those observed with the five inch mouthpiece except
that the size of the zone of influence was reduced. These
patterns are illustrated in Figure 11. The smal1 mouthpiece
was then raised so that it faced downstream in a partia11y sub-
39
merged position and the flow pattern on the surface was
traced with floating talc added upstream. Once again, some
of the talc (a small percentage) was captured by the wake of
the mouthpiece. The captured talc entered the mouthpiece it
self where when the intake velocity was very low, it lay for
some two minutes until it was absorbed by the intake or carried
out of the wake and into the stream flow by the oscillatory
effect noted in the description of the observations concerning
the five inch mouthpiece. In the case where the intake velocity
was five feet per second, there was a very strong flow towards
the intake conduit and ali of the captured talc entered the
mouthpiece almost immediately.
B. Sedimentation Measurements
In order to determine the rate of settlement of the
turbidity in still water, a sample from the fiume was left
standing in the sample bottle in the turbidimeter and the
turbidity of the sample was read at five-minute intervals from
12:30 p.m. to 2:00 p.m. on September 25, 1961. The res~lts of
this series of measurements are given in Table 4.
c. Hldraulic Characteristics of 5" d am. Mouthpiece
It was observed on September 26th, 1961 during the
first experimenta with the 5 inch diameter mouthpiece that a
hydraulic jump was set up approximately ten inches downstream
40
from the face of the large mouthpiece, regardless of whether
the mouthpiece faced upstream or downstream. In arder to
minimize this jump the depth of flow was kept at the maximum
which was possible without causing overflow of the mixing
basin.
D. Quantitative Observations
The quantitative results of the experimenta follow in
Tables 5 to 31, Pages 43 to 69.

Flume
Intake velocity 0 5 fps
-Flow pattern around 5" diam. mouthpiece (submerged) facing downstream (i Actual Size)
Figure 9
Flume velocity 1 fps 2
Intake velocity 0 5 fps ----
..........._
41
Successive positions of a particle of talc captured by the 5" diam. intake partially submerged (i Actual Size)
Flume velocity 1 fps ~
Intake ~ 5 f~---./"
Dye placed in hatched area flowed into intake
Figure 10
Flume velocity 1 fps
Dye placed in hatched area flowed upstream into intake
Flow patterns around 1.81) 11 diam. mouthpiece facing downstream (submerged) (! Actua1 Size)
Figure 11

42
TABLE 4
Variation of turbiditz with time of undisturbed samp1e in turbidimeter, September 2$th, 1961.
Ti me Turbidity Reduction
12:2.5 p.m. 82.5 ppm
tt 75 ppm
12:30 750 75
12:3.5 tt 67.5 75
12:40 tt 600
12:4.5 11 50
.550 25
12:50 11 525 13
12:5.5 tt 512
1:00 tt 25
487
1:0.5 " 37
4.50 13
1:10 tt 437 12
1:1.5 tt 425 13
1:20 " 412 12
1:25 tt 400
1:30 tt 387 13
12 1:3.5 tt 37.5
0 1:40 tt 37.5
12 1:4.5 tt 363
0 1:.50 tt 363
1:.55 tt 350 13
0 2:00 tt 350

43
TABLE 5
OBSERVATIONS- September 26th, 1961.
10:2.5 a.m. F1ume Turbidity - B25 ppm.
1st. Run F1ume 2 fps
Intake 1 fps .5" mouthpiece facing upstream.
Time F1ume Intake Reduction % Remarks Turbidity Turbidity ppm ppm
10:2B a.m. B10 B10 0 0 F1ume 1st.
10:41 n B5o 790 +60 +7.4 Intake 1st.
10:4.5 " Boo B10 -10 -1.2 F1ume lst.
10:49 n B40 Boo +40 +4.8 Intake 1st.
10:.54 " Boo BlO -10 -1.2 F1ume 1st.
10:.57 tt Boo Boo 0 0 Intake 1st.
11:00 tt Boo 790 +10 +1.2 F1ume 1st.
11:0.5 tt B25 77.5 +50 +6.1 Intake 1st.
11:07 " Boo Boo 0 0 F1ume 1st.
11:10 " B25 92.5 0 0 Intake 1st.
Total +17.1
Mean = +1.7%

44
TABLE 6
OBSERVATIONS- September 26th, 1961.
2nd. Run Flume 2 fps 5" mouthpiece facing downstream
Intake 1 fps
Ti me Flume Intake Reduction Remarks Turbidity Turbidity ppm ppm
11:35 a.m. 780 780 0 0
11:39 n 800 775 +25 +3.2
11:41 tt 775 790 -15 -1.9
11:44 tt 800 825 -25 -3.2
11:47 tt 775 775 0 0
11:52 n 800 825 -25 -3.2
11:.5.5 " 800 810 -10 -1.2
11:.50 tt Boo 775 +25 +3.2
12:00 noon 800 Boo 0 0
12.03 p.m. Boo 790 +10 +1.2
Total +1.9
Mean = +0.2%
4.5
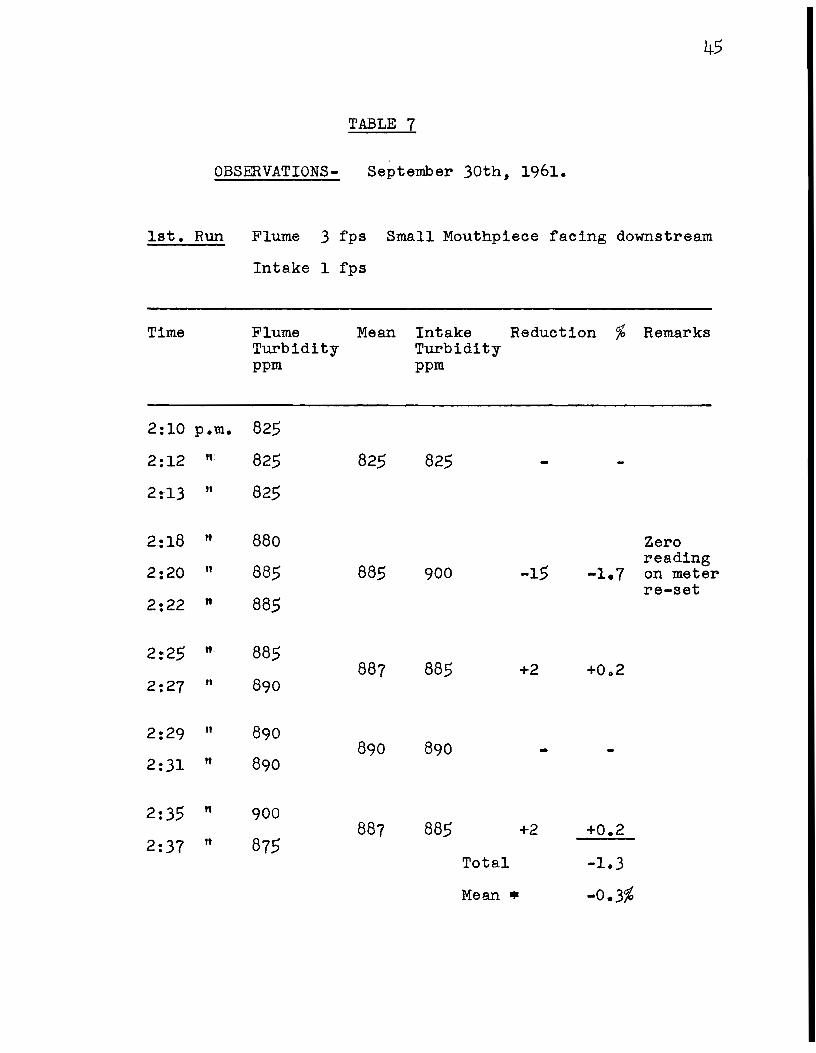
TABLE 7
OBSERVATIONS- September 30th, 1961.
lst. Run F1ume 3 fps Small Mouthpiece facing downstream
Intake 1 fps
Ti me F1ume Mean Intake Reduction % Remarks Turbidity Turbidity ppm ppm
2:10 p.m. 82.5
2:12 tt 82.5 825 82.5 -2:13 tt 825
2:18 " 880 Zero
2:20 n 88.5 885 900 -15 reading
-1.7 on meter re-set
2:22 n 885
2:25 n 885 887 885 +2 +Oo2
2:27 ft 890
2:29 n 890 890 890 -2:31 " 890
2:35 " 900 887 885 +2 +0.2
2:37 n 875 Total -1.3
Mean • -0.3%
46
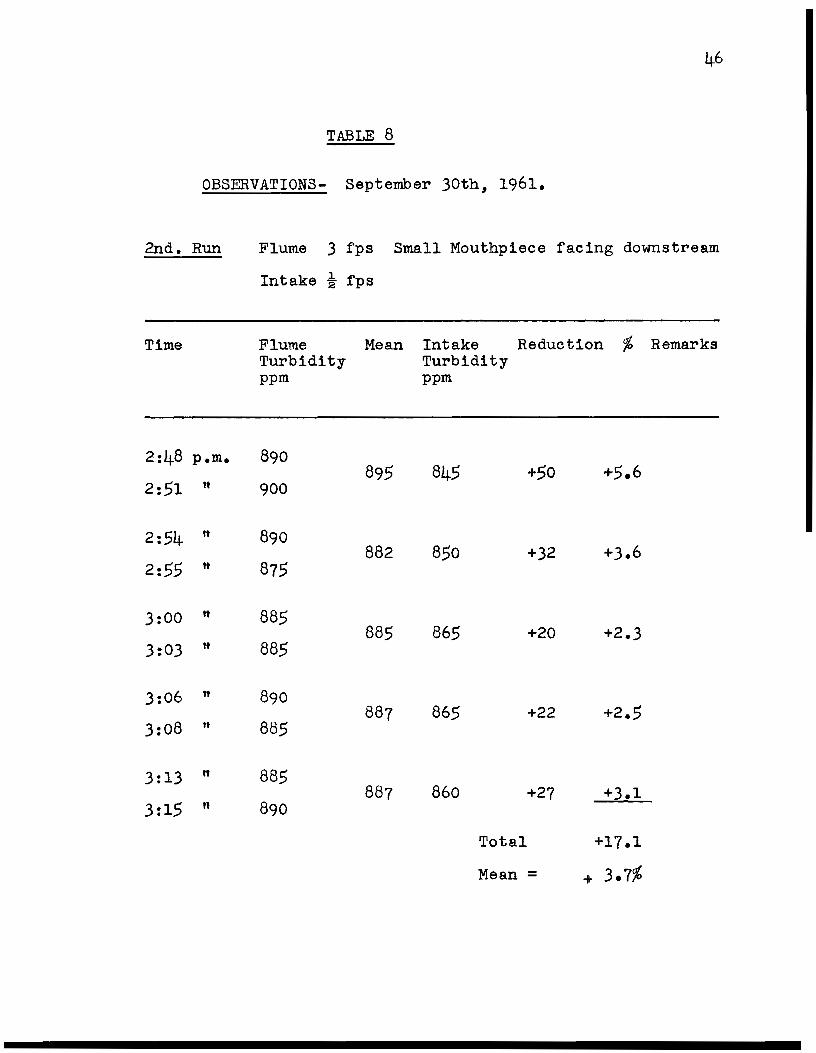
TABLE 8
OBSERVATIONS- September 30th, 1961.
2nd. Run
Time
2:48 p.m.
2:51 n
2:54 n
2:55 n
3:00 n
3:03 n
3:06 " 3:08 n
3:13 n
3:15 n
Flume 3 fps Small Mouthpiece facing downstream
Intake i fps
Flume Mean Intake Reduction % Remarks Turbidity Turbidity ppm ppm
890 895 845 +50 +5.6
900
890 882 850 +32 +3.6
875
885 885 865 +20 +2.3
885
890 887 865 +22 +2.5
885
885 887 860 +27 +3.1
890
Total +17.1
Mean = ... 3.7%

47
TABLE 9
OBSERVATIONS- September 30th, 1961.
)rd. Run
Time
3:.52 p.m.
3:.54 tt
3:.5.5 tt
3:.56 tt
3:.59 tt
4:01 tt
4:03 " 4:0.5 tt
4:09 tt
4:11 tt
F1ume 3 fps Sma11 straight Mouthpiece
Intake 0 • .5 fps
Flume Mean Intake Reduction % Remarks Turbidity Turbidity ppm ppm
875 882 870 +12 +1.4
890
900 892
88.5 87.5 +17 +1.9
900 887 87.5 +12 +1.4
87.5
875 875 875
875
890 89.5 87.5 +20 +2.2
900
Total +6.9
Mean = +1.4%
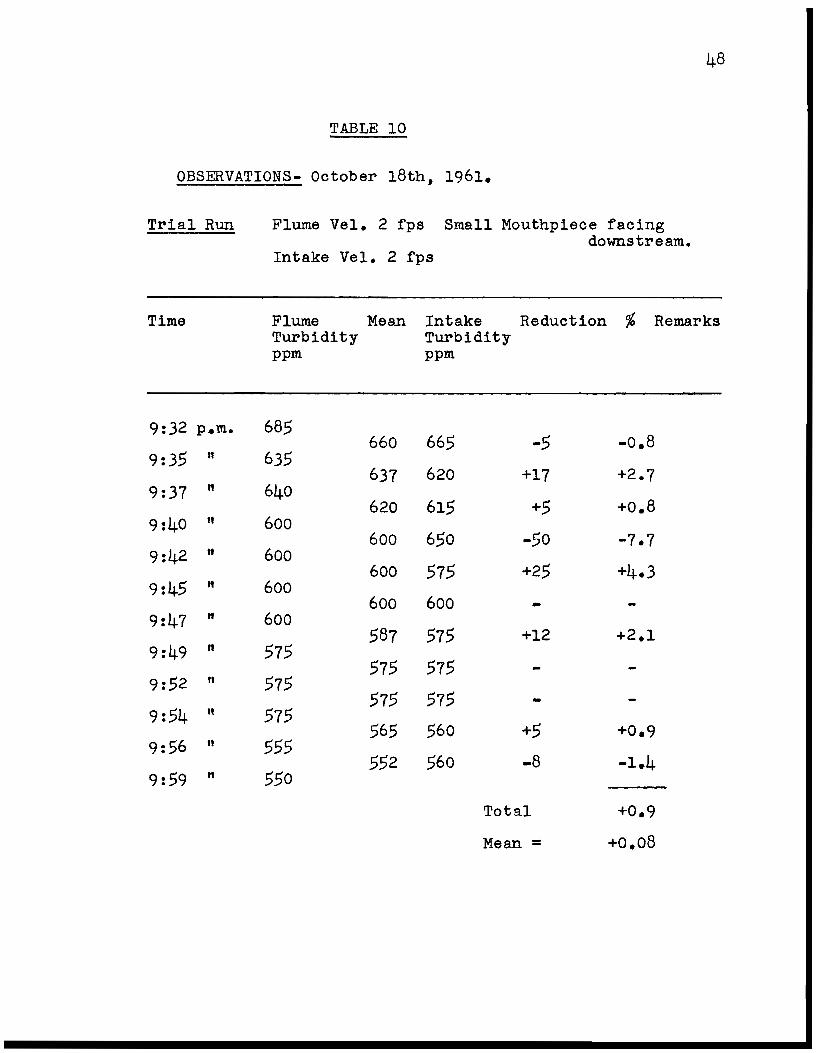
48
TABLE 10
OBSERVATIONS- October 18th, 1961.
Trial Run
Time
9:32 p.m.
9:35 " 9:37 " 9:40 tt
9:42 " 9:45 " 9:47 n
9:49 n
9:52 " 9:54 n
9:56 n
9:59 "
Flume Vel. 2 fps Small Mouthpiece facing downstream.
Intake Vel. 2 fps
Flume Mean Intake Reduction % Remarks Turbidity Turbidity ppm ppm
685 660 665 -5 -o.8
635 637 620 +17 +2.7
640 620 615 +5 +0.8
600 600 650 -50 -7.7
600 600 575 +25 +4.3
600 600 600 -600 587 575 +12 +2.1
575 575 575 -
575 575 575 -
575 565 560 +5 +0.9
555 552 560 -8 -1.4
550 Total +0.9
Mean = +0.08
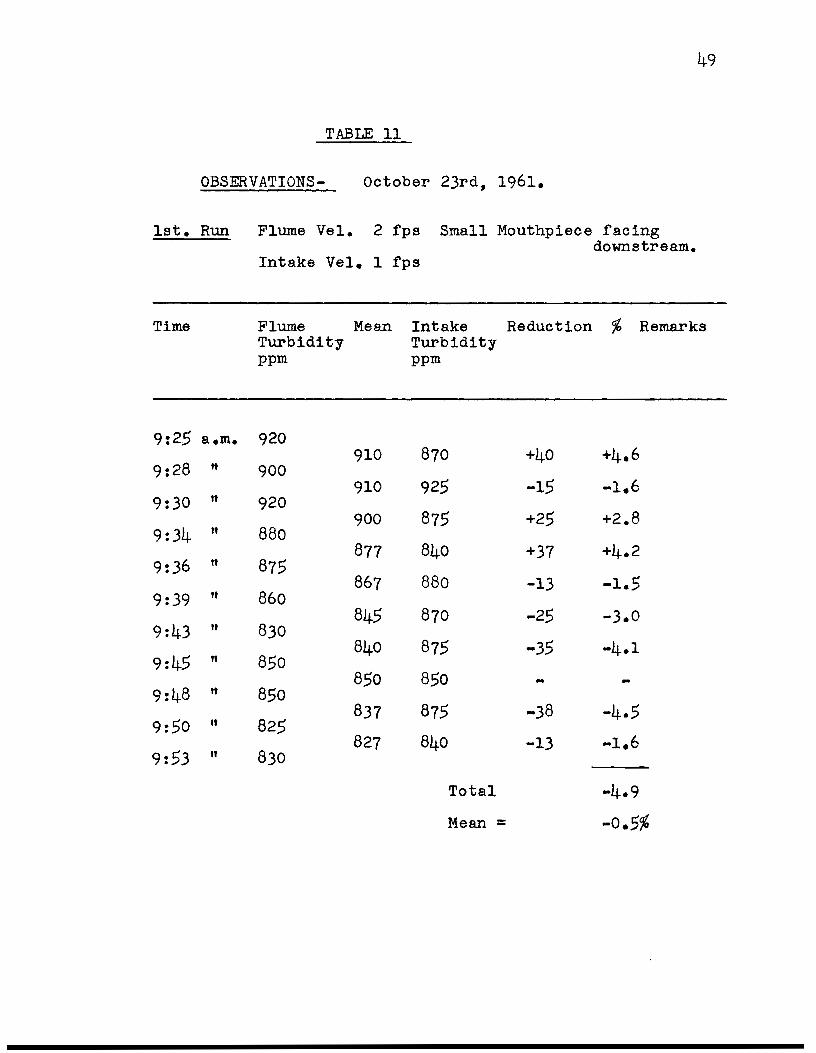
TABLE 11
OBSERVATIONS- October 23rd, 1961.
lst. Run F1ume Ve1. 2 fps Sma11 Mouthpiece facing downstream.
Intake Ve1. 1 fps
49
Ti me Flume Mean Intake Reduction % Remarks Turbidity Turbidity ppm ppm
9:25 a.m. 920 910 870 +40 +4.6
9:28 " 900 910 925 -15 -1.6
9:30 tt 920 900 875 +25 +2.8
9:34 tt 880 877 840 +37 +4.2
9:36 tt 875 867 880 -13 -1.5
9:39 tt 860 845 870 -25 -3.0
9:43 tt 830 840 875 -35 -4.1
9:45 ft 850 850 850 ...
9:48 tt 850
825 837 875 -38 -4.5
9:50 tt
827 840 -13 -1.6 9:53 " 830
Total -4.9
Mean = -o.5%

50
TABLE 12
OBSERVATIONS- Ootober 23rd, 1961.
2nd. Run Flume Vel. 2.0 fps Small Mouthpieoe faoing downstream.
Intake Vel. O.$ fps
Time Flume Mean Intake Reduction ~ Remarks Turbidity Turbidity ppm ppm
10~15 a.m. 780 775 790 ....15 -1.9
10:17 tt 770 775 760 +15 +1.9
10:19 tt 780 770 770 ...
10:21 tt 760 767 770 -3 -0.4
10:23 n 775 767 770 -3 -o.4
10:26 lt 760 767 765 +2 +0.3
10:28 n 775 770 780 -10 -1.3
10:31 " 765 757 750 +7 +0.9
10:33 tt 750 750 770 -20 -2.6
10:36 " 750 750 770 -20 -2.6
Total -6.1
Mean= -o.6%

51
TABLE 13
OBSERVATIONS- October 23rd, 1961.
3rd. Run Flume Ve1. 2.0 fps Sma11 Mouthpiece facing downstream.
Intake Ve1. 4.0 fps
'l'ime Flume Mean Intake Reduction '/, Remarks Turbidity Turbidity ppm ppm
10:47 a.m. 725 737 710 +27 +3.7
10:49 lt 750 740 725 +15 +2.0
10:51 tt 730 740 725 +15 +2.0
10:54 tt 750 737 725 +12 +1.6
10:56 tt 725 725 725 - 5 -0.7
10:59 n 725 730 725 + 5 +0.7
11:01 n 735 730 725 + 5 +0.7
11:03 " 725 725 735 -10 -1.4
11:06 n 725 730 725 + 5 +0.7
11:08 tt 735 730 725 + 5 +0.7
11:09 lt 725
Total +10.0
Mean= +l.O%

TABLE 14
OBSERVATIONS• October 23rd, 1961.
4th. Run Flume Vel. 2.0 fps Smal1 Mouthpiece facing upstream.
Intake Vel. 4.0 fps
52
Time F1ume Mean Intake Reduction % Remarks Turbidity Turbidity ppm ppm
11:30 a.m. 675 675 690 -1.5 -2.2
11:31 tt 675 .582 680 + 2 +0.3
11:33 tt 690 682 67.5 + 7 +1.0
11:3.5 tt 67.5 687 67.5 +12 +1.7
11:38 tt 700 68.5 67.5 +10 +1 • .5
11:39 tt 670 670 67.5 ... 5 -0.7
11:42 tt 670 670 680 -10 -1.5
11:44 tt 670 67.5 690 -1.5 -2.2
11:47 If 680 67.5 695 ·20 -3.0
11:50 " 61].0 677 67.5 + 2 +0.3
11:51 tt 685
Total -4.8
Mean = -o.5%

53
TABLE 1,5
OBSERVATIONS- October 23rd, 1961.
$th. Run
Time
3:15 p.m.
3:17 tt
3:19 tt
3:21 tt
3:25 rt
3:27 n
3:28 tt
3:31 tt
3:32 tt
3:35 tt
3:36 tt
Flume Vel. 2.0 fps. Sma11 Mouthpiece facing upstream.
Intake Vel. 2.0 fps.
F1ume Mean Intake Reduction % Remarks Turb1d1ty Turbidity ppm ppm
625 632 635 -3 -o.5
640 640 660 -20 -3.1
640 645 640 + 5 +0.8
650
635 642 640 + 2 -0.3
637 640 - 3 -o.5 640
638 640 ... 2 -0.3 635
632 6$0 -18 -2.7 625
630 640 -10 -1.6 635
635 635
640 - s -o.8
640 638 635 + 3 +0 • .5
Total -7.9
Mean = · -o.8%
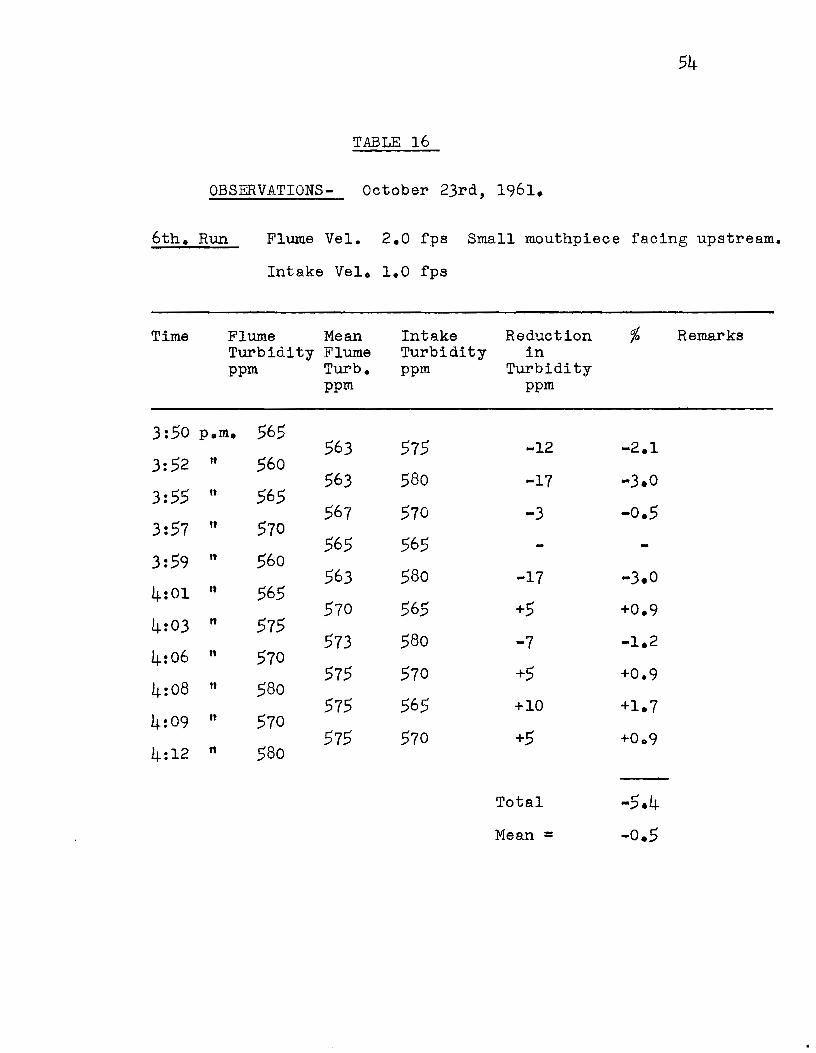
54
TABLE 16
OBSERVATIONS- October 23rd, 1961.
6th. Run
Time
F1ume Ve1. 2.0 fps Sma11 mouthpiece facing upstream.
Intake Ve1. 1.0 fps
F1ume Mean Intake Reduction Re marks Turbidity F1ume Turbidity in ppm Turb. ppm Turbidity
ppm ppm
3:50 p.m. 565 563 575 -12 -2.1
3:52 11 560 563 580 -17 -3.0
3:55 tt 565 567 570 -3 -o.5
3:57 tt 570 565 565
3:59 ft 560 563 580 -17 -3.0
4:01 ft 565 570 565 +5 +0.9
4:03 11 575 573 580 -7 -1.2
4:06 " 570 575 570 +5 +0.9
4:08 n 580 575 565 +10 +1.7
4:09 lt 570 575 570 +5 +Oo9
4:12 n 580
Total -5.4
Mean = -o.5
55
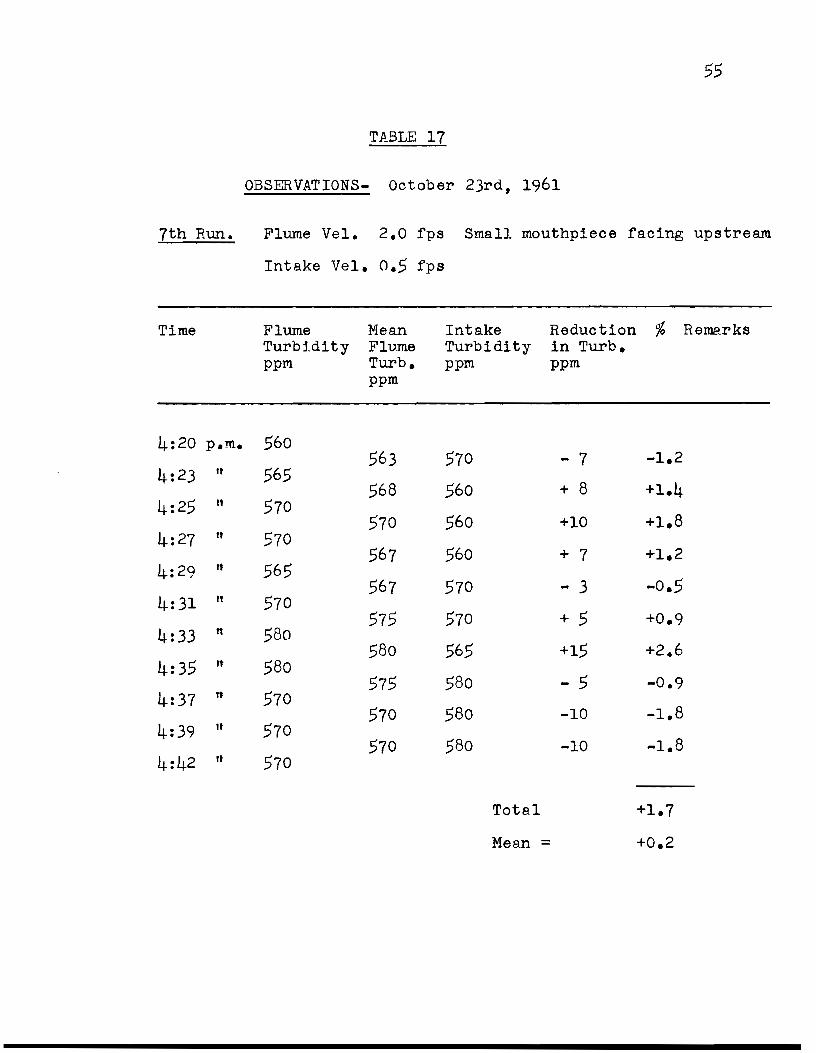
TABLE 17
OBSERVATIONS- October 23rd, 1961
7th Run. F1ume Vel. 2.0 fps Sma11 mouthpiece facing upstream
Intake Ve1. 0.5 fps
Ti me
4:20 p.m.
4:23 lt
4:25 " 4:27 lt
4:29 tt
4:31 n
4:33 " 4:35 tt
4:37 tt
4:39 n
4:42 rt
F1ume Turbldity pp Ill
560
565
570
570
565
570
580
580
570
570
570
Mean Flume Turb. ppm
563
568
570
567
567
575
580
575
570
570
Intake Turbidity ppm
570
560
560
560
570
570
565
580 580
580
Total
Reduction in Turb. ppm
... 7
+ 8
+10
+ 7
- 3
+ 5
+15
- 5 -10
-10
Mean=
% Remarks
-1.2
+1.4
+1.8
+1.2
-o.5
+0.9
+2.6
-0.9
-1.8
-1.8
+1.7
+0.2

56
TABLE 18
OBSERVATIONS- October 24th 1 1961.
1st.Run F1ume Ve1. 2 fps Sma11 mouthpiece straight-out
Intake Ve1. 4 fps
Ti me
10:32 a.m.
10:35 tt
10:38 tt
10:40 tl
10:42 tt
10:44 " 10:46 rt
10:48 rt
10:50 rt
10:52 " 10:54 "
F1ume Turbidity ppm
690
530
555 540
535
575 560
560
540
570
550
Mean Flume Turb. ppm
610
542
547
537
555 565
558
550
555 560
Intake Reduction Rems.rks Turbidity in Turb. ppm ppm
) These read-565 +45 +7.4 ) ings were
) probably
570 -28 -5.2 taken be-fore flume
540 + 7 +1.3 conditions had become
540 - 3 -0.5 stable.
565 -10 -1.8
560 + 5 +0.9
565 - 7 -1.3
560 -10 -1.8
565 -10 -1.8
550 +10 +1.8
Total -1.0
Mean = -0.1
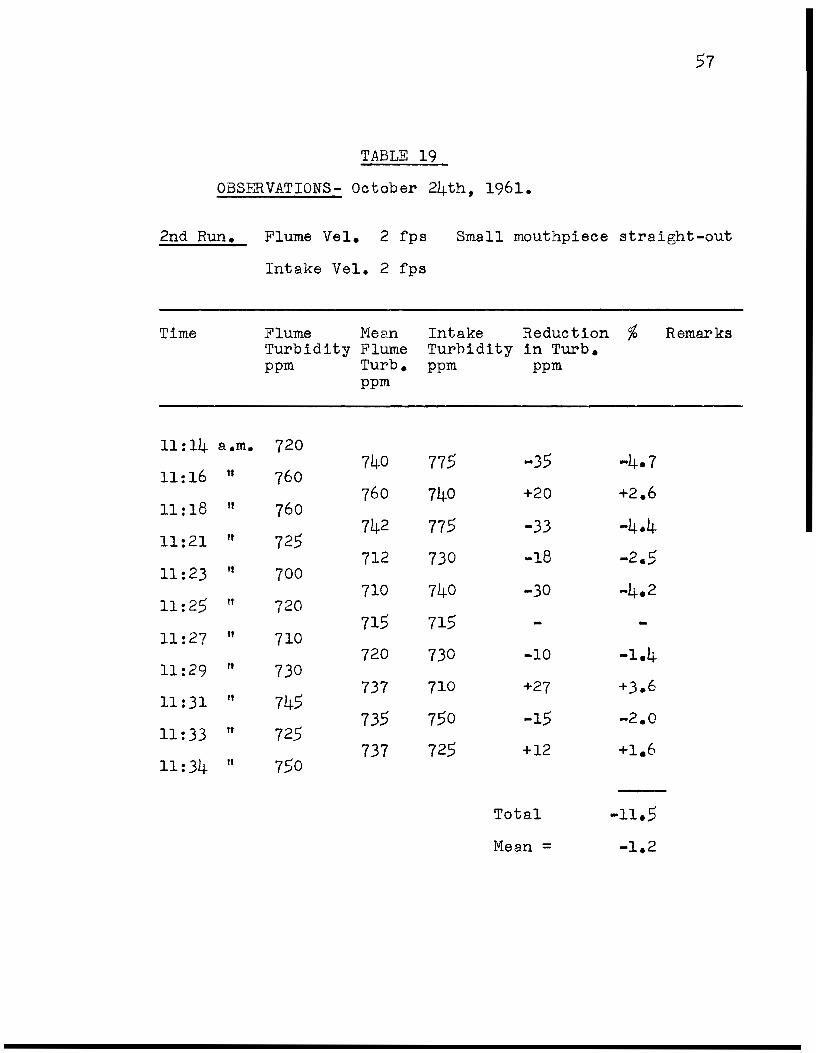
TABLE 19
OBSERVATIONS- October 24th, 1961.
57
2nd Run. Flume Vel. 2 fps Small mouthpiece straight-out
Intake Vel. 2 fps
Time
11:14 a.m.
11:16 n
11:18 lt
11:21 If
11:23 Il
11:25 ft
11:27 tt
11:29 tt
11:31 ft
11:33 n
11:34 11
F1ume Mean Turbidity Flume ppm Turb.
ppm
720
760 740
760 760
725 742
712 700
710 720
715 710
720 7.30
737 745
735 725
737 750
Intake Reduction % Remarks Turbidity in Turb. ppm ppm
775 -.35 -4.7
740 +20 +2.6
775 -.3.3 -4.4
7.30 -18 -2.5
740 -30 -4.2
715 -7.30 -10 -1.4
710 +27 +3.6
750 -15 -2.0
725 +12 +1.6
Total -11.5
Mean = -1.2
58
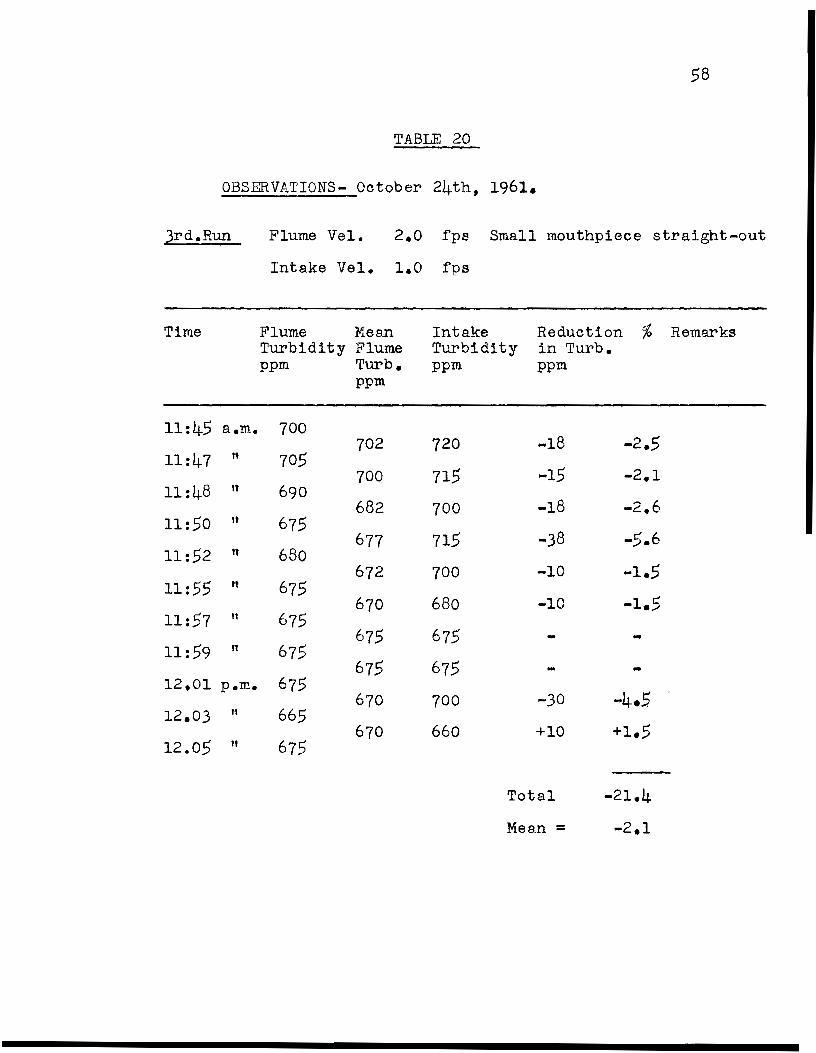
TABLE 20
OBSERVATIONS• October 24th, 1961.
3rd.Run Fiume Vel. 2.0 fps Sma11 mouthpiece straight-out
Intake Vel. 1.0 fps
Ti me Fiume l-1ean Intake Reduction % Remarks Turbidity Flume Turbidity in Turb. ppm Turb. ppm ppm
ppm
11:45 a.m. 700 702 720 -18 -2.5
11:47 " 705 700 715 -15 -2.1
11:48 tt 690 682 700 -18 -2.6
11:50 tt 675 677 715 -38 -5.6
11:52 tt 680 672 700 -10 -1.5
11:55 tt 675 670 680 -10 -1.5
11:57 tt 675 675 675
11:59 n 675 675 675 -12.01 p.m. 675 670 700 -30 -4.5.
12.03 tt 665 670 660 +10 +1.5
12.05 tt 675
Total -21.4
Mean= ... 2.1

59
TABLE 21
OBSERVATIONS- October 24th, 1961.
4th Run. Flume Vel. 2.0 fps Sma11 ro.outhpiece straight-out
Intake Ve1. 0.5 fps
Ti me
1:12 p.m.
1:14 tt
1:16 lt
1:18 11
1:20 n
1:22 tt
1:24 tt
1:26 n
1:28 tt
1:29 n
1:31 tt
Flume Turbidity ppm
600
600
600
600
600
600
600
600
610
600
600
Mean Flume Intake Turbidity Turbidity ppm ppm
600 600
600 595
600 625
600 625
600 610
600 600
600 610
605 600
605 595
600 600
Reduction % in Turb. pp m.
... + 5 +0.8
-25 -4.1
-25 -4.1
-10 -1.6
-10 -1.6
+ 5 +0.8
+10 +1.6
Total -8.2
J!.1ean = -o.e

TABLE 22
OBSERVATIONS- October 25th, 1961.
60
1st. Run F1ume Ve1. 2 fps Large ( 5n diam.) mouthpiece facing upstream.
Ti me
10:1.5
10:17
10:19
10:21
10:23
10:25
10:27
10:29
10:31
10:33
10:35
Intake Ve1. 4 fps
F1ume Turbidity ppm
a.m. 88.5
n 890 tt 87.5 tt 895
tt 845 n 835 tt 830
tt 835 tt 800
n 815
n 790
Mean F1ume Turb. ppm
887
882
885
870
840
832
832
817
807
802
Intake Turbidity ppm
900
890
875
900
840
84.5
8.50
82.5
82.5
Boo
Reduction in Turb.
ppm
- 3
- 8
+10
-30
-13
-18
- 8
-18
+ 2
Total
Mean =
% Remarks
-0.3
-0.9
+1.1
-3.5
-1.5
-2.1
-0.9
-2.1
+0.3
-9.9
-1.0

2nd. Run
Ti me
TABLE 23
OBSERVATIONS • October 25th, 1961
F1ume Ve1. 2.0 fps Large mouthpiece facing upstream
Intake Ve1. 2 fps
61
F1ume Mean Turbidi ty F1ume ppm Turb.
Intake Turb. ppm
Reduction % Remarks in Turb.
ppm ppm
10:43 p.m. 740
10:45 tt 735 725 +10
730
10:47 rt 710 720 755 -35
10:49 lt 720 730 -10
730
10:51 " 720 725 720 + 5
10:53 tt 680 700 720 -20
10:54 tt 715 697 730 -33
11:02 n 670 692 755 -63
11:04 tt 660 665 675 -10
11:06 lt 650 655 680 -25
11:08 tt 650 650 670 -20
Total
Mean =
* this reading not considered in total and mean.
+1.3
-4.8
-1.3
+0.7
-2.8
-4.7
-9.1 * Note long interval
-1.5 between
-3.8 readings.
... 3.0
-19.9
-2.2

TABLE 24
OBSERVATIONS - October 25th, 1961.
62
3rd. Run. Flume Vel. 2.0 fps Large mouthpiece facing upstream
Time
11:14 a.m.
11:16 lt
11:19 tt
11:21 n
11:23 ft
11:25 tt
11:27 lt
11:29 n
11:30 tt
11:31 ft
11:33 lt
Intake Vel. 1.0 fps
F1ume Turb. ppm
655
630
650
650
640
640
630
630
625
635
600
Mean Fiume Turb. ppm
642
640
650
645
640
635
630
627
630
617
Inta.ke Turb. ppm
640
650
660
650
640
640
625
6~5
630
625
Reduction in Turb. ppm
+ 2
-10
-10
- 5
- 5 + 5
+ 2
... 8
Total
JVlean =
Rema.rks
+0.3
-1.6
-1.6
-o.a
-o.a +0.8
+0.3
-1.3
-4.7
... o.4

TABLE 25
OBSERVATIONS - October 25th, 1961.
63
4th Run. F1ume Ve1. 2.0 fps
o.5 fps
Large mouthpiece facing upstream
Time
11:46
11:48
11:51
11:53
11:55
11:57
11:59
Intake Ve1.
F1ume Mean Turb. F1ume ppm Turb.
ppm
a.m. 605 615
t1 625 620
tt 615 615
tt 615 620
lt 625 617
ft 610 610
tt 610 612
12:01 p.m. 615 617
12:03 11 620 622
12:05 tt 625 605
12:07 tt 585
Intake Turb. ppm
770
600
610
600
600
595
595
590
575
590
Reduction % in Turb.
ppm
-155-l}
+20 +3.2
+ 5 +0.8
+20 +3.2
+17 +2.7
+15 +2.4
+17 +2.7
+27 +4.3
+47 +7.5
+15 +2.4
Total +29.2
.lV1ean = +3.2
* This reading not considered in total and mean.
Remarks

TABLE 26
OBSERVATIONS- October 25th, 1961
5th.Run. Flume Vel. 2.0 fps Large mouthpiece facing downstream
Intake Ve1. 4.0 fps
64
Time Flume Turb. ppm
Melin Flume Turb.
Intake Turb.
ppm.
Reduction in Turb.
ppm
% Remarks
ppm
12:18 p.m. 570 575 -o.5 572 .. 3
12:21 tt 575 567 575 - 8 -1.4
12:23 tt 560 565 570 - 5 -0.9
12:24 ft 570 572 575 - 3 -o.5
12:26 ft 575 567 560 + 7 +1.3
12:28 n 560 560 575 -15 -2.6
12:29 tt 560 560 560
12:31 ft 560 555 570 -15 -2.6
12:33 tt 550 555 570 -15 -2.6
12:35 ft 560 555 570 -15 -2.6
12:37 lt 550
Total -12.4
Mean = -1.2
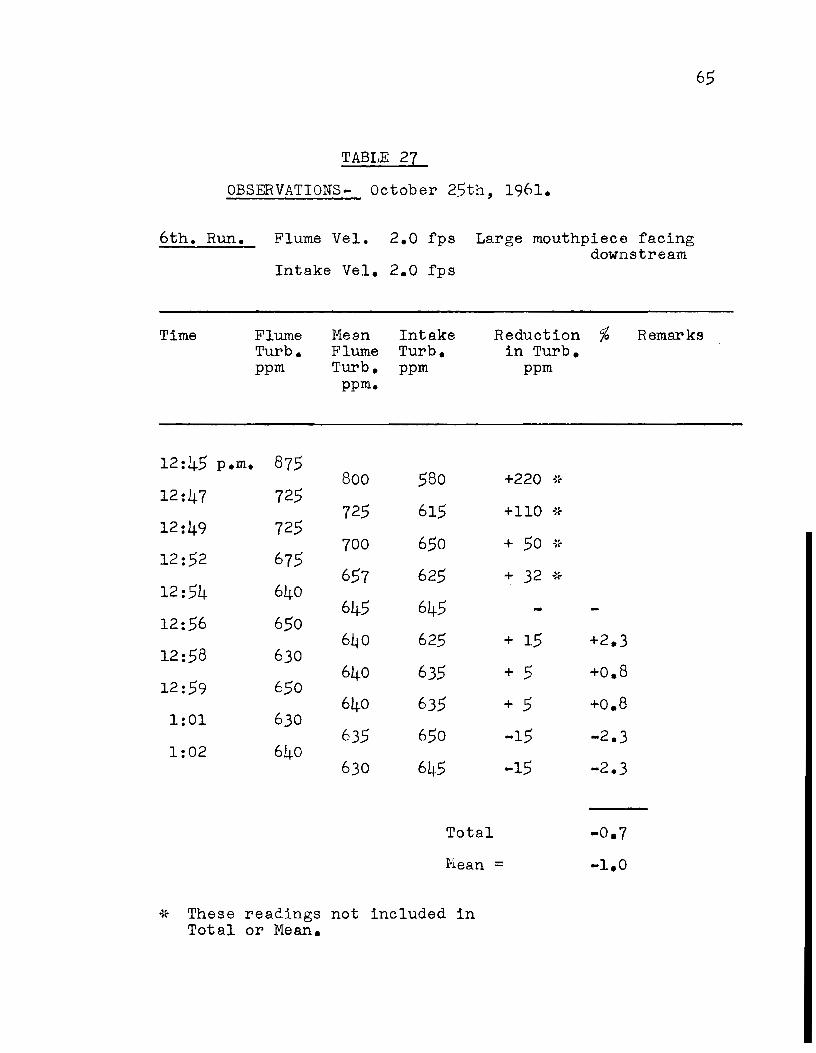
TABLE 27
OBSERVATIONS- October 25th, 1961.
6th. Run. F1ume Ve1. 2.0 fps Large mouthpiece facing downstream
Intake Ve1. 2.0 fps
65
Ti me F1ume Turb. ppm
Me sn F1ume Turb.
Intake Turb. ppm
Reduction % in Turb.
ppm
Remarks
pp m.
12:45 p.m. 875 800 580
12:47 725 725 615
12:49 725 700 650
12:52 675 657 625
12:54 640
12:56 650 645 645
640 625 12:58 630
640 635 12:59 650
640 635 1:01 630
635 650 1:02 640
630 645
Total
Nean =
* These readings not included in Total or Mean.
+220 ~(
+110 * + 50 * + 32 *
...
+ 15 +2.3
+ 5 +0.8
+ 5 +0.8
-15 -2.3
-15 -2.3
-0.7
-1.0
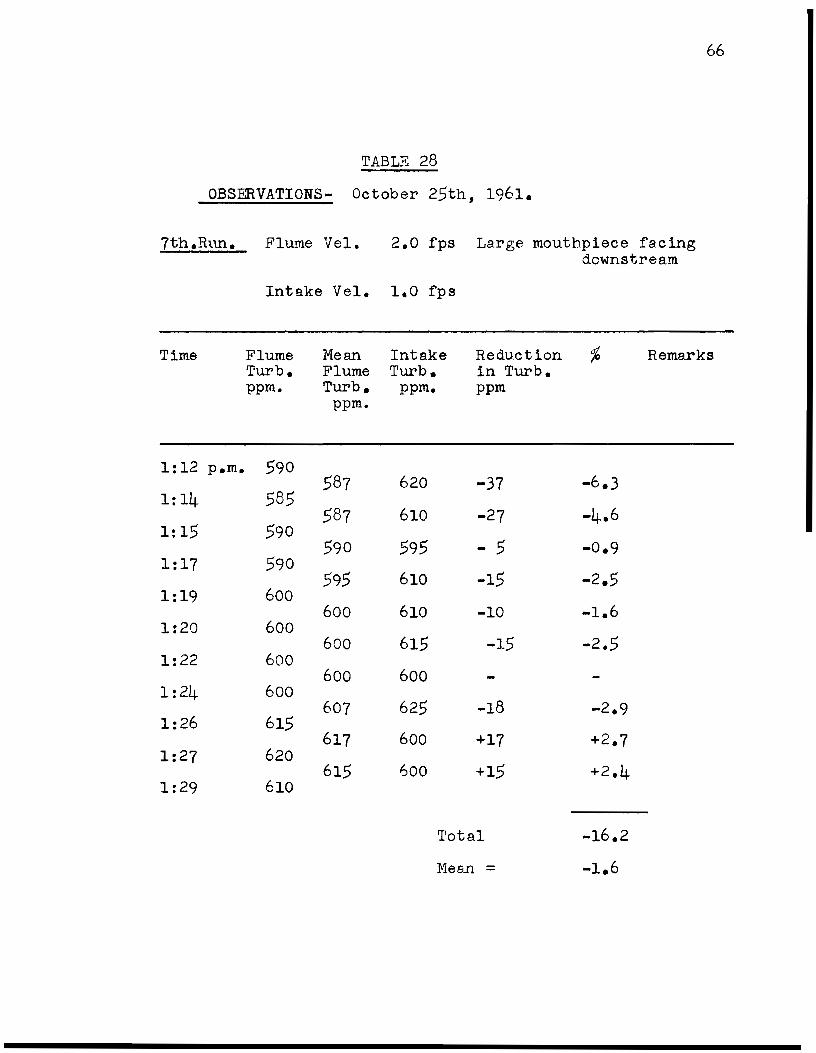
TABLE 28
OBSERVATIONS- October 25th, 1961.
7th.Rnn. Fiume Vel. 2.0 fps Large mouthpiece facing dcwnstream
Intake Vel. 1.0 fps
66
Ti me Flume Turb. pp m.
Mean Intake Fiume Turb. Turb. ppm.
Reduction % in Turb.
Remarks
ppm ppm.
1:12 p.m. 590 587 620 -37 -6.3
1:14 585 587 610 -27 -4.6
1:15 590 590 595 - 5 -0.9
1:17 590 595 610 -15 -2.5
1:19 600 600 610 -10 -1.6
1:20 600 600 615 -15 -2.5
1:22 600 600 600
1:24 600 607 625 -18 -2.9
1:26 615 617 600 +17 +2.7
1:27 620 615 600 +15 +2.4
1:29 610
Total -16.2
Mean = -1.6
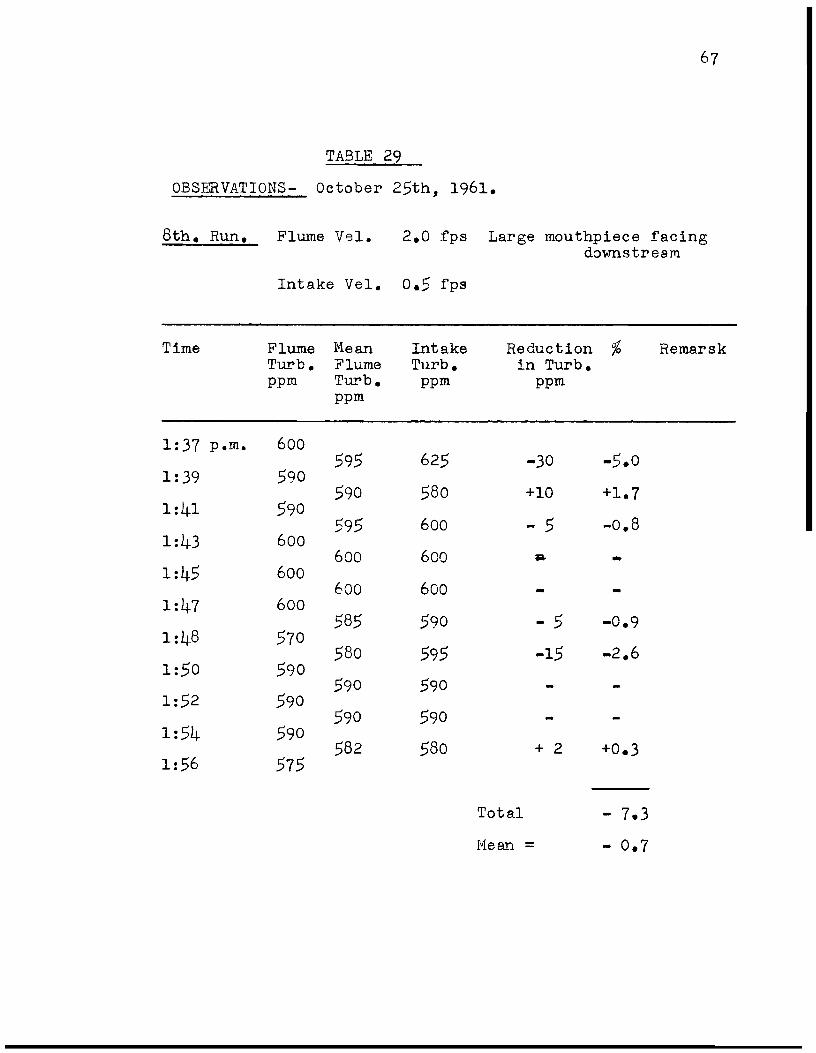
TABLE 29
OBSERVATIONS- October 25th, 1961.
67
8th. Run. F1ume Ve1. 2.0 fps Large mouthpiece facing dol-rnstresm
Intake Ve1. 0.5 fps
Time F1ume }1ean Intake Reduction % Remarsk Turb. F1ume Turb. in Turb. ppm Turb. ppm ppm
ppm
1:37 p.m. 600 595 625 -30 -.5.0
1:39 .590 590 580 +10 +1.7
1:41 .590 595 600 - 5 -o.8
1:43 600 600 600 .. -1:45 600 600 600 -
1:47 600 58.5 590 - 5 -0.9
1:48 570 580 595 -15 -2.6
1:50 590 .590 .590
1:.52 590 590 .590
1:.54 590 .582 .580 + 2 +0.3
1:56 575
Total - 7.3
Mean = - 0.7

TABLE 30
OBSERVATIONS - October 26th, 1961.
lst.Run. Flume Vel. 2.0 fps Large mouthpiece facing upstream
Intake Ve1. 0.75 fps
Time F1ume 1-Iean Intake Reduction Remarks Turb. F1ume Turb. in Turb. ppm Turb. ppm ppm
ppm
12:54 p.m. 990 985 950 +35 +3.5
12:55 980 970 970
12:57 960 952 955 ... 3 -0.3
12:59 945 950 955 - 5 -0.5
laOO 955 940 950 -10 -1.1
1:01 925 935 860 +75 +8.5
1:03 945 947 905 +42 +4.4
1:04 950 935 875 +70 +7.5
1:06 92~ 922 900 +22 +2.4
1:08 925 900 905 - 5 -0.5
1:12 875
Total +23.4
Mean= + 2.3
68

TABLE ,21
OBSERVATIONS - October 26th, 1961
2nd.Run F1ume Ve1. 2.0 fps Large mouthpiece facing upstream
Intake Ve1. 1.5 fps
69
Ti me Flume Turb. pprn.
Mean F1umo Turb.
Intake Turb. ppm
Reduction in Turb. ppm
% Remarks
ppm
1:30 p.m. B20 B20 B40 -20 ... 2.4
1:32 B20 B17 B40 -23 -2.8
1:33 B15 Bl7 B25 - B -1.0
1:3.5 B20 Bl5 B15 -
1:37 BlO Boo B25 -25 -3.1
1:39 790 792 B35 -43 -5.4
1:41 795 787 B20 -33 -4.2
1:43 780 7B5 Boo -15 -1.9
1:45 790 787 790 - 3 -0.4
1:46 785 782 795 -13 -1.6
1:48 780
Total -22.8
Mean = -2.3

CHAPTER Vl
DISCUSSION OF RESULTS
A. Apparatus and Methods.
10
Before proceeding with an analysis of the resulta obtained
in this experiment, it would be in order to carefully examine
the apparatus and methods used.
In actual practice a crib is generally built around the
intake mouthpiece to prevent its being damaged by partially sub
merged or floating debris. If the crib is not used, the mouth
piece may be protected by piles driven into the riverbed, up
stream from the mouthpiece. This crib or protective piling
might have an effect upon the hydraulic characteristics of the
intake. It may be suggested for an important intake, that
model studies using a properly scaled model of the intak~ be
carried out.
The fundamental part of the model used in this experiment
is the intake itself. The flume is only required to establish
hydraulic similarity between the intake mouthpiece of the model
and that of the prototype. Since the intake is below the sur
face thus having no wave-making quality, and since it occupies
a very small fraction of the cross-section of the stream and
thus has low-pressure resistance, Froude 1 s number may be
neglected. Friction forces predominate in determining the
characteristics of flow and therefore the Reynolds number should
be the same for both modal and prototype. This is confirmed by

71
Binder who states "For ••• f1ow in which bodies are fu11y
immersed in a f1uid {as vehic1es, submarines, aircraft and
structures) in such a fashion that free surfaces do not enter
into consideration and gravity forces are found by buoyant
forces, the inertia and viscous forces are the only ones which
need to be taken into account."5 Reynolds number is a dimen-
sionless number which expresses the ratio of
Where
The ratio
Inertia force Viscous force R = ;0 VL
--;;:-R - Reynolds number
L - any characteristic length
V - relative fluid velocity
?
?;a =
density of fluid
viscosity of fluid
1 ----fA- 7
Where: ~ = The kinematic viscosity
For water at 50°F. y = 1.410 x 10 -5
Therefore, assuming that the prototype has a diameter of
two feet which may be considered as representative of small in-
takes in rivers and that the average velocity in the stream is
2.5 ft. per second, the Reynolds number of the prototype:
R = V L -y = 2. x 2.0 c'
1. 10 x 10 -:;; = 365,000
5. "Fluid Mecha.nics 11 by R.C.Binder, Ph.D, Second Edition, Published by Prentice-Hall Inc., 1949 Page 8o.
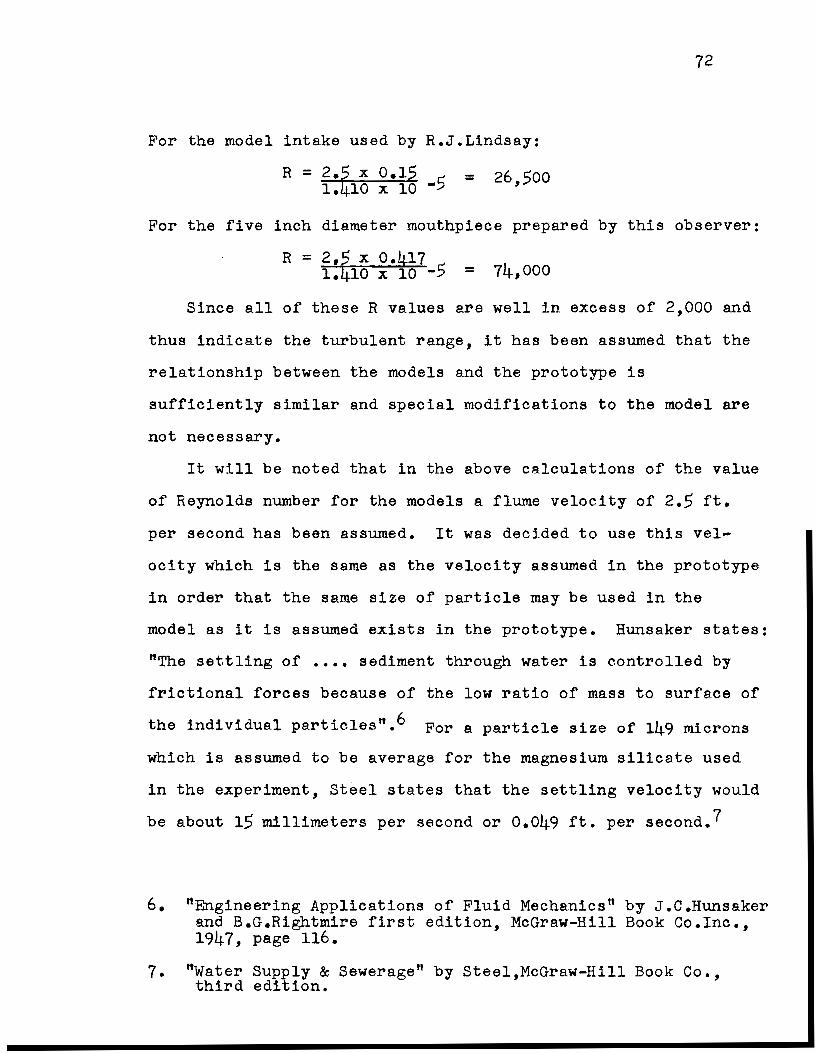
72
For the model inta.ke used by R.J .Lindsay:
For the five inch diameter mouthpiece prepared by this observer:
R = 2.5 x 0.417 5 1.410 x 10 - = 74,000
Since all of these R values are we11 in excess of 2,000 and
thus indicate the turbulent range, it has been assumed that the
relationship between the models and the prototype is
sufficiently similar and special modifications to the model are
not necessary.
It will be noted that in the above calculations of the value
of Reynolds number for the models a flume velocity of 2.5 ft.
per second has been assumed. It was decided to use this vel-
ocity which is the same as the velocity assumed in the prototype
in order that the same size of particle may be used in the
model as it is assumed exista in the prototype. Hunsaker states:
"The settling of •••• sediment through water is controlled by
frictional forces because of the low ratio of mass to surface of
the individual particles".6 For a particle size of 149 microns
which is assumed to be average for the magnesium silicate used
in the experiment, Steel states that the settling velocity would
be about 15 millimeters per second or 0.049 ft. per second.?
6. "Engineering Applications of Fluid Mechanics" by J.C.Hunsaker and B.G.Rightmire first edition, McGraw-Hill Book Co.Inc., 1947, page 116.
7. "water Supply & Sewerage" by Steel,McGraw-Hill Book Co., third edition.
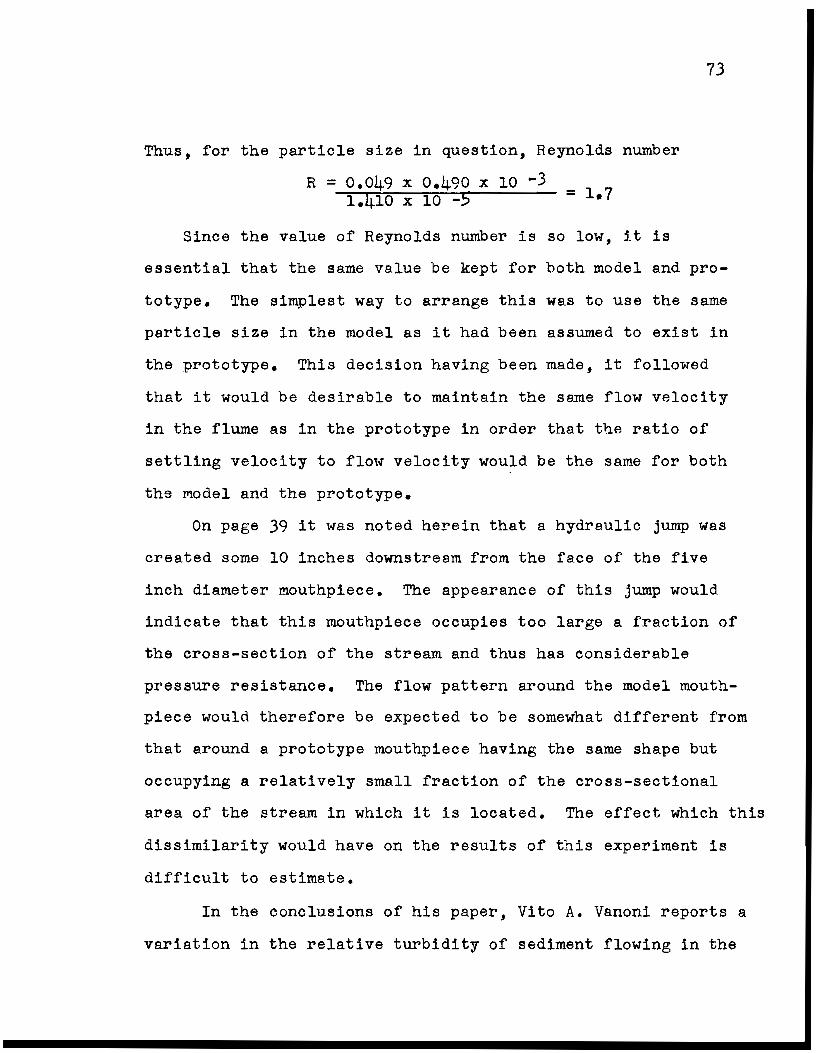
Thus, for the particle size in question, Reynolds number
R = 0.049 x 0.490 x 10 -3 1.410 x 10 -5 = 1•7
73
Since the value of Reynolds number is so low, it is
essential that the same value be kept for both model and pro-
totype. The simplest way to arrange this was to use the same
particle size in the model as it had been assumed to exist in
the prototype. This decision having been made, it followed
that it would be desirable to maintain the same flow velocity
in the flume as in the prototype in order that the ratio of
settling velocity to flow velocity would be the sam~ for both
the model and the prototype.
On page 39 it was noted herein that a hydraulic jump was
created some 10 inches downstream from the face of the five
inch diameter mouthpiece. The appearance of this jump would
indicate that this mouthpiece occupies too large a fraction of
the cross-section of the stream and thus has considerable
pressure resistance. The flow pattern around the model mouth
piece would therefore be expected to be somewhat different from
that around a prototype mouthpiece having the same shape but
occupying a relatively small fraction of the cross-sectional
area of the stream in which it is located. The effect which this
dissimilarity would have on the resulta of this experiment is
difficult to estimate.
In the conclusions of his paper, Vito A. Vanoni reports a
variation in the relative turbidity of sediment flowing in the

74
8 stream with depth from the surface of the stream. In these
experimenta the center line of the intake is fixed at a con
stant depth below the surface of the stream, and samples which
were taken through the intake therefore represent sorne function
of the apparent turbidity at that depth. On the other hand,
samples taken at the end of the flume to indicate the flume
turbidity were integrated samples since some water from all
depths was collected in the sampling peil. In the case of the
five-inch diameter mouthpiece, the intake sample would be an
integrated sample taken from 50% of the depth of the flow.
Since the variation in turbidity with depth depends upon the
variation in particle size, it would be necessary to carry out
additional comprehensive measurements for this particular flume
and particle aize in order to chart the actual variations. Once
aga in, it is difficult to determine the effect of this
phenomenon on the resulta of this experiment.
B. Probable Errors and Summarz of Resulta.
~e turbidimeter was read directly to 25 ppm although the
meter scale was graduated so that it could be interpreted to
the nearest 5 ppm. (see meter scale on Plate Vl). Since the tur
bidity readings during the experiment varied from approximately
550 ppm to 900 ppm, it therefore follows that the experimental
error in reading the meter would be less than ± 1% for a single
reading. The readings obtained actually showed a much greater
8. Vanoni, op.cit., page 2
75
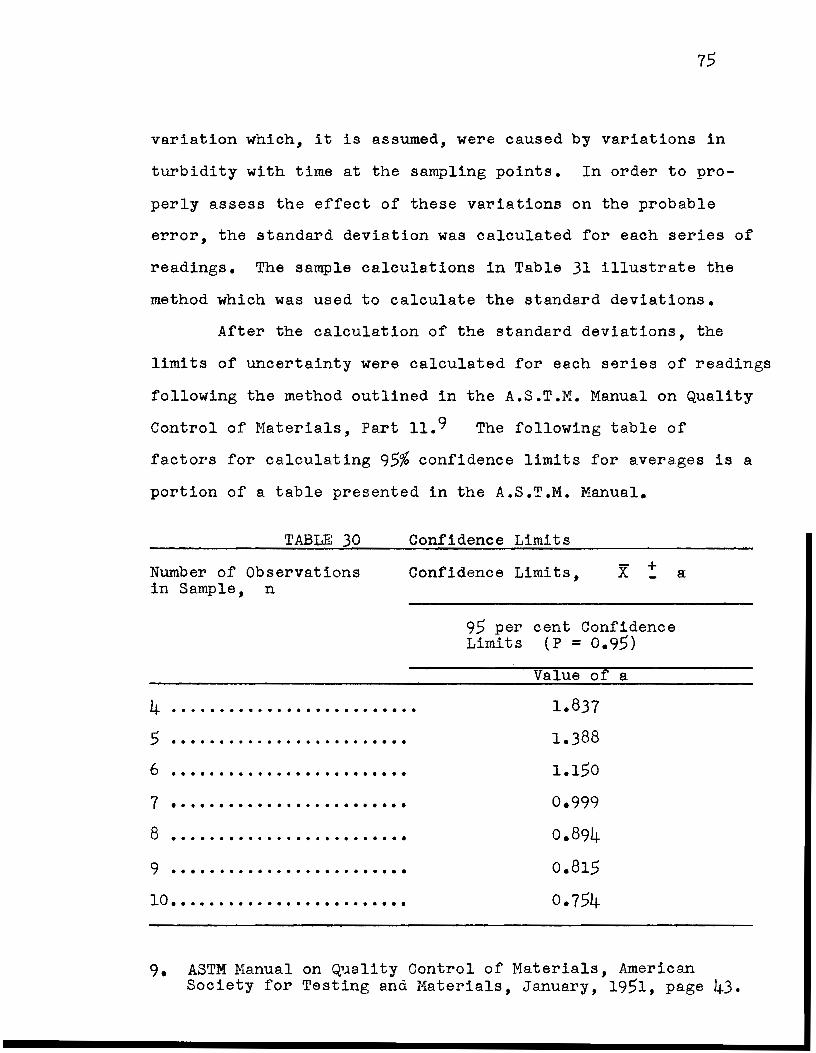
variation which, it is assumed, were caused by variations in
turbidity with time at the sampling points. In order to pro-
perly assess the effect of these variations on the probable
error, the standard deviation was calculated for each series of
readings. The sample calculations in Table 31 illustrate the
method which was used to calculate the standard deviations.
After the calculation of the standard deviations, the
limits of uncertainty were calculated for each series of readings
following the method outlined in the A.S.T.M. Manual on Quality
Control of Materials, Part 11.9 The following table of
factors for calculating 95% confidence limita for averages is a
portion of a table presented in the A.S.T.M. Manual.
TABLE 30
Number of Observations in Sample, n
Confidence Limits
Confidence Limits, +
95 per cent Confidence Limits (P = 0.95)
Value of a
4 .............•.........•.. 1.837
1.388
1.150
0.999
o.B94
0.815
0.754
5 ••••.••.•..••••••••..••••
6 •••••••••••••••••••••••••
7 • . . • • . . . . . • • . . . . . . • . . . • • •
8 . . . . . . . . . . . . . . . . . . . . . . . . . 9 •••••••••••••••••••••••••
10 ••••••••••••••••••.••••••
9. ASTM Manual on Quality Control of Materials, American Society for Tes ting and Materials, Janue_ry, 1951, page 43.
76
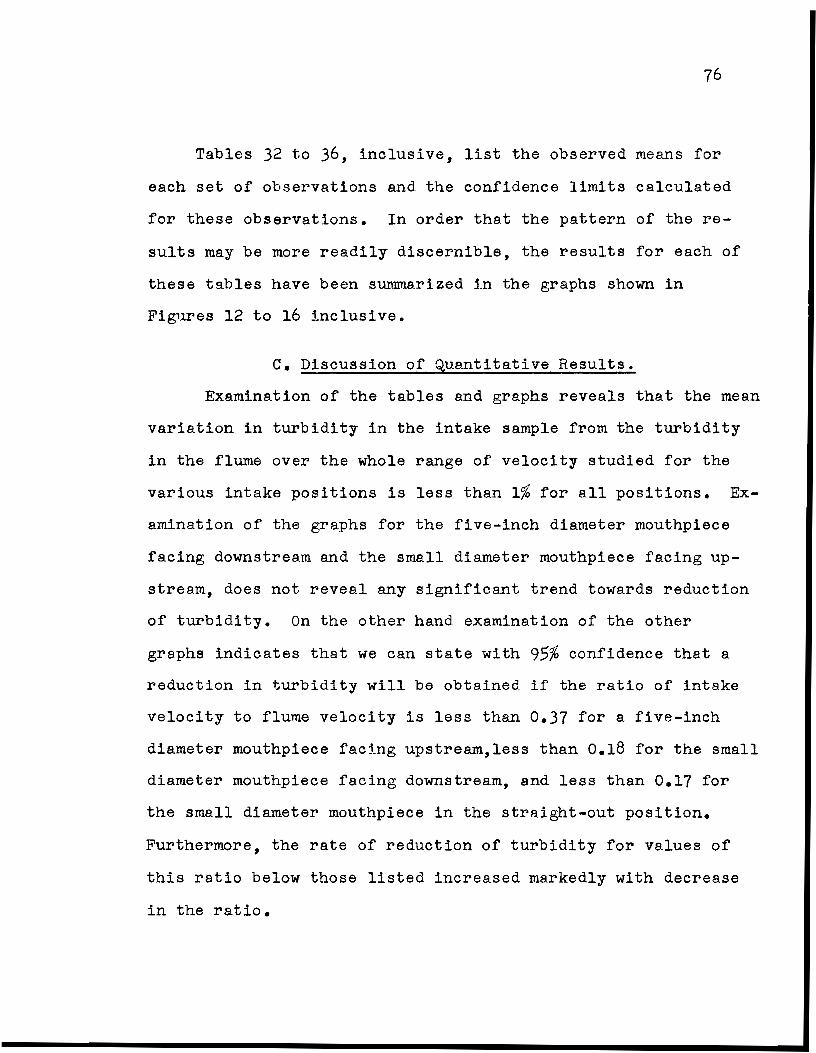
Tables 32 to 36, inclusive, list the obaerved means for
each set of observations and the confidence limita calculated
for these observations. In order that the pattern of the re
sulta may be more readily discernible, the resulta for each of
these tables have been aummarized ln the graphs shown in
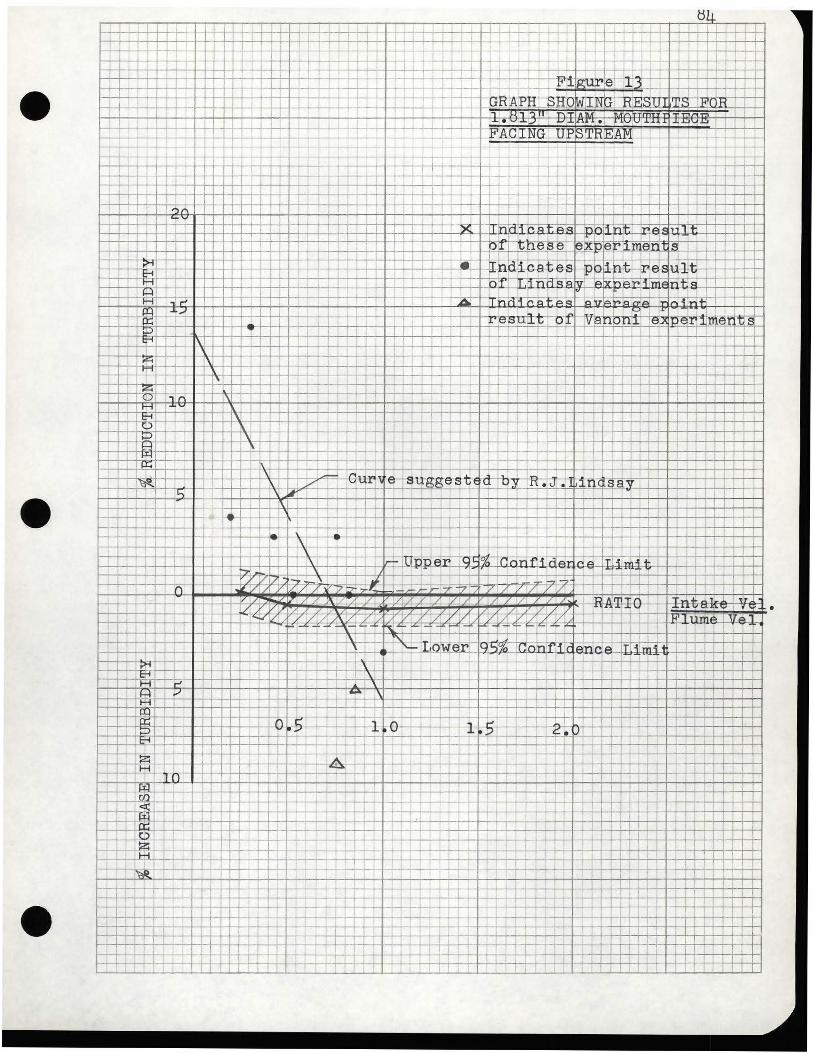
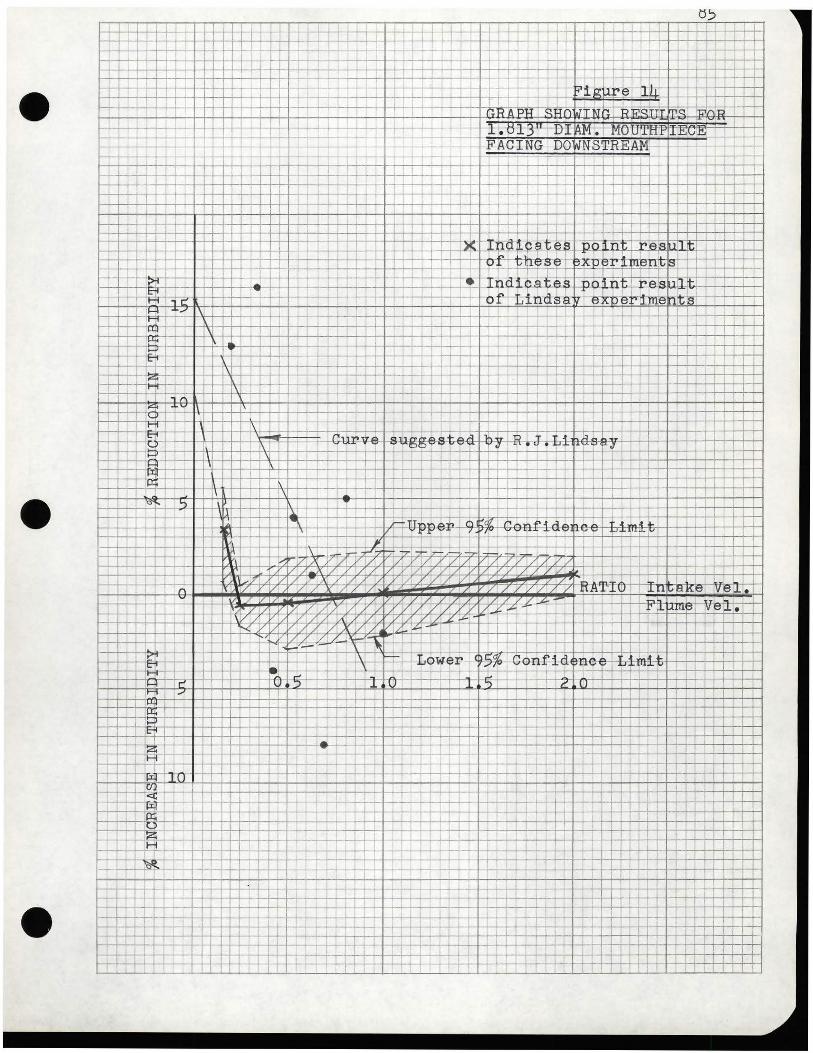
Figures 12 to 16 inclusive.
c. Discussion of ~uantitative Resulta.
Examination of the tables and graphs reveals that the mean
variation in turbidity in the intake sample from the turbidity
in the flume over the whole range of velocity studied for the
various intake positions is lesa than 1% for all positions. Ex
amination of the graphs for the five-inch diameter mouthpiece
facing downstream and the small diameter mouthpiece facing up
stream, does not reveal any significant trend towards reduction
of turbidity. On the other hand examination of the other
graphs indicates that we can atate with 95% confidence that a
reduction in turbidity will be obtained if the ratio of intake
velocity to flume velocity is less than 0.37 for a five-inch
diameter mouthpiece facing upstream,less than 0.18 for the small
diameter mouthpiece facing downstream, and less than 0.17 for
the small diameter mouthpiece in the straight-out position.
Furthermore, the rate of reduction of turbidity for values of
this ra.tio below those listed increased markedly with decrease
in the ratio.

F1ume Turb. ppm
572
567
565
572
567
560
560
555
555
555
!"lean
TABLE 31
Samp1e Ca1cu1ation of Standard Deviation.
A -555
17
12
10
17
12
5
5
A2
289
144
100
289
144
25
25
1016 101.6 60.8 4o.8
= 6.4 ppm
% Reduction, R
-cl.5
-1.4
-0.9
-0.5
+1.3
-2.6
-2.6
-2.6
-2.6
77
R2
0.25
1.96
o.81
0.25
1.69
6.76
6.76
6.76
6.76
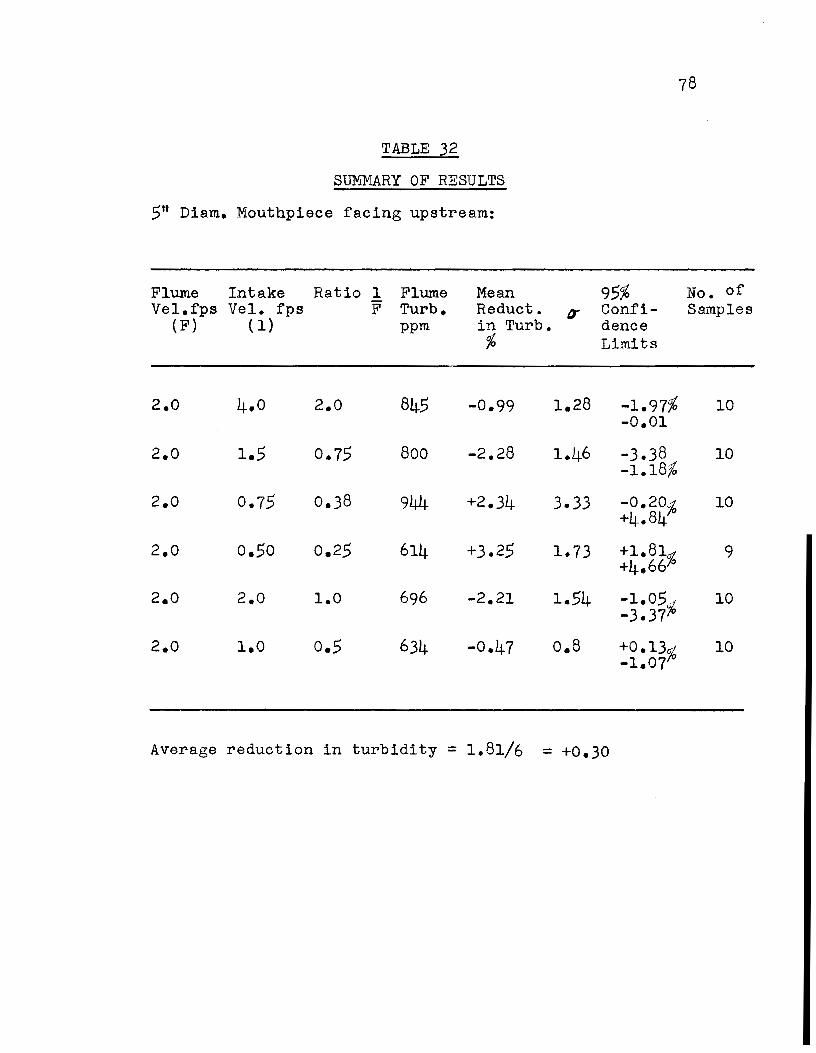
TABLE 32
SUMMARY OF RESULTS
.5" Diam.. Mouthpiece facing upstream.:
F1um.e Intake Ratio 1 Ve1.fps Ve1. fps F
(F) (1}
2.0 4.0 2.0
2.0 1 • .5 0.75
2.0 0.7.5 0.38
2.0 o • .so 0.2.5
2.0 2.0 1.0
2.0 1.0 o.5
F1ume Turb. pp m.
84.5
800
944
614
696
634
Mean Reduct. tr in Turb. %
-0.99 1.28
-2.28 1.46
+2.34 3.33
+3.2.5 1.73
-2.21 1.54
-0.47 o.8
95% Confidence Limits
-1.97% -0.01
-3.38 -1.18%
-0.20% +4.84
+1.81% +4.66
-1.0.5% -3.37
+0.13% -1.07
Average reduction in turbidity = 1.81/6 = +0.30
No. of Samp1es
10
10
10
9
10
10

TABLE 33
SUMMARY OF RESULTS
5" Diam. Mouthpiece facing downstream:
F1ume Ve1.fps
(F)
2.0
2.0
2.0
2.0
2.0
Intake Ve1.fps
( 1)
1.0
4.0
2.0
1.0
o.5
Ratio 1 F
o.5
2.0
1.0
o.5
0.25
F1ume Mean Turb. Reduct. ppm in Turb.
%
793 -0.19
563 -1.24
671 -0.07
599 -1.62
591 -0.73
95% (J Confi
dence Limita
2.17 +1.~5 ' -1. 3 lb
1.25 -0.30 % -2.18
1.31 +1. 75 ::' -1.89 Jo
2.68 +0.41 % -3.65
1.76 +0.60 % -2.10 "
Average reduction in turbidity = 3.85/5 = -0.77
79
No. of Samp1es
10
10
5
10
10
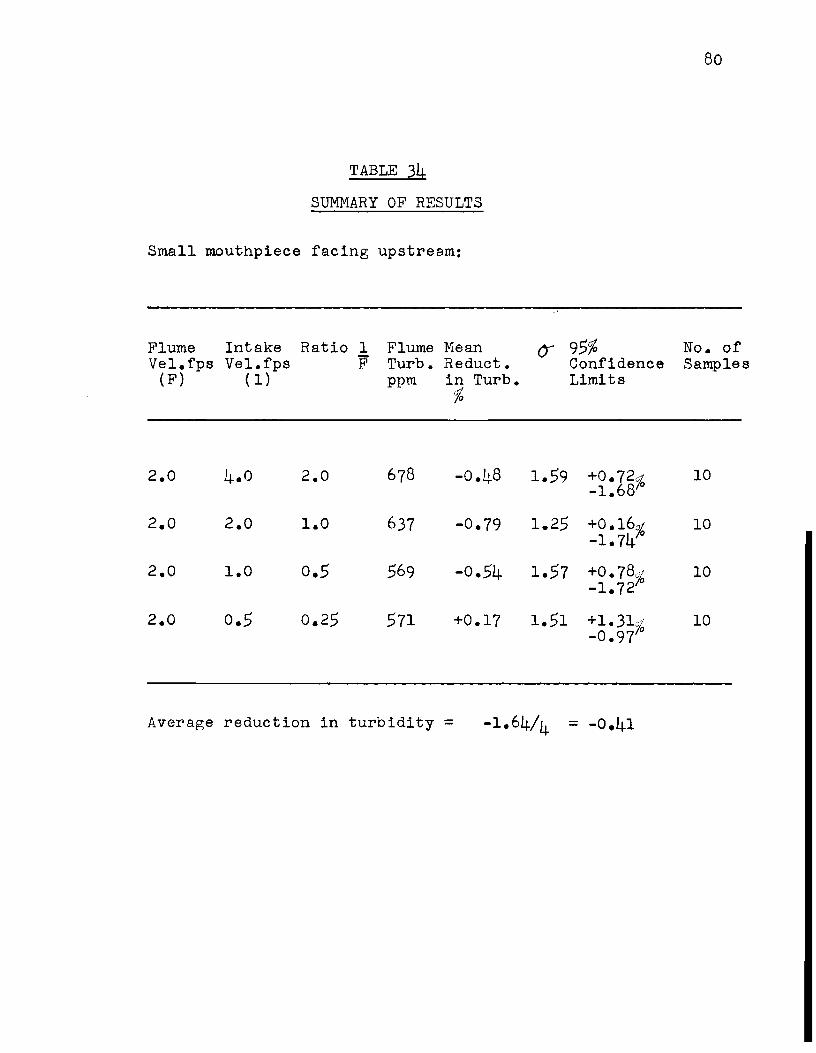
TABLE 34
SUMMARY OF RESULTS
Sma11 mouthpiece facing upstream:
F1ume Intake Ve1.fps Ve1.fps
(F) ( 1)
2.0 4.0
2.0 2.0
2.0 1.0
2.0 o.5
Ratio 1 F
2.0
1.0
o.5
0.25
F1ume Turb. ppm
678
637
569
571
Mean Reduct. in Turb. %
-0.48
-0.79
-0.54
+0.17
Average reduction in turbidity =
() 95% Confidence Limits
1.59 +0.72% -1.68 °
1.25 +0.16% -1.74 °
1.57 +0. 78<11
-1. 72/o
1.51 +1.31% -0.97
80
No. of Samp1es
10
10
10
10

TABLE 35
SUMMARY OF RESULTS
Small mouthpiece facing downstream:
Plume Intake Ratio 1 Plume Vel.fps Vel. fps F Turb.
(F) (1) ppm
3.0 o.5 0.16 887
2.0 2.0 1.0 597
2.0 1.0 o.5o 866
2.0 o.5 0.25 766
2.0 4.0 2.0 732
Mean Reduct. in Turb.
%
+3.42
+0.09
-0.47
-0.61
+1.0
81
CJ 95% No. of
1.93
2.91
3.12
1.42
1.37
Confidence Samples Limita
+6.10 +0.74 % 5
+2.29 -2.11 % 10
+1.88 -2.82% 10
+0.46 -1.68 10
+2.03 -0.03 10
Average reduction in Turbidity = +3.43/5 = +0.68

TABLE 36
S~1ARY OF RESULTS
Sma11 mouthpiece straight-out:
F1ume Intake Ve1.fns Ve1. fps
(F)~ (1)
3.0 o.5
2.0 4.0
2.0 2.0
2.0 1.0
2.0 o.5
Ratio 1 F1ume F Turb.
ppm
0.16 886
2.0 551
1.0 731
o.5o 679
0.25 601
Mean t:r 95% Reduct. Conti-in Turb. denee
% Limits
+1.38 0.75 +2.42 +0.34%
-0.93 2.02 +0.71 -2.57%
-1.14 2.76 +0.94 -3.221&
-2.14 2.11 -0.54 -3.74%
-0.82 1.89 +0.60 -2.2~
Average Reduction in Turbidity = -3.65/5 = -0.73
82
No. of Samp1es
5
9
10
10
10

•
•
•
83
1 1
~~ ~~r+~--1-r~~rr~~~~~~~~rrr+~--~~~~H~a~Al~~- ·~ v~ - ~~~~~~,~~~~++4-H ~r-~~r++'-+++++++~~~~-H~~rr~~~~--~~th~s~ ~~~e~.~--~~~~ H-~,~
1 1 i i
ts4 +-~· +-~~~:tt --;-+-~-~-1.._
i-l H-l- .j. .. ~ i i
-~~-- -tT ---+: !
f- ' 1 -1-~ ~ t--r--+-t- ~ . -- - ~~ - ----,..
• 1 ---~-----'- -------- •FJ: gur~e~· r--+-r+ +-
~ ,~ 1 r- f-+- .,.-.-- ' -t-- ~
' 1 i 1 1 1 1~ 1 ! 1 _GRA'PH >:il1\.. W.l..NU tti:!J;:) ~JI ~S FOR
i ' i 1 • }-f TLT 1
1 !-+- -i- ---- .... 4--+--t- +- -4 -"--+ -' - .._,_____,
~--~ .... _, 1 ...... ru • • f'VV.~H .J..J.:JU.cl ~ + t-+ F ACIN<Y _rrp ê_TR'EAN ....... - '- --+- ...... r- ___..~ ~
........ 1 --· +- 1 t t r t. 1 .,-----,-
..-...--.-- ...---. --+-----'- ............
1 1 ! 1··~ ·t---..-.f- - - -~-' 1 ! _.._._
1
' 1 1
1 - i 1 ! 1 ! i l--+--
1 1 ' : i '
"" 1 1 1 i 1 '
' '-'-' J 1 1 ' 1 1
1 x r. r in! • c ,
' 1
' _,.._
1 -i- 1 q~~ leX le ne l!'t '
. -r- f- ' . 1
[nâ1i~_t.es 1-4-- f-t ~ f-r; ; ~~} +-+-+- ~r=-::-tt_~~.- ~oi ;..., ....! ,, ,.a.
1 . ~
t-1 ..nr::::D n ns a IV _AIX 1"'1 · m~= frit-~ Q ' ~ ' t-' -;,~ ~ ~ .. H ~! ..-' .A ...a..!l '" ":,..;+-:
.X...J 1 J. ·-e-su:tt-crt rv~
':-' • r ~t1tm:ent;~ --,-- -----~ 1 ~JI
D 1 ; 1 1 1 . 1 1
1 t-i 1 1\ i 1 1 ! i i ~- -- -- -+· ' 1
! ;.<:< L T '.i..l __ IT Î 1 1
1 1
1 1
-1-~-1
i ' 1 1 ,_., !-' ~ T ~ ' l T ! ,, 1
;.<:< -' ·t-r-~ 1 1
. Q , , f'\ 1 1 1 1
: 1
t:-i 1 0 1 ! 1 J l_j_ --' l 1 1
• ~ i \ . ~~y j JJ __1_ 1 1 1 JJ. __1_ ' f-i--
' !--> ... t-... ~ -+ _,_ __ _J__._ 1 1
' 1-L( - --r--~
1 1
--t--- - 1 . ,
/~--0-ttl' d-'-bY,_ R • --+---
~ l '-' ~ '-'-ots"' st-E . av T ' I:) \ '1 1 i 1 1 • 1
1 ,"\ ! 1 : J _1 _l JI - f- ~ . 1
i 1 --+ 1 ~~,
1 1 1 1 1 l' ! i 1 .. ' 1 1
' i ' 1 1 \ - i ' : 1 1 -~ .. ~ li 1
.._ - _\ r---- --- ---- - - - -1 1 Î \ ~ner> ~ ~ I'Zi lri'Tif~1 . rl.~.t ~ ~.fm~+
' l'->-: \ --1-W- /:/17 '-z;rJ-n~t. 1 • _., "'? 1
( _/ / • / ~T-77 /LL /.LL // A -.4 .L .L-/.-..4-- / / L 1k L -./ 1 L L .L < F 1-Aqq:e r .... . ..
// / ' - / /\ '/'y / / /Y'7 -!/ / / / H' lm u.:. 1 1-":::::.. ~- '"'\ n; -. - r r 1 J.L: 1 '
•
1 ~'r ' t--:-'\-""Lower- l95%4 c n"n,ffi 1
-,-- ...._..___ --+--' ,___....__
eiîf' lA. rr imi 1 -Li
1 1
' \ -..... - - - -- - -...-....
~ .. ~\-rr~ · c- ~-~-~T- --·- - -
1
r' ,/ ' ."'!"' . ·' ' i 1 ' i
~ 1
e~-~-1~:~: 1 1 1
~ 0 ~ . "--=!- 5 J-r-4-~-..... ___,l _ _L _.___ c.. ' E-1 ' 1
h-f- -+--<-- +~ ~____J_+--"ï _._ ~r "z~ t ...,._____,_~ --+---_1_ i i
•-=c;=,-n~ T· - A-- 1 1 ' 1 1 1 1 1 i+- 1
rzJ 1 ' ' rn · ..,.+-+ ~~,___.__J --+ ±~-J..! L ' 1
~-:=.-r-= H- j_ __I___L 1 ., ~ .,.. 1,' 1 -r-- -. 1 1 1
~~...___,· r----P-r-~- ' 1 1
j_ --.-~~..;.....-t-l-- 4-t-J+ + +--.- ' Q -'-+ ,__ ~ i + __ ._,H ~ - 1 1
-----+--~ 1- - -l__l_j_ -Il ;· ~--r-~ -+-
_ _._ 1 1
--+- . _.;_,._ T 1 l 1 J_ 1
1 1
H-t-· ... • - L ~r __!__.. _l' 1 ' 1 -+---~~ - - - ·-t - f-'- ---,-~ -1-...- ,__--r[-+-
• _,___ 1 --.--+- ±1 r++ 1-· ~ t ~ t- r-~__i - + • .L...t- 1+
1 f--.- f--.- 1 • 1 1---'- H-+-r--r-----1--l- t--+-+- .1-
~jl-1=- 1 - t l 3::tf-.-:-:
-r~_- ,_.L.- -------+--t . ~ 1-+-.... ! 1 1 1 1 - t-1 1
1 -r~+ rh - · c± ~ ~ -'--+--r-- ...... ..-+ f-1 !--++
~1. ,___.. '
1 1
=~t:W= R-~m ft±D 1 ~-t-t- 1 1 /1 1 1 r . 1
-t ->--1- f-..1-: -+--r-f-+-h- l-' ; -++--!- 1
T or---;--- __1_ lj___l___l_l 1
•
•
•
1 1C:: . ' "'"'
1
1
' 1
r=~:t=~:'~;t~::-[1~+--++--t+ --+--+ -1-1--.___t-+-t-++ -++ -+-+ -~._.;...~+-r -+-f ~~-+-+-+-+-+...,.. _,.-+ -+-!---~-'--f+-_,-<;__--;__-:_l-_,...+---+f-.$x~-'- N<-~. ~"s"'tes PQ _nt . res Œ,l,.. 1-+-+-'-+--+-+-l-+-- t-++-+-+-+-.,--;--+-t-+-+-+--+-ic---'-+---.-.-+-+-+-l-J.-+-+-+ ...... -+-o·f -i t-he-s-e i---=nrnï~-..t.-...,.. ,-t::.~,-ii:.Hc.--+--+-++i--+1 +--+-! 1-+-+--+, __, T~ -1-++---H--+---t-t-, ~ --+--+--+ i ~ ï -+-t-t-1--!-_+-!_--t ,-,__ _ ~ î'"-' ~t----F - '+lr=+ll•t::=+-=, , :r-r"-i::!'-+-+-'-+-+-t--t-1-t
.?il ~ --~ 1 : T"' 1 ± -L • J.n.d:l~.t~t:A~ nn nt-. -r>PQI1 ' t:!
f--i---r-'--+1~i;;l:'=1'~r--t-c,:±-.::> -1-++-+-ll-l--+-+--i:-t-~~ -~ o-r----t:Jind-s-a ~e dJ e!--tM-e nti-r-r+ !·-r-.-1--+--i
H-~T--~!-i'r--l-t-~H--f-+IH-+-+1+1-+--1---+-"!-t-~'-+-r-!-+-t-+-r-+---+-tl-<·----t 1-t :----r--H f ,_. -·-~ -~-~~-<-t~rr-+-t--r++-r-1 i i 1 '--~1 llê-\1 1
~+---+----~~~~·~1-r+-+~1--+-+-+-1-r~~~;-~~~-r+--1-+--t-+....,-..1-l'lt-t---'--1 ++-1f-l\-t-+--H--+-+-+---~-_,_,._+--+-+- -'--- ~-+--i-+-1-+--+-t-t-~+~-,-~ 1-T+-t~l-+-~~-t-~--~~ ~~ ---+-+-~~-r~~~-t-~-11-~r+~---+-+-+-+--i
'< y v / / / x / /. ,Li :~ ~ 1 1 1 i 1 1
+--+-++-+--- -f'*- ;::---6..--V---tf, ~- -- -~ +--- -+-1- ---, r-~. i- - ~ +--+-+--+--'---',1--t--, +--+1-+-t-t-' +-:--t-~1 ~-t-+--t----1FH-~-+-+-+-+--+---+--+--+--+~--~-....... r=t- -Lowe r- ~% Co-n-f-id m-e-e--+--lrlm!-u ... v +--r--+--;-,--r---7---i!--r--1
l--++-+-+-t---"--1 -+-no\, 5_._ 1-f-6-+-+-----;-~ ., ~ -- ' é_
1 1 1 1 1 1 1
1 1

00
• ·t ___,. -H-r+ t ~
1 , r-~ -r -t~ -t ~-+- 1 ' f- f-..---<-----,_,.-
-1- j+-+-H-- ~ -+--_1 1 ' 1 :......-.---'- Ir - ... - H --1 -·- ·ir-.---+----;-
1 ... t ._,
f-·-J l-Hf- --,T t 4--r- !-~ r~r ------:-- -- Fi -1~-~ t r-r-;-~ ~- - fgur1e ~-
J 1 1 ll J l i-I WA"Pit--s-II-O"W rNGtrtESûi:;Ff ~-F~n 1
1
1 1 1 1
~.-----+_±~ +· j~± ~~ +-----+---~ -~~ _______,__ ~ - DtAM-'.~ ~U'I!I;H<W--EG-E 1 i
.- - ~ fACING n-ow ~STREAM --- -+--+--t
-+-... -...+; t _,_
~ t- T + t - -~ --- .... -1
- -- __,_..... ~+-
1 l tl t 1 i ! ! 1 1 1 1 ' 1 1 . : 1 1 . 1 i l l l 1 ' l . ..... ---- __ .._
1 1 t-1 ..... 1-- - ....
' : 1 1 ' 1 0 1 1 -r : ' 1 .
v 1 ' 1 1 1 1 1 1 1 1 ' A n 'n l'1 ~~it. 'P.~ :nn li iniï.i iT'A li :n!'i 1
1 ' :" 1 : 1 : 1 _l
1
i+ +H-~ +- j- -+-+-ri-+r t-1
-r~
+ t-,
·~ ' 1
'r 1 1
1 1 i 1 1 , 1 1 1
1 y~ --.-L 1
1 1 !:::" 1 1 ! 1 1 1 i 1 ' l 1 1 1 j ! i 1 1 ! l ' 1 1 : ! i i ! 1 1
' --r-'-4 i L LI 1 -+----+-' ' 1 1
1 ~~ 1 1 1 i 1 ' 1 i 1 1 i 1
' 1 1 : 1 1 :?:~---=- - • 1 ' 1
1
:-t": ' r ' 'T ' : 1 - ' -~ '
r' ' ~~-1
&±::' 1 l 1 1 1 ' 1 .
~1 1 ! 1 1 1 1 i 1 ' i 1 ! 1 : '
• 17" ~ 1
1
i"' ! ! 1 ~- ~-- ,.......,......
1 1 _l 1
• ? l ,..- tTnn""Y> a ~:;a; '(' '1"\n f'A ~ .:>h~ 1.:> T li 'm'i _t- 1 1 i
/ · r,r -- 1 1
.__/ _, -:z-n-L:: ~ -- 1
L>... ' 1 l
'7 // /// // //>-.. ' ' 1
~~y~~ / // /:-- . 1 -T------t--'-..-.-- j_ ! 1 / / / / // / // ...... 1
1 ~v / / / //,/// // / //1// i '/ / // / // / / // /// /""> /t/ / /7)/ / / l,-: // //// / /~
ITTh ()- V / / // // _//_/_//// / R 'A T it:RkA V P.
[--t--1- ~ / ' /~-7: ,/ /-/_;rL/7- / )' 1 : / // -" ~-· ! .r: lUif!.t:l l ~l.· // .:A' / / / (/ / ~.z ////. / V
1 1 1 ' 1 "'-1{ /( ~/ // ,v YLA / ~ YI/XJfL l ' r--'-- / 7"" //~7-;-~//8/S 7~
1 /. /
l :L /. /_ ////./ / /./// /_ '/'y/ /./ ' / ////.{/ /////// /f y •/ ' / /. /. _,
;?~ y/_.,/ ./. r LL L / l" I '/// 1 1 L L//LL ._._ ...L:.L '// L -' '/ ,( / '
' '-< , ./ V /./ / /1/f Y /, ..-_.., -L 7-. ~ 1 _t 1 ... / / A Y./r 1
i i ~ v / /:'/ / /~ ' 1
'1 VI / // ./ "' ' :J'ow-e-r-'--9 ,5~ rc'onifilt'Elh"'c ' 1
l'( ./ ,// 1 ")- e rn 1 "'.;........_ / // / ' ' ' ________.._ ~-
--r--1-' Î ~- -- '\. /L_ -- -- - -n- . -+-- - 1 rir;- r--__,..__.+" V'- t-~ . r:xr--- -+ +---------' , Cï)-r---1--: \.
~ ,...., '? i
-~ _y. 1 +-+ ' 1 ' -- - - --J~ .. r-- ---+~~ t-i--1 1 - l r-~-
.!:t:' t-- - 1 __!_ i- ~ 1
1 1 ............,~, ! 1
.. ·tï ' : i 1 1 1 L : ~ 1 ' =:±=- ,_ t-:1, '---i .J.-t-+-~ ~~~!. -:ti - -t-=+~~ _!_• 1
1 ..,..,
i i 1 1 i . ~ ... ....._~':
r- .tJ - ... - ------++ t----~ -+ ~+-
r-T -~ - ~rtt r-TT -~ ..... [--r· h--++ ~ ! ' _ ............... --- .... 1 1
• 1---:--:-, _!_ r--· _,_ f- -·+- ;~-- ~ f t:t3- . ;- - -- -+--4- ~+
i J ~ ..,.__ ±±± ~ --------- -~:::, ..... -r-d 1 -
1 1 1 i : 1 i : 1 : @ 1 1-r- 1 1 . !
P-n- - ~ t- ___,.~ -+ -~-+-+~- ___!___;_ -t- f- - +>-+++-r- -
1 i 1 ---r-t 1 . - i:l i 1 ; 1 1 . 1 1 1 -
t--l- ----n -~l i _1_ ' ï"--:-r---T 1 1 i
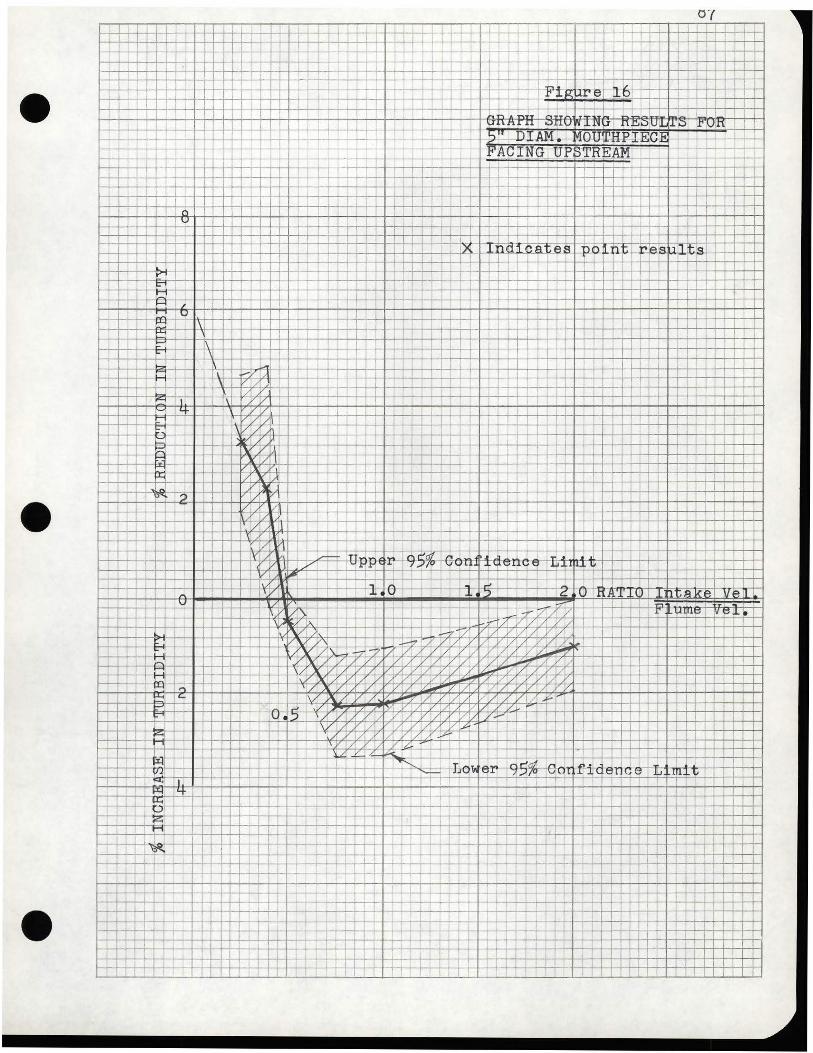
• -tt f-1--t- - -~--1--- J____
:_::_~ TT 1 ' -----+-+ --+-~ +-----'---+-tl -t--~ - t::::_ ~i---+ J ; 1
1 1--r: 4Ll 1 ~- 1 i 1 ' -+-t----- --+-----r----+- -t--+ t-r---+---+ -r ~~~.
; ~ --------"- "t--t-------'---- -.-------.---+- ~ -H-+- - _._____.__ .. ~ 1----r+-r-~ t- +-- _ _. ; Fip; '
1 ' ill'e -1-6 --;-- 1
1 1 1 i 1 -<-------r-
' 1 1 1 1 ~~ ~ 1
1 ' 1 rtT'> n iT .l"'LTT .. ,_.,._ . ____.., 1 1 1
,_ ~:±1-.- 1 1 4--l------ t 1 1 UH~LU ~-ty _.l.l''l ' p- npùUL [J: .::> :!''V tt' 1 1 -t-+---'-
2::~-DIAM-. ~OU'i'HPIECE 1-- ....... _________... -+-- - .,......... +- - - ~-
t " 1-- -+ - FACING UPSTREAM , ...... 1 t ·t ·t t1"t -----.---
1 1 1 i 1 ' 1 ! ' 1 1 1 ~ L
1 1 1 1
1 1 1 1 1
' 1 1 1 1 1 1 1 1 1 1 1 1 1 1 0 ' 1 1 1 JI JI 1 1
, v '
1
1 1 -1 1 ,_x. -
' .c:a a$. -ll~- _ntLr•·P :!'I h !1't.Q ' ' ---+---t--r--+-·-+- 1 1
-'->-r- 1- "T ' ' i 1-'--r 1
' __l_'_l 1 1
~ 1 i ·r
/ 1 1 ' ' -- --.-5:1-- _1_ .___!_ 1 1
1 1 ' i ! i 1 ' 1 1
1 ' i -t-+ ' ! 1 1 1 1 1 ! 1
i Î i 1 1 - : 1 __!____!_ ll 1 1
...,.;---+---- 1 1 i ! 1 1 1 1 ! ! __lj__!__l _j_ _l 1 1 l 1 l--"/ 1
; 1 - ' 1 T· / ! ' 1 1
/ -' ! ' ' 1
~ . '+ // 1 1 / /. --~ i 1 i - i '
1 ' ~ /, i ' ! 1 1 ! ! 1 ' 1 1 i 1 1 1 1 .......__ IY /LI 1 ' 1 1 1 1 i : 1 1 l j_ 1
Y '/ 1 ' 1 )1
l-'- / ' / 1'-111 • 1 - ' i _i 1 Ll 1 1 1 ' 1
• ? / - i i 1 1 1 _l - 1 1 1 ' v w 1 ' ! ' _l ' 1 ---j------T---- / /x
t- -+ 1 ' l-'-'- 1
' 1 /, tl 1 1 l 1 - _l_l ' /, 1----;--; ' 1
1 ./ n --4---- -
~ci5-%.; e-ri ' - _ ______._ - 1 J_ -- 1 1 - ·.v: - T c:;::::,lfftf> E ~-en~~ !li~ 1 _/ '
v """" i 1 ~ 1 1 <r-r- r-----'"" ~
...- j_ 2 ~ ~ :;1 L~ :~ lA 1
v 1 -)' v ),___,___._ - -+- tz:-.L_f> :ume 1 1 L' ' ; .L.
o/ A · f' IL L_ L •L L • 1 1
1 rv ;,, 1 1 -77 .//://y / 1 1 i 1
-- ~ ~' . li-"77/7'77 L(Y//1 ~ ~---+ z / ).. ~7 ~/ /./ ' 1
:~ / / / /, '// / /// ' ' /~ /;_/ 1
1-----~IJ / X // / ///// .a,.,-;/ / / / / ' / X / V '/. / /// /,/L~ / ////// 1 ,... .... / X / A' / // -~ / // V/7/. ,..... , '- ,/ _A / ,/ ~/// /. / Â / 1/ p 1
.o- i ./ /, /' •/ A' V. ' 1 ' / / . /, // Y/ .7 /v _/___!:"__ --'- '--'- ~ ' 1
\Y /. '/' //// /,~ 1 ~~ ! / Z /LX 1//L[~ ~ 1
'1 ' y y /
f- "--1' - pq~ -- ~v .c. !?<.. '
~~5% Eh?! f- - ~~· _, --.----+- ::::::,..'-'--' rf:,o--~ f-i-d-e-ri-c-e- I':i - :f124-- ''"'"" r- mi 1 1 +- !"':< '
1-Xl. ' '+ ' 1
i 1 1 _!!:' ! tl 1 1 1 .,.--.----.+
i r-
_j_ 1 o ,-+---~' i 1
-------+--1 j_l_L__:_ .li ~..-~
' ! 1 1
_Ll. ' z ' +1 1 '
, H ' ~+- _l ' -+~ ·-t i- .li
~~~-- - 1
__ ' -~-~: : i : ! ~~-~..L...---- ~~~ i 1 Ir -rJ-' --L -+- : l ; 1 1
~-f---r-- _.__,__...._..~cr-+
---+--t---.- ....__._ -+----r+--1-- - • ..L, +-I~i-.P± --:t-T- . _i' i .,,_. ---t-1-- ;
• - +-+---;--:±· - - --~ 1--+- ' -h+ -k .... -rf -t~--.----..--
+-i 1
' ... ---' 1 --t---+--~ -~~
~ !--- *ir~ - t--r--~ _____,.. -- ~
~· 1 ~ r-t--1 1
-- it- ·t tl - ..--±:±±± ;--+~~ _.._.___ h-~_f ---_,
- p. ,_._ .... ---+---.-+ ----t---1------ . ~ ..,....ï-+- --- t--r- . t- t±i+' 1 -.. + ' ' 1 '
=r;-P=t;: -1 !1 1 -+h-tr+ 1
1 : _ll_l__!__ ___]_ 1
t- ~--4-t- r-+-----+ 1 ~,__ -:--!+ 1
1 ' ' 1 ' l

88
It should be mentioned in regard to the curve for the
small mouthpiece facing upstream, that no readings were taken
for a ratio of intake velocity to flume velocity lesa than
0.25. In view of the fact that the strong tendency towards re
duction in turbidity for this mouthpiece in the downstream and
straight-out positions was not evident except at ratios below
0.25, and also since the general shape of the curve for the
mouthpiece facing upstream conforma with the general shape of
the ether curves, it is very probable that a similar reduction
in turbidity would be observed for this small mouthpiece facing
upstream at values of intake velocity to flume velocity ratio
of lesa than 0.25.
On the ether hand, the curve compiled from the resulta
for the five-inch diameter mouthpiece facing downstream does
not bear even general similarity to the four ether curves. It
was observed that the influence zone for this mouthpiece ex
tended some 8 inches downstream from the face of the mouthpiece.
It was also observed that a hydraulic jump occured approx
imately 10 inches downstream from this face. It is therefore
suggested that the experimental resulta for this mouthpiece
have been affected by the disturbence of flow conditions sur
rounding the mouthpiece, which disturbence is a direct result
of the failure to provide adequate depth and cross-sectional
area of flow in the model flume.
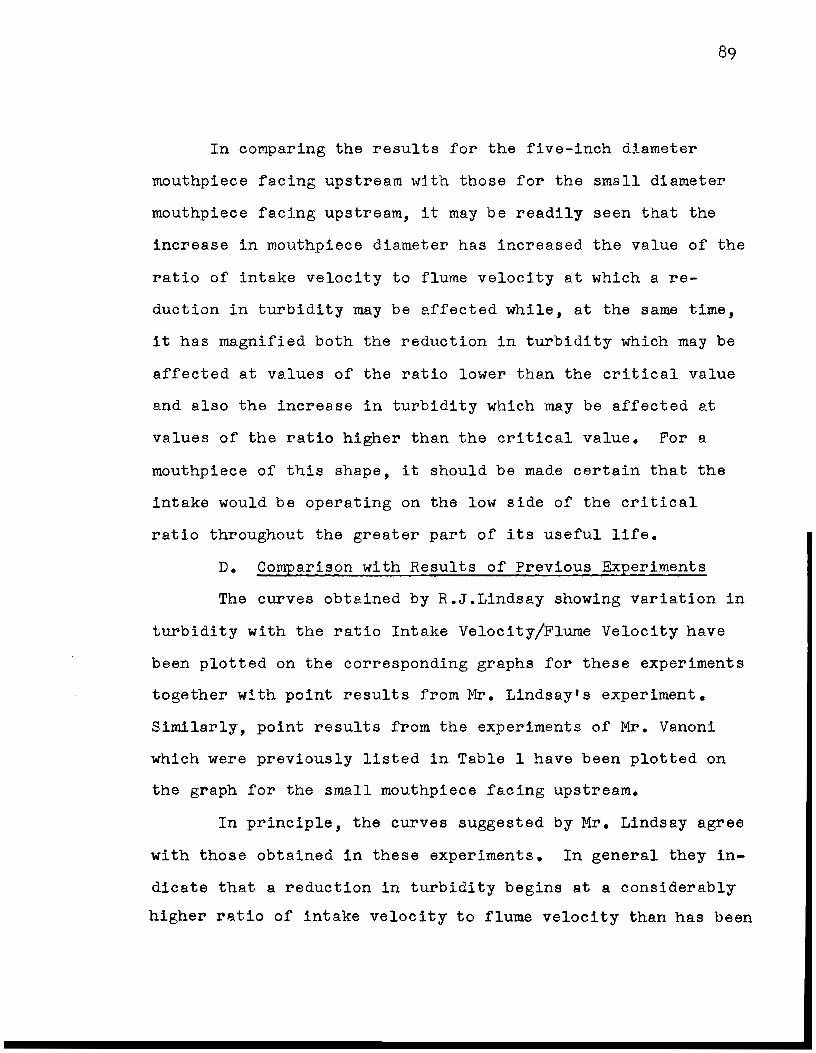
In comparing the resulta for the five-inch diameter
mouthpiece facing upstream with those for the small diameter
mouthpiece facing upstream, it may be readily seen that the
increase in mouthpiece diameter bas increased the value of the
ratio of intake velocity to fiume velocity at which a re
duction in turbidity may be affected while, at the same time,
it has magnified both the reduction in turbidity which may be
affected at values of the ratio lower than the critical value
and also the increase in turbidity which may be affected at
values of the ratio higher than the critical value. For a
mouthpiece of this shape, it should be made certain that the
intake would be operating on the low side of the critical
ratio throughout the greater part of its useful life.
D. Compariaon with Results of Previous Experimenta
The curves obtained by R.J.Lindsay showing variation in
turbidity with the ratio Intake Velocity/Flume Velocity have
been plotted on the corresponding graphs for these experimenta
together with point results from Mr. Lindsay's experiment.
Similarly, point results from the experimenta of Mr. Vanoni
which were previously listed in Table 1 have been plotted on
the graph for the small mouthpiece facing upstream.
In principle, the curves suggested by Mr. Lindsay agree
with those obtained in these experimenta. In general they in
dicate that a reduction in turbidity begins at a considerably
higher ratio of intake velocity to fiume velocity than has been

90
found by this experiment and they also indicate much more
marked increases or reduction in turbidity than has been found
by this experiment. It is likely that both of these differ
ences are the result of the wide variation in individuel
readings obtained by Mr. Lindsay.
The turbidity meast~ements made by Mr.Vanoni were taken
using a sediment sampler. These samplers were developed by the
United States Federal Inter-Agency River Basin Committee.
Figure 18 illustrates the u.s. DH-48 depth integrating hand
sampler. It is to be noted that the sampling tube is straight,
i.e. it does not have a flared inlet. Thus over the range of
values of the ratio of intake velocity to stream velocity which
were examined by Mr. Vanoni and bearing in mind that he found
deviations of ! 3% from the mean for a series of three con
secutive samples, it would appear that the elimination of the
flared mouthpiece has little significant effect upon the
apparent turbidity of the water carried into the intake.
One notable agreement between the results of Mr. Lindsay
and those of this experimenter is illustrated on the graph for
the small diameter mouthpiece in the straight-out position.
Although there is considerable difference in the positioning of
the curves, prepared from the resulta of the two experimenta,
nevertheless these curves do coincide at the point where the
ratio of intake velocity to flume velocity is equal to 1.0 and
also where the two curves intersect the ordinate axis, i.e.
91
where the ratio of intake velocity to flume velocity is equal
to o. Mention of the intersection of these curves with the
ordinate axis raises the question of whether it is correct to
produce these curves to intersect this axis. By this is meant,
not whether the slope of the curve should be extended but
rather whether there may be some dis-continuity in the reduction
of turbidity as the ratio of intake velocity to flume velocity
approaches 0 or, in effect, as the intake velocity approaches o. Assuming that the hypothesis derived later in this discussion
to explain these variations in turbidity, is correct, then the
main factor affecting a reduction in turbidity is the settle
ment of the sediment within the zone df. influence surrounding
the mouthpiece. So long as the rate of settlement with time is
constant, it may probably be assumed that the rate of reduction
in turbidi ty will likewise be consta.nt.
Using the data of Table 2, a graph has been prepared in
dicating the rate of reduction of turbidity with time for the
particular sediment used in this experiment. It may be seen
from this graph in Figure 18 that for at least twenty minutes
the rate of reduction of turbidity remains constant. For all
practical intenta and purposes an inlet time of 20 minutes
would indicate a flow of 0 fps with a corresponding ratio of in
ta.ke velo city to flume veloci ty of 0. The intersection of the
curves and the ordinate ~~is may, therefore, be justified.
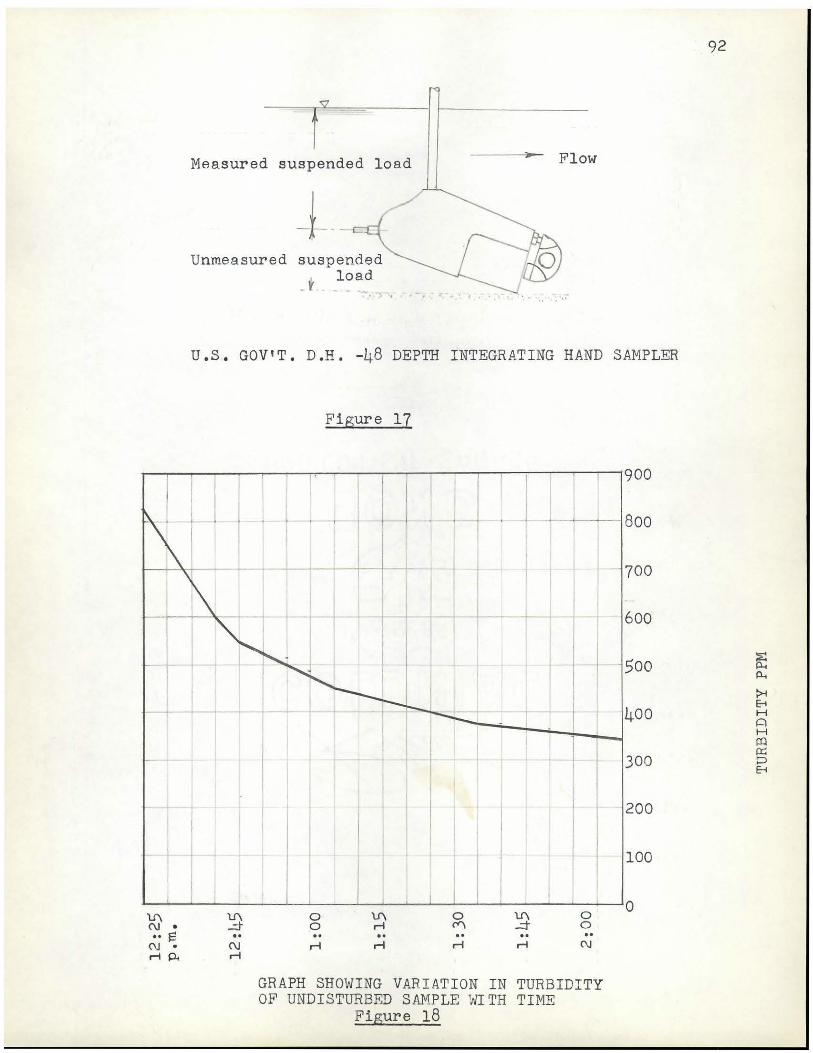
Measured suspended load
Unmeasured suspended load _t
Flow
U.S. GOV 1 T. D.H. -48 DEPTH INTEGRATING HAND SAMPLER
Figure 17
Boo
700
t 600
500
300
200
100
~~~~~----~~--~--~~~~--~~---~~--~o 0 0
U\ (\J • .. s (\J •
r-i P.
.. (\J .-1
0 0 .. .-1
.. .-1
.. . . .. .-1 .-1 (\J
GRAPH SHOWING VARIATION IN TURBIDITY OF UNDISTURBED SAMPLE ~~TH TIME
Figure 18
92
93
E. Flow Pattern Observations
It may be readily seen from the sketches of the flow
pattern observations that the zones of influence of both the
large diameter and small diameter mouthpieces, whether they
face upstream or downstream, were much greater when the intake
velocity was 5 ft. per second, than they were when the inte.ke
velocity approached zero. As previously stated in Chapter 1,
Vanoni suggests that the sediment particles follow paths of
less curvature than the streamlines which curve away from the
sampler tip with the result that sediment is transferred to the
fluid entering the sampler. 10 In our case, and from our obser
vations, this would mean that the sediment was being trans
ferred into the zone of influence from the streamlines around
it. The following theoretical discussions therefore concern a
particle of sediment which, because of a greater inertia than
that of the streamline of water which carries it, separates
from the streamline and entera the cone of influence created by
the intake mouthpiece.
Consider a particle of sediment moving in the stream at
stream velocity 2.5 fps. The streamline carrying this particle
skirts the cone of influence created by the intake. The
particle being discrete, attempts to decelerate to 0.2 fps
which is the port entrance velocity of the small diameter mouth
piece with an intake velocity of 2.0 fps. If we neglect the
mean free path of the particle, the motion of the particle can
10. Vanoni, op. cit., page 77.
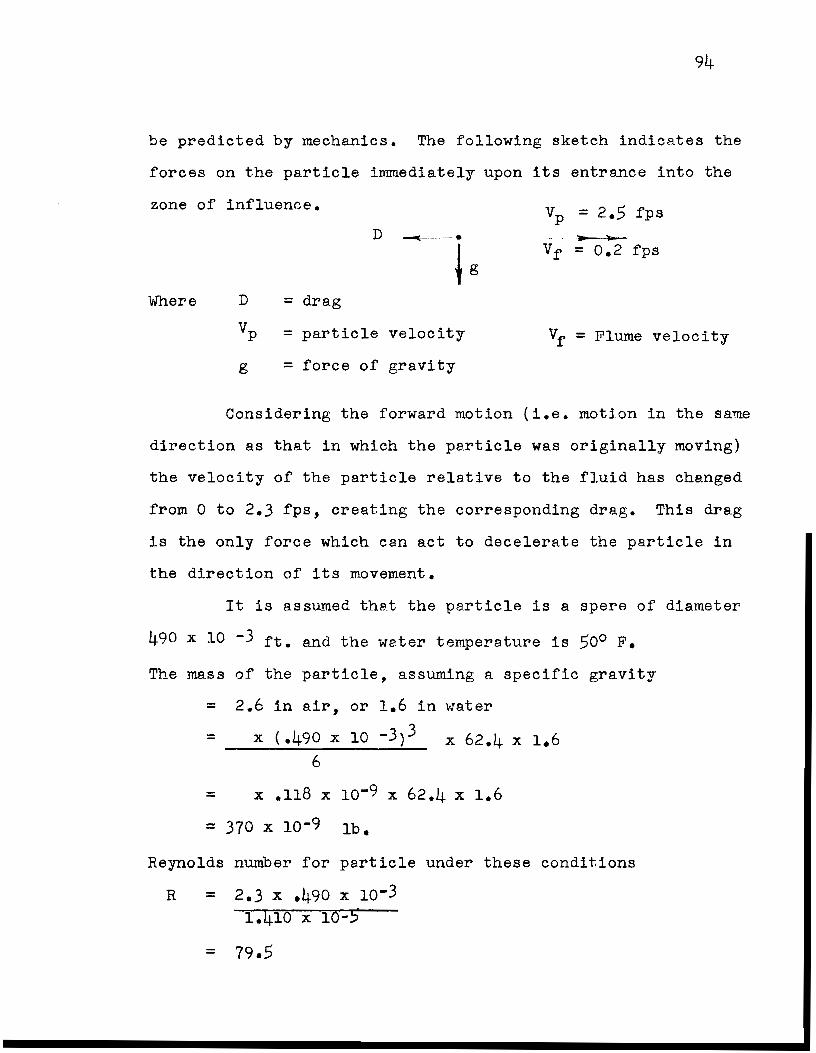
94
be predicted by mechanics. The fol1owing sketch indicates the
forces on the partic1e immediately upon its entrance into the
zone of influence.
D ~---·
~g vf = 0.2 fps
Where D = drag
vP = partic1e ve1ocity Vf = Flume ve1ocity
g = force of gravity
Considering the forward motion (i.e. motion in the same
direction as that in which the particle was originally moving)
the ve1ocity of the particle relative to the fluid has changed
from 0 to 2.3 fps, creating the corresponding drag. This drag
is the only force which can act to dece1erate the partic1e in
the direction of its movement.
It is assumed that the partic1e is a spere of diameter
490 x 10 -3 ft. and the water temperature is 50° F.
The mass of the partic1e, assuming a specifie gravity
= 2.6 in air, or 1.6 in water
= 6
= x .118 x lo-9 x 62.4 x 1.6
= 370 x lo-9 lb.
Reynolds number for particle under these conditions
R = 2.3 x .490 x lo-3 1.410 x 10-.5
= 79.5
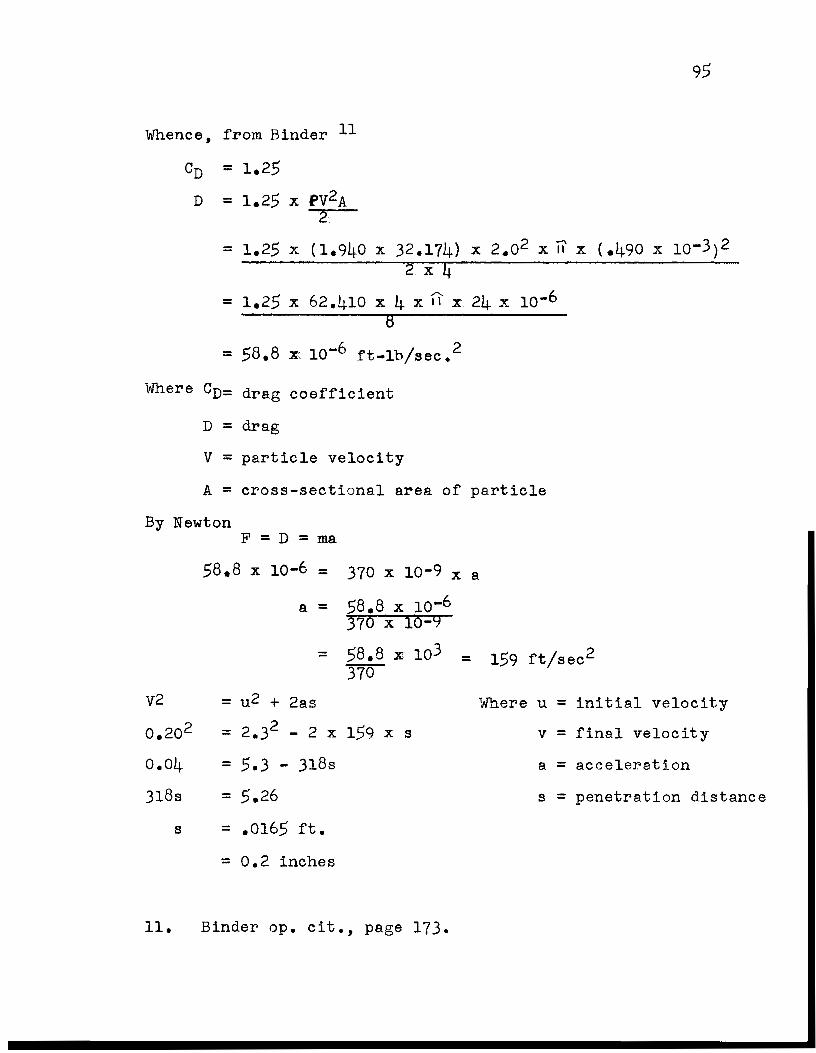
95
Whence, from Binder 11
en = 1.25
D = 1.25 x pv2A 2
= 1.25 x (1.940 x 32.174) x 2.o2 x il x (.490 x lo-3)2 2 x
= 1.25 x 62.410 x 4xÎÎx 24 x 1o-6
Where Cn= drag coefficient
D = drag
V = partic1e ve1ocity
A = cross-sectional area of partic1e
By Newton F=D=ma
58.8 x 10-6 = 370 x l0-9 x a
V2 =
o.2o2 =
0.04 =
318s =
B =
=
a =
=
u2 + 2as 2 2.3 - 2 x
5.3 - 318s
5.26
.0165 ft.
0.2 inches
58.8 x 1o-6 370 x 10-9
58.8 x 10³ 37"0
159 x s
11. Binder op. cit., page 173.
= 159 ft/sec2
Where u = initial ve1ocity
v = final velocity
a = acceleration
s = penetration distance
96
The foregoing discussions show that the particle will
penetrate far enough into the zone of influence and will no
longer be influenced by the flow outside of that zone. The
behaviour of the particle within the zone of influence will
depend entirely upon the hydraulic characteristics of the
flow within the zone. If the flow within the zone of influence
is not too turbulent, then the particle w:lll tend to settle
out at a velocity of 0.049 fps. which was previously mentioned.
The lower will be the intake. velocity, the longer time the
particle will take to reach the intake conduit itself, and
therefore the greater the settlement and the greater the re
duction in turbidity.
The above theory substantiates the resulta which were
obtained for the mouthpieces facing in the upstream position,
where the apparent turbidity is first increased by the penetra
tion of discrete particles as described above into the zone of
influence of the mouthpiece. All dye which was placed within
this zone of influence entered the intake, indicating that all
of the water within the zone of influence also entera the in
take. However, as the intake velocity is decreased, thus
decreasing the ratio of intake velocity to flume velocity, an
increasing number of particles of sediment settle out of the
zone of influence to be carried away by the streamline adjacent
thereto, thus affecting a reduction in the turbidity within the
zone of influence. As the intake velocity continues to be
97
decreased, a velocity is reached B.t which the rate of settlement
out of the zone of influence compensates for the increase in
turbidity caused by the penetration of particles into the zone.
At the corresponding ratio of intake velocity to flume velocity,
which has be en described previously as the cri tica.l ratio, the
apparent turbidity within the zone of influence is equal to the
turbidity in the flume itself. At values of the ratio lower
than the critical value, which result from further decreases in
the intake velocity, there is actually a reduction in turbidity
caused by a greater rate of removal of sediment out of the zone
of influence than the rate of penetration of sediment into the
zone of influence.
The flow conditions around the mouthpiece facing dawn
stream are not stable nor do they suggest any apparent reason
for the increases in turbidity which were observed. It would
appear that particles of sediment are carried into the wake by
the action of the turbulence which was observed to exist along
the boundary layer separating the wake from the streamflow.
This wake created downstream from the mouthpiece is very similar
to that which was observed by Helmholtz and Kirchhoff to exist
behind the flat plate. Their observations and the theory which
they developed to expla.in them are described by Hunsaker and
Rightmire.
"Noting that motion downstream from a plate is highly
rotational, Helmholtz and Kirchhoff approximated the actual wake
by a region of dead water or motionless fluid separated from the
mainstream by an infinitely thin sheet of rotating fluid
particles springing from each edge of the plate.n 12
Although the authors later go on to explain that this
flow pattern can be no more than the first approximation to the
actual one because of its instability, nevertheless, their
theory suggests that flow conditions inside the zone of in
fluence or wake are less turbulent than outside the zone, and
therefore it would be expected that the longer a particle re
mained within the zone, the greater would be its settlement and
the greater the reduction in turbidity of the fluid entering
the intake.
Lack of sufficiently detailed observations makes it
impossible to suggest a theoretical explanation for the reduction
in turbidity of the water entering the mouthpiece in its
straight-out position. It is likely that sorne zone of influence
exlsts within the mouthpiece or immediately in front of it in
which, as in the two ether positions, there is less turbulence
than in the stream itself, and out of which sorne of the sediment
will settle.
12. Hunsaker and Rightmire, op. cit., pages 198 and 199.

CHAPTER Vll
CONCLUSIONS
99
Bearing in mind the limitations of the experiment as
outlined in the foregoing discussion, the following conclusions
may be drawn:
1. For the small-diameter mouthpiece, which is modeled
after mouthpieces commonly in use, variation in the position of
the intake, i.e. whether it faces upstream, downstream or
straight out, does not substantially affect the turbidity of the
water carried into the mouthpiece, for values of the ratio of
intake velocity to stream velocity which wov.ld normally be con
sidered desirable in pre.ctice.
2. For the small-diameter mouthpiece, and values of the
ratio of intake velocity to strea.m velocity of less than 0.2, a
reduction in the turbidity of the water carried into the mouth
piece in e.ll three positions will occur. This reduction in
turbidity will be somewhat greater when the mouthpiece is facing
upstream or downstream than when it is facing straight out.
3. The five-inch diameter mouthpiece, which had a much
greater cross-sectional area relative to the cross-sectional
area of the intake conduit ths.n the small-diameter mouthpiece,
accented the effects which were observed to occur around the
small·diameter mouthpiece. It can be said with 95% confidence
that for values of the ratio of intake velocity to stream vel
ocity lesa than 0.37, this mouthpiece will affect a reduction in

lOO
turbidity.
4. The reduction in turbidity in the upstream and dawn
stream positions of the mouthpiece is the ref.mlt of sedimen
tation within the zones of influence in front of or within the
intake mouthpieces in which there is less turbulence than in
the adjacent stream flow.
5. From a practical point of view the resulta of this
experiment indicate that:
a) For slow-moving streams and/or streams with·low
turbidity, the intake should be designed on an economical basis
without regard for the insignificant effect which the mouthpiece
design or position will have on the turbidity of the water
gathered into the intake.
b) For streams where during the spring break-up periods and
heavy summer and fall storms,the flow velocity and the amount of
turbidity carried reaches high values, the design and con
struction of a special intake mouthpiece may become economically
warranted.
c) For swiftly flowing streams of significant turbidity
and/or for highly turbid streams, it would be worthwhile to
study a mouthpiece similar in shape to the five-inch diameter
mouthpiece used in this experiment and placed facing upstream.
Since the effectiveness of the mouthpiece in reducing turbidity
depends upon the hydraulic characteristics of the mouthpiece,
model tests should be carried out using a true scale model of the

101
stream bed and the intake including its protective cribbing.
The construction of a special mouthpiece may be warranted
when the saving in treatment cost due to the reduced turbidity
is larger than the additional cost of constructing this
special mouthpiece, and of a larger diameter intake conduit.
Appendix A
BIBLIOGRAPHY
1. Steel, Ernest w., Water Supply and Sewerage, 3rd Edition, McGraw-Hill Book Co.Inc.,
5.
6.
8.
Hunsaker, J.c., and Rightmire,B.G., Engineering Applications of Fluid Mechanics, McGraw ... Hill Book Co. Inc., 1947
Binder, R.C., Fluid Mechanics, Prentice-Hall Inc., 1949.
Hydraulic Models, ASCE Manual of Practice No. 25, American Society of Civil Engineers, 1942.
Vanoni, Vito A.; Transportation of Sediment by Water, Transactions, American Society of Civil Engineers, Vol. 111, 1946, p.67
Benedict, Albertson and Matejka; Total Sediment Load Measured in Turbulence FluMe, Transactions, ASCE, Vol. 120, 1955, P• 457
Simmons W.P.Jr., Models Primarily Depenèent on the Reynolds Number, Proceedings ASCE, Vol.86, No.HY 6 June 1960.
Carlson, Enos J., and Miller, Carl R., Research Needs in Sediment Hydraulics, Proceedings, ASCE, Vol. 82 No. HY 2, April 1956.
ASTM Manual on Quality Control of Materials, Special Technical Publications 15-c, American Society for Testing and Materials, January 1951.