solving assembly line balancing and feeding problems
226
Managing complex assembly lines: solving assembly line balancing and feeding problems Nico Andr´ e Schmid Dissertation submitted to the Faculty of Economics and Business Administration, Ghent University, in fulfillment of the requirements for the degree of Doctor in Business Economics
-
Upload
khangminh22 -
Category
Documents
-
view
1 -
download
0
Transcript of solving assembly line balancing and feeding problems

Managing complex assembly lines: solving assembly line
balancing and feeding problems
Nico Andre Schmid
Dissertation submitted to the Faculty of Economics and Business Administration,
Ghent University, in fulfillment of the requirements for the degree of
Doctor in Business Economics


Adviser:
Prof. Dr. Veronique Limere
Doctoral jury:
Prof. Dr. Patrick Van Kenhove Ghent University, Belgium
Prof. Dr. Benoit Montreuil Georgia Institute of Technology, USA
Prof. Dr. Elena Tappia Polytechnic University of Milan, Italy
Prof. Dr. Katrien Ramaekers Hasselt University, Belgium
Prof. Dr. Birger Raa Ghent University, Belgium
Antwerp Maritime Academy
Prof. Dr. Mario Vanhoucke Ghent University, Belgium
Vlerick Business School, Belgium
University College London, United Kingdom
Prof. Dr. Veronique Limere Ghent University, Belgium


“The best way to predict the future is to invent it.”
Alan Kay


Acknowledgment
With the submission of this thesis, my professional educational journey is ending after eleven
years in which I studied at five universities, spread over three countries and five cities. Therefore,
I would like to use this opportunity to thank some people I met along this way or who supported
me throughout the entire process.
First and foremost, I would like to thank my adviser, Prof. Dr. Veronique Limere. Veronique,
I would like to thank you for your support, guidance, and all the (extensive and sometimes
repetitive) discussions we had. I enjoyed collaborating closely with you, and I am sure you
greatly impacted my personal and professional development. I am looking forward to continuing
our collaborations and starting new ventures in the coming years.
Throughout my Ph.D., I had the excellent opportunity to conduct a research stay at the Georgia
Institute of Technology (USA), where I collaborated with Prof. Dr. Benoit Montreuil. For this
great experience and our conversations, which transformed my view on our field and research
in more general, I would like to thank you wholeheartedly, Benoit. I am looking forward to
finalizing our ongoing projects and starting some new ones.
Next, I would like to thank the members of my Ph.D.-jury for taking the time to read my thesis
and attending the defenses. I am particularly thankful for the insightful remarks and questions
you provided. I am glad each of you looked at my work from a different point of view which
helped to make it a better thesis. I hope to be able to transfer all these different points of view
to my new research projects.
When I started off with my Ph.D., I was funded by the Bijzonder Onderzoeksfonds (BOF) of
Ghent University. After two years in the process, I obtained an ICM-fellowship from the Fonds
Wetenschappelijk Onderzoek (FWO). I would like to thank both institutions for supporting my
research and providing me the opportunity to obtain a Ph.D.
I would also like to thank my collaborators, Birger, Shahab, and Ebenezer. It was a pleasure
working with you, and I hope to start new projects with you in the future.
During my tenure at Ghent University, I was placed in two different offices that had their own so-
cial dynamic but shared an excellent working and social atmosphere. Thank you for the pleasant
environment Babak, David, Ebenezer, Emilio, Jonas, Kunal, Linn, Miao, Mick, Mohannad, and
Xiajie. I would like to express a special thanks to David for all the exciting research discussions,

iv Acknowledgment
hoping we can keep this up in the future. In addition to having great office mates, I would also
like to thank all the other colleagues of the Business Informatics and Operations Management
department for the entertaining board game evenings and conversations during lunch: Abdel,
Annelies, Ben, Foad, Jakob, Jeroen, Jie, Jingyu, Michael, Pooria, Rob, Rojen, Shari, Thomas,
Tom, and Weikang.
I am very grateful for having had the opportunity to go to Atlanta and study at Georgia Tech
during my Ph.D. I met so many interesting and welcoming people there which made it a wonderful
experience. I would like to thank all the physical internet (PI) laboratory members and my friends
Albert, Alex, Daan, Daniele, Elena, Jana, Louis, Miguel and Patrick for making this research
stay unique.
Before starting my Ph.D. in Ghent, I was working at Marburg University and I would like to
thank my adviser, Prof. Dr. Ingrid Gopfert, for the trust and experience I could gather in this
position.
My initial interest in an academic career was already triggered during my Bachelor’s studies.
This initial interest was spurred further by Prof. Dr. Rainer Leisten, who sadly passed away
shortly after I completed my master thesis with him. I am glad I could follow his classes and
work with him during my master thesis as I value him as a great teacher and an amicable person.
Pursuing my studies and the Ph.D. would certainly not have been possible without the generous
support and personal motivation of my family, friends, and partner. Conny, I am incredibly
thankful for the emotional and constructive support you gave me in these past six years. I
am grateful you accepted my decision to go abroad, both to Belgium and the US. During the
COVID-pandemic, we decided to move in together and quickly realized it was the right decision,
and I am looking forward to our new endeavors in Paris.
Dear mom and Stephan, I am very grateful for all the nice activities and family time we had.
I am also glad for the discussions we had and that helped me make my way. Thank you for
supporting me for all these years.
Liebe Oma Lieselotte und Elfie, liebe Opas Alfred und Thomas ich mochte mich naturlich auch
bei euch bedanken fur eure jahrelange Unterstutzung. Es freut mich sehr, dass ihr alle so enthu-
siastisch uber den Abschluss meiner Promotion und meine Zukunftsplane seid.
Dear Andrea, Angelika, Martin, and the kids, thank you for being a part of my life and for all
those quality time family meetings we had over all those years.
A last and very special thanks goes to all my friends who chose to stay friends with me, even
though I was permanently moving and probably farther away than most of your other friends.
Thank you, Linus, for being a solid friend for more than 20 years. I would also like to thank Lars,
Marc, Oliver, Sascha, Sebastian, and Vagelis for all the funny evenings during our virtual pub.
It was a nice change to see good friends and get my mind off work during the final phase of my
Ph.D. every now and then. Lastly, I would like to thank my fellow students Aleksej, Henning,

Acknowledgment v
Johannes, and Thomas, who quickly become terrific friends. Thank you for the many football
and pub evenings and the reciprocal visits and experiences we have had more recently.
Having said all of this, I cannot help myself but consider myself very lucky for all the support,
unique opportunities, and experiences that I lived through during the past years. What a ride...
Nico Schmid
Ghent, May 10, 2021


Summary
Assembly lines are used in many different industries to produce all kinds of goods at a low
price. An assembly line’s main characteristics are the workpieces’ flows through a series of
stations and the decomposition of assembly steps into (mostly) inseparable tasks. Well-known
product examples are vehicles such as cars, buses, trains, or airplanes. In contrast, health care
equipment (e.g., ventilation machines or surgical robots) or consumer electronics (smartphones,
laptops, tablets) might be less-known examples. Due to this wide-spread use of assembly lines
in the industry, academics have targeted improving, analyzing, simulating, or optimizing various
aspects of assembly lines. In this research domain, efforts include product design, worker-related
aspects such as ergonomics or training in virtual reality environments, production planning,
logistics planning, outsourcing decisions, supplier management, inventory problems, Make-to-
stock (MTS) vs. Make-to-order (MTO) decisions, or facility planning. This thesis focuses on
optimizing intralogistics, task assignments, and combines them with facility planning decisions.
After a general introduction in Chapter 1, the thesis comprises five individual studies. These are
summarized in more detail in the following paragraphs.
In Chapter 2, we provide an introduction to the logistical activities within an assembly factory.
To this end, we distinguish various processes. Furthermore, we introduce various methods that
can be used to provide components or parts to the assembly station. They differ in the number of
parts provided, the type of container or load carrier used, and the very embodiment of logistical
handling processes. In the remainder of this thesis, these different methods are referred to as line
feeding policies. The line feeding policies are line stocking (provision of large containers filled
with a single type of parts), boxed-supply (provision of smaller containers filled with a single
type of parts), sequencing (provision of presorted interchangeable parts, e.g., differently colored
parts), stationary kitting (like sequencing but containing multiple sets of interchangeable parts
used at one station), and traveling kitting (like stationary kitting but containing parts for several
stations). In this chapter, we formally define the Assembly line feeding problem (ALFP) as a
cost minimization problem, and this problem is proven to be NP-hard. This chapter’s main
body is concerned with a classification scheme of aspects that may be included in this problem
without specifying the exact formulation but rather the content. We categorize the literature,
falling into the scope of the problem, according to this classification. Lastly, we indicate various
problems for future research.

viii Summary
Chapter 3 concerns a specific optimization model of an ALFP. This model is the first in the
literature to consider five line feeding policies. In addition, it discretized the Border of line (BoL),
i.e., the area at an assembly station used for part storage. This discretization allows for a more
accurate determination of the assembly workers’ walking activities. Lastly, the model allows for
space borrowing, which refers to using the space of a particular station to store parts for an
adjacent station. By doing so, we enable the feeding of parts through more space-consuming
but cheaper line feeding policies. We show the application of some preprocessing rules to solve
this model quicker and provide a more sophisticated Branch & Cut solution procedure. The
algorithms are tested on artificial problem instances, which we derived from a real-world case
study. The impact of space borrowing, location discretization, and the size of the BoL are
investigated.
In Chapter 4, we propose an optimization model to determine a kitting cell’s design. Kitting
cells are used to prepare stationary and traveling kits. In those kitting cells, different part families,
i.e., groups of distinct parts serving a similar or equal purpose, are picked and sorted according
to the assembly line’s demand and placed in a joint kitting container. Decisions determine the
cell’s sizing, the feeding of parts to that cell, and part placement within the cell. We applied the
model to design a kitting cell for an automotive company and compare the results to heuristic
approaches.
Chapter 5 covers an Assembly line balancing problem (ALBP), i.e., the assignment of assembly
tasks to different workstations. Due to the predetermined flow of workpieces, it is important to
consider the task’s relations. That is, e.g., task A has to be executed before task B, implying that
task B cannot be assigned to a station before task A’s station as the product moves from station
to station. In this chapter, a particular variant of the ALBP is studied, namely the ALBP of
type E, where E stands for efficiency. In this variant, the number of stations and the available
time at each station, known as cycle time, are optimally determined. While the so-called Simple
assembly line balancing problems (SALBPs) only considers temporal and precedence aspects,
this study also considers spatial aspects. We extended and adjusted an existing Mixed-integer
linear programming (MILP) and provided a new solution approach that exploits strengthening
techniques and constraint programming. We evaluate the impact of spatial requirements on the
assembly line’s efficiency by comparing to solutions that only consider temporal requirements.
In Chapter 6, we combine assembly line balancing and assembly line feeding decisions to min-
imize the assembly system’s costs. To this end, we extend and integrate the model presented
in Chapter 3 into an ALBP with a predetermined cycle time. Furthermore, we determine the
assembly factory’s size based on balancing and feeding decisions. Since this problem is challeng-
ing to solve, we propose a logic-based Bender’s decomposition approach. In this approach, the
assembly line balancing problem is solved in the first step. In the second step, the solution’s
feasibility is verified. Afterward, all costs are calculated and fed back to the balancing problem.
This process is reiterated until no better solution can be found. We apply this approach to

Summary ix
a synthetic case study that combines real-world data with artificial data. For our results, we
investigate the impact of considering both problems simultaneously by comparing the solutions
to scenarios where some decisions are excluded from the optimization model.


Samenvatting
Assemblagelijnen worden in veel verschillende industrieen gebruikt om allerlei goederen tegen een
lage prijs te produceren. De belangrijkste kenmerken van een assemblagelijn zijn de doorstroom
van producten doorheen een serie werkstations en de onderverdeling van de werkstappen in
(meestal) ondeelbare taken. Bekende productvoorbeelden zijn transportvoertuigen zoals auto’s,
bussen, treinen of vliegtuigen, terwijl apparatuur voor de gezondheidszorg (bv. beademingsma-
chines of operatierobots) of consumentenelektronica (smartphones, laptops, tablets,...) minder
bekende voorbeelden zijn. Vanwege dit wijdverbreide gebruik van assemblagelijnen in de indu-
strie, hebben academici zich gericht op het verbeteren, analyseren, simuleren, of optimaliseren
van verschillende aspecten van assemblagelijnen. Onderzoek in dit domein omvat productont-
werp, arbeidsgerelateerde aspecten zoals ergonomie of training in virtual reality omgevingen,
productieplanning, logistieke planning, outsourcing beslissingen, leveranciersmanagement, voor-
raadproblemen, MTS vs. MTO beslissing, of facilitaire planning. Dit proefschrift richt zich op
de optimalisatie van intralogistiek, de toewijzing van taken, en combineert deze met beslissingen
over high-level facility design. Na een algemene inleiding in hoofdstuk 1, omvat het proefschrift
vijf afzonderlijke studies. Deze worden in de volgende paragrafen meer in detail samengevat.
In hoofdstuk 2 geven we een inleiding op de logistieke activiteiten binnen een assemblagefa-
briek. Daartoe onderscheiden we verschillende processen. Verder introduceren we verschillende
methoden die kunnen worden gebruikt om onderdelen of componenten aan het assemblagestation
te leveren. Ze verschillen in de hoeveelheid onderdelen die wordt aangeleverd, het type container
of ladingdrager dat wordt gebruikt, en de precieze invulling van de logistieke afhandelingspro-
cessen. In het vervolg van dit proefschrift worden deze verschillende methoden aangeduid als
line feeding policies. De line feeding policies zijn line stocking (levering van grote containers ge-
vuld met een enkel type onderdelen), boxed-supply (levering van kleinere containers gevuld met
een enkel type onderdelen), sequencing (levering van voorgesorteerde verwisselbare onderdelen,
bv. verschillend gekleurde onderdelen), stationary kitting (zoals sequencing maar met meerdere
sets verwisselbare onderdelen die in een station worden gebruikt), en traveling kitting (zoals
stationary kitting maar met onderdelen voor meerdere stations).
In dit hoofdstuk wordt het Assembly line feeding problem (ALFP) formeel gedefinieerd als een
kostenminimalisatieprobleem en wordt bewezen dat dit probleem NP-hard is. De hoofdmoot van
dit hoofdstuk is een classificatie schema van overwegingen die in dit probleem kunnen worden
opgenomen zonder de exacte formulering te specificeren, maar wel de inhoud. Deze classificatie

xii Samenvatting
wordt vervolgens gebruikt om literatuur te classificeren die binnen het domein van het ALFP
valt. Tenslotte worden verschillende ideeen voor toekomstig onderzoek gepresenteerd. Enkele
daarvan zullen in het vervolg van dit proefschrift worden onderzocht.
Hoofdstuk 3 betreft een specifiek optimalisatiemodel van een ALFP. Dit model is het eerste in
de literatuur dat vijf verschillende methoden voor lijntoevoer in aanmerking neemt. Bovendien
werd de BoL, i.e., het gebied in een assemblagestation dat wordt gebruikt voor de opslag van
onderdelen, discreet gemodelleerd. Deze discretisatie maakt een nauwkeurigere bepaling van de
loopafstanden van de assemblagearbeiders mogelijk. Tenslotte laat het model toe dat stations
plaats uitlenen aan mekaar. Dit verwijst naar de mogelijkheid om de BoL van een bepaald
station te gebruiken om onderdelen op te slaan die nodig zijn in een aangrenzend station. Op die
manier wordt het mogelijk onderdelen aan te voeren via een line feeding policy die meer ruimte in
beslag neemt, maar goedkoper is. Om dit model op te lossen worden enkele voorbewerkingsregels
toegepast en wordt een meer verfijnde oplossingsprocedure in de vorm van Branch and cut (BAC)
en Cut and branch (CAB) voorgesteld. De algoritmen worden getest op artificiele probleem
instanties die gebaseerd zijn op een real-world gevalstudie. De invloed van het uitlenen van
plaats, de discretisatie van de locaties en de grootte van de BoL worden onderzocht.
In hoofdstuk 4 stellen we een optimalisatiemodel voor om het ontwerp van een kittingcel te
bepalen. Kittingcellen worden gebruikt voor twee lijntoevoermethodes, namelijk stationaire en
traveling kits. In deze kittingcellen worden verschillende onderdelenfamilies, i.e., groepen van
verschillende onderdelen die een gelijk(aardig) doel dienen, geselecteerd en gesorteerd volgens de
vraag van de assemblagelijn en in een gemeenschappelijke kittingcontainer geplaatst. Het model
maakt beslissingen over de grootte van de cel, de toevoer van onderdelen naar, en de plaatsing
van onderdelen binnen de cel. Het model wordt toegepast voor het ontwerp van een kitting cel
voor een automobielbedrijf en de resultaten worden vergeleken met heuristische benaderingen.
Hoofdstuk 5 behandelt een Assembly line balancing problem (ALBP), i.e., de toewijzing van
assemblagetaken aan verschillende arbeiders of werkstations. Vanwege de vooraf bepaalde door-
stroom van producten, is het belangrijk om rekening te houden met de relaties tussen de taken,
gewoonlijk beschreven als volgorderelaties. Dat wil zeggen, taak A moet worden uitgevoerd voor
taak B, hetgeen impliceert dat taak B niet kan worden toegewezen aan een station voor het
station van taak A, aangezien het product van station naar station beweegt. In dit hoofdstuk
wordt een bijzondere variant van het ALBP bestudeerd, namelijk het ALBP van het type E,
waarbij E staat voor efficientie. In deze variant worden het aantal stations en de beschikbare
tijd op elk station, de zogenaamde cyclustijd, optimaal bepaald. Terwijl het zogenaamde Simple
assembly line balancing problems (SALBPs) alleen rekening houdt met tijd en volgorde, wordt
in deze studie ook het plaatsaspect in aanmerking genomen. Dat wil zeggen, elke taak heeft een
tijds- en een plaatsvereiste terwijl elk assemblagestation beperkt is tot een bepaalde hoeveelheid
tijd en plaats. De beschikbare plaats van de stations is vooraf bepaald, terwijl de cyclustijd
wordt bepaald door het oplossen van een optimalisatieprobleem. Om dit probleem op te lossen,

Samenvatting xiii
wordt een bestaand model uitgebreid en aangepast. Bovendien wordt een nieuwe oplossings-
aanpak voorgesteld. Deze benadering is gebaseerd op versterkingstechnieken waarbij sommige
beslissingsvariabelen worden gefixeerd terwijl andere worden geoptimaliseerd. De selectie van
gefixeerde beslissingsvariabelen is gebaseerd op klassieke zoekalgoritmen en niet-gefixeerde be-
slissingsvariabelen worden geoptimaliseerd met Constraint programming (CP). We evalueren
de impact van plaatsvereisten op de efficientie van de assemblagelijn door te vergelijken met
oplossingen die enkel rekening houden met tijdsvereisten.
In hoofdstuk 6 combineren we beslissingen met betrekking tot het balanceren van de assem-
blagelijn en het bevoorraden van de assemblagelijn om de kosten van het assemblagesysteem te
minimaliseren. Daartoe breiden we het model uit hoofdstuk 3 uit en integreren het in een ALBP
met een vooraf bepaalde cyclustijd. Bovendien bepalen we de grootte van de assemblagefabriek
op basis van balancerings- en toevoerbeslissingen. Aangezien dit probleem moeilijk op te los-
sen is, stellen we een logic-based Bender’s decompositie aanpak voor. In deze aanpak wordt
het assemblagelijn-balanceerprobleem in de eerste stap opgelost. In de tweede stap wordt de
haalbaarheid van de oplossing geverifieerd. Daarna worden alle kosten berekend, en begint het
proces opnieuw totdat is bewezen dat geen betere oplossing kan worden gevonden. We passen
deze aanpak toe op een gevalstudie waarin reele gegevens worden gecombineerd met artificiele
gegevens. Voor onze resultaten onderzoeken we het effect van het gelijktijdig beschouwen van
beide problemen door de oplossingen te vergelijken met scenario’s waarin sommige beslissingen
buiten het optimalisatiemodel worden gemaakt.


Contents
Acknowledgment iii
Summary vii
Samenvatting xi
List of Figures xix
List of Tables xxi
1 Introduction 1
1.1 Motivation . . . . . . . . . . . . . . . . . . . . . . . . . . . . . . . . . . . . . . . 2
1.2 Problem statement . . . . . . . . . . . . . . . . . . . . . . . . . . . . . . . . . . . 5
1.2.1 Assembly line balancing problems . . . . . . . . . . . . . . . . . . . . . . 6
1.2.2 Assembly line feeding problems . . . . . . . . . . . . . . . . . . . . . . . . 7
1.3 Research outline . . . . . . . . . . . . . . . . . . . . . . . . . . . . . . . . . . . . 8
1.4 Publications . . . . . . . . . . . . . . . . . . . . . . . . . . . . . . . . . . . . . . . 12
2 A classification of tactical assembly line feeding problems 17
2.1 Introduction . . . . . . . . . . . . . . . . . . . . . . . . . . . . . . . . . . . . . . . 18
2.2 Problem definition and scope . . . . . . . . . . . . . . . . . . . . . . . . . . . . . 19
2.2.1 Assembly line feeding policies . . . . . . . . . . . . . . . . . . . . . . . . . 19
2.2.2 The assembly line feeding problem . . . . . . . . . . . . . . . . . . . . . . 23
2.2.3 Line feeding processes . . . . . . . . . . . . . . . . . . . . . . . . . . . . . 26
2.2.4 Line feeding decision levels . . . . . . . . . . . . . . . . . . . . . . . . . . 27
2.3 Problem classification . . . . . . . . . . . . . . . . . . . . . . . . . . . . . . . . . 30
2.3.1 Assembly line and product characteristics . . . . . . . . . . . . . . . . . . 31
2.3.2 Feeding system characteristics . . . . . . . . . . . . . . . . . . . . . . . . . 34
2.3.3 Objectives . . . . . . . . . . . . . . . . . . . . . . . . . . . . . . . . . . . . 40
2.4 Literature classification . . . . . . . . . . . . . . . . . . . . . . . . . . . . . . . . 41
2.5 Further research . . . . . . . . . . . . . . . . . . . . . . . . . . . . . . . . . . . . 45
2.5.1 Extending the ALFP . . . . . . . . . . . . . . . . . . . . . . . . . . . . . . 45
2.5.2 Integrating additional aspects with the ALFP . . . . . . . . . . . . . . . . 48

xvi Contents
2.6 Conclusion . . . . . . . . . . . . . . . . . . . . . . . . . . . . . . . . . . . . . . . 49
3 Mixed-model assembly line feeding with discrete location assignments and
variable station space 51
3.1 Introduction . . . . . . . . . . . . . . . . . . . . . . . . . . . . . . . . . . . . . . . 52
3.2 Literature study . . . . . . . . . . . . . . . . . . . . . . . . . . . . . . . . . . . . 53
3.3 Problem definition and planning environment . . . . . . . . . . . . . . . . . . . . 55
3.3.1 Characteristics of the assembly line feeding problem . . . . . . . . . . . . 55
3.3.2 Cost calculation . . . . . . . . . . . . . . . . . . . . . . . . . . . . . . . . 56
3.4 Modeling an ALFP with variable space . . . . . . . . . . . . . . . . . . . . . . . . 61
3.5 Solving procedure . . . . . . . . . . . . . . . . . . . . . . . . . . . . . . . . . . . . 66
3.5.1 Preprocessing . . . . . . . . . . . . . . . . . . . . . . . . . . . . . . . . . . 68
3.5.2 Valid inequalities . . . . . . . . . . . . . . . . . . . . . . . . . . . . . . . . 68
3.5.3 Branch and cut . . . . . . . . . . . . . . . . . . . . . . . . . . . . . . . . . 69
3.5.4 Cut and Branch . . . . . . . . . . . . . . . . . . . . . . . . . . . . . . . . 71
3.6 Computational experiments . . . . . . . . . . . . . . . . . . . . . . . . . . . . . . 71
3.6.1 Data . . . . . . . . . . . . . . . . . . . . . . . . . . . . . . . . . . . . . . . 71
3.6.2 Computational insights . . . . . . . . . . . . . . . . . . . . . . . . . . . . 74
3.6.3 Decision making insights . . . . . . . . . . . . . . . . . . . . . . . . . . . . 75
3.7 Discussion . . . . . . . . . . . . . . . . . . . . . . . . . . . . . . . . . . . . . . . . 88
3.7.1 Implication . . . . . . . . . . . . . . . . . . . . . . . . . . . . . . . . . . . 88
3.7.2 Limitations . . . . . . . . . . . . . . . . . . . . . . . . . . . . . . . . . . . 88
3.8 Conclusion . . . . . . . . . . . . . . . . . . . . . . . . . . . . . . . . . . . . . . . 89
3.8.1 Summary . . . . . . . . . . . . . . . . . . . . . . . . . . . . . . . . . . . . 89
3.8.2 Further research . . . . . . . . . . . . . . . . . . . . . . . . . . . . . . . . 90
4 Optimizing kitting cells in mixed-model assembly lines 91
4.1 Introduction . . . . . . . . . . . . . . . . . . . . . . . . . . . . . . . . . . . . . . . 92
4.2 Industrial setting . . . . . . . . . . . . . . . . . . . . . . . . . . . . . . . . . . . . 92
4.3 Related literature . . . . . . . . . . . . . . . . . . . . . . . . . . . . . . . . . . . . 93
4.4 Modeling approach . . . . . . . . . . . . . . . . . . . . . . . . . . . . . . . . . . . 94
4.4.1 Optimization model . . . . . . . . . . . . . . . . . . . . . . . . . . . . . . 97
4.4.2 Cost calculation . . . . . . . . . . . . . . . . . . . . . . . . . . . . . . . . 99
4.5 Computational study . . . . . . . . . . . . . . . . . . . . . . . . . . . . . . . . . . 100
4.5.1 Setting . . . . . . . . . . . . . . . . . . . . . . . . . . . . . . . . . . . . . 101
4.5.2 Results . . . . . . . . . . . . . . . . . . . . . . . . . . . . . . . . . . . . . 102
4.6 Future research . . . . . . . . . . . . . . . . . . . . . . . . . . . . . . . . . . . . . 103
5 The impact of spatial considerations on assembly line efficiency 105
5.1 Introduction . . . . . . . . . . . . . . . . . . . . . . . . . . . . . . . . . . . . . . . 106
5.2 Literature review . . . . . . . . . . . . . . . . . . . . . . . . . . . . . . . . . . . . 107
5.3 Bounds and solution space . . . . . . . . . . . . . . . . . . . . . . . . . . . . . . . 108

Contents xvii
5.3.1 Baseline bounds . . . . . . . . . . . . . . . . . . . . . . . . . . . . . . . . 109
5.3.2 Finding greedy solutions . . . . . . . . . . . . . . . . . . . . . . . . . . . . 111
5.3.3 Bound improvement . . . . . . . . . . . . . . . . . . . . . . . . . . . . . . 112
5.3.4 Calculating earliest and latest station . . . . . . . . . . . . . . . . . . . . 113
5.4 Solution approaches . . . . . . . . . . . . . . . . . . . . . . . . . . . . . . . . . . 114
5.4.1 A linear integer programming model . . . . . . . . . . . . . . . . . . . . . 115
5.4.2 A constraint programming approach . . . . . . . . . . . . . . . . . . . . . 117
5.5 Computational experiments . . . . . . . . . . . . . . . . . . . . . . . . . . . . . . 121
5.5.1 Solving SALBP-E . . . . . . . . . . . . . . . . . . . . . . . . . . . . . . . 122
5.5.2 Solving TSALBP-1/2 . . . . . . . . . . . . . . . . . . . . . . . . . . . . . 126
5.6 Conclusion . . . . . . . . . . . . . . . . . . . . . . . . . . . . . . . . . . . . . . . 130
5.6.1 Summary . . . . . . . . . . . . . . . . . . . . . . . . . . . . . . . . . . . . 130
5.6.2 Further research . . . . . . . . . . . . . . . . . . . . . . . . . . . . . . . . 131
6 Integrating assembly line feeding and balancing optimization for improved
decision making 133
6.1 Introduction . . . . . . . . . . . . . . . . . . . . . . . . . . . . . . . . . . . . . . . 134
6.2 Literature review . . . . . . . . . . . . . . . . . . . . . . . . . . . . . . . . . . . . 134
6.2.1 Assembly line balancing . . . . . . . . . . . . . . . . . . . . . . . . . . . . 134
6.2.2 Assembly line feeding . . . . . . . . . . . . . . . . . . . . . . . . . . . . . 135
6.2.3 Integration of both problems . . . . . . . . . . . . . . . . . . . . . . . . . 136
6.3 Problem definition . . . . . . . . . . . . . . . . . . . . . . . . . . . . . . . . . . . 137
6.3.1 Planning environment . . . . . . . . . . . . . . . . . . . . . . . . . . . . . 137
6.3.2 Solution approach . . . . . . . . . . . . . . . . . . . . . . . . . . . . . . . 141
6.3.3 Cost calculation . . . . . . . . . . . . . . . . . . . . . . . . . . . . . . . . 151
6.4 Case study . . . . . . . . . . . . . . . . . . . . . . . . . . . . . . . . . . . . . . . 157
6.4.1 Assembly line feeding data . . . . . . . . . . . . . . . . . . . . . . . . . . 157
6.4.2 Assembly line balancing data . . . . . . . . . . . . . . . . . . . . . . . . . 158
6.5 Results . . . . . . . . . . . . . . . . . . . . . . . . . . . . . . . . . . . . . . . . . . 161
6.5.1 Managerial results . . . . . . . . . . . . . . . . . . . . . . . . . . . . . . . 161
6.5.2 Computational results . . . . . . . . . . . . . . . . . . . . . . . . . . . . . 165
6.6 Conclusion and future research . . . . . . . . . . . . . . . . . . . . . . . . . . . . 166
7 General conclusions and recommendations for future research 167
7.1 Conclusions . . . . . . . . . . . . . . . . . . . . . . . . . . . . . . . . . . . . . . . 168
7.2 Practical implementation . . . . . . . . . . . . . . . . . . . . . . . . . . . . . . . 172
7.3 Future research . . . . . . . . . . . . . . . . . . . . . . . . . . . . . . . . . . . . . 174
7.3.1 Extensions and adaptations . . . . . . . . . . . . . . . . . . . . . . . . . . 174
7.3.2 Other research directions . . . . . . . . . . . . . . . . . . . . . . . . . . . 175
References 179


List of Figures
1.1 Overview of assembled products, clustered by industry . . . . . . . . . . . . . . . 3
1.2 Overview of Audi car production from 1965-2021 . . . . . . . . . . . . . . . . . . 4
1.3 Precedence graph of assembly tasks . . . . . . . . . . . . . . . . . . . . . . . . . . 7
1.4 Scope of the thesis’ chapters . . . . . . . . . . . . . . . . . . . . . . . . . . . . . . 8
2.1 Line feeding policies . . . . . . . . . . . . . . . . . . . . . . . . . . . . . . . . . . 21
2.2 Value stream map for assembly line feeding . . . . . . . . . . . . . . . . . . . . . 27
2.3 Effects of external handling on line feeding policies . . . . . . . . . . . . . . . . . 29
2.4 Structured approach to find related literature . . . . . . . . . . . . . . . . . . . . 31
3.1 Example of space borrowing . . . . . . . . . . . . . . . . . . . . . . . . . . . . . . 53
3.2 Solution approach . . . . . . . . . . . . . . . . . . . . . . . . . . . . . . . . . . . 67
3.3 Cost shares of feeding processes . . . . . . . . . . . . . . . . . . . . . . . . . . . . 76
3.4 Comparing a stepwise to the integrated approach . . . . . . . . . . . . . . . . . . 77
3.5 Line feeding policy mix . . . . . . . . . . . . . . . . . . . . . . . . . . . . . . . . 78
3.6 Line feeding policy mix depending on factorial design . . . . . . . . . . . . . . . . 80
3.7 Line feeding policy mix depending on dataset characteristics . . . . . . . . . . . . 83
3.8 Space usage in relation to regular station size . . . . . . . . . . . . . . . . . . . . 84
3.9 Usage of relative location for different line feeding policies . . . . . . . . . . . . . 86
3.10 Combinations of line feeding policies within a single family . . . . . . . . . . . . 87
4.1 Material flow . . . . . . . . . . . . . . . . . . . . . . . . . . . . . . . . . . . . . . 93
4.2 Flow in design . . . . . . . . . . . . . . . . . . . . . . . . . . . . . . . . . . . . . 95
4.3 Using rows to define a cell’s length . . . . . . . . . . . . . . . . . . . . . . . . . . 98
4.4 Front view of a rack used for smaller containers . . . . . . . . . . . . . . . . . . . 99
5.1 Precedence graph of assembly tasks described in Bowman (1960) . . . . . . . . . 106
5.2 Binomial probability distribution for the assignment of space requirements . . . . 127
5.3 Comparison of idle time and idle space . . . . . . . . . . . . . . . . . . . . . . . . 130
6.1 VSM of the processes in the assembly system . . . . . . . . . . . . . . . . . . . . 138
6.2 Shop floor plan of possible scenarios w.r.t preparation space (aerial view) . . . . 138
6.3 Use of locations . . . . . . . . . . . . . . . . . . . . . . . . . . . . . . . . . . . . . 140

xx List of Figures
6.4 Algorithmic steps of logic-based Benders’ decomposition . . . . . . . . . . . . . . 145
6.5 Change of line organization for the assembly line ‘Final4’ . . . . . . . . . . . . . 164

List of Tables
2.1 Line feeding policies . . . . . . . . . . . . . . . . . . . . . . . . . . . . . . . . . . 20
2.2 Notation for a simple assembly line feeding problem . . . . . . . . . . . . . . . . 23
2.3 Line feeding decisions on different decision levels . . . . . . . . . . . . . . . . . . 28
2.4 Search terms used in Web of Science and research fields used to exclude not related
papers . . . . . . . . . . . . . . . . . . . . . . . . . . . . . . . . . . . . . . . . . . 32
2.5 Classified literature on assembly line feeding . . . . . . . . . . . . . . . . . . . . . 42
3.1 Comparison of different line feeding policies . . . . . . . . . . . . . . . . . . . . . 55
3.2 Parameter notation and values . . . . . . . . . . . . . . . . . . . . . . . . . . . . 57
3.3 Notation for the IP model . . . . . . . . . . . . . . . . . . . . . . . . . . . . . . . 62
3.4 Instance characteristics . . . . . . . . . . . . . . . . . . . . . . . . . . . . . . . . . 73
3.5 Varied parameters for full factorial design . . . . . . . . . . . . . . . . . . . . . . 74
3.6 Solving times and gaps when applying solving procedure . . . . . . . . . . . . . . 74
3.7 Measuring the effect of high level decisions on costs . . . . . . . . . . . . . . . . . 76
3.8 Measuring the effect of high level decisions on line feeding policies . . . . . . . . 79
3.9 Part characteristics of parts assigned to a line feeding policy . . . . . . . . . . . . 81
3.10 Measuring the effect of high level decisions on line feeding policies . . . . . . . . 82
4.1 Model notation . . . . . . . . . . . . . . . . . . . . . . . . . . . . . . . . . . . . . 96
4.2 Parameters used for cost calculations . . . . . . . . . . . . . . . . . . . . . . . . . 99
4.3 Results of the partial level heuristics . . . . . . . . . . . . . . . . . . . . . . . . . 102
5.1 Types of TSALBP . . . . . . . . . . . . . . . . . . . . . . . . . . . . . . . . . . . 108
5.2 Notation . . . . . . . . . . . . . . . . . . . . . . . . . . . . . . . . . . . . . . . . . 114
5.3 Example of a tableau containing the realizable idle time of station and cycle time
combinations . . . . . . . . . . . . . . . . . . . . . . . . . . . . . . . . . . . . . . 118
5.4 Dataset characteristics . . . . . . . . . . . . . . . . . . . . . . . . . . . . . . . . . 121
5.5 Comparison of constructive greedy heuristics . . . . . . . . . . . . . . . . . . . . 123
5.6 Improved mathematical programming approach . . . . . . . . . . . . . . . . . . . 123
5.7 Constraint programming approach and redundant constraints . . . . . . . . . . . 124
5.8 Number of instances solved in the literature and by our approach . . . . . . . . . 125
5.9 Comparison of instance hardness . . . . . . . . . . . . . . . . . . . . . . . . . . . 126

xxii List of Tables
5.10 Comparison of instance hardness . . . . . . . . . . . . . . . . . . . . . . . . . . . 126
5.11 Comparison of the cycle time upper bounds . . . . . . . . . . . . . . . . . . . . . 127
5.12 Comparison of constructive greedy heuristics including space requirements . . . . 128
5.13 Comparison of SALBP-E and TSALBP-1/2 . . . . . . . . . . . . . . . . . . . . . 129
6.1 Notation for optimization models . . . . . . . . . . . . . . . . . . . . . . . . . . . 141
6.2 Parameters used for cost calculations . . . . . . . . . . . . . . . . . . . . . . . . . 151
6.3 Instance characteristics w.r.t. feeding . . . . . . . . . . . . . . . . . . . . . . . . . 157
6.4 Instance characteristics w.r.t. balancing . . . . . . . . . . . . . . . . . . . . . . . 158
6.5 Influence of balancing decisions on overall costs . . . . . . . . . . . . . . . . . . . 163
6.6 Solving times and gaps when applying solving procedure . . . . . . . . . . . . . . 165
7.1 Hardness list for instances from Scholl (1993) . . . . . . . . . . . . . . . . . . . . 194

List of Acronyms
3PL 3rd party logistics service provider
ALFP Assembly line feeding problem
ALBP Assembly line balancing problem
BoL Border of line
BAC Branch and cut
CAB Cut and branch
CP Constraint programming
FBFF Fixed balance, fixed feeding
FBOF Fixed balance, optimized feeding
JIS Just-in-Sequence
MaaS Manufacturing-as-a-Service
MILP Mixed-integer linear programming
MTO Make-to-order
MTS Make-to-stock

xxiv List of Acronyms
OBOF Optimized balance, optimized feeding
OBFF Optimized balance, fixed feeding
RB1OF Re-balance by 1 station, optimized feeding
RB2OF Re-balance by 2 stations, optimized feeding
RQ Research Question
SALBP Simple assembly line balancing problem
SALBP-1 Simple assembly line balancing problem type 1
VI Valid Inequality
VSM Value Stream Map

1Introduction
“If you can’t explain it simply, you don’t understand it well enough.”
Albert Einstein

2 Chapter 1
1.1 Motivation
The second industrial revolution, taking place between 1870-1914 A.D., was characterized by
a series of innovations, standardization, and industrialization (Mokyr, 1998). Merriam-Webster
defines standardization as a process that ‘bring[s] [something] into conformity with a standard
especially in order to assure consistency and regularity’. Henry Ford, founder of the Ford Motor
Company, contributed significantly to bringing this standardization into action when co-inventing
the assembly line. The introduction of assembly lines allowed for a better division of labor and
workers’ specialization, which led to a new era of efficient production, called mass production
(Watts, 2005). This process was especially useful for the production of complex physical goods
as standardization of products and processes enabled a far more efficient production. Historian
Mokyr (1998) even argues that the changes in production ‘from a purely economic point of view,
[may be] the most important invention [of the second industrial revolution]’.
Initially, Ford developed the assembly line for the production of Ford’s Model-T. However, other
automobile companies quickly adopted this system, and today, almost all automobiles are pro-
duced on assembly lines (excluding prototypes or limited models) (Rundfunk, 2021). With the
introduction of the assembly line, the average production time of a Model-T decreased from
around 12.5 hours to 1.5 hours (Welt, 2013). However, a reduction in lead time was not the
only change the assembly line was about to bring. It also facilitated to employ (some) untrained
workers at those assembly lines. As a result costs decreased drastically and the demand and
production of cars drastically increased in the following years.
Not surprisingly, other industries, especially industries with complex products, adopted assembly
lines to benefit from its efficiency increase. Today, various industries use assembly lines to produce
a wide variety of goods, as represented in Figure 1.1, that affect our everyday life.
The products shown in Figure 1.1 are manufactured on assembly lines due to high production
speed and low production costs.
However, there is a stark contrast in early- and modern-day assembly systems. That is, modern
assembly systems are much more complex than the former due to the following factors (amongst
others).
• Increase in product complexity.
• Increase in product diversity.
• Product customization.
Product complexity Typically, assembly systems are used to manufacture products with a
high complexity degree and they were used first when such products were demanded in large
quantities, i.e., the rise of the personal automobile. Considering the improvement and evolution
of all kinds of goods, increasing product complexity is impossible to miss. A good example is the
comparison of the first bicycles with a modern-day racing bicycle. The former consists only of
wheels, frame, steering wheel, and a seat whereas modern bikes are extended by many additional
parts such as pedals, chains, brakes, cogs, shifters, and lights. Many developed economies such

Introduction 3
Cars
Trucks
Buses
Trains
TractorsCombine harvester
Transport
Laptops
Phones Music systems
Tablets
Tools, e.g. jigsaw
CNC machines
3D-printers
ManufacturingConsumer electronics
Dryer
Fridges
Freezer
Microwaves Stoves
Restaurants
Ovens
Routers
Computing servers
Boats
Airplanes
(Motor)bikes
(Smart)watches
Houses
ATMs
Forklifts
AGVs
Beverage dispensing systems
Cash card reader
Household
Forest harvester
Agriculture
Agricultural machinery
RVs
Scooters
Toys
Wind turbines
Solar panels
Renewableenergies
Fuel cells
Faucets
Gasoline pumps
Boilers
HeatingCraft
DressersWardrobes
Racks
FurnitureLamps
Living
electric vehicle charging stations
Doors
Windows
Health Care
Hospital beds
Ventilation machines
X-ray machines MRI machines
Surgical robots
TVsTugger trains
Other
Convenience food
Washing machines
Figure 1.1 Overview of assembled products, clustered by industry
as Belgium, Germany, Japan, Sweden, and the United States of America build their wealth
with the production and export of such complex products (Felipe et al., 2012). The increase in
product functionality requires more complex production steps and more logistical coordination
in sourcing all parts and coordinating their material flow.
Product diversity In addition to the increase in products complexity, there is also a trend of
product diversification which we refer to as model proliferation. A model describes a product’s
specific version, such as a BMW series 3 or series 5. Models typically differ in the use of
fundamental parts (e.g., chassis or engine) or properties (e.g., minivan vs. convertible) (Scholl
et al., 1999). As a consequence of this model proliferation and the saturation of markets in western
countries, some product models’ production quantities are stagnating or decreasing (similar
trends can be observed in other sectors such as smartphones). Therefore, producers are adjusting
their assembly lines to facilitate the mass production of multiple complex products on a single
assembly line. Figure 1.2 provides an example on the evolution of the number of Audi models
produced, and the number of factories in which these models are produced over time. As one can
observe, facilities started off producing just a single model, however, over time multiple models
were produced at a single facility or even assembly line. This increase in product diversity also
leads to additional complexity in the coordination of manufacturing and logistics processes. For
example, additional suppliers may be needed to guarantee the provision of sufficient raw materials
and parts. Furthermore, the assembly tasks for some products produced on a single assembly
line may differ. Therefore, assembly lines need to be adjusted to spread tasks in an efficient
manner over different workstations, These adjustments lead to more diverse product flows and

4 Chapter 1
more variability in the system.
1,960 1,970 1,980 1,990 2,000 2,010 2,020
0
20
40
Year
#M
od
els
ModelsPlants
Figure 1.2 Overview of Audi car production from 1965-2021 (based on Wikipedia (2021))
Product customization While many products were initially standardized, customers were
demanding products matching their desires such as color, quality, and functionalities. This urge
was heavily supported by the marketing industry (Kotler, 1989). Even though some authors date
mass customization back to the late 1980s (Ferguson et al., 2014), it is difficult to determine
the exact starting time of this phenomenon. The so-called Just-in-Sequence (JIS)-principle,
introduced by Japanese automotive company Toyota in the 1980s, was undoubtedly an essential
change towards mass customization. The JIS-principle describes the delivery of parts in the
sequence of demand, i.e., each product receives some parts that are specifically dedicated to
this product as the client determined the product’s composition. The introduction of JIS also
coincides with the rise of the term mass customization 1 in the 1980s. Mass customization
describes the production according to the individual demand of each customer rather than the
production of few standardized products. Even though assembly lines were initially designed to
produce large quantities of a standardized product, they were adapted to suit mass customization,
e.g., by exploiting the JIS-principle.
As discussed above, the organization of assembly systems is becoming increasingly complex
while competition is becoming more fierce. Each of the trends described above contributed
to a steady complication of manufacturing and logistics activities. When products were more
standardized, logistical workflows were much more limited and less complicated. However, the
above-described increase in system complexity makes these systems prone to waste. Therefore,
companies target cutting costs and managing their assembly process by standardizing processes
1The term is a portmanteau of the phrases mass production and customization.

Introduction 5
and reducing unnecessary operations. However, as these systems are becoming huge in scale,
it is hard to manage such systems manually. Therefore, both academics and practitioners have
started turning towards quantitative solution approaches.
The vast amount of decisions, operations, and the control of these systems has also been addressed
in conceptual frameworks such as Industry 4.0 (Kagermann et al., 2013; Saucedo-Martınez et al.,
2018) or the physical internet (Montreuil, 2011), which seek to (autonomously) optimize the
design and operation of complex production and logistics systems based on (real-time) data.
Important aspects of these frameworks are data exchange between different entities such as
machines or vehicles and related communication technologies. This communication aims to
enable (near) optimal real-time decision-making for logistics and production systems. Clearly,
the optimization problems tackled in those frameworks are rather short-termed. Therefore, it is
of vital importance to design the corresponding systems appropriately. This thesis discusses such
design problems, i.e., it shows how to optimize more tactical decisions that determine essential
system parameters. Based on these decisions, more fine-grained operational decisions may be
optimized autonomously. Furthermore, the data availability in such hyper-connected systems
may be an asset when used to extract additional problem insights and incorporate those into
tactical decision-making tools.
1.2 Problem statement
As demonstrated above, assembled products are omnipresent in both our personal as much as
professional lives. However, the use of assembly lines requires setting up and efficiently organizing
assembly systems. While the term assembly system frequently describes the assembly line or the
feeding system (see, e.g., Arai et al. (2000); Battini et al. (2010b); Hu et al. (2011)), the term is
used in a much broader sense in this thesis. As mentioned above, an assembly system consists of
physical and organizational aspects. In terms of physical aspects, an assembly system is, among
others, defined by geographical location, factory size, building architecture, equipment usage and
placement, production and logistics areas within the building, gates, and driveways. Some of
the assembly system’s organizational aspects are the assignment of products to assembly lines,
the distribution of tasks among different workers, production planning, scheduling activities,
material flow, and process definitions. The combination of all these and other characteristics
determines an assembly system. For planners, this raises the task of making decisions on all
these aspects, knowing that many decisions are interlinked. When planning the manufacturing
and logistical processes of a production facility, e.g., physical characteristics may result from this
planning, or they may be an input to this planning. Another option is the joint planning of
physical characteristics and processes. The design of such an assembly system includes various
decisions, classified as strategic, tactical, and operational decisions in this thesis.
• Strategic level: The strategic level is concerned with long-term decisions such as make-
or-buy, supplier selection, single vs. multi-sourcing, and facility location (Gopfert et al.,
2016). These decisions are of the highest strategic relevance and form the basis for decisions

6 Chapter 1
on the tactical and operational levels. However, lower-level decisions may be taken into
account when making these decisions, or strategic decisions may require adaptation after
lower-level decisions are determined.
• Tactical level: Once a facility’s location and the outsourcing of production and logistics
activities are determined, tactical decisions can be taken. One tactical decision is the as-
sembly line’s design, which is concerned with deciding the number of assembly stations
and assigning tasks to stations (Boysen et al., 2007). In literature, this is described as
the ALBP. Another tactical decision is the logistical system’s determination, mainly con-
cerned with feeding parts to the line. Part feeding decisions, which are made in the ALFP,
determine presorting activities of parts and the delivery quantity to the line. Furthermore,
those decisions have an impact on the facility’s requirements in terms of space and equip-
ment. The facility’s design and the acquisition of logistical and assembly equipment such
as forklifts, racks, and tools may be considered another tactical decision. All decisions on
the tactical level are linked to each other.
• Operational level: On the operational level, short-term decisions such as loading and
routing of in-house vehicles or the scheduling of logistical picking operations are to be
taken. Another operational decision is the sequencing of products on the line: When
multiple products are produced on a single line, the assembly times at any station may
vary for these products, and drift may occur, i.e., some products may require less time
(negative drift) whereas other products may require more time (positive drift) than the
time available at a station (Hu et al., 2011). Therefore, it may be necessary to sequence
products such that any positive drift is canceled out over time (Emde and Polten, 2019).
In this thesis, the focus will be on tactical decision-making, specifically the assembly line balanc-
ing and the assembly line feeding problem. In literature, these two decision-making problems are
usually treated separately (see, e.g., Battaıa and Dolgui (2013) and Schmid and Limere (2019)).
Similarly, in practice, both problems are associated with two different departments: the in-house
logistics department works on assembly line feeding decisions the production department works
on assembly line balancing decisions. This thesis considers both problems individually before
both problems are combined and integrated with facility design to evaluate the merits of such an
integration. Before discussing the outline and contribution of this thesis, an informal explanation
of both problems is given.
1.2.1 Assembly line balancing problems
Assembly line balancing problems are concerned with assigning a set of assembly tasks to work
stations. The number of tasks and their characteristics needs to be known in advance. Essential
characteristics are assembly times and the precedence relations of all tasks. The assembly time
describes how long an operator needs to assemble a part onto the product. These times are
typically estimations based on time studies such as Methods-Of-Time-Measurements (MTM),
REFA, or Very Easy Work-factor (VWF). Precedence relations describe the order in which tasks

Introduction 7
can be conducted and are primarily given in the form of a precedence graph, more specifically an
acyclic digraph. An example of such a graph can be found in Figure 1.3, with nodes representing
tasks and arcs (directed edges) indicate precedence relations. E.g., task 8 can only be started
after task 7 is finished.
The assignment of tasks has to be done such that the sum of task assembly times at any station
is smaller or equal to the cycle time. This cycle time is either given as a parameter (following a
demand-driven calculation) or minimized. Similarly, the number of stations may be given as a
parameter or minimized. A combination of these options results in four possible combinations,
which are considered a class of simple assembly line balancing problems (SALBPs) (Baybars,
1986) SALBP-F: a feasibility problem, verifying if there is a solution with a given number of
stations and a given cycle time. SALBP-1: Cycle time given, Minimizing the number of stations.
SALBP-2: number of stations given, minimizing cycle time. SALBP-E: Efficiency problem,
minimizing both the number of stations and cycle time.
1
2
3
4
5
6
7 8
Figure 1.3 Precedence graph of assembly tasks (adjusted from Bowman (1960))
1.2.2 Assembly line feeding problems
The assembly line feeding problem is typically solved after the assembly line balancing problem.
Thus, the number of stations, the cycle time, and the tasks assigned to each station are known.
Next, every task is linked to all the parts needed for execution. The term part family is used to
create subsets of parts. Each part family is a set of parts, also known as Stock-Keeping-Units
(SKUs) or components, that serve the same or a very similar purpose. However, they are not
identical as they might differ concerning color, quality, or haptics. All parts in a part family
complement each other, which means that only one part from any family can be used for a
specific product.
When solving the assembly line feeding problem, the goal is to assign each part to a line feeding
policy while minimizing the associated logistical efforts or costs. This cost minimization problem
can be complemented by various constraints and decisions that will be discussed at a later stage
(Chapter 2). Line feeding policies define three aspects of part feeding:
• The execution of the associated logistical processes within the assembly facility.
• The combination of parts and part families in a single load carrier.
• The selection of a load carrier holding the material at the work station.

8 Chapter 1
In this work, we distinguish five line feeding policies: (i) line stocking, i.e., the provision of a
large load carrier including only one type of parts; (ii) boxed-supply, in which a smaller quantity
of one part type is provided in a small load carrier or box; (iii) sequencing, for which all parts
of a part family are sorted into a single load carrier according to the production sequence; (iv)
stationary kits, which contain multiple sequenced part families used at a single station; and (v)
traveling kits, that contain multiple sequenced part families used at multiple stations.
1.3 Research outline
As discussed above, this thesis is concerned with the assembly line balancing and the assembly
line feeding problem. Figure 1.4 shows how the problems in this thesis are linked to each other
and represents which problem is studied in which chapter. Assembly line feeding and balancing
are considered to be tactical (mid-term) problems and the balancing problem is typically solved
before solving feeding problems. Similarly, tactical problems are solved before operational prob-
lems such as product sequencing or in-house transportation optimization. However, in Chapter
6, we will solve both tactical problems jointly to investigate their interaction. All chapters except
Chapter 4 are concerned with more tactical problems whereas Chapter 4 is concerned with the
operational problem of increasing the efficiency of a subprocess that is a result of the tactical
line feeding problem. The content of each chapter will be discussed in the following.
Tactical ALBP
Chapter 5
Chapter 6
Chapter 2 & 3
Tactical ALFP
Sequencing
Chapter 4
Operational feeding
Hierarchical planning
Interactions
Figure 1.4 Scope of the thesis’ chapters
The remaining chapters of this thesis are mostly concerned with an optimization-based perspec-
tive on the problems described above, i.e., the assembly line feeding and balancing problems.
The motivation to study those problems by means of optimization-based approaches arises from
the fact that these problems are highly constrained which makes them difficult to handle. As

Introduction 9
the main goal of the studies in this thesis is efficiency gains, optimization approaches seem most
promising. However, it may be worthwhile to study the same problems from a simulation per-
spective. Simulation approaches can very well be used to (i) verify assumptions on the chosen
parameters; (ii) test the robustness of the solutions when parameters change and; (iii) serve as
a digital twin of an operational assembly system. This digital twin may provide information on
bottle necks in the system and help to reduce practical inefficiencies (see Coelho et al. (2021)).
In this chapter’s remainder, the other chapters’ content will be presented, and research questions
for each chapter will be formulated. Finally, the contribution of this thesis to the field of assembly
systems will be discussed.
Chapter 2: A classification of tactical assembly line feeding problems
Chapter 2 is concerned with the assembly line feeding problem and serves as a more detailed
introduction into the organization of assembly systems. Assembly line feeding is a rather young
field that has first received academic attention in the early 1990s (Bozer and McGinnis, 1992).
Therefore, efforts in this field are diverse in their scope and assumptions. Both the research
methodology and managerial aspects of assembly line feeding problems have been tackled differ-
ently in the literature. From a methodological point of view, the problem has been approached
by descriptive cost models (Bozer and McGinnis, 1992; Caputo and Pelagagge, 2011; Sali et al.,
2015), simulation (Klampfl et al., 2006) and optimization-based models (Limere, 2011; Limere
et al., 2015; Sali and Sahin, 2016). From a managerial perspective, some authors focused on
cost-elements (Caputo and Pelagagge, 2011; Caputo et al., 2015c) whereas others focused on
the system’s feasibility in a given environment (Limere, 2011; Sali and Sahin, 2016). More-
over, line feeding decisions have not been well-defined. Therefore, a first research question (RQ)
emerged that aims to unify efforts and provide fundamental definitions for academics and indus-
trial decision-makers for the optimization-based assembly line feeding problem.
RQ 1.1: What constitutes the tactical assembly line feeding problem and which decisions
are part of the problem’s scope?
To answer this research question, a formal definition of the problem is given, and the ALFP is
proven to be an NP-hard problem. Besides, this problem’s tactical decisions are delineated from
operational and strategic decisions, and the problem’s scope is defined.
Due to the diverse research approaches in assembly line feeding, the assumptions and decisions
incorporated in preceding studies are not always obvious. Therefore, Sections 2.3 provides a
three-field classification scheme similar to Graham et al. (1979) or Brucker et al. (1999). This
three-field-notation is then applied to literature to derive insights into future research directions
by answering the next research question.
RQ 1.2: Which decisions, assumptions, and constraints are fundamental for the assem-
bly line feeding problem, and which aspects of this problem class are vital for the field’s
development?

10 Chapter 1
Chapter 3: Mixed model assembly line feeding with discrete location assignments
and variable station space
The findings of Chapter 2 revealed that five different line feeding policies are used in practice, but
no study has considered more than three feeding policies at a time. Limere (2011); Limere et al.
(2015); Sternatz (2015), e.g., compare line stocking and stationary kitting. Sali and Sahin (2016)
include line stocking, sequencing, and stationary kits. Bozer and McGinnis (1992) describes
line stocking, stationary kits, and traveling kits. Therefore, Chapter 3 is concerned with the
assignment of assembly parts to all policies identified in Chapter 2.
RQ 2.1: Is it useful to consider all five line feeding policies simultaneously and how can
such a decision model be modeled?
In optimization-based models, most authors (see, e.g., Limere (2011); Sali and Sahin (2016)
consider that the space available at the BoL is limited and that the assignment of parts to line
feeding policies is influenced by the amount of space that is available. However, the positioning
of parts at the BoL has not received much attention. Only Klampfl et al. (2006) investigated
where to place parts at the BoL. However, the placement of parts may also affect the selection
of line feeding policies:
RQ 2.2: Does the placement of parts at specific locations affect the decision-making
process, and are there any patterns in the placement of items?
Each work station’s BoL was discretized into distinct locations to answer this question. Each
location can only be used to store parts assigned to a single line feeding policy, and each policy
has specific restrictions such as weight, volume, or the types of parts that can be combined.
These discrete locations are also used to accurately calculate the assembly operators’ walking
distances, affecting the system’s overall costs.
Lastly, Hua and Johnson (2010) noted that the amount of space available at any station might not
be used uniquely by that station. While the assembly line’s overall size remains fixed, adjacent
stations may share some of their space. In this study, we aimed to determine the gains of using
space more flexibly and tested the effect of ‘space borrowing’. Space borrowing means that a
station can use some space from an adjacent station if the adjacent station does not need that
space.
RQ 2.3: How does the possibility of space borrowing affect decision making for assembly
line feeding?
Chapter 4: Optimizing kitting cells in mixed-model assembly lines
Two of the line feeding policies identified in Chapter 2 are kitting-based policies. As described
above, a kit contains parts from multiple part families. Each kit contains only parts required for
a single product. The reader may think of it as a LEGO set that contains a collection of parts
needed to build a specific item. While a particular LEGO set always contains the same parts,

Introduction 11
this is not the case for kits used in the assembly process of mass customized products. Kits
include only a subset of part families since complex products typically contain too many parts
that cannot fit in a kit due to their physical characteristics. When preparing kits, however, only
one type of part per family will be included. This is obvious when considering that a part family
could describe a laptop’s hard drive: There may be multiple hard drives with varying capacities.
However, a laptop can only hold one of these hard drives. Kit preparation takes place in so-called
kitting cells. These cells have been described in various line feeding studies (Battini et al., 2017;
Limere, 2011; Schmid et al., 2020; Sternatz, 2015) but their design was mostly simplified. Other
studies were concerned with efficiency gains achieved by the cell’s location, batch sizing, or zoning
(Brynzer and Johansson, 1995). More recently, many studies have been investigating the impact
of technology such as pick-by-light on the performance of a kitting system (Fager et al., 2019).
However, only one study (Bortolini et al., 2020) was concerned with the positioning of parts
in kitting areas. However, this study assumed that kitting operations occur in the warehouse,
which is not feasible for many companies. Therefore, Chapter 4 investigates how such kitting
cells can be designed as there are no clear guidelines available yet.
RQ 3: How does the placement and determination of delivery quantities affect the cost of
operating a kitting cell?
To answer this question, we model and optimize such a kitting cell’s layout to minimize oper-
ating costs. This includes the determination of delivery quantities, the placement of parts and
equipment within the cell, and the sizing of the cell.
Chapter 5: The impact of spatial considerations on assembly line efficiency
Motivated by the results obtained in Chapter 3, namely that space borrowing is affecting de-
cision making in line feeding, this research investigates the impact of space on assembly line
balancing. In most studies on assembly line balancing, the requirement to store parts associated
with assembly tasks is neglected. Bautista and Pereira (2007), however, started to expand the
scope of assembly line balancing problems by the dimension of space. In this approach, each
task is associated with an individual space requirement while there is only a limited amount of
space available at each work station. In this chapter, an assembly line balancing problem of type
E, i.e., a problem that minimizes cycle time and the number of stations, is complemented with
spatial considerations as preceding studies for assembly line balancing problems of type-E do not
consider this (Corominas et al., 2016; Esmaeilbeigi et al., 2015; Wei and Chao, 2011).
RQ 4.1: How can existing solution approaches for the SALBP-E problem be improved and
extended to include additional constraints such as the consideration of spatial requirements?
To this end, existing mathematical programming approaches are benchmarked against each other
and improved. More importantly, a new approach combining classic search algorithms with
constraint programming is proposed. As mentioned above, the consideration of space may impact
decision making in line balancing. However, the impact of this has not yet been quantified as

12 Chapter 1
the focus in literature was mostly on computational aspects of the problem (see, e.g., Bautista
and Pereira (2007, 2011); Chica et al. (2016)).
RQ 4.2: To what extent does the consideration of spatial requirements alter an assembly
line’s performance?
This question will be answered by balancing the same tasks when considering spatial requirements
and comparing the results to a balance that does not consider spatial requirements.
Chapter 6: Integrating assembly line feeding and balancing optimization for im-
proved decision making
Building upon the previous chapters’ results, Chapter 6 is concerned with a simultaneous consid-
eration of assembly line balancing and assembly line feeding. It combines Chapter 3 and Chapter
5 in the form of a cost-minimization model that assigns tasks to stations and parts to feeding
policies. Sternatz (2015) was the first to integrate line feeding and balancing. However, similar
to many studies in line feeding, this study only considers two line feeding policies. Furthermore,
the proposed solution approach is based on a heuristic procedure. Therefore, it remains difficult
to evaluate the solution quality. With regards to balancing and feeding decisions, a similar study
has been conducted by Battini et al. (2017) while they additional integrated ergonomic aspects
and solved the problem using a standard MILP model. Furthermore, our study described in
Chapter 3 could confirm that the placement of parts along the BoL impacts feeding decision
making. When considering balancing and feeding simultaneously, this may be even more im-
portant as the placement affects walking and searching times which are typically assumed to be
known and included in the balancing times. This study aims to fill the research gap of accurately
modeling all line feeding policies and providing an exact solution approach.
RQ 5.1: How can this integrated problem be modeled accurately and solved efficiently?
A ‘natural’ way of modeling this problem is to separate the problems and iteratively solve them
individually utilizing a logic-based Bender’s decomposition. From a managerial perspective, this
integration raises the following question:
RQ 5.2: Does the integrated consideration of assembly line balancing and feeding impact
a line’s balance? What cost saving can be achieved?
1.4 Publications
Publications in peer-reviewed journals
• Schmid, N.A., Limere, V., Raa. B. (2021) Mixed model assembly line feeding with discrete
location assignments and variable station space, Omega - The international Journal of
Management Science, 102.

Introduction 13
• Schmid, N.A., Limere, V. (2019) A classification of tactical assembly line feeding problems,
International Journal of Production Research, 57(24), pp. 7586–7609.
Publications in peer-reviewed conference proceedings
• Limere, V., Popelier, L., Schmid, N.A. (2021) Balancing disassembly lines under considera-
tion of tool requirements and limited space, 17th IFAC Symposium on Information Control
Problems in Manufacturing
• Schmid, N.A., Wencang, B., Derhami, S., Montreuil, B., Limere, V. (2021) Optimizing
kitting cells in mixed-model assembly lines, 17th IFAC Symposium on Information Control
Problems in Manufacturing
• Schmid, N.A., Limere, V. Raa, B. (2018) Modeling variable space in assembly line feeding,
IFAC-PapersOnLine 51 (11), 164-169.
• Wijnant, H. Schmid, N.A. Limere, V. (2018) The influence of line balancing on line feeding
for mixed-model assembly lines, Proceedings of the 32nd annual European Simulation and
Modelling Conference, pp. 106–111.
Working paper
• Schmid, N.A., Limere, V., The impact of spatial considerations on assembly line efficiency.
• Schmid, N.A., Montreuil, B., Limere, V., Integrating assembly line feeding and balancing
optimization for improved decision making.
Presentations at (inter-)national conferences
• A Decomposition Scheme For Integrated Planning Of An Assembly System, coauthors:
Montreuil, B., Limere, V., INFORMS Annual Meeting 2020, 11/2020, Virtual Conference,
USA.
• Simultaneously optimizing assembly line feeding and assembly line balancing, coauthors:
Montreuil, B., Limere, V., 34th annual conference of the Belgian Operational Research
Society, 01/2020, Lille, France.
• Incorporating assembly line balancing into assembly line feeding decision making, coau-
thors: Montreuil, B., Limere, V., INFORMS Annual Meeting, 10/2019, Seattle, USA.
• Improving the solvability of time and space constrained assembly line balancing problems
type E, coauthor: Limere, V., Canadian Operational Research Society 61st Annual Con-
ference, 05/2019, Saskatoon, Canada.
• Modeling variable space in assembly line feeding, coauthors: Limere, V., Raa, B., 16th
IFAC Symposium on Information Control Problems in Manufacturing, 06/2018, Bergamo,
Italy.

14 Chapter 1
• Optimizing line feeding under consideration of variable space constraints for mixed-model
assembly lines, coauthor: Limere, V., at: 32nd annual conference of the Belgian Operational
Research Society, 02/2017, Liege, Belgium.
• Line feeding with variable space constraints for mixed-model assembly lines, coauthor:
Limere, V., International Conference on optimization and decision sciences, 09/2017, Sor-
rento, Italy.
• The assembly line feeding problem: classification and literature review, coauthor: Limere,
V., 31st annual conference of the Belgian Operational Research Society, 02/2017, Brussels,
Belgium.

Introduction 15
Funding
I acknowledge this doctoral research project’s support by the ‘Bijzonder Onderzoeksfons’ of
Ghent University under grant number BOF.STA.2016.0023.01 and by the ‘Fonds Wetenschap-
pelijk Onderzoek – Vlaanderen’ under grant number FWO18/ASP/198. The National Bank of
Belgium also supported this project.


2A classification of tactical assembly line feeding
problems
“In considering any new subject, there is frequently a tendency, first,
to overrate what we find to be already interesting or remarkable; and,
secondly, by a sort of natural reaction, to undervalue the true state
of the case, when we do discover that our notions have surpassed
those that were really tenable.”
Ada Lovelace

18 Chapter 2
2.1 Introduction
The manufacturing industry is progressively facing more competition, resulting in a wide variety
of highly functional products. Consequently, single manufacturing firms produce many very
complex product models with many functionalities in an enormous number of mass-customized
variants, as discussed above. This product complexity may be underlined by looking at a case
study done at a truck manufacturing company. The company needed to handle the astonishing
amount of 8,000 to 9,000 parts each day to produce just around 15 trucks (Limere et al., 2012).
These numbers even exclude small parts like nuts and bolts, and therefore, clearly illustrate that
assembly lines need to be fed with an enormous amount of parts already and that this number
will likely increase in the future.
Assembly line feeding, describing the provision of parts for assembly, can be performed in different
ways by storing all parts near the assembly line or pre-processing parts and delivering them when
needed (Sali and Sahin, 2016). The assembly line feeding problem (ALFP), formally defined in
this study, studies how parts should be provided for assembly by identifying the optimal provision
method for every part. Obviously, deciding on the way how to provide parts not only has an
impact on the used load carrier or quantities fed, but also on the design of the feeding system
with respect to transportation and preparation processes (Limere et al., 2012). Therefore, the
design of feeding systems is part of the assembly line feeding problem if it is not predetermined.
Hence, the problem under investigation is a complex task affected by many different aspects and
decisions. We will show that some of these aspects are already researched. However, at the
same time, there are still numerous questions unanswered, and literature integrating additional
aspects, such as the selection of vehicles or the number of storage facilities, is relatively scarce.
As we observed within this review, the number of scientific scholarly papers on issues assembly
line feeding problem is increasing. One can assume that this increase is due to both, a rising in-
terest of researchers but also the necessity of decision support systems in practice. This practical
need for decision support systems has specifically been observed by the authors of this article
during company visits. Feeding decisions were either loosely based on rules of thumb, without
evaluation of these rules, or even taken without any logical structure.
As the amount of literature increases, effort for scientists to review literature and delimit their
work also increases. In addition, not understanding focus and scope of previous research well
might result in less distinct and value adding research. Theoretical insights may also be used
less often in practice if industrial problems are not encountered in literature, either because they
are not yet explored or due to unclear or inconsistent notations and low visibility.
Thus, this study aims at providing knowledge on line feeding processes and at categorizing
different assembly line feeding problems, by means of a classification framework. We aim to
promote purposeful research, as well as to help practitioners detecting research fitting their
practical needs.
The rising interest in the field of line feeding has already motivated Kilic and Durmusoglu
(2015) to review the literature. However, their focus is on the characteristics of line feeding
policies depicting their advantages and disadvantages and they do not clearly delimit tactical

Classification of tactical ALFPs 19
and operational issues. The present review, instead, is more process-oriented and includes mostly
tactical decisions such as layout or transportation mode decisions. Moreover, a classification for
existing and future work is provided and a list of research opportunities is given. Another review
is done by Boysen et al. (2015) focusing on multiple operational decisions like routing, loading or
scheduling aspects within the automotive industry and organizes these along the material flow.
However, the present review does not focus on single operational aspects but considers assembly
line feeding as a holistic decision process which, in practice, is followed or supplemented by
operational decision making. Furthermore, in contrast to Boysen et al. (2015), the field of
application is not limited to the automotive industry.
The remainder of this chapter is organized as follows. In the following section, the scope of the
review is defined to underline the importance of the feeding problem and delimit it from general
logistical in-house problems or even inter-organizational logistics. Next, in the third section, the
classification scheme for the problem is proposed and described. Within the subsequent section,
existing literature on the actual ALFP is classified. Section 2.5 points out open research fields
and new research opportunities. In the final section, the chapter is shortly summarized.
2.2 Problem definition and scope
In this section, we formally define the assembly line feeding problem (ALFP). This requires
however, that different line feeding policies are introduced and defined first, as the selection
of those is the defining characteristic of the ALFP. After this, a formal definition of the basic
problem is given in the form of a mathematical programming model. The definition is followed by
a depiction of sub-processes and a delineation from other logistical material handling processes.
Finally, the hierarchical decision level of the ALFP is specified, and interactions as well as
differences with higher and lower decision levels are discussed.
2.2.1 Assembly line feeding policies
Line feeding policies describe how parts are provided to assembly stations. An assembly line
feeding policy thus concerns a sequence of logistical operations that need to be performed on the
shop floor and the presentation at the location of assembly.
By reviewing literature on assembly line feeding, one could assume a quite high number of distinct
line feeding policies. This can partly be explained by the use of different names for the same
feeding policies. To avoid confusion in further research, we now present five different terms for
line feeding policies and show them in Table 2.1 together with nomenclature previous literature.
Moreover, line feeding policies are sometimes mixed up with production control systems like by
Satoglu and Ucan (2015), where Kanban and Polca production control systems are confounded
with parts supply to assembly lines. This might also be due to the fact that boxed-supply is
often described by JIT supply or Kanban-based-feeding (see Table 2.1).
In their literature review, Kilic and Durmusoglu (2015) distinguish four policies: line stocking,
boxed-supply, kitting, and hybrid policies. In their framework, sequencing is not considered as a

20 Chapter 2
line stocking boxed-supply sequencing kitting
lot-wise-presentation;load-unit-presentation(Battini et al., 2015)
Kanban-based feeding(Kilic and Durmu-soglu, 2015)
sequential supply (Jo-hansson and Johans-son, 2006)
stationary:
line side stocking (Kilicand Durmusoglu, 2012)
downsizing (Limere,2011)
trolley to work station(Battini et al., 2009)
bulk feeding (Limere,2011)
continuous supply(Hanson and Brolin,2013)
indirect supply (Ster-natz, 2015)
line storage (Caputoet al., 2015c)
batch supply (Saliet al., 2015)
traveling:
pallet to work station(Battini et al., 2009)
JIT supply (Caputoet al., 2015a)
kit to assembly line(Battini et al., 2009)
direct supply (Ster-natz, 2015)
indirect supply (Bat-tini et al., 2017)
Table 2.1 Line feeding policies in literature
separate policy. On the other hand, a hybrid line feeding policy is described, combining different
policies within one assembly system. Within this review however, we do not consider the hybrid
policy to be a distinct policy, since we assume line feeding policies to be selected at the individual
part level, which usually results in a combination of multiple line feeding policies.
Thus, we define five policies in the context of assembly line feeding, namely line stocking, boxed-
supply, sequencing and kitting, whereas kits can be stationary or traveling. These line feeding
policies cover all described practices, found in literature and practice. In the following subsections
we introduce and explain those line feeding policies. A first overview of the effect of line feeding
policies on the provision of parts at the border of line (BoL), i.e. an area next to assembly
stations which is dedicated to store assembly parts, can be seen in Figure 2.1.
Figure 2.1 shows that parts can be provided in homogeneously filled (line stocking and boxed-
supply) or mixed containers (sequencing and kitting). Furthermore, they can be presented at the
BoL or on the line itself. The latter happens in the case of traveling kits, where every product
(grey boxes) on the assembly line is joined by a kit container (white box). For clarity, in Figure
2.1 only one line feeding policy is applied per station. However, in practice the simultaneous use
of multiple line feeding policies at a single station is assumed to be beneficial (see Sali and Sahin
(2016)).
Line stocking
Line stocking can be considered the simplest form of line feeding where a complete load car-
rier like a pallet or box is directly delivered from storage to the border of line (BoL) (Battini
et al., 2015; Limere et al., 2012; Sternatz, 2015). To consider line feeding as line stocking, no
further preparatory handling effort, except the transport of the load carrier to the line, should
be necessary. The load carrier remains at the BoL until depletion.

Classification of tactical ALFPs 21
Sequencing
Stationary kitting Travelling kitting
Boxed-supplyLine Stocking
Figure 2.1 Line feeding policies
Boxed-supply
In comparison to line stocking, line feeding with a boxed-supply policy requires more logistical
handling effort. The main characteristic of the boxed-supply policy is the reduction of container
sizes. Feeding parts in boxed-supply starts with the retrieval of a pallet or container from
storage, possibly transporting it to a preparation area, and repacking parts from this load carrier
into smaller bins. An important characteristic of boxed-supply is that all bins are still filled
homogeneously after repacking. Next, bins are transported to the BoL and stored there until
depletion. Since in both policies, line stocking and boxed-supply, parts are stored in a larger
quantity in homogeneously filled load carriers at the BoL, some authors do not consider these
policies to be distinct. However, within the framework of the ALFP it is necessary to distinguish
between both as the underlying logistical processes are distinct.
Sequencing
The increasing number of part variants is a big challenge for companies, since it rules out the
possibility of line stocking for all required parts at the BoL, due to space restrictions. This is
aimed to overcome by applying sequencing. Sequencing is initiated by the retrieval of pallets
or boxes containing different variants of parts which are possibly transported to a preparation
area. Next, variants of a part are sorted into a container according to the sequence of demand.
Subsequently, those sequenced parts are transported to the BoL in a container and stored there
until depletion (Sali et al., 2015). In particular, in case of many part variants this policy is
beneficial, as stocking an enormous amount of different part variants at the BoL can be avoided.

22 Chapter 2
The location of the sequencing activity can vary. Especially in the automotive industry suppliers
quite often already manufacture the parts needed by the original equipment manufacturer (OEM)
in the appropriate sequence. According to Swaminathan and Nitsch (2007), the sequencing point
can be located at the supplier, in an intermediate sequencing centre, in a sequencing area within
the assembly plant or at the BoL. Within this framework, the last option is considered as line
stocking. Boysen et al. (2015) also describe the location of a sequencing point at supplier(s),
logistics provider(s) or in-house.
Stationary kitting
Kits are an extension of sequenced containers since not only one part and its variants but a
combination of multiple parts and its respective variants are combined in a kit. A specific
characteristic of kits is the depletion of one kit for one product. A kit container can, however,
contain one (Sternatz (2015)) or multiple kits (cf. Limere et al. (2015, 2012)).
The logistical process starts with retrieval of different parts from storage, if applicable, trans-
porting and storing them in a preparation area, followed by repacking them into a common kit.
Stationary kit containers are afterwards transported to the BoL of a specific station, where all
parts of that kit are used and the kit is depleted (Bozer and McGinnis, 1992). The composition
of kits may vary and a distinction between uniform mix and variable mix kits can be made. In
the latter case, kits are not necessarily always composed in the same way. For instance, some
parts may be optional and therefore, not be used in every kit (Limere et al., 2012). Another
possibility for variable mix kits is that different product models require different kits and the
demand for those is varying often (Bozer and McGinnis, 1992). Both issues may result in a
different demand of kits and the corresponding parts. In contrast, uniform kits always contain
the same amount of parts and they differ only due to different variants of the same part.
Note that, though kitting seems to entail a larger effort for preparation than other line feeding
policies, in some scenarios it reduces effort for assembly workers (Hanson and Medbo, 2012).
Traveling kitting
Traveling kits have a similar characteristic to stationary kits since they also contain different
variants of multiple parts. One important difference is, that traveling kits contain parts that
are used at multiple stations whereas parts of a specific stationary kit are only used at a single
station. The process of preparing traveling kits is the same as preparing stationary kits though
it might cause even more outlay than for stationary kits due to a higher complexity. However,
traveling kits are usually brought to the beginning of an assembly line, and reduce effort for
assembly workers in comparison to stationary kits, since they do not need to walk to pick parts
from the BoL (Bozer and McGinnis, 1992). In fact, a traveling kit can also enter the line at an
arbitrary point but either way, it travels along the line with its dedicated product, until it is
depleted. Once a traveling kit is depleted it might be removed from the line and eventually be
replaced by another one or it simply travels until the end of the line. Thus, traveling kits contain
parts for more than one station.

Classification of tactical ALFPs 23
Sets:
I Set of partsS Set of stationsP Set of line feeding policies
Variables:
χisp =
1, part i is assigned to policy p at station s
0, otherwise
ψsp =
1, policy p is used at station s
0, otherwise
Ωp =
1, policy p is used
0, otherwise
Parameters:
cvisp Costs to feed part i with policy p to station scfsp Costs to use policy p at station scfp Costs to use policy pλis Demand of part i at station s
Table 2.2 Notation for a simple assembly line feeding problem
Similarly to stationary kits, traveling kits may also be distinguished into uniform and variable
kit mix (see previous paragraph).
2.2.2 The assembly line feeding problem
To define the assembly line feeding problem formally, parts and part families need to be defined.
Parts are physical items which are describable by a single part number or stock-keeping-unit
(SKU), and are denoted by the set I, containing all distinct physical parts i used for assembly
which may be used at every station in the set of stations S. Part families on the other hand
describe a set of parts, including different part variants with the same functionality, each iden-
tifiable by a single part number. The set of part families is denoted by F , and a part family
f contains a subset of parts If ⊆ I. All part families f and g are distinct from each other
If ∩ Ig:g 6=f = ∅, and the union of all part families equals I. Every model that is produced on
an assembly line may require parts from various part families, whereas a single part and the
corresponding family may be used for one or multiple models. Demand of parts is denoted by
λis ∈ N0 ∀i ∈ I ∀s ∈ S. This notation is summarized in the Table 2.2.
The assembly line feeding problem describes an unambiguous assignment of every part to a single
line feeding policy. If a part is used at multiple stations it may be assigned to different line feeding
policies (one assignment per station). This decision making process is usually performed once
whenever a new product is planned to be assembled on an assembly line and is done before the

24 Chapter 2
start of production (Sternatz, 2015). As the decisions taken in the ALFP affect the performance
of an assembly line’s feeding system for the entire product life cycle, we define this problem as
tactical (see Section 2.2.4). Furthermore, decision making in line feeding is heavily depending on
an assembly system’s layout and the available resources in a system. These may not be known up-
front as they also depend on the decisions taken in the assembly line feeding problem. Therefore,
other tactical decisions like the layout of storage areas or the amount of workers hired may also
be incorporated in the assembly line feeding problem. For example, it might be infeasible to feed
all parts in boxed-supply due to the insufficient space in the area where those parts needed to
be prepared. In this case the layout is a limiting factor. Contrary, it is also possible to imagine
an assembly system, where no such area has yet been used. Then it might be worthwhile to
investigate where to place such an area and how to dimension it. Both, limiting factors, but also
design decisions may be incorporated in the assembly line feeding problem without altering the
main purpose, namely the assignment of parts to line feeding policies.
In the following, we give a basic model describing the assignment of parts to line feeding policies.
χisp = 1 denotes the assignment of part i at station s to a feeding policy p ∈ P , P being the
set of policies, while χisp = 0 denotes no assignment to that policy. The ALFP is solved when∑p∈P χisp = 1 for all parts and stations where λis > 0. The auxiliary variables ψsp and Ωp
indicate if a policy is used at a station s, or in the overall assembly system, respectively. Using
an integer linearisable programming formulation, the basic problem formulation is the following:
Minimize
C =∑i∈I
∑s∈S
∑p∈P
χisp · cvisp +∑s∈S
∑p∈P
ψsp · cfsp +∑p∈P
Ωp · cfp (2.1)
subject to: ∑p∈P
χisp = min1, λis ∀i ∈ I ∀s ∈ S (2.2)
maxi∈Iχisp ≤ ψsp ∀s ∈ S ∀p ∈ P (2.3)
maxi∈I,s∈S
χisp ≤ Ωp ∀p ∈ P (2.4)
χisp ∈ 0, 1 ∀i ∈ I ∀s ∈ S ∀p ∈ P (2.5)
ψsp ∈ 0, 1 ∀s ∈ S ∀p ∈ P (2.6)
Ωp ∈ 0, 1 ∀p ∈ P (2.7)
In the objective function (Equation (2.1)), the sum of all line feeding costs is minimized. Note,
costs may describe actual costs, but also effort or time. We distinguish variable costs cvisp that
are different for every possible combination of parts, stations and line feeding policies and fixed
costs such as cfsp and cfp . These fixed costs depend on the assignment decisions taken as one can
see in equations (2.3) and (2.4). Obviously, both constraints are non-linear, as the maximal value

Classification of tactical ALFPs 25
over a set has to be chosen. However, this can be linearized easily, either by big-M constraints
or by adding a constraint for every element from the domain of the maximum value function.
The latter may be done as follows:
χisp ≤ ψsp ∀i ∈ I ∀s ∈ S ∀p ∈ P (2.8)
χisp ≤ Ωp ∀i ∈ I ∀s ∈ S ∀p ∈ P (2.9)
An example for such a fixed cost is the consideration of investment costs for hoists if a certain
policy for a certain part is chosen at a station. Similarly, it might be necessary to invest in a
supermarket when any part is assigned to boxed-supply, sequencing or kitting. Another example
are the fixed costs incurred for preparing and transporting a stationary kit which may trigger a
’free-riding-effect’ (parts that are only kitted due to empty space in a kit) as reported by Limere
et al. (2012).
Constraint (2.2) assures that every part is assigned to exactly one line feeding policy at station
s if the demand for that part i at station s is greater than 0. Constraints (2.5)-(2.7) describe the
binary characteristic of the decision variables.
Modeling the ALFP as such only holds true for the very simple case where neither limitations
on available resources are given nor additional tactical decisions are considered. For that reason,
to well represent practical problems, a decision model should be more complex, incorporating
constraints like a space constraint at the BoL, a capacity constraint for vehicles, limitations on
the preparation area, or others. These can, e.g., be included by knapsack constraints of which
two specific examples are given in equations (2.10) and (2.11).∑i∈I
∑p∈P
χisp · aip ≤ As, ∀s ∈ S (2.10)
∑f∈F
maxi∈IfχisKs · vi ≤ VKs, ∀s ∈ S (2.11)
Equation (2.10) reflects a space limitation. Here, aip is the required area for storing a load
carrier containing part i fed with line feeding policy p, whereas As describes the available space
at station s. Equation (2.11) gives an example for constraints regarding the volume of containers
used for stationary kits (p = Ks) where kitting containers have a certain volume VKs which is
not allowed to be exceeded by the sum over the largest part volumes vi within a part family.
In that sum only parts that are decided to be fed in this stationary kit should be considered.
Again, this constraint is non-linear but can easily be linearised.
Although these constraints might seem intuitive, they cannot be found in every research article.
We will explain two possible valid reasons to neglect those constraints. Firstly, neglecting space
constraints is reasonable if the problem at hand is not limited by space constraints (cf. Caputo
and Pelagagge (2011)). This is the case when facilities are planned from scratch and the available
space at assembly stations can still be altered in order to meet space requirements (see above).
In such cases, the implementation of additional costs for space usage might be a useful approach.
Secondly, the type of constraint regarding the volume of containers might not explicitly be

26 Chapter 2
covered, when kit containers are customized for every station after deciding on the line feeding
policy as we observed during company visits. In summary, we decided not to include these
constraints in the basic ALFP since we believe they are not appropriate and necessary in every
situation. That way, we describe the fundamental problem which can be extended by including
additional aspects as those discussed in Section 2.3. Next, we will shortly discuss the complexity
of the ALFP.
Theorem 2.2.1. The ALFP, described by formulas (2.1)-(2.7) is an NP-hard problem.
Proof. To verify this theorem, we will show that the problem can be restricted to the uncapac-
itated facility location problem (UFLP) which is proven to be NP-hard by Cornuejols et al.
(1990). We follow the problem definition given by Korte and Vygen (2012)
UFLP Input: A set of facilities J , a set of clients K, costs cij ∈ R+ for serving client i from
facility j, and a cost cj ∈ R+ for opening facility j.
The task is to find a subset of facilities X to be opened and an assignment σ : K → X of clients
to open facilities minimizing costs∑j∈X cj +
∑i∈K cσ(i)i
Given this, we restrict the ALFP to instances with the set of parts I equal to the set of clients
K, the set of policies P equal to the set of facilities J , cvisp = cij ∀s ∈ S, and cfsp = cj ∀s ∈ S.
Furthermore, we restrict the instances by setting cfp = 0 and only considering a single station
|S| = 1 which allows us to neglect the index s for the sake of clarity. This transformation can be
done in polynomial time and we obtain instances equal to the ones described for the UFLP.
Clearly, any solution for the UFLP directly corresponds with a solution for the restricted ALFP,
and vice versa, since opening a facility in the UFLP is equivalent to activating a policy in the
ALFP. In the UFLP clients can only be served from opened facilities. This is equivalent to the
ALFP where parts can only be assigned to a policy if the policy is activated. In addition, the
cost of a solution for one problem is equivalent to the cost of the transformed solution since the
variable costs for serving a client from a facility are identical to the variable costs for assigning
a policy to a part, and the fixed costs for opening a facility are identical to the fixed cost for
activating a policy.
2.2.3 Line feeding processes
The selection of line feeding policies may not only affect the presentation of parts at the BoL, as
shown in Figure 2.1, but also further processes, i.e. replenishment, preparation, transportation,
and usage as well as the intermediate storing of parts. To delineate the scope of the assembly
line feeding problem, hereafter the individual processes are described. The cost factors in the
objective function can relate to each of these processes, and each of these processes may incur
additional constraints. First, parts are stored in a warehouse or intermediate storing unit after
being received within the inbound process. This is no part of the ALFP though, as it does not
affect the selected line feeding policy. The first actual process, falling into the scope of ALFP, is
retrieval of parts from storage and replenishment of supermarkets. The term supermarket stems
from the Toyota Production System, and describes an area to intermediately store and process
(e.g., sorted) parts. Those are used for parts that are provided by boxed-supply, sequencing or

Classification of tactical ALFPs 27
kitting, and, therefore, have to be handled in some way. Decisions on the number, location,
and design as well as the location of parts within supermarkets may be included. This process
sequence is schematically depicted in Figure 2.2 by means of a Value Stream Map (VSM). This
preparation process consists of handling and repacking parts into load carriers used for the
corresponding line feeding policy. The preparation process might be influenced by decisions,
such as manual vs. automated picking or the efficiency of the operations. After parts have been
prepared, they might be intermediately stored in a buffer zone. These first two processes only
come into play, for parts that are not line stocked. In any case, parts are brought to the BoL
during the transportation process, either starting from the initial warehouse (line stocking) or
from a supermarket (boxed-supply, sequencing, kitting). At the BoL, parts are, e.g., stored in
racks, from which the assembly worker picks parts for final assembly during the usage process.
This usage process involves both, value-adding assembly and non-value-adding activities like
walking, searching and picking. This latter non-value-adding activities are affected by line feeding
decisions and vary with the chosen line feeding policy. Therefore, they have to be included in
the line feeding process, whereas the former can be neglected as they are independent of the
feeding method. After products have been assembled, they can be prepared for shipping in the
outbound process. This last process is not within the scope of the ALFP. As explained before,
replenishment and preparation may be skipped in some cases, which is indicated by the dotted
lines. The dashed lines on the other hand, delineate the scope of the ALFP.
UsageInbound Replenishment Preparation Transportation Usage Outbound
Focal company
Scope of assembly line feeding
Optional processes if parts are preprocessed
Figure 2.2 Value stream map for assembly line feeding 1
2.2.4 Line feeding decision levels
As the actual assembly line feeding problem has been introduced, we will further delimit the
scope by discussing different levels of decision making.
1Standardized VSM symbols are used; as only material flow is taken into account, push arrows are used.

28 Chapter 2
Table 2.3 Line feeding decisions on different decision levels
Strategic Tactical Operational
Placement of feeding preparation Feeding policy assignment Product sequencingFacility sizing Supermarket organization Replenishment scheduling
Outsourcing degree Vehicle selection Transportation schedulingStandardization degree Automation degree Preparation scheduling
In general planning, strategic, tactical and operational levels are distinguished. Bhatnagar
et al. (1993) describe that decisions of different levels affect each other and should be con-
sidered in an integrated way regarding the intra-organizational decision levels as well as the
inter-organizational hierarchy. Although the regular planning process is a top-down, hierarchical
process, it is widely believed that there is an interaction of strategic, tactical and operational
management decisions (Armbruster and Kempf, 2012). Transferred to this framework, it can be
stated that the assignment of parts to line feeding policies, being a tactical decision, is influenced
by decisions made at other planning levels and also affects other planning levels itself.
The tactical decision of assembly line feeding influences the efficiency of the system on an op-
erational level, but an improvement of operational efficiency, e.g., by locating parts in a more
efficient way, could also have an influence on the tactical decision of line feeding. The same holds
true for the relation of tactical and strategic decisions. Hence, tactical decisions can influence
operational or strategic decisions and vice versa, though the actual planning process is often
done in a hierarchical way. Even within one decision level there might be hierarchical decisions.
E.g., the ALFP determines part feeding policies and possibly the layout of a feeding system if
the system has not yet been designed. If the design is determined up front on the other hand, it
affects the ALFP.
In order to state the limits of the ALFP on the tactical level and distinguish it from strategic
and operational levels, the scope of every level is shortly explained in the following and some
examples of decisions on each level are given in Table 2.3.
Strategic line feeding
From a hierarchical point of view, one very long-termed or strategic issue in line feeding is
the cooperation with suppliers or logistics providers. This can be described by the outsourcing
decision, which deals with the determination of the right amount and consequences of outsourcing
logistical handling. It might also include the selection of suitable logistics providers or suppliers.
Another strategic decision is the location of external warehouses, which influences operations
and applicability of line feeding policies. This decision level could also be described as a supply
chain level. Klingenberg and Boksma (2010) provide a framework to investigate outsourcing of
logistics handling activities. They also incorporate the tactical and operational level by applying
strategic frameworks, like transaction cost theory, to outsourcing of line feeding aspects. For that,
mainly two dimensions are distinguished: the location of the outsourced activities and the type
of outsourced activities. Moreover, Mathisson-Ojmertz and Johansson (2000) evaluated five case

Classification of tactical ALFPs 29
studies with a different degree of outsourcing logistical handling. In those cases, material handling
operations were stationed at different locations within the supply chain. It was found that
systems, where a logistical service provider was integrated, required much more logistical handling
overall. On the other hand, no significant difference was found between performing handling at
the supplier and in-house. In Figure 2.3, it is schematically depicted how the flow of material
could look like, assuming different outsourcing options. This type of strategic considerations are
not elaborated in the following, as they are outside of this review’s scope.
Supplier
line
stockingboxed-supply sequencing kitting
Logistics Provider
boxed-supply sequencing kitting
Manufacturer
Inbound Inbound
boxed-supply sequencing kitting
Assembly line
Figure 2.3 Effects of external handling on line feeding policies
Tactical line feeding
The tactical level is subordinate to the strategic or supply chain level, and could also be described
as assembly system planning. The fundamental and constituting aspect of the tactical ALFP
is the assignment of parts to line feeding policies. Additionally, one may include other tactical
decisions that impact or are impacted by the decision making of line feeding policies. Those
decisions, amongst others, could be the number of storages, the kind of preparation areas or the

30 Chapter 2
types of vehicles used for transportation. All these decisions influence a system’s performance in
the medium term and can hence be classified as tactical and incorporated in decision models on
assembly line feeding. Those decisions do not have to be incorporated necessarily though. This
is due to the fact that in preexisting assembly systems those decisions might have been taken in
the past and are not desired to be changed.
The scope of decisions to design tactical aspects in an assembly feeding system is quite large,
and furthermore, impacts the operational as well as the strategic level. The chosen line feeding
policies, e.g., have an influence on the operations that need to be performed and hence on the
costs, which in turn may influence the desired degree of outsourcing.
Operational line feeding
Opposite to strategic and tactical, operational issues are more short-dated and can be changed
easily. On the operational level, decisions on facility design, products and the number and
characteristics of storage are already taken. Typical tasks are e.g. the constellation of load
carriers such as kits, transportation of pallets to stations and replacement of empty ones. All
these tasks depend on the current demand for parts and have to be planned in real-time whenever
the production schedule is altered. The aim of planning within this stage is, consequently, to
increase the efficiency of an assembly system while satisfying demand, which is of very high
importance since waiting for parts results in very expensive idle times of the entire assembly
line. Similar to strategic issues, operational ones are rather out of the scope of this review. They
might be classified by a framework similar to Brucker et al. (1999) or Graham et al. (1979) for
individual sub-processes.
2.3 Problem classification
Within this section, a classification for the actual assembly line feeding problem is proposed.
Issues, considered in the classification, stem from literature on the ALFP as well as related
literature. The aim is to categorize line feeding problems in order to reveal research gaps. The
classification is loosely based on other classifications, like Graham et al. (1979), Brucker et al.
(1999) and Boysen et al. (2007), each using three different fields, α, β, and γ, to describe a
specific problem. Graham et al. (1979) classify machine scheduling problems describing the
machine environment within the α-field, job characteristics in the β-field and optimality criteria
in the γ-field. This first classification has been adapted by Brucker et al. (1999) to classify
project scheduling problems and by Boysen et al. (2007) to classify the generalized assembly
line balancing problem. In project scheduling, the α-field is used for resource environment, the
β-field for activity characteristics and the γ-field for objective functions. Boysen et al. (2007)
exchanged the first two fields, describing job characteristics in the α-field and station and line
characteristics in the β-field, whereas the γ-field stays the same. In the present classification,
we adapt the classification scheme of Boysen et al. (2007), describing line feeding policies and
product characteristics in the α-field, characteristics of the feeding system in the β-field and

Classification of tactical ALFPs 31
objective functions in the γ-field. This is done due to the strong relation of assembly line feeding
and assembly line balancing as already shown by Sternatz (2015) and Battini et al. (2017).
Search terms
Body of Literature
WoS
relevant?
EvaluateEvaluate
Reject paper Final reference listno yes
Add references and’cited by’ papers
WoS/GS
Figure 2.4 Structured approach to find related literature
The selection of literature for this study was conducted in the following manner: First, we used
the Web of Science to search the terms listed in Table 2.4. The search results were filtered for
scholarly peer reviewed journals and recent conference papers. We exclusively considered articles
written in English. All articles found this way (described by body of literature were evaluated
for relevance based on title and abstract. The actual selection was based on the scope of the
paper: papers, dealing with the selection of line feeding policies out of at least two options were
considered as meeting the scope of the ALFP. We also took into account papers that focus on
sub-process(es) of the ALFP but do not explicitly assign parts to line feeding policies. However,
the latter papers were only considered when creating the classification framework. This is done
to enrich the classification by additional aspects which have not been addressed yet in papers
addressing the actual ALFP. Those latter papers were thus not classified in Table 2.5. Articles
we considered to be irrelevant were excluded from further consideration, whereas relevant articles
were added to a final references list. Every article in the final reference list was examined in two
ways: Firstly, we added the articles in the reference lists to the Body of literature. Secondly,
we investigated on Web of Science and Google Scholar, which other papers cited this work and
added those to the Body of literature as well. This step was done repeatedly, until the Body of
literature has been evaluated entirely. This process is depicted in Figure 2.4.
2.3.1 Assembly line and product characteristics
The line feeding policies, as well as the assembly line and product characteristics, are described
within the so-called α-field. It contains decisions on possible line feeding policies and considera-
tions on the usage process (Figure 2.2), being characteristics and demand of products and parts.
Throughout the classification, the symbol denotes an empty field.

32 Chapter 2
Table 2.4 Search terms used in Web of Science and research fields used to exclude not related papers
Search terms Exclusion of fields”assembly line*” AND ”feeding” Optics, plant sciences, chemistry,...”assembly” AND ”material* supply””assembly” AND ”part* supply””assembly line*” AND ”material* provision””assembly” AND ”part* provision””assembly” AND ”kitting””assembly” AND ”line stocking””assembly” AND ”feeding” cell biology, ecology, microbiology,...
Line feeding policies
As shown in Subsection 2.2.1, five policies are distinguished in this framework.
α1 ∈ L,B, S,Ks,Kt.
• α1 = L: Full load carriers are stored at the border of line (line stocking).
• α1 = B: Parts are repacked into smaller load carriers (boxed-supply).
• α1 = S: Sequenced parts are delivered to assembly lines.
• α1 = Ks. Parts are sorted in stationary kits, which are supplied to specific stations
requiring these.
• α1 = Kt. Parts for multiple stations are gathered in a common kit, which is delivered to
an entry point of the assembly line and travels along (part of) the line with the product.
As we experienced in company visits, the production control of feeding material for assembly
can differ for different line feeding policies. E.g., more standardized parts might be triggered by
a pull signal, whereas highly specific kits might be controlled in a push manner. The way of
controlling part replenishment might have an impact on the stock at the BoL and therefore, it
might affect holding costs when considered (see Section 2.5.1).
Remark 1. By defining the ALFP as the assignment of parts to line feeding policies, it is implied
that more than one policy is examined. This can, e.g., be denoted by α1 = LKs to describe
that line stocking and stationary kits are compared.
Assembled products
The products assembled in an assembly system can deviate from each other with respect to the
part variants used, processing times, or precedence graphs.
α2 ∈ ,mλ,Mλ
• α2 = : Only a single type of product is produced on the assembly line. In literature, this
is described by the term single model assembly (Boysen et al., 2007). This notation is also
used when no clear definition of the number and kind of produced models is given in a
paper which raises the assumption that a single model is assembled.

Classification of tactical ALFPs 33
• α2 = mλ: Different products are assembled on a single assembly line without the need for
setups: the sequence of products is arbitrary. This is referred to as mixed model assembly
line (Becker and Scholl, 2006). λ ∈ , is has to be defined.
• α2 = Mλ: Multiple products are assembled batch-wise on a single assembly line. This is
called multi model (Becker and Scholl, 2006). In this case, setup times may exist or it may
be useful to remove parts, which are temporarily not required, from the BoL when the
produced model is changed. λ ∈ , is has to be defined.
– λ = : The precedence graphs are considered to be distinct. Hence, the products differ
by the required part families and/or task precedence relations. This may affect the kit
constellation. When products truly differ with respect to their precedence relations,
one should plan kits for every model individually as (some) parts may be used by one
model only and thus block space for other parts used in a different product.
– λ = is: The precedence graphs of different products are considered to be isomorphic.
Hence, the products differ only by the required part variants of the same part families.
In these cases, one only needs to plan a single kit type.
In real-world applications, assembly systems often consist of more than one assembly line. One
possible consequence of multiple assembly systems is a change in transportation distances and
the organization of transportation. However, usually these problems can be decomposed into
individual problems, optimizing line feeding for every assembly line individually. Therefore, this
trait is not considered further.
Part partitioning
As mentioned earlier, one might make a distinction between parts and part families containing
multiple parts of the same kind.
α3 ∈ , f
• α3 = : All parts are assumed to be distinct and there is no interrelation between parts.
• α3 = f : The set of parts is partitioned in families, each containing up to multiple parts
with similar characteristics and a similar functional purpose.
As stated in Section 2.2.2 usually all different parts which can also be referred to as stock-
keeping-units are distinguished. Additionally, one might take into account that some of these
parts are linked to another (Limere et al., 2015, 2012). This can be described by families which
contain multiple parts but all of these parts may substitute each other. Therefore, for a single
final product, not more than one part out of a family is used. As the parts within a family are
substituting each other, this impacts, e.g., the required volume or weight in a kitting container.
Obviously, demand patterns of individual parts within a family are also not independent but
are linked to each other and the demand of the final products. Even if parts are classified in
families, the assignment to line feeding policies can still be done on a part level. However, if

34 Chapter 2
the assignment should be similar for all parts within a family, additional constraints need to be
included in the mathematical model.
Part demand
Product demand, and subsequently the demand for parts, can either be assumed to be stochastic
or deterministic.
α4 ∈ , λ
• α4 = : Demand for products as well as parts is assumed to be deterministic over time. This
assumption often results from the use of a master production schedule (MPS), indicating
a planned production quantity.
• α4 = λ: Product and part demand are assumed to be stochastic over time.
In operational problems, part demand can be known in advance on a short term basis if tracking
systems are used (Choi and Lee, 2002) or a frozen schedule is applied (Boysen and Emde, 2014).
But even then, demand can change due to machine breakdowns, line stoppages, rescheduling or
defective parts (Alnahhal and Noche, 2015a). However, in tactical problems, part demand is
unknown. This can easily be seen, as the ALFP is often solved before the start of production.
In that case, demand is usually not known. Though, it can be estimated by the use of a MPS or
by analyzing the demand of similar products (Faccio, 2014). Therefore, stochastic assumptions
seem to be more realistic than deterministic on this level. However, the latter are used in the
majority of papers.
2.3.2 Feeding system characteristics
The β-field describes typical assumptions and decisions of all assembly line feeding processes.
The sequence of the next subfields aims to follow the process flow starting after the inbound
and ending with the assembly of parts (see Figure 2.2). Following this logic, the first two
paragraphs are on the preparation of parts, followed by the process of replenishing supermarkets
and transporting parts to the BoL. Next, the usage process and space availability at the BoL
are discussed. Lastly, we included a more general section on ergonomics as this might affect all
previously mentioned processes of the assembly line feeding problem. Considerations affecting the
usage of parts are already incorporated in the α-field, as they are mostly determined by product
and line characteristics. For every process, mostly tactical and a few operational considerations
and assumptions are included. Furthermore, the interactions between tactical and operational
issues are explained as well.
Supermarkets
As parts have to be stored in some way before they are used or pre-processed, various options
for organizing the storage might be taken into account.
β1 ∈ flλ, olλ.

Classification of tactical ALFPs 35
• β1 = flλ: The number and location(s) of all preparation areas (also: supermarkets) are
assumed to be determined when parts are assigned to line feeding policies. Therefore, it is
referred to as a fixed layout. λ ∈ , s has to be defined.
• β1 = olλ: The number and/or location(s) of all storage and preparation areas are de-
termined during the ALFP which is described as an open layout. λ ∈ , s has to be
defined.
– λ = : The actual material flow is determined for every part up front. Therefore, it is
predetermined in which storage parts are stored and in which preparation area they
are pre-processed (Sali and Sahin, 2016; Sali et al., 2015).
– λ = s: The material flows are not determined up front and have to be structured by
making additional decisions on the location of part preparation and storage.
In case of an existing assembly plant (brown field) the number and locations of warehouses and
preparation areas might not be changeable. However, in the case of planning a new assembly
system (green field), finding the optimal number and location(s) for storage and preparation
units is not trivial (Alnahhal and Noche, 2015b). Integrating this decision into the ALFP might
actually affect decision making quite drastically. It could also be decided that all storage areas are
used as preparation areas at the same time (Sali and Sahin, 2016; Sali et al., 2015). However, in
practice mostly supermarkets are used (Hanson and Finnsgard, 2014; Limere et al., 2015). These
contain only a subset of parts that are decided to be preprocessed in some way. Additionally,
some parts might be stored at multiple locations, such as different supermarkets, serving the
entire line, or also in various so-called line-integrated supermarkets, serving only a subset of
stations (Boysen and Emde, 2014). The location of storages and supermarkets can influence the
number of parts that can be pre-processed or the costs that come along with transportation.
Lastly, the number of storage locations and the degree of decentralization might also affect the
amount of parts in the system and, therefore, the holding costs.
Preparation process
Preparation can be organized in multiple ways, e.g., by performing order picking in an automated
or manual manner.
β2 ∈ mλ, aλ, oλ.
• β2 = mλ: Preparation of parts is carried out in a manual manner. This means that opera-
tors walk to the storing position and pick the required amount for every part individually.
This can also be described with the picker-to-part order picking method. Here, the number
of operators might be a limiting factor but could depend on the decisions taken. λ ∈ , lahave to be defined.
• β2 = aλ: Preparation of parts is performed in a (partially) automated manner. This can
also be described by the part-to-picker order picking method, where parts are brought to a
picking table by automated storage and retrieval systems (ASRS). The actual retrieval from

36 Chapter 2
the storage container and repacking into another container can either be done manually
or automated. If preparation is done in an automated manner, there will most likely be
strict limitations on the system’s capacity and capacity can only be increased when high
investment costs are considered. λ ∈ , la have to be defined.
• β2 = oλ: At the time of planning feeding options it is not yet determined, whether an
automated or manual preparation system is to be used. Cost calculations can be used
to decide between different options (Caputo et al., 2018). Another option arises when
assembly parts are produced by additive manufacturing, as they can either be produced in
bulk or in kits (Khajavia et al., 2018). λ ∈ , la have to be defined.
– λ = : Parts have predetermined or randomized storing locations which are not
altered.
– λ = la: The actual storage location for every single part is determined while solving
the ALFP. This can be done in order to reduce operating/picking times (Brynzer
and Johansson, 1994). Moreover, in automated systems dynamic storage location
assignment, like in puzzle based storage systems (Gue and Kim, 2007) or kiva robot
operated systems, may be used.
Transportation and replenishment process
Within line feeding a lot of transportation operations have to be performed from a warehouse
either to preparation areas or to the assembly line. Prepared parts also need to be transported
from the preparation area to the assembly line. Lastly, empty load carriers have to be returned.
β3 ∈ ftλ,ω,θ, otλ,ω,θ.
• β3 = ftλ,ω,θ: For every part and line feeding policy, it is decided a priori on a fixed
transportation vehicle that is used. We refer to this situation as having a fixed mean of
transportation. λ ∈ , r, ω ∈ , s, θ ∈ , l have to be defined.
• β3 = otλ,ω,θ: The mean of transportation is not determined (open) when a decision on the
ALFP is taken. For every line feeding policy, a set of options for transportation vehicles
might be taken into account. λ ∈ , r, ω ∈ , s, θ ∈ , l have to be defined.
– λ = : Transportation vehicles operate on fixed and predetermined routes.
– λ = r: Routes for vehicles are not given and are formed throughout the decision
making process of the ALFP.
– ω = : Transportation is performed whenever demand occurs, not considering fleet or
other capacity restrictions.
– ω = s: Transportation is scheduled in a logical manner considering capacity con-
straints and aims for a steady supply. This decision process is incorporated in the
decision making model for assembly line feeding.

Classification of tactical ALFPs 37
– θ = : Loading of transportation vehicles in terms of capacity restrictions, such as
weight or volume is not taken into account.
– θ = l: Loading of vehicles is part of the decision making model. Capacities of the
respective vehicles are taken into account.
In practice, line stocked parts are often assumed to be fed by forklifts, whereas kits are usually
assumed to be transported by tow trains (Alnahhal and Noche, 2013; Boysen and Bock, 2011).
Similarly, sequenced and boxed-supply parts are mostly transported by tow trains as well. How-
ever, the determination of transportation vehicles for assembly line feeding might not be taken
as granted, but can be altered as proposed by Battini et al. (2015). Battini et al. (2015) present
selection rules for the use of tow trains, conveyors and automated guided vehicles.
Some reviewed literature aims at optimizing the load of vehicles (Beamon and Deshpande, 1998;
da Cunha and de Souza, 2008; de Souza et al., 2008; Emde et al., 2012; Emde and Gendreau, 2017;
Emde and Schneider, 2018; Fathi et al., 2016), sometimes also in combination with optimizing
scheduling or routing. Though loading and scheduling are more operational issues, they might
have an influence on the tactical decisions, as highlighted in Section 2.2.4 since they can affect
the feasibility or efficiency of a certain plan. Therefore, integrating these more operational issues
might be a worthwhile approach. Research on the loading problem shows that not optimally
or fully loaded vehicles are rather the norm than an exception. This, as well as the fact that
vehicles are not permanently moved due to certain schedules, can be tackled by incorporating
average fill rates or utilization rates of vehicles. By doing so, the actual fleet size or number of
transportation-tours can be approximated more realistically.
As mentioned earlier, transportation does not only include the final transportation of parts to the
assembly station but also replenishment of preparation areas as this will also require additional
transportation effort as, e.g., assumed by Caputo et al. (2015b); Limere et al. (2015, 2012).
Replenishment of supermarkets can be examined from a more operational point of view as well
by optimizing loading and scheduling (Emde, 2017) or routing.
Return process
The return process includes the removal of depleted load carriers from the BoL and transportation
to an area, where they are stored or reused (Alizon et al., 2009; Boysen et al., 2015). Most research
assumes return is performed in the course of feeding new load carriers. However, Boysen and
Bock (2011) describe a separate return process of load carriers, where parts are fed by forklifts,
but tow trains perform the return of empty load carriers. In this case, costs or effort for this
process have to be considered.
β4 ∈ , re.
• β4 = : The return process of empty load carriers is included in the feeding process of
parts, or not considered explicitly. Mostly, handling times are adjusted to compensate for
the exchange of empty load carriers.

38 Chapter 2
• β4 = re: Return of empty load carriers is considered separately from the feeding process
by planning additional vehicles or space requirements for storing empty containers.
When returning depleted load carriers is assumed to be included in the feeding process, this
should be considered within the cost and time allotted to the process. After all, the old load
carrier has to be removed, replaced by a new one and then transported to a storage area.
Furthermore, a practical problem could arise: when a new load carrier is fed before the previous
one is depleted, immediate return becomes either impossible, or very strenuous because either
leftover parts need to be repacked to the new load carrier, or the feeding vehicle has to wait until
depletion. This problem can be eliminated by not using load carriers. The concept of minomi
describes an elimination of containers by providing parts for assembly without any load carrier
but only being hooked on hangers or stacked. This separation of parts and containers can either
be done at the station or in a preparation area and has an influence on return and replenishment
operations (Hanson, 2011).
Remark 2. If the return is considered separately and is additionally planned in terms of routing,
loading or scheduling, this should be indicated in the transportation process (β3).
Usage process
The task of an assembly worker consists of multiple single activities. The most important and
long lasting activity is assembly, however, it requires the worker to perform additional tasks
such as walking to and from parts’ locations, searching for correct parts, as well as grasping
and handling parts. These tasks are similar to the ones done by logistical staff and include
walking to a storage location, picking parts and removing them from their location. Besides, it
was shown by Hanson et al. (2015) and Brynzer and Johansson (1995) that there are further
tasks, like reading picking lists or waiting. Here, all tasks performed by an assembly operator
are summarized as operations. The time required for these operations may be assumed to be
constant, i.e. fetching a part provided with a certain line feeding policy takes an average amount
of time, or those times may be assumed to be dynamic, i.e. depending on another location like
placement on along the BoL. Furthermore, one might think of a limit on the available time. In
assembly lines, tasks have to be performed within a cycle time such that the product can be
passed on to the next station when the time is over.
β5 ∈ , cλ, dλ
• β5 = : Operation times are not considered explicitly.
• β5 = cλ: Operation times are considered to be deterministic and constant. This includes
all operations times. λ ∈ , r has to be defined.
• β5 = dλ: Operation times are assumed to be dynamic. This may be reasoned in the chosen
size of a station (Limere et al., 2015) or by the placement of parts along the line. λ ∈ , rhas to be defined.
– λ = : Operation times are considered without giving a restriction on it.

Classification of tactical ALFPs 39
– λ = r: Operation times are restricted by the available time which is defined by
the share of the cycle time that is not needed to perform the actual assembly. This
approach has been described by Sali and Sahin (2016) where restrictions on the prepa-
ration times are given.
The operation times for walking at the BoL may be influenced by the space allocation of parts.
In warehousing-literature this is called the storage location assignment problem (SLAP) (van den
Berg, 1999). If it is included in an ALFP model, operation times may be considered dynamic
as they depend on the decision for a part’s storage location at the BoL. This effect has been
described by Klampfl et al. (2006), Finnsgard et al. (2011) and Finnsgard and Wanstrom (2013).
Thus, including this decision in the assembly line feeding problem also leads to dynamic operation
times.
Restrictions on times available for operations have only been applied by Sali and Sahin (2016) so
far. However, in reality this seems to be an important issue, as in paced assembly lines (assembly
lines with a strict cycle time) only a certain amount of time is available to do assembly operations
before the product is passed on to the next station.
Space at the BoL
The trends in assembly, described in Section 2.1, lead to a rising number of parts for assembly.
Especially in large product assembly, this may result in a crowded border of line, which might
be the reason for managers to start considering various line feeding policies in the first place.
Hence, the available space at the BoL is an important factor for the ALFP.
β6 ∈ , scλ,ω.
• β6 = : No space constraint is considered at the BoL.
• β6 = scλ,ω: The space at the BoL is constrained. With λ ∈ , sh and ω ∈ , eq.
– λ = : The space at all stations is constrained and given, e.g., by splitting up the
available space equally or by determining a certain amount of space for each station
a priori (Bukchin and Meller, 2005).
– λ = sh: Even if space at the border of line is constrained, it might be possible to use
variable space constraints on a stationary basis, with an overall upper bound equal
to the size of the plant (Hua and Johnson, 2010; Schmid et al., 2018). Furthermore,
one might consider that space can be shared by two adjacent stations to store parts
or equipment that is used by both stations (Hua and Johnson, 2010).
– ω = : The available space at all stations is solely used for the storage of products.
– ω = eq: The available space at all stations is not solely used for storage of parts,
but also for assembly or handling equipment, which might also be shared by two or
more stations. This aspect becomes especially important when line balancing and line
feeding are integrated (Sternatz, 2015), or costs for handling equipment, necessary at
the BoL and within the preparation area, are considered.

40 Chapter 2
The limitation of space at the BoL influences decisions on line feeding policies, as shown by
Limere et al. (2012). Though space constraints are often assumed (Fathi et al., 2014), space
at the BoL does not have to be constrained necessarily. It is also possible to think of problem
formulations minimizing the required space, if the assembly system is not yet designed (Caputo
et al., 2015a).
Ergonomic stress
Though there might be a trend towards automating assembly (Gunther et al., 1996; Spath and
Baumeister, 2001) as well as kit preparation (Balakirsky et al., 2013; Sellers and Nof, 1986,
1989), certain preparation and assembly operations are still executed manually. Furthermore,
transportation and exchange of depleted and full load carriers is often performed by a logistical
worker. In all these processes, ergonomic loads occur and they might differ for different line
feeding policies. This can be considered in a twofold manner: firstly, a single operation should not
exceed a certain ergonomic stress level, and secondly, the ergonomic stress during a shift should be
lower than a certain daily limit which could be implemented with constraints ensuring the daily
load to be less than a certain limit (Battini et al., 2016a; Christmansson et al., 2002; Kothiyal
and Kayis, 1995; Medbo, 2003; Neumann and Medbo, 2010). A mathematical mapping in an
optimization model could be done as described by Battini et al. (2016a) by calculating energy
expenditure and rest allowances and implementing them in knapsack constraints. However,
there are multiple ways to measure ergonomic loads (e.g. NIOSH, OCRA and EAWS) as their
implementation in optimization models is not limited.
β7 ∈ , erg
• β7 = : Ergonomics is not considered. This might be due to automation of tasks, but can
also be due to neglect.
• β7 = erg: Ergonomic stress is considered. This includes the ergonomic load of assembly
workers and/or logistical staff by constraining the amount of ergonomic stress for every
(individual) worker.
Another possibility to include ergonomics is the consideration of powered exoskeletons or hoists
for burdensome tasks. In this case, investment costs for stations with high ergonomic loads must
be taken into account in the objective function.
2.3.3 Objectives
Objectives of research papers are summarized within the γ-field. Objectives do not necessarily
have to be incorporated in an objective function, but can also be observed in terms of performance
indicators.
γ ∈ λ, ω, η, θ, χ, ζ, ψ, .
• λ = : Investment costs are not considered.

Classification of tactical ALFPs 41
• λ = i: Investment costs are considered.
• θ = : Shop floor costs/required amount of space are not considered.
• θ = s: Shop floor costs/required amount of space are considered. These may account for
renting space or for depreciation on the building.
• η = : Transportation costs/times are not considered.
• η = t: Transportation costs/times are considered.
• ω = : Logistical handling costs/times are not considered.
• ω = l: Logistical handling costs/times are considered.
• χ = : Holding costs/amount of inventory for material is not considered.
• χ = h: Holding costs/amount of inventory for material are considered.
• ζ = : Costs for logistical handling of the assembly workers are not considered.
• ζ = a: Costs for logistical handling of the assembly workers are considered.
• ψ = : No further cost elements/objective criteria are considered.
• ψ = fu: Further cost elements/objective criteria like stockout or error costs are considered.
• γ = : No explicit optimization criterion is defined.
The authors of this article propose to use cost functions in future research, as all reviewed
optimization criteria such as the number of held parts or number of workers are describable with
cost considerations obtaining at least the same level of detail.
Remark 3. The previous proposed classification can be extended as soon as further considerations
emerge. Whenever the classification is extended, it should be ensured that generic terms are used,
which are not yet included in another (sub-)field of the present classification.
2.4 Literature classification
Within this section we give a classification of reviewed literature, explicitly dealing with the
ALFP, in Table 2.5. The paper’s classifications are split up into two groups: papers that aim
to optimise decision making in the ALFP and papers investigating the selection of line feeding
options by other methodological means. In case a paper comprises multiple options for a single
subfield, e.g., if multiple problems are compared or a more detailed planning step is included
only for some of the processes or line feeding policies, only the most complex notation is denoted.
In the rightmost column, the research methodology is stated according to the table’s legend.

42 Chapter 2
Pu
blica
tion
Cla
ssifi
cati
on
Met
hod
olo
gy
α1
α2
α3
α4
β1
β2
β3
β4
β5
β6
β7
γ
Optim
isation
base
d:
Lim
ere
etal.
(2012)
LKs
mis
ffl
mft
csc
t,l,a
E
Facc
io(2
014)
BKt
mis
λfl
mft
l,h,fu
DM
,SC
ap
uto
etal.
(2015a)
LBKt
fl
mft
csc
i,s,t,l,h,a
EL
imer
eet
al.
(2015)
LKs
mis
ffl
mft
dsc
t,l,a
ES
tern
atz
(2015)∗
LKs
mis
fl
mft
crsc
eq
t,l,a
HS
ali
an
dS
ah
in(2
016)
LSKt
mis
ffl
mft
dr
scs,t,l,a
EB
att
ini
etal.
(2016a,
2017)∗
LKs
mis
fl
mft
crsc
erg
t,l,a
ES
chm
idet
al.
(2018)
LBSKsK
tm
ffl
mft
dsc
sh
t,l,a
E
Oth
erm
eth
odology:
Boze
ran
dM
cGin
nis
(1992)
LKsK
tfl
oft
s,t,l,h
DM
Batt
ini
etal.
(2009)
LKsK
tM
λol
mft
ct,l,a
DM
Wan
stro
man
dM
edb
o(2
009)
LBS
mλ
fl
oft
csc
s,t,l
CS
Batt
ini
etal.
(2010a)
LKsK
tM
λol
mft
ct,h
DM
Hu
aan
dJoh
nso
n(2
010)
LKsK
tm
fλ
ols
oft
scsh,eq
CS
,LR
,SC
ap
uto
an
dP
elagagge
(2011)
LBKt
fl
mft
i,s,t,l,h
DM
Han
son
an
dB
rolin
(2013)
LSKsK
tm
fl
mft
sct,l,h,a
CS
Han
son
an
dF
inn
sgard
(2014)
LBS
fl
mft
scs,l
CS
Sali
etal.
(2015)
LSKt
mis
ffl
mft
ds,t,l,a
DM
Cap
uto
etal.
(2015c)
LB
fl
mft
ci,s,t,l,h,a,fu
DM
Cap
uto
etal.
(2016,
2017b
)LBKt
fl
mft
ci,s,t,l,h,a
DM
Cap
uto
etal.
(2017a)
LBKt
fl
mft
fu
DM
Ust
aet
al.
(2017)
LKs
fl
mft
s,t,l,fu
CF
acc
ioet
al.
(2018)
BKs
mis
ft
mft
csc
l,t,a
DM
,S
DM
:D
escr
ipti
veM
od
el,
CS
:C
ase
Stu
dy,
LR
:L
iter
atu
reR
evie
w,
C:C
lust
erin
g
E:E
xact
solu
tion
was
fou
nd
,H
:H
euri
stic
solu
tion
was
fou
nd
,S
:S
imu
lati
on
∗A
lth
ou
gh
,th
ese
pap
ers
des
crib
ean
inte
gra
tion
of
ass
emb
lylin
ebala
nci
ng
an
dass
emb
lylin
efe
edin
g,
they
are
con
sid
ered
inth
iscl
ass
ifica
tion
by
class
ifyin
gth
easp
ects
on
ass
emb
lyli
ne
feed
ing.
Table
2.5
Cla
ssifi
edlite
ratu
reon
ass
embly
line
feed
ing

Classification of tactical ALFPs 43
Additionally, classified papers are briefly reviewed, sorted by time of publication to emphasize
the evolution of the field.
Bozer and McGinnis (1992) describe differences between line stocking and kitting in a conceptual
way. For this, relevant concepts like kits are formally introduced. Furthermore, a first descriptive
cost model is formulated. This paper can be seen as the seminal paper in line feeding.
Wanstrom and Medbo (2009) research different types of racks and packaging types at the BoL.
From analysing two case studies, it was found that line side presentation has an impact on assem-
bly performance regarding different characteristics like work task efficiency and manufacturing
flexibility.
Battini et al. (2010a) examine (de)centralization of stocks and utilization of different feeding
policies in order to keep assembly systems flexible and efficient. The paper is an integration of
Battini et al. (2009) on feeding policy selection and Battini et al. (2010b) on decentralization
of storages by establishing multiple supermarkets. To combine these approaches, a hierarchical
decision framework is introduced and demonstrated for some industrial examples.
Hua and Johnson (2010) describe a number of issues that may influence the assembly line feeding
problem, focussing on line stocking and kitting, by reviewing the literature and analyzing a case
company. The main influences are expected to be in the fields of product characteristics, storage,
production control and system design.
Caputo and Pelagagge (2011) provide a descriptive cost model for line stocking, boxed-supply
and traveling kits in order to provide production managers with information on improving the
structure of part feeding. For an easy assignment of parts to line feeding policies, an ABC-
methodology is described to group parts. Case data is used to show benefits of the proposed
methodology.
Limere et al. (2012) utilize a mixed integer programming model to optimise the assignment of
parts to kitting and line stocking at mixed model assembly lines, minimizing overall system
costs. Storage, preparation, transport, line side presentation and usage of parts are taken into
account. Computational results are basing on case study data and demonstrate that hybrid
policies perform better than a single policy.
Faccio (2014) quantitatively analyzes boxed-supply and kitting for feeding mixed model assem-
bly lines. This research is generally building on Faccio et al. (2013). But in contrast to the
previous paper, which is focusing on fleet size and inventory level optimization, this paper is
on the assignment of parts to line feeding policies by taking into account stochastic demand.
For evaluation a simulation of a large amount of scenarios is carried out. Rules of thumb are
summarized in a decision map.
Hanson and Brolin (2013) analyze the introduction of kitting instead of boxed-supply and se-
quencing by analyzing two case studies of two production environments. The effects on man-hour
consumption, quality and flexibility are discussed.
Hanson and Finnsgard (2014) examine the effect of different sizes of load carriers on man-hour
consumption by means of a case study. It was found that the size has an influence on differ-
ent tactical decisions, like the materials handling equipment used, and on operational assembly
performance. However, the results show that the overall man-hour consumption does not signif-

44 Chapter 2
icantly decrease with an increase of load carrier size, but activities are locally shifted.
Caputo et al. (2015c) aim at supporting the managerial decision between line stocking and boxed-
supply for single model assembly lines. Costs are analyzed using a descriptive model for both
feeding policies. It is assumed that only one line feeding policy is applied at once. It was found,
that there is no general superiority of one of these line feeding policies. In another study, Caputo
et al. (2015a) propose an optimization model to examine the assignment of single parts to line
feeding policies. Line stocking, boxed-supply and kitting are taken into account to provide a
model, aiming at managerial decision support.
Sternatz (2015) is the first to integrate assembly line feeding and assembly line balancing. A
given layout was assumed and all processes of line stocking and stationary kitting were taken
into account. A given cycle time was assumed, so that single-model line balancing could be
performed. Optimizing the integrated problem, lower costs could be achieved in comparison to
the suboptimal solution obtained by sequentially solving both problems.
Limere et al. (2015) extend previous work by Limere et al. (2012) by incorporating dynamic walk-
ing distances in preparation and usage, leading to dynamic operation times. Other assumptions
remain the same as in the previous study. New data instances, created with a data generator,
are used to conduct computational studies showing the influence of product characteristics on
the ALFP decision.
Sali et al. (2015) formulate a descriptive cost model for line stocking, sequencing and kitting
for a real-world production system. The least costly line feeding policies for that setting are
determined. Later, Sali and Sahin (2016) provide an optimization model for the decision between
line stocking, sequencing and kitting. Computational results show that available space at the
BoL and kitting container capacity have a major influence on this decision.
A descriptive model is used to evaluate the influence of part characteristics on the choice of line
feeding policies by Caputo et al. (2016, 2017b). A map is created to show rules of thumb for line
feeding policy decision.
Battini et al. (2016a, 2017) provide a decision support model, jointly optimizing assembly line
balancing and assembly line feeding by considering ergonomic aspects. For this, a mixed integer
programming model is proposed and solved for a small case study.
In Caputo et al. (2017a) a model for calculating error costs in picking operations for line stocking,
boxed-supply and traveling kits is presented.
A decision making approach by clustering parts into groups is proposed by Usta et al. (2017).
The results obtained for the data of a case study are compared to the current situation.
Faccio et al. (2018) examine the selection of line feeding policies (boxed-supply and stationary
kitting) by proposing a descriptive cost model together with a rule of thumb for decision making.
This model is applied to the feeding systems of five case study companies and results are tested
by simulating varying parameters.
Schmid et al. (2018) propose a model to optimise decision making, considering all possible line
feeding policies simultaneously. Multiple products on a single assembly line are considered and
the effect of shared space is investigated. The effect of these traits of assembly lines have been
compared on multiple artificial, though case study based, datasets.

Classification of tactical ALFPs 45
2.5 Further research
By reviewing and classifying literature on the ALFP, we discovered large research gaps. Hereafter,
we give an overview of the, to our perception, most substantial open research areas. Firstly,
we describe research opportunities within the framework of the proposed ALFP classification,
in Subsection 2.5.1. Secondly, we propose related research streams or possible integrations in
Subsection 2.5.2.
2.5.1 Extending the ALFP
Line feeding policies
In practice, the implementation of each line feeding policy is possible for every assembly system.
Thus, it is extremely important to evaluate the benefits and drawbacks of all line feeding policies
by comparing them with each other.
In most cases, except from Schmid et al. (2018), only two or three line feeding policies are
taken into account as can be seen in Table 2.5. This holds true for qualitative and quantitative
comparisons. Distinguishing stationary and traveling kits, future research should compare five
line feeding policies (α1) in order to make them easily comparable and creating managerial
insights. For creating managerial insights, it might be interesting to investigate the effect of all
possible different costs on decision making. Doing this, it can be found which costs are actually
relevant and should be incorporated in future decision making. Costs with high differences for
different line feeding policies are especially promising to have strong effects on decision making.
Quality costs, e.g., could differ largely for different line feeding policies and might therefore
influence decision making.
Product model characteristics
As mentioned in the introduction of this chapter, trends like mass customization can be observed
in product assembly, leading to an increased use of mixed and multi model assembly lines. This
can also be seen in the case studies reviewed for the classification. Though these trends are
prevalent in industry, only one research paper was found providing a mathematical model explic-
itly dealing with the feeding problem for multi model assembly lines or mixed model assembly
lines with models having distinct precedence graphs (α2) (Schmid et al., 2018). However, dis-
tinct precedence graphs will lead to a higher number of kits, since there will be different kits
established for different models. Additionally, in multi model assembly lines some particularities,
like feeding of assembly lines in intervals can be considered. These intervals can, e.g., depend on
the size of production lots. Battini et al. (2010a) mention a few rules of thumb on feeding multi
model lines. However, no mathematical model for distinct mixed and multi model assembly lines,
neither optimization, nor description, has been formulated. Therefore, it still is an open field for
research.

46 Chapter 2
Stochastic demand
In reality, product and part demand (α4) are deterministic only in a short perspective. But as
the ALFP is a more long-termed, tactical decision demand cannot be known exactly. Several
further possible reasons are demand volatility, part quality, rescheduling, and product change.
Variability of demand may lead to manifold difficulties in a feeding system, such as an unbalanced
usage of transportation or storage capacities. Furthermore, variability also has an impact on the
amount of stock that is needed in an assembly system. At this point, only Faccio (2014) and
Bukchin and Meller (2005) analyzed the influence of variable demand by showing the impact on
line feeding policy selection and space allocation, respectively. To summarize, the influence of
variable demand on the ALFP under varying circumstances is still not fully explored and should
be enriched by further research.
Configuration versus reorganization
As described in Section 2.2.4, decisions are usually taken in a hierarchical order. This applies to
decisions from different hierarchical levels but also to decisions from within a single hierarchical
decision levels. Arrangement of storage (β1) and planning of transportation and used equipment
(β3) as well as design of the preparation areas (β2) are vivid examples of decisions at the same
level as the ALFP. In most papers (see Table 2.5), these decisions are assumed to be taken before
the assignment of line feeding policies. Within this approach, existing systems are typically
reorganized and improved, than designed. As described by Sternatz (2015), decisions on line
feeding should be taken in advance of the start of production. Therefore, further research should
aim towards a simultaneous optimization of feeding and other design decisions. A first step
towards this is done by Battini et al. (2010a) integrating the determination of the number of
supermarkets and assignment of line feeding policies. However, this approach is still stepwise
and more logic based rather than optimised.
Return process
A promising research field is the exploration of the return process (β4) in the context of assembly
line feeding. As aforementioned in Section 2.3.2, most authors simply assume that returning
depleted load carriers is integrated in the feeding process. Determining situations, in which
it is useful to separate feeding and return, is a challenge for future research. Additionally,
configuration and control of such separated return processes need to be explored.
Ergonomics
As musculo-skeletal disorders are an increasing societal problem in many countries, companies
aim to reduce or redistribute the ergonomic load on their workers. As assembly line feeding
traditionally includes a lot of manual activities, it is worthwhile to investigate ergonomics further.
Especially the combination of ergonomics and multiple line feeding policies seems relevant, as the
way of providing material to the assembly worker heavily impacts the ergonomic load (Hanson

Classification of tactical ALFPs 47
and Medbo, 2016a). However, integrating ergonomics into assembly line feeding should not be
limited only to the assembly worker but also be extended to logistical workers.
Operation times
The investigation of operation times for the assembly worker (β5) is another auspicious field.
Limere et al. (2015), e.g., utilize dynamic walking distances for operators in the system at
the BoL as well as in the preparation area. A similar approach can be seen at Schmid et al.
(2018). As reported by Sali and Sahin (2016) and Schmid et al. (2018) it is hard to give good
approximations for operation times, and especially walking as the level of detail is not sufficient.
Therefore, assigning parts to specific locations might resolve this issue.
Another relevant issue is the investigation of cycle time restrictions as proposed by Sali and
Sahin (2016). As reasoned by Sternatz (2015), an integration of assembly line balancing and
line feeding is relevant, as in practice the decisions for line feeding are only taken when assembly
lines are balanced. Thus, optimization models, that do not integrate both aspects should take
into account that the available time for assembly operations is limited, which should be tackled
by a constraint ensuring feasibility.
Stocks in the feeding system
Mostly, objective functions aim at reducing costs. These costs can be a sum of various cost
elements as described in the γ-field of the classification. Limere et al. (2012), e.g., claim that
holding costs of parts at the BoL should not be considered, because it can be assumed that
the overall inventory of parts in an assembly system is constant, irrespective of the line feeding
policy. Therefore, only the location of storage will differ with respect to the line feeding policy.
Sali et al. (2015) on the other hand, assume that holding costs for parts at the BoL should be
considered in the form of opportunity costs, whereas holding costs for parts in storage areas are
neglected. These different assumptions call for an exploration of realistic assumptions on parts’
inventory and the respective holding costs within an assembly system. Utilizing multi echelon
concepts, stocks seem to differ according to the number of storage areas, which in turn depend
on the line feeding policy. Moreover, Hanson and Finnsgard (2014) describe a case company,
storing an additional pallet close to the BoL in order to compensate demand variability, if line
stocking is applied. Stock amounts in a system might also depend on production control and the
respective parameterization. E.g., if some line feeding policies are controlled by a pull production
control system using Kanban cards the number of cards and the size of containers might have
an influence on stocks in a systems. In summary, the effect of line feeding design on stocks in
the system is unclear and demands for investigation.

48 Chapter 2
2.5.2 Integrating additional aspects with the ALFP
Assembly line feeding scheduling
Operationally scheduling the feeding problem of assembly lines is closely related to the assignment
of line feeding policies. As raised in this review, the literature on scheduling part transportation
is broad. Yet it is just one out of three processes of the ALFP that may be scheduled in
an integrated manner. In fact, assembly line feeding scheduling includes the whole process of
replenishment of preparation areas (Emde, 2017), preparation itself and transportation of parts.
A possible objective function is, e.g., meeting due dates for part replenishment to avoid stockouts
at the assembly line. Those processes could be scheduled in a reverse manner, starting from
the demand date and scheduling the preceding processes in a similar way to the line traveling
repairman problem (TRP), which is described by Bock (2015). The TRP describes scheduling
repair operations with request deadlines and general processing times. This resembles the demand
due date of assembly line feeding that should not be missed under consideration of varying
processing times for operations like preparation, transportation loading and unloading.
The actual operations might be affected by new technologies, such as fluid logistics, robotic vision
used for automated picking or drones used for urgent deliveries. The control of these systems
could be taken into account when line feeding for real-time demand is scheduled.
Decision levels
As already mentioned above, decisions of different levels are taken in a hierarchical manner.
Examining the strategic outsourcing decision simultaneously with the tactical ALFP seems to
be a promising new research area, by which the outsourcing decision can be supported in a
quantitative manner.
In addition, more operational aspects like scheduling can also be combined with assembly line
feeding by solving the line feeding problem and the line feeding scheduling simultaneously. Andres
et al. (2008), e.g., connected the balancing and sequencing of assembly lines. This approach
can be transferred to assembly line feeding and feeding scheduling as partly mentioned in the
classification for the scheduling of preparation and/or transportation processes.
Line Balancing
In an assembly system, the assembly line balancing problem (ALBP) and assembly line feeding
problem are the most influential problems, affecting the system’s performance. Usually, an as-
sembly line is configured by solving the ALBP first, as described by Boysen et al. (2007), and
afterwards the assembly line feeding problem is solved (Sternatz, 2015). Both problems com-
prise the configuration of the assembly system and hence, belong to the same decision level. As
already proposed by Sternatz (2015) and Battini et al. (2016a), the integration of the highly
interdependent problems of line balancing and feeding should be tackled. In the former pa-
per, balancing and feeding are considered for a mixed model assembly system with isomorphic
precedence graphs, whereas in the latter paper, line balancing, line feeding and ergonomics are

Classification of tactical ALFPs 49
modelled for a single product assembly system.
Balancing and feeding both also have operational aspects, described within this paper as assembly
line scheduling and line feeding scheduling. In the field of assembly line scheduling, there is
already a broad literature (Boysen et al., 2009), whereas no literature on line feeding scheduling
could be found. It is easy to see that the interaction of ALBP and ALFP, as already shown
by Sternatz (2015), also has an impact on the operational scheduling level, since the tactical
decisions affect their respective operational problems and vice versa. Therefore, operational
decisions of scheduling problems may be treated in an integrated ALBP and ALFP formulation.
General manufacturing feeding
The main focus of this study is feeding material to assembly lines. Assembly lines are charac-
terized by the way how workpieces are transported through the manufacturing area and by the
tasks performed which can usually be described by joining operations like welding or screwing
(e.g. DIN 8580). However, generally speaking, products can be manufactured in multiple ways,
including molding, forming or machining. These manufacturing processes are usually organized
differently, in job shops or work cells. Aside from a different process, there might be a differ-
ence in the kinds of goods used in other manufacturing systems like, e.g., liquids or bulk goods.
Provision of material in these manufacturing types might also be an issue to address in future
research. Therefore, firstly the differences of these systems should be investigated and, secondly,
approaches for assembly lines have to be adapted to those other manufacturing types.
2.6 Conclusion
Throughout this study, we defined the assembly line feeding problem as the assignment of parts
to line feeding policies, viz., line stocking, boxed-supply, sequencing as well as stationary and
traveling kitting. Furthermore, we showed that even the basic problem is an NP-hard prob-
lem. To characterize all the complexities the ALFP involves, the scope of the problem is further
outlined by means of two dimensions. Firstly, different sub-processes under study are clearly
defined as storage, preparation, transportation, line side presentation and usage. Secondly, the
decision level of the ALFP is described by distinguishing different strategic, tactical and opera-
tional decisions. With the aid of this structure, we hope to make the problem more intelligible
and simplify future research.
Based on the provided problem definition, we introduced a classification scheme, including the
most important decisions and assumptions in research. This classification scheme serves to
classify the existing literature and reveals the most important research fields and streams for
future research.
In conclusion, the readers are warmly invited to use the proposed classification and enhance it
by new, generic, and relevant fields when needed. We hope that it will hereby become a standard
in the field of assembly line feeding, assisting in bundling efforts for thoroughly understanding
the field.


3Mixed-model assembly line feeding with discrete
location assignments and variable station space
“I skate to where the puck is going to be, not where it has been.”
Wayne Gretzy

52 Chapter 3
3.1 Introduction
As discussed in this thesis’s introduction, the complexity increase of assembly systems requires
more flexible and agile solution approaches (see also Battaıa et al. (2018)). As the number of
parts required for product assembly rises rapidly, congestion at the assembly stations is becoming
the norm. As mentioned earlier, one can avoid this by selecting adequate line feeding policies
more flexibly by choosing them individually for each part (Limere et al., 2012). One significant
trade-off in selecting the optimal policy balances space requirements and the associated costs
of all parts needed at any station. Policies that require less space are usually more expensive
because of additional efforts for reducing the size by, e.g., splitting up pallets and presorting parts
into boxes. In some cases, some stations may need more parts than others due to the outcome
of balancing decisions (Chica et al., 2016). E.g., at station A, only very few parts are assembled,
and at the adjacent station B, many parts are assembled. In such cases, station B may borrow
some space from station A to store parts required for assembly. Space borrowing lowers overall
costs as it facilitates space-consuming but cheaper line feeding policies.
With this study, we aim to extend previously developed optimization models in the area of
assembly line feeding. The extension is done in manifold ways: (i) Five line feeding policies
are incorporated, whereas, in the literature, a maximum of three could be found (e.g., Caputo
et al. (2015a); Sali and Sahin (2016)). This is intended to give a more general model and
support decision-making in practice as all line feeding policies can easily be implemented. (ii)
Furthermore, we incorporate decision making for discrete locations, i.e., every single part is
assigned to a discrete location at the BoL. The BoL describes the area next to a station designated
to store parts for assembly. An example for those dedicated positions can be seen in Figure 3.1.
Here, the BoL at every station of the assembly line (AL) consists of multiple locations that
are available for storing parts. By incorporating discrete locations, walking durations can be
estimated more realistically. Furthermore, it will also provide additional information on the
design of the border of the line. In previous works, no information on the exact usage of the BoL
was given. Only Klampfl et al. (2006) evaluated the effect of different designs through simulation.
(iii) The proposed model does not only assign parts to discrete locations but also allows to assign
these discrete locations to stations. By allowing this space borrowing, the available space per
station becomes more flexible and allows for cheaper line feeding policies. This is also depicted
in Figure 3.1 with station 2 borrowing location 8 from station 1. (iv) Lastly, the model describes
mixed-model assembly lines, meaning that various types of product models are produced on a
single assembly line in an arbitrary order. An example of these models would be the BMW 5
Series and 7 Series, which we consider distinct models. Therefore, every model allows for the use
of different kits. To summarize, it may be stated that in comparison to the existing literature,
we include more decisions in the model to make assembly line feeding optimization models more
applicable for complex, real-world assembly systems. In addition to these extensions, oriented
towards applicability, we also propose a more efficient procedure for solving the problem. More
elaborate solving procedures are necessary to include discrete locations, multiple line feeding
policies, different product models, and space borrowing, making this model harder to solve than

Mixed-model assembly line feeding 53
models previously described in the literature.
Sl =
l
BoL
1
1
1
2
1
3
1
4
1
5
1, 2
6
1, 2
7
1, 2
8
AL
1, 2
9
1, 2
10
1, 2
11
2
12
2
13
2
14
2
15
2
16
y x
Station 1 Station 2
AL: Assembly line BoL: Border of line
Sl: Stations that may use l l: Number of location
Locations used by station 1 Locations used by station 2
Figure 3.1 Example of space borrowing
The remainder of this chapter is organized as follows: In the next section, literature related
to decision making in assembly line feeding is reviewed. This is followed by a more formal
problem definition and an explanation of the setting in which the proposed optimization model
is applied. Afterwards, in Section 3.4, a newly developed mathematical optimization model is
proposed, describing a general ALFP with space constraints at the BoL, taking into account all
five line feeding policies. In Section 3.5, we firstly prove that the proposed model is NP-hard.
Secondly, we propose improvements to the solving procedure of the model by preprocessing,
Valid Inequalitys (VIs), and applying cuts. The latter are added in a Branch & Cut manner and
in the form of VIs (also referred to as Cut & Branch). Next, in Section 3.6, data generation and
experimental design are described and results are analyzed. Implications and limitations of this
research are discussed in Section 3.7. Finally, the chapter is concluded by summarizing results
and indicating ideas for future research.
3.2 Literature study
The basic idea for the assembly line feeding problem has been introduced in the 1990s by Bozer
and McGinnis (1992) by means of a descriptive cost model. However, only line stocking and
kitting are considered and the choice made was applied to all parts. Nowadays, however, we
consider the ALFP as an optimization problem choosing a line feeding policy for every part
individually. Making an optimization-based decision for every part individually is firstly done
by Limere et al. (2012). This work has been extended to incorporate variable walking distances
depending on the usage of space at the assembly station (Limere et al., 2015). As additional
line feeding options emerged in practice, other authors introduced boxed-supply and sequencing

54 Chapter 3
into line feeding. Caputo et al. (2015a), e.g., compared line stocking, boxed-supply and traveling
kitting for a single model assembly line. Sali et al. (2015) implemented sequencing in the context
of assembly line feeding in a cost model which was extended later towards an optimization based
model (Sali and Sahin, 2016). A first attempt towards analyzing the effect of demand variability
on feeding decision has been made by Faccio (2014). Recent works aim towards an integration of
assembly line feeding and balancing (the assignment of tasks to stations) (Sternatz, 2015). Battini
et al. (2017) even integrated ergonomic considerations in addition to line feeding and balancing
with the objective of reducing overall costs. However, it is very unlikely to find optimal solutions
for large assembly lines when integrating all these aspects. In the approaches combining line
feeding and balancing, both problems are solved simultaneously. However, only line stocking
and stationary kitting are considered as feeding policies. Recently, we proposed a preliminary
line feeding model of the one used in this work (Schmid et al., 2018). However, this preliminary
work does not investigate the effect of discrete locations. This extension was put forward for
multiple reasons: (i) Deciding on exact locations helps decision makers better than just providing
the policy that should be used, as the decision on the exact location is not always trivial. (ii)
If the exact locations are not taken into account, costs cannot be calculated accurately which
leads to differing policy decisions in some cases as we will show in our results. (iii) The impact
of walking costs along the line is not negligible as those operators might also be paid better
than other workers. (iv) This discrete location model easily allows for an extension to integrate
assembly line balancing considerations. Furthermore, in this study, an NP-completeness proof
is provided and a new solution methodology is proposed whereas the preliminary version was
exclusively relying on black box solvers. Lastly, we give more insight into decision making by
conducting more elaborate analyses.
Besides those works, which are clearly in the scope of the described assembly line feeding problem,
there are also more qualitative and otherwise linked approaches on assembly line feeding of
which we will only give a few examples as these are outside of this work’s scope. Bukchin and
Meller (2005) examine the allocation of space to components along the assembly line in order to
reduce the probability of line stoppages caused by the absence of required material. There is no
consideration of the actual line feeding policies used. Battini et al. (2009) evaluate the decision
problem between central and decentralized warehousing for in-house part feeding to assembly
lines. The main trade-off is described as inventory in decentralized and long lead times in central
storage systems. The aim is to provide a decision supporting framework for (de)centralization
of warehouses and the selection of line feeding policies considering line stocking, traveling, and
stationary kits. By the use of a case study company and reviewing literature, Hua and Johnson
(2010) defined some issues that could be tackled in future research on assembly line feeding.
One of these aspects is the availability and distribution of space along the BoL which is one
of the key aspects of this study. A last example for a more case study oriented approach is
Hanson and Finnsgard (2014). They examine the effect of different sizes of load carriers on
man-hour consumption by means of a case study. It was found that the size has an influence
on different tactical decisions, like the materials handling equipment used, and on operational
assembly performance. However, the results show that the overall man-hour consumption does

Mixed-model assembly line feeding 55
not significantly decrease with an increase of load carrier size, but activities are locally shifted.
3.3 Problem definition and planning environment
3.3.1 Characteristics of the assembly line feeding problem
As described in the preceding chapter, the ALFP describes an optimization problem which assigns
each part i from the set of parts I to one and only one line feeding policy p from the set P while
minimizing costs. Building upon the preceding chapter, we distinguish five line feeding policies.
The line feeding policies and the corresponding indices are: Line stocking (p = L), boxed-
supply (p = B), sequencing (p = S), stationary (p = K), and traveling kitting (p = T ). The
underlying processes and the key characteristics of the different line feeding policies have already
been discussed in Section 2.2. In addition, we will discuss some advantages and disadvantages,
presented in Table 3.1, of the individual line feeding policies in the following.
Table 3.1 Comparison of different line feeding policies (Adjusted and extended from (Limere, 2011))
Process Usage Transport Preparation Replenishment
Line stocking (–) large space req. (+) direct route (+) unnecessary (+) unnecessary(–) search for part (–) no steady flow(–) bad ergonomics (+) high density(+) safety stock
Boxed-supply (–) medium space req. (+) combinability (+) batchable (–) necessary(+) safety stock (–) lower density (–) double handling (–) no steady flow(–) search for part (–) long tours
Sequencing (+) small space req. (–) long tours (–) double handling (–) necessary(+) no searching (–) lower density (–) hardly batchable (–) no steady flow(–) no safety stock (–) no steady flow
St. kitting (+) small space req. (–) long tours (+) batchable (–) necessary(–) no safety stock (–) lower density (–) double handling (–) no steady flow(+) better ergonomics (+) steady flow(+) no searching
Tr. kitting (+) No space req. (+) batchable (–) necessary(+) No inventory (–) lower density (–) double handling (–) no steady flow(–) no safety stock (+) steady flow(+) better ergonomics(+) no searching
Clearly, line stocking has the single advantage over all feeding policies, that it does not require
any replenishment or preparation. Furthermore, parts can be transported on the most direct,
and therefore, shortest route. The packing on pallets is typically rather high as packing can be
optimized easily for a single type of parts. Both line stocking and boxed-supply also have the
advantage that some safety stock is available at the assembly station. This is especially useful if
a part is defect as the operator can just take another part. This is typically impossible for the
other line feeding policies. On the other hand, line stocked parts require a lot of space at the
line and it might be ergonomically difficult to retrieve all parts Hanson et al. (2016). If the part
family consists of multiple parts, the operator also needs to search for the right part.

56 Chapter 3
As mentioned above, all other feeding policies require replenishment and preparation. This
preparation leads inevitable to double handling as parts are handled for presorting into a different
load carrier by the supermarket operators before they are again handled by the assembly operator.
However, boxed-supplied and kitted parts can typically be batched, meaning that multiple load
carriers can be filled while doing only a single round-trip in the supermarket. This is more
difficult for sequenced containers but may depend on the actual part characteristics. As the
amount of stock is decreasing, the amount of space requirement goes down as well. However,
this clearly comes at the cost of an increased transportation demand for kitted parts. This
transportation may combine all feeding policies except line stocking. Therefore, the frequency
of transporting boxed-, sequenced, or kitted parts is rather high, leading to a rather steady flow
and vehicle utilization. At the same time the transportation vehicles need to do longer tours as
the demand for parts is spread over different stations.
Lastly, it may be mentioned that sequenced and kitted parts do not require a lot of searching
efforts from the assembly operator, while box-supplied and line stocked parts do require more
searching. Typically, parts in such load carriers can also be arranged more ergonomically such
that the ergonomic difference between picking any two parts is lower.
3.3.2 Cost calculation
The ALFP should consider all costs resulting from the depicted processes replenishing the prepa-
ration area, preparing parts for boxed-supply/sequencing/kitting, transporting parts to the BoL,
and lastly, using parts for the actual assembly. As the costs incurred by these processes depend
on the configuration of the assembly system, which can also be described as the planning envi-
ronment, we want to show in the following how these costs are calculated based on the assumed
planning environment.
Before explaining the cost elements, a quick overview of the decisions taken in the model is
given: every part i needs to be assigned to a policy p ∈ Pi and a location l ∈ Li. For this only
a subset of locations Li and a subset of policies Pi, suited for part i, may be used. The set Picontains only policies using load carriers that can hold part i w.r.t. weight and volume of that
part. The locations Li available for part i are defined by the station of that part and the amount
of space borrowing that is allowed. In case of traveling kits, no location needs to be selected.
We consider four different cost elements: cilp for parts delivered in line stocking, boxed-supply,
sequencing, or stationary kitting; ci for parts delivered in a traveling kit; cmK as a fixed cost for
using a stationary kit for model m; cmT as a fixed cost for using a traveling kit for model m.
The costs consist of the sum over all partial process costs which are indicated by the superscripts
R(eplenishing), P(reparation), T(ransportation), U(sage) (see Equations (3.1)-(3.3)).
cilp = cRilp + cPilp + cTilp + cUilp ∀i ∈ I ∀l ∈ Li ∀p ∈ P ′i (3.1)
ci = cRi + cPi ∀i ∈ IT (3.2)
cmp = cTmp ∀m ∈M ∀p ∈ K,T (3.3)

Mixed-model assembly line feeding 57
In the following paragraphs, the calculation of these cost elements will be explained along the
flow of parts within a typical assembly system which constitutes our planning environment. An
additional explanation of the notation used can be found in Table 3.2.
Table 3.2 Parameter notation and values
Parameter Meaning Value
ALp Length of an aisle in the preparation area(s) of
line feeding policy p
n.a., 50, 50, n.a.;n.a.
AL′p Incremental length of an aisle if one more part
is fed with line feeding policy p (storing parts
in a double sided aisle)
n.a.;n.a.;n.a.; 0.4; 0.4
bsp Batch sizes used in preparation n.a., 6, 1, 3, 2CA Wage of assembly operators 30¤
h
CL Wage of logistical operators 30¤h
cl Central point of location l along the BoL 0.8l − 0.4 [m]
de Distance between assembly line and BoL 1.5m
dil Distance from warehouse to location l 200.4 + 0.8l [m]
dpi Demand point of part i Moving line: (si − 1)L
|S|+ sni/max
i∈Issni[m]
Non-moving line: (si − 1)L
|S|+
L
2|S|[m]
ds Distance between warehouse and preparation
area
115m
htip Required time to handle part i when line feed-
ing policy p is applied
[1.6− 2.7][s]
L Length of the assembly line and facings along
the BoL
[200-320][m]
mrp Length of a milk-run tour in transportation n.a.; 400 + L; 400 + L; 400 + L; 400[m]
nip Number of units of part i that fit in one load
carrier used for feeding policy p
[1− 96, 800]; VBvi
;minniL, 20; VKvi
; VTvi[pcs]
ncp Number of boxes or containers that can be
transported by one tow train
n.a., 30, 5, 5, 5
o Percentage of families that are used for multi-
ple models (Overlap)
0, 40, 80[%]
OV Walking velocity of an operator 1m/s
r Number of boxes that fit in a rack used for
boxed-supply
4
|S| Number of stations in datasets 50
snf Number of family f in the sequence of used
families at a station
[1; maxs∈S|Fs|]
sni Number of part i in the sequence of used parts [1; maxs∈S|Is|]
stPp Time to search for the correct part during
preparation
n.a.;1.08
niB; 1.08; 1.08; 1.08[s]
stUp Time to search for the correct part at the as-
sembly line
1.08; 1.08;n.a.;n.a.;n.a.[s]
Vp Volume of a container used for line feeding pol-
icy p
n.a., 0.1, n.a., 0.2, 0.3[m3]
V Vp Velocity of a vehicle used for line feeding policy
p
3.5, 2, 2, 2, 2[ms
]

58 Chapter 3
vi Volume of part i [0.0001− 1.6][m3]
vf Volume of family f maxi∈If
vi[m3]
wi Weight of part i [0.005− 50][kg]
wf Weight of family f maxi∈If
wi[kg]
Wp Weight limitation of a container used for line
feeding policy p
n.a., n.a., n.a., 50, 75[kg]
wfp Walking distance in preparation area between
different variants of a family for policy p
n.a., n.a., 5, n.a., n.a.[m]
εp Utilization rate of vehicles used for line feeding
policies p
0.23, 0.335, 0.335, 0.335, 0.335
λi Demand for part i [1− 3500]
λm Demand for products of model type m3500
|M|
Replenishment costs
After receiving parts from a supplier or a preceding production stage and ensuring quality re-
quirements, parts are stored in a central storage area. In our cost calculations it is assumed
that this central storage area is solely used for storage and retrieval of full pallets. Retrievals
can be done in order to feed the line in a line stocking manner or to replenish the preparation
area. In case parts are not fed in a line stocking manner, and therefore have to be prepared,
replenishment costs need to be taken into account. This constitutes a first trade-off, i.e., the
decision for a cheaper line feeding policy, namely line stocking, which takes up a lot of space at
the BoL versus the decision for more space efficient policies entailing replenishment costs.
cRilp = CLλiniL
2ds
εLV VL∀p ∈ B,S,K ∀i ∈ Ip l ∈ Li (3.4)
cRi = CLλiniL
2ds
εLV VL∀i ∈ IT (3.5)
Equation (3.4) and (3.5) define costs for replenishing preparation areas, by dividing a part’s de-
mand λi by the number of parts on a pallet niL, to obtain the number of necessary replenishment
transports. Next, the time to conduct one transport is determined by dividing the distance 2ds
from the central storage to the preparation area and back by the velocity V VL and utilization
rate εL of forklifts (see below for further explanation on utilization rates). Both elements are
multiplied with each other and the wage of logistical workers CL. Costs for replenishment in
case of boxed-supply, sequencing and stationary kitting (Equation (3.4)) are calculated equally
to the costs for replenishment in traveling kitting (Equation (3.5)).
Preparation costs
Preparation describes the process of changing the constellation of load carriers, used to provide
parts to assembly workers, and occurs for all line feeding policies except line stocking. Operations

Mixed-model assembly line feeding 59
and costs of this process vary with the chosen line feeding policy.
cPilp = CLλinip
[ALp + wfpbspOV
+ (stPp + htip)nip
]∀p ∈ B,S ∀i ∈ Ip l ∈ Li (3.6)
cPilK = CL(λi(stPK + htiK) +
∑m∈Mi
λmAL′
K
bsKOV) ∀i ∈ IK (3.7)
cPi = CL(λi(stPT + htiT ) +
∑m∈Mi
λm
bsT
AL′
T
OV) ∀i ∈ IT (3.8)
For line stocking, no preparation is necessary. Whereas boxed-supplied, sequenced, and kitted
parts are prepared in batches of size bsp (Brynzer and Johansson, 1995). To calculate the number
of preparation cycles necessary, demands are divided by the number of parts in a box (boxed-
supply) or container (sequencing) nip. To estimate the walking effort, that number is multiplied
with the length of an aisle ALp in the corresponding preparation area (walking on average half
the length of an aisle back and forth). An additional distance wfS for sequencing is added
to estimate walking distances between all parts of a family. By dividing through the operator
velocity OV , the time for walking is calculated. Additionally, the number of preparation cycles is
multiplied with a searching time to find the correct storage position of a part in the preparation
area. Also a handling time htip is added for every part. All these times are multiplied with
the logistical workers wage. Whereas for boxed-supply and sequencing, costs are independent
of other decisions, kits usually contain parts from multiple families. Costs for walking along all
storage locations in a kitting cell are considered by using marginal costs. By adding one more
part, the operator has to walk by that part every time a kit is needed which results in walking the
distance AL′
p additionally (see Equations (3.7) and (3.8)). The number of kits that have to be
prepared can be calculated by dividing a model’s demand λm by the batch size in which kits can
be prepared bsp. Costs for walking are calculated as before. However, there are additional costs
for handling and searching as well. These are calculated similar to boxed-supply and sequencing
(see Equation (3.6)). Here, another trade-off between the different line feeding policies can be
seen: While all policies entailing preparation save space at the border of line in comparison to line
stocking, kits are potentially even more attractive than boxed-supply or sequencing as they may
contain many more different parts and take up little (stationary kit) or no space (traveling kit).
Nevertheless, preparation costs are higher, as the operator usually has to walk a full circle in the
kitting cell and batches for picking are smaller due to bigger kitting containers. In boxed-supply,
batches are larger and the operator does not have to walk the entire aisle every time. The latter
argument also holds for sequencing.
Transportation costs
Irrespective of the chosen line feeding policy, parts need to be transported from a warehouse
or preparation area to the BoL. The way of transporting parts to the assembly line is heavily
depending on the chosen load carrier and transportation vehicle. It is assumed that only one kind
of load carrier is considered for every feeding policy. Therefore, first the number of transports

60 Chapter 3
can be calculated by dividing demand λi by the number of parts per load carrier and policy nip
and the number of boxes and containers ncp fitting on one vehicle. We assume that the batch
size bsp, stemming from preparation, is equal to the number of kits or sequenced containers that
can be transported in one container. Next this is multiplied with the duration of a milk run
length in case of boxed-supply or sequencing (see Equation (3.10)) or the distance to a certain
location (back and forth) for line stocking (see Equation(3.9)).
For kits, we calculate transportation costs as a fixed cost, that is similarly calculated as for
boxed-supply and sequencing (see Equation (3.11)), however, it is based on models’ demands.
cTilL = CLλiniL
2dilεLV VL
∀i ∈ IL l ∈ Li (3.9)
cTilp = CLλi
nipncp
mrpεpV Vp
∀p ∈ B,S i ∈ Ip l ∈ Li (3.10)
cTmp = CLλm
bspncp
mrpεpV Vp
∀m ∈M p ∈ K,T (3.11)
Every vehicle might not be used all the time or to a full extent. To guarantee a certain service
level for the supply of all station with parts, it might be necessary to perform a transportation
although the vehicle is not fully loaded. Therefore an average utilization rate εp, lower than
100%, should be assumed for all line feeding policies. Time required for loading and unloading
also results in a decrease of utilization, in turn increasing the time requirements for the entire
transportation process. As different containers and/or transportation vehicles may be used for
different feeding policies they all entail different costs. This constitutes another trade-off for
policy decision making.
Usage costs
The process of part usage describes the operations performed by assembly workers. These oper-
ations consist of multiple tasks. While the actual assembly of parts is key, it is not considered
in this model because its duration is not affected by the line feeding decisions. However, there
are additional tasks that need to be performed, like walking to and from the BoL, searching and
grasping parts, handling parts, and further small tasks like reading the picking or assembly list
(Finnsgard et al., 2011; Limere et al., 2015; Sali and Sahin, 2016). Handling times are considered
neither, since they are not affected by the line feeding policy and can neither be reduced nor
avoided. In this work, usage costs describe operator costs for non-value adding tasks whose time
is affected by feeding decisions (see Equation (3.12)).
cUilp = CAλi(2wdilOV
+ stUp ) ∀i ∈ I l ∈ Li ∀p ∈ P ′i (3.12)
wdil =√
(|dpi − cl|)2 + de2 ∀i ∈ I l ∈ Li (3.13)
Within this research, we take into account walking distances wdil between the point where a

Mixed-model assembly line feeding 61
part is needed dpi and the center of a location cl where the part is stored. This is divided by
the operators velocity. Additional costs emerge when searching for parts with a duration of stUp .
This searching time may be affected by the chosen line feeding policy. Usage costs are induced
whenever a part is needed. Finally, the wage for assembly operators CA has to be taken into
account. In case of traveling kits, there are neither walking costs nor searching costs, as parts
travel the line along with the product and are already presorted according to the demand.
For calculating the walking distances wdil we assume, that the operator starts from the point of
demand dpi for part i and walks to the center cl of its storing location l (see Equation (3.13)).
After fetching the part, she returns to exactly that location. In case of a moving assembly line
that might not be perfectly accurate as the product is slowly moving as well. However, the
practical deviation is negligible and, therefore, not further considered here.
Costs, resulting from walking distances, do not largely discriminate or favor one particular policy.
Nevertheless, there are some trade-offs. For example when line stocking all parts of a family, all
parts should be at the same position which minimizes walking distance. Since this is not feasible,
parts with lower demand will be placed farther away. This, however, might make another feeding
policy like boxed-supply attractive for those parts if there is a rack close by. In addition, using
a stationary kit at that station might be beneficial. This could pose another conflict since,
depending on the parts being in that kit, the same location (which was optimal for line stocking
the above mentioned family) might be the best for that kit. Thus, there are a lot of smaller
trade-offs along the BoL.
3.4 Modeling an ALFP with variable space
Within this section we propose a linear integer programming (IP) model for decision making
in assembly line feeding systems taking into account space constraints at the assembly stations.
As described in the previous section, the assembly line feeding problem assigns every part to a
line feeding policy. We extend this approach by additionally assigning it to a discrete location l.
By this, we generate a better accuracy when determining assembly operator times which affect
the objective function in terms of costs. Furthermore, it also determines the exact design of the
BoL. In the proposed model, every part (index: i) is needed at a certain station (index: s) and
therefore assigned to a corresponding location that can be used for that station l ∈ Ls. In this
model, five line feeding policies (index: p), i.e., line stocking (p = L), boxed-supply (p = B),
sequencing (p = S), stationary (p = K), and traveling kitting (p = T ), are included.
For a better understanding, some important assumptions of the model are summarized in the
following:
Assumptions
1. Demand is assumed to be deterministic.
2. The size of the BoL of a station may vary as locations can be used for multiple stations.
3. Overall shop floor space is limited by the sum over all locations available at the stations.

62 Chapter 3
4. For every line feeding policy, a generic load carrier is used, meaning that, e.g., all kitted
parts are transported in cart containers with a specific volume and weight constraint.
5. Part families (index: f) contain multiple parts, that are substituting each other.
6. At most one traveling kit can be used for one final product.
7. Parts are assumed to be used for one task only.
While assumption 1, 5, and 6 should be self-explanatory, we want to give some explanation for
the remaining assumptions. Assumption 3 states that the length of the assembly line is fixed and
cannot be changed. This assumption is taken since the size of a station usually depends on the
size of a product and thus the overall length of the line depends on the number of stations and
cannot be changed. Assumption 2 states, however, that stations can borrow some space from
adjacent stations if this is beneficial. Lastly, assumption 4 states that for every line feeding policy
a standard container is used. For example, all pallets are assumed to have the same footprint
being, e.g., 0.8m x 1.2m. Similarly, kits are transported in containers of a fixed size, e.g., 0.8 x
1.2 x 1.4m. Every container in turn contains multiple kits, e.g., 3 such that the available volume
is equally split up between all kits in that container. Lastly, we assume that each part is only
used for one task at a particular station, which may be different in practice. Not adjusting the
model accordingly may result in suboptimal solutions. That is because the kitting cells would
be larger in the model than needed as using the same part for two different tasks which are both
served by a traveling kit would not require to store the part twice which would be the case in
model presented.
The notation used throughout the model can be found in Table 3.3.
Table 3.3 Notation for the IP model
Sets
F Set of part families Fl Set of families that may be assigned to location
l
Fm Set of families that are used for model m Fp Set of families for which line feeding policies p
can be used
Fs Set of families that are needed at station s I Set of parts
If Set of parts that are in family f Il Set of parts that might be placed at location l
Im Set of parts that are used in model m Ip Set of parts for which line feeding policies p
can be used
Is Set of parts that are used at station s L Set of locations to store parts
Li Set of locations that can be used to store part
i
Lf Set of locations that can be used to store parts
of family f
Ls Set of locations that can be used for station s M Set of models to be assembled
Mf Set of models that use family f Mi Set of models that use part i
P Set of line feeding policies P ′ Set of line feeding policies excluding traveling
kitting
Pi Set of line feeding policies usable for part i P ′i Set of line feeding policies excluding traveling
kitting usable for part i

Mixed-model assembly line feeding 63
S Set of assembly stations Sl Set of stations that can use location l
Binary variables
um Using a traveling kit for model m xilp Assigning part i to location l and line feeding
policy p ∈ P ′
yi Assigning part i to a traveling kit µlm Using a stationary kit at location l for model
m
τf Assigning family f to a traveling kit χlsp Using location l for station s and line feeding
policy p ∈ P ′
ψflp Assigning part family f to location l and line
feeding policy p ∈ S,K
Parameters
cilp Costs for providing part i to location l ∈ Liwith line feeding policy p ∈ P ′i
ci Costs to provide part i ∈ IT with a traveling
kit
cmK Fixed costs for a stationary kit for model m cmT Fixed costs for a traveling kit for model m
fi Family of part i M Large number
r Rack capacity, i.e., number of boxes that fit in
a rack used for boxed-supply
si Station at which part i is used
vf Volume of part family f vi Volume of part i
Vp Volume of a container/box used for policy p wf Weight of part family f
wi Weight of part i Wp Weight limit of container used for policy p
In the following, we give a generic linear integer model that solves the assembly line feeding
problem by unambiguously assigning every part to a line feeding policy and a location.
Minimize: ∑i∈I
∑l∈Li
∑p∈P′i
xilpcilp +∑i∈IT
yici +∑l∈L
∑m∈M
µlmcmK +∑m∈M
umcmT (3.14)
subject to: ∑l∈Li
∑p∈P′i
xilp + yi = 1 ∀i ∈ I (3.15)
∑i∈Is∩Il∩Ip
xilp ≤Mχlsp ∀s ∈ S ∀l ∈ Ls ∀p ∈ P ′ (3.16)
∑s∈Sl
∑p∈P′
χlsp ≤ 1 ∀l ∈ L (3.17)
∑i∈If
xilp ≤Mψflp ∀p ∈ S,K ∀f ∈ Fp ∀l ∈ Lf
(3.18)∑i∈Il∩IL
xilL +∑
f∈Fl∩FS
ψflS ≤ 1 ∀l ∈ L (3.19)
∑i∈Il∩IB
xilB ≤ r ∀l ∈ L (3.20)

64 Chapter 3
r∑l∈Ls
(χlsB − 1) ≤∑
i∈Is∩IB
∑l∈Li
xilB ∀s ∈ S (3.21)
∑f∈Fl∩Fm∩FK
vfψflK ≤ VKµlm ∀l ∈ L ∀m ∈M (3.22)
∑f∈Fl∩Fm∩FK
wfψflK ≤WKµlm ∀l ∈ L ∀m ∈M (3.23)
∑i∈If
yi ≤Mτf ∀f ∈ FT (3.24)
∑f∈Fm∩FT
vfτf ≤ VTum ∀m ∈M (3.25)
∑f∈Fm∩FT
wfτf ≤WTum ∀m ∈M (3.26)
∑i∈Ik:sj<si
∑l∈Li:l≤k
∑p∈P′i
xilp +∑p∈P′j
xjkp ≤ 1 +M(1−∑p∈P′j
xjkp) ∀k ∈ L ∀j ∈ Ik (3.27)
xilp ∈ 0, 1 ∀i ∈ I ∀l ∈ Li ∀p ∈ P ′i (3.28)
yi ∈ 0, 1 ∀i ∈ IT (3.29)
τf ∈ 0, 1 ∀f ∈ FT (3.30)
um ∈ 0, 1 ∀m ∈M (3.31)
µlm ∈ 0, 1 ∀l ∈ L ∀m ∈M (3.32)
ψflp ∈ 0, 1 ∀p ∈ S,K ∀l ∈ Lf ∀f ∈ Fp(3.33)
χlsp ∈ 0, 1 ∀l ∈ L ∀s ∈ Sl ∀p ∈ P ′ (3.34)
In case it is required or desired to feed all parts of a family using the same line feeding policy,
the following two constraints have to be added. Please note that w.l.o.g. it is assumed that parts
and their families are assumed to be sorted in increasing order w.r.t. their indices.
|Ifi |yi =∑
j∈IT :fi=fj
yj ∀i ∈ IT : fi > fi−1 (3.35)
∑l∈Li
|Ifi |xilp =∑
j∈Ip:fi=fj
∑l∈Lj
xjlp ∀p ∈ P ′ ∀i ∈ Ip : fi > fi−1 (3.36)
The objective function (3.14) aims to minimize four types of costs: costs for feeding part i at
location l with line feeding policy p, denoted by cilp; costs for feeding part i with a traveling kit,
ci; fixed costs for using stationary, cmK , or traveling kits, cmT , for model m. The calculation of
these costs has been discussed before in Subsection 3.3.2.
Within the first constraint (3.15), it is assured that every part is unambiguously assigned to a
location and a line feeding policy (xilp), unless it is fed in a traveling kit (yi) which does not
require a location assignment. Next, in Equation (3.16), we link χlsp variables to xilp variables

Mixed-model assembly line feeding 65
using a big-M constraint. The χlsp variables indicate whether a location is used for a certain
line feeding policy and station. Obviously, every location can only by used for one station, and
one line feeding policy (see Equation (3.17)). Equation (3.18) links another auxiliary variable
ψflp to the xilp variables. It indicates if any part of family f is assigned to location l using line
feeding policy p.
From Equation (3.19) on, we define specific rules for individual line feeding policies, starting with
a limit on line stocked parts and sequenced families per location (Equation (3.19)): A location
can contain at most a single line stocked part or one sequenced family. Analogously, there is also
a limit r on the number of parts that fit into a rack used for boxed-supply (Equation (3.20)).
As the Border of Line should not be plastered with racks, that are not needed, Equation (3.21)
ensures, that no rack can be removed without making the solution infeasible. This equation might
be neglected if investment costs for equipment such as racks are considered as an optimization
will balance investment costs and savings in walking costs. Equations (3.22) and (3.23) ensure
that volume vf and weight wf of part families in a stationary kit do not exceed the respective
container limits VK and WK . Simultaneously µlm is introduced, indicating whether a stationary
kit for model m is placed at location l. The binary decision variable τf , introduced in Equation
(3.24), indicates if any part of family f is assigned to a traveling kit. This variable is used to
enforce volume VT and weight WT constraints of traveling kits in the following two constraints
(3.25) and (3.26). Those constraints also link the variable um to the variable τf indicating if a
traveling kit is used for model m. Lastly, constraint (3.27) ensures that if a location l is used for
station s, no preceding location k : k < l can be used for a subsequent station q : s < q. This
constraint is only active if space borrowing is allowed. A visualization of this constraint is also
shown in Figure 3.1. In this simple example the line consists of 2 stations (left: station 1, right:
station 2). Each station may use some locations Ls which is indicated in the top-most line by
the set of stations Sl that may use location l. Here, locations 1-5 and 7 are used by station 1
and locations 8-16 are used by station 2. This means, station 2 borrows location 8 from station
1 as location 8 is within the boundaries of station 1. As one can see, location 6 is not used,
and constraint (3.27) avoids that station 2 uses it as long as station 1 uses location 7, even if
it reduced costs. This prevents crossing of workers. Furthermore, it avoids confusion about the
parts used at a station. In practice one might use, for instance, fluorescent tape to indicate that
locations 8-16 contain parts for station 2.
Equations (3.28) - (3.34) define the domains of all decision variables used in this model. As
mentioned before, Equations (3.35) and (3.36) may be added when the solution should contain
equal assignments for all parts of one family. For parts in a traveling kit this is ensured by the
first constraint and for parts in other line feeding policies by the second constraint. This might
be done to avoid confusion of assembly workers about the exact part to use for a product. We
refer to the model without constraints (3.35) and (3.36) as the part level model, and to the family
level model if the constraints are included. This is due to the fact that parts can be assigned to
every line feeding policy in the former formulation. In contrast, parts of the same family have
to be assigned to the same policy in the latter formulation.

66 Chapter 3
3.5 Solving procedure
First, we are going to prove in theorem 3.5.1, that both models described in the preceding chapter
are NP-hard, in a similar manner as Schmid and Limere (2019).
Theorem 3.5.1. The ALFP, described by formulas (3.14)-(3.34) is an NP-hard problem. Thus,
the ALFP including (3.35) and (3.36) is NP-hard as well.
Proof. To verify this theorem, we will show that the problem can be restricted to the uncapac-
itated facility location problem (UFLP) which is proven to be NP-hard by Cornuejols et al.
(1990). To do so, we follow the problem definition given by Korte and Vygen (2012)
UFLP Input: A set of facilities J , a set of clients K, costs cij ∈ R+ for serving client i from
facility j, and a cost cj ∈ R+ for opening facility j.
The task is to find a subset of facilities X to be opened and an assignment σ : K → X of clients
to open facilities minimizing costs∑j∈X cj +
∑i∈K cσ(i)i
Given this, we restrict the ALFP to instances with the set of parts I equal to the set of clients
K, the set of locations L equal to the set of facilities J , cilp = cij ∀p ∈ P ′, and cmK =
cj ∀m ∈ M. Furthermore, we restrict the instances by setting the set of policies to P = K.Thus, the variables yi, τf , um and constraints containing those variables are removed from the
problem. Additionally, we restrict instances to a single model to be assembled |M| = 1, and
to a single station |S| = 1 such that all locations belong to that station. As there is only one
policy and a single station, the variables χlsp and all constraints having these variables can be
removed from the model. Next, the volume VK and weight capacity WK of a stationary kit
are set equal to a large number (sufficiently large to contain all parts, e.g., sum over all part
volumes/weights). Lastly, we restrict the ALFP to instances with families such that |If | = 1 ∀f ∈F , which makes the constraints (3.35), (3.36), the variables ψflp, and associated constraints
superfluous. Thus, we obtain a heavily simplified version of the model being equivalent to the
UFLP. This transformation can be done in polynomial time and we obtain instances equal to
the ones described for the UFLP.
Clearly, any solution for the UFLP directly corresponds with a solution for the restricted ALFP,
and vice versa, since opening a facility in the UFLP is equivalent to using a location for a
stationary kit in the ALFP. In the UFLP clients can only be served from opened facilities. This
is equivalent to the ALFP where parts can only be assigned to a kit at location l if that location
is used for a kit. In addition, the cost of a solution for one problem is equivalent to the cost of
the transformed solution since the variable costs for serving a client from a facility are identical
to the variable costs for assigning a part to a location, and the fixed costs for opening a facility
are identical to the fixed cost for using a location for a stationary kit.
As both proposed models are intractable, we propose an extended solving approach to obtain
better solutions to that problem. This approach is schematically depicted in Figure 3.2
First, the number of variables is reduced. Next, some general VIs are imposed. Lastly, it is
decided if the decision is to be made on a part or a family level (see Section 3.4). Depending on
this decision, either BAC or CAB (which is synonymous to adding VIs) is used. We use both

Mixed-model assembly line feeding 67
IP Model
Reduce variables
VIs
Part decision?
no yes
Cut & Branch Branch & Cut
Figure 3.2 Solution approach
terms, namely valid inequalities and Cut & Branch here, even though they are conceptually the
same. This distinction is made to juxtapose the cuts added via C&B to the valid inequalities
added in C&B while not referring to the more general valid inequalities that are added in both
approaches.
Obviously, the way of formulating a mathematical programming model affects the solution pro-
cess and speed as well. Even though the use of big-M constraints for Equations (3.16), (3.18),
(3.22), (3.23), (3.24), (3.25), and (3.26) give weak linear programming relaxations, we decided
to use this formulation rather than other formulations using more constraints and thus resulting
in a tighter convex hull. This is done as in our test runs the formulation using big-M constraints
performed much better than the ones with a tighter convex hull. A theoretical explanation of
this behaviour can be found in Trick (2005); the use of big-M constraints leads to a sparser
formulation with a smaller matrix for which the linear programming relaxation can be solved
much faster. Furthermore, cuts with a tighter convex hull are added automatically but only for
those variables that take a value different from 0.
Another aspect of our proposed formulation are the variables (and associated constraints) used
in the program. Obviously, it is possible to build a model, meeting the same objective as the
proposed model without using the variables χlsp, τf or ψflp. If the model was implemented with
fewer of these variables one had to state, e.g., that parts cannot be assigned to a location if there
is any other part assigned to that location in a different policy. Doing this, linking constraints

68 Chapter 3
(e.g., (3.16), (3.18)) could be removed from the model and some other constraints, such as (3.17)
had to be formulated differently. However, this approach creates a very large MIP due to the
large number of possible combinations of parts at locations or parts in a kit. Obiously, the
number of variables can be reduced but the number of constraints is drastically increasing. This
is not desirable as more constraints make the (relaxed) model often more difficult to solve. It
also increases the number of non-zero elements in the coefficient matrix which may also slow
down computations. We were able to confirm this behaviour in pretests. The beneficial use of
those indicator variables has also been described by Rahmaniani et al. (2017).
3.5.1 Preprocessing
Due to the number of possible locations for storing a single part, the number of variables is
relatively high. Preprocessing may be used to reduce the number of variables, avoiding branching
on binary variables that can never take a value of 1 in an optimal solution. For this we propose
the following preprocessing rules.
1. If the boxed-supply feeding costs for every possible location are cheaper than the costs for
line stocking at any location, remove the variable for line stocking at this location. Remove
xilL ∀i ∈ IL ∀l ∈ Li : cilL > maxk∈Li
cikB
2. If all parts fit into the station without using stationary kits and the most expensive way
of feeding them is cheaper than the fixed cost of a stationary kit, variables for assigning
the parts to a stationary kit can be removed. Remove xilK ∀s ∈ S ∀i ∈ Is ∩ IK ∀l ∈ Li :∑i∈Is max
l∈Lip∈P′i\Kcilp −
∑i∈Is min
l∈Lip∈P′i
cilp < cmK
3. If the line feeding policy has to be the same for all parts of a family, the variables for line
stocking can be removed if the number of possible locations is smaller than the number of
parts in that family: Remove xilL ∀l ∈ L ∀i ∈ IL ∩ Il : |Fi| > |Li|. This can also be done
for boxed-supply if the number of parts in a family is larger than the number of locations
times the number of parts fitting in a rack: Remove xilB ∀l ∈ L ∀i ∈ IB ∩Il : |Fi| > |Li|r.
3.5.2 Valid inequalities
The current problem formulation rather considers every location individually. However, it may
benefit from adding a linking constraint that considers all the parts at a station at the same
time. This can be done by the following constraint which is complemented with two additional
variables.∑i∈Is∩IL
∑l∈Li
xilL + bs +∑
f∈Fs∩FS
∑l∈Ls
ψflS +∑l∈Ls
ksl ≤∑l∈Ls
∑p∈P′
χlsp ∀s ∈ S (3.37)
∑i∈Is∩IB
∑l∈Li
xilB ≤ bs ∀s ∈ S (3.38)
∑i∈Is∩IK
xilK ≤Mksl ∀s ∈ S ∀l ∈ Ls (3.39)

Mixed-model assembly line feeding 69
bs ∈ Z+ ∀s ∈ S (3.40)
ksl ∈ 0, 1 ∀l ∈ L (3.41)
bs indicates the number of racks at a station that is needed to store all parts in racks that
are boxed-supplied. ksl indicates if location l is used to store any kit for station s. Thus,
adding constraints (3.37)-(3.39) and the required variables to the model introduces a station
wise consideration of policies. This simplifies decision making while maintaining feasibility and
optimality.
3.5.3 Branch and cut
As BAC¸ is a well known concept, we refer the reader to Wolsey and Nemhauser (1988) and
Cornuejols (2008) for further reading and focus on explanations for this specific problem only.
By solving the linear relaxation, we found that parts from different families are often partially
sequenced at a single location. However, this cannot happen in an integer solution due to
constraint (3.19) which allows only a single family to be sequenced at a single location. However,
the use of the auxiliary variables ψflp, introduced in constraint (3.18), may give rise to weak
relaxations. In these cases the xilS variables take (fractional) values summing up to more than
1. Therefore, parts from multiple families can be sequenced fractionally at a single location in
the relaxed solution. This is tackled by the use of additional cuts introduced in the following
(the advantage of the chosen formulation is discussed in the beginning of Section 3.5).
Separation
To illustrate the underlying problem, consider a case with two families (f = 1, 2) each having
a part (i = 1, 6) being sequenced at location 2. Further, assume that both families consist of
five parts. Since x12S = x62S = 1 and∑i∈If xi2S ≤ 5ψf2S , it follows that ψ12S = ψ22S = 0.2.
Thus constraint (3.19) would be satisfied in the relaxed problem but not in the integer problem.
However, it is possible to add cuts avoiding these integer infeasible solutions. With the present
solution, for each family of product, we let if be the index such that xif lS is maximum for family
f . Then, we check if the following inequality is violated and add it to the model to strengthen
the relaxation if violated. ∑f∈Fl∩FS
xif lS ≤ 1 ∀l ∈ L (3.42)
In addition to multiple families being sequenced at a single location, another problem of the
weak linear relaxation of the problem can emerge when parts are kitted. The same reasoning
regarding the relaxation values explained above can be applied here, as there is no direct link
between the variables xilp and µlm and neither between yi and um. Therefore, we define the
index if similar to above to define the part for which, e.g., the product vifxif lK is maximum in
the current solution. Similarly for vif yif . If any of the following inequalities is violated, they
can be added to the model.

70 Chapter 3
∑f∈Fl∩Fm∩FK
vifxif lK ≤ VK ∀l ∈ L ∀m ∈M (3.43)
∑f∈Fl∩Fm∩FK
wifxif lK ≤WK ∀l ∈ L ∀m ∈M (3.44)
∑f∈Fm∩FT
vif yif ≤ VT ∀m ∈M (3.45)
∑f∈Fm∩FT
wif yif ≤WT ∀m ∈M (3.46)
Cuts (3.43) and (3.44) strengthen the formulation in comparison to the original constraints
(3.22) and (3.23) which use the variable ψflK for stationary kitting. Similarly, the cuts (3.45)
and (3.46) apply the same strengthening to traveling kits and the corresponding constraints
(3.26) and (3.27).
Lifting
Obviously, a location can only be used for a single line feeding policy as stated in constraint
(3.17). Therefore, the cut proposed in Equation (3.42) can be strengthened further, by adding
some terms to the left-hand side. This leads to the cut proposed in Equation (3.47). Thus,
a stronger cut avoiding not only fractional sequencing of multiple families, but also fractional
assignment of parts in other feeding policies such as line stocking is avoided. For this we define
the index i such that xilp is the maximum over all parts.
∑i∈Il∩IL
xilL +∑
p∈B,K
xilp +∑
f∈Fl∩FS
xif lS ≤ 1 ∀l ∈ L (3.47)
By this, it is ensured that neither line stocking for any part happens together with sequencing of
parts from different families, nor any part is supplied in boxed-supply or a stationary kit at that
location at the same time. To show the validity of this lifting procedure, consider the example
given in the paragraph above. It can be assumed that a third part (i = 2) is assigned to the
same location in line stocking with x22L = 0.6. This would still be feasible in the relaxed solution
since ψ12S +ψ22S + x22L = 1. However, this would never be feasible in the integer solution since
only one of these three binary variables can be different from 0. Therefore, x22L can be added
to the cut. In this example, we obtain the following cut:
x22L + x12S + x62S ≤ 1 (3.48)
Since the left hand side of this cut is greater than 1, i.e., 2.6 the cut is violated and can be added
to the model. This can be done for every part that is partially assigned to line stocking and this
location. A similar approach can be done for boxed-supplied and stationary kitted parts due to

Mixed-model assembly line feeding 71
constraints (3.16) and (3.17). These constraints ensure that only a single policy is used at one
location which will always be true in the integer but not in the relaxed solution. However, for
boxed-supply and stationary kitting only a single part can be considered since multiple parts are
allowed to be combined in a single location but the right-hand side of the VI is 1.
Although this could be achieved by adding VIs a priori (Cut & Branch), the number of addi-
tional constraints would be enormous due to the huge number of combinations for parts from
different families. The number of constraints, when applying a Cut & Branch approach to Con-
straint (3.42) would be∏f∈Fl
|If |. If instead, all constraints described in the lifting procedure
(Constraint (3.47)) were added, the number of constraints would be (∏f∈Fl
|If |)3.
3.5.4 Cut and Branch
As just stated, adding the cuts a priori would lead to an enormous number of constraints. How-
ever, if the problem statement includes constraints (3.35) and (3.36), i.e., ensuring a solution
where all parts of one family are fed in the same way, the number of required VIs is heavily
reduced. This can be explained by the fact that all parts of a family are linked by these con-
straints. Therefore, adding the following VIs leads to the same result as applying a Branch and
Cut approach. Please note that w.l.o.g. it is assumed that parts and their families are assumed
to be sorted in increasing order w.r.t. their indices.
∑i∈Il∩IL
xilL +∑
i∈Il∩IS :fi>fi−1
xilS ≤ 1 ∀l ∈ L (3.49)
∑i∈Il∩Im∩IK :fi>fi−1
vixilK ≤ VK ∀l ∈ L ∀m ∈M (3.50)
∑i∈Il∩Im∩IK :fi>fi−1
wixilK ≤WK ∀l ∈ L ∀m ∈M (3.51)
∑i∈Im∩IT :fi>fi−1
viyi ≤ VT ∀m ∈M (3.52)
∑i∈Im∩IT :fi>fi−1
wiyi ≤WT ∀m ∈M (3.53)
Obviously, lifting for boxed-supply and kitting cannot be applied for Equation (3.49) without
increasing the number of constraints drastically by a factor of |If ||P′|.
3.6 Computational experiments
3.6.1 Data
Creation of datasets
For experimentation, we used the dataset described by Limere et al. (2012) and reimplemented
and extended the data creation algorithm described in Limere et al. (2015). The extension

72 Chapter 3
allows the following additional features compared to the previously created datasets: (i) Multiple
product models are used within one dataset. (ii) Part families are used in multiple product
models. This is described by the term overlap. An overlap of 20% for instance indicates that
20% of the families in the dataset are used for at least two models. (iii) Lastly, we adjusted
the calculation of demand to obtain more random and realistic demand patterns. The algorithm
used to create datasets is described in Algorithm 1.
Algorithm 1 Algorithm to create datasets
1: procedure Dataset creation2: Choose number of models |M| and overlap of part families o3: Choose number of stations |S|4: Set correction factor correct = 15: Families:6: for s = 1 to |S| do7: for m = 1 to |M| do8: Randomly assign number of families per product and station |Fms| ← F (|Fs|)9: Calculate adjusted number of families per station |Fs| =
∑m∈M |Fms|(1− ocorrect)
10: for m = 1 to |M| do11: Assign StartingFamilym12: for f = StartingFamilym to StartingFamilym + |Fms| do13: Fm = Fm ∪ f14: |F| ←
∑s∈S |Fs|
15: Calculate actual overlap o = 1/|F|∑
f∈F:|Mf |>1 1
16: if o /∈ [o± 0.01] then17: Adjust correct18: goto Families
19: Sequence of part usage per station:20: for s ∈ S do21: CurrentNumber ← 122: for k = |M| to 1 do23: for f ∈ Fs do24: if |Mf | = k then25: snf ← CurrentNumber26: CurrentNumber + +
27: Part characteristics:28: for f ∈ F do29: Randomly assign a number of parts |If |30: Randomly assign a demand for that family λf31: for i ∈ If do32: Randomly assign a demand for every part λi33: Randomly assign a weight for every part wi
34: Randomly assign a way of receiving a part pallet or box) reci ← Fwi (rec)35: Randomly assign a number of parts usei that is needed for one product model usei ← Fwi (use)36: Randomly assign a number of parts per pallet ni ← Fwi,rec(ni)37: Normalize the number of received parts: ni = ni/(useiV olumerec)38: Calculate the volume for every part vi = 1[m3]/ni
39: λf ←∑
i∈If λi
40: Norm← λf/λf41: for i ∈ If do42: λi ← λiNorm
By using Algorithm 1, we created multiple problem instances. In those, the number of models
is ranging from 1 to 3. In case of multiple models, the percentage of overlap is between 0% and
80% and is increased in steps of 40 percentage points. Thus, we obtain seven combinations. For

Mixed-model assembly line feeding 73
each of those seven combinations, exactly six instances were created in order to represent some
variety. Those instances contain 50 stations and in between 403 and 2979 parts which reflects
realistic sizes of assembly lines. The parameters, describing the overall system, are the same in
every dataset, whereas the number of families, parts, and the corresponding characteristics like
weight, volume, delivery quantity, demand, etc., vary between the instances. A summary of the
most important characteristics is given in Table 3.4. It shows the ranges for the number of parts
and families in a dataset, and the range of parts in a family and families at a station. Finally it
also shows the average of part demand and its standard deviation. All parameters regarding the
overall system were already shown and described in Table 3.2. Note that for varying parameters
a range is given.
Table 3.4 Instance characteristics
#Models Overlap #Inst. #Parts #Families Parts/Family
Families/Station
Demand
1 n.a. 6 [909-1045] [369-404] [1-47] [1-36] 462± 6842 0 6 [1670-2057] [700-799] [1-47] [1-39] 241± 3532 40 6 [1031-1357] [432-526] [1-38] [1-35] 336± 5302 80 6 [403-710] [169-268] [1-47] [1-14] 409± 6563 0 6 [2536-2979] [1034-1177] [1-47] [1-39] 171± 2373 40 6 [1544-1932] [653-771] [2-47] [1-35] 235± 3973 80 6 [684-978] [281-356] [1-38] [1-18] 350± 558
Factorial design of experiments
The datasets are solved in a full factorial experiment with the parameters of Table 3.5. By
doing so, we aim to gain information on the impact of decisions that are relevant in industrial
decision making. Firstly, we assume space at every assembly station either to be given and fixed
or to be variable. When being variable, a station may use up to 25% of the space of both the
preceding and the succeeding station. Clearly, allowing more space borrowing may reduce costs
even further. However, obtaining (near) optimal solutions is becoming more difficult for such
settings but limiting the space borrowing may also be desired from a practical point of view. That
is, if workers walk far into an adjacent station, they may block each other. Next, we investigate
the available space per station being either 4m or 6.4m. This is done as in some situations, one
could decide to enlarge the assembly line to favor cheaper line feeding policies requiring more
space which could be an alternative to variable space of assembly stations. However, in practice
this might not be possible, e.g., when the assembly line is already built. A third component
of the factorial experiment is the movement of a line. In non-moving lines the demand points
dpi are equal for all parts at one station, whereas they vary for moving lines. Lastly, as already
indicated in Section 3.4, one can impose constraints to ensure that every part of a family is fed in
the same way. This might be more convenient for the assembly worker, although, economically it
might be better to assign every part individually to a feeding policy. Overall, we obtain 24 = 16
different designs due to the full factorial design, varying each of the discussed parameters by
choosing one of two options.

74 Chapter 3
Table 3.5 Varied parameters for full factorial design
Parameter Option 1 Option 2
Length BoL 4m 6.4mSpace borrowing 7 3Moving line 3 7Decision level Family Part
3.6.2 Computational insights
The model proposed in Section 3.4 is solved with the solving approach described in Section 3.5
using Gurobi 8 on a computer with 32 GB Ram and an Intel Core i7-3770 processor with 3.4
GHz. The computer was used to run two instances simultaneously, each using 4 CPU cores. A
maximum time limit of 3600 seconds was set.
When the problem was solved on a part level (every part from the same family can be assigned
a different policy), we used theBACapproach. Whereas, when solving on a family level (all parts
in a family need to be assigned the same policy), we added cuts a priori (Cut & Branch).
Table 3.6 Solving times and gaps when applying solving procedure
Instance Gurobi 8 BAC CAB#opt time gap #opt time gap #opt time gap
|M| = 1 o = 0%fam. 10 1849.25 0.06% - - - 21 581.59 0.02%part 11 1699.3 0.06% 22 369.38 0.00% - - -
|M| = 2 o = 0%fam. 0 n.a. 2.21% - - - 12 1839.00 0.02%part 0 n.a. 2.06% 13 1245.56 0.02% - - -
|M| = 3 o = 0%fam. 0 n.a. 12.62% - - - 0 n.a. 0.44%part 0 n.a. 11.65% 1 3363.77 0.50% - - -
To show the performance of our approach, we compare it to a regular solver, i.e., Gurobi. Due
to computational expenses, this was only done for a subset of the datasets. Firstly, we decided
to select the computationally most difficult datasets for 1, 2, and 3 models respectively, i.e., the
ones with no overlap, and investigate as such the worst case performance. Secondly, within each
class we solve only three instead of six datasets, where a class of problem is described by the
combination of product models in the dataset and the overlap of part families.
Every dataset was run 16 times due to the factorial experiment. Of these 16 runs eight are done
withBACand eight with CAB. Thus, 24 runs per class and solution method were investigated
(3 datasets in 8 settings). Table 3.6 shows the results obtained. Every row shows how many out
of these runs are solved to optimality (#opt), the average computation time of runs solved to
optimality (time) and the average gap of runs not solved to optimality (gap) with a time limit
of 3600s.
From Table 3.6 one can see that the proposed solving procedure in Section 3.5 reduces compu-
tation times and gaps quite drastically. For the easier problems, i.e., instances with one product
model, optimality could be proven for almost all runs. For the more difficult datasets with more

Mixed-model assembly line feeding 75
than one product model, the proposed approach could lower the average gaps drastically to
almost 0 for two products and less than half a percent for three products. For two products,
optimality could also be proven in about half the cases which is not possible at all when just using
Gurobi. Please note, that these are the hardest instances for one, two, and three product models
respectively, as the number of families and parts reduces with increasing overlap. Considering
all datasets tested in all runs, 421 out of 672 could be solved to optimality in 605.50s on average.
The average gap for the remaining runs is 0.24%.
3.6.3 Decision making insights
Aside from the performance improvement shown in the previous subsection, we also analyzed
the results from a managerial perspective. For this, all problem instances created, i.e., 42 have
been solved in 16 combinations each and analyzed as described in the following paragraphs.
Costs of line feeding
To investigate the costs of feeding parts to an assembly line, we aimed to create a comparable
cost measure by calculating the average costs of feeding a single item to the line. For this, we
divide the overall costs by demand over all parts∑i∈I λi.
Investigating differences in costs, we used a mixed-model two-way ANOVA test evaluating the
significance of the impact of BoL length, space borrowing, moving vs. non-moving lines, family
vs. part decisions, and all their combinations. A mixed-model ANOVA is used as the dataset
consists of repeated measurements of multiple problem instances. Therefore, effects can be tested
between different subjects, but also within the same subject. The assumptions for this statistical
analysis, namely normal distribution and homogeneity of the variance-covariance matrices were
tested and satisfied. A test of sphericity was not conducted as all observations have only two
different levels (e.g., two different lengths of the BOL).
The effect of the factors described above is investigated on the results obtained from the best
found solution but also on the lower bounds of costs, namely the LP-relaxed costs. The results of
this analysis can be found in Table 3.7 and read as follows: If the length of the BoL or the amount
of space that can be borrowed is increased, ↑ describes an increase in cost and ↓ a decrease in
costs. For the other two categories it means switching from the first to the second option leads
to an increase (↑) or decrease (↓) in costs. The effect size shows the interval of increase/decrease
for all problem instances when switching from the first to the second option.
As one can observe, costs are relatively robust against changes in the factors tested: However,
some things may be observed: (i) a longer border of line slightly decreases costs on average. But
it should be noted, that an increase in the length of BoL can also increase costs. The actual
effect depends on the dataset, i.e, the part, family, and station characteristics (ii) The allowance
of space borrowing lowers costs in most cases. However, this effect is statistically not significant.
An explanation might be, that the amount of space borrowing allowed is not sufficient to lower
the cost to a significant point. This also matches previous results of Schmid et al. (2018), where
1We used a 0.005 signifance threshold due to the standards proposed by Benjamin et al. (2018)

76 Chapter 3
Table 3.7 Measuring the effect of high level decisions on costs
Setting Observed costs Effect size [%] LP costs Effect size LP [%]
Length BoL ↓∗ [−8.44; +8.11] ↓∗ [−8.44; +6.46]Space borrowing ↓ [−6.82;−0.06] ↓ [−6.05;−0.06]Moving vs. non-moving line - [−1.81; +2.3] - [−1.81; +0.41]Family vs. part decision - [−1.42; 0] - [−1.42;−0.002]
∗ ∗ ∗ refers to a significance level of p = 0.005, ∗∗ to a significancelevel of p = 0.01 and ∗ to a significance level of p = 0.05 1
significant cost reductions were only achieved by allowing space borrowing of up to 50%. (iii)
Both other settings tested do not drastically influence the feeding cost. The two-way ANOVA
also did not reveal any significant interaction terms. Therefore, we do not report on them in
Table 3.7. Those results are especially relevant for future research as it allows to neglect the
decision about a moving or non-moving line (when not considering assembly line balancing).
Moreover, problems can be solved on a family level without risking much higher costs. Lastly,
the knowledge that interaction between these decisions are not significant allows for simpler
experimental settings.
Figure 3.3 Cost shares of feeding processes
Furthermore, the cost percentage of every process can be analyzed. The results can be seen
in Figure. 3.3. As one can see, transportation clearly has the greatest share. This can be
explained by the long distances in a factory as well as by lower density of transportation when
kitting and sequencing are applied. Usage costs are relatively low with an average of 10% and
a maximum of 22%. As the wage of assembly operators is assumed to be equal to the wage of
logistical operators, it is obvious that in scenarios where assembly operators earn higher wages
(for example in the automotive industry) this share would increase. But even with equal costs
for assembly and logistics operators taking the usage costs into account is relevant as we are
going to show in the next section.

Mixed-model assembly line feeding 77
Comparing to a stepwise approach
One may argue that usage costs do not play a significant role in this decision making process,
as somewhat indicated in Figure 3.3. Therefore, we also tested decision making in a stepwise
approach. For this, we assumed that usage costs are equal over all possible locations along the
BoL. Solving this problem (using a simplified model) randomly assigns parts to any location. In
a second step, we fixed the assignments of parts to policies resulting from the first stage and just
optimized the location to be used for each and every part.
Figure 3.4 Comparing a stepwise to the integrated approach
Figure 3.4 shows the relation between costs obtained from the stepwise approach in comparison
to the approach proposed within this chapter. The left graph shows results when the minimum

78 Chapter 3
costs over all locations are assumed for every part with respect to usage and replenishment costs,
whereas in the right graph the average cost over all locations was assumed. As one can easily
see, the integrated approach reduces costs in almost all cases (657/672 cases when using average
costs in the first step; 650/672 cases when using minimum costs in the first step). In cases where
no costs could be saved, the optimal solution could not be found within the time limit of 3600s
and thus costs were marginally higher. Nevertheless, this shows that neglecting usage costs may
increase costs by up to 7%. Another interesting observation is that comparing the results from
both approaches (minimum versus average costs) were mostly close but never ended up in the
exact same solution. Thus, it is also not clear a priori which approach should be chosen when
solving the problem in two steps.
Making line feeding decisions
Our results indicate that all line feeding policies are used in most of the examined datasets.
Hence, one can conclude that consider all line feeding policies is key to minimize costs. Figure
3.5 shows the relative usage of line feeding policies over all datasets examined indicating median
(dark line), first to third quartile (box) and the minimal and maximal values (whiskers) as well
as outliers (circles) by means of a box plot.
Figure 3.5 Line feeding policy mix
One can observe a low usage of line stocking as a feeding policy. As line stocking is often
considered to be the basic line feeding policy, this is quite surprising. Taking into account,
however, that in this study often multiple models are produced on a single line, many parts
are needed and therefore, space is becoming extremely scarce, this is an explainable result.
Furthermore, there are a few datasets where approximately 40% of the parts are line stocked.
This occurs in datasets with only one to two models being produced on a line or the number
of parts being low due to a high overlap. The average percentage of parts in stationary kits is

Mixed-model assembly line feeding 79
around 10-15%, with a peak of around 25% of the parts. This may also be considered to be a
surprising result as a lot of research in literature considers stationary kits to be an important
line feeding policy (e.g., Limere et al. (2012)). Thus, it may be stated that stationary kitting
is a relevant concept, especially when multiple models are produced on a single line but it does
not replace other feeding options such as sequencing and boxed-supply. Sequencing is also a
relatively scarcely used concept as it mostly makes sense for extremely large part families. The
most prevalent line feeding policies are boxed-supply and traveling kitting. However, one should
note the large deviations in traveling kitting.
As described in Section 3.6.1, we used a factorial experiment design. This allows us to investigate
the effect of the available space, space borrowing, moving lines and family vs. part decisions on
the decisions for line feeding policies similarly to the cost analysis in the previous section. We
used a mixed-model two-way ANOVA test and found that space borrowing and space along the
line have the most significant effect on decision making. The use of a mixed-model ANOVA is
motivated by the same reasons as discussed above and assumptions were tested and satisfied
before the application. As interaction terms did not show to be significant, we do not discuss
them here. Results can be seen in Table 3.8 and read as follows: If the length of the BoL or the
amount of space that can be borrowed is increased, ↑ describes an increase in the use of a policy
and ↓ a decrease. For the other two categories it means going from the first to the second option
leads to an increase (↑) or decrease (↓) in the use of a policy. The differences in decision making
can be seen in Figure 3.6 indicating the fraction of parts assigned to a line feeding policy in a
violin plot.
Table 3.8 Measuring the effect of high level decisions on line feeding policies
Line Boxed-supply Sequencing Stationary Travelingstocking Sequencing kitting kitting
Length BoL ↑∗∗∗ ↑∗∗∗ ↓∗∗∗ ↓∗∗∗ ↓∗∗∗Space borrowing ↑∗ ↑∗∗∗ ↓∗∗ - ↓∗∗∗Moving vs. non-moving line - - - - ↑∗∗∗Family vs. part decision - - ↑∗ - ↓∗∗∗
∗ ∗ ∗ refers to a significance level of p ≤ 0.005, ∗∗ to a significancelevel of p ≤ 0.01 and ∗ to a significance level of p ≤ 0.05

80 Chapter 3
Figure
3.6
Lin
efe
edin
gp
olicy
mix
dep
endin
gon
fact
ori
al
des
ign

Mixed-model assembly line feeding 81
Results shown in this section so far are rather on a macro level, depending on factory-wide
decisions. However, one might also be interested in the way part characteristics lead to different
policy assignments. Thus, we show some descriptive statistics of part characteristics on the
feeding policy assignment in Table 3.9 by stating mean and standard deviation. These part
characteristics may be physical properties such as part volume and weight. However, we also
consider some organizational aspects such as the expected demand, and the number of parts that
constitute a family. Lastly, we look at station characteristics such as the number of parts and
part families that is required at a station.
Table 3.9 Part characteristics of parts assigned to a line feeding policy
Line Boxed-supply Sequencing Stationary Travelingstocking Sequencing kitting kitting
Part volume [m3 0.032± 0.14 0.005± 0.007 0.13± 0.28 0.008± 0.015 0.002± 0.006Part weight [kg] 3.06± 5.6 4.03± 6.47 3.27± 6.13 3.30± 4.81 0.7± 1.26Demand [pcs.] 544.28± 592.3 161.87± 246.29 94.36± 261.25 122.63± 213.41 391.55± 574Parts in family [pcs.] 2.28± 1.85 4.59± 4.10 9.75± 5.15 6.01± 4.77 4.86± 4.34Parts at station [pcs.] 18.52± 14.36 39.95± 22.29 51.28± 24.6 99.07± 29.37 54.59± 27.47Families at station [pcs.] 7.79± 4.93 13.24± 6.42 14.85± 6.33 24.88± 7.11 16.63± 6.76
From Table 3.9, one can see that line stocking and sequencing is mostly applied for relatively
large and heavy parts. The other line feeding policies contain generally rather small parts.
Furthermore, traveling kits also contain rather light parts whereas boxed-supplied and stationary
kitted parts can also be heavy. Demand seems to vary also drastically for the different line feeding
policies. For example, line stocked parts have a low demand and sequenced parts have even lower
demand. This makes also sense when looking at the number of parts within a family as demand
is linked to this characteristic: the more parts there are in a family, the lower the demand of
an individual part on average. The last characteristics are somewhat linked as a large number
of families at a station usually results in a large number of families at that station. One can
see that both kitting policies and sequencing are applied more often as the number of parts is
strongly increasing. This can simply be explained by a lack of space.
Generally note, that the standard deviations are quite high which means that the mean of
a characteristic might give an indication on the line feeding policy but can certainly not be
consulted as a single criterion for decision making. Furthermore, some general decisions, such
as space borrowing, might additional affect this decision (see Table 3.8) and thus, have to be
considered.
Multiple models in line feeding
One of the main contributions of this chapter is the incorporation of multiple model assembly
on a single assembly line. Obviously, this has an effect on the decision making of line feeding
policies. We also investigated this by means of an ANOVA. Here, a regular ANOVA is sufficient
as no within-subject effects need to be measured. As one can see in Table 3.10, decision making
for all line feeding policies strongly depends on the number of product models and overlap of

82 Chapter 3
families.
Table 3.10 Measuring the effect of high level decisions on line feeding policies
Line Boxed-supply Sequencing Stationary Travelingstocking kitting kitting
Number products ↓∗∗∗ ↓∗∗∗ - ↑∗ ↑∗∗∗Overlap ↑∗∗∗ ↑∗∗∗ ↓∗∗∗ ↓∗∗∗ ↓∗∗∗Products ↔ Overlap − ↓↓∗∗∗ − - ↑↓∗∗∗
∗ ∗ ∗ refers to a significance level of p ≤ 0.005, ∗∗ to a significancelevel of p ≤ 0.01 and ∗ to a significance level of p ≤ 0.05
The results indicated in Table 3.10 can also be observed in Figure 3.7, representing the average
usage of line feeding policies in dependency of number of product models and overlap. ↑ describes
that increasing overlap or the number of products is proportional to the usage of a line feeding
policy and ↓ denotes that changes behave anti-proportional. For the interaction effect of overlap
and product number, we use the notation of two arrows. The first one shows, starting from the
base case (no overlap, one product) if an increase in both leads to an increase (↑) or a decrease
(↓) in the use of a line feeding policy. The second arrow shows if the value is higher (↑) or
lower (↓) than the expected effect. The violin plots show the distribution of averages weighted
with the number of occurrences as well as their median. E.g., an increasing overlap leads to
more space consuming line feeding policies such as line stocking and sequencing. This can be
explained by the lower number of parts that are required per station. The requirement for space
saving policies is decreasing drastically with increasing overlap. This can be observed especially
for boxed-supply and stationary kitting, but to a minor extent also for traveling kitting.
On the contrary, an increase in models leads to an increase in the assignment to kits, both
stationary and traveling, but also to boxed-supply. A remarkable result is the slight increase in
line stocking when two product models are produced on a single line. This might be explained
by datasets with high overlap or a small number of parts at some stations.
Space borrowing
Another novelty of this model is the possibility that stations may borrow space from adjacent
stations. As indicated in Table 3.7 the allowance of space borrowing does reduce the observed
costs on average. The extent, however is not always very large. This might be explained by
the relatively small allowance for space borrowing, i.e., 25% of the preceding and succeeding
stations, chosen due to computational tractability. Therefore, increasing the possibilities for
space borrowing might lead to a stronger decrease in costs. In Schmid et al. (2018) we could
observe that doubling the allowance for space borrowing does increase cost savings to a larger
extent.
In Figure 3.8 it is indicated how much space, measured in number of locations, is used by stations
on average. One can observe, that all locations are used all the time if no space borrowing is
allowed. This is easily explainable as a reduction in space consumption usually requires more

Mixed-model assembly line feeding 83
Figure 3.7 Line feeding policy mix depending on dataset characteristics
expensive line feeding policies. Thus, the available space is almost always used in entirety.
The allowance of space borrowing on the other hand, indicates that stations have a higher variety
in using space when space borrowing is allowed. Every station is still using some of its locations
and at no station all parts are fed with a traveling kit. The distribution of locations used looks
like it is normally distributed with its mean being equal to the maximum number of locations
per station. The amount of space borrowing seems quite high. Lastly, it can be observed that
all locations are used as well when allowing space borrowing.
Moving lines vs. non-moving lines
In assembly systems, assembly lines may be designed to move during the assembly process or to
be standing still. As shown at the beginning of this section, this decision does neither influence
the cost to a significant amount nor the decision for line feeding policies (see above). However, it
does influence the use of locations for line feeding policies. As shown in Figure 3.9, this decision
does drastically influence where stationary kits are positioned along the BoL. The figure shows
for every relative location of a station, i.e., the position of a location in relation to other locations
of the same station, how it is used. For every line feeding policy the values of the bars show how

84 Chapter 3
Figure 3.8 Space usage in relation to regular station size
many parts are assigned to a specific feeding policy at that relative location. There are a few
things to observe here. Starting with the use of locations that do not belong to a station but
can be borrowed by that station. Those locations (0,6,7 for short lines; -1,0,9,10 for long lines)
are mostly used for line stocking and boxed-supply. Stationary kits are almost never assigned to
these locations. Line stocked parts seem to be rather assigned to earlier locations along a station.
This might be explained when considering that line stocked parts are often high demand parts,
which makes it reasonable to position them as close as possible to the required point to reduce
walking. The left skew is likely a result of the left skewed demand points for parts at moving
lines as parts are needed as soon as the product enters the station but no parts are needed at
the very end of a station. Stationary kits are mostly placed in the center of the station which
facilitates a relative short walking distance on average if the demand points for parts in the kit
are spread over the entire station or agglomerate in the center. Surprisingly, this is not true for
long non-moving lines. In those cases, the central locations are mostly used for boxed-supply and
line stocking. This may be explained by a different constellation of kits as demands for parts in
the kits are higher (120 vs. 100). At the same time fewer parts are in the kit as part volumes are
almost twice the volume in comparison to a short line (0.0082 vs. 0.0049m3). Sequenced parts

Mixed-model assembly line feeding 85
seem to be spread quite equally in a flat U shape over all locations for moving lines, whereas
at non-moving lines sequenced parts are rather distributed in a V shape as central locations are
used for boxed-supply and line stocking.

86 Chapter 3
Figure
3.9
Usa
ge
of
rela
tive
loca
tion
for
diff
eren
tline
feed
ing
polici
es

Mixed-model assembly line feeding 87
Another interesting observation w.r.t. the positioning of sequenced parts can be made: In non-
moving lines, sequenced parts are positioned mostly in the center and fade slightly out towards
the sides. In moving lines in contrast, the center of the station seems to be the least favorable
position. This could be explained by the usage of those positions for boxed-supply which should
be positioned centrally. Moreover, they may contain parts for multiple operations throughout
the station.
Family versus part decisions
Based on Table 3.7 one can conclude that costs are not changing heavily when parts are assigned
to line feeding policies on a part level instead of a family level. This might be explained as only
relatively few families are supplied using multiple feeding policies and that splitting a family into
multiple policies requires additional space unless some parts in the family are box-supplied and
the others are line stocked. Out of 377,520 families (accumulated over all datasets and runs)
17,623 families are assigned to two and 409 to three different line feeding policies. No family
is assigned to more than three feeding policies. The following Figure reports which line feeding
policies are combined within one family if parts from a single family are assigned to multiple line
feeding policies. Overall, we conclude that feeding on a part level is not very beneficial and thus
not worthwhile to investigate further. However, future research should not neglect that families
consist of multiple parts, as this obviously has an impact on the feeding decisions taken.
Figure 3.10 Combinations of line feeding policies within a single family

88 Chapter 3
3.7 Discussion
3.7.1 Implication
With this research, we proposed a new state-of-the-art model for the assembly line feeding
problem. The model combines all line feeding policies in a single model which has not been done
yet so far. Furthermore, we allow multiple models to be produced on a single assembly line.
Therefore, this model increases the applicability of line feeding models in practice. Additionally,
we investigated the effect of different parameters that may be chosen in practice. Namely, the
allowance of space borrowing, the decision if parts of the same family can be fed differently, the
amount of available space and the decision if a line is moving at a constant pace or standing still.
The knowledge on these decisions provided in the preceding section should help to make better
decisions in practice but also to work on models incorporating even more decisions.
As shown in the Section 3.6.3, it is not very beneficial to make decisions on a part level. Therefore,
one might limit oneself to family-wise optimization in further research. This will drastically
improve the computation times of the model as adding VIs is sufficient to avoid a weak relaxation
of the model. Therefore, a restriction to a family level solution in future research allows the
incorporation of additional decisions as others may be neglected due to their minor effects.
By extending the scope of assembly line feeding to incorporate the decision on locating parts
along the line, we also increased the range of insights one obtains from solving the assembly line
feeding model. The model does not only take decisions for line feeding policy selection but also
determines the exact design of the border of line.
As all previous assembly line feeding models had more restricting assumptions or limitations
they all showed to be much easier to solve. With this work, however, we proposed a model
that is computationally more difficult to solve but also described an approach to improve the
solution process by adding cuts and performing preprocessing. Cuts that forbid sequencing of
multiple families at one location (see Equation (3.47)) can only be applied in models assigning
parts to discrete locations. The proposed cuts for stationary and traveling kitting (see Equations
(3.43)-(3.46)), however, are universally applicable whenever the concept of part families is used.
3.7.2 Limitations
The proposed model aims at integrating many aspects that are relevant for real world decision
making. Though this could be achieved in part, we still had to make limiting assumptions.
Even though we could realistically model most line feeding policies, we assumed traveling kits
to enter the assembly line at the beginning of a line and travel until the end. Although this is a
possible way of handling traveling kits, it is also possible to let traveling kits enter and leave at
random stations. Therefore, having multiple traveling kits for a single product is an option in
practice. This would have an impact on the costs for transporting traveling kits, since they had
to be provided in a (more expensive) milk run manner rather than just being transported to the
first station of the assembly line. Possibly, allowing multiple traveling kits per product would
lead to a higher percentage of parts being fed in traveling kits. It should be noted that allowing

Mixed-model assembly line feeding 89
traveling kits to enter and leave stations at any random point, will have a strong negative effect
on the problem’s solution quality in terms of LP-gaps.
As mentioned in Section 3.4, demand is assumed to be deterministic. Therefore, optimal solutions
obtained from this model do not give the optimal solution when demand differs strongly from
expectations. In order to give better solutions for assembly systems with heavily varying or
unpredictable demands, stochastic or robust optimization approaches could be applied to extend
this research.
One important aspect of the proposed model is the characteristic of variable space. As described
in Section 3.6, we assumed a size of 4m and 6.4m for the border of line of a station. Such
large stations are obviously not appropriate for the assembly of relatively small products such as
smartphones or TV’s. In those cases assembly stations are rather of the size of a table and small
racks may contain the assembly parts. Usually, walking does not play an important role in such
cases. Therefore, this model may be less suited for such assembly systems. However, using, e.g.,
Methods-Time Measurement (MTM) to measure times for grasping parts out of a rack versus
parts from a kit could be used to obtain data appropriate for this model. Though, we do not
preclude the possibility that further adjustments have to be done.
Finally, in this model some decisions like the position and number of storage areas and prepa-
ration areas are already taken in advance. The same is true for selection of vehicles and their
routing. One might refer to a fixed layout to describe this characteristic. When planning an
assembly system from scratch, these decisions may not have been taken in advance. In those
cases, a hierarchical or integrated decision making approach seems to be necessary.
3.8 Conclusion
3.8.1 Summary
Concluding this chapter, we proposed a linear IP model to understand and improve decision
making in assembly line feeding. The model includes four major novelties: (i) we included
five line feeding policies, i.e., line stocking, boxed-supply, sequencing, stationary and traveling
kitting. This has not been done so far (asides from the preliminary version of this chapter, see
Schmid et al. (2018)), although these policies are used in industrial production systems. (ii) we
introduced not only the decision on the assignment of parts to line feeding policies but also to
a discrete location along the line. By this we give a better understanding of the organization of
part storage along the line. Furthermore, we show that neglecting this decision may negatively
affect costs. (iii) decision making on the dimensioning of the assembly station, i.e., the available
space, in terms of locations, has been included as another decision to be made. This increases
flexibility and may be applied to reduce costs for assembly line feeding. (iv) Multiple models
being produced on a single assembly line have been integrated by deciding on the constellation
of kits for every individual model.
As commercial IP solvers were not able to solve this model in an efficient manner, a solving
framework exploiting cuts, either a priori (Cut & Branch) or on the fly (Branch & Cut) has been

90 Chapter 3
proposed to obtain optimal, or near optimal solutions. Furthermore, we created datasets based on
case study data to validate the proposed model and offer other researchers to use these datasets
for benchmarks2. Lastly, we investigated decision making by means of statistical analyses and
showed how part characteristics and facility decisions affect costs and policy selection.
3.8.2 Further research
As mentioned in Section 3.7.2, using this model requires to have all parameters and sets available
when the model is solved to determine optimal assembly line feeding. However, in reality some
aspects are not known up front with demand being the most unpredictable. Therefore, future
research should incorporate stochastic demand by using stochastic programming or robust opti-
mization approaches. Furthermore, we assumed operations in preparation and transport to be
done in a smart way. Therefore, we incorporated utilization rates for transportation as opera-
tions will not be done in a 100% optimal manner. To overcome such estimations, future research
may incorporate transportation or preparation planning in a more detailed manner by linking
the tactical nature of the problem with more operational aspects.
2The datasets can be downloaded from: www.opm.ugent.be/datasets.htm

4Optimizing kitting cells in mixed-model assembly
lines
“Details create the big picture.”
Sanford I. Weill

92 Chapter 4
4.1 Introduction
The production of highly customized products offered in various models, such as luxury cars,
requires an efficient parts provision system to feed assembly stations with the necessary parts at
the right time and place and in the right quantities. The production sequence on these lines is
arbitrary, and lot sizes are as small as one. Therefore, assembly workers require many different
parts. As we showed in the previous chapter, kitting line feeding policies are used in modern
production systems to enable this mass customization. As discussed above, kits are prepared in
kitting cells, which are replenished from the block storage and the flow rack area (see Figure 4.1
and Section 4.2).
While most research in this domain, such as the preceding chapter, has been conducted to study
which parts should be included in these kits. Contrarily, the operation of kitting cells has received
far less attention. Most research studies on kitting cells focus on human factors or technology-
related aspects such as pick-by-light support in kit preparation (Fager et al., 2019). However,
to the best of our knowledge, there has been no comprehensive study on optimizing the cells’
layout. Only Bortolini et al. (2020) investigated the design of a picking area integrated into a
warehouse. Although the preparation of kits resembles classical order picking, kit preparation
is more repetitive than order picking. In this study, we consider the kitting cell layout design
problem. Therefore, the objective is to minimize the cost of operating such cells while determining
their size, location of parts in the cell, and the load carriers used for replenishment. To this end,
a mixed-integer linear programming model will be developed and tested on a real-world dataset.
Our findings show that the application of such an approach may save manufacturers around 10%
of their costs.
The remainder of this chapter is organized as follows: First, we provide a better understanding
of the industrial setting in which kitting cells operate. Next, in Section 4.3, we review related
literature. Afterward, in Section 4.4, we propose a mixed-integer programming model to design
kitting cells and show cost calculations. The model is validated by applying it to a real-world
kitting cell and analyzing the results in Section 4.5. Finally, we discuss potential extensions of
our approach in Section 4.6.
4.2 Industrial setting
Kits serve different functional parts (e.g., bumpers, wing mirrors, and antennas) in several vari-
ants, defined by color, quality, etc., to one or multiple assembly stations. Stationary kits provide
parts to specific assembly stations. In contrast, traveling kits are serving multiple stations while
being attached to their dedicated product unit (e.g., car), and return to the kitting cell for re-
plenishment (see Figure 4.1). Kits serving the same (set of) assembly station(s) are prepared in
the same kitting cell. This cell is an area in which all parts required for kit preparation are stored
in limited quantities to be picked and loaded into a kit. Kitting cells do not entirely replace other
storage areas in the warehouse. They rather function as intermediate storage and picking area
that is replenished either directly from the warehouse (block storage area) or a flow rack area

Optimizing kitting cells in mixed-model assembly lines 93
Figure 4.1 Material flow
(see Figure 4.1). The former provides pallets, whereas the latter provides small boxes. Typically
a kitting cell is arranged in a U-shape layout to reduce space consumption and facilitate effective
picking (see Figure 4.2).
A kit can be a compartmentalized container or a mobile rack with compartments or hooks and
mountings to hold parts. Kits can either be transported manually or by automated guided
vehicles (AGVs) within the kitting cell. The kit moves along its path in the cell (or is pushed by
a worker) while being loaded with the assigned parts from the boxes temporarily stored in flow
racks or pallets. Loading is mostly performed manually, but efforts to automate these tasks by
robots are increasing. Once all parts are picked, the kit leaves the cell and is either placed in a
buffer zone or directly transported to the assembly line.
4.3 Related literature
The concept of kitting has been introduced in the 1990s (Bozer and McGinnis, 1992) and created
a stream of papers in the literature that aim to decide on the feeding of parts, i.e., whether parts
should be kitted, provided in full pallets, sequenced, or supplied Just-in-Time using smaller boxes
(see, e.g., Sali and Sahin (2016); Schmid et al. (2020)). Those studies usually have a broad scope
incorporating many aspects of assembly systems to assign each part of the assembly process to a
feeding policy. To this end, replenishing, preparation, transportation, investment, and usage costs
may be considered, with preparation costs covering the kitting activities. However, the exact
design of a kitting (or sequencing) cell is not discussed explicitly or simplified in these studies.
Limere et al. (2015), e.g., consider that walking times in a kitting cell may vary according to the
number of part variants in the cell. Similarly, Schmid et al. (2020) calculate walking distances
in a kitting cell as a function of the number of parts in a cell. However, the layout, feeding of
parts to the kitting cell, and walking efforts are not modeled. Therefore, providing additional

94 Chapter 4
insights into kitting cells’ design will provide a better understanding of these cells.
While the research on assembly line feeding simplifies the operation of kitting cells, other studies
investigate the operation of kitting cells in more detail (Hanson and Medbo, 2016b). Those
research efforts may be classified into three categories: (i) manual kitting; (ii) robotic kitting
and (iii) hybrid kitting. An example for hybrid kitting can be found in Boudella et al. (2018).
However, for the remainder of this study, we will focus on manual picking. For example, Brynzer
and Johansson (1995) measured the effects of geographical location, batch picking, and zoning
in picking areas on metrics such as walking distance and picking accuracy in manual picking
systems. Faccio et al. (2015) investigated the potential cost savings of batch picking. However,
batch picking is not always a feasible approach because in many environments, like our case
study, kits are too large to pick parts for multiple kits at a time. In another study, Hanson
and Medbo (2016b) investigated factors determining the efficiency of kitting cells by conducting
a cross-case analysis. They identified eight important design factors such as batch size, cell
size and layout, and part packaging types and sizes. More recently, there have been studies on
the effect of information systems. For example, Fager et al. (2019) developed an experimental
study to find how different support systems, such as pick-by-light or pick-by-paper, affect kit
preparation efficiency. Although all these studies focus on efficiency-influencing factors, the
problem of designing a kitting cell by minimizing material handling, equipment, and space costs
has rarely been addressed in the literature. Only a few recent studies have considered such cost-
based objectives. Examples are Caputo et al. (2020) who developed a descriptive cost model
to compare manual and hybrid kitting systems and Bortolini et al. (2020) who investigated the
warehouse design to support kitting activities. In their study, order picking is not separated but
conducted within the warehouse. A two-step procedure that first defines the layout and then
determines part placement is proposed and applied to a case study. The approach presented in
this study is differs from Bortolini et al. (2020) because kitting in the warehouse is not always a
feasible option due to long distances between the warehouse and the assembly line. Furthermore,
it is impossible to pick from block-stacking storage where pallets are stacked on top of one another
without racks.
4.4 Modeling approach
When designing a kitting cell, the definition of the flow within the cell determines its configu-
ration. Figure 4.2 shows an example of a U-shaped configuration, where the operator and the
traveling kit follow a reversed U. The dashed lines represent a selection of possible walking paths
for the picking operator and the kit, whereas the solid lines give specific examples of a kit’s path:
Returning depleted from the line at 1, traveling kits queue for a refill at 2. Once an operator
starts picking parts for a kit, it travels with the operator through the cell. When no more parts
further down the aisle are needed, the operator may take shortcuts (see an example at 3). Lastly,
the kit is dropped off at 4, from where it travels back to the assembly line, whereas the operator
goes back to 2 to pick up another empty kit. Figure 4.2 shows the effect of different layouts:
The cell may contain more large containers, shown in red, and thus be more spacious, as shown

Optimizing kitting cells in mixed-model assembly lines 95
in outcome 2. Contrary, increased use of small boxes (blue) results in smaller cells, as shown in
outcome 1.
1
2
3
4
1
2
3
4
Possible outcome 1 Possible outcome 2
Large containers
Small containers
Possible walking pathsExample of kit movement
Figure 4.2 Flow in design
In the following, we propose a mixed-integer programming model to design kitting cells with a
U-Shaped configuration. This model minimizes investments, space, and operational costs. The
operational cost includes the exact calculation of the operator’s walking distance within the cell.
To allow the optimization model to characterize the layout, we discretized the cell layouts into
locations (see Figure 4.3). The locations will be used in the model to decide on the storage
location of each part. We used historical data to simulate a large number (10,000) of demand
patterns for each kit. Each demand pattern includes the parts assigned to the kit and the total
daily demand of the kit. Of these demadn patterns, we selected a subset whose summed demand
equals the historic demand data and that have high probabilities to occur. These patterns are
used along with the parts’ locations to determine the total walking distance inside a cell per
demand pattern. The distance to fetch the part of the demand pattern being the farthest from
the entrance determines the walking distance. Similar to research on assembly line feeding,
a feeding method needs to be selected for each part. This feeding method defines whether a
part is delivered in large (e.g., containers or pallets) or small quantities (e.g., boxes and totes).
The notation used throughout this model is summarized in Table 1. This table only contains
the variables, sets, and parameters required for the optimization model. In Section 4.4.2, cost
calculations will be presented along with additional parameters.

96 Chapter 4
Table 4.1 Model notation
Sets
D Set of demand patterns I Set of parts
Id Set of parts in demand pattern d Ipl Set of parts for which policy p and lo-
cation l are feasible
F Set of possible extra locations needed
to store parts
L Set of locations
Lip Set of locations eligible to store part i
in policy p
Lr Set of locations in row r
Lr Set of locations that are inaccessible
when using row r
P Set of feeding policies, p = L for large
container such as a pallet, p = S for
small container such as a box
Pi Set of policies available for part i R Set of horizontal rows
Variables
Wd Walking distance for demand pattern d
Ul =
1, loc. l is used by adjacent loc.
0, otherwise
Ypl =
1, loc. l is used for policy p
0, otherwise
Xipl =
1, part i is fed to loc. l with pol. p
0, otherwise
Zr =
1, locations of row r may be used
0, otherwise
Parameters
cW Walking cost per meter cipl Cost of providing part i to location l by
policy p
cp Investment cost for equipment, e.g., a
flow rack, when using a location for pol-
icy p
cAr Space cost for the complete cell if row
r is used
dl Distance of location l from the starting
point (walking back and forth)
fi Number of additional locations re-
quired, when part i is stored in a large
container. fi ∈ Z+0
M A sufficiently large number sip Space required for feeding part i using
policy p: Equals 1 for large and (box-
width · box-height) for small containers
sp Location space for policy p: Equals 1
for large and (rack-width · rack height)
for small containers
λd Demand for traveling kit with demand
pattern d

Optimizing kitting cells in mixed-model assembly lines 97
4.4.1 Optimization model
Minimize: ∑i∈I
∑p∈Pi
∑l∈Lip
ciplXipl +∑d∈D
cWλdWd +∑p∈P
∑l∈L
cpYpl +∑r∈R
cAr Zr (4.1)
subject to: ∑p∈Pi
∑l∈Lip
Xipl = 1 ∀i ∈ I (4.2)
∑p∈Pi
∑l∈Lip
dlXipl ≤Wd ∀d ∈ D ∀i ∈ Id (4.3)
∑i∈Ipl
Xipl ≤MYpl ∀p ∈ P ∀l ∈ L (4.4)
∑i∈I
∑p∈Pi
∑l∈Lr∩Lip
Xipl ≤MZr ∀r ∈ R (4.5)
∑r∈R
Zr = 1 (4.6)∑i∈I
∑p∈Pi
∑l∈Lr∩Lip
Xipl ≤M(1− Zr) ∀r ∈ R (4.7)
∑i∈Ipl
sipXipl ≤ sp ∀p ∈ P ∀l ∈ L (4.8)
∑i∈ILl:fi≤f
XiLl ≤ Ul′ ∀l ∈ L ∀f ∈ F ∀l′
∈L : l − f ≤ l′ < l (4.9)∑p∈P
Ypl + Ul ≤ 1 ∀l ∈ L (4.10)
Wd ≥ 0 ∀d ∈ D (4.11)
Ypl ∈ 0, 1 ∀p ∈ P ∀l ∈ L (4.12)
Xipl ∈ 0, 1 ∀i ∈ I ∀p ∈ Pi∀l ∈ Lip (4.13)
Ul ∈ 0, 1 ∀l ∈ L (4.14)
The objective function (4.1) minimizes total cost, which includes replenishment costs (cipl),
walking costs (cw), investment costs (cp), and space costs (cAp ). Constraint (4.2) is a classical
assignment constraint, ensuring that every part is assigned to a feeding policy and a location. As
mentioned above, walking distances for all demand patterns d are calculated as the maximum
distance for that demand pattern in Constraint (4.3). Next, the assignment of parts to a location
is linked to Ypl in Constraint (4.4) with the big-M being set to |Ipl|. Variable Ypl indicates if
location l is used for policy p. A kitting cell’s size is determined by its length since its width is

98 Chapter 4
predetermined. Therefore, the use of the last horizontal set of locations is described as using a
horizontal row. Three out of eleven possible rows are depicted in Figure 4.3. Constraint (4.5)
links the assignment of parts to locations belonging to row r with the indicator variable Zr with
the big-M value being set to |I|. This variable determines the cell’s length as only one row
can be selected as the last row (see Constraint (4.6)). Only one row can be used as, e.g., the
use of row 3 makes the use of locations in other rows such as 26 impossible (see Figure 4.3).
Furthermore, using row 3 makes other locations such as 3, 4, 13, and 14 inaccessible. This is
ensured in Constraint (4.7).
1
2
3
4
5
6
7
8
9
10
11
12
13
14
15
16
17
18
19
20
21 22 23 24
25 26 27 28
29 30 31 32
Row 3
Row 7
Row 11
Figure 4.3 Using rows to define a cell’s length
Lastly, it is ensured that each location’s capacity is not exceeded (Constraints (4.8), (4.9), and
(4.10)). In case boxes are assigned to a location, a rack is used to store them. Such a rack
consists of several shelves, available for storing boxes, and one shelve to return empty boxes.
The available space of a rack is determined by the size of its facing sS , calculated by the product
of the storage shelves’ width and height (see Figure 4.4). It may further be adjusted by a
utilization degree. When storing a pallet, both the available space and the space requirement
are set equal to one since one location has exactly the capacity to fit one pallet. However, if a
pallet of a part is exceptionally large, adjacent locations may be used to fit this pallet as well.
This is indicated by the binary variable Ul, which is introduced in Constraint (4.9). To clarify
this constraint, consider the following example: Assume a large container of part A occupies
three locations. Thus, assigning it to location 24 (see Figure (4.3)) requires locations 22 and
23 to be used for this part as well. The parameter fi for this part is set to 2, showing it needs
two additional locations. Hence, Constraint (4.9) ensures that U22 = U23 = 1. Simultaneously,
assigning such a part to location 11 is avoided by the definition of the set Lip. Lastly, Constraint
(4.10) prevents assigning a location to more than one feeding policy. Constraints (4.11)-(4.14)
define the variable domains.

Optimizing kitting cells in mixed-model assembly lines 99
Location l
Ava
il.
space
Figure 4.4 Front view of a rack used for smaller containers
4.4.2 Cost calculation
Cost elements can be split into three major aspects: Investment, space, and operational costs.
Table 4.2 presents the notation used for deriving the cost functions.
Table 4.2 Parameters used for cost calculations
Parameter
b Width of a location
cIF Investment costs for a forklift [$/h]
cIT Investment costs for a tow train [$/h]
cOF Labour cost for a forklift operator [$/h]
cOT Labour cost for a tow train operator [$/h]
cA Space cost [$/m2]
cO Labour cost for a picking operator [$/h]
d Fixed traveling distance for a tow train in the warehouse
d Average distance between two drop-offs
dil Transportation distance to deliver part i to location l
dP Distance from warehouse to flow rack area
dT Length of a tow train tour
dr Depth of kitting cell when using row r
nip Quantity of part i when delivered using line feeding policy p
sip Space of a container used for delivering part i in policy p
sT Available space in the tow train
sA Additional space needed for traveling in the preparation area
s Average space required to store a box
tHF Pick up & drop off time for forklift transportation
tHT Pick up & drop off time for tow train transportation
tB Time to load and couple tow train wagons
vF Velocity of a forklift
vO Walking velocity of an operator
vT Velocity of a tow train
w Width of a kitting cell
λi Demand of part i
ηF Fill rate of a forklift
ηT Fill rate of a tow
εF Utilization rate of a Forklift
εT Utilization rate of a tow
As shown in the previous section, costs incorporated in the model are combined in the parameters
cipl, cW , cAr , and cp. Clearly, cp contains equipment investments costs only. Similarly, cAr and
cW exclusively contain space and picking costs, respectively. The former can be calculated based
on the depth and the width of a kitting cell with row r plus some additional space sA allowance
to permit logistics to and from the cell.
cAr = (dr + sA)(w + sA)cA ∀r ∈ R (4.15)

100 Chapter 4
The operator’s velocity and wage determine the latter.
cW = cO/vO (4.16)
In contrast, cipl, contains both vehicle investment and operator costs and constitutes replenish-
ment costs.
Replenishment costs consist of operator costs for driving vehicles or carrying parts and vehicle
cost. For replenishment of large containers, forklifts are used, and costs are calculated based on
a part’s demand λi and the number of parts in a large container niL. The outcome is combined
with the transportation distance dil, the vehicle velocity vF , and its fill rate ηF . Furthermore,
handling times tHF are considered. Before multiplying this with the investment cost cIF and the
operator costs cOF , one might consider the average forklift utilization rate εF . Combining this
data leads to Equation (4.17).
ciLl =λiniL
(2dilvF ηF
+ tHF )εF (cIF + cOF ) ∀i ∈ I ∀l ∈ LiL (4.17)
ciSl =λiniL
(2dP
vF ηF+ tHF )εF (cIF + cOF )+
λisiSniSsT
(dT
vT ηT+ tHT + tB)εT (cIT + cOT ) ∀i ∈ I ∀l ∈ LiS (4.18)
dT =sT
sd+ d (4.19)
The cost for feeding parts in small containers is calculated similarly. However, parts need to be
transported with a tow train and, additionally, need to be replenished to the flow rack area by
forklift (see Figure 4.1). Therefore, part of the transportation is done by forklift and another
part by tow trains. Furthermore, the time to couple the wagons of a tow train tB needs to be
considered. The length of a trip is estimated based on the distance between different drop-offs
and the average amount of boxes that can be transported by a train (see Equation (4.19)). Thus,
replenishment costs for small containers are a combination of operational and investment costs
for forklifts and tow trains (see Equation (4.18)).
4.5 Computational study
To validate the model, we use real-world data from an automobile Original Equipment Manu-
facturer (OEM) and evaluate the proposed optimization model by comparing various heuristic
approaches based on the well-known ABC classification (see below).
The cell to be designed is used to prepare traveling kits feeding parts to multiple assembly line
stations and consists of 77 parts, clustered into 59 part families. Costs are calculated for a
representative day, i.e., for the preparation of 735 kits. Investment and space costs are adjusted
to the same time horizon. We assumed 200 different demand patterns.
The model is implemented in Python and solved by Gurobi 9.0 on a laptop computer with an

Optimizing kitting cells in mixed-model assembly lines 101
AMD EPYC processor (2.5 GHz, 2 processors) and 230 GB of RAM. All results are optimal
and have been obtained within a maximum of eleven hours of computation time (the exact
computation times are reported in Table 4.3).
4.5.1 Setting
The baseline approach in this analysis is the solution obtained by the optimization model. This
solution is compared with solutions obtained from heuristic approaches, where parts are grouped
into different classes based on the well-known and widely-used ABC-classification (see, e.g.,
Caputo and Pelagagge (2008, 2011)). We clustered all parts in the kitting cell into three groups
based on their demand as follows:
• A: Parts with high demand accounting for 70% of overall demand (22.1% of parts).
• B: Parts with medium demand accounting for 20% of overall demand (27.3% of parts).
• C: Parts with low demand accounting for the remaining 10% of overall demand (50.6% of
parts).
We distinguish two levels of heuristic approaches: pure heuristic approaches (P1-P4) and hybrid
heuristic approaches (H1-H4). No optimization model is used for pure heuristics (P1-P4), but all
decisions, namely the feeding policy (pallet or box) and part location (therefore also investment
and cell size) are determined heuristically. In contrast, the hybrid heuristic approaches use the
optimization model to determine the parts placement but pre-assigns them to a feeding policy
based on their demand. With this, we aim to validate the results obtained by the optimization
model by comparing it to a simple to implement approach as it may occur in practice.
When pre-assigning the feeding policy, we use the classes derived from the ABC classification.
This approach is motivated by the intuition that delivering pallets is cheaper than delivering
boxes and that parts that are used often should therefore be delivered in pallets. However, it is
unknown to which feeding policy each group should be assigned, we tested multiple combinations
as described in the following enumeration while parts that are too large to fit into a box are
exempted from the policies described and stored in pallets instead.
• P-1: All parts in boxes, HDCE.
• P-2: A-parts in pallets, others in boxes, HDCE.
• P-3: A- and B-parts in pallets, C-parts in boxes, HDCE.
• P-4: All parts in pallets, HDCE.
When applying pure heuristic approaches, we also determine the parts’ locations in the cell
heuristically. For this, we propose a “higher demand, closer to the entrance” principle (HDCE).
As many kits will use a lot of parts with high demand it is most intuitive to place those parts at
the beginning of the kitting cell and parts with lower demand towards the end since an operator

102 Chapter 4
does not need to walk all the way to the end of the cell once she picked all parts required.
Therefore, this approach aims at reducing the traveling distance of the picker inside the cell.
In contrast, hybrid heuristics only determine the feeding policy heuristically, whereas the model
optimizes the parts’ locations. Again, four scenarios are compared:
• H-1: Optimizing location, all parts in boxes.
• H-2: Optimizing location, A-parts in pallets, others in boxes.
• H-3: Optimizing location, A- and B-parts in pallets and C-parts in boxes.
• H-4: Optimizing location, all parts in pallets.
4.5.2 Results
Table 4.3 presents the results of designing the cell for each scenario. Pallet pct. shows the
proportion of parts delivered in pallets (remaining parts are delivered in boxes). It also presents
replenishment (operational and investments), area, picking, and total costs. The racks’ invest-
ment costs were not included as they are close to zero. The table also shows the additional cost
imposed by each heuristic compared to the optimization model (Opt).
Table 4.3 Results of the partial level heuristics
time Pallet RC. AC PC TC Incr.(s) pct.(%) ($) ($) ($) ($) (%)
Opt. 38734 61.4 577 130 147 854 -P-1 3 46.8 745 119 81 945 10.66P-2 3 55.4 717 130 94 941 10.19P-3 3 70.1 655 148 117 920 7.72P-4 3 100.0 609 180 136 925 8.31H-1 147 46.8 686 119 128 933 9.25H-2 643 55.4 656 130 132 908 6.32H-3 892 70.1 579 148 147 874 2.34H-4 573 100.0 499 180 198 873 2.22
As Table 4.3 shows, the optimization model outperforms all heuristics approaches. On average,
the solution obtained by the optimization model is 9.22% cheaper than those obtained by heuristic
approaches. Even though the use of hybrid heuristics, which use part of our optimization model
for part location assignment inside a cell, narrows this gap, the optimization model is on average
still 5.03% cheaper.
Providing more parts in pallets results in a larger cell, which results in higher space and picking
costs but lower replenishment costs. However, there seems to be no easy decision rule for the
feeding policy assignment. Furthermore, our results indicate that part location within the cell
has a large effect on the overall costs. The importance of part placement can be inferred from
comparing purely heuristic approaches with hybrid heuristics. While pure heuristics locate parts
heuristically, hybrid heuristics place them optimally, leading to an average cost reduction of
3.98% while retaining all other decisions. Therefore, part placement may be relatively more
important than feeding policy assignment (e.g., comparing P-4 and H-4).

Optimizing kitting cells in mixed-model assembly lines 103
4.6 Future research
With this study, we provided a novel way to improve the efficiency of kitting cell operations. A
new optimization model was proposed and applied to a real-world industrial setting. To evaluate
the performance of the proposed model, we compared it with a variety of heuristic approaches.
Our experimental analyses showed that the optimization model reduces the total cost by 7-10%
for pure heuristics and 2-9% compared to hybrid heuristics, which use part of our optimization
model for part location assignment inside a cell. Clearly, a comparison with other heuristics may
be value as well. For example, one may investigate the use of the XYZ-classification (classifying
goods based on their physical properties) to determine line feeding policies. Although the results
reported above are auspicious, it is essential to test this approach for various kitting cells as
our study is limited to the automotive industry. While parts in our case study are relatively
large, it will be interesting to investigate smaller parts, such as parts in an electronics assembly
line. Developing a solution approach that improves the optimization model’s computational
performance is another promising direction for future research that enables solving problems
with a larger number of demand patterns, part families, and part variants. Lastly, it might
be worthwhile to investigate how this study can be adapted to match hybrid or robotic kitting
operations.


5The impact of spatial considerations on assembly
line efficiency
“You can’t look at the competition and say you’re going to do it
better. You have to look at the competition and say you’re going to
do it differently.”
Steve Jobs

106 Chapter 5
5.1 Introduction
The assembly line balancing problem (ALBP) has long been of interest in scholarship after being
defined in the 1950s (Salveson, 1955). The problem concerns the assignment of a set of tasks
I to assembly stations K. In ALBPs, directed acyclic graphs connect different tasks, indicating
precedence relations. Precedence relations describe that some tasks may require that other tasks,
so-called predecessors, are performed beforehand. Figure 5.1 illustrates such a precedence graph.
The nodes represent tasks, and the (directed) arcs represent precedence relations. The numbers
atop the nodes represent time and space requirements, and the colored boxes symbolize four
stations as a possible solution.
1
2
3
4
5
6
7 8
11/2
17/1
9/4
5/3
8/2
12/1
10/3 3/5
Figure 5.1 Precedence graph of assembly tasks described in Bowman (1960)
Baybars (1986) classifies ALBPs into simple assembly line balancing problems (SALBPs) and
generalized assembly line balancing problems (GALBPs). The former consider just time and
precedence restrictions. In contrast, the latter consider additional aspects of practical relevance,
such as task complexity (Zeltzer et al., 2017) or assembly lines with operators on both sides
(Kucukkoc and Zhang, 2015). Typical objectives in SALBP include the minimization of the
number of stations or the cycle time (i.e., the maximum time across all stations required to
process all tasks assigned to any station). When minimizing the number of stations m, one
usually predetermines the cycle time c as a parameter. This problem is referred to as SALBP-1.
Complementarily, when minimizing the cycle time, the number of stations is often given as an
input parameter, which is referred to as SALBP-2. In SALBP-Es, both the cycle time and the
number of stations are unknown. In SALBP-E, the product of cycle time and the number of
stations, also known as line capacity, is minimized. Minimizing line capacity is analogous to
maximizing the efficiency (thus E) and minimizing idle times across all stations. Attempts to
solve this more complex problem have hitherto been scarce (see, e.g., Corominas et al. (2016);
Esmaeilbeigi et al. (2015); Wei and Chao (2011)).
This chapter’s contribution is manifold: We are the first to tackle the SALBP-E problem with
space considerations that much better resemble real-world problems. This extension has its
roots in industrial requirements (Bautista and Pereira, 2007) but is also particularly relevant
to SALBP-E since, according to Zacharia and Nearchou (2013), it allows the introduction of
meaningful bounds on the number of stations. Next, we propose a new constraint programming
algorithm to solve both the classical SALBP-E and the time- and space-constrained ALBP that

Optimization procedures for TSALBP-1/2 107
maximizes efficiency (called TSALBP-1/2). Finally, we use these algorithms to assess the impact
of spatial considerations on assembly line balancing efficiency. For rigorous testing, we created
new datasets and compared the results for the space-constrained to the unconstrained problem.
Following a brief literature review, we first show important bound calculations in Section 5.3.
In Section 5.4, we show how the problem can be approached from an algorithmic perspective
before conducting computational experiments. Finally, a brief summary and recommendations
for future research are given.
5.2 Literature review
A little over a decade ago, Bautista and Pereira (2007) introduced a new class of GALBP:
TSALBPs in which each task has both a temporal and a spatial requirement. To classify the
variants of this GALBP, Bautista and Pereira (2007) proposed an extended scheme to classify
the variants of this GALBP (see Table 5.1). Subsequently, Scholl et al. (2010) proposed a
new class, called assignment-restricted assembly line balancing problems (ARALBPs), under
which TSALBPs may also be subsumed. Since their introduction, TSALBPs have been studied
intensively (see, e.g., Bautista and Pereira (2011); Chica et al. (2016); Sternatz (2014)) with
varying objectives. Most papers have focused on the minimization of cycle time, the number of
stations, or multiple objectives, such as number of stations and space minimization. However, no
research has yet been carried out with respect to the optimization of TSALBP-1/2, which would
optimize line efficiency similar to the SALBP-E problem, where 1/2 stands for the simultaneous
optimization of objectives and 1 and 2 are the number of stations and cycle time, respectively.
This is surprising since, e.g., Zacharia and Nearchou (2013) point out that, especially in SALBP-
E, a lower bound on the number of stations may arise from space restrictions, justifying the
extension to TSALBP-1/2. As the problem is part of the TSALBP class it considers the parts’
spatial requirements and the stations’ spatial availability. The amount of available space per
station is assumed to be equal for all stations, since equally sized stations allow greater flexibility
than unequally sized stations when reorganizing the assembly line. As an example, we may
assume an assembly line consisting of several stations that differ with respect to size. This may
have implications for equipment, such as conveyers or tools. Thus, when introducing a new
product that might also require the same number of stations but in different sizes, the process of
restructuring will be more complicated, since tools and conveyors will likely have to be replaced.
Therefore, specifically tailored assembly lines are less desirable. If one allows for stations of
different sizes, it is sufficient to solve the simple ALBP and adjust the stations’ sizes accordingly,
since one would just obtain an optimal line balance with respect to (w.r.t.) task times and the
stations could be sized to meet spatial requirements.
According to our literature review, the first approach to solving line balancing problems, by
determining cycle time and number of stations, was developed by Rosenblatt and Carlson (1985).
However, the objective was not to minimize the idle time/line capacity but to maximize profits by
first determining the number of stations and then minimizing cycle time. The first approach to
minimizing line capacity, however, was proposed by Plans and Corominas (1999) by providing a

108 Chapter 5
Table 5.1 Types of TSALBP (Bautista and Pereira, 2007)
Problem name Stations Cycle time Space Type
TSALBP-F Given Given Given FeasibilityTSALBP-1 Minimize Given Given Single-objectiveTSALBP-2 Given Minimize Given Single-objectiveTSALBP-3 Given Given Minimize Single-objectiveTSALBP-1/2 Minimize Minimize Given Multi-objectiveTSALBP-1/3 Minimize Given Minimize Multi-objectiveTSALBP-2/3 Given Minimize Minimize Multi-objectiveTSALBP-1/2/3 Minimize Minimize Minimize Multi-objective
mixed-integer linear programming (MILP) formulation. In addition, a fix-and-relax heuristic was
also proposed. This work was followed by Wei and Chao (2011), who proposed a two-step solution
methodology, solving SALBP-2 multiple times for every possible number of stations. Some errors
in Wei and Chao’s paper were corrected by Garcıa-Villoria and Pastor (2013). Gurevsky et al.
(2012) analyzed SALBP-E solutions while considering task time variations. Various proofs on the
stability of solutions were given and tested based on the outcome of heuristic procedures. Zacharia
and Nearchou (2013) also approached the SALBP-E with uncertain (i.e., fuzzy) assembly times
and proposed a genetic algorithm.
Esmaeilbeigi et al. (2015) approached the SALBP-E by linearizing the objective in a way that
allowed a direct solution approach with a linear MIP formulation. Furthermore, they extended
some of Wei and Chao’s (2011) ideas by not only eliminating variables that could not be used but
also by adding valid inequalities that dynamically restricted the assignment of tasks to stations.
Precedence constraints were also modeled differently using auxiliary variables. We derive our
model from this approach. Corominas et al. (2016) proposed various methodologies for solving
SALBP-E, either based on a different linearized MILP formulation or by extending the two-step
procedure proposed by Wei and Chao (2011), which heuristically solves SALBP-2 repeatedly.
For this, cycle time and number of stations are linked to the corresponding best possible line
efficiency and an upper bound on cycle time. Most recently, Cerqueus and Delorme (2019)
proposed a branch-and-bound algorithm to solve SALBP-E by creating the Pareto front.
5.3 Bounds and solution space
As the special cases of ALBPs such as SALBP-F are known to be NP-hard (Alvarez-Miranda
and Pereira, 2019; Garey and Johnson, 1979), SALBP-E and TSALBP-1/2 are also NP-hard.
This is also evident when considering the k-partitioning problem, which does not have precedence
constraints and therefore is a special case of SALBP-E (Korf, 2009). To improve the solvability of
this hard problem, however, some bounding techniques are proposed. This will help to improve
solution times as it allows the search space to be significantly diminished. It will also help
to clarify the approaches described later in the chapter. The notation used in this section is
explained when used but also summarized at the start of the next section. First, in Subsection
5.3.1, we propose bounds based on traditional bounding techniques proposed for SALBP-1 or

Optimization procedures for TSALBP-1/2 109
SALBP-2, and adjust them to fit both the SALBP-E and TSALBP-1/2. We also derive new
bounds for the TSALBP-1/2. Next, in Subsection 5.3.2, we present some greedy heuristics that
can be used to easily find solutions for both the SALBP-E and TSALBP-1/2. In Subsection
5.3.3, we show how the results of greedy heuristics can be used to improve previous bounds.
Finally, we show how those bounds can be used to define the earliest and latest stations for every
task. This reduces the number of decision variables in the mathematical programming model
and their domains in the constraint programming model.
5.3.1 Baseline bounds
For the TSALBP-1/2 as well as the SALBP-E, three types of bounds can be distinguished: (i)
upper and lower bounds on the number of stations, (ii) upper and lower bounds on cycle time,
and finally (iii) upper and lower bounds on idle time (i.e., the objective value). The former two
are discussed below. Bounds on the idle time follow indirectly from the combination of those
bounds.
Bounds on the number of stations
When solving instances of SALBP-E, bounds on the number of stations are usually given exter-
nally (denoted as me or me), as in Scholl’s (1993) dataset. However, extended to TSALBP-1/2,
one can state, more generally
m = min|I|,me (5.1)
m = max⌈ tsumce
⌉,⌈asum
A
⌉,me (5.2)
The lower bound calculation for the SALBP-E can only be performed if a certain cycle time is
assumed. Thus, for SALBP-E, either an upper bound on the cycle time ce or a lower bound
on the number of stations must be given externally. For TSALBP-1/2, however, the additional
information on space requirements ai and availability of space per station A allows the calculation
of a lower bound without imposing any external knowledge. Thus, more realistic lower bounds
on the number of stations can be obtained by the extension of the problem.
Cycle time bounds
Cycle time bounds may either be given externally (denoted by ce or ce), as discussed above, or
may be calculated based on the number of stations and the sum of all task times tsum. Since
the final number of stations is known neither for TSALBP-1/2 nor for SALBP-E, the upper
bound on the number of stations must be used (see Equation (5.4)) (Corominas et al., 2016).
Nevertheless, it is also possible to calculate an upper bound on the cycle time for each station
individually (see Equation (5.5)). This assumes that the station index is equal to the number of
stations in the solution.
c1 = mintsum, ce (5.3)

110 Chapter 5
c1 = max⌈ tsumm
⌉, tmax, ce (5.4)
ck1 = max⌈ tsum
k
⌉, tmax, ce (5.5)
To improve the weak upper bound in (5.3), the bound proposed by Coffman et al. (1978) may
be used. This bound for parallel machine scheduling problems with makespan minimization was
adapted by Hackman et al. (1989) for the SALBP-2 problem and reformulated by Klein and
Scholl (1995) as follows: maxtmax, 2btsum/mc. We adjusted this for SALBP-E using the lower
bound on the number of stations to obtain
c2 = maxtmax, 2btsum/mc (5.6)
However, this upper bound is only valid for SALBP-E. For any other resource-constrained ALBP
(see Scholl et al. (2010) for examples of those problems), this may not hold. A proof by con-
tradiction is given in Appendix A of this thesis. Therefore, we propose three new methods to
calculate this bound for TSALBP-1/2. These are also applicable to other ALBPs with similar
resource constraints:
Theorem 5.3.1. Without loss of generality (w.l.o.g.), assume that the set of tasks is ordered
such that ti ≥ ti+1... Let I denote the set of tasks and K be the set of stations. The upper
bound on cycle time for the space constrained problem can be written as cI2 =∑i=|I|−m+1i=1 ti for
TSALBP-2 (here: m = |K|) and TSALBP-1/2.
Proof. W.l.o.g., we assume that ai ≤ A ∀i ∈ I, as no solution could be found otherwise. For the
base case, assume |K| = |I|. Here, the upper bound of cycle time is equal to the maximum task
time as each task can be trivially assigned to a station. For induction, consider that, |K| = |I|−1.
Thus, two tasks must be assigned to a single station, which may increase the cycle time. However,
the worst case would be the combination of the two tasks with the highest task times. Inductive
reasoning indicates that this holds for every subsequent case where |K| is reduced by one.
Theorem 5.3.2. Let k be the number of stations for which an upper bound is desired in the
TSALBP-1/2 problem. The upper bound on cycle time for the space constrained problem can be
written as ck2 = btmax|I|/kc. Note that this is only true if m ≥ |I. For k = m, we obtain the
overall upper bound cII2 on the cycle time.
Proof. W.l.o.g., we assume that ai ≤ A ∀i ∈ I, as no solution could be found otherwise. A
trivial solution to the problem is to assign every task to a single station. Thus, the idle time of
this solution is tmax|I|− tsum. Therefore, no optimal solution can have a higher idle time. Thus,
we can generally state ck2k − tsum ≤ tmax|I| − tsum, which is equal to: cII2 k ≤ tmax|I|, and
ck2 ≤ tmax|I|/k. W.l.o.g., we can assume that all task times are integers; thus, the right-hand
side can be rounded down if not integral.
Corollary 5.3.3. W.l.o.g., assume that the set of tasks is ordered such that ti ≥ ti+1.... Let
k be the lower bound on the number of stations. If an external limitation on the number of

Optimization procedures for TSALBP-1/2 111
stations exists, the upper bound on cycle time for the space-constrained problem can be written
as cI2 = b∑i=|I|−k+1i=1 ti|I|/kc .
Proof. Follows from theorems 1 and 2.
Theorem 5.3.4. W.l.o.g., assume that the set of tasks is ordered such that t1/a1 ≥ t2/a2 ≥... ≥ t|I|/a|I|. Furthermore, let l ∈ I :
∑l−1i=1 ai < A ∧
∑li=1 ai ≥ A and r = al/(A −
∑l−1i=1 ai).
Then, the upper bound on cycle time cIII2 for TSALBP-2, and TSALBP-1/2 can be calculated
as rtl +∑i=l−1i=1 ti.
Proof. Assume that a bound of cIII2 is calculated. Assume for contradiction that the optimal
solution has cycle time c : c > cIII2 . Let I ′ denote the set of tasks with index being at most
l. In this case, it must hold that∑i∈I′ ti > rtl +
∑i=l−1i=1 ti and
∑i∈I′ ai ≤ A. Therefore,∑
i∈I′ ti/ai >∑i=li=1 ti/ai. Clearly, this contradicts the definition of l and the ordered set of
tasks.
Remark: Clearly, the calculations for the upper and lower bounds of the cycle time can be
performed for every possible number of stations, similar to the lower bound in Equation (5.5),
as already discussed by Corominas et al. (2016). For example, one could obtain ck = 10 and
ck+1 = 8. The station index refers to a solution that has k or k + 1 stations.
5.3.2 Finding greedy solutions
As the upper bounds on cycle time may still be relatively high, we propose to use greedy heuristics
to improve them. First, a feasible solution must be found by the heuristic. From this solution,
we can deduct a better upper bound on the cycle time (explained in greater detail in the next
subsection). The greedy heuristic is executed for every possible number of stations, i.e., m ≤k ≤ m. In every execution, the cycle time is assumed to be equal to the corresponding lower
bound ck. The procedure begins with all tasks that have no predecessors. From these tasks, one
is selected based on a decision criterion and assigned to the first station. In case of a tie, the task
with the lowest index is assigned. While space and time remain, tasks are continually assigned
to that station. Whenever a task is assigned, all successors j are tested for eligibility and are
added to the set of eligible tasks if all predecessors of that task j have already been assigned. If
no more tasks can be assigned, a new station is opened and the procedure is repeated. When
all tasks have been assigned, it is necessary to verify whether the number of stations is equal
to the number of stations for which one wishes to obtain a solution. If this is not the case, the
solution is infeasible. In such cases, cycle time is increased and the execution is restarted. This
is reiterated until a feasible solution has been found or the tested cycle time exceeds the upper
bound on the cycle time.
We implemented and compared various selection criteria: 1. the task with the lowest index
(FIFO); 2. the task with the highest index (LIFO); 3. the task with the longest processing
time (LPT); 4. the task with the shortest processing time (SPT); 5. the task with the most
successors; 6. the task with the fewest successors; 7. the task with the highest value of the

112 Chapter 5
number of successors multiplied by the processing time, |Si|ti; 8. the task with the lowest value
of the number of successors multiplied by the processing time, |Si|ti; 9. the task with the longest
tail (i.e., the sum of all successors’ task times), and 10. the task with the shortest tail. These ten
selection rules can be applied to SALBP-E as well as TSALBP-1/2. Furthermore, we propose
several selection criteria that are only applicable to TSALBP-1/2: 11. the task with the largest
spatial requirement is added first; 12. the task with the smallest spatial requirement is added
first; 13. the task with the highest value for tiai is added first, and 14. the task with the lowest
value for tiai is added first.
Every incumbent feasible solution provides an upper bound on the objective function (i.e., the
idle time I). The lowest value across all solutions is saved. A pseudo-algorithm for the greedy
heuristic is given in Algorithm 2.
Algorithm 2 Greedy algorithm to create feasible solutions
1: procedure Task assignment2: for m ≤ k ≤ m do3: c = ck4: SolutionFound=false5: while SolutionFound==false ∧ c ≤ ck do6: EligibleTasks = ∅7: AssignedTasks = ∅8: for i ∈ I : |Pi| = 0 do9: EligibleTasks = EligibleTasks ∪ i
10: for k′ ∈ K : k′ ≤ k do11: Current station time st = 012: Current station space ss = 013: StationOpen=true14: while StationOpen == true do15: select task i s.t. ti + st ≤ c ∧ ai + ss ≤ A16: if task selected then17: st = st+ ti18: ss = ss+ ai19: AssignedTasks = AssignedTasks ∪ i20: EligibleTasks = EligibleTasks \ i21: for j ∈ I : j ∈ Si do22: if PredecessorTasks(j) ⊆ AssignedTasks then23: EligibleTasks = EligibleTasks ∪ j24: else25: StationOpen = false
26: if |EligibleTasks| == 0 then27: SolutionFound=true28: break29: if k′ == k then30: c = c+ 1
5.3.3 Bound improvement
Both the rigorous application of the bounding rules described above and the greedy heuristic
allow the improvement of bounds for cycle time and the number of stations.

Optimization procedures for TSALBP-1/2 113
Improving cycle time bounds
As Corominas et al. (2016) demonstrated, it is possible to use the idle time of a previous solution
to a SALBP-2 problem to obtain an upper bound on the cycle time for a different number of
stations when solving SALBP-2 iteratively to obtain a solution for SALBP-E. However, this can
also be done a priori. As shown in Equation (5.7), a cycle time bound can be calculated for each
station, assuming that the station index is equal to the number of stations used. Then, for every
possible number of stations m, the upper bound on idle time can be calculated by I = ckk−tsum.
The minimum of these values gives an upper bound on the objective function. Therefore, the
upper bounds ck can be further decreased such that ckk − tsum is I at most.
A similar approach is used when a greedy heuristic finds a solution with value I.
ck = argminc∈Z+:(c+1)k−tsum>I
ck − tsum ∀k ∈ K : k ≥ m (5.7)
This upper bound is equal to the cycle time for which the realizable idle time is at most the
solution obtained from any greedy heuristic. By selecting the maximum of these upper bounds
across all stations, the overall upper bound on cycle time may also be improved:
c3 = maxk∈K:m≤k≤m
ck (5.8)
Therefore, cycle time can be restricted to the lowest bound identified, as described by Equations
(5.9) and (5.10) for SALBP-E and TSALBP-1/2, respectively.
c = minc1, c2, c3 (5.9)
c = minc1, cI2, cII2 , cIII2 , c3 (5.10)
Improving station bounds
After the cycle time bounds have been calculated for all stations, as described in (5.7), one
knows that every number of stations will provide a feasible solution, provided that the cycle
time is sufficiently high. Now, one can calculate the maximum idle time Ik for every station as
Ik = ckk − tsum for each station. The minimum of these numbers I = mink∈K
Ik can in turn be
used to improve the upper bounds on the number of stations:
m = mink∈K:kck−tsum>I
k (5.11)
5.3.4 Calculating earliest and latest station
Given the precedence information, it is clear that every task can only be assigned to a station later
than or equal to the stations of its predecessors (as shown in the example of Figure 5.1). This
information can be combined with the bounds described above to define the earliest and latest
possible stations to which this task can be assigned. This has proven a fruitful preprocessing

114 Chapter 5
step in reducing computation times in mathematical programming, constraint programming, and
dedicated algorithms (see, e.g., (Alakas et al., 2020; Bukchin and Raviv, 2018; Klein and Scholl,
1995; Schaus et al., 2008; Scholl et al., 2010; Scholl and Klein, 1997)). Taking the calculations
from Corominas et al. (2016) and adjusting them for TSALBP-1/2 leads to the following:
Ei := max
minm≤k≤m
⌈ ti + tPick
⌉,⌈ai + aPi
A
⌉(5.12)
Li := min
maxm≤k≤m
k + 1−
⌈ ti + tSick
⌉,m+ 1−
⌈ai + aSiA
⌉(5.13)
5.4 Solution approaches
In this section, we propose two algorithms for the solution of both TSALBP-1/2 and SALBP-E.
First, an improved version of the linear integer programming formulation proposed by Esmaeil-
beigi et al. (2015) is given. For the second approach, search algorithms are combined with a
constraint programming model. The constraint programming model is further strengthened by
the addition of redundant constraints. Table 5.2 presents the notation used throughout the study.
Table 5.2 Notation
Sets
K Set of stations with index k
Ki Subset of stations where task i can be assigned
I Set of tasks with index i
Ik Subset of tasks that can be assigned to station k
Pi Set of direct predecessors of task i
Pi Set of indirect predecessors of task i
Si Set of direct successors of task i
Si Set of indirect successors of task i
Parameters
A Available space at any station
ai Space required to store parts for task i
aij Sum of space needed for parts of tasks in Si ∩ Pj + ai + aj
aPi Space required to store parts for all predecessors of task i
aSi Space required to store parts for all successors of task i
asum Sum of all task space requirements
c Upper bound on the cycle time
c Lower bound on the cycle time
ck Upper bound on the cycle time when station k is the last station
ck Lower bound on the cycle time when station k is the last station
dij Minimum distance between tasks i and j, calculated as
max(b aij
A+1c, b tij
c+1c)
Ei Earliest station for task i
Li Latest station for task i
I Upper bound on idle time
Ik Upper bound on idle time for station k

Optimization procedures for TSALBP-1/2 115
Imc Idle time of a solution with m stations and a cycle time of c
m Number of stations in the solution
m Upper bound on number of stations
m Lower bound on number of stations
n Number of tasks
ti Assembly time required for task i
tPi Sum of assembly times for all predecessors of task i
tSi Sum of assembly times for all successors of task i
tij Sum of assembly times needed for tasks in Si ∩ Pj + ti + tj
Tmaxk The maximum number of tasks that can be assigned to station k
tmax The longest task time over all tasks
tsum Sum of all task times
Variables
c Cycle time
Iak Idle space of station k
Itk Idle time of station k
Lak Space load of station k
Ltk Time load of station k
xik Binary decision variable indicating if task i is assigned to station k
yk Binary decision variable indicating if the solution has k stations
αi Integer decision variable taking the value of the station to which task i is assigned
βk Auxiliary variable with the sum of idle times of all stations up to an index of k
5.4.1 A linear integer programming model
Since the classical version of SALBP-E is non-linear, Esmaeilbeigi et al. (2015) proposed a
linearized model by introducing (w.l.o.g.) integer variables Ik indicating the idle time of each
station. Both the cycle time c and idle times Ik can be considered integers as long as the
task times ti are integer. Since tasks can only be assigned in their entirety, the optimal cycle
time, and thus all resulting idle times, will always be integer values. Integer task times can be
obtained by scaling fractional task times before inputting them to the model. This is a common
practice/assumption in assembly line balancing (see, e.g., Esmaeilbeigi et al. (2015); Klein and
Scholl (1995)).
The most important change to Esmaeilbeigi et al.’s (2015) model is a change in the interpretation
of yk variables. Formerly, they indicated whether or not station k was opened. This new
formulation, however, indicates whether the solution has k stations. This also impacts some
of the constraints. Additionally, we extended the SALBP-E to the more general TSALBP-1/2
by incorporating the additional constraints (5.21) and (5.22), limiting the available space per
station. These changes, however, do not alter the basic assumptions inherent in the optimization
of a deterministic single model assembly line.
minimize∑k∈K
Itk (5.14)

116 Chapter 5
subject to:∑k∈Ki
xik = 1 ∀i ∈ I (5.15)
αj + dij ≤ αi ∀i ∈ I ∀j ∈ Pi (5.16)∑k∈Ki
kxik = αi ∀i ∈ I (5.17)
∑i∈Ik
tixik + Itk = c ∀k ∈ K : k ≤ m (5.18)
∑i∈Ik
tixik + Itk ≤ c ∀k ∈ K : k > m (5.19)
∑i∈Ik
tixik + Itk ≥ c+ c(∑
k′∈K:k′≥k
yk′ − 1) ∀k ∈ K : k > m (5.20)
∑i∈Ik
aixik ≤ A ∀k ∈ K : k ≤ m (5.21)
∑i∈Ik
aixik ≤ A∑
k′∈K:k′≥k
yk′ ∀k ∈ K : k > m (5.22)
∑k∈K:k>m
yk ≤ 1 (5.23)
xik ∈ 0, 1 ∀i ∈ I ∀k ∈ Ki (5.24)
αi ∈ Z+ ∀i ∈ I (5.25)
yk ∈ 0, 1 ∀k ∈ K : k > m (5.26)
Itk ∈ Z+ ∀k ∈ K (5.27)
c ≤ c ≤ c (5.28)
Objective function (5.14) minimizes the sum of idle times over all stations while Constraint (5.15)
ensures that every task is assigned to a station. Constraints (5.16) and (5.17) ensure precedence
relations. Furthermore, the former constraint has been strengthened to take into account that it
might be necessary to assign these two tasks dij stations apart from each other. The subsequent
three constraints ensure that the sum of task and idle time at every station are equal to the
cycle time if that station is used. The extension to the TSALBP-1/2 problem is achieved by
including Constraints (5.21) and (5.22), giving an upper bound A on the available space per
station. The following constraint ensures that only one station can be the last one. Lastly, all
variable domains are defined.
Adaptations for SALBP-E
The proposed formulation solves the TSALBP-1/2 assembly line balancing problem. Neverthe-
less, it can be attuned to solve SALBP-E, too. To do so, the space related constraints — i.e.,
Constraints (5.21) and (5.22) — need to be removed from the model. In return, another con-
straint must be added to the model to ensure that tasks are only assigned to stations that are

Optimization procedures for TSALBP-1/2 117
part of the solution.∑i∈Ik
xik ≤ Tmaxk
∑k′∈K:k′>k
yk′ ∀k ∈ K : k > m (5.29)
Tmaxk is defined as follows: tasks are sorted in increasing order based on their time requirements.
Next, these tasks’ time requirements until they are greater than or equal to the upper bound of
the cycle time for this station (see Equation 5.7 for its calculation). Tmaxk is equal to the number
of elements in that addition if the time sum is equal to the upper bound and one less if the sum
is greater than the upper bound. Clearly, another option with a tighter convex hull would be to
add a constraint for each station and task. However, our pretests confirmed that the proposed
approach works better. An explanation of this behavior can be found in Trick (2005).
Valid inequalities
Furthermore, Esmaeilbeigi et al. (2015) proposed the inclusion of three valid inequalities to
dynamically update the earliest and latest stations for every task while incorporating idle time.
These are retained as they were proven to be beneficial but are adjusted according to the changed
definition of the yk variables in Constraint (5.32).
(ti + tPi )xik + βk ≤ kc ∀i ∈ I ∀k ∈ Ki
(5.30)
(ti + tSi )xik + (k − 1)c ≤ βk + tsum ∀i ∈ I ∀k ∈ Ki : k ≤ m(5.31)
(ti + tSi )xik + (k − 1)c− tsum ≤ βk + ((k − 1)c− tsum)(1−∑
k′∈K:k′≥k
yk) ∀i ∈ I ∀k ∈ Ki : k ≤ m
(5.32)
βk =∑
k′∈K:k′<k
Ik′ ∀k ∈ K (5.33)
βk ≥ 0 ∀k ∈ K (5.34)
5.4.2 A constraint programming approach
Since its introduction, constraint programming (CP) has proven to be a potent tool in identifying
(in-)feasibility of combinatorial problems (Rossi et al., 2006). The literature also contains some
studies using constraint programming for ALBPs (Alakas et al., 2020; Bukchin and Raviv, 2018).
Considering CP’s strength in verifying (in-)feasible solutions, ALBPs may also be tackled from
a different angle. The mathematical programming model proposed above starts from an ample
solution space (cycle time and the number of stations are unknown, as are the assignments of
tasks to stations) and narrows it down during the search. In contrast, one may approach SALBP-
E and TSALBP-1/2 as a series of feasibility problems that only require the tasks’ assignment to
be verified for feasibility. For this approach, CP seems very promising.

118 Chapter 5
To illustrate this, consider the precedence graph given in Figure 5.1. Assume that one station
has eight space units and that no more than five stations should be used. Thus, the bounds
on the number of stations are m = 3 and m = 5. Running a greedy heuristic for this problem
may yield a solution as indicated in the figure. It has four stations and a cycle time of 22,
leading to an idle time of 13. This allows the calculation of upper bounds on the cycle time
for each possible number of stations. Furthermore, one can calculate the lower bound on the
cycle time for each station, as described in Equation (5.5). One may obtain 25, 19, and 15 as
lower bounds for stations 3, 4, and 5, respectively, and 29, 22, and 17 for the upper bounds,
respectively. Therefore, the following combinations may result in an optimal feasible solution:
(3, 25) · · · (3, 29), (4, 19) · · · (4, 22), (5, 15) · · · (5, 17). This notation follows the notation (m, c)
where m is the number of stations and c is the cycle time.
Table 5.3 Example of a tableau containing the realizable idle time of station and cycle time combina-tions
mc
14 15 16 17 18 19 20 21 22 23 24 25 26 27 28 29 30 31
3 - - - - - - - - - - - 0 3 6 9 12 15 184 - - - - - 1 5 9 13 17 21 25 29 33 37 41 45 495 - 0 5 10 15 20 25 30 35 40 45 50 55 60 65 70 75 80
Table 5.3 shows a graphical representation of an instance with the number of stations on the
left-hand side and the cycle time values along the first row. Some combinations are simply not
feasible (represented by -) while others may be feasible but are guaranteed to be suboptimal
(represented by, e.g.,60) because of the cycle time bounds.
Considering Table 5.3, one could clearly try to find a feasible task assignment for every possible
combination of m and c. Once all combinations have been tested, the only task remaining is to
select the feasible solution with the lowest idle time.
Since it would likely be time-intensive to test all combinations, we propose to use classical search
algorithms. In particular, two options are considered here: linear and binary search. For linear
search, one would sort all options based on their objective value and solve them in sequence, either
starting from the lowest or the highest value. When starting from the lowest value, one might not
actually find a solution for a long time but only increase the lower bound. Conversely, starting
from the highest value, only bad solutions might be found for some time with no improvement
on the lower bound.
Binary search was introduced by Lehmer (1960). The intuition here is straightforward: Imagine
that you are reading a book. After a hiatus from reading, you want to pick up where you left off.
Thus, you open the book in the center to check the page number. If the page number is higher
than which you are seeking, you continue searching in the first half of the book. By contrast, if
the page number is lower than that which you were seeking for you would continue to search in the
second half of the book. This step is performed repeatedly for the part of the book that remains.
To conduct a search like this, the list or array that is searched must be sorted. For more formal
definitions and properties, we refer the interested reader to Flores and Madpis (1971); Lehmer
(1960) and Knuth (1999). When applying binary search for TSALPB-1/2, one must first compile

Optimization procedures for TSALBP-1/2 119
all combinations of cycle time and stations into a list. Next, the list must be sorted in increasing
or decreasing order according to the resulting idle time. Then, the combination of cycle time
and number of stations resulting in the median idle time is chosen and checked for feasibility
with the CP model described below. If the solution is feasible, all combinations with an idle time
greater than or equal to the one just found can be removed from the list (similar to no longer
considering the second half of a book). On the other hand, infeasible solutions also allow the
removal of some combinations from the list. However, in this case, not all combinations can be
removed but only those that are proven to be infeasible (i.e., those with a cycle time smaller than
or equal to that of the current combination and a number of stations smaller than or equal to the
number of stations in the current combination). From a theoretical point of view, the search and
sorting parts do not add much complexity to the overall algorithm. Sorting may be performed by
any efficient sorting algorithm, such as Quicksort or merge sort. The search algorithms are also
efficient. Binary search has a time complexity of O(log n) (Flores and Madpis, 1971), whereas
linear search has a time complexity of O(n) (Knuth, 1999). Therefore, binary search may be
expected to outperform linear search. Nevertheless, linear search may be better if the searched
list is small or the list consists of multiple branches (number of stations), as in this case. Thus,
we implement and compare both options. The general idea of this procedure is described in
Algorithm 3.
Algorithm 3 Search-based algorithm
1: Queue + = (m, c)2: while Queue 6= ∅ do3: Solve CP4: if Solution found then5: Prune (m′, c′) : Im′c′ ≥ Imc
6: Queue = ∅7: Queue + = (m, c) based on search structure8: else9: Prune (m′, c′) : m′ ≤ m ∧ c′ ≤ c
10: Queue = ∅11: Queue + = (m, c) based on search structure
The selection of a new combination for testing may be achieved according to various rules. As
discussed above, (i) the combinations can be sorted based on idle time (linear search); (ii) select
the combination with the number of stations that is greater than the current one and the cycle
time that is the median for that station; (iii) solve the same amount of stations with the new
median idle time; and (iv) solve the combination with the median idle time. These variants are
tested and discussed in Section 5.5.
Constraint programming model
To solve each of these feasibility problems, we propose the following constraint programming
model.
minimize - (5.35)

120 Chapter 5
s.t.∑i∈Ik
(αi = k)ti = Ltk ∀k ∈ K (5.36)
∑i∈Ik
(αi = k)ai = Lak ∀k ∈ K (5.37)
Ltk + Itk = c ∀k ∈ K (5.38)
Lak + Iak = A ∀k ∈ K (5.39)
αj + dij ≤ αi ∀i ∈ I ∀j ∈ Pi (5.40)
Ei ≤ αi ≤ Li ∀i ∈ I (5.41)
This model is solved repeatedly for a fixed cycle time and number of stations. Thus, the objective
(i.e., idle time) is actually determined when solving the model. Therefore, no objective function
exists and the model is only used to verify whether or not a feasible solution exists. The first
constraint (5.36) is a so-called reification constraint: Whenever αi is equal to the station index k,
the task duration ti is added to the load of that station Ltk. The same procedure is performed for
space requirements in Constraint (5.37). Constraint (5.38) ensures that the sum of idle time and
load is equal to the cycle time c for each station in the model. Again, this is repeated for spatial
consideration in Constraint (5.39). The assignment of predecessors to the same or a previous
station as their successors is ensured in Constraint (5.40). Finally, the station domain to which
a task can be assigned is reduced by incorporating its earliest and latest stations.
Redundant constraints
In constraint programming, the addition of redundant constraints often improves the model
strength. Therefore, we provide multiple redundant constraints and show the impact of each in
the following section.
First, the use of idle time variables allows us to introduce Constraint 5.42, where c is the cycle
time and m is the number of stations of the current solution step.
∑k∈K
Itk = mc− tsum (5.42)
In addition to Constraints (5.36) and (5.37), one can add the same constraint as a packing
constraint (IloPack), as discussed by Shaw (2004). The obtained result is exactly the same;
however, special structures can be detected when such a constraint is used (e.g., IloPack, as
provided in the CP Optimizer of IBM ILOG). Here, Lt and La represent the vectors of load
variables, α the vector of station assignment variables, and t and a the vectors of time and space
requirements, respectively.
IloPack(Lt, α, t) (5.43)
IloPack(La, α, a) (5.44)

Optimization procedures for TSALBP-1/2 121
While already imposed in the model in Constraint (5.40), it is possible to add specific minimum
distance constraints (e.g., IloAllMinDist in the CP Optimizer of IBM ILOG). These ensure, in
addition to the precedence constraint, that a successor i not only comes after its predecessor j
but also that there may be some stations (i.e., dij) between them.
IloAllMinDist(αi,αj , dij) ∀i ∈ I ∀j ∈ Pi (5.45)
Constraint (5.41) already restricts the domain of stations to which a task can be assigned.
However, this can be further strengthened by considering the idle time of stations.
max(IloDivti + tPi +
∑k≤Ei
k=1 Itkc+ 1
, IloDivai + aPi +
∑k≤Ei
k=1 IakA+ 1
) ≤ αi ∀i ∈ I (5.46)
m−max(IloDivti + tSi +
∑k≤mk=Li
Itkc+ 1
, IloDivai + aSi +
∑k≤mk=Li
IakA+ 1
) ≥ αi ∀i ∈ I (5.47)
5.5 Computational experiments
Within the computational experiments, we first aim to find the best performing formulation
for SALBP-E. For this, we investigate the proposed changes in the mathematical programming
algorithm and the different formulations of the constraint programming algorithm as well as
different searching strategies in the next subsection. Subsequently, the solution methodology
that yields the most promising results is used to solve new TSALBP-1/2 instances in Subsection
5.5.2.
All tests are performed on the benchmark dataset described by Scholl (1993). This benchmark
dataset consists of 24 datasets, each with a different number of instances, where an instance is
characterized by the lower and upper bounds on the number of stations. Some general metrics
for these datasets can be found in Table 5.4. In this table, the order strength (OS) indicates how
strongly the tasks in the precedence graph are interlinked. The time variability ratio (TV) gives
the ratio between the minimum (tmin) and maximum (tmax) task times. Divergence (div) and
convergence (conv) indicate how strongly/weakly the precedence graphs converge and diverge.
For further information and additional metrics, the interested reader is referred to Scholl (1993)
and Otto et al. (2013). Finally, the number of instances (#inst) is given in the table.
Table 5.4 Dataset characteristics
Name n tmin tmax tsum OS TV div conv #inst
Arcus1 83 233 3691 75707 59.09 15.84 0.73 0.73 14
Arcus2 111 10 5689 150399 40.38 568.90 0.63 0.63 20
Barthold 148 3 383 5634 25.80 127.67 0.74 0.72 9
Barthol2 148 1 83 4234 25.80 83.00 0.74 0.72 30
Bowman 8 3 17 75 75.00 5.67 0.88 0.80 2
Buxey 29 1 25 324 50.74 25.00 0.74 0.78 7
Gunther 35 1 40 483 59.50 40.00 0.78 0.76 8
Hahn 53 40 1775 14026 83.82 44.38 0.63 0.63 4

122 Chapter 5
Heskiaoff 28 1 108 1024 22.49 108.00 0.68 0.69 6
Jackson 11 1 7 46 58.18 7.00 0.77 0.77 3
Jaeschke 9 1 6 37 83.33 6.00 0.73 0.73 4
Kilbridge 45 3 55 552 44.55 18.33 0.67 0.69 6
Lutz1 32 100 1400 14140 83.47 14.00 0.76 0.82 6
Lutz2 89 1 10 485 77.55 10.00 0.75 0.75 22
Lutz3 89 1 74 1644 77.55 74.00 0.75 0.75 14
Mansoor 11 2 45 185 60.00 22.50 0.79 0.91 2
Mertens 7 1 6 29 52.38 6.00 1.00 0.78 2
Mitchell 21 1 13 105 70.95 13.00 0.74 0.70 4
Roszieg 25 1 13 125 71.67 13.00 0.74 0.69 4
Sawyer 30 1 25 324 44.83 25.00 0.83 0.83 8
Scholl 297 5 1386 69655 58.16 277.20 0.70 0.69 32
Tonge 70 1 156 3510 59.42 156.00 0.78 0.73 12
Warnecke 58 7 53 1548 59.10 7.57 0.72 0.81 15
Wee-Mag 75 2 27 1499 22.67 13.50 0.85 0.62 22
5.5.1 Solving SALBP-E
All tests were performed on a high-performance computer. Each optimization procedure was
allotted 16GB Ram and used four cores of an Intel Xeon E5-2680v3 processor with 2.5 GHz.
The mathematical programming models were implemented in C++ using Gurobi 9. Heuristics
were turned off to investigate the models’ strength as they produce random results based on the
solution path and make it difficult to evaluate the actual strength of a formulation. All other
settings were set to their default value. The constraint programming models were implemented
in C++ using ILOG CP solver version 12.10, with the number of workers equal to the number
of cores and all other settings at their default values. A time limit of 3600s was implemented for
all testing purposes.
Before comparing our results to results from literature, we first investigated the performance
of the described greedy heuristics using various selection rules and the performance of selected
formulations.
Evaluation of greedy heuristics
Within the proposed solution methodology, we used a greedy heuristic to obtain better bounds
on the cycle time. As described in Algorithm 2, one must select the task that is going to be
assigned next. We tested various selection rules as proposed in Section 5.3.2. The performance
of these selection criteria was evaluated across all datasets and instances tested. The results are
presented in Table 5.5, where we show how often a decision criterion gives the best value found
using a heuristic (best heuristic) and the average gap in comparison to the best result found
across all greedy heuristics.
As one can see from the results, the proposed heuristics perform very differently, and some are
clearly outperformed by others. Thus, it seems that criteria 4, 6, 8, 9, and 10 are not well suited
to this purpose. For example, the combination of criteria 3 and 7 results in the best found
objective in 215 out of 256 instances with an average gap of 46.33% for the remaining instances.

Optimization procedures for TSALBP-1/2 123
Table 5.5 Comparison of constructive greedy heuristics
Selection criterion 1 2 3 4 5 6 7 8 9 10
Best heuristic 52 23 133 6 29 11 143 6 23 14Avg. gap(%) 65.25 68.51 47.78 79.20 62.49 67.44 49.05 74.77 68.51 71.70
Combining heuristics 1, 3, and 7 resulted in the best found objective in 246 out of 256 instances
with an average gap of 52.92% for the remaining instances.
Detailed evaluation of solution approaches
In this section, we first evaluate the mathematical programming approach and then the constraint
programming approach. For the mathematical programming model, the model proposed by
Esmaeilbeigi et al. (2015) is used as a baseline (E1) and tested for improvements (E2-E4). For
this, the auxiliary variables αi and βk are set to be integer variables both individually (E2, E3)
and in combination (E4). Next, we solved the model as proposed in Section 5.4.1, including the
adjusted valid inequalities (MP1). For this, branching priorities for yk were used such that later
stations were branched on first. Finally, the impact of having given a starting solution via the
greedy heuristics is analyzed (MP2).
Table 5.6 Improved mathematical programming approach
Name Start αi βk Branching #opt inf. Gap (%) time (s)
E1 7 Cont. Cont. - 155 1 31.28 1506.51E2 7 Cont. Int. - 153 2 32.04 1507.99E3 7 Int. Cont. - 157 1 30.65 1476.74E4 7 Int. Int. - 154 2 31.77 1498.55
MP1 7 Int. Cont. k 164 1 28.81 1394.55MP2 3 Int. Cont. k 166 0 28.06 1378.35
The results are shown in Table 5.6, including whether a starting solution has been used. Fur-
thermore, the branching priority for yk variables and the types of variables used for αi and βk
are given. Finally, the number of instances solved to optimality (#opt), the number of instances
without a solution (inf.), the average gap, and the average time are given. While the proposed
changes do improve the performance of the mathematical programming approach developed by
Esmaeilbeigi et al. (2015), the effects are not outstanding. Nevertheless, the number of instances
solved to optimality with MP1 and MP2 were increased by 5.8% and 7.1%, respectively, when
compared to the original formulation E1. Gaps were reduced by 7.9% and 10.3%, respectively.
The use of constructive heuristics eliminated instances without any solution.
Three major aspects determine the performance of the approach using constraint programming:
1. The use of greedy heuristics to reduce the search space; 2. the formulation of the constraint
programming model; and 3. the search strategy. Therefore, we test how these aspects change the
results. First, a search without a starting solution (CP1) is compared to a search with a starting
solution (CP2). For this the binary search strategy described in Section 5.4.2 is applied. Next,
we investigate how the addition of redundant constraints changes the performance of the model

124 Chapter 5
(CP3-CP6). Finally, the most efficient settings is used to compare different search strategies
for their performance (CP6-CP9). CP6 uses a binary search approach in which the combination
(m, c) with median idle time is solved in every iteration. CP7 also uses a binary search, beginning
with the lowest number of possible stations and taking the corresponding median cycle time
before increasing the number of stations by one and solving for the corresponding median cycle
time. Once the last station has been reached, the process begins again at the first station. CP8
is a simple linear search whereby problems with increasing idle time are solved until the optimal
solution is found. Finally, in CP9, a certain number of stations is chosen and the median cycle
time is selected. This is repeated until all possible cycle times of that station are tested or
pruned. The number of stations is then increased and the process repeated.
Table 5.7 Constraint programming approach and redundant constraints
Name Start Search Strategy Red. cstr. #opt Gap time Iterations
CP1 7 Binary/Median - 128 43.53 1835.44 8.89CP2 3 Binary/Median - 137 39.85 1704.47 3.01
CP3 3 Binary/Median (5.42) 182 23.26 1120.94 4.25CP4 3 Binary/Median (5.43) 215 14.20 672.59 4.77CP5 3 Binary/Median (5.45) 215 14.21 669.68 4.77CP6 3 Binary/Median (5.46),(5.47) 219 13.00 632.83 4.85
CP6 3 Binary/Median - 219 13.00 632.83 4.85CP7 3 Binary/Station - 221 12.19 544.41 4.66CP8 3 Linear/Increasing - 222 12.22 522.39 16.83CP9 3 Binary/Cycle Time - 216 14.09 526.08 5.23
In Table 5.7, we compare the different formulations by reporting on the search strategy used and
the use of a starting solution. Similar to Table 5.6, the number of instances solved to optimality
(#opt), the average gap and time, and the number of combinations solved are reported. There
were no instances without any solution.
Comparing the results from the mathematical programming approach (see Table 5.6) with the
results from the constaint programming approach (see Table 5.7), it is clear that the latter far
outperforms the former. The number of optimally solved instances increased by 32%, and gaps
as well as computation times are both reduced by around 50%. It should be noted, however, that
the basic model does not perform well without the addition of redundant constraints. Finally, all
search strategies perform quite well. The last search strategy shows the worst performance. An
explanation for this could be the lack of diversity, since many problems with the same amount of
stations are solved before changing the number of stations. This may be compared to an intensive
but not diversified search. The other search strategies have greater diversity and perform almost
equally well. Surprisingly, binary search does not clearly outperform linear search. Although
the average number of CP models solved in linear search is 16.83, compared to 4.66 for CP7, it
does not slow down the search significantly. This can be explained by strong capabilities in the
detection of infeasible models. Since those models can be solved quickly, the higher number of
problems that must be solved can be compensated. If the formulation could be improved such
that feasible models may be more swiftly solved, binary search should outperform linear search

Optimization procedures for TSALBP-1/2 125
due to the number of models that are solved.
Comparison with literature
To put our results into perspective, we compare them with results from literature in Table
5.8 by showing the number of instances solved to optimality in the literature compared to the
instances solved to optimality by the formulations proposed in this study. Please note that only
solution procedures specifically developed for SALBP-E problems are compared, which excludes
branch-and-bound methods solving SALBP-1 which could be attuned to solve SALBP-E (Scholl
et al., 1999). All procedures are tested for all 256 instances of the dataset used. #opt describes
how many of these could be solved to optimality and #unsolved describes for how many of
these instances no solution could be found. It should be noted that we reimplemented the best
performing optimal formulations described in Esmaeilbeigi et al. (2015) and Corominas et al.
(2016) and tested them using the same hardware and settings. Corominas et al. (2016) also
proposed heuristic procedures that were excluded from this comparison since the focus is on
optimal procedures.
Table 5.8 Number of instances solved in the literature and by our approach
Paper Esmaeilbeigi et al.(2015)
Corominas et al.(2016)
Our approach
Procedure E1 Enh-MILP MP2 CP7 CP8
Avg. time(s) 1506.51 1454.51 1378.35 544.41 522.39Avg. GAP(%) 31.28 34.38 28.06 12.19 12.22#opt 155 147 166 221 222# unsolved 1 2 0 0 0
A closer look at the test results reveals that some of the instances tested are easy to solve.
Therefore, we analyzed the hardness of the instances using the benchmarking technique pro-
posed by Achterberg and Wunderling (2013) and discussed by Lodi and Tramontani (2013). For
this, the solution procedures compared in Table 5.8 were used to evaluate the hardness of the
instances. The table is organized as follows: The first column is used to define the instances
under investigation using so-called brackets. While the row “All” contains all instances each of
the following rows contains only a subset of the row above. For example, the row “(1,3600]”
contains instances for which the maximum time used by any procedure is between 1 and 3600
seconds. Thus, all instances in this row must be solved to optimality by at least one procedure.
Columns 3–7 contain the number of time-outs produced by a procedure in the set of instances.
Owing to the table’s design, the values of the last five rows are equal
We used this analysis to define different categories for the hardness of instances. To this end,
we used the hardness categories of Otto et al. (2013) and complemented them with a “simple”
category 1. With this, we obtained the categories described in Table 5.10. For future research,
we propose to use only those instances that are classified as tricky or very/extremely tricky. The
exact definitions of those instances can be found in Appendix B.
1Please note that the category names are the same but the definition of hardness varies

126 Chapter 5
Table 5.9 Comparison of instance hardness
Instances E1 Enh-MILP MP2 CP7 CP8
All 256 101 97 90 35 34(0,3600] 224 69 65 58 3 2(1,3600] 187 69 65 58 3 2(60,3600] 110 69 65 58 3 2(300,3600] 97 69 65 58 3 2(1800,3600] 82 69 65 58 3 2
Table 5.10 Comparison of instance hardness
Category Definition # Instances
Extremely tricky Not solved by any algorithm 32Very tricky Not “tricky” and solved by at least one algorithm in < 3600s 82Tricky Not “less tricky” and solved in ≤ 1800s for all algorithms 15Less tricky Not “simple” and solved in ≤ 300s for all algorithms 13Simple Not “trivial” and solved in ≤ 60s for all algorithms 77Trivial Solved in ≤ 1s for all algorithms 37
5.5.2 Solving TSALBP-1/2
To test the impact of space requirements, the datasets used must be supplemented with a space
requirement for each individual task. Clearly, each task must be assigned a positive space
requirement that does not exceed the available space per station 0 < ai ≤ A. We assume w.l.o.g.
that space requirements ai as well as space limitations A are positive integer numbers. To do
so, we decide on the available space per station A and use a discrete probability distribution
to obtain space requirements ai for each task. To test the effect for different types of assembly
lines with items of different sizes, we use a binomial probability distribution with probability
values between p = 0.1 and p = 0.5 in steps of size 0.1. For every probability value and dataset
(24), three instances have been created resulting in a total of 360 instances. By deciding on
A = 20 [space units] and setting A equal to the number of independent experiments, we obtain
probability distributions, as depicted in Figure 5.2, from which random space requirements are
drawn.2
The probability values are selected such that the distributions seem to reflect reality. Larger
values seem unrealistic, as (in practice) parts for one task would rarely use more than half of
the available space. Moreover, larger values would render the problem trivial as it would often
result in stations that only have a single task due to the spatial requirements.
Evaluation of bounding methods
In Section 5.3.1, we proposed various ways to calculate upper bounds for TSALBP-1/2. Table
5.11 shows how they compare to one another for different instances clustered by the binomial
probability value p that was used to create the spatial requirements. For this, we report on the
2The obtained values for the datasets of Scholl (1993) can be downloaded from the website ww.opm.ugent.be/
datasets.htm

Optimization procedures for TSALBP-1/2 127
1 2 3 4 5 6 7 8 9 10 11 12 13 14 15 16 17 18 19 20
0
10
20
30
Space units required for a part [SU]
Pro
bab
ilit
y[%
]
B(20, 0.1)
B(20, 0.2)
B(20, 0.3)
B(20, 0.4)
B(20, 0.5)
Figure 5.2 Binomial probability distribution for the assignment of space requirements
Table 5.11 Comparison of the cycle time upper bounds
# best gap (%) avg. WCR max WCR
Instances cI2 cII2 cIII2 cI2 cII2 cIII2 cI2 cII2 cIII2 cI2 cII2 cIII2
p=0.1 8 38 27 49.78 9.2 13.26 18.39 6.23 6.82 53.33 8 14.56p=0.2 2 56 15 61.44 2.83 22.66 17.54 3.94 5.41 49.19 4.5 11.59p=0.3 0 62 11 69.12 1.41 26.92 16.48 2.88 4.47 44.89 3.5 12.33p=0.4 0 63 10 73.76 0.92 33.18 15.09 2.2 4.09 41.39 2.36 13.16p=0.5 0 67 8 75.31 0.92 36.35 13.61 1.82 3.74 37.58 2 12.49
All 10 286 71 65.88 3.06 26.47 16.22 3.41 4.9 53.33 8 14.56
number instances for which an approach (cI2, cII2 , c
III2 ) gave the best bound in comparison to
the others. Evidently, the bound proposed in Theorem 1 cI2 is the weakest. The other bounds,
however, appear to be relatively strong. This becomes also evident when looking at the relative
gaps (gap(%)) that are calculated based on the best found bound for each instance. Lastly, we
calculated the average and the maximum worst case ratio (WCR), i.e., the ratio of the best pos-
sible cycle time, bounded by the lower bound defined in Equation (5.4), to the bound obtained
by the different approaches cI2, cII2 and cIII2 . For the latter two bounds, the approximation rates
measured by the WCR seem to be around eight and fifteen, respectively. Clearly, using the
optimal solution might result in a better WCR than the calculation based on the lower bound
calculated in Equation (5.4). To summarize, one can see that cII2 seems to be the best bound
among those discussed. However, it may be best to calculate all bounds as one cannot be sure
to obtain the best bound by applying only a single approach.

128 Chapter 5
Evaluation of greedy heuristics
The introduction of space creates additional options to generate feasible solutions via heuristic
approaches.
Table 5.12 Comparison of constructive greedy heuristics including space requirements
Selection criterion 1 2 3 4 5 6 7
Best heuristic 54 31 103 25 80 44 131avg. gap(%) 25.79 42.28 14.58 40.31 21.78 29.82 10.34
Selection criterion 8 9 10 11 12 13 14
Best heuristic 33 160 36 109 43 132 40avg. gap(%) 37.31 13.69 35.42 24.87 32.36 13.43 37.78
The performance of the proposed heuristics, shown in Table 5.12, is similar to the results ob-
tained for the instances of type SALBP-E. We report how often any heuristic selection criterion
(described in Section 5.3.2) results in the best solution found by any of heuristic selection criteria
(best heuristic). For some instances, multiple heuristics (selection criteria) result in the same
(best) solution. Furthermore, we report on the average gap, when compared to the best heuristic
for the same problem instance (avg. gap (%)). Heuristics 3, 7, 9, 11, and 13 perform best. As
can be seen from these results, taking into account spatial requirements (Heuristics 11–14) does
produce good solutions (i.e., one would obtain the best results in 206 out of 360 instances). Con-
sidering the above, the best performing heuristics (3, 7, 9, 11, and 13) lead to the best heuristic
solution 344 times.
Effects of space requirements
In this section, we compare the solution for the space-constrained problem (TSALBP-1/2) to the
solution for the same problem without spatial requirements (SALBP-E). For the latter, the same
bounds on the number of stations was used as for the former. In Table 5.13, the results are shown
separately for different groups of problem instances clustered by spatial requirements. The table
reports the number of instances (#inst) solved optimally (3) for both SALBP-E and TSALBP-
1/2 as well as the number of instances for which at least one of both problems could not be
solved optimally (7). For both problems, SALBP-E and TSALBP-1/2, the average computation
times and gaps are reported. Furthermore, the increase in idle time when comparing the solution
of SALBP-E to the solution of TSALBP-1/2 is reported. In some instances, the increase in idle
time may be misleading, since a large increase may be negligible if the initial idle time was very
low. Therefore, we also compare the increase in line capacity, which is calculated by summing
all idle and task times of the solution. Alternatively, this may also be calculated as the number
of stations multiplied with the cycle times. We further distinguish the actually observed (act.)
increase which is based on the best solutions found and the maximum increase (max.) which is
based on the bounds of the solution. That is, we compare the best-found solution of TSALBP-1/2
to the lower bound of the SALBP-E solution.

Optimization procedures for TSALBP-1/2 129
Table 5.13 Comparison of SALBP-E and TSALBP-1/2
Size Opt. #inst. SALBP-E TSALBP-1/2 Idle time increase Line cap. increasetime gap time gap Act.[%] Max.[%] Act.[%] Max.[%]
0.17 10 2163.62 59.61 3600.15 88.04 326.85 661.42 2.41 2.83 62 0.94 0 60.4 0 120.91 120.91 9.69 9.69
0.27 16 718 18.75 3600.11 61.59 34.68 34.91 4.79 4.823 56 0.91 0 110.45 0 41.36 41.36 6.84 6.84
0.37 18 822.47 16.51 3600.27 59.67 16.34 16.45 7.71 7.763 54 6.08 0 64.29 0 10.58 10.58 3.44 3.44
0.47 28 401.7 9.18 3600.16 39.27 15.19 15.2 7.78 7.783 44 0.05 0 32.57 0 16.19 16.19 7.36 7.36
0.57 20 911.02 17.08 3600.28 26.13 30.26 30.31 18.76 18.793 52 0.17 0 96.48 0 22.42 22.42 12.65 12.65
All 360 216.24 4.98 975.19 12.67 21.69 21.82 8.6 8.64
As expected, the introduction of spatial requirements leads to a decrease in the efficiency of
assembly lines. The observed average increase in idle time is 21.69%. Considering that not all
instances were solved to optimality, this increase might be slightly higher in actuality, namely
21.82%. A remarkable result is that the increase in idle time is actually higher when spatial
requirements are smaller. An explanation for this result is that the lower bound for the number
of stations is high when spatial requirements are large. Therefore, the idle time is high and
many trivial solutions are found when the SALBP-E version is solved using those high lower
bounds. When spatial requirements are introduced, those trivial solutions become infeasible.
Nevertheless, good solutions may be found without a large increase in idle time. This can also
be observed in Figure 5.3 which contrasts the idle time with the idle space for all stations. As
idle time is mostly low when the number of stations is low, this effect is quite the contrary for
smaller space requirements, e.g. p = 0.1, p = 0.2. To illustrate this, a specific instance can be
considered. While the idle time is rather low in SALBP-E with m = 13 and a value of 467,
it is 27,641 when the lower bound on the number of stations is changed to 28. It can also be
seen that the second case is much easier to solve because the minimum idle time resulting from
such a high number of stations gives considerable freedom to the problem. This is also reflected
in the trend whereby SALBP-E problems tend to be solved more quickly when higher lower
bounds on the number of stations are imposed. Somewhat the reverse seems to be the case for
TSALBP-1/2. These problems become more constrained, and therefore it is more difficult to
find the optimal solution, as can be seen in the reported gaps. In conclusion, the addition of
spatial requirements perturbs the assignment algorithm much more when spatial requirements
are small rather than large. Generally, this may be attributable to the fact that in cases with
tight space but weak time constraints, the impact on idle time is smaller, while instances with
tight time and space constraints are significantly more affected. These cases are simpler to solve,
however, when spatial requirements are neglected.
Table 5.13 also shows how the overall line capacity is affected by the introduction of spatial
requirements. As expected, in most cases, the consideration of spatial requirements requires an
increase in line capacity, either in terms of more workstations and workers or in terms of a higher

130 Chapter 5
Figure 5.3 Comparison of idle time and idle space
cycle time. The addition of line capacity seems to follow the increase in spatial requirements
more or less linearly. At first glance, this seems to contradict the change in idle time in the
solution. However, the absolute values of idle times are small when spatial requirements are
small. Thus, even a small increase in idle time leads to a high relative change in idle time but a
small increase in line capacity. For larger spatial requirements, the reverse is true, as discussed
above.
5.6 Conclusion
5.6.1 Summary
In this chapter, we proposed a generalized version of the SALBP-E problem, additionally incor-
porating spatial requirements and constraints, called TSALBP-1/2. Furthermore, we improved
existing approaches from literature and proposed a new algorithm that solves both the classical
SALBP-E and the generalized TSALBP-1/2. This new solution procedure is based on constraint
programming to repeatedly solve feasibility problems that have been selected based on classical
search algorithms, such as linear and binary search. Their effect on solving performance was
investigated and analyzed. Our results indicate that our solving procedure outperforms those of
Esmaeilbeigi et al. (2015) and Corominas et al. (2016) for SALBP-E. We also provide first results
and procedures for TSALBP-1/2. For this, we also propose a simple way to complement existing
datasets with space considerations. On a managerial level, we show that spatial requirements are
not negligible, as they can certainly affect the line efficiency negatively, and capacity adjustments
must be made in real life.

Optimization procedures for TSALBP-1/2 131
5.6.2 Further research
With this study, we improved the solvability of both SALBP-E and TSALBP-1/2 by proposing a
more efficient enumeration procedure that searches the solution space and solves a set of feasibility
problems. This approach might be applicable to other problems. Clearly, other ALBPs are likely
to benefit from this approach, but it may also be worthwhile to investigate this approach for
completely different sets of problems.
Next, Scholl’s (1993) dataset is now partially inadequate, given the development of hardware
and algorithms, as analyzed in Section 5.5.1. Thus, a larger dataset with more challenging -
though not extremely difficult - instances for the SALBP-E and TSALBP-1/2 is required. While
Otto et al. (2013) provided datasets for the SALBP-1 and SALBP-2 problems, no meaningful
datasets have been proposed for SALBP-E. It should be noted that determining datasets with
the desired difficulty is not a trivial task and requires extensive computation. However, our
analysis in Section 5.5.1 has demonstrated how to determine datasets with the desired level of
difficulty.
Finally, the integration of spatial considerations is clearly valuable, as it can not only negatively
affect line efficiency but also requires increased production capacities. However, two extensions
are necessary: (i) The space required to store parts for any task cannot necessarily be easily
determined as it depends on how a part is provided. For example, one may deliver all part
variants on full pallets, requiring a lot of space, or in a sequenced container, requiring less space
(Limere et al., 2012; Schmid and Limere, 2019; Schmid et al., 2018). Therefore, this decision
must also be addressed in assembly line balancing; (ii) part provision and storage along the line
affects the operating times for the assembly worker, as walking, searching, and fetching times
may depend on it (Limere et al., 2015; Schmid et al., 2020). It has already been shown that
line balances influence decision making regarding part feeding (Wijnant et al., 2018), but our
discussion should clarify that the reverse is also true. Thus, an integrated approach solving both
assembly line balancing and feeding, as proposed by Sternatz (2015) and Battini et al. (2017),
is desirable for all variants of the time- and space-constrained ALBP.


6Integrating assembly line feeding and balancing
optimization for improved decision making
“To improve is to change; to be perfect is to change often.”
Winston Churchill

134 Chapter 6
6.1 Introduction
As demonstrated in the preceding chapter, the consideration of spatial requirements in assembly
line balancing may affect the line’s balance. However, the spatial requirements considered above
do not perfectly resemble real-world space and time requirements as those depend on the feeding
policy used and the exact positioning of parts at the BoL. However, these are of particular
interest for assembly systems that produce multiple customized models on a single assembly
line.
With this research, we propose an optimization approach that solves ALBPs and ALFPs simul-
taneously to overcome the lack of accuracy occurring in a step-wise solution. While few studies
already approached the integration of assembly line feeding and assembly line balancing (Bat-
tini et al., 2017; Sternatz, 2015), this study includes various novelties. (i) The number of line
feeding policies under investigation has been increased to five; (ii) the exact positioning of parts
at workstations is considered, such that walking times can be calculated more accurately; (iii)
facility sizing is incorporated to determine space and transportation costs; and (iv) an exact
solution methodology, i.e., a logic-based Benders’ Decomposition framework, is proposed.
The remainder of the chapter is structured as follows: After motivating the investigation of as-
sembly line balancing and assembly line feeding in a combined fashion, we discuss the literature
on both individual research domains in the following section. Besides, we discuss studies on the
integration of both topics. Afterward, in Section 6.3, we first explain the planning environment,
i.e., the type of assembly system under investigation, and the scope of our investigation before
proposing a logic-based Bender’s decomposition framework for this problem. To this end, we
present cost calculations for this type of problem. Section 6.5 provides computational and man-
agerial insights. Lastly, we provide a summary and showcase ideas for further research in the
last section.
6.2 Literature review
Within this section, we provide a limited overview of assembly line balancing and feeding prob-
lems. Furthermore, studies on the integration of both problems are discussed. We refer the
interested reader to Becker and Scholl (2006); Boysen et al. (2007), and Battaıa and Dolgui
(2013) for comprehensive reviews of the assembly line balancing literature and to Schmid and
Limere (2019) for a review on assembly line feeding literature.
6.2.1 Assembly line balancing
The origin of modern assembly lines goes back to the assembly line’s invention and Ford’s Model
T at the beginning 20th century. Academics started studying this topic only half a century later
(Salveson, 1955). However, interest in this topic is vast. The fundamental problem variants,
assigning tasks to stations and minimizing either the number of workstations or cycle time, have
been classified as simple assembly line balancing problems (SLABPs) (Baybars, 1986). Other

Integrating ALFP and ALBP 135
problem types, including various extensions, have been labeled generalized assembly line bal-
ancing problems (Baybars, 1986). Due to the enormous number of publications, we present
only a subset of studies. Many studies are concerned with the proposal and improvement of
exact solution methods for the simple assembly line balancing problem with a fixed cycle time
and minimizing the number of stations. Bowman (1960) was the first author to propose a lin-
ear programming-based solution approach for assembly line balancing problems. Many studies
followed this mathematical programming approach using techniques such as Lagrangian relax-
ation (Aghezzaf and Artiba, 1995) or formulation improvements Patterson and Albracht (1975).
(Scholl and Klein, 1997) proposed a Branch-and-Bound procedure for SALBP-1, which still out-
performs many other approaches. The most efficient solution procedure for this problem has
been proposed by Morrison et al. (2014); Sewell and Jacobson (2012). They also propose a
Branch-and-Bound method. However, the algorithm identifies and remembers the solution to
subproblems such that recurring subproblems do not require being repeatedly solved. Pape
(2015) compared and improved multiple lower bounds for the same problem. Due to the dif-
ficulty of this NP-hard problem, many researchers studied heuristic approaches. Fleszar and
Hindi (2003) provide enumerative heuristic approaches, i.e., an iterative rule-based assignment
that alters some search-determining parameters in each iteration. This heuristics is an extension
of the well-known Hoffmann heuristic (Hoffmann, 1963). Recently, Sternatz (2014) extended the
heuristic of Fleszar and Hindi (2003) to incorporate more practical considerations such as mul-
tiple workers per station or assignment restrictions. Asides from computational aspects, many
studies are concerned with the investigation of GALBPs that consider many more balancing
aspects. One of these extensions is concerned with the necessity to provide sufficient storage
space at the workstations (Bautista et al., 2013; Bautista and Pereira, 2007; Chica et al., 2016).
In these studies, each task requires some storage space. However, as discussed above, the exact
amount of space depends on other decisions, namely line feeding decisions. Bartholdi (1993)
consider two-sided assembly lines, i.e., workers assemble parts on both sides of the product. In
reality, the assembly of different products may vary for specific products. Bartholdi III et al.
(2001) investigate assembly lines with these properties and propose the use of bucket brigades
to balance assembly lines more efficiently. More recently, an increasing number of studies focus
on human factors such as ergonomics (Battini et al., 2016b) or task complexity (Zeltzer et al.,
2017).
6.2.2 Assembly line feeding
Even though early assembly lines such as the above-mentioned Ford Model T assembly line
required various parts, it is not clear when logistics engineers started to consider various options
of supplying material. However, the advent of lean manufacturing systems in the 1970s certainly
spurred the use of Just-in-Time and Just-in-Sequence part feeding. Nowadays, five line feeding
policies are distinguished (Schmid and Limere, 2019): (i) line stocking, i.e., the provision of a
container or pallet as received from the supplier or preceding production stage; (ii) boxed-supply
(also known as kanban), i.e., a repacking of parts into smaller bins which are then provided to the

136 Chapter 6
assembly operator in a flow rack; (iii) sequencing, i.e., the provision of presorted multiple part
variants of functionally equivalent but distinct parts (known as part families); (iv) stationary
kitting, i.e., the provision of multiple specific parts, required at a specific workstation for the
production of a specific product. These parts belong to various part families and (v) traveling
kitting. Traveling kitting is almost equivalent to stationary kitting. However, a traveling kit
contains parts for multiple stations as the kit is typically attached to the product and travels
along the assembly line for multiple stations.
Nevertheless, only in the 1990s, the assembly line feeding problem received academic attention
(Bozer and McGinnis, 1992). This first research paper investigated the effect of using one or
another feeding policy through cost-based comparisons. One major limitation of this work was
applying an all-or-nothing approach that assumed a single feeding policy is used to supply all
parts. This research has been extended to include additional aspects in terms of costs (Caputo
and Pelagagge, 2011) such as error or space costs. Over time additional feeding policies have
been discussed (Battini et al., 2009; Sali et al., 2015). In the meantime, the focus shifted towards
optimization-based decision-supporting models. These models determine a feeding policy for each
part individually (Limere et al., 2012). The cost-savings of those optimal hybrid policies were
significant, even when only considering two line feeding policies. This study has been extended
to consider the sizing of stations and preparation areas (Limere et al., 2015). Sali et al. (2015)
propose a descriptive cost model that distinguishes three line feeding policies. Sali and Sahin
(2016) transformed this model into an optimization model. The model is unique in ensuring
that all assembly and logistics activities can be executed without violating the cycle time. More
recently, Schmid et al. (2018, 2020) proposed models that compare all five line feeding policies
and minimize the cost of operation. Besides, this study found that flexible use of storage space
at the stations can reduce costs by up to 7%. Baller et al. (2020) also distinguish various line
feeding policies and even consider different load carrier quantities and sizes for those line feeding
policies.
6.2.3 Integration of both problems
The integration of line feeding and balancing has been considered a promising research project
(Limere, 2011; Schmid and Limere, 2019). In a first study, Sternatz (2015) investigated the
integration of both problems. The results indicate that costs may be reduced by up to 20%. This
study uses a heuristic procedure to solve various cases. However, this study only distinguishes
line stocking and stationary kitting and does not incorporate walking-related operation times.
Since the use of additional line feeding policies is expected to reduce feeding costs even further,
this study is not conclusive in its findings. Battini et al. (2016a) proposed a MILP model to solve
a problem with similar assumptions and limitations. However, also, ergonomic considerations
are taken into account. This work has been extended, and the integrated approach has been
compared to a hierarchical planning approach (Battini et al., 2017). Lastly, Wijnant et al.
(2018) investigated the impact of different assembly line balancing decisions on line feeding. To
this end, the authors balanced multiple assembly lines with various objectives. Afterward, the

Integrating ALFP and ALBP 137
feeding of those lines has been optimized, and results were compared for the same assembly
lines balanced with different objectives. The experiments show that the choice of the objective
heavily affects the costs of the feeding system. Summarizing these findings, it is evident that
simultaneously optimizing both problems will result in better solutions.
6.3 Problem definition
As this problem is a combination of both the ALBP and ALFP, each task f is assigned to
a station s and all parts, required for that task i ∈ If , are assigned to a feeding policy p. A
collection of parts, required for a specific task, is described as part family or family. Furthermore,
each part is also assigned to a location l at the BoL, i.e., the part storage area at each assembly
station, to determine walking distance and duration. The objective is to minimize the overall
costs of the resulting assembly system. Furthermore, the problem includes the determination
of the facility’s size, including the logistics facility, comprising a warehouse and supermarket,
and the shop floor. Supermarkets (also described as preparation areas) serve as logistics area in
which parts are repacked or sequenced.
The line feeding policies under consideration re line stocking (provision of large containers filled
with a single type of parts), boxed-supply (provision of smaller boxes filled with a single type of
parts), sequencing (provision of presorted interchangeable parts, e.g., differently colored parts),
stationary kitting (like sequencing but containing multiple sets of interchangeable parts used
at one station), and traveling kitting (like stationary kitting but containing parts for several
stations).
6.3.1 Planning environment
This problem affects multiple areas of an assembly system, represented in Figure 6.1. It shows
all processes (replenishment, preparation, transportation, and usage). In addition, a dispatch
process that covers some transportation within the logistics facility is considered in this work.
The exact execution of all theses processes varies for the different line feeding policies and will
be described in more detail when describing cost calculations (see Section 6.3.3).
Furthermore, the system includes three distinct types of storage areas: the warehouse (between
inbound and replenishment processes), the supermarket or preparation area (between replenish-
ment and preparation processes), and the storage at the border of line (BoL). In this study, the
inbound and outbound processes are excluded as they are mostly unaffected by balancing and
feeding decisions.
In contrast, the execution of the processes and the required areas for the warehouse, supermarket,
and shop floor depend on balancing and feeding decisions. For example, considering all parts to
be line stocked would require the largest warehouse since no parts are stored in the supermarket.
In this scenario, the supermarket is not needed. This scenario also does not include replenishment
or preparation processes. However, the assembly stations will be relatively large as load carriers
used in line stocking require much space. This would also increase the assembly operators’ time

138 Chapter 6
Focal company
Scope of assembly line feeding and balancing
Optional processes if parts are preprocessed
Figure 6.1 VSM1of the processes in the assembly system (Adjusted from Schmid and Limere (2019))
for walking and searching for the right part. In the other extreme case, all parts may be fed
in traveling kits. In this case, the warehouse area would be smaller as some of the pallets will
be stored in the preparation area. At the same time, it would require an extensive preparation
area. On the other hand, stations can be rather small since no space at the BoL is required.
In this scenario all processes depicted in Figure 6.1 are carried out. These two scenarios are
schematically contrasted in Figure 6.2.
Warehouse
Shop Floor
Assembly Line
Logistics facility width
Log
isti
csfa
cili
tyh
eigh
t
Warehouse Preparation areaS
hop
floor
hei
ght
Shop floor width
Shop Floor
Assembly Line
Figure 6.2 Shop floor plan of possible scenarios w.r.t preparation space (aerial view)
1Standardized VSM symbols are used; as only material flow is taken into account, push arrows are used.

Integrating ALFP and ALBP 139
Facility layout
The assembly line balancing problem assigns tasks to assembly stations. Therefore, it also
assigns parts to workstations. Balancing problems may incorporate the determination of the
stations’ size (see, e.g., Chica et al. (2016). Nevertheless, we exclude the determination of space
at the BoL, meaning the length and height of stations are defined a priori based on product
characteristics. Sternatz (2015) showed that the assignment of tasks (and parts) to stations
determines the optimal line feeding. Since the assembly line feeding problem determines the
number of parts undergoing preparation, it directly affects the space demand for preparation
activities. Therefore, this research includes the facility sizing for two reasons: (i) line feeding
decisions affect warehouse requirements both in terms of space but also in terms of the number
of warehouse racks required; (ii) balancing and line feeding decisions affect the warehouse’s and
supermarket’s sizing. Therefore, it affects space costs and transportation distances.
To optimize the logistics facility’s size, we discretized several options. The warehouse’s and
supermarket’s height is equal to the assembly line’s height. Their width and the share of su-
permarket and warehouse area varies for different options. There is a direct link between the
warehouse’s and the supermarket’s size as parts stored in the supermarket do not require storage
space in the warehouse.
Line balancing
As discussed above, assembly line balancing is a central aspect of planning the assembly system.
In practice, customer demand frequently determines the cycle time for assembly line balancing.
As demand-driven balancing is the most prevalent type of balancing, we also focus on this
type of line balancing, also known as Simple assembly line balancing problem type 1 (SALBP-1),
minimizing the number of workstations. However, in this study, the objective is slightly modified
to minimize costs incurred by using those workstations. This alteration does not change the
model’s output as costs do not vary for different stations. Besides, this research considers not
only balancing costs but also costs incurred through feeding. Therefore, a trade-off between
balancing-incurred and feeding-incurred costs may arise.
Line feeding
The BoL describes an area parallel to the assembly line, used to store parts and potentially
equipment or tools. However, in this work, it is assumed that the BoL is exclusively used to
store parts. Each assembly station, therefore, each station’s BoL is sized equally such that
one product fits a station. For an accurate determination of walking distances, we discretize
the available space by dividing it into equally sized locations. Furthermore, we distinguish two
categories of locations: (i) close locations, and (ii) distant locations. Using close locations is
far more attractive than using distant locations as operators have to walk shorter distances.
Furthermore, close and distant locations are mutually exclusive, as shown in Figure 6.3b).
Nevertheless, distant locations may be used under particular circumstances, namely when a kit
travels through a station (see Figure 6.3a)). Traveling kits travel close to the assembly line such

140 Chapter 6
a)
Station i− 1 Station i Station i+ 1
b)
Station i− 1 Station i Station i+ 1
Figure 6.3 Use of locations
that the operator does not have to walk to fetch parts. Therefore, traveling kits avoid the use of
close locations. In those cases, however, distant locations may be used for part storage. Figure
6.3 shows a series of stations with a traveling kit (the kits path is represented with an arc), using
some distant locations, and a series of stations without a traveling kit, using only close stations.
The optimization model proposed in this research allows for multiple traveling kits, i.e., one
traveling kit may serve stations 1-3, and another one may serve station 4-6. However, it should
be noted that traveling kits should never serve less than two stations, as conceptually they
would become stationary kits. We discretized all possible traveling kits to optimize their use.
For example, for an assembly line with three stations, the following traveling kits may be used:
Tr. kit 1, serving station 1 and 2; Tr. kit 2, serving stations 1, 2, and 3. Tr. kit 3, serving
stations 2 and 3.
Assumptions
The problem studied in the following, relies on several assumptions, listed below:
1. Demand is assumed to be deterministic.
2. Operation times are assumed to be deterministic.
3. Parts are assumed to be used for one task only.
4. Costs are optimized over a defined planning horizon.
5. Transportation and replenishment distances depend on the facility’s sizing and are esti-
mated as averages.
6. The logistics facility consists of a single logistics area, including a warehouse and a super-
market.
7. Each line feeding policy uses one type of load carrier with predetermined capacity.

Integrating ALFP and ALBP 141
8. Demand points, therefore, walking times of assembly operators depend on the tasks as-
signed to a station.
9. All set elements (except line feeding policies) are assumed to be a sequence of natural
numbers.
As both, demand and operation times are assumed to be deterministic, cost calculations and con-
straint satisfaction do only depend on the parameter values. Relaxing these assumptions would
lead to stochastic problems that would need to be tackled by stochastic, robust, or distribution-
ally robust programming approaches. It is assumed that each part is uniquely used for a specific
task. This is done to simplify the problem. Otherwise, one would need to calculate the amount
of space required in the preparation area in more detail. That is, some parts supplied to different
stations by a single traveling kits may be the same, which would only require to store one pallet
of this part in the kitting cell instead of multiple ones. The costs are calculated for a fixed time
horizon to make the results comparable. It is important to note that in this work, compared to
other studies, the replenishment and transportation distances depend on the logistics facility’s
size. Therefore, the respective costs change whenever a different facility size is chosen. As we
do not determine the exact positioning of preparation operations within the preparation area,
distances are estimated as average transportation distances. To relax this assumption, more
detailed modeling would be required. All load carriers used for the different line feeding policies
are assumed to be equally sized to simplify the model. However, this may be relaxed by adding
additional load carrier options to each feeding policy. When calculating walking distances, it
needs to be determined at which point at the line a part is used. To calculate this, we consider
the number of tasks per station and their duration. One may also (optimally) sequence the
tasks at each station considering their precedence relations. However, this would likely result in
either a nonlinear or cumbersome model formulation. The final assumption is taken to facilitate
a simpler notation and a more efficient problem formulation.
6.3.2 Solution approach
The problem discussed in this study is solved by solving different mathematical programming
models. The notation for all models is presented in Table 6.1. The table contains multiple cost
parameters, which we discuss in more detail in Section 6.3.3. For this, we will also introduce
additional parameters. The following indices are used when referring to a particular feeding
policy: L - line stocking; B boxed-supply; S - sequencing; K - stationary kitting; T - traveling
kitting.
Table 6.1 Notation for optimization models
Sets
A Set of logistics facilities B Set of subproblems
Bk Set of subproblems in callback k DPf Set of direct predecessors of part family f
F Set of part families Fkb Set of part families in subproblem b of callback
k

142 Chapter 6
Fm Set of part families used for model m Fp Set of part families assignable to policy p
Fs Set of part families assignable to station s H Set of master iterations
I Set of parts If Set of parts in family f
Ikb Set of parts in subproblem b of callback k Ip Set of parts assignable to policy p
Is Set of parts assignable to station s K Set of master callbacks
L Set of locations and set of tr. kits LBs Set of locations at the border of line of station
s
Lfp Set of locations/tr. kits that may be used for
family f in policy p
Lkb Set of locations that can be used in callback k
and subproblem b
Lp Set of locations or tr. kits usable by policy p Lsp Locations usable by station s and p
M Set of product models P Set of line feeding policies
Pi Set of line feeding policies for part i
Pkb Set of feeding policies available in callback k
and and subproblem b
R Set of resources under consideration (Weight
and Volume)
S Set of assembly stations
Si Set of assembly stations to which part i may
be assigned
Sf Set of assembly stations to which family f may
be assigned
Skb Set of assembly stations in subproblem b of
callback k
SSl Set of stations that may be served by traveling
kit l
Variables
αf Auxiliary variable for the assignment of family
f
ab Space variable for subproblem b
χl Variable indicating whether traveling kit l is
used
χpl Variable indicating whether location l is used
for policy p
ψfpl Variable indicating whether family f is as-
signed to location l and feeding policy p
tf Assembly time of family f
va Variable indicating whether logistics facility a
is used
xipl Variable indicating whether part i is assigned
to location l and line feeding policy p
xfs Assigning family f to station s ys Variable indicating the use of station s
zb Optimality variable for subproblem b
Parameters
ah Logistics facility selected in callback k a∗kb Size required in preparation area for subprob-
lem b of callback k
a∗k Size required in preparation area for callback
k
aa Space in preparation area a
aip Space required to prepare part i for policy p ca Costs to use preparation area a
cispla Costs for providing part i to location l with
line feeding policy p and logistics facility a
cfpla Costs to provide part family f to location l
using policy p when using preparation a
cl Costs to use traveling kit l cpla Costs to provide use a location l for policy p
when using preparation a
cs Costs to open a station ct Cycle time
lkb Index of traveling kit used in in subproblem b
of callback k
l′pl Location l used to store a part that is fed with
policy p to location/kit k
M A sufficiently large number rir Resource requirement of resource r for a box
of part i
rfr Resource requirement of resource r for family
f
Rpr Resource availability of resource r for policy p
sik Station of part i in callback k sfk Station of family f in callback k

Integrating ALFP and ALBP 143
tAf Assembly time of part family f tiplh Walking and searching time of the assembly
operator if part i is assigned to policy p and
location l in iteration h
tiplk Walking and searching time of the assembly
operator if part i is assigned to policy p and
location l in callback k
tl Minimum walking time to location l
sLl Station at which traveling kit l is leaving the
line
z∗kb Optimal costs for subproblem b of callback k
zrkb Relaxed master costs for subproblem b of call-
back k
The problem discussed in this study is far more complicated than the individual problems of
balancing and feeding as it integrates the individual problems and extends their scope, i.e., we
added decisions on multiple traveling kits and the facility size in this problem. As discussed
in Section 6.2, both problems are mostly solved sequentially in practice and theory. Therefore,
the use of a decomposition technique seems appropriate. Since we are the first to propose a
model and a solution approach for this particular problem, we intend to provide an optimal
solution approach. Optimal decomposition approaches can be distinguished into row generation
and column generation techniques. Both techniques decompose the problem into two problems.
One well-studied row generation decomposition approach is Bender’s decomposition. Here, the
master problem contains some of the difficult decisions, whereas the subproblem solves ”lower-
level” decisions suiting the solution of the master Bender (1962). This approach was often
applied to facility location problems, where the opening of facilities are the difficult decisions in
the master and the assignment of customers to the opened facilities are the easier decisions taken
in the subproblem (see, e.g., Fischetti et al. (2017); Wentges (1996)). In contrast, the problems
are transformed through the Dantzig-Wolfe transformation for column generation approaches
Barnhart et al. (1998). This transformation often changes the problem such that the master
problem needs to select some variables from a large set of variables. Since the creation of all
possible variables is intractable in many practical cases, the variables are created whenever the
master found a solution.
For this study, we decided to apply a logic-based Bender’s decomposition. While the classic Ben-
der’s decomposition does not allow integer decision variables in the subproblem, this is feasible
in the logic-based approach. However, in the classic Bender’s decomposition, the cuts (rows)
generated by the subproblem have a standardized. Contrarily, in a logic-based Bender’s de-
composition, they must be derived based on the problem’s characteristics. This approach was
preferred over a column generation (CG) approach for a few reasons: (i) To apply a CG approach,
it would be necessary to calculate the point of demand for each task and the associated families
as this is necessary to calculate walking times correctly. While this is certainly feasible, it would
create many nonlinear constraints that would slow down the problem. (ii) the problem represents
an integration of two problems that are typically solved sequentially. Therefore, solving those
problems and linking them in a logic-based Bender’s decomposition framework seemed to be a
straightforward approach. (iii) the costs obtained from the subproblems depend on a decision

144 Chapter 6
variable in the master problem. When translating this into a CG-based approach, this master
variable would need to be somewhat considered in the subproblems. Thus, the subproblems
would need to include the space variable, which would avoid a decomposition on a station level
and complicate the subproblems. Another option would be to handle this through some logical
constraints in the master, which would also complicate the master problem. To summarize,
we believe that a logic-based Bender’s decomposition is more suited than a column generation
based approach. Nevertheless, there may be a problem formulation that does not suffer from the
above-mentioned issues.
We decompose the problem in two stages: 1. A balancing stage, which determines the number
of stations, assigns tasks to stations, sizes the warehouse and supermarket, and determines
the use of traveling kits. This is also called the master problem 2. A feeding stage, which
determines the parts’ feeding policies and placement at the BoL. The second stage solves the
feeding problem and is referred to as the subproblem stage. For this, two types of subproblems
are distinguished: (i) subproblems that contain a single station, not served by a traveling kit;
and (ii) subproblems that contain multiple stations that are all served by the same traveling
kit. The subproblems’ solutions determine feeding costs and the amount of space required in the
warehouse and preparation area. Therefore, it needs to be verified if a solution to the master
problem is feasible concerning the preparation area space. To this end, we solve a feasibility
problem in a callback procedure that determines the minimum amount of space required in the
preparation area and adds lazy constraints accordingly.
Due to the problem’s intractability, a linear relaxation of the subproblems may be added (shown
in Appendix C). Finding an optimal solution to the master problem in each iteration also slows
down computations. Therefore, we utilize an ε-based approach (see, e.g., Rahmaniani et al.
(2017)), which interrupts the master problem when it finds a solution with an optimality gap of
ε or less. This epsilon is reduced based on a sigmoid function when a non-optimal solution is
found repeatedly.
It remains to be stated that, even though a master problem and all subproblems may be feasible,
the overall solution might be infeasible. This problem arises when the amount of space required
in the preparation area determined in the optimality subproblem is larger than the amount of
space designated by the master problem and ensured by the minimum space generated in the
callback. In the before-mentioned case, the entire line’s feeding needs to be optimized in a single
optimality subproblem. Figure 6.4 shows the proposed solution procedure for this decomposition
schematically.
The sequence of solving the feasibility subproblems in a callback and the optimality subproblems
after finding a (sufficiently good) master solution was chosen based on computational pretests.

Integrating ALFP and ALBP 145
Master problem(linear rel.)
Optimal?
new sol.?
Opt. subproblem
Spacefeasible?
Relaxationincluded?
Opt. cuts(6.38)(6.39)
Adjust ε
new sol.?
Large opt.subproblem
Feas. subproblem
Stop
Opt. cuts(6.40)(6.41)
Callback
Lazy constraint
No
Y es
No
Y es
No
Y es
No
Yes
Y es
No
Addopt.
cut
Addopt.
cut
Figure 6.4 Algorithmic steps of logic-based Benders’ decomposition
Master problem
minimize∑s∈S
csys +∑l∈LT
clχl +∑a∈A
cava +∑b∈B
zb (6.1)
s.t.∑s∈Sf
xfs = 1 ∀f ∈ F (6.2)
αf ≤ αg ∀g ∈ F ∀f ∈ DPg (6.3)∑s∈Sf
sxfs = αf ∀f ∈ F (6.4)
∑f∈Fs∩Fm
tAf xfs ≤ ctys ∀s ∈ S ∀m ∈M (6.5)
ys ≤ ys−1 ∀s ∈ S : s > s+ 1 (6.6)∑l∈LT :s∈SS
l
χl ≤ ys ∀s ∈ S (6.7)
∑a∈A
va = 1 (6.8)

146 Chapter 6
∑b∈B
ab ≤∑a∈A
aava (6.9)
ys = 1 ∀s ∈ S : s ≤ s (6.10)
ys ∈ 0, 1 ∀s ∈ S : s > s (6.11)
xfs ∈ 0, 1 ∀f ∈ F ∀s ∈ Sf (6.12)
χl ∈ 0, 1 ∀l ∈ LT (6.13)
va ∈ 0, 1 ∀a ∈ A (6.14)
ab, zb ≥ 0 ∀b ∈ B (6.15)
αf ∈ Z ∀b ∈ B (6.16)
As described above, the master problem addresses the balancing of the line (i.e., the assignment
of tasks to workstations and the opening of workstations), the use of traveling kits, and the sizing
of the preparation area. Those decisions also impact the objective function (see Equation (6.1))
as each of these decisions incurs specific costs. Constraints (6.2) and (6.3) ensure the assignment
of all tasks and adherence to the precedence relations, respectively. Cycle time restrictions are
ensured in Constraint (6.5). Constraint (6.6) ensures that a station is not used if the previous
station is not used either. While this constraint is often added to reduce symmetry in the solution,
it is essential to this study because of the discretization of traveling kits: the use of a certain
traveling kit is defined by the stations at which it enters and leaves. If stations in between are
not used, the number of stations served (and the related costs) is no longer correct.
In this research, we assume there is only space for one traveling kit at each station. Thus, only
one traveling kit may traverse a station (see Constraint (6.7)). Furthermore, this constraint
ensures that traveling kits only serve stations that are opened.
A third aspect of the master problem is to ensure that preparation space is sufficient. Since the
amount of space, however, depends on the solution to the subproblems, additional variables are
used to incorporate the information from the lazy callback (see Constraints (6.32) and (6.33)).
This information can then be used in Constraint (6.9).
Finally, the master problem considers optimality cuts generated from the optimality subproblems.
Whenever the master problem is solved, several subproblems are derived. The exact number de-
pends on the number of disconnected and connected stations in the solution of the master. In this
study, we use the notation for callback iterations (k) and master iterations (h) interchangeably.
Let Bh denote the set of subproblems of iteration h. Then, |Bh| =∑s∈S y
hs −
∑l∈LT
|SSl |χhl with
yhs being the stations opened and χhl being the set of traveling kits used in the current iteration
h. This translates into two types of subproblems. The first type describes a subproblem for each
station not served by any traveling kit. The second type solves a subproblem for each traveling
kit and includes all stations served by that traveling kit. For each subproblem of an iteration,
the set of stations in that problem is defined as Shb. Similarly, we define the set of locations Lhb,the set of families Fhb, and the set of parts Ihb for that subproblem.

Integrating ALFP and ALBP 147
Feasibility subproblem
This model builds upon the model described in Schmid et al. (2020). However, we made some
adjustments to incorporate cycle time constraints and to simplify the model’s representation.
minimize∑i∈Ikb
∑p∈Pi
∑l∈Lsikp
xiplaip (6.17)
∑p∈Pi∩Pkb
∑l∈Lsikp∩Lkb
xipl = 1 ∀i ∈ Ikb (6.18)
∑p∈Pi∩Pkb
∑l∈Lsikp∩Lkb
tiplkxipl + tAf ≤ tf ∀f ∈ Fkb ∀i ∈ If (6.19)
∑f∈Fs∩Fm:sfk=s
tf ≤ ct ∀s ∈ Skb ∀m ∈M (6.20)
xipl ≤ χpl′pl ∀i ∈ Ikb ∀p ∈ Pi ∩ Pkb ∀l ∈ Lsikp ∩ Lkb(6.21)∑
p∈Pχpl ≤ 1 ∀s ∈ Skb ∀l ∈ LBs (6.22)
xipl ≤ ψfpl ∀f ∈ Fkb ∀i ∈ If ∀p ∈ S,K, T
∀l ∈ Lsfkp ∩ Lkb (6.23)∑i∈Is∩Ikb:sik=s
xiLl +∑
f∈Fs∩Fkb:sfk=s
ψfSl ≤ 1 ∀s ∈ Skb ∀l ∈ Lkb \ LsT (6.24)
∑i∈Is∩Ikb:sik=s
rirxiBl ≤ RBrχBl ∀s ∈ Skb ∀l ∈ Lkb ∩ LsB ∀r ∈ R (6.25)
∑f∈Fm∩Fp∩Fkb
rfrψfpl ≤ Rprχpl ∀m ∈M ∀p ∈ K,T ∀l ∈ Lp ∩ Lkb
(6.26)∑l∈Lbk∩Lsikp
xipl −∑
l∈Lbk∩Lsjkp
xjpl = 0 ∀f ∈ Fbk ∀i, j ∈ If : i < j ∀p ∈ Pf (6.27)
xipl ∈ 0, 1 ∀i ∈ Ikb ∀p ∈ Pi ∀l ∈ Lsikp ∩ Lkb (6.28)
ψfpl ∈ 0, 1 ∀f ∈ Fkb ∀p ∈ Pf ∀l ∈ Lsfkp ∩ Lkb (6.29)
χpl ∈ 0, 1 ∀p ∈ P ∀l ∈ Lkb (6.30)
tf ≥ tAf ∀f ∈ F (6.31)
This model optimizes the assignment of parts to feeding policies while minimizing the space
needed in the preparation area (see Equation (6.17)). To that end, the model assigns each part
to a feeding policy and location (Equation (6.18). It should be noted that a location refers to
a discretized location as shown in Figure 6.3 for all feeding policies except traveling kits. In

148 Chapter 6
contrast, in the case of traveling kits, it refers to a specific traveling kit from the set of traveling
kits. Each traveling kit has a specific starting and ending point defined by the entering and leaving
locations at the border of line. Again, the cycle time must not be violated (Equation (6.20). To
this end, accurate task times are calculated in Constraint (6.19), taking into account searching
and walking times. The walking distances depend on the part positioning at the BoL and the
demand/assembly point at the line, where the part (family) is needed. These demand points
are calculated before solving this model based on the assembly times of all tasks at a station.
In Constraint (6.21), we introduce an indicator variable χpl that is linked to the assignment
variables xipl, and is used to ensure that no location is used for more than one policy (Constraint
(6.22)). The location(s) l′ that need to be blocked for a policy depends on the policy. For all line
feeding policies except traveling kits l′ = l. However, for traveling kits l′pl is different from l as it
refers to the discretized locations instead of the traveling kit’s index l. Another indicator variable
ψfpl is introduced in Constraint (6.23) to indicate whether any part of family f is assigned to
policy p and location l.
Next, the feasibility of part positioning is ensured. To this end, we allow either a single part to
be line stocked or a family to be sequenced at a single location (Constraint (6.24). Furthermore,
it is verified that all boxes assigned to a location fit into a rack (Constraint (6.25)), and all
parts assigned to a kit match its volume and weight capacities (Constraint (6.26)). Lastly,
Constraint (6.27) enforces the assignment of a family’s parts to the same feeding policy. This
equal assignment has multiple reasons: (i) it simplifies operations for the operator; (ii) possible
gains in relaxing this constraint are marginal (see Schmid et al. (2020)); and (iii) it simplifies
the solution of the model.
This model may be feasible or infeasible since the master problem is neglecting information
on walking and searching times and on the BoL space (if the master includes the subproblems
relaxation, it considers some information but only in a non-integral form). Let the optimal
solution of subproblem b in callback k be denoted by a∗kb. After solving each subproblem, lazy
constraints of type (6.32) or (6.33) will be added for each subproblem solved. The former is for
subproblems with a single, and the latter for subproblems with multiple stations. Potentially,
multiple lazy constraints are added based on a single subproblem.
a∗kb +M
∑f∈Fkb
(xfs − 1)−∑
l∈LT :s∈SSl
χl
≤ ab ∀k ∈ K ∀b ∈ Bk : |Skb| = 1
∀s ∈ S : Fkb ⊆ Fs (6.32)
a∗kb +M
∑f∈Fkb
(xfsfk− 1) +
∑l∈LT :SS
lkb⊂SS
l
χl − 1
≤ ab ∀k ∈ K ∀b ∈ Bk : |Skb| > 1 (6.33)
If the subproblem is infeasible, too many families have been assigned to the set of stations in the
subproblem. Infeasibility can be rooted in the required operation times, i.e., the worker is not
able to perform all tasks within the allowed time (see Constraints (6.19) and (6.20)). Another

Integrating ALFP and ALBP 149
cause for infeasibility may be space insufficiency (see Constraints (6.24)-(6.27)). Either way, the
number of tasks and parts in the subproblem is too high and must be reduced. To this end, one
of the following combinatorial cuts is added to the master as a lazy constraint. If the subproblem
contains a single station, the first cut is added, whereas the second cut is added if the subproblem
contains a linking traveling kit serving multiple stations.∑f∈Fkb
xfs ≤ |Fkb| − 1 +∑
l∈L:skb∈SSl
χl ∀k ∈ K ∀b ∈ Bk ∀s ∈ S : Fkb ⊆ Fs
(6.34)∑f∈Fkb
xfsfk+
∑l∈LT :SS
lkb⊆SS
l
χlkb≤ |Fkb| ∀k ∈ K ∀b ∈ Bk : |Skb| > 1 (6.35)
These cuts avoid a repetition of the same assignment. However, the use of a traveling kit may
avoid this infeasibility (see Constraint (6.34)) because it may reduce operation times or space
requirements at the border of line.
Optimality subproblem
The optimality subproblems start from a feasible master solution where each iteration is labeled
h, replacing k from the feasibility subproblems. This model determines the minimum feeding
costs for each subproblem given the assignment of families. This includes three cost parameters:
(i) cipla including investment, replenishment, preparation, and transportation costs ; (ii) cfpla
including investment, preparation, dispatch, and transportation costs ; and (iii) cpla including,
dispatch, and transportation costs. We will discuss the exact cost calculations in the next section.
∑i∈Ihb
∑p∈P
∑l∈Lsihp
ciplahxipl +∑f∈Fhb
∑p∈Pf
∑l∈Lsfhp
cfplahψfpl +∑p∈P
∑l∈Lp∩Lhb
cplahχpl (6.36)
s.t. (6.18)− (6.31)∑i∈Ihb
∑p∈Pi
∑l∈Lsihp
aipxisihpl ≤ aah (6.37)
Due to the feasibility cuts based on the feasibility subproblem added in the callback, the opti-
mality subproblems are always feasible. Their solutions are used to add an optimality cut to the
master problem. Similar to the feasibility subproblems, optimality subproblems may be used to
generate multiple cuts. Let z∗b denote the optimal solution value to the subproblem at hand.
Then, either an optimality cut of type (6.38) or (6.39) is added to the master problem.

150 Chapter 6
z∗hb +M
∑f∈Fhc
(xfs − 1) +∑
a∈A:a>ah
va − 1−∑
l∈LT :s∈SSl
χl
≤ zb ∀h ∈ H
∀b ∈ Bh : |Shb| = 1∀s ∈ S : s ≥ sbk ∧ Fhb ⊂ Fs (6.38)
z∗hb +M
∑f∈Fhc
(xfsfk− 1) +
∑a∈A:a>ah
va − 1 + (χlhb− 1)−
∑l∈LT :SS
l ⊂SSlhb
χl
≤ zb ∀h ∈ H
∀b ∈ Bh : |Shb| > 1 (6.39)
In case the master problem contains the subproblems’ relaxation, cuts must be adjusted. Most
importantly, these cuts can only be added if the sum of required space in the preparation area is
smaller than or equal to the available space. Otherwise, the relaxed costs of the master problem
might be higher than the costs determined in the subproblem. Lastly, the relaxation costs,
denoted zrhb have to be subtracted from the subproblem’s costs.
z∗hb − zrhb +M
∑f∈Fhc
(xfs − 1) +∑
a∈A:a>ah
va − 1−∑
l∈LT :s∈SSl
χl
≤ zb ∀h ∈ H
∀b ∈ Bh : |Shb| = 1 ∀s ∈ S : s ≥ sbk ∧ Fhb ⊂ Fs (6.40)
z∗hb − zrhb +M
∑f∈Fhc
(xfsfh− 1) +
∑a∈A:a>ah
va − 1 + (χlhb− 1)−
∑l∈LT :SS
l ⊂SSlhb
χl
≤ zb ∀h ∈ H
∀b ∈ Bh : |Shb| > 1 (6.41)
Final step
After all the optimality subproblems are solved, the solution must be checked for preparation-
space feasibility. For this, the required preparation area space of all optimality subproblems in
iteration h is summed up: a∗h =∑b∈Bh
a∗hb. Then, the algorithm may proceed with one of the
following options:
• a∗h ≤ aah : The solution is optimal given the current master solution and feasible. Optimal-
ity cuts (see Constraints (6.38)-(6.41)) are added to the master problem, and the iteration
stops.
• a∗h ≥ aah : The solutions obtained from the optimality subproblems do not match the
solution of the master problem as preparation area space is insufficient. To obtain a feasible
solution, an optimality subproblem, including all stations, must be solved. Afterward, a
single optimality cut is given to the master.

Integrating ALFP and ALBP 151
6.3.3 Cost calculation
The costs considered in this model are split up into multiple blocks as they depend on different
decisions and, therefore, on the value of different decision variables. Each of these blocks com-
prises different costs arising from the processes of replenishment (R), preparation (P), dispatch
(D), transportation (T), and usage (U) or investments (I), and space cost (S). The processes and
investment or space costs are described by a superscript. It is important to note that even one
costs parameter does not necessarily include the same processes when considering different line
feeding policies. E.g., transportation costs for line stocking are included in cipla whereas they
are included in cpla for stationary kits. The different cost blocks are cipla, cfpla, cpla, cs, ca, cl.
The former four consists of costs originating in different processes, whereas the latter only con-
sists of a single origin cost (see Equations (6.42)-(6.45). The individual cost components will be
described in the following subsections. The notation used throughout this section is presented
in Table 6.2. The table introduces the used symbols, described them, and provides some values.
However, for values that highly on the problem instance, this is indicated by var.
cipla = cIispl + cRispl + cPispl + cTispl ∀i ∈ I ∀s ∈ Si ∀p ∈ P ∀l ∈ Lsp (6.42)
cfpla = cIfpl + cPfpl + cDfpl + cTfpl+ ∀f ∈ F ∀p ∈ P ∀l ∈ Lfp (6.43)
cpla = cIpla + cDpla + cTpla ∀p ∈ P ∀l ∈ Lp (6.44)
cs = csS + csU + csI (6.45)
ca = cS (6.46)
cl = cI (6.47)
It is important to remark that this section’s cost calculations are not generalizable to any as-
sembly facility. However, we aimed to describe them such that adjustments can easily be made.
The following enumeration list the assumptions for cost calculations described in the following.
1. The same vehicle type transports all parts assigned to a particular line feeding policy.
Namely, forklifts are used for line stocking, tugger-trains for boxed-supply, sequencing, and
stationary kitting, and AGVs for traveling kitting.
2. The individual preparation cells are spread over the entire supermarket area. For the
estimation of transportation distances, only the width of the supermarket area and ware-
house are considered (see Figure 6.2. For replenishment, the entire warehouse width and
half the supermarket width are considered. For dispatching, half the supermarket width is
considered.
3. Whenever kits are used, it is assumed that each product requires a kit.
Table 6.2 Parameters used for cost calculations
Parameter Description Value
ALB Aisle length for boxed-supply preparation cells 50m

152 Chapter 6
εF Forklift utilization rate 90%
εL Utilization rate logistical operators 80%
εT Utilization rate tugger trains 90%
λ Demand for all products 15840
λf Normalized demand of part family f [31− 14, 436]
λm Demand for model m [1, 584− 11, 088]
λi Demand for part i [4− 57, 810]
aS Area of an assembly station 42− 69m2
aPa Area in supermarket for logistics facility a var
aWa Area in warehouse for logistics facility a var
ALf Aisle length for the sequencing cell of part fam-
ily f
var
AL′i Incremental aisle length caused by part i 0.8m
aoc Assembly operator costs 30$/h
bsp Preparation batch size for policy p n.a., 5, 1, 12, 1ccp Depreciation cost for a container used for feed-
ing policy p
n.a., 0.1, 0.3, 8.33, 8.33($/month)
cal Investment cost assembly line 8.33$/(month m)
cfr Depreciation cost for a flow rack 5.33$/month
cnf Number of containers required for part family
f when sequenced
3
cni Number of boxes required for part i when box-
supplied
var
cnp Number of containers required for a kit (p ∈K,T)
3, var
cp Depreciation costs of a pick-by-light system at-
tached to a flow rack
2.08$/month
ct Cycle time 120s
cwr Depreciation cost for a rack spot in the ware-
house
1.67$/month
dda Dispatch distance for logistics facility a var
dial Transportation distance from warehouse to lo-
cation l when using logistics facility a
var
fv Forklift velocity 2.8m/s
lca Depreciation cost for an AGV 416.66$/month
lcf Lease costs for a forklift 1500$/month
lct Lease costs for a tugger train 500$/month
loc Costs for a logistical operator 20$/h
mrp Milk run length for feeding policy p var
nf Number of parts in a sequencing container for
family f
var
nip Number of parts of type i in a load carrier used
for feeding policy p
var
nal Number of AGVs required for tr. Kit l var
ov Operator Velocity 0.8m/s
pnip Number of pallets of part i stored in the ware-
house when fed with policy p
var
ptip Picking time in preparation area for feeding
policy p and part i
var
rdpa Replenishment distance for feeding policy p
and logistics area a
var

Integrating ALFP and ALBP 153
sl Length of a station var
sc Space leasing/depreciation costs 16.67$/(month m2)
stp Searching time in preparation for feeding pol-
icy p
var
tD Dropp-off time for a pallet 17s
tPip Pickup time for part i and line feeding policy
p
var
ttc Tugger train coupling an loading time 30s
ttdp Tugger train dropoff time for feeding policy p n.a., 18, 30, 30, n.a.ttv Tugger train velocity m/s
v Volume of a kit container 1.92m3
vi Volume of a box of part i var
vf Volume of a sequencing container of family f var
voc Cost for vehicle operators 25$/h
vtt Volume tugger train 3.84m3
Space costs
As shown in Figure 6.2, the space required for warehousing and preparation area depends on
the decisions made in the feeding systems. If many parts are preprocessed, more space is needed
in the preparation area and spatial requirement for the warehouse reduces. Therefore, several
possible different sizes for the logistics area are defined of which one will be selected (see Equation
(6.8)). Each logistics area is defined by a corresponding warehouse size and a preparation area
size. The size of the warehouse aWa and preparation area aPa can be directly linked and, therefore,
combined in this study. The costs of every option is simply calculated by the area aa in space
units multiplied with costs for a space unit sc.
ca = (aWa + aPa )sc ∀a ∈ A (6.48)
Space costs also need to be considered for the shop floor since the use of additional stations
increases the demand for space. Here, the space of a single station aS is also multiplied with the
costs per space unit sc
csS = aSsc (6.49)
Investment costs
Investment costs arise at multiple places: The provision of parts in any container requires to buy
several containers at a price of ccp. The numbers of containers for boxed-supply cni, sequencing
cnf and both types of kits cnp (see Equations (6.50)-(6.55)) may vary. Furthermore, one has to
consider the investment in warehouse racks that store pallets of parts. Thus, the the number
of pallets in racks pnip is multiplied with the cost for a rack spot cwr (see Equation (6.50)).
The number of pallets depends on the feeding policy, as line-stocked parts are stored in the
warehouse, whereas other feeding policies store parts in the warehouse and the supermarket.

154 Chapter 6
Another occurrence of investment costs is the placement of flow racks at the BoL, needed to
hold box-supplied parts. In this case, the depreciation or leasing costs of a flow rack cfr need
to be considered. Additionally, picking support systems, such as pick-by-light may be leased
depreciated with cost cp (see Equation (6.52)). Lastly, this research assumes that AGVs transport
traveling kits. Therefore, several AGVs nal need to be leased or depreciated at costs lca. nal
depends on the stations a particular kit is serving and considers that kits need to be refilled.
From an assembly line balancing perspective, additional costs arise for the investment in assembly
line conveyor technology, depending on the size of the stations and ultimately on the number of
stations (see Equation 6.56).
cIipla = pnipcwr ∀i ∈ I ∀s ∈ Si ∀p ∈ P \ B ∀l ∈ Lsp ∀a ∈ A (6.50)
cIiBla = cniccB + npiBcwr ∀i ∈ I ∀s ∈ Si ∀l ∈ Lsp ∀a ∈ A (6.51)
cIfSla = cnfccS ∀f ∈ F ∀l ∈ Lp ∀a ∈ A (6.52)
cIBla = cfr + cp ∀l ∈ LB ∀a ∈ A (6.53)
cIKla = cnKccK ∀l ∈ LK ∀a ∈ A (6.54)
cIl = cnT ccT + nallca ∀l ∈ LT (6.55)
csI = cal sl (6.56)
Replenishment costs
Replenishment costs occur when parts have to be delivered to the supermarket for boxed-supply,
sequencing, or kitting. Replenishment costs depend on the warehouse’s and preparation area’s
size. Additionally, pallet pickup times at the warehouse tPip and drop-off times at the supermarket
tD are considered in replenishment cost calculations. Since parts can either be stored (in multiple
layers) on the floor or in racks in the warehouse, pickup times may vary. A part’s feeding policy
determines whether a part is stored on the floor (also known as block stacking) or in a rack.
Since the number of pallets stored in the warehouse depends on the feeding policy, we utilize it
to determine whether a part is block-stacked or rack-stored. To this end, we defined a threshold
on the number of pallets. If the number of pallets is lower than this threshold, it is stored in a
rack, otherwise in block-storage.
For the calculation of replenishment costs, we consider (un-)loading and transportation times
and multiply it with forklift investment (lcf), and vehicle operator costs voc. Transportation
time consider the distance rdpa, forklifts velocity fv, and forklift utilization rate εF . Lastly, costs
are multiplied by the number of pallets transported, which is defined by the part’s demand λi
and the number of parts on a pallet niL.
cRipla = (voc+ lcf)((tPip + tD) +rdpaεF fv
)λiniL
∀i ∈ I ∀s ∈ Si ∀p ∈ Pi \ L ∀l ∈ Lsp ∀a ∈ A
(6.57)

Integrating ALFP and ALBP 155
Preparation costs
Preparation costs are incurred by the logistics workers labor when picking parts and placing
them in a different load carrier such as boxes, sequencing containers, or kitting containers. In
sequencing and kitting parts are also presorted. Costs for preparation typically differ for each
feeding policy due the batch size, i.e., the number of load carriers that can be prepared simul-
taneously, the required accuracy (no sequencing vs. sequencing) and the size of the preparation
cell. A preparation cell describes a smaller area within the supermarket. In sequencing, e.g., each
cell contains all part (variants) of a specific part family. In kitting, all part families, supplied
with a certain kit, and their parts are included. Boxed-supply cells contain many different parts
from different families. The size of a cell, here measured by the length of an aisle, determines
the walking duration.
cPiBla = locλi
niBεLl
[ ALBbsBov
+ stB + ptiBniB
]∀i ∈ IB ∀l ∈ LB ∀a ∈ A (6.58)
cPfSla = locλfniSεl
[ ALfbsSov
+ (stS + ptiS)niS
]∀f ∈ F ∩ FS ∀l ∈ LS ∀a ∈ A (6.59)
cPiKla = loc(λiεL
(stK + ptiK) +λAL
′
i
bsKovεL) ∀i ∈ I ∀l ∈ LK ∀a ∈ A (6.60)
cPiT la = loc(λiεL
(stT + ptiT ) +λAL
′
i
bsT ovεL) ∀i ∈ I ∀l ∈ Lsp ∀a ∈ A (6.61)
Equation (6.58) covers cost for boxed-supply if parts are loosely provided on a pallet and have to
be repacked. Equation (6.59) combines the costs for all parts of a family if provided in sequenced
containers. Equation (6.60) describes costs for parts in stationary kits and preparation costs
for parts in traveling kits are calculated in Equation (6.61). For kits, the kitting cell’s size is
unknown. Therefore, an incremental aisle length AL′
i, depending on the pallets width, is used
to calculate walking distances.
Dispatch costs
After parts have been prepared, containers need to be placed in a dispatch zone, where they
are picked up for final transportation. This concerns only sequenced containers and stationary
kits. Line stocked parts do not undergo preparation and, therefore, do not require dispatching.
In this study, it is assumed that preparation areas for boxed-supply are placed at the dispatch.
Therefore, no dispatching activity is needed. Sequencing containers and traveling kits may be
prepared anywhere in the supermarket. Therefore, they need to be dispatched. It is assumed that
workers push the container to the dispatch zone. Since the distance depends on the factory’s size,
calculation is done similar to replenishment costs. In this study, traveling kits are transported
by dedicated AGVs. Therefore, dispatch is not needed either.
The dispatch distances dda are estimations based on the assumption that the average preparation
cell is placed in the center of the supermarket. In practice, one may arrange cells optimally.

156 Chapter 6
However, this level of detail is out of scope of this research. Based upon this assumption, the
operators have to travel half the width of the supermarket in both directions.
cDfSl = locλfddanfOV εL
∀f ∈ F ∀p ∈ Pi ∀l ∈ Lp (6.62)
cK lD = loc
λddabsKOV εL
∀l ∈ LK (6.63)
Transportation costs
During the transportation process, parts are delivered to the BoL. The number of transports
depends on part demands divided by the number of parts in a load carrier. The result is multiplied
with vehicle operator costs voc and the investment or leasing costs for the forklifts lcf and
tugger trains lct, respectively. Lastly, this is multiplied by the time, which is calculated based on
transportation distance and (un)loading activities divided by the vehicles’ utilization rates (εF
for forklifts and εT for tugger trains). Transportation distances depend on the direct distances
dil for forklifts and the milk-run lengths for boxed-supply, sequencing, and stationary kitting.
Whenever tugger trains are used, only a fraction of their costs is calculated as they can typically
hold more than one load carrier. To this end, we divide the load carriers volume (vi for boxes,vf
for sequenced containers, and v for st. kits) by the tugger train’s volume ttv.
cTiLla = (vo+ lcf)λiniL
(2dialεF fv
+tPiL + tD
εF) ∀i ∈ I ∀l ∈ Li ∀a ∈ A (6.64)
cTiBla = (voc+ lct)λiviniBvtt
(mrpεT ttv
+ttc+ ttdB
εT) ∀i ∈ I ∀l ∈ Li ∀a ∈ A (6.65)
cTfSla = (voc+ lct)λfvf
bsSnf ttv(mrSεT ttv
+ttc+ ttdS
εT) ∀f ∈ F ∀l ∈ Lf ∀a ∈ A (6.66)
cTKla = (voc+ lct)λv
ttv(mrKεT ttv
+ttc+ ttdK
εT) ∀l ∈ LK ∀a ∈ A (6.67)
As transportation activities differ for most line feeding policies, cost calculations need to be
adjusted accordingly. Equation (6.64) calculates transportation costs for line stocked parts based
on the number of pallets required. Similarly, costs for box-supplied parts depend on the number
of boxes required (see Equation (6.65)). However, transportation is assumed to be conducted
by tugger-trains, whereas forklifts transport line stocked parts. Tugger-trains also transport
sequencing containers, but the number of transports depends on the families’ demand λf instead
of the individual part demands (Equation (6.66)). The transportation costs for stationary kits
are calculated in Equation (6.67). It is assumed that each final product requires a kit. Therefore,
costs are based on the product demand.

Integrating ALFP and ALBP 157
Usage costs
Contrary to other studies (Limere et al., 2012; Schmid et al., 2020), usage costs are calculated
differently. The usage process consists of various activities such as identifying assembly instruc-
tions and required parts, walking to the parts’ storage locations, searching for the correct part,
fetching and handling the parts, and finally assembling the part. In contrast to calculating all
these activities’ costs, Constraint (6.20) ensures the execution of all activities within the cycle
time. If that cycle time is not sufficient, some activities may be shifted to another station. There-
fore, usage costs consist of the assembly operator costs per second multiplying by the number of
products λ and cycle time ct.
csU = aoc ctλ (6.68)
6.4 Case study
We applied the approach described above to optimize three assembly lines of an automobile
manufacturer. While we obtained feeding-related data, balancing-related data was unavailable.
Therefore, we reverse-engineered missing data based upon available information. Therefore, the
case does not represent real-life data exactly. However, we reverse-engineered multiple scenarios
to mitigate this problem.
6.4.1 Assembly line feeding data
Data related to assembly line feeding contains information about the demands of parts, delivery
quantities, physical characteristics, or costs for investment, space, and operations. Table 6.3
summarized some characteristics of the assembly lines under investigation. It contains the num-
ber of different product models assembled (#Models), the overlap of parts, i.e., the percentage
of parts that are used in at least two product models, the number of parts (#Parts), and part
families (#Families). Lastly, the range of the number of parts per family and the average part
demand, and its standard deviation are presented.
Table 6.3 Instance characteristics w.r.t. feeding
Lines #Models Overlap #Parts #Families Parts/ Family Dailydemand
Trim3L 3 56 265 138 [1-16] 148± 240Final2EastL 3 89 75 47 [1-8] 195± 367Final4 3 85 104 55 [1-20] 236± 422

158 Chapter 6
6.4.2 Assembly line balancing data
Since the company could not provide balancing-associated data, we reverse-engineered it based on
available information. For this problem, balancing data consists of assembly times and precedence
constraints. We create assembly times for each task, which we assume to be equal to a part family.
We are aware of two dataset generators in the literature (Otto et al., 2013; Serrano et al., 2014)
describing a simulation-based approach to generate precedence graphs and assembly times jointly.
The generation in both cases is based on probability distributions and randomized constructive
procedures. Contrary, we aim to reverse-engineer this data using real-world information such
as the number of tasks, the available cycle time, and the number of tasks per station. In the
following, we propose two methods to generate precedence data and assembly times separately.
Therefore, they can be combined arbitrarily. Table 6.4 shows the data obtained from these
methods and compares it to datasets from literature to evaluate their realism.
For this comparison, we utilize various metrics summarized by Otto et al. (2013). Amongst them
are number of tasks (Elmaghraby and Herroelen, 1980), order strength (Mastor, 1970), average
number of direct predecessors (Rosenberg and Ziegler, 1992), maximum task degree (Baybars,
1986), and the number of isolated tasks. Based on the value dispersion, one can conclude that
our approach produces realistic data.
Table 6.4 Instance characteristics w.r.t. balancing
Metric/Lines Scholl (1993) Otto et al. (2013) Trim3L Final2EL Final4L
Instances 269 7350 25 25 25Tasks 7-297 20-1000 138 47 55# Is. tasks 0-4 0-8 0 0 0Average immediate pred. 0.86-1.93 0.65-2.81 1.22-1.46 1.32-1.66 1.29-1.44Tasks w/o predecessors 1-26 1-30 3-3 3-4 4-5Tasks w/o successors 1-34 1-373 1-1 1-2 1-1Order strength 22.49-83.82 14.21-90.45 60 - 80 60 - 80 60 - 80Min. task degree 0-2 0-2 1 1 1Max. task degree 3-23 2-47 4-5 5-6 5-5%Bottleneck tasks 0-11.11 0-15 0 0 0% Chain tasks 0-57.14 0-95 12.32-55.80 10.64-40.43 20-38.19Chain length 0-4.3 0-4.98 2.89-4.28 2.2-4.75 2.17-4.2Convergence 51.09-90.91 34.89-1 68.15-81.55 58.75-74.19 68.35-76.01Divergence 51.38-1 35.47-1 67.65-80.70 57.32-72.31 65.48-73.33Tmin
c[%] 0.06-17 2-41.8 2.5-2.5 2.5-2.5 2.5-2.5
Tmaxc
[%] 30-100 19-99.7 95-95.83 95-95.83 50.83-75.83Std. dev. time 0.05-1 0.04-0.19 0.15-0.15 0.16-0.17 0.11-0.13
Precedence graphs
A precedence graph links some or all of the tasks under consideration with each other. The links
between those are typically distinguished in direct and indirect precedence relations. A classical
and easy to explain example is the precedence graph described in the preceding chapter (see Fig-
ure 5.1). Here, task 1 is a direct predecessor of task 3, whereas it is an indirect predecessor of task
5 since task 3 indirectly connects tasks 1 and 5. More generally, one could state that every two

Integrating ALFP and ALBP 159
tasks that are linked without a task in between them are direct predecessors/successors. Tasks
that are linked through several intermediate tasks are called indirect predecessors/successors.
In addition to the metrics used in Table 6.4, we propose a new metric called station distance (SD)
for reverse-engineered precedence graphs. With a given line balance, precedence graphs could
be created somewhat arbitrarily. The only restriction is that a task assigned to a later station
can not be a predecessor of a task assigned to an earlier station. To diminish this arbitrariness,
we propose to link at least one task of each station to any task of a station with a maximum
distance. This maximum distance defines the SD metric:
SDs = maxf,g∈F :xfs=1∧g∈DP
f ∪DSf
|sxfs − sxgs| ∀s ∈ S (6.69)
We define the desired order strength and input the current assignment to a constraint program-
ming model to reverse-engineer precedence graphs. This model does not allow isolated tasks,
i.e., tasks without any predecessor or successor. This assumption is made because isolated tasks
occur rather seldom in real life (Otto et al., 2013; Sternatz, 2014). Before running the model
described in the following, tasks are given a number in increasing order such that tasks at earlier
stations have lower numbers than tasks at later stations.
s. t.: pfg + pgk = 2⇒ pfk = 1 ∀f, g, k ∈ F : f < g < k (6.70)∑f∈F :f<k
pfk +∑
f∈F :k<f
pkf ≥ 1 ∀k ∈ F (6.71)
∑f∈F
∑k∈F :f<k
pfk =|F|2 − |F|
2OS (6.72)
∑f∈F :sf=s
∑t∈S:t<s∧t≥s−SD
∑g∈F :sg=t
pgf ≥ 1 ∀s ∈ S (6.73)
∑f∈F :sf=s
∑t∈S:t>s∧t≤s+SD
∑g∈F :sg=t
pgf ≥ 1 ∀s ∈ S (6.74)
pfg + pgk = 2⇒ dfk = 0 ∀f ∈ F + ∀g ∈ F : f < g
∀k ∈ F : j < k (6.75)
pfg = 1⇒ dfg = 1 ∀f ∈ F + ∀g ∈ F : g = f + 1 (6.76)
dfg ≤ pfg ∀f ∈ F + ∀g ∈ F (6.77)
pfg = 1 ∧∑
k∈F :f<k<g
pfkpkg = 0⇒ dfg = 1 ∀f ∈ F + ∀g ∈ F (6.78)
∑f∈DP
j
dfg ≤ D ∀f ∈ F (6.79)
∑f∈DP
j
dfg ≥ D ∀g ∈ F (6.80)
dfg, pfg ∈ 0, 1 ∀f ∈ F ∀g ∈ F : f ≤ g (6.81)

160 Chapter 6
This constraint programming model does not have an objective function since it only needs to
create a precedence graph with predefined properties. It will create a precedence graph with |F|tasks by deciding for all task pairs f and g whether task f is a predecessor of task g, indicated
by the binary variable pfg. If f < g, g is either assembled at the same or a later station in
the current solution. Therefore, we exclude this precedence link. As stated above, this model
generates graphs that do not have isolated tasks, ensured by Constraint (6.71). Constraint (6.70)
ensures consistency in the links between tasks: If a task f is a predecessor of task g, which in turn
is a predecessor of task k, then f is an indirect predecessor of task k. Constraint (6.72) ensures
that this model will create a precedence graph with the desired order strength OS. Constraints
(6.73) and (6.74) represent the consideration of the station distance (forwards and backwards).
Constraints (6.75)-(6.78) calculate the number of direct predecessors. The binary variable dfg
indicates if task f is a direct predecessor of task g. Constraints (6.79) and (6.80) enforce upper
D and lower bounds D on the number of direct predecessors for each task.
We used this model to generate five different precedence graphs for each assembly line with
different order strengths, i.e., 60, 65, 70, 75, and 80%.
Assembly times
For the generation of assembly times, we utilized the cycle time and the number of tasks at
each station. For simplicity and without loss of much accuracy, we restrict ourselves to integer
assembly times. In this work, assembly time exclusively describes the actual assembly and the
handling of the part but does not contain times for searching and walking activities. To estimate
reasonable task times, we assume a specific cycle time and a reasonably efficient line balance.
Next, we generate a station time ts for each station by deducting some time for non-assembly
activities from the cycle time. These activities may include walking, searching, or idling. The
time deducted depends on the number of tasks at that station.
For the generation of task times, we propose a stochastic (linear) goal programming model. This
model assigns assembly times to tasks based on the station time and the tasks at that station.
For each station, multiple scenarios C are created. Those can be seen as multi-stage stochastic
programs with the execution of each task representing a stage. Each task’s probability depends
on the number of executions over a number of cycles. For clarity, consider a station with two
tasks. Task 1 needs to be executed 1000 out of 1000 times, whereas task 2 is only executed 700
out of 1000 times. With this information, two scenarios are created: (i) Only task 1 is executed
with probability 0.3 (1 · (1− 0.7)); and (ii) Both tasks need to be executed with probability 0.7
(1 · 0.7).
The program assigns task times to all tasks tAf while calculating the deviations from the goal, i.e.,
the stations time ts, and minimizes the sum of deviations over all scenarios uc weighted with the
scenarios’ probabilities pc. Only negative deviations are allowed since positive deviations would
violate the cycle time constraint. Also, each task is given an upper tf and a lower bound tf to
increase the variability of task times. These bounds are determined by drawing a number from
a trimodal distribution. When all tasks are assigned a value, these values are normalized based
on the station time ts. A deviation of, e.g., 50% from that value in both directions determines

Integrating ALFP and ALBP 161
the bounds.
Minimize:∑c∈C
pcuc (6.82)
subject to:∑f∈Fc
tAf + uc = ts ∀s ∈ S ∀c ∈ C : sc = s (6.83)
tAf ≤ tf ∀f ∈ F (6.84)
tAf ≥ tf ∀f ∈ F (6.85)
tAf ∈ Z+ ∀f ∈ F (6.86)
uc ≥ 0 ∀c ∈ C (6.87)
This model requires the number of tasks, the line’s balance, and the tasks’ probabilities of
execution as an input. Table 6.4 summarizes the model’s results for the different assembly lines.
They are highly compliant with the values described by Sternatz (2014) for another automotive
company.
6.5 Results
This section will first provide an overview of the type of experiments conducted and their man-
agerial implications. Afterward, we will report on the solution quality in terms of optimality gaps
and computation times for the different experiments. The experiments are based on the problem
instances described in Table 6.4 and Table 6.3 and costs are optimized for a planning horizon
of one month. For each assembly line, five different assembly time and five different precedence
graphs have been created according to the methods described above. Those were combined in a
full-factorial settings to create 25 scenarios.
6.5.1 Managerial results
This section investigates the monetary value of an integrated planning approach for line balancing
and feeding. To this end, we consider and optimize various settings.
• Fixed balance, fixed feeding (FBFF): In this setting, the assembly line is optimally
balanced, as is currently the case at the company. It is assumed that all parts are supplied
in boxes, as this is a widely-used feeding method. Parts that cannot be delivered in boxes
due to their size or weight are either line stocked or sequenced. The former is applied if the
part family only consists of a single part, whereas the latter is applied if the part family
comprises multiple parts. This reflects an easy-to-implement decision rule as it may occur
in practical settings.
• Fixed balance, optimized feeding (FBOF): In this setting, the assembly line is bal-
anced exactly as in the previous setting. However, in this setting, part feeding is optimized.

162 Chapter 6
• Re-balance by 1 station, optimized feeding (RB1OF): In this setting, the assembly
line may be slightly re-balanced. Compared to the initial line balance, tasks may be shifted
by one station in each direction as long as precedence relations are considered. As in the
previous setting, part feeding is optimized.
• Re-balance by 2 stations, optimized feeding (RB2OF): Similarly to the previous
setting, the assembly line may be re-balanced compared to the initial balance. However,
in this setting, tasks may be shifted by up to two stations in each direction, as long as
precedence relations are considered. As in the previous setting, part feeding is optimized.
• Optimized balance, optimized feeding (OBOF): In this setting, the assembly line is
balanced entirely from scratch. At the same time, part feeding is optimized.
• Optimized balance, fixed feeding (OBFF): As traveling kits reduce the work load
for assembly operators, all parts are assumed to be delivered in traveling kits. If this is
impossible, parts are either line stocked or sequenced as in the first setting. This feeding
approach is used to balanced the line entirely from scratch.
The results for those different settings and the different assembly lines are summarized in Table
6.5. Most importantly, it can be seen that almost every setting outperforms the previous, more
restricted, setting. This is not true for the last setting, however, as it is much more restricted than
the previous. The table shows information on the different cost elements in different solutions,
and provides the number of stations and the size of the preparation area averaged over all
scenarios.
Simultaneous consideration of both problems allows an average cost reduction of 2.6% and a
maximum cost reduction of 11.44% when compared to solutions that are optimized individually
(FBOF). For approaches that determine line feeding on simple decision rules (FBFF), costs are
reduced on average by 8.1%, and at most by 18.83% when optimizing balancing and feeding
jointly (OBOF).
As demonstrated in Table 6.5, feeding costs can be minimized for a given balance. However,
simultaneously optimizing (re-)balancing and feeding may reduce the number of stations and thus
assembly costs. However, some lines seems to be more flexible than others. That is Final2EastL
and Final4L have rather many tasks per station with shorter assembly times, whereas Trim3L
has fewer tasks with longer assembly times. It seems the latter is less likely to benefit from the
integration of line feeding and balancing as only feeding costs could be decreased while balancing
costs remained more stable.
Figure 6.5 illustrates an example of an assembly line to which the different settings are ap-
plied. It is important to note that existing assembly facilities will likely be organized differently.
Nevertheless, decisions and costs are expected to be similar to the assumptions made in this
study.
2No instance of Trim3L could be solved within the specified computation time.

Integrating ALFP and ALBP 163
Table 6.5 Influence of balancing decisions on overall costs
Setting Line Final2EastL Final4L Trim3L Change to [%]# Scen. 25 25 25 prev. setting
FBFF
Cost sum 125078 130001 386807Feeding costs 8947 30460 76932Assembly costs 116131 99541 309875Number stations 7 6 18Preparation space 370 524 1292
FBOF
Cost sum 123071 114028 369924 [-12.6,-1.6]Feeding costs 6940 14487 71302 [-54.3,-7]Assembly costs 116131 99541 298622 [-3.6,0]Number stations 7 6 18Preparation space 265 412 1295
RB1OF
Cost sum 122362 112954 369781 [-5.7,2]Feeding costs 6231 16731 71301 [-12.8,103.8]Assembly costs 116131 96223 298622 [-16.7,0]Number stations 7 5.8 18Preparation space 234 429 1295
RB2OF
Cost sum 122272 107201 369811 [-9.2,1]Feeding costs 6141 24250 71159 [-13.9,95]Assembly costs 116131 82951 298622 [-16.7,0]Number stations 7 5 18Preparation space 231 454 1295
OBOF
Cost sum 122019 106783 370002 [-4.9,7.5]Feeding costs 8542 22505 71379 [-47.1,149.2]Assembly costs 113477 84278 298622 [0,20]Number stations 7 5.1 18Preparation space 231 438 1295
OBFF2
Cost sum 196437 206658 - [+49.5,+103.4]Feeding costs 30536 40677 - [+40,+402]Assembly costs 165901 165901 - [+42.8,+100]Number stations 10 10 -Preparation space 374 524 -

164 Chapter 6L
ine
stock
ing
Box
ed-su
pp
lyS
equ
encin
gS
tationary
kittin
gT
raveling
kittin
gW
areh
ou
seN
um
ber
of
tasks
at
statio
nn
Fix
ed
bala
nce,
fixed
feed
ing
620
420
23
Fix
ed
bala
nce,
op
timiz
ed
feed
ing
TC
:−12.6
4%
AC
:±0%
FC
:−54.2
8%
620
420
23
Re-b
ala
nce
1,
op
timiz
ed
feed
ing
TC
:−0.24
%
AC
:±0%
FC
:−2.0
2%4
19
1511
33
Re-b
ala
nce
2,
op
timiz
ed
feed
ing
TC
:−3.27%
AC
:−16.67%
FC
:+
95.29%
12
21
64
12
Op
timiz
ed
bala
nce,
op
timiz
ed
feed
ing
TC
:−2.57
%
AC
:±0%
FC
:−10.62%
15
912
11
8
Op
timiz
ed
bala
nce,
fixed
feed
ing
TC
:+
78.27%
AC
:+
80%
FC
:+
72.21%
93
10
21
65
415
70140
21028
0350
420
490
560
630
682.5
[m2]
Figure
6.5
Change
of
line
org
aniza
tion
for
the
assem
bly
line
‘Fin
al4
’

Integrating ALFP and ALBP 165
Most importantly, Figure 6.5 demonstrates that an the optimization of feeding decisions affects
the assembly systems design and can significantly reduce feeding and overall costs. A key ob-
servation is that the FBFF setting does not utilize the entire space available at the BoL. When
optimizing feeding decisions, the utilization of BoL-space almost doubles. Furthermore, opti-
mal feeding decisions reduce the space requirements in both preparation area and warehouse
and, thus, reduce transportation distances. While a slight re-balancing (RB1OF) does only im-
pact feeding decisions, a less restrictive rebalancing, reduces the number of stations. At the
same time, feeding costs are strongly increasing. Nevertheless, overall costs could be reduced by
3.27%. When optimizing balancing for the entire line, even more costs can be saved.
The last setting demonstrates that the use of traveling kit may not necessarily benefit assembly
operations. Due to the limited capacity of a kit, the amount of parts that can be supplied to
the individual assembly stations is reduced. Therefore, additional stations need to be opened.
This result needs to be taken carefully, as we assume that traveling kits need to visit at least
two stations and not more than one traveling kit can supply a single station. In practice, there
may be workarounds to circumvent these assumptions. However, these results indicates that
switching to exclusive feeding via traveling kits certainly does not benefit logistics operations
and may even negatively affect assembly operations.
6.5.2 Computational results
The Bender’s decomposition approach described above is applied to solve all scenarios described
above. The approach was implemented in C++, and Gurobi 9.1 was used as a solver. Computa-
tions were executed on a High-Performance-Computer. For each instance, 16GB of Ram and six
cores of an Intel(R) Xeon(R) Gold 6130 were allotted. Since this study deals with tactical and,
therefore, medium-to-long-term decisions, the computation time was set to 3 hours. This strikes
a balance between resource requirements and reasonable computation times for such long term
problems which may easily use 12 hours or more. The relaxation, described in Appendix C, is
included for all tests. The ε, i.e., the allowed master optimality gap, was set to 0, 0, 0.15, 0.2,
0.25 and 0.2 for the different settings, respectively.
Table 6.6 Solving times and gaps when applying solving procedure
Scenario inst. time(h) #opt #unsolved avg. time avg. time opt. avg. gap all avg. gap
FBFF 75 3 75 0 9.12 9.12 0 n.a.FBOF 75 3 50 0 3616 24.98 1.20 3.61
RB1OF 75 3 6 0 10209.97 3424.66 5.94 6.45RB2OF 75 3 6 0 10440.24 7792.29 8.06 8.76OBOF 75 3 2 0 10789.89 10420.75 14.05 14.43OBFF 75 3 50 25 3855.44 590.56 33.33 100
Table 6.6 shows the computational results of optimizing the various scenarios described in the
Section 6.5.1. To this end, the table shows the number of instances solved (inst.) and the
maximum computation times given to solve an instance (time(h)). For each scenario, it is
reported how many instances could be solved to optimality (#opt), how many instances could

166 Chapter 6
not be solved (#unsolved). In addition, we report on the average solution time of all instances
(avg. time) as well as on the computation time for instances that were solved to optimality.
Similarly, the average gaps over all instances (avg. gap all) are compared to the average gaps
of instances that could not be solved to optimality (avg. gap). The results indicate that, as
expected, additional decisions complicate the solution procedure. However, gaps for rebalancing
settings seem reasonable small. Furthermore, it should be stated that more CPU-cores and
longer computation times may be used in practice.
6.6 Conclusion and future research
In this chapter, we propose an integrated approach for assembly line balancing and assembly
line feeding. This study comprises numerous novelties: (i) this study describes the integration
of assembly line balancing and feeding while considering five distinct line feeding policies; (ii)
the model accurately considers walking and searching times at the assembly line; (iii) the model
considers multiple traveling kits in a discretized manner; (iv) the assembly facility design is
incorporated in the model; and (v) a logic-based Bender’s decomposition scheme is proposed to
solve this complex problem.
Our findings indicate that simultaneous consideration of both problems allows an average cost
reduction of 2.8% and a maximum cost reduction of 12.9% when compared to solutions that are
optimized individually. For approaches that determine line feeding on simple decision rules, costs
are reduced on average by 6.7%, and at most by 14.46%. Therefore, we can confirm previous
findings (Battini et al., 2017; Sternatz, 2015) on the usefulness of this integration. However, the
extent of cost reduction is lower than in previous studies, which is likely to result from additional
line feeding policies. Besides, this may also be attributed to the broader scope of this research.
Future research may build upon this study to investigate the effect of multiple versions of each line
feeding policy. For example, kits may be provided in containers of different sizes, and sequenced
parts may be supplied in smaller boxes that are presented in flow racks, currently exclusively
used for boxed-supplied parts. Furthermore, it would be of interest to apply this model to a
multi-model setting, where different products are produced in batches on the assembly lines.
In between the different batches, parts at the BoL might need to be exchanged to suit an
entirely different product. Lastly, improving the solution approach is vital to optimize multiple
(dis)connected assembly lines at once. The proposed solution approach may serve as a benchmark
for (meta-)heuristic approaches in terms of the solution quality.

7General conclusions and recommendations for
future research
“There will come a time when you believe everything is finished.
That will be the beginning”
Louis L’Amour

168 Chapter 7
7.1 Conclusions
This thesis consists of five studies on logistical and production processes within assembly systems.
More specifically, they are concerned with the ALFP, a kitting cell design problem, the ALBP,
and the integration of ALFP and ALBP. In the following, the studies are summarized, and the
research questions, posed in Section 1.3, are answered.
Chapter 2 provides a literature review on assembly line feeding problems and classifies various
problem characteristics utilizing a three-field classification scheme. While providing an overview
of existing literature, it also answers the first Research Question (RQ) of this thesis:
RQ 1.1: What constitutes the tactical assembly line feeding problem, and which decisions
are part of the problem’s scope?
In Section 2.2.4, the tactical assembly line feeding is delineated from strategic and operational
aspects. Tactical problems are concerned with logistical decision-making that affects in-house
logistical processes. These processes are replenishment, preparation, transportation, and usage.
Most importantly, the tactical assembly line feeding problem assigns parts to line feeding policies
as those have the most significant impact on the processes’ design. Besides, more specific decisions
such as vehicle selection or supermarket design may be incorporated. In contrast, operational
feeding problems are input with a given system (e.g., determined feeding policies and vehicles)
and target to improve short-term goals such as vehicle scheduling, loading, or kit preparation.
On the other hand, strategic feeding problems are long-term decisions, which affect tactical
decision-making processes. An excellent example of strategic decision-making is the outsourcing
decision of logistical tasks.
The second research question of this chapter is concerned with the provision of a formal problem
definition:
RQ 1.2: Which decisions, assumptions, and constraints are fundamental for the assem-
bly line feeding problem, and which aspects of this problem class are vital for the field’s
development?
To answer this question, we defined a fundamental tactical assembly line feeding problem that
assigns parts to feeding policies while minimizing the costs. Even though this model is rather
simplistic and does not consider many practical issues, we proved it to be NP-hard. As various
factors may be considered when optimizing assembly line feeding decisions, we provided a three-
field notation that includes product and feeding system characteristics and possible cost elements
for the objective function. Crucial aspects in this framework consider different line feeding policies
and the inter-relatedness of parts belonging to the same family and space considerations. We
identified those to be most promising for future investigations. Besides, we identified additional
aspects such as the material flow or facility design or the integration with assembly line balancing
as promising research areas.
Chapter 3 investigates the most important aspects identified in the previous chapter, i.e., multiple
line feeding policies, space considerations, and part-family links. As all prior studies in the
literature considered different subsets of line feeding policies, the first RQ is concerned with

Conclusion 169
the simultaneous consideration of all line feeding policies identified in the literature and during
factory visits:
RQ 2.1: Is it useful to consider all five line feeding policies simultaneously and how can
such a decision model be modeled?
This study considered all line feeding policies identified beforehand, namely line stocking, boxed-
supply, sequencing, stationary kitting, and traveling kitting. To this end, we proposed an opti-
mization model assigning each part to a line feeding policy. The assignment of parts to policies is
mainly determined by the associated costs, as each assignment incurs a different cost. However,
the available space at each station restricts assignments. Furthermore, each feeding policy has
specific characteristics such as weight or volume constraints. We used the model to optimize line
feeding for various assembly lines. The results show that all line feeding policies are beneficial.
As expected, some may be more favorable than others. However, the use of a particular line
feeding policy ultimately depends on the assembly system’s configuration. For example, the sta-
tions’ sizing impacts decision-making. Additionally, the design of preparation areas affects cost
calculations and, therefore, decision making. Nevertheless, the results indicate that all feeding
policies provide some merit. Adjusting their execution may alleviate some of their drawbacks.
In this study, space at the assembly stations was modeled with higher accuracy than in previous
studies, i.e., it includes the parts’ placement at the station. Concerning spatial considerations,
the following two RQs emerged:
RQ 2.2: Does the placement of parts at specific locations affect the decision-making
process, and are there any patterns in the placement of items?
RQ 2.3: How does the possibility of space borrowing affect decision making for assembly
line feeding?
As the placement of parts along the line impacts the assembly operators’ walking distances, it
was investigated whether the placement may impact line feeding policies. To this end, we tested
whether an approach that optimizes the feeding policy in a first step and the parts’ locations
in a second step generates identical solutions to the integrated approach. Even though some
results were similar, they differ for the majority of assembly lines. On average, the integrated
approach reduced costs by around 2%, whereas a maximum cost reduction of almost 7% could
be achieved with an integrated approach. Furthermore, we tested the impact of moving vs. non-
moving assembly lines on the parts’ placement. At moving lines, the product is permanently
moving. Therefore, we assumed that parts are assembled at different locations, whereas they
are assembled at a joint location at non-moving lines. We could confirm that parts are placed
differently in those scenarios. For example, stationary kits are typically placed at the beginning
of the line for moving lines but mainly at the center for non-moving lines.
Also, we investigated whether a more flexible use of space at the assembly stations can reduce
costs. When many parts are assembled at a single station, it typically requires more space.
Therefore, we tested whether the use of space from an adjacent station, called space borrowing,
might result in a more efficient feeding system. Our results could confirm this hypothesis and
indicate that costs decrease when space borrowing is allowed. The maximum observed reduction
in costs was 6.82%.

170 Chapter 7
As many feeding systems make use of stationary or traveling kits, Chapter 4 is concerned with
the design of kitting cells:
RQ 3: How does the placement and determination of delivery quantities affect the cost of
operating a kitting cell?
To answer this RQ, we defined an optimization model that determines the design of kitting cells,
given the parts and part families kitted in these cells. The design consists of the kitting cell’s
size, the feeding policies used to provide parts, and the parts’ placements. As kits often contain
various parts, combined in almost arbitrary ways, we approached the problem by creating so-
called demand patterns, representing kits that mimic real-world demand. Each demand pattern
contains various parts as they may be combined while considering that a single kit can never
contain multiple different parts of the same family. We used the model to optimize a kitting
cell of an automobile company and compared it to the heuristic approaches. We found that
most parts should be fed by line stocking as another preparation step often increases costs.
However, some parts (often with low demand) should be delivered in boxes as this reduces the
cell’s spatial requirements and, therefore, the operators’ walking distances. In comparison to
heuristic approaches, the optimal solution saves between 7 and 11% of the costs. Besides, our
results indicate that the placement of parts within the cell may have a more considerable impact
than the parts’ feeding policies. However, this cannot be generalized as feeding policies and
placement show interactive effects.
Chapter 5 is concerned with a simple assembly line balancing problem of type E, i.e., maximizing
an assembly line’s efficiency. Minimizing both the line’s cycle time and the number of stations
increases a line’s efficiency. As we found in Chapter 3, spatial requirements are an important
factor in assembly lines, this research incorporates them into assembly line balancing. As this
assembly line balancing problem is tough to solve, the paper is concerned with solving this
problem more efficiently:
RQ 4.1: How can existing solution approaches for the SALBP-E problem be improved and
extended to include additional constraints such as the consideration of spatial requirements?
We extended a mixed-integer programming model, proposed by Esmaeilbeigi et al. (2015), by a
set of space constraints and made some minor improvements to the model. More importantly,
we proposed a strengthening approach combined with search algorithms. For this strengthening
technique, possible combinations of cycle times and the number of stations are listed. Those
combinations are then solved individually. As the cycle time and the number of stations are
fixed (i.e., the variable values are strengthened), the problems are easier to solve. We converted
the problem formulation into a constrained programming model that can solve these problems
more efficiently.
Furthermore, we were interested in the managerial implications that arise from the consideration
of spatial requirements:
RQ 4.2: To what extent does the consideration of spatial requirements alter an assembly
line’s performance?
To evaluate the impact of spatial requirements, we used a benchmarking dataset from the litera-

Conclusion 171
ture and complemented it with spatial data. We optimized the problem instances in this dataset
with and without spatial requirements using the algorithm described above. For this, we set the
bounds on the number of stations equal for space-constrained and unconstrained instances to
guarantee a fair comparison. Based on those results, we could show that spatial requirements
reduce an assembly line’s effectiveness by 2.4–18.78%. However, it should be noted that the effect
may be more extensive for assembly lines with a given cycle time (SALBP-1) or a given number
of stations (SALBP-2) as the ALBP type-E is more flexible than SALBP-1 and SALBP-2.
Lastly, Chapter 6 integrates assembly line balancing and assembly line feeding. As both problems
are proven to be NP-hard and they are highly interactive (both problems affect each other), the
first RQ is:
RQ 5.1: How can this integrated problem be modeled accurately and solved efficiently?
Both in practice and theory, those two problems are mostly considered separately. Moreover, they
are considered hierarchical, i.e., first, the assembly line balancing problem is solved before using
the results as an input to the assembly line feeding problem. However, this approach is rather
simplistic as the line’s balance affects the line’s feeding costs, e.g., when assigning many part
families to one station. More importantly, the parts’ feeding policies and placement determine
how much time the assembly operator needs to spend on walking and searching. To tackle this
interdependence, we proposed a logic-based Bender’s decomposition approach that resembles the
‘traditional’ hierarchical approach, i.e., first balancing the line and then optimize the feeding, but
introduces a feedback loop. Whenever the line is balanced, its feeding is optimized. This approach
considers interaction effects and guarantees feasibility. Additionally, it minimizes feeding costs
and imposes them on the balancing problem, i.e., when the same balance occurs for a second
time, the feeding costs are included. Therefore, the balancing problem tries to find another
solution that has lower feeding costs.
We used the approach described above to test whether this integrated approach is superior to
the hierarchical approach:
RQ 5.2: Does the integrated consideration of assembly line balancing and feeding impact
a line’s balance? How much can be saved?
We applied the integrated planning approach to optimize three assembly lines in various scenarios,
i.e., differing assembly times and precedence graphs. The results indicate that a multitude of
line balances are optimal from a pure balancing perspective. From an integrated perspective,
however, these are not equally good. Our results indicate that seemingly indifferent line balances
may change overall costs more than 10%. Moreover, we tested the impact of predefined feeding
policies. For example, we used some simple rules of thumb that either assign most parts to
boxed-supply or traveling kits and compared those to optimized feeding policies. The results
prove that predefined feeding policies may increase both feeding and balancing related costs.
Comparing results for reasonably predefined feeding policies with optimized feeding policies, we
could observe an average cost reduction of around 7.7%. Likely, the most critical insight from
this study is that both balancing and feeding costs can be improved when jointly considering
these problems.

172 Chapter 7
This thesis contributes to the research domain of assembly systems both in a methodological
but also managerial manner. Both aspects have been discussed above, along with the research
questions. However, in the following, some of the most important practical/managerial aspects
will be highlighted. First and foremost, this thesis provides an overview of the decision problems
arising in assembly systems and examples of the industries that can benefit from investigating
these problems (see Figure 1.1). In the second chapter, many practical aspects such as vehicle
selection, policy definitions, or ergonomic aspects determining a feeding’s system operations
have been classified. The most important financial objectives are outlined. The next chapter
investigated optimal decision-making in feeding systems. One important finding is that each
feeding policy is worth considering (see RQ 2.1) as it may reduce overall costs. Next, we could
demonstrate that providing flexibility to the system by allowing space borrowing reduces costs
even further. While practitioners may not necessarily apply mathematical modeling techniques,
these insights can easily be transferred to practice. Similarly, Chapter 4 provides a framework
to improve kitting cells’ design by considering the placement and feeding policies of parts used
in a cell (see RQ 3). Practitioners may use this framework to either optimize their kitting cells
or use the heuristic approaches discussed in the chapter. Chapter 5 and 6 both address the
issue of spatial consideration in assembly line balancing. While the former is rather a proof of
concept, showing that assembly line design should incorporate spatial considerations, the latter
provides a straightforward method to optimize line balancing and feeding simultaneously. Most
importantly, our results demonstrate the impact of integrating both aspects on cost savings (see
RQ 5.2). Additionally, we also highlight the interaction effects of varying decisions and how they
shift costs within a system that may support decision-makers.
7.2 Practical implementation
We based the models discussed in this thesis on industrial demands and tried to make them as
generic as possible. Nevertheless, it may not always be straightforward to transfer them into
practice. Therefore, some pitfalls that may occur when applying the models and methods in
practice will be discussed in the following:
1. Robustness of the results.
2. Data collection.
3. Adaptations to the specific case.
4. User-friendliness and computational speed
Robustness As all models described in this thesis depend on various parameters, one may
be interested in the robustness of the solutions when parameter values change. The robustness
mostly depends on the parameter that changes. Many of the parameters occur in different cost
calculations for processes and line feeding policies. When these parameters are changing, one
may obtain different results in terms of costs, but the solution quality should be robust. Similarly,
changing parameters for a single part or part family will slightly change the costs of the solution.
However, the impact on overall feeding costs should be marginal. Nevertheless, other parameters

Conclusion 173
may impact the solution more drastically. For example, the size of kitting containers or the
costs for the vehicle transporting sequenced containers may have a more significant impact.
Generally speaking, the solution quality may diminish for any change in the data but is only
expected to be heavily affected by parameters affecting a specific type of decision. Therefore,
it is recommended to test different parameter values when the parameter cannot be determined
well, and the parameter is primarily relevant for one type of decision.
Data collections The models described in this thesis are very data-driven and therefore re-
quire many input parameters. Based on discussions with practitioners, most of them should be
available in practice. However, some data may be available within a company but not accessible
by everyone. For example, there is a barrier in data sharing between line balancing (production
department), line feeding (logistics department), and product design (engineering department)
in many companies. Therefore, improving data accessibility across multiple departments is vital
to obtain good quality data. Furthermore, practitioners may use estimations from academic
literature and time studies. For example, searching, walking, and picking times may be challeng-
ing to measure but can be well estimated through time study methods such as the ”very easy
work-factor” (VWF).
Case-specific adaptations It will mostly be necessary to adapt the models presented in this
thesis to match a specific case in the real world. Many adaptations may occur in calculating costs
as some of the processes may be executed differently from what is described in this thesis. Fur-
thermore, some companies may have different types of kits or sequencing containers. Therefore,
including those as an additional option may become necessary. However, from a modeling point
of view, those adaptations should not alter the models drastically as they can mostly be modeled
by adding another index to those feeding policies. Other adaptations may result from relaxing
some of the assumptions, such as the exclusive use of any part for one particular station and task.
As mentioned in Chapters 2 and 6, we assumed that each part is used for a single task. When
using the same part multiple times at different stations, the spatial requirements for that part
in the preparation area or the walking times in a kitting cell may reduce. For example, when a
part is box-supplied at multiple stations, only one pallet needs to be present in the boxed-supply
picking area. An additional type of variable could be introduced to consider this. The variable
would then indicate whether any of the parts used for different tasks are boxed-supplied. Then
this variable would be used to consider the space requirement instead of each part’s variable. A
similar approach may be used for the determination of walking times in kitting cells.
User experience For the models presented in this thesis and similar models to get used
by practitioners, the development of intuitive, user-friendly software seems essential. While
providing a more graphical representation of the problem, such software may also support the
user by estimating parts of the data or automatically retrieving the data from the company’s
ERP system. Furthermore, such software should have short computation times. This may be
achieved by relying on (meta-)heuristic approaches to solve large problem instances more quickly.

174 Chapter 7
This would also allow the provision of multiple solutions with varying underlying assumptions
or parameters.
7.3 Future research
Considering the studies described in this thesis and the vast amount of literature that was only
touched upon in this thesis (e.g., on strategic issues or the integration of product design and
manufacturing), it should be evident that complex assembly system design and operation pose
many research opportunities. In the following, various concepts for future research are presented,
separated into extensions and new avenues.
7.3.1 Extensions and adaptations
Large parts of this thesis are concerned with providing new models to obtain insights into the
effects of using different line feeding policies. While we distinguish five line feeding policies,
these line feeding policies may occur in different variants, i.e., different load carriers may be
available for a single line feeding policy. For example, part families may be sequenced into small
boxes (provided parts fit in this box) and presented to the assembly operator in a flow rack.
In this case, flow racks provide both box-supplied and sequenced parts. Similarly, one may use
large traveling kits, as discussed in Chapter 6 and simultaneously smaller kits as discussed in
Chapter 3, placed on or within the product. When assembly lines are long or multiple lines are
connected, there may also be an option to use a single traveling kit to serve two separate line
segments or assembly lines. Ideally, optimization models would determine the size of each load
carrier individually and determine the line segments a single traveling kit serves.
Also, new line feeding policies may emerge in the future. One such policy could be called direct
feeding, which directly provides parts to the assembly operator or robot through conveyor belts,
drones, or robotic arms. Incorporating those feeding policy changes into the existing literature
may reveal additional cost savings.
Similarly, new transportation technologies may emerge. An example of a new transportation
concept is a vertical robotic storage and retrieval system (Tappia et al., 2020). These robots
may be used to automate the part picking process in the warehouse or supermarket and the
transportation of the load carrier to the assembly line.
One major limitation of this work is its focus on manual, large-scale assembly. Therefore, adjust-
ing the models and cost formulations for automated and small-product assembly (e.g., smart-
phones) will leverage their applicability to many more industries.
While the study presented in Chapter 6 includes warehouse and supermarket area sizing, it does
not determine their design in detail. As discussed in Section 2.3.2 it might be worthwhile to

Conclusion 175
optimize the placement of different activities and thus the flow of parts in the assembly system
to achieve additional cost savings.
Lastly, some companies may be interested in outsourcing some preparation activities as repre-
sented in Figure 2.3. In those cases, it is essential to distinguish the type of outsourcing as there
are two possibilities: (i) outsourcing to a third party such as a logistics service provider and
suppliers; or (ii) outsourcing to a separate facility that the assembling company operates. In the
case of the former, the models can be easily adjusted by incorporating different options for each
line feeding policy, e.g., in-house and outsourcing options. Both options then have different costs
and space requirements. In case of outsourcing operations to another facility, this facility would
need to be sized appropriately. Those separate facilities may not only deliver parts to one but
potentially multiple sites. Therefore, it may of interest to investigate what parts these sites share
to pool more parts in this shared preparation site. However, outsourcing typically imposes the
risk of late delivery and line starvation. Therefore, transportation planning and vehicle loading
have to be considered carefully. Potentially, each facility may also require a small safety stock to
buffer against delivery delays. The models presented in this thesis may be used in combination
with other optimization models that individually optimize parts of the overall problem. The
solutions to the individual problems may then be linked and reiterated based on the results of
other models until a feasible and efficient solution is found.
7.3.2 Other research directions
While many studies on assembly systems focus on assembly line balancing and assembly line
feeding and their specific variants, studies with an overarching scope are scarce.
As many resources are becoming more difficult to mine or become an object of speculations or
geopolitical strategies, and (plastic) waste pollutes the environment, efforts need to be directed
towards recycling and reusing products that have reached the end of their life cycle. This is
especially true for assembled products such as smartphones or other consumer electronics as they
contain many valuable resources such as gold or rare earth elements. Organizing the efficient
collection of such goods may pose an interesting problem for researchers. Furthermore, recycling,
refurbishing, and reusing these products may complement classic production activities. Jointly
optimizing disassembly and assembly operations, therefore, poses new research opportunities.
Most research in assembly line feeding and balancing either directly or implicitly assumes that
the assembly facility is flexible in size and equipment (green-field factory). However, this may
not always be true in reality. Companies frequently have to plan their assembly activities within
an existing (brown-field) factory, which poses certain limitations such as shop floor size, ware-
house capacity, or construction-related obstacles. Reasons for this may be the introduction of
additional products, functional product changes, product version changes, or a change in de-
mand. Capturing those limitations while optimizing decision-making will provide high value to

176 Chapter 7
industrial decision-makers since assembly systems frequently require reorganization.
Another research opportunity is the optimization of assembly and logistics activities while consid-
ering modularization. As discussed in Section 2.2.4, logistical activities may be outsourced to 3rd
party logistics service provider (3PL). These may operate within the same facility or a separate
facility. Important decisions include the type of activities to be outsourced and the pricing, i.e.,
the determination of fees that make this option more profitable than conducting those operations
in-house. Similarly, this is true for assembly activities. It may be worthwhile to relocate the
pre-assembly of some larger components. Relocation may refer to a separate in-house production
or external sourcing. Nowadays, technological capabilities drive these decisions. However, there
may be economic, sustainability-related, or resilience-related opportunities in in- and outsourc-
ing. Supporting this decision-making process by quantitative approaches might reshape entire
assembly facilities.
Researchers developed many optimization models for different variants of balancing and feeding
problems. In balancing, for example, one may minimize assembly worker costs with a given
cycle time (see Chapter 6), or the assembly line’s efficiency may be maximized (see Chapter
5). Besides, one may include considerations such as flexibility, ergonomics, tool costs, or other
decisions. However, determining the best optimization approach may not be trivial. Production
managers may have to consider some of the following problems and make a decision on the line’s
configuration: (i) lines may be moving (paced) or non-moving (unpaced); (ii) unpaced assembly
lines may use buffers, i.e., storage areas that hold parts in between different production steps.
The size of such buffer areas needs to be determined; (iii) Assembly lines may be straight, U-
Shaped, or S-Shaped, and each station may be staffed with a single or multiple workers that
work from different positions (left side, right side, before/behind/above/below the product); (iv)
The design of the assembly line may encompass other problems such as tool requirements or
ergonomics; (v) Depending on the product and assembly technology, some line feeding policy
may not be considered or require adjustment; and (vi) Some tasks may be automated.
Additionally, when producing multiple product models or highly customized products, it must
be decided whether these should be produced on joint or separate assembly lines. In the latter
case, it also needs to be determined whether workers should switch between the lines (which
may be only operational when needed) or should all lines have a fixed set of operators and run
permanently.
The optimal answer to these questions largely depends on the product(s) characteristics. To
this end, decision support models may either incorporate these decisions as variables or optimize
different settings and select the best alternative. Another opportunity may be an in-depth
analysis of product characteristics. Machine learning algorithms may then guide decisions based
upon previous studies. However, this approach is unable to guarantee optimal solutions.

References 177
Lastly, we would like to highlight the shift towards platform-based economies currently hap-
pening in various industries. This trend may also apply to production, and more particularly,
assembly. For manufacturing in a wider sense, this is termed Manufacturing-as-a-Service (MaaS).
In this case, manufacturing companies may set up assembly systems, and product designers may
commission those companies. An obvious example is the assembly of consumer electronics. In-
stead of producing in one or very few production facilities, companies may commission various
manufacturing companies in different markets to produce specific products. In this scenario, the
design of assembly systems becomes essential, especially as they have to be cost-efficient while
remaining flexible. Manufacturing facilities would likely specialize since they will not produce
cars in the same factory as electric toothbrushes. This specialization will pose problems in facility
location and facility design that may be of interest for future research. It will also be vital for
the manufacturing companies to determine which orders and contracts to accept. To this end,
researchers could investigate lead time and pricing agreements. Additionally, product designers
need to determine the best manufacturers, which may pose similar problems as supplier selection.
In summary, there are tremendous opportunities to optimize the operation and design of assembly
systems. Besides, new business models may arise, posing new challenges for both practitioners
and researchers.


References
Achterberg, T. and Wunderling, R. (2013). Mixed integer programming: Analyzing 12 years of
progress. In Facets of combinatorial optimization, pages 449–481. Springer.
Aghezzaf, E.-H. and Artiba, A. (1995). A lagrangian relaxation technique for the general assembly
line balancing problem. Journal of Intelligent Manufacturing, 6(2):123–131.
Alakas, H. M., Pınarbası, M., and Yuzukırmızı, M. (2020). Constraint programming model for
resource-constrained assembly line balancing problem. Soft Computing, 24(7):5367–5375.
Alizon, F., Dallery, Y., Essafi, I., and Feillet, D. (2009). Optimising material handling costs in
an assembly workshop. International Journal of Production Research, 47(14):3853–3866.
Alnahhal, M. and Noche, B. (2013). Efficient material flow in mixed model assembly lines.
Springerplus, 2:1–12.
Alnahhal, M. and Noche, B. (2015a). Dynamic material flow control in mixed model assembly
lines. Computers & Industrial Engineering, 85:110–119.
Alnahhal, M. and Noche, B. (2015b). A genetic algorithm for supermarket location problem.
Assembly Automation, 35(1):122–127.
Alvarez-Miranda, E. and Pereira, J. (2019). On the complexity of assembly line balancing prob-
lems. Computers & Operations Research, 108:182–186.
Andres, C., Miralles, C., and Pastor, R. (2008). Balancing and scheduling tasks in assembly lines
with sequence-dependent setup times. European Journal of Operational Research, 187(3):1212–
1223.
Arai, T., Aiyama, Y., Maeda, Y., Sugi, M., and Ota, J. (2000). Agile assembly system by “plug
and produce”. CIRP annals, 49(1):1–4.
Armbruster, D. and Kempf, K. G., editors (2012). Decision Policies for Production Networks.
Springer, London.
Balakirsky, S., Kootbally, Z., Kramer, T., Pietromartire, A., Schlenoff, C., and Gupta, S.
(2013). Knowledge driven robotics for kitting applications. Robotics and Autonomous Systems,
61(11):1205–1214.

180 References
Baller, R., Hage, S., Fontaine, P., and Spinler, S. (2020). The assembly line feeding problem:
An extended formulation with multiple line feeding policies and a case study. International
Journal of Production Economics, 222:107489.
Barnhart, C., Johnson, E. L., Nemhauser, G. L., Savelsbergh, M. W., and Vance, P. H. (1998).
Branch-and-price: Column generation for solving huge integer programs. Operations research,
46(3):316–329.
Bartholdi, J. (1993). Balancing two-sided assembly lines: a case study. International Journal of
Production Research, 31(10):2447–2461.
Bartholdi III, J. J., Eisenstein, D. D., and Foley, R. D. (2001). Performance of bucket brigades
when work is stochastic. Operations research, 49(5):710–719.
Battaıa, O. and Dolgui, A. (2013). A taxonomy of line balancing problems and their solution-
approaches. International Journal of Production Economics, 142(2):259–277.
Battaıa, O., Otto, A., Sgarbossa, F., and Pesch, E. (2018). Future trends in management and
operation of assembly systems: from customized assembly systems to cyber-physical systems.
Omega, 78:1–4.
Battini, D., Calzavara, M., Otto, A., and Sgarbossa, F. (2016a). The integrated assembly line
balancing and parts feeding problem with ergonomics considerations. IFAC-PapersOnLine,
49(12):191–196.
Battini, D., Calzavara, M., Otto, A., and Sgarbossa, F. (2017). Preventing ergonomic risks with
integrated planning on assembly line balancing and parts feeding. International Journal of
Production Research, 55(24):7452—-7472.
Battini, D., Delorme, X., Dolgui, A., Persona, A., and Sgarbossa, F. (2016b). Ergonomics in
assembly line balancing based on energy expenditure: a multi-objective model. International
Journal of Production Research, 54(3):824–845.
Battini, D., Faccio, M., Persona, A., and Sgarbossa, F. (2009). Design of the optimal feeding
policy in an assembly system. International Journal of Production Economics, 121(1):233–254.
Battini, D., Faccio, M., Persona, A., and Sgarbossa, F. (2010a). Framework to optimise the
inventory centralisation/ decentralisation degree and feeding policy in assembly systems. In-
ternational Journal of Services and Operations Management, 6(2):184.
Battini, D., Faccio, M., Persona, A., and Sgarbossa, F. (2010b). “supermarket warehouses”:
Stocking policies optimization in an assembly-to-order environment. The International Journal
of Advanced Manufacturing Technology, 50(5-8):775–788.
Battini, D., Gamberi, M., Persona, A., and Sgarbossa, F. (2015). Part-feeding with supermar-
ket in assembly systems: transportation mode selection model and multi-scenario analysis.
Assembly Automation, 35(1):149–159.

References 181
Bautista, J., Batalla, C., Alfaro, R., and Cano, A. (2013). Extended models for tsalbp with
ergonomic risk constraints. IFAC Proceedings Volumes, 46(9):839–844.
Bautista, J. and Pereira, J. (2007). Ant algorithms for a time and space constrained assembly
line balancing problem. European Journal of Operational Research, 177(3):2016–2032.
Bautista, J. and Pereira, J. (2011). Procedures for the time and space constrained assembly line
balancing problem. European Journal of Operational Research, 211(1):473–481.
Baybars, I. (1986). A survey of exact algorithms for the simple assembly line balancing problem.
Management Science, 32(8):909–932.
Beamon, B. M. and Deshpande, A. N. (1998). A mathematical programming approach to si-
multaneous unit-load and fleet-size optimisation in material handling systems design. The
International Journal of Advanced Manufacturing Technology, 14(11):858–863.
Becker, C. and Scholl, A. (2006). A survey on problems and methods in generalized assembly
line balancing. European Journal of Operational Research, 168(3):694–715.
Bender, J. (1962). Partitioning procedures for solving mixed-variables programming problems ‘.
Numerische mathematik, 4(1):238–252.
Benjamin, D. J., Berger, J. O., Johannesson, M., Nosek, B. A., Wagenmakers, E.-J., Berk,
R., Bollen, K. A., Brembs, B., Brown, L., Camerer, C., et al. (2018). Redefine statistical
significance. Nature Human Behaviour, 2(1):6.
Bhatnagar, R., Chandra, P., and Goyal, S. K. (1993). Models for multi-plant coordination.
European Journal of Operational Research, 67(2):141–160.
Bock, S. (2015). Solving the traveling repairman problem on a line with general processing times
and deadlines. European Journal of Operational Research, 244(3):690–703.
Bortolini, M., Faccio, M., Gamberi, M., and Pilati, F. (2020). Assembly kits with variable part
physical attributes: warehouse layout design and assignment procedure. Assembly Automation,
40(6):857–768.
Boudella, M. E. A., Sahin, E., and Dallery, Y. (2018). Kitting optimisation in just-in-time mixed-
model assembly lines: assigning parts to pickers in a hybrid robot–operator kitting system.
International Journal of Production Research, 56(16):5475–5494.
Bowman, E. H. (1960). Assembly-line balancing by linear programming. Operations Research,
8(3):385–389.
Boysen, N. and Bock, S. (2011). Scheduling just-in-time part supply for mixed-model assembly
lines. European Journal of Operational Research, 211(1):15–25.
Boysen, N. and Emde, S. (2014). Scheduling the part supply of mixed-model assembly lines in
line-integrated supermarkets. European Journal of Operational Research, 239(3):820–829.

182 References
Boysen, N., Emde, S., Hoeck, M., and Kauderer, M. (2015). Part logistics in the automotive
industry: Decision problems, literature review and research agenda. European Journal of
Operational Research, 242(1):107–120.
Boysen, N., Fliedner, M., and Scholl, A. (2007). A classification of assembly line balancing
problems. European Journal of Operational Research, 183(2):674–693.
Boysen, N., Fliedner, M., and Scholl, A. (2009). Sequencing mixed-model assembly lines: Survey,
classification and model critique. European Journal of Operational Research, 192(2):349–373.
Bozer, Y. A. and McGinnis, L. F. (1992). Kitting versus line stocking: A conceptual framework
and a descriptive model. International Journal of Production Economics, 28(1):1–19.
Brucker, P., Drexl, A., Mohring, R., Neumann, K., and Pesch, E. (1999). Resource-constrained
project scheduling: Notation, classification, models, and methods. European Journal of Oper-
ational Research, 112(1):3–41.
Brynzer, H. and Johansson, M. I. (1994). Storage location assignment: Using the product
structure to reduce order picking times. International Journal of Production Economics, 46-
47(1-3):595–603.
Brynzer, H. and Johansson, M. I. (1995). Design and performance of kitting and order picking
systems. International Journal of production economics, 41(1-3):115–125.
Bukchin, Y. and Meller, R. D. (2005). A space allocation algorithm for assembly line components.
IIE Transactions, 37(1):51–61.
Bukchin, Y. and Raviv, T. (2018). Constraint programming for solving various assembly line
balancing problems. Omega, 78:57–68.
Caputo, A. C. and Pelagagge, P. M. (2008). Analysis and optimization of assembly lines feeding
policies. In Proceedings of the 10th International Conference on the Modern Information
Technology in the Innovation Processes of the Industrial Enterprises.
Caputo, A. C. and Pelagagge, P. M. (2011). A methodology for selecting assembly systems
feeding policy. Industrial Management & Data Systems, 111(1-2):84–112.
Caputo, A. C., Pelagagge, P. M., and Salini, P. (2015a). A decision model for selecting parts
feeding policies in assembly lines. Industrial Management & Data Systems, 115(6):974–1003.
Caputo, A. C., Pelagagge, P. M., and Salini, P. (2015b). A model for kitting operations planning.
Assembly Automation, 35(1):69–80.
Caputo, A. C., Pelagagge, P. M., and Salini, P. (2015c). Planning models for continuous supply
of parts in assembly systems. Assembly Automation, 35(1):35–46.
Caputo, A. C., Pelagagge, P. M., and Salini, P. (2016). Selection of assembly lines feeding policies
based on parts features. IFAC-PapersOnLine, 49(12):185–190.

References 183
Caputo, A. C., Pelagagge, P. M., and Salini, P. (2017a). Modeling errors in parts supply processes
for assembly lines feeding. Industrial Management & Data Systems, 117(6):1263–1294.
Caputo, A. C., Pelagagge, P. M., and Salini, P. (2017b). Selection of assembly lines feeding
policies based on parts features and scenario conditions. International Journal of Production
Research, 56(3):1208–1232.
Caputo, A. C., Pelagagge, P. M., and Salini, P. (2018). Economic comparison of manual and
automation-assisted kitting systems. IFAC-PapersOnLine, 51(11):1482–1487.
Caputo, A. C., Pelagagge, P. M., and Salini, P. (2020). A model for planning and economic
comparison of manual and automated kitting systems. International Journal of Production
Research, 59(3):885–908.
Cerqueus, A. and Delorme, X. (2019). A branch-and-bound method for the bi-objective simple
line assembly balancing problem. International Journal of Production Research, 57(18):5640–
5659.
Chica, M., Bautista, J., and Cordon, O. (2016). A multiobjective model and evolutionary
algorithms for robust time and space assembly line balancing under uncertain demand. Omega,
58(1):55–68.
Choi, W. and Lee, Y. (2002). A dynamic part-feeding system for an automotive assembly line.
Computers & Industrial Engineering, 43(1-2):123–134.
Christmansson, M., Medbo, L., Hansson, G. A., Ohlsson, K., Bystrom, J. U., Moller, T., and
Forsman, M. (2002). A case study of a principally new way of materials kitting - an evaluation
of time consumption and physical workload. International Journal of Industrial Ergonomics,
30(1):49–65.
Coelho, F., Relvas, S., and Barbosa-Povoa, A. (2021). Simulation-based decision support tool for
in-house logistics: the basis for a digital twin. Computers & Industrial Engineering, 153:107094.
Coffman, Jr, E. G., Garey, M. R., and Johnson, D. S. (1978). An application of bin-packing to
multiprocessor scheduling. SIAM Journal on Computing, 7(1):1–17.
Cornuejols, G. (2008). Valid inequalities for mixed integer linear programs. Mathematical pro-
gramming, 112:3–44.
Cornuejols, G., Nemhauser, G., and Wolsey, L. (1990). The uncapacitated facility location
problem. In Mirchandani, P. and Francis, R., editors, Discrete Location Theory, pages 119–
171. John Wiley and Sons, Inc., New York.
Corominas, A., Garcıa-Villoria, A., and Pastor, R. (2016). Improving the resolution of the
simple assembly line balancing problem type e. SORT-Statistics and Operations Research
Transactions, 40(2):227–242.

184 References
da Cunha, A. S. and de Souza, M. C. (2008). Stronger upper and lower bounds for a hard batching
problem to feed assembly lines. Electronic Notes in Discrete Mathematics, 30:159–164.
de Souza, M. C., de Carvalho, C. R., and Brizon, W. B. (2008). Packing items to feed assembly
lines. European Journal of Operational Research, 184(2):480–489.
Elmaghraby, S. E. and Herroelen, W. S. (1980). On the measurement of complexity in activity
networks. European Journal of Operational Research, 5(4):223–234.
Emde, S. (2017). Scheduling the replenishment of just-in-time supermarkets in assembly plants.
OR Spectrum, 39(1):321–345.
Emde, S., Fliedner, M., and Boysen, N. (2012). Optimally loading tow trains for just-in-time
supply of mixed-model assembly lines. IIE Transactions, 44(2):121–135.
Emde, S. and Gendreau, M. (2017). Scheduling in-house transport vehicles to feed parts to
automotive assembly lines. European Journal of Operational Research, 260(1):255–267.
Emde, S. and Polten, L. (2019). Sequencing assembly lines to facilitate synchronized just-in-time
part supply. Journal of Scheduling, 22(6):607–621.
Emde, S. and Schneider, M. (2018). Just-in-time vehicle routing for in-house part feeding to
assembly lines. Transportation Science, 52(3):657–672.
Esmaeilbeigi, R., Naderi, B., and Charkhgard, P. (2015). The type e simple asembly line bal-
ancing problem: A mixed integer linear programming formulation. Computers & Operations
Research, 64(1):168–177.
Faccio, M. (2014). The impact of production mix variations and models varieties on the parts-
feeding policy selection in a jit assembly system. International Journal of Advanced Manufac-
turing Technology, 72(1-4):543–560.
Faccio, M., Cohen, Y., Hanson, R., Medbo, L., and Johansson, M. I. (2015). Order batching and
time efficiency in kit preparation. Assembly Automation, 35(1):143–148.
Faccio, M., Gamberi, M., Bortolini, M., and Pilati, F. (2018). Macro and micro-logistics aspects
in defining the parts-feeding policy in mixed-model assembly systems. International Journal
of Services and Operations Management, 31(4):433—-462.
Faccio, M., Gamberi, M., Persona, A., Regattieri, A., and Sgarbossa, F. (2013). Design and sim-
ulation of assembly line feeding systems in the automotive sector using supermarket, kanbans
and tow trains: A general framework. Journal of Management Control, 24(2):187–208.
Fager, P., Hanson, R., Medbo, L., and Johansson, M. I. (2019). Kit preparation for mixed
model assembly–efficiency impact of the picking information system. Computers & Industrial
Engineering, 129:169–178.

References 185
Fathi, M., Rodrıguez, V., and Alvarez, M. J. (2014). A novel memetic ant colony optimization-
based heuristic algorithm for solving the assembly line part feeding problem. International
Journal of Advanced Manufacturing Technology, 75(1-4):629–643.
Fathi, M., Rodrıguez, V., Fontes, D., and Alvarez, M. J. (2016). A modified particle swarm
optimisation algorithm to solve the part feeding problem at assembly lines. International
Journal of Production Research, 54(3):878–893.
Felipe, J., Kumar, U., Abdon, A., and Bacate, M. (2012). Product complexity and economic
development. Structural Change and Economic Dynamics, 23(1):36–68.
Ferguson, S. M., Olewnik, A. T., and Cormier, P. (2014). A review of mass customization across
marketing, engineering and distribution domains toward development of a process framework.
Research in Engineering Design, 25(1):11–30.
Finnsgard, C. and Wanstrom, C. (2013). Factors impacting manual picking on assembly lines:
an experiment in the automotive industry. International Journal of Production Research,
51(6):1789–1798.
Finnsgard, C., Wanstrom, C., Medbo, L., and Neumann, W. P. (2011). Impact of materials
exposure on assembly workstation performance. International Journal of Production Research,
49(24):7253–7274.
Fischetti, M., Ljubic, I., and Sinnl, M. (2017). Redesigning benders decomposition for large-scale
facility location. Management Science, 63(7):2146–2162.
Fleszar, K. and Hindi, K. S. (2003). An enumerative heuristic and reduction methods for the
assembly line balancing problem. European Journal of Operational Research, 145(3):606–620.
Flores, I. and Madpis, G. (1971). Average binary search length for dense ordered lists. Commu-
nications of the ACM, 14(9):602–603.
Garcıa-Villoria, A. and Pastor, R. (2013). Erratum to “a solution procedure for type e simple
assembly line balancing problem”. Computers & Industrial Engineering, 66(1):201–202.
Garey, M. R. and Johnson, D. S. (1979). Computers and intractability, volume 174. freeman San
Francisco.
Gopfert, I., von Grunert, M., and Schmid, N. A. (2016). Logistiknetze der zukunft–das neue
hersteller-zulieferer-verhaltnis in der automobilindustrie. In Logistik der Zukunft-Logistics for
the future, pages 175–217. Springer.
Graham, R. L., Lawler, E. L., Lenstra, J. K., and Rinnoy Kan, A. H. G. (1979). Optimization
and approximation in deterministic sequencing and scheduling: a survey. Annals of Discrete
Mathematics, 5:287–326.
Gue, K. R. and Kim, B. S. (2007). Puzzle-based storage systems. Navel research logistics,
54(5):556–567.
186 References
Gunther, H. O., Gronalt, M., and Piller, F. (1996). Component kitting in semi-automated printed
circuit board assembly. International Journal of Production Economics, 43(2-3):213–226.
Gurevsky, E., Battaıa, O., and Dolgui, A. (2012). Balancing of simple assembly lines under
variations of task processing times. Annals of Operations Research, 201(1):265–286.
Hackman, S. T., Magazine, M. J., and Wee, T. (1989). Fast, effective algorithms for simple
assembly line balancing problems. Operations Research, 37(6):916–924.
Hanson, R. (2011). Effects of using minomi in in–plant materials supply. Journal of Manufac-
turing Technology Management, 22(1):90–106.
Hanson, R. and Brolin, A. (2013). A comparison of kitting and continuous supply in in-plant
materials supply. International Journal of Production Research, 51(4):979–992.
Hanson, R. and Finnsgard, C. (2014). Impact of unit load size on in-plant materials supply
efficiency. International Journal of Production Economics, 147:46–52.
Hanson, R. and Medbo, L. (2012). Kitting and time efficiency in manual assembly. International
Journal of Production Research, 50(4):1115–1125.
Hanson, R. and Medbo, L. (2016a). Aspects influencing man-hour efficiency of kit preparation
for mixed-model assembly. Procedia CIRP, 44:353–358.
Hanson, R. and Medbo, L. (2016b). Aspects influencing man-hour efficiency of kit preparation
for mixed-model assembly. Procedia CIRP, 44:353–358.
Hanson, R., Medbo, L., and Johansson, M. I. (2015). Order batching and time efficiency in kit
preparation. Assembly Automation, 35(1):143–148.
Hanson, R., Medbo, L., Jukic, P., and Assaf, M. (2016). Manual picking from large containers -
time efficiency and physical workload. IFAC-PapersOnLine, 49(12):1703–1708.
Hoffmann, T. R. (1963). Assembly line balancing with a precedence matrix. Management Science,
9(4):551–562.
Hu, S. J., Ko, J., Weyand, L., ElMaraghy, H. A., Lien, T. K., Koren, Y., Bley, H., Chryssolouris,
G., Nasr, N., and Shpitalni, M. (2011). Assembly system design and operations for product
variety. CIRP annals, 60(2):715–733.
Hua, S. Y. and Johnson, D. J. (2010). Research issues on factors influencing the choice of kitting
versus line stocking. International Journal of Production Research, 48(3):779–800.
Johansson, E. and Johansson, M. I. (2006). Materials supply systems design in product develop-
ment projects. International Journal of Operations & Production Management, 26(4):371–393.
Kagermann, H., Wahlster, W., and Helbig, J. (2013). Recommendations for implementing the
strategic initiative industrie 4.0.

References 187
Khajavia, S. H., Baumers, M., Holmstrom, J., Ozcanc, E., Atkin, J., Jackson, W., and Li,
W. (2018). To kit or not to kit: Analysing the value of model-based kitting for additive
manufacturing. Computers in Industry, 98:100–117.
Kilic, H. S. and Durmusoglu, M. B. (2012). Design of kitting system in lean-based assembly
lines. Assembly Automation, 32(3):226–234.
Kilic, H. S. and Durmusoglu, M. B. (2015). Advances in assembly line parts feeding policies: a
literature review. Assembly Automation, 35(1):57–68.
Klampfl, E., Gusikhin, O., and Rossi, G. (2006). Optimization of workcell layouts in a mixed-
model assembly line environment. International Journal of Flexible Manufacturing Systems.
Klein, R. and Scholl, A. (1995). Maximizing the prodcution rate in simple assembly line balancing
- a branch and bound procedure. European Journal of Operational Research, 91(1):367–385.
Klingenberg, W. and Boksma, J. D. (2010). A conceptual framework for outsourcing of materials
handling activities in automotive: differentiation and implementation. International Journal
of Production Research, 48(16):4877–4899.
Knuth, D. E. (1999). The art of computer programming. Sorting and searching, 3:426–458.
Korf, R. E. (2009). Multi-way number partitioning. International Joint Conference on Artificial
Intelligence, pages 538–543.
Korte, B. and Vygen, J. (2012). Combinatorial Optimization: Theory and Algorithms. Springer,
Berlin, Heidelberg, 5th edition.
Kothiyal, K. P. and Kayis, B. (1995). Workplace design for manual assembly tasks: Effect
of spatial arrangement on workcycle time. International Journal of Occupational Safety and
Ergonomics, 1(2):136–143.
Kotler, P. (1989). From mass marketing to mass customization. Planning review.
Kucukkoc, I. and Zhang, D. Z. (2015). Type-e parallel two-sided assembly line balancing problem:
Mathematical model and ant colony optimisation based approach with optimised parameters.
Computers & Industrial Engineering, 84(1):56–69.
Lehmer, D. H. (1960). Teaching combinatorial tricks to a computer. In Proc. Sympos. Appl.
Math. Combinatorial Analysis, volume 10, pages 179–193.
Limere, V. (2011). To Kit or Not to Kit: Optimizing Part Feeding in the Automotive Assembly
Industry. Universiteit Ghent, Ghent.
Limere, V., van Landeghem, H., and Goetschalckx, M. (2015). A decision model for kitting and
line stocking with variable operator walking distances. Assembly Automation, 35(1):47–56.

188 References
Limere, V., van Landeghem, H., Goetschalckx, M., Aghezzaf, E. H., and McGinnis, L. F. (2012).
Optimising part feeding in the automotive assembly industry: deciding between kitting and
line stocking. International Journal of Production Research, 50(15):4046–4060.
Lodi, A. and Tramontani, A. (2013). Performance variability in mixed-integer programming.
INFORMS Tutorials in Operations Research, pages 1–12.
Mastor, A. A. (1970). An experimental investigation and comparative evaluation of production
line balancing techniques. Management Science, 16(11):728–746.
Mathisson-Ojmertz, B. and Johansson, M. I. (2000). Influences of process location on materials
handling: Cases from the automotive industry. International Journal of Logistics Research
and Applications, 3(1):25–39.
Medbo, L. (2003). Assembly work execution and materials kit functionality in parallel flow
assembly systems. International Journal of Industrial Ergonomics, 31(4):263–281.
Mokyr, J. (1998). The second industrial revolution, 1870-1914. Storia dell’economia Mondiale,
21945.
Montreuil, B. (2011). Toward a physical internet: meeting the global logistics sustainability
grand challenge. Logistics Research, 3(2):71–87.
Morrison, D. R., Sewell, E. C., and Jacobson, S. H. (2014). An application of the branch, bound,
and remember algorithm to a new simple assembly line balancing dataset. European Journal
of Operational Research, 236(2):403–409.
Neumann, W. P. and Medbo, L. (2010). Ergonomic and technical aspects in the redesign of
material supply systems: Big boxes vs. narrow bins. International Journal of Industrial Er-
gonomics, 40(5):541–548.
Otto, A., Otto, C., and Scholl, A. (2013). Systematic data generation and test design for
solution algorithms on the example of salbpgen for assembly line balancing. European Journal
of Operational Research, 228(1):33–45.
Pape, T. (2015). Heuristics and lower bounds for the simple assembly line balancing problem
type 1: Overview, computational tests and improvements. European Journal of Operational
Research, 240(1):32–42.
Patterson, J. H. and Albracht, J. J. (1975). Assembly-line balancing: zero-one programming
with fibonacci search. Operations Research, 23(1):166–172.
Plans, J. and Corominas, A. (1999). Modelling and solving the salbp-e problem. In Proceedings
of the 1999 IEEE International Symposium on Assembly and Task Planning, pages 56–360.
Rahmaniani, R., Crainic, T. G., Gendreau, M., and Rei, W. (2017). The benders decomposition
algorithm: A literature review. European Journal of Operational Research, 259(3):801–817.

References 189
Rosenberg, O. and Ziegler, H. (1992). A comparison of heuristic algorithms for cost-oriented
assembly line balancing. Zeitschrift fur Operations Research, 36(6):477–495.
Rosenblatt, M. J. and Carlson, R. C. (1985). Designing a production line to maximize profit.
IIE Transactions, 17(2):117–122.
Rossi, F., Van Beek, P., and Walsh, T. (2006). Handbook of constraint programming. Elsevier.
Rundfunk, B. (2021). Autos vom fließband. https://www.br.de/wissen/
henry-ford-automobil-auto-fliessband-100.html. Accessed: 2021-03-01.
Sali, M. and Sahin, E. (2016). Line feeding optimization for just in time assembly lines: An appli-
cation to the automotive industry. International Journal of Production Economics, 174:54–67.
Sali, M., Sahin, E., and Patchong, A. (2015). An empirical assessment of the performances of
three line feeding modes used in the automotive sector: line stocking vs. kitting vs. sequencing.
International Journal of Production Research, 53(5):1439–1459.
Salveson, M. E. (1955). The assembly line balancing problem. Journal of Industrial Engineering,
6:18–25.
Satoglu, S. I. and Ucan, K. (2015). Redesigning the material supply system of the automo-
tive suppliers based on lean principles and an application. 2015 International Conference on
Industrial Engineering and Operations Management (IEOM).
Saucedo-Martınez, J. A., Perez-Lara, M., Marmolejo-Saucedo, J. A., Salais-Fierro, T. E., and
Vasant, P. (2018). Industry 4.0 framework for management and operations: a review. Journal
of ambient intelligence and humanized computing, 9(3):789–801.
Schaus, P., Deville, Y., et al. (2008). A global constraint for bin-packing with precedences:
Application to the assembly line balancing problem. In AAAI, pages 369–374.
Schmid, N. A. and Limere, V. (2019). A classification of tactical assembly line feeding problems.
International Journal of Production Research, 57(24):7586—-7609.
Schmid, N. A., Limere, V., and Raa, B. (2018). Modeling variable space in assembly line feeding.
IFAC-PapersOnLine, 51(11):164–169.
Schmid, N. A., Limere, V., and Raa, B. (2020). Mixed model assembly line feeding with discrete
location assignments and variable station space. Omega, page In press.
Scholl, A. (1993). Data of assembly line balancing problems. Schriften zur Quantitativen Be-
triebswirtschaftslehre, 16(193).
Scholl, A. et al. (1999). Balancing and sequencing of assembly lines. Technical report, Darmstadt
Technical University, Department of Business Administration, Economics and Law, Institute
for Business Studies (BWL).

190 References
Scholl, A., Fliedner, M., and Boysen, N. (2010). Absalom: Balancing assembly lines with assign-
ment restrictions. European Journal of Operational Research, 200(3):688–701.
Scholl, A. and Klein, R. (1997). Salome: A bidirectional branch-and-bound procedure for assem-
bly line balancing. INFORMS journal on Computing, 9(4):319–334.
Sellers, C. J. and Nof, S. Y. (1986). Part kitting in robotic facilities. Robotics and Material Flow,
3(1-3):163–174.
Sellers, C. J. and Nof, S. Y. (1989). Performance analysis of robotic kitting systems. Robotics
and Computer-Integrated Manufacturing, 6(1):15–24.
Serrano, M. C., Garcıa, O. C., Arroyo, S. D., and Bautista, J. (2014). Ntigen: a software for
generating nissan based instances for time and space assembly line balancing. In Managing
Complexity, pages 121–128. Springer.
Sewell, E. C. and Jacobson, S. H. (2012). A branch, bound, and remember algorithm for the
simple assembly line balancing problem. INFORMS Journal on Computing, 24(3):433–442.
Shaw, P. (2004). A constraint for bin packing. In International conference on principles and
practice of constraint programming, pages 648–662. Springer.
Spath, D. and Baumeister, M. (2001). Synchronisation of material flow and assembly in hybrid
and modular systems. Assembly Automation, 21(2):152–157.
Sternatz, J. (2014). Enhanced multi-hoffmann heuristic for efficiently solving real-world assembly
line balancing problems in automotive industry. European Journal of Operational Research,
235(3):740–754.
Sternatz, J. (2015). The joint line balancing and material supply problem. International Journal
of Production Economics, 159:304–318.
Swaminathan, J. M. and Nitsch, T. R. (2007). Managing product variety in automobile assembly:
The importance of the sequencing point. Interfaces, 37(4):324–333.
Tappia, E., Moretti, E., and Melacini, M. (2020). A simulation analysis of part feeding to assem-
bly stations with vertical robotic storage and retrieval systems. In Lalic, B., Majstorovic, V.,
Marjanovic, U., von Cieminski, G., and Romero, D., editors, Advances in Production Manage-
ment Systems. The Path to Digital Transformation and Innovation of Production Management
Systems, pages 45–53, Cham. Springer International Publishing.
Trick, M. (2005). Formulations and reformulations in integer programming. In Bartak, R.
and Milano, M., editors, Integration of AI and OR Techniques in Constraint Programming
for Combinatorial Optimization Problems. CPAIOR 2005, volume ↑3524 of Lecture Notes in
Computer Science, pages 366–379. Springer, Berlin, Heidelberg.
Usta, S. K., Oksuz, M. K., and Durmusoglu, M. B. (2017). Design methodology for a hybrid
part feeding system in lean-based assembly lines. Assembly Automation, 37(1):84—-102.

References 191
van den Berg, J. P. (1999). A literature survey on planning and control of warehousing systems.
IIE Transactions, 31(8):751–762.
Wanstrom, C. and Medbo, L. (2009). The impact of materials feeding design on assembly process
performance. Journal of Manufacturing Technology Management, 20(1):30–51.
Watts, S. (2005). The people’s tycoon: Henry Ford and the American century. Vintage.
Wei, N.-C. and Chao, I.-M. (2011). A solution procedure for type e simple asembly line balancing
problem. Computers & Industrial Engineering, 61(1):824–830.
Welt (2013). Die inspiration, die aus dem schlachthof kam. https://www.welt.de/geschichte/
article120638758/Die-Inspiration-die-aus-dem-Schlachthof-kam.html. Accessed:
2021-03-01.
Wentges, P. (1996). Accelerating benders’ decomposition for the capacitated facility location
problem. Mathematical Methods of Operations Research, 44(2):267–290.
Wijnant, H., Schmid, N., and Limere, V. (2018). The influence of line balancing on line feeding for
mixed-model assembly lines. In 32nd annual European Simulation and Modelling Conference
2018, pages 106–111.
Wikipedia (2021). Audi wikipedia article. https://de.wikipedia.org/wiki/Audi. Accessed:
2021-03-05.
Wolsey, L. and Nemhauser, G. (1988). Integer and Combinatorial Optimization. John Wiley &
Sons, Inc., New York.
Zacharia, P. and Nearchou, A. C. (2013). A meta-heuristic algorithm for the fuzzy asembly line
balancing type e problem. Computers & Operations Research, 30(1):3033–3044.
Zeltzer, L., Aghezzaf, E.-H., and Limere, V. (2017). Workload balancing and manufacturing com-
plexity levelling in mixed-model assembly lines. International Journal of Production Research,
55(10):2829–2844.


Appendices
Appendix A
Theorem 7.3.1. The upper bound on cycle time proposed by Hackman et al. (1989), calculated
as c = maxtmax, 2tsum/m, does not hold for the more general version TSALBP-2 or any other
knapsack-constrained assembly line balancing problem.
Proof. Assume for contradiction that six serial tasks must be balanced on three stations. The
task times are: 1, 1, 1, 19, 3, 2, and the corresponding spatial requirements are 11, 10, 11, 1, 3, 3.
Thus, according to the calculations, tsum = 27 and c = 19. However, in this case, no solution can
be found, as tasks 1, 2, and 3 cannot be assigned to the same station due to spatial restrictions
when space is constrained by a value of 20. Therefore, tasks 3, 4, 5, and 6 had to be assigned
to station 3. However, this increases the cycle time to 25, whereas the solution for the problem
without space constraints would have a cycle time of 19 with tasks 1, 2, and 3 at station 1, task
4 at station 2, and tasks 5 and 6 at station 3.

194 Appendices
Appendix B
Table 7.1 Hardness list for instances from Scholl (1993)
Trivial instances
Prec. graph m m Prec. graph m m Prec. graph m m
Barthold 4 5 Bowman 3 5 Bowman 4 5
Buxey 3 13 Buxey 6 7 Buxey 9 13
Gunther 3 13 Heskiaoff 3 10 Jackson 3 7
Jackson 4 7 Jackson 5 7 Jaeschke 3 7
Jaeschke 4 7 Jaeschke 5 7 Jaeschke 6 7
Kilbridge 3 11 Kilbridge 4 11 Kilbridge 5 11
Kilbridge 7 11 Kilbridge 9 11 Kilbridge 10 11
Mansoor 3 5 Mansoor 4 5 Mertens 3 5
Mertens 4 5 Mitchell 3 9 Mitchell 4 9
Mitchell 6 9 Mitchell 7 9 Roszieg 3 10
Roszieg 4 10 Roszieg 7 10 Roszieg 9 10
Sawyer 3 13 Sawyer 4 13 Sawyer 5 13
Sawyer 6 7
Easy instances
Prec. graph m m Prec. graph m m Prec. graph m m
Arcus1 3 21 Arcus1 4 21 Arcus1 11 13
Arcus2 3 27 Arcus2 6 7 Barthold 3 15
Barthold 4 15 Barthold 7 15 Barthold 7 8
Barthold 10 15 Barthold 11 15 Barthold 13 15
Barthold 14 15 Barthold2 8 10 Buxey 4 13
Buxey 6 13 Buxey 10 11 Buxey 10 13
Gunther 4 13 Gunther 5 13 Gunther 6 13
Gunther 6 8 Gunther 10 13 Gunther 11 13
Gunther 12 13 Hahn 3 4 Hahn 3 8
Hahn 6 8 Hahn 7 8 Heskiaoff 5 10
Heskiaoff 6 10 Heskiaoff 7 10 Heskiaoff 8 10
Heskiaoff 9 10 Lutz1 3 11 Lutz1 5 11
Lutz1 6 11 Lutz1 7 11 Lutz1 8 11
Lutz1 10 11 Lutz2 3 49 Lutz2 11 13
Lutz2 15 17 Lutz2 20 25 Lutz2 21 24
Lutz2 21 25 Lutz2 22 24 Lutz3 3 23
Lutz3 4 23 Lutz3 5 23 Lutz3 7 9
Lutz3 8 9 Lutz3 11 23 Lutz3 12 14
Lutz3 12 15 Lutz3 17 23 Lutz3 18 21
Lutz3 18 23 Lutz3 19 20 Lutz3 19 21
Sawyer 6 13 Sawyer 9 13 Sawyer 10 11
Sawyer 10 13 Scholl 3 4 Tonge 4 23
Tonge 3 23 Warnecke 3 30 Warnecke 4 30
Warnecke 5 30 Warnecke 7 30 Wee-Mag 3 38
Wee-Mag 4 38 Wee-Mag 6 38 Wee-Mag 7 9
Wee-Mag 13 14 Wee-Mag 16 18
Less tricky instances

Appendices 195
Prec. graph m m Prec. graph m m Prec. graph m m
Arcus1 5 21 Arcus1 6 21 Arcus2 4 8
Barthold2 13 18 Barthold2 14 18 Lutz2 4 49
Lutz2 30 34 Lutz2 32 34 Lutz3 6 23
Scholl 6 7 Warnecke 11 13 Wee-Mag 5 38
Wee-Mag 36 38
Tricky instances
Prec. graph m m Prec. graph m m Prec. graph m m
Arcus1 8 9 Arcus1 11 21 Arcus2 6 8
Barthold2 3 28 Barthold2 12 28 Barthold2 20 25
Barthold2 21 25 Barthold2 23 25 Lutz2 7 49
Lutz2 11 49 Lutz2 18 28 Lutz2 20 26
Tonge 6 23 Warnecke 11 13 Warnecke 16 17
Very tricky instances
Prec. graph m m Prec. graph m m Prec. graph m m
Arcus1 7 21 Arcus1 8 21 Arcus1 11 12
Arcus1 15 17 Arcus1 15 21 Arcus1 16 17
Arcus1 19 21 Arcus2 4 27 Arcus2 5 8
Arcus2 10 16 Arcus2 10 27 Arcus2 11 16
Arcus2 12 16 Arcus2 13 16 Arcus2 14 16
Barthold2 3 52 Barthold2 6 28 Barthold2 8 28
Barthold2 13 28 Barthold2 20 28 Barthold2 22 25
Barthold2 27 28 Barthold2 30 34 Barthold2 30 52
Barthold2 32 33 Barthold2 32 34 Barthold2 36 39
Barthold2 36 52 Barthold2 37 39 Barthold2 41 52
Barthold2 43 49 Barthold2 43 52 Barthold2 44 48
Barthold2 44 49 Barthold2 45 47 Barthold2 45 48
Barthold2 51 52 Lutz2 10 49 Lutz2 15 49
Lutz2 18 49 Lutz2 30 49 Lutz2 42 44
Scholl 3 51 Scholl 6 51 Scholl 9 20
Scholl 9 51 Scholl 10 20 Scholl 11 20
Scholl 13 14 Scholl 13 20 Scholl 16 17
Scholl 16 20 Scholl 19 20 Scholl 22 26
Scholl 22 28 Scholl 22 30 Scholl 22 51
Scholl 24 26 Scholl 25 26 Tonge 7 23
Tonge 10 23 Tonge 11 12 Tonge 14 23
Tonge 16 17 Tonge 16 23 Tonge 19 23
Tonge 20 23 Tonge 21 23 Warnecke 10 30
Warnecke 15 30 Warnecke 19 20 Warnecke 19 30
Warnecke 22 30 Warnecke 25 30 Warnecke 27 30
Warnecke 28 30 Wee-Mag 7 38 Wee-Mag 11 38
Wee-Mag 13 38 Wee-Mag 21 24 Wee-Mag 22 24
Wee-Mag 35 38
Extremely tricky instances
Prec. graph m m Prec. graph m m Prec. graph m m
Arcus2 15 16 Arcus2 18 19 Arcus2 18 27
Arcus2 21 24 Arcus2 21 27 Arcus2 22 23

196 Appendices
Arcus2 22 24 Arcus2 26 27 Lutz2 36 49
Lutz2 46 48 Lutz2 42 49 Scholl 32 35
Scholl 32 40 Scholl 32 51 Scholl 34 35
Scholl 37 40 Scholl 38 39 Scholl 38 40
Scholl 42 51 Scholl 44 45 Scholl 44 48
Scholl 44 51 Scholl 47 48 Scholl 50 51
Wee-Mag 16 19 Wee-Mag 16 38 Wee-Mag 21 38
Wee-Mag 26 29 Wee-Mag 26 31 Wee-Mag 26 38
Wee-Mag 27 29 Wee-Mag 32 38

Appendices 197
Appendix C
As discussed in Section 6.3.2, one may include a relaxation of the optimality subproblems into the
master problem. In this case, the domain of the variables xipl, ψfpl, and tf need to be extended by
the set of stations. Furthermore, the following terms need to be added to the objective function.
Lastly, the constraints listed below need to be considered.
∑i∈I
∑s∈Si
∑p∈P
∑l∈Lsp
ciplxispl +∑f∈F
∑s∈Sf
∑p∈Pf
∑l∈Lsp
cfplψfspl +∑p∈P
∑l∈Lp
cplχpl
+∑i∈I
cRi dRi +
∑f∈F
cDf dDf +
∑l∈L
cDdDl (7.1)
∑p∈Pi
∑l∈Lsp
xispl = xfs ∀s ∈ S ∀f ∈ Fs ∀i ∈ If (7.2)
∑p∈Pi
∑l∈Lsp
tlxispl + tAxfs ≤ tfs ∀s ∈ S ∀f ∈ Fs ∀i ∈ If (7.3)
∑f∈Fm∩Fs
tfs ≤ c ∀s ∈ S ∀m ∈M (7.4)
∑i∈Is∩Ip
xispl ≤Mχpl′pl ∀s ∈ S ∀p ∈ P ∀l ∈ Lsp (7.5)
∑i∈If
xispl ≤Mψfspl ∀f ∈ F ∀s ∈ Sf ∀p ∈ Pf \ L,B
∀l ∈ Lsp ∩ L (7.6)∑i∈Is
xisLl +∑f∈Fs
ψfsSl + χBl + χKl + χTl ≤ 1 ∀s ∈ S ∀l ∈ LBs (7.7)
∑i∈Is∩IB
rirxisBl ≤ RBrχBl ∀s ∈ S ∀l ∈ LsB (7.8)
∑f∈Fs∩Fp
rfrψfspl ≤ Rprχpl ∀s ∈ S ∀p ∈ K,T ∀l ∈ Lsp
(7.9)∑i∈I
∑s∈Si
∑l∈Lsp
xispl =∑s∈Si
∑l∈Lsp
xjspl ∀f ∈ F ∀p ∈ Pf ∀j ∈ If (7.10)
∑s∈Si
∑l∈Lsp
dRpaxispl +M(va − 1) ≤ dRi ∀i ∈ I ∀a ∈ A ∀p ∈ Pi (7.11)
∑s∈Si
∑l∈LsS
dDa ψfsSl +M(va − 1) ≤ dDf ∀f ∈ FS ∀a ∈ A (7.12)
dDa χKl +M(va − 1) ≤ dDl ∀s ∈ S ∀l ∈ LsK ∀a ∈ A (7.13)
xispl ≥ 0 ∀i ∈ I ∀s ∈ Si ∀p ∈ Pi∀l ∈ Lsp ∩ L (7.14)
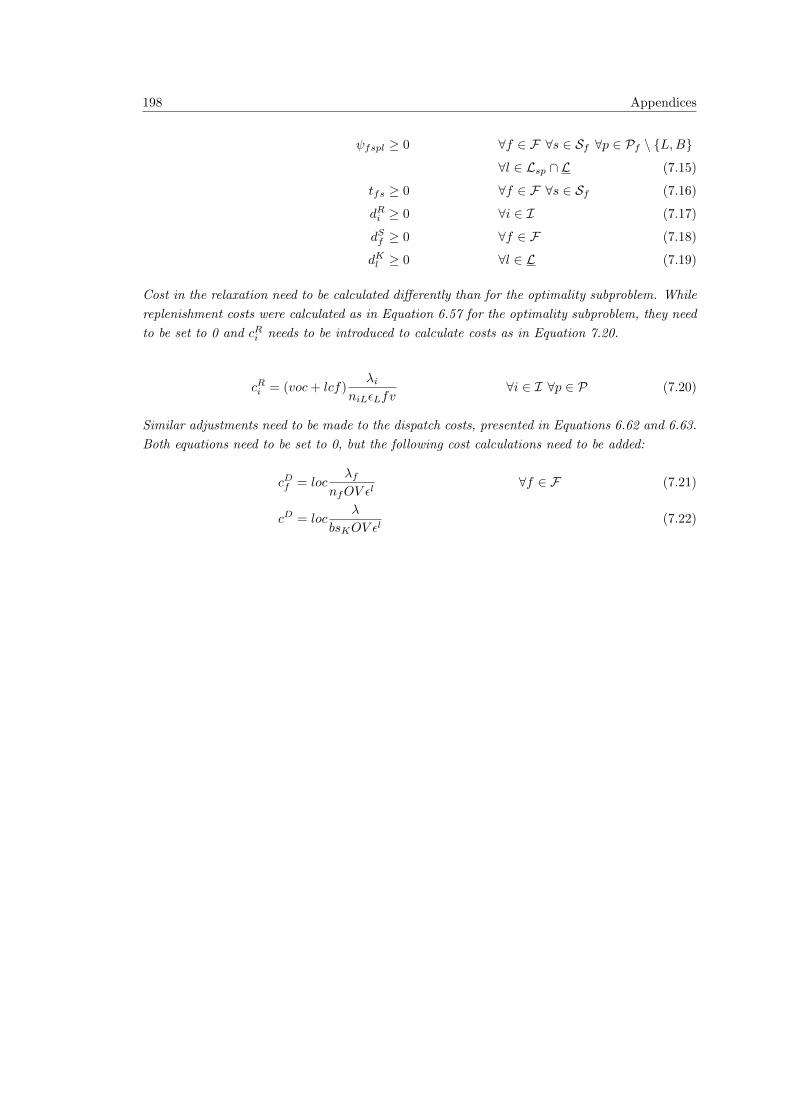
198 Appendices
ψfspl ≥ 0 ∀f ∈ F ∀s ∈ Sf ∀p ∈ Pf \ L,B
∀l ∈ Lsp ∩ L (7.15)
tfs ≥ 0 ∀f ∈ F ∀s ∈ Sf (7.16)
dRi ≥ 0 ∀i ∈ I (7.17)
dSf ≥ 0 ∀f ∈ F (7.18)
dKl ≥ 0 ∀l ∈ L (7.19)
Cost in the relaxation need to be calculated differently than for the optimality subproblem. While
replenishment costs were calculated as in Equation 6.57 for the optimality subproblem, they need
to be set to 0 and cRi needs to be introduced to calculate costs as in Equation 7.20.
cRi = (voc+ lcf)λi
niLεLfv∀i ∈ I ∀p ∈ P (7.20)
Similar adjustments need to be made to the dispatch costs, presented in Equations 6.62 and 6.63.
Both equations need to be set to 0, but the following cost calculations need to be added:
cDf = locλf
nfOV εl∀f ∈ F (7.21)
cD = locλ
bsKOV εl(7.22)