Solutions for Sustainable Urbanisation - AnnualReports.com
210
Solutions for Sustainable Urbanisation Report to Shareholders 2017
-
Upload
khangminh22 -
Category
Documents
-
view
0 -
download
0
Transcript of Solutions for Sustainable Urbanisation - AnnualReports.com
Solutions for Sustainable Urbanisation
Report to Shareholders 2017
Operating Principles
1 Best value propositions to customers.
2 Tapping and developing best talents from our global workforce.
3 Cultivating a spirit of innovation and enterprise.
4 Executing our projects well.
5 Being financially disciplined to earn best risk-adjusted returns.
6 Clarity of focus and operating within our core competence.
7 Being prepared for the future.
Vision
A global company at the forefront of our chosen industries, shaping the future for the benefit of all our stakeholders – Sustaining Growth, Empowering Lives and Nurturing Communities.
Mission
Guided by our operating principles and core values, we will deliver solutions for sustainable urbanisation profitably, safely and responsibly.
Keppel is a multi-business company committed to providing robust solutions for sustainable urbanisation. We are driving value creation by enhancing collaboration and harnessing synergies within the Group.
Focused on being at the forefront of our chosen industries, we are sharpening our competitive edge and developing new platforms for growth.
Solutions for Sustainable Urbanisation

Contents
Group Overview
Group Financial Highlights 2
Group at a Glance 4
Our Global Presence 6
Chairman’s Statement 8
Interview with the CEO 14
Board of Directors 20
Keppel Group Boards of Directors 24
Keppel Technology Advisory Panel 26
Senior Management 28
Investor Relations 30
Significant Milestones in 2017 32
Performance Review
Operating & Financial Review
Offshore & Marine 34
Property 39
Infrastructure 42
Investments 47
Management Discussion & Analysis 51
Financial Review & Outlook 53
Group Structure 61
Governance & Sustainability
Sustainability Highlights 62
Sustaining Growth
Corporate Governance 64
Risk Management 91
Regulatory Compliance 94
Environmental Performance 96
Product Excellence 97
Empowering Lives
Labour Practices & Human Rights 98
Safety & Health 99
Nurturing Communities
Our Community 100
Financial Report
Directors’ Statement & Financial Statements
Directors’ Statement 102
Independent Auditor’s Report 107
Balance Sheets 114
Consolidated Profit & Loss Account 115
Consolidated Statement of Comprehensive Income 116
Statements of Changes in Equity 117
Consolidated Statement of Cash Flows 120
Notes to the Financial Statements 123
Significant Subsidiaries & Associated Companies 171
Other Information
Interested Person Transactions 180
Key Executives 181
Major Properties 185
Group Five-Year Performance 190
Group Value-Added Statements 194
Share Performance 195
Shareholding Statistics 196
Notice of Annual General Meeting & Closure of Books 197
Corporate Information 202
Financial Calendar 203
Proxy Form 205
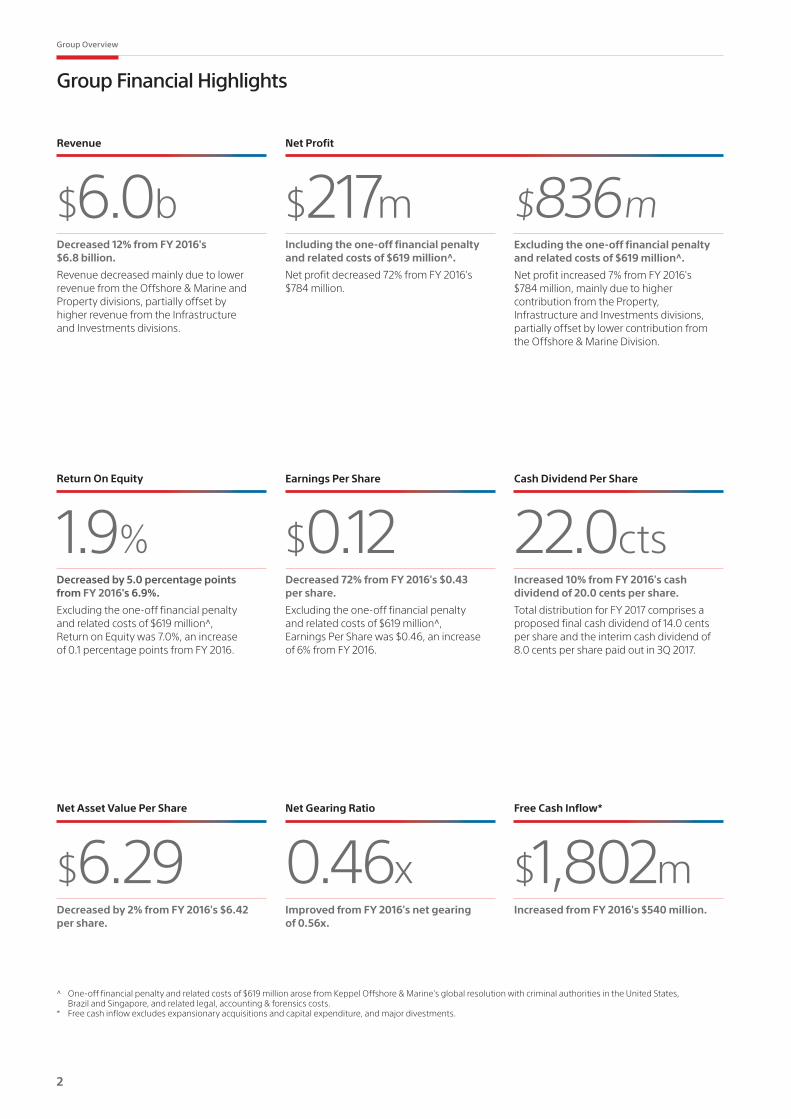
Group Financial Highlights
$6.0bDecreased 12% from FY 2016's $6.8 billion.
Revenue decreased mainly due to lower revenue from the Offshore & Marine and Property divisions, partially offset by higher revenue from the Infrastructure and Investments divisions.
$217mIncluding the one-off financial penalty and related costs of $619 million^.
Net profit decreased 72% from FY 2016's $784 million.
Revenue Net Profit
$0.12Decreased 72% from FY 2016's $0.43 per share.
Excluding the one-off financial penalty and related costs of $619 million ,̂ Earnings Per Share was $0.46, an increase of 6% from FY 2016.
22.0ctsIncreased 10% from FY 2016's cash dividend of 20.0 cents per share.
Total distribution for FY 2017 comprises a proposed final cash dividend of 14.0 cents per share and the interim cash dividend of 8.0 cents per share paid out in 3Q 2017.
Earnings Per Share Cash Dividend Per Share
$6.29Decreased by 2% from FY 2016's $6.42 per share.
0.46xImproved from FY 2016's net gearing of 0.56x.
$1,802mIncreased from FY 2016's $540 million.
Net Asset Value Per Share Net Gearing Ratio Free Cash Inflow*
1.9%Decreased by 5.0 percentage points from FY 2016's 6.9%.
Excluding the one-off financial penalty and related costs of $619 million ,̂ Return on Equity was 7.0%, an increase of 0.1 percentage points from FY 2016.
Return On Equity
^ One-off financial penalty and related costs of $619 million arose from Keppel Offshore & Marine's global resolution with criminal authorities in the United States, Brazil and Singapore, and related legal, accounting & forensics costs.
* Free cash inflow excludes expansionary acquisitions and capital expenditure, and major divestments.
$836mExcluding the one-off financial penalty and related costs of $619 million^.
Net profit increased 7% from FY 2016's $784 million, mainly due to higher contribution from the Property, Infrastructure and Investments divisions, partially offset by lower contribution from the Offshore & Marine Division.
2 3
Group Overview

n.m. = not meaningful^ Includes the one-off financial penalty from the global resolution and related costs of $619 million.* Free cash inflow excludes expansionary acquisitions and capital expenditure, and major divestments.
2017 2016 % Change
For the year ($m)
Revenue 5,964 6,767 -12%
Profit
EBITDA 988 1,032 -4%
Operating 776 795 -2%
Before tax 516^ 1,055 -51%
Net profit 217^ 784 -72%
Operating cash inflow 1,377 294 368%
Free cash inflow* 1,802 540 234%
Economic value added (834)^ (140) 496%
Per share
Earnings ($) 0.12^ 0.43 -72%
Net assets ($) 6.29 6.42 -2%
Net tangible assets ($) 6.21 6.34 -2%
At year-end ($m)
Shareholders’ funds 11,433 11,659 -2%
Non-controlling interests 527 675 -22%
Total equity 11,960 12,334 -3%
Net debt 5,519 6,966 -21%
Net gearing ratio (times) 0.46 0.56 -18%
Return on shareholders’ funds (%)
Profit before tax 4.3^ 8.8 -51%
Net profit 1.9^ 6.9 -72%
Shareholders’ value
Distribution (cents per share)
Interim dividend 8.0 8.0 –
Final dividend 14.0 12.0 17%
Total distribution 22.0 20.0 10%
Share price ($) 7.35 5.79 27%
Total shareholder return (%) 30.9 (6.3) n.m.
Group Quarterly Results ($m)
2017 2016
1Q 2Q 3Q 4Q Total 1Q 2Q 3Q 4Q Total
Revenue 1,248 1,554 1,617 1,545 5,964 1,743 1,625 1,459 1,940 6,767
EBITDA 243 196 374 175 988 334 292 238 168 1,032
Operating profit 187 139 324 126 776 278 234 185 98 795
Profit/(Loss) before tax 346 218 363 (411)^ 516^ 278 285 286 206 1,055
Attributable profit/(loss) 260 161 291 (495)^ 217̂ 211 205 225 143 784
Earnings per share (cents) 14.3 8.9 16.0 (27.3)^ 11.9^ 11.6 11.3 12.4 7.9 43.2
2 3
Keppel Corporation Limited | Report to Shareholders 2017

Property
$1,782mFrom 2016's $2,035m
As a multi-faceted property player, Keppel Land aims to be a developer with one of the highest returns on equity in Asia. To date, Keppel Land has a landbank of about 63,000 homes and a commercial portfolio of about 1.5 million square metres of gross floor area.
Keppel Land is committed to providing quality and innovative urban living solutions in the core markets of Singapore and China, and growth markets of Vietnam and Indonesia.
Infrastructure
$2,207mFrom 2016's $1,744m
The Infrastructure Division comprises the Group's businesses in energy and environmental infrastructure, as well as logistics and data centres.
In addition to developing and operating quality infrastructure assets, the Division is focused on growing its recurring income base from the management, operation and maintenance of these assets.
Offshore & Marine
$1,802mFrom 2016's $2,854m
The Offshore & Marine Division is a global leader in offshore rig design, construction and repair, shiprepair and conversion, and specialised shipbuilding.
With the integration of key functions in the New Builds and Conversions & Repairs divisions, Keppel O&M is well positioned to provide customers with reliable end-to-end solutions.
Investments
$173mFrom 2016's $134m
The Investments Division comprises Keppel Capital and Keppel Urban Solutions, as well as the Group’s investments in k1 Ventures, M1, KrisEnergy and the Sino-Singapore Tianjin Eco-City.
The Investments Division serves as an incubator for the Group’s new growth engines, harnessing the core capabilities of the Keppel Group.
The Keppel Group leverages its international network, resources and talents to provide solutions for sustainable urbanisation, harnessing synergies across its different businesses.
With prudent financial discipline and a strong balance sheet, we aim to deliver the best risk-adjusted returns for shareholders while investing for growth.
Keppel Corporation
Guided by our core values and operating principles, we will deliver solutions for sustainable urbanisation profitably, safely and responsibly. As OneKeppel, we will harness synergies across our businesses to seize new opportunities and create enduring value.
In 2017, we continued to deliver on our multi-business strategy, entering into new markets and establishing new vehicles and engines for growth.
Group Revenue ($m)
$5,964mFrom 2016's $6,767m
Revenue ($m) Revenue ($m) Revenue ($m) Revenue ($m)
Our 2017 Highlights
Delivered 10 major Offshore & Marine projects including the world’s first floating liquefaction vessel conversion for Golar LNG, and secured about $1.2 billion of non-drilling contracts.
Signed a Heads of Agreement with Pavilion Energy and Indonesia's PLN to develop small-scale liquefied natural gas infrastructure.
Announced investments of about $1.6 billion and divestments of more than $1.0 billion in the Property Division as part of a proactive capital recycling strategy.
Sold over 5,480 homes with a total sales value of about $2.8 billion.
Secured a contract to design, build and operate Hong Kong’s first Integrated Waste Management Facility and commenced construction of Keppel Marina East Desalination Plant in Singapore.
Raised over US$1.5 billion of property and data centre funds under Keppel Capital, and listed Keppel-KBS US REIT on the Singapore Exchange.
Established Keppel Urban Solutions as a master developer of large-scale urban developments.
Our 2018/2019 Strategic Focus
Strengthen our core businesses and collaborate on new opportunities, unleashing synergies from Keppel’s multi-business model to achieve our financial, people, stakeholder and process goals.
Build new engines for growth through innovation and technology.
Sharpen project execution through continuous improvements in productivity and efficiency.
Focus on enhancing risk management, compliance, controls and safety.
Enhance people development and bolster bench strength through talent management and succession planning.
Maintain strong financial discipline, seize opportunities to recycle assets, and deploy capital astutely for the best risk-adjusted returns.
12% 37% 12% 27% 29%
4 5
Group at a Glance
For more details on Property, go to: pages 39–41
For more details on Infrastructure, go to: pages 42–46
For more details on Investments, go to: pages 47–50
Net Profit by Segment ($m) Net Profit by Segment ($m) Net Profit by Segment ($m)
2016 620
2017 685
2016 2017Property Trading 240 395Property Investment 211 212Hotels/Resorts 57 11REIT 112 67
2016 99
2017 132
2016 2017Energy, Environmental & Infrastructure Services
66 100
Data Centres 29 3REIT & Trust 20 20Logistics & Others (16) 9
2016 36
2017 235
2016 2017Asset Management
64 83
Others (28) 152
Net Profit ($m) Net Profit ($m) Net Profit ($m)Group Net Profit ($m)
2013 1,846
2014 1,885
2015 1,525
2016 784
2017 217
^ Excluding one-off financial penalty from the global resolution and related costs of $619 million.
* Including one-off financial penalty from the global resolution and related costs of $619 million.
2016 2017Offshore & Marine 29 (216)Property 620 685Infrastructure 99 132Investments 36 235
^
Group Net Profit by Division ($m)
2016 784
2017 836̂
*
For more details on Offshore & Marine, go to: pages 34–38
Net Profit by Segment ($m)
2016 2017
Operations (5) (213)Associates 34 (3)
^
^ Excluding one-off financial penalty from the global resolution and related costs.
2016 29
2017 (216)^
Net Profit ($m)
2013 945
2014 1,040
2015 482
2016 29
2017 (835)
2013 800
2014 469
2015 661
2016 620
2017 685
2013 13
2014 307
2015 197
2016 99
2017 132
2013 88
2014 69
2015 185
2016 36
2017 235
* Including one-off financial penalty from the global resolution and related costs of $619 million.
*
4 5
Keppel Corporation Limited | Report to Shareholders 2017Group Overview
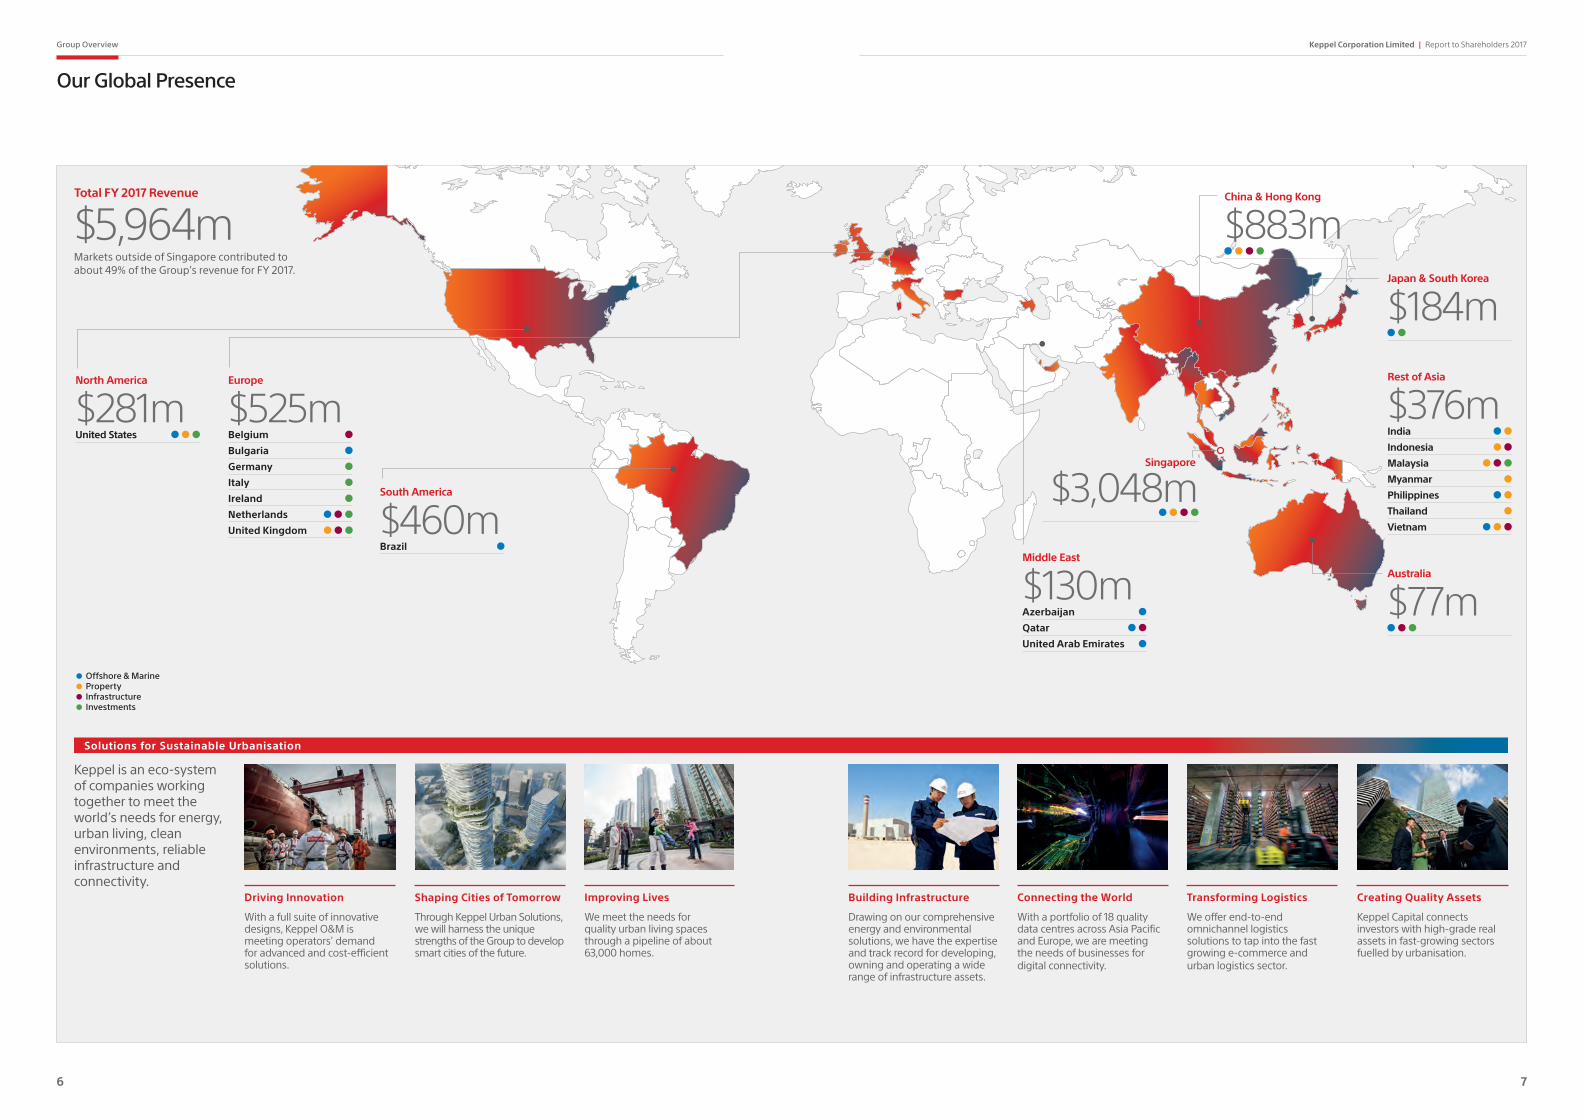
Our Global Presence
Offshore & Marine Property Infrastructure Investments
Singapore
Total FY 2017 Revenue
$5,964mMarkets outside of Singapore contributed to about 49% of the Group’s revenue for FY 2017.
North America
$281mUnited States
South America
$460mBrazil
Middle East
$130mAzerbaijan
Qatar
United Arab Emirates
Europe
$525mBelgium
Bulgaria
Germany
Italy
Ireland
Netherlands
United Kingdom
China & Hong Kong
$883m
Australia
$77m
Rest of Asia
$376mIndia
Indonesia
Malaysia
Myanmar
Philippines
Thailand
Vietnam
Japan & South Korea
$184m
$3,048m
Solutions for Sustainable Urbanisation
Keppel is an eco-system of companies working together to meet the world’s needs for energy, urban living, clean environments, reliable infrastructure and connectivity.
Driving Innovation
With a full suite of innovative designs, Keppel O&M is meeting operators' demand for advanced and cost-efficient solutions.
Building Infrastructure
Drawing on our comprehensive energy and environmental solutions, we have the expertise and track record for developing, owning and operating a wide range of infrastructure assets.
Shaping Cities of Tomorrow
Through Keppel Urban Solutions, we will harness the unique strengths of the Group to develop smart cities of the future.
Improving Lives
We meet the needs for quality urban living spaces through a pipeline of about 63,000 homes.
Connecting the World
With a portfolio of 18 quality data centres across Asia Pacific and Europe, we are meeting the needs of businesses for digital connectivity.
Transforming Logistics
We offer end-to-end omnichannel logistics solutions to tap into the fast growing e-commerce and urban logistics sector.
Creating Quality Assets
Keppel Capital connects investors with high-grade real assets in fast-growing sectors fuelled by urbanisation.
6 7
Keppel Corporation Limited | Report to Shareholders 2017Group Overview

Chairman’s Statement
Dear Shareholders,
We live in a rapidly changing and evolving world. People everywhere face digital disruptions which are changing the way they live, work, play, and interact with one another. Companies must likewise adapt to the changing environment to stay relevant and ahead of competitors.
Whether it is the growing prevalence of e-commerce, increasing shift towards renewables, needs of ageing population or rapid urbanisation in many countries, these megatrends present both challenges and opportunities that the Group can harness.
Amidst these tectonic shifts, Keppel strives to become a stronger, more innovative, and more sustainable company, with different business units collaborating to harness synergies in providing solutions for sustainable urbanisation. Keppel continues to deliver projects, enter new markets, seize new opportunities, and establish vehicles and engines for growth.
Rebuilding Trust Last December, we closed a painful chapter with the global resolution reached by Keppel Offshore & Marine (Keppel O&M) with criminal authorities in the US, Brazil and Singapore over corruption investigations in Brazil.
We regretted and are deeply disappointed by the misdeeds of certain Keppel O&M executives, which we now know to have taken place in Brazil. We have dealt firmly with the issues, including imposing sanctions and separation from these executives, and enhancing the Group's compliance regime. Integrity is one of Keppel's core values. We do not and will not tolerate any illegal activity in the conduct of our business.
The past practices uncovered at Keppel O&M do not reflect how the Keppel Group conducts business today. We have put in place significant enhancements to the compliance and internal controls systems across the Group to ensure that such unacceptable behaviour will not be repeated.
The Board and management are determined to hold the Company to the highest ethical standards and to rebuild and regain the trust which had been lost. Keppel will win business legally and ethically, on the merit of our collective strengths of superior solutions and execution. Resilience of Our Multi-Business Strategy We have stayed on track with our multi-business strategy, which continues to steady the ship through stormy weather.
Keppel will push ahead with our growth strategy, harnessing Group synergies and strengths from all our businesses. We will also strive to become a stronger, more disciplined and more sustainable company.
Lee Boon YangChairman
8 9
Group Overview
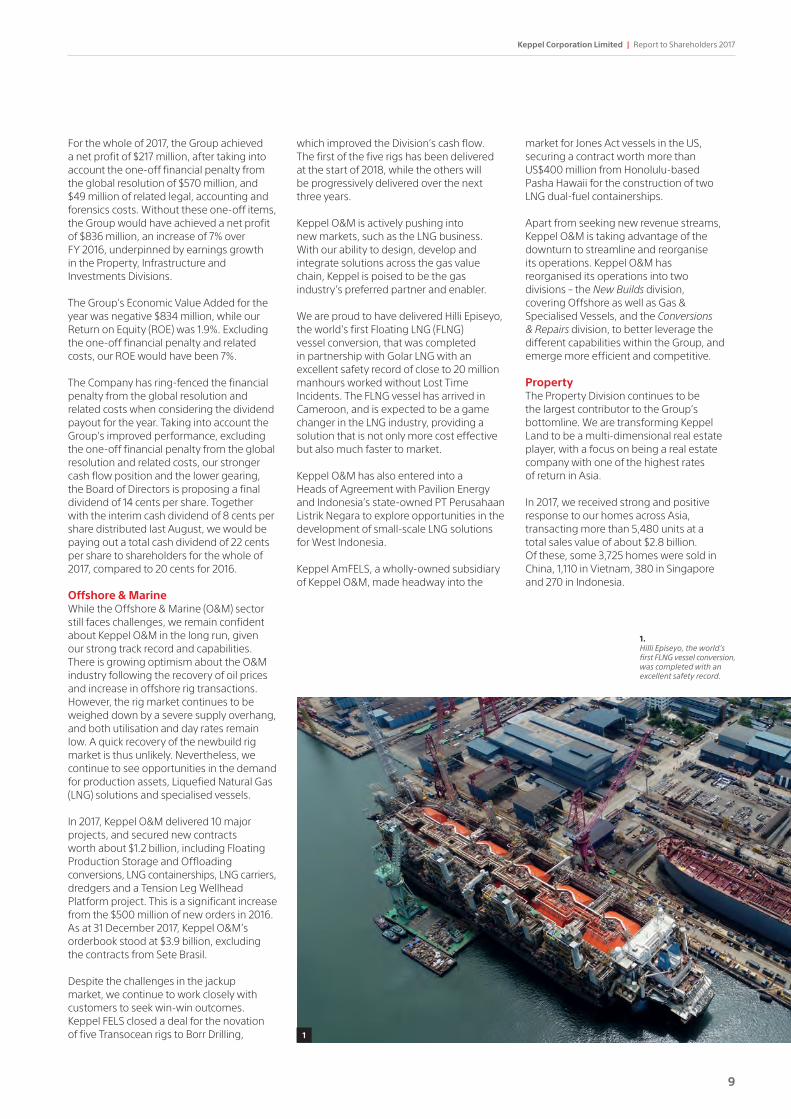
1.Hilli Episeyo, the world’s first FLNG vessel conversion, was completed with an excellent safety record.
For the whole of 2017, the Group achieved a net profit of $217 million, after taking into account the one-off financial penalty from the global resolution of $570 million, and $49 million of related legal, accounting and forensics costs. Without these one-off items, the Group would have achieved a net profit of $836 million, an increase of 7% over FY 2016, underpinned by earnings growth in the Property, Infrastructure and Investments Divisions.
The Group’s Economic Value Added for the year was negative $834 million, while our Return on Equity (ROE) was 1.9%. Excluding the one-off financial penalty and related costs, our ROE would have been 7%.
The Company has ring-fenced the financial penalty from the global resolution and related costs when considering the dividend payout for the year. Taking into account the Group’s improved performance, excluding the one-off financial penalty from the global resolution and related costs, our stronger cash flow position and the lower gearing, the Board of Directors is proposing a final dividend of 14 cents per share. Together with the interim cash dividend of 8 cents per share distributed last August, we would be paying out a total cash dividend of 22 cents per share to shareholders for the whole of 2017, compared to 20 cents for 2016.
Offshore & MarineWhile the Offshore & Marine (O&M) sector still faces challenges, we remain confident about Keppel O&M in the long run, given our strong track record and capabilities.There is growing optimism about the O&M industry following the recovery of oil prices and increase in offshore rig transactions. However, the rig market continues to be weighed down by a severe supply overhang, and both utilisation and day rates remain low. A quick recovery of the newbuild rig market is thus unlikely. Nevertheless, we continue to see opportunities in the demand for production assets, Liquefied Natural Gas (LNG) solutions and specialised vessels.
In 2017, Keppel O&M delivered 10 major projects, and secured new contracts worth about $1.2 billion, including Floating Production Storage and Offloading conversions, LNG containerships, LNG carriers, dredgers and a Tension Leg Wellhead Platform project. This is a significant increase from the $500 million of new orders in 2016. As at 31 December 2017, Keppel O&M’s orderbook stood at $3.9 billion, excluding the contracts from Sete Brasil.
Despite the challenges in the jackup market, we continue to work closely with customers to seek win-win outcomes. Keppel FELS closed a deal for the novation of five Transocean rigs to Borr Drilling,
which improved the Division’s cash flow. The first of the five rigs has been delivered at the start of 2018, while the others will be progressively delivered over the next three years.
Keppel O&M is actively pushing into new markets, such as the LNG business. With our ability to design, develop and integrate solutions across the gas value chain, Keppel is poised to be the gas industry’s preferred partner and enabler.
We are proud to have delivered Hilli Episeyo, the world's first Floating LNG (FLNG) vessel conversion, that was completed in partnership with Golar LNG with an excellent safety record of close to 20 million manhours worked without Lost Time Incidents. The FLNG vessel has arrived in Cameroon, and is expected to be a game changer in the LNG industry, providing a solution that is not only more cost effective but also much faster to market.
Keppel O&M has also entered into a Heads of Agreement with Pavilion Energy and Indonesia’s state-owned PT Perusahaan Listrik Negara to explore opportunities in the development of small-scale LNG solutions for West Indonesia.
Keppel AmFELS, a wholly-owned subsidiary of Keppel O&M, made headway into the
1
market for Jones Act vessels in the US, securing a contract worth more than US$400 million from Honolulu-based Pasha Hawaii for the construction of two LNG dual-fuel containerships.
Apart from seeking new revenue streams, Keppel O&M is taking advantage of the downturn to streamline and reorganise its operations. Keppel O&M has reorganised its operations into two divisions – the New Builds division, covering Offshore as well as Gas & Specialised Vessels, and the Conversions & Repairs division, to better leverage the different capabilities within the Group, and emerge more efficient and competitive.
Property The Property Division continues to be the largest contributor to the Group’s bottomline. We are transforming Keppel Land to be a multi-dimensional real estate player, with a focus on being a real estate company with one of the highest rates of return in Asia.
In 2017, we received strong and positive response to our homes across Asia, transacting more than 5,480 units at a total sales value of about $2.8 billion. Of these, some 3,725 homes were sold in China, 1,110 in Vietnam, 380 in Singapore and 270 in Indonesia.
8 9
Keppel Corporation Limited | Report to Shareholders 2017
Chairman’s Statement
With a landbank of about 63,000 residential units, Keppel Land is not under pressure to acquire land, and will do so very selectively. We can even choose to monetise part of this sizeable landbank, if there are good opportunities.
In 2017, Keppel Land announced five divestments totalling more than $1 billion involving projects mainly in China and Indonesia. We also made investments amounting to about $1.6 billion, including the acquisition of residential sites in Singapore, Wuxi, Ho Chi Minh City and Bangkok, thus better positioning the Group for long-term growth.
On the commercial front, Keppel Land has about one and a half million square metres of gross floor area, either completed or under development. When fully stabilised, this portfolio can generate an annual net operating income of about $300 million.
During the year, we deepened our presence in key markets in Asia. In Shanghai, Keppel Land China and Alpha Investment Partners, together with a co-investor, collaborated to acquire an office and retail mixed-use development, Trinity Tower (formerly known as SOHO Hongkou), for approximately US$525 million. We also increased our stake in the landmark mixed-use development, Saigon Centre, in Ho Chi Minh City, and expanded our presence in the Junction City development in Yangon, another market which Keppel Land has been in for many years.
Infrastructure2017 marked several significant milestones for our infrastructure business as we strengthened our positions in energy and environmental infrastructure, as well as data centres and logistics. They demonstrate how the Group is growing in our breadth of expertise and range of solutions.
Keppel Infrastructure continues to seek value-enhancing projects, leveraging its project development, engineering, and operations and maintenance expertise. The company began the year with the signing of the 25-year Water Purchase Agreement with PUB, the national water agency, for Singapore’s fourth desalination plant. The first of its kind in Singapore, the Keppel Marina East Desalination Plant will be a large-scale dual-mode desalination plant that can treat both seawater and freshwater when it is completed in 2020.
Keppel Infrastructure has also concluded an agreement with the Singapore Economic Development Board to develop, own and operate a state-of-the-art environmentally sustainable gasification facility on Jurong Island, which will be well positioned to meet the anticipated future demands of Singapore’s refining and chemicals industries. Securing the agreement is an important step in the preparation for the final investment decision, which will be taken at a later date.
1
10 11
Group Overview

Beyond Singapore, Keppel Seghers and Zhen Hua Engineering Co Ltd have secured a $5.3 billion contract to design, build and operate Hong Kong’s first Integrated Waste Management Facility. Keppel will provide its proprietary waste-to-energy technology and participate in the EPC (Engineering, Procurement and Construction) phase of the contract and subsequently undertake the operations and maintenance of the facility for 15 years after it is completed in 2024. Keppel Seghers also further reinforced its position as a leading provider of waste-to-energy solutions in China by securing two new contracts to provide technology solutions to plants in Beijing and Hunan.
Our data centre and logistics businesses under Keppel Telecommunications & Transportation are making good progress. Over the past year, the global data centre industry has continued expanding, bolstered by the burgeoning growth of cloud service providers as well as increasing storage and processing requirements due to end-user adoption of new technologies and data sovereignty regulations.
Keppel Data Centres has injected its interest in Keppel DC Singapore 4 into the Alpha Data Centre Fund (Alpha DC Fund). It has also invested in a US data centre start-up, Nautilus Data Technologies, which has developed patented water-cooling technology in pre-fabricated facilities that present more cost-efficient and environmentally-friendly solutions than traditional structures. Through the investment, we can also explore opportunities for collaboration and harnessing of synergies within the Keppel Group, such as by tapping the Group's capabilities in the O&M sector for the development of floating water-cooled data centres.
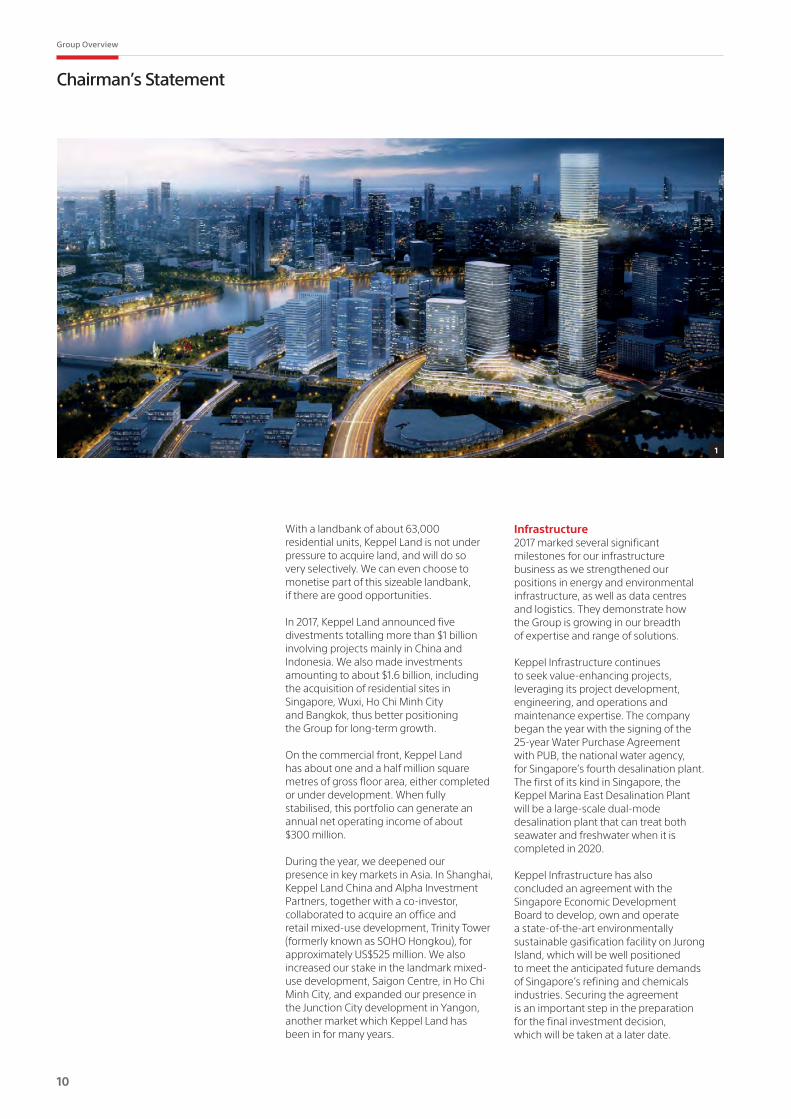
1.Riding on positive market sentiments, Keppel Land will continue to deepen its presence in growth markets with projects such as Empire City in Ho Chi Minh City, Vietnam.
2.When completed in 2020, the Keppel Marina East Desalination Plant will contribute to the Group's recurring income.
2
We are reshaping our Logistics business to tap into fast growing market sectors, such as e-commerce and urban logistics. In October, Keppel Logistics launched UrbanFox, an omnichannel logistics and channel management solutions brand with end-to-end capabilities from e-commerce channel management, warehousing and inventory management to last-mile fulfilment.
InvestmentsKeppel Capital actively pursues both organic and inorganic growth opportunities for its integrated asset management platform.
In 2017, the REITs and Trust managed by Keppel Capital continued to deliver positive total returns to unitholders and made several strategic acquisitions which strengthened their sustainable income streams. Riding on the attractive prospects of Australia’s office market, Keppel REIT acquired a 50% interest in a premium office tower to be built at 311 Spencer Street, its second asset in Melbourne. Keppel DC REIT acquired a 90% interest in Keppel DC Singapore 3, its third Singapore asset, and a second data centre asset in Dublin.
Keppel-KBS US REIT was successfully listed on the Singapore Exchange on 9 November 2017, raising about US$553 million. The US commercial real estate investment trust, jointly sponsored by Keppel Capital and KBS Pacific Advisors, is part of Keppel’s efforts to expand our asset management business into new geographies and asset classes.
The Alpha DC Fund had closed at a total of about US$1 billion, double the initial target size of US$500 million. The strong interest garnered and successful closing of the Fund are testament to Keppel’s ability to grow our capital platform with investments from
10 11
Keppel Corporation Limited | Report to Shareholders 2017
Chairman’s Statement
quality institutional investors. The Alpha DC Fund is a prime example of how we can collaborate across the Keppel Group to create and capture value for different stakeholders.
On a fully leveraged and invested basis, Keppel Capital’s assets under management (AUM) has grown from $25 billion in the preceding year to $29 billion as at end-2017. We will continue to grow our AUM, boosting the Group’s funding capabilities and expanding our funding base.
Large-scale Urban DevelopmentsKeppel leads the Singapore Consortium in the development of the Sino-Singapore Tianjin Eco-City (Tianjin Eco-City), which is envisaged to be a model for sustainable urban development, which can be replicated across other cities in China. The Tianjin Eco-City celebrates its 10th anniversary in 2018, and with its growing maturity, we have seen increasing demand for homes and land in the Eco-City. We expect the project to continue to be a long-term contributor to the Group in the years ahead.
To leverage the Group’s capabilities and strong track record in large-scale urban developments, we announced the creation of a new business unit, Keppel Urban Solutions (KUS) in October. KUS will be an integrator of the latest urban solutions, bringing together the diverse capabilities
of the Group, and also collaborating with the best-in-class technology providers, to create vibrant and smart precincts and cities of the future.
KUS will begin by collaborating with Keppel Land to apply our capabilities in the Saigon Sports City (SSC), a 64-hectare township in the prime District 2 in Ho Chi Minh City, Vietnam. We will develop SSC into a bustling hub, combining modern and sustainable urban living with vibrant and healthy lifestyles.
Committed to SustainabilityKeppel is committed to deliver value to all our stakeholders through Sustaining Growth in our businesses, Empowering Lives of people and Nurturing Communities wherever we operate.
Even as we focus on executing our businesses well for strong results, the board and management pay close attention to environmental, social and governance issues, and take them into consideration in the determination of the Company’s strategy and policies. To assist the Board in the discharge of its oversight function, all board committees, namely the Audit, Board Risk, Nominating, Remuneration, and Board Safety committees, are actively engaged and play an important role in ensuring good corporate governance in the Company and within the Group.
We are heartened that Keppel’s sustainability efforts continue to be recognised internationally, with the Company’s inclusion in the DJSI Asia Pacific Index and MSCI Global Sustainability Index, among others. The Securities Investors Association (Singapore) also named Keppel as a winner of its inaugural Sustainability Award.
With people as our most important asset, we are committed to nurture and empower a diverse, competent and dedicated talent pool to drive Keppel’s further growth. This year, we invested over 500,000 hours training Keppelites, which included leveraging e-learning platforms for faster and better reach.
Innovation has always been a part of Keppel’s DNA. To support Keppel’s mission to be a leading solutions provider for sustainable urbanisation, we established Keppel Technology & Innovation (KTI) as a change agent and innovation catalyst for the Group. Through KTI, we aim to transform how Keppel harnesses technology and innovation to create value for our stakeholders, including innovation in business models and the way we work, as well as how we collaborate with third parties to accelerate change.
1
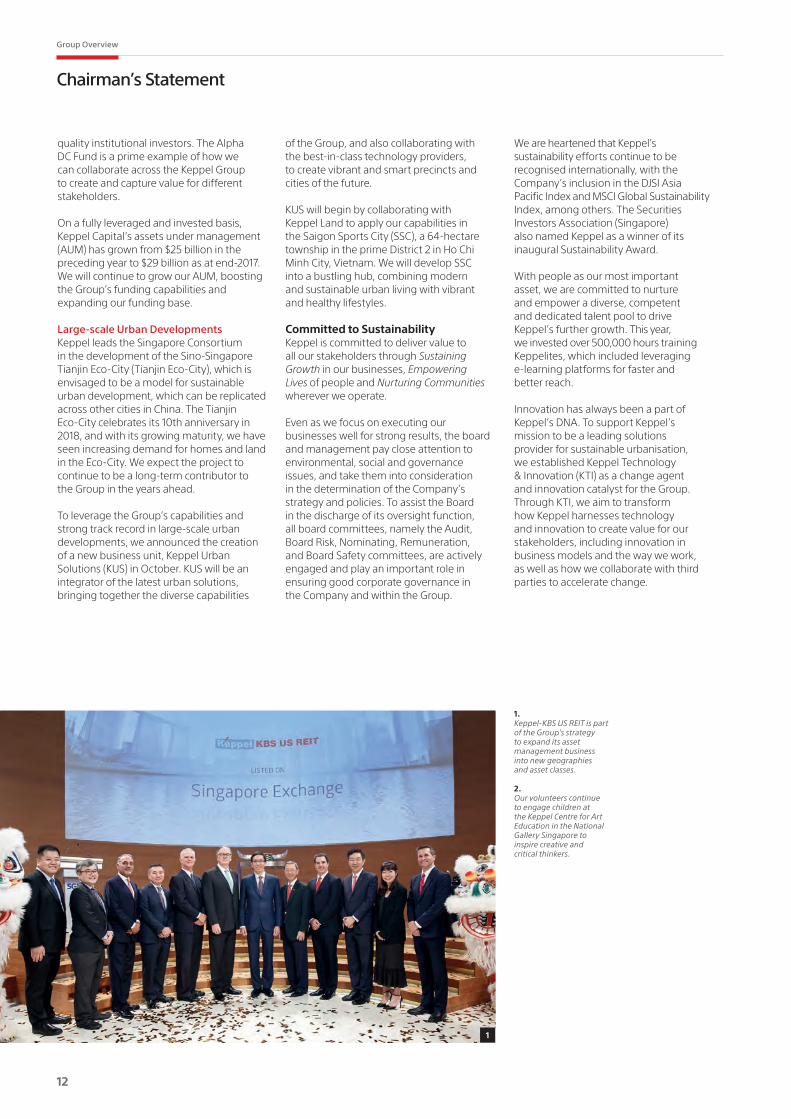
1.Keppel-KBS US REIT is part of the Group's strategy to expand its asset management business into new geographies and asset classes.
2.Our volunteers continue to engage children at the Keppel Centre for Art Education in the National Gallery Singapore to inspire creative and critical thinkers.
12 13
Group Overview
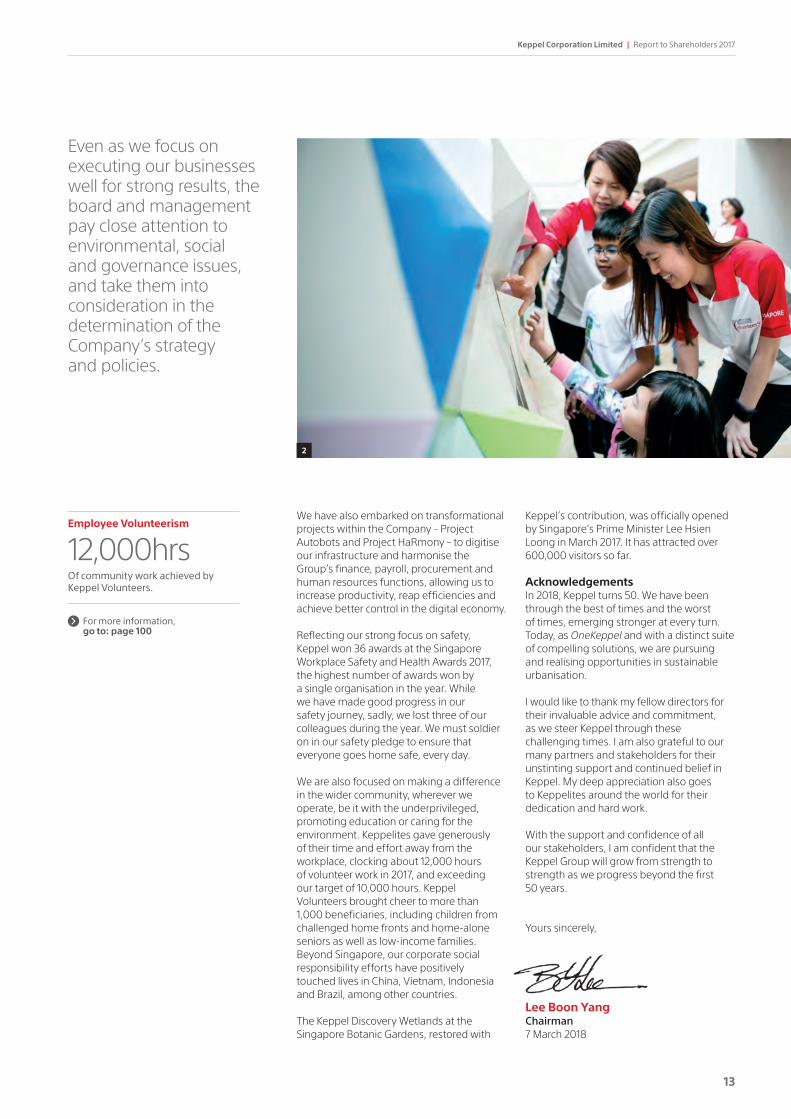
Even as we focus on executing our businesses well for strong results, the board and management pay close attention to environmental, social and governance issues, and take them into consideration in the determination of the Company’s strategy and policies.
We have also embarked on transformational projects within the Company – Project Autobots and Project HaRmony – to digitise our infrastructure and harmonise the Group’s finance, payroll, procurement and human resources functions, allowing us to increase productivity, reap efficiencies and achieve better control in the digital economy.
Reflecting our strong focus on safety, Keppel won 36 awards at the Singapore Workplace Safety and Health Awards 2017, the highest number of awards won by a single organisation in the year. While we have made good progress in our safety journey, sadly, we lost three of our colleagues during the year. We must soldier on in our safety pledge to ensure that everyone goes home safe, every day.
We are also focused on making a difference in the wider community, wherever we operate, be it with the underprivileged, promoting education or caring for the environment. Keppelites gave generously of their time and effort away from the workplace, clocking about 12,000 hours of volunteer work in 2017, and exceeding our target of 10,000 hours. Keppel Volunteers brought cheer to more than 1,000 beneficiaries, including children from challenged home fronts and home-alone seniors as well as low-income families. Beyond Singapore, our corporate social responsibility efforts have positively touched lives in China, Vietnam, Indonesia and Brazil, among other countries.
The Keppel Discovery Wetlands at the Singapore Botanic Gardens, restored with
Keppel’s contribution, was officially opened by Singapore’s Prime Minister Lee Hsien Loong in March 2017. It has attracted over 600,000 visitors so far.
AcknowledgementsIn 2018, Keppel turns 50. We have been through the best of times and the worst of times, emerging stronger at every turn. Today, as OneKeppel and with a distinct suite of compelling solutions, we are pursuing and realising opportunities in sustainable urbanisation.
I would like to thank my fellow directors for their invaluable advice and commitment, as we steer Keppel through these challenging times. I am also grateful to our many partners and stakeholders for their unstinting support and continued belief in Keppel. My deep appreciation also goes to Keppelites around the world for their dedication and hard work.
With the support and confidence of all our stakeholders, I am confident that the Keppel Group will grow from strength to strength as we progress beyond the first 50 years.
Yours sincerely,
Lee Boon YangChairman7 March 2018
Employee Volunteerism
12,000hrs Of community work achieved by Keppel Volunteers.
2
For more information, go to: page 100
12 13
Keppel Corporation Limited | Report to Shareholders 2017

Interview with the CEO
Our vision is to be a global company at the forefront of our chosen industries. The market has grown to appreciate the merits of our multi-business strategy and model for creating and capturing value across verticals.
Loh Chin HuaChief Executive Officer
Q2018 marks Keppel Corporation’s 50th anniversary and also your fifth year as CEO. What were some of the most significant highlights of the past few years?
AWhen I assumed the role of CEO at the start of 2014, my focus was to make Keppel an even better and more successful company, one that would last for generations to come. That focus remains unchanged.
At the onset, my leadership team and I sought to rally our diverse business units around a common purpose and direction for the Group. This set us on a transformational roadmap, which converged on harnessing the Group’s synergies as OneKeppel, and building new muscles to become an agile, better-rounded, and more sustainable organisation in a fast-changing landscape.
Following the sharp fall in oil price from mid-2014, we found ourselves in a perfect storm in the Offshore & Marine (O&M) business, which was at that time the main contributor to our bottom line. We worked hard over the next few years rightsizing Keppel Offshore & Marine (Keppel O&M) and reducing costs, while re-positioning it to capture new opportunities in the gas and non-drilling sectors.
Through these efforts, Keppel O&M is now more efficient and compact. With its business units working as an integrated body to offer better value propositions to our customers and partners, Keppel O&M is also in a stronger position, ready to capture opportunities when the O&M industry finally recovers.
With the privatisation of Keppel Land in 2015, our corporate structure was simplified, giving Keppel Corporation better control of the Group’s key business verticals. There is now tighter alignment across units, allowing us to strengthen collaboration and allocate capital towards investments that would yield the best risk-adjusted returns. Keppel Land has contributed noticeably, particularly in recent years. It has provided a strong pillar of earnings, which has kept the Group on an even keel, amidst turmoil in the O&M space.
Bolstering our strength in capital management, we integrated the Group’s asset management businesses under Keppel Capital in 2016. Through the managed portfolio of listed trusts and private funds, Keppel Capital enables the Group to grow its asset management business, recycle capital and expand its capital base with funding from co-investors.
More recently, in 2017, we launched Keppel Urban Solutions, our latest strategic platform aimed at melding the diverse experience and competencies of the Keppel Group to develop smart cities of the future, leveraging the latest technologies.
Today, Keppel is not just a group of diverse entities that share a common name, but an eco-system of companies working closely together, with a common purpose to provide compelling solutions for sustainable urbanisation.
Our vision to be a global company at the forefront of our chosen industries has been made clear to all Keppelites. The market has also grown to appreciate the merits of our multi-business strategy and Keppel’s model for creating and capturing value across its verticals.
14 15
Group Overview
QThe world is a very different place today. How does the future look to Keppel?
QHow will you ensure that the Group maintains a high standard of compliance?
AThe global economy is enjoying broad-based growth, with improved business sentiments in both advanced economies and emerging markets. We are excited about the many opportunities presented by strong urbanisation trends across our businesses.
At the same time, we are also seeing rapid change, with new disruptive technology and business models shaking up long-standing businesses, and threatening to derail others. Growing digitalisation, advances in artificial intelligence (AI) and robotics, will redefine the way we live and work, and can also give us the very stage to make quantum leaps.
Making Keppel future-ready, in this fast-changing world with plentiful disruptions, requires us to be agile and bold in seizing opportunities. Business models are changing, including those of our customers. We must be nimble, prepared to take calculated risks, and constantly evolve to ensure that Keppel remains relevant to our customers and the market place.
We must dare to experiment, to be the disruptor rather than the disrupted. Keppel must continue to retain the growth initiative even in the face of uncertainty. Our success lies in building resilience, staying relevant and maintaining a growth mindset.
We are creating and capturing value in our chosen industries in a way that only Keppel can - by defining our own playing fields and collaborating across units to unleash the synergies of our business model. Be they data centres, urban logistics, the gas business or urban solutions, the new growth engines to propel our future are being built today, even as we continue to ramp up our existing engines.
QHow has the global resolution changed the way you look at Keppel’s businesses and operations, particularly in emerging countries where governance issues and corruption risks are more prevalent?
AOur license to operate requires us to act within clear legal and ethical boundaries, and to contribute positively to the community, wherever we operate. As we grow our businesses in this increasingly complex global landscape, we need to conduct ourselves according to the highest ethical standards, and always do what is right, even when no one is watching.
The global resolution reached by Keppel O&M brings closure to a painful chapter. We have put in place effective compliance controls to ensure that this does not happen again. Above all, Keppel’s core values of accountability and integrity must continue to serve as the true north to guide our people.
Some people have asked if the global resolution would result in Keppel taking less risks in the future, especially in emerging countries. This is not the case. Keppel has grown to what it is today led by generations of leaders who had
AThe tone for regulatory compliance is driven from the top.
Keppel Corporation’s Board exercises oversight of regulatory compliance and governance with the support of our Group Risk and Compliance team. As CEO, I chair the Group’s Regulatory Compliance Management Committee, whose members include the heads of all business units. Each business unit in turn has its own risk and compliance team to drive and administer the compliance function, ensuring that policies, measures and best practices are cascaded down to our operations.
Our core value of integrity prohibits Keppel and its employees from engaging in any unethical practices or behaviour. This is absolutely clear to me. Since my appointment in 2014, the Chairman of the Board and I have sent letters to all employees regularly, underscoring Keppel’s anti-bribery stance and the need to embrace the Group’s Code of Conduct and apply it in all aspects of their daily work.
Compliance, like safety, is a continuous journey. Since 2015, we have strengthened our regulatory compliance measures and rolled out an improved programme across the Group. We enhanced the Employees’ Code of Conduct, which sets out key principles to guide Keppelites in carrying out their duties and responsibilities to the highest standards of personal and corporate integrity. We also revised and improved our compliance policies governing gifts and hospitality, suppliers’ code of conduct, whistle-blowing, as well as the processes for conducting due diligence on appointing and making payments to third parties who represent Keppel in business dealings.
As part of the global resolution with the criminal authorities in the three jurisdictions, Keppel O&M has committed to strengthen its compliance processes, obtain certification by accredited international bodies, and report on its corporate compliance measures annually. I am confident that Keppel O&M will emerge from this process a more disciplined company and a benchmark for the industry.
To further entrench the compliance culture, we ramped up training programmes for staff, keeping them abreast of rules and regulations, as well as the expectations of them as employees and officers of the Company. This includes comprehensive annual compliance-related e-learning and attestation exercises, which have to be completed by all Keppelites.
exercised a spirit of enterprise and taken appropriate business risks. I encourage all Keppelites to continue taking legitimate business risks for which we expect to be rewarded with appropriate returns. But there are bright lines that we must never cross.
Keppel will win business legally and ethically, based on our collective strengths, customer-centric solutions and good track record in execution. We look forward to continue on our growth trajectory and build a more disciplined and sustainable business – a Keppel that will remain trusted and admired by all our stakeholders.
14 15
Keppel Corporation Limited | Report to Shareholders 2017

Interview with the CEO
1
QWill Keppel O&M continue to feature prominently in the Group’s business mix moving forward? What is being done to prepare it to capture future opportunities?
1.Apart from purchasing land for development, Keppel Land can also selectively acquire newly-completed assets in prime locations, such as Trinity Tower (formerly known as SOHO Hongkou) in Shanghai, China.
AI do not see a future Keppel without an O&M division. The immediate focus for Keppel O&M in 2018 is to break even and position itself for growth. Beyond the current challenges, we have big plans for the Division and I am very excited about where things are heading.
Whilst shale or unconventional oil will continue to impact the energy sector, offshore oil is making a comeback. Offshore oil producers have to up their game to become more competitive against shale players. As an industry leader, Keppel O&M will play an important role to help the offshore oil sector become more efficient.
In response to our customers’ drive to improve operational efficiency and lower costs across the project life cycle, Keppel O&M is developing rigs of the future. Our initiatives include building 'digital twins' of physical structures, processes and systems; designing smarter rigs using sensing technology, and providing mission critical aftermarket services.
To execute these innovations, Keppel O&M is developing yards of the future, by incorporating robotics and AI into our manufacturing process. We are also collaborating with equipment providers to see how we can extract timely, actionable insights from the vast amount of data generated from running a rig.
Our end-to-end gas strategy will unveil new opportunities for the Group in the way forward, taking us beyond a shipyard’s regular turnkey business model to become a developer, owner and operator of floating energy infrastructure. Our experience working with various industry stakeholders such as governments, energy companies, operators and financiers over the past few years, has made apparent the gap that needs to be filled by a competent and resourceful industry partner and enabler.
With proven cryogenic expertise and the ability to stitch-up the entire gas value chain, Keppel O&M is well placed to address this growing market segment. Keppel O&M can collaborate with Keppel Infrastructure, which is already an experienced owner, developer and operator of onshore infrastructure projects, as well as with Keppel Capital to secure co-investors to fund projects.
In building the future Keppel O&M, we will need to cast our sights beyond the current playing fields. As rapid electrification continues, electricity’s share of total energy demand is expected to increase from 18% in 2015 to around 40% in 2050, with most of the production coming from renewable sources.
As it is, we have seen oil and gas majors gradually shift their business focus to renewables. They are also linking up the value chain, from upstream to downstream, to convert gas molecules into electrons. Keppel O&M likewise needs to position itself for this new reality. We are actively considering expansion into renewables, and how we can play a part in the electrification of island states using our proprietary floating solutions.
QOptimism seems to have returned to the O&M sector with the improvements in oil price. How does 2018 look from Keppel’s perspective? Is the long and harsh winter ending?
AThe more positive market sentiments appear to be underpinned by rising oil prices, and in general, a more favourable global economic environment. However, the hard times may not be over yet for many in the industry.
As I have cautioned on several occasions, the offshore rig market continues to be plagued by a supply overhang, which has put a ceiling to utilisation and day rates. It could take some more time for demand and supply to rebalance, before we see a return in new rig orders. On the brighter side, the market has seen increased secondary market activity involving companies such as Borr Drilling.
Meanwhile, we will advance our pursuit of new markets and top lines in the non-drilling sector. Despite the current challenges, Keppel O&M more than doubled its new contract wins in 2017 to $1.2 billion, from about $500 million in 2016, securing a majority of the FPSO conversion jobs in the market, on top of the contracts for newbuild dredgers and LNG dual-fuel vessels won.
We expect 2018 to be a more fruitful year. The team is working hard to convert a pipeline of potential jobs, many in the production and non-drilling sectors, into new contracts.
16 17
Group Overview

QThe Property Division has been the largest contributor to the Group’s earnings for the past three years. What opportunities are you seeing in Keppel Land’s key property markets?
QInvestors are starting to recognise the inherent value of the Group’s real estate business. What is Keppel’s strategy to realise the full potential of its Property Division?
AAs a provider of quality homes, offices and mixed-use developments, the Property Division is a core pillar in our mission to provide solutions for sustainable urbanisation. Keppel Land is in an enviable position, given its sizeable pipeline of about 63,000 homes in Asia. Of these units, 31,000 are located in China; 20,000 in Vietnam; 8,200 in Indonesia and some 1,200 in Singapore.
Despite the cooling measures, we believe that the demand for good quality homes in China remains healthy. Keppel Land will continue to deepen its presence in the five focus cities of Beijing, Chengdu, Shanghai, Tianjin and Wuxi, where it enjoys strong competitive advantage and branding.
In Vietnam, long-term prospects are supported by continued urbanisation and a growing middle class. As a pioneer foreign developer with a prime landbank mostly located in Ho Chi Minh City, Keppel Land is well positioned to tap Vietnam’s vibrant property market.
Keppel Land maintains a quality portfolio in Singapore, including the Keppel Bay precinct and the Serangoon North development. Amidst rising land prices, we will remain disciplined in bidding for sites. The returns must commensurate with the risks. Meanwhile, we are also studying the redevelopment of Keppel Towers and Nassim Woods, which can potentially add another 500 homes in prime locations to our Singapore portfolio.
On the commercial front, rising demand for high-quality office space in Asia is supporting rental growth in the region. Today, Keppel Land has a total commercial portfolio of 1.5 million square metres of gross floor area, either completed or under development, which can generate an annual net operating income of about $300 million when fully stabilised. This puts the company in prime position to ride the favourable market conditions, and earn more recurring rental income. When stabilised, the investment properties could be potentially monetised, either through a sale or injection into a REIT.
AWe are transforming Keppel Land into a multi-dimensional real estate player with one of the highest returns on equity (ROE) in Asia. Our target is a through-the-cycle ROE of about 12% for the property business. Although returns have hovered at high single-digit levels in the recent three years, we are reasonably comfortable with a longer-term target of 12% considering that Keppel Land had achieved an average ROE of 14.6% over the past decade.
In today’s context where land is expensive, we are fortunate to have entered some markets early and acquired land at relatively lower cost, particularly in China and Vietnam. With about 10 years of supply in its landbank, Keppel Land can afford to be more selective in its land acquisition – purchasing new sites only when the pricing makes sense.
In addition to selling homes, Keppel Land will also continue reviewing its sizeable residential landbank for opportunities to unlock capital that will give good returns. A case in point is the divestment of three residential projects in 2017, equivalent to about 4,330 units sold en bloc, which contributed immediately to the year’s profit. The value that we unlock can then be recycled into higher growth opportunities. Apart from purchasing land for development, we can also selectively acquire newly-completed assets in prime locations. The cost of buying land in some of these prime cities is so high today that standing investments can be bought below their replacement costs if we factored in the current land prices. After acquisition, we can add value through asset enhancements and improving the tenant mix just as we are doing in K-Plaza and Trinity Tower (formerly known as SOHO Hongkou) in Shanghai, China.
An advantage of buying completed assets is that most of them are already cash flow generating. Unlike development projects, the time-to-market for these is also much quicker, making the investment holding period shorter. Returns for such investments can be attractive and there is no need to take development risks.
I am confident that Keppel Land will be an effective, multi-faceted property solutions provider, as we work towards maintaining one of the highest ROEs in the region for a real estate company.
QThe Infrastructure Division has seen a pickup in activity in 2017. Could you discuss the key milestones achieved and the business prospects in this Division?
A2017 was a busy year for the Infrastructure Division. The Division has not only delivered significantly higher net profits year-on-year but was also active in securing new projects and building new businesses.
As an infrastructure developer, owner and operator, Keppel Infrastructure has contributed steadily to the Group’s recurring income. In 2017, Keppel Infrastructure inked two major projects, namely the Keppel Marina East Desalination Plant (KMEDP), as well as the Hong Kong Integrated Waste Management Facility (IWMF). The company also signed an agreement with the Singapore Economic Development Board to develop, own and operate a state-of-the-art gasification facility in the petrochemical hub on Jurong Island. This agreement is a pivotal first step towards achieving the final investment decision.
16 17
Keppel Corporation Limited | Report to Shareholders 2017

Interview with the CEO
QThe Investments Division performed well in 2017 with a net profit of $235 million. At a broader level, what has changed and how does the Division fit in with the Group’s growth plans?
APrior to 2016, the Investments Division had consisted mainly of the Group’s holdings in key associates such as M1, KrisEnergy and the Sino-Singapore Tianjin Eco-City (Tianjin Eco-City). In the past two years, we have added to it new operating subsidiaries – Keppel Capital and Keppel Urban Solutions (KUS) – with the aim of growing stable income contributions from the Division. Today, the Investments Division also serves as an incubator of future growth engines for the Group, as well as a driver of synergy across our key business verticals.
Through Keppel Capital, we will be looking to create more private funds and co-investment vehicles with like-minded investors. This will expand our capital base and allow us to seize more opportunities without putting a strain on our balance sheet. By enlarging our investment capacity with co-funding from like-minded investors, we can give the Group even greater financial capacity to grow.
Not all of the funds managed by Keppel Capital will be invested in assets built by the Group. But there will be considerable pull through for the various business units that are engaged in developing infrastructure and other real assets – all of which are solutions that meet the needs of urbanisation sustainably. As the assets under management (AUM) grow, the requirement for operations & maintenance services will also increase, thereby enhancing our recurring service fees. If we add that to the recurring income from our co-investments in the funds and trusts managed by Keppel Capital, as well as the asset management fees we receive, the overall quality of our earnings would improve over time with a larger proportion of income from recurring sources.
To further operationalise collaboration and the tapping of synergies, we created KUS at the end of 2017. KUS will integrate the latest urban solutions, bringing together the Group’s capabilities and track record in energy, property, infrastructure and connectivity, to create sustainable, highly-liveable and digitally-connected communities. Moreover, KUS’s open platform allows us to partner best-in-class technology providers, such as Microsoft, and tap the power of sensing technology and the Internet of Things for residents as well as operators of infrastructure and community services.
The possibilities are boundless. For a start, KUS is collaborating with Keppel Land to develop the 64-hectare Saigon Sports City, located in the prime District 2 of Ho Chi Minh City. Through KUS, the Group can enhance and capture the value of land and real estate that we own or acquire. We will be able to enjoy multiple earnings streams across the Group, as we develop, manage and maintain properties and horizontal infrastructure, and provide a host of high-quality urban services. We can also bring in co-investors through Keppel Capital to participate in this long-term value creation process.
In 2017, Keppel Infrastructure earned about $160 million in operations & maintenance revenues from power, waste-to-energy, district heating and cooling as well as water and wastewater facilities. When the KMEDP and Hong Kong IWMF are completed, they will further extend income visibility from infrastructure services into 2045.
Meanwhile, Keppel Telecommunications & Transportation (Keppel T&T) is positioning itself to ride the digitalisation wave and meet the fast-changing needs of its data centre and logistics customers.
Keppel T&T will continue pursuing new development and acquisition opportunities for data centres in Asia Pacific and Europe. The company will leverage its partnerships with the Alpha Data Centre Fund (Alpha DC Fund) and Keppel DC REIT, and focus on green data centre designs and technologies to sharpen its value proposition. In 2017, Keppel Data Centres invested US$10 million in Nautilus Data Technologies, a Californian startup currently developing a commercial water-cooled data centre for deployment in 2018.
Rapid urbanisation and the proliferation of connected mobile devices have fuelled e-commerce in Asia at high double-digit growth rates, unearthing new opportunities for omnichannel logistics, multi-modal transportation, cold chain logistics and intelligent transportation systems. Last year, we launched UrbanFox, Keppel Logistics’ new omnichannel logistics and channel management solutions arm, to tap opportunities in e-commerce by offering value-added services and solutions seamlessly from businesses to consumers.
1
1.Through the IWMF, Keppel will contribute to Hong Kong's sustainable urbanisation.
2.As its pilot project, KUS is collaborating with Keppel Land to develop the 64-ha Saigon Sports City in Ho Chi Minh City, Vietnam.
18 19
Group Overview
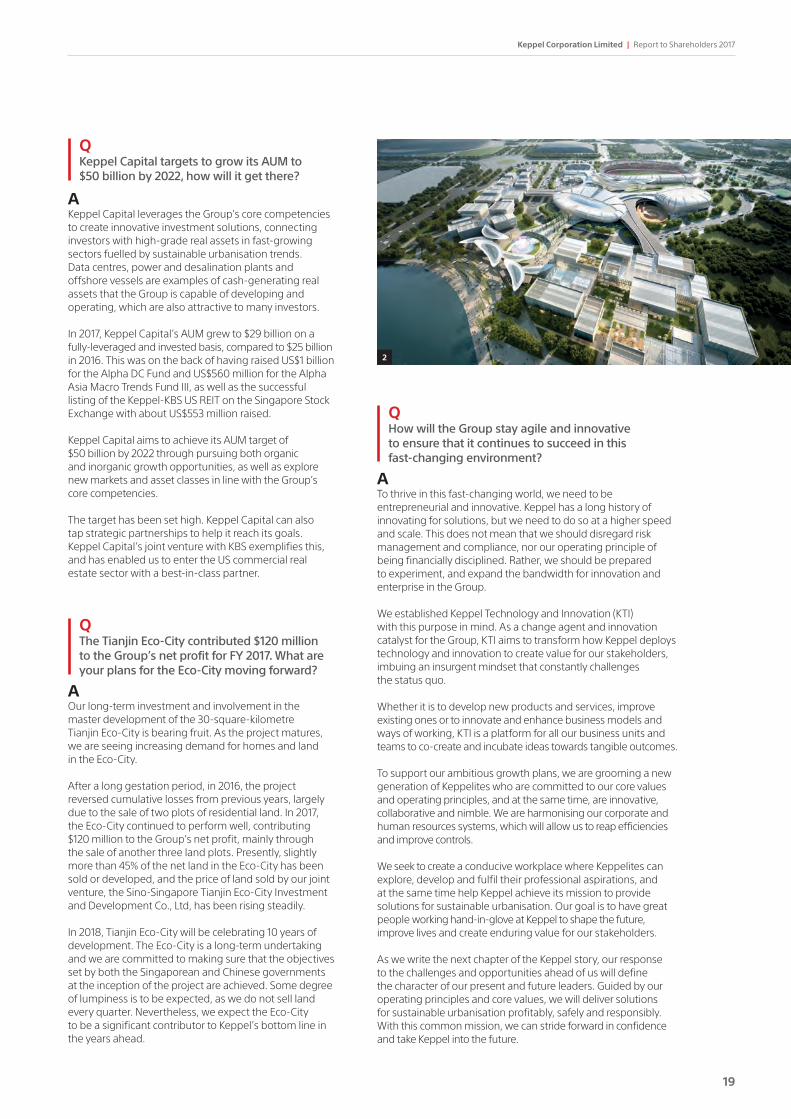
QKeppel Capital targets to grow its AUM to $50 billion by 2022, how will it get there?
QThe Tianjin Eco-City contributed $120 million to the Group’s net profit for FY 2017. What are your plans for the Eco-City moving forward?
AKeppel Capital leverages the Group’s core competencies to create innovative investment solutions, connecting investors with high-grade real assets in fast-growing sectors fuelled by sustainable urbanisation trends. Data centres, power and desalination plants and offshore vessels are examples of cash-generating real assets that the Group is capable of developing and operating, which are also attractive to many investors.
In 2017, Keppel Capital’s AUM grew to $29 billion on a fully-leveraged and invested basis, compared to $25 billion in 2016. This was on the back of having raised US$1 billion for the Alpha DC Fund and US$560 million for the Alpha Asia Macro Trends Fund III, as well as the successful listing of the Keppel-KBS US REIT on the Singapore Stock Exchange with about US$553 million raised.
Keppel Capital aims to achieve its AUM target of $50 billion by 2022 through pursuing both organic and inorganic growth opportunities, as well as explore new markets and asset classes in line with the Group’s core competencies.
The target has been set high. Keppel Capital can also tap strategic partnerships to help it reach its goals. Keppel Capital’s joint venture with KBS exemplifies this, and has enabled us to enter the US commercial real estate sector with a best-in-class partner.
AOur long-term investment and involvement in the master development of the 30-square-kilometre Tianjin Eco-City is bearing fruit. As the project matures, we are seeing increasing demand for homes and land in the Eco-City.
After a long gestation period, in 2016, the project reversed cumulative losses from previous years, largely due to the sale of two plots of residential land. In 2017, the Eco-City continued to perform well, contributing $120 million to the Group’s net profit, mainly through the sale of another three land plots. Presently, slightly more than 45% of the net land in the Eco-City has been sold or developed, and the price of land sold by our joint venture, the Sino-Singapore Tianjin Eco-City Investment and Development Co., Ltd, has been rising steadily. In 2018, Tianjin Eco-City will be celebrating 10 years of development. The Eco-City is a long-term undertaking and we are committed to making sure that the objectives set by both the Singaporean and Chinese governments at the inception of the project are achieved. Some degree of lumpiness is to be expected, as we do not sell land every quarter. Nevertheless, we expect the Eco-City to be a significant contributor to Keppel’s bottom line in the years ahead.
QHow will the Group stay agile and innovative to ensure that it continues to succeed in this fast-changing environment?
ATo thrive in this fast-changing world, we need to be entrepreneurial and innovative. Keppel has a long history of innovating for solutions, but we need to do so at a higher speed and scale. This does not mean that we should disregard risk management and compliance, nor our operating principle of being financially disciplined. Rather, we should be prepared to experiment, and expand the bandwidth for innovation and enterprise in the Group.
We established Keppel Technology and Innovation (KTI) with this purpose in mind. As a change agent and innovation catalyst for the Group, KTI aims to transform how Keppel deploys technology and innovation to create value for our stakeholders, imbuing an insurgent mindset that constantly challenges the status quo.
Whether it is to develop new products and services, improve existing ones or to innovate and enhance business models and ways of working, KTI is a platform for all our business units and teams to co-create and incubate ideas towards tangible outcomes.
To support our ambitious growth plans, we are grooming a new generation of Keppelites who are committed to our core values and operating principles, and at the same time, are innovative, collaborative and nimble. We are harmonising our corporate and human resources systems, which will allow us to reap efficiencies and improve controls.
We seek to create a conducive workplace where Keppelites can explore, develop and fulfil their professional aspirations, and at the same time help Keppel achieve its mission to provide solutions for sustainable urbanisation. Our goal is to have great people working hand-in-glove at Keppel to shape the future, improve lives and create enduring value for our stakeholders.
As we write the next chapter of the Keppel story, our response to the challenges and opportunities ahead of us will define the character of our present and future leaders. Guided by our operating principles and core values, we will deliver solutions for sustainable urbanisation profitably, safely and responsibly. With this common mission, we can stride forward in confidence and take Keppel into the future.
2
18 19
Keppel Corporation Limited | Report to Shareholders 2017
Board of Directors
Board Committees
B Board Risk Committee
B Board Safety Committee
N Nominating Committee
A Audit Committee
R Remuneration Committee
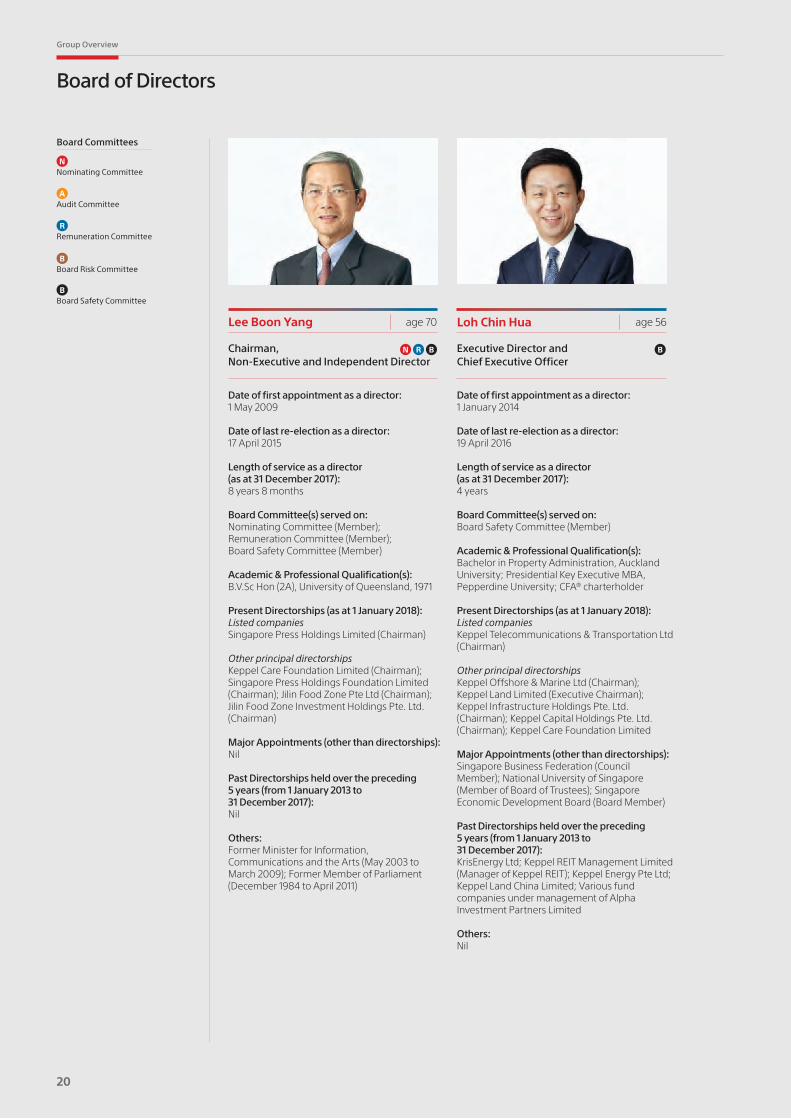
Date of first appointment as a director:1 May 2009
Date of last re-election as a director:17 April 2015
Length of service as a director (as at 31 December 2017): 8 years 8 months
Board Committee(s) served on:Nominating Committee (Member); Remuneration Committee (Member); Board Safety Committee (Member)
Academic & Professional Qualification(s): B.V.Sc Hon (2A), University of Queensland, 1971
Present Directorships (as at 1 January 2018):Listed companiesSingapore Press Holdings Limited (Chairman)
Other principal directorshipsKeppel Care Foundation Limited (Chairman); Singapore Press Holdings Foundation Limited (Chairman); Jilin Food Zone Pte Ltd (Chairman); Jilin Food Zone Investment Holdings Pte. Ltd. (Chairman)
Major Appointments (other than directorships):Nil
Past Directorships held over the preceding 5 years (from 1 January 2013 to 31 December 2017): Nil
Others:Former Minister for Information, Communications and the Arts (May 2003 to March 2009); Former Member of Parliament (December 1984 to April 2011)
Date of first appointment as a director:1 January 2014
Date of last re-election as a director:19 April 2016
Length of service as a director (as at 31 December 2017): 4 years
Board Committee(s) served on:Board Safety Committee (Member) Academic & Professional Qualification(s): Bachelor in Property Administration, Auckland University; Presidential Key Executive MBA, Pepperdine University; CFA® charterholder
Present Directorships (as at 1 January 2018):Listed companiesKeppel Telecommunications & Transportation Ltd (Chairman) Other principal directorshipsKeppel Offshore & Marine Ltd (Chairman); Keppel Land Limited (Executive Chairman); Keppel Infrastructure Holdings Pte. Ltd. (Chairman); Keppel Capital Holdings Pte. Ltd. (Chairman); Keppel Care Foundation Limited
Major Appointments (other than directorships):Singapore Business Federation (Council Member); National University of Singapore (Member of Board of Trustees); Singapore Economic Development Board (Board Member)
Past Directorships held over the preceding 5 years (from 1 January 2013 to 31 December 2017): KrisEnergy Ltd; Keppel REIT Management Limited (Manager of Keppel REIT); Keppel Energy Pte Ltd; Keppel Land China Limited; Various fund companies under management of Alpha Investment Partners Limited Others:Nil
Chairman, Non-Executive and Independent Director
Lee Boon Yang age 56
Executive Director and Chief Executive Officer
Loh Chin Huaage 70
N R B B
20 21
Group Overview
N R B N A
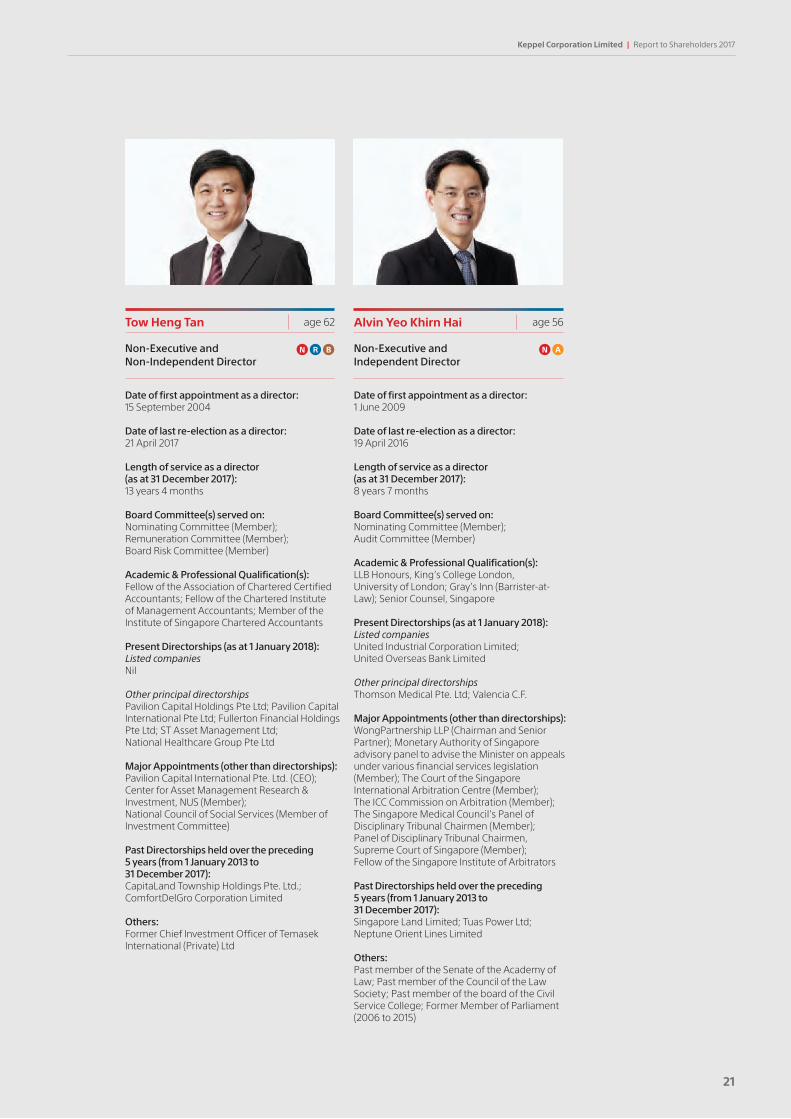
Date of first appointment as a director:15 September 2004
Date of last re-election as a director:21 April 2017
Length of service as a director (as at 31 December 2017): 13 years 4 months
Board Committee(s) served on:Nominating Committee (Member); Remuneration Committee (Member); Board Risk Committee (Member)
Academic & Professional Qualification(s): Fellow of the Association of Chartered Certified Accountants; Fellow of the Chartered Institute of Management Accountants; Member of the Institute of Singapore Chartered Accountants
Present Directorships (as at 1 January 2018):Listed companiesNil
Other principal directorshipsPavilion Capital Holdings Pte Ltd; Pavilion Capital International Pte Ltd; Fullerton Financial Holdings Pte Ltd; ST Asset Management Ltd; National Healthcare Group Pte Ltd
Major Appointments (other than directorships):Pavilion Capital International Pte. Ltd. (CEO);Center for Asset Management Research & Investment, NUS (Member); National Council of Social Services (Member of Investment Committee)
Past Directorships held over the preceding 5 years (from 1 January 2013 to 31 December 2017): CapitaLand Township Holdings Pte. Ltd.; ComfortDelGro Corporation Limited
Others:Former Chief Investment Officer of Temasek International (Private) Ltd
Date of first appointment as a director:1 June 2009
Date of last re-election as a director:19 April 2016
Length of service as a director (as at 31 December 2017): 8 years 7 months
Board Committee(s) served on:Nominating Committee (Member); Audit Committee (Member)
Academic & Professional Qualification(s): LLB Honours, King’s College London, University of London; Gray’s Inn (Barrister-at-Law); Senior Counsel, Singapore
Present Directorships (as at 1 January 2018):Listed companiesUnited Industrial Corporation Limited; United Overseas Bank Limited
Other principal directorshipsThomson Medical Pte. Ltd; Valencia C.F.
Major Appointments (other than directorships):WongPartnership LLP (Chairman and Senior Partner); Monetary Authority of Singapore advisory panel to advise the Minister on appeals under various financial services legislation (Member); The Court of the Singapore International Arbitration Centre (Member); The ICC Commission on Arbitration (Member);The Singapore Medical Council’s Panel of Disciplinary Tribunal Chairmen (Member); Panel of Disciplinary Tribunal Chairmen, Supreme Court of Singapore (Member); Fellow of the Singapore Institute of Arbitrators
Past Directorships held over the preceding 5 years (from 1 January 2013 to 31 December 2017): Singapore Land Limited; Tuas Power Ltd; Neptune Orient Lines Limited
Others:Past member of the Senate of the Academy of Law; Past member of the Council of the Law Society; Past member of the board of the Civil Service College; Former Member of Parliament (2006 to 2015)
Non-Executive and Non-Independent Director
Tow Heng Tan age 62
Non-Executive and Independent Director
Alvin Yeo Khirn Hai age 56
20 21
Keppel Corporation Limited | Report to Shareholders 2017

Board of Directors
Date of first appointment as a director:1 October 2010
Date of last re-election as a director:21 April 2017
Length of service as a director (as at 31 December 2017): 7 years 3 months
Board Committee(s) served on:Audit Committee (Chairman); Remuneration Committee (Member); Board Risk Committee (Member) Academic & Professional Qualification(s): Member of the Institute of Chartered Accountants in England & Wales
Present Directorships (as at 1 January 2018):Listed companiesDBS Group Holdings Ltd; M1 Limited (Chairman) Other principal directorshipsChangi Airport Group (Singapore) Pte Ltd; DBS Bank Ltd; DBS Bank (China) Limited; DBS Foundation Ltd; Ascendas-Singbridge Pte. Ltd.
Major Appointments (other than directorships):Nil
Past Directorships held over the preceding 5 years (from 1 January 2013 to 31 December 2017): Singapore Olympic Foundation; CapitaLand Mall Trust Management Limited (Manager of Capitaland Mall Trust); JTC Corporation Others:Former Managing Partner, KPMG LLP, Singapore; Past member of KPMG’s International Board and Council; Former Head of Audit and Risk Advisory Services and Head of Financial Services
age 62
Non-Executive and Independent Director
Tan Ek Kia age 69
A BB A R B
Date of first appointment as a director: 1 October 2010
Date of last re-election as a director: 19 April 2016
Length of service as a director (as at 31 December 2017): 7 years 3 months
Board Committee(s) served on:Board Safety Committee (Chairman); Audit Committee (Member); Board Risk Committee (Member)
Academic & Professional Qualification(s): BSc Mechanical Engineering (First Class Hons), Nottingham University, United Kingdom; Management Development Programme, International Institute for Management Development, Lausanne, Switzerland; Fellow of the Institute of Engineers, Malaysia; Chartered Engineer of Engineering Council, United Kingdom; Member of Institute of Mechanical Engineer, United Kingdom
Present Directorships (as at 1 January 2018):Listed companiesKrisEnergy Ltd (Chairman); PT Chandra Asri Petrochemical Tbk; Transocean Ltd
Other principal directorshipsSMRT Corporation Ltd; Keppel Offshore & Marine Ltd; Star Energy Group Holdings Pte Ltd (Chairman); Dialog Systems (Asia) Pte Ltd
Major Appointments (other than directorships):Nil
Past Directorships held over the preceding 5 years (from 1 January 2013 to 31 December 2017): CitySpring Infrastructure Management Pte Ltd (as Trustee-Manager of CitySpring Infrastructure Trust); City Gas Pte Ltd
Others:Former Vice President (Ventures and Developments) of Shell Chemicals, Asia Pacific and Middle East region (based in Singapore); Former Chairman, Shell companies in North East Asia; Former Managing Director, Shell Malaysia Exploration and Production
Non-Executive and Independent Director
Danny Teoh
22 23
Group Overview
N BB
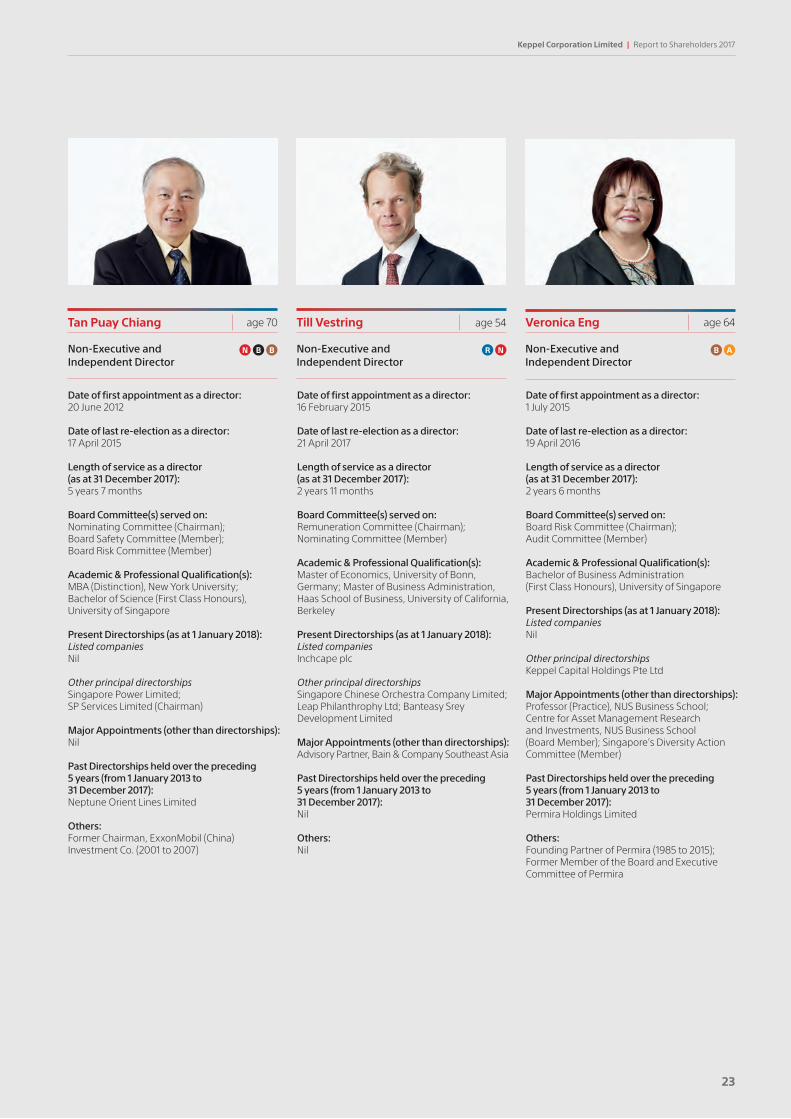
Date of first appointment as a director:20 June 2012
Date of last re-election as a director:17 April 2015
Length of service as a director (as at 31 December 2017): 5 years 7 months
Board Committee(s) served on:Nominating Committee (Chairman); Board Safety Committee (Member); Board Risk Committee (Member)
Academic & Professional Qualification(s): MBA (Distinction), New York University; Bachelor of Science (First Class Honours), University of Singapore
Present Directorships (as at 1 January 2018):Listed companiesNil
Other principal directorshipsSingapore Power Limited; SP Services Limited (Chairman)
Major Appointments (other than directorships):Nil
Past Directorships held over the preceding 5 years (from 1 January 2013 to 31 December 2017): Neptune Orient Lines Limited
Others:Former Chairman, ExxonMobil (China) Investment Co. (2001 to 2007)
Non-Executive and Independent Director
Tan Puay Chiang age 70
R N B A
Date of first appointment as a director:16 February 2015
Date of last re-election as a director:21 April 2017
Length of service as a director (as at 31 December 2017): 2 years 11 months
Board Committee(s) served on:Remuneration Committee (Chairman); Nominating Committee (Member)
Academic & Professional Qualification(s): Master of Economics, University of Bonn, Germany; Master of Business Administration, Haas School of Business, University of California, Berkeley
Present Directorships (as at 1 January 2018):Listed companiesInchcape plc
Other principal directorshipsSingapore Chinese Orchestra Company Limited; Leap Philanthrophy Ltd; Banteasy Srey Development Limited
Major Appointments (other than directorships):Advisory Partner, Bain & Company Southeast Asia
Past Directorships held over the preceding 5 years (from 1 January 2013 to 31 December 2017): Nil
Others:Nil
Date of first appointment as a director:1 July 2015
Date of last re-election as a director:19 April 2016
Length of service as a director (as at 31 December 2017): 2 years 6 months
Board Committee(s) served on:Board Risk Committee (Chairman); Audit Committee (Member)
Academic & Professional Qualification(s): Bachelor of Business Administration (First Class Honours), University of Singapore
Present Directorships (as at 1 January 2018):Listed companiesNil
Other principal directorshipsKeppel Capital Holdings Pte Ltd
Major Appointments (other than directorships):Professor (Practice), NUS Business School; Centre for Asset Management Research and Investments, NUS Business School (Board Member); Singapore’s Diversity Action Committee (Member)
Past Directorships held over the preceding 5 years (from 1 January 2013 to 31 December 2017): Permira Holdings Limited
Others:Founding Partner of Permira (1985 to 2015); Former Member of the Board and Executive Committee of Permira
Non-Executive and Independent Director
Non-Executive and Independent Director
Till Vestring Veronica Engage 54 age 64
22 23
Keppel Corporation Limited | Report to Shareholders 2017
Keppel Group Boards of Directors
Keppel Offshore & Marine
Loh Chin Hua ChairmanChief Executive Officer, Keppel Corporation
Chris Ong Leng YeowChief Executive Officer
Stephen Pan Yue KuoChairman, World-Wide Shipping Agency Limited
Prof Minoo Homi Patel, FREngChief Executive Officer,BPP Technical Services Group, UK
Dr Malcolm SharplesPresident, Offshore Risk & Technology Consulting Inc, USA
Po’ad Bin Shaik Abu Bakar Mattar Independent Director, Hong Leong Finance Limited
Tan Ek Kia Chairman, Star Energy Group Holdings Pte Ltd
Lim Chin Leong Former Chairman of Asia, Schlumberger
Robert D. SomervilleChairman, Maine Maritime Academy Board of Trustees
Chan Hon ChewChief Financial Officer, Keppel Corporation
Kevin Kwok KhienIndependent Director, Singapore Exchange Ltd
Keppel Infrastructure
Loh Chin HuaChairmanChief Executive Officer, Keppel Corporation
Dr Ong Tiong Guan Chief Executive Officer
Chan Hon Chew Chief Financial Officer, Keppel Corporation
Koh Ban HengDirector
Khoo Chin HeanDirector
Louis Lim Lu-YiChief Operating Officer, Keppel Land
Keppel Infrastructure Fund Management (Trustee-manager of Keppel Infrastructure Trust)
Koh Ban HengChairman
Thio Shen Yi Joint Managing Director, TSMP Law Corporation
Daniel Cuthbert Ee Hock HuatIndependent Director
Mark Andrew Yeo Kah ChongIndependent Director
Kunnasagaran ChinniahIndependent Director
Christina Tan Hua Mui Chief Executive Officer, Keppel Capital
Keppel Telecommunications & Transportation
Loh Chin HuaChairmanChief Executive Officer, Keppel Corporation Thomas Pang Thieng Hwi Chief Executive Officer
Prof Neo Boon SiongCanon Endowed Chair Professor of Business and Director, Asian Business Case Centre at Nanyang Business School, Nanyang Technological University Karmjit SinghIndependent Director
Lim Chin Leong Former Chairman of Asia, Schlumberger
Chan Hon ChewChief Financial Officer, Keppel Corporation
Khor Poh HwaIndependent Director
Lee Ai Ming (Mrs)Senior Consultant, Dentons Rodyk & Davidson LLP
24 25
Group Overview

Keppel Land
Loh Chin HuaExecutive ChairmanChief Executive Officer, Keppel Corporation
Tan Yam PinFormer Managing Director, Fraser and Neave Group
Koh-Lim Wen Gin Former URA Chief Planner and Deputy Chief Executive Officer
Yap Chee Meng Former Senior Partner, KPMG and COO of KPMG International for Asia Pacific
Willy Shee Ping Yah Senior Advisor and Former Chairman, CBRE
Chan Hon Chew Chief Financial Officer, Keppel Corporation
Keppel Capital
Loh Chin HuaChairmanChief Executive Officer, Keppel Corporation
Christina Tan Hua Mui Chief Executive Officer
Chan Hon Chew Chief Financial Officer, Keppel Corporation Dr Ong Tiong Guan Chief Executive Officer, Keppel Infrastructure Thomas Pang Thieng Hwi Chief Executive Officer, Keppel Telecommunications & Transportation
Tow Heng Tan Chief Executive Officer, Pavilion Capital International Pte. Ltd.
Veronica Eng Independent Director,Keppel Corporation
Keppel REIT Management (Manager of Keppel REIT)
Penny Goh (Mrs) Chairman Co-Chairman and Senior Partner, Allen & Gledhill LLP
Tan Swee Yiow Chief Executive Officer
Lee Chiang Huat Independent Director
Daniel Chan Choong Seng Managing Director, DCG Capital Pte. Ltd.
Lor Bak Liang Independent Director
Christina Tan Hua Mui Chief Executive Officer, Keppel Capital
Alan Rupert Nisbet Principal, Kanni Advisory
Keppel DC REIT Management (Manager of Keppel DC REIT)
Chan Hon Chew ChairmanChief Financial Officer, Keppel Corporation
Lee Chiang HuatIndependent Director
Leong Weng Chee Independent Director
Dileep Nair Independent Director Teo Cheng Hiang Richard Independent Director
Dr Tan Tin WeeChief Executive, National Supercomputing Centre (NSCC), Singapore; Chairman, A*STAR Computational Resource Centre (ACRC); Associate Professor, Department of Biochemistry, National University of Singapore
Thomas Pang Thieng HwiChief Executive Officer, Keppel Telecommunications & Transportation
Christina Tan Hua MuiChief Executive Officer, Keppel Capital
24 25
Keppel Corporation Limited | Report to Shareholders 2017
Keppel Technology Advisory Panel
The Keppel Technology Advisory Panel (KTAP) was established in 2004 as a key platform to advance the Group’s technology leadership. Its members include eminent business leaders and industry experts from across the world.
Over the years, KTAP members have contributed to a broad range of ideas and technology foresight in Keppel. Besides offshore and marine topics like drilling and subsea technologies, KTAP has broadened its agenda to cover more of Keppel’s diversified businesses, with themes like sustainable urbanisation, wastewater technologies, solid waste management, alternative energy and more. This has helped Keppel to enhance business value and to harness synergies across the Group.
KTAP convenes once a year with key members of Keppel Corporation’s board and senior management. Throughout the year, KTAP members support and provide advice on projects that are driven by cross-functional teams across various business units.
Professor Ng Wun Jern KTAP ChairmanBSc (Civil Engineering), QMC, University of London; MSc (Water Resources) and PhD, University of Birmingham, PE(S), FIES, FSEng.
Professor Ng is the Executive Director at the Nanyang Environment & Water Research Institute, and Professor of Environmental Engineering in the School of Civil & Environmental Engineering at Nanyang Technological University. He has some 400 publications on water and wastewater management, has founded spin-off companies based on his IPs, and serves as technical advisor to various environmental companies across ASEAN, China and India. He also operates his own spin-off companies which are active in China, Indonesia and Vietnam.
Professor Chan Eng SoonB.Eng (First Class Honours) & M.Eng, National University of Singapore (NUS); PhD, Masachusetts Institute of Technology.
Professor Chan, Provost's Chair Professor in the Faculty of Engineering at the National University of Singapore, is a Fellow of the Singapore Academy of Engineering, Institute of Marine Engineering, Science & Technology, and the Institution of Engineers Singapore. He is the CEO of the Technology Centre for Offshore & Marine, Singapore and Programme Director for Offshore & Marine in the Science & Engineering Research Council of A*STAR. Professor Chan was Vice Provost (Special Duties) of the National University of Singapore and Keppel Chair Professor in the Faculty of Engineering. Prior to his Vice Provost position, he was the Dean of the Faculty of Engineering and Head of the Civil Engineering Department. He was also the Executive Director of the Centre for Offshore Research and Engineering, National University of Singapore, and Director of Tropical Marine Science Institute. Professor Chan has served on the Management Board and Board of Governors of various institutions and research centres. He now contributes as a member of the Singapore Workplace Safety and Health Council and the Board of Directors of PUB and DSO National Laboratories. Professor Chan’s research interests include marine hydrodynamics, wave-structure interactions, sediment transport and coastal processes.
Mr Peter NobleFellow, Land Medalist and Past-President, Society of Naval Architects & Marine Engineering, USA; Fellow and Vice President, The Institute of Marine Engineering, Science and Technology, UK; Fellow, Canadian Academy of Engineering; Offshore Technology Distinguished Achievement Award for Individuals, B.Sc. Naval Architecture, University of Glasgow.
Mr Noble is a naval architect and ocean engineer with a wide range of expertise and experience in the marine and offshore industries. His career has included positions with shipyards, ship and offshore design
consultants, offshore and marine research and development companies, major classification societies and as chief naval architect with an international oil company. He currently undertakes consulting and advisory assignments across a broad range of topics relating to ocean engineering.
Mr Noble holds a number of patents and is active on the advisory boards of a number of universities and institutions.
Dr Liu Thai-KerB. Architecture (First Class Honours and University Medal) and Doctor of Science honoris causa, University of New South Wales; Master in City planning with Parson's Memorial Medal, Yale University.
Dr Liu is Founder and Head of Morrow Architects & Planners. He is also the Founding Chairman of Centre of Liveable Cities since 2008. Dr Liu has served as the Adjunct Professor of School of Design and Environment and the Lee Kuan Yew School of Public Policy, National University of Singapore. He is also the Adjunct Professor in the College of Humanities, Arts & Social Sciences, Nanyang Technological University. He is a member of several governmental bodies in Singapore and planning advisor to around 30 cities in China.
Dr Liu was Director of RSP Architects Planners & Engineers Pte Ltd, from 1991 to 2017. He was the Architect-Planner and CEO of the Housing & Development Board from 1969 to 1989 and CEO and Chief Planner of Urban Redevelopment Authority from 1989 to 1992. Dr Liu served as the Chairman of the National Arts Council from 1996 to June 2005, and Singapore Tyler Print Institute from 2000 to 2009. He served as the chairperson of the External Review Panel, Arts Quality Framework appointed by the Ministry of Education in 2009 and a founding member of the Board of Trustees, Arts & Culture Development Fund, Ministry of Information, Communications and the Arts in 2010.
Professor Jim Swithenbank BSc, PhD, DSc, DEng, FREng, FInstE, FIChemE, Energy and Environmental Engineering Group.
Professor Swithenbank is a Fellow of the Royal Academy of Engineering, Chairman of the Sheffield University Waste Incineration Research Centre, and a member of numerous international combustion and energy committees. He was the President of the Institute of Energy from 1986 to 1987, and served on many UK government/DTI/EPSRC Committees. He is a prolific researcher with over 400 refereed papers to his credit and the holder of more than 30 patents. Professor Swithenbank’s current work is largely focused on energy and environmental issues of CHP, fossil fuels, biomass, wastes and hydrogen.
26 27
Group Overview
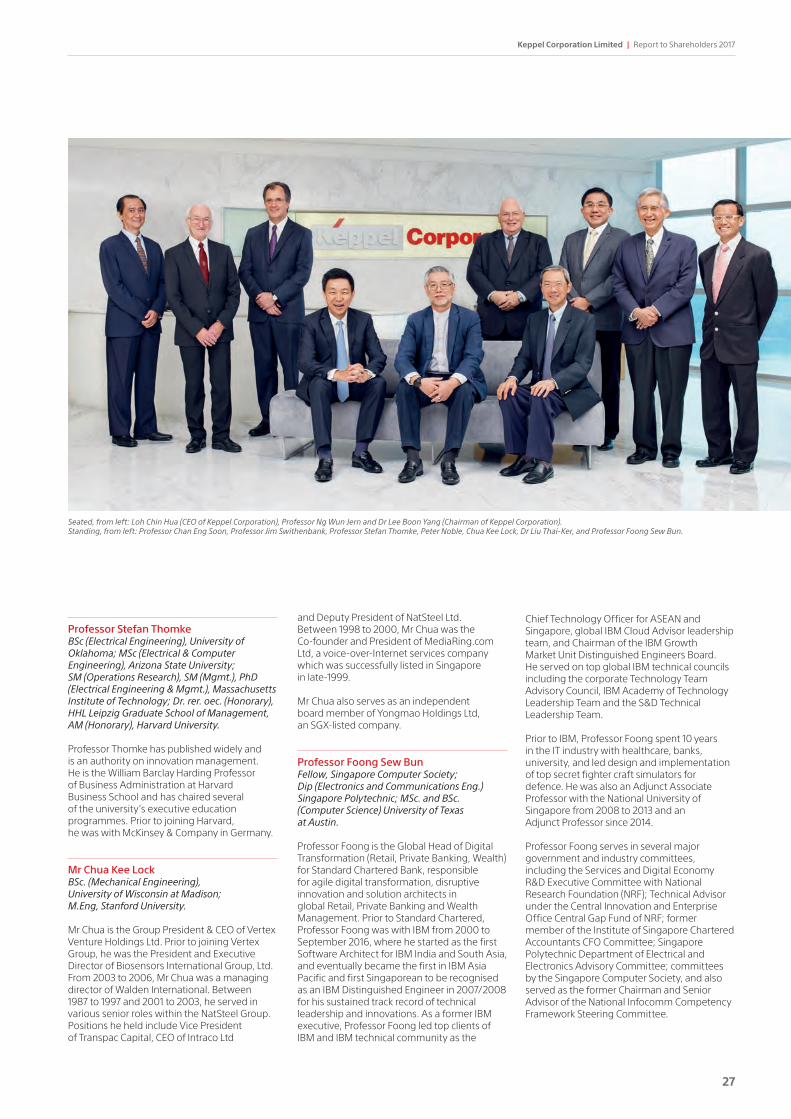
Seated, from left: Loh Chin Hua (CEO of Keppel Corporation), Professor Ng Wun Jern and Dr Lee Boon Yang (Chairman of Keppel Corporation). Standing, from left: Professor Chan Eng Soon, Professor Jim Swithenbank, Professor Stefan Thomke, Peter Noble, Chua Kee Lock, Dr Liu Thai-Ker, and Professor Foong Sew Bun.
Professor Stefan ThomkeBSc (Electrical Engineering), University of Oklahoma; MSc (Electrical & Computer Engineering), Arizona State University; SM (Operations Research), SM (Mgmt.), PhD (Electrical Engineering & Mgmt.), Massachusetts Institute of Technology; Dr. rer. oec. (Honorary), HHL Leipzig Graduate School of Management, AM (Honorary), Harvard University.
Professor Thomke has published widely and is an authority on innovation management. He is the William Barclay Harding Professor of Business Administration at Harvard Business School and has chaired several of the university’s executive education programmes. Prior to joining Harvard, he was with McKinsey & Company in Germany.
Mr Chua Kee Lock BSc. (Mechanical Engineering), University of Wisconsin at Madison; M.Eng, Stanford University.
Mr Chua is the Group President & CEO of Vertex Venture Holdings Ltd. Prior to joining Vertex Group, he was the President and Executive Director of Biosensors International Group, Ltd. From 2003 to 2006, Mr Chua was a managing director of Walden International. Between 1987 to 1997 and 2001 to 2003, he served in various senior roles within the NatSteel Group. Positions he held include Vice President of Transpac Capital, CEO of Intraco Ltd
and Deputy President of NatSteel Ltd. Between 1998 to 2000, Mr Chua was the Co-founder and President of MediaRing.com Ltd, a voice-over-Internet services company which was successfully listed in Singapore in late-1999.
Mr Chua also serves as an independent board member of Yongmao Holdings Ltd, an SGX-listed company.
Professor Foong Sew BunFellow, Singapore Computer Society; Dip (Electronics and Communications Eng.) Singapore Polytechnic; MSc. and BSc. (Computer Science) University of Texas at Austin.
Professor Foong is the Global Head of Digital Transformation (Retail, Private Banking, Wealth) for Standard Chartered Bank, responsible for agile digital transformation, disruptive innovation and solution architects in global Retail, Private Banking and Wealth Management. Prior to Standard Chartered, Professor Foong was with IBM from 2000 to September 2016, where he started as the first Software Architect for IBM India and South Asia, and eventually became the first in IBM Asia Pacific and first Singaporean to be recognised as an IBM Distinguished Engineer in 2007/2008 for his sustained track record of technical leadership and innovations. As a former IBM executive, Professor Foong led top clients of IBM and IBM technical community as the
Chief Technology Officer for ASEAN and Singapore, global IBM Cloud Advisor leadership team, and Chairman of the IBM Growth Market Unit Distinguished Engineers Board. He served on top global IBM technical councils including the corporate Technology Team Advisory Council, IBM Academy of Technology Leadership Team and the S&D Technical Leadership Team.
Prior to IBM, Professor Foong spent 10 years in the IT industry with healthcare, banks, university, and led design and implementation of top secret fighter craft simulators for defence. He was also an Adjunct Associate Professor with the National University of Singapore from 2008 to 2013 and an Adjunct Professor since 2014.
Professor Foong serves in several major government and industry committees, including the Services and Digital Economy R&D Executive Committee with National Research Foundation (NRF); Technical Advisor under the Central Innovation and Enterprise Office Central Gap Fund of NRF; former member of the Institute of Singapore Chartered Accountants CFO Committee; Singapore Polytechnic Department of Electrical and Electronics Advisory Committee; committees by the Singapore Computer Society, and also served as the former Chairman and Senior Advisor of the National Infocomm Competency Framework Steering Committee.
26 27
Keppel Corporation Limited | Report to Shareholders 2017
Senior Management
Keppel Corporation
Loh Chin HuaChief Executive Officer
Chan Hon ChewChief Financial Officer
Corporate Services
Robert ChongDirectorGroup Human Resources
Paul Tan Poh LeeGroup Controller
Louis LimDirectorGroup Strategy & Development(appointment till 1 Apr 2018)Managing DirectorKeppel Technology & Innovation(effective 1 Jan 2018)
Khor Un-HunDirectorGroup Mergers & Acquisition
Cindy Lim DirectorGroup Corporate DevelopmentManaging DirectorKeppel Urban Solutions(effective 1 Jan 2018)
Lynn KohGeneral ManagerGroup Treasury
Caroline ChangGeneral ManagerGroup Legal
Ho Tong Yen General ManagerGroup Corporate Communications
Tok Soo HwaGeneral ManagerGroup Control & Accounts
Sepalika Kulasekera General ManagerGroup Internal Audit
Kevin ChngGeneral ManagerGroup Risk & Compliance
Jacob TongGeneral ManagerGroup Information Systems
Tay Guan ChewGeneral ManagerGroup Tax
Jaggi Ramesh Kumar General ManagerGroup Health, Safety & Environment
Eric Goh Chief Representative, China
Linson Lim Soon KooiCountry Representative, Vietnam
Tay Lim HengChief Executive OfficerSino-Singapore Tianjin Eco-City Investment and Development
Offshore & Marine
Chris Ong Leng YeowChief Executive Officer Keppel Offshore & Marine(effective 1 Jul 2017)Managing Director (Offshore)Keppel Offshore & Marine(effective 5 Jun 2017)
Paul Tan Poh LeeChief Financial OfficerKeppel Offshore & Marine(effective 1 Apr 2017)
Chor How JatManaging Director (Conversions & Repairs)Keppel Offshore & Marine(effective 5 Jun 2017)
Abu Bakar Bin Mohd Nor Managing Director (Gas & Specialised Vessels)Keppel Offshore & Marine(effective 5 Jun 2017)
Property
Loh Chin HuaExecutive ChairmanKeppel Land
Ang Wee GeeChief Executive OfficerKeppel Land(appointment till 31 Dec 2017)
Lim Kei HinChief Financial OfficerKeppel Land
Louis LimChief Operating OfficerKeppel Land(effective 1 Jan 2018) Ng Ooi HooiPresident, SingaporeKeppel Land
Ben Lee Siew KeongPresident, ChinaKeppel Land
Linson Lim Soon KooiPresident, VietnamKeppel Land
Goh York Lin President, IndonesiaKeppel Land Sam Moon Thong President, Regional InvestmentsKeppel Land
28 29
Group Overview

Infrastructure
Dr Ong Tiong GuanChief Executive Officer Keppel Infrastructure
Lim Siew HwaChief Financial OfficerKeppel Infrastructure
Tan Boon LengExecutive Director (Environmental Infrastructure) Keppel Infrastructure
Nicholas Lai Garchun Executive Director (Energy Infrastructure)Keppel Infrastructure
Alan Tay Teck Loon Executive Director (Business Development)Keppel Infrastructure
Thomas Pang Thieng Hwi Chief Executive OfficerKeppel Telecommunications & Transportation
Tan Eng Hwa Chief Financial OfficerKeppel Telecommunications & Transportation
Wong Wai Meng Chief Executive OfficerKeppel Data Centres
Desmond Gay Kah Meng Chief Executive OfficerKeppel Logistics
Investments
Christina Tan Hua MuiChief Executive Officer Keppel CapitalManaging DirectorAlpha Investment Partners (appointment till 31 Jan 2018)
Paul ThamChief Financial OfficerKeppel Capital
Tan Swee YiowChief Executive Officer Keppel REIT Management(effective 20 Mar 2017)
Khor Un-HunChief Executive OfficerKeppel Infrastructure Fund Management
Chua Hsien YangChief Executive OfficerKeppel DC REIT Management
David Eric SnyderChief Executive OfficerKeppel-KBS US REIT Management(effective 3 Nov 2017)
Alvin MahChief Executive Officer Alpha Investment Partners(effective 1 Feb 2018)
Young Lok KuanExecutive Director Keppel Capital(effective 1 Feb 2018)
Unions
Keppel FELS Employees’ Union
Vincent Ho Mun ChoongPresident
Atyyah Binte HassanGeneral Secretary
David Lim Kin WaiExecutive Secretary
Keppel Employees’ Union
Razali Bin Maulod President
Atan EnjahGeneral Secretary
Shipbuilding & Marine Engineering Employees’ Union
Tommy Goh Hock Wah President
Eileen Yeo Chor GekGeneral Secretary NTUC Central Committee Member
Mah Cheong FattExecutive Secretary
Singapore Industrial & Services Employees’ Union
Sazali Bin ZainalPresident(effective 1 Jan 2018)
Philip Lee Soon FattGeneral Secretary
Sylvia Choo Sor Chew Executive Secretary
Union of Power & Gas Employees
Tay Seng ChyePresident
Abdul Samad Bin Abdul Wahab General Secretary
S. ThiagarajanExecutive Secretary
28 29
Keppel Corporation Limited | Report to Shareholders 2017
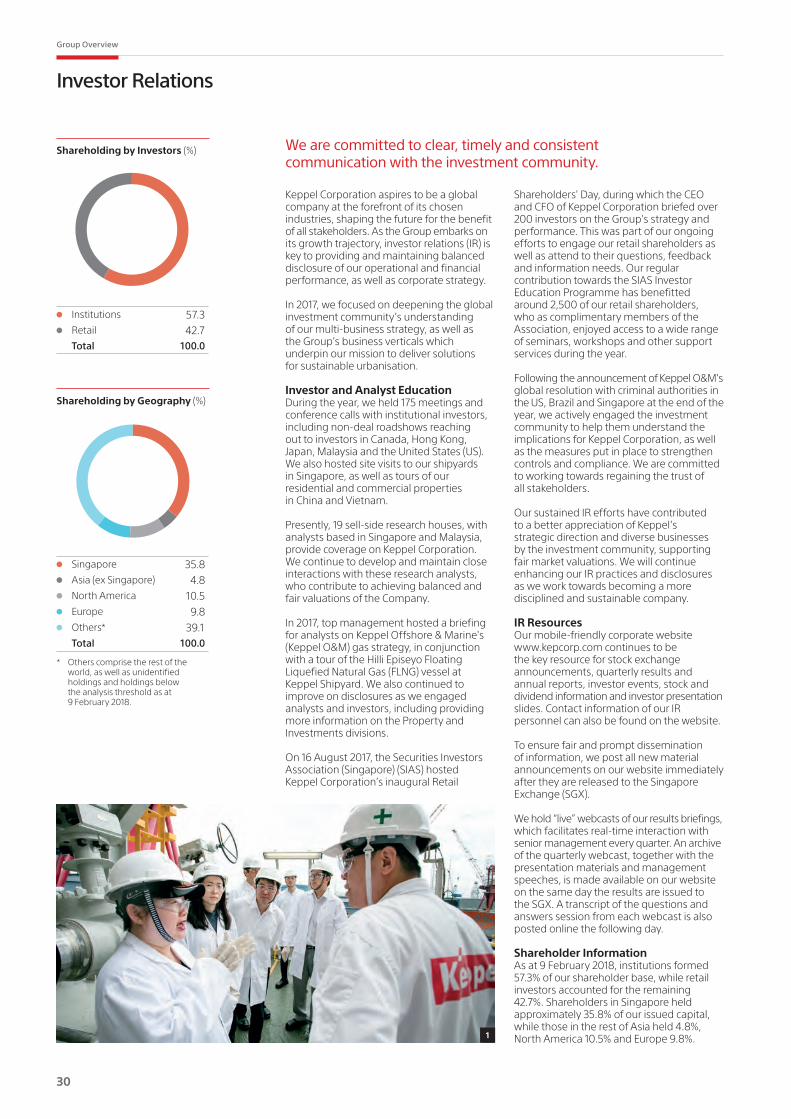
Investor Relations
We are committed to clear, timely and consistent communication with the investment community.
Keppel Corporation aspires to be a global company at the forefront of its chosen industries, shaping the future for the benefit of all stakeholders. As the Group embarks on its growth trajectory, investor relations (IR) is key to providing and maintaining balanced disclosure of our operational and financial performance, as well as corporate strategy.
In 2017, we focused on deepening the global investment community’s understanding of our multi-business strategy, as well as the Group’s business verticals which underpin our mission to deliver solutions for sustainable urbanisation.
Investor and Analyst EducationDuring the year, we held 175 meetings and conference calls with institutional investors, including non-deal roadshows reaching out to investors in Canada, Hong Kong, Japan, Malaysia and the United States (US). We also hosted site visits to our shipyards in Singapore, as well as tours of our residential and commercial properties in China and Vietnam.
Presently, 19 sell-side research houses, with analysts based in Singapore and Malaysia, provide coverage on Keppel Corporation. We continue to develop and maintain close interactions with these research analysts, who contribute to achieving balanced and fair valuations of the Company.
In 2017, top management hosted a briefing for analysts on Keppel Offshore & Marine's (Keppel O&M) gas strategy, in conjunction with a tour of the Hilli Episeyo Floating Liquefied Natural Gas (FLNG) vessel at Keppel Shipyard. We also continued to improve on disclosures as we engaged analysts and investors, including providing more information on the Property and Investments divisions.
On 16 August 2017, the Securities Investors Association (Singapore) (SIAS) hosted Keppel Corporation’s inaugural Retail
Shareholders' Day, during which the CEO and CFO of Keppel Corporation briefed over 200 investors on the Group’s strategy and performance. This was part of our ongoing efforts to engage our retail shareholders as well as attend to their questions, feedback and information needs. Our regular contribution towards the SIAS Investor Education Programme has benefitted around 2,500 of our retail shareholders, who as complimentary members of the Association, enjoyed access to a wide range of seminars, workshops and other support services during the year.
Following the announcement of Keppel O&M's global resolution with criminal authorities in the US, Brazil and Singapore at the end of the year, we actively engaged the investment community to help them understand the implications for Keppel Corporation, as well as the measures put in place to strengthen controls and compliance. We are committed to working towards regaining the trust of all stakeholders.
Our sustained IR efforts have contributed to a better appreciation of Keppel’s strategic direction and diverse businesses by the investment community, supporting fair market valuations. We will continue enhancing our IR practices and disclosures as we work towards becoming a more disciplined and sustainable company.
IR ResourcesOur mobile-friendly corporate website www.kepcorp.com continues to be the key resource for stock exchange announcements, quarterly results and annual reports, investor events, stock and dividend information and investor presentation slides. Contact information of our IR personnel can also be found on the website.
To ensure fair and prompt dissemination of information, we post all new material announcements on our website immediately after they are released to the Singapore Exchange (SGX).
We hold “live” webcasts of our results briefings, which facilitates real-time interaction with senior management every quarter. An archive of the quarterly webcast, together with the presentation materials and management speeches, is made available on our website on the same day the results are issued to the SGX. A transcript of the questions and answers session from each webcast is also posted online the following day.
Shareholder Information As at 9 February 2018, institutions formed 57.3% of our shareholder base, while retail investors accounted for the remaining 42.7%. Shareholders in Singapore held approximately 35.8% of our issued capital, while those in the rest of Asia held 4.8%, North America 10.5% and Europe 9.8%. 1
Shareholding by Geography (%)
Singapore 35.8Asia (ex Singapore) 4.8North America 10.5
Europe 9.8
Others* 39.1
Total 100.0
Shareholding by Investors (%)
Institutions 57.3Retail 42.7Total 100.0
* Others comprise the rest of the world, as well as unidentified holdings and holdings below the analysis threshold as at 9 February 2018.
30 31
Group Overview
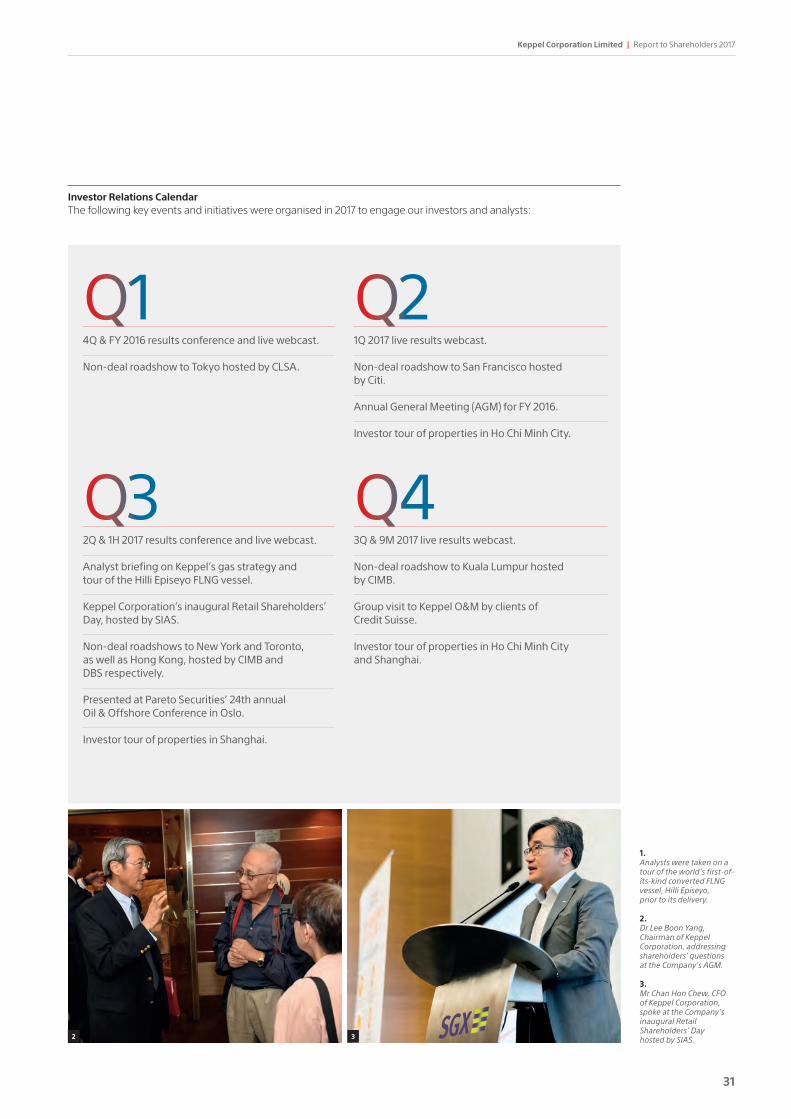
Investor Relations CalendarThe following key events and initiatives were organised in 2017 to engage our investors and analysts:
Q1
Q3
Q2
Q42Q & 1H 2017 results conference and live webcast.
Analyst briefing on Keppel’s gas strategy and tour of the Hilli Episeyo FLNG vessel.
Keppel Corporation’s inaugural Retail Shareholders’ Day, hosted by SIAS.
Non-deal roadshows to New York and Toronto, as well as Hong Kong, hosted by CIMB and DBS respectively.
Presented at Pareto Securities’ 24th annual Oil & Offshore Conference in Oslo.
Investor tour of properties in Shanghai.
1Q 2017 live results webcast.
Non-deal roadshow to San Francisco hosted by Citi.
Annual General Meeting (AGM) for FY 2016.
Investor tour of properties in Ho Chi Minh City.
4Q & FY 2016 results conference and live webcast.
Non-deal roadshow to Tokyo hosted by CLSA.
3Q & 9M 2017 live results webcast.
Non-deal roadshow to Kuala Lumpur hosted by CIMB.
Group visit to Keppel O&M by clients of Credit Suisse.
Investor tour of properties in Ho Chi Minh City and Shanghai.
2 3
1.Analysts were taken on a tour of the world’s first-of-its-kind converted FLNG vessel, Hilli Episeyo, prior to its delivery.
2.Dr Lee Boon Yang, Chairman of Keppel Corporation, addressing shareholders' questions at the Company's AGM.
3.Mr Chan Hon Chew, CFO of Keppel Corporation, spoke at the Company’s inaugural Retail Shareholders’ Day hosted by SIAS.
30 31
Keppel Corporation Limited | Report to Shareholders 2017
Significant Milestones in 2017
Offshore & MarineKeppel Offshore & Marine (Keppel O&M) delivered the Floating Production Storage and Offloading vessel (FPSO) P-66 to Tupi BV and the FPSO John Agyekum Kufuor to a subsidiary of Yinson.
PropertyKeppel Land announced the divestment of its 80% interest in a prime site in Surabaya’s central business district (CBD). Keppel Land also increased its stake in Saigon Centre in Ho Chi Minh City, Vietnam.
Keppel Land signed a Memorandum of Understanding with Vietnam’s State Capital Investment Corporation to collaborate on investment opportunities in Vietnam.
InfrastructureKeppel Infrastructure signed a 25-year Water Purchase Agreement with PUB, Singapore's national water agency, for the Keppel Marina East Desalination Plant.
InvestmentsSino-Singapore Tianjin Eco-City sold three land parcels at record prices for a total of about RMB 5 billion.
Offshore & MarineReorganised operations into the New Builds and Conversions & Repairs divisions.
Keppel FELS completed the novation of contracts for five jackup rigs under construction for Transocean to Borr Drilling for US$1.1 billion, including a down payment of US$275 million.
Keppel O&M secured contracts worth a total of over $300 million, to build two Liquefied Natural Gas (LNG) carrier vessels, two Trailing Suction Hopper Dredgers, and to undertake the conversion/repair/modification of four vessels, as well as provide technology and support services for the construction of a Tension Leg Wellhead Platform.
Keppel O&M delivered Heydar Aliyev, the first modern semisubmersible to be almost completely built in Azerbaijan.
CorporateKeppel Corporation clinched Bronze Award at the 12th Singapore Corporate Awards in the Best Annual Report Category.
At the 18th Securities Investors Association (Singapore) Investors’ Choice Awards, Keppel Corporation won the inaugural Sustainability Award and was named runner-up in the large-cap category for the Singapore Corporate Governance Award.
Keppel Corporation ranked fifth in the general category of the Singapore Governance and Transparency Index 2017, and was listed as an index component of the Dow Jones Sustainability Indices Asia Pacific Index for the fifth consecutive year.
Offshore & MarineKeppel O&M entered into a Heads of Agreement with Pavilion Energy and PLN to explore opportunities in the development of small-scale LNG solutions for West Indonesia.
PropertyKeppel Land acquired an additional stake in the Junction City mixed-use development in Yangon, Myanmar, for about US$49 million.
Keppel Land China and Alpha Investment Partners (Alpha), together with Allianz Real Estate, acquired a mixed-use development, Trinity Tower (formerly known as SOHO Hongkou) in China, for approximately US$525 million.
InfrastructureKeppel Infrastructure signed an agreement with the Singapore Economic Development Board to develop, own and operate a state-of-the-art gasification facility on Jurong Island, Singapore. The final investment decision will be taken at a later date.
InvestmentsKeppel REIT announced the acquisition of a 50% stake in a premium office tower in Melbourne from Australia Postal Corporation.
Keppel Land China, Alpha and Allianz Real Estate partnered to a mixed-use development in Shanghai's Hongkou District.
Over the last 10 years, the Sino-Singapore Tianjin Eco-City has made steady progress in realising its vision of being a model for sustainable urbanisation. Today, more than 80,000 people live and work in the Eco-City.
We harness synergies across our businesses to seize new opportunities and create enduring value.
Jan Jun
Q1 Q3Q2
32 33
Group Overview

Offshore & MarineKeppel O&M secured an FPSO conversion contract from SBM Offshore, as well as projects worth approximately $130 million from repeat customers Petrobras and SOFEC.
Keppel Singmarine delivered the multi-purpose ice-class vessel, MPV Everest, to Maritime Construction Services.
Keppel Shipyard delivered the world’s first converted Floating Liquefaction Vessel, Hilli Episeyo, to Golar LNG.
Keppel O&M reached a global resolution with criminal authorities in the US, Brazil and Singapore, bringing closure to the corruption investigations in Brazil.
PropertyKeppel Land announced the proposed divestment of its stake in mixed-use development Keppel Cove, Zhongshan City, China, as well as a 20.5-hectare site in West Bali’s Tanah Lot district in Indonesia.
Keppel Land announced the acquisition of five prime residential sites in China, Vietnam and Thailand.
Keppel AmFELS secured a contract worth more than US$400 million from Pasha Hawaii for the construction of two dual-fuel LNG containerships, to be built to Keppel’s proprietary design.
FueLNG, a joint venture between Keppel and Shell Eastern Petroleum, achieved the first commercial LNG bunker transfer in Singapore.
Keppel O&M delivered four non-drilling projects namely three FPSOs to MTC Engineering, MODEC and BW Offshore, and a subsea construction vessel to the Shah Deniz consortium.
PropertyKeppel Land and Wing Tai Land jointly won the tender for a prime residential site in Serangoon North Avenue 1.
Keppel Land entered into a conditional sales and purchase agreement with Bank Central Asia to acquire a prime residential site in Jakarta’s CBD.
InfrastructureKeppel Seghers and Zhen Hua Engineering jointly secured a contract to design, build and operate an Integrated Waste Management Facility (IWMF) off the coast of Shek Kwu Chau, Hong Kong.
Keppel Logistics launched UrbanFox, an omnichannel logistics and channel management solutions brand.
InvestmentsThe Alpha DC Fund closed at US$1 billion, double its initial target size, after a commitment from the Canada Pension Plan Investment Board to allocate an initial US$350 million, with an option to invest a further US$150 million.
Keppel-KBS US REIT was listed on the Main Board of the Singapore Exchange, raising gross proceeds of about US$553 million.
Keppel Corporation announced the establishment of a new business unit, Keppel Urban Solutions, which aims to be an end-to-end integrated master developer of smart, sustainable precincts in Asia.
The IWMF, a landmark project to be jointly developed by Keppel Seghers and Zhen Hua Engineering, will play a key role in Hong Kong’s waste management strategy.
The Heads of Agreement signed between Keppel O&M, Pavilion Energy and PLN will pave the way for the development of small-scale LNG infrastructure serving West Indonesia.
Keppel Urban Solutions will collaborate with Keppel Land to develop Saigon Sports City into a bustling hub in Ho Chi Minh City.
Sep Oct Dec
Q4
Keppel Land announced the divestment of its 100% stake in Waterfront Residences, Nantong, China for a net gain of about $79 million.
InfrastructureKeppel Seghers secured two contracts worth over $20 million to provide waste-to-energy technology and services for two projects in Beijing and Hunan, China.
InvestmentsThe Alpha Data Centre Fund (Alpha DC Fund) acquired a 70% stake in Keppel DC Singapore 4.
Keppel DC REIT acquired Keppel DC Dublin 2 (formerly known as B10 Data Centre) in Dublin, Ireland, for approximately $101.3 million.
32 33
Keppel Corporation Limited | Report to Shareholders 2017
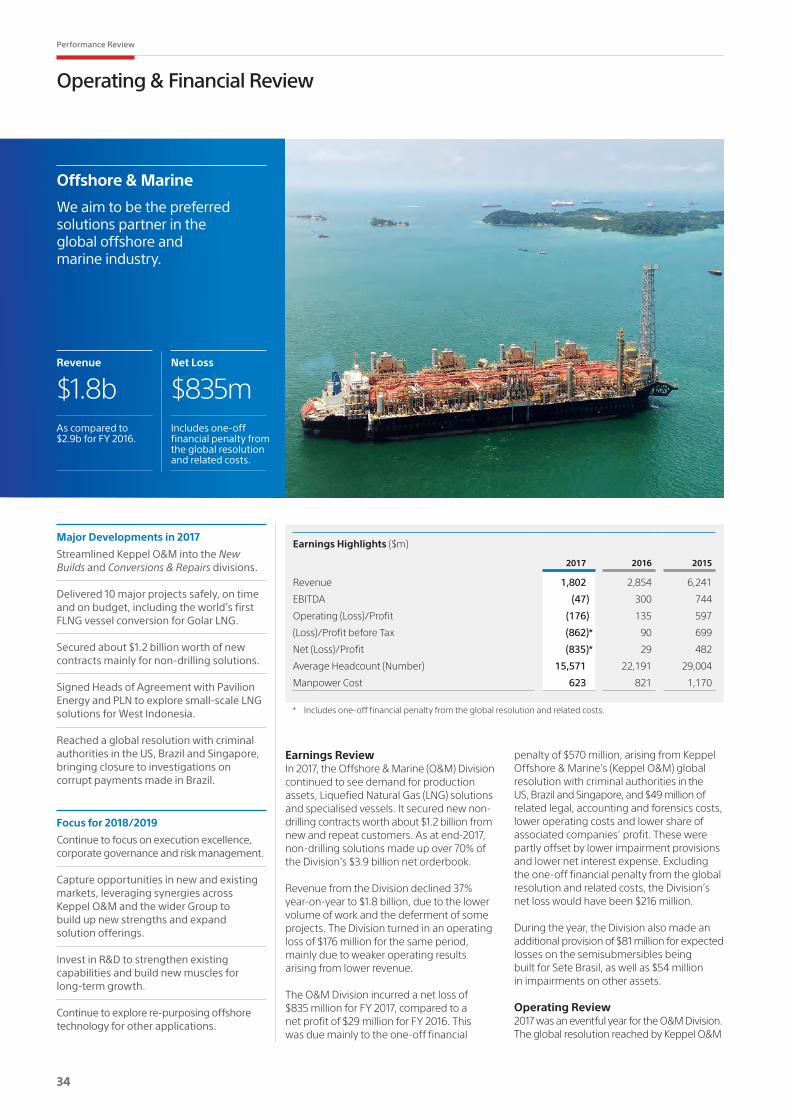
Operating & Financial Review
Offshore & Marine
We aim to be the preferred solutions partner in the global offshore and marine industry.
Earnings ReviewIn 2017, the Offshore & Marine (O&M) Division continued to see demand for production assets, Liquefied Natural Gas (LNG) solutions and specialised vessels. It secured new non-drilling contracts worth about $1.2 billion from new and repeat customers. As at end-2017, non-drilling solutions made up over 70% of the Division’s $3.9 billion net orderbook.
Revenue from the Division declined 37% year-on-year to $1.8 billion, due to the lower volume of work and the deferment of some projects. The Division turned in an operating loss of $176 million for the same period, mainly due to weaker operating results arising from lower revenue.
The O&M Division incurred a net loss of $835 million for FY 2017, compared to a net profit of $29 million for FY 2016. This was due mainly to the one-off financial
penalty of $570 million, arising from Keppel Offshore & Marine’s (Keppel O&M) global resolution with criminal authorities in the US, Brazil and Singapore, and $49 million of related legal, accounting and forensics costs, lower operating costs and lower share of associated companies’ profit. These were partly offset by lower impairment provisions and lower net interest expense. Excluding the one-off financial penalty from the global resolution and related costs, the Division’s net loss would have been $216 million.
During the year, the Division also made an additional provision of $81 million for expected losses on the semisubmersibles being built for Sete Brasil, as well as $54 million in impairments on other assets.
Operating Review2017 was an eventful year for the O&M Division. The global resolution reached by Keppel O&M
Major Developments in 2017
Streamlined Keppel O&M into the New Builds and Conversions & Repairs divisions.
Delivered 10 major projects safely, on time and on budget, including the world’s first FLNG vessel conversion for Golar LNG.
Secured about $1.2 billion worth of new contracts mainly for non-drilling solutions.
Signed Heads of Agreement with Pavilion Energy and PLN to explore small-scale LNG solutions for West Indonesia.
Reached a global resolution with criminal authorities in the US, Brazil and Singapore, bringing closure to investigations on corrupt payments made in Brazil.
Focus for 2018/2019
Continue to focus on execution excellence, corporate governance and risk management.
Capture opportunities in new and existing markets, leveraging synergies across Keppel O&M and the wider Group to build up new strengths and expand solution offerings.
Invest in R&D to strengthen existing capabilities and build new muscles for long-term growth.
Continue to explore re-purposing offshore technology for other applications.
Earnings Highlights ($m)
2017 2016 2015
Revenue 1,802 2,854 6,241
EBITDA (47) 300 744
Operating (Loss)/Profit (176) 135 597
(Loss)/Profit before Tax (862)* 90 699
Net (Loss)/Profit (835)* 29 482
Average Headcount (Number) 15,571 22,191 29,004
Manpower Cost 623 821 1,170
As compared to $2.9b for FY 2016.
$1.8bRevenue
Includes one-off financial penalty from the global resolution and related costs.
$835mNet Loss
* Includes one-off financial penalty from the global resolution and related costs.
34 35
Performance Review

with criminal authorities in the US, Brazil and Singapore brought closure to the investigations on corrupt payments made in Brazil. Keppel O&M will continue its operations in the US, Brazil and Singapore, and does not expect any negative impact on its ability to bid for contracts in these or other countries.
Effective compliance controls have been implemented to ensure that Keppel O&M emerges as a more disciplined and sustainable company.
In response to the challenging business environment, Keppel O&M continued its rightsizing efforts to streamline operations and reduce overheads. During the year, Keppel O&M’s direct global staff strength was reduced by about 25% from 2016, while its subcontract workforce in Singapore came down by about 23% in the same period.
As part of efforts to optimise operations and rationalise its global network of yards, Keppel O&M divested Keppel Verolme and ceased operations of two supporting yards in Singapore. In January 2018, Keppel also announced that Caspian Shipyard Company had commenced its members’ voluntary liquidation, following the expiration of the agreement made between AzerFELS (a subsidiary of Keppel O&M), the State Oil Company of Azerbaijan Republic (SOCAR) and Lukoil Europe Holdings.
Keppel O&M will continue to monitor the environment and take the necessary measures to reduce costs, while retaining its core capabilities, with the goal of making the company leaner, stronger and more competitive for the upturn.
Notwithstanding the challenging environment, Keppel O&M secured new orders worth about $1.2 billion in 2017, more than double the $500 million secured in 2016. These included two LNG dual-fuel containerships from Pasha Hawaii; three dredgers from Jan De Nul; two LNG carriers from Stolt-Nielsen Gas; Floating Production Storage and Offloading (FPSO) jobs from SBM Offshore, BW Offshore and Petrobras, as well as engineering and construction management support services on a Tension Leg Wellhead Platform (TLWP) from PetroVietnam.
In 2017, Keppel O&M delivered 10 major projects safely, on time and on budget. These included an Floating Liquefied Natural Gas (FLNG) vessel conversion for Golar LNG; four FPSOs for Yinson, MODEC, BW Offshore and MTC Ledang; a semisubmersible for SOCAR; an ice-class multi-purpose vessel for New Orient Marine, and a subsea construction vessel (SCV) for the Shah Deniz consortium.
The company continued to make headway in its gas strategy. In September 2017, Keppel O&M signed a Heads of Agreement (HoA) with Pavilion Energy and PLN to explore opportunities to develop small-scale LNG infrastructure for West Indonesia. With a comprehensive suite of solutions for every stage of the gas value chain, Keppel is able to provide cost effective, end-to-end solutions for its customers.
Furthering its gas strategy in 2017, FueLNG, Keppel O&M’s joint venture with Shell, made progress and achieved its first commercial LNG bunker transfer in
Singapore by completing truck-to-ship bunkering for Hilli Episeyo. The FLNG vessel has since been delivered to Golar LNG in 2017 for operations in offshore Kribi, Cameroon and is scheduled to commence commercial operations in 1H 2018.
During the year, Keppel O&M broke into the captive Jones Act market. The Jones Act requires vessels carrying goods between US ports to be built in the US, and Keppel AmFELS is well positioned to capture opportunities in this market. The average age of the US-built fleet of vessels is over 30 years old, exceeding the typical operating life of most ocean-going vessels, and new vessels will be needed to meet the latest safety and environmental standards.
To streamline operations and effectively capture new opportunities, Keppel O&M reorganised its operations into two divisions – the New Builds division, covering Offshore as well as Gas & Specialised Vessels, and the Conversions & Repairs division.
The reorganisation integrated key functions in the New Builds division, allowing Keppel O&M to improve efficiency and better leverage synergies and different capabilities of Keppel FELS and Keppel Singmarine. Keppel Shipyard can similarly draw on the Conversions & Repairs divison's diverse resources to undertake a wider variety of complex projects. With its business divisions working as an integrated body, Keppel O&M is able to achieve greater efficiency and provide customers with even more competitive and reliable end-to-end solutions.
As cities continue to undergo urbanisation, the demand for energy will grow. However, with climate change as the priority for most governments, demand for cleaner sources of energy such as LNG is also expected to rise. As one of the world’s leaders in LNG vessel repair, Keppel O&M has built up critical knowledge for handling materials at extremely low temperatures. This experience, coupled with a strong track record in oil and gas projects, has enabled Keppel to achieve many firsts in the delivery of LNG solutions.
The ability to offer end-to-end solutions has also primed Keppel to meet rising demand for LNG in archipelagic markets unserved by gas pipelines. In 2017, Keppel O&M signed an HoA with Pavilion Energy and PLN to explore the development of small-scale LNG solutions for West Indonesia.
Keppel O&M's value proposition extends beyond a typical engineering, procurement and construction shipyard. With the ability to design, develop and integrate solutions across the gas value chain, Keppel is poised to be the gas industry’s preferred partner and enabler.
By collaborating with Keppel Infrastructure and Keppel Capital, Keppel O&M can also become a co-owner and developer of floating energy infrastructure assets, which generate long-term recurring income.
Gas Industry Partner & Enabler
34 35
Keppel Corporation Limited | Report to Shareholders 2017
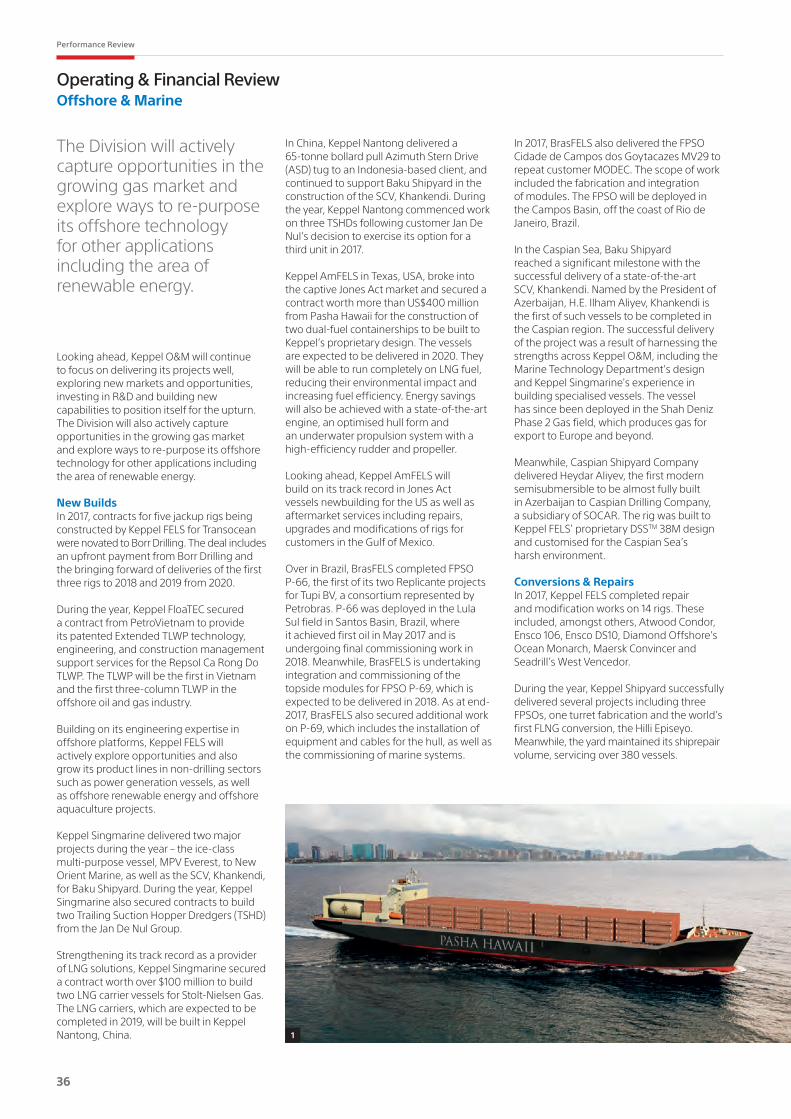
Operating & Financial ReviewOffshore & Marine
1
Looking ahead, Keppel O&M will continue to focus on delivering its projects well, exploring new markets and opportunities, investing in R&D and building new capabilities to position itself for the upturn. The Division will also actively capture opportunities in the growing gas market and explore ways to re-purpose its offshore technology for other applications including the area of renewable energy.
New BuildsIn 2017, contracts for five jackup rigs being constructed by Keppel FELS for Transocean were novated to Borr Drilling. The deal includes an upfront payment from Borr Drilling and the bringing forward of deliveries of the first three rigs to 2018 and 2019 from 2020.
During the year, Keppel FloaTEC secured a contract from PetroVietnam to provide its patented Extended TLWP technology, engineering, and construction management support services for the Repsol Ca Rong Do TLWP. The TLWP will be the first in Vietnam and the first three-column TLWP in the offshore oil and gas industry.
Building on its engineering expertise in offshore platforms, Keppel FELS will actively explore opportunities and also grow its product lines in non-drilling sectors such as power generation vessels, as well as offshore renewable energy and offshore aquaculture projects.
Keppel Singmarine delivered two major projects during the year – the ice-class multi-purpose vessel, MPV Everest, to New Orient Marine, as well as the SCV, Khankendi, for Baku Shipyard. During the year, Keppel Singmarine also secured contracts to build two Trailing Suction Hopper Dredgers (TSHD) from the Jan De Nul Group.
Strengthening its track record as a provider of LNG solutions, Keppel Singmarine secured a contract worth over $100 million to build two LNG carrier vessels for Stolt-Nielsen Gas. The LNG carriers, which are expected to be completed in 2019, will be built in Keppel Nantong, China.
In China, Keppel Nantong delivered a 65-tonne bollard pull Azimuth Stern Drive (ASD) tug to an Indonesia-based client, and continued to support Baku Shipyard in the construction of the SCV, Khankendi. During the year, Keppel Nantong commenced work on three TSHDs following customer Jan De Nul’s decision to exercise its option for a third unit in 2017.
Keppel AmFELS in Texas, USA, broke into the captive Jones Act market and secured a contract worth more than US$400 million from Pasha Hawaii for the construction of two dual-fuel containerships to be built to Keppel’s proprietary design. The vessels are expected to be delivered in 2020. They will be able to run completely on LNG fuel, reducing their environmental impact and increasing fuel efficiency. Energy savings will also be achieved with a state-of-the-art engine, an optimised hull form and an underwater propulsion system with a high-efficiency rudder and propeller.
Looking ahead, Keppel AmFELS will build on its track record in Jones Act vessels newbuilding for the US as well as aftermarket services including repairs, upgrades and modifications of rigs for customers in the Gulf of Mexico.
Over in Brazil, BrasFELS completed FPSO P-66, the first of its two Replicante projects for Tupi BV, a consortium represented by Petrobras. P-66 was deployed in the Lula Sul field in Santos Basin, Brazil, where it achieved first oil in May 2017 and is undergoing final commissioning work in 2018. Meanwhile, BrasFELS is undertaking integration and commissioning of the topside modules for FPSO P-69, which is expected to be delivered in 2018. As at end-2017, BrasFELS also secured additional work on P-69, which includes the installation of equipment and cables for the hull, as well as the commissioning of marine systems.
In 2017, BrasFELS also delivered the FPSO Cidade de Campos dos Goytacazes MV29 to repeat customer MODEC. The scope of work included the fabrication and integration of modules. The FPSO will be deployed in the Campos Basin, off the coast of Rio de Janeiro, Brazil.
In the Caspian Sea, Baku Shipyard reached a significant milestone with the successful delivery of a state-of-the-art SCV, Khankendi. Named by the President of Azerbaijan, H.E. Ilham Aliyev, Khankendi is the first of such vessels to be completed in the Caspian region. The successful delivery of the project was a result of harnessing the strengths across Keppel O&M, including the Marine Technology Department's design and Keppel Singmarine's experience in building specialised vessels. The vessel has since been deployed in the Shah Deniz Phase 2 Gas field, which produces gas for export to Europe and beyond.
Meanwhile, Caspian Shipyard Company delivered Heydar Aliyev, the first modern semisubmersible to be almost fully built in Azerbaijan to Caspian Drilling Company, a subsidiary of SOCAR. The rig was built to Keppel FELS’ proprietary DSSTM 38M design and customised for the Caspian Sea’s harsh environment.
Conversions & Repairs In 2017, Keppel FELS completed repair and modification works on 14 rigs. These included, amongst others, Atwood Condor, Ensco 106, Ensco DS10, Diamond Offshore’s Ocean Monarch, Maersk Convincer and Seadrill’s West Vencedor.
During the year, Keppel Shipyard successfully delivered several projects including three FPSOs, one turret fabrication and the world’s first FLNG conversion, the Hilli Episeyo. Meanwhile, the yard maintained its shiprepair volume, servicing over 380 vessels.
The Division will actively capture opportunities in the growing gas market and explore ways to re-purpose its offshore technology for other applications including the area of renewable energy.
36 37
Performance Review

1.Keppel AmFELS will be building its first two dual-fuel LNG containerships for the Jones Act market.
2.Senior management from Keppel O&M, New Orient Marine and Marine Construction services celebrated the naming of MPV Everest, an ice-class vessel built to Keppel's proprietary design.
2
During the year, Keppel Shipyard secured several contracts from both new and repeat customers, including a turret fabrication project from SOFEC, a crane vessel conversion from Boskalis, the Liza FPSO conversion contract from SBM Offshore and various FPSO conversion and upgrading projects.
In the Philippines, Keppel Batangas completed shiprepair works for over 85 vessels and delivered a 50-tonne bollard pull ASD tug to an Indonesia-based client. Meanwhile, Keppel Subic Shipyard completed 67 shiprepair jobs in 2017, including the drydocking and repair of two LNG carriers from Greece.
Keppel Subic Shipyard will continue to support Keppel Shipyard on FPSO and marine conversion projects, and explore collaboration opportunities with other companies within the Keppel Group for fabrication work in the renewable energy sector.
Over in the Americas, BrasFELS completed several repair jobs such as Olinda Star, Ocean Rig Mykonos and Siem Helix I.
In the Middle East, Nakilat-KOM (N-KOM) continues to be well positioned to serve
The cut in E&P expenditures by oil companies and fleet operators has led to a drive towards greater efficiency and productivity in the industry. From increased automation to the digitalisation of vessels, technology will be a key driver for the industry moving forward.
To remain competitive in a changing market environment, Keppel O&M has repositioned itself and improved on existing core products and services. Leveraging technology, the Division has developed innovative solutions to stay ahead of the curve.
Notwithstanding the current challenges in the drilling segment, there continues to be robust demand for production assets, LNG solutions and specialised vessels.
Keppel O&M remains confident about the long-term potential of the O&M industry as demand for energy remains strong, driven by global economic growth.
Offshore RigsThe offshore rig market is expected to remain saturated, due to insufficient rig retirements and a significant overhang in jackup rig supply. It will take some time before an equilibrium between supply and demand is reached. 2018 will continue to see industry consolidation and the potential emergence of new drilling operators.
As the cost of offshore projects normalises and oil companies focus on sanctioning new projects, market confidence will return to the industry. There is increased interest for mid-water harsh environment rigs in the North Sea, while emerging markets such as Brazil, Mexico and Africa are also garnering more interest from major oil companies focused on managing their declining reserves.
In readying itself for the upturn, Keppel O&M is exploring how novel technologies can define the future of jackup rigs by introducing new systems and expanding rig capabilities. These rigs of tomorrow will transform the current operating environment to become more efficient, ergonomic and versatile, without compromising on safety.
In collaboration with the Group, Keppel O&M will continue to explore opportunities to re-purpose its offshore technology for other applications such as floating data centres.
With an extensive suite of proprietary solutions for the offshore drilling market and global yard network, Keppel O&M is well positioned to ride the upturn when it returns.
customers in the Arabian Gulf. As one of the most well-equipped yards in the region, N-KOM remains focused on the execution of repair and maintenance of Nakilat's and other customers’ vessels, and is also actively pursuing opportunities in the region.
Market Review & OutlookIn early-December 2017, the Organization of Petroleum Exporting Countries (OPEC) and non-OPEC countries reached an agreement to extend production cuts to end-2018. Since the first production cuts agreed by the two groups in December 2016, oil prices have recovered from a low of about US$30 per barrel in early-2016 to over US$60 per barrel as at end-2017.
Following the recovery in oil prices, there has been growing optimism in the O&M industry. Final Investment Decisions (FIDs) for new offshore projects doubled in 2017 and are expected to gather momentum in the years ahead. However, the rig market continues to be plagued by a supply overhang, and both utilisation and day rates remain low. As such, a quick recovery is not expected in the demand for offshore drilling rigs as oil companies take time to restart exploration & production (E&P) programmes.
36 37
Keppel Corporation Limited | Report to Shareholders 2017

Operating & Financial ReviewOffshore & Marine
1.Keppel Singmarine is building the world’s first EU Stage V dredger in compliance with stricter international limits on emissions.
ShiprepairIndustry players foresee significant changes in the shiprepair industry over the next two years. This comes in tandem with the Ballast Water Management Convention in 2019 and the International Maritime Organization’s (IMO) global sulphur cap in 2020. Under the new regulations, IMO 2020 requires ships to use marine fuels with a sulphur content of no more than 0.5%, compared to the current limit of 3.5%. Consequently, ship owners will have to decide between the continued use of high sulphur fuel oil, in conjunction with scrubbers or exhaust gas cleaning systems, or switch to low sulphur fuel options including distillates and LNG.
Over the longer term, the shipping industry will also continue its drive toward greater efficiency by reducing costs, improving utilisation and deploying new technologies.
Against this backdrop, Keppel O&M is well placed to provide retrofitting solutions to meet the changing needs of the shiprepair industry.
Floating Production SystemsIn 2017, 28 Floating Production Systems (FPS) contracts estimated to be worth over US$15 billion were awarded, including the high profile contract for ENI’s Coral South FLNG. The LNG space had also attracted a record number of contracts for Floating Storage & Regasification Units (FSRU) in 2017. Meanwhile, after almost two years with no orders, the award of 10 FPSO contracts in 2017 has signalled a brighter 2018.
fuelled by rapid urbanisation within the region, as well as the increased use of gas for transportation purposes and power generation, and as raw materials for petrochemical feedstock.
Meanwhile, many countries are pushing for the use of cleaner fossil fuels such as LNG, driving up demand for regasification assets.
In anticipation of an increase in demand for LNG-related products including FLNGs, FSRUs and LNG Carriers, Keppel O&M has designed a suite of proprietary solutions to cater to the market. With the ability to provide end-to-end solutions across the gas value chain, Keppel O&M is well positioned to capture opportunities in the gas industry.
Specialised ShipbuildingProspects in the specialised shipbuilding market remain robust, particularly for non-oil related solutions such as dredgers and containerships, as well as vessels for subsea construction, cable lay and rock dumping. This bodes well for Keppel O&M, which can offer an extensive range of solutions, leveraging its technology and construction expertise. Keppel O&M is also primed to capture opportunities in the Jones Act market after securing its first contract with Pasha Hawaii through Keppel AmFELS in Brownsville, Texas. Looking ahead, Keppel O&M will continue efforts to grow its capabilities for non-drilling and gas solutions. These capabilities will provide the company with new opportunities and sources of revenue, despite continuing challenges in the offshore drilling sector.
Industry players are optimistic about the FPS market. The Energy Maritime Associates estimates that about 125 FPS projects, valued at over US$90 billion, are expected to be sanctioned over the next five years. Of these, FPSOs are expected to dominate, constituting over 40% of new orders.
With more contracts for production assets expected to be awarded, Keppel O&M is in pole position to benefit. Backed by a strong track record in executing offshore conversion projects, Keppel O&M will continue to monitor the pipeline of projects available in the market and proactively engage customers early to provide cost-effective solutions.
Gas SolutionsThe increase in demand for gas is expected to persist, with natural gas being the fuel of the future. In 2018, the number of LNG projects to be sanctioned is expected to increase, mainly due to an improving energy market and the need to invest to meet long-term demand.
In 2017, Keppel Shipyard delivered the world’s first FLNG vessel conversion, Hilli Episeyo, to Golar LNG. The successful deployment of the vessel in offshore Kribi, Cameroon, will put Keppel O&M ahead of the curve as a leading solutions provider for floating liquefaction solutions.
There are increasing numbers of LNG carriers and oil tankers that travel the trade routes between Australia and the Far East, as well as between America and India and the Far East. Moreover, there is increasing demand for LNG within Southeast Asia,
1
38 39
Performance Review

Major Developments in 2017
Sold about 5,480 homes in Asia, mostly in China and Vietnam.
More than $1 billion worth of divestments announced, including assets in China and Indonesia.
Announced nine acquisitions worth about $1.6 billion across Singapore, China, Vietnam, Indonesia and Thailand.
Focus for 2018/2019
Invest strategically and opportunistically in core and growth markets, as well as in new and existing platforms, projects and properties.
Capitalise on the recovery of the residential market in Singapore and tap demand in overseas markets with about 16,800 launch-ready homes from 2018 to 2020.
Actively scale up commercial presence and harness the strengths of its retail management arm to bolster its commercial portfolio.
Grow co-working space value proposition under the KLOUD brand.
Recycle capital strategically, reinvesting for growth and higher returns.
Property
We are committed to providing quality and innovative urban living solutions in Asia.
As compared to $2b for FY 2016.
$1.8b
Revenue
As compared to $620m for FY 2016.
$685m
Net Profit
Earnings Highlights ($m)
2017 2016 2015
Revenue 1,782 2,035 1,823
EBITDA 693 533 614
Operating Profit 656 505 581
Profit before Tax 868 759 848
Net Profit 685 620 661
Average Headcount (Number) 3,257 3,733 4,230
Manpower Cost 194 199 216
12% 10%
Earnings ReviewThe Property Division’s revenue of $1.8 billion for FY 2017 was $253 million or 12% lower than FY 2016, due mainly to lower revenue from China and Singapore, partly offset by higher revenue from Vietnam.
The Division’s FY 2017 net profit of $685 million was $65 million or 10% higher than FY 2016. This was mainly due to divestment gains of $212 million, as well as higher fair value gains on investment properties.
In FY 2017, the Division contributed 82% of the Group’s net profit, excluding Keppel Offshore & Marine's one-off financial penalty from the global resolution and related costs.
Operating ReviewSingapore Market sentiments in the Singapore residential market have been improving,
on the back of successful launches, a surge in collective sales and an improved economic outlook. In 2017, Keppel Land sold about 380 residential units in Singapore, similar to the sales volume for 2016. About 70% of the sales came from The Glades and Highline Residences.
In line with strong demand for Keppel Land’s projects in Singapore, The Glades was fully sold out in August 2017, ahead of its Additional Buyers Stamp Duty deadline. Meanwhile, Highline Residences was almost fully sold as at end-January 2018. Both Reflections and Corals at Keppel Bay saw healthy demand, and were 88% and 73% sold respectively as at end-December 2017.
OverseasDespite continued property cooling measures in Tier-1 and Tier-2 cities, Keppel Land achieved steady sales in China for 2017. With rising affluence and increasing urbanisation driving demand, Keppel Land
38 39
Keppel Corporation Limited | Report to Shareholders 2017

Operating & Financial ReviewProperty
1
sold 3,725 homes in China, slightly lower than the 3,800 homes sold in 2016. Take up in China came mostly from Tianjin Eco-City, V City and Park Avenue Heights in Chengdu, as well as Waterfront Residences in Wuxi. During the year, Keppel Land also started selling strata-titled units in the newly-renovated K-Plaza, located in Shanghai, China.
Over in Vietnam, Keppel Land saw strong demand for its residential properties in 2017. During the year, Keppel Land launched Tilia Residences in Phase 2 of Empire City, which registered strong sales of 454 units out of a total of 472. Correspondingly, Keppel Land sold a total of about 1,110 units in Vietnam in 2017, some 27% lower than
the 1,520 units sold in the previous year, due to the timing of project launches.
Keppel Land also ramped up its commercial presence in Vietnam and Myanmar with the completion of two mixed-use developments. At Saigon Centre Phase 2 in Ho Chi Minh City, Vietnam, about 80% of the office space has been leased out to multinational corporations including AIA, Lazada, Chanel, Country Garden and Royal Thai. Meanwhile, Junction City Tower in Yangon, Myanmar, secured established tenants including Allen & Gledhill, WongPartnership, Samsung and the British Chamber of Commerce.
Urbanisation will continue to drive growth in Vietnam and Myanmar. As an early entrant into these fast-growing markets, Keppel Land is well positioned to value add to businesses and consumers as a provider of high-quality homes and offices.
Capital Recycling for Higher ReturnsIn 2017, Keppel Land announced five divestments worth about $1 billion, including the sale of stakes in waterfront projects in Zhongshan and Nantong, both in China, as well as long-held development sites in Surabaya and Bali, in Indonesia.
In tandem, nine acquisitions worth about $1.6 billion were announced, including residential sites in Singapore, China, Vietnam, Indonesia and Thailand, as well as an office and retail mixed-use development in Shanghai, China.
To generate the best risk-adjusted returns,Keppel Land will continue to explore opportunities to unlock capital, and reinvest by acquiring new sites as well as completed commercial projects.
Reinvesting for GrowthDuring the year, Keppel Land continued to strengthen its presence in its core markets of Singapore and China, as well as its growth markets of Vietnam and Indonesia. It also expanded into Thailand through new acquisitions. In total, Keppel Land replenished its pipeline with over 5,710 homes in 2017.
In Singapore, Keppel Land and Wing Tai jointly acquired a prime residential site in Serangoon North, which will yield over 600 homes in an attractive and mature residential estate. Overseas, Keppel Land continued to expand its footprint across all key cities, securing a large-scale site in Wuxi, China; two residential sites in Saigon South and District 9, Ho Chi Minh City, Vietnam; a residential site in the Central Business District (CBD) in Jakarta, Indonesia, and two freehold sites along Sukhumvit Road in Bangkok, Thailand.
Total Residential Landbank
63,000 unitsTotal Commercial Portfolio
1.5 million smWe are transforming Keppel Land into a multi-dimensional property player with one of the highest returns on equity in Asia.
1.Keppel Land saw strong demand for Tilia Residences in Ho Chi Minh City, Vietnam, selling 96% of units launched in 2017.
2.KLOUD combines the benefits of serviced offices and co-working spaces.
40 41
Performance Review

2
Market Review & OutlookSingaporeA pick up in residential and commercial real estate sentiments accompanied Singapore’s 3.6% economic growth in 2017. In Singapore, new home sales reached 10,600 units, 33% higher than the year before. Prices also rose in 3Q 2017, with private residential prices reversing 15 quarters of decline. For the whole of 2017, prices rose 1.1% compared to a 3.1% drop in 2016. Over in the commercial space, CB Richard Ellis (CBRE) reported that Grade A office rents in the CBD rose 3.3% year-on-year and are expected to continue rising in tandem with Singapore's economic growth and the absorption of existing stock.
En bloc sales have also lifted the property market, fuelling demand for replacement units while providing developers with the opportunity to replenish their landbanks. Capitalising on positive market sentiments, Keppel Land is launching its joint venture condominium project, The Garden Residences, in Serangoon North in 2018. Keppel Land is also studying the redevelopment of Keppel Towers and Nassim Woods to add another 500 homes in prime locations, which will boost its Singapore landbank to 1,700 homes.
OverseasRapid urbanisation and a burgeoning middle-class population will continue to drive demand for quality homes and prime commercial space in Asia. Riding on these trends, Keppel Land will continue to tap demand with more than 15,800 overseas launch-ready homes over the next three years.
China’s Gross Domestic Product (GDP) grew 6.9% in 2017, up from the previous year’s 6.7%. Strong domestic consumption, a robust service sector and government infrastructure spending continued to underpin the economy. However, GDP growth is expected to be slower in 2018 alongside further property tightening measures targeted at dampening speculation and curbing run-away prices. Nonetheless, China’s property market will continue to be supported by rising affluence and demand from the growing urban population.
In Vietnam, GDP grew at an estimated 6.8% in 2017, with similar growth targeted for 2018. Demand outstripped supply in the residential market, which saw about 32,900 homes sold compared with 31,100 units launched in Ho Chi Minh City. Average selling prices also increased by about 4% year-on-year and the healthy demand for
homes is expected to continue. With its sizeable landbank of 20,000 units, which can be launched in quick succession over the next few years, Keppel Land is poised to meet the robust demand for homes in the city. Office take-up in Ho Chi Minh City was healthy, lifting Grade A rents by 4.8% even as two new Grade A buildings totalling 61,200 square metres (sm) entered the market. The retail market also saw healthy growth and tight supply, with the CBD experiencing full occupancy in existing malls.
In Indonesia, the economy is expected to grow above 5% per annum through to 2020. While there is an oversupply of condominiums, the landed residential market in Jakarta and Greater Jakarta is expected to remain resilient. Tangerang, where Keppel Land’s The Riviera at Puri project is located, will continue to be a sought-after residential area due to its good connectivity and amenities.
With a pipeline of about 63,000 residential units and a total commercial footprint of 1.5 million sm of gross floor area, Keppel Land is well positioned to capitalise on demand for homes, office and retail space in its target markets.
With rising real estate costs and smart technology transforming the way we work, co-working spaces have become increasingly popular globally. Co-working provides an innovative alternative to traditional office spaces, riding on the shared economy.
To meet the growing demand in this niche market, Keppel Land launched KLOUD, a new generation serviced co-office catering to companies looking for flexible spaces.
Keppel Land’s flagship co-office KLOUD Keppel Bay Tower boasts 18,000 square feet (sf) of smart office space. Since its opening, the co-working space has attracted start-ups, small and medium-sized enterprises, and multinational companies from a diverse mix of industries.
KLOUD features an office-apartment concept, offering a cosy shared-working environment.Through an integrated smart office mobile application, users can access KLOUD facilities around the clock and enjoy other lifestyle offerings by Keppel Land, including the rental of serviced residences.
To date, KLOUD has also been introduced to Vietnam and Myanmar, bringing Keppel Land's total serviced co-office footprint to about 60,000 sf.
Looking ahead, Keppel Land plans to operate a KLOUD centre in each of the markets where it operates.
KLOUD, a New Generation Serviced Co-Office
40 41
Keppel Corporation Limited | Report to Shareholders 2017

Operating & Financial Review
Infrastructure
We will focus on growing the Infrastructure Division’s contributions to the Group.
Earnings ReviewWe are a developer and operator of quality infrastructure assets with a focus on growing stable income from the management, operation and maintenance of our projects and the provision of connectivity solutions. The Infrastructure Division comprises the Group’s businesses in energy, environment and infrastructure services, as well as logistics and data centres.
The Infrastructure Division’s revenue of $2.2 billion was $463 million or 27% higher than 2016, mainly driven by stronger performance by the energy and environmental infrastructure segments. Through providing operations and maintenance (O&M) services for power, waste-to-energy (WTE), district heating and cooling, as well as water and wastewater assets, our growing Infrastructure Services business contributed recurring revenue of about $160 million for FY 2017.
The Division’s FY 2017 net profit of $132 million was $33 million or 33% higher than 2016, mainly due to higher profit from power and gas businesses and progressive profit recognition from the construction of the Keppel Marina East Desalination Plant (KMEDP), the gain on divestment of GE Keppel Energy Services and fair value gain on investment. In FY 2017, the Division contributed 16% of the Group’s net profit, excluding the one-off financial penalty from Keppel Offshore & Marine’s global resolution and related costs.
Energy Infrastructure Operating Review Despite challenging market conditions in 2017, Keppel Infrastructure’s integrated gas, power, and utilities business maintained a strong competitive advantage riding on synergy and overall portfolio optimisation. Keppel Infrastructure signed an agreement with the Singapore Economic Development Board (EDB) to develop, own and operate
Major Developments in 2017
Signed an agreement with EDB to develop, own and operate a gasification facility in Singapore, an important step towards FID.
Secured a contract together with Zhen Hua Engineering to design, build and operate Hong Kong's first IWMF.
Commenced construction of KMEDP and received final takeover certificate for DNSTW.
Secured two WTE technology and services contracts in China.
Injected KDC SGP 4 into the Alpha DC Fund.
Launched UrbanFox to offer end-to-end omnichannel logistics solutions.
Focus for 2018/2019
Continue seeking out value-enhancing projects, leveraging the Division’s project development, engineering, operations and maintenance expertise.
Harness the strength of an integrated gas, power and district cooling platform to pursue opportunities for growth.
Extend and develop new business-to-consumer retail and marketing capabilities in power, e-commerce and urban logistics.
Continue building up a portfolio of quality data centre assets and providing higher value services to customers.
Earnings Highlights ($m)
2017 2016 2015
Revenue 2,207 1,744 2,037
EBITDA 166 136 246
Operating Profit 122 94 208
Profit before Tax 167 123 243
Net Profit 132 99 197
Average Headcount (Number) 2,618 2,669 2,739
Manpower Cost 180 173 182
As compared to $1.7b for FY 2016.
$2.2b
Revenue
As compared to $99m for FY 2016.
$132m
Net Profit
27% 33%
42 43
Performance Review
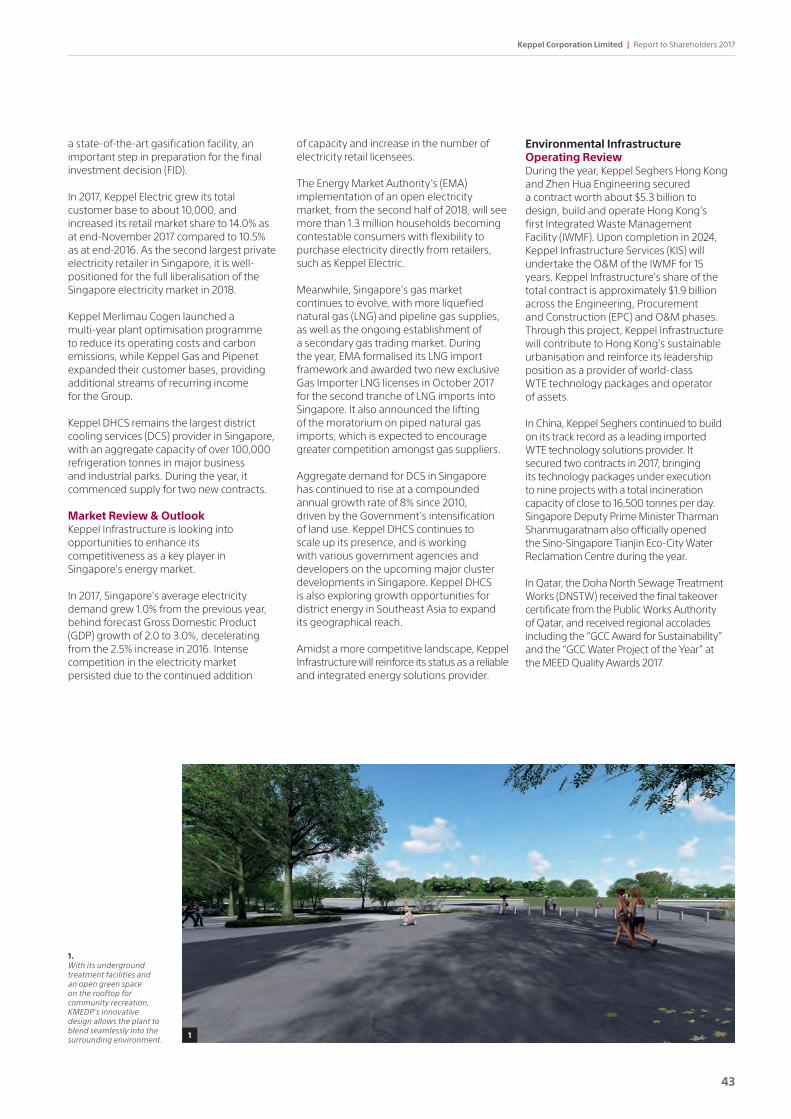
a state-of-the-art gasification facility, an important step in preparation for the final investment decision (FID).
In 2017, Keppel Electric grew its total customer base to about 10,000, and increased its retail market share to 14.0% as at end-November 2017 compared to 10.5% as at end-2016. As the second largest private electricity retailer in Singapore, it is well-positioned for the full liberalisation of the Singapore electricity market in 2018.
Keppel Merlimau Cogen launched a multi-year plant optimisation programme to reduce its operating costs and carbon emissions, while Keppel Gas and Pipenet expanded their customer bases, providing additional streams of recurring income for the Group.
Keppel DHCS remains the largest district cooling services (DCS) provider in Singapore, with an aggregate capacity of over 100,000 refrigeration tonnes in major business and industrial parks. During the year, it commenced supply for two new contracts. Market Review & OutlookKeppel Infrastructure is looking into opportunities to enhance its competitiveness as a key player in Singapore's energy market.
In 2017, Singapore’s average electricity demand grew 1.0% from the previous year, behind forecast Gross Domestic Product (GDP) growth of 2.0 to 3.0%, decelerating from the 2.5% increase in 2016. Intense competition in the electricity market persisted due to the continued addition
of capacity and increase in the number of electricity retail licensees.
The Energy Market Authority’s (EMA) implementation of an open electricity market, from the second half of 2018, will see more than 1.3 million households becoming contestable consumers with flexibility to purchase electricity directly from retailers, such as Keppel Electric.
Meanwhile, Singapore’s gas market continues to evolve, with more liquefied natural gas (LNG) and pipeline gas supplies, as well as the ongoing establishment of a secondary gas trading market. During the year, EMA formalised its LNG import framework and awarded two new exclusive Gas Importer LNG licenses in October 2017 for the second tranche of LNG imports into Singapore. It also announced the lifting of the moratorium on piped natural gas imports, which is expected to encourage greater competition amongst gas suppliers.
Aggregate demand for DCS in Singapore has continued to rise at a compounded annual growth rate of 8% since 2010, driven by the Government’s intensification of land use. Keppel DHCS continues to scale up its presence, and is working with various government agencies and developers on the upcoming major cluster developments in Singapore. Keppel DHCS is also exploring growth opportunities for district energy in Southeast Asia to expand its geographical reach.
Amidst a more competitive landscape, Keppel Infrastructure will reinforce its status as a reliable and integrated energy solutions provider.
Environmental Infrastructure Operating ReviewDuring the year, Keppel Seghers Hong Kong and Zhen Hua Engineering secured a contract worth about $5.3 billion to design, build and operate Hong Kong’s first Integrated Waste Management Facility (IWMF). Upon completion in 2024, Keppel Infrastructure Services (KIS) will undertake the O&M of the IWMF for 15 years. Keppel Infrastructure's share of the total contract is approximately $1.9 billion across the Engineering, Procurement and Construction (EPC) and O&M phases. Through this project, Keppel Infrastructure will contribute to Hong Kong's sustainable urbanisation and reinforce its leadership position as a provider of world-class WTE technology packages and operator of assets.
In China, Keppel Seghers continued to build on its track record as a leading imported WTE technology solutions provider. It secured two contracts in 2017, bringing its technology packages under execution to nine projects with a total incineration capacity of close to 16,500 tonnes per day. Singapore Deputy Prime Minister Tharman Shanmugaratnam also officially opened the Sino-Singapore Tianjin Eco-City Water Reclamation Centre during the year.
In Qatar, the Doha North Sewage Treatment Works (DNSTW) received the final takeover certificate from the Public Works Authority of Qatar, and received regional accolades including the “GCC Award for Sustainability” and the “GCC Water Project of the Year” at the MEED Quality Awards 2017.
1
1.With its underground treatment facilities and an open green space on the rooftop for community recreation, KMEDP's innovative design allows the plant to blend seamlessly into the surrounding environment.
42 43
Keppel Corporation Limited | Report to Shareholders 2017

In Singapore, Keppel Seghers completed the upgrading of the Keppel Seghers Ulu Pandan NEWater Plant, increasing its capacity and making it the first large-scale plant to adopt a third-stage reverse osmosis configuration. Meanwhile, the construction of KMEDP, a dual-mode desalination plant, commenced in June 2017, supported by design and technical inputs from KIS. When completed in 2020, it will add 30 million gallons of water per day to Singapore’s water supply. Market Review & OutlookRising public awareness of environmental issues and focus on environmental protection have led to policy adjustments favouring investments into modern infrastructure and systems. Against this backdrop, Keppel Infrastructure will continue to seek out value-enhancing projects, strengthen its market position, and leverage its project development, engineering as well as O&M expertise across a wide range of infrastructure solutions.
In China, the government has set strict targets for both pollutant emission reduction and environment quality improvement in its 13th Five Year Plan. This includes the goal to treat about one-third of municipal solid waste using proven incineration technology by 2030. The focus on green developments and innovation presents opportunities for Keppel Seghers to capture new projects, as well as to expand in China beyond the provision of WTE technology packages.
Keppel Infrastructure is also pursuing opportunities in India, where favourable feed-in tariffs for green power generated
upgrade. Together with the Keppel Seghers Tuas WTE plant, Keppel Infrastructure supports Singapore’s waste incineration needs. Contributions from the Keppel Seghers Ulu Pandan NEWater Plant and Keppel Merlimau Cogen remained creditable despite challenging market conditions faced by the latter.
In Qatar, operational availability at the Domestic Solid Waste Management Centre exceeded 90%, while production of treated water at the DNSTW increased 61% year on year.
Market Review & OutlookUrbanisation blueprints unveiled by governments worldwide call for more efficient and sustainable energy and environmental management solutions. This provides exciting opportunities for KIS, which has built up a comprehensive range of operating expertise in power, WTE, district heating and cooling, as well as water and wastewater facilities.
Underpinning Keppel Infrastructure’s ability to deliver the full value chain of infrastructure services, KIS aims to strengthen its position as the preferred long-term O&M partner. KIS will continue to deliver high quality and value-added O&M services, supporting Keppel’s vision to build an environmentally sustainable future for populations around the world.
Data CentresOperating Review2017 saw the completion of Keppel DC Singapore 4 (KDC SGP 4) and its injection into the Alpha Data Centre Fund (Alpha DC Fund). KDC SGP 4 is Keppel Data Centres Holding's (KDCH) fourth data centre development in Singapore. Amid strong interest from institutional investors for quality assets,
from solid waste have led to strong interests in WTE projects, particularly in the more developed regions.
Closer to home, economies experiencing rapid growth and urbanisation, such as Vietnam and Thailand, present strong markets for environmental infrastructure. Leveraging a combination of technology and execution track record, Keppel Seghers and KIS are well-placed to provide holistic solutions for the effective treatment of water and waste.
Over in Europe, interest in WTE solutions has picked up alongside its economic recovery, as countries such as Poland, Spain, Ireland and Portugal continue their efforts to fulfil the European Union’s (EU) waste legislation on landfill diversion. Meanwhile, stable demand growth and the replacement and upgrading of ageing facilities in the EU will provide more prospects in the WTE sector. Keppel Seghers will continue to improve its WTE technology offerings and seek value-enhancing projects to strengthen its market position.
Infrastructure Services Operating ReviewWith its expertise in delivering sustainable O&M services to its clients, KIS will continue to maintain high operating standards by maximising availability, reliability, and efficiency for its existing assets spanning the power, WTE, water and district cooling sectors.
Under KIS, Keppel Infrastructure’s operating assets have been significant contributors toward sustainable urbanisation. In Singapore, contributions from the Senoko WTE plant increased in 2017 following a capacity
1
1.Underpinning Keppel Infrastructure’s ability to deliver the full value chain of infrastructure services, KIS aims to strengthen its position as the preferred long-term O&M partner.
2.Nautilus' patented water-cooling technology is employed in its pre-fabricated facilities, which are more cost-efficient and environmentally sustainable than traditional structures and have a lower lead-time to production.
Operating & Financial ReviewInfrastructure
44 45
Performance Review

Floating Data Centres
2
During the year, Keppel Data Centres formed several strategic partnerships to advance its position as a leading-edge solutions provider.
Projected Compound Annual Growth Rate of Global Data Centre Colocation Market
14.6%The global data centre colocation market is projected to grow at a compound annual growth rate of 14.6% from 2017 to 2020.
Alpha DC Fund has closed at US$1 billion and has expanded the Group’s capital base to seize opportunities.
The PCCW Global-Keppel International Carrier Exchange (ICX), a joint venture between KDCH and PCCW Global, was launched to provide faster interconnects for businesses in Hong Kong. This is part of a long-term collaboration between the partners to utilise the vast submarine cable capacity in the region as well as leverage KDCH’s technical expertise and operational track record and PCCW Global's extensive global network connectivity.
During the year, KDCH formed several strategic partnerships to advance its position as a leading-edge solutions provider. These included the signing of Memoranda with the Info-communications Media Development Authority of Singapore and Huawei on the deployment of a high-rise energy efficient data centre, and separately with JTC to explore the feasibility of underground data centres. Additionally, KDCH has partnered with the Singapore Internet Exchange to enhance connectivity solutions for its customers, and is also exploring a potential collaboration with Huawei on data centre efficiency and sustainability.
As part of its commitment to green data centre solutions, KCDH invested US$10 million in Nautilus Data Technologies (Nautilus), a data centre startup based in California. Nautilus has successfully launched a waterborne data centre prototype with
its patented water-cooling technology in a pre-fabricated facility, and is currently developing a commercial data centre for deployment in 2018.
Market Review & OutlookAccording to research consultancy MarketsandMarkets, the global data centre colocation segment is projected to grow at a compound annual growth rate of 14.6% from 2017 to 2020. This is underpinned by the proliferation of cloud computing, big data and digitalisation.
In Asia Pacific, growth in data centre colocation remained strong with the surge in data consumption, rising trend for data centre outsourcing and a continued focus on regional hosting by global content providers.
In Europe, growth in data centre colocation demand has expanded from the core hubs of Frankfurt, London, Amsterdam and Paris to other locations such as Milan andDublin. The creation of new data centrehubs is spurred by the continued entrance of subsea cables into these regions.
Demand for data centre colocation has increasingly shifted from the traditional sectors of financial services, international enterprise and telecommunications to cloud service providers and digital content providers. Continued market consolidation and new entrants are expected to increase competition, as well as pressures to reduce energy costs and improve efficiency.
In September 2017, Keppel T&T invested US$10 million in the Series C preferred stock funding of Nautilus, which is engaged in the business of developing water-cooled data centres, including pre-fabricated, vessel-based facilities that can be rapidly deployed globally.
By eliminating the need for energy-intensive cooling, a key part of a data centre's operating expenditures, water-cooled data centres can reduce carbon emissions and air pollution significantly while also reducing costs.
The world’s first successful waterborne data centre prototype, incorporating Nautilus’ patented water-cooling technology, was launched in 2015.
Together with Nautilus, Keppel T&T will be able to expand offerings of innovative solutions for data centre technology. Keppel T&T is also exploring opportunities to collaborate with other parts of the Group, such as Keppel Offshore & Marine, which brings to the table a strong track record in the design and production of floating platforms.
44 45
Keppel Corporation Limited | Report to Shareholders 2017

Together with Keppel DC REIT, the Group has a total of 18 facilities spanning nine countries and over 1.4 million sf of net lettable area. KDCH will continue to proactively pursue new development and acquisition opportunities in Asia Pacific and Europe, leveraging its partnerships with ADCF and Keppel DC REIT, and focus on green data centre design and technologies to sharpen its value propositions.
LogisticsOperating ReviewIn 2017, Keppel Logistics launched UrbanFox to provide omnichannel logistics and channel management solutions, which was formed after the acquisition of a stake in Courex in 2016. Drawing on Keppel Logistics' track record in third-party logistics solutions, and Courex’s business-to-consumer capabilities, UrbanFox won several channel management contracts and continues to see strong interest from both existing and potential customers for its end-to-end omnichannel logistics solutions.
In Vietnam and Indonesia, Keppel Logistics’ joint ventures have secured new contracts in e-commerce logistics, providing warehousing, inventory management and value-added services in urban hubs. In China, utilisation levels at the Sino-Singapore Tianjin Eco-City distribution centre has improved with the commencement of freight forwarding and transportation services to customers.
Despite intense competition, Keppel Logistics’ river ports in China performed better in 2017. Throughput at Sanshui Port
grew 3% year-on-year, while that of Wuhu Sanshan Port grew 9% year-on-year driven by an expanded customer base. Amidst challenges posed by industrial relocation and traffic regulations, Lanshi Port continued to actively pursue alternative sources of cargoes. Meanwhile, Foshan Sanshui Port upgraded its port technology in 2017 to improve productivity.
In August 2017, Keppel Wanjiang International Coldchain Logistics Park in Anhui province commenced trial operations. On the other hand, the construction of the Sino-Singapore Jilin Food Zone International Logistics Park has been put on hold due to a slow down in the development progress of the Jilin Food Zone.
With a view to optimise and focus resources to become the urban logistics solutions provider of choice, Keppel T&T is currently undertaking a strategic review of its China logistics portfolio.
Market Review & OutlookChina registered economic growth of 6.9% as the economy continued to rebalance towards domestic-driven consumption and services.
Meanwhile, Southeast Asia registered stable growth of 5% for 2017, backed by a broad-based pick-up in external demand and continued resilience in domestic consumption and investment. Rapid urbanisation, growing incomes and the proliferation of connected mobile devices have fuelled e-commerce in the region at high double-digit growth rates in the
1.Mr Thomas Pang, CEO of Keppel T&T, delivered the opening speech at the launch of UrbanFox in October 2017.
past few years. In response, the region’s logistics sector is evolving, unearthing new opportunities in omnichannel logistics, multi-modal transportation, cold chain logistics and intelligent transportation systems in the process.
To stay ahead, Keppel Logistics will continue to strengthen its capabilities to deliver new solutions in target markets, boost productivity and optimise its capital resources.
1
Operating & Financial ReviewInfrastructure
Keppel Logistics will continue to strengthen its capabilities to deliver new solutions in target markets as it works on boosting productivity and optimising its capital resources.
46 47
Performance Review
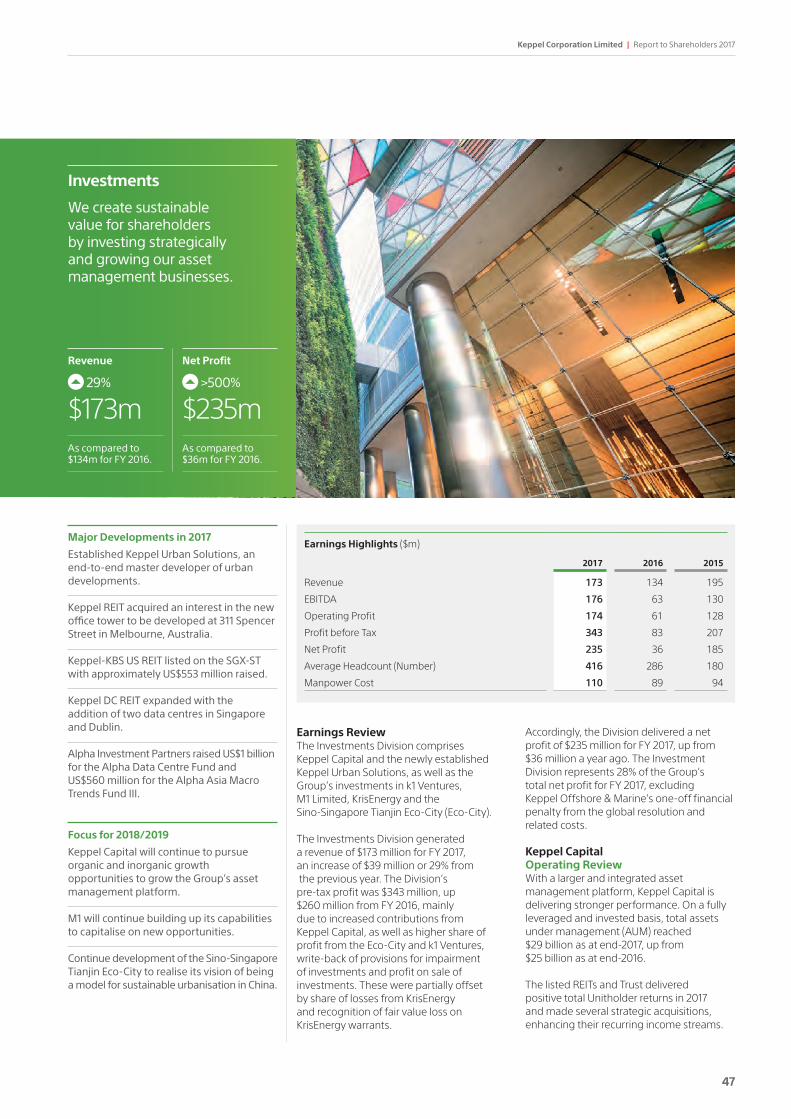
Major Developments in 2017
Established Keppel Urban Solutions, an end-to-end master developer of urban developments.
Keppel REIT acquired an interest in the new office tower to be developed at 311 Spencer Street in Melbourne, Australia.
Keppel-KBS US REIT listed on the SGX-ST with approximately US$553 million raised.
Keppel DC REIT expanded with the addition of two data centres in Singapore and Dublin.
Alpha Investment Partners raised US$1 billion for the Alpha Data Centre Fund and US$560 million for the Alpha Asia Macro Trends Fund III.
Focus for 2018/2019
Keppel Capital will continue to pursue organic and inorganic growth opportunities to grow the Group’s asset management platform.
M1 will continue building up its capabilities to capitalise on new opportunities.
Continue development of the Sino-Singapore Tianjin Eco-City to realise its vision of being a model for sustainable urbanisation in China.
Investments
We create sustainable value for shareholders by investing strategically and growing our asset management businesses.
As compared to $134m for FY 2016.
$173m
Revenue
As compared to $36m for FY 2016.
$235m
Net Profit
Earnings Highlights ($m)
2017 2016 2015
Revenue 173 134 195
EBITDA 176 63 130
Operating Profit 174 61 128
Profit before Tax 343 83 207
Net Profit 235 36 185
Average Headcount (Number) 416 286 180
Manpower Cost 110 89 94
29% >500%
Earnings ReviewThe Investments Division comprises Keppel Capital and the newly established Keppel Urban Solutions, as well as the Group’s investments in k1 Ventures, M1 Limited, KrisEnergy and the Sino-Singapore Tianjin Eco-City (Eco-City).
The Investments Division generated a revenue of $173 million for FY 2017, an increase of $39 million or 29% from the previous year. The Division’s pre-tax profit was $343 million, up $260 million from FY 2016, mainly due to increased contributions from Keppel Capital, as well as higher share of profit from the Eco-City and k1 Ventures, write-back of provisions for impairment of investments and profit on sale of investments. These were partially offset by share of losses from KrisEnergy and recognition of fair value loss on KrisEnergy warrants.
Accordingly, the Division delivered a net profit of $235 million for FY 2017, up from $36 million a year ago. The Investment Division represents 28% of the Group’s total net profit for FY 2017, excluding Keppel Offshore & Marine's one-off financial penalty from the global resolution and related costs.
Keppel CapitalOperating ReviewWith a larger and integrated asset management platform, Keppel Capital is delivering stronger performance. On a fully leveraged and invested basis, total assets under management (AUM) reached $29 billion as at end-2017, up from $25 billion as at end-2016.
The listed REITs and Trust delivered positive total Unitholder returns in 2017 and made several strategic acquisitions, enhancing their recurring income streams.
46 47
Keppel Corporation Limited | Report to Shareholders 2017
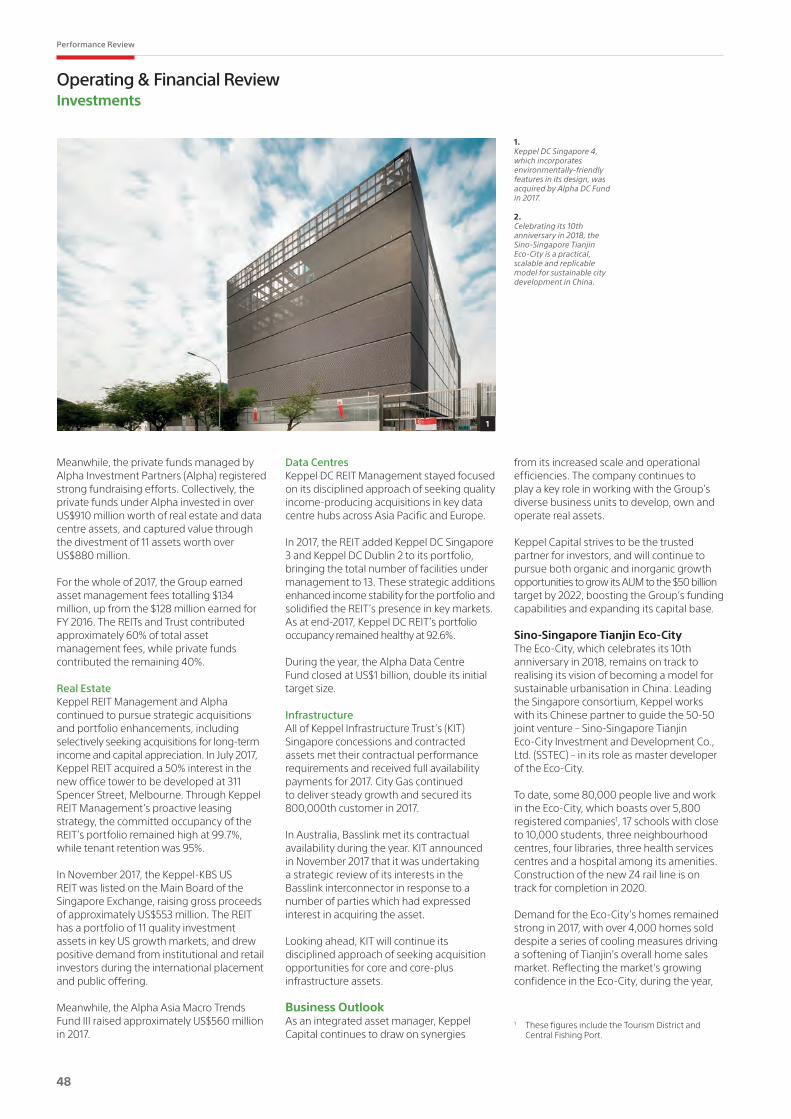
Operating & Financial ReviewInvestments
from its increased scale and operational efficiencies. The company continues to play a key role in working with the Group’s diverse business units to develop, own and operate real assets.
Keppel Capital strives to be the trusted partner for investors, and will continue to pursue both organic and inorganic growth opportunities to grow its AUM to the $50 billion target by 2022, boosting the Group’s funding capabilities and expanding its capital base.
Sino-Singapore Tianjin Eco-City The Eco-City, which celebrates its 10th anniversary in 2018, remains on track to realising its vision of becoming a model for sustainable urbanisation in China. Leading the Singapore consortium, Keppel works with its Chinese partner to guide the 50-50 joint venture – Sino-Singapore Tianjin Eco-City Investment and Development Co., Ltd. (SSTEC) – in its role as master developer of the Eco-City.
To date, some 80,000 people live and work in the Eco-City, which boasts over 5,800 registered companies1, 17 schools with close to 10,000 students, three neighbourhood centres, four libraries, three health services centres and a hospital among its amenities. Construction of the new Z4 rail line is on track for completion in 2020.
Demand for the Eco-City’s homes remained strong in 2017, with over 4,000 homes sold despite a series of cooling measures driving a softening of Tianjin’s overall home sales market. Reflecting the market’s growing confidence in the Eco-City, during the year,
Meanwhile, the private funds managed by Alpha Investment Partners (Alpha) registered strong fundraising efforts. Collectively, the private funds under Alpha invested in over US$910 million worth of real estate and data centre assets, and captured value through the divestment of 11 assets worth over US$880 million.
For the whole of 2017, the Group earned asset management fees totalling $134 million, up from the $128 million earned for FY 2016. The REITs and Trust contributed approximately 60% of total asset management fees, while private funds contributed the remaining 40%.
Real EstateKeppel REIT Management and Alpha continued to pursue strategic acquisitions and portfolio enhancements, including selectively seeking acquisitions for long-term income and capital appreciation. In July 2017, Keppel REIT acquired a 50% interest in the new office tower to be developed at 311 Spencer Street, Melbourne. Through Keppel REIT Management’s proactive leasing strategy, the committed occupancy of the REIT’s portfolio remained high at 99.7%, while tenant retention was 95%.
In November 2017, the Keppel-KBS US REIT was listed on the Main Board of the Singapore Exchange, raising gross proceeds of approximately US$553 million. The REIT has a portfolio of 11 quality investment assets in key US growth markets, and drew positive demand from institutional and retail investors during the international placement and public offering.
Meanwhile, the Alpha Asia Macro Trends Fund III raised approximately US$560 million in 2017.
Data CentresKeppel DC REIT Management stayed focused on its disciplined approach of seeking quality income-producing acquisitions in key data centre hubs across Asia Pacific and Europe.
In 2017, the REIT added Keppel DC Singapore 3 and Keppel DC Dublin 2 to its portfolio, bringing the total number of facilities under management to 13. These strategic additions enhanced income stability for the portfolio and solidified the REIT’s presence in key markets. As at end-2017, Keppel DC REIT’s portfolio occupancy remained healthy at 92.6%.
During the year, the Alpha Data Centre Fund closed at US$1 billion, double its initial target size.
InfrastructureAll of Keppel Infrastructure Trust’s (KIT) Singapore concessions and contracted assets met their contractual performance requirements and received full availability payments for 2017. City Gas continued to deliver steady growth and secured its 800,000th customer in 2017.
In Australia, Basslink met its contractual availability during the year. KIT announced in November 2017 that it was undertaking a strategic review of its interests in the Basslink interconnector in response to a number of parties which had expressed interest in acquiring the asset.
Looking ahead, KIT will continue its disciplined approach of seeking acquisition opportunities for core and core-plus infrastructure assets.
Business Outlook As an integrated asset manager, Keppel Capital continues to draw on synergies
1
1.Keppel DC Singapore 4, which incorporates environmentally-friendly features in its design, was acquired by Alpha DC Fund in 2017.
2.Celebrating its 10th anniversary in 2018, the Sino-Singapore Tianjin Eco-City is a practical, scalable and replicable model for sustainable city development in China.
1 These figures include the Tourism District and Central Fishing Port.
48 49
Performance Review

three residential land parcels were sold at record prices of around RMB 13,800 psm of gross floor area (GFA) at a land auction in early-2017.
With the focus of the development shifting to the Central District, SSTEC has embarked on a new urban design scheme for the district, which will become the main commercial, hotel and recreation hub of the Eco-City. Meanwhile, work on the Sino-Singapore Friendship Garden and Sino-Singapore Friendship Library is on-going.
In February 2017, Singapore’s Deputy Prime Minister Teo Chee Hean and Minister for National Development and Second Minister for Finance Lawrence Wong met their Chinese counterparts in Beijing for the Joint Steering Council meeting, affirming the Eco-City’s progress.
The various business units of the Keppel Group continued to contribute towards the growth of the Eco-City by providing solutions for urban living, clean environment and connectivity.
In 2017, Keppel Land China sold 1,017 homes in the Eco-City. As at end-December 2017, Keppel’s Seasons Garden has sold 97% of its 1,190 units, Seasons Residences has sold over 62% of its 380 launched units, and Seasons Heights has sold all of its 124 launched units. Meanwhile, Waterfront Residences was almost fully sold as at end-December 2017.
Other businesses within the Group also contributed to the Eco-City’s development. Keppel T&T’s logistics distribution centre in the Eco-Industrial Park maintained its occupancy at an average of 65% for 2017.
The Sino-Singapore Tianjin Eco-City Water Reclamation Centre, a joint venture between Keppel Infrastructure and Tianjin Eco-City Investment and Development Co., Ltd, was officially opened by Singapore's Deputy Prime Minister Tharman
intermittent weather disruptions curtailed production in other fields.
As at end-December 2017, KrisEnergy’s working interest proved plus probable (2P) reserves were estimated at 83.5 million barrels of oil equivalent (mmboe), a reduction of 13.6% from 96.6 mmboe in 2016, mainly due to KrisEnergy’s reduced working interest in the Block A Aceh production sharing contract. This was partially offset by a reclassification to 2P reserves of 8.1 million barrels of oil from contingent resources associated with the Apsara development in Cambodia Block A.
Health, safety and the environment remained a priority and KrisEnergy recorded 1,587,181 man-hours on its operated assets with zero lost time injuries in FY 2017.
Financial RestructuringIn January 2017, KrisEnergy successfully extended its debt profile to 2022 and 2023 in the case of the existing $330 million senior unsecured notes, and issued $139.5 million new zero coupon secured notes (ZCNs) due 2024 combined with detachable warrants. Keppel’s wholly-owned subsidiary, Keppel Oil & Gas, successfully subscribed for 107,205,985 ZCNs with 964,853,865 Warrants, pursuant to an irrevocable undertaking.
Following the completion of its Consent Solicitation Exercise and financial restructuring, KrisEnergy also revised its strategic and operational goals. In line with its strategy of increasing production and cash flows by focusing on existing producing fields and near-term development projects, KrisEnergy has divested three non-core assets since late-2016 and ceased development activities in the Block A Aceh Production Sharing Contract to focus capital resources on the strategic core area of the Gulf of Thailand. Accordingly, total capital expenditure for 2017 was US$68.7 million, significantly lower compared to the mid-year forecast of US$110.3 million, as KrisEnergy
2
Shanmugaratnam in June 2017. The Centre treats wastewater effluent from an existing wastewater treatment plant to produce recycled water that meets China’s most stringent standards for urban miscellaneous water consumption.
KrisEnergy Trading conditions based on oil price improved for KrisEnergy in 2017 as Brent crude futures recovered, averaging US$55 per barrel (bbl) for the year. However, oil prices continued to be volatile, touching three-year highs above US$70/bbl in January 2018 before skidding to its biggest weekly loss in two years at around US$62/bbl in February 2018. While average oil prices have recovered, trading and financing conditions remained turbulent. Such fluctuations have caused significant uncertainty in the upstream sector's ability to plan and commit to capital expenditure, and continues to dent investor sentiment and reduce avenues to capital.
In 2017, KrisEnergy reported revenues of US$141 million, stable year-on-year as higher average selling prices for both crude oil and liquids as well as natural gas offset lower year-on-year sales volumes. FY 2017 operating margins improved significantly, mainly due to a focus on cost-cutting measures and reduced depreciation, depletion and amortisation charges. Net losses for FY 2017 narrowed to US$139 million from US$237 million in FY 2016, due to improved operating margins, offset by non-cash impairment charges and write-offs for non-core assets as the company directed capital and operational resources towards the Gulf of Thailand and Bangladesh.
During the year, KrisEnergy’s working interest production averaged 12,745 barrels of oil equivalent per day, a decrease of 21% from 2016. Infill drilling at the Wassana field in the Gulf of Thailand was deferred to 4Q 2017 from 1H 2017. Also in the Gulf of Thailand, the Tantawan field and production facilities in licenses B8/32 and B9A permanently ceased production. Meanwhile, natural decline and
48 49
Keppel Corporation Limited | Report to Shareholders 2017
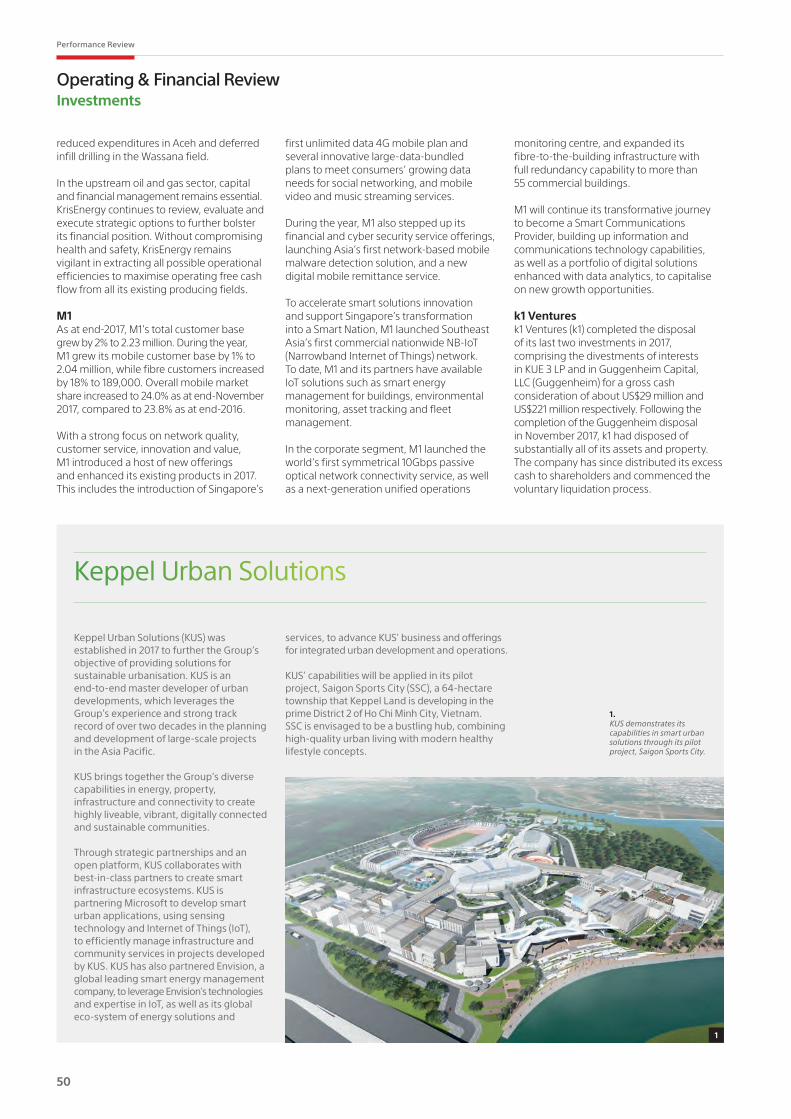
Keppel Urban Solutions
Keppel Urban Solutions (KUS) was established in 2017 to further the Group’s objective of providing solutions for sustainable urbanisation. KUS is an end-to-end master developer of urban developments, which leverages the Group’s experience and strong track record of over two decades in the planning and development of large-scale projects in the Asia Pacific. KUS brings together the Group’s diverse capabilities in energy, property, infrastructure and connectivity to create highly liveable, vibrant, digitally connected and sustainable communities.
Through strategic partnerships and an open platform, KUS collaborates with best-in-class partners to create smart infrastructure ecosystems. KUS is partnering Microsoft to develop smart urban applications, using sensing technology and Internet of Things (IoT), to efficiently manage infrastructure and community services in projects developed by KUS. KUS has also partnered Envision, a global leading smart energy management company, to leverage Envision's technologies and expertise in IoT, as well as its global eco-system of energy solutions and
1.KUS demonstrates its capabilities in smart urban solutions through its pilot project, Saigon Sports City.
1
Operating & Financial ReviewInvestments
reduced expenditures in Aceh and deferred infill drilling in the Wassana field.
In the upstream oil and gas sector, capital and financial management remains essential. KrisEnergy continues to review, evaluate and execute strategic options to further bolster its financial position. Without compromising health and safety, KrisEnergy remains vigilant in extracting all possible operational efficiencies to maximise operating free cash flow from all its existing producing fields.
M1As at end-2017, M1’s total customer base grew by 2% to 2.23 million. During the year, M1 grew its mobile customer base by 1% to 2.04 million, while fibre customers increased by 18% to 189,000. Overall mobile market share increased to 24.0% as at end-November 2017, compared to 23.8% as at end-2016.
With a strong focus on network quality, customer service, innovation and value, M1 introduced a host of new offerings and enhanced its existing products in 2017. This includes the introduction of Singapore’s
first unlimited data 4G mobile plan and several innovative large-data-bundled plans to meet consumers’ growing data needs for social networking, and mobile video and music streaming services.
During the year, M1 also stepped up its financial and cyber security service offerings, launching Asia’s first network-based mobile malware detection solution, and a new digital mobile remittance service.
To accelerate smart solutions innovation and support Singapore’s transformation into a Smart Nation, M1 launched Southeast Asia’s first commercial nationwide NB-IoT (Narrowband Internet of Things) network. To date, M1 and its partners have available IoT solutions such as smart energy management for buildings, environmental monitoring, asset tracking and fleet management.
In the corporate segment, M1 launched the world’s first symmetrical 10Gbps passive optical network connectivity service, as well as a next-generation unified operations
monitoring centre, and expanded its fibre-to-the-building infrastructure with full redundancy capability to more than 55 commercial buildings.
M1 will continue its transformative journey to become a Smart Communications Provider, building up information and communications technology capabilities, as well as a portfolio of digital solutions enhanced with data analytics, to capitalise on new growth opportunities.
k1 Ventures k1 Ventures (k1) completed the disposal of its last two investments in 2017, comprising the divestments of interests in KUE 3 LP and in Guggenheim Capital, LLC (Guggenheim) for a gross cash consideration of about US$29 million and US$221 million respectively. Following the completion of the Guggenheim disposal in November 2017, k1 had disposed of substantially all of its assets and property. The company has since distributed its excess cash to shareholders and commenced the voluntary liquidation process.
services, to advance KUS' business and offerings for integrated urban development and operations.
KUS’ capabilities will be applied in its pilot project, Saigon Sports City (SSC), a 64-hectare township that Keppel Land is developing in the prime District 2 of Ho Chi Minh City, Vietnam. SSC is envisaged to be a bustling hub, combining high-quality urban living with modern healthy lifestyle concepts.
50 51
Performance Review

Management Discussion & Analysis
We are configured for growth, building on an institutional quality balance sheet.
Group OverviewGroup net profit for 2017 was $217 million, down 72% from $784 million for 2016, due largely to the one-off financial penalty arising from Keppel Offshore & Marine’s (Keppel O&M) global resolution with criminal authorities in the US, Brazil and Singapore, and related legal, accounting and forensics costs amounting to $619 million. This was partly offset by earnings growth registered by the Property, Infrastructure and Investments divisions.
Earnings Per Share (EPS) was 11.9 cents, down 72% from 43.2 cents for 2016. Return On Equity (ROE) was 1.9%, compared to 6.9% for 2016. Economic Value Added (EVA) was negative $834 million for 2017, compared to negative $140 million for 2016.
Free cash inflow for 2017 was $1,802 million, compared to $540 million for 2016.Meanwhile, net gearing for 2017 was 0.46 times, compared to 0.56 times for 2016.
Total cash dividend for 2017 will be 22.0 cents per share. This comprises a proposed final cash dividend of 14.0 cents per share and the interim cash dividend of 8.0 cents per share paid in the third quarter of 2017.
Segment Operations Group revenue of $5,964 million for 2017 was $803 million or 12% below that of 2016. Revenue from the O&M Division declined by $1,052 million to $1,802 million due to lower volume of work and deferment of some projects. Major jobs completed
and delivered in 2017 include a semisubmersible, a subsea construction vessel, a Floating Production Storage and Offloading (FPSO) vessel conversion, an FPSO topsides installation/integration, a module fabrication & integration, a floating liquefaction vessel conversion and an ice-class multi-purpose vessel. Revenue from the Property Division decreased by $253 million to $1,782 million due mainly to lower revenue from China and Singapore, partly offset by higher revenue from Vietnam. Revenue from the Infrastructure Division grew by $463 million to $2,207 million as a result of increased sales in the power and gas businesses and progressive revenue recognition from the Keppel Marina East Desalination Plant project.
Group net profit of $217 million was $567 million or 72% lower than the previous year. Loss from the O&M Division was $835 million as compared to net profit of $29 million in the prior year. This was mainly due to the one-off financial penalty from the global resolution and related costs of $619 million, lower operating results arising from lower revenue and lower share of associated companies’ profits. The negative variance was partly offset by lower impairment provisions and lower net interest expense.
Profit from the Property Division of $685 million increased by $65 million due largely to higher fair value gains on investment properties and higher contribution from Singapore and
As compared to $540m for FY 2016.
$1,802mFree Cash Inflow
Includes one-off financial penalty from the global resolution and related costs.
11.9ctsEarnings Per Share
50 51
Keppel Corporation Limited | Report to Shareholders 2017

Operating & Financial ReviewManagement Discussion & Analysis
52 53
Performance Review
^ Includes the one-off financial penalty from the global resolution and related costs of $619 million.* Free cash flow excludes expansionary acquisitions and capital expenditure, and major divestments.
Key Performance Indicators
2017$ million
17 vs 16% +/(-)
2016$ million
16 vs 15% +/(-)
2015$ million
Revenue 5,964 -12 6,767 -34 10,296
Net profit 217^ -72 784 -49 1,525
Earnings Per Share 11.9 cts^ -72 43.2 cts -49 84.0 cts
Return On Equity 1.9%^ -73 6.9% -51 14.2%
Economic Value Added (834)^ +496 (140) n.m. 648
Operating cash flow 1,377 +368 294 n.m. (785)
Free cash flow* 1,802 +234 540 n.m. (694)
Total cash dividend per share 22.0 cts +10 20.0 cts -41 34.0 cts
Revenue ($m)
7,000
6,000
5,000
4,000
3,000
2,000
1,000
0
Offshore & Marine Property Infrastructure Investments Total
2015 6,241 1,823 2,037 195 10,296
2016 2,854 2,035 1,744 134 6,767
2017 1,802 1,782 2,207 173 5,964
Net Profit ($m)
800
600
400
200
0
-200
-400
-600
-800
-1,000
Offshore & Marine Property Infrastructure Investments Total
2015 482 661 197 185 1,525
2016 29 620 99 36 784
2017 -835^ 685 132 235 217
^ Includes the one-off financial penalty from the global resolution and related costs of $619 million.
Vietnam property trading and en bloc sales of development projects, partly offset by lower share of associated companies’ profits.
Profit from the Infrastructure Division of $132 million increased by $33 million due largely to higher contribution from Energy Infrastructure, the gain on divestment of its interest in GE Keppel Energy Services, as well as the recognition of fair value gain on investment. These were partly offset by lower contribution from the data centre business, due mainly to the absence of contribution from Keppel DC Singapore 3, which was injected into Keppel DC REIT in January 2017.
Profit from the Investments Division of $235 million increased by $199 million due mainly to higher share of profits from Sino-Singapore Tianjin Eco-City and k1 Ventures, higher contribution from the asset management business, write-back of provision for impairment of investments and profit on sale of investments. These were partly offset by the share of loss in KrisEnergy and recognition of fair value loss on KrisEnergy warrants.
Excluding the one-off financial penalty from the global resolution and related costs, the Property Division was the largest contributor to Group net profit with an 82% share. This was followed by the Investments Division at 28% and the Infrastructure Division at 16% while the O&M Division contributed negative 26% to the Group’s net profit.

52 53
Keppel Corporation Limited | Report to Shareholders 2017
ProspectsThe Offshore & Marine (O&M) Division’s net order book, excluding the Sete rigs, stands at $3.9 billion. The Division will continue to focus on delivering its projects well, exploring new markets and opportunities, investing in R&D and building new capabilities to position itself for the upturn. The Division is also actively capturing opportunities in production assets, specialised vessels and the growing gas market and exploring ways to re-purpose its offshore technology for other uses.
The Property Division sold more than 5,480 homes in 2017, comprising about 3,725 in China, 1,110 in Vietnam, 380 in Singapore and 270 in Indonesia. This is 4.2% lower than the 5,720 homes sold in 2016. In addition, three projects, equivalent to about 4,330 homes sold en bloc, were divested in 2017. Keppel REIT’s office buildings in Singapore and Australia maintained a high portfolio committed occupancy rate of 99.7% as at end-2017. The Division will remain focused on strengthening its presence in its core and growth markets, while seeking opportunities to unlock value and recycle capital.
In the Infrastructure Division, Keppel Infrastructure will continue to build on its core competencies in energy and environment-related infrastructure, as well as infrastructure services businesses to pursue promising growth areas.
Keppel Telecommunications & Transportation (Keppel T&T) will continue to develop its data centre business locally and overseas. Besides building complementary capabilities in the growing e-commerce business, Keppel T&T plans to transform the logistics business from an asset-heavy business to a high-performing asset-light service provider in urban logistics.
In the Investments Division, Keppel Capital will continue to allow the Group to more effectively recycle capital and expand its capital base with co-investments, giving the Group greater capacity to seize opportunities for growth. Keppel Capital will also create value for investors and grow the Group’s asset management business.
The newly established Keppel Urban Solutions will harness opportunities as an integrated master developer of smart, sustainable precincts, starting with Saigon Sports City in Ho Chi Minh City, while the Sino-Singapore Tianjin Eco-City Investment and Development Co., Ltd will continue to develop the Eco-City, including selling further land parcels in 2018.
The Group will continue to execute its multi-business strategy, capturing value by harnessing its core strengths and growing collaboration across divisions to unleash potential synergies, while being agile and investing in the future.
Financial Review & Outlook
We will sustain value creation through execution excellence, technology innovation and financial discipline.
Total assets decreased by $1.1b to $28.1b. The decrease in current assets was partially offset by increase in non-current assets.
$28.1b
Total Assets
Total distribution to shareholders of the Company and non-controlling shareholders of subsidiaries for the year amounted to $390m.
$0.22
Total Cash Dividend Per Share
4% 10%

Operating & Financial ReviewFinancial Review & Outlook
54 55
Performance Review
Shareholder ReturnsReturn on Equity (ROE) decreased to 1.9% in 2017 from 6.9% in the previous year, largely due to the one-off financial penalty from the global resolution and related costs, and higher average total equity. Excluding the one-off financial penalty from the global resolution and related costs of $619 million, ROE was 7.0% in 2017.
The Company will be distributing a total cash dividend of 22.0 cents per share for 2017, comprising a proposed final cash dividend of 14.0 cents per share and the interim cash dividend of 8.0 cents per share distributed in the third quarter of 2017. Total cash dividend for 2017 represents 185% of Group net profit. Excluding the one-off financial penalty from the global resolution and related costs of $619 million, total cash dividend for 2017 represents 48% of Group net profit. On a per share basis, it translates into a gross yield of 3.0% on the Company’s last transacted share price of $7.35 as at 31 December 2017.
Notes:1. Profit after tax excludes net revaluation gain on investment properties. 2. The reported current tax is adjusted for statutory tax impact on interest expenses.3. Average EVA Capital Employed is derived from the quarterly averages of net assets, interest-bearing liabilities, timing of provisions, present value of operating leases and
other adjustments. 4. Weighted Average Cost of Capital is calculated in accordance with the Keppel Group EVA Policy as follows:
(a) Cost of Equity using Capital Asset Pricing Model with market risk premium set at 5.0% (2016: 5.0%); (b) Risk-free rate of 2.41% (2016: 2.50%) based on yield-to-maturity of Singapore Government 10-year Bonds; (c) Unlevered beta at 0.75 (2016: 0.75); and (d) Pre-tax Cost of Debt at 2.30% (2016: 2.45%) using 5-year Singapore Dollar Swap Offer Rate plus 60 basis points (2016: 45 basis points).
^ Includes the one-off financial penalty from the global resolution and related costs of $619 million.
EVA
2017 $ million
17 vs 16 +/(-)
2016 $ million
16 vs 15+/(-)
2015 $ million
Profit after tax (Note 1) 2 -764 766 -648 1,414
Adjustment for:
Interest expense 189 -36 225 +70 155
Interest expense on non-capitalised leases 26 -3 29 +4 25
Tax effect on interest expense adjustments (Note 2) (38) +6 (44) -12 (32)
Provisions, deferred tax, amortisation & other adjustments 76 +79 (3) -180 177
Net Operating Profit After Tax (NOPAT) 255 -718 973 -766 1,739
Average EVA Capital Employed (Note 3) 18,936 -183 19,119 +561 18,558
Weighted Average Cost of Capital (Note 4) 5.75% -0.07% 5.82% -0.06% 5.88%
Capital Charge (1,089) +24 (1,113) -22 (1,091)
Economic Value Added (834)^ -694 (140) -788 648
ROE & Dividend
% cents
25 50
20 40
15 30
10 20
5 10
0 0
2013 2014 2015 2016 2017
ROE 19.5 18.8 14.2 6.9 1.9^
Full-Year Dividend 40.0 48.0 34.0 20.0 22.0
Interim Dividend 10.0 12.0 12.0 8.0 8.0
Dividend in specie
~ 9.5 cts/share
^ Includes the one-off financial penalty from the global resolution and related costs of $619 million.
EVA ($m)
2,000
1,500
1,000
500
0
-500
-1,000
2012 2013 2014 2015 2016 2017
1,430 1,142 1,778 648 (140) (834)^
^ Includes the one-off financial penalty from the global resolution and related costs of $619 million.

54 55
Keppel Corporation Limited | Report to Shareholders 2017
Economic Value AddedIn 2017, Economic Value Added (EVA) was negative $834 million as compared to negative $140 million in the previous year. Excluding the one-off financial penalty from the global resolution and related costs of $619 million, EVA was negative $215 million in 2017. This was attributable to lower net operating profit after tax, partially offset by lower capital charge.
Capital charge decreased by $24 million as a result of lower Average EVA Capital and lower Weighted Average Cost of Capital (WACC). WACC decreased from 5.82% to 5.75% due mainly to a decrease in equity value resulting from lower market capitalisation, partly offset by higher cost of debt. Average EVA Capital decreased by $183 million from $19.12 billion to $18.94 billion mainly because of lower borrowings.
Financial PositionGroup shareholders’ funds decreased from $11.66 billion as at 31 December 2016 to $11.43 billion as at 31 December 2017. The decrease was mainly attributable to payment of the final dividend of 12.0 cents per share in respect of financial year 2016 and the interim dividend of 8.0 cents per share in respect of the first half year ended 30 June 2017, and foreign exchange translation losses. This was partially offset by retained profits for 2017 and an increase in fair value on cash flow hedges.
Group total assets of $28.11 billion at 31 December 2017 were $1.1 billion or 4% lower than at the previous year end. Decrease in current assets was partially offset by increase in non-current assets. The decrease in current assets was due mainly to the lower stocks & work-in-progress and debtors from the O&M and Property divisions, partially offset by higher bank balances, deposits and cash. The increase in non-current assets was due mainly to acquisition and further investment in associated companies, partially offset by depreciation of fixed assets.
Group total liabilities of $16.15 billion at 31 December 2017 were $0.7 billion or 4% lower than at the previous year end. This was mainly due to net repayment of term loans and a reduction in derivative liabilities, partially offset by an increase in creditors arising from higher billings by suppliers, and accruals for the one-off financial penalty from the global resolution and related costs.
Group net debt of $5.52 billion was $1.4 billion lower than that as at 31 December 2016. This was mainly due to proceeds from the disposal of subsidiaries in the Property and Infrastructure divisions as well as dividends received from investments and
Total Assets Owned ($m)
35,000
30,000
25,000
20,000
15,000
10,000
5,000
0
2015 2016 2017
Fixed assets 2,846 2,645 2,433
Properties 3,272 3,550 3,461
Investments 6,029 6,065 6,563
Stocks & work-in-progress 10,763 10,026 8,782
Debtors & others 4,117 4,861 4,600
Bank balances, deposits & cash 1,893 2,087 2,274
Total 28,920 29,234 28,113
Total Liabilities Owed and Capital Invested ($m)
35,000
30,000
25,000
20,000
15,000
10,000
5,000
0
2015 2016 2017
Shareholders’ funds 11,096 11,659 11,433
Non-controlling interests 830 675 527
Creditors 8,362 7,516 8,025
Term loans & bank overdrafts 8,259 9,053 7,793
Other liabilities 373 331 335
Total 28,920 29,234 28,113
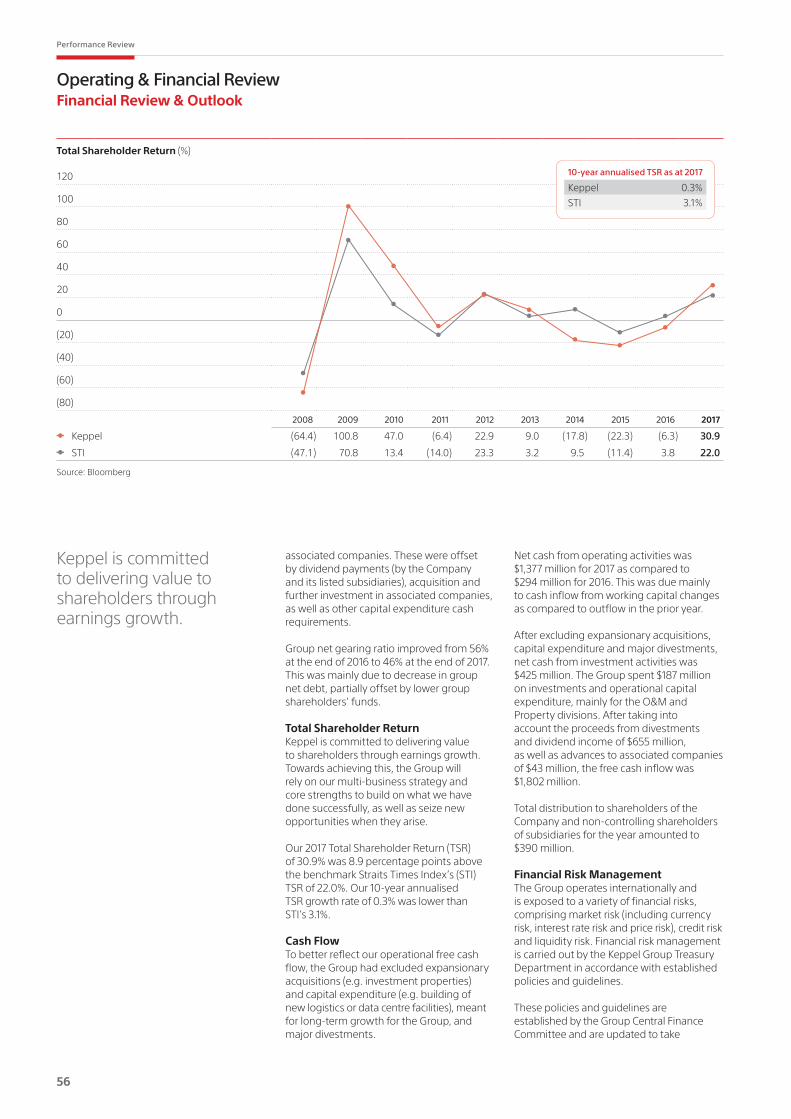
Operating & Financial ReviewFinancial Review & Outlook
Keppel is committed to delivering value to shareholders through earnings growth.
56 57
Performance Review
Net cash from operating activities was $1,377 million for 2017 as compared to $294 million for 2016. This was due mainly to cash inflow from working capital changes as compared to outflow in the prior year.
After excluding expansionary acquisitions, capital expenditure and major divestments, net cash from investment activities was $425 million. The Group spent $187 million on investments and operational capital expenditure, mainly for the O&M and Property divisions. After taking into account the proceeds from divestments and dividend income of $655 million, as well as advances to associated companies of $43 million, the free cash inflow was $1,802 million.
Total distribution to shareholders of the Company and non-controlling shareholders of subsidiaries for the year amounted to $390 million.
Financial Risk ManagementThe Group operates internationally and is exposed to a variety of financial risks, comprising market risk (including currency risk, interest rate risk and price risk), credit risk and liquidity risk. Financial risk management is carried out by the Keppel Group Treasury Department in accordance with established policies and guidelines.
These policies and guidelines are established by the Group Central Finance Committee and are updated to take
Total Shareholder Return (%)
120
100
80
60
40
20
0
(20)
(40)
(60)
(80)
2008 2009 2010 2011 2012 2013 2014 2015 2016 2017
Keppel (64.4) 100.8 47.0 (6.4) 22.9 9.0 (17.8) (22.3) (6.3) 30.9
STI (47.1) 70.8 13.4 (14.0) 23.3 3.2 9.5 (11.4) 3.8 22.0
10-year annualised TSR as at 2017
Keppel 0.3%
STI 3.1%
Source: Bloomberg
associated companies. These were offset by dividend payments (by the Company and its listed subsidiaries), acquisition and further investment in associated companies, as well as other capital expenditure cash requirements.
Group net gearing ratio improved from 56% at the end of 2016 to 46% at the end of 2017. This was mainly due to decrease in group net debt, partially offset by lower group shareholders’ funds.
Total Shareholder ReturnKeppel is committed to delivering value to shareholders through earnings growth. Towards achieving this, the Group will rely on our multi-business strategy and core strengths to build on what we have done successfully, as well as seize new opportunities when they arise.
Our 2017 Total Shareholder Return (TSR) of 30.9% was 8.9 percentage points above the benchmark Straits Times Index’s (STI) TSR of 22.0%. Our 10-year annualised TSR growth rate of 0.3% was lower than STI’s 3.1%.
Cash FlowTo better reflect our operational free cash flow, the Group had excluded expansionary acquisitions (e.g. investment properties) and capital expenditure (e.g. building of new logistics or data centre facilities), meant for long-term growth for the Group, and major divestments.
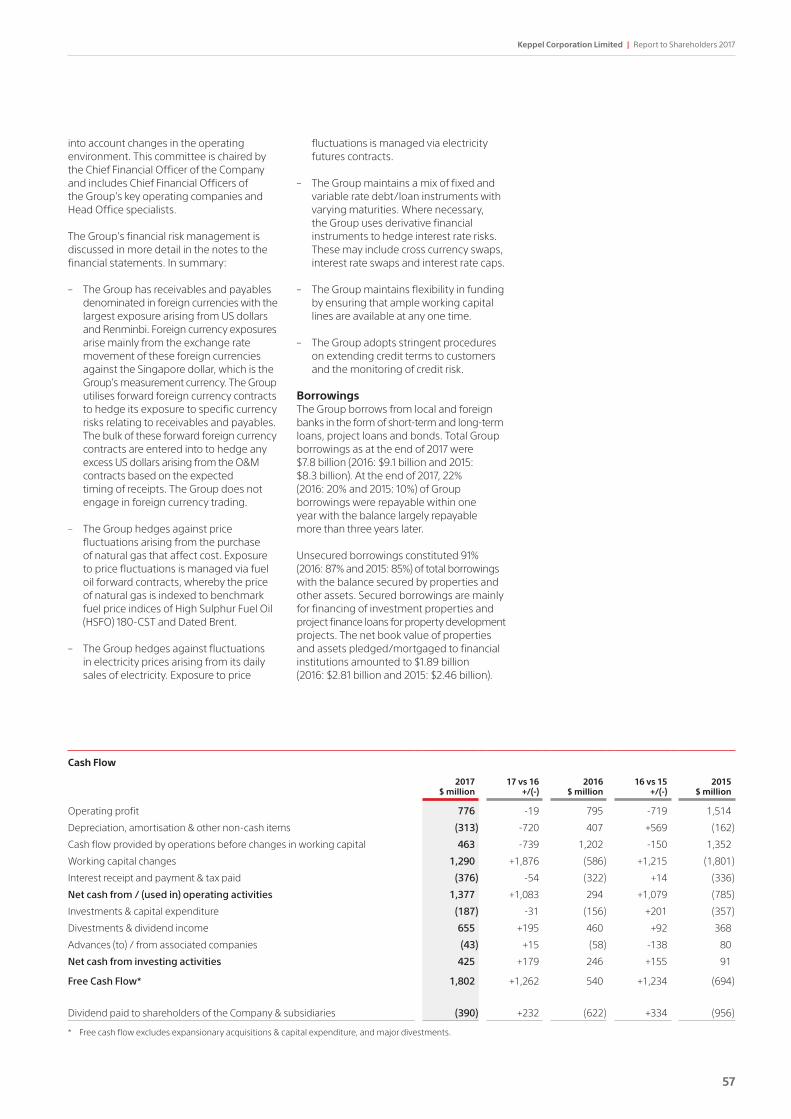
56 57
Keppel Corporation Limited | Report to Shareholders 2017
into account changes in the operating environment. This committee is chaired by the Chief Financial Officer of the Company and includes Chief Financial Officers of the Group’s key operating companies and Head Office specialists.
The Group’s financial risk management is discussed in more detail in the notes to the financial statements. In summary:
– The Group has receivables and payables denominated in foreign currencies with the largest exposure arising from US dollars and Renminbi. Foreign currency exposures arise mainly from the exchange rate movement of these foreign currencies against the Singapore dollar, which is the Group’s measurement currency. The Group utilises forward foreign currency contracts to hedge its exposure to specific currency risks relating to receivables and payables. The bulk of these forward foreign currency contracts are entered into to hedge any excess US dollars arising from the O&M contracts based on the expected timing of receipts. The Group does not engage in foreign currency trading.
– The Group hedges against price fluctuations arising from the purchase of natural gas that affect cost. Exposure to price fluctuations is managed via fuel oil forward contracts, whereby the price of natural gas is indexed to benchmark fuel price indices of High Sulphur Fuel Oil (HSFO) 180-CST and Dated Brent.
– The Group hedges against fluctuations in electricity prices arising from its daily sales of electricity. Exposure to price
fluctuations is managed via electricity futures contracts.
– The Group maintains a mix of fixed and variable rate debt/loan instruments with varying maturities. Where necessary, the Group uses derivative financial instruments to hedge interest rate risks. These may include cross currency swaps, interest rate swaps and interest rate caps.
– The Group maintains flexibility in funding by ensuring that ample working capital lines are available at any one time.
– The Group adopts stringent procedures on extending credit terms to customers and the monitoring of credit risk.
BorrowingsThe Group borrows from local and foreign banks in the form of short-term and long-term loans, project loans and bonds. Total Group borrowings as at the end of 2017 were $7.8 billion (2016: $9.1 billion and 2015: $8.3 billion). At the end of 2017, 22% (2016: 20% and 2015: 10%) of Group borrowings were repayable within one year with the balance largely repayable more than three years later.
Unsecured borrowings constituted 91% (2016: 87% and 2015: 85%) of total borrowings with the balance secured by properties and other assets. Secured borrowings are mainly for financing of investment properties and project finance loans for property development projects. The net book value of properties and assets pledged/mortgaged to financial institutions amounted to $1.89 billion (2016: $2.81 billion and 2015: $2.46 billion).
Cash Flow
2017 $ million
17 vs 16 +/(-)
2016 $ million
16 vs 15+/(-)
2015 $ million
Operating profit 776 -19 795 -719 1,514
Depreciation, amortisation & other non-cash items (313) -720 407 +569 (162)
Cash flow provided by operations before changes in working capital 463 -739 1,202 -150 1,352
Working capital changes 1,290 +1,876 (586) +1,215 (1,801)
Interest receipt and payment & tax paid (376) -54 (322) +14 (336)
Net cash from / (used in) operating activities 1,377 +1,083 294 +1,079 (785)
Investments & capital expenditure (187) -31 (156) +201 (357)
Divestments & dividend income 655 +195 460 +92 368
Advances (to) / from associated companies (43) +15 (58) -138 80
Net cash from investing activities 425 +179 246 +155 91
Free Cash Flow* 1,802 +1,262 540 +1,234 (694)
Dividend paid to shareholders of the Company & subsidiaries (390) +232 (622) +334 (956)
* Free cash flow excludes expansionary acquisitions & capital expenditure, and major divestments.
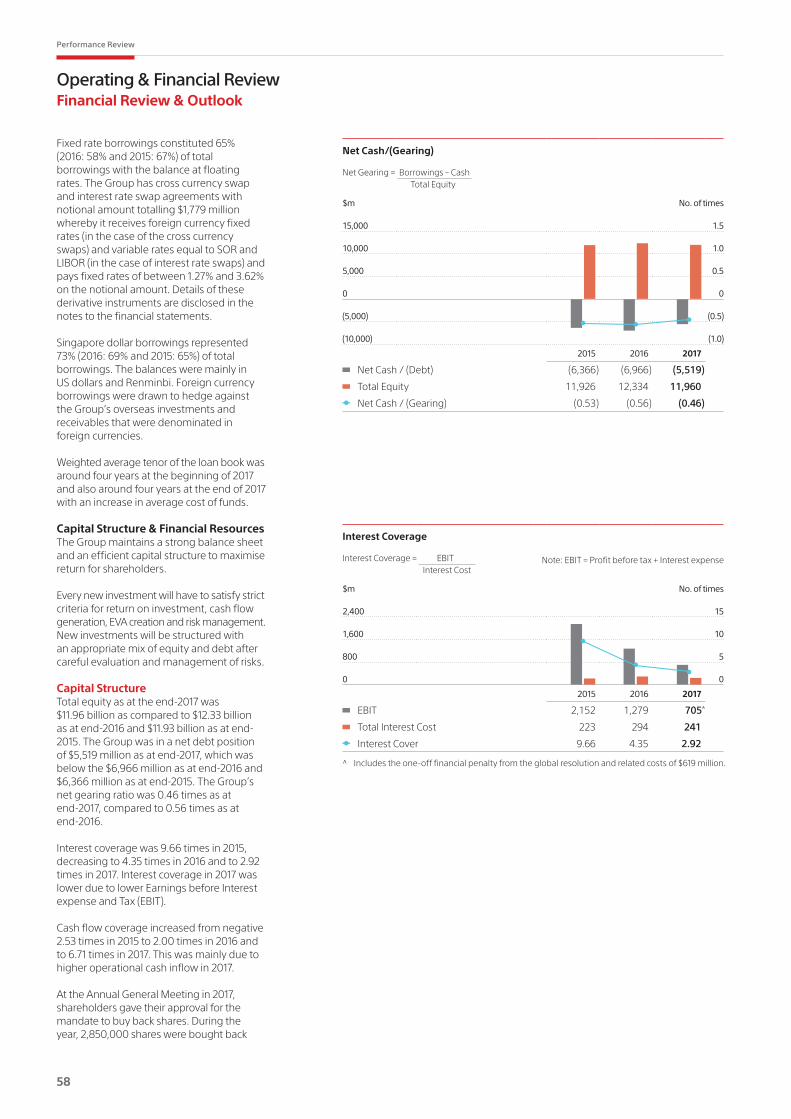
Operating & Financial ReviewFinancial Review & Outlook
58 59
Performance Review
Fixed rate borrowings constituted 65% (2016: 58% and 2015: 67%) of total borrowings with the balance at floating rates. The Group has cross currency swap and interest rate swap agreements with notional amount totalling $1,779 million whereby it receives foreign currency fixed rates (in the case of the cross currency swaps) and variable rates equal to SOR and LIBOR (in the case of interest rate swaps) and pays fixed rates of between 1.27% and 3.62% on the notional amount. Details of these derivative instruments are disclosed in the notes to the financial statements.
Singapore dollar borrowings represented 73% (2016: 69% and 2015: 65%) of total borrowings. The balances were mainly in US dollars and Renminbi. Foreign currency borrowings were drawn to hedge against the Group’s overseas investments and receivables that were denominated in foreign currencies.
Weighted average tenor of the loan book was around four years at the beginning of 2017 and also around four years at the end of 2017 with an increase in average cost of funds.
Capital Structure & Financial ResourcesThe Group maintains a strong balance sheet and an efficient capital structure to maximise return for shareholders.
Every new investment will have to satisfy strict criteria for return on investment, cash flow generation, EVA creation and risk management. New investments will be structured with an appropriate mix of equity and debt after careful evaluation and management of risks.
Capital StructureTotal equity as at the end-2017 was $11.96 billion as compared to $12.33 billion as at end-2016 and $11.93 billion as at end-2015. The Group was in a net debt position of $5,519 million as at end-2017, which was below the $6,966 million as at end-2016 and $6,366 million as at end-2015. The Group’s net gearing ratio was 0.46 times as at end-2017, compared to 0.56 times as at end-2016.
Interest coverage was 9.66 times in 2015, decreasing to 4.35 times in 2016 and to 2.92 times in 2017. Interest coverage in 2017 was lower due to lower Earnings before Interest expense and Tax (EBIT).
Cash flow coverage increased from negative 2.53 times in 2015 to 2.00 times in 2016 and to 6.71 times in 2017. This was mainly due to higher operational cash inflow in 2017.
At the Annual General Meeting in 2017, shareholders gave their approval for the mandate to buy back shares. During the year, 2,850,000 shares were bought back
Net Cash/(Gearing)
Net Gearing = Borrowings – Cash Total Equity
$m No. of times
15,000 1.5
10,000 1.0
5,000 0.5
0 0
(5,000) (0.5)
(10,000) (1.0)
2015 2016 2017
Net Cash / (Debt) (6,366) (6,966) (5,519)
Total Equity 11,926 12,334 11,960
Net Cash / (Gearing) (0.53) (0.56) (0.46)
Interest Coverage
Interest Coverage = EBIT Interest Cost
Note: EBIT = Profit before tax + Interest expense
$m No. of times
2,400 15
1,600 10
800 5
0 0
2015 2016 2017
EBIT 2,152 1,279 705^
Total Interest Cost 223 294 241
Interest Cover 9.66 4.35 2.92
^ Includes the one-off financial penalty from the global resolution and related costs of $619 million.

Cash Flow Coverage
Cash Flow Coverage = Operating Cash Flow + Interest Cost Interest Cost
$m No. of times
1,800 12
1,500 10
1,200 8
900 6
600 4
300 2
0 0
(300) (2)
(600) (4)
2015 2016 2017
Total Interest Expense + Interest Capitalised 223 294 241
Operating Cash Flow + Interest (563) 589 1,619
Cash Flow Coverage (2.53) 2.00 6.71
58 59
Keppel Corporation Limited | Report to Shareholders 2017
Debt Maturity ($m)
< 1 year 1,714 (22%)
1 - 2 years 1,404 (18%)
2 - 3 years 967 (12%)
3 - 4 years 594 (8%)
4 - 5 years 1,613 (21%)
> 5 years 1,501 (19%)
and held as treasury shares. The Company also transferred 5,071,722 treasury shares to employees upon vesting of shares releasedunder the KCL Share Plans and Share Option Scheme. As at the end of the year, the Company had 10,788 treasury shares. Except for the transfer, there was no other sale, transfer, disposal, cancellation and/or use of treasury shares during the year.
Financial ResourcesThe Group continues to be able to tap into the debt capital market at competitive terms.
As part of its liquidity management, the Group has built up adequate cash reserves and short-term marketable securities as well as sufficient undrawn banking facilities and capital market programs. Funding of working capital requirements, capital expenditure and investment needs was made through a mix of short-term money market borrowings, bank loans as well as medium/long term bonds via the debt capital market.
The Group maintains flexibility in funding by ensuring that ample working capital lines are available at any one time. Cash flow, debt maturity profile and overall liquidity position are actively reviewed on an ongoing basis.
As at end-2017, total available credit facilities, including cash at Corporate Treasury, amounted to $11.51 billion (2016: $8.71 billion).
Critical Accounting PoliciesThe Group’s significant accounting policies are discussed in more detail in the notes to the financial statements. The preparation of financial statements requires management to exercise its judgment in the process of applying the accounting policies. It also requires the use of accounting estimates and assumptions which affect the reported amounts of assets, liabilities, income and expenses. Critical accounting estimates and judgment are described below.
Impairment of Loans & ReceivablesThe Group assesses at each balance sheet date whether there is any objective evidence that a loan and receivable is impaired. The Group considers factors such as the probability of insolvency or significant financial difficulties of the debtor and default or significant delay in payments. When there is objective evidence of impairment, the amount and timing of future cash flows are estimated based on historical loss experience for assets with similar credit risk characteristics. The carrying amounts of trade, intercompany and other receivables are disclosed in the balance sheet. As at 31 December 2017, the Group has credit risk exposure to an external group of companies for receivables that are past due.
Financial Capacity
$ million Remarks
Cash at Corporate Treasury 527 23% of total cash of $2.27 billion
Available credit facilities to the Group 10,985 Credit facilities of $12.94 billion, of which $1.95 billion was utilised
Total 11,512

Operating & Financial ReviewFinancial Review & Outlook
60 61
Performance Review
Management has considered any changes in the credit quality of the debtors, the possibility of discontinuance of the projects and the cost incurred to-date when determining the allowance for doubtful receivables and its expected loss. Management performs on-going assessments on the ability of its debtors to repay the amounts owing to the Group. These assessments include the review of the customers’ credit-standing and the possibility of discontinuance of the projects.
Impairment of Available-For-Sale InvestmentsThe Group follows the guidance of FRS 39 in determining whether available-for-sale investments are considered impaired. The Group evaluates, among other factors, the duration and extent to which the fair value of an investment is less than its cost, the financial health of and the near-term business outlook of the investee, including factors such as industry and sector performance, changes in technology and operational and financing cash flows. The fair values of available-for-sale investments are disclosed in the balance sheet.
Impairment of Non-Financial AssetsDetermining whether the carrying value of a non-financial asset is impaired requires an estimation of the value in use of the cash- generating units. This requires the Group to estimate the future cash flows expected from the cash-generating units and an appropriate discount rate in order to calculate the present value of the future cash flows. The carrying amounts of fixed assets, investments in subsidiaries, investments in associates and joint ventures, and intangibles are disclosed in the balance sheet.
Revenue Recognition and Contract CostThe Group recognises contract revenue and contract cost based on the percentage of completion method. The stage of completion is measured in accordance with the accounting policy stated in Note 2(q). Significant assumptions are required in determining the stage of completion, the extent of the contract cost incurred, the estimated total contract revenue and contract cost and the recoverability of the contracts. In making the assumption, the Group evaluates by relying on past experience and the work of engineers.
Revenue from construction contracts is disclosed in Note 22.
Revenue arising from additional claims and variation orders, whether billed or unbilled, is recognised when negotiations have reached an advanced stage such that it is probable that the customer will accept the claims or approve the variation orders, and the amount that it is probable will be accepted by the customer can be measured reliably.
Recoverability of Work-in-Progress Balances in Relation to Offshore & Marine Construction Contracts and Stocks for Sale
Contracts with Sete Brasil (Sete)The Group had previously entered into contracts with Sete for the construction of six rigs for which progress payments from Sete had ceased since November 2014. In April 2016, Sete filed for bankruptcy protection and its authorised representatives had been in discussion with the Group on the eventual completion and delivery of some of the rigs. Management has continually assessed the probable outcomes of these contracts by taking into consideration the progress and status of the discussions and market conditions in Brazil. During the financial year ended 31 December 2017, an expected loss of $81 million was recognised, taking into consideration cost of completion, cost of discontinuance, salvage cost and unpaid progress billings with regards to these rigs, bringing the total loss recognised on these rigs to $309 million.
Other ContractsAs at 31 December 2017, the Group had several rigs/vessels that were under construction for customers or had been completed and were awaiting delivery to the customers. See Note 13 on work-in-progress balances.
During 2017, some of the Group’s customers had requested for further deferral of delivery dates of the rigs/vessels.
Management has assessed each deferred construction project individually to make judgment as to whether the customers will be able to fulfil their contractual obligations and take delivery of the rigs at the revised delivery dates.
Management has also estimated the net realisable values of rigs/vessels under construction as stocks for sale in assessing whether a provision for loss on work-in-progress is necessary.
Management has further assessed if the values of the rigs/vessels would exceed the carrying values of work-in-progress and stocks for sale. Management has estimated, with the assistance of an independent professional firm, the values of the rigs/vessels using Discounted Cash Flow (DCF) calculations that cover each class of rig/vessel under construction. The most significant inputs to the DCF calculations include day rates, utilisation rates, forecasted oil price movements and discount rates.
Income TaxesThe Group has exposure to income taxes in numerous jurisdictions. Significant assumptions are required in determining the provision for income taxes. There are certain transactions and computations for which the ultimate tax determination is uncertain during the ordinary course of business. The Group recognises liabilities for expected tax issues based on estimates of whether additional taxes will be due. Where the final tax outcome of these matters is different from the amounts that were initially recognised, such differences will impact the income tax and deferred tax provisions in the period in which such determination is made. The carrying amounts of taxation and deferred taxation are disclosed in the balance sheet.
Claims, Litigations & ReviewsThe Group entered into various contracts with third parties in its ordinary course of business and is exposed to the risk of claims, litigations, latent defects or review from the contractual parties and/or government agencies. These can arise for various reasons, including change in scope of work, delay and disputes, defective specifications or routine checks etc. The scope, enforceability and validity of any claim, litigation or review may be highly uncertain. In making its judgment as to whether it is probable that any such claim, litigation or review will result in a liability and whether any such liability can be measured reliably, Management relies on past experience and the opinion of legal and technical expertise.

Notes:1 Owned by a Singapore Consortium, which is in turn 90%-owned by the Keppel Group.2 Owned by Keppel Telecommunications & Transportation Ltd, a 79%-owned subsidiary of Keppel Corporation.3 Owned by Keppel Telecommunications & Transportation Ltd (30%) and Keppel Land Limited (5%).4 Public listed company.5 Owned by Keppel Infrastructure Holdings Pte Ltd (49%) and Keppel Infrastructure Trust (51%).6 Owned by Keppel Capital Holdings Pte Ltd (50%) and Keppel Telecommunications & Transportation Ltd (50%).7 Owned by Keppel Land Limited (44%) and Keppel Capital Holdings Pte Ltd (1%).
Updated as at 7 March 2018. The complete list of subsidiaries and significant associated companies is available at www.kepcorp.com.
• Offshore rig design, construction, repair and upgrading
• Ship conversion and repair• Specialised shipbuilding
Offshore & Marine
KEPPEL OFFSHORE &MARINE LTD
100%
Keppel FELS Limited 100%
Keppel Shipyard Limited 100%
Keppel Singmarine Pte Ltd 100%
Keppel LeTourneau 100%
Keppel Nantong Shipyard Company LimitedChina
100%
Offshore Technology Development Pte Ltd
100%
Deepwater Technology Group Pte Ltd
100%
Marine Technology Development Pte Ltd
100%
Keppel AmFELS LLC United States
100%
Keppel FELS Brasil SABrasil
100%
Keppel Philippines Marine Inc The Philippines
98%
Keppel Subic Shipyard IncThe Philippines
86%
Nakilat-Keppel Offshore & Marine Ltd Qatar
20%
Dyna-Mac Holdings Limited4 24%
KEPPEL CORPORATION LIMITED
• Property development• Investments
Property
Keppel Land International Limited Southeast Asia and India
100%
Keppel Land China China
100%
Keppel Bay Pte Ltd 100%
Keppel REIT 4 & 7 45%
KEPPEL LAND LIMITED
100%
• Energy infrastructure• Environmental infrastructure• Infrastructure services• Investments• Logistics and data centres
Infrastructure
KEPPEL CAPITAL HOLDINGSPTE LTD
100%
Keppel REIT Management Limited
100%
Alpha Investment Partners Ltd
100%
Keppel Infrastructure Fund Management Pte Ltd
100%
Keppel DC REIT Management Pte Ltd6
50%
Keppel-KBS US REIT Management Pte Ltd
50%
Keppel-KBS US REIT4 7%
KEPPEL INFRASTRUCTUREHOLDINGS PTE LTD
100%
ENERGY INFRASTRUCTURE
Keppel Gas Pte Ltd 100%
Keppel Electric Pte Ltd 100%
Keppel DHCS Pte Ltd 100%
Keppel Merlimau Cogen Pte Ltd5
49%
ENVIRONMENTAL INFRASTRUCTURE
Keppel Seghers Pte Ltd 100%
INFRASTRUCTURE SERVICES
Keppel Seghers Engineering Singapore Pte Ltd
100%
INVESTMENTS
Keppel Infrastructure Trust4 18%
LOGISTICS & DATA CENTRES
Keppel Logistics Pte Ltd 100%
Keppel Data Centres Holding Pte Ltd
100%
Keppel Logistics (Foshan) Pte Ltd China
70%
Keppel DC REIT3 & 4 35%
KEPPEL TELECOMMUNICATIONS & TRANSPORTATION LTD4
79%
• Asset management• Master development• Investments
Investments
M1 LIMITED2 & 4
19%
SINO-SINGAPORE TIANJIN ECO-CITY INVESTMENT AND DEVELOPMENT CO., LTD1
China 50%
Control & Accounts
Corporate Communications
Strategy & Development
Mergers & Acquisitions/Corporate Development
Human Resources
Legal
Risk & Compliance
Audit
Tax
Treasury
Information Systems
Health, Safety & Environment
GROUP CORPORATE SERVICES
KRISENERGY LTD4
40%Cayman Islands
Group Structure
KEPPEL URBAN SOLUTIONSPTE LTD
100%
60 61
Keppel Corporation Limited | Report to Shareholders 2017

62 63
Governance & SustainabilityGovernance & Sustainability
62
Sustainability Highlights
We place sustainability at the heart of our strategy, delivering solutions for sustainable urbanisation while creating enduring value for our stakeholders – Sustaining Growth, Empowering Lives and Nurturing Communities.
Sustainability Framework
Our commitment to business excellence is driven by our unwavering focus on strong corporate governance and prudent risk management.
Resource efficiency is our responsibility and makes good business sense.
Innovation and delivering quality products and services sharpen our competitive edge.
People are the cornerstoneof our businesses.
As an employer of choice, we are committed to grow and nurture our talent pool through continuous training and development to help our people reach their full potential.
We want to instil a culture of safety so that everyone who comes to work goes home safe.
As a global citizen, Keppel believes that as communities thrive, we thrive.
We engage and nurture communities wherever we are, with the aim of achieving a sustainable future together.
As leaders in our businesses, we support industry initiatives and encourage open dialogue to promote growth.
Sustaining Growth
Empowering Lives
Nurturing Communities
For more information, go to: page 100
For more information, go to: pages 98-99
For more information, go to: pages 64-97
Governance & Sustainability
62

62 63
Keppel Corporation Limited | Report to Shareholders 2017
Managing Sustainability
We drive our businesses to deliver solutions for sustainable urbanisation and create shared value for our stakeholders.
Our Sustainability Framework articulates our commitment to deliver value to all our stakeholders through Sustaining Growth in our businesses, Empowering Lives of people and Nurturing Communities wherever we operate.
Our management systems, policies and guidelines, including our Employee Code of Conduct; Health, Safety and Environment Policy, and Supplier Code of Conduct, translate our principles into practice by setting standards both for our Company and those whom we work with.
We publish sustainability reports annually, and the next report will be published in May 2018. Our sustainability reports draw on internationally-recognised standards of reporting, including the Global Reporting Initiative (GRI), and are externally assured in adherence to the AccountAbility AA1000 Assurance Standard (2008). Since 2017, our report has been brought in line with the new sustainability reporting requirements by the Singapore Exchange.
This section contains a summary of our approach on sustainability issues that are most material to our business and stakeholders.
Management Structure Sustainability issues are managed and communicated at all levels of the Group. The Keppel Corporation Board and management regularly review as well as oversee the
management and monitoring of the material Environmental, Social and Governance (ESG) factors of the Company, and take them into consideration in the determination of the Company's strategic direction and policies.
The Group Sustainability Steering Committee, chaired by Keppel Corporation's CEO Loh Chin Hua and comprising senior management from across the Group, provides guidance on the Group’s sustainability strategy while the Working Committee, comprising discipline-specific working groups, executes and reports on the Group’s efforts.
Material IssuesA robust process was undertaken to identify and prioritise the Company’s material ESG issues. The assessments were based on the foundational principles of inclusivity and materiality outlined in the AccountAbility AA1000 Principles Standard (2008) as well as the GRI Principles for Defining Report Content – stakeholder inclusiveness, sustainability context, materiality and completeness.
The process was supported by an independent consultant and involved stakeholder consultations, workshops for senior management, an assessment of long-term global trends and an internal review of our businesses. The key material ESG issues for Keppel Corporation were reviewed by the Steering and Working Committees in 2017 and deemed to remain relevant.
Stakeholder Engagement Collaboration with stakeholders supports us in addressing sustainability challenges. We promote ongoing communication and active engagement with our stakeholders.
Stakeholder relations, including engagement with customers, employees, investors, media, government agencies and communities where we operate, are managed by departments at the corporate level, as well as by functional divisions and volunteer committees across our business units worldwide.
We also engage with stakeholders on broader issues through our membership and support of multi-stakeholder initiatives. These include Global Compact Network Singapore to advance the United Nations Global Compact initiative and its 10 principles, Singapore Institute of Directors to uphold high standards of corporate governance, as well as Workplace Safety and Health Council to build industry capabilities to better manage safety and health at work.
Best Practices Keppel Corporation has been part of the widely respected Dow Jones Sustainability Index for five consecutive years. We participate in the CDP (formerly Carbon Disclosure Project) and are listed on a number of other sustainability indices and rankings, including MSCI Global Sustainability Index, Euronext Vigeo Eiris Index – World 120 and all four sustainability indices launched by the Singapore Exchange in 2016.
Keppel Corporation was conferred the Best Workforce award and received Special Recognition for Strategy and Sustainability Management at the Sustainable Business Awards 2017. The Awards, organised by Global Initiatives in partnership with PwC Singapore, recognise businesses with sustainable business practices.
Keppel Corporation was also awarded Winner of the inaugural Sustainability Award at the Securities Investors Association (Singapore) 18th Investors' Choice Awards. The Award honours companies with a strong commitment towards corporate responsibility.
Keppel Corporation Material Issues
Tier 1: Issues of Critical Importance
Tier 2: Issues of High Importance
Corporate Governance
Safety & Health
Economic Sustainability
Product Excellence
Environmental Performance
Supply Chain & Responsible Procurement
Community Development
Labour Practices & Human Rights
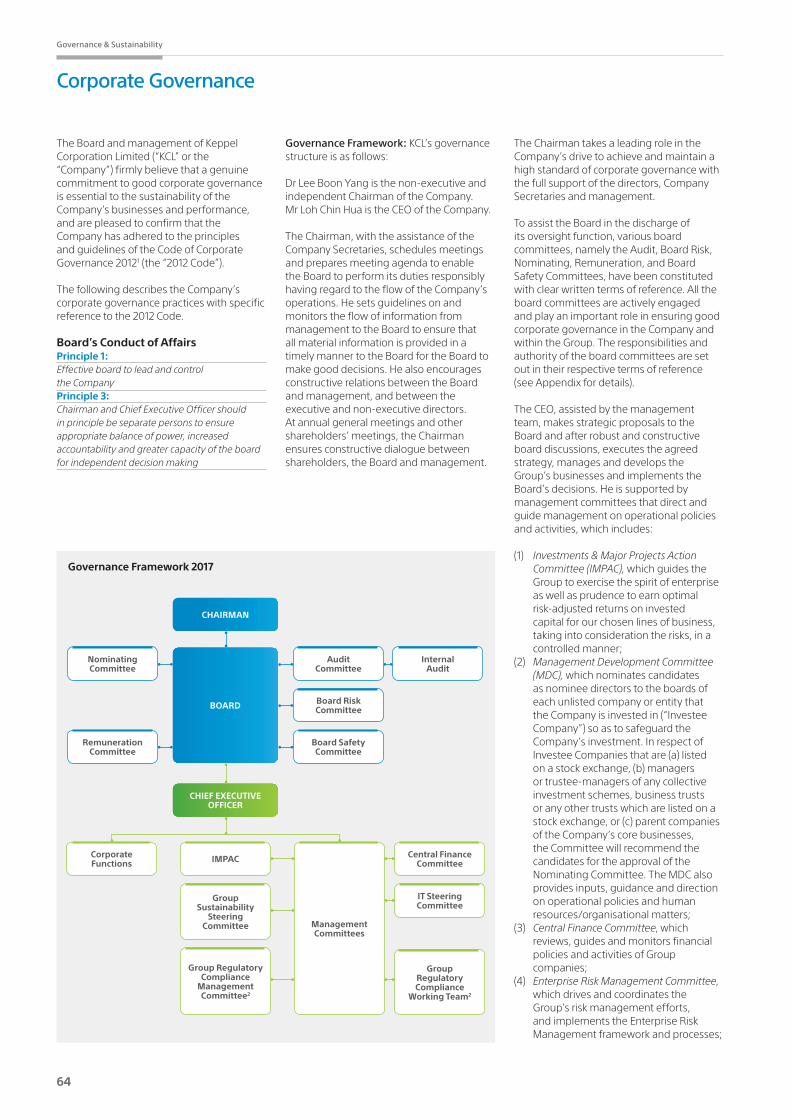
64 65
Governance & Sustainability
Corporate Governance
The Board and management of Keppel Corporation Limited (“KCL” or the “Company”) firmly believe that a genuine commitment to good corporate governance is essential to the sustainability of the Company’s businesses and performance, and are pleased to confirm that the Company has adhered to the principles and guidelines of the Code of Corporate Governance 20121 (the “2012 Code”).
The following describes the Company’s corporate governance practices with specific reference to the 2012 Code.
Board’s Conduct of Affairs Principle 1: Effective board to lead and control the CompanyPrinciple 3: Chairman and Chief Executive Officer should in principle be separate persons to ensure appropriate balance of power, increased accountability and greater capacity of the board for independent decision making
Governance Framework: KCL’s governance structure is as follows:
Dr Lee Boon Yang is the non-executive and independent Chairman of the Company. Mr Loh Chin Hua is the CEO of the Company.
The Chairman, with the assistance of the Company Secretaries, schedules meetings and prepares meeting agenda to enable the Board to perform its duties responsibly having regard to the flow of the Company’s operations. He sets guidelines on and monitors the flow of information from management to the Board to ensure that all material information is provided in a timely manner to the Board for the Board to make good decisions. He also encourages constructive relations between the Board and management, and between the executive and non-executive directors. At annual general meetings and other shareholders’ meetings, the Chairman ensures constructive dialogue between shareholders, the Board and management.
The Chairman takes a leading role in the Company’s drive to achieve and maintain a high standard of corporate governance with the full support of the directors, Company Secretaries and management.
To assist the Board in the discharge of its oversight function, various board committees, namely the Audit, Board Risk, Nominating, Remuneration, and Board Safety Committees, have been constituted with clear written terms of reference. All the board committees are actively engaged and play an important role in ensuring good corporate governance in the Company and within the Group. The responsibilities and authority of the board committees are set out in their respective terms of reference (see Appendix for details).
The CEO, assisted by the management team, makes strategic proposals to the Board and after robust and constructive board discussions, executes the agreed strategy, manages and develops the Group’s businesses and implements the Board’s decisions. He is supported by management committees that direct and guide management on operational policies and activities, which includes:
(1) Investments & Major Projects Action Committee (IMPAC), which guides the Group to exercise the spirit of enterprise as well as prudence to earn optimal risk-adjusted returns on invested capital for our chosen lines of business, taking into consideration the risks, in a controlled manner;
(2) Management Development Committee (MDC), which nominates candidates as nominee directors to the boards of each unlisted company or entity that the Company is invested in (“Investee Company”) so as to safeguard the Company’s investment. In respect of Investee Companies that are (a) listed on a stock exchange, (b) managers or trustee-managers of any collective investment schemes, business trusts or any other trusts which are listed on a stock exchange, or (c) parent companies of the Company’s core businesses, the Committee will recommend the candidates for the approval of the Nominating Committee. The MDC also provides inputs, guidance and direction on operational policies and human resources/organisational matters;
(3) Central Finance Committee, which reviews, guides and monitors financial policies and activities of Group companies;
(4) Enterprise Risk Management Committee, which drives and coordinates the Group’s risk management efforts, and implements the Enterprise Risk Management framework and processes;
Governance Framework 2017
Internal Audit
Audit Committee
Nominating Committee
Board Risk Committee
Board Safety Committee
Remuneration Committee
CHIEF EXECUTIVE OFFICER
CHAIRMAN
BOARD
Corporate Functions IMPAC
Management Committees
Central Finance Committee
Group Sustainability
Steering Committee
IT Steering Committee
Group Regulatory Compliance
Management Committee2
Group Regulatory Compliance
Working Team2

64 65
Keppel Corporation Limited | Report to Shareholders 2017
(5) Group Regulatory Compliance Management Committee (Group RCMC), which articulates the Group’s commitment to regulatory compliance, directs and supports the development of over-arching compliance policies and guidelines, and facilitates the implementation and sharing of policies and procedures across the Group2;
(6) Group Regulatory Compliance Working Team (Group RCWT), which supports the Group RCMC and oversees the development and review of over-arching compliance policies and guidelines for the Group, as well as reviewing training and communication programmes2;
(7) Keppel IT Steering Committee, which provides strategic information technology (IT) leadership and ensures IT strategy alignment in achieving business strategies; and
(8) Group Sustainability Steering Committee, which sets the sustainability strategy and leads performance in key focus areas.
Board MattersRole: The principal functions of the Board are to:
• decide on matters in relation to the Group’s activities which are of a significant nature, including decisions on strategic directions and guidelines and the approval of periodic plans and major investments and divestments;
• oversee the business and affairs of the Company, establish, with management, the strategies and financial objectives to be implemented by management, and monitor the performance of management;
• set the Company’s values and standards (including ethical standards);
• oversee processes for evaluating the adequacy of internal controls, risk management, financial reporting and compliance, and satisfy itself as to the adequacy of such processes;
• assume responsibility for corporate governance; and
• consider sustainability issues such as environmental and social factors as part of its strategic formulation.
Board Strategic Review: The Board periodically reviews and approves the Group’s strategic plans. In FY 2014, the Board approved the Group’s Vision 20203 which sets out the vision, operating principles and values of the Group, and the roadmap4 to take the Group’s businesses into 2020 to achieve faster growth, build a stronger Keppel that fully captures the significant synergies within and among its Group companies, and fully develop the potential of its people.
Review Process: A process is in place to support the Board in reviewing and monitoring the Group’s strategic plans, including providing directors with the necessary context and opportunity to undertake effective and robust deliberation and debate. In this regard, a two-day off-site board strategy meeting is organised annually for in-depth discussion on strategic issues and direction of the Group. This is followed by an update of each business unit’s strategic plans for alignment with the Group’s strategy. To support the Board’s oversight of the implementation of the strategic plans, one business unit is invited to each quarterly Board meeting to present on its plans and current challenges, and to provide the Board an opportunity to perform an in-depth review into each of the Group’s core businesses.
Independent Judgment: All directors are expected to exercise independent judgment in the best interests of the Company. This is one of the performance criteria for the peer and self assessment on the effectiveness of the individual directors. Based on the results of the peer and self assessment carried out by the directors for FY 2017, all directors have discharged this duty consistently well.
Conflicts of Interest: Every director is required to declare any conflict of interest in a transaction or proposed transaction with the Company as soon as is practicable after the relevant facts have come to his/her knowledge. On an annual basis, each director is also required to submit details of his/her associates for the purpose of monitoring interested persons transactions.
Meetings: The Board meets six times a year and as warranted by particular circumstances. Board meetings are scheduled and circulated to the directors prior to the start of the financial year to allow directors to plan ahead to attend such meetings, so as to maximise participation. Telephonic attendance and conference via audio-visual communication at board meetings are allowed under the Company’s constitution. Further, the non-executive directors meet without the presence of management after each board meeting as well as on a need-be basis. The number
of board and board committee meetings held in FY 2017, as well as the attendance of each Board member at these meetings, are disclosed in Table 1 on page 66 of this report.
If a director were unable to attend a board or board committee meeting, he/she would still receive all the papers and materials for discussion at that meeting. He/she would review them and advise the Chairman or board committee chairman of his/her views and comments on the matters to be discussed, so that they may be conveyed to other members at the meeting.
Internal Limits of Authority: The Company has adopted internal guidelines setting forth matters that require board approval. Under these guidelines, (a) new investments or increase in investments, (b) acquisition and disposal of assets and (c) capital equipment purchase and/or lease, exceeding $30 million by any Group company (not separately listed), and all commitments to term loans and lines of credit from banks and financial institutions by the Company, require the approval of the Board. Each Board member has equal responsibility to oversee the business and affairs of the Company. Management, on the other hand, is responsible for the day-to-day operation and administration of the Company in accordance with the policies and strategy set by the Board.
Director Orientation: A formal letter is sent to newly-appointed directors upon their appointment explaining their duties and obligations as a board director. All newly-appointed directors receive a director tool-kit and undergo a comprehensive orientation programme which includes site visits and management presentations on the Group’s businesses, strategic plans and objectives.
Training: The directors are provided with continuing education in areas such as directors’ duties and responsibilities, corporate governance, changes in financial reporting standards, changes in the Companies Act, continuing listing obligations and industry-related matters, so as to update and refresh them on matters that may affect or enhance their performance as board or board committee
1 The Code of Corporate Governance 2012 issued by the Monetary Authority of Singapore on 2 May 2012.2 The Group RCMC and Group RCWT were set up in October 2015 and operationalised in 2016.3 With effect from FY 2014, and following a review and update in FY 2017, the vision of the Company is to be
a global company at the forefront of its chosen industries, shaping the future for the benefit of all its stakeholders – Sustaining Growth, Empowering Lives and Nurturing Communities. Guided by our operating principles and core values, the Company’s mission is to deliver our solutions for sustainable urbanisation profitably, safely and responsibly.
4 This roadmap includes four broad areas for sustainable growth: (1) Business: Setting the overarching strategies, targets and key actions to be undertaken by the business units; (2) People: Building a robust succession pipeline and continued strong employee satisfaction; (3) Process: Pursuing excellence in safety, productivity and innovation; and (4) Corporate Citizenry: Formalising and further organising community outreach efforts to positively impact communities in which the Group operates.
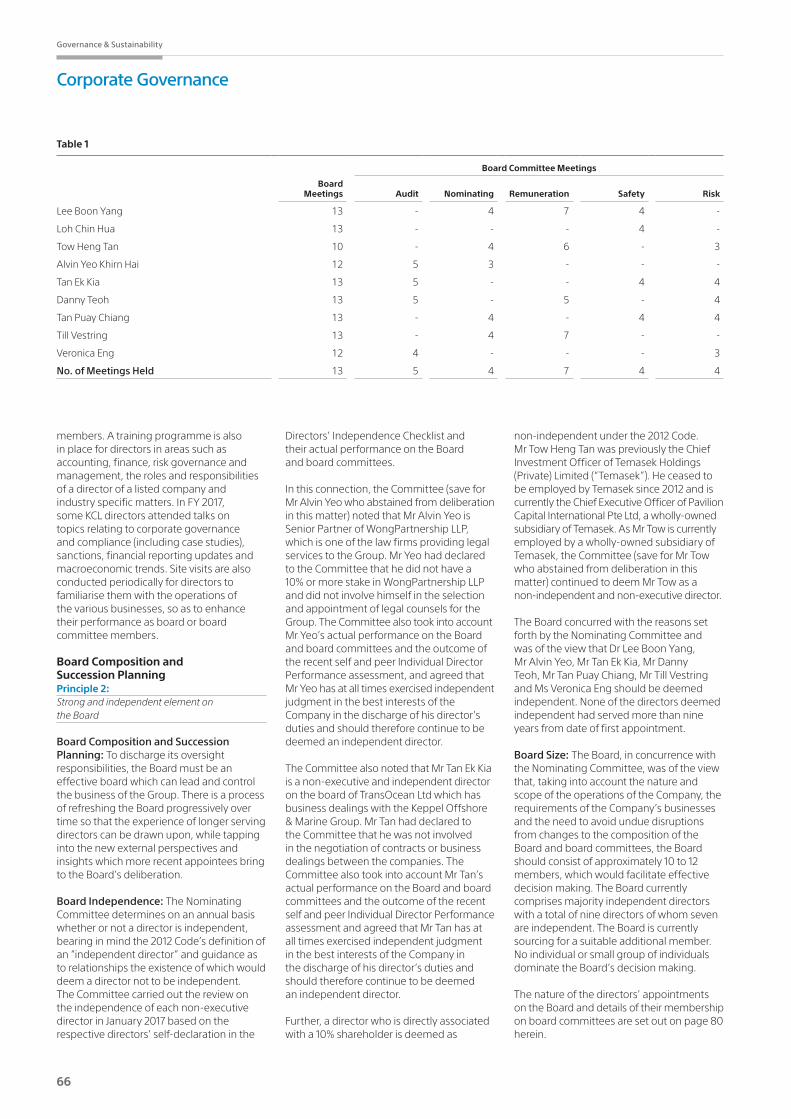
66 67
Governance & Sustainability
Corporate Governance
members. A training programme is also in place for directors in areas such as accounting, finance, risk governance and management, the roles and responsibilities of a director of a listed company and industry specific matters. In FY 2017, some KCL directors attended talks on topics relating to corporate governance and compliance (including case studies), sanctions, financial reporting updates and macroeconomic trends. Site visits are also conducted periodically for directors to familiarise them with the operations of the various businesses, so as to enhance their performance as board or board committee members.
Board Composition and Succession Planning Principle 2: Strong and independent element on the Board
Board Composition and Succession Planning: To discharge its oversight responsibilities, the Board must be an effective board which can lead and control the business of the Group. There is a process of refreshing the Board progressively over time so that the experience of longer serving directors can be drawn upon, while tapping into the new external perspectives and insights which more recent appointees bring to the Board’s deliberation.
Board Independence: The Nominating Committee determines on an annual basis whether or not a director is independent, bearing in mind the 2012 Code’s definition of an “independent director” and guidance as to relationships the existence of which would deem a director not to be independent. The Committee carried out the review on the independence of each non-executive director in January 2017 based on the respective directors’ self-declaration in the
Directors’ Independence Checklist and their actual performance on the Board and board committees.
In this connection, the Committee (save for Mr Alvin Yeo who abstained from deliberation in this matter) noted that Mr Alvin Yeo is Senior Partner of WongPartnership LLP, which is one of the law firms providing legal services to the Group. Mr Yeo had declared to the Committee that he did not have a 10% or more stake in WongPartnership LLP and did not involve himself in the selection and appointment of legal counsels for the Group. The Committee also took into account Mr Yeo’s actual performance on the Board and board committees and the outcome of the recent self and peer Individual Director Performance assessment, and agreed that Mr Yeo has at all times exercised independent judgment in the best interests of the Company in the discharge of his director’s duties and should therefore continue to be deemed an independent director.
The Committee also noted that Mr Tan Ek Kia is a non-executive and independent director on the board of TransOcean Ltd which has business dealings with the Keppel Offshore & Marine Group. Mr Tan had declared to the Committee that he was not involved in the negotiation of contracts or business dealings between the companies. The Committee also took into account Mr Tan’s actual performance on the Board and board committees and the outcome of the recent self and peer Individual Director Performance assessment and agreed that Mr Tan has at all times exercised independent judgment in the best interests of the Company in the discharge of his director’s duties and should therefore continue to be deemed an independent director.
Further, a director who is directly associated with a 10% shareholder is deemed as
non-independent under the 2012 Code. Mr Tow Heng Tan was previously the Chief Investment Officer of Temasek Holdings (Private) Limited (“Temasek”). He ceased to be employed by Temasek since 2012 and is currently the Chief Executive Officer of Pavilion Capital International Pte Ltd, a wholly-owned subsidiary of Temasek. As Mr Tow is currently employed by a wholly-owned subsidiary of Temasek, the Committee (save for Mr Tow who abstained from deliberation in this matter) continued to deem Mr Tow as a non-independent and non-executive director.
The Board concurred with the reasons set forth by the Nominating Committee and was of the view that Dr Lee Boon Yang, Mr Alvin Yeo, Mr Tan Ek Kia, Mr Danny Teoh, Mr Tan Puay Chiang, Mr Till Vestring and Ms Veronica Eng should be deemed independent. None of the directors deemed independent had served more than nine years from date of first appointment.
Board Size: The Board, in concurrence with the Nominating Committee, was of the view that, taking into account the nature and scope of the operations of the Company, the requirements of the Company’s businesses and the need to avoid undue disruptions from changes to the composition of the Board and board committees, the Board should consist of approximately 10 to 12 members, which would facilitate effective decision making. The Board currently comprises majority independent directors with a total of nine directors of whom seven are independent. The Board is currently sourcing for a suitable additional member. No individual or small group of individuals dominate the Board’s decision making.
The nature of the directors’ appointments on the Board and details of their membership on board committees are set out on page 80 herein.
Board Committee Meetings
BoardMeetings Audit Nominating Remuneration Safety Risk
Lee Boon Yang 13 - 4 7 4 -
Loh Chin Hua 13 - - - 4 -
Tow Heng Tan 10 - 4 6 - 3
Alvin Yeo Khirn Hai 12 5 3 - - -
Tan Ek Kia 13 5 - - 4 4
Danny Teoh 13 5 - 5 - 4
Tan Puay Chiang 13 - 4 - 4 4
Till Vestring 13 - 4 7 - -
Veronica Eng 12 4 - - - 3
No. of Meetings Held 13 5 4 7 4 4
Table 1

66 67
Keppel Corporation Limited | Report to Shareholders 2017
Board Competency: The Nominating Committee is satisfied that the Board and the board committees comprise directors who, as a group, provide an appropriate balance and diversity of skills, experience, gender, knowledge of the Group, core competencies such as accounting or finance, business or management experience, human resources, risk management, technology, mergers and acquisitions, legal, international perspective, industry knowledge, strategic planning experience and customer-based experience or knowledge, required for the Board and the board committees to be effective.
In this respect, the Nominating Committee recognises the merits of gender diversity in relation to the composition of the Board and, in identifying suitable candidates for new appointment to the Board, would ensure that female candidates are included for consideration. Having said that, gender is but one aspect of diversity and new directors will continue to be selected based on objective criteria set as part of the process for appointment of new directors and Board succession planning. In FY 2017, there was one female director out of a total of nine directors.
Board Information: The Board and management fully appreciate that fundamental to good corporate governance is an effective and robust Board whose members engage in open and constructive debate and challenge management on its assumptions and proposals, and that for this to happen, the Board, in particular, the non-executive directors, must be kept well-informed of the Company’s business and affairs, and be knowledgeable about the industry in which the businesses operate. The Company has therefore adopted initiatives to put in place processes to ensure that the non-executive directors are well supported by accurate, complete and timely information, have unrestricted access to management, and have sufficient time and resources to discharge their oversight function effectively.
These initiatives include regular informal meetings for management to brief the directors on prospective deals and potential developments at an early stage before formal board approval is sought, and the circulation of relevant information on business initiatives, industry developments, and analyst and press commentaries on matters in relation to the Company or the industries in which it operates. A two-day off-site board strategy meeting is organised annually for in-depth discussion on strategic issues and direction of the Group, to give the non-executive directors a better understanding of the Group and its businesses, and to provide an opportunity
for the non-executive directors to familiarise themselves with the management team so as to facilitate the Board’s review of the Group’s succession planning and leadership development programme.
Non-executive Directors’ Meetings: The non-executive directors set aside time at each scheduled quarterly meeting to meet without the presence of management to discuss matters such as board processes, corporate governance initiatives, matters which they wish to discuss during the board off-site strategy meeting, succession planning and leadership development, and performance management and remuneration matters. Such meetings may also be scheduled on a need-be basis.
Board MembershipPrinciple 4: Formal and transparent process for the appointment and re-appointment of directors to the Board
Nominating CommitteeThe Company has established a Nominating Committee (NC) to, among other things, make recommendations to the Board on all board appointments and oversee the Board and senior management’s succession and leadership development plans. The NC comprises entirely of non-executive directors, four out of five of whom (including the Chairman) are independent, namely:
• Mr Tan Puay Chiang Independent Chairman
• Dr Lee Boon Yang Independent Member
• Mr Tow Heng Tan Non-Executive and Non-Independent Member
• Mr Alvin Yeo Independent Member
• Mr Till Vestring Independent Member
The responsibilities of the NC are set out on pages 79 and 80 herein.
Process for appointment of new directors and Board succession planning The NC is responsible for reviewing the succession plans for the Board. In this regard, it has put in place a formal process for the renewal of the Board and the selection of new directors. The NC leads the process and makes recommendations to the Board as follows:
(a) NC reviews annually the balance and diversity of skills, experience, gender and knowledge required by the Board and the size of the Board which would facilitate decision making.
(b) In the light of such review and in consultation with management, the NC assesses if there is any inadequate representation in respect of any of those attributes and if so, determines the role and the desirable competencies for a particular appointment.
(c) External help (for example, from the Singapore Institute of Directors, search consultants, or through open advertisement) may be used to source for potential candidates if need be. Directors and management may also make recommendations.
(d) NC meets with the short-listed candidate(s) to assess suitability and to ensure that the candidate(s) is/are aware of the expectations and the level of commitment required.
(e) NC makes recommendations to the Board for approval.
The Board believes that orderly succession and renewal is achieved as a result of careful planning, where the appropriate composition of the Board is continually under review.
Criteria for Appointment of New DirectorsAll new appointments are subject to the recommendation of the NC based on the following objective criteria:
(1) Integrity(2) Independent mindedness(3) Diversity – Possess core competencies
that meet the needs of the Company and complement the skills and competencies of the existing directors on the Board
(4) Able to commit time and effort to carry out duties and responsibilities effectively
(5) Track record of making good decisions(6) Experience in high-performing
companies(7) Financially literate
Re-nomination of DirectorsThe NC is also charged with the responsibility of re-nomination having regard to the director’s contribution and performance (such as attendance, preparedness, participation and candour), with reference to the results of the assessment of the performance of the individual director by his/her peers.
The directors submit themselves for re-nomination and re-election at regular intervals of at least once every three years. Pursuant to the Company’s constitution, one-third of the directors retire from office at the Company’s annual general meeting, and a newly-appointed director must submit himself/herself for re-election at the annual general meeting immediately following his/her appointment.
68 69
Governance & Sustainability
Annual Review of Board Committees CompositionThe NC reviews the composition of the board committees on an annual basis to ensure that they comprise members with the necessary qualifications and skills to discharge their responsibilities effectively.
Annual Review of Directors’ IndependenceThe NC is also charged with determining the “independence” status of the directors annually. Please refer to page 66 herein on the basis of the NC’s determination as to whether a director should or should not be deemed independent.
Annual Review of Directors’ Time CommitmentsThe NC has adopted internal guidelines addressing competing time commitments that are faced when directors serve on multiple boards and/or have other principal commitments.
The NC determines annually whether a director with other listed company board representations and/or other principal commitments is able to and has been adequately carrying out his/her duties as a director of the Company. The NC takes into account the results of the assessment of the effectiveness of the individual director, the level of commitment required of the director’s other principal commitments, and the respective directors’ actual conduct and participation on the Board and board committees, including availability and attendance at regular scheduled meetings and ad-hoc meetings, in making this determination.
In respect of FY 2017, the NC was of the view that each director has given sufficient time and attention to the affairs of the Company and has been able to discharge his/her duties as director effectively. The NC noted that based on the attendance of board and board committee meetings during the year, all the directors were able to participate in at least a substantial number of such meetings to carry out their duties. The NC also noted that, based on the Independent Co-ordinator’s Report on individual director assessment for FY 2017, all the directors performed well. The NC was therefore satisfied that in FY 2017, where a director had other listed company board representations and/or other principal commitments, the director was able and had been adequately carrying out his/her duties as a director of the Company.
Nominee Director PolicyAt the recommendation of the NC, the Board approved the adoption of the KCL Nominee Director Policy in January 2009. For the purposes of the policy, a “Nominee
Director” is a person who, at the request of KCL, acts as director (whether executive or non-executive) on the board of another company or entity (“Investee Company”) to oversee and monitor the activities of the relevant Investee Company so as to safeguard KCL’s investment in the company.
The purpose of the policy is to highlight certain obligations of a person while acting in his/her capacity as a Nominee Director. The policy also sets out the internal process for the appointment and resignation of a Nominee Director. The policy would be reviewed and amended as required to take into account current best practices and changes in the law and stock exchange requirements.
Key Information Regarding DirectorsThe following key information regarding directors is set out in the following pages of this Annual Report:
Pages 20 to 23: Academic and professional qualifications, board committees served on (as a member or Chairman), date of first appointment as director, date of last re-election as director, directorships or chairmanships both present and past held over the preceding five years in other listed companies and other major appointments, whether appointment is executive or non-executive, whether considered by the NC to be independent; and
Pages 103 to 104: Shareholding in the Company and its subsidiaries.
Board PerformancePrinciple 5: Formal assessment of the effectiveness of the Board and Board Committees and the contribution by each director to the effectiveness of the Board
The Board has implemented formal processes for assessing the effectiveness of the Board as a whole and its board committees, the contribution by each individual director to the effectiveness of the Board, as well as the effectiveness of the Chairman of the Board.
Independent Co-ordinator: To ensure that the assessments are done promptly and fairly, the Board has appointed an independent third party (the “Independent Co-ordinator”) to assist in collating and analysing the returns of the board members. Mrs Fang Ai Lian, former Chairman, Ernst & Young and Great Eastern Holdings Ltd, and currently Advisor to Far East Organisation, was appointed for this role. Mrs Fang Ai Lian does not have business relationships or any other connections with the Company which may affect her independent judgment.
Formal Process and Performance Criteria: The evaluation processes and performance criteria are disclosed in the Appendix to this report.
Objectives and Benefits: The board assessment exercise provides an opportunity to obtain constructive feedback from each director on whether the Board’s procedures and processes allow him/her to discharge his/her duties effectively and the changes which should be made to enhance the effectiveness of the Board and/or board committees. The assessment exercise also helps the directors to focus on their key responsibilities. The individual director assessment exercise allows for peer review, with a view to raising the quality of board members. It also assists the NC in determining whether to re-nominate directors who are due for retirement at the next annual general meeting, and in determining whether directors with multiple board representations are nevertheless able to and have adequately discharged their duties as directors of the Company.
Access to Information Principle 6: Board members to have complete, adequate and timely information
As a general rule, board papers are required to be distributed to the directors at least seven days before the board meeting so that the members may better understand the matters prior to the board meeting and discussion may be focused on questions that the directors may have. Directors are provided with tablet devices to enable them to access and read the board papers. However, sensitive matters may be tabled at the meeting itself or discussed without any papers being distributed. Managers who can provide additional insights into the matters at hand would be present at the relevant time during the board meeting. The directors are also provided with the names and contact details of the Company’s senior management and the Company Secretaries to facilitate direct access to senior management and the Company Secretaries.
The Company fully recognises that the flow of relevant information on an accurate and timely basis is critical for the Board to be effective in the discharge of its duties. Management is therefore expected to provide the Board with accurate information in a timely manner concerning the Company’s progress or shortcomings in meeting its strategic business objectives or financial targets, and other information relevant to the strategic issues facing the Company.
Management also provides the Board members with management accounts
Corporate Governance
68 69
Keppel Corporation Limited | Report to Shareholders 2017
on a monthly basis and as the Board may require from time to time. Such reports keep the Board informed, on a balanced and understandable basis, of the Group’s performance, financial position and prospects.
The Company Secretaries administer, attend and prepare minutes of board proceedings. They assist the Chairman to ensure that board procedures (including but not limited to assisting the Chairman to ensure timely and good information flow to the Board and board committees, and between senior management and the non-executive directors, and facilitating orientation and assisting in the professional development of the directors) are followed and regularly reviewed to ensure effective functioning of the Board, and that the Company’s constitution and relevant rules and regulations, including requirements of the Companies Act, Securities & Futures Act and Listing Manual of the Singapore Exchange Securities Trading Limited (“SGX”), are complied with. They also assist the Chairman and the Board to implement and strengthen corporate governance practices and processes with a view to enhancing long-term shareholder value. They are also the primary channel of communication between the Company and the SGX.
The appointment and removal of the Company Secretaries are subject to the approval of the Board.
Subject to the approval of the Chairman, the directors, whether as a group or individually, may seek and obtain independent professional advice to assist them in their duties, at the expense of the Company.
Remuneration MattersPrinciple 7: The procedure for developing policy on executive remuneration and for fixing remuneration packages of individual directors should be formal and transparentPrinciple 8: The level and structure of director fees are aligned with the long-term interest of the Company and appropriate to attract, retain and motivate directors to provide good stewardship of the Company
The level and structure of key management remuneration are aligned with the long-term interest and risk policies of the Company and appropriate to attract, retain and motivate key management to successfully manage the Company Principle 9: There should be clear disclosure of remuneration policy, level and mix of remuneration, and procedure for setting remuneration
Remuneration CommitteeThe Remuneration Committee (RC) comprises entirely non-executive directors, three out of four of whom (including the Chairman) are independent; namely:
• Mr Till Vestring Independent Chairman
• Dr Lee Boon Yang Independent Member• Mr Danny Teoh Independent Member• Mr Tow Heng Tan
Non-Executive and Non-Independent Member
The RC is responsible for ensuring a formal and transparent procedure for developing policy on executive remuneration and for determining the remuneration packages of individual directors and senior management. The RC assists the Board to ensure that remuneration policies and practices are sound in that they are able to attract, retain and motivate without being excessive, and thereby maximise shareholder value. The RC recommends to the Board for endorsement a framework of remuneration (which covers all aspects of remuneration including directors’ fees, salaries, allowances, bonuses, grant of shares and benefits in kind) and the specific remuneration packages for each director and the key management personnel. The RC also reviews the remuneration of senior management and administers the KCL Share Option Scheme in respect of the outstanding options granted prior to the termination of the KCL Share Option Scheme in 2010, the KCL Restricted Share Plan (the “KCL RSP”) and the KCL Performance Share Plan (the “KCL PSP”). In addition, the RC reviews the Company’s obligations arising in the event of termination of the executive directors’ and key management personnel’s contract of service, to ensure that such contracts of service contain fair and reasonable termination clauses which are not overly generous.
The RC has access to expert advice from external remuneration consultants where required. In FY 2017, the RC sought views on market practice and trends from external remuneration consultants, Aon Hewitt. The RC undertook a review of the independence and objectivity of the external remuneration consultants through discussions with the external remuneration consultants, and has confirmed that the external remuneration consultants had no relationships with the Company which would affect their independence and objectivity.
Annual Remuneration ReportPolicy in respect of Non-Executive Directors’ RemunerationEach non-executive director’s remuneration comprises a basic fee and an additional
fee for services performed on board committees. The Chairman of each board committee is also paid a higher fee compared with the members of the respective committees in view of the greater responsibility carried by that office. The non-executive directors participated in additional ad-hoc meetings with management during the year and are not paid for attending such meetings. Executive directors are not paid directors’ fees.
The RC, in consultation with Aon Hewitt, conducted a review of the non-executive directors’ fee structure in 2017. The review took into account a variety of factors, including prevailing market practices and referencing directors’ fees against comparable benchmarks (locally and in the region), as well as the roles and responsibilities of the Board and board committees. Recognising that directors have ongoing oversight responsibilities towards the Company, a revised directors’ fee structure was developed, comprising only basic fees for the Board, as well as additional fees for services performed on board committees. Attendance fees were removed from the non-executive directors’ fee structure from 2017 onwards. The 2017 total fees for non-executive directors are lower than 2016’s total fees (before the 10% voluntary fee reduction agreed to in 2016).
The directors’ fee structure is set out in Table 2 on page 70 of this report.
Each of the non-executive directors (including the Chairman) will receive 70% of his/her total directors’ fees in cash (“Cash Component”) and 30% in the form of KCL shares (“Remuneration Shares”) (both amounts subject to adjustment as described below). The actual number of Remuneration Shares, to be purchased from the market on the first trading day immediately after the date of the Annual General Meeting (“Trading Day”) for delivery to the respective non-executive directors, will be based on the market price of the Company’s shares on the SGX on the Trading Day. The actual number of Remuneration Shares will be rounded down to the nearest thousand and any residual balance will be paid in cash. Such incorporation of an equity component in the total remuneration of the non-executive directors is intended to achieve the objective of aligning the interests of the non-executive directors with those of the shareholders’ and the long-term interests of the Company. The aggregate directors’ fees for non-executive directors is subject to shareholders’approval at the Annual General Meeting. The Chairman and the non-executive directors will abstain from voting, and will procure their respective associates to abstain from voting in respect of this resolution.

70 71
Governance & Sustainability
Remuneration policy in respect of Executive Directors and other Key Management PersonnelThe Company advocates a performance-based remuneration system that is highly flexible and responsive to the market, Company’s, business unit’s and individual employee’s performance, and is aligned with shareholders’ interests.
In designing the remuneration structure, the RC seeks to ensure that the level and mix of remuneration is competitive, relevant and appropriate in finding a balance between current versus long-term remuneration, and between cash versus equity incentive remuneration.
In 2016/2017, the RC undertook a comprehensive review of the total remuneration structure. With the assistance of Aon Hewitt, the RC revised the total remuneration structure to reflect the following four key objectives:
(a) Shareholder Alignment: To incorporate performance measures that are aligned to shareholders’ interests
(b) Long-term Orientation: To motivate employees to drive sustainable long-term growth
(c) Simplicity: To ensure that the remuneration structure is easy to understand and communicate to stakeholders
(d) Synergy: To facilitate talent mobility and enhance collaboration across businesses
The revised total remuneration structure comprises three components; that is, annual fixed cash, annual performance bonus, and the KCL Share Plans. The annual fixed cash component comprises the annual basic salary plus any other fixed allowances, which the Company benchmarks with the
relevant industry market median. The size of the Company's annual performance bonus pot is determined by the Group’s financial and non-financial performance, and is distributed to employees based on their individual performance. The KCL Share Plans are in the form of two share plans approved by shareholders, the KCL RSP and the KCL PSP. A portion of the annual performance bonus is granted in the form of deferred shares that are awarded under the KCL RSP. The KCL PSP comprises performance targets determined on an annual basis. The KCL RSP and KCL PSP are long-term incentive plans which vest over a longer term horizon. Executives who have a greater ability to influence Group outcomes have a greater proportion of their overall remuneration at risk.
The RC exercises broad discretion and independent judgement in ensuring that the amount and mix of remuneration is aligned with the interests of shareholders and promotes the long-term success of the Company. The mix of fixed and variable reward is considered appropriate for the Group and for each individual role.
The remuneration structure is directly linked to corporate and individual performance, both in terms of financial and non-financial performance. This link is achieved in the following ways:
(a) by placing a significant portion of executives’ remuneration at risk (“At Risk component”) and subject to a vesting schedule;
(b) by incorporating appropriate key performance indicators (“KPIs”) for awarding of annual performance bonus:(i) There are four scorecard areas
that the Company has identified as key to measuring the performance of the Group – (i) Financial and Business Drivers; (ii) Process;
(iii) Stakeholders; and (iv) People. Some of the key sub-targets within each of the scorecard areas include key financial indicators, safety goals, risk management, compliance and controls measures, corporate social responsibilities activities, employee engagement, talent development and succession planning;
(ii) The four scorecard areas have been chosen because they support how the Group achieves its strategic objectives. The framework provides a link for staff to understand how they contribute to each area of the scorecard, and therefore to the Company’s overall strategic goals. This is designed to achieve a consistent approach and understanding across the Group. The RC reviews and approves the scorecard annually;
(c) by selecting performance conditions for the KCL PSP awards, such as Total Shareholder Return, Return on Capital Employed and Net Profit that are aligned with shareholder interests;
(d) by requiring those KPIs or conditions to be met in order for the At Risk components of remuneration to be awarded or to vest; and
(e) by forfeiting the At Risk components of remuneration when those KPIs or conditions are not met at a satisfactory level.
The RC also recognises the need for a reasonable alignment between risk and remuneration to discourage excessive risk taking. Therefore, in determining the remuneration structure, the RC had taken into account the risk policies and risk tolerance of the Group as well as the time horizon of risks, and incorporated risk-adjustments into the remuneration structure through several initiatives, including but not limited to:
Basic Fee (per annum)
Board Chairman $750,000 (all-in)
Board Member $108,000
Additional Fees for Membership in Board Committees (per annum)
Chairman Member
Audit Committee $67,000 $36,000
Board Risk Committee $67,000 $36,000
Remuneration Committee $47,000 $31,000
Board Safety Committee $47,000 $31,000
Nominating Committee $40,000 $24,000
Table 2
Corporate Governance
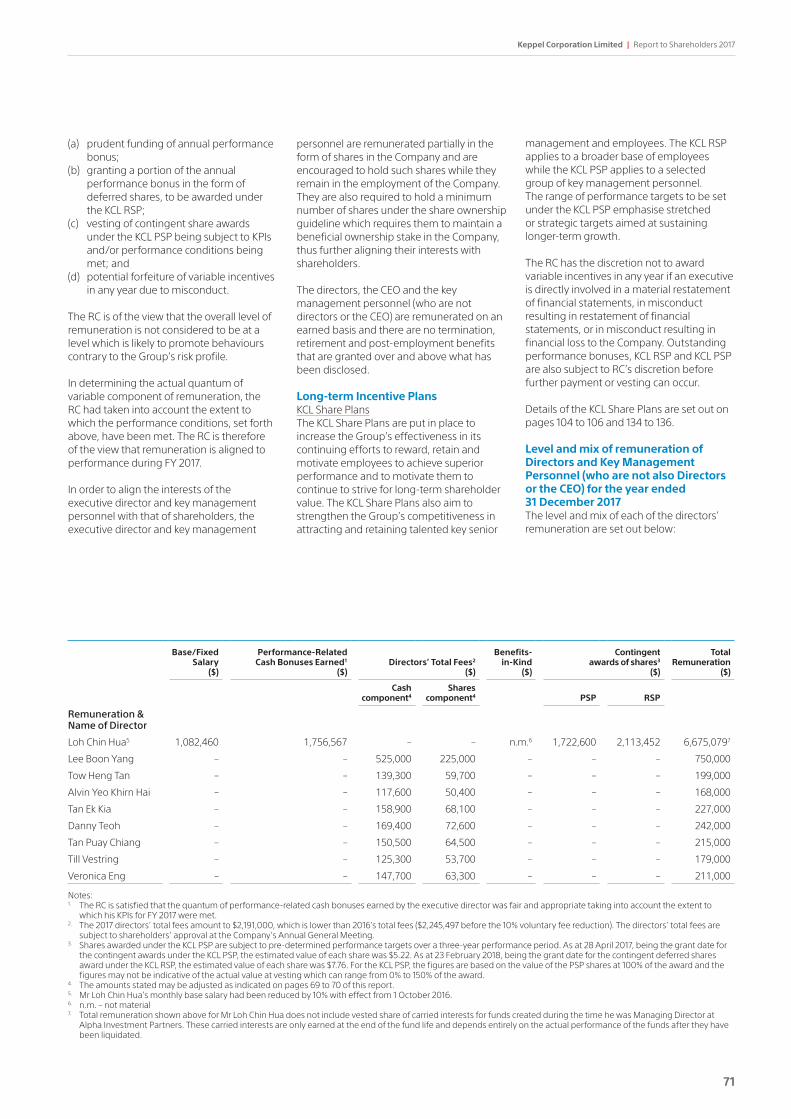
70 71
Keppel Corporation Limited | Report to Shareholders 2017
(a) prudent funding of annual performance bonus;
(b) granting a portion of the annual performance bonus in the form of deferred shares, to be awarded under the KCL RSP;
(c) vesting of contingent share awards under the KCL PSP being subject to KPIs and/or performance conditions being met; and
(d) potential forfeiture of variable incentives in any year due to misconduct.
The RC is of the view that the overall level of remuneration is not considered to be at a level which is likely to promote behaviours contrary to the Group’s risk profile.
In determining the actual quantum of variable component of remuneration, the RC had taken into account the extent to which the performance conditions, set forth above, have been met. The RC is therefore of the view that remuneration is aligned to performance during FY 2017.
In order to align the interests of the executive director and key management personnel with that of shareholders, the executive director and key management
personnel are remunerated partially in the form of shares in the Company and are encouraged to hold such shares while they remain in the employment of the Company. They are also required to hold a minimum number of shares under the share ownership guideline which requires them to maintain a beneficial ownership stake in the Company, thus further aligning their interests with shareholders.
The directors, the CEO and the key management personnel (who are not directors or the CEO) are remunerated on an earned basis and there are no termination, retirement and post-employment benefits that are granted over and above what has been disclosed.
Long-term Incentive PlansKCL Share PlansThe KCL Share Plans are put in place to increase the Group’s effectiveness in its continuing efforts to reward, retain and motivate employees to achieve superior performance and to motivate them to continue to strive for long-term shareholder value. The KCL Share Plans also aim to strengthen the Group’s competitiveness in attracting and retaining talented key senior
Notes:1. The RC is satisfied that the quantum of performance-related cash bonuses earned by the executive director was fair and appropriate taking into account the extent to
which his KPIs for FY 2017 were met.2. The 2017 directors’ total fees amount to $2,191,000, which is lower than 2016’s total fees ($2,245,497 before the 10% voluntary fee reduction). The directors’ total fees are
subject to shareholders’ approval at the Company’s Annual General Meeting. 3. Shares awarded under the KCL PSP are subject to pre-determined performance targets over a three-year performance period. As at 28 April 2017, being the grant date for
the contingent awards under the KCL PSP, the estimated value of each share was $5.22. As at 23 February 2018, being the grant date for the contingent deferred shares award under the KCL RSP, the estimated value of each share was $7.76. For the KCL PSP, the figures are based on the value of the PSP shares at 100% of the award and the figures may not be indicative of the actual value at vesting which can range from 0% to 150% of the award.
4. The amounts stated may be adjusted as indicated on pages 69 to 70 of this report.5. Mr Loh Chin Hua’s monthly base salary had been reduced by 10% with effect from 1 October 2016. 6. n.m. – not material7. Total remuneration shown above for Mr Loh Chin Hua does not include vested share of carried interests for funds created during the time he was Managing Director at
Alpha Investment Partners. These carried interests are only earned at the end of the fund life and depends entirely on the actual performance of the funds after they have been liquidated.
Base/Fixed Salary
($)
Performance-Related Cash Bonuses Earned1
($)Directors’ Total Fees2
($)
Benefits- in-Kind
($)
Contingent awards of shares3
($)
Total Remuneration
($)
Cash component4
Shares component4 PSP RSP
Remuneration & Name of Director
Loh Chin Hua5 1,082,460 1,756,567 – – n.m.6 1,722,600 2,113,452 6,675,0797
Lee Boon Yang – – 525,000 225,000 – – – 750,000
Tow Heng Tan – – 139,300 59,700 – – – 199,000
Alvin Yeo Khirn Hai – – 117,600 50,400 – – – 168,000
Tan Ek Kia – – 158,900 68,100 – – – 227,000
Danny Teoh – – 169,400 72,600 – – – 242,000
Tan Puay Chiang – – 150,500 64,500 – – – 215,000
Till Vestring – – 125,300 53,700 – – – 179,000
Veronica Eng – – 147,700 63,300 – – – 211,000
management and employees. The KCL RSP applies to a broader base of employees while the KCL PSP applies to a selected group of key management personnel. The range of performance targets to be set under the KCL PSP emphasise stretched or strategic targets aimed at sustaining longer-term growth.
The RC has the discretion not to award variable incentives in any year if an executive is directly involved in a material restatement of financial statements, in misconduct resulting in restatement of financial statements, or in misconduct resulting in financial loss to the Company. Outstanding performance bonuses, KCL RSP and KCL PSP are also subject to RC’s discretion before further payment or vesting can occur.
Details of the KCL Share Plans are set out on pages 104 to 106 and 134 to 136.
Level and mix of remuneration of Directors and Key Management Personnel (who are not also Directors or the CEO) for the year ended 31 December 2017The level and mix of each of the directors’ remuneration are set out below:

72 73
Governance & Sustainability
Notes:8. The value of the shares vested under KCL PSP and RSP is computed based on the market price of the shares when the shares are credited to the employee’s CDP account.
The RC is satisfied that the value of the shares vested under the KCL PSP and RSP to the executive director was fair and appropriate taking into account the extent to which his KPIs and performance conditions for FY 2017 were met.
9. Refers to contingent shares awarded under the KCL PSP.10. Refers to one-time contingent shares awarded under the KCL PSP – TIP.
PSP Awards
Vesting Date
Contingent Awards
of PSP Shares
Number of PSP Shares
Vested
Value of PSP Shares
Vested ($)8
RSP Awards
Vesting Date
Contingent Awards
of RSP Shares
Number of RSP Shares
Vested
Value of RSP Shares
Vested ($)8
Name of Executive Director
Loh Chin Hua 2014 Awards
28 Feb 2017
0 to 270,000
0 0 2014 Awards
27 Feb 2015 26 Feb 2016 9 Mar 2017
150,000 50,00050,00050,000
438,000265,500337,500
2015 Awards
28 Feb 2018
0 to 330,000
– – 2015 Awards
26 Feb 2016 9 Mar 2017
28 Feb 2018
150,000 50,00050,000
–
265,500337,500
–
2016 Awards
28 Feb 2019
0 to 450,000
9 – – 2016 Awards
9 Mar 2017 28 Feb 2018 28 Feb 2019
180,000 60,000––
405,000––
28 Feb 2022
0 to1,125,000
10
2017 Awards
28 Feb 2020
0 to 495,000
– – 2018 Awards
28 Feb 201828 Feb 201928 Feb 2020
272,352
–––
–––
PSP and RSP Shares granted and vested for the Executive Director are shown below:
Notes:11. The RC is satisfied that the quantum of performance-related bonuses earned by the key management personnel was fair and appropriate taking into account the extent to
which their KPIs for FY 2017 were met.12. Included one-time performance shares awarded under the KCL PSP–TIP. As at 28 April 2017, being the grant date, the estimated value of each share granted in respect of
the contingent awards under the KCL PSP-TIP was $0.87.13. Ms Tan Hua Mui, Christina served as CEO, Keppel Capital and Managing Director, Alpha Investment Partners concurrently in 2017. The total remuneration shown above for
Ms Tan does not include vested share of carried interests for funds created in her role as Managing Director at Alpha Investment Partners. These carried interests are only earned at the end of the fund life and depend entirely on the actual performance of the funds after they have been liquidated.
14. Mr Ang Wee Gee ceased employment with the Company with effect from 1 January 2018. 15. Mr Ong Leng Yeow, Chris assumed the role of Acting CEO, Keppel Offshore & Marine with effect from 1 April 2017 and the role of CEO, Keppel Offshore & Marine with effect
from 1 July 2017. His full year remuneration is reported in the table above. Mr Ong succeeded Mr Chow Yew Yuen who retired with effect from 1 April 2017. For the period from 1 January to 31 March 2017, Mr Chow earned fixed salary of below $250,000.
16. On Keppel Telecommunications & Transportation Ltd (“KTT”) share based remuneration scheme and KCL PSP–TIP. As at 28 April 2017, being the grant date, the estimated value of each share granted in respect of the contingent awards under the KTT PSP was $1.48 respectively. As at 23 February 2018, being the grant date for the contingent deferred shares award under the KTT RSP, the estimated value of each share was $1.54.
Base/Fixed Salary
Performance-Related Bonuses Earned11
Benefits- in-Kind Contingent awards of shares
PSP12 RSP
Remuneration Band & Name of Key Management Personnel
Above $3,000,000 to $3,250,000
Chan Hon Chew 20% 26% n.m. 24% 30%
Ong Tiong Guan 18% 28% n.m. 21% 33%
Above $2,500,000 to $2,750,000
Tan Hua Mui, Christina13 20% 27% n.m. 22% 31%
Above $2,250,000 to $2,500,000
Ang Wee Gee14 37% 63% n.m. – –
Above $1,500,000 to $1,750,000
Ong Leng Yeow, Chris15 22% 18% n.m. 39% 21%
Above $1,250,000 to $1,500,000
Pang Thieng Hwi, Thomas16 26% 32% n.m. 12% 30%
The total remuneration paid to the key management personnel (who are not directors or the CEO) in FY 2017 was $14,039,417. The level and mix of each of the key management personnel (who are not also directors or the CEO) in bands of $250,000 are set out below:
Corporate Governance

72 73
Keppel Corporation Limited | Report to Shareholders 2017
Remuneration of employees who are immediate family members of a Director or the Chief Executive OfficerNo employee of the Company and its subsidiaries was an immediate family member of a director or the CEO and whose remuneration exceeded $50,000 during the financial year ended 31 December 2017. “Immediate family member” means the spouse, child, adopted child, step-child, brother, sister and parent.
Details of the KCL Share PlansThe KCL Share Plans, which have been approved by shareholders of the Company, are administered by the RC. Please refer to pages 104 to 106 and 134 to 136 of this Annual Report for details on the KCL Share Plans.
Accountability and Audit Principle 10: The Board should present a balanced and understandable assessment of the Company’s performance, position and prospects Principle 12: Establishment of Audit Committee with written terms of reference
The Board is responsible for providing a balanced and understandable assessment of the Company’s and Group’s performance, position and prospects, including interim and other price sensitive public reports, and reports to regulators (if required).
The Board has embraced openness and transparency in the conduct of the Company’s affairs, whilst preserving the commercial interests of the Company. Financial reports and other price sensitive information are disseminated to shareholders through announcements via SGXNET, press releases, the Company’s website, public webcast and media and analyst briefings.
The Company’s Annual Report is accessible on the Company’s website, and can be viewed or downloaded from the Annual Report microsite at www.kepcorp.com/annualreport2017/. In line with the Company’s drive towards sustainable development, the Company encourages shareholders to read the Annual Report on the Company’s website. Shareholders may, however, request for a physical copy at no cost.
Management provides all members of the Board with management accounts which present a balanced and understandable assessment of the Company’s and Group’s performance, position and prospects on a monthly basis and as the Board may require from time to time. Such reports keep the board members informed of the Company’s and Group’s performance, position and prospects.
The Board, supported by the Audit Committee (AC) and Board Risk Committee (BRC), oversees the Company’s Keppel’s System of Management Controls Framework (the “Framework”), which outlines the Company’s internal control and risk management processes and procedures to, among others, ensure compliance with legislative and regulatory requirements. Details of the Framework are set out on pages 74 and 75 of this Annual Report. Audit CommitteeThe AC comprises the following non-executive directors, all of whom are independent:
• Mr Danny Teoh Independent Chairman
• Mr Alvin Yeo Independent Member
• Ms Veronica Eng Independent Member
• Mr Tan Ek Kia Independent Member
Mr Danny Teoh and Ms Veronica Eng have recent and relevant accounting and related financial management expertise and in-depth experience. Mr Alvin Yeo has in-depth knowledge of the responsibilities of the AC, and practical experience and knowledge of the issues and considerations affecting the Committee from serving on the audit committee of other listed companies. Mr Tan Ek Kia, who is a seasoned executive in the oil and gas and petrochemicals businesses and had held senior positions in Shell, has sufficient financial management knowledge and experience to discharge his responsibilities as a member of the Committee. Mr Danny Teoh, Mr Tan Ek Kia and Ms Veronica Eng are also members of BRC, with Ms Veronica Eng being the Chairman of the BRC.
None of the members of the AC were partners or directors of the Company’s existing external auditors within the last 12 months and none of the members of the AC hold any financial interest in the auditing firm.
The AC’s primary role is to assist the Board to ensure integrity of financial reporting and that there is in place sound internal control systems. The Committee’s responsibilities are set out on page 79 herein.
The AC has explicit authority to investigate any matter within its responsibilities, full access to and co-operation by management and full discretion to invite any director or executive officer to attend its meetings, and reasonable resources (including access to external consultants) to enable it to discharge its functions properly. The Company has an internal audit team, which together with the external auditors, report their findings and recommendations to the AC independently.
The AC met with the external auditors five times, and with the internal auditors five times during the year, and at least one of these meetings was conducted without the presence of management.
The AC reviewed and approved the Group internal auditor’s plan to ensure that the risk-based plan sufficiently covered the effectiveness of controls to mitigate the significant risks of the Company. Such significant controls comprise financial, operational, compliance and IT controls. All significant audit findings and recommendations put up by the internal and the external auditors were forwarded to the AC, and discussed at AC meetings.
The AC also reviewed and approved the Group external auditor’s audit plan for the year. The AC also undertook a review of the independence and objectivity of the external auditors through discussions with the external auditors, as well as reviewing the non-audit fees awarded to them, and has confirmed that the non-audit services performed by the external auditors would not affect their independence. For details of fees payable to the auditors in respect of audit and non-audit services, please refer to Note 24 of the Notes to the Financial Statements on page 155.
The Company has complied with Rules 712, and Rule 715 read with 716 of the SGX Listing Manual in relation to its auditing firms.
The AC also reviewed the adequacy of the internal audit function and is satisfied that the team is adequately resourced and has appropriate standing within the Company. The internal audit team attends the Company’s and the Group’s key strategy sessions and executive meetings, and is staffed with professionals with sufficient expertise in corporate governance, risk management, internal controls, and other relevant disciplines. The AC also reviewed the training costs and programs attended by the internal audit team to ensure that their technical knowledge and skill sets remain current and relevant.
The AC has reviewed the “Keppel Whistle-Blower Policy” (the “Policy”) which provides for the mechanisms by which employees and other persons may, in confidence, raise concerns about possible improprieties in business conduct, and was satisfied that arrangements are in place for the independent investigation of such matters and for appropriate follow-up action. To facilitate the management of incidences of alleged fraud or other misconduct, the AC is guided by a set of guidelines to ensure proper conduct of investigations and appropriate closure actions following completion of the investigations, including

74 75
Governance & Sustainability
administrative, disciplinary, civil and/or criminal actions, and remediation of control weaknesses that perpetrated the fraud or misconduct so as to prevent a recurrence.
In addition, the AC reviews the Policy yearly to ensure that it remains current. The details of the Policy are set out on page 82 hereto.
On a quarterly basis, management reported to the AC the interested person transactions (“IPTs”) in accordance with the Company’s Shareholders’ Mandate for IPT. The IPTs were reviewed by the internal auditors. All findings were reported during AC meetings.
Financial MattersChanges to accounting standards and accounting issues which have a direct impact on the financial statements were reported to the AC, and highlighted by the external auditors in their quarterly meetings with the AC. In addition, the AC members are invited to the Company’s annual finance seminars where relevant changes to the accounting standards that will impact the Keppel Group of Companies are shared by, and discussed with accounting practitioners from one of the leading accounting firms.
During the year, the AC performed independent review of the financial statements of the Company before the announcement of the Company’s quarterly and full-year results. In the process, the Committee reviewed the key areas of management judgment applied for adequate provisioning and disclosure, critical accounting policies and any significant changes made that would have a material impact on the financials.
In its review of the financial statements of the Group and the Company for FY 2017, the AC reviewed the key areas of management’s estimates and judgment applied for key financial issues, including valuation and assessment of impairment of assets, recoverability of construction contracts, global resolution with criminal authorities in relation to corrupt payments and revenue recognition, that might affect the integrity of the financial statements. The AC also considered the report from the external auditors, including their findings on the key audit matters as set out in the independent auditor’s report for the financial year ended 31 December 2017.
In addition to the findings of the external auditors, the AC took into consideration the methodology applied in determining the valuation and value-in-use of different asset classes, including the reasonableness of the estimates and key assumptions used. The AC also reviewed management’s assessment of recoverability of work-in-progress balances on outstanding construction
contracts, including expectation of probable outcomes, assessment on whether there was a potential for any additional provision in relation to the corrupt payments, as well as estimates of the total costs and physical proportion of work completed in determining the percentage-of-completion. Furthermore, external independent valuations as well as opinions from internal and external legal counsel, where applicable, were considered when reviewing management’s assessment.
The AC concurs with the methodology, accounting treatment and estimates adopted, as well as the disclosures made in the financial statements for each of the key audit matters set out by the external auditors in their report.
Risk Management and Internal ControlsPrinciple 11: Sound system of risk management and internal controls
The Board Risk Committee (BRC) comprises the following non-executive directors, four out of five of whom (including the Chairman) are independent and the remaining director being a non-executive director who is independent of management, namely:
• Ms Veronica Eng Independent Chairman
• Mr Danny Teoh Independent Member
• Mr Tow Heng Tan Non-executive and Non-independent Member
• Mr Tan Puay Chiang Independent Member
• Mr Tan Ek Kia Independent Member
Ms Veronica Eng was a Founding Partner of Permira until September 2015 and had extensive experience in a wide range of roles in relation to its funds’ investments across sectors and geographies. She served on the board of Permira and its Executive Committee, chaired the Investment Committee and was the Fund Minder to various Permira funds. In addition, she had oversight of Permira’s firm-wide risk management as well as its operations in Asia.
Mr Danny Teoh, who is the Chairman of the AC, is the second member of the BRC. Mr Danny Teoh was the Managing Partner of KPMG Singapore from October 2005 to October 2010. He was also the Head of Audit and Risk Advisory Services practices in Singapore as well as in Asia, and served on its global team.
The third member is Mr Tow Heng Tan, who has deep management experience
from his extensive business career spanning the management consultancy, investment banking and stock-broking industries. Mr Tow was previously the Chief Investment Officer of Temasek.
The fourth member is Mr Tan Puay Chiang, who held various executive management roles in his 37-year career with Mobil and later ExxonMobil, and has in-depth knowledge and experience in the oil and gas industry and wide international exposure.
The fifth member is Mr Tan Ek Kia, who is a seasoned executive in the oil and gas and petrochemicals businesses and had held senior positions in Shell including Vice President (Ventures and Developments) of Shell Chemicals, Asia Pacific and Middle East region, Managing Director (Exploration and Production) of Shell Malaysia, Chairman of Shell North East Asia and Managing Director of Shell Nanhai Ltd.
The BRC reviews and guides management in the formulation of risk policies and processes to effectively identify, evaluate and manage significant risks, to safeguard shareholders’ interests and the Group’s assets. The Committee reports to the Board on critical risk issues, material matters, findings and recommendations. The detailed responsibilities of this Committee are disclosed on page 79 herein.
The Group’s approach to risk management is set out in the “Risk Management” section on pages 91 to 93 of this Annual Report. The Group is guided by a set of Risk Tolerance Guiding Principles, as disclosed on page 91.
The Group also has in place a Risk Management Assessment Framework, which was established to facilitate the Board’s assessment on the adequacy and effectiveness of the Group’s risk management system. The framework lays out the governing policies, processes and systems pertaining to each of the key risk areas of the Group and assessments are made on the adequacy and effectiveness of the Group’s risk management system in managing each of these key risk areas.
KCL’s Group Internal Audit also conducts regular reviews of the adequacy and effectiveness of the Group’s material internal controls, including financial, operational, compliance and IT controls, and risk management. Any material non-compliance or failures in internal controls and recommendations for improvements are reported to the AC. The AC also reviews the effectiveness of the actions taken by management on the recommendations made by Group Internal Audit and the external auditors.
Corporate Governance

74 75
Keppel Corporation Limited | Report to Shareholders 2017
The Group also has in place Keppel’s System of Management Controls Framework (the “Framework”) outlining the Group’s internal control and risk management processes and procedures. The Framework comprises three Lines of Defence towards ensuring the adequacy and effectiveness of the Group’s system of internal controls and risk management.
Under the first Line of Defence, management is required to ensure good corporate governance through the implementation and management of policies and procedures relevant to the Group’s business scope and environment. Such policies and procedures govern financial, operational, information technology and regulatory compliance matters and are reviewed and updated periodically. Compliance governance is governed by the respective regulatory compliance management committees and working teams. Employees are also guided by the Group’s Core Values and expected to comply strictly with Keppel’s Code of Conduct.
Under the second Line of Defence, significant business units are required to conduct a self-assessment exercise on an annual basis. This exercise requires such business units to assess the status of their respective internal controls and risk management via self-assessment. Where
required, action plans are developed to remedy identified control gaps. Under the Group’s Enterprise Risk Management Framework, significant risks areas of the Group are also identified and assessed, with systems, policies and processes put in place to manage and mitigate the identified risks. Regulatory Compliance supports and works alongside business management to ensure relevant policies, processes and controls are effectively designed, managed and implemented to ensure compliance risks and controls are effectively managed.
Under the third Line of Defence, to assist the Group to ascertain the adequacy and effectiveness of the Group’s internal controls, business units are required to provide the Group with written assurances as to the adequacy and effectiveness of their system of internal controls and risk management. Such assurances are also sought from the Group’s internal and external auditors based on their independent assessments.
The Board, supported by the AC and BRC, oversees the Group’s system of internal controls and risk management.
Enhancements to Compliance ProgrammeIn December 2017, a wholly-owned subsidiary, Keppel Offshore and Marine (KOM), reached a global resolution with
the criminal authorities in the United States, Brazil and Singapore in relation to corrupt payments made by KOM’s former agent in Brazil, which were made with knowledge or approval of former KOM executives.
This section provides an overview of the improvements and enhancements that have been made to strengthen Keppel’s compliance programme since 2015, following a review of our compliance programme. Further details of our compliance initiatives are set out on pages 94 to 95 of this Annual Report. The Company is committed to a continuous review and, where necessary and appropriate, further improvements and enhancements to the Group’s compliance programme will be made.
The Group has taken the following steps since 2015 to enhance its internal controls, policies and procedures:
(i) substantially enhanced its Code of Conduct and implemented a compliance governance structure through the formation of a Regulatory Compliance Management Committee and Regulatory Compliance Working Team, bringing together senior management, compliance personnel, and other core function leads to discuss compliance enhancements and address compliance issues as they arise;
Keppel's System of Management Controls
Syst
em
s
Policies
People
Pro
cesse
s
Board Oversight Board of Directors
Assurance3 Business Unit Representation
Internal Audit
External Audit
Management & Assurance Frameworks2 Self-Assessment
ProcessEnterprise Risk Management
IT Governance Framework
Regulatory Compliance
Business Governance/ Rules of Governance1
Policy Management
Compliance Governance
Financial Governance
Operational Governance
Core Values, Corporate & Employee Conduct
4

76 77
Governance & Sustainability
(ii) improved and streamlined its due diligence processes and procedures with respect to intermediaries, including examining the business justification of the engagement;
(iii) implemented a new Agent Fees Policy setting forth limits, guidelines and authority for review and approval of agent fees including specific parameters to be applied when engaging the services of an agent;
(iv) established a Supplier Code of Conduct to integrate Keppel’s sustainability principles across our supply chain, and positively influence the environmental, social and governance performance of our suppliers. Suppliers of the Group are expected to abide by the Supplier Code of Conduct, which covers areas pertaining to business conduct (including specific anti-bribery provisions), labour practices, safety and health, and environmental management;
(v) committed to compliance, from the top level down, through regular workshops provided and scheduled for senior management, improved communications by management, and Code of Conduct, anti-corruption and compliance training for our employees, including comprehensive annual compliance-related e-learning and attestations;
(vi) ongoing recruitment of additional professional and experienced compliance officers in each business unit. This dedicated independent Group-wide compliance function has reporting lines independent of business divisions. The Head of the Group's compliance function has a primary line of reporting to the Chairman of the BRC, with an administrative reporting line to the CFO of the Company;
(vii) increased headcount of internal audit personnel by more than 20% across the Group, reduced the length of the internal audit cycle to a three-year cycle (resulting in more frequent audits), strengthened our team with the recruitment of professionals with deep anti-corruption audit experience, and enhanced our Whistle-Blower Policy with centralised procedures and established local toll-free whistle-blower hotlines for Singapore, Brazil, China, USA, Vietnam and Indonesia respectively;
The Group's Enhanced Compliance ProgrammeThe Group’s compliance programme is and will be subjected to a periodic review to ensure it meets the following standards, i.e. that:
1. Board and Senior Management Commitment
The Group’s senior management, including members of the Board, provide continuous, clear and explicit support to the compliance programme.
2. Policies and Procedures The Group continuously implements
and communicates its corporate policy against violations of any anti-corruption laws. This policy has been and will continue to be documented in writing, include appropriate measures to reduce the prospect of violations of anti-corruption laws, and encourage and support the observance of compliance policies and procedures by personnel at all levels of the Group. These anti-corruption policies and procedures apply to all directors, officers and employees and, where necessary and appropriate, outside parties acting on behalf of Keppel, including but not limited to, agents and intermediaries, consultants, representatives, partners and suppliers.
Individuals at all levels of Keppel comply with Keppel’s Code of Conduct and its compliance policies and procedures. Such policies and procedures address, among other areas:
a) gifts;b) hospitality, entertainment, and
expenses;c) agent fees;d) political contributions;e) charitable donations and
sponsorships; andf) facilitation payments.
The Group ensures that:
a) books, records and accounts are in reasonable detail, and accurately and fairly reflect the transactions and disposition of assets; and
b) the Group develops and maintains a system of internal accounting controls, sufficient to provide reasonable assurance that:i. transactions are performed in
accordance with the Group’s general guidelines or specific authorisation;
ii. transactions are recorded as necessary to permit preparation of financial statements in conformity with generally accepted accounting principles or any other criteria applicable to such statements, and to maintain accountability for assets;
iii. access to assets shall only be permitted in accordance with the
Group’s general guidelines or specific authorisation; and
iv. the recorded accountability for assets shall be compared with the existing assets at reasonable intervals and appropriate action be taken with respect to any differences.
3. Periodic Risk-based Review The Group continues to enhance its
compliance policies and procedures on the basis of a periodic risk assessment to ensure their continued effectiveness, taking into account relevant developments such as international and industry standards, and addressing the individual circumstances of the Group, and in particular corruption risks, including but not limited to its geographical organisation and sectors of industrial operation.
4. Training and Orientation The Group continuously ensures that
its compliance policies and procedures are communicated effectively to all employees, including officers, directors, and where necessary and appropriate agents, and business partners. These mechanisms include:
a) periodic focused ‘gate-keeper’ training for all senior management members (including directors), employees in positions of leadership, and targeted training for employees in positions otherwise exposed to corruption risks, and where necessary and appropriate, compliance training for agents and business partners; and
b) corresponding certifications by all such senior management members (including directors), employees, agents and business partners, certifying conformity with training requirements.
5. Internal Reporting, Communication and Investigation
The Group maintains an effective system for the internal reporting/communication of potential violations of compliance policies and procedures and applicable laws, that ensures as far as possible confidentiality to the whistleblower.
The Group maintains a reliable and effective process for receiving internal reports/communications with sufficient resources to respond and document allegations of violations of compliance policies and procedures and applicable law. When necessary, the Group undertakes independent investigations of the alleged violations.
Corporate Governance

76 77
Keppel Corporation Limited | Report to Shareholders 2017
6. Enforcement and Discipline The Group maintains and, where
necessary, improves its mechanisms designed to effectively enforce its compliance policies and procedures including, where appropriate, the imposition of disciplinary measures in the case of violations.
The Group institutes disciplinary measures with reference to, among other things, violations of compliance policies and procedures, and applicable law by its senior management (including directors) and employees. Such procedures should be applied consistently and fairly, regardless of the position held by, or the perceived importance of the senior management member (including directors) or employee. Where misconduct is discovered, measures are taken promptly to cease the misconduct or irregularities, and remedy the harm resulting from such misconduct.
7. Third-party Relationships The Group continues to implement the
following procedures with reference to its agents and business partners:
a) due diligence relating to the hiring of third-parties;
b) appropriate oversight of third-parties; and
c) seeking reciprocal commitments regarding ethical conduct from third-parties, associates and business partners.
When necessary, the Group includes in contracts with third-parties, agents and business partners, anti-corruption provisions, which may include the following:
a) commitment to act in accordance with applicable laws;
b) right to conduct audits of the books and records of third-parties, agents or business partners; and
c) right to terminate a contract due to violations of compliance policies and procedures or any applicable anti-corruption law by any third-party, agent or business partner.
8. Mergers, Acquisitions and Corporate Restructuring
The Group implements policies and procedures aimed at identifying misconduct, irregularities, or the existence of vulnerabilities in potential new entities in the context of mergers, acquisitions and corporate restructuring.
The Group applies its compliance codes, policies and procedures in a speedy and efficient manner to newly acquired
businesses or entities, and conducts training for new employees, senior management (including directors), agents, and business partners.
9. Monitoring and Developments The Group conducts continuous
monitoring of its compliance programme to enhance its effectiveness in preventing and detecting violations of its compliance policies and procedures and applicable law.
Annual AssuranceThe Board has received assurance from CEO, Mr Loh Chin Hua and Chief Financial Officer, Mr Chan Hon Chew, that, amongst others:
(a) the financial records of the Group have been properly maintained and the financial statements give a true and fair view of the operations and finances of the Group;
(b) the internal controls of the Group are adequate and effective to address the financial, operational, compliance and IT risks which the Group considers relevant and material to its current business scope and environment and that they are not aware of any material weaknesses in the system of internal controls; and
(c) they are of the view that the Group’s risk management system is adequate and effective.
Based on the review of the Group’s governing framework, systems, policies and processes in addressing the key risks under the Group’s Enterprise Risk Management Framework, the monitoring and review of the Group’s overall performance and representation from the management, the Board, with the concurrence of the BRC, is of the view that, as at 31 December 2017, the Group’s risk management system is adequate and effective.
Based on the Group’s framework of management control, the internal control policies and procedures established and maintained by the Group, and the regular audits, monitoring and reviews performed by the internal and external auditors, the Board, with the concurrence of the AC, is of the opinion that, as at 31 December 2017, the Group’s internal controls are adequate and effective to address the financial, operational, compliance and IT risks which the Group considers relevant and material to its current business scope and environment.
The system of internal controls and risk management established by the Group provides reasonable, but not absolute, assurance that the Group will not be adversely
affected by any event that can be reasonably foreseen as it strives to achieve its business objectives. However, the Board also notes that no system of internal controls and risk management can provide absolute assurance in this regard, or absolute assurance against the occurrence of material errors, poor judgment in decision making, human error, losses, fraud or other irregularities.
Internal AuditPrinciple 13: Effective and independent internal audit function that is adequately resourced
The Company has an in-house internal audit function that supports the Group ("Group Internal Audit"). The role of Group Internal Audit is to provide independent assurance to the AC to ensure that the Company maintains a sound system of internal controls. Group Internal Audit adopts a risk-based approach to evaluate the adequacy and effectiveness of key controls and procedures when performing audits of high-risk areas. They also undertake investigations as directed by the AC.
Staffed by suitably qualified executives, Group Internal Audit has direct access to the AC and unrestricted access to all the Group’s documents, records, properties and personnel. The Head of Group Internal Audit’s primary line of reporting is to the Chairman of the AC, with an administrative reporting line to the CEO of the Company.
The AC approves the hiring, removal, evaluation and compensation of the Head of Group Internal Audit.
As a member of the Institute of Internal Auditors (“IIA”), Group Internal Audit is guided by the Code of Ethics and the International Standards for the Professional Practice of Internal Auditing set by the IIA. External quality assessment reviews are carried out at least once every five years by qualified professionals, with the last assessment conducted in 2016. The results re-affirmed that the internal audit activity conforms to the International Standards. Group Internal Audit staff perform a yearly declaration of independence and confirm their adherence to Keppel’s Code of Conduct as well as the Code of Ethics established by the IIA, from which the principles of objectivity, competence, confidentiality and integrity are based.
During the year, Group Internal Audit adopted a risk-based auditing approach that focuses on key risks, including financial, operational, compliance and information technology risks. An annual audit plan is developed using a structured risk and control assessment framework. Audits are planned based on the results of the assessment, with priority given to auditing the areas of highest

78 79
Governance & Sustainability
risk within the Company. All Group Internal Audit’s reports are submitted to the AC for deliberation with copies of these reports extended to the Chairman, CEO and relevant senior management personnel. In addition, Group Internal Audit’s summary of findings and recommendations are discussed at the AC meetings. To ensure timely and adequate closure of audit findings, the status of implementation of the actions agreed by management is tracked and discussed with the AC.
Shareholder Rights and Communication with ShareholdersPrinciple 14: Fair and equitable treatment of shareholders and protection of shareholders’ rights Principle 15: Regular, effective and fair communication with shareholdersPrinciple 16: Greater shareholder participation at Annual General Meetings
In addition to the matters mentioned above in relation to “Access to Information”, the Company’s Group Corporate Communications Department (with assistance from the Group Finance and Group Legal Departments, when required) regularly communicates with shareholders and receives and attends to their queries and concerns.
The Company treats all its shareholders fairly and equitably and keeps all its shareholders and other stakeholders informed of its corporate activities, including changes in the Company or its business which would be likely to materially affect the price or value of its shares, on a timely basis.
The Company has in place an Investor Relations Policy which sets out the principles and practices that the Company applies in order to provide shareholders and prospective investors with information necessary to make well-informed investment decisions and to ensure a level playing field. The Investor Relations Policy is published on the Company’s website at www.kepcorp.com.
The Company employs various platforms to effectively engage the shareholders and the investment community, with an emphasis on timely, accurate, fair and transparent disclosure of information. Engagement with shareholders and other stakeholders takes many forms, including “live” webcasts of quarterly results and presentations, e-mail communications, publications and content on the Company’s website as well as through facility visits, where stakeholders may raise any queries or concerns that they may have. The Company’s mobile-friendly website is also continually updated with the latest information concerning the Company, such as the latest updates on business and operations, quarterly
financial statements, materials provided at analysts and media briefings, annual reports, and notices of general meetings. Contact details of the Investor Relations department are also set out on the website to facilitate any queries from investors.
In addition to shareholder meetings, senior management meet with investors, analysts and the media, as well as participate in industry conferences to solicit and understand the views of the investment community. In FY 2017, the Company hosted about 175 meetings and conference calls with institutional investors, including several facility visits to its shipyards in Singapore, as well as to its residential and commercial properties in China and Vietnam. Management also traveled widely for non-deal roadshows to meet investors across countries. Such meetings provide useful platforms for management to engage with investors and analysts. In addition, the Securities Investors Association (Singapore) hosted the Company’s inaugural Retail Shareholders Day during which senior management briefed over 200 retail shareholders on the Company’s strategy and performance.
Material information is disclosed in a comprehensive, accurate and timely manner via SGXNET and the press. To ensure a level playing field and provide confidence to shareholders, unpublished price sensitive information is not selectively disclosed, and on the rare occasion when such information is inadvertently disclosed, they are immediately released to the public via SGXNET and the press.
The Company ensures that shareholders have the opportunity to participate effectively and vote at shareholders’ meeting. In this regard, the shareholders’ meeting are generally held in central locations which are easily accessible by public transportation. Shareholders are informed of shareholders’ meetings through notices published in the newspapers and via SGXNET, and reports or circulars sent or made available to all shareholders. Shareholders are invited at such meetings to put forth any questions they may have on the motions to be debated and decided upon, and vote on the resolutions at shareholders’ meetings. Such resolutions include matters of significance to shareholders such as, where applicable, proposed amendments to the Company’s constitution, the authorisation to issue additional shares, the transfer of significant assets, and the remuneration of non-executive directors. Shareholders are also informed of the rules, including voting procedures, governing such meetings.
If any shareholder is unable to attend, he is allowed to appoint up to two proxies to vote on his behalf at the meeting through
proxy forms sent in advance. Specified intermediaries, such as banks and capital markets services licence holders which provide custodial services, may however appoint more than two proxies. This will enable indirect investors, including CPF investors, to be appointed as proxies to participate in shareholders’ meetings. Such indirect investors, where so appointed, will have the same rights as direct investors to vote at the shareholders’ meetings.
Any payment of interim dividend or, upon receipt of shareholders’ approval at annual general meetings, final dividend, will be paid to all shareholders in an equitable and timely manner.
At shareholders’ meetings, each distinct issue is proposed as a separate resolution. Such resolutions include matters of significance to shareholders such as, where applicable, proposed amendments to the Company’s constitution, the authorisation to issue additional shares, the transfer of significant assets, re-election of directors, and the remuneration of non-executive directors. The rationale for the resolutions to be proposed at the meeting is set out in the notices to the meeting or its accompanying appendices. To ensure transparency, the Company conducts electronic poll voting for shareholders/proxies present at the meeting for all the resolutions proposed at the general meeting. A scrutineer is also appointed to count and validate the votes cast at the meetings. Votes cast for and against and the respective percentages, on each resolution will be displayed “live” to shareholders/proxies immediately after each poll conducted. The total number of votes cast for or against the resolutions and the respective percentages are also announced in a timely manner after the general meeting via SGXNET. Each share is entitled to one vote. Where possible, all directors will attend shareholders’ meetings. The Chairmen of the Board and each board committee are required to be present to address questions at general meetings of shareholders. External auditors are also present at such meetings to assist the directors to address shareholders’ queries, if necessary.
The Company is not implementing absentia voting methods such as voting via mail, e-mail or fax until security, integrity and other pertinent issues are satisfactorily resolved.
The Company Secretaries prepare minutes of shareholders’ meetings, which incorporates substantial comments or queries from shareholders and responses from the Board and management. These minutes are available to shareholders upon their requests.
Corporate Governance
78 79
Keppel Corporation Limited | Report to Shareholders 2017
Securities TransactionsInsider Trading PolicyThe Company has a formal Insider Trading Policy and Guidelines on Disclosure of Dealings in Securities on dealings in the securities of the Company and its listed subsidiaries and associated companies, which sets out the implications of insider trading and guidance on such dealings, including the prohibition on dealings with the Company’s securities on short-term considerations. The policy and guidelines have been distributed to the Group’s directors and officers. In compliance with Rule 1207(19) of the Listing Manual on best practices on dealing in securities, the Company issues circulars to its directors and officers informing that the Company and its officers must not deal in listed securities of the Company one month before the release of the full-year results and two weeks before the release of quarterly results, and if they are in possession of unpublished price-sensitive information. Directors and CEO are also required to report their dealings in the Company’s securities within two business days.
Appendix
Board Committees – ResponsibilitiesA. Audit Committee 1.1 Review financial statements and formal
announcements relating to financial performance, and review significant financial reporting issues and judgments contained in them, for better assurance of the integrity of such statements and announcements.
1.2 Review and report to the Board at least annually the adequacy and effectiveness of the Group’s internal controls, including financial, operational, compliance and information technology controls (such review can be carried out internally or with the assistance of any competent third parties).
1.3 Review audit plans and reports of the external auditors and internal auditors, and consider the effectiveness of actions or policies taken by management on the recommendations and observations.
1.4 Review the independence and objectivity of the external auditors.
1.5 Review the nature and extent of non-audit services performed by the auditors.
1.6 Meet with external auditors and internal auditors, without the presence of management, at least annually.
1.7 Make recommendations to the Board on the proposals to the shareholders on the appointment, re-appointment and
removal of the external auditors, and approve the remuneration and terms of engagement of the external auditors.
1.8 Review the adequacy and effectiveness of the Company’s internal audit function, at least annually.
1.9 Ensure that the internal audit function is adequately resourced and has appropriate standing within the Company, at least annually.
1.10 Approve the hiring, removal evaluation and compensation of the head of the internal audit function, or the accounting/auditing firm or corporation to which the internal audit function is outsourced.
1.11 Review the policy and arrangements by which employees of the Company and any other persons may, in confidence, raise concerns about possible improprieties in matters of financial reporting or other matters, to ensure that arrangements are in place for such concerns to be raised and independently investigated, and for appropriate follow up action to be taken.
1.12 Review interested person transactions.
1.13 Investigate any matters within the Committee's purview, whenever it deems necessary.
1.14 Report to the Board on material matters, findings and recommendations.
1.15 Review the Committee’s terms of reference annually and recommend any proposed changes to the Board.
1.16 Perform such other functions as the Board may determine.
1.17 Sub-delegate any of its powers within its terms of reference as listed above from time to time as the Audit Committee may deem fit.
B. Board Risk Committee 1.1 Obtain recommendations on
risk tolerance and strategy from Management, and where appropriate, report and recommend to the Board for its determination the nature and extent of significant risks which the Group overall may take in achieving its strategic objectives and the overall Group’s levels of risk tolerance and risk policies.
1.2 Review and discuss, as and when appropriate, with Management the Group’s risk governance structure and framework including risk policies, risk mitigation and monitoring processes and procedures.
1.3 Receive and review quarterly reports from Management on major risk exposures and the steps taken to monitor, control and mitigate such risks.
1.4 Review the Group’s capability to identify and manage new risk types.
1.5 Receive and review updates from Management to assess the adequacy and effectiveness of the Group’s compliance framework in line with relevant laws, regulations and best practices.
1.6 Through interactions with the Compliance Lead who has a direct reporting line to the Committee, review and oversee performance of the Group’s implementation of compliance programmes.
1.7 Review and monitor the Group’s approach to ensuring compliance with regulatory commitments, including progress of remedial actions where applicable.
1.8 Review and monitor Management’s responsiveness to the risks and matters identified and recommendations of the Group Risk and Compliance department.
1.9 Provide timely input to the Board on critical risk and compliance issues, material matters, findings and recommendations.
1.10 Review the Committee’s terms of reference annually and recommend any proposed changes to the Board.
1.11 Review and report to the Board annually on the adequacy and effectiveness of the Group’s risk management and internal controls systems, including financial, operational, compliance and information technology controls.
1.12 Perform such other functions as the Board may determine.
1.13 Sub-delegate any of its powers within its terms of reference as listed above from time to time as the Committee may deem fit.
C. Nominating Committee1.1 Recommend to the Board the
appointment/re-appointment of directors.
1.2 Annual review of balance and diversity of skills, experience, gender and knowledge required by the Board, and the size of the Board which would facilitate decision-making.
1.3 Annual review of independence of each director, and to ensure that the Board comprises at least one-third

80 81
Governance & Sustainability
independent directors. In this connection, the Nominating Committee should conduct particularly rigorous review of the independence of any director who has served on the Board beyond nine years from the date of his/her first appointment.
1.4 Decide, where a director has other listed company board representation and/or other principal commitments, whether the director is able to and has been adequately carrying out his/her duties as director of the Company.
1.5 Recommend to the Board the process for the evaluation of the performance of the Board, the board committees and individual directors, and propose objective performance criteria to assess the effectiveness of the Board as a whole and the contribution of each director.
1.6 Annual assessment of the effectiveness of the Board as a whole and individual directors.
1.7 Review the succession plans for the Board (in particular, the Chairman) and senior management (in particular, the CEO).
1.8 Review talent development plans.
1.9 Review the training and professional development programs for Board members.
1.10 Review and, if deemed fit, approve recommendations for nomination
of candidates as nominee director (whether as chairman or member) to the board of directors of investee companies which are:
(i) listed on the Singapore Exchange or any other stock exchange;
(ii) managers or trustee-managers of any collective investment schemes, business trusts, or any other trusts which are listed on the Singapore Exchange or any other stock exchange; and
(iii) parent companies of the Company’s core businesses which are unlisted.
1.11 Report to the Board on material matters and recommendations.
1.12 Review the Committee’s terms of reference annually and recommend any proposed changes to the Board.
1.13 Perform such other functions as the Board may determine.
1.14 Sub-delegate any of its powers within its terms of reference as listed above, from time to time as the Committee may deem fit.
D. Remuneration Committee1.1 Review and recommend to the
Board a framework of remuneration for Board members and key management personnel, and the specific remuneration packages for each director, as well as for the key management personnel.
1.2 Review the Company’s obligations arising in the event of termination of the executive directors’ and key management personnel’s contracts of service, to ensure that such clauses are fair and reasonable and not overly generous.
1.3 Consider whether directors should be eligible for benefits under long-term incentive schemes (including weighing the use of share schemes against the other types of long-term incentive scheme).
1.4 Administer the Company’s employee share option scheme (the “KCL Share Option Scheme”), and the Company’s Restricted Share Plan and Performance Share Plan (collectively, the “KCL Share Plans”), in accordance with the rules of the KCL Share Option Scheme and KCL Share Plans.
1.5 Report to the Board on material matters and recommendations.
1.6 Review the Committee’s terms of reference annually and recommend any proposed changes to the Board.
1.7 Perform such other functions as the Board may determine.
1.8 Sub-delegate any of its powers within its terms of reference as listed above, from time to time as the Committee may deem fit.
Save that a member of this Committee shall not be involved in the deliberations in respect of any remuneration, compensation, award of shares or any form of benefits to be granted to him/her.
Nature of Current Directors’ Appointments and Membership on Board Committees
Director Board Membership
Committee Membership
Audit Nominating Remuneration Risk Safety
Lee Boon Yang Chairman – Member Member – Member
Loh Chin Hua Chief Executive Officer – – – – Member
Tow Heng Tan Non-Independent & Non-Executive – Member Member Member –
Alvin Yeo Khirn Hai Independent Member Member – – –
Tan Ek Kia Independent Member – – Member Chairman
Danny Teoh Independent Chairman – Member Member –
Tan Puay Chiang Independent – Chairman – Member Member
Till Vestring Independent – Member Chairman – –
Veronica Eng Independent Member – – Chairman –
Corporate Governance
80 81
Keppel Corporation Limited | Report to Shareholders 2017
E. Board Safety Committee 1.1 Ensure there is a set of Group Health,
Safety and Environment (“HSE”) policies and standards to guide HSE operation and performance across the Group.
1.2 Monitor HSE performance of the Group companies, analyse trends and accident root causes, and recommend or propose Group-wide initiatives for improvement where appropriate to ensure a robust HSE management system is maintained.
1.3 Structure an audit programme of Group companies’ HSE management programme to verify effectiveness and use its resources to lead the execution of such audits, drawing additional resources from the line where needed.
1.4 Make greater use of its HSE staff to lead serious accident investigations.
1.5 Review serious accident and near miss incident investigation reports timely to understand underlying root causes and introduce Group-wide initiatives or remedial measures where appropriate.
1.6 Follow up on key actions initiated by the Committee.
1.7 Ensure that each Group company complies with HSE legislation in the country in which it operates as a minimum.
1.8 Keep abreast of developments in the HSE world, discuss such developments and best practices and consider the desirability of implementation in the Group.
1.9 Introduce actions to enhance safety awareness and culture within the Group.
1.10 Ensure that the safety functions in Group companies are adequately resourced (in terms of number, qualification and budget) and have appropriate standing within the organisation.
1.11 Consider management’s proposals on safety-related matters.
1.12 Carry out such investigations into safety-related matters as the Committee deems fit.
1.13 Report to the Board on material matters, findings and recommendations.
1.14 Perform such other functions as the Board may determine.
1.15 Sub-delegate any of its powers within its terms of reference as listed above from time to time as the Committee may deem fit.
Board Assessment Evaluation ProcessesBoardEach board member is required to complete a Board Evaluation Questionnaire and send the Questionnaire direct to the Independent Co-ordinator (“IC”) within five working days. An “Explanatory Note” is attached to the Questionnaire to clarify the background, rationale and objectives of the various performance criteria used in the Board Evaluation Questionnaire with the aim of achieving consistency in the understanding and interpretation of the questions. Based on the returns from each of the directors, the Independent Co-ordinator prepares a consolidated report and briefs the Chairman of the Nominating Committee (“NC”) and the Board Chairman on the report. Thereafter, the IC presents the report to the Board for discussion on the changes which should be made to help the Board discharge its duties more effectively.
Individual DirectorsThe Board differentiates the assessment of an executive director from that of a Non-Executive Director (NED).
In the case of the assessment of the individual executive director, each NED is required to complete the executive director’s assessment form and send the form directly to the IC within five working days. It is emphasised that the purpose of the assessment is to assess the executive director on his performance on the Board (as opposed to his executive performance). The executive director is not required to perform a self, nor a peer, assessment. Based on the returns from each of the NEDs, the IC prepares a consolidated report and briefs the NC Chairman and Board Chairman on the report. Thereafter, the IC presents the report to the Board for discussion. The NC Chairman will in consultation with the Board Chairman thereafter meet with the executive director, where necessary, to provide feedback to the executive director on his board performance with a view to improving his board performance and shareholder value.
As for the assessment of the performance of the NEDs, each director (both NEDs and executive director) is required to complete the NED’s assessment form and send the form directly to the IC within five working days. Each NED is also required to perform a self-assessment in addition to a peer assessment. Based on the returns, the IC prepares a consolidated report and briefs the NC Chairman and Board Chairman on the
report. Thereafter, the IC presents the report to the Board for discussion at a meeting of the NEDs. The NC Chairman will in consultation with the Board Chairman thereafter meet with the NEDs individually, where necessary, to provide feedback to the NEDs on their respective board performance with a view to improving their board performance and shareholder value. ChairmanThe Chairman Evaluation Form is completed by each director (both non-executive and executive) and sent directly to the IC within five working days. Based on the returns, the IC prepares a consolidated report and briefs the NC Chairman and Board Chairman on the report. Thereafter, the IC presents the report to the Board for discussion.
Performance CriteriaThe performance criteria for the board evaluation are in respect of the board size, board and board committee composition, board independence, board processes, board information and accountability, board performance in relation to discharging its principal functions and ensuring the integrity and quality of financial reporting to stakeholders and board committee performance in relation to discharging their responsibilities set out in their respective terms of reference.
The individual director’s performance criteria are categorised into four segments; namely, (1) interactive skills (under which factors as to whether the director works well with other directors, and participates actively are taken into account); (2) knowledge (under which factors as to the director’s industry and business knowledge, functional expertise, whether he/she provides valuable inputs, his/her ability to analyse, communicate and contribute to the productivity of meetings, and his/her understanding of finance and accounts, are taken into consideration); (3) director’s duties (under which factors as to the director’s board committee work contribution, whether the director takes his/her role of director seriously and works to further improve his/her own performance, whether he/she listens and discusses objectively and exercises independent judgment, and meeting preparation are taken into consideration); and (4) availability (under which the director’s attendance at board and board committee meetings, whether he/she is available when needed, and his/her informal contribution via e-mail, telephone, written notes etc are considered).
The assessment of the Chairman of the Board is based on, among others, his ability to lead, whether he established proper procedures to ensure the effective functioning of the Board, whether he ensured that the time devoted to board
82 83
Governance & Sustainability
meetings were appropriate (in terms of number of meetings held a year and duration of each board meeting) for effective discussion and decision-making by the Board, whether he ensured that information provided to the Board was adequate (in terms of adequacy and timeliness) for the Board to make informed and considered decisions, whether he guided discussions effectively so that there was timely resolution of issues, whether he ensured that meetings were conducted in a manner that facilitated open communication and meaningful participation, and whether he ensured that board committees were formed where appropriate, with clear terms of reference, to assist the Board in the discharge of its duties and responsibilities.
Keppel Whistle-Blower Policy Keppel Whistle-Blower Policy (the “Policy”) took effect on 1 September 2004 and was enhanced on 15 February 2017 to encourage reporting in good faith of suspected Reportable Conduct (as defined below) by establishing clearly defined and centralised processes through which such reports may be made with confidence that employees and other persons making such reports will be treated fairly and, to the extent possible, protected from reprisal.
Reportable Conduct refers to any act or omission by an employee of the Group or contract worker appointed by a company within the Group, which occurred in the course of his/her work (whether or not the act is within the scope of his/her employment) which in the view of a Whistle-Blower acting in good faith, is:
(a) dishonest, including but not limited to theft or misuse of resources within the Group;
(b) fraudulent;(c) corrupt;(d) illegal;(e) other serious improper conduct;(f) an unsafe work practice; or(g) any other conduct which may cause
financial or non-financial loss to the Group or damage to the Group’s reputation.
A person who files a report or provides evidence which he/she knows to be false, or without a reasonable belief in the truth and accuracy of such information, will not be
protected by the Policy and may be subject to administrative and/or disciplinary action.
Similarly, a person may be subject to administrative and/or disciplinary action if he/she subjects (i) a person who has made or intends to make a report in accordance with the Policy, or (ii) a person who was called or may be called as a witness, to any form of reprisal which would not have occurred if he/she did not intend to, or had not made the report or be a witness.
The General Manager (Internal Audit) is the Receiving Officer for the purposes of the Policy and is responsible for the administration, implementation and overseeing ongoing compliance with the Policy. She reports directly to the Audit Committee (AC) Chairman on all matters arising under the Policy.
Reporting MechanismThe Policy emphasises that the role of the Whistle-Blower is as a reporting party, and that Whistle-Blowers are not to investigate, or determine the appropriate corrective or remedial actions that may be warranted. Employees are encouraged to report suspected Reportable Conduct to their respective supervisors who are responsible for promptly informing the Receiving Officer, who in turn is required to promptly report to the AC Chairman, of any such report. The supervisor must not start any investigation in any event. If any of the persons in the reporting line prefers not to disclose the matter to the supervisor and/or Receiving Officer (as the case may be), he/she may make the report directly to the Receiving Officer or the AC Chairman.
Other Whistle-Blowers may report a suspected Reportable Conduct to either the Receiving Officer or the AC Chairman.
All reports and related communications made will be documented by the person first receiving the report. The information disclosed should be as precise as possible so as to allow for proper assessment of the nature, extent and urgency of preliminary investigative procedures to be undertaken.
InvestigationThe AC Chairman will review the information disclosed, interview the Whistle-Blower(s) when required and, either exercising his
own discretion or in consultation with the other AC members, determine whether the circumstances warrant an investigation and if so, the appropriate investigative process to be employed and corrective actions (if any) to be taken. The AC Chairman will use his best endeavours to ensure that there is no conflict of interests on the part of any person involved in the investigations. A Whistle-Blower Committee assists the AC Chairman with overseeing the investigation process and any matters arising therefrom.
All employees have a duty to cooperate with investigations initiated under the Policy. An employee may be placed on administrative leave or investigatory leave when it is determined by the AC Chairman that it would be in the best interests of the employee, the Company or both. Such leave is not to be interpreted as an accusation or a conclusion of guilt or innocence of any employee, including the employee on leave. All participants in the investigation must also refrain from discussing or disclosing the investigation or their testimony with anyone not connected to the investigation. In no circumstance should such persons discuss matters relating to the investigation with the person(s) who is/are subject(s) of the investigation (“Investigation Subject(s)”).
Identities of Whistle-Blower, participants of the investigations and the Investigation Subject(s) will be kept confidential to the extent possible.
No ReprisalNo person will be subject to any reprisal for having made a report in accordance with the Policy or having participated in the investigation.
Any reprisal suffered may be reported to the Receiving Officer (who shall refer the matter to the AC Chairman) or directly to the AC Chairman. The AC Chairman shall review the matter and determine the appropriate actions to be taken. Any protection does not extend to situations where the Whistle-Blower or witness has committed or abetted the Reportable Conduct that is the subject of allegation. However, the AC Chairman will take into account the fact that he/she has cooperated as a Whistle-Blower or a witness in determining the suitable disciplinary measure to be taken against him/her.
Corporate Governance
82 83
Keppel Corporation Limited | Report to Shareholders 2017
Code of Corporate Governance 2012Guidelines for Disclosure
Guideline Questions How has the Company complied?
General
(a) Has the Company complied with all the principles and guidelines of the Code? If not, please state the specific deviations and the alternative corporate governance practices adopted by the Company in lieu of the recommendations in the Code.
Yes.
b) In what respect do these alternative corporate governance practices achieve the objectives of the principles and conform to the guidelines in the Code?
N.A.
Board Responsibility
Guideline 1.5 What are the types of material transactions which require approval from the Board?
(a) New investments or increase in investments exceeding $30 million by any Group company (not separately listed);
(b) Acquisition and disposal of assets exceeding $30 million by any Group company (not separately listed);
(c) Capital equipment purchase and/or lease exceeding $30 million by any Group company (not separately listed), and
(d) All commitments to term loans and lines of credit from banks and financial institutions by the Company.
Members of the Board
Guideline 2.6 (a) What is the Board’s policy with regard to diversity in identifying director nominees?
The Nominating Committee (NC) reviews annually the balance and diversity of skills, experience, gender and knowledge required by the Board and the size of the Board which would facilitate decision making. Thereafter, in consultation with management, the NC assesses if there is any inadequate representation in respect of any of those attributes and if so, determines the role and the desirable competencies for a particular appointment.
(b) Please state whether the current composition of the Board provides diversity on each of the following – skills, experience, gender and knowledge of the Company, and elaborate with numerical data where appropriate.
The NC is satisfied that the Board and the board committees comprise directors who as a group provide an appropriate balance and diversity of skills, experience, gender, knowledge of the Group, core competencies such as accounting or finance, business or management experience, human resource, risk management, technology, mergers and acquisitions, legal, international perspective, industry knowledge, strategic planning experience and customer-based experience or knowledge, required for the Board and the board committees to be effective.
(c) What steps has the Board taken to achieve the balance and diversity necessary to maximise its effectiveness?
There is a process of refreshing the Board progressively.
See Guideline 4.6 below on process for nomination of new directors and Board succession planning.
Guideline 4.6 Please describe the board nomination process for the Company in the last financial year for: (i) selecting and appointing new directors;
and (ii) re-electing incumbent directors.
For new directorsThere were no new directors appointed in the last financial year.However, on an annual basis:
(a) the NC will review the balance and diversity of skills, experience, gender and knowledge required by the Board and the size of the Board which would facilitate decision-making;
(b) in light of such review and in consultation with management, the NC will assess if there was any inadequate representation in respect of any of those attributes and determined the role and the desirable competencies for a particular appointment;
(c) NC will then meet with the short-listed candidates to assess
suitability and to ensure that the candidates are aware of the expectations and the level of commitment required; and
(d) NC will thereafter make recommendations to the Board for approval.

84 85
Governance & Sustainability
Code of Corporate Governance 2012Guidelines for Disclosure
Guideline Questions How has the Company complied?
For incumbent directorsPursuant to the Company’s constitution, one-third of the directors retire from office at the Company’s annual general meeting, and a newly appointed director must submit himself/herself for re-election at the annual general meeting immediately following his appointment.
NC recommended the re-nomination of directors to the Board for approval, having regard to the director’s contribution and performance (such as attendance, preparedness, participation and candour), with reference to the results of the assessment of the performance of the individual director by his/her peers.
Guideline 1.6 (a) Are new directors given formal training? If not, please explain why.
Yes, all new directors undergo a comprehensive orientation programme.
(b) What are the types of information and training provided to (i) new directors and (ii) existing directors to keep them up-to-date?
All directors are provided with continuing education in areas such as directors’ duties and responsibilities, corporate governance, changes in financial reporting standards, changes in the Companies Act, continuing listing obligations and industry-related matters.
A training programme is also in place for directors in areas such as accounting, finance, risk governance and management, the roles and responsibilities of a director of a listed company and industry specific matters.
Site visits are also conducted periodically for directors to familiarise them with the operations of the various businesses so as to enhance their performance as board or board committee members.
Guideline 4.4 (a) What is the maximum number of listed company board representations that the Company has prescribed for its directors? What are the reasons for this number?
N.A.
(b) If a maximum number has not been determined, what are the reasons?
Instead of fixing a maximum number of listed company board representations that a director may have, the NC assesses holistically whether a director is able to and has been adequately carrying out his/her duties as a director of the Company, taking into account considerations as set out below.
(c) What are the specific considerations in deciding on the capacity of directors?
The NC takes into account the results of the annual assessment of the effectiveness of the individual director, the level of commitment required of the director’s other principal commitments, and the respective directors’ actual conduct and participation on the Board and board committees, including availability and attendance at regular scheduled meetings and ad-hoc meetings, in determining whether a director with other listed company board representations and/or other principal commitments is able to and has been adequately carrying out his/her duties as a director of the Company.
Board Evaluation
Guideline 5.1 (a) What was the process upon which the Board reached the conclusion on its performance for the financial year?
An independent third party (the “Independent Co-ordinator”) was appointed to assist in collating and analysing the returns of the board members for the annual assessment. Based on the returns from each of the directors, the Independent Co-ordinator prepared a consolidated report and briefed the Chairman of the NC and the Board Chairman on the report. Thereafter, the Independent Co-ordinator presented the report to the Board for discussion on the changes which should be made to help the Board discharge its duties more effectively.
The detailed process is set out on page 81 of the Corporate Governance Report.
(b) Has the Board met its performance objectives?
Yes.
Corporate Governance
84 85
Keppel Corporation Limited | Report to Shareholders 2017
Code of Corporate Governance 2012Guidelines for Disclosure
Guideline Questions How has the Company complied?
Independence of Directors
Guideline 2.1 Does the Company comply with the guideline on the proportion of independent directors on the Board? If not, please state the reasons for the deviation and the remedial action taken by the Company.
Yes.
Guideline 2.3 (a) Is there any director who is deemed to be independent by the Board, notwithstanding the existence of a relationship as stated in the Code that would otherwise deem him not to be independent? If so, please identify the director and specify the nature of such relationship.
Yes.
Mr Alvin Yeo is Senior Partner of WongPartnership LLP which is one of the law firms providing legal services to the Keppel Group.
Mr Tan Ek Kia is a non-executive and independent director on the board of TransOcean Ltd which has business dealings with the Keppel Offshore & Marine Group.
(b) What are the Board’s reasons for considering him independent? Please provide a detailed explanation.
Mr Alvin Yeo had declared to the NC that he did not have a 10% or more stake in WongPartnership LLP and did not involve himself in the selection and appointment of legal counsels for the Group. The NC also took into account Mr Yeo’s actual performance on the Board and board committees and the outcome of the recent self and peer Individual Director Performance assessment, and agreed that Mr Yeo has at all times exercised independent judgment in the best interests of the Company in the discharge of his director’s duties and should therefore continue to be deemed an independent director.
Mr Tan Ek Kia had declared to the NC that he was not involved in the negotiation of contracts or business dealings between the Keppel Offshore & Marine Group and TransOcean Ltd. The NC also took into account Mr Tan’s actual performance on the Board and board committees and the outcome of the recent self and peer Individual Director Performance assessment and agreed that Mr Tan has at all times exercised independent judgment in the best interests of the Company in the discharge of his director’s duties and should therefore continue to be deemed an independent director.
Guideline 2.4 Has any independent director served on the Board for more than nine years from the date of his first appointment? If so, please identify the director and set out the Board’s reasons for considering him independent.
No.
Disclosure on Remuneration
Guideline 9.2 Has the Company disclosed each director's and the CEO's remuneration as well as a breakdown (in percentage or dollar terms) into base/fixed salary, variable or performance-related income/bonuses, benefits in kind, stock options granted, share-based incentives and awards, and other long-term incentives? If not, what are the reasons for not disclosing so?
Yes.

86 87
Governance & Sustainability
Code of Corporate Governance 2012Guidelines for Disclosure
Guideline Questions How has the Company complied?
Guideline 9.3 (a) Has the Company disclosed each key management personnel's remuneration, in bands of S$250,000 or in more detail, as well as a breakdown (in percentage or dollar terms) into base/fixed salary, variable or performance-related income/bonuses, benefits in kind, stock options granted, share-based incentives and awards, and other long-term incentives? If not, what are the reasons for not disclosing so?
Yes.
(b) Please disclose the aggregate remuneration paid to the top five key management personnel (who are not directors or the CEO).
Aggregate remuneration paid to top six key management personnel: S$14,039,417
Guideline 9.4 Is there any employee who is an immediate family member of a director or the CEO, and whose remuneration exceeds S$50,000 during the year? If so, please identify the employee and specify the relationship with the relevant director or the CEO.
No.
Guideline 9.6 (a) Please describe how the remuneration received by executive directors and key management personnel has been determined by the performance criteria.
The total remuneration mix comprises 3 key components; that is, annual fixed cash, annual performance bonus, and the KCL Share Plans. The annual fixed cash component comprises the annual basic salary plus any other fixed allowances which the Company benchmarks with the relevant industry market median. The annual performance bonus is tied to the Company’s, business unit’s and individual employee’s performance. The KCL Share Plans are in the form of two share plans approved by shareholders, the KCL Restricted Share Plans (“KCL RSP”) and the KCL Performance Share Plans (“KCL PSP”). The KCL Share Plans are long-term incentive plans.
(b) What were the performance conditions used to determine their entitlement under the short-term and long-term incentive schemes?
The remuneration structure is directly linked to corporate and individual performance, both in terms of financial and non-financial performance. The key performance indicators (“KPIs”) for awarding of annual performance bonus are based on the four scorecard areas that the Company has identified as key to measuring the performance of the Group – (i) Financial and Business Drivers; (ii) Process; (iii) Stakeholders; and (iv) People. For the KCL PSP, performance conditions that are aligned with shareholder interests such as Total Shareholder Return, Return on Capital Employed and Net Profit are selected for equity awards.
(c) Were all of these performance conditions met? If not, what were the reasons?
The Remuneration Committee is satisfied that the quantum of performance-related bonuses and the value of shares vested under the KCL PSP and RSP to the executive director and key management personnel was fair and appropriate taking into account the extent to which their KPIs and performance conditions for FY 2017 were met.
Please refer to pages 70 to 73 of the Corporate Governance Report for more details.
Corporate Governance
86 87
Keppel Corporation Limited | Report to Shareholders 2017
Code of Corporate Governance 2012Guidelines for Disclosure
Guideline Questions How has the Company complied?
Risk Management and Internal Controls
Guideline 6.1 What types of information does the Company provide to independent directors to enable them to understand its business, the business and financial environment as well as the risks faced by the Company? How frequently is the information provided?
The Company has adopted initiatives to put in place processes to ensure that the non-executive directors are well supported by accurate, complete and timely information, and have unrestricted access to management.
These initiatives include regular informal meetings for management to brief the directors on prospective deals and potential developments at an early stage before formal board approval is sought, and the circulation of relevant information on business initiatives, industry developments and analyst and press commentaries on matters in relation to the Company or the industries in which it operates.
A two-day off-site board strategy meeting is organised annually for in-depth discussion on strategic issues and direction of the Group, to give the non-executive directors a better understanding of the Group and its businesses and to provide an opportunity for the non-executive directors to familiarise themselves with the management team so as to facilitate the Board’s review of the Group’s succession planning and leadership development programme.
Aside from board papers, management is also expected to provide the Board with accurate information in a timely manner concerning the Company’s progress or shortcomings in meeting its strategic business objectives or financial targets and other information relevant to the strategic issues facing the Company.
Management also provides the Board members with management accounts on a monthly basis and as the Board may require from time to time. Such reports keep the Board informed, on a balanced and understandable basis, of the Group’s performance, financial position and prospects.
Management surfaces key risk issues for discussion and confers with the Board Risk Committee and the Board regularly. The Board reviews the Group’s key risks and, on an annual basis, assesses the adequacy and effectiveness of the risk management system.
Guideline 13.1 Does the Company have an internal audit function? If not, please explain why.
Yes.
Guideline 11.3 (a) In relation to the major risks faced by the Company, including financial, operational, compliance, information technology and sustainability, please state the bases for the Board’s view on the adequacy and effectiveness of the Company’s internal controls and risk management systems.
The Board oversees the Group’s system of internal controls and risk management with the support from Audit Committee (AC) and Board Risk Committee (BRC).
Board’s view on the adequacy and effectiveness of the Company’s internal controls is based on the Group’s framework of management control, the internal control policies and procedures established and maintained by the Group, and the regular audits, monitoring and reviews performed by the internal and external auditors. The Audit Committee has concurred with this view.
The Board’s view on the adequacy and effectiveness of the Company’s risk management system is based on the review of the Group’s governing framework, systems, policies and processes in addressing the key risks under the Group’s Enterprise Risk Management Framework, the monitoring and review of the Group’s overall performance and representation from the management. The BRC has concurred with this view.

88 89
Governance & Sustainability
Code of Corporate Governance 2012Guidelines for Disclosure
Guideline Questions How has the Company complied?
(b) In respect of the past 12 months, has the Board received assurance from the CEO and the CFO as well as the internal auditor that: (i) the financial records have been properly maintained and the financial statements give true and fair view of the Company's operations and finances; and (ii) the Company's risk management and internal control systems are effective? If not, how does the Board assure itself of points (i) and (ii) above?
Yes. The Board has received assurance from the CEO and the CFO on points (i) and (ii). The Board received assurance from the internal auditor on the adequacy and effectiveness of the Company’s internal control systems.
Guideline 12.6 (a) Please provide a breakdown of the fees paid in total to the external auditors for audit and non-audit services for the financial year.
The Group’s estimated audit fees payable to the external auditors of the Company and other auditors of subsidiaries for FY 2017 is S$4,988,000. The Group’s non audit services fees paid to external auditors of the Company and other auditors of subsidiaries amounted to S$264,000.
(b) If the external auditors have supplied a substantial volume of non-audit services to the Company, please state the bases for the Audit Committee’s view on the independence of the external auditors.
The Audit Committee undertook a review of the independence and objectivity of the external auditors through discussions with the external auditors as well as reviewing the non-audit fees awarded to them, and has confirmed that the non-audit services performed by the external auditors would not affect their independence.
Communication with Shareholders
Guideline 15.4 (a) Does the Company regularly communicate with shareholders and attend to their questions? How often does the Company meet with institutional and retail investors?
Yes.
In FY 2017, the Company hosted about 175 meetings and conference calls with institutional investors, including several facility visits to its shipyards in Singapore, as well as to its residential and commercial properties in China and Vietnam. Management also traveled widely for non-deal roadshows to meet investors across countries. Such meetings provide useful platforms for management to engage with investors and analysts. In addition, the Securities Investors Association (Singapore) (SIAS) hosted the Company’s inaugural Retail Shareholders Day during which senior management briefed over 200 retail shareholders on the Company’s strategy and performance.
In addition to addressing the retail shareholders’ questions over the phone and email, the Company also engaged retail shareholders’ through its general meetings and long-term sponsorship of SIAS's Investor Education Programme.
(b) Is this done by a dedicated investor relations team (or equivalent)? If not, who performs this role?
This role is performed by Group Corporate Communications Department (with assistance from the Group Finance and Group Legal Department, where required)
(c) How does the Company keep shareholders informed of corporate developments, apart from SGXNET announcements and the annual report?
Engagement with shareholders and other stakeholders take many forms including “live” webcasts of quarterly results briefings, email communications, publications and content on the Company’s website as well as through facility visits. The Company’s mobile-friendly website is also continually updated with the latest information concerning the Company, such as the latest updates on business and operations, quarterly financial statements, materials provided at analysts and media briefings, annual reports, and notices of general meetings. Contact details of the investor relations department are also set out on the website to facilitate any queries from investors.
Senior management also meets with investors, analysts and the media, as well as participates in industry conferences to solicit and understand the views of the investment community.
Guideline 15.5 If the Company is not paying any dividends for the financial year, please explain why.
N.A.
Corporate Governance

88 89
Keppel Corporation Limited | Report to Shareholders 2017
Code of Corporate Governance 2012Specific Principles and Guidelines for Disclosure
Relevant Guideline or Principle Page Reference in this Report
Guideline 1.3 Delegation of authority, by the Board to any board committee, to make decisions on certain board matters
Page 64
Guideline 1.4 The number of meetings of the Board and board committees held in the year, as well as the attendance of every board member at these meetings
Page 66
Guideline 1.5 The type of material transactions that require board approval under guidelines
Page 65
Guideline 1.6 The induction, orientation and training provided to new and existing
Page 65
Guideline 2.3 The Board should identify in the company's Annual Report each director it considers to be independent. Where the Board considers a director to be independent in spite of the existence of a relationship as stated in the Code that would otherwise deem a director not to be independent, the nature of the director's relationship and the reasons for considering him as independent should be disclosed
Page 66
Guideline 2.4 Where the Board considers an independent director, who has served on the Board for more than nine years from the date of his first appointment, to be independent, the reasons for considering him as independent should be disclosed
N.A.
Guideline 3.1 Relationship between the Chairman and the CEO where they are immediate family members
N.A.
Guideline 4.1 Names of the members of the NC and the key terms of reference of the NC, explaining its role and the authority delegated to it by the Board
Pages 67, 79 and 80
Guideline 4.4 The maximum number of listed company board representations which directors may hold should be disclosed
Page 84
Guideline 4.6 Process for the selection, appointment and re-appointment of new directors to the Board, including the search and nomination process
Pages 67 and 68
Guideline 4.7 Key information regarding directors, including which directors are executive, non-executive or considered by the NC to be independent
Pages 20 to 23
Guideline 5.1 The Board should state in the company's Annual Report how assessment of the Board, its board committees and each director has been conducted. If an external facilitator has been used, the Board should disclose in the company's Annual Report whether the external facilitator has any other connection with the company or any of its directors. This assessment process should be disclosed in the company's Annual Report
Pages 81 and 82
Guideline 7.1 Names of the members of the RC and the key terms of reference of the RC, explaining its role and the authority delegated to it by the Board
Pages 69 and 80
Guideline 7.3 Names and firms of the remuneration consultants (if any) should be disclosed in the annual remuneration report, including a statement on whether the remuneration consultants have any relationships with the company
Page 69
Guideline 9 Clear disclosure of remuneration policies, level and mix of remuneration, and procedure for setting remuneration
Pages 69 to 73
Guideline 9.1Remuneration of directors, the CEO and at least the top five key management personnel (who are not also directors or the CEO) of the company. The annual remuneration report should include the aggregate amount of any termination, retirement and post-employment benefits that may be granted to directors, the CEO and the top five key management personnel (who are not directors or the CEO)
Pages 69 to 73
Guideline 9.2 Fully disclose the remuneration of each individual director and the CEO on a named basis. There will be a breakdown (in percentage or dollar terms) of each director's and the CEO's remuneration earned through base/fixed salary, variable or performance-related income/bonuses, benefits in kind, stock options granted, share-based incentives and awards, and other long-term incentives
Page 71
90 91
Governance & Sustainability
Code of Corporate Governance 2012Specific Principles and Guidelines for Disclosure
Relevant Guideline or Principle Page Reference in this Report
Guideline 9.3 Name and disclose the remuneration of at least the top five key management personnel (who are not directors or the CEO) in bands of S$250,000. There will be a breakdown (in percentage or dollar terms) of each key management personnel's remuneration earned through base/fixed salary, variable or performance-related income/bonuses, benefits in kind, stock options granted, share-based incentives and awards, and other long-term incentives. In addition, the company should disclose in aggregate the total remuneration paid to the top five key management personnel (who are not directors or the CEO). As best practice, companies are also encouraged to fully disclose the remuneration of the said top five key management personnel
Page 72
Guideline 9.4 Details of the remuneration of employees who are immediate family members of a director or the CEO, and whose remuneration exceeds S$50,000 during the year. This will be done on a named basis with clear indication of the employee's relationship with the relevant director or the CEO. Disclosure of remuneration should be in incremental bands of S$50,000
Page 73
Guideline 9.5 Details and important terms of employee share schemes
Pages 104 to 106 and 134 to 136
Guideline 9.6 For greater transparency, companies should disclose more information on the link between remuneration paid to the executive directors and key management personnel, and performance. The annual remuneration report should set out a description of performance conditions to which entitlement to short-term and long-term incentive schemes are subject, an explanation on why such performance conditions were chosen, and a statement of whether such performance conditions are met
Pages 70 to 73
Guideline 11.3 The Board should comment on the adequacy and effectiveness of the internal controls, including financial, operational, compliance and information technology controls, and risk management systems
The commentary should include information needed by stakeholders to make an informed assessment of the company's internal control and risk management systems
The Board should also comment on whether it has received assurance from the CEO and the CFO: (a) that the financial records have been properly maintained and the financial statements give true and fair view of the company's operations and finances; and (b) regarding the effectiveness of the company's risk management and internal control systems.
Pages 74 to 77
Guideline 12.1 Names of the members of the AC and the key terms of reference of the AC, explaining its role and the authority delegated to it by the Board
Pages 73 and 79
Guideline 12.6 Aggregate amount of fees paid to the external auditors for that financial year, and breakdown of fees paid in total for audit and non-audit services respectively, or an appropriate negative statement
Pages 73 and 88
Guideline 12.7 The existence of a whistle-blowing policy should be disclosed in the company's Annual Report
Page 82
Guideline 12.8 Summary of the AC's activities and measures taken to keep abreast of changes to accounting standards and issues which have a direct impact on financial statements
Pages 73 and 74
Guideline 12.9 A former partner or director of the company's existing auditing firm or auditing corporation should not act as a member of the company's AC: (a) within a period of 12 months commencing on the date of his ceasing to be a partner of the auditing firm or director of the auditing corporation; and in any case (b) for as long as he has any financial interest in the auditing firm or auditing corporation
Page 73
Guideline 15.4 The steps the Board has taken to solicit and understand the views of the shareholders e.g. through analyst briefings, investor roadshows or Investors' Day briefings
Page 78
Guideline 15.5Where dividends are not paid, companies should disclose their reasons.
N.A.
Corporate Governance

90 91
Keppel Corporation Limited | Report to Shareholders 2017
Risk Management
We maintain a balanced approach to risk management, undertaking only appropriate and well-considered risks to optimise returns for our shareholders.
Keppel's risk management approach arises from the philosophy of seeking sustainable growth opportunities and creating economic value, while ensuring only appropriate and well-considered risks are assumed. Risk management is an integral part of the way in which we develop and execute our business strategies.
Notwithstanding the challenges, we continued a disciplined pursuit of new opportunities, innovation and revenue streams to safeguard shareholder’s interest and the Group’s assets. Our robust risk-centric culture and risk management system have enabled us to continue to respond effectively to the dynamic business environment, shifting business demands and to seize new value-added opportunities for our stakeholders.
Risk-Centric CultureEffective risk management hinges not only on systems and processes, but equally on mindsets and attitudes. The Group fosters a risk-centric culture through several aspects.
1. Leadership & Governance Our management is fully committed to
fostering a strong risk-centric culture, role-modelling and demonstrating strong support for risk management in all
initiatives. Key messages encouraging prudent risk taking in decision making and business processes are interwoven into major meetings, speeches and publications.
2. Framework & Values Supported by an established risk
management framework, our core values of integrity, accountability, people-centredness and safety, along with our refreshed mission to deliver solutions for sustainable urbanisation responsibly, guides management and staff to consider risks in all their daily activities.
3. Process & Methods In applying the risk management
framework and guided by best practices, an integral aspect of both strategic and operational decision making includes consideration and management of risks at all levels of the businesses. As part of the process, appropriate tools, techniques and risk management methodologies are applied along with the requisite domain knowledge capabilities.
4. Training & Communication Training and communication are held
regularly to enhance risk management
competency across the Group.Through various forums and in-house publications, including different modes of training, risk management is reinforced as a discipline and developed through awareness and practice.
5. Transparency & Competency We promote transparency in information
sharing and escalation of risk-related matters. Risk identification and assessment are embedded in our control processes. A Group-wide survey is conducted periodically to assess the level of risk awareness amongst employees.
6. Ownership & Accountability To maintain our standards in risk
management, we advocate ownership and accountability of our employees for risk management through the performance evaluation process.
Enterprise Risk Management FrameworkKeppel’s Board is responsible for risk governance and ensures that management maintains a sound system of risk management and internal controls. Through the Board Risk Committee (BRC), the Board provides valuable advice to management in formulating the risk management framework, policies and guidelines. Our management surfaces significant risk issues for discussion with the BRC and the Board to keep them fully informed in a timely manner.
The terms of reference for the BRC are disclosed on page 79 and 80 of this report.
The Board has defined three risk tolerance guiding principles for the Group. These principles serve to determine the nature and extent of the significant risks which our Board is willing to take in achieving our strategic objectives.
These principles are:1. Risk taken should be carefully evaluated,
commensurate with rewards and in line with the Group’s core strengths and strategic objectives.
2. No risk arising from a single area of operation, investment or undertaking should be so huge as to endanger the entire Group.
3. The Group does not condone safety breaches or lapses, non-compliance with laws and regulations, as well as acts such as fraud, bribery and corruption.
Leadership & Governance
Risk-Centric Culture
Ownership & Accountability
Process & Methods
Training & Communication
Framework & Values
Transparency & Competency

92 93
Governance & Sustainability
Keppel’s risk governance framework, set out on pages 74 to 77 under Principle 11 (Risk Management and Internal Controls), facilitates management and the BRC in determining the adequacy and effectiveness of the Group’s risk management system.
Risk management is an integral part of decision making across the Group. We are cognisant of the dynamic environment in which the Group operates and continue to constantly refine the framework and systems where necessary, to ensure strong risk governance across the Group. Keppel’s Enterprise Risk Management (ERM) framework, a component of Keppel’s System of Management Controls, provides the Group with a holistic and systematic approach to risk management. It outlines the reporting structure, monitoring mechanisms, processes and tools, as well as policies and limits, in addressing the Group’s key risks.
Our ERM framework is constantly refined to ensure relevance in a dynamic operating environment and where required, tailored to the requirements of each business unit depending on specific industries and objectives. The framework takes reference from the Singapore Code of Corporate Governance, ISO 31000, ISO 22313 and the Guidebook for Audit Committees.
Our Risk and Compliance Committee, comprising relevant subject matter risk champions across the business units, drives and coordinates Group-wide risk management activities and initiatives. This is bolstered by regular bilateral and business unit level meetings to ensure that relevant risks are identified, assessed and mitigated in a timely manner. We keep abreast of the latest developments and best practices through participation in industry seminars and interacting with risk management practitioners.
We adopt a balanced approach to risk management. Given not all risks can be eliminated, we are committed to undertaking appropriate and well-considered risks to optimise returns for the Group.
Strategic RisksMarket & Competition A large part of the Group’s strategic risks comprise market driven forces, evolving competitive landscapes, changing customer demands and disruptive innovation. The Group remains vulnerable to a number of external factors including uncertainties in the global economy, implications from geo-political developments and threats of disruptive technology. These risks receive constant high-level attention throughout the year. Strategy meetings are held across the Group
to review business strategies, formulate responses and take pre-emptive action against these risks.
The BRC guides the Group in formulating and reviewing risk policies and limits. These policies and limits are subject to periodic reviews to ensure they continue to support business objectives and are aligned to our risk tolerance level. Taking into consideration the prevailing business climate and the Group’s risk appetite, the policies aim to address risks effectively and proactively.
Investments & DivestmentsWe have an established process for evaluating investment and divestment decisions. Investments are monitored to ensure they are on track to meet the Group’s strategic intent, investment objectives and returns. These investment decisions are guided by investment parameters set on a Group-wide basis.
Together with the Board, the Investment and Major Project Action Committee (IMPAC) guides the Group to take considered risks in a controlled manner, exercising the spirit of enterprise, as well as prudence to earn the best risk-adjusted returns on invested capital across all our businesses.
Investment risk assessment involves rigorous due diligence, feasibility studies and sensitivity analyses of key assumptions and variables. Some factors considered in the assessment include alignment to Group strategy, financial viability, country-specific political and regulatory developments, contractual risk implications as well as lessons learnt. The investment portfolio is constantly monitored to ensure that performance is on track to meet the Group’s strategic intent and investment returns.
Human ResourcesWe continue to maintain a strong emphasis on attracting and building a deep pool of talent. This includes nurturing employees, maintaining good industrial relations and fostering a conducive work environment for our employees. The Group is focused on strengthening succession planning and bench strength, as well as building organisational capabilities to drive business growth whilst maintaining our status as an employer of choice.
We recognise the importance of having a risk-centric mindset and the ability to identify, assess, develop and implement mitigation actions, as well as monitor risks. Keppel Leadership Institute, established as a global centre to groom leaders and equip them with the capabilities to drive and support Keppel’s growth, helps to inculcate this mindset by embedding risk management in its key leadership courses.
Operational RisksProject ManagementFrom initiation through to completion, risk management processes are an integral part of project management activities to facilitate early risk detection and proactive management. The Group adopts a systematic assessment and monitoring process to help manage the key risks for each project. Particular attention is given to technically challenging and high-value projects, including greenfield developments, as well as those that involve new technology or operations in a new country. Projects are managed in accordance to the respective country’s environmental laws and labour practices.
At the project execution stage, we carry out project reviews and quality assurance programmes to address issues involving cost, schedule and quality. Project Key Risk Indicators are used as early warning signals. In addition, we conduct knowledge sharing workshops to share best practices and lessons learnt across the Group. All these help to ensure that projects are completed on time and within budget, while meeting safety and quality standards, as well as contract obligations.
Health, Safety & Environment Maintaining a high level of Health, Safety and Environmental (HSE) standard is of paramount importance to the Group.
We constantly strive to raise awareness, maintain vigilance and foster a strong HSE-centric culture across the Group and particularly at the ground level. Key initiatives include driving a zero fatality strategy with a roadmap focused on aligning Hazard Identification Risk Assessment standards across our global operations, enhancing competency of employees performing safety-critical tasks, strengthening operational controls, deploying standard Root Cause Analysis across the Group, as well as developing more proactive and leading matrices to monitor HSE performance. Environmental management practices in key operating sites are also closely monitored. As a Group, we continue to embrace and leverage technology to improve HSE processes and systems. Testament to the Group’s concerted efforts in safety, Keppel clinched 36 awards at the WSH Awards for exemplary safety performances and implementation of strong WSH management systems, as well as efforts in creating solutions that improve workplace safety.
Business & Operational Processes We continue to streamline business processes. We have implemented initiatives to establish a common shared services platform which allows us to continue to
Risk Management

92 93
Keppel Corporation Limited | Report to Shareholders 2017
achieve cost savings, improve efficiency and productivity, as well as enhance governance, compliance and control.
We have adopted ISO standards and certifications to achieve standardisation of processes and best practices. In addition, procedures relating to defect management, operations, project control and supply chain management were established to improve the quality of deliverables. We conduct regular reviews of policies and authority limits to ensure that they remain relevant in meeting changing business requirements.
Business ContinuityWe are committed to enhancing operational resilience through a robust Business Continuity Management (BCM) Plan that will equip us to respond effectively to business disruptions, ensuring that critical business functions continue to operate with minimal impact to our people, operations and assets. As a Group, we are cognisant of the increasing risk of natural disasters, terrorism and cyber threats, and have increased our efforts in reviewing and testing our operational preparedness and effectiveness of our BCM plans. Follow-up actions are taken to strengthen operational resilience with all key learning points documented.
Crisis management and communication procedures have also been embedded into the Group’s BCM processes. These procedures are constantly refined to allow us to respond in an orderly and coordinated way, as well as to expedite recovery.
Urbanisation and connectivity has given rise to rapidly increasing concerns around cyber security. The Group maintains a close watch and keeps abreast of techniques and threats as they evolve in order to develop the appropriate mitigation measures. This will remain a key focus area for the Group. Our focus is on building capabilities to respond to crises effectively while safeguarding our people, assets and the interests of our stakeholders.
Information TechnologyThe Group has in place an Information Technology (IT) security framework to address evolving IT security threats such as hacking, malware, mobile threats and loss of data.
Our IT security, governance and control have been strengthened through the alignment of IT policies, processes and systems, and the consolidation of servers and storages. We have also appointed IT security officers and implemented guided self-assessments to identify IT security gaps.
We have dedicated IT expertise to keep abreast of the latest developments, innovation and threats in technology and assess their impact and risks at various levels. Extensive training, including assessment exercises, have been conducted on user security education to heighten awareness of IT threats. Measures and considerations have also been taken to safeguard against loss of information, data security and prolonged service disruption of critical IT systems.
Compliance RisksLaws, Regulations & Compliance Given the geographical diversity of our businesses, we closely monitor developments in the laws and regulations of countries where the Group operates to ensure that our businesses and operations comply with all relevant laws and regulations. We regularly engage with local government authorities and agencies to keep abreast of changes to laws and regulations.
We recognise that non-compliance with laws and regulations not only has significant financial impact but potentially detrimental reputational impact on the Group. We are fully committed to strengthening our regulatory compliance framework. Our emphasis is clear and consistently reiterated. We have zero tolerance for fraud, bribery, corruption and violation of laws and regulations.
During the year, we continued to make significant progress on our regulatory compliance initiatives, ensuring that compliance principles are embedded in our activities and implementing best practices from industry leaders as we develop and strengthen our compliance framework. More details on the steps taken by the Group in operationalising regulatory compliance are set out on page 94 and 95 of this report.
Financial RisksFraud, Misstatement of Financial Statements & DisclosuresWe maintain a strong emphasis on ensuring financial statements are accurate and presented fairly in accordance with applicable financial reporting standards and framework.
Regular external and internal audits are conducted to provide assurance on accuracy of financial statements and adequacy of the internal control framework supporting the statements. Where required, we leverage the expertise of the engaged auditors in the interpretation of financial reporting standards and changes. We hold regular training and education programmes to enhance competency of finance managers
across the Group. Keppel’s System of Management Controls framework outlines the Group’s internal control and risk management processes and procedures. For more details on the framework, please refer to page 75 of this report.
Financial ManagementFinancial risk management relates to our ability to meet financial obligations and mitigate credit, liquidity, currency and interest rate risks. Policies and financial authority limits are reviewed regularly to incorporate changes in the operating and control environment.
At Keppel, we are focused on financial discipline, deploying our capital to earn the best risk-adjusted returns and maintaining a strong balance sheet to seize new opportunities. This includes the evaluation of counterparties and related risks against pre-established guidelines. For more details on the Group’s financial risk management, please refer to page 57 and 58 of this report.
Impact assessment and stress tests are performed to gauge the Group’s exposure to changing market situations, allowing for informed decision making and implementation of prompt mitigating actions. We regularly monitor the concentration of exposure in the countries where the Group operates to ensure that our portfolio of assets, investments and businesses are adequately safeguarded against the systemic risks of operating in a specific geography.
Proactive Risk ManagementWe remain vigilant against emerging threats that may affect our different businesses. Through close collaboration with stakeholders and keeping vigilant, we will continue to assess our risks and review our risk management system to ensure that our ability to manage and respond to threats remains adequate and effective.
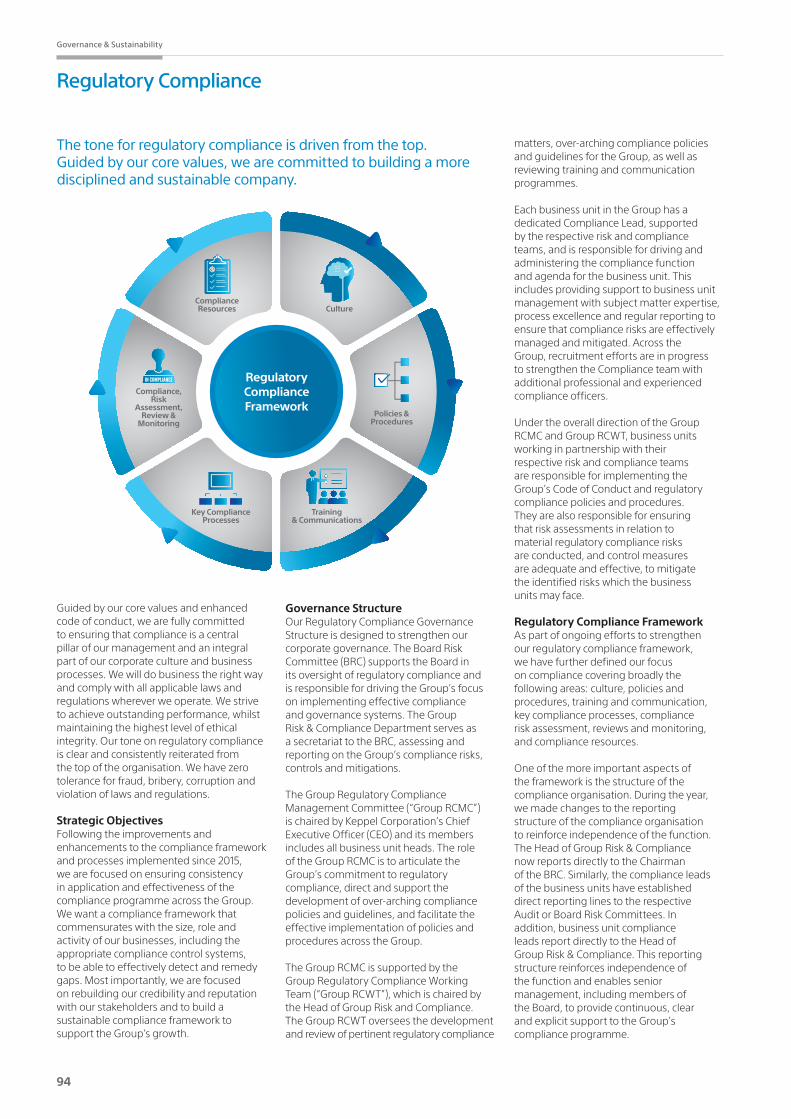
94 95
Governance & Sustainability
Regulatory Compliance
The tone for regulatory compliance is driven from the top. Guided by our core values, we are committed to building a more disciplined and sustainable company.
Guided by our core values and enhanced code of conduct, we are fully committed to ensuring that compliance is a central pillar of our management and an integral part of our corporate culture and business processes. We will do business the right way and comply with all applicable laws and regulations wherever we operate. We strive to achieve outstanding performance, whilst maintaining the highest level of ethical integrity. Our tone on regulatory compliance is clear and consistently reiterated from the top of the organisation. We have zero tolerance for fraud, bribery, corruption and violation of laws and regulations.
Strategic ObjectivesFollowing the improvements and enhancements to the compliance framework and processes implemented since 2015, we are focused on ensuring consistency in application and effectiveness of the compliance programme across the Group. We want a compliance framework that commensurates with the size, role and activity of our businesses, including the appropriate compliance control systems, to be able to effectively detect and remedy gaps. Most importantly, we are focused on rebuilding our credibility and reputation with our stakeholders and to build a sustainable compliance framework to support the Group's growth.
Governance StructureOur Regulatory Compliance Governance Structure is designed to strengthen our corporate governance. The Board Risk Committee (BRC) supports the Board in its oversight of regulatory compliance and is responsible for driving the Group’s focus on implementing effective compliance and governance systems. The Group Risk & Compliance Department serves as a secretariat to the BRC, assessing and reporting on the Group’s compliance risks, controls and mitigations.
The Group Regulatory Compliance Management Committee (“Group RCMC”) is chaired by Keppel Corporation’s Chief Executive Officer (CEO) and its members includes all business unit heads. The role of the Group RCMC is to articulate the Group’s commitment to regulatory compliance, direct and support the development of over-arching compliance policies and guidelines, and facilitate the effective implementation of policies and procedures across the Group.
The Group RCMC is supported by the Group Regulatory Compliance Working Team (“Group RCWT”), which is chaired by the Head of Group Risk and Compliance. The Group RCWT oversees the development and review of pertinent regulatory compliance
matters, over-arching compliance policies and guidelines for the Group, as well as reviewing training and communication programmes.
Each business unit in the Group has a dedicated Compliance Lead, supported by the respective risk and compliance teams, and is responsible for driving and administering the compliance function and agenda for the business unit. This includes providing support to business unit management with subject matter expertise, process excellence and regular reporting to ensure that compliance risks are effectively managed and mitigated. Across the Group, recruitment efforts are in progress to strengthen the Compliance team with additional professional and experienced compliance officers.
Under the overall direction of the Group RCMC and Group RCWT, business units working in partnership with their respective risk and compliance teams are responsible for implementing the Group’s Code of Conduct and regulatory compliance policies and procedures. They are also responsible for ensuring that risk assessments in relation to material regulatory compliance risks are conducted, and control measures are adequate and effective, to mitigate the identified risks which the business units may face.
Regulatory Compliance FrameworkAs part of ongoing efforts to strengthen our regulatory compliance framework, we have further defined our focus on compliance covering broadly the following areas: culture, policies and procedures, training and communication, key compliance processes, compliance risk assessment, reviews and monitoring, and compliance resources.
One of the more important aspects of the framework is the structure of the compliance organisation. During the year, we made changes to the reporting structure of the compliance organisation to reinforce independence of the function. The Head of Group Risk & Compliance now reports directly to the Chairman of the BRC. Similarly, the compliance leads of the business units have established direct reporting lines to the respective Audit or Board Risk Committees. In addition, business unit compliance leads report directly to the Head of Group Risk & Compliance. This reporting structure reinforces independence of the function and enables senior management, including members of the Board, to provide continuous, clear and explicit support to the Group’s compliance programme.
Training & Communications
Key Compliance Processes
Compliance, Risk
Assessment, Review &
Monitoring
Compliance Resources
Policies & Procedures
Culture
Regulatory Compliance Framework
94 95
Keppel Corporation Limited | Report to Shareholders 2017
CultureCulture and mindset are critical in ensuring effectiveness of the compliance programme. Management has a key role in setting the right tone and walking the talk. The tone on full regulatory compliance has to cascade through the organisation. During the year, we implemented initiatives to continue to foster the desired full compliance culture. These include campaign posters on anti-bribery, anti-corruption and reporting mechanisms that are now exhibited in all our offices globally to reinforce the message; individual performance measures to influence personal behaviour, and periodic compliance-focused messages delivered by business unit heads to their employees. A Group-wide survey was conducted to assess awareness of compliance and to identify potential areas requiring further emphasis.
Policies & ProceduresEmployee Code of Conduct We have a strict Code of Conduct that applies to all employees, who are required to acknowledge and comply with the Code. The Code of Conduct sets out important principles to guide employees in carrying out their duties and responsibilities to the highest standards of personal and corporate integrity. It covers areas from conduct in the workplace to business conduct, including clear provisions on prohibitions against bribery and corruption, and conflicts of interests amongst others. Appropriate disciplinary action, including suspension or termination of employment, will be taken in the event that an employee is found to have violated the rules set out in the Code of Conduct. The Code of Conduct is also provided to all third parties who represent Keppel in business dealings, including joint venture partners, who are required to acknowledge understanding and compliance with the requirements of the Code of Conduct.
Supplier Code of ConductThe acknowledgement to abide by our Supplier Code of Conduct, which was developed to integrate Keppel’s sustainability principles across our supply chain, and positively influence the environmental, social and governance performance of our suppliers, is mandatory for all key suppliers of the Keppel Group. The areas covered within the Supplier Code of Conduct includes proper business conduct, fair labour practices, stringent safety and health standards, and responsible environmental management.
Whistle-Blower PolicyKeppel’s Whistle-Blower Policy encourages the reporting of suspected bribery, violations or misconduct through a clearly-defined process and reporting
channel, by which reports can be made in confidence and without fear of reprisal. The process is reviewed regularly. During the year, we made enhancements to ensure that reporting channels are readily available and we are in the process of implementing solutions to cater to different languages and time zone requirements globally.
Compliance PoliciesThe Group maintains a comprehensive list of policies covering compliance-related matters including gifts, hospitality, agent fees, donations, sponsorships and insider trading amongst others. These policies are reviewed periodically to ensure that they commensurate with the activities in the jurisdictions in which the Group operates. Group policies are applicable to all business units and unless the jurisdictional regulatory requirements are more stringent, the Group policy represents the minimum standard for the Group.
Training & CommunicationsTraining is an essential component of Keppel’s regulatory compliance framework. Our programmes are tailored to specific audiences and we leverage Group-wide forums to reiterate key messages. We have a comprehensive annual e-learning training programme which is mandatory for all directors, officers and employees. The content of the training covers key compliance policies, and directors, officers and employees are required to complete assessments at the end of the training to successfully mark completion. As part of the annual training, directors, officers and employees are also required to formally acknowledge their understanding of policies and declare any potential conflicts of interest.
We continue to focus on refining our compliance training programmes and curriculum for new and existing employees as well as, to develop and tailor training content depending on the target audience. In addition to policy-related training programmes, we conduct trainings focused on the line manager's responsibilities in developing the desired culture and mindset regarding compliance. These responsibilities include the need to establish and maintain effective internal controls to ensure that processes are robust and potential gaps are identified and mitigated in a timely manner.
Group Risk & Compliance conducts periodic site visits, particularly to locations susceptible to higher corruption risks, to raise awareness of compliance risks. In addition, we leverage opportunities at various management conferences and employee meetings to stress the importance of compliance.
Key ProcessesDue Diligence We have improved our risk-based due diligence process for all third party associates who represent the Keppel Group in business dealings, including our joint venture partners, to assess the compliance risk of the business partner. In addition to background checks, the due diligence process incorporates requirements for third party associates to acknowledge understanding and compliance with our Code of Conduct.
Other ProcessesAs part of our ongoing review of policies and procedures, we ensure compliance oversight is embedded in key processes including areas such as gifts and hospitality, agent fees, donations and sponsorships, as well as conflicts of interest.
Best Practices We recognise the need to continually benchmark our compliance programmes against best practices and augment our processes to ensure they are consistent and robust. During the year, our compliance framework and programmes have also been reviewed by an external advisor and all recommendations from the review have been incorporated into our compliance initiatives.
Risk Assessment, Review & Monitoring We continue to develop our compliance resources and framework. This will enable the Compliance team to conduct independent risk assessments to identify and mitigate key compliance risks. Regular discussions are held with all business units, focusing on risk assessments including specific compliance risks identified for their respective businesses. Separately, independent reviews of compliance risks are carried out within the scope of internal audits including thematic reviews of the effectiveness of key aspects of our compliance programmes.
ResourcesWe recognise the need for an experienced compliance team to effectively support the business in compliance advisory, as well as to ensure that compliance programmes and controls are effectively implemented. Senior management, including members of the Board, are fully committed to ensuring that we build a strong compliance function.
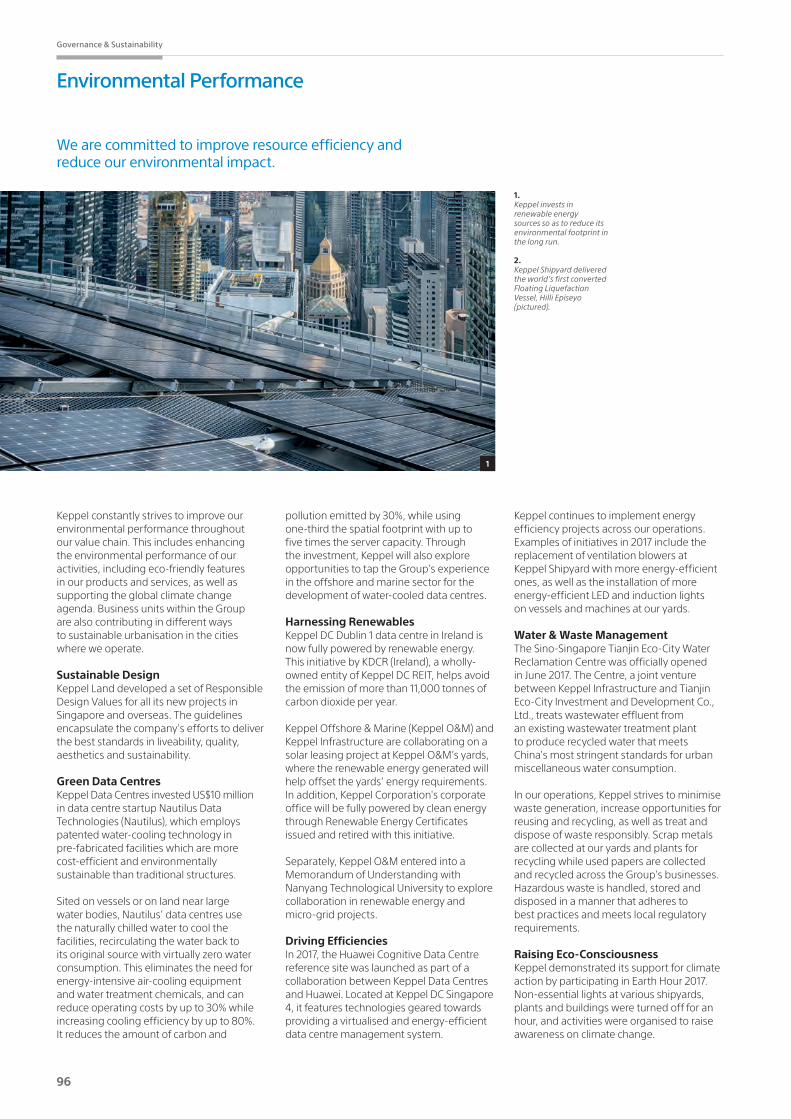
96 97
Governance & Sustainability
Environmental Performance
We are committed to improve resource efficiency and reduce our environmental impact.
Keppel constantly strives to improve our environmental performance throughout our value chain. This includes enhancing the environmental performance of our activities, including eco-friendly features in our products and services, as well as supporting the global climate change agenda. Business units within the Group are also contributing in different ways to sustainable urbanisation in the cities where we operate.
Sustainable DesignKeppel Land developed a set of Responsible Design Values for all its new projects in Singapore and overseas. The guidelines encapsulate the company's efforts to deliver the best standards in liveability, quality, aesthetics and sustainability.
Green Data CentresKeppel Data Centres invested US$10 million in data centre startup Nautilus Data Technologies (Nautilus), which employs patented water-cooling technology in pre-fabricated facilities which are more cost-efficient and environmentally sustainable than traditional structures.
Sited on vessels or on land near large water bodies, Nautilus’ data centres use the naturally chilled water to cool the facilities, recirculating the water back to its original source with virtually zero water consumption. This eliminates the need for energy-intensive air-cooling equipment and water treatment chemicals, and can reduce operating costs by up to 30% while increasing cooling efficiency by up to 80%. It reduces the amount of carbon and
Keppel continues to implement energy efficiency projects across our operations. Examples of initiatives in 2017 include the replacement of ventilation blowers at Keppel Shipyard with more energy-efficient ones, as well as the installation of more energy-efficient LED and induction lights on vessels and machines at our yards.
Water & Waste Management The Sino-Singapore Tianjin Eco-City Water Reclamation Centre was officially opened in June 2017. The Centre, a joint venture between Keppel Infrastructure and Tianjin Eco-City Investment and Development Co., Ltd., treats wastewater effluent from an existing wastewater treatment plant to produce recycled water that meets China's most stringent standards for urban miscellaneous water consumption.
In our operations, Keppel strives to minimise waste generation, increase opportunities for reusing and recycling, as well as treat and dispose of waste responsibly. Scrap metals are collected at our yards and plants for recycling while used papers are collected and recycled across the Group’s businesses. Hazardous waste is handled, stored and disposed in a manner that adheres to best practices and meets local regulatory requirements.
Raising Eco-Consciousness Keppel demonstrated its support for climate action by participating in Earth Hour 2017. Non-essential lights at various shipyards, plants and buildings were turned off for an hour, and activities were organised to raise awareness on climate change.
1
1.Keppel invests in renewable energy sources so as to reduce its environmental footprint in the long run.
2.Keppel Shipyard delivered the world’s first converted Floating Liquefaction Vessel, Hilli Episeyo (pictured).
pollution emitted by 30%, while using one-third the spatial footprint with up to five times the server capacity. Through the investment, Keppel will also explore opportunities to tap the Group’s experience in the offshore and marine sector for the development of water-cooled data centres.
Harnessing RenewablesKeppel DC Dublin 1 data centre in Ireland is now fully powered by renewable energy. This initiative by KDCR (Ireland), a wholly-owned entity of Keppel DC REIT, helps avoid the emission of more than 11,000 tonnes of carbon dioxide per year.
Keppel Offshore & Marine (Keppel O&M) and Keppel Infrastructure are collaborating on a solar leasing project at Keppel O&M’s yards, where the renewable energy generated will help offset the yards’ energy requirements. In addition, Keppel Corporation's corporate office will be fully powered by clean energy through Renewable Energy Certificates issued and retired with this initiative.
Separately, Keppel O&M entered into a Memorandum of Understanding with Nanyang Technological University to explore collaboration in renewable energy and micro-grid projects.
Driving Efficiencies In 2017, the Huawei Cognitive Data Centre reference site was launched as part of a collaboration between Keppel Data Centres and Huawei. Located at Keppel DC Singapore 4, it features technologies geared towards providing a virtualised and energy-efficient data centre management system.
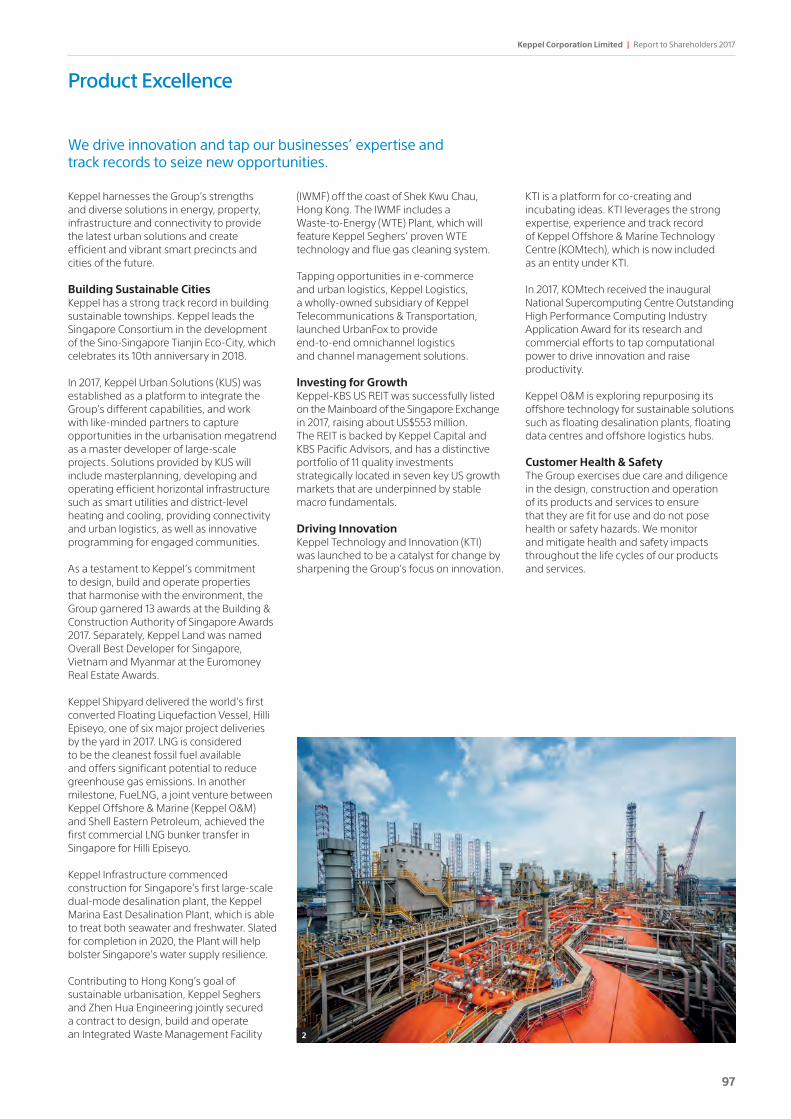
96 97
Keppel Corporation Limited | Report to Shareholders 2017
We drive innovation and tap our businesses’ expertise and track records to seize new opportunities.
Product Excellence
Keppel harnesses the Group’s strengths and diverse solutions in energy, property, infrastructure and connectivity to provide the latest urban solutions and create efficient and vibrant smart precincts and cities of the future.
Building Sustainable Cities Keppel has a strong track record in building sustainable townships. Keppel leads the Singapore Consortium in the development of the Sino-Singapore Tianjin Eco-City, which celebrates its 10th anniversary in 2018.
In 2017, Keppel Urban Solutions (KUS) was established as a platform to integrate the Group’s different capabilities, and work with like-minded partners to capture opportunities in the urbanisation megatrend as a master developer of large-scale projects. Solutions provided by KUS will include masterplanning, developing and operating efficient horizontal infrastructure such as smart utilities and district-level heating and cooling, providing connectivity and urban logistics, as well as innovative programming for engaged communities.
As a testament to Keppel’s commitment to design, build and operate properties that harmonise with the environment, the Group garnered 13 awards at the Building & Construction Authority of Singapore Awards 2017. Separately, Keppel Land was named Overall Best Developer for Singapore, Vietnam and Myanmar at the Euromoney Real Estate Awards.
Keppel Shipyard delivered the world’s first converted Floating Liquefaction Vessel, Hilli Episeyo, one of six major project deliveries by the yard in 2017. LNG is considered to be the cleanest fossil fuel available and offers significant potential to reduce greenhouse gas emissions. In another milestone, FueLNG, a joint venture between Keppel Offshore & Marine (Keppel O&M) and Shell Eastern Petroleum, achieved the first commercial LNG bunker transfer in Singapore for Hilli Episeyo.
KeppeI Infrastructure commenced construction for Singapore’s first large-scale dual-mode desalination plant, the Keppel Marina East Desalination Plant, which is able to treat both seawater and freshwater. Slated for completion in 2020, the Plant will help bolster Singapore’s water supply resilience.
Contributing to Hong Kong’s goal of sustainable urbanisation, Keppel Seghers and Zhen Hua Engineering jointly secured a contract to design, build and operate an Integrated Waste Management Facility
(IWMF) off the coast of Shek Kwu Chau, Hong Kong. The IWMF includes a Waste-to-Energy (WTE) Plant, which will feature Keppel Seghers’ proven WTE technology and flue gas cleaning system.
Tapping opportunities in e-commerce and urban logistics, Keppel Logistics, a wholly-owned subsidiary of Keppel Telecommunications & Transportation, launched UrbanFox to provide end-to-end omnichannel logistics and channel management solutions.
Investing for GrowthKeppel-KBS US REIT was successfully listed on the Mainboard of the Singapore Exchange in 2017, raising about US$553 million. The REIT is backed by Keppel Capital and KBS Pacific Advisors, and has a distinctive portfolio of 11 quality investments strategically located in seven key US growth markets that are underpinned by stable macro fundamentals.
Driving Innovation Keppel Technology and Innovation (KTI) was launched to be a catalyst for change by sharpening the Group’s focus on innovation.
2
KTI is a platform for co-creating and incubating ideas. KTI leverages the strong expertise, experience and track record of Keppel Offshore & Marine Technology Centre (KOMtech), which is now included as an entity under KTI.
In 2017, KOMtech received the inaugural National Supercomputing Centre Outstanding High Performance Computing Industry Application Award for its research and commercial efforts to tap computational power to drive innovation and raise productivity.
Keppel O&M is exploring repurposing its offshore technology for sustainable solutions such as floating desalination plants, floating data centres and offshore logistics hubs.
Customer Health & Safety The Group exercises due care and diligence in the design, construction and operation of its products and services to ensure that they are fit for use and do not pose health or safety hazards. We monitor and mitigate health and safety impacts throughout the life cycles of our products and services.
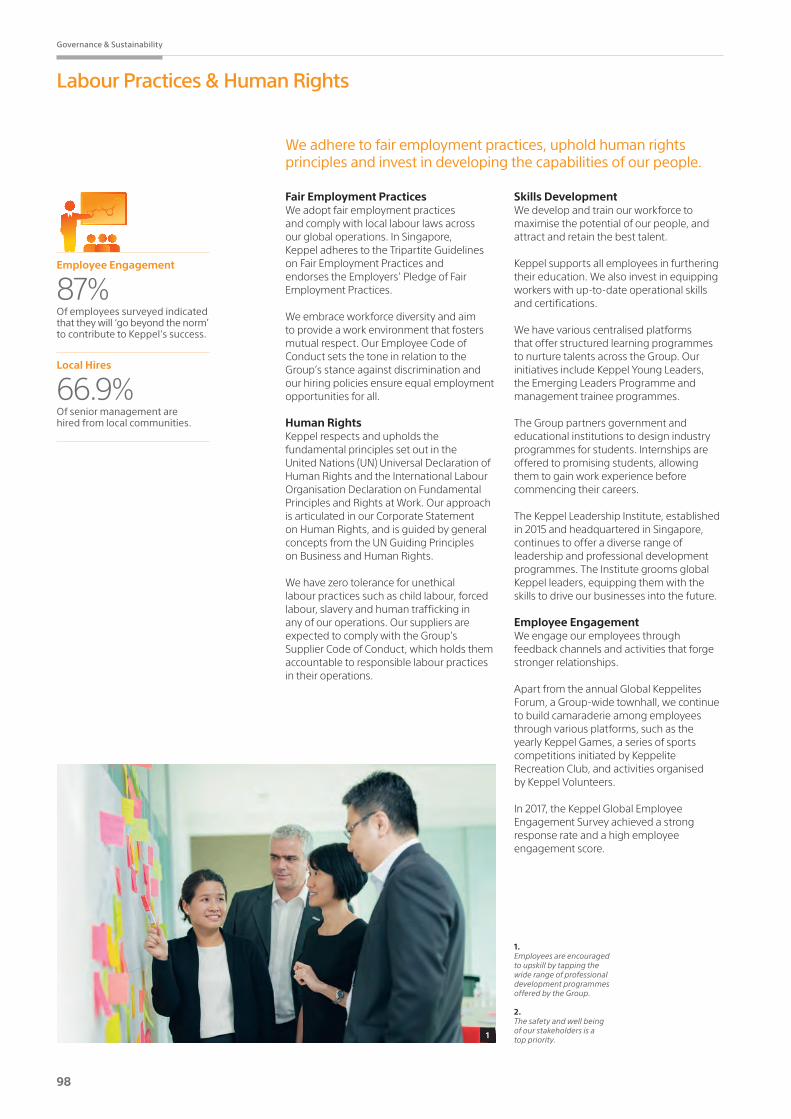
98 99
Governance & Sustainability
Labour Practices & Human Rights
We adhere to fair employment practices, uphold human rights principles and invest in developing the capabilities of our people.
Fair Employment PracticesWe adopt fair employment practices and comply with local labour laws across our global operations. In Singapore, Keppel adheres to the Tripartite Guidelines on Fair Employment Practices and endorses the Employers’ Pledge of Fair Employment Practices.
We embrace workforce diversity and aim to provide a work environment that fosters mutual respect. Our Employee Code of Conduct sets the tone in relation to the Group’s stance against discrimination and our hiring policies ensure equal employment opportunities for all.
Human Rights Keppel respects and upholds the fundamental principles set out in the United Nations (UN) Universal Declaration of Human Rights and the International Labour Organisation Declaration on Fundamental Principles and Rights at Work. Our approach is articulated in our Corporate Statement on Human Rights, and is guided by general concepts from the UN Guiding Principles on Business and Human Rights.
We have zero tolerance for unethical labour practices such as child labour, forced labour, slavery and human trafficking in any of our operations. Our suppliers are expected to comply with the Group’s Supplier Code of Conduct, which holds them accountable to responsible labour practices in their operations.
Skills Development We develop and train our workforce to maximise the potential of our people, and attract and retain the best talent.
Keppel supports all employees in furthering their education. We also invest in equipping workers with up-to-date operational skills and certifications.
We have various centralised platforms that offer structured learning programmes to nurture talents across the Group. Our initiatives include Keppel Young Leaders, the Emerging Leaders Programme and management trainee programmes.
The Group partners government and educational institutions to design industry programmes for students. Internships are offered to promising students, allowing them to gain work experience before commencing their careers.
The Keppel Leadership Institute, established in 2015 and headquartered in Singapore, continues to offer a diverse range of leadership and professional development programmes. The Institute grooms global Keppel leaders, equipping them with the skills to drive our businesses into the future.
Employee Engagement We engage our employees through feedback channels and activities that forge stronger relationships.
Apart from the annual Global Keppelites Forum, a Group-wide townhall, we continue to build camaraderie among employees through various platforms, such as the yearly Keppel Games, a series of sports competitions initiated by Keppelite Recreation Club, and activities organised by Keppel Volunteers.
In 2017, the Keppel Global Employee Engagement Survey achieved a strong response rate and a high employee engagement score.
1.Employees are encouraged to upskill by tapping the wide range of professional development programmes offered by the Group.
2.The safety and well being of our stakeholders is a top priority. 1
Employee Engagement
87%Of employees surveyed indicated that they will ‘go beyond the norm’ to contribute to Keppel’s success.
Local Hires
66.9%Of senior management are hired from local communities.

98 99
Keppel Corporation Limited | Report to Shareholders 2017
Safety & Health
Safety is our core value. We are committed to provide a safe and healthy workplace for all our stakeholders.
Commitment from the Top The Keppel Corporation Board Safety Committee, supported by the Inter-Strategic Business Unit Safety Committee, leads efforts to formulate strategies, implement initiatives and improve safety performance.
At the annual Keppel Leadership Health, Safety and Environment (HSE) Roundtable, senior management shared insights and exchanged ideas to improve Keppel’s safety performance. The resultant action plan was incorporated in the Group’s safety roadmap.
Safety PracticesWe empower and train our stakeholders to ensure that they are kept up-to-date on best practices. Training programmes are regularly reviewed to equip all personnel, including workers, frontline supervisors and managers, with the competence to handle any situation with confidence.
To further strengthen the Group’s safety culture and achieve our shared aspirations, we continue to align safety systems and processes across our global operations.
Championing Safety The Keppel Group Safety Convention in 2017 saw the continuation of the Keppel Group Safety Awards, which recognise employees who have gone the extra mile to foster safe and healthy work environments.
Employees across the Group continue to develop innovative solutions to improve work processes and enhance safety in their daily work. In 2017, a total of 34 Safety Innovation Teams submitted Safety Innovation Projects which yielded practical solutions to address challenges on the ground.
Safety Performance While our Accident Frequency Rate decreased, we suffered three fatalities globally in 2017 despite our best efforts. We are saddened by the loss of our colleagues and have thoroughly investigated the causes, stepped up efforts to prevent recurrences, and shared the lessons learnt across the Group.
The Group believes that every incident is preventable, and will continue to improve work processes and promote a culture of safety ownership across our global operations.
Safety AchievementsThe Group was conferred 36 awards at the Workplace Safety and Health (WSH) Awards 2017, organised by Singapore’s Ministry of Manpower (MOM) and the WSH Council. This is the largest number of awards won by a single organisation in 2017.
Influencing our Supply Chain We work closely with internal and external stakeholders, including our contractors and subcontractors, to maintain high safety standards. Our subcontract workers undergo the same safety training as direct employees.
To raise industry standards, we work closely with customers, suppliers, regulators and industry associations to implement initiatives and encourage our subcontractors to attend regular safety trainings. Keppel is also a sponsor of annual national safety events.
Five Key Safety Principles
1. Every incident is preventable.
2. HSE is an integral part of our business.
3. HSE is a line responsibility.
4. Everyone is empowered to stop any unsafe work.
5. A strong safety culture is achieved through teamwork.
KEPPEL
2

100 PB
Governance & Sustainability
Our Community
We uplift communities wherever we operate through programmes that deliver enduring socio-economic impact.
1.Keppel Volunteers work closely with key partners on regular activities that provide care for communities.
Conserving Biodiversity The Keppel Discovery Wetlands at the Singapore Botanic Gardens was officially opened in March 2017 by Prime Minister of Singapore Lee Hsien Loong. Established with a $2.08 million commitment from Keppel, the Wetlands includes a plant collection of over 200 species. Since its launch, over 600,000 people have visited the Wetlands. Keppel Volunteers act as ambassadors for the Wetlands by leading tours for students and seniors to promote conservation.
Arts Advocate In recognition of the Group’s contributions to the arts, Singapore’s National Arts Council presented Keppel with its 10th consecutive Distinguished Patron of the Arts Award in 2017.
The Keppel Centre for Art Education at the National Gallery Singapore is the first art education facility of its kind in the region. Established with a $12 million commitment from Keppel, the Centre has benefitted over 850,000 visitors since its launch in 2015. Guided school tours and workshops introduce visual literacy, analytical and interpretive skills to students. In 2017, several key spaces at the Centre were refreshed with new exhibits incorporating elements that cultivate a sense of adventure and exploration among children.
Keppel Nights, developed in partnership with Esplanade – Theatres on the Bay, provides students from heartland schools with access to world class performances and exposure to various art and cultural forms. Since its re-launch in 2013, the programme has benefitted close to 20,000 students from 72 schools.
Caring for CommunitiesKeppel continued to work with key partners in Singapore and overseas to organise regular activities for beneficiaries. Beneficiaries in Singapore include children from Care Corner and the Muscular Dystrophy Association Singapore, senior citizens from Thye Hua Kwan Senior Activity Centre, as well as underprivileged households supported by North West Community Development Council.
Abroad, Keppel Land works with non-governmental organisations in China like Bless China International and local hospitals to provide medical support for underprivileged villagers in Yunnan. Volunteers also regularly visit remote villages to donate essential supplies.
BrasFELS engineers lead the Teach-It-Forward programme in Brazil, providing public school children and youth in Angra dos Reis with supplementary classes and educational visits.
Keppel’s initiatives in the Philippines include the College Scholarship programme that provides technical training for out-of-school youth.
Keppel Land promotes child literacy in Ho Chi Minh City, Vietnam, through its sponsorship of Words on Wheels, a mobile library programme in partnership with Singapore International Foundation. To date, over 3,000 students have benefitted from the English lessons and exposure to online resources provided under the programme.
1
We partner organisations that share our values and invest in programmes aligned with Keppel’s focus areas of Protecting the Environment, Empowering Lives through Education and the Arts, and Caring for the Underprivileged.
Charitable contributions by the Group’s philanthropic arm, Keppel Care Foundation, are complemented by employee volunteerism led by Keppel Volunteers. The Foundation has disbursed close to $29 million to worthy causes to date, since its launch in 2012.
In 2017, the Group spent $4.5 million on social investments. Meanwhile, Keppel Volunteers achieved about 12,000 hours of community service, exceeding the target of 10,000 hours.
Social Investment Spending by Project Type, 2017 (%)
Education 47.0Industry Advancement 10.7Arts, Sports and Community Development Projects
9.3
Care for the Underprivileged and Healthcare
7.6
Environment 25.4
Total $4.5 million 100.0

Keppel Corporation Limited | Report to Shareholders 2017
101
Contents
Directors’ Statement 102
Independent Auditor’s Report 107
Balance Sheets 114
Consolidated Profit and Loss Account 115
Consolidated Statement of 116
Comprehensive Income
Statements of Changes in Equity 117
Consolidated Statement of Cash Flows 120
Notes to the Financial Statements 123
Significant Subsidiaries & 171
Associated Companies
Interested Person Transactions 180
Key Executives 181
Major Properties 185
Group Five-Year Performance 190
Group Value-Added Statements 194
Share Performance 195
Shareholding Statistics 196
Notice of Annual General Meeting & 197
Closure of Books
Corporate Information 202
Financial Calendar 203
Proxy Form 205
Directors’ Statement & Financial Statements
102
Financial Report
Directors’ StatementFor the financial year ended 31 December 2017
The Directors present their statement together with the audited consolidated financial statements of the Group, and balance sheet and statement of changes in equity of the Company for the financial year ended 31 December 2017.
In the opinion of the directors, the consolidated financial statements of the Group, and the balance sheet and statement of changes in equity of the Company as set out on pages 114 to 179, are drawn up so as to give a true and fair view of the financial position of the Group and of the Company as at 31 December 2017, and the financial performance, changes in equity and the cash flows of the Group and changes in equity of the Company for the financial year then ended and at the date of this statement, there are reasonable grounds to believe that the Company will be able to pay its debts when they fall due.
1. Directors The Directors of the Company in office at the date of this statement are:
Lee Boon Yang (Chairman) Loh Chin Hua (Chief Executive Officer) Tow Heng Tan Alvin Yeo Khirn Hai Tan Ek Kia Danny Teoh Tan Puay Chiang Till Bernhard Vestring Veronica Eng
2. Audit Committee The Audit Committee of the Board of Directors comprises four independent non-executive Directors. Members of the Committee are:
Danny Teoh (Chairman) Alvin Yeo Khirn Hai Tan Ek Kia Veronica Eng
The Audit Committee carried out its function in accordance with the Singapore Companies Act, including the following:
− Reviewedauditscopes,plansandreportsoftheCompany’sindependentauditorsandinternalauditorsandconsideredeffectiveness of actions/policies taken by management on the recommendations and observations;
− ReviewedtheassistancegivenbytheCompany’sofficerstotheauditors;− Carriedoutindependentreviewofquarterlyfinancialreportsandyear-endfinancialstatements;− Examinedeffectivenessoffinancial,operational,complianceandinformationtechnologycontrols;− Reviewedtheindependenceandobjectivityoftheindependentauditorsannually;− Reviewedthenatureandextentofnon-auditservicesperformedbyindependentauditors;− Metwithindependentauditorsandinternalauditors,withoutthepresenceofmanagement,atleastannually;− EnsuredthattheinternalauditfunctionisadequatelyresourcedandhasappropriatestandingwithintheCompany,atleast
annually;− Reviewedinterestedpersontransactions;and− InvestigatedanymatterswithintheAuditCommittee’stermofreference,wheneveritdeemednecessary.
The Audit Committee has recommended to the Board of Directors the nomination of PricewaterhouseCoopers LLP for re-appointment as independent auditors at the forthcoming Annual General Meeting of the Company.
3. Arrangements to enable directors to acquire shares or debentures Neither at the end of the financial year nor at any time during the financial year did there subsist any arrangement whose object was
to enable the Directors of the Company to acquire benefits by means of the acquisition of shares or debentures in the Company or any other body corporate other than the KCL Restricted Share Plan, KCL Performance Share Plan and Remuneration Shares to Directors of the Company.
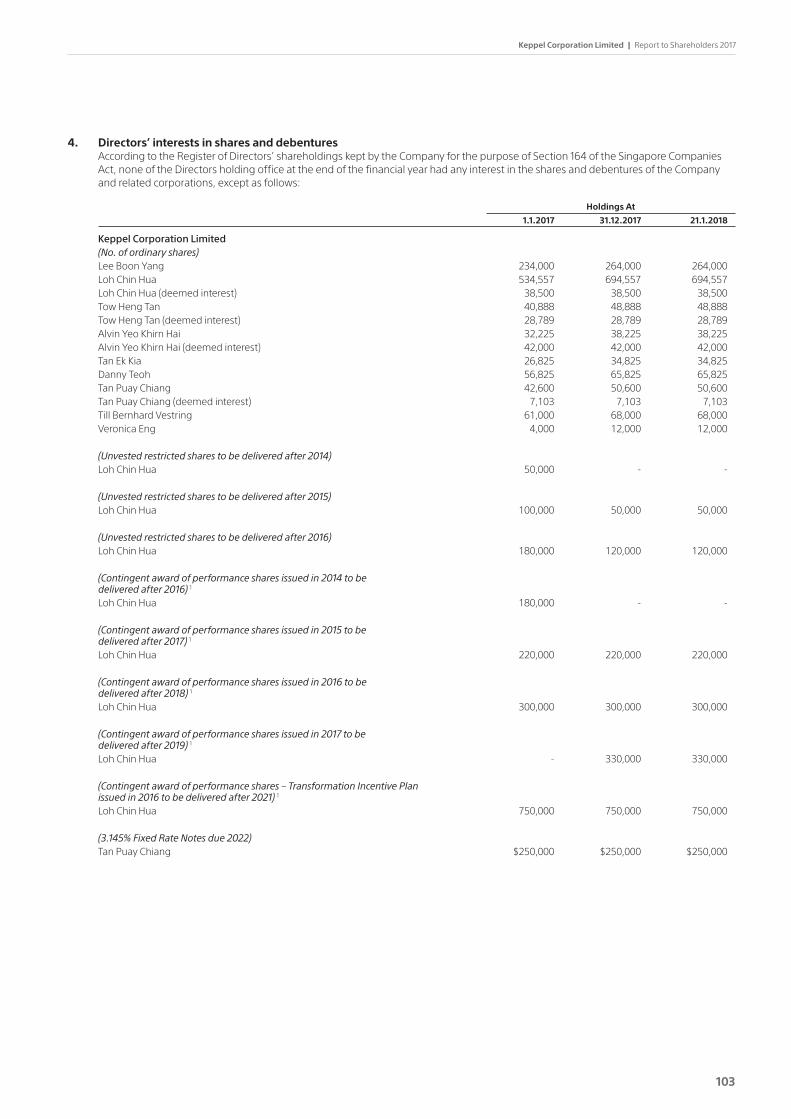
Keppel Corporation Limited | Report to Shareholders 2017
103
4. Directors’ interests in shares and debentures According to the Register of Directors’ shareholdings kept by the Company for the purpose of Section 164 of the Singapore Companies
Act, none of the Directors holding office at the end of the financial year had any interest in the shares and debentures of the Company and related corporations, except as follows:
Holdings At
1.1.2017 31.12.2017 21.1.2018
Keppel Corporation Limited (No. of ordinary shares) Lee Boon Yang 234,000 264,000 264,000 Loh Chin Hua 534,557 694,557 694,557 Loh Chin Hua (deemed interest) 38,500 38,500 38,500 Tow Heng Tan 40,888 48,888 48,888 Tow Heng Tan (deemed interest) 28,789 28,789 28,789 Alvin Yeo Khirn Hai 32,225 38,225 38,225 Alvin Yeo Khirn Hai (deemed interest) 42,000 42,000 42,000 Tan Ek Kia 26,825 34,825 34,825 Danny Teoh 56,825 65,825 65,825 Tan Puay Chiang 42,600 50,600 50,600 Tan Puay Chiang (deemed interest) 7,103 7,103 7,103 Till Bernhard Vestring 61,000 68,000 68,000 Veronica Eng 4,000 12,000 12,000
(Unvested restricted shares to be delivered after 2014) Loh Chin Hua 50,000 - -
(Unvested restricted shares to be delivered after 2015) Loh Chin Hua 100,000 50,000 50,000
(Unvested restricted shares to be delivered after 2016) Loh Chin Hua 180,000 120,000 120,000
(Contingent award of performance shares issued in 2014 to be delivered after 2016) 1
Loh Chin Hua 180,000 - -
(Contingent award of performance shares issued in 2015 to be delivered after 2017) 1
Loh Chin Hua 220,000 220,000 220,000
(Contingent award of performance shares issued in 2016 to be delivered after 2018) 1
Loh Chin Hua 300,000 300,000 300,000
(Contingent award of performance shares issued in 2017 to be delivered after 2019) 1
Loh Chin Hua - 330,000 330,000
(Contingent award of performance shares – Transformation Incentive Plan issued in 2016 to be delivered after 2021) 1
Loh Chin Hua 750,000 750,000 750,000
(3.145% Fixed Rate Notes due 2022) Tan Puay Chiang $250,000 $250,000 $250,000

104
Financial Report
Directors’ Statement
4. Directors’ interests in shares and debentures (continued)
Holdings At
1.1.2017 31.12.2017 21.1.2018
Subsidiary - Keppel Land Limited (3.90% Fixed Rate Notes due 2024) Tan Puay Chiang $250,000 $250,000 $250,000
Associated Companies - Keppel REIT (No. of units) Lee Boon Yang 16,118 16,989 16,989 Loh Chin Hua 7,000 7,000 7,000 Loh Chin Hua (deemed interest) 556,160 556,160 556,160 Tow Heng Tan 5,568 5,568 5,568 Tow Heng Tan (deemed interest) 8,070 8,070 8,070 Alvin Yeo Khirn Hai 4,303 4,303 4,303 Alvin Yeo Khirn Hai (deemed interest) 210,663 210,663 210,663 Tan Ek Kia 1,939 1,939 1,939 Danny Teoh 8,911 8,911 8,911 Tan Puay Chiang 12,000 12,000 12,000 Tan Puay Chiang (deemed interest) 6,000 6,000 6,000
- Keppel DC REIT (No. of units) Alvin Yeo Khirn Hai 95,550 95,550 95,550 Tan Puay Chiang 100,000 100,000 100,000
1 Dependingontheachievementofpre-determinedperformancetargets,theactualnumberofsharestobereleasedcouldrangefromzeroto150%ofthenumber stated.
5. Share options of the Company Details of share options granted under the KCL Share Option Scheme (“Scheme”) are disclosed in Note 3 to the financial statements.
No options to take up Ordinary Shares (“Shares”) were granted during the financial year. There were 632,900 Shares issued by virtue of exercise of options and options to take up 7,304,289 Shares were cancelled during the financial year. At the end of the financial year, there were 6,088,785 Shares under option as follows:
Number of Share Options
Balance at Balance at Exercise Date of Date of grant 1.1.2017 Exercised Cancelled 31.12.2017 price expiry
13.02.2007 1,166,100 - (1,166,100) - $7.70 12.02.2017 10.08.2007 4,693,759 - (4,693,759) - $11.17 09.08.2017 14.02.2008 1,873,800 - (429,000) 1,444,800 $8.46 13.02.2018 14.08.2008 2,659,530 - (582,530) 2,077,000 $8.73 13.08.2018 05.02.2009 103,800 (15,400) - 88,400 $3.07 04.02.2019 06.08.2009 1,624,785 (352,500) (235,500) 1,036,785 $6.86 05.08.2019 09.02.2010 1,904,200 (265,000) (197,400) 1,441,800 $6.89 08.02.2020 14,025,974 (632,900) (7,304,289) 6,088,785
There are no options granted to any of the Company’s controlling shareholders or their associates under the Scheme.
6. Share plans of the Company The KCL Performance Share Plan (“KCL PSP”) and KCL Restricted Share Plan (“KCL RSP”) were approved by the Company’s shareholders at
the Extraordinary General Meeting of the Company on 23 April 2010.
After a comprehensive review of the Group’s total remuneration structure, eligible employees will receive deferred shares under the approved KCL RSP scheme from Year 2017 onwards. For Year 2017, the deferred shares were granted in February 2018 after taking into consideration the Group, business units and individual performance. Subject to the fulfilment of service conditions at vesting, the deferred shares will vest equally over three years from February 2018 onwards.
During the year, the transformation incentive plan (“KCL PSP-TIP”), which was implemented in 2016, was also updated after a review of the Group’s long-term business plans. The performance period was extended from five years to six years, with a corresponding revision in the absolute total shareholder’s return targets. As a result, the estimated fair value of the contingent shares granted under the KCL PSP-TIP on 29 April 2016 was revised from $0.78 to $1.74.

Keppel Corporation Limited | Report to Shareholders 2017
105
Details of share plans awarded under the KCL PSP, KCL PSP-TIP and KCL RSP are disclosed in Note 3 to the financial statements and as follows:
Contingent awards:
Number of Shares
Contingent Adjustments Balance at awards upon Balance at Date of Grant 1.1.2017 granted release Released Cancelled 31.12.2017
KCL PSP 31.03.2014 565,082 - (565,082) - - - 31.03.2015 662,705 - - - (257,705) 405,000 30.07.2015 220,000 - - - (50,000) 170,000 29.04.2016 1,114,425 - - - (284,425) 830,000 28.04.2017 - 1,120,000 - - - 1,120,000 2,562,212 1,120,000 (565,082) - (592,130) 2,525,000
KCL PSP-TIP 29.04.2016 5,625,000 - - - (917,509) 4,707,491 28.04.2017 - 2,040,000 - - - 2,040,000 5,625,000 2,040,000 - - (917,509) 6,747,491
KCL RSP 29.04.2016 5,726,426 - - (5,676,157) (50,269) - 5,726,426 - - (5,676,157) (50,269) -
Awards released but not vested:
Number of Shares
Balance at Other Balance at Date of Grant 1.1.2017 Released Vested Cancelled adjustments 31.12.2017
KCL RSP 31.03.2014 1,375,006 - (1,266,447) (103,159) - 5,400 31.03.2015 2,989,935 - (1,462,058) (168,486) - 1,359,391 30.07.2015 489,957 - (244,200) (15,432) (6,000) 224,325 29.04.2016 - 5,676,157 (1,890,117) (252,791) (20,000) 3,513,249 4,854,898 5,676,157 (4,862,822) (539,868) (26,000) 5,102,365
TheinformationonDirectoroftheCompanyparticipatingintheKCLRSP,theKCLPSPandtheKCLPSP-TIPwhoreceive5%ormoreofthetotal number of contingent award of shares granted to date is as follows:
Contingent awards:
Aggregate Aggregate other Aggregate awards adjustments awards granted since since released since Aggregate Contingent commencement commencement commencement awards awards granted of plans of plans of plans not released as during the to the end of to the end of to the end of at the end of Name of Director financial year financial year financial year financial year financial year
KCL RSP Director of the Company Loh Chin Hua - 644,757 - (644,757) -
KCL PSP Director of the Company Loh Chin Hua 330,000 1,200,814 (281,014) (69,800) 850,000
KCL PSP-TIP Director of the Company Loh Chin Hua - 750,000 - - 750,000

106
Financial Report
Directors’ Statement
6. Share plans of the Company (continued)
Awards released but not vested:
Aggregate Aggregate awards awards Aggregate released since vested since awards commencement commencement released but of plans of plans not vested as to the end of to the end of at the end of Name of Director financial year financial year financial year
KCL RSP Director of the Company Loh Chin Hua 644,757 (474,757) 170,000
KCL PSP Director of the Company Loh Chin Hua 69,800 (69,800) -
No Director or employee received more than 5 percent or more of the total number of contingent award of Shares granted during the financial year and aggregated to date, except for the following:
Contingent shares Aggregate granted during the contingent shares Name of Director financial year (%) granted to date (%)
Loh Chin Hua 10.4% 5.4%
There are no contingent award of Shares granted to any of the Company’s controlling shareholders or their associates under the KCL RSP, the KCL PSP and the KCL PSP-TIP.
7. Share options and share plans of a subsidiary The particulars of share option and share plans of a subsidiary of the Company are as follows:
Keppel Telecommunications & Transportation Ltd (“Keppel T&T”) At the end of the financial year, there were 250,000 unissued shares of Keppel Telecommunications & Transportation Ltd under option
relating to Keppel T&T Share Option Scheme. In addition, there were 941,315 unvested shares under Keppel T&T Restricted Share Plan and 740,000 contingent shares granted under Keppel T&T Performance Share Plan at the end of the financial year. Details and terms of the options and share plans have been disclosed in the Directors’ Statement of Keppel Telecommunications & Transportation Ltd.
8. Independent auditor The independent auditor, PricewaterhouseCoopers LLP, has expressed its willingness to accept re-appointment.
On behalf of the Board
LEE BOON YANG LOH CHIN HUAChairman Chief Executive Officer
Singapore, 23 February 2018
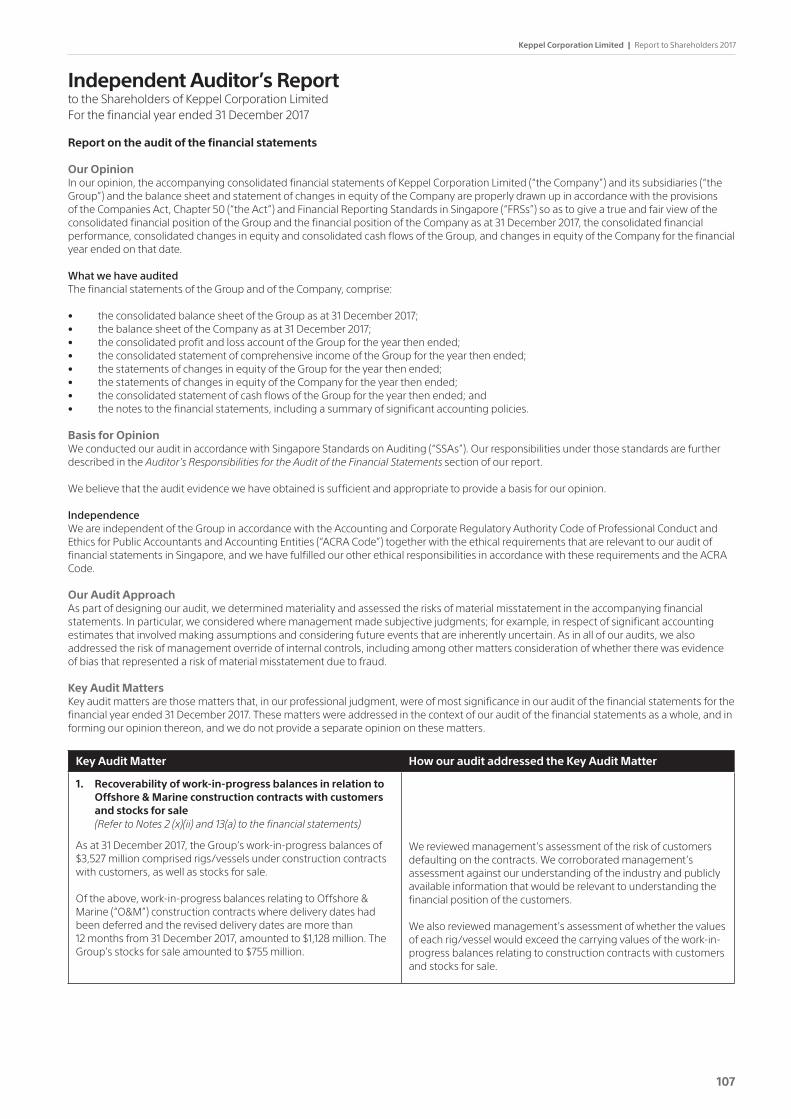
Keppel Corporation Limited | Report to Shareholders 2017
107
Independent Auditor’s Reportto the Shareholders of Keppel Corporation LimitedFor the financial year ended 31 December 2017
Report on the audit of the financial statements
Our OpinionIn our opinion, the accompanying consolidated financial statements of Keppel Corporation Limited (“the Company”) and its subsidiaries (“the Group”) and the balance sheet and statement of changes in equity of the Company are properly drawn up in accordance with the provisions of the Companies Act, Chapter 50 (“the Act”) and Financial Reporting Standards in Singapore (“FRSs”) so as to give a true and fair view of the consolidated financial position of the Group and the financial position of the Company as at 31 December 2017, the consolidated financial performance, consolidated changes in equity and consolidated cash flows of the Group, and changes in equity of the Company for the financial year ended on that date.
What we have auditedThe financial statements of the Group and of the Company, comprise:
• the consolidated balance sheet of the Group as at 31 December 2017;• the balance sheet of the Company as at 31 December 2017;• the consolidated profit and loss account of the Group for the year then ended;• the consolidated statement of comprehensive income of the Group for the year then ended;• the statements of changes in equity of the Group for the year then ended;• the statements of changes in equity of the Company for the year then ended;• the consolidated statement of cash flows of the Group for the year then ended; and • the notes to the financial statements, including a summary of significant accounting policies.
Basis for OpinionWe conducted our audit in accordance with Singapore Standards on Auditing (“SSAs”). Our responsibilities under those standards are further described in the Auditor’s Responsibilities for the Audit of the Financial Statements section of our report.
We believe that the audit evidence we have obtained is sufficient and appropriate to provide a basis for our opinion.
IndependenceWe are independent of the Group in accordance with the Accounting and Corporate Regulatory Authority Code of Professional Conduct and Ethics for Public Accountants and Accounting Entities (“ACRA Code”) together with the ethical requirements that are relevant to our audit of financial statements in Singapore, and we have fulfilled our other ethical responsibilities in accordance with these requirements and the ACRA Code.
Our Audit ApproachAs part of designing our audit, we determined materiality and assessed the risks of material misstatement in the accompanying financial statements. In particular, we considered where management made subjective judgments; for example, in respect of significant accounting estimates that involved making assumptions and considering future events that are inherently uncertain. As in all of our audits, we also addressed the risk of management override of internal controls, including among other matters consideration of whether there was evidence of bias that represented a risk of material misstatement due to fraud.
Key Audit MattersKey audit matters are those matters that, in our professional judgment, were of most significance in our audit of the financial statements for the financial year ended 31 December 2017. These matters were addressed in the context of our audit of the financial statements as a whole, and in forming our opinion thereon, and we do not provide a separate opinion on these matters.
Key Audit Matter How our audit addressed the Key Audit Matter
1. Recoverability of work-in-progress balances in relation to Offshore & Marine construction contracts with customers and stocks for sale(Refer to Notes 2 (x)(ii) and 13(a) to the financial statements)
As at 31 December 2017, the Group’s work-in-progress balances of $3,527 million comprised rigs/vessels under construction contracts with customers, as well as stocks for sale. Of the above, work-in-progress balances relating to Offshore & Marine (“O&M”) construction contracts where delivery dates had been deferred and the revised delivery dates are more than 12 months from 31 December 2017, amounted to $1,128 million. The Group’s stocks for sale amounted to $755 million.
We reviewed management’s assessment of the risk of customers defaulting on the contracts. We corroborated management’s assessment against our understanding of the industry and publicly available information that would be relevant to understanding the financial position of the customers.
We also reviewed management’s assessment of whether the values of each rig/vessel would exceed the carrying values of the work-in-progress balances relating to construction contracts with customers and stocks for sale.

108
Financial Report
Key Audit Matter How our audit addressed the Key Audit Matter
We focused on this area because of the significant judgment and assumptions required in:
• assessing whether the Group’s customers will be able to fulfil their contractual obligations and take delivery of the rigs at the revised delivery dates;
• estimating the values of the rigs for recovery of the work-in-progress balances; and
• estimating the net realisable values of stocks for sale.
To assess whether the values of rigs/vessels would exceed the carrying values of the work-in-progress balances relating to construction contracts with customers and stocks for sale, management performed an assessment with the assistance of an independent professional firm, using Discounted Cash Flow (“DCF”) calculations that cover each class of rig/vessel under construction. The most significant inputs to the DCF calculations included day rates, utilisation rates, forecasted oil price movements and discount rates.
Arising from management’s assessment, no further write-down of the balances was made in the current year.
We reviewed the most significant inputs to the DCF calculations, comprising day rates, utilisation rates and forecasted oil price movements, and engaged our valuation specialists to review the discount rates applied.
We also considered the adequacy of the disclosures in the financial statements in respect of this matter.
Based on our procedures, we found management’s judgment around the recovery of the work-in-progress balances on construction contracts and stocks to be appropriate. In respect of the independent professional firm, we found that it possessed the requisite competency and experience to assist management in assessment of the valuation.
We also found the disclosures in the financial statements in respect of the critical judgment and sources of estimation uncertainty to be adequate.
2. Assessment of impairment of fixed assets in relation to the Group’s O&M Division
(Refer to Note 6 to the financial statements) As at 31 December 2017, the Group had $983 million of fixed assets for which management performed an impairment review. Included in these were fixed assets relating to its O&M Division, comprising various rigbuilding, shipbuilding and repair operations around the world.
For fixed assets in the O&M Division with indicators of impairment, management performed an impairment review to assess the recoverable amount of these fixed assets, with each rigbuilding, shipbuilding and repair facility identified as an individual cash-generating unit (“CGU”). Arising from the review, the Group assessed that the recoverable amounts of these CGUs exceeded their respective carrying amounts, with the exception of one CGU. Accordingly, an impairment charge of $3.1 million was recognised in 2017 relating to this CGU. In the prior year, an impairment charge of $148 million was recognised relating to the fixed assets in the Group’s O&M Division.
We focused on this area as the assessment of the recoverable amount using value-in-use (“VIU”) models required management to exercise significant judgment over the estimation of forecasted cash flows and discount rates.
We reviewed management’s identification of the rigbuilding, shipbuilding and repair operations which contained indicators of impairment at 31 December 2017.
In respect of the CGUs where indicators of impairment were present, we obtained the VIU calculations and evaluated the reasonableness of the forecasted cash flows, considering our knowledge of the business and our understanding of the industry. We involved our valuation specialists to review the discount rates applied.
We also considered the adequacy of the disclosures in the financial statements in respect of this matter.
Based on our procedures, we found management’s assessment of the recoverable amounts of the fixed assets relating to the Group’s rigbuilding, shipbuilding and repair operations to be appropriate.
We also found the disclosures in the financial statements in respect of the impairment to be adequate.
Independent Auditor’s Report
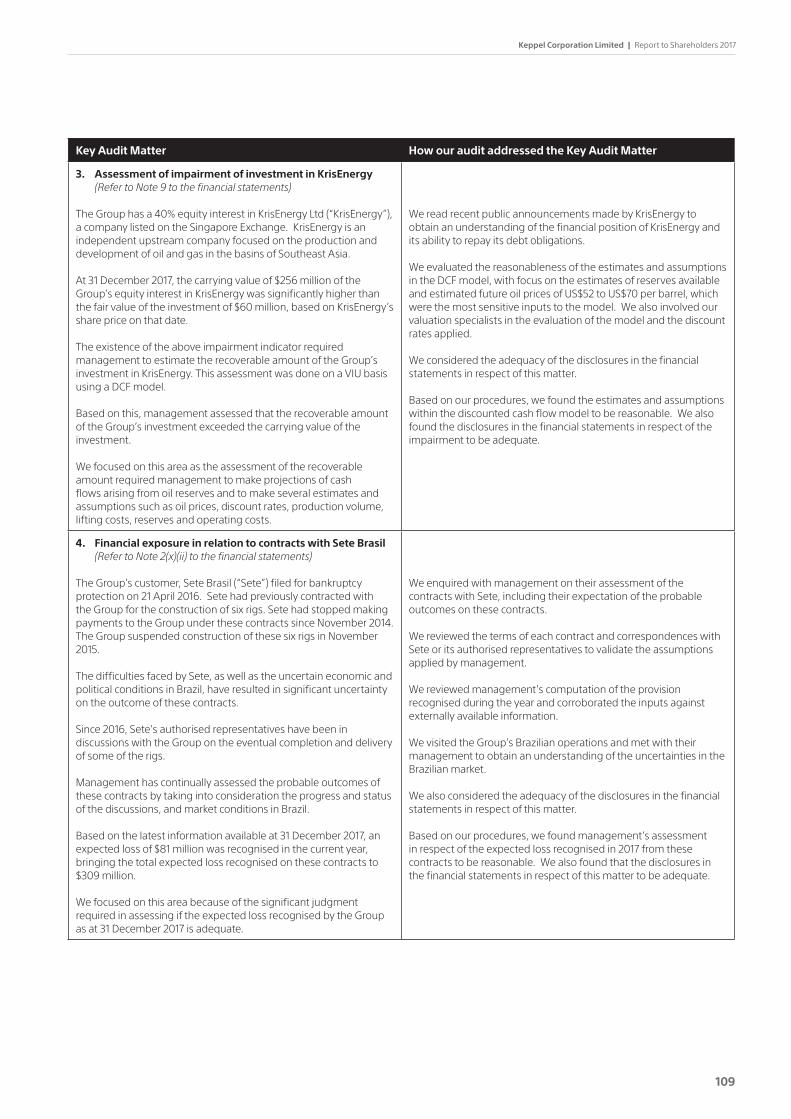
Keppel Corporation Limited | Report to Shareholders 2017
109
Key Audit Matter How our audit addressed the Key Audit Matter
3. Assessment of impairment of investment in KrisEnergy (Refer to Note 9 to the financial statements) TheGrouphasa40%equityinterestinKrisEnergyLtd(“KrisEnergy”),a company listed on the Singapore Exchange. KrisEnergy is an independent upstream company focused on the production and development of oil and gas in the basins of Southeast Asia.
At 31 December 2017, the carrying value of $256 million of the Group’s equity interest in KrisEnergy was significantly higher than the fair value of the investment of $60 million, based on KrisEnergy’s share price on that date. The existence of the above impairment indicator required management to estimate the recoverable amount of the Group’s investment in KrisEnergy. This assessment was done on a VIU basis using a DCF model.
Based on this, management assessed that the recoverable amount of the Group’s investment exceeded the carrying value of the investment.
We focused on this area as the assessment of the recoverable amount required management to make projections of cash flows arising from oil reserves and to make several estimates and assumptions such as oil prices, discount rates, production volume, lifting costs, reserves and operating costs.
We read recent public announcements made by KrisEnergy to obtain an understanding of the financial position of KrisEnergy and its ability to repay its debt obligations.
We evaluated the reasonableness of the estimates and assumptions in the DCF model, with focus on the estimates of reserves available and estimated future oil prices of US$52 to US$70 per barrel, which were the most sensitive inputs to the model. We also involved our valuation specialists in the evaluation of the model and the discount rates applied.
We considered the adequacy of the disclosures in the financial statements in respect of this matter.
Based on our procedures, we found the estimates and assumptions within the discounted cash flow model to be reasonable. We also found the disclosures in the financial statements in respect of the impairment to be adequate.
4. Financial exposure in relation to contracts with Sete Brasil (Refer to Note 2(x)(ii) to the financial statements) The Group’s customer, Sete Brasil (“Sete”) filed for bankruptcy protection on 21 April 2016. Sete had previously contracted with the Group for the construction of six rigs. Sete had stopped making payments to the Group under these contracts since November 2014. The Group suspended construction of these six rigs in November 2015.
The difficulties faced by Sete, as well as the uncertain economic and political conditions in Brazil, have resulted in significant uncertainty on the outcome of these contracts.
Since 2016, Sete’s authorised representatives have been in discussions with the Group on the eventual completion and delivery of some of the rigs.
Management has continually assessed the probable outcomes of these contracts by taking into consideration the progress and status of the discussions, and market conditions in Brazil.
Based on the latest information available at 31 December 2017, an expected loss of $81 million was recognised in the current year, bringing the total expected loss recognised on these contracts to $309 million.
We focused on this area because of the significant judgment required in assessing if the expected loss recognised by the Group as at 31 December 2017 is adequate.
We enquired with management on their assessment of the contracts with Sete, including their expectation of the probable outcomes on these contracts.
We reviewed the terms of each contract and correspondences with Sete or its authorised representatives to validate the assumptions applied by management.
We reviewed management’s computation of the provision recognised during the year and corroborated the inputs against externally available information.
We visited the Group’s Brazilian operations and met with their management to obtain an understanding of the uncertainties in the Brazilian market. We also considered the adequacy of the disclosures in the financial statements in respect of this matter.
Based on our procedures, we found management’s assessment in respect of the expected loss recognised in 2017 from these contracts to be reasonable. We also found that the disclosures in the financial statements in respect of this matter to be adequate.
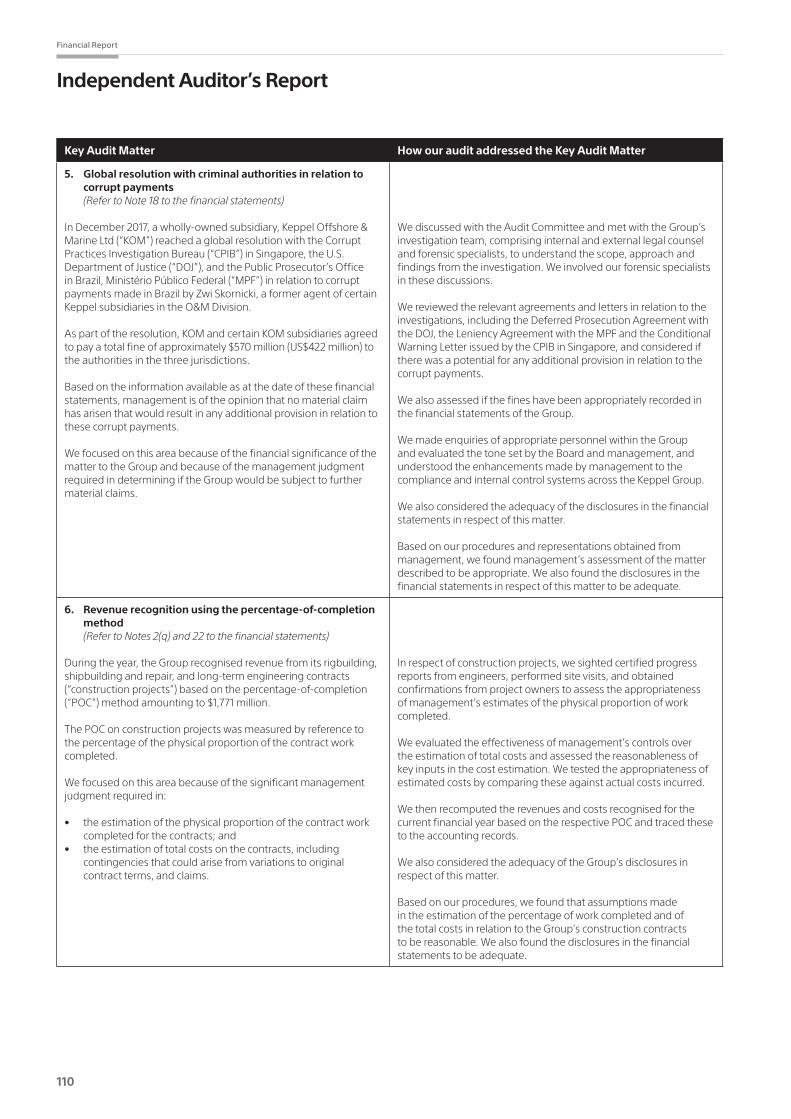
110
Financial Report
Independent Auditor’s Report
Key Audit Matter How our audit addressed the Key Audit Matter
5. Global resolution with criminal authorities in relation to corrupt payments
(Refer to Note 18 to the financial statements)
In December 2017, a wholly-owned subsidiary, Keppel Offshore & Marine Ltd (“KOM”) reached a global resolution with the Corrupt Practices Investigation Bureau (“CPIB”) in Singapore, the U.S. Department of Justice (“DOJ”), and the Public Prosecutor’s Office in Brazil, Ministério Público Federal (“MPF”) in relation to corrupt payments made in Brazil by Zwi Skornicki, a former agent of certain Keppel subsidiaries in the O&M Division.
As part of the resolution, KOM and certain KOM subsidiaries agreed to pay a total fine of approximately $570 million (US$422 million) to the authorities in the three jurisdictions.
Based on the information available as at the date of these financial statements, management is of the opinion that no material claim has arisen that would result in any additional provision in relation to these corrupt payments.
We focused on this area because of the financial significance of the matter to the Group and because of the management judgment required in determining if the Group would be subject to further material claims.
We discussed with the Audit Committee and met with the Group’s investigation team, comprising internal and external legal counsel and forensic specialists, to understand the scope, approach and findings from the investigation. We involved our forensic specialists in these discussions.
We reviewed the relevant agreements and letters in relation to the investigations, including the Deferred Prosecution Agreement with the DOJ, the Leniency Agreement with the MPF and the Conditional Warning Letter issued by the CPIB in Singapore, and considered if there was a potential for any additional provision in relation to the corrupt payments.
We also assessed if the fines have been appropriately recorded in the financial statements of the Group.
We made enquiries of appropriate personnel within the Group and evaluated the tone set by the Board and management, and understood the enhancements made by management to the compliance and internal control systems across the Keppel Group.
We also considered the adequacy of the disclosures in the financial statements in respect of this matter. Based on our procedures and representations obtained from management, we found management’s assessment of the matter described to be appropriate. We also found the disclosures in the financial statements in respect of this matter to be adequate.
6. Revenue recognition using the percentage-of-completion method
(Refer to Notes 2(q) and 22 to the financial statements)
During the year, the Group recognised revenue from its rigbuilding, shipbuilding and repair, and long-term engineering contracts (“construction projects”) based on the percentage-of-completion (“POC”) method amounting to $1,771 million.
The POC on construction projects was measured by reference to the percentage of the physical proportion of the contract work completed.
We focused on this area because of the significant management judgment required in:
• the estimation of the physical proportion of the contract work completed for the contracts; and
• the estimation of total costs on the contracts, including contingencies that could arise from variations to original contract terms, and claims.
In respect of construction projects, we sighted certified progress reports from engineers, performed site visits, and obtained confirmations from project owners to assess the appropriateness of management’s estimates of the physical proportion of work completed.
We evaluated the effectiveness of management’s controls over the estimation of total costs and assessed the reasonableness of key inputs in the cost estimation. We tested the appropriateness of estimated costs by comparing these against actual costs incurred.
We then recomputed the revenues and costs recognised for the current financial year based on the respective POC and traced these to the accounting records.
We also considered the adequacy of the Group’s disclosures in respect of this matter.
Based on our procedures, we found that assumptions made in the estimation of the percentage of work completed and of the total costs in relation to the Group’s construction contracts to be reasonable. We also found the disclosures in the financial statements to be adequate.
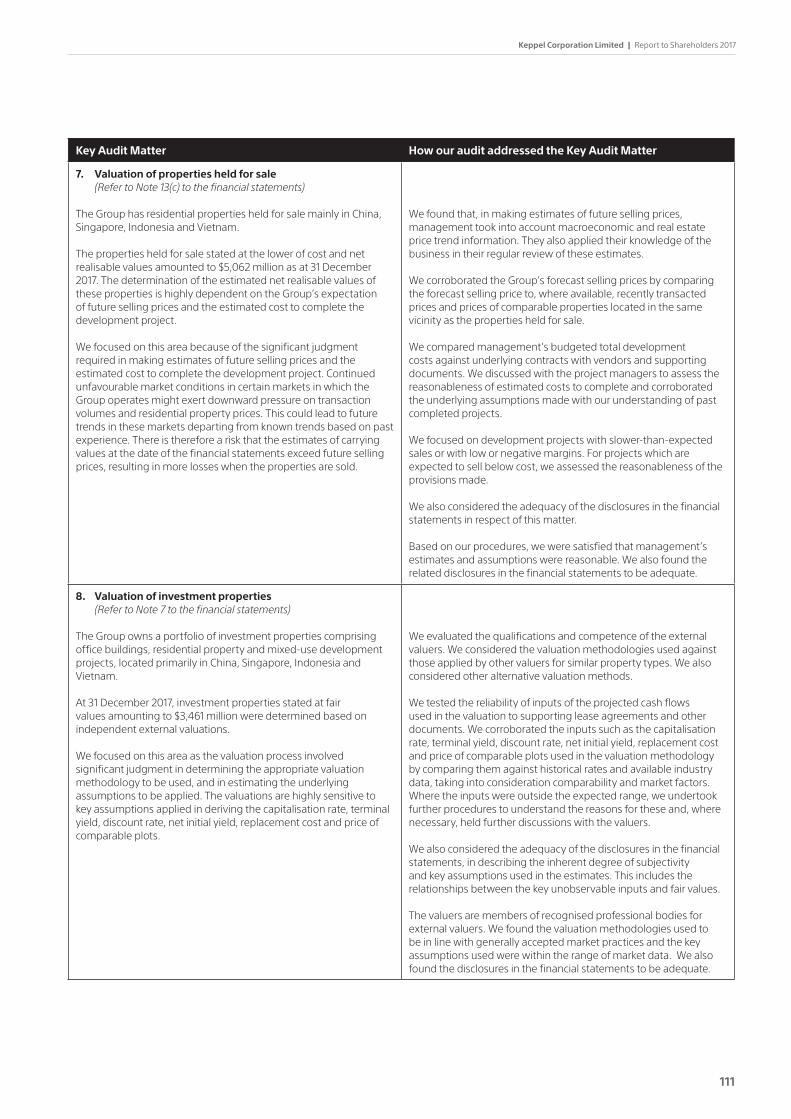
Keppel Corporation Limited | Report to Shareholders 2017
111
Key Audit Matter How our audit addressed the Key Audit Matter
7. Valuation of properties held for sale (Refer to Note 13(c) to the financial statements)
The Group has residential properties held for sale mainly in China, Singapore, Indonesia and Vietnam.
The properties held for sale stated at the lower of cost and net realisable values amounted to $5,062 million as at 31 December 2017. The determination of the estimated net realisable values of these properties is highly dependent on the Group’s expectation of future selling prices and the estimated cost to complete the development project.
We focused on this area because of the significant judgment required in making estimates of future selling prices and the estimated cost to complete the development project. Continued unfavourable market conditions in certain markets in which the Group operates might exert downward pressure on transaction volumes and residential property prices. This could lead to future trends in these markets departing from known trends based on past experience. There is therefore a risk that the estimates of carrying values at the date of the financial statements exceed future selling prices, resulting in more losses when the properties are sold.
We found that, in making estimates of future selling prices, management took into account macroeconomic and real estate price trend information. They also applied their knowledge of the business in their regular review of these estimates.
We corroborated the Group’s forecast selling prices by comparing the forecast selling price to, where available, recently transacted prices and prices of comparable properties located in the same vicinity as the properties held for sale.
We compared management’s budgeted total development costs against underlying contracts with vendors and supporting documents. We discussed with the project managers to assess the reasonableness of estimated costs to complete and corroborated the underlying assumptions made with our understanding of past completed projects.
We focused on development projects with slower-than-expected sales or with low or negative margins. For projects which are expected to sell below cost, we assessed the reasonableness of the provisions made.
We also considered the adequacy of the disclosures in the financial statements in respect of this matter.
Based on our procedures, we were satisfied that management’s estimates and assumptions were reasonable. We also found the related disclosures in the financial statements to be adequate.
8. Valuation of investment properties (Refer to Note 7 to the financial statements)
The Group owns a portfolio of investment properties comprising office buildings, residential property and mixed-use development projects, located primarily in China, Singapore, Indonesia and Vietnam.
At 31 December 2017, investment properties stated at fair values amounting to $3,461 million were determined based on independent external valuations.
We focused on this area as the valuation process involved significant judgment in determining the appropriate valuation methodology to be used, and in estimating the underlying assumptions to be applied. The valuations are highly sensitive to key assumptions applied in deriving the capitalisation rate, terminal yield, discount rate, net initial yield, replacement cost and price of comparable plots.
We evaluated the qualifications and competence of the external valuers. We considered the valuation methodologies used against those applied by other valuers for similar property types. We also considered other alternative valuation methods.
We tested the reliability of inputs of the projected cash flows used in the valuation to supporting lease agreements and other documents. We corroborated the inputs such as the capitalisation rate, terminal yield, discount rate, net initial yield, replacement cost and price of comparable plots used in the valuation methodology by comparing them against historical rates and available industry data, taking into consideration comparability and market factors. Where the inputs were outside the expected range, we undertook further procedures to understand the reasons for these and, where necessary, held further discussions with the valuers.
We also considered the adequacy of the disclosures in the financial statements, in describing the inherent degree of subjectivity and key assumptions used in the estimates. This includes the relationships between the key unobservable inputs and fair values.
The valuers are members of recognised professional bodies for external valuers. We found the valuation methodologies used to be in line with generally accepted market practices and the key assumptions used were within the range of market data. We also found the disclosures in the financial statements to be adequate.
112
Financial Report
Independent Auditor’s Report
Other informationManagement is responsible for the other information. The other information comprises the “Directors’ Statement” and other sections of the Keppel Corporation Limited Report to Shareholders 2017 (“Other Sections of the Annual Report”), but does not include the financial statements and our auditor’s report thereon. We obtained the Directors’ Statement prior to the date of this auditor’s report. The Other Sections of the Annual Report are expected to be made available to us after that date.
Our opinion on the financial statements does not cover the other information and we do not and will not express any form of assurance conclusion thereon.
In connection with our audit of the financial statements, our responsibility is to read the other information identified above and, in doing so, consider whether the other information is materially inconsistent with the financial statements or our knowledge obtained in the audit, or otherwise appears to be materially misstated.
If, based on the work we have performed on the other information that we obtained prior to the date of this auditor’s report, we conclude that there is a material misstatement of this other information, we are required to report that fact. We have nothing to report in this regard.
When we read the Other Sections of the Annual Report, if we conclude that there is a material misstatement therein, we are required to communicate the matter to those charged with governance and take appropriate actions in accordance with SSAs.
Responsibilities of Management and Directors for the Financial StatementsManagement is responsible for the preparation of financial statements that give a true and fair view in accordance with the provisions of the Act and FRSs, and for devising and maintaining a system of internal accounting controls sufficient to provide a reasonable assurance that assets are safeguarded against loss from unauthorised use or disposition; and transactions are properly authorised and that they are recorded as necessary to permit the preparation of true and fair financial statements and to maintain accountability of assets.
In preparing the financial statements, management is responsible for assessing the Group’s ability to continue as a going concern, disclosing, as applicable, matters related to going concern and using the going concern basis of accounting unless management either intends to liquidate the Group or to cease operations, or has no realistic alternative but to do so.
The directors’ responsibilities include overseeing the Group’s financial reporting process.
Auditor’s Responsibilities for the Audit of the Financial StatementsOur objectives are to obtain reasonable assurance about whether the financial statements as a whole are free from material misstatement, whether due to fraud or error, and to issue an auditor’s report that includes our opinion. Reasonable assurance is a high level of assurance, but is not a guarantee that an audit conducted in accordance with SSAs will always detect a material misstatement when it exists. Misstatements can arise from fraud or error and are considered material if, individually or in the aggregate, they could reasonably be expected to influence the economic decisions of users taken on the basis of these financial statements.
As part of an audit in accordance with SSAs, we exercise professional judgment and maintain professional skepticism throughout the audit. We also:
• Identify and assess the risks of material misstatement of the financial statements, whether due to fraud or error, design and perform audit procedures responsive to those risks, and obtain audit evidence that is sufficient and appropriate to provide a basis for our opinion. The risk of not detecting a material misstatement resulting from fraud is higher than for one resulting from error, as fraud may involve collusion, forgery, intentional omissions, misrepresentations, or the override of internal control.
• Obtain an understanding of internal control relevant to the audit in order to design audit procedures that are appropriate in the circumstances, but not for the purpose of expressing an opinion on the effectiveness of the Group’s internal control.
• Evaluate the appropriateness of accounting policies used and the reasonableness of accounting estimates and related disclosures made by management.
• Conclude on the appropriateness of management’s use of the going concern basis of accounting and, based on the audit evidence obtained, whether a material uncertainty exists related to events or conditions that may cast significant doubt on the Group’s ability to continue as a going concern. If we conclude that a material uncertainty exists, we are required to draw attention in our auditor’s report to the related disclosures in the financial statements or, if such disclosures are inadequate, to modify our opinion. Our conclusions are based on the audit evidence obtained up to the date of our auditor’s report. However, future events or conditions may cause the Group to cease to continue as a going concern.
• Evaluate the overall presentation, structure and content of the financial statements, including the disclosures, and whether the financial statements represent the underlying transactions and events in a manner that achieves fair presentation.
• Obtain sufficient appropriate audit evidence regarding the financial information of the entities or business activities within the Group to express an opinion on the financial statements. We are responsible for the direction, supervision and performance of the group audit. We remain solely responsible for our audit opinion.

Keppel Corporation Limited | Report to Shareholders 2017
113
We communicate with the directors regarding, among other matters, the planned scope and timing of the audit and significant audit findings, including any significant deficiencies in internal control that we identify during our audit.
We also provide the directors with a statement that we have complied with relevant ethical requirements regarding independence, and to communicate with them all relationships and other matters that may reasonably be thought to bear on our independence, and where applicable, related safeguards.
From the matters communicated with the directors, we determine those matters that were of most significance in the audit of the financial statements of the current period and are therefore the key audit matters. We describe these matters in our auditor’s report unless law or regulation precludes public disclosure about the matter or when, in extremely rare circumstances, we determine that a matter should not be communicated in our report because the adverse consequences of doing so would reasonably be expected to outweigh the public interest benefits of such communication.
Report on Other Legal and Regulatory RequirementsIn our opinion, the accounting and other records required by the Act to be kept by the Company and by those subsidiary corporations incorporated in Singapore of which we are the auditors have been properly kept in accordance with the provisions of the Act.
The engagement partner on the audit resulting in this independent auditor’s report is Sim Hwee Cher.
PricewaterhouseCoopers LLPPublic Accountants and Chartered AccountantsSingapore, 23 February 2018
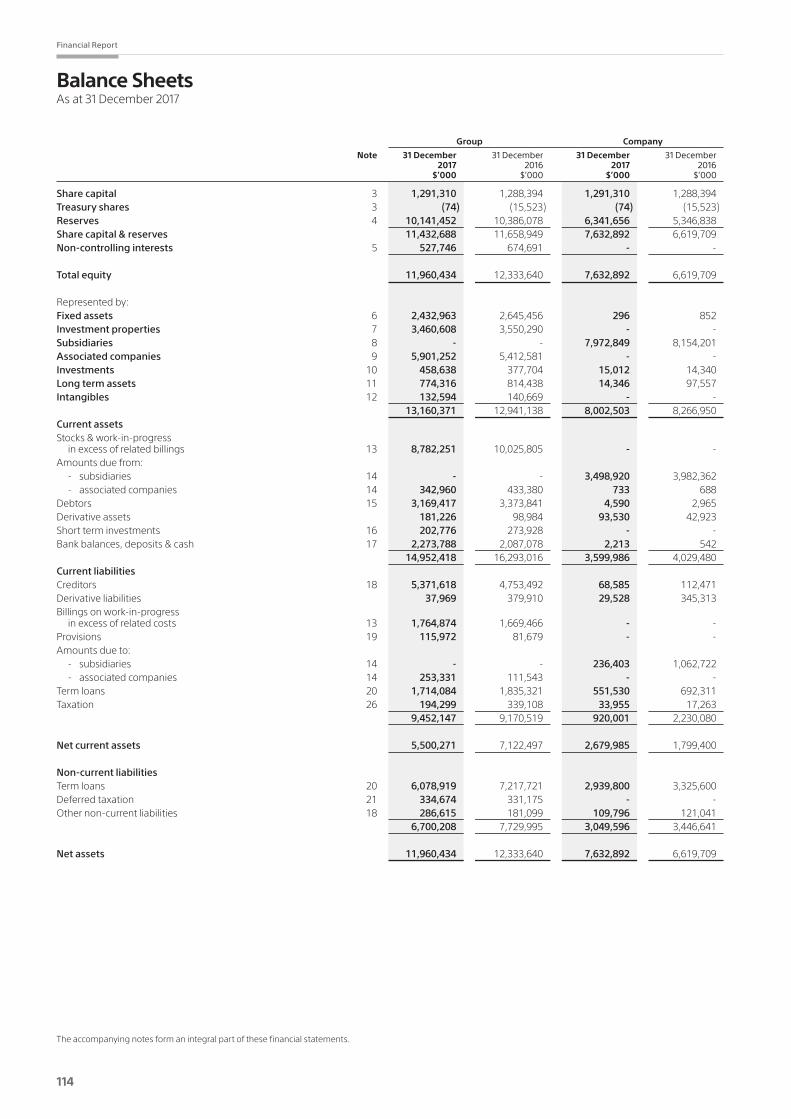
114
Financial Report
Balance SheetsAs at 31 December 2017
Group Company
Note 31 December 31 December 31 December 31 December 2017 2016 2017 2016 $’000 $’000 $’000 $’000
Share capital 3 1,291,310 1,288,394 1,291,310 1,288,394Treasury shares 3 (74) (15,523) (74) (15,523)Reserves 4 10,141,452 10,386,078 6,341,656 5,346,838Share capital & reserves 11,432,688 11,658,949 7,632,892 6,619,709Non-controlling interests 5 527,746 674,691 - -
Total equity 11,960,434 12,333,640 7,632,892 6,619,709
Represented by:Fixed assets 6 2,432,963 2,645,456 296 852Investment properties 7 3,460,608 3,550,290 - -Subsidiaries 8 - - 7,972,849 8,154,201Associated companies 9 5,901,252 5,412,581 - -Investments 10 458,638 377,704 15,012 14,340Long term assets 11 774,316 814,438 14,346 97,557Intangibles 12 132,594 140,669 - - 13,160,371 12,941,138 8,002,503 8,266,950Current assetsStocks & work-in-progress in excess of related billings 13 8,782,251 10,025,805 - -Amounts due from: - subsidiaries 14 - - 3,498,920 3,982,362 - associated companies 14 342,960 433,380 733 688Debtors 15 3,169,417 3,373,841 4,590 2,965Derivative assets 181,226 98,984 93,530 42,923Short term investments 16 202,776 273,928 - -Bank balances, deposits & cash 17 2,273,788 2,087,078 2,213 542 14,952,418 16,293,016 3,599,986 4,029,480Current liabilitiesCreditors 18 5,371,618 4,753,492 68,585 112,471Derivative liabilities 37,969 379,910 29,528 345,313Billings on work-in-progress in excess of related costs 13 1,764,874 1,669,466 - -Provisions 19 115,972 81,679 - -Amounts due to: - subsidiaries 14 - - 236,403 1,062,722 - associated companies 14 253,331 111,543 - -Term loans 20 1,714,084 1,835,321 551,530 692,311Taxation 26 194,299 339,108 33,955 17,263 9,452,147 9,170,519 920,001 2,230,080
Net current assets 5,500,271 7,122,497 2,679,985 1,799,400
Non-current liabilitiesTerm loans 20 6,078,919 7,217,721 2,939,800 3,325,600Deferred taxation 21 334,674 331,175 - -Other non-current liabilities 18 286,615 181,099 109,796 121,041 6,700,208 7,729,995 3,049,596 3,446,641
Net assets 11,960,434 12,333,640 7,632,892 6,619,709
The accompanying notes form an integral part of these financial statements.

Keppel Corporation Limited | Report to Shareholders 2017
115
The accompanying notes form an integral part of these financial statements.
Consolidated Profit and Loss AccountFor the financial year ended 31 December 2017
Note 2017 2016 $’000 $’000
Revenue 22 5,963,773 6,767,264Materials and subcontract costs (3,999,053) (4,204,065)Staff costs 23 (1,027,019) (1,155,382)Depreciation and amortisation (212,380) (236,475)Other operating income/(expenses) 50,357 (376,129)Operating profit 24 775,678 795,213One-off financial penalty & related costs i (618,722) -Investment income 25 19,871 15,179Interest income 25 137,928 124,093Interest expenses 25 (189,227) (224,549)Share of results of associated companies 9 390,039 344,986Profit before tax 515,567 1,054,922Taxation 26 (298,388) (233,147)
Profit for the year 217,179 821,775
Attributable to:Shareholders of the Company 216,668 783,928Non-controlling interests 5 511 37,847 217,179 821,775
Earnings per ordinary share 27 - basic 11.9 cts 43.2 cts - diluted 11.8 cts 42.9 cts
i One-off financial penalty and related costs arose from Keppel Offshore & Marine’s global resolution with criminal authorities in the United States, Brazil and Singapore and related legal, accounting and forensics costs.
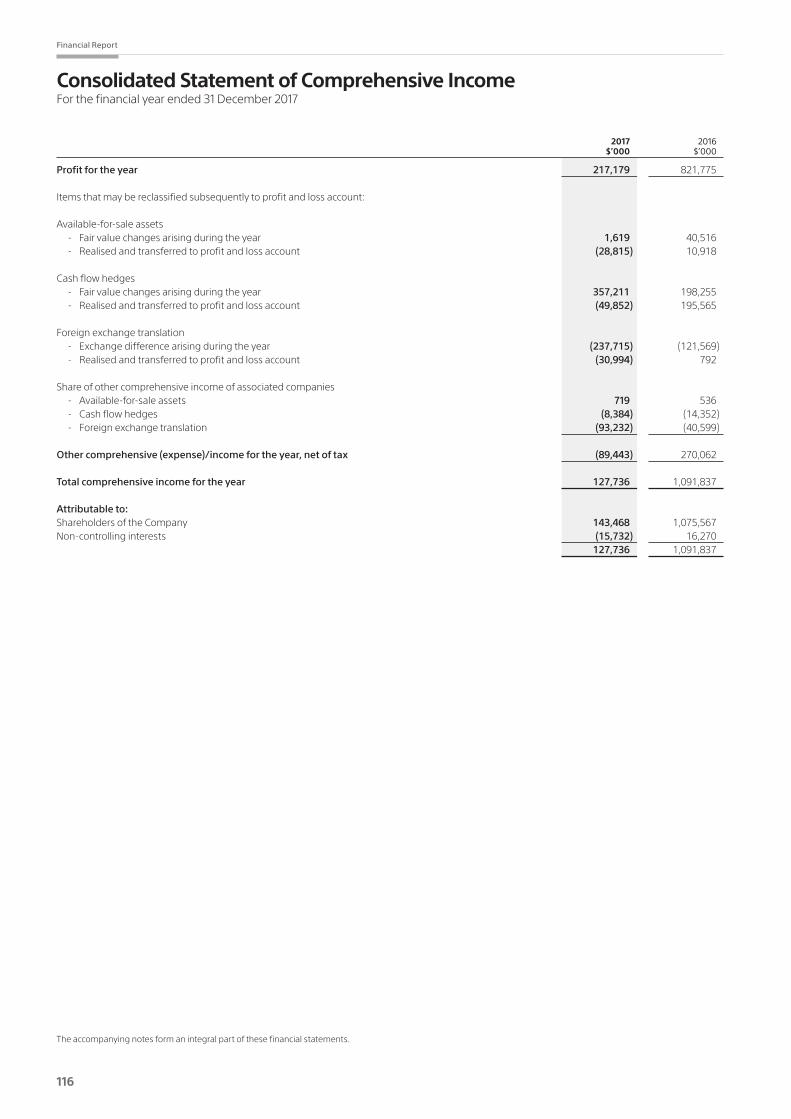
116
Financial Report
Consolidated Statement of Comprehensive IncomeFor the financial year ended 31 December 2017
The accompanying notes form an integral part of these financial statements.
2017 2016 $’000 $’000
Profit for the year 217,179 821,775
Items that may be reclassified subsequently to profit and loss account:
Available-for-sale assets - Fair value changes arising during the year 1,619 40,516 - Realised and transferred to profit and loss account (28,815) 10,918
Cash flow hedges - Fair value changes arising during the year 357,211 198,255 - Realised and transferred to profit and loss account (49,852) 195,565
Foreign exchange translation - Exchange difference arising during the year (237,715) (121,569) - Realised and transferred to profit and loss account (30,994) 792
Share of other comprehensive income of associated companies - Available-for-sale assets 719 536 - Cash flow hedges (8,384) (14,352) - Foreign exchange translation (93,232) (40,599)
Other comprehensive (expense)/income for the year, net of tax (89,443) 270,062
Total comprehensive income for the year 127,736 1,091,837
Attributable to:Shareholders of the Company 143,468 1,075,567Non-controlling interests (15,732) 16,270 127,736 1,091,837

Keppel Corporation Limited | Report to Shareholders 2017
117
The accompanying notes form an integral part of these financial statements.
Statements of Changes in EquityFor the financial year ended 31 December 2017
Attributable to owners of the Company
Foreign Exchange Share Non- Share Treasury Capital Revenue Translation Capital & controlling Total Capital Shares Reserves Reserves Account Reserves Interests Equity $’000 $’000 $’000 $’000 $’000 $’000 $’000 $’000
Group2017As at 1 January 1,288,394 (15,523) 11,486 10,655,379 (280,787) 11,658,949 674,691 12,333,640
Total comprehensive income for the yearProfit for the year - - - 216,668 - 216,668 511 217,179Other comprehensive income * - - 272,022 - (345,222) (73,200) (16,243) (89,443)Total comprehensive income for the year - - 272,022 216,668 (345,222) 143,468 (15,732) 127,736 Transactions with owners, recognised directly in equityContributions by and distributions to owners Dividends paid (Note 28) - - - (363,531) - (363,531) - (363,531)Share-based payment - - 31,124 - - 31,124 470 31,594Dividend paid to non-controlling shareholders - - - - - - (26,574) (26,574)Shares issued 2,916 - - - - 2,916 - 2,916Purchase of treasury shares - (19,428) - - - (19,428) - (19,428)Treasury shares reissued pursuant to share plans and share option scheme - 34,877 (33,503) - - 1,374 - 1,374 Transfer of statutory, capital and other reserves to revenue reserves - - 22,462 (22,462) - - - -Cash subscribed by non-controlling shareholders - - - - - - 77 77Contributions to defined benefits plans - - 707 - - 707 152 859Other adjustments - - - - - - 3,368 3,368Total contributions by and distributions to owners 2,916 15,449 20,790 (385,993) - (346,838) (22,507) (369,345)
Changes in ownership interests in subsidiaries Acquisition of additional interest in subsidiaries - - (22,891) - - (22,891) (43,489) (66,380)Disposal of interest in subsidiaries - - - - - - (69,451) (69,451)Other adjustments - - - - - - 4,234 4,234Total change in ownership interests in subsidiaries - - (22,891) - - (22,891) (108,706) (131,597)Total transactions with owners 2,916 15,449 (2,101) (385,993) - (369,729) (131,213) (500,942)
As at 31 December 1,291,310 (74) 281,407 10,486,054 (626,009) 11,432,688 527,746 11,960,434
* Details of other comprehensive income have been included in the consolidated statement of comprehensive income.
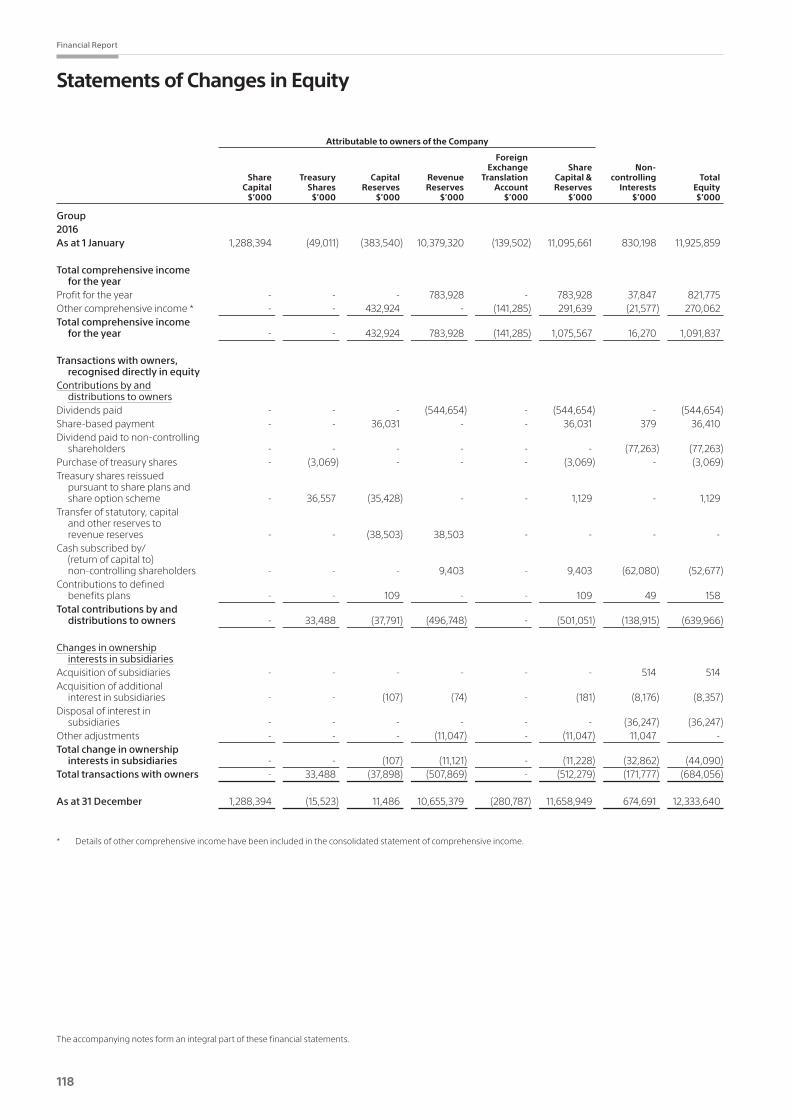
118
Financial Report
The accompanying notes form an integral part of these financial statements.
Attributable to owners of the Company
Foreign Exchange Share Non- Share Treasury Capital Revenue Translation Capital & controlling Total Capital Shares Reserves Reserves Account Reserves Interests Equity $’000 $’000 $’000 $’000 $’000 $’000 $’000 $’000
Group2016As at 1 January 1,288,394 (49,011) (383,540) 10,379,320 (139,502) 11,095,661 830,198 11,925,859
Total comprehensive income for the yearProfit for the year - - - 783,928 - 783,928 37,847 821,775Other comprehensive income * - - 432,924 - (141,285) 291,639 (21,577) 270,062Total comprehensive income for the year - - 432,924 783,928 (141,285) 1,075,567 16,270 1,091,837
Transactions with owners, recognised directly in equityContributions by and distributions to owners Dividends paid - - - (544,654) - (544,654) - (544,654)Share-based payment - - 36,031 - - 36,031 379 36,410 Dividend paid to non-controlling shareholders - - - - - - (77,263) (77,263)Purchase of treasury shares - (3,069) - - - (3,069) - (3,069)Treasury shares reissued pursuant to share plans and share option scheme - 36,557 (35,428) - - 1,129 - 1,129 Transfer of statutory, capital and other reserves to revenue reserves - - (38,503) 38,503 - - - -Cash subscribed by/ (return of capital to) non-controlling shareholders - - - 9,403 - 9,403 (62,080) (52,677)Contributions to defined benefits plans - - 109 - - 109 49 158 Total contributions by and distributions to owners - 33,488 (37,791) (496,748) - (501,051) (138,915) (639,966)
Changes in ownership interests in subsidiaries Acquisition of subsidiaries - - - - - - 514 514 Acquisition of additional interest in subsidiaries - - (107) (74) - (181) (8,176) (8,357)Disposal of interest in subsidiaries - - - - - - (36,247) (36,247)Other adjustments - - - (11,047) - (11,047) 11,047 -Total change in ownership interests in subsidiaries - - (107) (11,121) - (11,228) (32,862) (44,090)Total transactions with owners - 33,488 (37,898) (507,869) - (512,279) (171,777) (684,056)
As at 31 December 1,288,394 (15,523) 11,486 10,655,379 (280,787) 11,658,949 674,691 12,333,640
* Details of other comprehensive income have been included in the consolidated statement of comprehensive income.
Statements of Changes in Equity

Keppel Corporation Limited | Report to Shareholders 2017
119
The accompanying notes form an integral part of these financial statements.
Share Treasury Capital Revenue Capital Shares Reserves Reserves Total $’000 $’000 $’000 $’000 $’000
Company2017As at 1 January 1,288,394 (15,523) 213,116 5,133,722 6,619,709
Total comprehensive income for the yearProfit for the year - - - 1,361,959 1,361,959Other comprehensive income - - 672 - 672Total comprehensive income for the year - - 672 1,361,959 1,362,631
Transactions with owners, recognised directly in equityDividends paid - - - (363,531) (363,531)Share-based payment - - 29,221 - 29,221Shares issued 2,916 - - - 2,916Purchase of treasury shares - (19,428) - - (19,428)Treasury shares reissued pursuant to share plans and share option scheme - 34,877 (33,503) - 1,374Total transactions with owners 2,916 15,449 (4,282) (363,531) (349,448)
As at 31 December 1,291,310 (74) 209,506 6,132,150 7,632,892
Company2016As at 1 January 1,288,394 (49,011) 199,713 5,408,710 6,847,806
Total comprehensive income for the yearProfit for the year - - - 269,666 269,666 Other comprehensive income - - 14,340 - 14,340 Total comprehensive income for the year - - 14,340 269,666 284,006
Transactions with owners, recognised directly in equityDividends paid - - - (544,654) (544,654)Share-based payment - - 34,491 - 34,491 Purchase of treasury shares - (3,069) - - (3,069)Treasury shares reissued pursuant to share plans and share option scheme - 36,557 (35,428) - 1,129 Total transactions with owners - 33,488 (937) (544,654) (512,103)
As at 31 December 1,288,394 (15,523) 213,116 5,133,722 6,619,709
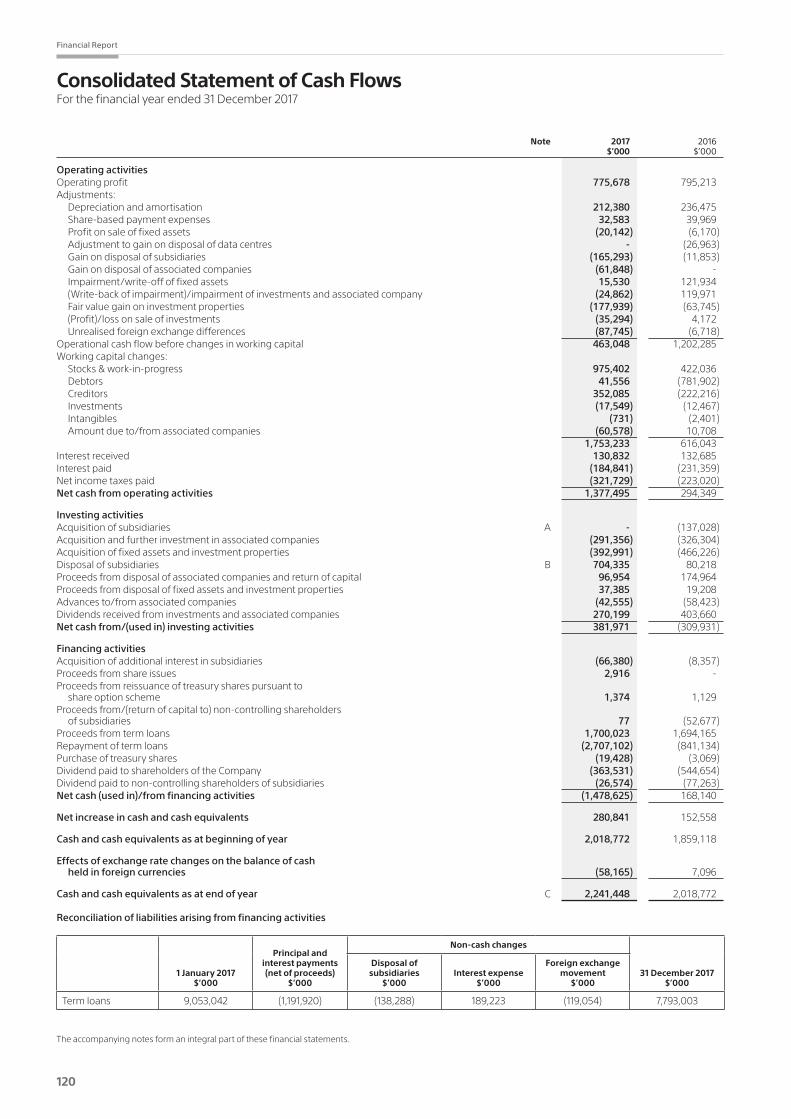
120
Financial Report
Consolidated Statement of Cash FlowsFor the financial year ended 31 December 2017
The accompanying notes form an integral part of these financial statements.
Note 2017 2016 $’000 $’000
Operating activitiesOperating profit 775,678 795,213Adjustments: Depreciation and amortisation 212,380 236,475 Share-based payment expenses 32,583 39,969 Profit on sale of fixed assets (20,142) (6,170) Adjustment to gain on disposal of data centres - (26,963) Gain on disposal of subsidiaries (165,293) (11,853) Gain on disposal of associated companies (61,848) - Impairment/write-off of fixed assets 15,530 121,934 (Write-back of impairment)/impairment of investments and associated company (24,862) 119,971 Fair value gain on investment properties (177,939) (63,745) (Profit)/loss on sale of investments (35,294) 4,172 Unrealised foreign exchange differences (87,745) (6,718)Operational cash flow before changes in working capital 463,048 1,202,285Working capital changes: Stocks & work-in-progress 975,402 422,036 Debtors 41,556 (781,902) Creditors 352,085 (222,216) Investments (17,549) (12,467) Intangibles (731) (2,401) Amount due to/from associated companies (60,578) 10,708 1,753,233 616,043Interest received 130,832 132,685Interest paid (184,841) (231,359)Net income taxes paid (321,729) (223,020)Net cash from operating activities 1,377,495 294,349
Investing activitiesAcquisition of subsidiaries A - (137,028)Acquisition and further investment in associated companies (291,356) (326,304)Acquisition of fixed assets and investment properties (392,991) (466,226)Disposal of subsidiaries B 704,335 80,218Proceeds from disposal of associated companies and return of capital 96,954 174,964Proceeds from disposal of fixed assets and investment properties 37,385 19,208Advances to/from associated companies (42,555) (58,423)Dividends received from investments and associated companies 270,199 403,660Net cash from/(used in) investing activities 381,971 (309,931)
Financing activitiesAcquisition of additional interest in subsidiaries (66,380) (8,357)Proceeds from share issues 2,916 -Proceeds from reissuance of treasury shares pursuant to share option scheme 1,374 1,129Proceeds from/(return of capital to) non-controlling shareholders of subsidiaries 77 (52,677)Proceeds from term loans 1,700,023 1,694,165Repayment of term loans (2,707,102) (841,134)Purchase of treasury shares (19,428) (3,069)Dividend paid to shareholders of the Company (363,531) (544,654)Dividend paid to non-controlling shareholders of subsidiaries (26,574) (77,263)Net cash (used in)/from financing activities (1,478,625) 168,140
Net increase in cash and cash equivalents 280,841 152,558
Cash and cash equivalents as at beginning of year 2,018,772 1,859,118
Effects of exchange rate changes on the balance of cash held in foreign currencies (58,165) 7,096
Cash and cash equivalents as at end of year C 2,241,448 2,018,772
Reconciliation of liabilities arising from financing activities
1 January 2017$’000
Principal and interest payments (net of proceeds)
$’000
Non-cash changes
31 December 2017$’000
Disposal of subsidiaries
$’000Interest expense
$’000
Foreign exchange movement
$’000
Term loans 9,053,042 (1,191,920) (138,288) 189,223 (119,054) 7,793,003
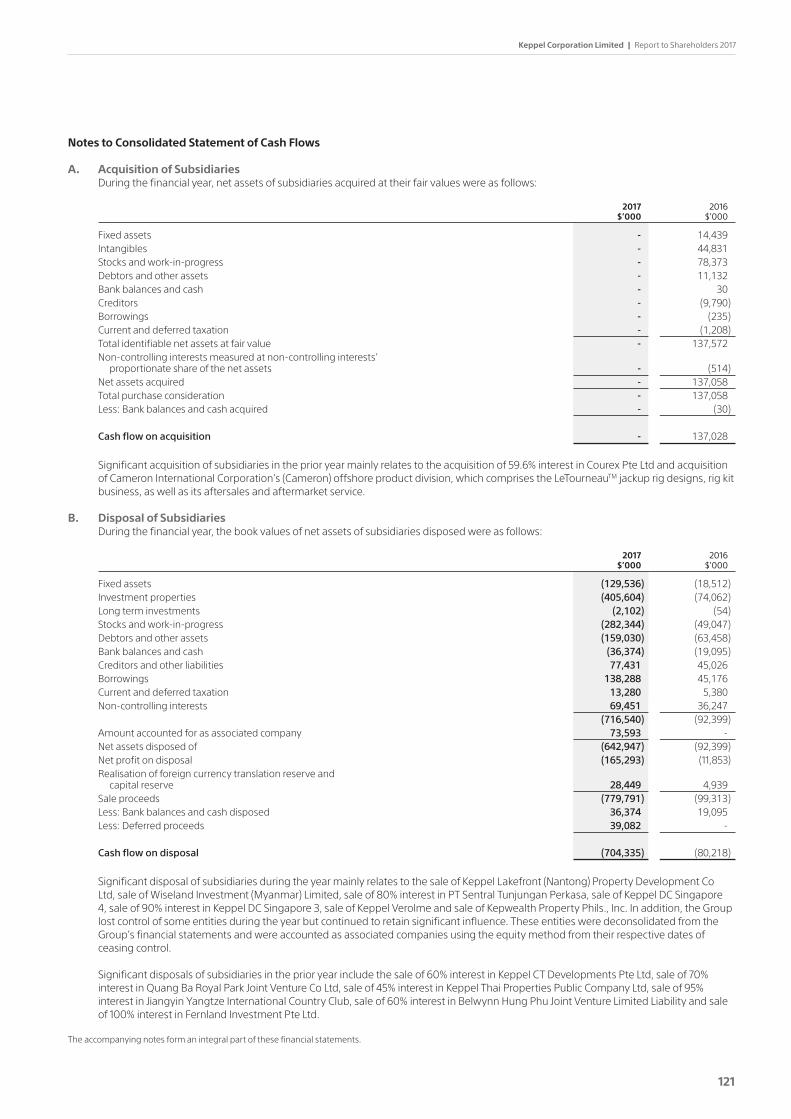
Keppel Corporation Limited | Report to Shareholders 2017
121
The accompanying notes form an integral part of these financial statements.
Notes to Consolidated Statement of Cash Flows
A. Acquisition of Subsidiaries During the financial year, net assets of subsidiaries acquired at their fair values were as follows:
2017 2016 $’000 $’000
Fixed assets - 14,439 Intangibles - 44,831 Stocks and work-in-progress - 78,373 Debtors and other assets - 11,132 Bank balances and cash - 30 Creditors - (9,790) Borrowings - (235) Current and deferred taxation - (1,208) Total identifiable net assets at fair value - 137,572 Non-controlling interests measured at non-controlling interests’
proportionate share of the net assets - (514) Net assets acquired - 137,058 Total purchase consideration - 137,058 Less: Bank balances and cash acquired - (30)
Cash flow on acquisition - 137,028
Significantacquisitionofsubsidiariesintheprioryearmainlyrelatestotheacquisitionof59.6%interestinCourexPteLtdandacquisitionof Cameron International Corporation’s (Cameron) offshore product division, which comprises the LeTourneauTM jackup rig designs, rig kit business, as well as its aftersales and aftermarket service.
B. Disposal of Subsidiaries During the financial year, the book values of net assets of subsidiaries disposed were as follows:
2017 2016 $’000 $’000
Fixed assets (129,536) (18,512) Investment properties (405,604) (74,062) Long term investments (2,102) (54) Stocks and work-in-progress (282,344) (49,047) Debtors and other assets (159,030) (63,458) Bank balances and cash (36,374) (19,095) Creditors and other liabilities 77,431 45,026 Borrowings 138,288 45,176 Current and deferred taxation 13,280 5,380 Non-controlling interests 69,451 36,247 (716,540) (92,399) Amount accounted for as associated company 73,593 - Net assets disposed of (642,947) (92,399) Net profit on disposal (165,293) (11,853) Realisation of foreign currency translation reserve and
capital reserve 28,449 4,939 Sale proceeds (779,791) (99,313) Less: Bank balances and cash disposed 36,374 19,095 Less: Deferred proceeds 39,082 -
Cash flow on disposal (704,335) (80,218)
Significant disposal of subsidiaries during the year mainly relates to the sale of Keppel Lakefront (Nantong) Property Development Co Ltd,saleofWiselandInvestment(Myanmar)Limited,saleof80%interestinPTSentralTunjunganPerkasa,saleofKeppelDCSingapore4,saleof90%interestinKeppelDCSingapore3,saleofKeppelVerolmeandsaleofKepwealthPropertyPhils.,Inc.Inaddition,theGrouplost control of some entities during the year but continued to retain significant influence. These entities were deconsolidated from the Group’s financial statements and were accounted as associated companies using the equity method from their respective dates of ceasing control.
Significantdisposalsofsubsidiariesintheprioryearincludethesaleof60%interestinKeppelCTDevelopmentsPteLtd,saleof70%interestinQuangBaRoyalParkJointVentureCoLtd,saleof45%interestinKeppelThaiPropertiesPublicCompanyLtd,saleof95%interestinJiangyinYangtzeInternationalCountryClub,saleof60%interestinBelwynnHungPhuJointVentureLimitedLiabilityandsaleof100%interestinFernlandInvestmentPteLtd.

122
Financial Report
Consolidated Statement of Cash Flows
Notes to Consolidated Statement of Cash Flows (continued)
C. Cash and Cash Equivalents Cash and cash equivalents consist of cash on hand and balances with banks. Cash and cash equivalents in the consolidated statement of
cash flows comprise the following balance sheet amounts:
2017 2016 $’000 $’000
Bank balances, deposits and cash 2,273,788 2,087,078
Amounts held under escrow accounts for overseas acquisition of land, payment of construction cost and liabilities (32,340) (68,306)
2,241,448 2,018,772
The accompanying notes form an integral part of these financial statements.
Keppel Corporation Limited | Report to Shareholders 2017
123
Notes to the Financial StatementsFor the financial year ended 31 December 2017
These notes form an integral part of and should be read in conjunction with the accompanying financial statements.
1. General The Company is incorporated and domiciled in Singapore and is listed on the Singapore Exchange Securities Trading Limited. The
address of its principal place of business and registered office is 1 HarbourFront Avenue #18-01, Keppel Bay Tower, Singapore 098632.
The Company’s principal activity is that of an investment holding and management company.
The principal activities of the companies in the Group consist of:
- offshore oil-rig construction, shipbuilding & shiprepair and conversion;- environmental engineering, power generation, logistics and data centres; - property development & investment; and- investments and asset management.
There has been no significant change in the nature of these principal activities during the financial year.
The financial statements of the Group for the financial year ended 31 December 2017 and the balance sheet and statement of changes in equity of the Company at 31 December 2017 were authorised for issue in accordance with a resolution of the Board of Directors on
23 February 2018.
2. Significant accounting policies
(a) Basis of Preparation The financial statements have been prepared in accordance with the provisions of the Singapore Companies Act and Singapore
Financial Reporting Standards (“FRS”). The financial statements have been prepared under the historical cost convention, except as disclosed in the accounting policies below.
Adoption of New and Revised Standards In the current year, the Group adopted the new/revised FRS that are effective for annual periods beginning on or after 1 January
2017. Changes to the Group’s accounting policies have been made as required, in accordance with the transitional provisions in the respective FRS.
The following are the new or amended FRS that are relevant to the Group:
• Improvements to Financial Reporting Standards (December 2016)• Amendments to FRS 7 Statement of Cash Flows: Disclosure Initiative• Amendments to FRS 12 Income Taxes: Recognition of Deferred Tax Assets for Unrealised Losses
The adoption of the above new or amended FRS did not have any significant impact on the financial statements of the Group.
(b) Basis of Consolidation The consolidated financial statements incorporate the financial statements of the Company and entities (including structured
entities) controlled by the Company and its subsidiaries.
The financial statements of subsidiaries acquired or disposed of during the financial year are included or excluded from the consolidated financial statements from their respective dates of obtaining control or ceasing control. All intercompany transactions, balances and unrealised gains on transactions between group companies are eliminated. Unrealised losses are also eliminated unless the transaction provides evidence of an impairment of the asset transferred. Where necessary, adjustments are made to the financial statements of subsidiaries to ensure consistency of accounting policies with those of the Group.
Acquisition of subsidiaries is accounted for using the acquisition method. The cost of an acquisition is measured at the aggregate of the fair value of the assets transferred, equity instruments issued, liabilities incurred or assumed at the date of exchange and the fair values of any contingent consideration arrangement and any pre-existing equity interest in the subsidiary. Acquisition-related costs are recognised in the profit and loss account as incurred. Identifiable assets acquired and liabilities and contingent liabilities assumed in a business combination are measured initially at their fair values at the acquisition date, irrespective of the extent of any non-controlling interests, except for deferred tax assets/liabilities, share-based related accounts and assets held for sale.
Any excess of the cost of business combination over the Group’s interest in the net fair value of the identifiable assets, liabilities and contingent liabilities represents goodwill. Any excess of the Group’s interest in the net fair value of the identifiable assets, liabilities and contingent liabilities over the cost of business combination is recognised in the profit and loss account on the date of acquisition.
Changes in the Group’s interest in a subsidiary that do not result in a loss of control are accounted for as equity transactions. The carrying amounts of the Group’s interests and the non-controlling interests are adjusted and the difference between the change in the carrying amounts of the non-controlling interests and the fair value of the consideration paid or received is recognised directly in equity and attributed to owners of the Company.

124
Financial Report
Notes to the Financial Statements
2. Significant accounting policies (continued)
When control of a subsidiary is lost as a result of a transaction, event or other circumstance, the Group derecognises all assets (including any goodwill), liabilities and non-controlling interests at their carrying amounts. Amounts previously recognised in other comprehensive income in respect of that former subsidiary are reclassified to the profit and loss account or transferred directly to revenue reserves if required by a specific Standard. Any retained interest in the former subsidiary is recognised at its fair value at the date control is lost, with the gain or loss arising recognised in the profit and loss account.
On a transaction-by-transaction basis, the measurement of non-controlling interests is either at fair value or at the non-controlling interests’ share of the fair value of the identifiable net assets of the acquiree.
Contingent consideration is measured at fair value at the acquisition date; subsequent adjustments to the consideration are recognised against goodwill only to the extent that they arise from better information about the fair value at the acquisition date, and they occur within the ‘measurement period’ (a maximum of 12 months from the acquisition date). All other subsequent adjustments are recognised in the profit and loss account.
Non-controlling interests are that part of the net results of operations and of net assets of a subsidiary attributable to the interests which are not owned directly or indirectly by the owners of the Company. They are shown separately in the consolidated statement of comprehensive income, statement of changes in equity and balance sheet. Total comprehensive income is attributed to the non-controlling interests in a subsidiary based on their respective interests in a subsidiary, even if this results in the non-controlling interests having a deficit balance.
(c) Fixed Assets Fixed assets are initially stated at cost and subsequently carried at cost less accumulated depreciation and accumulated
impairment loss, if any. The cost initially recognised includes its purchase price and any cost that is directly attributable to bringing the asset to the location and condition necessary for it to be capable of operating in the manner intended by management. Subsequent expenditure is added to the carrying amount only when it is probable that future economic benefits will flow to the entity and the cost can be measured reliably. When the carrying amount of an asset is greater than its estimated recoverable amount, it is written down to its recoverable amount. Profits or losses on disposal of fixed assets are included in the profit and loss account.
Depreciation of fixed assets is calculated on a straight-line basis to write off the cost of the fixed assets over their estimated useful lives. No depreciation is provided on freehold land and capital work-in-progress. The estimated useful lives of other fixed assets are as follows:
Buildings on freehold land 20 to 50 years Leasehold land & buildings Over period of lease (ranging from 15 to 60 years) Vessels & floating docks 10 to 20 years Plant, machinery & equipment 3 to 30 years Furniture, fittings & office equipment 2 to 10 years Cranes 5 to 30 years Small equipment and tools 2 to 20 years
The estimated useful lives, residual values and depreciation method are reviewed at each year end, with the effect of any changes in estimate accounted for on a prospective basis.
(d) Investment Properties Investment properties comprise completed properties and properties under construction or re-development held to earn rental
and/or for capital appreciation. Investment properties are initially recognised at cost and subsequently measured at fair value, determined annually based on valuations by independent professional valuers. Changes in fair value are recognised in the profit and loss account.
The cost of major renovations or improvements is capitalised and the carrying amounts of the replaced components are recognised in the profit and loss account.
On disposal of an investment property, the difference between the disposal proceeds and the carrying amount is recognised in the profit and loss account.

Keppel Corporation Limited | Report to Shareholders 2017
125
(e) Subsidiaries A subsidiary is an entity (including structured entities) over which the Group has control. The Group controls an entity when the
Group is exposed to, or has rights to, variable returns from its involvement with the entity and has the ability to affect those returns through its power over the entity. The Company reassesses whether or not it controls an investee if facts and circumstances indicate that there are changes to one or more of the three elements of control listed above.
When the Company has less than a majority of the voting rights of an investee, it has power over the investee when the voting rights are sufficient to give it the practical ability to direct the relevant activities of the investee unilaterally. The Company considers all relevant facts and circumstances in assessing whether or not the Company’s voting rights in an investee are sufficient to give it power, including:
- The size of the Company’s holding of voting rights relative to the size and dispersion of holdings of the other vote holders;- Potential voting rights held by the Company, other vote holders or other parties;- Rights arising from other contractual arrangements; and- Any additional facts and circumstances that indicate that the Company has, or does not have, the current ability to direct the
relevant activities at the time that decisions need to be made, including voting patterns at previous shareholders’ meetings.
Investments in subsidiaries are stated in the financial statements of the Company at cost less accumulated impairment losses. On disposal of a subsidiary, the difference between net disposal proceeds and carrying amount of the investment is taken to profit or loss.
(f) Associated Companies An associated company is an entity, not being a subsidiary, over which the Group has significant influence, but not control.
Investments in associated companies are stated in the Company’s financial statements at cost less any impairment losses. On disposal of an associated company, the difference between net disposal proceeds and the carrying amount of the investment is taken to the profit and loss account.
Investments in associated companies are accounted for in the consolidated financial statements using the equity method of accounting less impairment loss, if any. The Group’s share of profit or loss and other comprehensive income of the associated company is included in the consolidated profit and loss account and other comprehensive income respectively. The Group’s share of net assets of the associated company is included in the consolidated balance sheet.
Any excess of the cost of acquisition over the Group’s share of net identifiable assets, liabilities and contingent liabilities of the associated company recognised at the date of acquisition measured at their fair values is recognised as goodwill. The goodwill is included within the carrying amount of the investment and is assessed for impairment as part of the investment. Any excess of the Group’s share of the net identifiable assets, liabilities and contingent liabilities measured at their fair values over the cost of acquisition, after reassessment, is recognised immediately in the profit and loss account as a bargain purchase gain.
(g) Intangibles Goodwill Goodwill is measured as the excess of the sum of the consideration transferred, the amount of any non-controlling interest
in the acquiree and the fair value of the acquirer’s previously held equity interest (if any) in the entity over the net identifiable assets acquired and the liabilities assumed measured at their fair values at acquisition date. Goodwill is initially recognised as an asset at cost and is subsequently measured at cost less any impairment losses. If the Group’s interest in the fair value of the acquiree’s identifiable net assets exceeds the sum of the consideration transferred, the amount of any non-controlling interests in the acquiree and the fair value of the acquirer’s previously held equity interest in the acquiree (if any), the excess is recognised immediately in the profit and loss account as a bargain purchase gain.
Management Rights Management rights acquired is initially recognised at cost and subsequently carried at cost less accumulated impairment losses, if
any. The useful life of the management rights is estimated to be indefinite because management believes there is no foreseeable limit to the period over which the management rights is expected to generate net cash inflows for the Group.
Other Intangible Assets Intangible assets include development expenditure, customer contracts and customer relationships initially recognised at cost
and subsequently carried at cost less accumulated amortisation. Costs incurred which are expected to generate future economic benefits are recognised as intangibles and amortised on a straight line basis over their useful lives, ranging from 3 to 20 years.

126
Financial Report
Notes to the Financial Statements
2. Significant accounting policies (continued)
(h) Investments Investments are classified as held for trading or available-for-sale. Investments acquired for the purpose of selling in the short
term are classified as held for trading. Other investments held by the Group are classified as available-for-sale.
Investments are recognised and derecognised on the trade date where the purchase or sale of an investment is under a contract whose terms required delivery of investment within the timeframe established by the market concerned.
Investments are initially measured at fair value plus transaction costs except for investments held for trading, which are recognised at fair value. Transaction costs for investments held for trading are recognised immediately as expenses. Investments are subsequently carried at fair value. For unquoted equity investments whose fair value cannot be reliably measured using alternative valuation methods, they are carried at cost less any impairment loss.
For investments held for trading, gains and losses arising from changes in fair value are included in the profit and loss account.
For available-for-sale investments, gains and losses arising from changes in fair value are recognised directly in other comprehensive income and accumulated in the fair value reserve, until the investment is disposed of or is determined to be impaired, at which time the cumulative gain or loss previously recognised in other comprehensive income is reclassified to the profit and loss account.
The fair value of investments that are traded in active markets is based on quoted market prices at the balance sheet date. The quoted market prices are the current bid prices. The fair value of investments that are not traded in an active market is determined using valuation techniques. Such techniques include using recent arm’s length transactions, reference to the underlying net asset value of the investee companies and discounted cash flow analysis.
(i) Derivative Financial Instruments and Hedge Accounting Derivative financial instruments are initially recognised at fair value on the date a derivative contract is entered into and are
subsequently re-measured at fair value. Derivative financial instruments are carried as assets when the fair value is positive and as liabilities when the fair value is negative.
Gains or losses arising from changes in fair value of derivative financial instruments that do not qualify for hedge accounting are taken to the profit and loss account.
For cash flow hedges, the effective portion of the gains or losses on the hedging instrument is recognised directly in other comprehensive income and accumulated in the hedging reserve, while the ineffective portion is recognised in the profit and loss account. Amounts taken to other comprehensive income are reclassified to the profit and loss account when the hedged transaction affects the profit and loss account.
The Group documents at the inception of the transaction the relationship between the hedging instruments and hedged items, as well as its risk management objective and strategies for undertaking various transactions. The Group also documents its assessment, both at hedge inception and on an ongoing basis, of whether the derivatives designated as hedging instruments are highly effective in offsetting changes in fair value or cash flows of the hedged items.
The fair value of forward foreign currency contracts is determined using forward exchange market rates at the balance sheet date. The fair value of High Sulphur Fuel Oil (“HSFO”) and Dated Brent forward contracts is determined using forward HSFO and Dated Brent prices provided by the Group’s key counterparty. The fair value of electricity future contracts is determined based on the Uniform Singapore Energy Price quarterly base load electricity futures prices quoted on the Singapore Exchange. The fair value of interest rate caps and interest rate swaps are based on valuations provided by the Group’s bankers.
(j) Financial Assets Financial assets include cash and bank balances, trade, intercompany and other receivables and investments. Trade,
intercompany and other receivables are stated initially at fair value and subsequently at amortised cost as reduced by appropriate allowances for estimated irrecoverable amounts.
For the purpose of the consolidated statement of cash flows, cash and cash equivalents comprise cash on hand and bank deposits and are subject to an insignificant risk of changes in value. For cash subjected to restriction, assessment is made on the economic substance of the restriction and whether they meet the definition of cash and cash equivalents.
Financial assets and financial liabilities are offset and the net amount presented in the balance sheet when the Company and the Group has a legally enforceable right to set off the recognised amounts; and intends either to settle on a net basis, or to realise the asset and settle the liability simultaneously. A right to set-off must be available today rather than being contingent on a future event and must be exercisable by any of the counterparties, both in the normal course of business and in the event of default, insolvency or bankruptcy.
Keppel Corporation Limited | Report to Shareholders 2017
127
(k) Stocks & Work-in-Progress Stocks (including work-in-progress), consumable materials and supplies are stated at the lower of cost and net realisable value,
cost being principally determined on the weighted average method. Net realisable value is the estimated selling price in the ordinary course of business, less the estimated costs of completion and applicable variable selling expenses.
For work-in-progress in relation to construction contract, when contract costs incurred to date plus recognised profits less recognised losses exceed progress billings, the surplus is shown as amounts due from customers for contract work. For contracts where progress billings exceed contract costs incurred to date plus recognised profits less recognised losses, the surplus is shown as work-in-progress (billings in excess of costs). Amounts received before the related work is performed are included in the statement of financial position, as a liability, as work-in-progress (billings in excess of costs). Amounts billed for work performed but not yet paid by the customer are included in the balance sheet under debtors. When it is probable that total contract costs will exceed total contract revenue, the expected loss is recognised as an expense immediately.
Completed properties held for sale are stated at the lower of cost and net realisable value. Cost includes cost of land and construction, related overhead expenditure, financing charges and other net costs incurred during the period of development.
Properties held for sale are stated at the lower of cost and net realisable value. Cost includes cost of land and construction, related overheads expenditure, and financing charges incurred during the period of development. Net realisable value represents the estimated selling price less costs to be incurred in selling the property. Upon completion of construction, they are transferred to completed properties held for sale.
Each property under development is accounted for as a separate project. Where a project comprises more than one component or phase with a separate temporary occupation permit, each component or phase is treated as a separate project, and interest and other net costs are apportioned accordingly.
(l) Impairment of Assets Financial Assets The Group assesses at each balance sheet date whether there is objective evidence that a financial asset or a group of financial
assets is impaired and recognises an allowance for impairment when such evidence exists.
Loans and receivables Significant financial difficulties of the debtor and default or significant delay in payments are objective evidence that the financial
assets are impaired. The carrying amount of these assets is reduced through the use of an allowance account and the loss is recognised in the profit and loss account. When the asset becomes uncollectible, the carrying amount is written off against the allowance account. If, in a subsequent period, the amount of the impairment loss decreases and the decrease can be objectively measured, the previously recognised impairment loss is reversed to the extent that the carrying amount does not exceed the amortised cost had no impairment been recognised in the prior periods. The amount of reversal is recognised in the profit and loss account.
Investments In addition to the objective evidence of impairment described in the preceding paragraph, significant or prolonged decline in the
fair value of the investment below its cost is considered in determining whether the investment is impaired. If any such evidence exists for available-for-sale financial assets, the cumulative loss - measured as the difference between the acquisition cost and the current fair value, less any impairment loss on that financial asset previously recognised in the profit and loss account - is removed from equity and recognised in the profit and loss account. For available-for-sale equity investments, impairment losses previously recognised in the profit and loss account are not reversed through the profit and loss account in a subsequent period.
Goodwill Goodwill is tested for impairment annually and whenever there is an indication that the goodwill may be impaired. Goodwill
included in the carrying amount of an associated company is tested for impairment as part of the investment.
For the purpose of impairment testing, goodwill is allocated to each of the Group’s cash-generating units (“CGU”s) expected to benefit from the synergies of the combination.
An impairment loss is recognised in the profit and loss account when the carrying amount of the CGU, including goodwill, exceeds the recoverable amount of the CGU. The recoverable amount of a CGU is the higher of the CGU’s fair value less cost to sell and value-in-use. The impairment loss is allocated first to reduce the carrying amount of goodwill allocated to the CGU and then, to reduce the carrying amount of the other assets in the unit on a pro-rata basis. An impairment loss recognised for goodwill is not reversed in a subsequent period.

128
Financial Report
Notes to the Financial Statements
2. Significant accounting policies (continued)
Other Non-Financial Assets Tangible and intangible assets are tested for impairment whenever there is any indication that these assets may be impaired.
Management rights are tested for impairment annually and whenever there is an indication that the management rights may be impaired.
For the purpose of impairment testing, the recoverable amount (i.e. the higher of the fair value less cost to sell and the value-in-use) is determined on an individual asset basis unless the asset does not generate cash flows that are largely independent of those from other assets. If this is the case, recoverable amount is determined for CGU to which the asset belongs.
If the recoverable amount of the asset (or CGU) is estimated to be less than its carrying amount, the carrying amount of the asset (or CGU) is reduced to its recoverable amount. The difference between the carrying amount and recoverable amount is recognised as impairment loss in the profit and loss account. An impairment loss for an asset is reversed if, and only if, there has been a change in the estimates used to determine the asset’s recoverable amount since the last impairment loss was recognised. The carrying amount of the asset is increased to its revised recoverable amount, provided that this amount does not exceed the carrying amount that would have been determined had no impairment loss been recognised for the asset in prior years. A reversal of impairment loss for an asset is recognised in the profit and loss account.
(m) Financial Liabilities and Equity Instruments Financial liabilities include trade, intercompany and other payables, bank loans and overdrafts. Trade, intercompany and other
payables are stated initially at fair value and subsequently carried at amortised cost. Interest-bearing bank loans and overdrafts are initially measured at fair value and are subsequently measured at amortised cost. Interest expense calculated using the effective interest method is recognised over the term of the borrowings in accordance with the Group’s accounting policy for borrowing costs (see below).
An equity instrument is any contract that evidences a residual interest in the assets of the Group after deducting all of its liabilities. Equity instruments are recorded at the proceeds received, net of direct issue costs.
(n) Provisions Provisions are recognised when the Group has a present legal or constructive obligation as a result of past events, it is probable
that an outflow of resources will be required to settle the obligation, and a reliable estimate of the amount can be made. Provisions are not recognised for future operating losses.
Provision for warranties is set up upon completion of a contract to cover the estimated liability which may arise during the warranty period. This provision is based on service history. Any surplus of provision will be written back at the end of the warranty period while additional provisions where necessary are made when known. These liabilities are expected to be incurred over the applicable warranty periods.
Provision for claims is made for the estimated cost of all claims notified but not settled at the balance sheet date, less recoveries, using the information available at the time. Provision is also made for claims incurred but not reported at the balance sheet date based on historical claims experience, modified for variations in expected future settlement. The utilisation of provisions is dependent on the timing of claims.
(o) Leases When a group company is the lessee Operating leases Leases of assets in which the Group does not transfer substantially all the risks and rewards of ownership of the assets by the
lessor are classified as operating leases. Payments made under operating leases (net of any incentive received from lessor) are taken to the profit and loss account on a straight-line basis over the period of the lease. When an operating lease is terminated before the lease period has expired, any payment required to be made to the lessor by way of penalty is recognised as an expense in the period in which termination takes place.
When a group company is the lessor Operating leases Assets leased out under operating leases are included in investment properties and are stated at fair values. Rental income (net of
any incentive given to lessee) is recognised on a straight-line basis over the lease term.
(p) Assets classified as held for sale Non-current assets and disposal groups are classified as held for sale if their carrying amount will be recovered principally through
a sale transaction rather than through continuing use. This condition is regarded as met only when the sale is highly probable and the asset (or disposal group) is available for immediate sale in its present condition. Management must be committed to the sale, which should be expected to qualify for recognition as a completed sale within one year from the date of classification.
When the Group is committed to a sale plan involving loss of control of a subsidiary, all of the assets and liabilities of that subsidiary are classified as held for sale when the criteria described above are met, regardless of whether the Group will retain a non-controlling interest in its former subsidiary after the sale.
Non-current assets (and disposal groups) classified as held for sale are measured at the lower of their previous carrying amount and fair value less costs to sell.
Keppel Corporation Limited | Report to Shareholders 2017
129
(q) Revenue Revenue consists of:
- Revenue recognised on contracts, under the completion of construction method;- Revenue recognised on contracts, under the percentage of completion method when the outcome of the contract can be
estimated reliably;- Sale of goods and services;- Rental income from investment properties;- Investment and fee income; and- Dividend income.
Revenue recognition Revenue from rigbuilding, shipbuilding and repairs, and long term engineering contracts is recognised based on the percentage
of completion method in proportion to the stage of completion and provided the outcome of such work can be reliably estimated. The percentage of completion is measured by reference to the percentage of the physical proportion of the contract work completed as determined by engineers’ estimates. Where applicable, anticipated losses on contracts in progress are recognised in the profit and loss account.
Revenue recognition on partly completed properties, which are held for sale is based on the following methods:
- For Singapore trading properties under progressive payment scheme, revenue and profit are recognised on the percentage-of-completion method to reflect the continuous transfer of significant risks and rewards of the ownership of the properties to the purchasers as construction progresses. The percentage of work completion is measured based on the construction and related costs incurred to date as a proportion of the estimated total construction and related costs;
- For overseas trading properties, profit recognition is recognised upon the transfer of significant risks and rewards of ownership to the purchasers under the completion of construction method; and
- Where a project comprises more than one component or phase with a separate temporary occupation permit, each component or phase is treated as a separate project.
When losses are expected, they are recognised in full in the accounts after adequate allowance has been made for estimated costs to completion including cost of discontinuance and salvage cost. Any expenditure incurred on abortive projects is written off in the profit and loss account.
Revenue from the sale of products is recognised when all the following conditions are satisfied:
- The Group has transferred to the buyer the significant risks and rewards of ownership of the goods;- The Group retains neither continuing managerial involvement to the degree usually associated with ownership nor effective
control over the goods sold;- The amount of revenue can be measured reliably;- It is probable that the economic benefits associated with the transaction will flow to the entity; and- The costs incurred or to be incurred in respect of the transaction can be measured reliably.
Sales are stated net of goods and services tax, sales returns, rebates and discounts, and after eliminating sales within the Group.
Revenue from the rendering of services including electricity supply and logistic services is recognised over the period in which the services are rendered, by reference to completion of the specific transaction assessed on the basis of the actual services provided as a proportion of the total services to be performed.
Rental income from operating leases on investment properties are recognised on a straight-line basis over the lease term.
Dividend income is recognised in the profit and loss account when the right to receive payment is established, and in the case of fixed interest bearing investments, on a time proportion basis using the effective interest method.
Interest income is recognised on a time proportion basis using the effective interest method.
(r) Borrowing Costs Borrowing costs incurred to finance the development of properties and acquisition of fixed assets are capitalised during the
period of time that is required to complete and prepare the asset for its intended use. Other borrowing costs are taken to the profit and loss account over the period of borrowing using the effective interest rate method.
130
Financial Report
Notes to the Financial Statements
2. Significant accounting policies (continued)
(s) Employee Benefits Defined Contribution Plan The Group makes contributions to pension schemes as defined by the laws of the countries in which it has operations. In
particular, the Singapore companies make contributions to the Central Provident Fund in Singapore, a defined contribution pension scheme. Contributions to pension schemes are recognised as an expense in the period in which the related service is performed.
Employee Leave Entitlement Employee entitlements to annual leave are recognised when they accrue to employees. A provision is made for the estimated
liability for leave as a result of services rendered by employees up to the balance sheet date.
Share Option Scheme and Share Plans The Group operates share-based compensation plans. The fair value of the employee services received in exchange for the
grant of options, restricted shares and performance shares is recognised as an expense in the profit and loss account with a corresponding increase in the share option and share plan reserve over the vesting period. The total amount to be recognised over the vesting period is determined by reference to the fair values of the options, restricted shares and performance shares granted on the respective dates of grant.
At each balance sheet date, the Group revises its estimates of the number of options that are expected to become exercisable and share plan awards that are expected to vest on the vesting dates, and recognises the impact of the revision of the estimates in the profit and loss account, with a corresponding adjustment to the share option and share plan reserve over the remaining vesting period.
No expense is recognised for options or share plan awards that do not ultimately vest, except for options or share plan awards where vesting is conditional upon a market condition, which are treated as vested irrespective of whether or not the market condition is satisfied, provided that all other performance and/or service conditions are satisfied.
The proceeds received from the exercise of options are credited to share capital when the options are exercised. When share plan awards are released, the share plan reserve is transferred to share capital if new shares are issued, or to the treasury shares account when treasury shares are reissued to the employee.
(t) Income Taxes Current income tax is recognised at the amounts expected to be paid to or recovered from the tax authorities, using the tax rates
(and tax laws) that have been enacted or substantively enacted by the balance sheet date.
Deferred income tax assets/liabilities are recognised for deductible/taxable temporary differences arising between the tax bases of assets and liabilities and their carrying amounts. The principal temporary differences arise from depreciation, valuation of investment properties, unremitted offshore income and future tax benefits from certain provisions not allowed for tax purposes until a later period. Deferred tax assets are recognised to the extent that it is probable that future taxable profit will be available against which the temporary differences can be utilised.
Deferred income tax is measured at the tax rates that are expected to apply when the related deferred income tax asset/liability is realised/settled, based on the tax rates and tax laws that have been enacted or substantively enacted by the balance sheets date, and based on the tax consequence that will follow from the manner in which the Group expects, at the balance sheet date, to recover or settle the carrying amounts of its assets and liabilities.
The carrying amount of deferred tax assets is reviewed at each balance sheet date and reduced to the extent that it is no longer probable that sufficient taxable profits will be available to allow all or part of the asset to be recovered. Deferred tax assets and liabilities are offset when there is a legally enforceable right to set off current tax assets against current tax liabilities and when they relate to income taxes levied by the same taxation authority and the Group intends to settle its current tax assets and liabilities on a net basis.
Current and deferred tax are recognised as an expense or income in the profit and loss account, except when they relate to items credited or debited directly to equity, in which case the tax is also recognised directly in equity, or where they arise from the initial accounting for a business combination. In the case of a business combination, the tax effect is taken into account in calculating goodwill or determining the excess of the acquirer’s interest in the net fair value of the acquiree’s identifiable assets, liabilities and contingent liabilities over cost.

Keppel Corporation Limited | Report to Shareholders 2017
131
(u) Foreign Currencies Functional Currency Items included in the financial statements of each entity in the Group are measured using the currency that best reflects the
economic substance of the underlying events and circumstances relevant to that entity (“functional currency”).
The financial statements of the Group and the balance sheet and statement of changes in equity of the Company are presented in Singapore Dollars, which is the functional currency of the Company.
Foreign Currency Transactions Transactions in foreign currencies are translated at exchange rates approximating those ruling at the transaction dates. Monetary
assets and liabilities denominated in foreign currencies at the balance sheet date are translated at exchange rates approximating those ruling at that date. Exchange differences arising from translation of monetary assets and liabilities are taken to the profit and loss account. Non-monetary items carried at fair value that are denominated in foreign currencies are retranslated at the rates prevailing on the date when the fair value was determined. Non-monetary items that are measured in terms of historical cost in a foreign currency are not retranslated.
Foreign Currency Translation For inclusion in the Group’s financial statements, the assets and liabilities of foreign subsidiaries and associated companies that
are in functional currencies other than Singapore Dollars are translated into Singapore Dollars at the exchange rates ruling at the balance sheet date. Profit or loss of foreign subsidiaries and associated companies are translated into Singapore Dollars using the average exchange rates for the financial year. Goodwill and fair value adjustments arising on acquisition of a foreign entity are treated as assets and liabilities of the foreign subsidiaries and associated companies. Exchange differences due to such currency translation are recognised in other comprehensive income and accumulated in Foreign Exchange Translation Account until disposed.
Disposal or partial disposal of a foreign operation On the disposal of a foreign operation (i.e. a disposal of the Group’s entire interest in a foreign operation, or a disposal involving
loss of control over a subsidiary that includes a foreign operation, loss of joint control over a jointly controlled entity that includes a foreign operation, or loss of significant influence over an associate that includes a foreign operation), all of the accumulated exchange differences in respect of that operation attributable to the Group are reclassified from equity to profit or loss. Any exchange differences that have previously been attributed to non-controlling interests are derecognised, but they are not reclassified to profit or loss.
In the case of a partial disposal (i.e. no loss of control) of a subsidiary that includes a foreign operation, the proportionate share of accumulated exchange differences are re-attributed to non-controlling interests and are not recognised in profit or loss. For all other partial disposals (i.e. of associates or jointly controlled entities that do not result in the Group losing significant influence or joint control), the proportionate share of the accumulated exchange differences is reclassified to profit or loss.
(v) Share Capital Ordinary shares are classified as equity. Incremental costs directly attributable to the issuance of new ordinary shares are
deducted against the share capital account.
When shares are reacquired by the Company, the amount of consideration paid and any directly attributable transaction cost is recognised directly in equity. Reacquired shares are classified as treasury shares and presented as a deduction from total equity. When treasury shares are subsequently sold or reissued, the cost of treasury shares is reversed from the treasury shares account and the realised gain or loss on sale or reissue, net of any directly attributable incremental transaction costs, is recognised in non-distributable capital reserve. Voting rights related to treasury shares are nullified for the Group and no dividends are allocated to them respectively.
(w) Segment Reporting The Group has four reportable segments, namely Offshore & Marine, Property, Infrastructure and Investments. Management
monitors the results of each of these operating segments for the purpose of making decisions on resource allocation and performance assessment.
(x) Critical Accounting Estimates and Judgments
(i) Critical judgments in applying the Group’s accounting policies In the process of applying the Group’s accounting policies, the management is of the opinion that there is no instance
of application of judgments which is expected to have a significant effect on the amounts recognised in the financial statements, apart from those involving estimations and as follows:
Control over Keppel REIT TheGrouphasapproximately45%(2016:approximately45%)grossownershipinterestofunitsinKeppelREITasat31
December 2017. Keppel REIT is managed by Keppel REIT Management Limited (“KRML”), a wholly-owned subsidiary of the Group. The Group has provided an undertaking to the trustee of Keppel REIT to grant the other unitholders the right to endorse or re-endorse the appointment of directors of KRML at the annual general meetings of Keppel REIT. The Group has determined that it does not have control over Keppel REIT but continues to have significant influence over the investment.
132
Financial Report
Notes to the Financial Statements
2. Significant accounting policies (continued)
Control over KrisEnergy TheGrouphasapproximately40%(2016:approximately40%)grossownershipinterestofsharesinKrisEnergyLimited
(“KrisEnergy”) as at 31 December 2017. The management assessed whether or not the Group has control over KrisEnergy based on whether it has the practical ability to direct the relevant activities of KrisEnergy. In exercising its judgment, management considers the relative size and dispersion of the shareholdings owned by the other shareholders. Taking into considerationtheapproximately26%(2016:approximately37%)interestheldbyanothersingleshareholderofKrisEnergy,management concluded that the Group does not have sufficient dominant vesting interest to exert control over KrisEnergy but continues to have significant influence over the investment.
(ii) Key sources of estimation uncertainty The key assumptions concerning the future and other key sources of estimation uncertainty at the balance sheet date that
have a significant risk of causing a material adjustment to the carrying amounts of assets and liabilities within the next financial year, are as follows:
Impairment of loans and receivables The Group assesses at each balance sheet date whether there is any objective evidence that a loan and receivable is
impaired. The Group considers factors such as the probability of insolvency or significant financial difficulties of the debtor and default or significant delay in payments. When there is objective evidence of impairment, the amount and timing of future cash flows are estimated based on historical loss experience for assets with similar credit risk characteristics. The carrying amounts of trade, intercompany and other receivables are disclosed in the balance sheet. As at 31 December 2017, the Group has credit risk exposure to an external group of companies for receivables that are past due. Management has considered any changes in the credit quality of the debtors, the possibility of discontinuance of the projects and the cost incurred to-date when determining the allowance for doubtful receivables and its expected loss. Management performs on-going assessments on the ability of its debtors to repay the amounts owing to the Group. These assessments include the review of the customers’ credit-standing and the possibility of discontinuance of the projects.
Impairment of available-for-sale investments The Group follows the guidance of FRS 39 in determining whether available-for-sale investments are considered impaired.
The Group evaluates, among other factors, the duration and extent to which the fair value of an investment is less than its cost, the financial health of and the near-term business outlook of the investee, including factors such as industry and sector performance, changes in technology and operational and financing cash flows. The fair values of available-for-sale investments are disclosed in the balance sheet.
Impairment of non-financial assets Determining whether the carrying value of a non-financial asset is impaired requires an estimation of the value in use of
the CGUs. This requires the Group to estimate the future cash flows expected from the CGUs and an appropriate discount rate in order to calculate the present value of the future cash flows. The carrying amounts of fixed assets, investments in subsidiaries, investment in associates and joint ventures, and intangibles are disclosed in the balance sheet. Management performed impairment tests on these non-financial assets as at 31 December 2017. Refer to Note 6, 8, 9 and 12 for more details.
Revenue recognition and contract cost The Group recognises contract revenue and contract cost based on the percentage of completion method. The stage of
completion is measured in accordance with the accounting policy stated in Note 2(q). Significant assumptions are required in determining the stage of completion, the extent of the contract cost incurred, the estimated total contract revenue and contract cost and the recoverability of the contracts. In making the assumption, the Group evaluates by relying on past experience and the work of engineers. Revenue from construction contracts is disclosed in Note 22.
Revenue arising from additional claims and variation orders, whether billed or unbilled, is recognised when negotiations have reached an advanced stage such that it is probable that the customer will accept the claims or approve the variation orders, and the amount that it is probable will be accepted by the customer can be measured reliably.
Recoverability of work-in-progress balances in relation to Offshore & Marine construction contracts and stocks for sale Contracts with Sete Brasil (“Sete”) The Group had previously entered into contracts with Sete for the construction of six rigs for which progress payments from
Sete had ceased since November 2014. In April 2016, Sete filed for bankruptcy protection and its authorised representatives had been in discussion with the Group on the eventual completion and delivery of some of the rigs. Management has continually assessed the probable outcomes of these contracts by taking into consideration the progress and status of the discussions and market conditions in Brazil. During the financial year ended 31 December 2017, an expected loss of $81,000,000 was recognised, taking into consideration cost of completion, cost of discontinuance, salvage cost and unpaid progress billings with regards to these rigs, bringing the total loss recognised on these rigs to $309,000,000.

Keppel Corporation Limited | Report to Shareholders 2017
133
Other contracts As at 31 December 2017, the Group had several rigs/vessels that were under construction for customers or had been
completed and were awaiting delivery to the customers. See Note 13 on work-in-progress balances.
During 2017, some of the Group’s customers had requested for further deferral of delivery dates of the rigs/vessels.
Management has assessed each deferred construction project individually to make judgment as to whether the customers will be able to fulfil their contractual obligations and take delivery of the rigs at the revised delivery dates.
Management has also estimated the net realisable values of rigs/vessels under construction as stocks for sale in assessing whether a provision for loss on work-in-progress is necessary.
Management has further assessed if the values of the rigs/vessels would exceed the carrying values of work-in-progress and stocks for sale. Management has estimated, with the assistance of an independent professional firm, the values of the rigs/vessels using Discounted Cash Flow (“DCF”) calculations that cover each class of rig/vessel under construction. The most significant inputs to the DCF calculations include day rates, utilisation rates, forecasted oil price movements and discount rates.
Income taxes The Group has exposure to income taxes in numerous jurisdictions. Significant assumptions are required in determining
the provision for income taxes. There are certain transactions and computations for which the ultimate tax determination is uncertain during the ordinary course of business. The Group recognises liabilities for expected tax issues based on estimates of whether additional taxes will be due. Where the final tax outcome of these matters is different from the amounts that were initially recognised, such differences will impact the income tax and deferred tax provisions in the period in which such determination is made. The carrying amounts of taxation and deferred taxation are disclosed in the balance sheet.
Claims, litigations and reviews The Group entered into various contracts with third parties in its ordinary course of business and is exposed to the risk of
claims, litigations, latent defects or review from the contractual parties and/or government agencies. These can arise for various reasons, including change in scope of work, delay and disputes, defective specifications or routine checks etc. The scope, enforceability and validity of any claim, litigation or review may be highly uncertain. In making its judgment as to whether it is probable that any such claim, litigation or review will result in a liability and whether any such liability can be measured reliably, management relies on past experience and the opinion of legal and technical expertise.
3. Share capital
Group and Company
Number of Ordinary Shares (“Shares”) Issued Share Capital Treasury Shares
2017 2016 2017 2016
Balance at 1 January 1,817,910,180 1,817,910,180 (2,232,510) (6,762,980) Issue of shares under the share option scheme 424,000 - - - Treasury shares transferred pursuant to
share option scheme - - 208,900 367,500 Treasury shares transferred pursuant to KCL PSP - - - 122,600 Treasury shares transferred pursuant to KCL RSP - - 4,862,822 4,630,370 Treasury shares purchased - - (2,850,000) (590,000) Balance at 31 December 1,818,334,180 1,817,910,180 (10,788) (2,232,510)
Amount ($’000) Issued Share Capital Treasury Shares
2017 2016 2017 2016
Balance at 1 January 1,288,394 1,288,394 (15,523) (49,011) Issue of shares under the share option scheme 2,916 - - - Treasury shares transferred pursuant to
share option scheme - - 1,437 2,555 Treasury shares transferred pursuant to KCL PSP - - - 877 Treasury shares transferred pursuant to KCL RSP - - 33,440 33,125 Treasury shares purchased - - (19,428) (3,069) Balance at 31 December 1,291,310 1,288,394 (74) (15,523)
Fully paid ordinary shares, which have no par value, carry one vote per share and carry a right to dividends declared by the Company.
During the financial year, the Company issued 424,000 (2016: nil) Shares at an average weighted price of $6.88 (2016: nil) per Share for cash upon exercise of options under the KCL Share Option Scheme.
During the financial year, 4,862,822 (2016: 4,630,370) Shares under the KCL Restricted Share Plan (“KCL RSP”) were vested. In the prior year, 122,600 Shares under the KCL Performance Share Plan (“KCL PSP”) were vested.
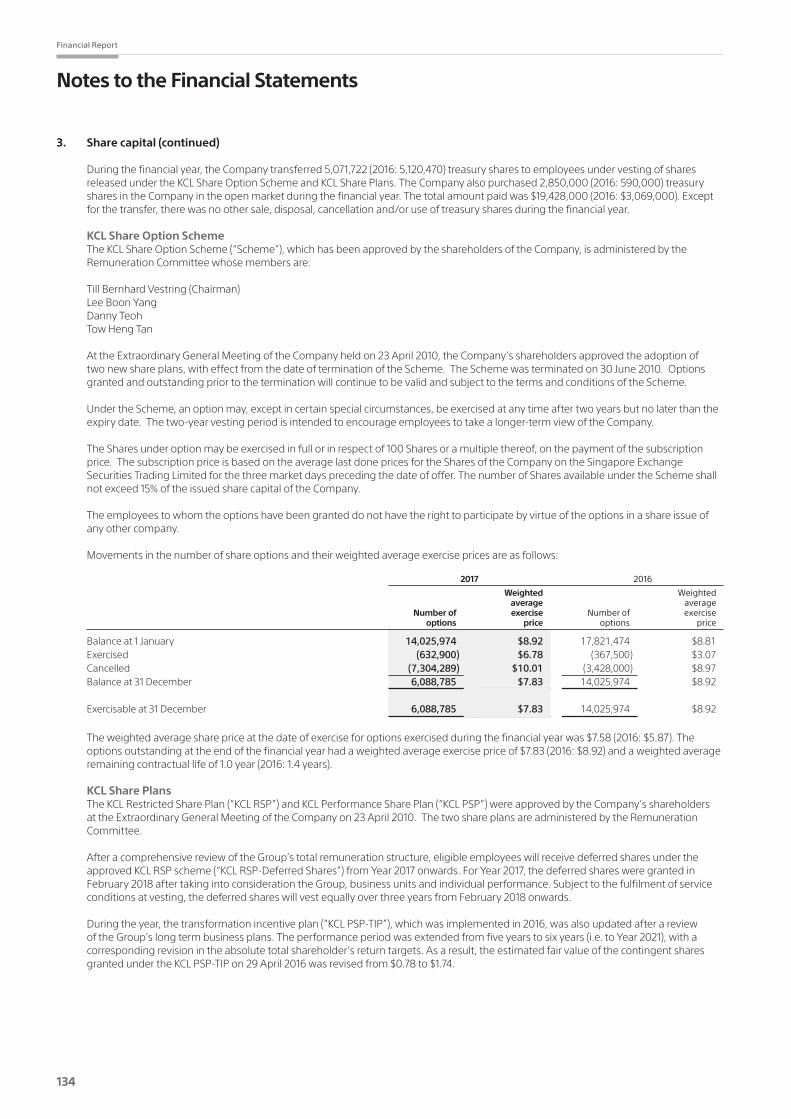
134
Financial Report
Notes to the Financial Statements
3. Share capital (continued)
During the financial year, the Company transferred 5,071,722 (2016: 5,120,470) treasury shares to employees under vesting of shares released under the KCL Share Option Scheme and KCL Share Plans. The Company also purchased 2,850,000 (2016: 590,000) treasury shares in the Company in the open market during the financial year. The total amount paid was $19,428,000 (2016: $3,069,000). Except for the transfer, there was no other sale, disposal, cancellation and/or use of treasury shares during the financial year.
KCL Share Option Scheme The KCL Share Option Scheme (“Scheme”), which has been approved by the shareholders of the Company, is administered by the
Remuneration Committee whose members are:
Till Bernhard Vestring (Chairman) Lee Boon Yang Danny Teoh Tow Heng Tan
At the Extraordinary General Meeting of the Company held on 23 April 2010, the Company’s shareholders approved the adoption of two new share plans, with effect from the date of termination of the Scheme. The Scheme was terminated on 30 June 2010. Options granted and outstanding prior to the termination will continue to be valid and subject to the terms and conditions of the Scheme.
Under the Scheme, an option may, except in certain special circumstances, be exercised at any time after two years but no later than the expiry date. The two-year vesting period is intended to encourage employees to take a longer-term view of the Company.
The Shares under option may be exercised in full or in respect of 100 Shares or a multiple thereof, on the payment of the subscription price. The subscription price is based on the average last done prices for the Shares of the Company on the Singapore Exchange Securities Trading Limited for the three market days preceding the date of offer. The number of Shares available under the Scheme shall notexceed15%oftheissuedsharecapitaloftheCompany.
The employees to whom the options have been granted do not have the right to participate by virtue of the options in a share issue of any other company.
Movements in the number of share options and their weighted average exercise prices are as follows:
2017 2016
Weighted Weighted average average Number of exercise Number of exercise options price options price
Balance at 1 January 14,025,974 $8.92 17,821,474 $8.81 Exercised (632,900) $6.78 (367,500) $3.07 Cancelled (7,304,289) $10.01 (3,428,000) $8.97 Balance at 31 December 6,088,785 $7.83 14,025,974 $8.92
Exercisable at 31 December 6,088,785 $7.83 14,025,974 $8.92
The weighted average share price at the date of exercise for options exercised during the financial year was $7.58 (2016: $5.87). The options outstanding at the end of the financial year had a weighted average exercise price of $7.83 (2016: $8.92) and a weighted average remaining contractual life of 1.0 year (2016: 1.4 years).
KCL Share Plans The KCL Restricted Share Plan (“KCL RSP”) and KCL Performance Share Plan (“KCL PSP”) were approved by the Company’s shareholders
at the Extraordinary General Meeting of the Company on 23 April 2010. The two share plans are administered by the Remuneration Committee.
After a comprehensive review of the Group’s total remuneration structure, eligible employees will receive deferred shares under the approved KCL RSP scheme (“KCL RSP-Deferred Shares”) from Year 2017 onwards. For Year 2017, the deferred shares were granted in February 2018 after taking into consideration the Group, business units and individual performance. Subject to the fulfilment of service conditions at vesting, the deferred shares will vest equally over three years from February 2018 onwards.
During the year, the transformation incentive plan (“KCL PSP-TIP”), which was implemented in 2016, was also updated after a review of the Group’s long term business plans. The performance period was extended from five years to six years (i.e. to Year 2021), with a corresponding revision in the absolute total shareholder’s return targets. As a result, the estimated fair value of the contingent shares granted under the KCL PSP-TIP on 29 April 2016 was revised from $0.78 to $1.74.
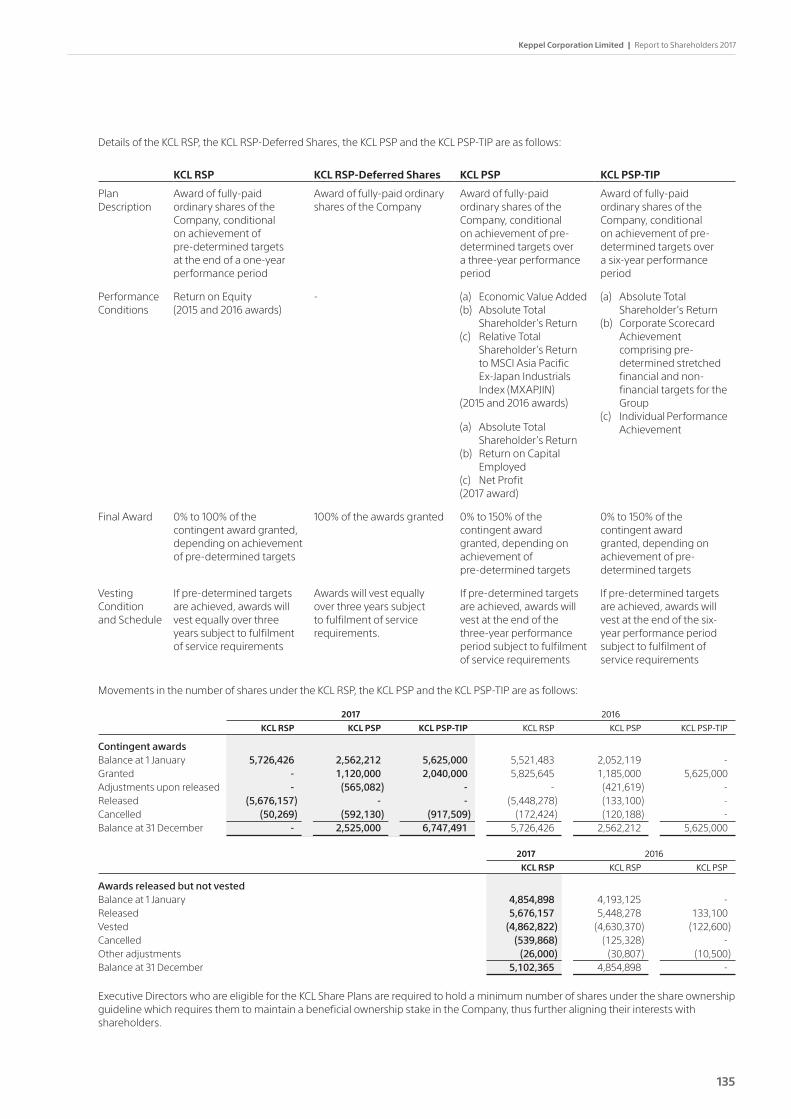
Keppel Corporation Limited | Report to Shareholders 2017
135
Details of the KCL RSP, the KCL RSP-Deferred Shares, the KCL PSP and the KCL PSP-TIP are as follows:
KCL RSP KCL RSP-Deferred Shares KCL PSP KCL PSP-TIP
Plan Description
Award of fully-paid ordinary shares of the Company, conditional on achievement of pre-determined targets at the end of a one-year performance period
Award of fully-paid ordinary shares of the Company
Award of fully-paid ordinary shares of the Company, conditional on achievement of pre-determined targets over a three-year performance period
Award of fully-paid ordinary shares of the Company, conditional on achievement of pre-determined targets over a six-year performance period
Performance Conditions
Return on Equity (2015 and 2016 awards)
- (a) Economic Value Added(b) Absolute Total
Shareholder’s Return(c) Relative Total
Shareholder’s Return to MSCI Asia Pacific
Ex-Japan Industrials Index (MXAPJIN)
(2015 and 2016 awards)
(a) Absolute Total Shareholder’s Return
(b) Return on Capital Employed
(c) Net Profit(2017 award)
(a) Absolute Total Shareholder’s Return
(b) Corporate Scorecard Achievement comprising pre-determined stretched financial and non-financial targets for the Group
(c) Individual Performance Achievement
Final Award 0%to100%ofthecontingent award granted, depending on achievement of pre-determined targets
100%oftheawardsgranted 0%to150%ofthecontingent award granted, depending on achievement of pre-determined targets
0%to150%ofthecontingent award granted, depending on achievement of pre-determined targets
Vesting Condition and Schedule
If pre-determined targets are achieved, awards will vest equally over three years subject to fulfilment of service requirements
Awards will vest equally over three years subject to fulfilment of service requirements.
If pre-determined targets are achieved, awards will vest at the end of the three-year performance period subject to fulfilment of service requirements
If pre-determined targets are achieved, awards will vest at the end of the six-year performance period subject to fulfilment of service requirements
Movements in the number of shares under the KCL RSP, the KCL PSP and the KCL PSP-TIP are as follows:
2017 2016
KCL RSP KCL PSP KCL PSP-TIP KCL RSP KCL PSP KCL PSP-TIP
Contingent awards Balance at 1 January 5,726,426 2,562,212 5,625,000 5,521,483 2,052,119 - Granted - 1,120,000 2,040,000 5,825,645 1,185,000 5,625,000 Adjustments upon released - (565,082) - - (421,619) - Released (5,676,157) - - (5,448,278) (133,100) - Cancelled (50,269) (592,130) (917,509) (172,424) (120,188) - Balance at 31 December - 2,525,000 6,747,491 5,726,426 2,562,212 5,625,000
2017 2016
KCL RSP KCL RSP KCL PSP
Awards released but not vested Balance at 1 January 4,854,898 4,193,125 - Released 5,676,157 5,448,278 133,100 Vested (4,862,822) (4,630,370) (122,600) Cancelled (539,868) (125,328) - Other adjustments (26,000) (30,807) (10,500) Balance at 31 December 5,102,365 4,854,898 -
Executive Directors who are eligible for the KCL Share Plans are required to hold a minimum number of shares under the share ownership guideline which requires them to maintain a beneficial ownership stake in the Company, thus further aligning their interests with shareholders.

136
Financial Report
Notes to the Financial Statements
3. Share capital (continued)
As at 31 December 2017, there were 5,102,365 (2016: 4,854,898) shares under the KCL RSP that were released but not vested. At the end of the financial year, the number of contingent Shares granted but not released was nil (2016: 5,726,426) under the KCL RSP, 2,525,000 (2016: 2,562,212) under the KCL PSP and 6,747,491 (2016: 5,625,000) under the KCL PSP-TIP. Depending on the achievement of pre-determined performance targets, the actual number of Shares to be released could range from zero to a maximum of 3,787,500 under the KCL PSP and zero to a maximum of 10,121,237 under the KCL PSP-TIP.
The fair values of the contingent award of shares under the KCL RSP and the KCL PSP are determined at the grant date using Monte Carlo simulation method which involves projection of future outcomes using statistical distributions of key random variables including share price and volatility.
On 28 April 2017 (2016: 29 April 2016), the Company granted contingent awards of 1,120,000 (2016: 1,185,000) Shares under the KCL PSP and 2,040,000 (2016: 5,625,000) Shares under the KCL PSP-TIP. The estimated fair value of the shares granted amounts to $5.22
(2016: $3.05) under the KCL PSP and $1.74 (2016: $0.78) under the KCL PSP-TIP. In the prior year, the Company granted contingent awards of 5,825,645 Shares under the KCL RSP on 29 April 2016 and the estimated fair value of the shares granted amounts to $4.85.
The significant inputs into the model are as follows:
2017
KCL PSP KCL PSP-TIP
Date of grant 28.04.2017 28.04.2017 Prevailing share price at date of grant $6.51 $6.51 Expected volatility of the Company 23.47% 23.47% Expected term 2.83 years 4.83 years Risk free rate 1.35% 1.64% Expected dividend yield * *
2016
KCL RSP KCL PSP KCL PSP -TIP
Date of grant 29.04.2016 29.04.2016 29.04.2016 Prevailing share price at date of grant $5.40 $5.40 $5.40 Expected volatility: Company 21.89% 21.89% 21.89% MXAPJIN # 14.96% # Correlation with MXAPJIN # 68.0% # Expected term 0.83–2.83years 2.83years 5.83years Risk free rate 0.81%-1.15% 1.15% 1.55% Expected dividend yield * * *
# This input is not required for the valuation of shares granted under the KCL RSP and KCL PSP-TIP.* Expected dividend yield is based on management’s forecast.
The expected volatilities are based on the historical volatilities of the Company’s share price and the MXAPJIN price over the previous 36 months immediately preceding the grant date. The expected term used in the model is based on the grant date and the end of the performance period.
Share option and share plans of a subsidiary Keppel Telecommunications & Transportation Ltd (“Keppel T&T”)
Details of share option and share plans granted by Keppel T&T are disclosed in its annual report.
4. Reserves
Group Company
2017 2016 2017 2016 $’000 $’000 $’000 $’000
Capital Reserves Share option and share plan reserve 202,048 207,139 177,599 184,593 Fair value reserve 99,169 126,014 15,012 14,340 Hedging reserve (111,930) (410,797) - - Bonus issue by subsidiaries 40,000 40,000 - - Others 52,120 49,130 16,895 14,183 281,407 11,486 209,506 213,116 Revenue Reserves 10,486,054 10,655,379 6,132,150 5,133,722 Foreign Exchange
Translation Account (626,009) (280,787) - - 10,141,452 10,386,078 6,341,656 5,346,838
Movements in the Group’s and the Company’s reserves are set out in the Statements of Changes in Equity.

Keppel Corporation Limited | Report to Shareholders 2017
137
5. Non-controlling interests The Group’s subsidiaries that have material non-controlling interests (“NCI”) are as follows:
NCI percentage of ownership interest and Profit after tax voting interest Carrying amount of NCI allocated to NCI
2017 2016 2017 2016 2017 2016 $’000 $’000 $’000 $’000 $’000 $’000
Beijing Aether Property Development Limited 49% 49% 199,716 202,855 2,150 3,641
Keppel Telecommunications & Transportation Ltd 21% 20% 172,434 163,173 10,473 9,750
Other subsidiaries with immaterial NCI 155,596 308,663 (12,112) 24,456
Total 527,746 674,691 511 37,847
Summarised financial information before inter-group elimination
Beijing Aether Property Keppel Telecommunications & Development Limited Transportation Ltd
2017 2016 2017 2016 $’000 $’000 $’000 $’000
Non-current assets 934,671 928,471 1,264,383 1,240,751 Current assets 2,001 3,405 272,816 482,115 Non-current liabilities 139,547 136,606 366,009 477,548 Current liabilities 389,542 381,280 222,985 337,291 407,583 413,990 948,205 908,027 Less: NCI - - (113,499) (111,363) Net assets 407,583 413,990 834,706 796,664
Revenue - - 176,988 194,622 Profit for the year 4,387 7,431 55,917 113,323 Total comprehensive income (36,347) (24,320) 64,203 97,455
Net cash flow (used in)/from operations (8,909) (4,625) 9,736 48,935
Total comprehensive income allocated to NCI (17,810) (11,917) 12,247 7,085
Dividends paid to NCI - - 6,495 5,357
During the financial year, the Group acquired additional interest in certain subsidiaries of the Company from its non-controlling interests. The following summarises the effect of the change in the Group’s ownership interest on the equity attributable to owners of the Company:
2017 2016 $’000 $’000
Amounts paid on changes in ownership interest in subsidiaries (66,380) (8,357) Non-controlling interest acquired 43,489 8,176 Total amount recognised in equity reserves (22,891) (181)
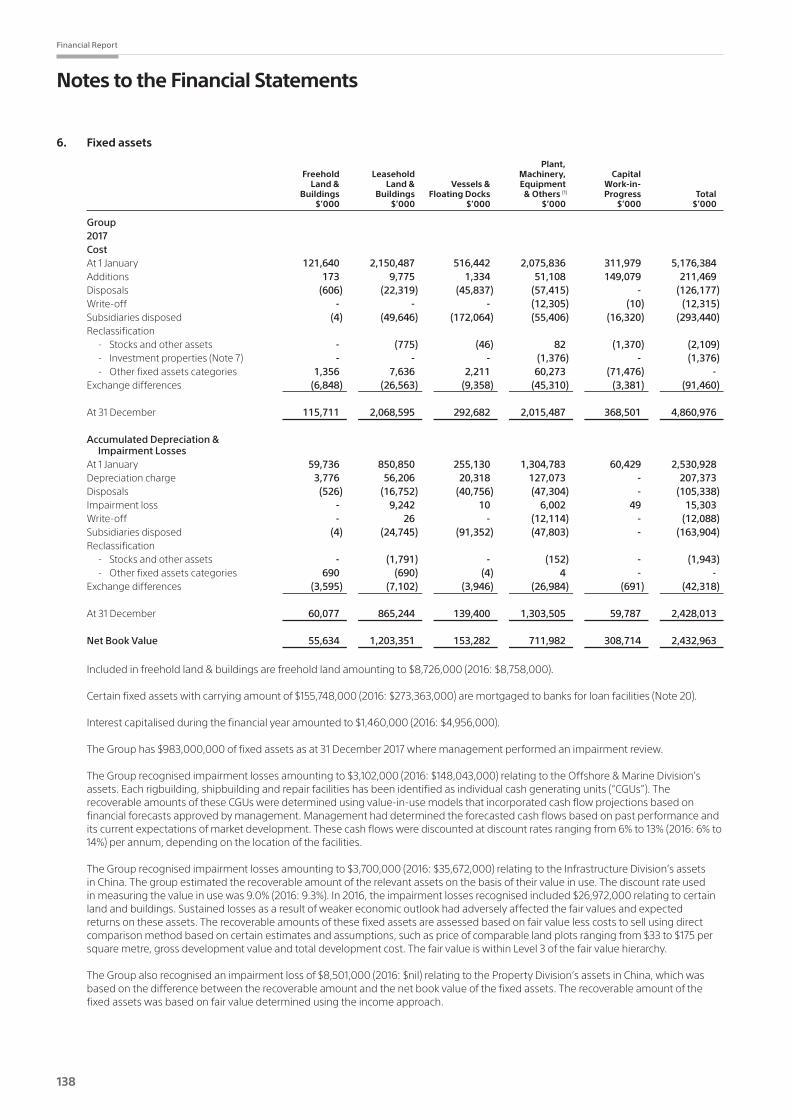
138
Financial Report
Notes to the Financial Statements
6. Fixed assets
Plant, Freehold Leasehold Machinery, Capital Land & Land & Vessels & Equipment Work-in- Buildings Buildings Floating Docks & Others (1) Progress Total $’000 $’000 $’000 $’000 $’000 $’000
Group 2017 Cost At 1 January 121,640 2,150,487 516,442 2,075,836 311,979 5,176,384 Additions 173 9,775 1,334 51,108 149,079 211,469 Disposals (606) (22,319) (45,837) (57,415) - (126,177) Write-off - - - (12,305) (10) (12,315) Subsidiaries disposed (4) (49,646) (172,064) (55,406) (16,320) (293,440) Reclassification - Stocks and other assets - (775) (46) 82 (1,370) (2,109) - Investment properties (Note 7) - - - (1,376) - (1,376) - Other fixed assets categories 1,356 7,636 2,211 60,273 (71,476) - Exchange differences (6,848) (26,563) (9,358) (45,310) (3,381) (91,460)
At 31 December 115,711 2,068,595 292,682 2,015,487 368,501 4,860,976
Accumulated Depreciation & Impairment Losses
At 1 January 59,736 850,850 255,130 1,304,783 60,429 2,530,928 Depreciation charge 3,776 56,206 20,318 127,073 - 207,373 Disposals (526) (16,752) (40,756) (47,304) - (105,338) Impairment loss - 9,242 10 6,002 49 15,303 Write-off - 26 - (12,114) - (12,088) Subsidiaries disposed (4) (24,745) (91,352) (47,803) - (163,904) Reclassification - Stocks and other assets - (1,791) - (152) - (1,943) - Other fixed assets categories 690 (690) (4) 4 - - Exchange differences (3,595) (7,102) (3,946) (26,984) (691) (42,318)
At 31 December 60,077 865,244 139,400 1,303,505 59,787 2,428,013
Net Book Value 55,634 1,203,351 153,282 711,982 308,714 2,432,963
Included in freehold land & buildings are freehold land amounting to $8,726,000 (2016: $8,758,000).
Certain fixed assets with carrying amount of $155,748,000 (2016: $273,363,000) are mortgaged to banks for loan facilities (Note 20).
Interest capitalised during the financial year amounted to $1,460,000 (2016: $4,956,000).
The Group has $983,000,000 of fixed assets as at 31 December 2017 where management performed an impairment review.
The Group recognised impairment losses amounting to $3,102,000 (2016: $148,043,000) relating to the Offshore & Marine Division’s assets. Each rigbuilding, shipbuilding and repair facilities has been identified as individual cash generating units (“CGUs”). The recoverable amounts of these CGUs were determined using value-in-use models that incorporated cash flow projections based on financial forecasts approved by management. Management had determined the forecasted cash flows based on past performance and itscurrentexpectationsofmarketdevelopment.Thesecashflowswerediscountedatdiscountratesrangingfrom6%to13%(2016:6%to14%)perannum,dependingonthelocationofthefacilities.
The Group recognised impairment losses amounting to $3,700,000 (2016: $35,672,000) relating to the Infrastructure Division’s assets in China. The group estimated the recoverable amount of the relevant assets on the basis of their value in use. The discount rate used inmeasuringthevalueinusewas9.0%(2016:9.3%).In2016,theimpairmentlossesrecognisedincluded$26,972,000relatingtocertainland and buildings. Sustained losses as a result of weaker economic outlook had adversely affected the fair values and expected returns on these assets. The recoverable amounts of these fixed assets are assessed based on fair value less costs to sell using direct comparison method based on certain estimates and assumptions, such as price of comparable land plots ranging from $33 to $175 per square metre, gross development value and total development cost. The fair value is within Level 3 of the fair value hierarchy.
The Group also recognised an impairment loss of $8,501,000 (2016: $nil) relating to the Property Division’s assets in China, which was based on the difference between the recoverable amount and the net book value of the fixed assets. The recoverable amount of the fixed assets was based on fair value determined using the income approach.
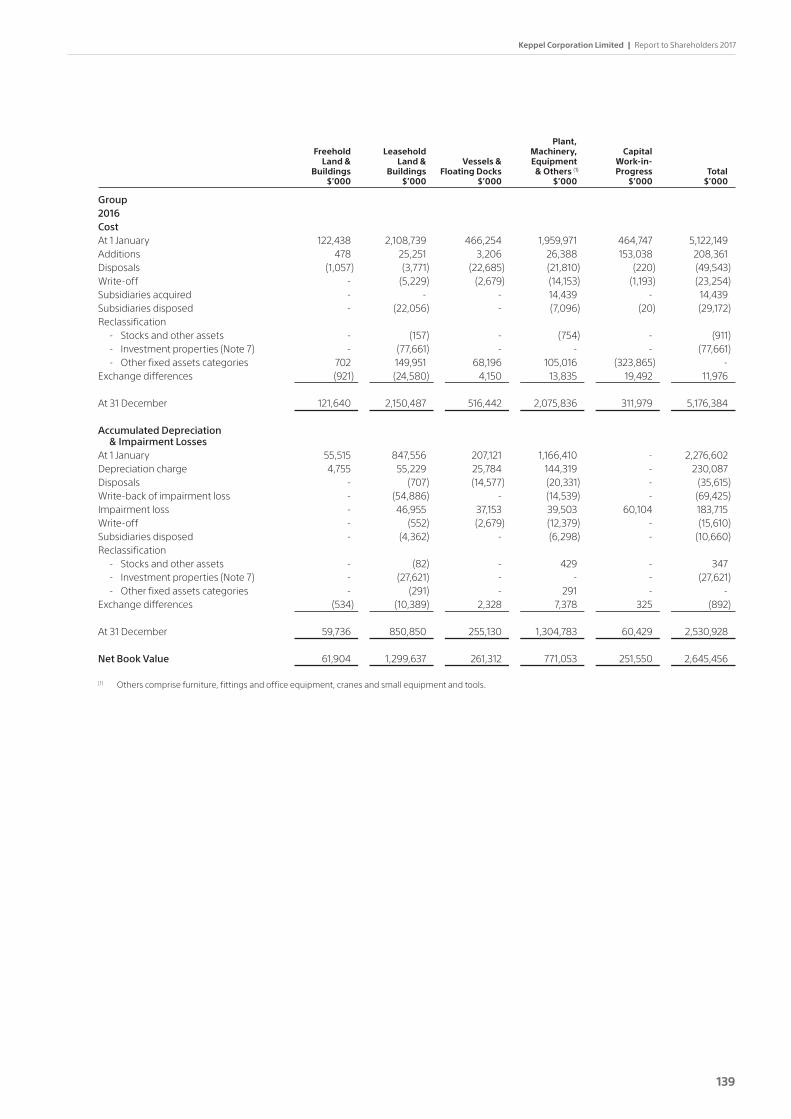
Keppel Corporation Limited | Report to Shareholders 2017
139
Plant, Freehold Leasehold Machinery, Capital Land & Land & Vessels & Equipment Work-in- Buildings Buildings Floating Docks & Others (1) Progress Total $’000 $’000 $’000 $’000 $’000 $’000
Group 2016 Cost At 1 January 122,438 2,108,739 466,254 1,959,971 464,747 5,122,149 Additions 478 25,251 3,206 26,388 153,038 208,361 Disposals (1,057) (3,771) (22,685) (21,810) (220) (49,543) Write-off - (5,229) (2,679) (14,153) (1,193) (23,254) Subsidiaries acquired - - - 14,439 - 14,439 Subsidiaries disposed - (22,056) - (7,096) (20) (29,172) Reclassification - Stocks and other assets - (157) - (754) - (911) - Investment properties (Note 7) - (77,661) - - - (77,661) - Other fixed assets categories 702 149,951 68,196 105,016 (323,865) - Exchange differences (921) (24,580) 4,150 13,835 19,492 11,976
At 31 December 121,640 2,150,487 516,442 2,075,836 311,979 5,176,384
Accumulated Depreciation & Impairment Losses
At 1 January 55,515 847,556 207,121 1,166,410 - 2,276,602 Depreciation charge 4,755 55,229 25,784 144,319 - 230,087 Disposals - (707) (14,577) (20,331) - (35,615) Write-back of impairment loss - (54,886) - (14,539) - (69,425) Impairment loss - 46,955 37,153 39,503 60,104 183,715 Write-off - (552) (2,679) (12,379) - (15,610) Subsidiaries disposed - (4,362) - (6,298) - (10,660) Reclassification - Stocks and other assets - (82) - 429 - 347 - Investment properties (Note 7) - (27,621) - - - (27,621) - Other fixed assets categories - (291) - 291 - - Exchange differences (534) (10,389) 2,328 7,378 325 (892)
At 31 December 59,736 850,850 255,130 1,304,783 60,429 2,530,928
Net Book Value 61,904 1,299,637 261,312 771,053 251,550 2,645,456
(1) Others comprise furniture, fittings and office equipment, cranes and small equipment and tools.
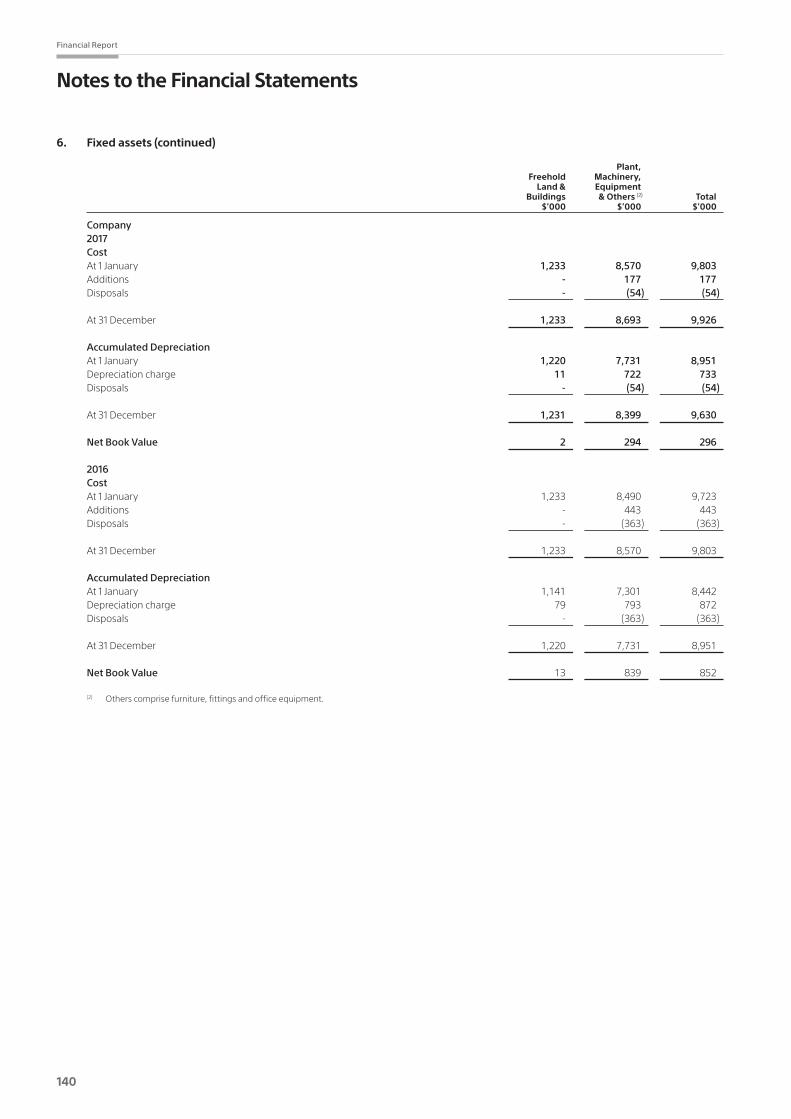
140
Financial Report
Notes to the Financial Statements
6. Fixed assets (continued)
Plant, Freehold Machinery, Land & Equipment Buildings & Others (2) Total $’000 $’000 $’000
Company 2017 Cost At 1 January 1,233 8,570 9,803 Additions - 177 177 Disposals - (54) (54)
At 31 December 1,233 8,693 9,926
Accumulated Depreciation At 1 January 1,220 7,731 8,951 Depreciation charge 11 722 733 Disposals - (54) (54)
At 31 December 1,231 8,399 9,630
Net Book Value 2 294 296
2016 Cost At 1 January 1,233 8,490 9,723 Additions - 443 443 Disposals - (363) (363)
At 31 December 1,233 8,570 9,803
Accumulated Depreciation At 1 January 1,141 7,301 8,442 Depreciation charge 79 793 872 Disposals - (363) (363)
At 31 December 1,220 7,731 8,951
Net Book Value 13 839 852
(2) Others comprise furniture, fittings and office equipment.
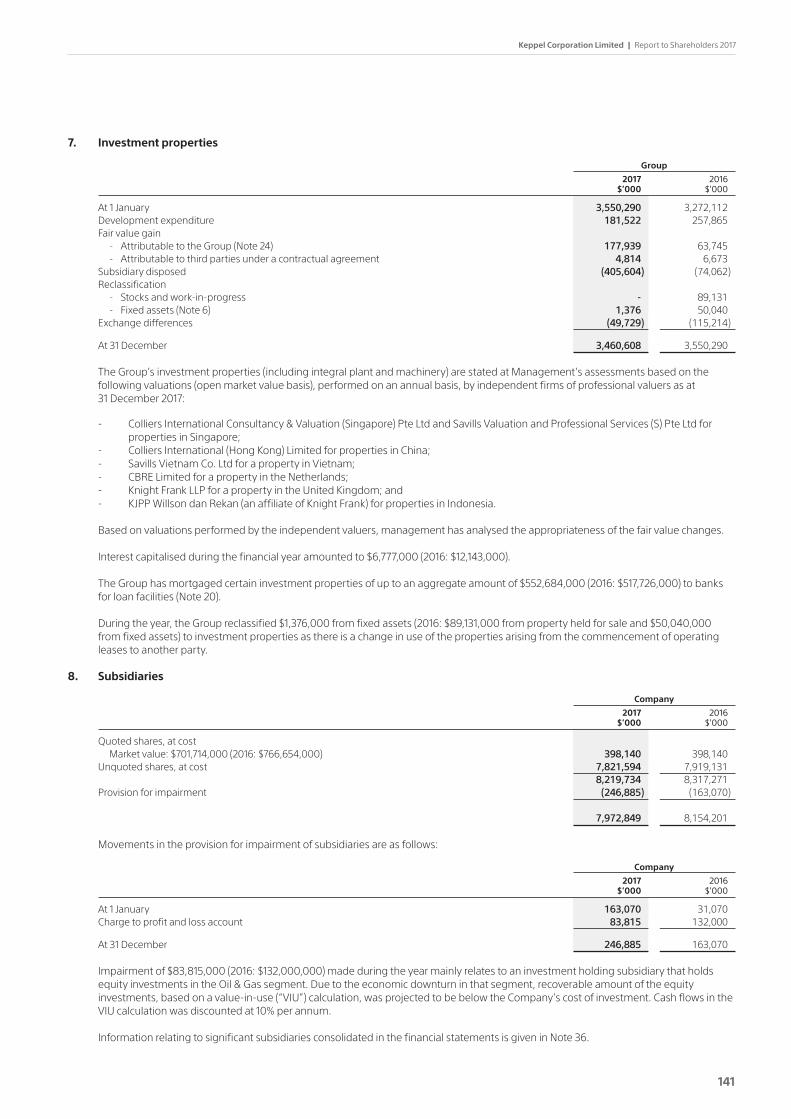
Keppel Corporation Limited | Report to Shareholders 2017
141
7. Investment properties
Group
2017 2016 $’000 $’000
At 1 January 3,550,290 3,272,112 Development expenditure 181,522 257,865 Fair value gain - Attributable to the Group (Note 24) 177,939 63,745 - Attributable to third parties under a contractual agreement 4,814 6,673 Subsidiary disposed (405,604) (74,062) Reclassification - Stocks and work-in-progress - 89,131 - Fixed assets (Note 6) 1,376 50,040 Exchange differences (49,729) (115,214)
At 31 December 3,460,608 3,550,290
The Group’s investment properties (including integral plant and machinery) are stated at Management’s assessments based on the following valuations (open market value basis), performed on an annual basis, by independent firms of professional valuers as at
31 December 2017:
- Colliers International Consultancy & Valuation (Singapore) Pte Ltd and Savills Valuation and Professional Services (S) Pte Ltd for properties in Singapore;
- Colliers International (Hong Kong) Limited for properties in China;- Savills Vietnam Co. Ltd for a property in Vietnam;- CBRE Limited for a property in the Netherlands;- Knight Frank LLP for a property in the United Kingdom; and- KJPP Willson dan Rekan (an affiliate of Knight Frank) for properties in Indonesia.
Based on valuations performed by the independent valuers, management has analysed the appropriateness of the fair value changes.
Interest capitalised during the financial year amounted to $6,777,000 (2016: $12,143,000).
The Group has mortgaged certain investment properties of up to an aggregate amount of $552,684,000 (2016: $517,726,000) to banks for loan facilities (Note 20).
During the year, the Group reclassified $1,376,000 from fixed assets (2016: $89,131,000 from property held for sale and $50,040,000 from fixed assets) to investment properties as there is a change in use of the properties arising from the commencement of operating leases to another party.
8. Subsidiaries
Company
2017 2016 $’000 $’000
Quoted shares, at cost Market value: $701,714,000 (2016: $766,654,000) 398,140 398,140 Unquoted shares, at cost 7,821,594 7,919,131 8,219,734 8,317,271 Provision for impairment (246,885) (163,070)
7,972,849 8,154,201
Movements in the provision for impairment of subsidiaries are as follows:
Company
2017 2016 $’000 $’000
At 1 January 163,070 31,070 Charge to profit and loss account 83,815 132,000
At 31 December 246,885 163,070
Impairment of $83,815,000 (2016: $132,000,000) made during the year mainly relates to an investment holding subsidiary that holds equity investments in the Oil & Gas segment. Due to the economic downturn in that segment, recoverable amount of the equity investments, based on a value-in-use (“VIU”) calculation, was projected to be below the Company’s cost of investment. Cash flows in the VIUcalculationwasdiscountedat10%perannum.
Information relating to significant subsidiaries consolidated in the financial statements is given in Note 36.

142
Financial Report
Notes to the Financial Statements
9. Associated companies
Group
2017 2016 $’000 $’000
Quoted shares, at cost Market value: $3,525,749,000 (2016: $2,978,817,000) 3,105,919 3,080,800 Unquoted shares, at cost 1,784,809 1,640,502 4,890,728 4,721,302 Provision for impairment (100,297) (150,845) 4,790,431 4,570,457 Share of reserves 514,057 499,621 Carrying amount of equity interest 5,304,488 5,070,078 Notes issued by associated companies 310,242 245,000 Advances to associated companies 286,522 97,503
5,901,252 5,412,581
Notesissuedbyassociatedcompaniesareunsecuredandmaturebetween2024and2040.Interestischargedatratesrangingfrom0%to17.5%(2016:17.5%)perannum.
Advances to associated companies are unsecured and are not repayable with the next 12 months. Interest is charged at rates ranging from3.0%to7.0%(2016:6.0%)perannumoninterest-bearingadvances.
Movements in the provision for impairment of associated companies are as follows:
Group
2017 2016 $’000 $’000
At 1 January 150,845 83,871 (Write-back of impairment loss)/impairment loss (39,192) 66,504 Disposal (9,873) - Exchange differences (1,483) 470
At 31 December 100,297 150,845
Write-back of impairment losses during the year mainly relates to the excess of recoverable amount of an associated company over the carrying amount of the investment which includes share of losses recognised by the Group in 2017.
Impairment loss made in the prior year mainly relates to the shortfall between the carrying amount of the costs of investment and the recoverable amount of certain associated companies.
Group
2017 2016 $’000 $’000
The Group’s share of net profit of associated companies is as follows:
Share of profit before tax 390,039 344,986 Share of taxation (Note 26) (95,990) (72,361)
Share of net profit 294,049 272,625
The carrying amount of the Group’s material associated companies, all of which are equity accounted for and whose activities are strategic to the Group’s activities, are as follows:
2017 2016 $’000 $’000
Keppel REIT 1,850,409 1,844,738 Keppel Infrastructure Trust 267,169 284,320 KrisEnergy Limited 321,562 347,397 Keppel DC REIT 396,152 392,834 Other associated companies 3,065,960 2,543,292 5,901,252 5,412,581

Keppel Corporation Limited | Report to Shareholders 2017
143
The summarised financial information of the material associated companies, not adjusted for the Group’s proportionate share, based on its FRS financial statements and a reconciliation with the carrying amount of the investment in the consolidated financial statements are as follows:
Keppel REIT Keppel Infrastructure Trust
2017 2016 2017 2016 $’000 $’000 $’000 $’000
Current assets 208,307 290,193 488,154 516,723 Non-current assets 7,395,981 7,245,132 3,468,262 3,601,919 Total assets 7,604,288 7,535,325 3,956,416 4,118,642 Current liabilities 492,865 59,869 919,010 937,324 Non-current liabilities 2,196,165 2,576,898 1,725,512 1,727,348 Total liabilities 2,689,030 2,636,767 2,644,522 2,664,672 Net assets 4,915,258 4,898,558 1,311,894 1,453,970 Less: Non-controlling interests (151,834) (151,841) (158,959) (198,580) 4,763,424 4,746,717 1,152,935 1,255,390
Proportion of the Group’s ownership 45% 45% 18% 18% Group’s share of net assets 2,146,723 2,128,798 209,949 228,607 Other adjustments (296,314) (284,060) 57,220 55,713 Carrying amount of equity interest 1,850,409 1,844,738 267,169 284,320
Revenue 164,516 161,252 632,476 581,117 Profit after tax 180,154 257,787 13,776 6,121 Other comprehensive (loss)/income (49,789) 9,217 (10,051) (6,695) Total comprehensive income/(loss) 130,365 267,004 3,725 (574) Fair value of ownership interest (if listed) ** 1,914,043 1,505,741 403,858 333,622 Dividends received 80,011 90,922 26,126 26,128
KrisEnergy Limited * Keppel DC REIT
2017 2016 2017 2016 $’000 $’000 $’000 $’000
Current assets 191,987 183,440 178,078 338,312 Non-current assets 869,374 1,236,024 1,585,204 1,244,687 Total assets 1,061,361 1,419,464 1,763,282 1,582,999 Current liabilities 74,604 273,951 53,224 35,144 Non-current liabilities 653,172 546,346 593,556 473,987 Total liabilities 727,776 820,297 646,780 509,131 Net assets 333,585 599,167 1,116,502 1,073,868 Less: Non-controlling interests - - (26,786) (343) 333,585 599,167 1,089,716 1,073,525
Proportion of the Group’s ownership 40% 40% 35% 35% Group’s share of net assets 133,067 239,607 380,617 375,841 Other adjustments 123,253 107,790 15,535 16,993 Carrying amount of equity interest 256,320 347,397 396,152 392,834
Revenue 196,612 182,474 139,050 99,139 (Loss)/profit after tax (293,277) (262,322) 70,274 50,943 Other comprehensive income/(loss) 32 300 21,044 (7,656) Total comprehensive (loss)/income (293,245) (262,022) 91,318 43,287 Fair value of ownership interest (if listed) ** 60,425 110,679 562,990 466,534 Dividends received - - 20,958 17,595
* As at the date of approval of these financial statements, the most recent available financial information on which equity accounting for the current year can be practically applied are those financial information from October of the preceding year to September of the current year. The difference in reporting period has no materialimpactontheGroup’sconsolidatedfinancialstatements.TheGroupalsoholdsnotesamountingto$65,242,000issuedbyKrisEnergyLimitedin2017.
** Basedonthequotedmarketpriceat31December(Level1inthefairvaluehierarchy).

144
Financial Report
Notes to the Financial Statements
9. Associated companies (continued)
For the investment in KrisEnergy Limited (“KrisEnergy”), management performed an assessment on the recoverable amount using a discounted cash flow model based on a cash flow projection from 2018 to 2036 applying certain estimates and assumptions, such as oil prices, discount rates, production volume, lifting costs, reserves and operating costs. The assumption for oil prices, ranging from US$52 to US$70 per barrel for 2018 to 2036 (2016: US$59 to US$76 per barrel for 2017 to 2032), is determined by taking reference from external informationsources.Thediscountrateusedis10%(2016:10%).TheGrouphasrecognisedawrite-backofimpairmentof$46,000,000(2016: impairment charge of $46,000,000) during the financial year. The write-back was primarily due to equity accounting for the Group’s share of loss in 2017 amounting to $118,995,000. This share of loss recognised by the Group in 2017 included impairment loss recorded by KrisEnergy on its exploration assets which the Group had taken into consideration when performing the impairment review in 2016. The estimates and assumptions used are subject to risk and uncertainty. Therefore, there is a possibility that changes in circumstances will impact these projections, which may impact the recoverable amount of the investment in KrisEnergy. If the estimated oilpricesappliedtothediscountedcashflowshadbeen10%(2016:10%)lowerthanmanagement’sestimates,theGroupwouldhaverecognised a write-back of impairment amounting to $22,000,000 (2016: further impairment charge of $40,000,000).
In addition, the Group carried out a review of the recoverable amount of an associated company held by its Offshore & Marine Division, in consideration of the fact that the fair value of the investment is significantly below its carrying amount as at the balance sheet date. The recoverable amount of the associated company was determined based on a value-in-use calculation where cash flow projections were based on financial forecasts by management. Management had determined the forecasted cash flows based on past performance and their current expectations of market development. Cash inflows were based on revenue projections from existing order books with anestimateoftheterminalgrowthrateof2.2%(2016:2.0%)andadiscountrateof7.9%(2016:7.6%)perannumonthecashflows.Animpairment charge of $8,000,000 (2016: $21,640,000) was recognised in the profit and loss account within other operating expense as a result of the above review.
Aggregate information about the Group’s investments in other associated companies are as follows:
2017 2016 $’000 $’000
Share of profit before tax 381,642 287,995 Share of taxation (78,505) (50,309) Share of other comprehensive loss (65,443) (62,221) Share of total comprehensive income 237,694 175,465
Information relating to significant associated companies, including information on principal activities, country of operation/incorporation and proportion of ownership interest, and whose results are included in the financial statements is given in Note 36.
10. Investments
Group Company
2017 2016 2017 2016 $’000 $’000 $’000 $’000
Available-for-sale investments: Carried at fair value - Quoted equity shares 8,854 12,878 - - - Unquoted equity shares 53,419 47,736 15,012 14,340 - Unquoted property funds 185,187 174,154 - - - Unquoted - others - 11,788 - - Total–Carriedatfairvalue 247,460 246,556 15,012 14,340
Carried at cost - Unquoted equity shares 102,183 116,446 - - - Unquoted - others 3,285 5,729 - - Total–Carriedatcost 105,468 122,175 - -
Total available-for-sale investments 352,928 368,731 15,012 14,340
Investments at fair value through profit or loss: - Quoted warrants 31,647 - - - - Unquoted equity shares 74,063 8,973 - - Total investments at fair value through profit or loss 105,710 8,973 - -
Total investments 458,638 377,704 15,012 14,340
Unquotedinvestmentsincludedabondamountingto$39,256,000(2016:$41,700,000)bearinginterestat4%(2016:4%)perannumwhich is maturing in 2027. In prior year, an impairment loss of $35,971,000 was recorded based on cash flow projections using financial forecasts approved by the management.
During the financial year, the Group recognised an impairment loss of $14,330,000 (2016: $17,496,000) for certain unquoted equity securities in which the Group does not expect to recover its cost of investment.
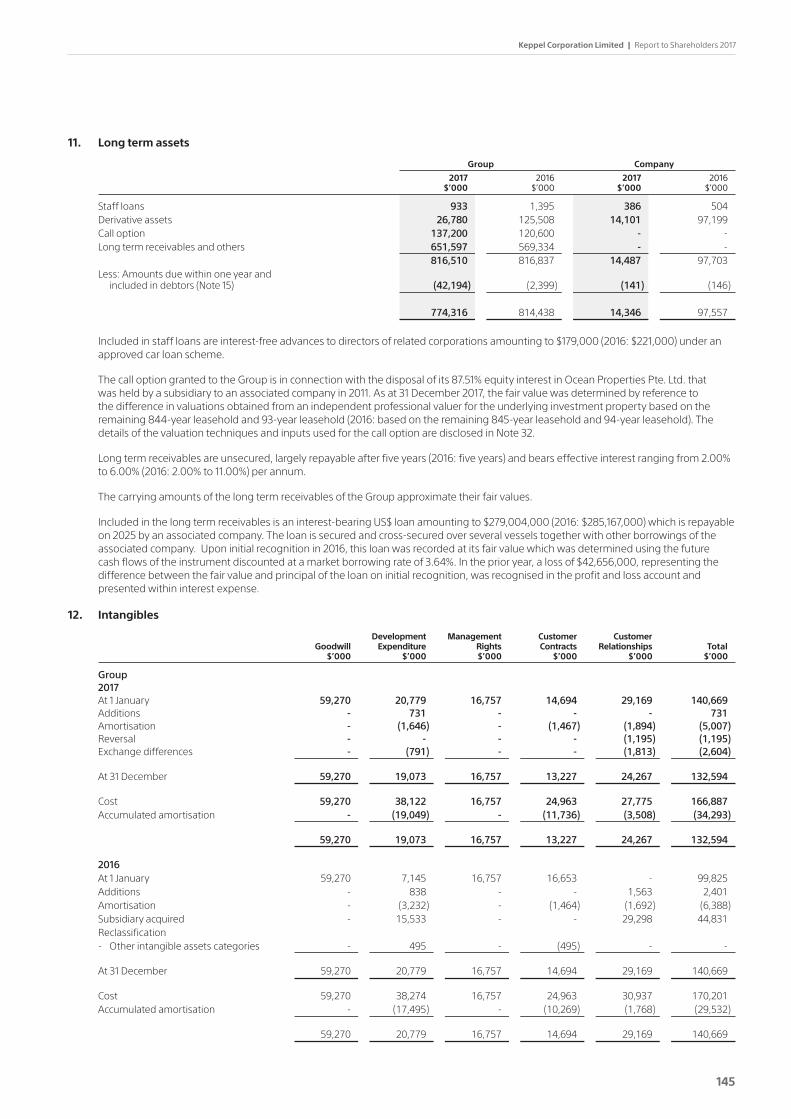
Keppel Corporation Limited | Report to Shareholders 2017
145
11. Long term assets
Group Company
2017 2016 2017 2016 $’000 $’000 $’000 $’000
Staff loans 933 1,395 386 504 Derivative assets 26,780 125,508 14,101 97,199 Call option 137,200 120,600 - - Long term receivables and others 651,597 569,334 - - 816,510 816,837 14,487 97,703 Less: Amounts due within one year and
included in debtors (Note 15) (42,194) (2,399) (141) (146)
774,316 814,438 14,346 97,557
Included in staff loans are interest-free advances to directors of related corporations amounting to $179,000 (2016: $221,000) under an approved car loan scheme.
ThecalloptiongrantedtotheGroupisinconnectionwiththedisposalofits87.51%equityinterestinOceanPropertiesPte.Ltd.thatwas held by a subsidiary to an associated company in 2011. As at 31 December 2017, the fair value was determined by reference to the difference in valuations obtained from an independent professional valuer for the underlying investment property based on the remaining 844-year leasehold and 93-year leasehold (2016: based on the remaining 845-year leasehold and 94-year leasehold). The details of the valuation techniques and inputs used for the call option are disclosed in Note 32.
Longtermreceivablesareunsecured,largelyrepayableafterfiveyears(2016:fiveyears)andbearseffectiveinterestrangingfrom2.00%to6.00%(2016:2.00%to11.00%)perannum.
The carrying amounts of the long term receivables of the Group approximate their fair values.
Included in the long term receivables is an interest-bearing US$ loan amounting to $279,004,000 (2016: $285,167,000) which is repayable on 2025 by an associated company. The loan is secured and cross-secured over several vessels together with other borrowings of the associated company. Upon initial recognition in 2016, this loan was recorded at its fair value which was determined using the future cashflowsoftheinstrumentdiscountedatamarketborrowingrateof3.64%.Intheprioryear,alossof$42,656,000,representingthedifference between the fair value and principal of the loan on initial recognition, was recognised in the profit and loss account and presented within interest expense.
12. Intangibles
Development Management Customer Customer Goodwill Expenditure Rights Contracts Relationships Total $’000 $’000 $’000 $’000 $’000 $’000
Group 2017 At 1 January 59,270 20,779 16,757 14,694 29,169 140,669 Additions - 731 - - - 731 Amortisation - (1,646) - (1,467) (1,894) (5,007) Reversal - - - - (1,195) (1,195) Exchange differences - (791) - - (1,813) (2,604)
At 31 December 59,270 19,073 16,757 13,227 24,267 132,594
Cost 59,270 38,122 16,757 24,963 27,775 166,887 Accumulated amortisation - (19,049) - (11,736) (3,508) (34,293)
59,270 19,073 16,757 13,227 24,267 132,594
2016 At 1 January 59,270 7,145 16,757 16,653 - 99,825 Additions - 838 - - 1,563 2,401 Amortisation - (3,232) - (1,464) (1,692) (6,388) Subsidiary acquired - 15,533 - - 29,298 44,831 Reclassification - Other intangible assets categories - 495 - (495) - -
At 31 December 59,270 20,779 16,757 14,694 29,169 140,669
Cost 59,270 38,274 16,757 24,963 30,937 170,201 Accumulated amortisation - (17,495) - (10,269) (1,768) (29,532)
59,270 20,779 16,757 14,694 29,169 140,669
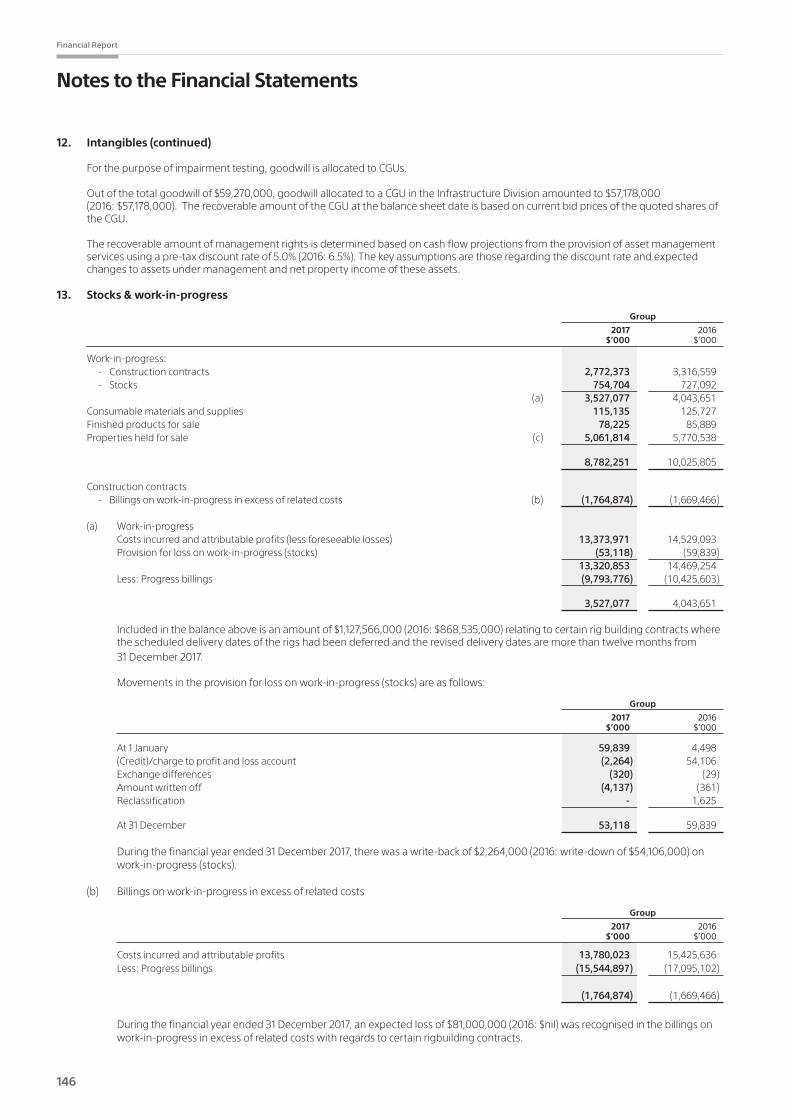
146
Financial Report
Notes to the Financial Statements
12. Intangibles (continued)
For the purpose of impairment testing, goodwill is allocated to CGUs.
Out of the total goodwill of $59,270,000, goodwill allocated to a CGU in the Infrastructure Division amounted to $57,178,000 (2016: $57,178,000). The recoverable amount of the CGU at the balance sheet date is based on current bid prices of the quoted shares of
the CGU.
The recoverable amount of management rights is determined based on cash flow projections from the provision of asset management servicesusingapre-taxdiscountrateof5.0%(2016:6.5%).Thekeyassumptionsarethoseregardingthediscountrateandexpectedchanges to assets under management and net property income of these assets.
13. Stocks & work-in-progress Group
2017 2016 $’000 $’000
Work-in-progress: - Construction contracts 2,772,373 3,316,559 - Stocks 754,704 727,092 (a) 3,527,077 4,043,651 Consumable materials and supplies 115,135 125,727 Finished products for sale 78,225 85,889 Properties held for sale (c) 5,061,814 5,770,538
8,782,251 10,025,805
Construction contracts - Billings on work-in-progress in excess of related costs (b) (1,764,874) (1,669,466)
(a) Work-in-progress Costs incurred and attributable profits (less foreseeable losses) 13,373,971 14,529,093 Provision for loss on work-in-progress (stocks) (53,118) (59,839) 13,320,853 14,469,254 Less: Progress billings (9,793,776) (10,425,603)
3,527,077 4,043,651
Included in the balance above is an amount of $1,127,566,000 (2016: $868,535,000) relating to certain rig building contracts where the scheduled delivery dates of the rigs had been deferred and the revised delivery dates are more than twelve months from
31 December 2017.
Movements in the provision for loss on work-in-progress (stocks) are as follows:
Group
2017 2016 $’000 $’000
At 1 January 59,839 4,498 (Credit)/charge to profit and loss account (2,264) 54,106 Exchange differences (320) (29) Amount written off (4,137) (361) Reclassification - 1,625
At 31 December 53,118 59,839
During the financial year ended 31 December 2017, there was a write-back of $2,264,000 (2016: write-down of $54,106,000) on work-in-progress (stocks).
(b) Billings on work-in-progress in excess of related costs
Group
2017 2016 $’000 $’000
Costs incurred and attributable profits 13,780,023 15,425,636 Less: Progress billings (15,544,897) (17,095,102)
(1,764,874) (1,669,466)
During the financial year ended 31 December 2017, an expected loss of $81,000,000 (2016: $nil) was recognised in the billings on work-in-progress in excess of related costs with regards to certain rigbuilding contracts.

Keppel Corporation Limited | Report to Shareholders 2017
147
(c) Properties held for sale
Group
2017 2016 $’000 $’000
Properties under development Land cost 2,848,223 3,039,080 Development cost incurred to date 1,006,820 842,811 Related overhead expenditure and recognised profits 323,043 282,593 Progress billings (362,922) (189,417) 3,815,164 3,975,067 Completed properties held for sale 1,284,426 1,867,887 5,099,590 5,842,954 Provision for properties held for sale (37,776) (72,416)
5,061,814 5,770,538
Movements in the provision for properties held for sale are as follows: At 1 January 72,416 83,959 Charge to profit and loss account - 19,008 Exchange differences (383) (400) Amount written off (28,866) (15,155) Subsidiary disposed (5,391) (14,996)
At 31 December 37,776 72,416
The provision for properties held for sale is estimated taking into account estimated selling prices and estimated total construction costs. The estimated selling prices are based on recent selling prices for the development project or comparable projects and the prevailing market conditions. The estimated total construction costs include contracted amounts plus estimated costs to be incurred based on historical trends. The provision is progressively reversed for those residential units sold above their carrying amounts.
The following table provides information about agreements that are in progress at the reporting date whose revenue are recognised on a percentage of completion basis:
Group
2017 2016 $’000 $’000
Aggregate amount of costs incurred and recognised profit (less recognised losses) to date 1,426,286 1,414,377
Less: Progress billings (362,922) (189,417)
At 31 December 1,063,364 1,224,960
Interestcapitalisedduringthefinancialyearamountedto$44,187,000(2016:$54,982,000)atratesrangingfrom1.60%to3.36%(2016:0.93%to3.91%)perannumforSingaporepropertiesand0.05%to15.00%(2016:0.05%to15.00%)perannumforoverseasproperties.
Certain properties held for sale with carrying amount of $1,186,296,000 (2016: $2,019,439,000) are mortgaged to banks for loan facilities (Note 20).

148
Financial Report
Notes to the Financial Statements
14. Amounts due from/to
Company
2017 2016 $’000 $’000
Subsidiaries Amounts due from - trade 97,984 86,001 - advances 3,407,536 3,902,961 3,505,520 3,988,962 Provision for doubtful debts (6,600) (6,600)
3,498,920 3,982,362 Amounts due to - trade 4,726 900,632 - advances 231,677 162,090
236,403 1,062,722
Movements in the provision for doubtful debts are as follows:
At 1 January/31 December 6,600 6,600
Advancestoandfromsubsidiariesareunsecuredandarerepayableondemand.Interestischargedatratesupto4.00%(2016:upto4.00%)perannumoninterest-bearingadvances.
Group Company
2017 2016 2017 2016 $’000 $’000 $’000 $’000
Associated Companies Amounts due from - trade 66,482 61,117 733 688 - advances 291,735 373,394 - - 358,217 434,511 733 688 Provision for doubtful debts (15,257) (1,131) - -
342,960 433,380 733 688
Amounts due to - trade 34,110 16,094 - - - advances 219,221 95,449 - -
253,331 111,543 - -
Movements in the provision for doubtful debts are as follows:
At 1 January 1,131 46 - - Charge to profit and loss account 14,126 1,085 - -
At 31 December 15,257 1,131 - -
Advances to and from associated companies are unsecured and are repayable on demand. Interest is charged at rates ranging from 0.25%to8.00%(2016:0.13%to8.90%)perannumoninterest-bearingadvances.
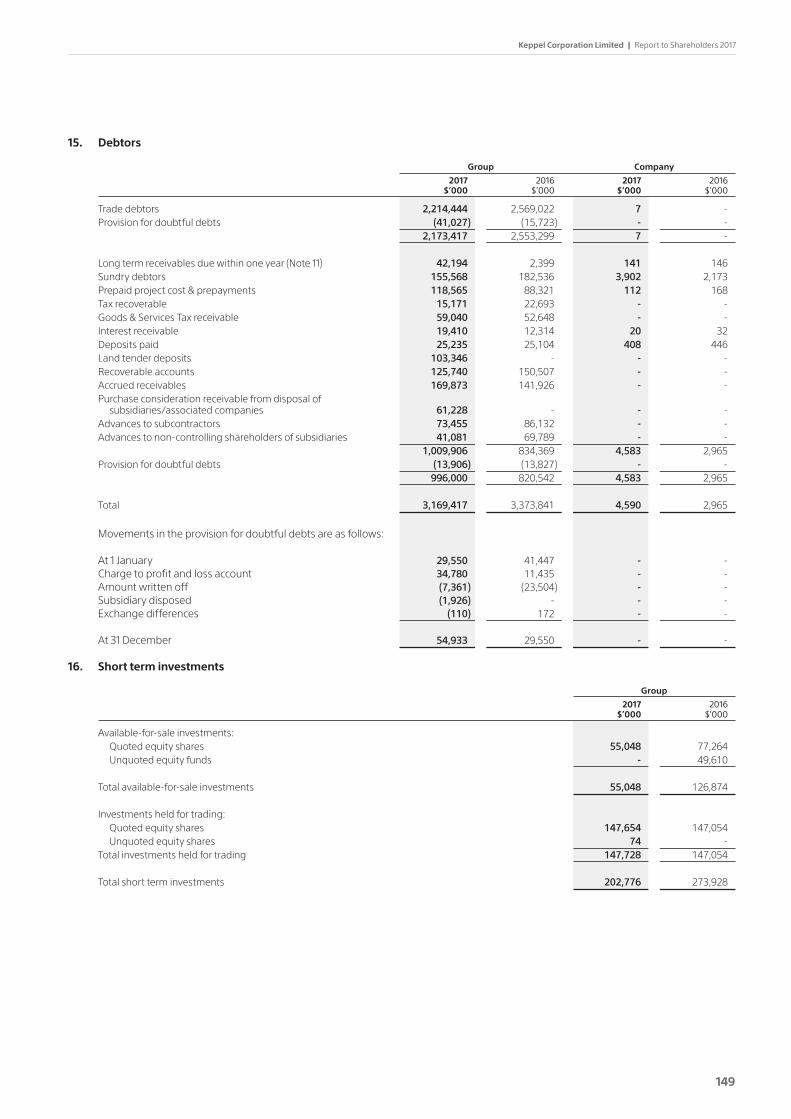
Keppel Corporation Limited | Report to Shareholders 2017
149
15. Debtors
Group Company
2017 2016 2017 2016 $’000 $’000 $’000 $’000
Trade debtors 2,214,444 2,569,022 7 - Provision for doubtful debts (41,027) (15,723) - - 2,173,417 2,553,299 7 -
Long term receivables due within one year (Note 11) 42,194 2,399 141 146 Sundry debtors 155,568 182,536 3,902 2,173 Prepaid project cost & prepayments 118,565 88,321 112 168 Tax recoverable 15,171 22,693 - - Goods & Services Tax receivable 59,040 52,648 - - Interest receivable 19,410 12,314 20 32 Deposits paid 25,235 25,104 408 446 Land tender deposits 103,346 - - - Recoverable accounts 125,740 150,507 - - Accrued receivables 169,873 141,926 - - Purchase consideration receivable from disposal of
subsidiaries/associated companies 61,228 - - - Advances to subcontractors 73,455 86,132 - - Advances to non-controlling shareholders of subsidiaries 41,081 69,789 - - 1,009,906 834,369 4,583 2,965 Provision for doubtful debts (13,906) (13,827) - - 996,000 820,542 4,583 2,965
Total 3,169,417 3,373,841 4,590 2,965
Movements in the provision for doubtful debts are as follows:
At 1 January 29,550 41,447 - - Charge to profit and loss account 34,780 11,435 - - Amount written off (7,361) (23,504) - - Subsidiary disposed (1,926) - - - Exchange differences (110) 172 - -
At 31 December 54,933 29,550 - -
16. Short term investments
Group
2017 2016 $’000 $’000
Available-for-sale investments: Quoted equity shares 55,048 77,264 Unquoted equity funds - 49,610
Total available-for-sale investments 55,048 126,874
Investments held for trading: Quoted equity shares 147,654 147,054 Unquoted equity shares 74 - Total investments held for trading 147,728 147,054
Total short term investments 202,776 273,928
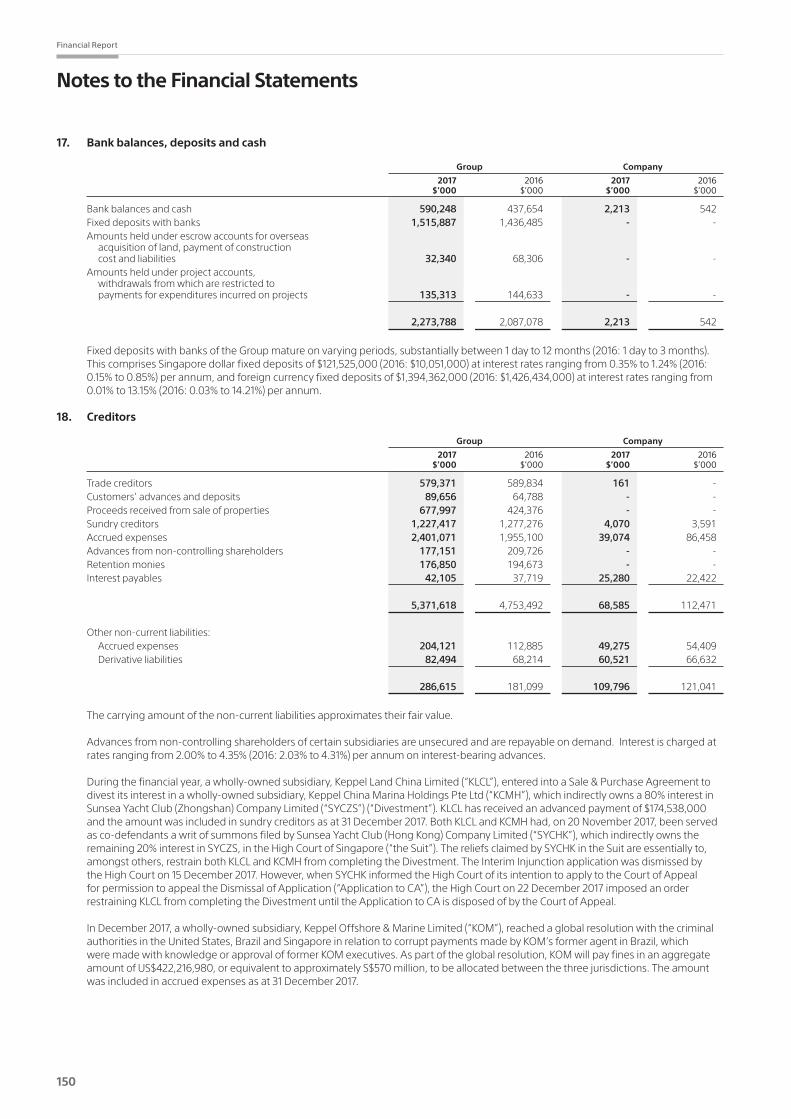
150
Financial Report
Notes to the Financial Statements
17. Bank balances, deposits and cash
Group Company
2017 2016 2017 2016 $’000 $’000 $’000 $’000
Bank balances and cash 590,248 437,654 2,213 542 Fixed deposits with banks 1,515,887 1,436,485 - - Amounts held under escrow accounts for overseas
acquisition of land, payment of construction cost and liabilities 32,340 68,306 - -
Amounts held under project accounts, withdrawals from which are restricted to payments for expenditures incurred on projects 135,313 144,633 - -
2,273,788 2,087,078 2,213 542
Fixed deposits with banks of the Group mature on varying periods, substantially between 1 day to 12 months (2016: 1 day to 3 months). ThiscomprisesSingaporedollarfixeddepositsof$121,525,000(2016:$10,051,000)atinterestratesrangingfrom0.35%to1.24%(2016:0.15%to0.85%)perannum,andforeigncurrencyfixeddepositsof$1,394,362,000(2016:$1,426,434,000)atinterestratesrangingfrom0.01%to13.15%(2016:0.03%to14.21%)perannum.
18. Creditors
Group Company
2017 2016 2017 2016 $’000 $’000 $’000 $’000
Trade creditors 579,371 589,834 161 - Customers’ advances and deposits 89,656 64,788 - - Proceeds received from sale of properties 677,997 424,376 - - Sundry creditors 1,227,417 1,277,276 4,070 3,591 Accrued expenses 2,401,071 1,955,100 39,074 86,458 Advances from non-controlling shareholders 177,151 209,726 - - Retention monies 176,850 194,673 - - Interest payables 42,105 37,719 25,280 22,422
5,371,618 4,753,492 68,585 112,471
Other non-current liabilities: Accrued expenses 204,121 112,885 49,275 54,409 Derivative liabilities 82,494 68,214 60,521 66,632
286,615 181,099 109,796 121,041
The carrying amount of the non-current liabilities approximates their fair value.
Advances from non-controlling shareholders of certain subsidiaries are unsecured and are repayable on demand. Interest is charged at ratesrangingfrom2.00%to4.35%(2016:2.03%to4.31%)perannumoninterest-bearingadvances.
During the financial year, a wholly-owned subsidiary, Keppel Land China Limited (“KLCL”), entered into a Sale & Purchase Agreement to divestitsinterestinawholly-ownedsubsidiary,KeppelChinaMarinaHoldingsPteLtd(“KCMH”),whichindirectlyownsa80%interestinSunsea Yacht Club (Zhongshan) Company Limited (“SYCZS”) (“Divestment”). KLCL has received an advanced payment of $174,538,000 and the amount was included in sundry creditors as at 31 December 2017. Both KLCL and KCMH had, on 20 November 2017, been served as co-defendants a writ of summons filed by Sunsea Yacht Club (Hong Kong) Company Limited (“SYCHK”), which indirectly owns the remaining20%interestinSYCZS,intheHighCourtofSingapore(“theSuit”).ThereliefsclaimedbySYCHKintheSuitareessentiallyto,amongst others, restrain both KLCL and KCMH from completing the Divestment. The Interim Injunction application was dismissed by the High Court on 15 December 2017. However, when SYCHK informed the High Court of its intention to apply to the Court of Appeal for permission to appeal the Dismissal of Application (“Application to CA”), the High Court on 22 December 2017 imposed an order restraining KLCL from completing the Divestment until the Application to CA is disposed of by the Court of Appeal.
In December 2017, a wholly-owned subsidiary, Keppel Offshore & Marine Limited (“KOM”), reached a global resolution with the criminal authorities in the United States, Brazil and Singapore in relation to corrupt payments made by KOM’s former agent in Brazil, which were made with knowledge or approval of former KOM executives. As part of the global resolution, KOM will pay fines in an aggregate amount of US$422,216,980, or equivalent to approximately S$570 million, to be allocated between the three jurisdictions. The amount was included in accrued expenses as at 31 December 2017.

Keppel Corporation Limited | Report to Shareholders 2017
151
As part of the global resolution, KOM has accepted a Conditional Warning from the Corrupt Practices Investigation Bureau (“CPIB”) in Singapore, and entered into a Deferred Prosecution Agreement (“DPA”) with the U.S. Department of Justice (“DOJ”), while Keppel FELS Brasil S.A., a wholly-owned subsidiary of KOM, has entered into a Leniency Agreement with the Public Prosecutor’s Office in Brazil, the Ministério Público Federal (“MPF”). The Leniency Agreement would become effective following the approval of the Fifth Chamber for Coordination and Review of the MPF. In addition, Keppel Offshore & Marine USA, Inc. (“KOM USA”), also a wholly-owned subsidiary of KOM, has pleaded guilty to one count of conspiracy to violate the U.S. Foreign Corrupt Practices Act and has entered into a Plea Agreement with the DOJ. KOM USA will pay a penalty, which will be subtracted from the amount owed by KOM to the United States government under the DPA.
Pursuant to the DPA, KOM has paid a monetary penalty of US$105,554,245, of which US$4,725,000 has been paid as a criminal fine by KOM USA, to the United States Treasury within ten business days of 22 December 2017 (the date of entry of the judgment of KOM USA’s sentence by the United States District Court for the Eastern District of New York). In addition, KOM will pay US$211,108,490 to the MPF within 90 days of the payment instructions provided by the MPF and after the approval of the Fifth Chamber for Coordination and Review of the MPF. Under the Conditional Warning issued by CPIB, KOM has committed to certain undertakings and will pay US$52,777,122.50 to the Singapore authorities within 90 days from the date of the Conditional Warning dated 23 December 2017 (i.e. being 23 March 2018) and a further US$52,777,122.50 within three years from the date of the Conditional Warning (less any penalties paid by KOM to specified Brazilian authorities during this period).
Based on the information available as at the date of these financial statements, management is of the opinion that no material claim has arisen that would result in additional provision in relation to these corrupt payments.
19. Provisions
Warranties $’000
Group 2017 At 1 January 81,679 Charge to profit and loss account 39,280 Amount utilised (4,205) Subsidiary disposed (397) Exchange differences (385)
At 31 December 115,972
2016 At 1 January 90,216 Write-back to profit and loss account (1,450) Amount utilised (7,153) Exchange differences 66
At 31 December 81,679
20. Term loans
2017 2016
Due within Due after Due within Due after one year one year one year one year $’000 $’000 $’000 $’000
Group Keppel Corporation Medium Term Notes (a) - 1,700,000 - 1,700,000 Keppel Land Medium Term Notes (b) - 916,027 99,964 786,873 Keppel Telecommunications & Transportation
Medium Term Notes (c) - 100,000 - 120,000 Keppel GMTN Floating Rate Notes (d) - 269,800 - 286,600 Bank and other loans - secured (e) 150,591 580,825 391,046 744,449 - unsecured (f) 1,563,493 2,512,267 1,344,311 3,579,799
1,714,084 6,078,919 1,835,321 7,217,721
Company Keppel Corporation Medium Term Notes (a) - 1,700,000 - 1,700,000 Unsecured bank loans (f) 551,530 1,239,800 692,311 1,625,600
551,530 2,939,800 692,311 3,325,600

152
Financial Report
Notes to the Financial Statements
20. Term loans (continued)
(a) At the end of the financial year, notes issued under the US$3,000,000,000 Multi-Currency Medium Term Note Programme by the Company amounted to $1,700,000,000 (2016: $1,700,000,000). The notes denominated in Singapore Dollars, are unsecured and comprisedfixedratenotesduefrom2020to2042(2016:from2020to2042)withinterestratesrangingfrom3.10%to4.00%(2016:3.10%to4.00%)perannum.
(b) At the end of the financial year, notes issued under the US$3,000,000,000 Multi-Currency Medium Term Note Programme by Keppel Land Limited and its wholly-owned subsidiary, Keppel Land Financial Services Pte. Ltd. amounted to $486,696,000 (2016: $357,691,000), of which $149,818,000 (2016: $nil) are denominated in Singapore dollar and $336,878,000 (2016: $357,691,000) are denominated in foreign currency. The fixed rate notes are unsecured and are due from 2019 to 2023 (2016: from 2020 to 2042), withinterestratesof2.84%perannumforfixedratenotesdenominatedinSingaporedollarand3.26%(2016:3.26%)perannumfor fixed rate notes denominated in foreign currency.
At the end of the financial year, notes issued under the US$800,000,000 Multi-Currency Medium Term Note Programme by Keppel Land Limited amounted to $429,331,000 (2016: $529,146,000). The notes denominated in Singapore Dollars, are unsecuredandcomprisedfixedratenotesduefrom2020to2024(2016:2017to2024)withinterestratesrangingfrom2.83%to3.90%(2016:2.83%to3.90%)perannum.
(c) At the end of the financial year, notes issued under the S$500,000,000 Multi-Currency Medium Term Note Programme by Keppel Telecommunications & Transportation Ltd, amounted to $100,000,000 (2016: $120,000,000). The fixed rates notes, due in 2024, areunsecuredandcarriedaninterestrateof2.85%perannumfromSeptember2017toSeptember2022and3.85%perannumfromSeptember2022toSeptember2024(2016:2.63%perannumfromAugust2012toAugust2017and3.83%perannumfromAugust 2017 to August 2019).
(d) At the end of the financial year, US$200,000,000 notes issued under the US$2,000,000,000 Euro Medium Term Note Programme by Keppel GMTN Pte Ltd amounted to $269,800,000 (2016: $286,600,000). The floating rate notes due in 2020 are unsecured andbearinterestratepayablequarterlyat3-monthUSDollarLondonInterbankOfferedRateplus0.89%perannumandrangingfrom1.75%to2.24%(2016:1.21%to1.75%)perannum.
(e) The secured bank loans consist of:
- A term loan of $256,498,000 (2016: $351,557,000) drawn down by a subsidiary. The term loan is repayable in 2019 and is securedoncertainassetsofthesubsidiary.Interestisbasedonmoneymarketratesrangingfrom1.35%to1.94%(2016:0.93%to2.30%)perannum.
- Other secured bank loans comprised $474,918,000 (2016: $504,943,000) of foreign currency loans. They are repayable between one to sixteen (2016: one to seventeen) years and are secured on investment property and certain fixed and other assetsofthesubsidiaries.Interestonforeigncurrencyloansisbasedonmoneymarketratesrangingfrom1.49%to7.23%(2016:1.60%to10.89%)perannum.
During the previous financial year,
- A term loan of $175,874,000 was drawn down by a subsidiary. The term loan was repaid in 2017 and was previously secured oncertainassetsofthesubsidiary.Interestwasbasedonmoneymarketratesrangingfrom1.28%to2.68%perannum.
- A term loan of $53,121,000 was drawn down by a subsidiary. The term loan was repaid in 2017 and was previously secured oncertainassetsofthesubsidiary.Interestwasbasedonmoneymarketratesrangingfrom1.21%to2.94%perannum.
- A term loan of $50,000,000 was drawn down by a subsidiary. The term loan was repaid in 2017 and was previously secured oncertainassetsofthesubsidiary.Interestwasfixedat2.62%perannum.
(f) The unsecured bank and other loans of the Group totalling $4,075,760,000 (2016: $4,924,110,000) comprised $2,823,820,000 (2016: $3,136,786,000) of loans denominated in Singapore dollar and $1,251,940,000 (2016: $1,787,324,000) of foreign currency loans. They are repayable between one to fourteen (2016: one to fifteen) years. Interest on loans denominated in Singapore dollarisbasedonmoneymarketratesrangingfrom1.18%to3.38%(2016:0.84%to3.38%)perannum.Interestonforeigncurrencyloansisbasedonmoneymarketratesrangingfrom0.48%to10.69%(2016:0.25%to13.76%)perannum.
The unsecured bank loans of the Company totalling $1,791,330,000 (2016: $2,317,911,000) comprise $1,550,000,000 (2016:
$1,707,350,000) of loans denominated in Singapore dollar and $241,330,000 (2016: $610,561,000) of foreign currency loans. They are repayable within one to seven years (2016: one to seven years). Interest on loans denominated in Singapore dollar is based on moneymarketratesrangingfrom1.46%to3.38%(2016:0.84%to3.38%)perannum.Interestonforeigncurrencyloansisbasedonmoneymarketratesrangingfrom0.50%to2.10%(2016:0.41%to2.30%)perannum.

Keppel Corporation Limited | Report to Shareholders 2017
153
The Group has mortgaged certain properties and assets of up to an aggregate amount of $1,894,728,000 (2016: $2,810,528,000) to banks for loan facilities.
The fair values of term loans for the Group and Company are $7,864,285,000 (2016: $9,055,975,000) and $3,556,370,000 (2016: $4,024,498,000) respectively. These fair values, under Level 2 of the fair value hierarchy, are computed on the discounted cash flow
method using a discount rate based upon the borrowing rate which the Group expect would be available as at the balance sheet date.
Loans due after one year are estimated to be repayable as follows:
Group Company
2017 2016 2017 2016 $’000 $’000 $’000 $’000
Years after year-end: After one but within two years 1,403,471 1,839,458 - 400,000 After two but within five years 3,174,902 3,027,749 1,900,000 1,000,000 After five years 1,500,546 2,350,514 1,039,800 1,925,600
6,078,919 7,217,721 2,939,800 3,325,600
21. Deferred taxation
Group
2017 2016 $’000 $’000
Deferred tax liabilities: Accelerated tax depreciation 108,936 115,424 Investment properties valuation 184,429 152,751 Offshore income & others 90,502 96,334 383,867 364,509 Deferred tax assets: Provisions (32,778) (29,711) Unutilised tax benefits (16,415) (3,623) (49,193) (33,334)
Net deferred tax liabilities 334,674 331,175
Net deferred tax liabilities are determined by offsetting deferred tax assets against deferred tax liabilities of the same entities. Deferred tax assets are recognised for unutilised tax benefits carried forward to the extent that realisation of the related tax benefits through future taxable profits is probable.
The Group has unrecognised deferred tax liabilities of $96,255,000 (2016: $86,905,000) for taxes that would be payable on the undistributed earnings of certain subsidiaries as these earnings would not be distributed in the foreseeable future and the Group is in a position to control the timing of the reversal of the temporary differences.
The Group has unutilised tax losses and capital allowances of $886,858,000 (2016: $950,132,000) for which no deferred tax benefit is recognised in the balance sheet. These tax losses and capital allowances can be carried forward and used to offset against future taxable income subject to meeting certain statutory requirements by those companies with unrecognised tax losses and capital allowances in their respective countries of incorporation. Tax losses amounting to $227,747,000 (2016: $322,206,000) can be carried forward for a period of one to five years subsequent to the year of the loss, while the remaining tax losses have no expiry date.

154
Financial Report
Notes to the Financial Statements
21. Deferred taxation (continued) Movements in deferred tax liabilities and assets are as follows:
Charged/ (credited) to other Charged/ comprehen- At (credited) to sive Subsidiaries Subsidiaries Reclassifi- Exchange At 1 January profit or loss income disposed acquired cation differences 31 December $’000 $’000 $’000 $’000 $’000 $’000 $’000 $’000
Group 2017 Deferred Tax Liabilities Accelerated tax depreciation 115,424 (2,320) - (2,753) - (1,195) (220) 108,936 Investment properties valuation 152,751 32,196 - - - - (518) 184,429 Offshore income & others 96,334 (5,028) 898 (1,441) - - (261) 90,502 Total 364,509 24,848 898 (4,194) - (1,195) (999) 383,867
Deferred Tax Assets Other provisions (29,711) (3,392) 229 (53) - (49) 198 (32,778) Unutilised tax benefits (3,623) (7,402) - (6,052) - (131) 793 (16,415) Total (33,334) (10,794) 229 (6,105) - (180) 991 (49,193)
Net Deferred Tax Liabilities 331,175 14,054 1,127 (10,299) - (1,375) (8) 334,674
2016 Deferred Tax Liabilities Accelerated tax depreciation 123,573 (9,212) - - 1,208 - (145) 115,424 Investment properties valuation 148,684 9,662 - (4,380) - - (1,215) 152,751 Offshore income & others 137,972 (39,261) (14) (853) - - (1,510) 96,334 Total 410,229 (38,811) (14) (5,233) 1,208 - (2,870) 364,509
Deferred Tax Assets Other provisions (26,981) (2,650) - (50) - (55) 25 (29,711) Unutilised tax benefits (10,075) 6,292 - - - - 160 (3,623) Total (37,056) 3,642 - (50) - (55) 185 (33,334)
Net Deferred Tax Liabilities 373,173 (35,169) (14) (5,283) 1,208 (55) (2,685) 331,175
22. Revenue
Group
2017 2016 $’000 $’000
Revenue from construction contracts 1,771,007 2,705,985 Sale of property - Recognised on completion of construction method 885,022 1,064,540 - Recognised on percentage of completion method 748,037 797,071 Sale of goods 49,835 118,808 Rental income from investment properties 54,592 59,718 Revenue from services rendered 2,417,293 2,017,761 Sale of investments 34,953 - Dividend income from quoted shares 2,760 3,163 Others 274 218
5,963,773 6,767,264
23. Staff costs
Group
2017 2016 $’000 $’000
Wages and salaries 821,201 909,671 Employer’s contribution to Central Provident Fund 75,609 80,687 Share options and share plans granted to Directors and employees 32,583 39,969 Other staff benefits 97,626 125,055
1,027,019 1,155,382
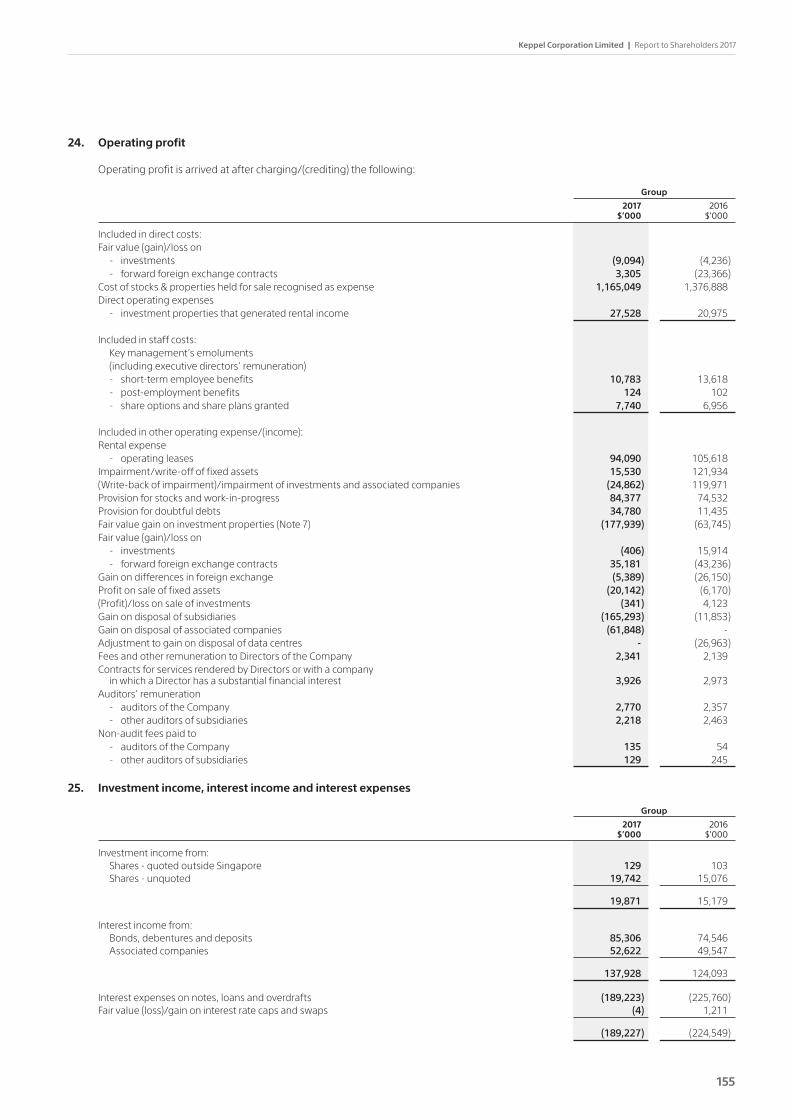
Keppel Corporation Limited | Report to Shareholders 2017
155
24. Operating profit
Operating profit is arrived at after charging/(crediting) the following:
Group
2017 2016 $’000 $’000
Included in direct costs: Fair value (gain)/loss on - investments (9,094) (4,236) - forward foreign exchange contracts 3,305 (23,366) Cost of stocks & properties held for sale recognised as expense 1,165,049 1,376,888 Direct operating expenses - investment properties that generated rental income 27,528 20,975
Included in staff costs: Key management’s emoluments (including executive directors’ remuneration) - short-term employee benefits 10,783 13,618 - post-employment benefits 124 102 - share options and share plans granted 7,740 6,956
Included in other operating expense/(income): Rental expense - operating leases 94,090 105,618 Impairment/write-off of fixed assets 15,530 121,934 (Write-back of impairment)/impairment of investments and associated companies (24,862) 119,971 Provision for stocks and work-in-progress 84,377 74,532 Provision for doubtful debts 34,780 11,435 Fair value gain on investment properties (Note 7) (177,939) (63,745) Fair value (gain)/loss on - investments (406) 15,914 - forward foreign exchange contracts 35,181 (43,236) Gain on differences in foreign exchange (5,389) (26,150) Profit on sale of fixed assets (20,142) (6,170) (Profit)/loss on sale of investments (341) 4,123 Gain on disposal of subsidiaries (165,293) (11,853) Gain on disposal of associated companies (61,848) - Adjustment to gain on disposal of data centres - (26,963) Fees and other remuneration to Directors of the Company 2,341 2,139 Contracts for services rendered by Directors or with a company
in which a Director has a substantial financial interest 3,926 2,973 Auditors’ remuneration - auditors of the Company 2,770 2,357 - other auditors of subsidiaries 2,218 2,463 Non-audit fees paid to - auditors of the Company 135 54 - other auditors of subsidiaries 129 245
25. Investment income, interest income and interest expenses
Group
2017 2016 $’000 $’000
Investment income from: Shares - quoted outside Singapore 129 103 Shares - unquoted 19,742 15,076
19,871 15,179
Interest income from: Bonds, debentures and deposits 85,306 74,546 Associated companies 52,622 49,547
137,928 124,093
Interest expenses on notes, loans and overdrafts (189,223) (225,760) Fair value (loss)/gain on interest rate caps and swaps (4) 1,211
(189,227) (224,549)
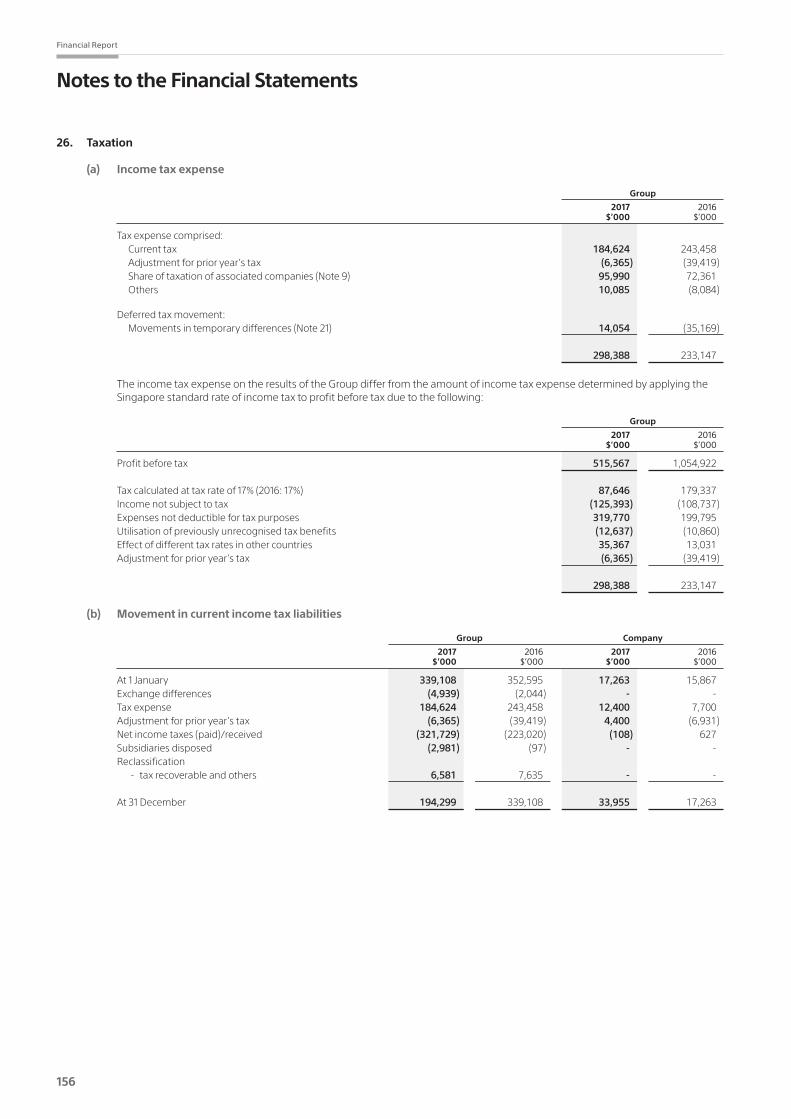
156
Financial Report
Notes to the Financial Statements
26. Taxation
(a) Income tax expense
Group
2017 2016 $’000 $’000
Tax expense comprised: Current tax 184,624 243,458 Adjustment for prior year’s tax (6,365) (39,419) Share of taxation of associated companies (Note 9) 95,990 72,361 Others 10,085 (8,084)
Deferred tax movement: Movements in temporary differences (Note 21) 14,054 (35,169)
298,388 233,147
The income tax expense on the results of the Group differ from the amount of income tax expense determined by applying the Singapore standard rate of income tax to profit before tax due to the following:
Group
2017 2016 $’000 $’000
Profit before tax 515,567 1,054,922
Taxcalculatedattaxrateof17%(2016:17%) 87,646 179,337 Income not subject to tax (125,393) (108,737) Expenses not deductible for tax purposes 319,770 199,795 Utilisation of previously unrecognised tax benefits (12,637) (10,860) Effect of different tax rates in other countries 35,367 13,031 Adjustment for prior year’s tax (6,365) (39,419)
298,388 233,147
(b) Movement in current income tax liabilities
Group Company
2017 2016 2017 2016 $’000 $’000 $’000 $’000
At 1 January 339,108 352,595 17,263 15,867 Exchange differences (4,939) (2,044) - - Tax expense 184,624 243,458 12,400 7,700 Adjustment for prior year’s tax (6,365) (39,419) 4,400 (6,931) Net income taxes (paid)/received (321,729) (223,020) (108) 627 Subsidiaries disposed (2,981) (97) - - Reclassification - tax recoverable and others 6,581 7,635 - -
At 31 December 194,299 339,108 33,955 17,263

Keppel Corporation Limited | Report to Shareholders 2017
157
27. Earnings per ordinary share
Group
2017 2016 $’000 $’000 Basic Diluted Basic Diluted
Net profit attributable to shareholders 216,668 216,668 783,928 783,928 Adjustment for dilutive potential ordinary shares
of subsidiaries and associated companies - - - (443)
Adjusted net profit 216,668 216,668 783,928 783,485
Number of Shares Number of Shares ’000 ’000
Weighted average number of ordinary shares (excluding treasury shares) 1,816,965 1,816,965 1,814,792 1,814,792
Adjustment for dilutive potential ordinary shares - 12,737 - 11,566 Weighted average number of ordinary shares used
to compute earnings per share (excluding treasury shares) 1,816,965 1,829,702 1,814,792 1,826,358
Earnings per ordinary share 11.9 cts 11.8 cts 43.2cts 42.9cts
28. Dividends
A final cash dividend of 14.0 cents per share tax exempt one-tier (2016: final cash dividend of 12.0 cents per share tax exempt one-tier) in respect of the financial year ended 31 December 2017 has been proposed for approval by shareholders at the next Annual General Meeting to be convened.
Together with the interim dividend comprising a cash dividend of 8.0 cents per share tax exempt one-tier (2016: cash dividend of 8.0 cents per share tax exempt one-tier), total distributions paid and proposed in respect of the financial year ended 31 December 2017 will be 22.0 cents per share (2016: 20.0 cents per share).
During the financial year, the following distributions were made:
$’000
A final cash dividend of 12.0 cents per share tax exempt one-tier on the issued and fully paid ordinary shares in respect of the previous financial year 218,117
An interim cash dividend of 8.0 cents per share tax exempt one-tier on the issued and fully paid ordinary shares in respect of the current financial year 145,414
363,531
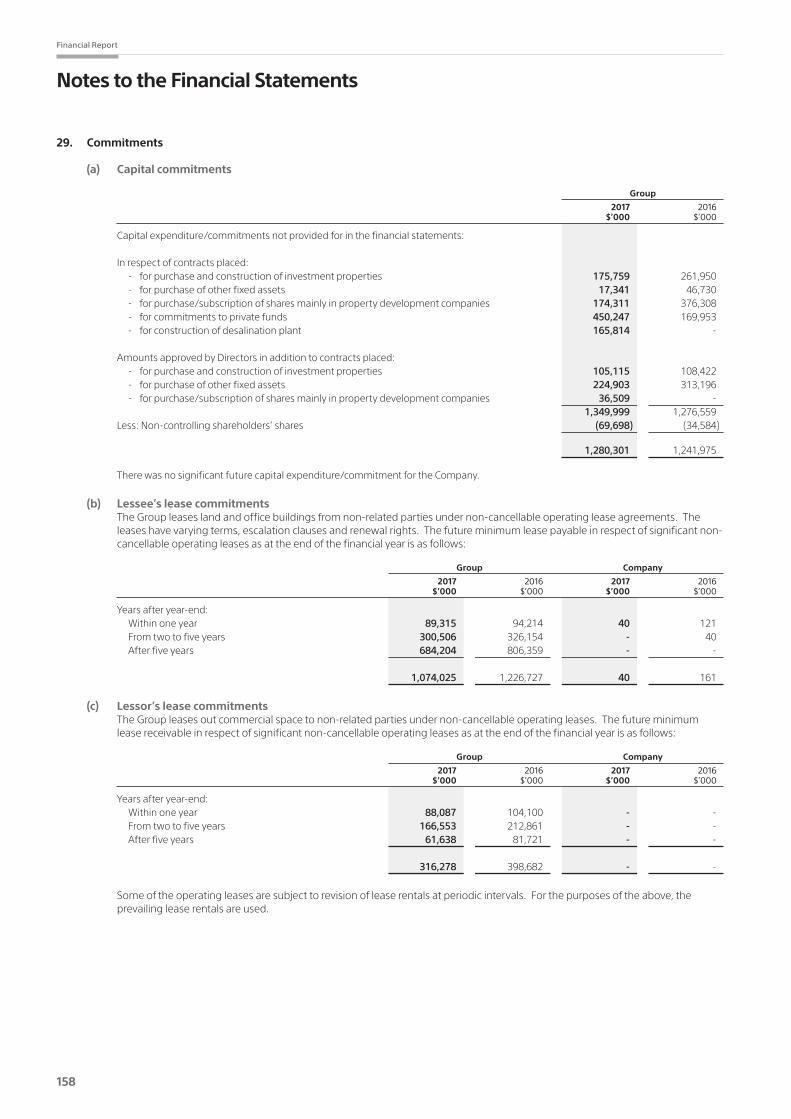
158
Financial Report
Notes to the Financial Statements
29. Commitments
(a) Capital commitments
Group
2017 2016 $’000 $’000
Capital expenditure/commitments not provided for in the financial statements:
In respect of contracts placed: - for purchase and construction of investment properties 175,759 261,950 - for purchase of other fixed assets 17,341 46,730 - for purchase/subscription of shares mainly in property development companies 174,311 376,308 - for commitments to private funds 450,247 169,953 - for construction of desalination plant 165,814 - Amounts approved by Directors in addition to contracts placed: - for purchase and construction of investment properties 105,115 108,422 - for purchase of other fixed assets 224,903 313,196 - for purchase/subscription of shares mainly in property development companies 36,509 - 1,349,999 1,276,559 Less: Non-controlling shareholders’ shares (69,698) (34,584)
1,280,301 1,241,975
There was no significant future capital expenditure/commitment for the Company.
(b) Lessee’s lease commitments The Group leases land and office buildings from non-related parties under non-cancellable operating lease agreements. The
leases have varying terms, escalation clauses and renewal rights. The future minimum lease payable in respect of significant non-cancellable operating leases as at the end of the financial year is as follows:
Group Company
2017 2016 2017 2016 $’000 $’000 $’000 $’000
Years after year-end: Within one year 89,315 94,214 40 121 From two to five years 300,506 326,154 - 40 After five years 684,204 806,359 - -
1,074,025 1,226,727 40 161
(c) Lessor’s lease commitments The Group leases out commercial space to non-related parties under non-cancellable operating leases. The future minimum
lease receivable in respect of significant non-cancellable operating leases as at the end of the financial year is as follows:
Group Company
2017 2016 2017 2016 $’000 $’000 $’000 $’000
Years after year-end: Within one year 88,087 104,100 - - From two to five years 166,553 212,861 - - After five years 61,638 81,721 - -
316,278 398,682 - -
Some of the operating leases are subject to revision of lease rentals at periodic intervals. For the purposes of the above, the prevailing lease rentals are used.

Keppel Corporation Limited | Report to Shareholders 2017
159
30. Contingent liabilities and guarantees (unsecured)
Group Company
2017 2016 2017 2016 $’000 $’000 $’000 $’000
Guarantees in respect of banks and other loans granted to subsidiaries and associated companies 585,207 469,263 1,574,853 1,715,102
Bank guarantees 1,677 5,328 - - Others - 327 - -
586,884 474,918 1,574,853 1,715,102
The financial effects of FRS 39 relating to financial guarantee contracts issued by the Company are not material to the financial statements of the Company and therefore are not recognised.
31. Significant related party transactions
In addition to the related party information disclosed elsewhere in the financial statements, the Group has significant related party transactions as follows:
Group
2017 2016 $’000 $’000
Sales of goods and/or services to - associated companies 168,705 205,489 - other related parties 82,884 103,749
251,589 309,238
Purchase of goods and/or services from - associated companies 83,761 79,384 - other related parties 28,842 48,057
112,603 127,441
Treasury transactions with - associated companies 9,093 10,546
32. Financial risk management
The Group operates internationally and is exposed to a variety of financial risks, comprising market risk (including currency risk, interest rate risk and price risk), credit risk and liquidity risk. Financial risk management is carried out by the Keppel Group Treasury Department in accordance with established policies and guidelines. These policies and guidelines are established by the Group Central Finance Committee and are updated to take into account changes in the operating environment. This committee is chaired by the Chief Financial Officer of the Company and includes Chief Financial Officers of the Group’s key operating companies and Head Office specialists.
Market Risk
(i) Currency risk The Group has receivables and payables denominated in foreign currencies viz US dollars, Renminbi and other currencies. The
Group’s foreign currency exposures arise mainly from the exchange rate movement of these foreign currencies against the functional currencies of the respective Group entities. To hedge against the volatility of future cash flows caused by changes in foreign currency rates, the Group utilises forward foreign currency contracts and other foreign currency hedging instruments to hedge the Group’s exposure to specific currency risks relating to investments, receivables, payables and other commitments. Group Treasury Department monitors the current and projected foreign currency cash flow of the Group and aims to reduce the exposure of the net position in each currency by borrowing in foreign currency and other currency contracts where appropriate.
As at the end of the financial year, the Group has outstanding forward foreign exchange contracts with notional amounts totalling $6,344,009,000 (2016: $7,865,165,000). The net positive fair value of forward foreign exchange contracts is $58,266,000
(2016: net negative fair value of $270,025,000) comprising assets of $105,511,000 (2016: $138,169,000) and liabilities of $47,245,000 (2016: $408,194,000). These amounts are recognised as derivative assets and derivative liabilities.
As at the end of the financial year, the Company has outstanding forward foreign exchange contracts with notional amounts totalling $6,269,592,000 (2016: $7,716,396,000). The net positive fair value of forward foreign exchange contracts is $56,859,000 (2016: net negative fair value of $265,342,000) comprising assets of $104,045,000 (2016: $137,860,000) and liabilities of $47,186,000 (2016: $403,202,000). These amounts are recognised as derivative assets and derivative liabilities.
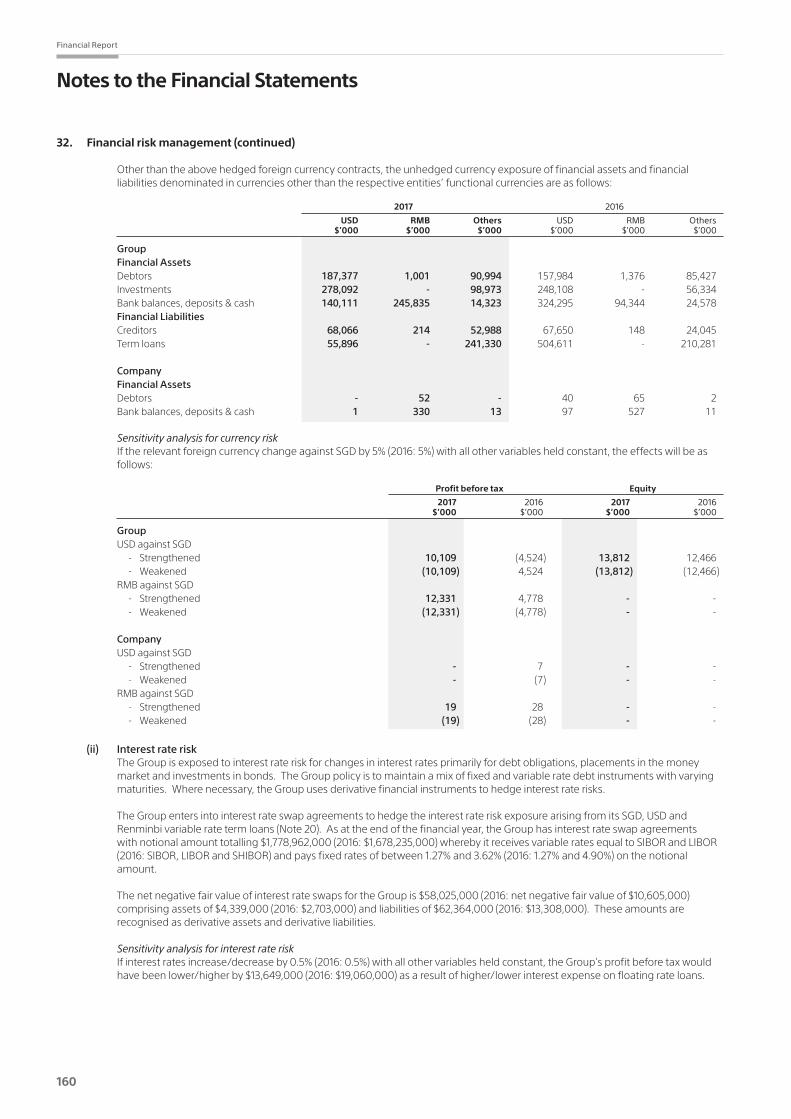
160
Financial Report
Notes to the Financial Statements
32. Financial risk management (continued)
Other than the above hedged foreign currency contracts, the unhedged currency exposure of financial assets and financial liabilities denominated in currencies other than the respective entities’ functional currencies are as follows:
2017 2016
USD RMB Others USD RMB Others $’000 $’000 $’000 $’000 $’000 $’000
Group Financial Assets Debtors 187,377 1,001 90,994 157,984 1,376 85,427 Investments 278,092 - 98,973 248,108 - 56,334 Bank balances, deposits & cash 140,111 245,835 14,323 324,295 94,344 24,578 Financial Liabilities Creditors 68,066 214 52,988 67,650 148 24,045 Term loans 55,896 - 241,330 504,611 - 210,281
Company Financial Assets Debtors - 52 - 40 65 2 Bank balances, deposits & cash 1 330 13 97 527 11
Sensitivity analysis for currency risk IftherelevantforeigncurrencychangeagainstSGDby5%(2016:5%)withallothervariablesheldconstant,theeffectswillbeas
follows:
Profit before tax Equity
2017 2016 2017 2016 $’000 $’000 $’000 $’000
Group USD against SGD - Strengthened 10,109 (4,524) 13,812 12,466 - Weakened (10,109) 4,524 (13,812) (12,466) RMB against SGD - Strengthened 12,331 4,778 - - - Weakened (12,331) (4,778) - -
Company USD against SGD - Strengthened - 7 - - - Weakened - (7) - - RMB against SGD - Strengthened 19 28 - - - Weakened (19) (28) - -
(ii) Interest rate risk The Group is exposed to interest rate risk for changes in interest rates primarily for debt obligations, placements in the money
market and investments in bonds. The Group policy is to maintain a mix of fixed and variable rate debt instruments with varying maturities. Where necessary, the Group uses derivative financial instruments to hedge interest rate risks.
The Group enters into interest rate swap agreements to hedge the interest rate risk exposure arising from its SGD, USD and Renminbi variable rate term loans (Note 20). As at the end of the financial year, the Group has interest rate swap agreements with notional amount totalling $1,778,962,000 (2016: $1,678,235,000) whereby it receives variable rates equal to SIBOR and LIBOR (2016:SIBOR,LIBORandSHIBOR)andpaysfixedratesofbetween1.27%and3.62%(2016:1.27%and4.90%)onthenotionalamount.
The net negative fair value of interest rate swaps for the Group is $58,025,000 (2016: net negative fair value of $10,605,000) comprising assets of $4,339,000 (2016: $2,703,000) and liabilities of $62,364,000 (2016: $13,308,000). These amounts are recognised as derivative assets and derivative liabilities.
Sensitivity analysis for interest rate risk Ifinterestratesincrease/decreaseby0.5%(2016:0.5%)withallothervariablesheldconstant,theGroup’sprofitbeforetaxwould
have been lower/higher by $13,649,000 (2016: $19,060,000) as a result of higher/lower interest expense on floating rate loans.

Keppel Corporation Limited | Report to Shareholders 2017
161
(iii) Price risk The Group hedges against fluctuations arising on the purchase of natural gas that affect cost. Exposure to price fluctuations is
managed via fuel oil forward contracts, whereby the price of natural gas is indexed to benchmark fuel price indices, High Sulphur Fuel Oil (HSFO) 180-CST and Dated Brent. As at the end of the financial year, the Group has outstanding HSFO forward contracts with notional amounts totalling $542,679,000 (2016: $579,270,000). The net positive fair value of HSFO forward contracts for the Group is $89,599,000 (2016: net positive fair value of $57,122,000) comprising assets of $97,957,000 (2016: $83,215,000) and liabilities of $8,358,000 (2016: $26,093,000). These amounts are recognised as derivative assets and derivative liabilities. The Group has no outstanding Dated Brent forward contracts as at 31 December 2016 and 2017.
The Group hedges against fluctuations in electricity prices via its daily sales of electricity. Exposure to price fluctuations is managed via electricity futures contracts. As at the end of the financial year, the Group has outstanding electricity futures contracts with notional amounts totalling $47,042,000 (2016: $6,964,000). The net negative fair values of electricity futures contracts is $2,297,000 (2016: net negative fair value of $124,000) comprising assets of $199,000 (2016: $405,000) and liabilities of $2,496,000 (2016: $529,000). These amount are recognised as derivative assets and derivative liabilities.
The Group is exposed to equity securities price risk arising from equity investments classified as investments held for trading and available-for-sale investments. To manage its price risk arising from investments in equity securities, the Group diversifies its portfolio. Diversification of the portfolio is done in accordance with the limits set by the Group.
Sensitivity analysis for price risk IfpricesforHSFOincrease/decreaseby5%(2016:5%)withallothervariablesheldconstant,theGroup’shedgingreserveinequity
would have been higher/lower by $30,635,000 (2016: $31,820,000) as a result of fair value changes on cash flow hedges.
Ifpricesforelectricityfuturescontractsincrease/decreaseby5%(2016:5%)withallothervariablesheldconstant,theGroup’shedging reserve in equity would have been lower/higher by $2,467,000 (2016: $15,000) as a result of fair value changes on cash flow hedges.
Ifpricesforquotedinvestmentsincrease/decreaseby5%(2016:5%)withallothervariablesheldconstant,theGroup’sprofitbeforetax would have been higher/lower by $8,965,000 (2016: $7,353,000) as a result of higher/lower fair value gains on investments held for trading, and the Group’s fair value reserve in other comprehensive income would have been higher/lower by $3,195,000 (2016: $4,507,000) as a result of higher/lower fair value gains on available-for-sale investments.
The various sensitivity rates used in the sensitivity analysis for currency, interest rate and price risks represent rates generally used internally by management when assessing the various risks.
Credit Risk Credit risk refers to the risk that debtors will default on their obligation to repay the amount owing to the Group. A substantial portion
of the Group’s revenue is on credit terms. The Group adopts stringent procedures on extending credit terms to customers and on the monitoring of credit risk. The credit policy spells out clearly the guidelines on extending credit terms to customers, including monitoring the process and using related industry’s practices as reference. This includes assessment and valuation of customers’ credit reliability and periodic review of their financial status to determine the credit limits to be granted. Customers are also assessed based on their historical payment records. Where necessary, customers may also be requested to provide security or advance payment before services are rendered. The Group’s policy does not permit non-secured credit risk to be significantly centralised in one customer or a group of customers.
The maximum exposure to credit risk is the carrying amount of financial assets which are mainly debtors, amounts due from associated companies and bank balances, deposits and cash.
(i) Financial assets that are neither past due nor impaired Debtors and amounts due from associated companies that are neither past due nor impaired are substantially companies with
good collection track record with the Group. Bank deposits, forward foreign exchange contracts, interest rate caps and interest rate swaps are mainly transacted with banks of high credit ratings assigned by international credit-rating agencies.
(ii) Financial assets that are past due but not impaired/partially impaired The age analysis of trade debtors past due but not impaired/partially impaired is as follows:
Group
2017 2016 $’000 $’000
Past due zero to three months but not impaired 88,280 120,531 Past due three to six months but not impaired 74,420 74,905 Past due over six months and partially impaired 1,180,123 1,262,615
1,342,823 1,458,051
Trade debtors that are individually determined to be impaired at the balance sheet date relate to debtors that are in significant financial difficulties and have defaulted on payments.
Information relating to the provision for doubtful debts is given in Note 15.
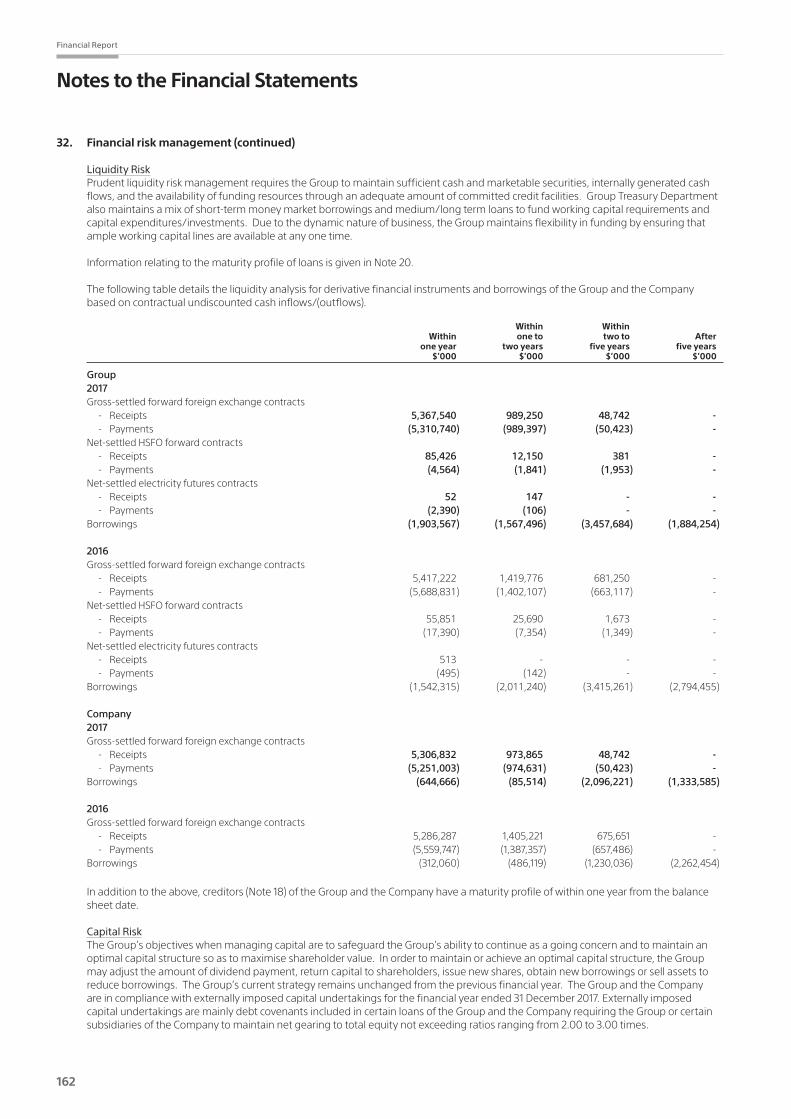
162
Financial Report
Notes to the Financial Statements
32. Financial risk management (continued)
Liquidity Risk Prudent liquidity risk management requires the Group to maintain sufficient cash and marketable securities, internally generated cash
flows, and the availability of funding resources through an adequate amount of committed credit facilities. Group Treasury Department also maintains a mix of short-term money market borrowings and medium/long term loans to fund working capital requirements and capital expenditures/investments. Due to the dynamic nature of business, the Group maintains flexibility in funding by ensuring that ample working capital lines are available at any one time.
Information relating to the maturity profile of loans is given in Note 20.
The following table details the liquidity analysis for derivative financial instruments and borrowings of the Group and the Company based on contractual undiscounted cash inflows/(outflows).
Within Within Within one to two to After one year two years five years five years $’000 $’000 $’000 $’000
Group 2017 Gross-settled forward foreign exchange contracts - Receipts 5,367,540 989,250 48,742 - - Payments (5,310,740) (989,397) (50,423) - Net-settled HSFO forward contracts - Receipts 85,426 12,150 381 - - Payments (4,564) (1,841) (1,953) - Net-settled electricity futures contracts - Receipts 52 147 - - - Payments (2,390) (106) - - Borrowings (1,903,567) (1,567,496) (3,457,684) (1,884,254)
2016 Gross-settled forward foreign exchange contracts - Receipts 5,417,222 1,419,776 681,250 - - Payments (5,688,831) (1,402,107) (663,117) - Net-settled HSFO forward contracts - Receipts 55,851 25,690 1,673 - - Payments (17,390) (7,354) (1,349) - Net-settled electricity futures contracts - Receipts 513 - - - - Payments (495) (142) - - Borrowings (1,542,315) (2,011,240) (3,415,261) (2,794,455)
Company 2017 Gross-settled forward foreign exchange contracts - Receipts 5,306,832 973,865 48,742 - - Payments (5,251,003) (974,631) (50,423) - Borrowings (644,666) (85,514) (2,096,221) (1,333,585)
2016 Gross-settled forward foreign exchange contracts - Receipts 5,286,287 1,405,221 675,651 - - Payments (5,559,747) (1,387,357) (657,486) - Borrowings (312,060) (486,119) (1,230,036) (2,262,454)
In addition to the above, creditors (Note 18) of the Group and the Company have a maturity profile of within one year from the balance sheet date.
Capital Risk The Group’s objectives when managing capital are to safeguard the Group’s ability to continue as a going concern and to maintain an
optimal capital structure so as to maximise shareholder value. In order to maintain or achieve an optimal capital structure, the Group may adjust the amount of dividend payment, return capital to shareholders, issue new shares, obtain new borrowings or sell assets to reduce borrowings. The Group’s current strategy remains unchanged from the previous financial year. The Group and the Company are in compliance with externally imposed capital undertakings for the financial year ended 31 December 2017. Externally imposed capital undertakings are mainly debt covenants included in certain loans of the Group and the Company requiring the Group or certain subsidiaries of the Company to maintain net gearing to total equity not exceeding ratios ranging from 2.00 to 3.00 times.
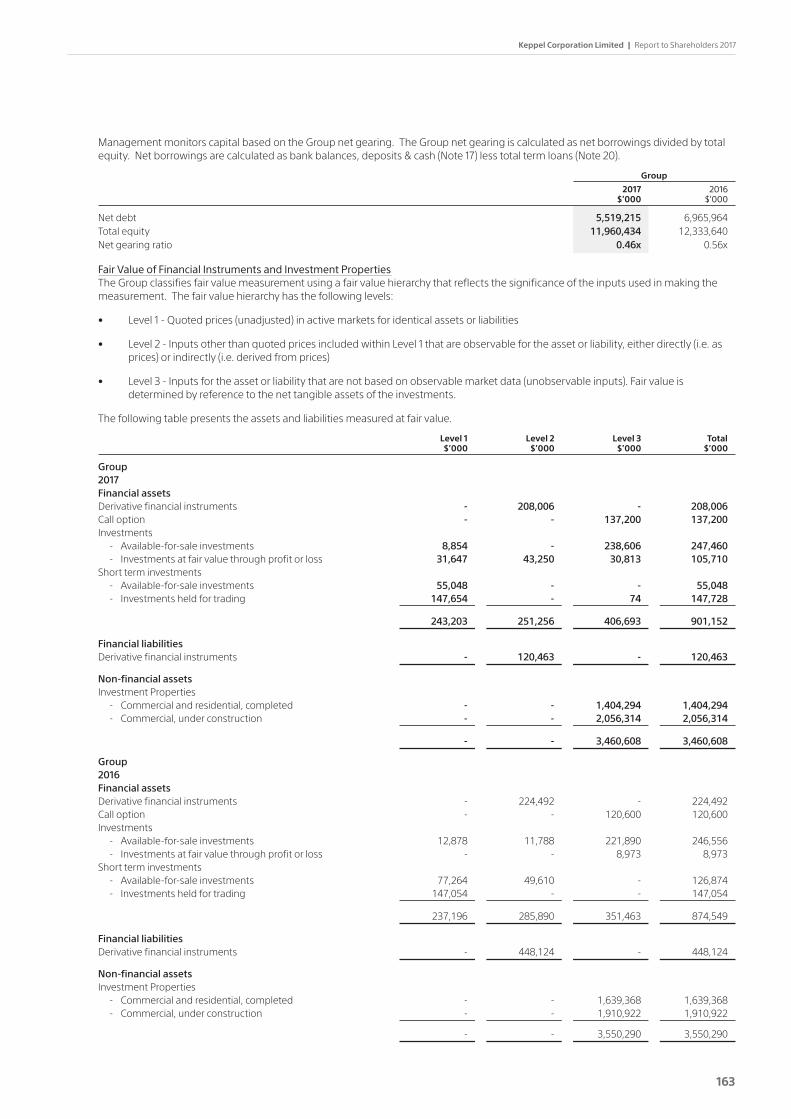
Keppel Corporation Limited | Report to Shareholders 2017
163
Management monitors capital based on the Group net gearing. The Group net gearing is calculated as net borrowings divided by total equity. Net borrowings are calculated as bank balances, deposits & cash (Note 17) less total term loans (Note 20).
Group
2017 2016 $’000 $’000
Net debt 5,519,215 6,965,964 Total equity 11,960,434 12,333,640 Net gearing ratio 0.46x 0.56x
Fair Value of Financial Instruments and Investment Properties The Group classifies fair value measurement using a fair value hierarchy that reflects the significance of the inputs used in making the
measurement. The fair value hierarchy has the following levels:
• Level 1 - Quoted prices (unadjusted) in active markets for identical assets or liabilities
• Level 2 - Inputs other than quoted prices included within Level 1 that are observable for the asset or liability, either directly (i.e. as prices) or indirectly (i.e. derived from prices)
• Level 3 - Inputs for the asset or liability that are not based on observable market data (unobservable inputs). Fair value is determined by reference to the net tangible assets of the investments.
The following table presents the assets and liabilities measured at fair value.
Level 1 Level 2 Level 3 Total $’000 $’000 $’000 $’000
Group 2017 Financial assets Derivative financial instruments - 208,006 - 208,006 Call option - - 137,200 137,200 Investments - Available-for-sale investments 8,854 - 238,606 247,460 - Investments at fair value through profit or loss 31,647 43,250 30,813 105,710 Short term investments - Available-for-sale investments 55,048 - - 55,048 - Investments held for trading 147,654 - 74 147,728
243,203 251,256 406,693 901,152
Financial liabilities Derivative financial instruments - 120,463 - 120,463
Non-financial assets Investment Properties - Commercial and residential, completed - - 1,404,294 1,404,294 - Commercial, under construction - - 2,056,314 2,056,314
- - 3,460,608 3,460,608
Group 2016 Financial assets Derivative financial instruments - 224,492 - 224,492 Call option - - 120,600 120,600 Investments - Available-for-sale investments 12,878 11,788 221,890 246,556 - Investments at fair value through profit or loss - - 8,973 8,973 Short term investments - Available-for-sale investments 77,264 49,610 - 126,874 - Investments held for trading 147,054 - - 147,054
237,196 285,890 351,463 874,549
Financial liabilities Derivative financial instruments - 448,124 - 448,124
Non-financial assets Investment Properties - Commercial and residential, completed - - 1,639,368 1,639,368 - Commercial, under construction - - 1,910,922 1,910,922
- - 3,550,290 3,550,290
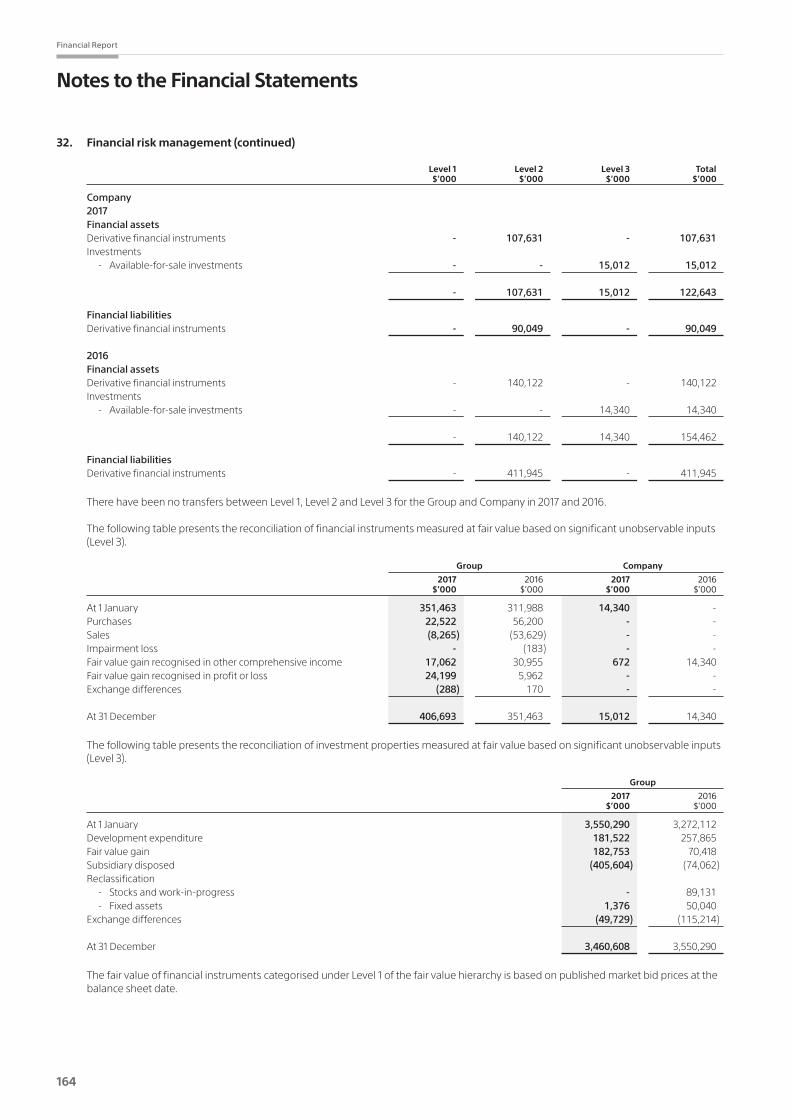
164
Financial Report
Notes to the Financial Statements
32. Financial risk management (continued)
Level 1 Level 2 Level 3 Total $’000 $’000 $’000 $’000
Company 2017 Financial assets Derivative financial instruments - 107,631 - 107,631 Investments - Available-for-sale investments - - 15,012 15,012
- 107,631 15,012 122,643
Financial liabilities Derivative financial instruments - 90,049 - 90,049
2016 Financial assets Derivative financial instruments - 140,122 - 140,122 Investments - Available-for-sale investments - - 14,340 14,340
- 140,122 14,340 154,462
Financial liabilities Derivative financial instruments - 411,945 - 411,945
There have been no transfers between Level 1, Level 2 and Level 3 for the Group and Company in 2017 and 2016.
The following table presents the reconciliation of financial instruments measured at fair value based on significant unobservable inputs (Level 3).
Group Company
2017 2016 2017 2016 $’000 $’000 $’000 $’000
At 1 January 351,463 311,988 14,340 - Purchases 22,522 56,200 - - Sales (8,265) (53,629) - - Impairment loss - (183) - - Fair value gain recognised in other comprehensive income 17,062 30,955 672 14,340 Fair value gain recognised in profit or loss 24,199 5,962 - - Exchange differences (288) 170 - -
At 31 December 406,693 351,463 15,012 14,340
The following table presents the reconciliation of investment properties measured at fair value based on significant unobservable inputs (Level 3).
Group
2017 2016 $’000 $’000
At 1 January 3,550,290 3,272,112 Development expenditure 181,522 257,865 Fair value gain 182,753 70,418 Subsidiary disposed (405,604) (74,062) Reclassification - Stocks and work-in-progress - 89,131 - Fixed assets 1,376 50,040 Exchange differences (49,729) (115,214)
At 31 December 3,460,608 3,550,290
The fair value of financial instruments categorised under Level 1 of the fair value hierarchy is based on published market bid prices at the balance sheet date.

Keppel Corporation Limited | Report to Shareholders 2017
165
The fair value of financial instruments categorised under Level 2 of the fair value hierarchy are fair valued under valuation techniques with market observable inputs. These include forward pricing and swap models utilising present value calculations using inputs such as observable foreign exchange rates (forward and spot rates), interest rate curves and forward rate curves and discount rates that reflects the credit risks of various counterparties. The fair value of investment at fair value through profit or loss categorised under Level 2 of the fair value hierarchy is based on the consideration specified in a sales and purchase agreement.
The following table presents the valuation techniques and key inputs that were used to determine the fair value of financial instruments and investment properties categorised under Level 3 of the fair value hierarchy.
Fair value as at 31 December Range of 2017 Valuation Unobservable Unobservable Description $’000 Techniques Inputs Inputs
Investments 269,493 Net asset value and/or Net asset value* Not applicable discountedcashflow Discountrate 11%
Call option 137,200 Direct comparison method and Transacted price of $2,600 to $3,200 investment method comparable properties (psf) Capitalisationrate 3.5%to3.75%
Investment Properties - Commercialandresidential, 1,404,294 Directcomparisonmethod, Discountrate 11.50%to13.00%
completed investmentmethod,cost Terminalyield 7.00% replacementmethodand/or Capitalisationrate 2.80%to12.50% discounted cash flow method Price of comparable $7,627 to $12,463 land plots (psm) Transacted price of $1,321 to $2,500 comparable properties (psf)
- Commercial, under construction 2,056,314 Direct comparison method, and/or Price of comparable $7,627 to $12,463 residual method land plots (psm) Gross development $588 to $1,866 value ($’million)
Fair value as at 31 December Range of 2016 Valuation Unobservable Unobservable Description $’000 Techniques Inputs Inputs
Investments 230,863 Net asset value and/or Net asset value* Not applicable discountedcashflow Discountrate 11%
Call option 120,600 Direct comparison method and Transacted price of $3,000 to $3,400 investment method comparable properties (psf) Capitalisationrate 3.5%to3.75%
Investment Properties - Commercialandresidential, 1,639,368 Directcomparisonmethod, Discountrate 7.50%to13.70% completed investmentmethod,income Occupancyrate 95% capitalisationmethod, Terminalyield 7.25%to7.70% costreplacementmethod Capitalisationrate 2.80%to12.50% and/or discounted cash flow Price of comparable $9,513 to $13,213 method land plots (psm) Transacted price of $1,296 to $2,100 comparable properties (psf)
- Commercial, under construction 1,910,922 Direct comparison method, Price of comparable $9,513 to $13,213 and/or residual method land plots (psm) Gross development $629 to $1,699 value ($’million)
* Fair value of unquoted equity instruments is determined by reference to the underlying assets value of the investee companies, which comprise mainly investment properties stated at fair value.

166
Financial Report
Notes to the Financial Statements
32. Financial risk management (continued)
The financial instruments and investment properties categorised under Level 3 of the fair value hierarchy are generally sensitive to the various unobservable inputs tabled above. A significant movement of each input would result in significant change to the fair value of the respective asset/liability.
The Group’s finance team assessed the fair value of available-for-sale investments on a quarterly basis.
Valuation process of investment properties is described in Note 7.
33. Segment analysis The Group is organised into business units based on their products and services, and has four reportable operating segments as follows:
(i) Offshore & Marine Principal activities include offshore rig design, construction, repair and upgrading, ship conversions and repair, and specialised
shipbuilding. The Division has operations in Brazil, China, Singapore, United States and other countries.
(ii) Property Principal activities include property development and investment, and property fund management. The Division has operations in
Australia, China, India, Indonesia, Singapore, Vietnam and other countries.
(iii) Infrastructure Principal activities include environmental engineering, power generation, logistics and data centres. The Division has operations in
China, Qatar, Singapore, United Kingdom and other countries.
(iv) Investments The Investments Division consists mainly of the Group’s investments in fund management, KrisEnergy Limited, M1 Limited, k1 Ventures Ltd, Sino-Singapore Tianjin Eco-City Investment and Development Co., Limited and equities.

Keppel Corporation Limited | Report to Shareholders 2017
167
Management monitors the results of each of the above operating segments for the purpose of making decisions about resource allocation and performance assessment. Segment performance is evaluated based on net profit or loss. Information regarding the Group’s reportable segments is presented in the following table:
Offshore & Marine Property Infrastructure Investments Elimination Total $’000 $’000 $’000 $’000 $’000 $’000
2017 Revenue External sales 1,801,347 1,782,343 2,207,162 172,921 - 5,963,773 Inter-segment sales 584 6,217 20,031 62,795 (89,627) - Total 1,801,931 1,788,560 2,227,193 235,716 (89,627) 5,963,773
Segment Results Operating (loss)/profit (176,407) 656,200 122,309 173,477 99 775,678 One-off financial penalty &
related costs (618,722) - - - - (618,722) Investment income 2,112 12,377 - 5,382 - 19,871 Interest income 50,897 40,413 47,801 263,754 (264,937) 137,928 Interest expenses (127,080) (67,053) (16,009) (243,923) 264,838 (189,227) Share of results of associated
companies 6,692 225,562 12,590 145,195 - 390,039 (Loss)/Profit before tax (862,508) 867,499 166,691 343,885 - 515,567 Taxation 4,838 (187,180) (27,800) (88,246) - (298,388) (Loss)/Profit for the year (857,670) 680,319 138,891 255,639 - 217,179
Attributable to: Shareholders of Company (835,433) 684,858 131,730 235,513 - 216,668 Non-controlling interests (22,237) (4,539) 7,161 20,126 - 511 (857,670) 680,319 138,891 255,639 - 217,179
Other information Segment assets 9,542,565 14,949,530 3,417,867 11,096,071 (10,893,244) 28,112,789 Segment liabilities 8,353,177 6,892,999 1,867,633 9,931,790 (10,893,244) 16,152,355 Net assets 1,189,388 8,056,531 1,550,234 1,164,281 - 11,960,434
Investment in associated companies 690,086 2,918,425 1,032,008 1,260,733 - 5,901,252 Additions to non-current assets 183,879 342,337 224,996 173,216 - 924,428 Depreciation and amortisation 129,527 36,869 43,953 2,031 - 212,380 Impairment loss/(write-back of
impairment loss) 109,800 8,499 2,554 (45,808) - 75,045
Geographical information
Other Far East & ASEAN Other Singapore China Brazil countries countries Elimination Total $’000 $’000 $’000 $’000 $’000 $’000 $’000
External sales 3,969,057 807,780 456,727 436,187 294,022 - 5,963,773 Non-current assets 5,925,269 3,367,171 267,965 1,473,070 893,942 - 11,927,417
OtherthanSingaporeandChina,nosinglecountryaccountedfor10%ormoreoftheGroup’srevenueforthefinancialyearended 31 December 2017.
Information about a major customer Nosingleexternalcustomeraccountedfor10%ormoreoftheGroup’srevenueforthefinancialyearended31December2017.
Note: Pricing of inter-segment goods and services is at fair market value.
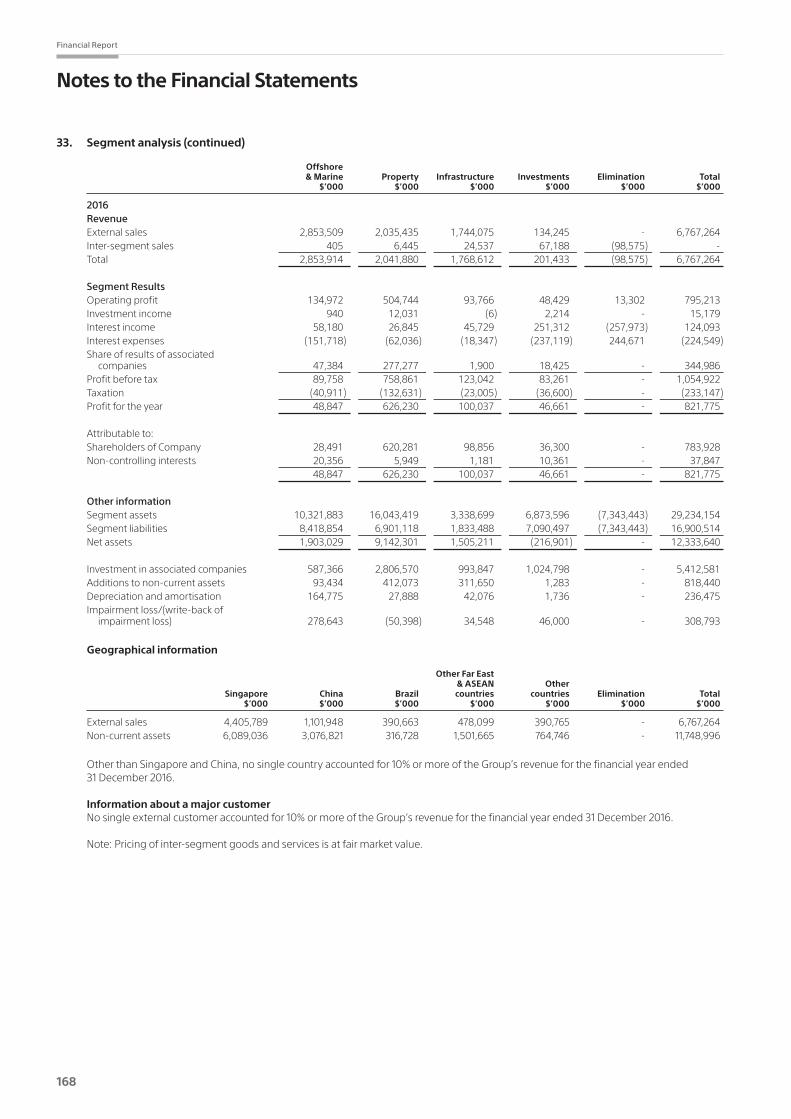
168
Financial Report
Notes to the Financial Statements
33. Segment analysis (continued)
Offshore & Marine Property Infrastructure Investments Elimination Total $’000 $’000 $’000 $’000 $’000 $’000
2016 Revenue External sales 2,853,509 2,035,435 1,744,075 134,245 - 6,767,264 Inter-segment sales 405 6,445 24,537 67,188 (98,575) - Total 2,853,914 2,041,880 1,768,612 201,433 (98,575) 6,767,264
Segment Results Operating profit 134,972 504,744 93,766 48,429 13,302 795,213 Investment income 940 12,031 (6) 2,214 - 15,179 Interest income 58,180 26,845 45,729 251,312 (257,973) 124,093 Interest expenses (151,718) (62,036) (18,347) (237,119) 244,671 (224,549) Share of results of associated
companies 47,384 277,277 1,900 18,425 - 344,986 Profit before tax 89,758 758,861 123,042 83,261 - 1,054,922 Taxation (40,911) (132,631) (23,005) (36,600) - (233,147) Profit for the year 48,847 626,230 100,037 46,661 - 821,775
Attributable to: Shareholders of Company 28,491 620,281 98,856 36,300 - 783,928 Non-controlling interests 20,356 5,949 1,181 10,361 - 37,847 48,847 626,230 100,037 46,661 - 821,775
Other information Segment assets 10,321,883 16,043,419 3,338,699 6,873,596 (7,343,443) 29,234,154 Segment liabilities 8,418,854 6,901,118 1,833,488 7,090,497 (7,343,443) 16,900,514 Net assets 1,903,029 9,142,301 1,505,211 (216,901) - 12,333,640
Investment in associated companies 587,366 2,806,570 993,847 1,024,798 - 5,412,581 Additions to non-current assets 93,434 412,073 311,650 1,283 - 818,440 Depreciation and amortisation 164,775 27,888 42,076 1,736 - 236,475 Impairment loss/(write-back of
impairment loss) 278,643 (50,398) 34,548 46,000 - 308,793
Geographical information
Other Far East & ASEAN Other Singapore China Brazil countries countries Elimination Total $’000 $’000 $’000 $’000 $’000 $’000 $’000
External sales 4,405,789 1,101,948 390,663 478,099 390,765 - 6,767,264 Non-current assets 6,089,036 3,076,821 316,728 1,501,665 764,746 - 11,748,996
OtherthanSingaporeandChina,nosinglecountryaccountedfor10%ormoreoftheGroup’srevenueforthefinancialyearended 31 December 2016.
Information about a major customer Nosingleexternalcustomeraccountedfor10%ormoreoftheGroup’srevenueforthefinancialyearended31December2016.
Note: Pricing of inter-segment goods and services is at fair market value.
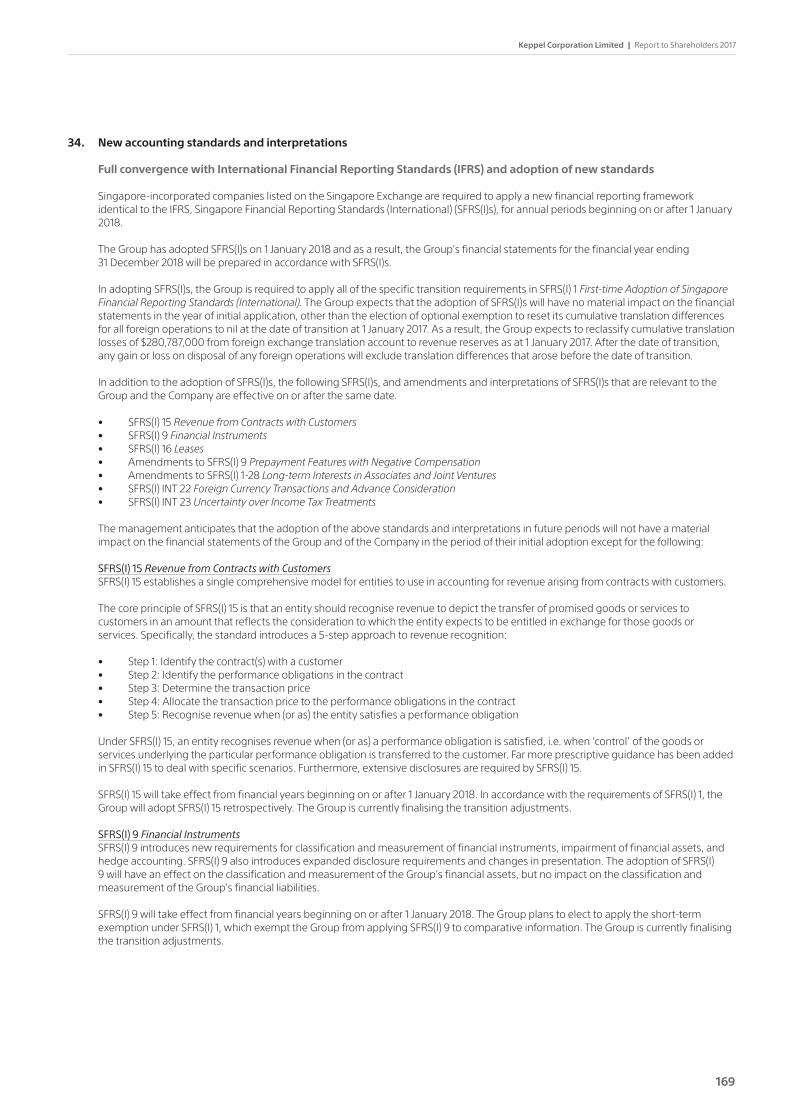
Keppel Corporation Limited | Report to Shareholders 2017
169
34. New accounting standards and interpretations
Full convergence with International Financial Reporting Standards (IFRS) and adoption of new standards
Singapore-incorporated companies listed on the Singapore Exchange are required to apply a new financial reporting framework identical to the IFRS, Singapore Financial Reporting Standards (International) (SFRS(I)s), for annual periods beginning on or after 1 January 2018.
The Group has adopted SFRS(I)s on 1 January 2018 and as a result, the Group’s financial statements for the financial year ending 31 December 2018 will be prepared in accordance with SFRS(I)s.
In adopting SFRS(I)s, the Group is required to apply all of the specific transition requirements in SFRS(I) 1 First-time Adoption of Singapore Financial Reporting Standards (International). The Group expects that the adoption of SFRS(I)s will have no material impact on the financial statements in the year of initial application, other than the election of optional exemption to reset its cumulative translation differences for all foreign operations to nil at the date of transition at 1 January 2017. As a result, the Group expects to reclassify cumulative translation losses of $280,787,000 from foreign exchange translation account to revenue reserves as at 1 January 2017. After the date of transition, any gain or loss on disposal of any foreign operations will exclude translation differences that arose before the date of transition.
In addition to the adoption of SFRS(I)s, the following SFRS(I)s, and amendments and interpretations of SFRS(I)s that are relevant to the Group and the Company are effective on or after the same date.
• SFRS(I) 15 Revenue from Contracts with Customers• SFRS(I) 9 Financial Instruments • SFRS(I) 16 Leases• Amendments to SFRS(I) 9 Prepayment Features with Negative Compensation• Amendments to SFRS(I) 1-28 Long-term Interests in Associates and Joint Ventures• SFRS(I) INT 22 Foreign Currency Transactions and Advance Consideration• SFRS(I) INT 23 Uncertainty over Income Tax Treatments
The management anticipates that the adoption of the above standards and interpretations in future periods will not have a material impact on the financial statements of the Group and of the Company in the period of their initial adoption except for the following:
SFRS(I) 15 Revenue from Contracts with Customers SFRS(I) 15 establishes a single comprehensive model for entities to use in accounting for revenue arising from contracts with customers.
The core principle of SFRS(I) 15 is that an entity should recognise revenue to depict the transfer of promised goods or services to customers in an amount that reflects the consideration to which the entity expects to be entitled in exchange for those goods or services. Specifically, the standard introduces a 5-step approach to revenue recognition:
• Step 1: Identify the contract(s) with a customer• Step 2: Identify the performance obligations in the contract• Step 3: Determine the transaction price• Step 4: Allocate the transaction price to the performance obligations in the contract• Step 5: Recognise revenue when (or as) the entity satisfies a performance obligation
Under SFRS(I) 15, an entity recognises revenue when (or as) a performance obligation is satisfied, i.e. when ‘control’ of the goods or services underlying the particular performance obligation is transferred to the customer. Far more prescriptive guidance has been added in SFRS(I) 15 to deal with specific scenarios. Furthermore, extensive disclosures are required by SFRS(I) 15.
SFRS(I) 15 will take effect from financial years beginning on or after 1 January 2018. In accordance with the requirements of SFRS(I) 1, the Group will adopt SFRS(I) 15 retrospectively. The Group is currently finalising the transition adjustments.
SFRS(I) 9 Financial Instruments SFRS(I) 9 introduces new requirements for classification and measurement of financial instruments, impairment of financial assets, and
hedge accounting. SFRS(I) 9 also introduces expanded disclosure requirements and changes in presentation. The adoption of SFRS(I) 9 will have an effect on the classification and measurement of the Group’s financial assets, but no impact on the classification and measurement of the Group’s financial liabilities.
SFRS(I) 9 will take effect from financial years beginning on or after 1 January 2018. The Group plans to elect to apply the short-term exemption under SFRS(I) 1, which exempt the Group from applying SFRS(I) 9 to comparative information. The Group is currently finalising the transition adjustments.
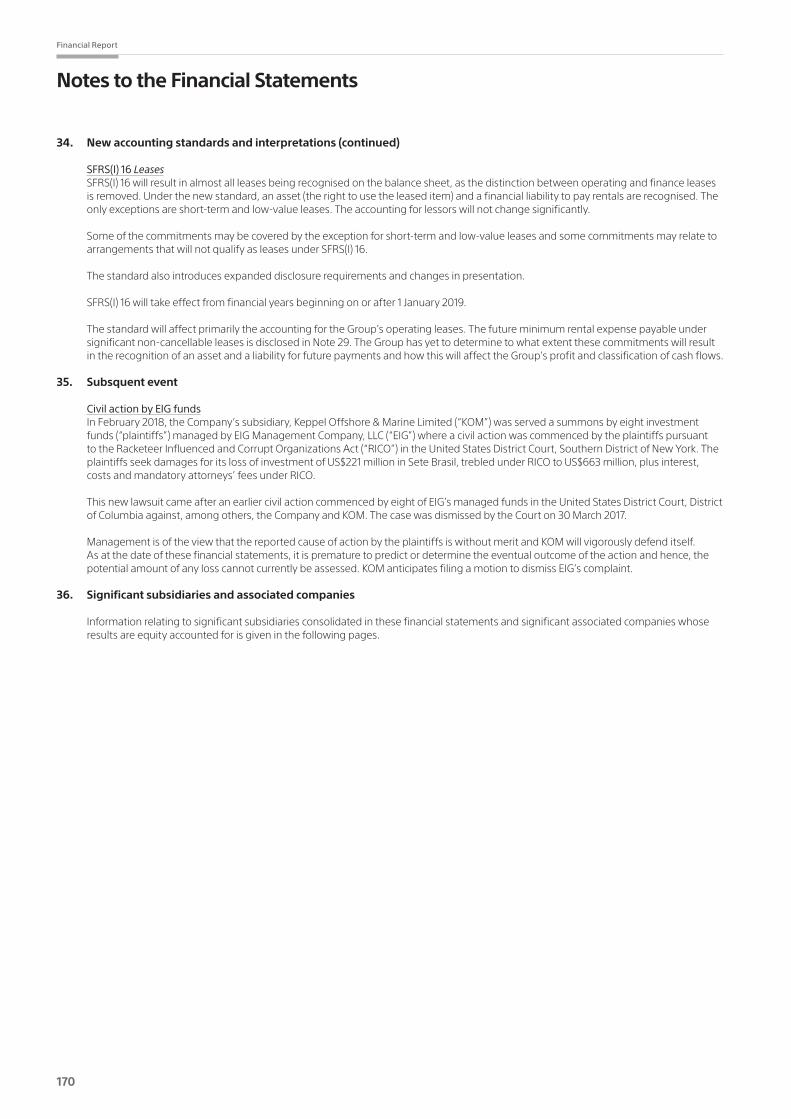
170
Financial Report
Notes to the Financial Statements
34. New accounting standards and interpretations (continued)
SFRS(I) 16 Leases SFRS(I) 16 will result in almost all leases being recognised on the balance sheet, as the distinction between operating and finance leases
is removed. Under the new standard, an asset (the right to use the leased item) and a financial liability to pay rentals are recognised. The only exceptions are short-term and low-value leases. The accounting for lessors will not change significantly.
Some of the commitments may be covered by the exception for short-term and low-value leases and some commitments may relate to arrangements that will not qualify as leases under SFRS(I) 16.
The standard also introduces expanded disclosure requirements and changes in presentation. SFRS(I) 16 will take effect from financial years beginning on or after 1 January 2019.
The standard will affect primarily the accounting for the Group’s operating leases. The future minimum rental expense payable under significant non-cancellable leases is disclosed in Note 29. The Group has yet to determine to what extent these commitments will result in the recognition of an asset and a liability for future payments and how this will affect the Group’s profit and classification of cash flows.
35. Subsquent event
Civil action by EIG funds In February 2018, the Company’s subsidiary, Keppel Offshore & Marine Limited (“KOM”) was served a summons by eight investment
funds (“plaintiffs”) managed by EIG Management Company, LLC (“EIG”) where a civil action was commenced by the plaintiffs pursuant to the Racketeer Influenced and Corrupt Organizations Act (“RICO”) in the United States District Court, Southern District of New York. The plaintiffs seek damages for its loss of investment of US$221 million in Sete Brasil, trebled under RICO to US$663 million, plus interest, costs and mandatory attorneys’ fees under RICO.
This new lawsuit came after an earlier civil action commenced by eight of EIG’s managed funds in the United States District Court, District of Columbia against, among others, the Company and KOM. The case was dismissed by the Court on 30 March 2017.
Management is of the view that the reported cause of action by the plaintiffs is without merit and KOM will vigorously defend itself. As at the date of these financial statements, it is premature to predict or determine the eventual outcome of the action and hence, the potential amount of any loss cannot currently be assessed. KOM anticipates filing a motion to dismiss EIG’s complaint.
36. Significant subsidiaries and associated companies
Information relating to significant subsidiaries consolidated in these financial statements and significant associated companies whose results are equity accounted for is given in the following pages.

Keppel Corporation Limited | Report to Shareholders 2017
171
Significant Subsidiaries and Associated Companies
Country of Gross Effective Equity Incorporation Interest Interest Cost of Investment /Operation Principal Activities
2017 2017 2016 2017 2016 % % % $’000 $’000
OFFSHORE & MARINEOffshoreSubsidiaries
Keppel Offshore & Marine Ltd 100 100 100 801,720 801,720 Singapore Investment holding
Keppel FELS Ltd 100 100 100 # # Singapore Construction, fabrication and repair of offshore production facilities and drilling rigs, power barges, specialised vessels and other offshore production facilities
Angra Propriedades & 100 100 100 # # Brazil Holding of long-term investments and Administracao Ltd (1a) property management
Deepwater Technology Group 100 100 100 # # Singapore Research and experimental Pte Ltd development on deepwater engineering
Estaleiro BrasFELS Ltda (1a) 100 100 100 # # Brazil Engineering, construction and fabrication of platforms for the oil and gas sector, shipyard works and other general business activities
FELS Offshore Pte Ltd 100 100 100 # # Singapore Holding of long-term investments
Fernvale Pte Ltd 100 100 100 # # Singapore Construction, fabrication and repair of drilling rigs and offshore production facilities
FSTP Brasil Ltda (1a) 75 75 75 # # Brazil Procurement of equipment and materials for the construction of offshore production facilities
FSTP Pte Ltd 75 75 75 # # Singapore Project management, engineering and procurement
Greenwood Pte Ltd 100 100 100 # # Singapore Holding of long-term investments
Guanabara Navegacao Ltda (1a) 100 100 100 # # Brazil Ship owning
Keppel AmFELS, LLC 100 100 100 # # USA Construction and repair of offshore drilling rigs and offshore production facilities
Keppel FELS Baltech Ltd (1a) 100 100 100 # # Bulgaria Marine and offshore engineering services
Keppel FELS Brasil SA (1a) 100 100 100 # # Brazil Engineering, construction and fabrication of platforms for the oil and gas industry
Keppel Letourneau USA, Inc 100 100 100 # # USA Design and license of various offshore rigs and platforms
Keppel Offshore & Marine 100 100 100 # # India Marine and offshore engineering Engineering Services Mumbai services Pte Ltd (1a)
Keppel Offshore & Marine 100 100 100 # # Singapore Research & development on marine Technology Centre Pte Ltd and offshore engineering
Keppel Offshore & Marine USA Inc 100 100 100 # # USA Offshore and marine-related services
Keppel Sea Scan Pte Ltd 100 100 100 # # Singapore Trading and installation of hardware, industrial, marine and building related products, leasing and provision of services
Keppel Verolme BV (3) - - 100 # # Netherlands Disposed
KV Enterprises BV (3) 100 100 100 # # Netherlands Holding of long-term investments
KVE Adminstradora de Bens 100 100 100 # # Brazil Holding of long-term investments and Imoveis Ltda (1a) property management
Lindel Pte Ltd 100 100 100 # # Singapore Project management, engineering and procurement
Offshore Technology 100 100 100 # # Singapore Production of jacking systems Development Pte Ltd

172
Financial Report
Significant Subsidiaries and Associated Companies
Country of Gross Effective Equity Incorporation Interest Interest Cost of Investment /Operation Principal Activities
2017 2017 2016 2017 2016 % % % $’000 $’000
Regency Steel Japan Ltd (1a) 51 51 51 # # Japan Sourcing, fabricating and supply of specialised steel components
Willalpha Limited (3) 100 100 100 # # BVI Holding of long-term investments
Associated Companies
Asian Lift Pte Ltd 50 50 50 # # Singapore Provision of heavy-lift equipment and related services
Atwin Offshore & Marine Pte Ltd (2) 30 30 30 # # Singapore Investment holding company
FloaTEC Singapore Pte Ltd (2) 50 50 50 # # Singapore Manufacturing and repair of oil rigs
Floatel International Ltd (1a) 50 50 50 # # Bermuda Operating accommodation and construction support vessels (floatels) for the offshore oil and gas industry
Marine Housing Services Pte Ltd 50 50 50 # # Singapore Provision of housing services for marine workers
Seafox 5 Ltd (2) 49 49 49 # # Isle of Man Owning and leasing of multi-purpose self-elevating platforms
Marine
Subsidiaries
Keppel Shipyard Ltd 100 100 100 # # Singapore Ship repairing, shipbuilding and conversions
Keppel Philippines Marine Inc (1a) 98 98 98 # # Philippines Shipbuilding and repairing
Alpine Engineering Services 100 100 100 # # Singapore Marine contracting Pte Ltd
Blastech Abrasives Pte Ltd 100 100 100 # # Singapore Painting, blasting, shot blasting, process and sale of slag
Keppel Nantong Heavy Industry 100 100 100 # # China Engineering and construction of Co Ltd (1a) specialised vessels
Keppel Nantong Shipyard 100 100 100 # # China Engineering and construction of Company Ltd (1a) specialised vessels
Keppel Singmarine Pte Ltd 100 100 100 # # Singapore Shipbuilding and repairing
Keppel Subic Shipyard Inc (1a) 87 + 86 + 86 + 3,020 3,020 Philippines Shipbuilding and repairing
KS Investments Pte Ltd 100 100 100 # # Singapore Holding of long-term investments
KSI Production Pte Ltd (3) 100 100 100 # # BVI Holding of long-term investments
Marine Technology Development 100 100 100 # # Singapore Provision of technical consultancy for Pte Ltd ship design and engineering works
Associated Companies
Arab Heavy Industries PJSC (2) 33 33 33 # # UAE Shipbuilding and repairing
Dyna-Mac Holdings Ltd 24 24 24 # # Singapore Investment holding
Keppel Smit Towage Pte Ltd (r) 51 51 51 # # Singapore Provision of towage services
Maju Maritime Pte Ltd (r) 51 51 51 # # Singapore Provision of towage services
Nakilat - Keppel Offshore & 20 20 20 # # Qatar Ship repairing Marine Ltd (2)
PV Keez Pte Ltd (2) 20 20 20 # # Singapore Chartering of ships, barges and boats with crew
PROPERTY
Subsidiaries
Keppel Land Ltd 100 100 100 4,793,367 4,716,367 Singapore Holding, management and investment company
Keppel Land China Ltd 100 100 100 # # Singapore Investment holding
Keppel Bay Pte Ltd 100 100 100 # # Singapore Property development
Keppel Philippines Properties Inc (1a) 87 + 87 + 80 + 493 493 Philippines Investment holding
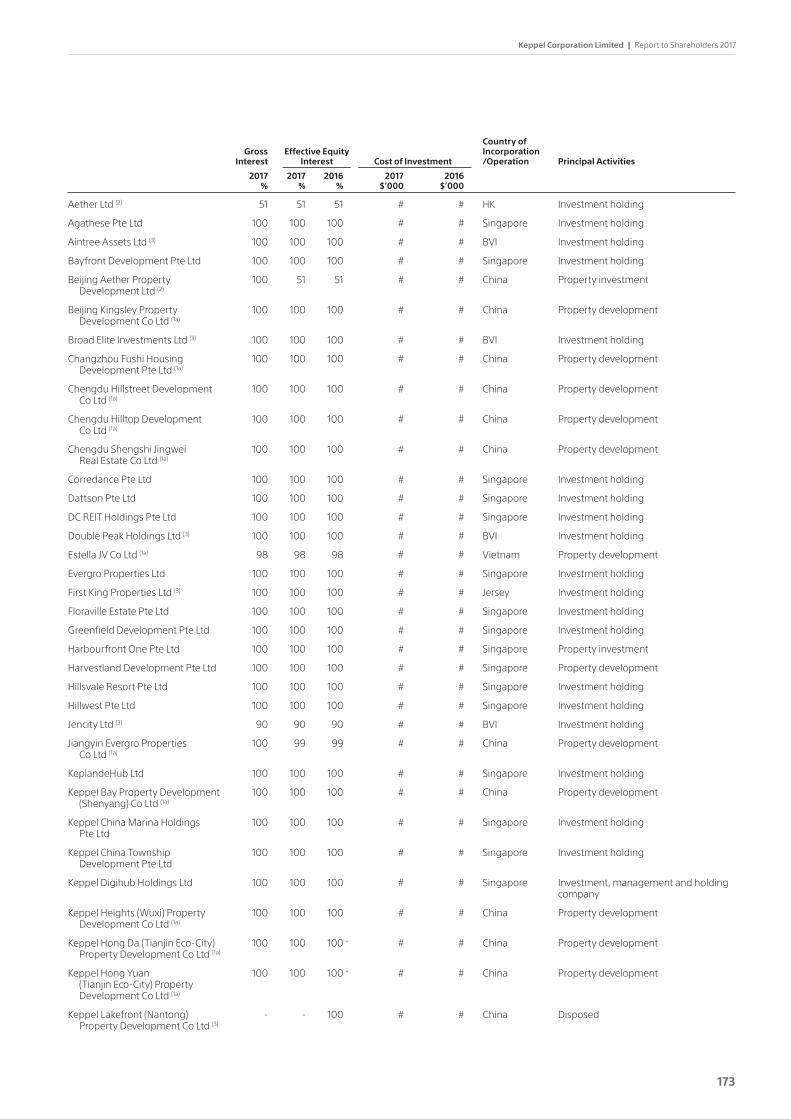
Keppel Corporation Limited | Report to Shareholders 2017
173
Country of Gross Effective Equity Incorporation Interest Interest Cost of Investment /Operation Principal Activities
2017 2017 2016 2017 2016 % % % $’000 $’000
Aether Ltd (2) 51 51 51 # # HK Investment holding
Agathese Pte Ltd 100 100 100 # # Singapore Investment holding
Aintree Assets Ltd (3) 100 100 100 # # BVI Investment holding
Bayfront Development Pte Ltd 100 100 100 # # Singapore Investment holding
Beijing Aether Property 100 51 51 # # China Property investment Development Ltd (2)
Beijing Kingsley Property 100 100 100 # # China Property development Development Co Ltd (1a)
Broad Elite Investments Ltd (3) 100 100 100 # # BVI Investment holding
Changzhou Fushi Housing 100 100 100 # # China Property development Development Pte Ltd (1a)
Chengdu Hillstreet Development 100 100 100 # # China Property development Co Ltd (1a)
Chengdu Hilltop Development 100 100 100 # # China Property development Co Ltd (1a)
Chengdu Shengshi Jingwei 100 100 100 # # China Property development Real Estate Co Ltd (1a)
Corredance Pte Ltd 100 100 100 # # Singapore Investment holding
Dattson Pte Ltd 100 100 100 # # Singapore Investment holding
DC REIT Holdings Pte Ltd 100 100 100 # # Singapore Investment holding
Double Peak Holdings Ltd (3) 100 100 100 # # BVI Investment holding
Estella JV Co Ltd (1a) 98 98 98 # # Vietnam Property development
Evergro Properties Ltd 100 100 100 # # Singapore Investment holding
First King Properties Ltd (3) 100 100 100 # # Jersey Investment holding
Floraville Estate Pte Ltd 100 100 100 # # Singapore Investment holding
Greenfield Development Pte Ltd 100 100 100 # # Singapore Investment holding
Harbourfront One Pte Ltd 100 100 100 # # Singapore Property investment
Harvestland Development Pte Ltd 100 100 100 # # Singapore Property development
Hillsvale Resort Pte Ltd 100 100 100 # # Singapore Investment holding
Hillwest Pte Ltd 100 100 100 # # Singapore Investment holding
Jencity Ltd (3) 90 90 90 # # BVI Investment holding
Jiangyin Evergro Properties 100 99 99 # # China Property development Co Ltd (1a)
KeplandeHub Ltd 100 100 100 # # Singapore Investment holding
Keppel Bay Property Development 100 100 100 # # China Property development (Shenyang) Co Ltd (1a)
Keppel China Marina Holdings 100 100 100 # # Singapore Investment holding Pte Ltd
Keppel China Township 100 100 100 # # Singapore Investment holding Development Pte Ltd
Keppel Digihub Holdings Ltd 100 100 100 # # Singapore Investment, management and holding company
Keppel Heights (Wuxi) Property 100 100 100 # # China Property development Development Co Ltd (1a)
Keppel Hong Da (Tianjin Eco-City) 100 100 100 + # # China Property development Property Development Co Ltd (1a)
Keppel Hong Yuan 100 100 100 + # # China Property development (Tianjin Eco-City) Property Development Co Ltd (1a)
Keppel Lakefront (Nantong) - - 100 # # China Disposed Property Development Co Ltd (3)
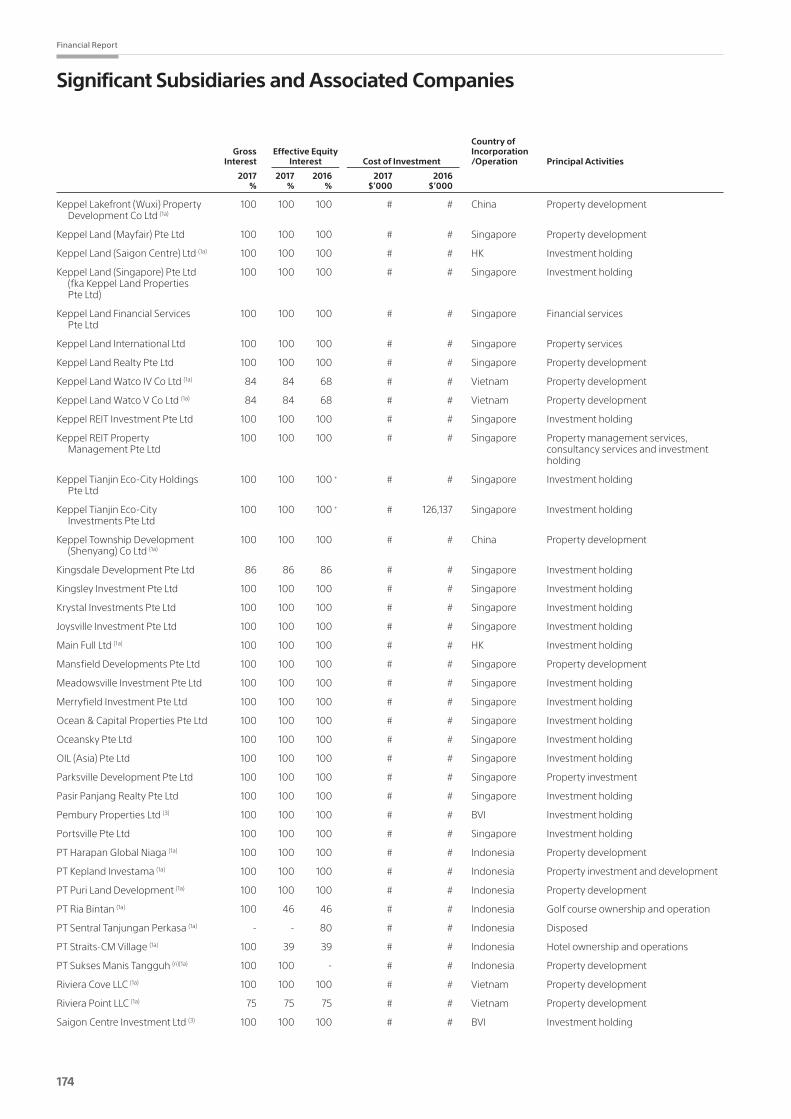
174
Financial Report
Significant Subsidiaries and Associated Companies
Country of Gross Effective Equity Incorporation Interest Interest Cost of Investment /Operation Principal Activities
2017 2017 2016 2017 2016 % % % $’000 $’000
Keppel Lakefront (Wuxi) Property 100 100 100 # # China Property development Development Co Ltd (1a)
Keppel Land (Mayfair) Pte Ltd 100 100 100 # # Singapore Property development
Keppel Land (Saigon Centre) Ltd (1a) 100 100 100 # # HK Investment holding
Keppel Land (Singapore) Pte Ltd 100 100 100 # # Singapore Investment holding (fka Keppel Land Properties Pte Ltd)
Keppel Land Financial Services 100 100 100 # # Singapore Financial services Pte Ltd
Keppel Land International Ltd 100 100 100 # # Singapore Property services
Keppel Land Realty Pte Ltd 100 100 100 # # Singapore Property development
Keppel Land Watco IV Co Ltd (1a) 84 84 68 # # Vietnam Property development
Keppel Land Watco V Co Ltd (1a) 84 84 68 # # Vietnam Property development
Keppel REIT Investment Pte Ltd 100 100 100 # # Singapore Investment holding
Keppel REIT Property 100 100 100 # # Singapore Property management services, Management Pte Ltd consultancy services and investment holding
Keppel Tianjin Eco-City Holdings 100 100 100 + # # Singapore Investment holding Pte Ltd
Keppel Tianjin Eco-City 100 100 100 + # 126,137 Singapore Investment holding Investments Pte Ltd
Keppel Township Development 100 100 100 # # China Property development (Shenyang) Co Ltd (1a)
Kingsdale Development Pte Ltd 86 86 86 # # Singapore Investment holding
Kingsley Investment Pte Ltd 100 100 100 # # Singapore Investment holding
Krystal Investments Pte Ltd 100 100 100 # # Singapore Investment holding
Joysville Investment Pte Ltd 100 100 100 # # Singapore Investment holding
Main Full Ltd (1a) 100 100 100 # # HK Investment holding
Mansfield Developments Pte Ltd 100 100 100 # # Singapore Property development
Meadowsville Investment Pte Ltd 100 100 100 # # Singapore Investment holding
Merryfield Investment Pte Ltd 100 100 100 # # Singapore Investment holding
Ocean & Capital Properties Pte Ltd 100 100 100 # # Singapore Investment holding
Oceansky Pte Ltd 100 100 100 # # Singapore Investment holding
OIL (Asia) Pte Ltd 100 100 100 # # Singapore Investment holding
Parksville Development Pte Ltd 100 100 100 # # Singapore Property investment
Pasir Panjang Realty Pte Ltd 100 100 100 # # Singapore Investment holding
Pembury Properties Ltd (3) 100 100 100 # # BVI Investment holding
Portsville Pte Ltd 100 100 100 # # Singapore Investment holding
PT Harapan Global Niaga (1a) 100 100 100 # # Indonesia Property development
PT Kepland Investama (1a) 100 100 100 # # Indonesia Property investment and development
PT Puri Land Development (1a) 100 100 100 # # Indonesia Property development
PT Ria Bintan (1a) 100 46 46 # # Indonesia Golf course ownership and operation
PT Sentral Tanjungan Perkasa (1a) - - 80 # # Indonesia Disposed
PT Straits-CM Village (1a) 100 39 39 # # Indonesia Hotel ownership and operations
PT Sukses Manis Tangguh (n)(1a) 100 100 - # # Indonesia Property development
Riviera Cove LLC (1a) 100 100 100 # # Vietnam Property development
Riviera Point LLC (1a) 75 75 75 # # Vietnam Property development
Saigon Centre Investment Ltd (3) 100 100 100 # # BVI Investment holding
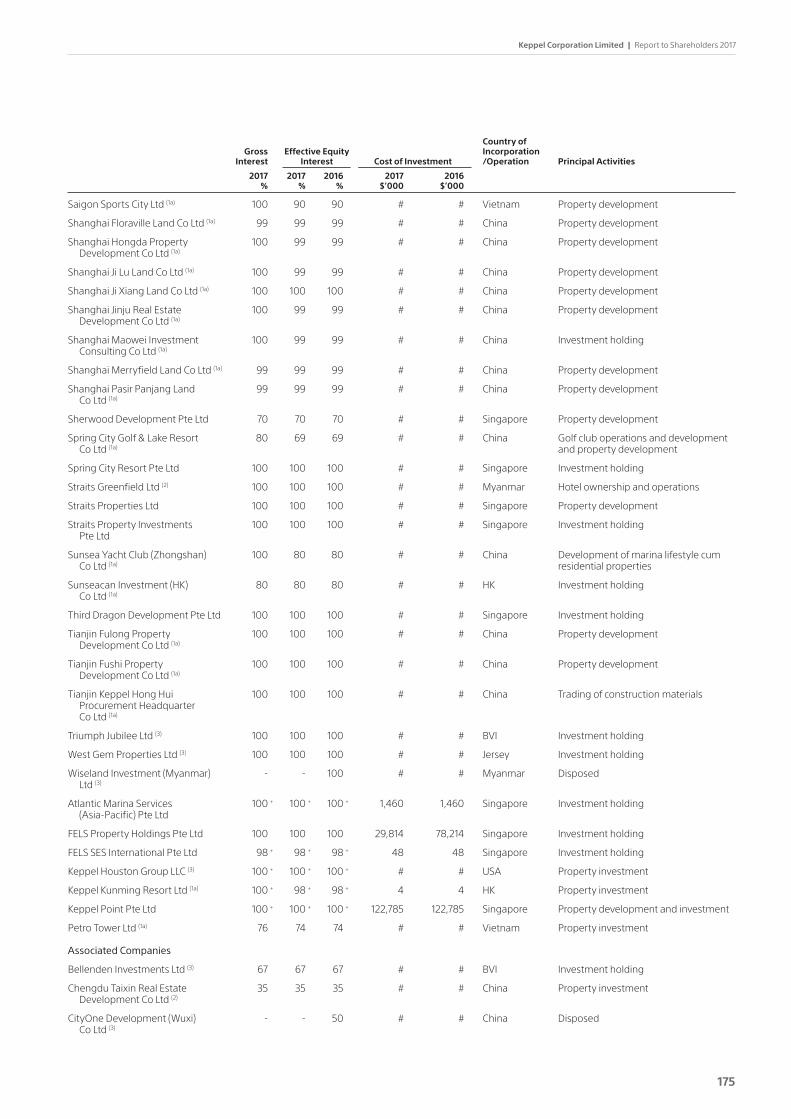
Keppel Corporation Limited | Report to Shareholders 2017
175
Country of Gross Effective Equity Incorporation Interest Interest Cost of Investment /Operation Principal Activities
2017 2017 2016 2017 2016 % % % $’000 $’000
Saigon Sports City Ltd (1a) 100 90 90 # # Vietnam Property development
Shanghai Floraville Land Co Ltd (1a) 99 99 99 # # China Property development
Shanghai Hongda Property 100 99 99 # # China Property development Development Co Ltd (1a)
Shanghai Ji Lu Land Co Ltd (1a) 100 99 99 # # China Property development
Shanghai Ji Xiang Land Co Ltd (1a) 100 100 100 # # China Property development
Shanghai Jinju Real Estate 100 99 99 # # China Property development Development Co Ltd (1a)
Shanghai Maowei Investment 100 99 99 # # China Investment holding Consulting Co Ltd (1a)
Shanghai Merryfield Land Co Ltd (1a) 99 99 99 # # China Property development
Shanghai Pasir Panjang Land 99 99 99 # # China Property development Co Ltd (1a)
Sherwood Development Pte Ltd 70 70 70 # # Singapore Property development
Spring City Golf & Lake Resort 80 69 69 # # China Golf club operations and development Co Ltd (1a) and property development
Spring City Resort Pte Ltd 100 100 100 # # Singapore Investment holding
Straits Greenfield Ltd (2) 100 100 100 # # Myanmar Hotel ownership and operations
Straits Properties Ltd 100 100 100 # # Singapore Property development
Straits Property Investments 100 100 100 # # Singapore Investment holding Pte Ltd
Sunsea Yacht Club (Zhongshan) 100 80 80 # # China Development of marina lifestyle cum Co Ltd (1a) residential properties
Sunseacan Investment (HK) 80 80 80 # # HK Investment holding Co Ltd (1a)
Third Dragon Development Pte Ltd 100 100 100 # # Singapore Investment holding
Tianjin Fulong Property 100 100 100 # # China Property development Development Co Ltd (1a)
Tianjin Fushi Property 100 100 100 # # China Property development Development Co Ltd (1a)
Tianjin Keppel Hong Hui 100 100 100 # # China Trading of construction materials Procurement Headquarter Co Ltd (1a)
Triumph Jubilee Ltd (3) 100 100 100 # # BVI Investment holding
West Gem Properties Ltd (3) 100 100 100 # # Jersey Investment holding
Wiseland Investment (Myanmar) - - 100 # # Myanmar Disposed Ltd (3)
Atlantic Marina Services 100 + 100 + 100 + 1,460 1,460 Singapore Investment holding (Asia-Pacific) Pte Ltd
FELS Property Holdings Pte Ltd 100 100 100 29,814 78,214 Singapore Investment holding
FELS SES International Pte Ltd 98 + 98 + 98 + 48 48 Singapore Investment holding
Keppel Houston Group LLC (3) 100 + 100 + 100 + # # USA Property investment
Keppel Kunming Resort Ltd (1a) 100 + 98 + 98 + 4 4 HK Property investment
Keppel Point Pte Ltd 100 + 100 + 100 + 122,785 122,785 Singapore Property development and investment
Petro Tower Ltd (1a) 76 74 74 # # Vietnam Property investment
Associated Companies
Bellenden Investments Ltd (3) 67 67 67 # # BVI Investment holding
Chengdu Taixin Real Estate 35 35 35 # # China Property investment Development Co Ltd (2)
CityOne Development (Wuxi) - - 50 # # China Disposed Co Ltd (3)
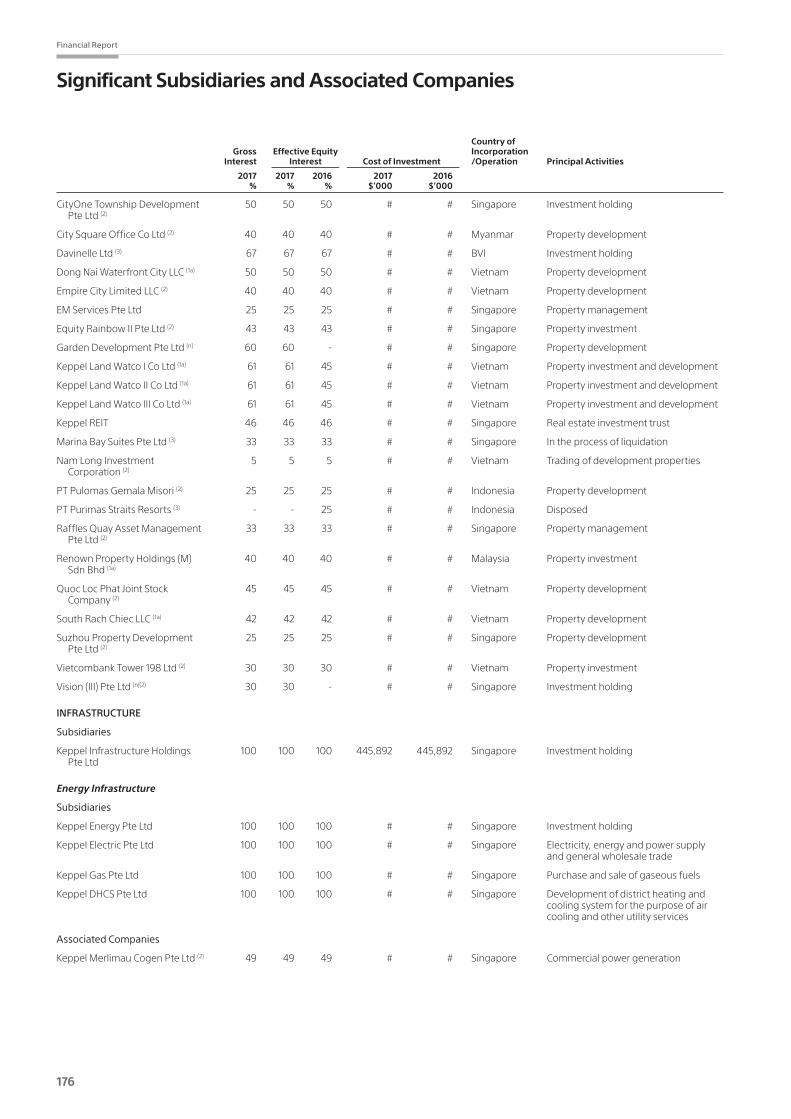
176
Financial Report
Significant Subsidiaries and Associated Companies
Country of Gross Effective Equity Incorporation Interest Interest Cost of Investment /Operation Principal Activities
2017 2017 2016 2017 2016 % % % $’000 $’000
CityOne Township Development 50 50 50 # # Singapore Investment holding Pte Ltd (2)
City Square Office Co Ltd (2) 40 40 40 # # Myanmar Property development
Davinelle Ltd (3) 67 67 67 # # BVI Investment holding
Dong Nai Waterfront City LLC (1a) 50 50 50 # # Vietnam Property development
Empire City Limited LLC (2) 40 40 40 # # Vietnam Property development
EM Services Pte Ltd 25 25 25 # # Singapore Property management
Equity Rainbow II Pte Ltd (2) 43 43 43 # # Singapore Property investment
Garden Development Pte Ltd (n) 60 60 - # # Singapore Property development
Keppel Land Watco I Co Ltd (1a) 61 61 45 # # Vietnam Property investment and development
Keppel Land Watco II Co Ltd (1a) 61 61 45 # # Vietnam Property investment and development
Keppel Land Watco III Co Ltd (1a) 61 61 45 # # Vietnam Property investment and development
Keppel REIT 46 46 46 # # Singapore Real estate investment trust
Marina Bay Suites Pte Ltd (3) 33 33 33 # # Singapore In the process of liquidation
Nam Long Investment 5 5 5 # # Vietnam Trading of development properties Corporation (2)
PT Pulomas Gemala Misori (2) 25 25 25 # # Indonesia Property development
PT Purimas Straits Resorts (3) - - 25 # # Indonesia Disposed
Raffles Quay Asset Management 33 33 33 # # Singapore Property management Pte Ltd (2)
Renown Property Holdings (M) 40 40 40 # # Malaysia Property investment Sdn Bhd (1a)
Quoc Loc Phat Joint Stock 45 45 45 # # Vietnam Property development Company (2)
South Rach Chiec LLC (1a) 42 42 42 # # Vietnam Property development
Suzhou Property Development 25 25 25 # # Singapore Property development Pte Ltd (2)
Vietcombank Tower 198 Ltd (2) 30 30 30 # # Vietnam Property investment
Vision (III) Pte Ltd (n)(2) 30 30 - # # Singapore Investment holding
INFRASTRUCTURE
Subsidiaries
Keppel Infrastructure Holdings 100 100 100 445,892 445,892 Singapore Investment holding Pte Ltd
Energy Infrastructure
Subsidiaries
Keppel Energy Pte Ltd 100 100 100 # # Singapore Investment holding
Keppel Electric Pte Ltd 100 100 100 # # Singapore Electricity, energy and power supply and general wholesale trade
Keppel Gas Pte Ltd 100 100 100 # # Singapore Purchase and sale of gaseous fuels
Keppel DHCS Pte Ltd 100 100 100 # # Singapore Development of district heating and cooling system for the purpose of air cooling and other utility services
Associated Companies
Keppel Merlimau Cogen Pte Ltd (2) 49 49 49 # # Singapore Commercial power generation

Keppel Corporation Limited | Report to Shareholders 2017
177
Country of Gross Effective Equity Incorporation Interest Interest Cost of Investment /Operation Principal Activities
2017 2017 2016 2017 2016 % % % $’000 $’000
Environmental Infrastructure
Subsidiaries
Keppel Seghers Pte Ltd 100 100 100 # # Singapore Provision of environmental, technologies, engineering works & construction activities
Keppel Seghers Holdings BV (1a) 100 100 100 # # Netherlands Investment holding
Keppel Seghers Belgium NV (1a) 100 100 100 # # Belgium Provider of services and solutions to the environmental industry related to solid waste treatment
Marina East Water Pte Ltd (n) 100 100 - # # Singapore Design and construction of desalination plant
Associated Companies
Tianjin Eco-City Energy Investment 20 20 20 # # China Investment and implementation of & Construction Co Ltd (2) energy and utilities related infrastructure
Tianjin Eco-City Environmental 20 20 20 # # China Investment, construction and operation Protection Co Ltd (2) of infrastructure for environmental protection
Infrastructure Services
Subsidiaries
Keppel Infrastructure Services 100 100 100 # # Singapore Provision of technical support including Pte Ltd engineering, construction, operations and maintenance of plants and facilities
KMC O&M Pte Ltd 100 100 100 # # Singapore Engineering works, construction and operations and maintenance of plants and facilities
Keppel Seghers Engineering 100 100 100 # # Singapore Engineering works, construction and Singapore Pte Ltd operations and maintenance of plants and facilities
Investments
Subsidiaries
Keppel Integrated Engineering Ltd 100 100 100 # # Singapore Investment holding
Keppel Prince Engineering Pty 100 100 100 # # Australia Metal fabrication Ltd (1a)
Keppel XTE Investments Pte Ltd 100 100 100 # # Singapore Investment holding
Associated Companies
Keppel Infrastructure Trust (2) 18 18 18 # # Singapore Infrastructure business trust
GE Keppel Energy Services Pte - - 50 # # Singapore Disposed Ltd (3)
Logistics & Data Centres
Subsidiaries
Keppel Telecommunications & 79 79 80 397,647 397,647 Singapore Investment, management and holding Transportation Ltd company
Keppel Logistics Pte Ltd 100 79 80 # # Singapore Integrated logistics services and supply chain solutions
Keppel Logistics (Foshan) Ltd (2) 70 55 56 # # China Integrated logistics port operations, warehousing and distribution
Keppel Logistics (Foshan Sanshui 60 33 33 # # China Integrated logistics port operations and Port) Co Ltd (2) warehousing
Jilin Sino-Singapore Food Zone 70 55 56 # # China Integrated logistics services, International Logistics Co Ltd (2) warehousing and distribution

178
Financial Report
Significant Subsidiaries and Associated Companies
Country of Gross Effective Equity Incorporation Interest Interest Cost of Investment /Operation Principal Activities
2017 2017 2016 2017 2016 % % % $’000 $’000
Keppel Wanjiang International 60 47 48 # # China Integrated logistics services, food Coldchain Logistics Park (Anhui) trading hub, warehousing and Co Ltd (2) distribution
Courex Pte Ltd (2) 60 47 48 # # Singapore Warehousing and distribution
Keppel Data Centres Pte Ltd 100 79 80 # # Singapore Investment holding
Keppel Data Centres Holding 100 + 86 + 86 + # # Singapore Investment holding and management Pte Ltd services
Keppel DC Singapore 1 Ltd 100 + 86 + 86 + # # Singapore Data centre facilities management
Keppel DC Singapore 2 Pte Ltd 100 + 86 + 86 + # # Singapore Data centre facilities management
Keppel DC Investment Holdings 100 79 80 # # Singapore Investment holding Pte Ltd
Keppel Communications Pte Ltd 100 79 80 # # Singapore Trading and provision of communications systems and accessories
Keppel Telecoms Pte Ltd 100 79 80 # # Singapore Investment holding
Associated Companies
Asia Airfreight Terminal Company 10 8 8 # # HK Operation of an air cargo handling Ltd (2) terminal
Computer Generated Solutions 21 17 17 # # USA IT consulting and outsourcing provider Inc (2)
Keppel DC REIT (2) 35 + 29 + 29 + # # Singapore Data centre real estate investment trust
Nautilus Data Technologies, 21 17 - # # USA Data centre leasing, co-location and Inc. (n)(2) inter-connection services
Radiance Communications Pte Ltd 50 40 40 # # Singapore Distribution and maintenance of communications equipment and systems
SVOA Public Company Ltd (2) 32 25 25 # # Thailand Distribution of IT products and telecommunications services
Wuhu Sanshan Port Co Ltd (2) 50 40 40 # # China Integrated logistics services and port operations
INVESTMENTS
Subsidiaries
Keppel Capital Holdings Pte Ltd 100 100 100 783,000 783,000 Singapore Investment holding
Keppel Capital Investment 100 100 100 # # Singapore Investment holding Holdings Pte Ltd
Alpha Investment Partners Ltd 100 100 100 # # Singapore Fund management
Keppel DC REIT Management 100 + 90 + 90 + # # Singapore Real estate investment trust Pte Ltd management and investment holding
Keppel Infrastructure Fund 100 100 100 # # Singapore Trust management Management Pte Ltd
Keppel REIT Management Ltd 100 100 100 # # Singapore Investment advisory and property fund management
Keppel Philippines Holdings Inc (1a) 82 + 81 + 64 + - - Philippines Investment holding
Alpha Real Estate Securities Fund 99 99 99 # # Singapore Investment holding
Kephinance Investment Pte Ltd 100 100 100 90,000 90,000 Singapore Investment holding
Kepinvest Singapore Pte Ltd 100 100 100 18,425 18,425 Singapore Investment holding
Kepital Management Ltd (1a) 100 100 100 # # HK Investment company
Keppel Group Eco-City 100 + 100 + 100 + 126,744 126,744 Singapore Investment holding Investments Pte Ltd
Keppel Funds Investment Pte Ltd 100 100 100 # # Singapore Investment company
Keppel GMTN Pte Ltd 100 100 100 10 10 Singapore Investment holding
Keppel Investment Ltd 100 100 100 # # Singapore Investment company

Keppel Corporation Limited | Report to Shareholders 2017
179
Country of Gross Effective Equity Incorporation Interest Interest Cost of Investment /Operation Principal Activities
2017 2017 2016 2017 2016 % % % $’000 $’000
Keppel Oil & Gas Pte Ltd 100 100 100 # # Singapore Investment holding
Kepventure Pte Ltd 100 100 100 594,922 594,922 Singapore Investment holding
KI Investments (HK) Ltd (3) 100 100 100 # # HK In the process of liquidation
Primero Investments Pte Ltd 100 100 100 # # Singapore Investment company
Singapore Tianjin Eco-City 90 + 90 + 90 + # # Singapore Investment holding Investment Holdings Pte Ltd
Substantial Enterprises Ltd (3) 100 + 100 + 100 + # # BVI Investment holding
Travelmore Pte Ltd 100 100 100 265 265 Singapore Travel agency
Associated Companies
k1 Ventures Ltd (2) 36 36 36 # # Singapore Investment holding
Keppel-KBS US REIT (n)(2) 7 7 - # # Singapore Real estate investment trust
KrisEnergy Ltd (2) 40 40 40 # # Cayman Exploration for, and the development Islands and production of oil and gas
M1 Ltd (2) 19 15 15 # # Singapore Telecommunications services
Sino-Singapore Tianjin Eco-City 50 45 45 # # China Property development Investment and Development Co., Ltd (2)
Total
Subsidiaries 8,209,616 8,307,153
Notes:(i) All the companies are audited by PricewaterhouseCoopers LLP, Singapore except for the following: (1a) AuditedbyoverseaspracticeofPricewaterhouseCoopersLLP; (2) Auditedbyotherfirmsofauditors;and (3) Notrequiredtobeauditedbylawinthecountryofincorporationandcompaniesdisposed,liquidatedandstruckoff. InaccordancetoRule716ofTheSingaporeExchangeSecuritiesTradingLimited–ListingRules,theAuditCommitteeandBoardofDirectorsoftheCompanyconfirmed
that they are satisfied that the appointment of different auditors for its subsidiaries and significant associated companies would not compromise the standard and effectiveness of the audit of the Company.
(ii) + The shareholdings of these companies are held jointly with other subsidiaries.(iii) # The shareholdings of these companies are held by subsidiaries of Keppel Corporation Limited.(iv) (n) These companies were incorporated/acquired during the financial year.(v) (r)Thesecompanieswereaccountedasassociatedcompaniesin2017followingthelossofcontrolbytheGroup.(vi) The subsidiaries’ place of business is the same as its country of incorporation, unless otherwise specified.(vii) Abbreviations: British Virgin Islands (BVI) United Arab Emirates (UAE) Hong Kong (HK) United States of America (USA)(viii) TheCompanyhas253significantsubsidiariesandassociatedcompaniesasat31December2017.Subsidiariesandassociatedcompaniesareconsideredassignificant
(a)inaccordancetoRule718ofTheSingaporeExchangeSecuritiesTradingLimited–ListingRules,or(b)byreferencetothesignificanceoftheireconomicactivities.

180
Other Information
Interested Person Transactions
The Group has obtained a general mandate from shareholders of the Company for interested person transactions in the Annual General Meeting held on 21 April 2017. During the financial year, the following interested person transactions were entered into by the Group:
Aggregate value of all interested person Aggregate value of all transactions during interested person the financial year transactions conducted under review (excluding under a shareholders’ transactions less than mandate pursuant $100,000 and transactions to Rule 920 of the conducted under SGX Listing Manual shareholders’ mandate (excluding transactionsName of Interested Person pursuant to Rule 920) less than $100,000)
2017 2016 2017 2016 $’000 $’000 $’000 $’000
Transaction for the Sale of Goods and ServicesCapitaLand Group – – 174,000 –Neptune Orient Lines Group – – – 389PSA International Group – – 8,077 1,482SATS Group – – 24,400 –SembCorp Marine Group – – 1,783 4,635Singapore Power Group – – 2,657 1,567Singapore Technologies Engineering Group – 280 189 899Temasek Holdings Group – – 338 16,938
Transaction for the Purchase of Goods and ServicesCapitaMalls Asia Group – – 254 –Certis CISCO Security Group – – 718 474Mapletree Investments Group – – 1,020 –Pavilion Gas Pte Ltd – – 51,000 50,000PSA International Group – – 305 208SembCorp Marine Group – – – 55Singapore Power Group – – 353 526Singapore Technologies Engineering Group – – 3,289 5,437Singapore Telecommunications Group – – 441 1,160Temasek Holdings Group – – 546 1,810 Total Interested Person Transactions – 280 269,370 85,580
Save for the interested person transactions disclosed above, there were no other material contracts entered into by the Company and its subsidiaries involving the interests of its chief executive officer, directors or controlling shareholders, which are either still subsisting at the end of the financial year or, if not then subsisting, entered into since the end of the previous financial year.

Keppel Corporation Limited | Report to Shareholders 2017
181
Key Executives
Chan Hon Chew, 52Bachelor of Accountancy (Honours), National University of Singapore; CFA® charterholder; Member of the Institute of Chartered Accountants Australia and Fellow Member of the Institute of the Singapore Chartered Accountants.
Mr Chan is the Chief Financial Officer of Keppel Corporation Limited, appointed with effect from 1 February 2014.
Prior to joining Keppel Corporation, Mr Chan was with Singapore Airlines Limited (SIA) and served as Senior Vice President (SVP) of Finance since June 2006. As SVP Finance, Mr Chan was responsible for a diverse range of functions including investor relations, corporate accounting and reporting, treasury, risk management and insurance. He was also involved in SIA’s strategic planning process and had represented SIA as Director on the Boards of various companies including Tiger Airways and Virgin Atlantic Airways Limited.
Prior to SIA, Mr Chan was Assistant General Manager for Finance and Corporate Services at Wing Tai Holdings Limited, where he oversaw all financial matters as well as tax, legal and corporate secretarial functions from 1998 to 2003.
Mr Chan was appointed by Singapore’s Ministry of Finance to the Board of the Accounting Standard Council in November 2015. He also serves on the management board of the Institute of System Science, National University of Singapore since 15th April 2015.
Mr Chan’s principal directorships include Keppel Offshore & Marine Ltd, Keppel Land Limited, Keppel Infrastructure Holdings Pte Ltd, Keppel Telecommunications & Transportation Ltd, KrisEnergy Ltd and Keppel Capital Holdings Pte Ltd. He is also the Chairman of Keppel DC REIT Management Pte Ltd (Manager of Keppel DC REIT).
Past principal directorships in the last five yearsTiger Airways Holdings Limited, Singapore Aviation & General Insurance Company (Pte) Ltd and RCMS Properties Private Limited.
Ang Wee Gee, 56Bachelor of Science summa cum laude, University of Denver, USA; Master of Business Administration, Imperial College, University of London, UK.
Mr Ang joined The Keppel Land Group in 1991 and was the Chief Executive Officer of Keppel Land Limited from 1 January 2013 to 31 December 2017.
Prior to his appointment as Chief Executive Officer of Keppel Land Limited, Mr Ang held senior management positions in the Group. He was Executive Vice Chairman of Keppel Land China Limited, a wholly-owned subsidiary of Keppel Land Limited which was formed in 2010 to own and operate Keppel Land Limited’s businesses in China. Prior to that, he was Executive Director and Chief Executive Officer, International of Keppel Land International Limited, responsible for the Group’s overseas businesses. He was also Chairman of Keppel Philippines Properties Inc which is listed on the Philippine Stock Exchange and Chairman of Keppel Thai Properties Public Company Limited which was listed on The Stock Exchange of Thailand. Mr Ang was also the Group’s Country Head for Vietnam as well as Head of Keppel Land Hospitality Management Pte Ltd. He previously held various positions in business and project development for Singapore and overseas markets, and corporate planning in the Group’s hospitality management arm.
Prior to joining Keppel Land Group, Mr Ang acquired diverse experience in the hotel, real estate and management consulting industries in the USA, Hong Kong and Singapore.
Mr Ang was a member of the Board of the Building and Construction Authority of Singapore.
Past principal directorships in the last five yearsVarious subsidiaries and associated companies of Keppel Land Limited.
Ong Tiong Guan, 59Bachelor of Engineering (First Class Honours), Monash University; Doctor of Philosophy (Ph.D.) under Monash Graduate Scholarship, Monash University.
Dr Ong was appointed Keppel Energy Pte Ltd’s Executive Director in November 1999. He became Managing Director of Keppel Energy Pte Ltd with effect from 1 May 2003 and was appointed Deputy Chairman of Keppel Integrated Engineering Ltd on April 2013.
Upon reorganisation of Keppel Energy Pte Ltd and Keppel Integrated Engineering Ltd under Keppel Infrastructure Holdings Pte Ltd in May 2013, Dr Ong was appointed Chief Executive Officer of Keppel Infrastructure Holdings Pte Ltd, responsible for the Keppel Group’s energy infrastructure business.
Dr Ong’s career spans across the energy industry from engineering and contracting to investment and ownership of energy assets.
His principal directorships include Keppel Infrastructure Holdings Pte Ltd, Keppel Energy Pte Ltd, Keppel Electric Pte Ltd, Keppel Gas Pte Ltd, Keppel DHCS Pte Ltd, Keppel Infrastructure Services Pte Ltd, Keppel Seghers Pte Ltd, Keppel Capital Holdings Pte Ltd and Energy Studies Institute.
Past principal directorships in the last five yearsKeppel Merlimau Cogen Pte Ltd, GE Keppel Energy Services Pte Ltd and Keppel Infrastructure Fund Management Pte Ltd (Trustee-Manager of Keppel Infrastructure Trust).
182
Other Information
Key Executives
Chris Ong Leng Yeow, 43Bachelor and Master Degree in Electrical and Electronics Engineering, National University of Singapore.
Mr Chris Ong is the Chief Executive Officer of Keppel Offshore & Marine since 1 July 2017. Prior to this, he was Acting Chief Executive Officer of Keppel Offshore & Marine. Mr Ong started his career at Keppel FELS in 1999 as a Commissioning Superintendent (E&I) and has accumulated extensive experience through subsequent appointments as a Project Engineer, Section Manager, General Manager (Engineering), Acting Executive Director (Operations), Executive Director (Commercial) and Managing Director.
In addition to his current appointment, he is also a board member of The Institute of Technical Education Board of Governors (BOG), a member of the Workplace Safety & Health (WSH) Council Marine Industries Committee, a member of the U EnTech Steering Committee, a member of the Keppel Chair Professor Management/Selection Committee and a member of the Governance Board of Keppel-NUS Corporate Laboratory. He was appointed a Board Member of the Maritime and Port Authority of Singapore on 2 Feb 2018.
Mr Ong is a Chartered Engineer, a Fellow of the Institute of Marine Engineering, Science and Technology and is a member of the American Bureau of Shipping and the DNV GL South East Asia and Pacific Committee.
Mr Ong is the Chairman of Bennett Offshore LLC, Keppel LeTourneau USA Inc, Bintan Offshore Fabricators Pte Ltd and Keppel SLP LLC and a director of various subsidiaries or associated companies of Keppel Offshore & Marine Ltd. He was also appointed a director of Kris Energy Ltd and Keppel Technology and Innovation Pte. Ltd.
Past principal directorships in the last five yearsMod Prefab Private Limited, Bintan Offshore Fabricators Pte Ltd, Keppel FEL Engineering Shenzhen Co Ltd, Keppel Offshore and Marine Engineering Services Mumbai Pvt Ltd, PT Bintan Offshore, Keppel FELS Baltech OOD and Keppel FELS Engineering Wu Han Co. Ltd.
Christina Tan Hua Mui, 52Bachelor of Accountancy (Honours), National University of Singapore; CFA® charterholder.
Ms Tan is the CEO of Keppel Capital Holdings Pte Ltd (Keppel Capital).
Keppel Capital is the Keppel Group’s asset management arm, which includes the asset managers Keppel REIT Management, Keppel Infrastructure Fund Management, Keppel DC REIT Management, Keppel-KBS REIT Management and Alpha Investment Partners Limited (“Alpha”). Ms Tan is a founding member of Alpha. She sits on the Investment Committee for all Alpha-managed funds and is instrumental in developing as well as implementing the portfolio strategy for all the funds.
Ms Tan has over 20 years of expertise and experience in investing and fund management across the US, Europe and Asia. She previously served as the Chief Financial Officer of GRA (Singapore) Private Limited, the Asian real estate fund management arm of the Prudential Insurance Company of America. Prior to that, she was the Treasury Manager with Chartered Industries of Singapore, managing the group’s cash positions and investments. Ms Tan started her career with Ernst & Young before joining the Government of Singapore Investment Corporation (GIC).
Ms Tan’s principal directorships include Keppel Capital, Keppel REIT Management Limited (the manager of Keppel REIT), Keppel DC REIT Management Pte Ltd (the manager of Keppel DC REIT), Keppel Infrastructure Fund Management Pte Ltd (the trustee-manager of Keppel Infrastructure Trust) and Alpha.
Past principal directorships in the last five yearsNil.
Thomas Pang Thieng Hwi, 53Bachelor of Arts (Engineering) and Master of Arts (Honorary Award), University of Cambridge (UK).
Mr Pang is currently Executive Director and Chief Executive Officer of Keppel Telecommunications & Transportation Ltd, a position he held since July 2014. From June 2010 to June 2014, he was Chief Executive Officer of Keppel Infrastructure Fund Management Pte Ltd, the Trustee-Manager of Keppel Infrastructure Trust (KIT).
Mr Pang joined Keppel Offshore & Marine Ltd in 2002 as a Senior Manager (Merger Integration Office) to assist in the merger integration of Keppel FELS Limited and Keppel Shipyard Limited. He was promoted to General Manager (Corporate Development) in 2007 and oversaw the investment, mergers and acquisitions, and strategic planning of Keppel Offshore & Marine Ltd. Prior to that, he was an investment manager with Vertex Management (United Kingdom) from 1998 to 2001. Mr Pang was also the Vice President (Central USA) of the Singapore Tourism Board from 1995 to 1998, as well as the Assistant Head (Services Group, Enterprise Development Division) at the Economic Development Board of Singapore from 1988 to 1995.
Mr Pang currently holds directorships in several Keppel Telecommunications & Transportation subsidiaries, associates and joint venture companies. He is also directors on ADCF C Private Limited, Keppel Capital Holdings Pte Ltd, Keppel DC REIT Management Pte Ltd (manager of Keppel DC REIT) and Keppel Technology and Innovation Pte Ltd.
Past principal directorships in the last five yearsVarious subsidiaries and associated companies of Keppel Telecommunications & Transportation Ltd, Keppel DC REIT and Keppel Infrastructure Trust.

Keppel Corporation Limited | Report to Shareholders 2017
183
Tan Swee Yiow, 57Bachelor of Science (First Class Honours) in Estate Management, National University of Singapore; Master of Business Administration in Accountancy, Nanyang Technological University.
Mr Tan was appointed Chief Executive Officer and Executive Director of Keppel REIT Management Limited with effect from 20 March 2017.
Mr Tan has been with the Keppel Land Group since 1990. Prior to his current appointment, Mr Tan was President, Singapore, in Keppel Land and concurrently Head, Keppel Land Hospitality Management.
Mr Tan is the President of Singapore Green Building Council and a Member of World Green Building Council’s Corporate Advisory Board. He also serves as Honorary Treasurer on the Management Council of Real Estate Developers’ Association of Singapore and sits on the Workplace Safety and Health Council (Construction and Landscape Committee).
Past principal directorships in the last five yearsKeppel Thai Properties Public Company Ltd and other subsidiaries and associated companies of Keppel Land Limited.
Khor Un-Hun, 48Bachelor of Accountancy (First Class Honours), Nanyang Technological University.
Mr Khor has been the Chief Executive Officer of Keppel Infrastructure Fund Management Pte Ltd, the Trustee-Manager of Keppel Infrastructure Trust (KIT), since May 2014. As the Chief Executive Officer, he is responsible for working with the Board to determine the strategy for KIT.
He works with other members of the Trustee-Manager’s management team to execute the stated strategy of the Trustee-Manager. He is concurrently the Director (Group Mergers & Acquisitions) of Keppel Corporation Limited.
Mr Khor joined Keppel Infrastructure Holdings Pte Ltd (KI) as Development Director in April 2014, where he worked on KI’s various business development initiatives.
Prior to joining KI, Mr Khor spent most of his career in the banking industry, during which he was involved in a wide range of mergers and acquisitions, financial advisory, capital markets and debt transactions across different sectors throughout Asia.
He held various positions in the corporate finance teams of Deutsche Bank and ING Bank in Singapore and Hong Kong before becoming Managing Director and Head of Corporate Finance, Asia at ING Bank. He was also a member of ING Bank’s Regional Management Committee.
Past principal directorships in the last five yearsNil.
Chua Hsien Yang, 40Bachelor of Engineering (Civil), University of Canterbury; Master of Business Administration, University of Western Australia.
Mr Chua is the Chief Executive Officer of Keppel DC REIT Management Pte Ltd (Manager of Keppel DC REIT). Mr Chua has more than 16 years of experience in mergers and acquisitions, real estate investments, fund management, business development and asset management in the real estate sector within the Asia Pacific region.
Prior to joining Keppel DC REIT Management Pte Ltd, Mr Chua headed the investment team of Keppel REIT Management Limited for six years. He was previously with Ascott Residence Trust Management Limited as Director of Business Development and Asset Management, and with Hotel Plaza Limited (now known as Pan Pacific Hotels Group Limited) as Assistant Vice President of Asset Management.
Past principal directorships in the last five yearsMirvac 8 Chifley Pty Limited and Mirvac (Old Treasury) Pty Limited.

184
Other Information
Key Executives
David Eric Snyder, 47Bachelor of Science in Business Administration, Biola University.
Mr Snyder is the Chief Executive Officer/Chief Investment Officer of Keppel-KBS US REIT Management Pte Ltd, the manager of Keppel-KBS US REIT.
Prior to this, Mr Snyder was a consultant to KBS where he oversaw the overall management of the AFRT portfolio and assisted in formulating the operational strategy and tactics for the portfolio. From 2008 to 2015, Mr Snyder was the Chief Financial Officer at KBS where he managed and advised five non-traded REITs. In addition, he oversaw, directed and participated in all aspects of investor relations, finance, financial reporting, accounting and financial planning including the negotiation and management of a portfolio transfer of over 800 properties with a value of over US$1 billion.
Mr Snyder started out as a Senior Accountant with Arthur Andersen LLP in 1993 where he was responsible for the design, testing and supervision of the financial statements of various public and private enterprises. From 1996 to 1997, Mr Snyder joined Regency Health Services as its Director of Financial Reporting. Subsequently, from 1998 to 2008, Mr Snyder was with Nationwide Health Properties, starting out as a Financial Controller before rising to become Vice President & Financial Controller in 2005. He was one of four members on the senior management team which determined the corporate strategy and financial decisions of the firm.
Past principal directorships in the last five yearsNil.
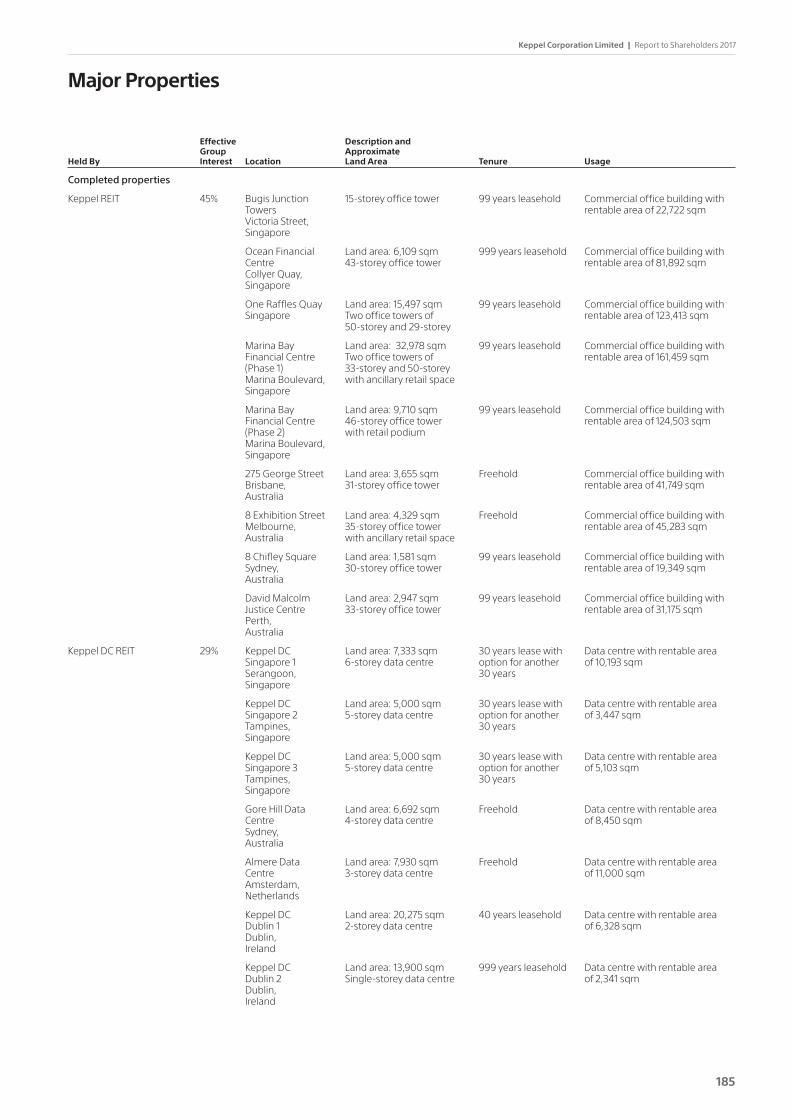
Keppel Corporation Limited | Report to Shareholders 2017
185
Major Properties
Effective Description and Group ApproximateHeld By Interest Location Land Area Tenure Usage
Completed properties
KeppelREIT 45% BugisJunction 15-storeyofficetower 99yearsleasehold Commercialofficebuildingwith Towers rentable area of 22,722 sqm Victoria Street, Singapore
Ocean Financial Land area: 6,109 sqm 999 years leasehold Commercial office building with Centre 43-storey office tower rentable area of 81,892 sqm Collyer Quay, Singapore
One Raffles Quay Land area: 15,497 sqm 99 years leasehold Commercial office building with Singapore Two office towers of rentable area of 123,413 sqm 50-storey and 29-storey
Marina Bay Land area: 32,978 sqm 99 years leasehold Commercial office building with Financial Centre Two office towers of rentable area of 161,459 sqm (Phase 1) 33-storey and 50-storey Marina Boulevard, with ancillary retail space Singapore
Marina Bay Land area: 9,710 sqm 99 years leasehold Commercial office building with Financial Centre 46-storey office tower rentable area of 124,503 sqm (Phase 2) with retail podium Marina Boulevard, Singapore
275 George Street Land area: 3,655 sqm Freehold Commercial office building with Brisbane, 31-storey office tower rentable area of 41,749 sqm Australia
8 Exhibition Street Land area: 4,329 sqm Freehold Commercial office building with Melbourne, 35-storey office tower rentable area of 45,283 sqm Australia with ancillary retail space
8 Chifley Square Land area: 1,581 sqm 99 years leasehold Commercial office building with Sydney, 30-storey office tower rentable area of 19,349 sqm Australia
David Malcolm Land area: 2,947 sqm 99 years leasehold Commercial office building with Justice Centre 33-storey office tower rentable area of 31,175 sqm Perth, Australia
KeppelDCREIT 29% KeppelDC Landarea:7,333sqm 30yearsleasewith Datacentrewithrentablearea Singapore 1 6-storey data centre option for another of 10,193 sqm Serangoon, 30 years Singapore
Keppel DC Land area: 5,000 sqm 30 years lease with Data centre with rentable area Singapore 2 5-storey data centre option for another of 3,447 sqm Tampines, 30 years Singapore
Keppel DC Land area: 5,000 sqm 30 years lease with Data centre with rentable area Singapore 3 5-storey data centre option for another of 5,103 sqm Tampines, 30 years Singapore
Gore Hill Data Land area: 6,692 sqm Freehold Data centre with rentable area Centre 4-storey data centre of 8,450 sqm Sydney, Australia
Almere Data Land area: 7,930 sqm Freehold Data centre with rentable area Centre 3-storey data centre of 11,000 sqm Amsterdam, Netherlands
Keppel DC Land area: 20,275 sqm 40 years leasehold Data centre with rentable area Dublin 1 2-storey data centre of 6,328 sqm Dublin, Ireland
Keppel DC Land area: 13,900 sqm 999 years leasehold Data centre with rentable area Dublin 2 Single-storey data centre of 2,341 sqm Dublin, Ireland

186
Other Information
Major Properties
Effective Description and Group ApproximateHeld By Interest Location Land Area Tenure Usage
ThoriumDCPteLtd 65% KeppelDC Landarea:6,805sqm 30yearsleasewith Datacentrewithgrossfloorarea Singapore 4 option for another of 16,917 sqm Tampines, 30 years Singapore
CalciumDCPteLtd 68% GraphiteDC Landarea:38,445sqm Freehold Datacentrewithgrossfloorarea Heinrich-Lanz-Allee of 20,000 sqm 47 Kalbach, Frankfurt, Germany
Keppel-KBSUSREIT 7% ThePlazaBuildings Landarea:16,295sqm Freehold Commercialofficebuildingwith 8th Street, Bellevue, 16 and 10 storey rentable area of 45,615 sqm Washington, multi-tenanted USA office buildings
Bellevue Land area: 188,570 sqm Freehold Commercial office buildings with Technology Office campus featuring rentable area of 30,705 sqm Center 9 multi-tenanted office 24th Street, buildings Bellevue, Washington, USA
Westmoor Center Land area: 176,953 sqm Freehold Commercial office building with Westmoor Drive, Office campus featuring rentable area of 56,462 sqm Colorado, 6 multi-tenanted office USA buildings
1800 West Loop Land area: 7,627 sqm Freehold Commercial office building with South A 21-storey high rise office rentable area of 37,021 sqm Houston, multi-tenanted property USA
MansfieldDevelopment 100% KeppelTowersand Landarea:9,127sqm Freehold Commercialofficebuildingwith Pte Ltd Keppel Towers 2 27-storey and 13-storey rentable area of 39,958 sqm Hoe Chiang Rd, office towers Singapore
KeppelBayPteLtd 100% Reflections Landarea:83,538sqm 99yearsleasehold A1,129-unitwaterfront at Keppel Bay condominium development Singapore
100% Coralsat Landarea:38,830sqm 99yearsleasehold A366-unitwaterfront Keppel Bay condominium development Singapore
HarbourFrontOnePteLtd 100% KeppelBayTower Landarea:17,267sqm 99yearsleasehold Commercialofficebuildingwith HarbourFront 18-storey office tower rentable area of 36,015 sqm Avenue, Singapore
ParksvilleDevelopment 100% NassimWoods Landarea:5,785sqm 99yearsleasehold A35-unitcondominium Pte Ltd Nassim Road, development Singapore
DCREITHoldingsPteLtd 22% I12Katong Landarea:7,261sqm 99yearsleasehold A6-storeyshoppingmall East Coast Road and Joo Chiat Road, Singapore
SpringCityGolf& 69% SpringCityGolf Landarea:2,578,705sqm 70yearslease Integratedresortcomprising Lake Resort Co & Lake Resort Two 18-hole golf courses, (residential) golf courses, resort homes (owned by Kingsdale Kunming, a club house 50 years lease and resort facilities Development Pte Ltd) China (golf course)
ChengduHillstreet 100% ParkAvenue Landarea:50,782sqm 70yearslease A1,535-unitresidential Development Co Ltd Heights (residential) development with commercial Chengdu, 40 years lease facilities in Jinjiang District China (commercial)
ChengduTaixinReal 35% V-City(Phase2) Landarea:167,000sqm 70yearslease A5,399-unitresidential Estate Development Co Chengdu, (residential) development with retail facilities Ltd China 40 years lease (commercial)
TianjinFushiProperty 100% SerenityVilla Landarea:128,685sqm 70yearsleasehold A340-unitresidential Development Co Ltd Tianjin, development in Tianjin Eco-City China

Keppel Corporation Limited | Report to Shareholders 2017
187
Effective Description and Group ApproximateHeld By Interest Location Land Area Tenure Usage
TianjinFulongProperty 100% Waterfront Landarea:103,683sqm 70yearsleasehold A341-unitlandeddevelopment Development Co Ltd Residence in Tianjin Eco-City Tianjin, China
ShanghaiPasirPanjang 99% EightParkAvenue Landarea:33,432sqm 70yearsleasehold A918-unitresidential Land Co Ltd Shanghai, development China
ShanghaiJiXiangLand 100% SeasonsResidence Landarea:71,621sqm 70yearsleasehold A1,102-unitresidential Co Ltd Shanghai, development in Nanxiang, China Jiading District
ShanghaiXusheng 30% TrinityTower Landarea:16,427sqm 50yearslease Amixed-usedevelopmentin Property Investment Shanghai, (office) Hong Kou District Co Ltd China 40 years lease (retail)
PTStraits-CMVillage 39% ClubMedRiaBintan Landarea:200,000sqm 30yearsleasewith A302-roombeachfronthotel Bintan, option for another Indonesia 50 years
PTKeplandInvestama 100% International Landarea:10,428sqm 20yearsleasewith Aprimeofficedevelopmentwith Financial Centre option for another rentable area of 27,933 sqm (Tower 1) 20 years Jakarta, Indonesia
100% International Landarea:10,428sqm 20yearsleasewith Aprimeofficedevelopmentwith Financial Centre option for another rentable area of 50,200 sqm (Tower 2) 20 years Jakarta, Indonesia
KeppelLandWatcoICoLtd 61% SaigonCentre Landarea:2,730sqm 50yearsleasehold Commercialofficebuildingwith (Phase 1) 25-storey office, retail rentable area of 10,626 sqm office Ho Chi Minh City, cum serviced apartments and 89 units of serviced Vietnam development apartments
SouthRachChiecLLC 42% PalmCity Landarea:289,365sqm 50yearsleasehold A3,670-unitresidentialtownship (South Rach Chiec) and commercial space (Phase 1) Ho Chi Minh City, Vietnam
CitySquareOfficeCoLtd 40% JunctionCityTower Landarea:26,406sqm 50yearsBOTwith Amix-useddevelopmentinCBD (Phase 1) option for another Yangon, two 10-years Myanmar
StraitsGreenfieldLtd 100% SedonaHotel Landarea:40,516sqm 50yearsBOTwith A5-starhotelinYangonwith Yangon option for another 797 rooms Yangon, two 10-years Myanmar
FirstKingPropertiesLtd 100% OfficeDevelopment Landarea:1,947sqm Freehold Commercialofficebuildingwith 75 King William 9-storey office tower rentable area of 11,731 sqm Street London, United Kingdom
Properties under development
KeppelREIT 45% 311SpencerStreet Landarea:5,136sqm Freehold Anofficedevelopmentlocatedin Melbourne, CBD Australia *(2019)
KeppelBayPteLtd 100% KeppelBayPlot6 Landarea:43,701sqm 99yearsleasehold Aproposed86-unitwaterfront Singapore condominium development
KeppelDCREIT 29% maincubesData Landarea:5,596sqm Freehold Datacentre Centre Main, *(2018) Germany
HarvestlandDevelopment 100% HighlineResidences Landarea:10,991sqm 99yearsleasehold A500-unitcondominium Pte Ltd Tiong Bahru, development Singapore *(2018)
BeijingAetherProperty 51% Commercial Landarea:26,081sqm 40/50years Anofficeandretaildevelopment Development Ltd Development leasehold in Chaoyang District Beijing, *(2020) China
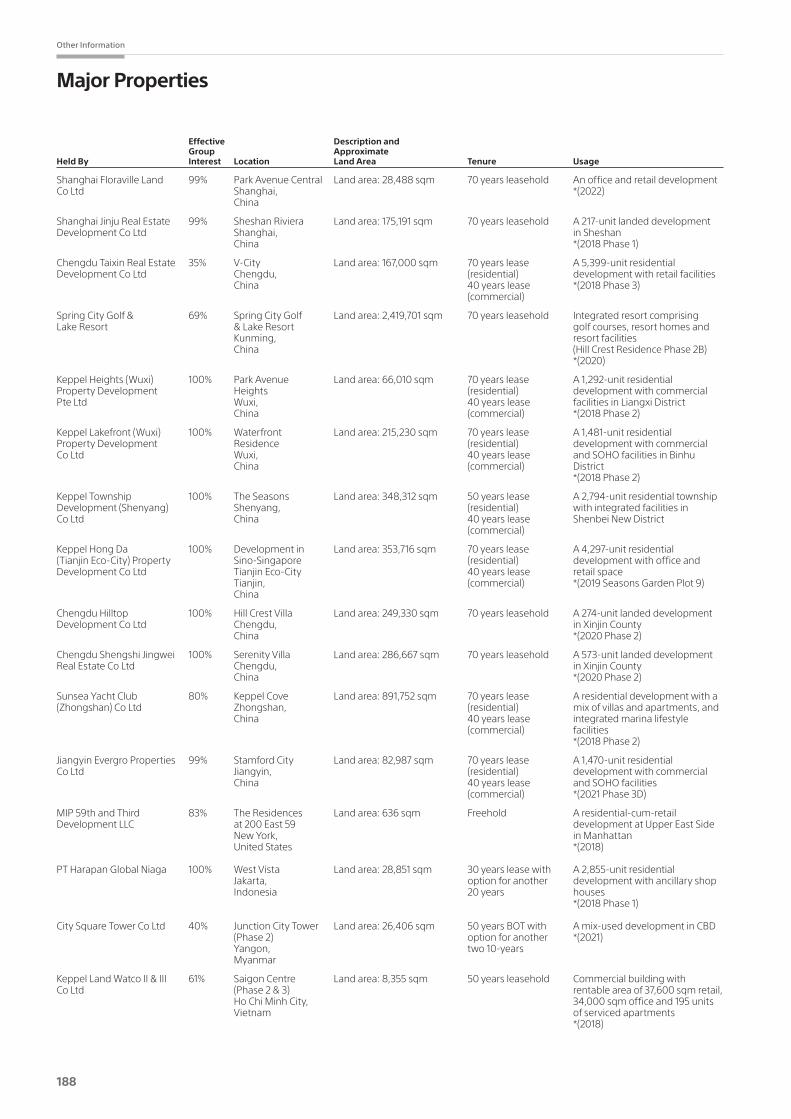
188
Other Information
Major Properties
Effective Description and Group ApproximateHeld By Interest Location Land Area Tenure Usage
ShanghaiFloravilleLand 99% ParkAvenueCentral Landarea:28,488sqm 70yearsleasehold Anofficeandretaildevelopment Co Ltd Shanghai, *(2022) China
ShanghaiJinjuRealEstate 99% SheshanRiviera Landarea:175,191sqm 70yearsleasehold A217-unitlandeddevelopment Development Co Ltd Shanghai, in Sheshan China *(2018 Phase 1)
ChengduTaixinRealEstate 35% V-City Landarea:167,000sqm 70yearslease A5,399-unitresidential Development Co Ltd Chengdu, (residential) development with retail facilities China 40 years lease *(2018 Phase 3) (commercial)
SpringCityGolf& 69% SpringCityGolf Landarea:2,419,701sqm 70yearsleasehold Integratedresortcomprising Lake Resort & Lake Resort golf courses, resort homes and Kunming, resort facilities China (Hill Crest Residence Phase 2B) *(2020)
KeppelHeights(Wuxi) 100% ParkAvenue Landarea:66,010sqm 70yearslease A1,292-unitresidential Property Development Heights (residential) development with commercial Pte Ltd Wuxi, 40 years lease facilities in Liangxi District China (commercial) *(2018 Phase 2)
KeppelLakefront(Wuxi) 100% Waterfront Landarea:215,230sqm 70yearslease A1,481-unitresidential Property Development Residence (residential) development with commercial Co Ltd Wuxi, 40 years lease and SOHO facilities in Binhu China (commercial) District *(2018 Phase 2)
KeppelTownship 100% TheSeasons Landarea:348,312sqm 50yearslease A2,794-unitresidentialtownship Development (Shenyang) Shenyang, (residential) with integrated facilities in Co Ltd China 40 years lease Shenbei New District (commercial)
KeppelHongDa 100% Developmentin Landarea:353,716sqm 70yearslease A4,297-unitresidential (Tianjin Eco-City) Property Sino-Singapore (residential) development with office and Development Co Ltd Tianjin Eco-City 40 years lease retail space Tianjin, (commercial) *(2019 Seasons Garden Plot 9) China
ChengduHilltop 100% HillCrestVilla Landarea:249,330sqm 70yearsleasehold A274-unitlandeddevelopment Development Co Ltd Chengdu, in Xinjin County China *(2020 Phase 2)
ChengduShengshiJingwei 100% SerenityVilla Landarea:286,667sqm 70yearsleasehold A573-unitlandeddevelopment Real Estate Co Ltd Chengdu, in Xinjin County China *(2020 Phase 2)
SunseaYachtClub 80% KeppelCove Landarea:891,752sqm 70yearslease Aresidentialdevelopmentwitha (Zhongshan) Co Ltd Zhongshan, (residential) mix of villas and apartments, and China 40 years lease integrated marina lifestyle (commercial) facilities *(2018 Phase 2)
JiangyinEvergroProperties 99% StamfordCity Landarea:82,987sqm 70yearslease A1,470-unitresidential Co Ltd Jiangyin, (residential) development with commercial China 40 years lease and SOHO facilities (commercial) *(2021 Phase 3D)
MIP59thandThird 83% TheResidences Landarea:636sqm Freehold Aresidential-cum-retail Development LLC at 200 East 59 development at Upper East Side New York, in Manhattan United States *(2018)
PTHarapanGlobalNiaga 100% WestVista Landarea:28,851sqm 30yearsleasewith A2,855-unitresidential Jakarta, option for another development with ancillary shop Indonesia 20 years houses *(2018 Phase 1)
CitySquareTowerCoLtd 40% JunctionCityTower Landarea:26,406sqm 50yearsBOTwith Amix-useddevelopmentinCBD (Phase 2) option for another *(2021) Yangon, two 10-years Myanmar
KeppelLandWatcoII&III 61% SaigonCentre Landarea:8,355sqm 50yearsleasehold Commercialbuildingwith Co Ltd (Phase 2 & 3) rentable area of 37,600 sqm retail, Ho Chi Minh City, 34,000 sqm office and 195 units Vietnam of serviced apartments *(2018)

Keppel Corporation Limited | Report to Shareholders 2017
189
Effective Description and Group ApproximateHeld By Interest Location Land Area Tenure Usage
SaigonSportsCityLtd 90% SaigonSportsCity Landarea:640,477sqm 50yearsleasehold A4,300-unitresidentialtownship, Ho Chi Minh City, commercial complexes and public Vietnam sports facilities *(2021 Phase 1)
SouthRachChiecLLC 42% PalmCity Landarea:289,365sqm 50yearsleasehold A3,670-unitresidentialtownship (South Rach Chiec) and commercial space Ho Chi Minh City, *(2019 Phase 2) Vietnam
EstellaJVCoLtd 98% EstellaHeights Landarea:25,393sqm 50yearsleasehold A872-unitresidential Ho Chi Minh City, development with commercial Vietnam space in An Phu Ward, District 2 *(2018 Phase 2)
EmpireCityLLC 40% EmpireCity Landarea:146,000sqm 50yearsleasehold Aresidentialdevelopmentwith Ho Chi Minh City, commercial space in Thu Thiem Vietnam New Urban Area, District 2 *(2020 Phase 1 & 2)
DongNaiWaterfrontCity 50% DongNai Landarea:3,667,127sqm 50yearsleasehold A7,850-unitresidentialtownship LLC Waterfront City with commercial space in (owned by Portsville Dong Nai Province, Long Thanh District Pte Ltd) Vietnam *(2023 Phase 1)
INDUSTRIAL PROPERTIES
KeppelFELSLimited 100% Pioneerand Landarea:522,097sqm 16-30years Offshoreoilrigconstructionand Crescent Yard, buildings, workshops, leasehold repair Singapore building berths, drydocks and wharves
EstaleiroBrasFELSLtda 100% AngradosReis, Landarea:409,020sqm 30yearsleasehold Offshoreoilrigconstructionand Rio de Janeiro, buildings, workshops, repair Brazil drydock, berths and wharf
KeppelShipyardLimited 100% Benoiand Landarea:799,111sqm 30yearsleasehold Shiprepairing,shipbuildingand Pioneer Yard, buildings, workshops, marine construction Singapore drydocks and wharves
* Expected year of completion
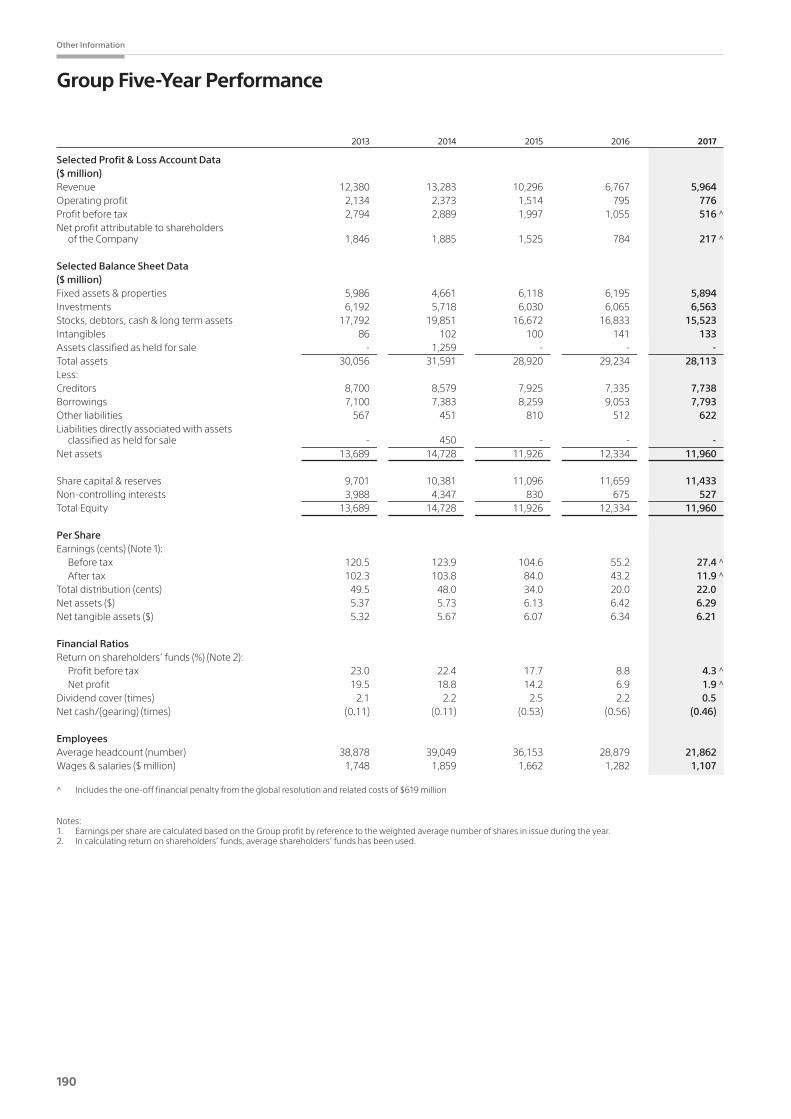
190
Other Information
Group Five-Year Performance
2013 2014 2015 2016 2017
Selected Profit & Loss Account Data($ million)Revenue 12,380 13,283 10,296 6,767 5,964Operating profit 2,134 2,373 1,514 795 776Profit before tax 2,794 2,889 1,997 1,055 516 ̂Net profit attributable to shareholders of the Company 1,846 1,885 1,525 784 217 ̂
Selected Balance Sheet Data($ million)Fixed assets & properties 5,986 4,661 6,118 6,195 5,894Investments 6,192 5,718 6,030 6,065 6,563Stocks, debtors, cash & long term assets 17,792 19,851 16,672 16,833 15,523Intangibles 86 102 100 141 133Assets classified as held for sale - 1,259 - - -Total assets 30,056 31,591 28,920 29,234 28,113Less:Creditors 8,700 8,579 7,925 7,335 7,738Borrowings 7,100 7,383 8,259 9,053 7,793Other liabilities 567 451 810 512 622Liabilities directly associated with assets classified as held for sale - 450 - - -Net assets 13,689 14,728 11,926 12,334 11,960
Share capital & reserves 9,701 10,381 11,096 11,659 11,433Non-controlling interests 3,988 4,347 830 675 527Total Equity 13,689 14,728 11,926 12,334 11,960
Per ShareEarnings (cents) (Note 1): Before tax 120.5 123.9 104.6 55.2 27.4 ̂ After tax 102.3 103.8 84.0 43.2 11.9 ̂Total distribution (cents) 49.5 48.0 34.0 20.0 22.0Net assets ($) 5.37 5.73 6.13 6.42 6.29Net tangible assets ($) 5.32 5.67 6.07 6.34 6.21
Financial RatiosReturnonshareholders’funds(%)(Note2): Profit before tax 23.0 22.4 17.7 8.8 4.3 ̂ Net profit 19.5 18.8 14.2 6.9 1.9 ̂Dividend cover (times) 2.1 2.2 2.5 2.2 0.5Net cash/(gearing) (times) (0.11) (0.11) (0.53) (0.56) (0.46)
EmployeesAverage headcount (number) 38,878 39,049 36,153 28,879 21,862Wages & salaries ($ million) 1,748 1,859 1,662 1,282 1,107
^ Includestheone-offfinancialpenaltyfromtheglobalresolutionandrelatedcostsof$619million
Notes: 1. EarningspersharearecalculatedbasedontheGroupprofitbyreferencetotheweightedaveragenumberofsharesinissueduringtheyear.2. Incalculatingreturnonshareholders’funds,averageshareholders’fundshasbeenused.
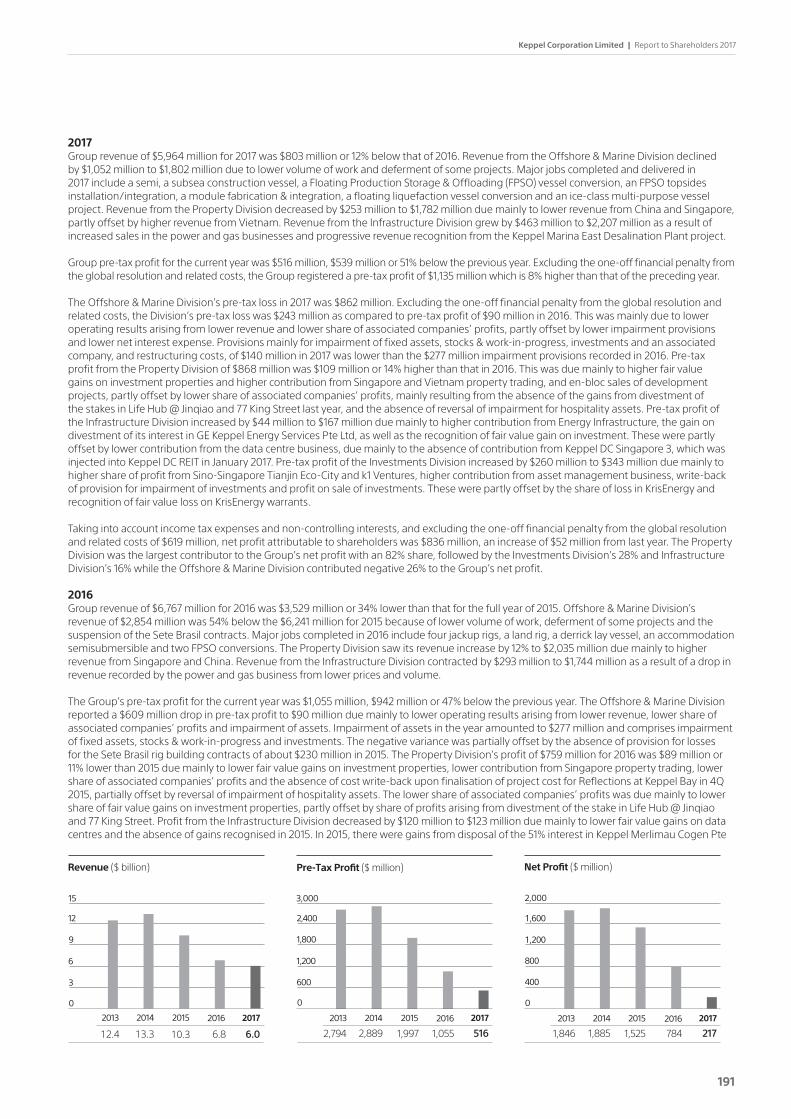
Keppel Corporation Limited | Report to Shareholders 2017
191
2017Grouprevenueof$5,964millionfor2017was$803millionor12%belowthatof2016.RevenuefromtheOffshore&MarineDivisiondeclinedby $1,052 million to $1,802 million due to lower volume of work and deferment of some projects. Major jobs completed and delivered in 2017 include a semi, a subsea construction vessel, a Floating Production Storage & Offloading (FPSO) vessel conversion, an FPSO topsides installation/integration, a module fabrication & integration, a floating liquefaction vessel conversion and an ice-class multi-purpose vessel project. Revenue from the Property Division decreased by $253 million to $1,782 million due mainly to lower revenue from China and Singapore, partly offset by higher revenue from Vietnam. Revenue from the Infrastructure Division grew by $463 million to $2,207 million as a result of increased sales in the power and gas businesses and progressive revenue recognition from the Keppel Marina East Desalination Plant project.
Grouppre-taxprofitforthecurrentyearwas$516million,$539millionor51%belowthepreviousyear.Excludingtheone-offfinancialpenaltyfromtheglobalresolutionandrelatedcosts,theGroupregisteredapre-taxprofitof$1,135millionwhichis8%higherthanthatoftheprecedingyear.
The Offshore & Marine Division’s pre-tax loss in 2017 was $862 million. Excluding the one-off financial penalty from the global resolution and related costs, the Division’s pre-tax loss was $243 million as compared to pre-tax profit of $90 million in 2016. This was mainly due to lower operating results arising from lower revenue and lower share of associated companies’ profits, partly offset by lower impairment provisions and lower net interest expense. Provisions mainly for impairment of fixed assets, stocks & work-in-progress, investments and an associated company, and restructuring costs, of $140 million in 2017 was lower than the $277 million impairment provisions recorded in 2016. Pre-tax profitfromthePropertyDivisionof$868millionwas$109millionor14%higherthanthatin2016.Thiswasduemainlytohigherfairvaluegains on investment properties and higher contribution from Singapore and Vietnam property trading, and en-bloc sales of development projects, partly offset by lower share of associated companies’ profits, mainly resulting from the absence of the gains from divestment of the stakes in Life Hub @ Jinqiao and 77 King Street last year, and the absence of reversal of impairment for hospitality assets. Pre-tax profit of the Infrastructure Division increased by $44 million to $167 million due mainly to higher contribution from Energy Infrastructure, the gain on divestment of its interest in GE Keppel Energy Services Pte Ltd, as well as the recognition of fair value gain on investment. These were partly offset by lower contribution from the data centre business, due mainly to the absence of contribution from Keppel DC Singapore 3, which was injected into Keppel DC REIT in January 2017. Pre-tax profit of the Investments Division increased by $260 million to $343 million due mainly to higher share of profit from Sino-Singapore Tianjin Eco-City and k1 Ventures, higher contribution from asset management business, write-back of provision for impairment of investments and profit on sale of investments. These were partly offset by the share of loss in KrisEnergy and recognition of fair value loss on KrisEnergy warrants.
Taking into account income tax expenses and non-controlling interests, and excluding the one-off financial penalty from the global resolution and related costs of $619 million, net profit attributable to shareholders was $836 million, an increase of $52 million from last year. The Property DivisionwasthelargestcontributortotheGroup’snetprofitwithan82%share,followedbytheInvestmentsDivision’s28%andInfrastructureDivision’s16%whiletheOffshore&MarineDivisioncontributednegative26%totheGroup’snetprofit.
2016Grouprevenueof$6,767millionfor2016was$3,529millionor34%lowerthanthatforthefullyearof2015.Offshore&MarineDivision’srevenueof$2,854millionwas54%belowthe$6,241millionfor2015becauseoflowervolumeofwork,defermentofsomeprojectsandthesuspension of the Sete Brasil contracts. Major jobs completed in 2016 include four jackup rigs, a land rig, a derrick lay vessel, an accommodation semisubmersibleandtwoFPSOconversions.ThePropertyDivisionsawitsrevenueincreaseby12%to$2,035millionduemainlytohigherrevenue from Singapore and China. Revenue from the Infrastructure Division contracted by $293 million to $1,744 million as a result of a drop in revenue recorded by the power and gas business from lower prices and volume.
TheGroup’spre-taxprofitforthecurrentyearwas$1,055million,$942millionor47%belowthepreviousyear.TheOffshore&MarineDivisionreported a $609 million drop in pre-tax profit to $90 million due mainly to lower operating results arising from lower revenue, lower share of associated companies’ profits and impairment of assets. Impairment of assets in the year amounted to $277 million and comprises impairment of fixed assets, stocks & work-in-progress and investments. The negative variance was partially offset by the absence of provision for losses for the Sete Brasil rig building contracts of about $230 million in 2015. The Property Division’s profit of $759 million for 2016 was $89 million or 11%lowerthan2015duemainlytolowerfairvaluegainsoninvestmentproperties,lowercontributionfromSingaporepropertytrading,lowershare of associated companies’ profits and the absence of cost write-back upon finalisation of project cost for Reflections at Keppel Bay in 4Q 2015, partially offset by reversal of impairment of hospitality assets. The lower share of associated companies’ profits was due mainly to lower share of fair value gains on investment properties, partly offset by share of profits arising from divestment of the stake in Life Hub @ Jinqiao and 77 King Street. Profit from the Infrastructure Division decreased by $120 million to $123 million due mainly to lower fair value gains on data centresandtheabsenceofgainsrecognisedin2015.In2015,thereweregainsfromdisposalofthe51%interestinKeppelMerlimauCogenPte
6.810.313.312.4
0
3
6
9
12
0
600
1,200
1,800
2,400
Net Profit ($ million)Revenue ($ billion) Pre-Tax Profit ($ million)
2,794 5161,0551,9972,889 1,846 2177841,5251,885
400
800
1,200
1,600
0
2013 201720152014 2016
6.0
2013 201720152014 2016 2013 201720152014 2016
15 3,000 2,000

192
Other Information
Group Five-Year Performance
Ltd and dilution re-measurement gain from the combination of Crystal Trust and CitySpring Infrastructure Trust to form the enlarged Keppel Infrastructure Trust, which were partially offset by the losses following finalisation of the cost to complete the Doha North Sewage Treatment Plant. Pre-tax profit of the Investments Division decreased by $124 million to $83 million due mainly to share of losses and impairment losses of an associated company, and the absence of gain from sale of investments last year, partially offset by share of profits from Sino-Singapore Tianjin Eco-City.
Taking into account income tax expenses and non-controlling interests, net profit attributable to shareholders was $784 million, $741 million or 49%lowerthanlastyear.ThePropertyDivisionwasthelargestcontributortoGroupnetprofitat79%,followedbytheInfrastructureDivision’s13%,theInvestmentsDivision’sandtheOffshore&MarineDivision’sat4%each.
2015Grouprevenueof$10,296millionfor2015was$2,987millionor22%lowerthanthatforthefullyearof2014.Offshore&MarineDivision’srevenueof$6,241millionwas27%belowthe$8,556millionfor2014duetolowervolumeofwork,defermentofsomeprojectsandthesuspensionoftheSete Brasil contracts. Major jobs completed in 2015 include seven jackup rigs, an accommodation semisubmersible, one FPSO conversion, one depletioncompressionplatform,onefloatingcraneandanFPSOintegration.ThePropertyDivisionsawitsrevenueincreaseby12%to$1,823 million due mainly to higher revenue from China partly offset by lower revenue from Singapore and the absence of the sale of a residential development in Jeddah, Saudi Arabia which was sold in 2014. Revenue from the Infrastructure Division contracted by $877 million to $2,037 million as a result of a drop in revenue recorded by the power and gas business due to lower prices and volume, lower revenue from engineering, procurement and construction (EPC) projects, lower contribution from the data centre business, as well as absence of revenue from Keppel FMO Pte Ltd which was disposed in December 2014.
TheGroup’spre-taxprofitforthecurrentyearwas$1,997million,$892millionor31%belowthepreviousyear.TheOffshore&MarineDivisionreported a $666 million drop in pre-tax profit to $699 million. Lower operating results arising from lower revenue, provision for losses for Sete Brasil rig building contracts of about $230 million and lower net interest income were partially offset by an increase in share of associated companies’profits.ThePropertyDivision’sprofitof$848millionfor2015was$122millionor13%belowthatof2014.Thiswasduemainlytolower operating results, reduction in share of associated companies’ profits, higher net interest expense and absence of gains from the disposal of investment properties (Equity Plaza, Prudential Tower and Marina Bay Financial Centre Tower 3 were disposed in 2014), partly offset by higher fair value gains on investment properties and cost write-back upon finalisation of project cost for the Reflections at Keppel Bay. Profit from the InfrastructureDivisiondecreasedby$192millionto$243million.Thegainfromdisposalof51%interestinKeppelMerlimauCogenPteLtdanddilution re-measurement gain from the combination of Crystal Trust and CitySpring Infrastructure Trust to form the enlarged Keppel Infrastructure Trust were partially offset by the losses following finalisation of the cost to complete the Doha North Sewage Treatment Works and the reduced contribution from the power and gas business. There were also gains from divestment of data centre assets and Keppel FMO in 2014.
Taking into account income tax expenses and non-controlling interests, net profit attributable to shareholders was $1,525 million, $360 million or19%lowerthanlastyear.ThePropertyDivisionwasthelargestcontributortoGroupnetprofitat43%,followedbytheOffshore&MarineDivision’s32%,theInfrastructureDivision’s13%andtheInvestmentsDivision’sat12%.
2014Grouprevenueof$13,283millionfor2014was$903millionor7%higherthanthatforthefullyearof2013.Offshore&MarineDivision’srevenueof$8,556millionwas20%abovetheS$7,126millionfor2013,drivenmainlybyprogressfromon-goingjobs.Majorjobscompletedin2014include 7 jackup rigs, 3 FPSO upgrades, 2 FPSO conversions, one FPSO integration and one semisubmersible upgrade. Revenue from the Infrastructure Division decreased by $538 million to $2,914 million mainly due to lower revenue contributed by Keppel Infrastructure’s power generation plant, partially offset by stronger contribution from Keppel Telecommunications & Transportation’s logistics and data centre businesses.ThePropertyDivisionsawitsrevenueweakenedby2%to$1,629millionmainlyfromweakersalesinSingapore.Inaddition,Keppel REIT did not contribute any revenue in 2014 as it was deconsolidated from 31 August 2013. This was partly offset by sale of a residential development in Jeddah, Saudi Arabia.
TheGroup’spre-taxprofitforthecurrentyearwas$2,889million,$95millionor3%abovethepreviousyear.TheOffshore&MarineDivisionposted a higher pre-tax profit of $1,365 million mainly from better operating results and higher interest income partially offset by lower share of associated companies’ profits. Profit from the Infrastructure Division increased by $365 million to $435 million due mainly to better operating results from both Keppel Infrastructure and Keppel Telecommunications & Transportation as well as gains from divestments of data centre assetsandKeppelFMO.ThePropertyDivision’sprofitof$970millionfor2014was$407millionor30%belowthatof2013.Loweroperatingresults, lower fair value gains on investment properties and absence of gains from deconsolidation of Keppel REIT recognised in 2013 was partially offset by gains from the disposals of Equity Plaza, Prudential Tower and Marina Bay Financial Centre Tower 3 in 2014.
11.711.110.49.7
0
2.5
5.0
7.5
10
0
3
6
9
12
Market Capitalisation ($ billion)Shareholders’ Fund ($ billion) Total Equity ($ billion)
13.7 12.012.311.914.7 20.2 13.410.511.816.0
5
10
15
20
0
2013 201720152014 2016
11.4
2013 201720152014 2016 2013 201720152014 2016
12.5 15 25
Keppel Corporation Limited | Report to Shareholders 2017
193
Taking into account income tax expenses and non-controlling interests, net profit attributable to shareholders was $1,885 million, $39 million or2%higherthanlastyear.TheOffshore&MarineDivisionwasthelargestcontributortoGroupnetprofitat55%,followedbythePropertyDivision’s25%,theInfrastructureDivision’s16%andtheInvestmentsDivision’sat4%.
2013Group revenue was $12,380 million as compared to $13,965 million for 2012. Many jobs started during the year have not reached the stage ofrevenuerecognitionresultingintherevenueofOffshore&MarineDivisionfallingby11%to$7,126million.In2013,22majornewbuilds,comprising 20 jack-ups, an accommodation semisubmersible and a semisubmersible, were completed. Other significant jobs completed include a drillship upgrade, a semi upgrade, several FPSO projects and a diving support vessel. Revenue from Infrastructure Division increased by $620 million to $3,452 million due to higher revenue contributed by the co-generation power plant in Singapore. Property Division saw its revenueweakenedby43%to$1,711millionmainlyfromdeclineinsalesrecognitionofReflectionsatKeppelBayunitsarisingfromthedeliveriesof residential units sold under the deferred payment scheme in 2012 which was not repeated in 2013.
At the pre-tax level, Group profit went down by $462 million from $3,256 million in 2012 to $2,794 million for the current year. Offshore & Marine Division posted a higher pre-tax profit of $1,202 million mainly from an increase in share of associated companies’ profits partly offset byadecreaseinoperatingresults.ProfitfromInfrastructureDivisionpickedupby21%to$70millionduemainlytoimprovedperformanceby its power and gas business. There was also a reversal of provision following the finalisation of the sale of the power barge. This was partly offsetbylossesarisingfromcostoverrunspertainingtotheEPCcontracts.PropertyDivisionprofitof$1,377millionwas22%lowerthanprofitof $1,757 million for 2012. Reflections at Keppel Bay recorded higher profits in the previous year as it benefited from revenue recognition from the deliveries of residential units sold under the deferred payment scheme. There were also lower gains on investment properties in 2013. This reduction was partially offset by higher contribution of profit from China, profit from the sale of Jakarta Garden City project and gain from deconsolidation of Keppel REIT during the current year. Fewer disposals of equity investments in 2013 resulted in the decline of Investments Division’s profit to $144 million.
Taking into account income tax expenses and non-controlling interests, net profit attributable to shareholders was $1,846 million, $391 million or17%lowerthanlastyear.TheOffshore&MarineDivisionwasthelargestcontributortoGroupnetprofitat51%,followedbythePropertyDivision’s43%.
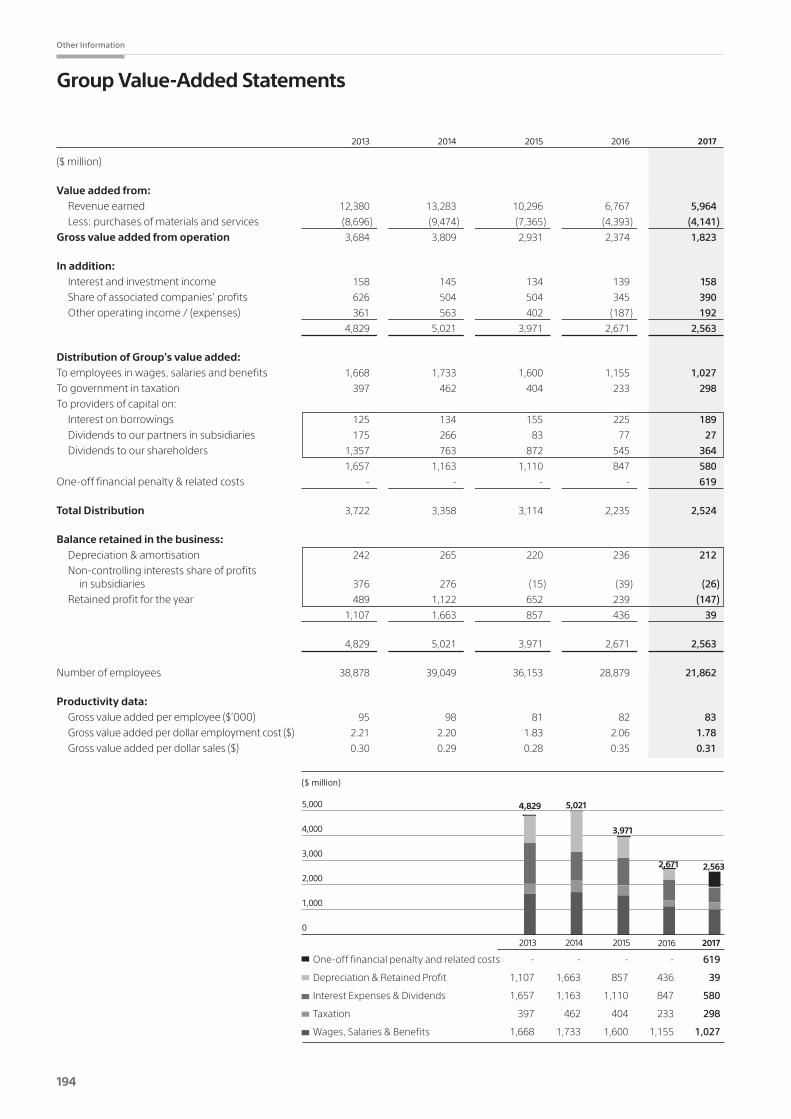
194
Other Information
Group Value-Added Statements
2013 2014 2015 2016 2017
($ million)
Value added from:
Revenue earned 12,380 13,283 10,296 6,767 5,964
Less: purchases of materials and services (8,696) (9,474) (7,365) (4,393) (4,141)
Gross value added from operation 3,684 3,809 2,931 2,374 1,823
In addition:
Interest and investment income 158 145 134 139 158
Share of associated companies’ profits 626 504 504 345 390
Other operating income / (expenses) 361 563 402 (187) 192
4,829 5,021 3,971 2,671 2,563
Distribution of Group’s value added:
To employees in wages, salaries and benefits 1,668 1,733 1,600 1,155 1,027
To government in taxation 397 462 404 233 298
To providers of capital on:
Interest on borrowings 125 134 155 225 189
Dividends to our partners in subsidiaries 175 266 83 77 27
Dividends to our shareholders 1,357 763 872 545 364
1,657 1,163 1,110 847 580
One-off financial penalty & related costs - - - - 619
Total Distribution 3,722 3,358 3,114 2,235 2,524
Balance retained in the business:
Depreciation & amortisation 242 265 220 236 212
Non-controlling interests share of profits in subsidiaries 376 276 (15) (39) (26)
Retained profit for the year 489 1,122 652 239 (147)
1,107 1,663 857 436 39
4,829 5,021 3,971 2,671 2,563
Number of employees 38,878 39,049 36,153 28,879 21,862
Productivity data:
Gross value added per employee ($’000) 95 98 81 82 83
Gross value added per dollar employment cost ($) 2.21 2.20 1.83 2.06 1.78
Gross value added per dollar sales ($) 0.30 0.29 0.28 0.35 0.31
One-off financial penalty and related cost 0 0 0 0 619
Depreciation & Retained Profit 1,107 1,663 857 436 39
Interest Expenses & Dividends 1,657 1,163 1,110 847 580
Taxation 397 462 404 233 298
Wages, Salaries & Benefits 1,668 1,733 1,600 1,155 1,027
0
1,000
2,000
3,000
4,000
5,000
20172016201520142013
3,971
4,829
($ million)
5,021
2,671 2,563
One-off financial penalty and related costs - - - - 619
Depreciation & Retained Profit 1,107 1,663 857 436 39
Interest Expenses & Dividends 1,657 1,163 1,110 847 580
Taxation 397 462 404 233 298
Wages, Salaries & Benefits 1,668 1,733 1,600 1,155 1,027

Keppel Corporation Limited | Report to Shareholders 2017
195
Share Performance
2013 2014 2015 2016 2017
Share Price ($) *Last transacted (Note 3) 11.19 8.85 6.51 5.79 7.35High 11.93 11.24 9.54 6.56 7.83Low 10.01 7.91 6.20 4.64 5.73Volume weighted average (Note 2) 10.87 10.01 7.92 5.46 6.79
Per ShareEarnings (cents) (Note 1) 102.3 103.8 84.0 43.2 11.9^Total distribution (cents) 49.5 48.0 34.0 20.0 22.00Distributionyield(%)(Note2) 4.6 4.8 4.3 3.7 3.2Net price earnings ratio (Note 2) 10.6 9.6 9.4 12.6 57.0Net assets backing ($) 5.32 5.70 6.07 6.34 6.21
At Year EndShare price ($) 11.19 8.85 6.51 5.79 7.35Distributionyield(%)(Note3) 4.4 5.4 5.2 3.5 3.0Net price earnings ratio (Note 3) 10.9 8.5 7.8 13.4 61.7Net price to book ratio (Note 3) 2.1 1.6 1.1 0.9 1.2
Notes: 1. EarningspersharearecalculatedbasedontheGroupnetprofitbyreferencetotheweightedaveragenumberofsharesinissueduringtheyear.2. Volumeweightedaveragesharepriceisusedincalculatingdistributionyieldandnetpriceearningsratio.3. Lasttransactedsharepriceisusedincalculatingdistributionyield,netpriceearningsratioandnetpricetobookratio.* Historical share prices are not adjusted for special dividends, capital distribution and dividend in specie.^ Includestheone-offfinancialpenaltyfromtheglobalresolutionandrelatedcostsof$619million .
2014 20162013
Turnover High and Low Prices
Turnover(million)
0
20
40
60
80
100
120
140
160
180
200
300
400
0
2
4
6
8
10
12
14
16
18
20
30
40
2015 2017
Share Prices($)

196
Other Information
Shareholding StatisticsAs at 5 March 2018
Issued and Fully paid-up capital (including Treasury Shares) : $1,291,720,897.98 Issued and Fully paid-up capital (excluding Treasury Shares) : $1,271,805,975.81 Number of Issued shares (including Treasury Shares) : 1,818,394,180 Number of Issued shares (excluding Treasury Shares) : 1,816,051,774 Number/PercentageofTreasuryShares : 2,342,406(0.13%) Number/Percentage of Subsidiary Holdings 1 : 0(0%) Class of Shares : Ordinary Shares Voting Rights (excluding Treasury Shares) : One Vote Per Share. The Company cannot exercise any voting rights in respect of treasury shares
Subject to the Companies Act, Chapter 50, subsidiaries cannot exercise any voting rights in respect of shares held by them as subsidiary holdings.
No. of No. ofSize of Shareholdings Shareholders % Shares %
1-99 155 0.23 5,166 0.00100-1,000 16,150 23.74 13,171,982 0.721,001-10,000 42,800 62.91 166,475,923 9.1710,001-1,000,000 8,900 13.08 270,204,384 14.881,000,001&Above 29 0.04 1,366,194,319 75.23
Total 68,034 100.00 1,816,051,774 100.00
No. ofTwenty Largest Shareholders Shares %
Temasek Holdings (Private) Limited 371,408,292 20.45Citibank Nominees Singapore Pte Ltd 337,189,662 18.57DBS Nominees Pte Ltd 204,205,679 11.24HSBC (Singapore) Nominees Pte Ltd 105,390,174 5.80United Overseas Bank Nominees Pte Ltd 91,335,967 5.03DBSN Services Pte Ltd 80,508,498 4.43Raffles Nominees (Pte) Ltd 50,055,361 2.75BPSS Nominees Singapore (Pte.) Ltd. 39,434,983 2.17DB Nominees (S) Pte Ltd 19,134,179 1.05OCBC Nominees Singapore Pte Ltd 11,957,711 0.66OCBC Securities Private Ltd 7,277,482 0.40Shanwood Development Pte Ltd 7,040,000 0.39UOB Kay Hian Pte Ltd 4,492,915 0.25Phillip Securities Pte Ltd 3,993,737 0.22Chen Chun Nan 3,618,100 0.20BNP Paribas Nominees Singapore Pte Ltd 3,234,394 0.18DBS Vickers Securities (S) Pte Ltd 3,035,770 0.17Maybank Kim Eng Securities Pte Ltd 2,856,473 0.16Societe Generale S’pore Branch 2,841,985 0.16Lim Chee Onn 2,569,282 0.14
Total 1,351,580,644 74.42
Substantial Shareholders (as shown in the Register of Substantial Shareholders)
Direct Interest Deemed Interest Total Interest No. of Shares % No. of Shares % No. of Shares %
Temasek Holdings (Private) Limited 2 371,408,292 20.45 655,258 0.03 372,063,550 20.48BlackRock, Inc 3 96,191,360 5.29 96,191,360 5.29The PNC Financial Services Group, Inc 4 96,202,088 5.29 96,202,088 5.29
Notes:1 ”Subsidiaryholdings”isdefinedintheListingManualtomeansharesreferredtoinSections21(4),21(4B),21(6A)and21(6C)oftheCompaniesAct,Chapter50.2 TemasekHoldings(Private)Limitedisdeemedinterestedin655,258sharesinwhichitssubsidiariesandassociatedcompanieshavedirectordeemedinterests.3 BlackRock,Incisdeemedtobeinterestedinanaggregateof96,191,360sharesheldthroughitsvarioussubsidiaries.4 ThePNCFinancialServicesGroup,Incisdeemedtobeinterestedinthe96,191,360sharesheldthroughBlackRock,Incthroughitsover20%ownershipofBlackRock,Inc.
aswellas10,728sharesrepresentedby5,364AmericanDepositoryReceiptsthroughotherentities.
Public ShareholdersBasedontheinformationavailabletotheCompanyasat5March2018,approximately79%oftheissuedsharesoftheCompanyisheldbythepublic and therefore, pursuant to Rules 723 and 1207 of the Listing Manual of the Singapore Exchange Securities Trading Limited, it is confirmed thatatleast10%oftheordinarysharesoftheCompanyisatalltimesheldbythepublic.

Keppel Corporation Limited | Report to Shareholders 2017
197
Notice of Annual General Meeting & Closure of Books
Keppel Corporation LimitedCompanyRegistrationNo.196800351N(Incorporated in the Republic of Singapore)
Corporationeppel
NOTICE IS HEREBY GIVEN that the 50th Annual General Meeting of the Company will be held at Level 3, Heliconia Main Ballroom, Sands Expo and Convention Centre, 10 Bayfront Avenue, Singapore 018956 on Friday, 20 April 2018 at 3.00 p.m. to transact the following business:
Ordinary Business
1. To receive and adopt the Directors’ Statement and Audited Financial Statements for the year ended 31 December 2017.
2. To declare a final tax-exempt (one-tier) dividend of 14.0 cents per share for the year ended 31 December 2017 (2016: final tax-exempt (one-tier) dividend of 12.0 cents per share).
3. To re-elect the following directors of the Company (“Directors”), each of whom will be retiring by rotation pursuant to Regulation 83 of the Constitution of the Company (“Constitution”) and who, being eligible, offers himself for re-election pursuant to Regulation 84 of the Constitution (see Note 3):
(i) Dr Lee Boon Yang
(ii) Mr Tan Puay Chiang
(iii) Ms Veronica Eng
4. To approve the sum of S$2,191,000 as Directors’ fees for the year ended 31 December 2017 (2016: S$2,020,948) (see Note 4).
5. To re-appoint PricewaterhouseCoopers LLP as the auditors of the Company, and authorise the Directors to fix their remuneration.
Special Business
To consider and, if thought fit, approve with or without any modifications, the following ordinary resolutions: 6. That pursuant to Section 161 of the Companies Act, Chapter 50 of Singapore (the “Companies Act”), authority be and
is hereby given to the Directors to:
(1) (a) issue shares in the capital of the Company (“Shares”), whether by way of rights, bonus or otherwise, and including any capitalisation of any sum for the time being standing to the credit of any of the Company’s reserve accounts or any sum standing to the credit of the profit and loss account or otherwise available for distribution; and/or
(b) make or grant offers, agreements or options that might or would require Shares to be issued (including but not limited to the creation and issue of (as well as adjustments to) warrants, debentures or other instruments convertible into Shares) (collectively “Instruments”),
at any time and upon such terms and conditions and for such purposes and to such persons as the Directors may in their absolute discretion deem fit; and
(2) (notwithstanding that the authority so conferred by this Resolution may have ceased to be in force) issue Shares in pursuance of any Instrument made or granted by the Directors while the authority was in force;
Resolution 1
Resolution 2
Resolution 3
Resolution 4
Resolution 5
Resolution 6
Resolution 7
Resolution 8

198
Other Information
Notice of Annual General Meeting & Closure of Books
provided that: (i) the aggregate number of Shares to be issued pursuant to this Resolution (including Shares to be issued in
pursuance of Instruments made or granted pursuant to this Resolution and any adjustment effected under any relevant Instrument) shall not exceed fifty (50) per cent. of the total number of issued Shares (excluding treasury Shares and subsidiary holdings) (as calculated in accordance with sub-paragraph (ii) below), of which the aggregate number of Shares to be issued other than on a pro rata basis to shareholders of the Company (including Shares to be issued in pursuance of Instruments made or granted pursuant to this Resolution and any adjustment effected under any relevant Instrument) shall not exceed five (5) per cent. of the total number of issued Shares (excluding treasury Shares and subsidiary holdings) (as calculated in accordance with sub-paragraph (ii) below);
(ii) (subject to such manner of calculation as may be prescribed by the Singapore Exchange Securities Trading Limited (“SGX-ST”)) for the purpose of determining the aggregate number of Shares that may be issued under sub-paragraph (i) above, the percentage of issued Shares shall be calculated based on the total number of issued Shares (excluding treasury Shares and subsidiary holdings) at the time this Resolution is passed, after adjusting for:
(a) new Shares arising from the conversion or exercise of convertible securities or share options or vesting of share awards which are outstanding or subsisting as at the time this Resolution is passed; and
(b) any subsequent bonus issue, consolidation or sub-division of Shares,
and in sub-paragraph (i) above and this sub-paragraph (ii), “subsidiary holdings” has the meaning given to it in the listing manual of the SGX-ST (“Listing Manual”);
(iii) in exercising the authority conferred by this Resolution, the Company shall comply with the provisions of the Companies Act, the Listing Manual (unless such compliance has been waived by the SGX-ST) and the Constitution for the time being in force; and
(iv) (unless revoked or varied by the Company in a general meeting) the authority conferred by this Resolution shall continue in force until the conclusion of the next annual general meeting of the Company or the date by which the next annual general meeting of the Company is required by law to be held, whichever is the earlier (see Note 5).
7. That:
(1) for the purposes of the Companies Act, the exercise by the Directors of all the powers of the Company to purchase or otherwise acquire Shares not exceeding in aggregate the Maximum Limit (as hereafter defined), at such price(s) as may be determined by the Directors from time to time up to the Maximum Price (as hereafter defined), whether by way of:
(a) market purchase(s) (each a “Market Purchase”) on the SGX-ST; and/or
(b) off-market purchase(s) (each an “Off-Market Purchase”) in accordance with any equal access scheme(s) as may be determined or formulated by the Directors as they consider fit, which scheme(s) shall satisfy all the conditions prescribed by the Companies Act;
and otherwise in accordance with all other laws and regulations, including but not limited to, the provisions of the Companies Act and the Listing Manual as may for the time being be applicable, be and is hereby authorised and approved generally and unconditionally (the “Share Purchase Mandate”);
(2) (unless varied or revoked by the members of the Company in a general meeting) the authority conferred on the Directors pursuant to the Share Purchase Mandate may be exercised by the Directors at any time and from time to time during the period commencing from the date of the passing of this Resolution and expiring on the earliest of:
(a) the date on which the next annual general meeting of the Company is held;
(b) the date on which the next annual general meeting of the Company is required by law to be held; or
(c) the date on which the purchases or acquisitions of Shares by the Company pursuant to the Share Purchase Mandate are carried out to the full extent mandated;
Resolution 9

Keppel Corporation Limited | Report to Shareholders 2017
199
(3) in this Resolution:
“Maximum Limit” means that number of issued Shares representing five (5) per cent. of the total number of issued Shares as at the date of the passing of this Resolution, unless the Company has at any time during the Relevant Period reduced its share capital by a special resolution under Section 78C of the Companies Act, or the court has, at any time during the Relevant Period (as hereinafter defined), made an order under Section 78I of the Companies Act confirming the reduction of share capital of the Company, in which event the total number of issued Shares shall be taken to be the total number of issued Shares as altered by the special resolution of the Company or the order of the court, as the case may be. Any Shares which are held as treasury shares and any subsidiary holdings will be disregarded for purposes of computing the five (5) per cent. limit;
“Relevant Period” means the period commencing from the date of the passing of this Resolution and expiring on the date the next annual general meeting is held or is required by law to be held, whichever is the earlier;
“subsidiary holdings” has the meaning given to it in the Listing Manual; and
“Maximum Price”, in relation to a Share to be purchased or acquired, means the purchase price (excluding brokerage, stamp duties, commission, applicable goods and services tax and other related expenses) which is:
(a) in the case of a Market Purchase, 105 per cent. of the Average Closing Price (as hereafter defined); and
(b) in the case of an Off-Market Purchase pursuant to an equal access scheme, 120 per cent. of the Average Closing Price,
where:
“Average Closing Price” means the average of the closing market prices of a Share over the last five (5) Market Days (a “Market Day” being a day on which the SGX-ST is open for trading in securities), on which transactions in the Shares were recorded, in the case of Market Purchases, before the day on which the purchase or acquisition of Shares was made and deemed to be adjusted for any corporate action that occurs after the relevant five (5) Market Days, or in the case of Off-Market Purchases, before the date on which the Company makes an offer for the purchase or acquisition of Shares from holders of Shares, stating therein the purchase price of each Share and the relevant terms of the equal access scheme for effecting the Off-Market Purchase; and
(4) the Directors and/or any of them be and are hereby authorised to complete and do all such acts and things (including without limitation, executing such documents as may be required) as they and/or he may consider necessary, expedient, incidental or in the interests of the Company to give effect to the transactions contemplated and/or authorised by this Resolution (see Note 6).
8. That:
(1) approval be and is hereby given, for the purposes of Chapter 9 of the Listing Manual, for the Company, its subsidiaries and target associated companies (as defined in Appendix 2 to this Notice of Annual General Meeting (“Appendix 2”)), or any of them, to enter into any of the transactions falling within the types of Interested Person Transactions described in Appendix 2, with any person who falls within the classes of Interested Persons described in Appendix 2, provided that such transactions are made on normal commercial terms and in accordance with the review procedures for Interested Person Transactions as set out in Appendix 2 (the “IPT Mandate”);
(2) the IPT Mandate shall, unless revoked or varied by the Company in general meeting, continue in force until the date that the next annual general meeting is held or is required by law to be held, whichever is the earlier;
(3) the Audit Committee of the Company be and is hereby authorised to take such action as it deems proper in respect of such procedures and/or to modify or implement such procedures as may be necessary to take into consideration any amendment to Chapter 9 of the Listing Manual which may be prescribed by the SGX-ST from time to time; and
(4) the Directors and/or any of them be and are hereby authorised to complete and do all such acts and things (including, without limitation, executing such documents as may be required) as they and/or he may consider necessary, expedient, incidental or in the interests of the Company to give effect to the IPT Mandate and/or this Resolution (see Note 7).
To transact such other business which can be transacted at the annual general meeting of the Company.
Resolution 10

200
Other Information
Notice of Annual General Meeting & Closure of Books
NOTICE IS ALSO HEREBY GIVEN THAT:
(a) the Share Transfer Books and the Register of Members of the Company will be closed on 27 April 2018 at 5.00 p.m., for the preparation of dividend warrants. Duly completed transfers of Shares received by the Company’s Share Registrar, B.A.C.S. Private Limited, at 8 Robinson Road, #03-00 ASO Building, Singapore 048544 up to 5.00 p.m. on 27 April 2018 will be registered to determine shareholders’ entitlement to the proposed final dividend. Shareholders whose securities accounts with The Central Depository (Pte) Limited are credited with Shares as at 5.00 p.m. on 27 April 2018 will be entitled to the proposed final dividend. The proposed final dividend if approved at this annual general meeting will be paid on 10 May 2018; and
(b) the electronic copy of the Company’s Annual Report 2017 will be published on the Company’s website on 29 March 2018. The Company’s website address is http://www.kepcorp.com, and the electronic copy of the Annual Report 2017 can be viewed or downloaded from the annual report microsite at www.kepcorp.com/annualreport2017/. To download the electronic copy of the Annual Report 2017, click on the link at the top right hand corner of the microsite webpage. You will need an internet browser and PDF reader to view the document.
BY ORDER OF THE BOARD
Caroline Chang/Leon NgCompany Secretaries
Singapore, 29 March 2018

Keppel Corporation Limited | Report to Shareholders 2017
201
Notes:1. AmemberoftheCompanyentitledtoattendandvoteatameetingoftheCompany,andwhoisnotaRelevantIntermediaryisentitledtoappointoneproxyortwoproxies
to attend and vote in his place. A member of the Company who is a Relevant Intermediary is entitled to appoint more than two proxies to attend and vote in his place, but each proxy must be appointed to exercise the rights attached to a different Share or Shares held by such member. A proxy need not be a member of the Company.
“RelevantIntermediary”hasthemeaningascribedtoitinSection181oftheCompaniesAct.
2. TheinstrumentappointingaproxymustbedepositedattheregisteredofficeoftheCompanyat1HarbourFrontAvenue,#18-01KeppelBayTower,Singapore098632,notlessthan72hoursbeforethetimeappointedforholdingtheannualgeneralmeeting.InthecaseofmembersoftheCompanywhoseSharesareenteredagainsttheirnames in the Depository Register, the Company may reject any instrument appointing a proxy or proxies lodged if such members are not shown to have Shares entered againsttheirnamesintheDepositoryRegisterasat72hoursbeforethetimeappointedforholdingtheannualgeneralmeetingascertifiedbyTheCentralDepository(Pte) Limited to the Company.
3. Detailedinformationonthesedirectorscanbefoundinthe“BoardofDirectors”sectionoftheCompany’sAnnualReportforthefinancialyearended31December2017(“AnnualReport2017”).
Dr Lee Boon Yang will, upon his re-election, continue to serve as the Chairman of the Board and as a member of the Nominating, Remuneration and Board Safety Committees. Dr Lee was formerly Minister for Information, Communications and the Arts, and Member of Parliament. He stood as a candidate in the Singapore General Electionsin1984andwontheJalanBesarparliamentaryseat,whichheheldforsixconsecutivetermstillhisretirementin2011.HeiscurrentlyalsotheChairmanoftheboards of Singapore Press Holdings Limited, Singapore Press Holdings Foundation Limited and Keppel Care Foundation Limited.
Mr Tan Puay Chiang will, upon his re-election, continue to serve as the Chairman of the Nominating Committee, and as a member of the Board Safety and Board RiskCommittees.MrTanwas formerlyChairman,ExxonMobil (China) InvestmentCo.Duringhis37-yearcareerwithMobiland laterExxonMobil,heheldexecutivemanagement roles in Australia, Singapore and the United States. These included the executive positions of Vice-President, Mobil Research & Technology Corp, United States; and Chairman of Mobil Oil Australia. He is a member of the board of Singapore Power Limited and is also the Chairman of the board of SP Services Limited.
Ms Veronica Eng will, upon her re-election, continue to serve as the Chairman of the Board Risk Committee and as a member of the Audit Committee. Ms Eng retired asaFoundingPartnerofPermirainlate2015.Overher30-yearcareerwithPermira,MsEngheldanumberofkeypositionsinthefirmandhadextensiveexperiencein a wide range of roles in relation to its funds’ investments across sectors and geographies. She served on the board of Permira and its Executive Committee, chaired the Investment Committee and was the Fund Minder to various Permira funds. In addition, she also had oversight of Permira’s firm-wide risk management as well as its operations in Asia. Ms Eng sits on the Board of the Centre for Asset Management Research & Investments at National University of Singapore’s Business School, and is a member of Singapore’s Diversity Action Committee. She is also a Professor (Practice) at the National University of Singapore’s Business School.
DrLeeBoonYang,MrTanPuayChiangandMsVeronicaEngareconsideredbytheboardofDirectorstobeindependentDirectors.Pleaseseepages20and23oftheAnnualReport2017.
4. Resolution6istoapprovethepaymentofanaggregatesumofS$2,191,000asDirectors’feesforthenon-executiveDirectorsoftheCompanyforFY2017.Thisislowerthanthetotalfeesforthenon-executivedirectorsforFY2016(beforethevoluntary10%reductionintheirtotalfeesforFY2016).
Ifapproved,eachofthenon-executiveDirectors(includingtheChairman)willreceive70%ofhis/hertotalDirectors’feesincash(“CashComponent”)and30%intheformof Shares (“Remuneration Shares”) (both amounts subject to adjustment as described below). The actual number of Remuneration Shares, to be purchased from the market on the first trading day immediately after the date of the annual general meeting (“Trading Day”) for delivery to the respective non-executive Directors, will be based on the market price of the Company’s shares on the SGX-ST on the Trading Day. The actual number of Remuneration Shares will be rounded down to the nearest thousand and any residual balance will be paid in cash.
The Remuneration Shares will rank pari passuwiththethenexistingissuedShares.DetailsoftheDirectors’remunerationcanbefoundonpage71oftheAnnualReport2017.Thenon-executiveDirectorswillabstainfromvoting,andwillprocurethattheirrespectiveassociatesabstainfromvoting,inrespectofthisResolution.
5. Resolution8istoempowertheDirectorsfromthedateofthisannualgeneralmeetinguntilthedateofthenextannualgeneralmeetingtoissueSharesandInstrumentsin
theCompany,uptoanumbernotexceeding50percent.ofthetotalnumberofShares(excludingtreasurysharesandsubsidiaryholdings)(withasub-limitof5percent.of the total number of Shares (excluding treasury shares and subsidiary holdings) in respect of Shares to be issued other than on a pro ratabasistoshareholders).The5percent. sub-limit for non-pro rataissuesislowerthanthe20percent.sub-limitallowedundertheListingManual.Ofthe5percent.sub-limit,inrelationtotheCompany’sRestricted Share Plan and Performance Share Plan (collectively, the “Share Plans”), the Company shall not award Shares (“Awards”) under the Share Plans exceeding in aggregate2percent.ofthetotalnumberofissuedShares(“YearlyLimit”).However,iftheYearlyLimitisnotfullyutilisedinanygivenyear,thebalanceoftheunutilisedYearly Limit may be used by the Company to make grants of Awards in subsequent years. For the purpose of determining the total number of Shares (excluding treasury shares and subsidiary holdings) that may be issued, the percentage of issued Shares shall be based on the total number of issued Shares (excluding treasury shares and subsidiary holdings) at the time that this Resolution is passed, after adjusting for new Shares arising from the conversion or exercise of any convertible securities or share optionsorvestingofshareawardswhichareoutstandingorsubsistingatthetimethatResolution8ispassed,andanysubsequentbonusissue,consolidationorsub-division of Shares.
6. Resolution9relatestotherenewaloftheSharePurchaseMandatewhichwasoriginallyapprovedbyShareholderson18February2000andwaslastrenewedattheannualgeneralmeetingoftheCompanyon21April2017.Atthisannualgeneralmeeting,theCompanyisseekingalower“MaximumLimit”of5percent.ofthetotalnumberofissuedShares,whichislowerthanthe10percent.limitallowedundertheListingManual.PleaserefertoAppendix1tothisNoticeofAnnualGeneralMeetingfor details.
7. Resolution10relatestotherenewalofamandategivenbyShareholderson22May2003allowingtheCompany,itssubsidiariesandtargetassociatedcompaniestoenterintotransactionswithinterestedpersonsasdefinedinChapter9oftheListingManual.PleaserefertoAppendix2tothisNoticeofAnnualGeneralMeetingfordetails.
8. Personal Data Privacy: By submitting an instrument appointing proxy or proxies, and/or representative(s) to attend, speak and vote at the annual general meeting and/or any adjournment
thereof, a member (i) consents to the collection, use and disclosure of the member’s personal data by the Company (or its agents or service providers) for the purpose of the processing, administration and analysis by the Company (or its agents or service providers) of proxies and representatives appointed for the annual general meeting (including any adjournment thereof), and in order for the Company (or its agents or service providers) to comply with any applicable laws, listing rules, regulations and/or guidelines (collectively, the “Purposes”), and (ii) warrants that where the member discloses the personal data of the member’s proxy(ies) and/or representative(s) to the Company (or its agents or service providers), the member has obtained the prior consent of such proxy(ies) and//or representative(s) for the collection, use and disclosure of such individual’s personal data for the Purposes.

202
Other Information
Corporate Information
Board of DirectorsLee Boon Yang (Chairman)Loh Chin Hua (Chief Executive Officer)Tow Heng TanAlvin Yeo Khirn HaiTan Ek KiaDanny TeohTan Puay ChiangTill VestringVeronica Eng
Audit CommitteeDanny Teoh (Chairman)Alvin Yeo Khirn HaiVeronica EngTan Ek Kia
Remuneration CommitteeTill Vestring (Chairman)Lee Boon YangDanny TeohTow Heng Tan
Nominating CommitteeTan Puay Chiang (Chairman)Lee Boon YangTow Heng TanAlvin YeoTill Vestring
Board Risk CommitteeVeronica Eng (Chairman)Tow Heng TanDanny Teoh Tan Puay ChiangTan Ek Kia
Board Safety CommitteeTan Ek Kia (Chairman)Lee Boon YangLoh Chin HuaTan Puay Chiang
Company SecretariesCaroline ChangLeon Ng
Registered Office1 HarbourFront Avenue#18-01 Keppel Bay TowerSingapore 098632Telephone: (65) 6270 6666Facsimile No.: (65) 6413 6391Email: [email protected]: www.kepcorp.com
Share RegistrarB.A.C.S. Private Limited8 Robinson Road#03-00 ASO BuildingSingapore 048544
AuditorsPricewaterhouseCoopers LLP7 Straits View Marina One East TowerLevel 12Singapore 018936Audit Partner: Sim Hwee CherYear appointed: 2016
Keppel Corporation Limited | Report to Shareholders 2017
203
Financial Calendar
FY 2017
Financial year-end 31 December 2017 Announcement of 2017 1Q results 20 April 2017 Announcement of 2017 2Q results 20 July 2017 Announcement of 2017 3Q results 19 October 2017 Announcement of 2017 full year results 25 January 2018
Despatch of Annual Report to Shareholders 29 March 2018
Annual General Meeting 20 April 2018
2017 Proposed final dividend Books closure date 5.00 p.m., 27 April 2018 Payment date 10 May 2018
FY 2018
Financial year-end 31 December 2018 Announcement of 2018 1Q results April 2018 Announcement of 2018 2Q results July 2018 Announcement of 2018 3Q results October 2018 Announcement of 2018 full year results January 2019

This page is intentionally left blank.

Proxy Form
I/We, (Name) (NRIC/Passport/UEN Number)
of (Address)
being a member or members of KEPPEL CORPORATION LIMITED (the “Company”) hereby appoint:
Name AddressNRIC/
Passport Number
Proportion of Shareholdings(Ordinary Shares)
No. of Shares %
and/or (delete as appropriate)
Name AddressNRIC/
Passport Number
Proportion of Shareholdings(Ordinary Shares)
No. of Shares %
as my/our proxy/proxies to attend, speak and vote for me/us on my/our behalf at the Annual General Meeting of the Company (“AGM”) to be held on Friday, 20 April 2018 at Level 3, Heliconia Main Ballroom, Sands Expo and Convention Centre, 10 Bayfront Avenue, Singapore 018956 at 3.00 p.m. and at any adjournment thereof. I/We direct my/our proxy/proxies to vote for or against the resolutions to be proposed at the meeting as indicated hereunder. If no specific direction as to voting is given, the proxy/proxies will vote or abstain from voting at his/their discretion, as he/they will on any other matter arising at the meeting and at any adjournment thereof.
Resolutions Number of Votes For *
Number of Votes Against *
Ordinary Business
1. Adoption of Directors’ Statement and Audited Financial Statements
2. Declaration of Dividend3. Re-election of Dr Lee Boon Yang as Director
4. Re-election of Mr Tan Puay Chiang as Director
5. Re-election of Ms Veronica Eng as Director
6. Approval of fees to non-executive Directors
7. Re-appointment of Auditors
Special Business
8. Authority to issue shares and convertible instruments
9. Renewal of Share Purchase Mandate
10. Renewal of Shareholders’ Mandate for Interested Person Transactions
* If you wish to exercise all your votes “For” or “Against” the relevant Resolution, please tick (“4”) within the relevant box provided. Alternatively, if you wish to exercise your votes for both “For” and “Against” the relevant Resolution, please indicate the number of Shares in the boxes provided.
Dated this day of 2018
Signature(s) or Common Seal of Member(s)
IMPORTANT: Please read the notes overleaf before completing this Proxy Form.
Glue all sides firmly. Stapling and spot sealing are disallowed.
Glu
e all sides firm
ly. Staplin
g and sp
ot sealin
g are disallo
wed
.
Total Number of Shares held
ANNUAL GENERAL MEETING
IMPORTANT1. Relevant Intermediaries (asdefined in Section181of theCompaniesAct,
Chapter50ofSingapore),mayappointmorethantwoproxiestoattendandvote at the Annual General Meeting.
2. ForCPF/SRSinvestorswhohaveusedtheirCPF/SRSmoniestobuyordinaryshares in the capital of Keppel Corporation Limited (“Shares”), this report is forwarded to them at the request of their Agent Banks/SRS Operators and is sent solely FOR INFORMATION ONLY.
3. This Proxy Form is not valid for use by CPF/SRS investors and shall beineffective for all intents and purposes if used or purported to be used by them.
4. ACPF/SRS investorwhowishes toattend theAnnualGeneralMeetingasproxy has to submit his request to his Agent Bank/SRS Operator so that his Agent Bank/SRS Operator may appoint him as its proxy within the specified timeframe.(AgentBanks/SRSOperators:PleaserefertoNotes2(b)and4onthe reverse side of this form on the required details.)
Personal Data PrivacyBy submitting an instrument appointing proxy or proxies and/or representative(s), a member of the Company accepts and agrees to the personal data privacy terms setoutintheNoticeofAnnualGeneralMeetingdated29March2018.
Keppel Corporation LimitedCompanyRegistrationNo.196800351N(Incorporated in the Republic of Singapore)
Glu
e al
l sid
es f
irm
ly. S
tap
ling
and
spo
t sea
ling
are
dis
allo
wed
.
Corporationeppel
Notes:1. PleaseinsertthetotalnumberofSharesheldbyyou.IfyouonlyhaveSharesenteredagainstyournameintheDepositoryRegister(asdefinedinPartIIIAAofthe
SecuritiesandFuturesAct,Chapter289ofSingapore),youshouldinsertthatnumberofShares.IfyouonlyhaveSharesregisteredinyournameintheRegisterofMembers, you should insert that number of Shares. However, if you have Shares entered against your name in the Depository Register and Shares registered in your name in the Register of Members, you should insert the aggregate number of Shares entered against your name in the Depository Register and registered in your name in the Register of Members. If no number is inserted, the proxy form shall be deemed to relate to all the Shares held by you (in both the Register of Members and the Depository Register).
2. (a) AmemberoftheCompanyentitledtoattendandvoteatameetingoftheCompany,andwhoisnotaRelevantIntermediary,isentitledtoappointoneortwo proxies to attend and vote instead of him. A proxy need not be a member of the Company. Where a member of the Company appoints two proxies, the proportion of the shareholding concerned to be represented by each proxy shall be specified in the proxy form. If no percentage is specified, the first named proxyshallbedeemedtorepresent100percentoftheshareholdingandthesecondnamedproxyshallbedeemedtobeanalternatetothefirstnamedproxy.
(b) A member of the Company who is a Relevant Intermediary is entitled to appoint more than two proxies to attend and vote at a meeting of the Company, but each proxy must be appointed to exercise the rights attached to a different Share or Shares held by such member. Where more than one proxy is appointed, the number and class of shares in relation to which each proxy has been appointed shall be specified in the proxy form. In relation to a Relevant Intermediary who wishes to appoint more than two proxies, it should annex to the proxy form the list of proxies, setting out, in respect of each proxy, the name, address, NRIC/Passport Number and proportion of shareholding (number of shares, class of shares and percentage) in relation to which the proxy has been appointed. For the avoidance of doubt, Agent Bank/SRS Operator who intends to appoint CPF/SRS investors as its proxies shall comply with this Note.
(c)“RelevantIntermediary”hasthemeaningascribedtoitinSection181oftheCompaniesAct,Chapter50ofSingapore(“CompaniesAct”).
The Company SecretaryKeppel Corporation Limited
1 HarbourFront Avenue#18-01 Keppel Bay Tower
Singapore 098632
-
3. Completionandreturnoftheproxyformshallnotprecludeamemberfromattendingandvotinginpersonatthemeeting.Anyappointmentofaproxyorproxieswill be revoked if a member attends the meeting in person, and in such event, the Company reserves the right to refuse to admit any person or persons appointed under the proxy form, to the meeting.
4. TheproxyformmustbedepositedattheregisteredofficeoftheCompanyat1HarbourFrontAvenue,#18-01KeppelBayTower,Singapore098632,notlessthan72hours before the time appointed for the Annual General Meeting.
5. Theproxyformappointingaproxyorproxiesmustbeunderthehandoftheappointororofhisattorneydulyauthorisedinwriting.Wheretheproxyformisexecutedby a corporation, it must be executed either under its seal or under the hand of an officer or attorney duly authorised in writing. Where a proxy form is signed on behalf of the appointor by an attorney, the power of attorney or other authority or a duly certified copy thereof must (failing previous registration with the Company) be lodged with the proxy form, failing which the proxy form may be treated as invalid.
6. AcorporationwhichisamemberoftheCompanymayauthorise,byresolutionofitsdirectorsorothergoverningbody,suchpersonasitthinksfittoactasitsrepresentativeattheAnnualGeneralMeeting,inaccordancewithSection179oftheCompaniesAct.
7. TheCompanyshallbeentitledtorejecttheproxyformappointingaproxyorproxiesifitisincomplete,improperlycompletedorillegibleorwherethetrueintentions
of the appointor are not ascertainable from the instructions of the appointor specified in the proxy form (including any related attachment) appointing a proxy or proxies. In addition, in the case of members of the Company whose Shares are entered against their names in the Depository Register, the Company shall be entitled torejectanyproxyformlodgedifsuchmembersarenotshowntohaveSharesenteredagainsttheirnamesintheDepositoryRegisterasat72hoursbeforethetimeappointed for holding the Annual General Meeting as certified by The Central Depository (Pte) Limited to the Company.
Foldalongthisline(1)
Foldalongthisline(2)
Affix
Postage
Stamp

Notes

Notes

Edited and Compiled byGroup Corporate Communications, Keppel Corporation
Designed bySedgwick Richardson

Keppel Corporation Limited(Incorporated in the Republic of Singapore)1 HarbourFront Avenue#18-01 Keppel Bay TowerSingapore 098632
Tel: (65) 6270 6666Fax: (65) 6413 6391Email: [email protected]
Co Reg No: 196800351N
Solu
tion
s for Su
stainab
le Urb
anisatio
nK
epp
el Co
rpo
ration
Limited
R
epo
rt to Sh
areho
lders 20
17