Soliton staircases and standing strain waves in confined colloidal crystals
22
1 Soliton Staircases and Standing Strain Waves in Confined Colloidal Crystals Yu-Hang Chui 1* , Surajit Sengupta 2 and Kurt Binder 1 1 Institute of Physics, Johannes-Gutenberg University D-55099 Mainz, Staudinger Weg 7, Germany 2 S.N. Bose National Centre for Basic Sciences, Block JD, Sector III, Salt Lake, Kolkata 70098, India * Corresponding author, email address: [email protected] PACS 82.70.Dd Colloids PACS 05.10.Ln Monte Carlo methods PACS 68.55.-a Thin Film Structure and Morphology
-
Upload
independent -
Category
Documents
-
view
2 -
download
0
Transcript of Soliton staircases and standing strain waves in confined colloidal crystals
1
Soliton Staircases and Standing Strain Waves in Confined
Colloidal Crystals
Yu-Hang Chui1*, Surajit Sengupta2 and Kurt Binder1
1 Institute of Physics, Johannes-Gutenberg University
D-55099 Mainz, Staudinger Weg 7, Germany
2 S.N. Bose National Centre for Basic Sciences, Block JD, Sector III,
Salt Lake, Kolkata 70098, India
* Corresponding author, email address: [email protected]
PACS 82.70.Dd Colloids
PACS 05.10.Ln Monte Carlo methods
PACS 68.55.-a Thin Film Structure and Morphology
2
Abstract
We show by computer simulation of a two-dimensional crystal confined by
corrugated walls that confinement can be used to impose a controllable mesoscopic
superstructure of predominantly mechanical elastic character. Due to an interplay of
the particle density of the system and the width D of the confining channel, ``soliton
staircases'' can be created along both parallel confining boundaries, that give rise to
standing strain waves in the entire crystal. The periodicity of these waves is of the
same order as D. This mechanism should be useful for structure formation in the
self-assembly of various nanoscopic materials.
3
Introduction
Colloidal particles and their self-assembly can be influenced by laser fields [1],
confinement in photolithographically fabricated channels [2], and various other
external fields [3]. Also the interparticle interaction is controllable (e.g. in
magneto-rheological fluids via a magnetic field [4]). Due to their visibility in optical
microscopes where confocal microscopy allows the tracking of individual particles in
real time [5] colloidal particles and the crystals they form are ideal model systems for
basic studies in the physics of condensed matter and materials science [6,7]. Such
systems have widespread applications, e.g. efficient DNA separation [8].
Thus the present work also deals with a model [9] for a confined colloidal crystal in
two dimensions, for which we consider the case of increasing misfit between the
distance between the two corrugated walls and the lattice structure that the system
would adopt at the chosen density in a stress-free crystal. With increasing misfit (i.e.
strain) we observe that the stress increases up to some critical value, where a
transition occurs that reduces the number of crystalline rows parallel to the boundaries
by one. At constant density, the extra particles of the row that disappears are
distributed in the system such that along the walls a ``soliton staircase'' [10] is created,
accompanied by a pattern of standing strain waves in the crystal.

4
This new type of mesophase is reminiscent of charge density waves [11] or spin
density waves in crystals [10]. Here we demonstrate a mechanical analog of a
predominantly elastic character. Although we consider here such mesoscopic
superstructures only for colloidal systems explicitly we expect that our findings
should have a much wider applicability: related phenomena could occur for dusty
plasmas [12], lattices of spherical block copolymer micelles under confinement [13],
superstructures of small molecules or atoms adsorbed on stepped surfaces [14], etc.
Boundary-induced strain fields are a commonly observed phenomenon, e.g. for
quantum dot superlattices [15], lattice mismatched fused GaAs/InP wafers [16],
GexSi(1-x)/Si heterostructures [17] and rotationally misaligned Si wafers covalently
bonded together [18]. In the last case, a careful X-ray analysis did reveal a periodic
displacement pattern, qualitatively similar to the findings we shall report below.
However, while the experimental observation of strain distributions on atomic scales
(via electron microscopy or x-ray scattering) is difficult, elastic distortions and lattice
defects can be very nicely visualized in colloidal crystals [19].
Model and simulation protocol
We describe the colloidal particles as point particles interacting with a potential V(r)
= ε(σ / r )12, where ε sets the energy scale and r denotes the interparticle distance. As
5
is well known, at low enough temperatures T this system forms a crystal with a
triangular lattice structure, where the lattice parameter a is related to the chosen
density ρ via a2 = 2/( 3 ρ). Of course, for such systems with inverse power law
potentials, T and ρ are not independent control parameters, in our case it is only the
combination ρ(ε / kBT)1/6 that matters [20]. Thus, choosing length units such that ρ =
1.05 one finds that the (presumably continuous) melting transition of the crystal
occurs at [21] kBTm / ε ≈ 1.35. In the present work, however, we are not concerned
with the melting behavior of the system, and shall consider only temperatures kBT / ε
= 1 or below. Note that due to the finite width D of the confined crystals that we
consider the melting transition is strongly smeared out (already in the fluid phase
surface-induced crystalline layers occur close to the walls [9]).
We here use a 1/r12 potential rather than the experimentally realizable [22] 1/ r3
potential since we expect that the qualitative character of the phenomena under study
is independent of the range of the potential, and moreover the present faster decaying
potential is computationally much more convenient. Furthermore the present choice
has been used in related earlier work [9, 21].
Following Ricci et al. [9], we create a confinement potential commensurate with this

6
lattice structure by putting two rows of frozen particle at either side of the crystal,
which in our case has nx rows containing ny particles each, so that the crystal in the
case where there is no misfit has the linear dimensions Ly = nya and D = nxa 3 /2.
However, choosing a smaller distance between the frozen rows on both sides of this
crystalline strip we can enforce a misfit, such that D = (nx-∆)a 3 /2.
Choosing nx = 30, ny = 108 (and periodic boundary conditions in the y-direction
parallel to the walls) we first choose the positions of the wall atoms such that ∆ = 0,
with an initial condition of a perfect triangular lattice structure, and equilibrate the
system at kBT / ε = 1 by standard Monte Carlo methods [23]. Then we move the rows
with the wall atoms closer to each other, in order to create a misfit with ∆= 0.25,
re-equilibrate the system (typical equilibration times were of the order of 8 million
Monte Carlo steps per particle), increase the misfit to ∆ = 0.5, and so forth. Recording
the stress σ = σyy - σxx [24] from the computation of the virial tensor [20] we observe
an almost linear increase up to a maximum value which is reached at ∆= 2.0, where
an abrupt first-order like transition to a slightly negative value of σ is observed (Fig.
1). Further increase of ∆ leads to an increase of σ again.
Examination of the structure reveals that this sudden decrease of σ is caused by a
7
transition in the number of rows, nx → nx-1. Since the particle number in our
simulation is conserved, the ny extra particles of the row that has disappeared need to
be redistributed in the system. These extra particles are not distributed at random,
however, but in an almost regular way, giving rise to an almost periodic stress (and
strain) pattern, see Fig. 2a.
Since both boundaries of the system are fully equivalent, one would expect that at
both walls the deformation pattern is the same (apart form a translation in y direction).
This, however, is not the case. We interpret this lack of symmetry by the problem that
the defects that the extra particles cause in the original triangular lattice structure
leads to the creation of many metastable states with similar (free) energies, which are
only slightly higher than the true free energy minimum.
Thus we have attempted to guess the optimal structure by distributing an equal
number of excess atoms, namely nd = ny/(nx -3), (= 4 for the present choice of nx and
ny) into each of the available nx-3 rows, at randomly chosen positions in these rows,
and then carefully equilibrate the system. Note that we observe (Fig. 2a) that the rows
adjacent to the rows of fixed particles forming the boundaries stay free from excess
particles, and thus still contain ny particles commensurate with the corrugation of the
8
``walls'', while all the nx-3 inner rows then contain ny + nd particles.
Indeed such a preparation of the systems leads to more regular pattern of local stresses
and strains, in the form of standing waves (Fig. 2b). When we reduce ∆ we find that
this structure makes the inverse transition nx-1 → nx at about ∆ = 1.5, indicative of
some hysteresis, always to be expected for discontinuous transitions. However, on
further reduction of ∆ the data for σ in the commensurate state with nx = 30 rows are
reproduced, within statistical errors, irrespective on the starting condition. In contrast,
the parts of the curves for ∆ ≥ 2 do not agree with each other, since the system that is
incommensurate with the corrugated walls is easily locked into metastable states.
However, we have tried various other ways of distributing excess particles (leaving
two rows adjacent to the walls free of them, etc.), but we did not find stable states in
this way, giving a strong hint that with the structure of Fig. 2b the free energy
minimum has been correctly guessed.
Soliton staircases and their characterization
In order to study the structure of the incommensurate strip in more detail, Fig. 3
presents superimposed snapshot positions of the particles. The size of the
superimposed irregular black dots thus shows roughly the typical mean square
9
displacement of the particles. One can see that less displacement occurs in the rows
adjacent to the row of fixed particles, and the arrangement of the particles is
commensurate with the boundary. In the next rows, however, there are regions
where the particles are in well-defined positions compatible with the commensurate
row, while in between there are regions where the particle positions are almost fully
smeared out along the y-direction. These regions represent solitons, where an extra
particle needs to be accommodated, Fig.3b, and these solitons form a regular lattice in
the y-direction. However, unlike standard solitons considered in the literature [25],
these defects are spread out also in the x-direction perpendicular to the walls, and
hence are not strictly one-dimensional objects.
Fig.4a shows that the strain density wave pattern is maintained when one considers
lower temperatures, and Fig.4b shows that indeed the wavelength of the pattern is
controlled by the thickness D of the strip: for nx =20 the rule that nd = ny/( nx -3) = ny
/17 yields nd =6 for ny =102, and indeed 6 solitons can be identified at each boundary.
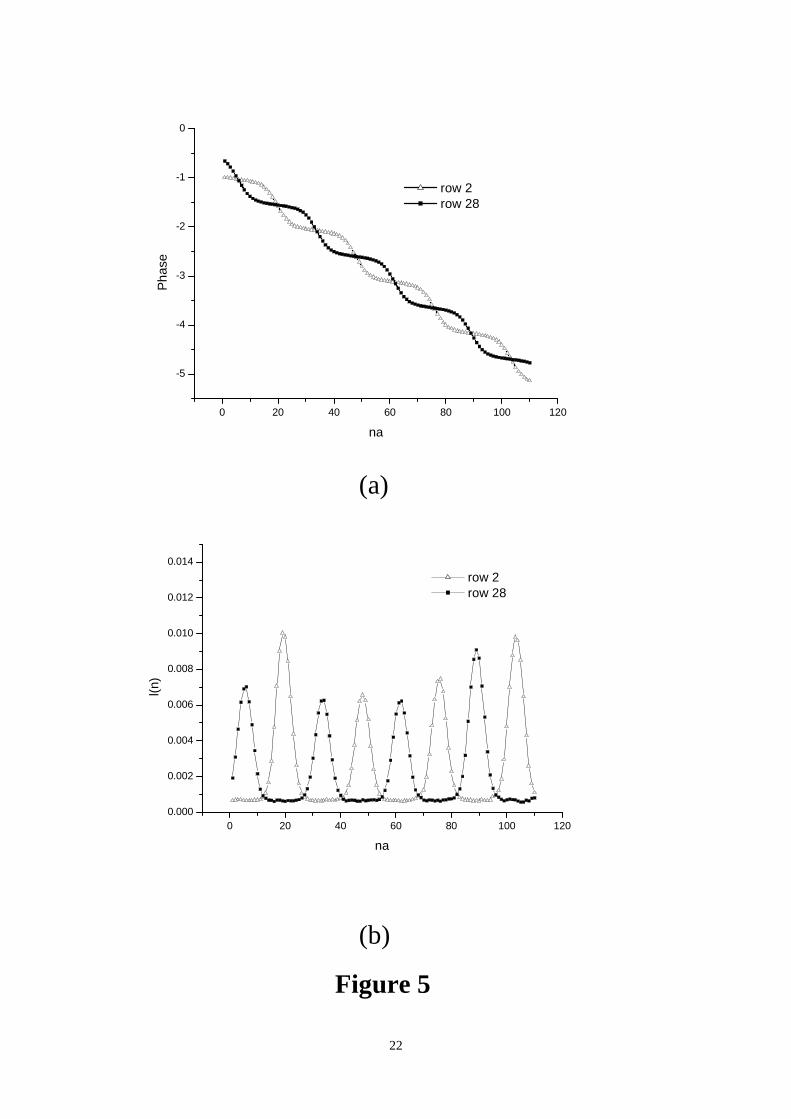
Finally, Fig.5 characterizes the soliton staircase in terms of the displacement variable
of the particles in a row from their original lattice position and their local fluctuations.
The periodicity expected for a soliton staircase indeed is rather well developed.
Choosing analogous data for rows further inward the picture is qualitatively similar,

10
but the amplitude of the periodic variation is smaller.
While in the state where the transition nx → nx-1 has not yet occurred a crystalline
structure commensurate with the wall potential occurs, and hence long range order is
enforced by the boundaries even for Ly → ∞, this is not so for the incommensurate
phase with the soliton lattices at the walls. Thus we expect that for Ly → ∞ the soliton
“lattice” is not strictly periodic, since the mean square displacements between
subsequent solitons will increase linearly with the distance between the solitons in the
thermodynamic limits at nonzero temperature. For finite Ly, however, the periodic
boundary condition enforces a periodic soliton arrangement, on average (but this
lattice then is not strictly pinned but can diffuse along the strip as a whole, due to
translational invariance. On the time-scale of the Monte Carlo simulation at T = 0.1,
we have not observed a significant diffusion of this type, however).
Thus understanding qualitative aspects of the soliton lattice (such unstable widths of
the peaks in Fig. 5b) is a subtle matter: we hope to analyze this issue in a more
detailed publication. Note, however, that real systems are finite also in the y-direction,
and may also have some confining walls rather than a periodic boundary condition, so
this lack of order for Ly → ∞ may be a somewhat academic question.

11
Of course, the fact that the boundary potential in our model is so strong that the rows
k=1 and k= nx -1 that are immediately adjacent to the fixed particles defining the
boundaries stay commensurate is an unimportant detail of our model. It is clear that in
the physical realizations of confinement of colloidal crystals e.g. via laser fields or
other experimental means providing particle confinement such features need not carry
over. Thus, the precise relation between the period ℓ of the soliton staircases and the
confining width D will be somewhat model-dependent, but we believe that the general
mechanism of boundary-induced periodic strain patterns demonstrated here should be
widely applicable.
Concluding remarks
By simulations of a generic model we have discovered a new state of matter where
due to confining boundaries in a two-dimensional crystalline strip a long-wavelength
periodic strain field pattern is realized, the case of the elastic distortions being given
by the steps of the soliton staircase close to the boundaries. Of course, it has been well
known that confining a two-dimensional crystal between two parallel boundaries a
distance D apart invariably creates some misfit, except for ``magic numbers'' of D
where the misfit is zero. For small nx such situations have been studied in the

12
literature [24,26,27,28,29]. However, the new feature of the present work is the study
of long-wavelength boundary-induced superstructures that occur when nx is large. We
have described these super-structures as standing strain waves caused by the soliton
lattices that form along the boundaries.
We expect that closely related phenomena are experimentally realizable not only in
colloidal crystals and various other soft matter systems, but also for epitaxial growth
on striped crystalline substrates, semiconductor heterostructures, and fused wafers.
Our findings may provide interesting perspectives to the field of strain engineering
[30,31,32,33] for different potential applications.
Acknowledgements
This research was partially supported by the Deutsche Forschungsgemeinschaft,
Project TR6/C4. We are grateful to P. Nielaba, A. Ricci and I. Snook for very useful
interactions.
References
[1] WEI Q.-H., BECHINGER C., RUDHARD D. and LEIDERER P., Phys. Rev.
13
Lett., 81 (1998) 2606.
[2] WEI Q.-H., BECHINGER C. and LEIDERER P., Science, 287 (2000) 625.
[3] LOEWEN H. and LIKOS C. N. (eds.) Colloidal Dispersions in External Fields,
J. Phys.: Condens. Matter, 16 (2004) Special Issue.
[4] ZAHN K., LENKE R. and MARET G., Phys. Rev. Lett., 82 (1999) 2721.
[5] BLAADEREN A., Progr. Colloid Polym. Sci., 104 (1997) 59.
[6] ZAHN K. and MARET G., Phys. Rev. Lett., 85 (2000) 3656.
[7] POON W., Science, 304 (2004) 830.
[8] DOYLE P. S., BIBETTE J., BANCAUD, A. and VIOVY J. L., Science, 295
(2002) 2237.
[9] RICCI A., NIELABA P., SENGUPTA S. and BINDER K., Phys. Rev. E, 75
(2007) 011405.
[10] CHAIKIN P. M. and LUBENSKY T. C., Principles of condensed matter physics
(Cambridge University Press, Cambridge) 1995.
[11] THORNE R.E., Physics Today, 49 (5) (1996) 42.
[12] TENG L.-W., TU P.-S. and LIN I., Phys. Rev. Lett., 90 (2003) 245004.
[13] SEGALMAN R. A., HEXEMER A., and KRAMER E. J., Phys. Rev. Lett., 91
(2003) 196101.
[14] BINDER K. in Cohesion and Structure of Surfaces, edited by Pettifor D.G.
14
(Elsevier, Amsterdam) 1995, Chapter III.
[15] SAARIIANNIDOUE D. D., BAHIERATHAN B., LAFONTAINE H.,
HOUGHTON D. C. and MCCOMB D. W., Appl. Phys. Lett. 87 (2005) 203112.
[16] LIAU Z.L. Phys. Rev. B 55, 12899-12901 (1999).
[17] PREVIĆ D. D., BAHIERATHAN B., LAFONTAINE H., HOUGHTON D. C.
and McCOMB D. W., Physica A, 239 (1997) 11.
[18] NIELSEN M., POULSEN BUNK O., KUMPF C., FEIDENHANS R.,
JOHNSON R. L., JENSEN F. and GREY F., Appl. Phys. Lett., 80 (2002) 3412.
[19] SCHALL P., COHEN I., WEITZ D. A. and SPAEPEN F., Nature, 440 (2006)
319-323.
[20] HANSEN J. P. and MCDONALD I. R., Theory of Simple Liquids, (Academic,
London) 1986.
[21] BAGCHI K., ANDERSEN H. C. and SWOPE W., Phys. Rev. E, 53 (1996) 3794.
[22] KOPPL M., HENSELER P., ERBE A., NIELABA P., and LEIDERER P., Phys.
Rev. Lett., 97 (2006) 208302.
[23] LANDAU D.P. and BINDER K., A Guide to Monte Carlo Simulations in
Statistical Physics (Cambridge University Press, Cambridge) 2000.
[24] CHAUDHURI D. and SENGUPTA S., Phys. Rev. Lett., 93 (2004)115702.
[25] BRAUN O.M. and KIVSHAR Y.S., The Frenkel-Kontorova Model. Concepts,
Methods and Applications (Springer, Berlin) 2004.
15
[26] HAGHGOOIE R. and DOYLE P.S., Phys. Rev. E, 70 (2004) 061408.
[27] CHAUDHURI D. and SENGUPTA S. and RAO, M., Phys. Rev. Lett., 95 (2005)
266103.
[28] HAGHGOOIE R. and DOYLE P.S., Phys. Rev. E, 72 (2005) 011405.
[29] PIACENTE G., SCHWEIGERT I. V., BETOURAS J. J. and PELTERS F. M.,
Phys. Rev. B, 69 (2004) 045324.
[30] KATO Y., MYERS R. C., GOSSARD A. C. and AWSCHALOM D. D., Nature,
427 (2003) 50.
[31] JUNGWIRTH T., ABOLFATH M., SINOVA J., KUCERA J. and
MACDONALD A. H., Appl. Phys. Lett., 81 (2002) 4029.
[32] AUMER M. E., LEBOEUF S. F., BEDDAIR S. M., SMITH M., LIN J. Y. and
JIANG H. X., Appl. Phys. Lett., 77 (2000) 821.
[33] OGINO T., HOMMA Y., KOBAYASHI T., BOTTOMLEY D. J., LING F. and
KANEKO A., Surf. Sci., 514 (2002) 1.
16
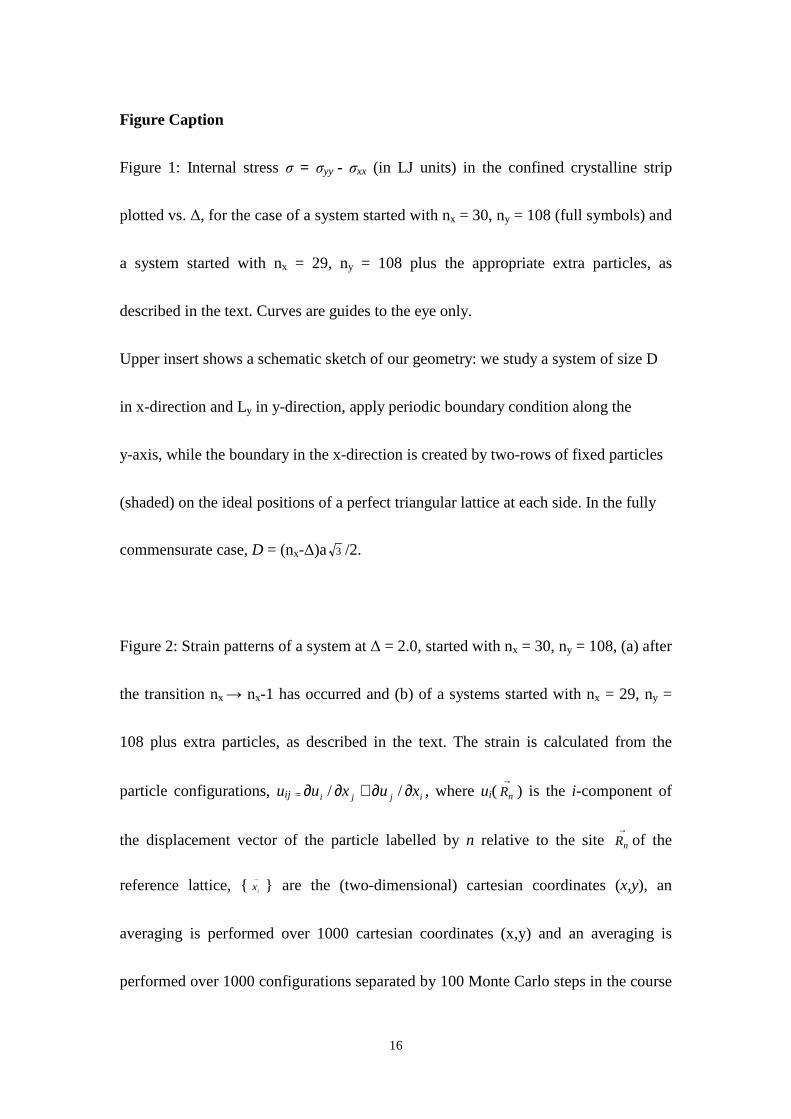
Figure Caption
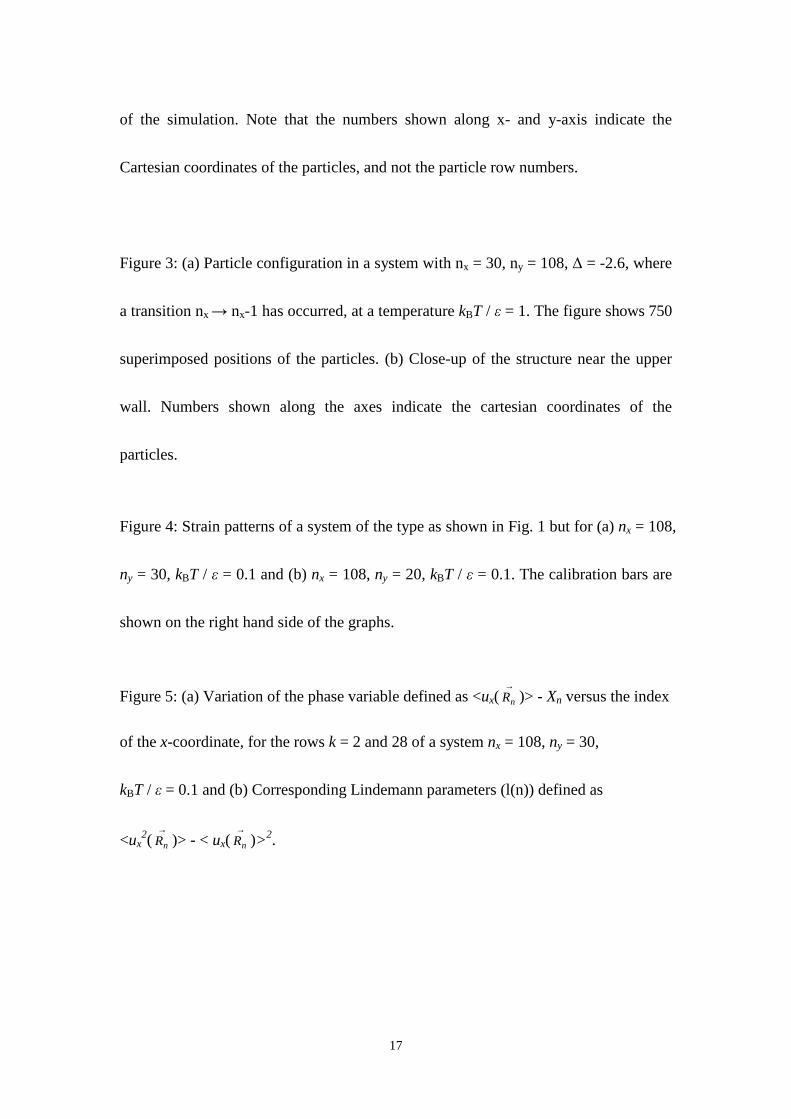
Figure 1: Internal stress σ = σyy - σxx (in LJ units) in the confined crystalline strip
plotted vs. ∆, for the case of a system started with nx = 30, ny = 108 (full symbols) and
a system started with nx = 29, ny = 108 plus the appropriate extra particles, as
described in the text. Curves are guides to the eye only.
Upper insert shows a schematic sketch of our geometry: we study a system of size D
in x-direction and Ly in y-direction, apply periodic boundary condition along the
y-axis, while the boundary in the x-direction is created by two-rows of fixed particles
(shaded) on the ideal positions of a perfect triangular lattice at each side. In the fully
commensurate case, D = (nx-∆)a 3 /2.
Figure 2: Strain patterns of a system at ∆ = 2.0, started with nx = 30, ny = 108, (a) after
the transition nx → nx-1 has occurred and (b) of a systems started with nx = 29, ny =
108 plus extra particles, as described in the text. The strain is calculated from the
particle configurations, uij = ijji xuxu ∂∂+∂∂ // , where ui(→
nR ) is the i-component of
the displacement vector of the particle labelled by n relative to the site →
nR of the
reference lattice, {→
ix } are the (two-dimensional) cartesian coordinates (x,y), an
averaging is performed over 1000 cartesian coordinates (x,y) and an averaging is
performed over 1000 configurations separated by 100 Monte Carlo steps in the course
17
of the simulation. Note that the numbers shown along x- and y-axis indicate the
Cartesian coordinates of the particles, and not the particle row numbers.
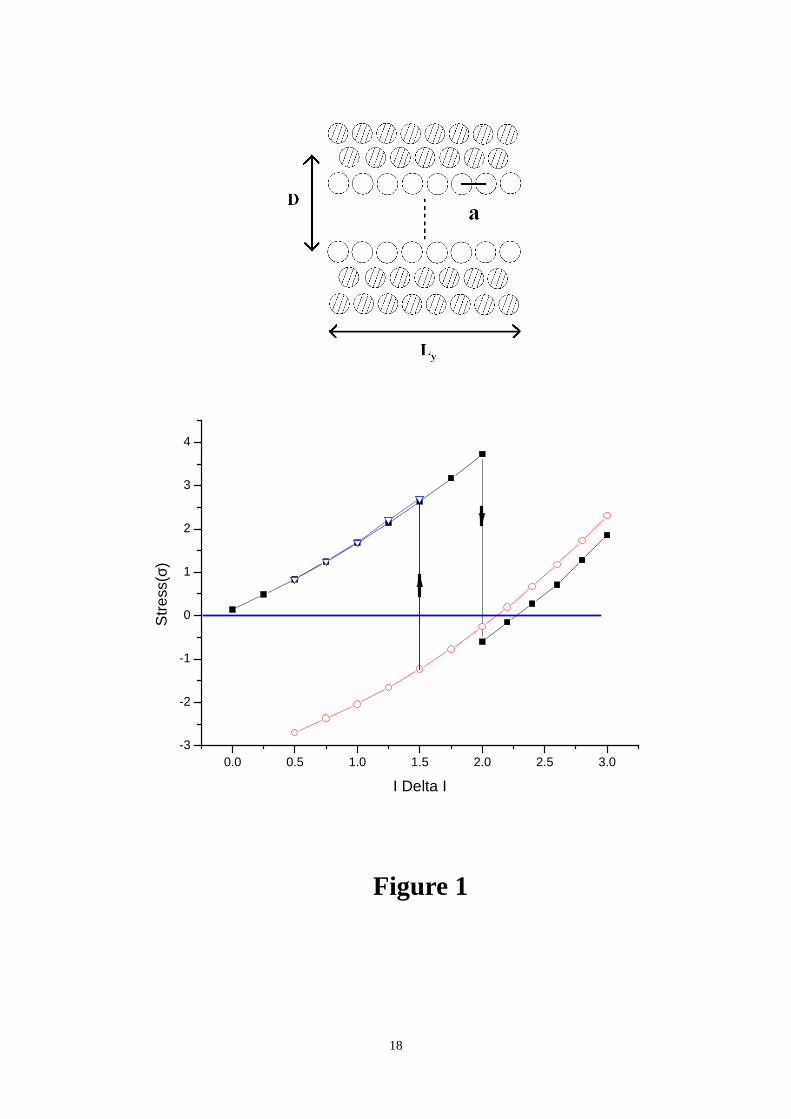
Figure 3: (a) Particle configuration in a system with nx = 30, ny = 108, ∆ = -2.6, where
a transition nx → nx-1 has occurred, at a temperature kBT / ε = 1. The figure shows 750
superimposed positions of the particles. (b) Close-up of the structure near the upper
wall. Numbers shown along the axes indicate the cartesian coordinates of the
particles.
Figure 4: Strain patterns of a system of the type as shown in Fig. 1 but for (a) nx = 108,
ny = 30, kBT / ε = 0.1 and (b) nx = 108, ny = 20, kBT / ε = 0.1. The calibration bars are
shown on the right hand side of the graphs.
Figure 5: (a) Variation of the phase variable defined as <ux(→
nR )> - Xn versus the index
of the x-coordinate, for the rows k = 2 and 28 of a system nx = 108, ny = 30,
kBT / ε = 0.1 and (b) Corresponding Lindemann parameters (l(n)) defined as
<ux2(
→
nR )> - < ux(→
nR )>2.
18
0.0 0.5 1.0 1.5 2.0 2.5 3.0-3
-2
-1
0
1
2
3
4
Str
ess(
σ)
I Delta I
Figure 1

19
(a) (b) Figure 2
20
(a)
(b) Figure 3

21
(a) (b) Figure 4
22
0 20 40 60 80 100 120
-5
-4
-3
-2
-1
0
row 2 row 28
Pha
se
na
(a)
0 20 40 60 80 100 1200.000
0.002
0.004
0.006
0.008
0.010
0.012
0.014
row 2 row 28
l(n)
na
(b)
Figure 5