Solar forcing of Nile discharge and sapropel S1 formation in the early to middle Holocene eastern...
14
Solar forcing of Nile discharge and sapropel S1 formation in the early to middle Holocene eastern Mediterranean Rick Hennekam 1 , Tom Jilbert 1 , Bernhard Schnetger 2 , and Gert J. de Lange 1 1 Department of Earth Sciences-Geochemistry, Faculty of Geosciences, Utrecht University, Utrecht, Netherlands, 2 Institute of Chemistry and Biology of the Marine Environment, Carl von Ossietzky University, Oldenburg, Germany Abstract We present high-resolution records for oxygen isotopes of the planktic foraminifer Globigerinoides ruber (δ 18 O ruber ) and bulk sediment inorganic geochemistry for Holocene-age sediments from the southeast Mediterranean. Our δ 18 O ruber record appears to be dominated by Nile discharge rather than basin-scale salinity/temperature changes. Nile discharge was enhanced in the early to middle Holocene relative to today. The timing of the long-term maximum in Nile discharge during the early Holocene corresponds to the timing of maximum intensity of the Indian Ocean-influenced Southwest Indian summer monsoon (SIM). This coincidence suggests a major influence of an Indian Ocean moisture source on Nile discharge in the early to middle Holocene, while, presently, the Atlantic Ocean is the main moisture source. Nile discharge was highly variable on multicentennial time scale during the early to middle Holocene, being strongly influenced by variable solar activity. This solar-driven variability is also recorded in contemporaneous SIM records, however, not observed in an Atlantic Ocean-derived West African summer monsoon record from the Holocene. This supports the hypothesis that the Indian Ocean moisture source predominantly controlled Nile discharge at that time. Solar-driven variability in Nile discharge also influenced paleoenvironmental conditions in the eastern Mediterranean. Bulk sediment Ba/Al and V/Al, used as indicators for (export) productivity and redox conditions, respectively, varied both in response to solar forcing on multicentennial time scales. We suggest that changes in Nile discharge on these time scales have been concordant with nutrient inputs to, and shallow ventilation of, the eastern Mediterranean. 1. Introduction The discharge (rate of outflow) of the River Nile into the Mediterranean Sea is mainly dependent on changes in the intensity and northward penetration of the monsoonal rainbelt associated with the Intertropical Convergence Zone (ITCZ) [Nicholson, 2009]. Nile discharge can therefore be seen as a gauge, detecting the amount of precipitation falling in the Nile catchment due to the northeast African monsoon. The persistence of Nile outflow throughout contrasting climatic regimes of the late Pleistocene and Holocene epochs means that reconstructions of Nile discharge may contain invaluable paleoenvironmental information. For example, variability in the relative contribution of the two main moisture sources contributing to Nile outflow—the Atlantic Ocean and the Indian Ocean [Mohamed et al., 2005]—may be expected to influence Nile discharge. Understanding how such large-scale hydrological patterns respond to external forcing factors such as Milankovitch cycles is a key goal of climate science. Moreover, the continuity of Nile outflow potentially facilitates reconstructions of short time scale (i.e., sub-Milankovitch) climatic variability, provided that the climatic archives used to reconstruct Nile discharge are of adequately high resolution. At present most of the Nile outflow (~70%) derives from the Blue Nile/Atbara Rivers (Figure 1a) [Foucault and Stanley, 1989]. These rivers originate from the Ethiopian Highlands, have a mainly Atlantic-derived moisture source, and have their peak outflow around August [Mohamed et al., 2005]. The remaining ~30% of Nile outflow derives from the White Nile. This originates from the Equatorial African mountain ranges (Figure 1a; most notably Lake Victoria), has a mixed Atlantic/Indian Ocean origin, and maintains the perennial flow into the main Nile [Mohamed et al., 2005]. In contrast, during the early to middle Holocene, large-scale moisture patterns were rearranged in response to the orbital precession cycle, meaning that Indian Ocean-derived moisture had an increased influence on Nile outflow [Hamann et al., 2009]. However, it has not yet been investigated to what extent the enhanced Indian Ocean moisture source influenced sub-Milankovitch time scale variability in Nile discharge during that time. HENNEKAM ET AL. ©2014. American Geophysical Union. All Rights Reserved. 1 PUBLICATION S Paleoceanography RESEARCH ARTICLE 10.1002/2013PA002553 Key Points: • High-resolution record of Nile discharge from foraminiferal oxygen isotopes • Early-Holocene Nile dominated by Indian Ocean moisture • Solar cycles in Mediterranean sapropel S1 intensity linked to Nile discharge Correspondence to: R. Hennekam, [email protected] Citation: Hennekam, R., T. Jilbert, B. Schnetger, and G. J. de Lange (2014), Solar forcing of Nile discharge and sapropel S1 formation in the early to middle Holocene eastern Mediterranean, Paleoceanography, 29, doi:10.1002/2013PA002553. Received 22 AUG 2013 Accepted 11 APR 2014 Accepted article online 15 APR 2014
Transcript of Solar forcing of Nile discharge and sapropel S1 formation in the early to middle Holocene eastern...
Solar forcing of Nile discharge and sapropel S1formation in the early to middle Holoceneeastern MediterraneanRick Hennekam1, Tom Jilbert1, Bernhard Schnetger2, and Gert J. de Lange1
1Department of Earth Sciences-Geochemistry, Faculty of Geosciences, Utrecht University, Utrecht, Netherlands, 2Institute ofChemistry and Biology of the Marine Environment, Carl von Ossietzky University, Oldenburg, Germany
Abstract We present high-resolution records for oxygen isotopes of the planktic foraminifer Globigerinoidesruber (δ18Oruber) and bulk sediment inorganic geochemistry for Holocene-age sediments from the southeastMediterranean. Our δ18Oruber record appears to be dominated by Nile discharge rather than basin-scalesalinity/temperature changes. Nile discharge was enhanced in the early to middle Holocene relative to today.The timing of the long-term maximum in Nile discharge during the early Holocene corresponds to thetiming of maximum intensity of the Indian Ocean-influenced Southwest Indian summer monsoon (SIM). Thiscoincidence suggests a major influence of an Indian Ocean moisture source on Nile discharge in the early tomiddle Holocene, while, presently, the Atlantic Ocean is the main moisture source. Nile discharge was highlyvariable on multicentennial time scale during the early to middle Holocene, being strongly influenced byvariable solar activity. This solar-driven variability is also recorded in contemporaneous SIM records, however,not observed in an Atlantic Ocean-derived West African summer monsoon record from the Holocene. Thissupports the hypothesis that the Indian Ocean moisture source predominantly controlled Nile discharge atthat time. Solar-driven variability in Nile discharge also influenced paleoenvironmental conditions in theeastern Mediterranean. Bulk sediment Ba/Al and V/Al, used as indicators for (export) productivity and redoxconditions, respectively, varied both in response to solar forcing on multicentennial time scales. We suggestthat changes in Nile discharge on these time scales have been concordant with nutrient inputs to, andshallow ventilation of, the eastern Mediterranean.
1. Introduction
The discharge (rate of outflow) of the River Nile into the Mediterranean Sea is mainly dependent on changesin the intensity and northward penetration of the monsoonal rainbelt associated with the IntertropicalConvergence Zone (ITCZ) [Nicholson, 2009]. Nile discharge can therefore be seen as a gauge, detecting theamount of precipitation falling in the Nile catchment due to the northeast African monsoon. The persistenceof Nile outflow throughout contrasting climatic regimes of the late Pleistocene and Holocene epochs meansthat reconstructions of Nile discharge may contain invaluable paleoenvironmental information. For example,variability in the relative contribution of the two main moisture sources contributing to Nile outflow—theAtlantic Ocean and the Indian Ocean [Mohamed et al., 2005]—may be expected to influence Nile discharge.Understanding how such large-scale hydrological patterns respond to external forcing factors such asMilankovitch cycles is a key goal of climate science. Moreover, the continuity of Nile outflow potentiallyfacilitates reconstructions of short time scale (i.e., sub-Milankovitch) climatic variability, provided that theclimatic archives used to reconstruct Nile discharge are of adequately high resolution.
At present most of the Nile outflow (~70%) derives from the Blue Nile/Atbara Rivers (Figure 1a) [Foucault andStanley, 1989]. These rivers originate from the Ethiopian Highlands, have a mainly Atlantic-derived moisturesource, and have their peak outflow around August [Mohamed et al., 2005]. The remaining ~30%of Nile outflowderives from the White Nile. This originates from the Equatorial African mountain ranges (Figure 1a; mostnotably Lake Victoria), has a mixed Atlantic/Indian Ocean origin, andmaintains the perennial flow into themainNile [Mohamed et al., 2005]. In contrast, during the early tomiddle Holocene, large-scale moisture patterns wererearranged in response to the orbital precession cycle, meaning that Indian Ocean-derived moisture had anincreased influence on Nile outflow [Hamann et al., 2009]. However, it has not yet been investigated to whatextent the enhanced Indian Ocean moisture source influenced sub-Milankovitch time scale variability in Niledischarge during that time.
HENNEKAM ET AL. ©2014. American Geophysical Union. All Rights Reserved. 1
PUBLICATIONSPaleoceanography
RESEARCH ARTICLE10.1002/2013PA002553
Key Points:• High-resolution record of Niledischarge from foraminiferaloxygen isotopes
• Early-Holocene Nile dominated byIndian Ocean moisture
• Solar cycles in Mediterranean sapropelS1 intensity linked to Nile discharge
Correspondence to:R. Hennekam,[email protected]
Citation:Hennekam, R., T. Jilbert, B. Schnetger, andG. J. de Lange (2014), Solar forcing of Niledischarge and sapropel S1 formation inthe early to middle Holocene easternMediterranean, Paleoceanography, 29,doi:10.1002/2013PA002553.
Received 22 AUG 2013Accepted 11 APR 2014Accepted article online 15 APR 2014

This study focuses on a marine sediment core (PS009PC) from the southeast Levantine Basin (Figure 1b).This area is known to be largely influenced by Nile sedimentation [Krom et al., 1999] and to have maintainedhigh sedimentation rates throughout the Holocene [Schilman et al., 2001; Almogi-Labin et al., 2009; Hamannet al., 2009; Castañeda et al., 2010; Box et al., 2011]. Variability in Nile River discharge is, consequently,documented at this core location by indicators of the freshwater input (such as planktic foraminifer oxygenisotopes) and bulk sediment composition [Fontugne et al., 1994; Almogi-Labin et al., 2009]. Moreover, thehigh sedimentation rates (12.5–104 cm kyr�1) and high sampling resolution (0.5 cm, thus≤ 40 year persample) allow the identification of centennial variability in Nile outflow. Hence, for the first time, we report onthe sub-Milankovitch variability in Nile discharge during the early to middle Holocene.
The sediment core used in this study is considered not only to be a high-resolution archive of northeastAfrican climate but also to be an indicator for the paleoenvironment of the eastern Mediterranean [e.g.,Almogi-Labin et al., 2009]. The sensitivity of the eastern Mediterranean to the northeast African climate isdemonstrated by the intermittent deposition of distinct organic-rich sediment layers (sapropels). Periods ofincreased Nile discharge have been closely associated to sapropel formation in the eastern Mediterranean[Rossignol-Strick et al., 1982]. These periods of increased Nile outflow are generally thought to be due toprecession-forced insolation changes causing increased monsoonal activity. The increased Nile discharge,subsequently, may have influenced ventilation and/or productivity in the eastern Mediterranean, thuspromoting sapropel deposition [e.g., Rossignol-Strick et al., 1982; Rohling and Hilgen, 1991; Rohling, 1994;Thomson et al., 1999; De Lange et al., 2008]. The high sedimentation rate site of this study permits us toevaluate at high resolution the paleoclimate-related mechanisms of, and variability within, sapropelformation and its link to Nile discharge.
2. The Core Locality and Oceanographic Setting
Piston core PS009PC (32°07.7′N, 34°24.4′E; 552m water depth) and box core PS008BC (same coordinates)were taken during the PASSAP cruise with the R/V Pelagia in May 2000. This coring site is located in thesoutheast Levantine Basin, approximately 100 km southwest of Haifa, Israel (Figure 1b).
Figure 1. Overview of environmental setting and sites used in this study. (a) August wind field (925hPa; small black arrows) andprecipitation intensity (green shading) over northern Africa (http://iridl.ldeo.columbia.edu). The ITCZ position and the Congo AirBoundary (zone of confluence between Atlantic- and Indian Ocean-derived moisture [Tierney et al., 2011]) (black dashed lines),the Niger/Sanaga catchment (yellow dashed line), and the Nile catchment area (orange dashed line) are indicated. Numbersindicate (1) Atbara River, (2) Blue Nile River, (3) White Nile River, and (4) Lake Turkana. Sites: PS009PC (yellow star; this study),MD03-2707 (purple star) [Weldeab et al., 2007], and Qunf Cave (grey diamond) [Fleitmann et al., 2003]. (b) Eastern Mediterraneanwith core PS009PC (32°07.7′N, 34°24.4′E; 552m water depth). The primary current direction is indicated with a blue arrow.
Paleoceanography 10.1002/2013PA002553
HENNEKAM ET AL. ©2014. American Geophysical Union. All Rights Reserved. 2

Mediterranean surface water (MSW), originating from the Atlantic, follows an eastward path through theeastern Mediterranean basin. On its way its salinity increases, because of excess evaporation, to values above39 [Wüst, 1961]. In the eastern Mediterranean the MSW flows anticlockwise, being diverted northward in thesoutheast Levantine Basin along, respectively, the Israeli, Lebanese, and Syrian coastlines to southern Turkey[Pinardi and Masetti, 2000]. It is this current that transports much of the Nile sediment to our core location,resulting in high sedimentation rates (Figure 1b). Concurringly, the Nile freshwater input is diverted in thesame direction. This is indicated by the occurrence of a distinct freshwater anomaly in the southeastLevantine Basin, which was observed prior to completion of the high Aswan Dam in 1964 [Hecht andGertman, 2001]. West of Cyprus, in the Rhodes gyre, Levantine Intermediate Water (LIW) is formed duringintense winter cooling of already saline MSW by relatively cold northern air masses [Lascaratos et al., 1993].This LIW flows to depths between 200 and 600 m and spreads over the entire Mediterranean basin [Wüst,1961]. Subsequently, Eastern Mediterranean Deep Water (EMDW), flowing below depths of 1500 m [Wüst,1961], is formed in the southern Adriatic basin [Schlitzer et al., 1991] and (occasionally) in the southernAegean basin [Roether et al., 1996]. This happens in winter, due to mixing of LIW with relatively cold but lesssaline waters in those basins.
3. Material and Methods3.1. Core Chronology
The age model for core PS009PC was constructed by means of 11 210Pb measurements on sediment samplesof PS008BC and 7 14C accelerator mass spectrometry (AMS) measurements on planktonic foraminiferal
samples of PS009PC (Table 1). Box corePS008BC was sampled every 0.5 cm forits full 34 cm length. The samples werefreeze dried and ground to powderusing an agate mortar. The 210Pbactivity was subsequently measured atthe Royal Netherlands Institute for SeaResearch (NIOZ) (Figure 2a), and aconstant rate of supply (CRS) modelwas used to construct the age-depthprofile (for details see Boer et al. [2006])(Figure 2b). The correlation of PS008BCto PS009PC using elemental ratios wasmade in Hennekam and De Lange[2012]. By the use of two correlationpoints the ages of the top and 8.75 cmdepth in PS009PC were determined,relating to, respectively, 1975 and1881 year A.D. (Figure 2b).
Table 1. The 14C and 210Pb Data Used to Construct the Age Model
Depth (cm)
14C Age(year B.P.) ±2σ
Calendar Age(cal year B.P.) ±2σ
210Pb Age(year B.P.) ± 2σ
Final Age Model(year B.P.) Material 14C Lab Code
0 - - �25± 10 �25 Sediment8.75 - - 69 ± 15 59 Sediment67.5 1,690± 30 1,205 ± 146 - 1,111 G. ruber, G. sacculifer, and O. universa Poz-40169132.1 3,320± 30 3,138 ± 193 - 3,240 G. ruber, G. sacculifer, and O. universa Poz-40170191.2 5,750± 40 6,118 ± 169 - 6,080 G. ruber and G. sacculifer Poz-40171217.2 7,950± 40 8,388 ± 166 - 8,155 G. ruber Poz-40173247.2 9,620± 50 10,433 ± 186 - 10,548 G. ruber and G. sacculifer Poz-40174285.2 12,000± 60 13,460 ± 204 - 13,580 G. ruber, G. sacculifer, and O. universa Poz-40175322.6 13,950± 80 16,581 ± 374 - 16,565 G. ruber and G. sacculifer Poz-40176
Figure 2. Agemodel of core PS009PC. (a) Depth profile of excess 210Pb of boxcore PS008BC, including horizontal error bars. (b) Constant rate of supply (CRS)age model, based on 210Pb data. Dashed lines indicate correlation points ofPS008BC to PS009PC and corresponding ages. (c) Final age model based onseven calibrated 14C ages (triangles; horizontal error bars are indicated) andcorrelation of PS009PC to PS008BC 210Pb age model for the top (circle). (d)Sedimentation rate (grey line) through time, by using the final age model.
Paleoceanography 10.1002/2013PA002553
HENNEKAM ET AL. ©2014. American Geophysical Union. All Rights Reserved. 3
The sediment samples for 14C analysis were first wet sieved using deionized water over a 150μm sieve. Persample approximately 10mg of a mixture of planktonic foraminiferal material was picked (Table 1). The 14Canalyses were done at the Poznań Radiocarbon Laboratory in Poland. For 14C age conversion to calendar agesthe OxCal 4.1.7 program was used [Ramsey, 2009]. The Marine’09 data set was used for calibration [Reimer et al.,2009] with a local reservoir correction (ΔR) of 21± 63 year. This reservoir correction was based on 14C analysesof recent shell material near the core locality [Reimer and McCormac, 2002; Boaretto et al., 2010].
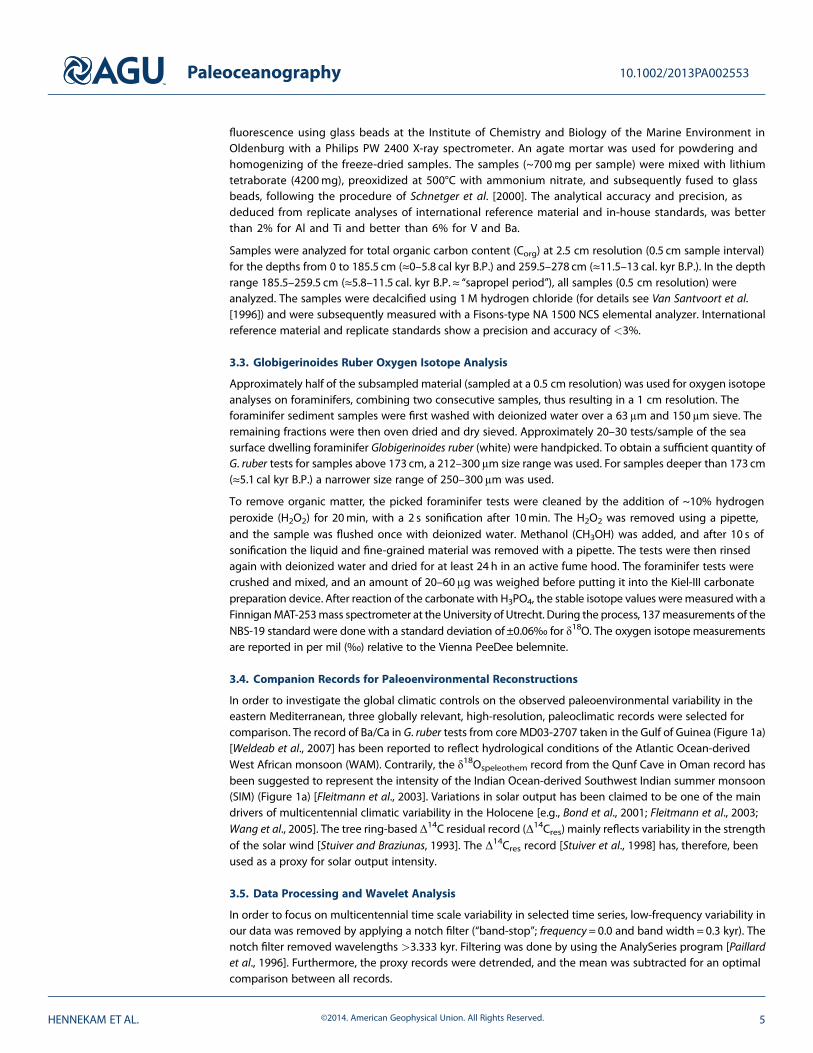
The final age model for the upper 190 cm was constructed using the uppermost four samples and a second-order polynomial best fit, with a fixed start at 1975 (i.e., �25 cal years B.P.) (Figure 2c). The change insedimentation rate is a result not only of different water contents but also of a change in mass accumulationrates (MARs) (Table 2). The increased MAR to the top is thought to relate to gradually drier conditions in theEthiopian Highlands, enhancing erosion [see Box et al., 2011]. A significant increase during the last ~2500 yearB.P. might be related to extra soil erosion due to deforestation in the same region [Darbyshire et al., 2003]. Alinear best fit was used to construct the age model of the samples from 191 to 323 cm, expressing therelatively constant sedimentation rates in this core segment (Figure 2d). The age at 191 cm was fixed toacquire a smooth flow from the top segment to the bottom segment of the age model.
Certain factors might influence the accuracy of age models based on foraminiferal 14C measurements (i.e.,measurement uncertainties, depositional events, bioturbation, and variable reservoir ages). Measurementuncertainties are inherent to the use of 14C for dating and are in the order of several decades for these samples(Table 1). Event-related deposits are generally detectable in the sedimentological and geochemicalcomposition of the sediment, but these were not detected in this core. The age effect of bioturbation on highsedimentation rate sites is limited [Siani et al., 2001], as is also indicated by a poorly developed top mixed layerin the 210Pb activity profile of core PS008BC (Figure 2a). Moreover, during sapropel S1 formation, bioturbationwas probably reduced by the low oxygen concentrations of the eastern Mediterranean bottom water.Understanding past variability in sea surface reservoir ages is crucial for a robust age model. For the easternMediterranean, sea surface reservoir ages during the Holocene remained similar to the midlatitudes of theAtlantic Ocean [Siani et al., 2001]. Therefore, we believe that calibration to the Marine’09 data set with a minorlocal reservoir correction is valid for our targeted time interval. Due to uncertainty within reservoir ages andtuning to the Marine’09 curve, the 2σ uncertainties of the calendar ages increase to ~150–200 years within theHolocene (Table 1). Nevertheless, the final age model concords well to the 14C-based age models from similarlocations [e.g., Hamann et al., 2008; Castañeda et al., 2010], showing relatively constant sedimentation ratesduring the early to middle Holocene and increasing sedimentation rates during the late Holocene.
As this study focuses on the Holocene, the samples in the time window 0–13 cal kyr B.P. were used forfurther analyses.
3.2. Geochemical Analysis
The top 278 cm (≈13 kyr) of core PS009PC was subsampled with a 0.5 cm resolution (average of ~23 year persample) for geochemical analysis. The bulk inorganic analyses for Al, Ti, V, and Ba were made by X-ray
Table 2. Data Used to Deduce the Mass Accumulation Rates (MARs)a
Depth(cm)
Water(wt %)
Salt(wt %)
Sediment(wt %)
Porosity(vol %)
DBD(g/cm3)
Sed. Rate(cm/kyr)
MAR(g/cm2/kyr)
0 - - - - - - -8.75 58.2 2.24 39.6 80.8 0.51 104 52.667.5 57.3 2.21 40.5 80.2 0.52 55.9 29.3132.1 54.2 2.09 43.7 77.9 0.58 30.3 17.7191.2 55.2 2.12 42.7 78.7 0.56 20.8 11.2217.2 53.9 2.08 44.0 77.7 0.59 12.5 7.39247.2 48.5 1.87 49.6 73.4 0.70 12.5 8.82285.2 43.9 1.69 54.4 69.4 0.81 12.5 10.2322.6 37.0 1.42 61.6 62.7 0.99 12.5 12.4
aA bottomwater density of 1.027 g/cm3 and a sediment density of 2.65 g/cm3 were used to calculate porosity and drybulk density (DBD).
Paleoceanography 10.1002/2013PA002553
HENNEKAM ET AL. ©2014. American Geophysical Union. All Rights Reserved. 4
fluorescence using glass beads at the Institute of Chemistry and Biology of the Marine Environment inOldenburg with a Philips PW 2400 X-ray spectrometer. An agate mortar was used for powdering andhomogenizing of the freeze-dried samples. The samples (~700mg per sample) were mixed with lithiumtetraborate (4200mg), preoxidized at 500°C with ammonium nitrate, and subsequently fused to glassbeads, following the procedure of Schnetger et al. [2000]. The analytical accuracy and precision, asdeduced from replicate analyses of international reference material and in-house standards, was betterthan 2% for Al and Ti and better than 6% for V and Ba.
Samples were analyzed for total organic carbon content (Corg) at 2.5 cm resolution (0.5 cm sample interval)for the depths from 0 to 185.5 cm (≈0–5.8 cal kyr B.P.) and 259.5–278 cm (≈11.5–13 cal. kyr B.P.). In the depthrange 185.5–259.5 cm (≈5.8–11.5 cal. kyr B.P.≈ “sapropel period”), all samples (0.5 cm resolution) wereanalyzed. The samples were decalcified using 1M hydrogen chloride (for details see Van Santvoort et al.[1996]) and were subsequently measured with a Fisons-type NA 1500 NCS elemental analyzer. Internationalreference material and replicate standards show a precision and accuracy of <3%.
3.3. Globigerinoides Ruber Oxygen Isotope Analysis
Approximately half of the subsampled material (sampled at a 0.5 cm resolution) was used for oxygen isotopeanalyses on foraminifers, combining two consecutive samples, thus resulting in a 1 cm resolution. Theforaminifer sediment samples were first washed with deionized water over a 63μm and 150μm sieve. Theremaining fractions were then oven dried and dry sieved. Approximately 20–30 tests/sample of the seasurface dwelling foraminifer Globigerinoides ruber (white) were handpicked. To obtain a sufficient quantity ofG. ruber tests for samples above 173 cm, a 212–300μm size range was used. For samples deeper than 173 cm(≈5.1 cal kyr B.P.) a narrower size range of 250–300μm was used.
To remove organic matter, the picked foraminifer tests were cleaned by the addition of ~10% hydrogenperoxide (H2O2) for 20min, with a 2 s sonification after 10min. The H2O2 was removed using a pipette,and the sample was flushed once with deionized water. Methanol (CH3OH) was added, and after 10 s ofsonification the liquid and fine-grained material was removed with a pipette. The tests were then rinsedagain with deionized water and dried for at least 24 h in an active fume hood. The foraminifer tests werecrushed and mixed, and an amount of 20–60μg was weighed before putting it into the Kiel-III carbonatepreparation device. After reaction of the carbonate with H3PO4, the stable isotope values weremeasured with aFinniganMAT-253mass spectrometer at the University of Utrecht. During the process, 137measurements of theNBS-19 standard were done with a standard deviation of ±0.06‰ for δ18O. The oxygen isotope measurementsare reported in per mil (‰) relative to the Vienna PeeDee belemnite.
3.4. Companion Records for Paleoenvironmental Reconstructions
In order to investigate the global climatic controls on the observed paleoenvironmental variability in theeastern Mediterranean, three globally relevant, high-resolution, paleoclimatic records were selected forcomparison. The record of Ba/Ca in G. ruber tests from core MD03-2707 taken in the Gulf of Guinea (Figure 1a)[Weldeab et al., 2007] has been reported to reflect hydrological conditions of the Atlantic Ocean-derivedWest African monsoon (WAM). Contrarily, the δ18Ospeleothem record from the Qunf Cave in Oman record hasbeen suggested to represent the intensity of the Indian Ocean-derived Southwest Indian summer monsoon(SIM) (Figure 1a) [Fleitmann et al., 2003]. Variations in solar output has been claimed to be one of the maindrivers of multicentennial climatic variability in the Holocene [e.g., Bond et al., 2001; Fleitmann et al., 2003;Wang et al., 2005]. The tree ring-based Δ14C residual record (Δ14Cres) mainly reflects variability in the strengthof the solar wind [Stuiver and Braziunas, 1993]. The Δ14Cres record [Stuiver et al., 1998] has, therefore, beenused as a proxy for solar output intensity.
3.5. Data Processing and Wavelet Analysis
In order to focus on multicentennial time scale variability in selected time series, low-frequency variability inour data was removed by applying a notch filter (“band-stop”; frequency= 0.0 and band width = 0.3 kyr). Thenotch filter removed wavelengths >3.333 kyr. Filtering was done by using the AnalySeries program [Paillardet al., 1996]. Furthermore, the proxy records were detrended, and the mean was subtracted for an optimalcomparison between all records.
Paleoceanography 10.1002/2013PA002553
HENNEKAM ET AL. ©2014. American Geophysical Union. All Rights Reserved. 5
In order to explore the frequencyvariability over time, a continuouswavelet transform (CWT) wasperformed, using a Morlet wavelet,within the Paleontological Statisticssoftware package [Hammer et al.,2001]. Before analysis the proxyrecords were filtered, as detailedabove, and resampled at acontinuous and higher 1 yearresolution to maintain all availablefrequency data within allproxy records.
The outcome of the CWT was used toselect the window width (1005 years)for a running correlation procedure.Data points in the running correlationrepresent a linear correlationmagnitude (Pearson’s R) between twotime series within a window of1005 years centered at that specificdata point. Running correlations,relative to the Δ14Cres record [Stuiver
et al., 1998], were performed between the WAM record [Weldeab et al., 2007], SIM record [Fleitmannet al., 2003], and δ18Oruber (this study). We have focused on multicentennial variability by applyingfiltering as above and applying an additional low-pass filter with a cutoff at 256 years for smoothing(resulting in an overall band-pass filter of all records between 0.256 and 3.333 kyr) within the AnalySeriesprogram [Paillard et al., 1996].
4. Results4.1. General Trends in the Holocene Proxy Records of PS009PC
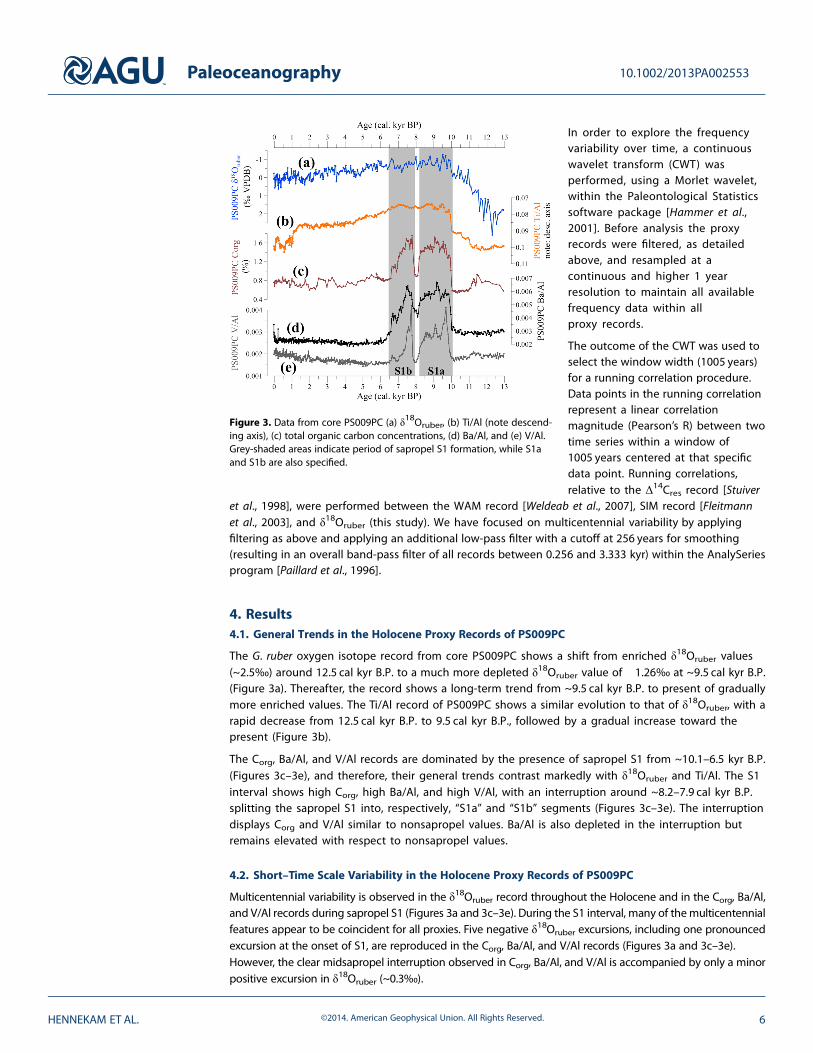
The G. ruber oxygen isotope record from core PS009PC shows a shift from enriched δ18Oruber values(~2.5‰) around 12.5 cal kyr B.P. to a much more depleted δ18Oruber value of �1.26‰ at ~9.5 cal kyr B.P.(Figure 3a). Thereafter, the record shows a long-term trend from ~9.5 cal kyr B.P. to present of graduallymore enriched values. The Ti/Al record of PS009PC shows a similar evolution to that of δ18Oruber, with arapid decrease from 12.5 cal kyr B.P. to 9.5 cal kyr B.P., followed by a gradual increase toward thepresent (Figure 3b).
The Corg, Ba/Al, and V/Al records are dominated by the presence of sapropel S1 from ~10.1–6.5 kyr B.P.(Figures 3c–3e), and therefore, their general trends contrast markedly with δ18Oruber and Ti/Al. The S1interval shows high Corg, high Ba/Al, and high V/Al, with an interruption around ~8.2–7.9 cal kyr B.P.splitting the sapropel S1 into, respectively, “S1a” and “S1b” segments (Figures 3c–3e). The interruptiondisplays Corg and V/Al similar to nonsapropel values. Ba/Al is also depleted in the interruption butremains elevated with respect to nonsapropel values.
4.2. Short–Time Scale Variability in the Holocene Proxy Records of PS009PC
Multicentennial variability is observed in the δ18Oruber record throughout the Holocene and in the Corg, Ba/Al,and V/Al records during sapropel S1 (Figures 3a and 3c–3e). During the S1 interval, many of themulticentennialfeatures appear to be coincident for all proxies. Five negative δ18Oruber excursions, including one pronouncedexcursion at the onset of S1, are reproduced in the Corg, Ba/Al, and V/Al records (Figures 3a and 3c–3e).However, the clear midsapropel interruption observed in Corg, Ba/Al, and V/Al is accompanied by only a minorpositive excursion in δ18Oruber (~0.3‰).
Figure 3. Data from core PS009PC (a) δ18Oruber, (b) Ti/Al (note descend-ing axis), (c) total organic carbon concentrations, (d) Ba/Al, and (e) V/Al.Grey-shaded areas indicate period of sapropel S1 formation, while S1aand S1b are also specified.
Paleoceanography 10.1002/2013PA002553
HENNEKAM ET AL. ©2014. American Geophysical Union. All Rights Reserved. 6

5. Discussion5.1. Nile Discharge and MoistureSources During the Early toMiddle Holocene
G. ruber is abundantly found in corePS009PC throughout the Holocene.The modern day Mediterranean G.ruber has its peak abundance duringthe late summer around August. Itprefers to live in the upper 50 m of thewater column during summer and inthe upper 100 m during winter [Pujoland Grazzini, 1995]. G. ruber is knownfor its resistance to freshwaterdisturbances, being one of the mosteuryhaline foraminifer species,capable to inhabit freshwater lenses[e.g., Schmuker and Schiebel, 2002].The average yearly peak of Niledischarge is in August [Williams et al.,2006, and references therein]. Thebasin-wide peak abundance of G.ruber thus appears to coincide with,but not to be directly related to, thepeak of Nile discharge.
In general, the δ18O of foraminiferalcalcite is controlled by temperature-dependent isotopic fractionation between water and calcite and by theisotopic composition of seawater. The latter is influenced by ice volume, freshwater input, and evaporation/precipitation [e.g., Rohling and Bigg, 1998]. Alkenone-derived sea surface temperatures indicate relativelyconstant temperatures throughout the Holocene in the eastern Mediterranean [Essallami et al., 2007;Almogi-Labin et al., 2009; Castañeda et al., 2010]. Typical eastern Mediterranean δ18Oruber records will,therefore, mainly document seawater δ18O changes during the Holocene. The latter is influenced by theevaporation/precipitation budget and by major river systems. Earlier work has shown that the Holoceneδ18Oruber records from our study area differ from typical eastern Mediterranean δ18Oruber data [Fontugneand Calvert, 1992; Fontugne et al., 1994; Almogi-Labin et al., 2009]. Fontugne et al. [1994] show that in theIsraeli coastal area the δ18Oruber values are up to >1.3‰more depleted during sapropel S1 formation andbecome progressively more enriched to the west. These authors indicate that Nile River water was driventoward the east during sapropel S1 formation as it is in the present sea surface circulation. The mostdepleted δ18Oruber value in PS009PC (�1.26‰) is in line with the study of Fontugne et al. [1994] andconfirms their statement that δ18Oruber is more depleted when compared to other eastern Mediterraneanrecords [e.g., De Lange et al., 2008] throughout the Holocene. Correspondingly, significantly more depletedδ18Oruber values were documented in the Israeli coastal area compared to the northern Levantine Basin(up to 1.3‰) during most of the Holocene [Almogi-Labin et al., 2009]. These authors attribute this gradientmainly to Nile River water influencing the southeast Levantine Basin. This confirms that the Holoceneδ18Oruber record from this location primarily reflects changes in isotopically light Nile discharge, whichregulated local seawater δ18O in this part of the Levantine Basin.
The general trends in our δ18Oruber record are similar to those observed in previously published archives ofWAM [Weldeab et al., 2007] and SIM [Fleitmann et al., 2003] strength, supporting our hypothesis that δ18Oruber
primarily reflects Nile discharge (Figures 4a, 4b, and 4d). These records show evidence for an increase inmonsoon strength during the transition from the Younger Dryas to the Holocene Climatic Optimum. This isfollowed by a more gradual decline in monsoon strengths toward the late Holocene, which is likely aresponse to the gradual declining insolation at 30°N [Fleitmann et al., 2003; Laskar et al., 2004] (Figure 4c).
Figure 4. (a) Ba/Ca in G. ruber tests of core MD03-2707 in Gulf ofGuinea (higher Ba/Ca values indicate stronger WAM) [Weldeab et al., 2007].(b) δ18Ospeleothem record from Qunf Cave, Oman (more depletedδ18Ospeleothem relate to a stronger SIM) [Fleitmann et al., 2003]. (c) June-July-August insolation at 30°N [Laskar et al., 2004]. (d) δ18Oruber of corePS009PC (this study). (e) Ti/Al of core PS009PC (note descending axis). Alldata are three-pointmoving averages. Grey-shaded areas indicate periods ofYounger Dryas (YD) and sapropel S1 formation, while S1a and S1b are alsospecified (based on data from Figure 3). Vertical dotted line marks period ofmaximum WAM (based on G. ruber Ba/Ca of MD03-2707).
Paleoceanography 10.1002/2013PA002553
HENNEKAM ET AL. ©2014. American Geophysical Union. All Rights Reserved. 7
WAM peaked earlier (~11.3 cal kyr B.P.) than SIM strength (~9.4 cal kyr B.P.). Our δ18Oruber record also showsmaximum Nile discharge close to 9.4 cal kyr B.P., suggesting the dominance of Indian Ocean-derivedmoisture on Nile discharge during the early to middle Holocene [see also Hamann et al., 2009].
The dominance of Indian Ocean moisture on Nile discharge during the early to middle Holocene seems to berelated to the northerly position of the ITCZ, but this influencemay have expressed itself in various ways. First,direct penetration of Indian Ocean air masses through the Ethiopian Highlands into the Blue Nile/Atbarawatersheds may have been greater. This scenario is supported by generally more depleted δ18ONile valuesduring this time period [Abell and Hoelzmann, 2000; Rodrigues et al., 2000], as expected from moisturetransported across the Ethiopian Highlands [Kebede and Travi, 2012]. Second, Lake Turkana was connected tothe Nile via the Sobat River until ~5.3 cal kyr B.P. [Garcin et al., 2012]. Thus, at this time the land surface areawith Indian Ocean influence to the Nile catchment was larger than today. Finally, prolonged, strong positivephases of the Indian Ocean Dipole [Saji et al., 1999] during the early to middle Holocene [Abram et al., 2007]may have increased the moisture transport from the Indian Ocean onto the African continent.
Considering the effect of direct penetration of Indian Ocean moisture through the Ethiopian Highlands,it should be noted that part of the depletion we observe in early to middle Holocene δ18Oruber mayhave related to variability in the oxygen isotopic composition of the Nile water itself (δ18ONile). Theaverage δ18O value of precipitation in the modern Nile catchment during August is approximately �1 to�2‰ (http://www.WaterIsotopes.org [e.g., Bowen and Wilkinson 2002]). However, values for cellulose-inferred oxygen isotopes of Lake Victoria [Beuning et al., 2002], for “fossil” water in aquifers in northwestSudan [Abell and Hoelzmann, 2000] and for northwest Sudan shell material [Rodrigues et al., 2000], allshow a relative depletion in oxygen isotope values of approximately �7 to �10‰ during the early tomiddle Holocene. Nevertheless, the clear coevolution of Ti/Al and δ18Oruber (see section 5.2) indicatesthat δ18Oruber was not just an expression of variability in changing precipitation sources affectingδ18ONile, but primarily of variability in the quantity of Nile discharge.
5.2. Inorganic Geochemical Proxies of Paleoenvironmental Conditions (Ti, Ba, and V)
Variability in Ti/Al has generally been interpreted as representing the relative contribution of aeolian input(high in Ti) in the eastern Mediterranean, especially for distal marine sediments [Wehausen and Brumsack,2000; Lourens et al., 2001]. Nevertheless, sedimentary Ti/Al increases from west to east in the easternMediterranean, possibly due to an increase in material from Ti-rich basalts [Wehausen and Brumsack, 2000].Today, approximately 97% of the main Nile sediment is derived fromweathering of Miocene-Pliocene basaltsin the Ethiopian Highlands and transported through the Blue Nile and Atbara Rivers to the easternMediterranean [Foucault and Stanley, 1989]. The Nile Ti/Al end-member (~0.19) has been observed to be evenhigher than that of Saharan dust (~0.11) [Krom et al., 1999]. Since the sediments in PS009PC are dominated byNile material, the Ti/Al record likely reflects variability in contribution of White Nile versus Blue Nile/Atbarasediment and in particular weathering rates in the Ethiopian Highlands. These have been reported toincrease during drier periods, due to reduced vegetation cover [Krom et al., 2002; Box et al., 2011]. Hence, thegenerally depleted Ti/Al values in our record observed during the African Humid Period (~11–5 cal kyr B.P.)are thought to represent reduced weathering in the Ethiopian Highlands at this time (Figure 4e). Thisconcords well with the general trend of δ18Oruber (Figure 4d), implying that increased Nile discharge occurredsimultaneously with decreased weathering in the Blue Nile catchment during the early to middle Holocene.Nevertheless, multicentennial variability is not well expressed in Ti/Al, which might indicate a bufferedresponse of vegetation cover to precipitation in the Ethiopian Highlands on these time scales.
Three main barium sources may contribute to Ba concentrations in sediments, namely, biogenic barite(BaSO4), Ba in aluminosilicates, and Ba associated with Mn/Fe oxides [e.g., Schenau et al., 2001]. Barium in theeastern Mediterranean has primarily been used as a proxy for paleo(export) productivity, showing generally aBa (barite) enrichment during sapropel S1 deposition [e.g., Thomson et al., 1995; Van Santvoort et al., 1997;Wehausen and Brumsack, 1999;Mercone et al., 2000; Jilbert et al., 2010]. The Ba enrichment has been shown tobe proportional to the initial organic carbon (Corg) accumulation rate during sapropel formation [VanSantvoort et al., 1997; Thomson et al., 1999; De Lange et al., 2008]. Hence, the Ba/Al enrichment during the S1interval in PS009PC confirms that export productivity was enhanced in the Levantine Basin at this time(Figure 3d), showing a close correspondence to Corg (Figure 3c).
Paleoceanography 10.1002/2013PA002553
HENNEKAM ET AL. ©2014. American Geophysical Union. All Rights Reserved. 8
The redox sensitive element vanadiumhas been reported to be enriched insediments deposited under reducingconditions, as in sapropels [e.g.,Thomson et al., 1995; Nijenhuis et al.,1999; Warning and Brumsack, 2000;Jilbert et al., 2010]. Generally, it hasbeen observed that V is transformedfrom dissolved to solid species atspecific redox potential thresholdsat the sediment-water interface[Emerson and Huested, 1991]. Thedissolution/precipitation of redoxsensitive elements can bediagenetically redistributed throughpostdepositional oxidative alterationof these elements after reventilationof the water column [Thomson et al.,1995]. This diagenetic oxygenpenetration effect (“burn down”) ofsapropels is mainly dependent onsediment accumulation rates and lesson bioturbation [Van Santvoort et al.,1996]. For this core locality, being a
very high sedimentation rate site (on average ~21 cm kyr�1) compared to other eastern Mediterraneansites (2–3 cm kyr�1), downward oxidation is negligible. Therefore, a relatively pristine vanadiumdistribution is observed which confirms that relatively reducing conditions were present throughout muchof the S1 interval (Figure 3e).
5.3. Solar-Forced Multicentennial Variability in Nile Discharge
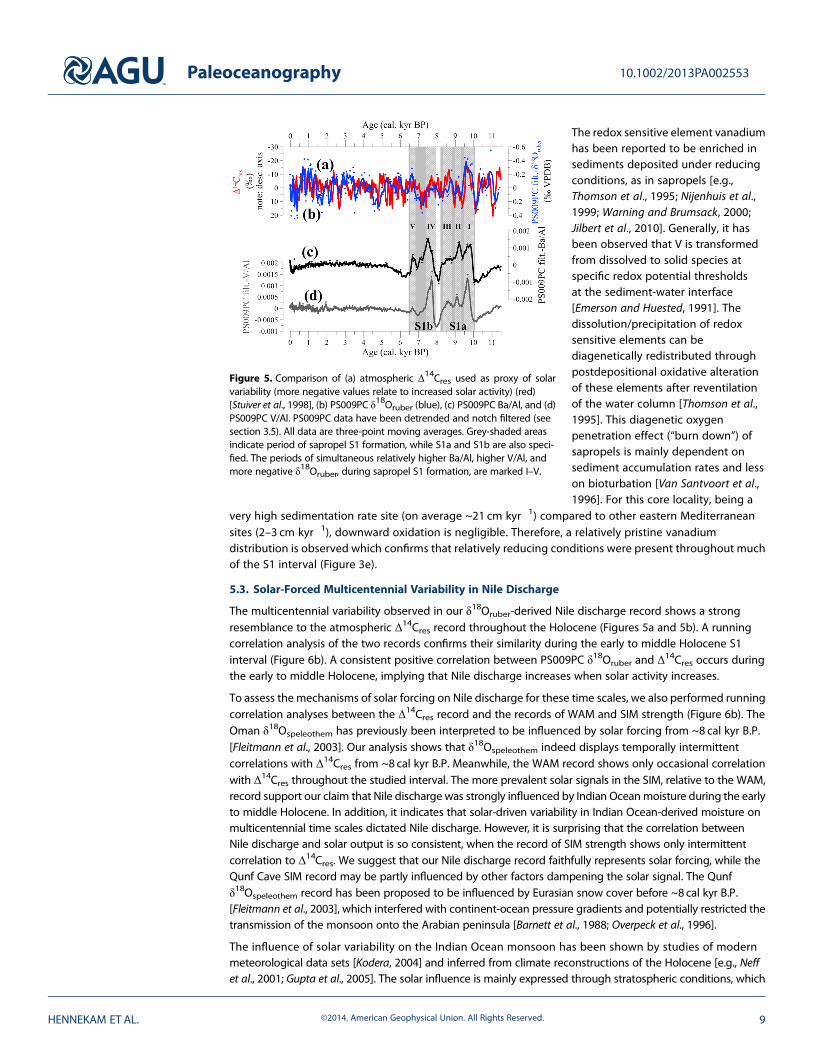
The multicentennial variability observed in our δ18Oruber-derived Nile discharge record shows a strongresemblance to the atmospheric Δ14Cres record throughout the Holocene (Figures 5a and 5b). A runningcorrelation analysis of the two records confirms their similarity during the early to middle Holocene S1interval (Figure 6b). A consistent positive correlation between PS009PC δ18Oruber and Δ14Cres occurs duringthe early to middle Holocene, implying that Nile discharge increases when solar activity increases.
To assess the mechanisms of solar forcing on Nile discharge for these time scales, we also performed runningcorrelation analyses between the Δ14Cres record and the records of WAM and SIM strength (Figure 6b). TheOman δ18Ospeleothem has previously been interpreted to be influenced by solar forcing from ~8 cal kyr B.P.[Fleitmann et al., 2003]. Our analysis shows that δ18Ospeleothem indeed displays temporally intermittentcorrelations with Δ14Cres from ~8 cal kyr B.P. Meanwhile, the WAM record shows only occasional correlationwith Δ14Cres throughout the studied interval. The more prevalent solar signals in the SIM, relative to the WAM,record support our claim that Nile discharge was strongly influenced by Indian Oceanmoisture during the earlyto middle Holocene. In addition, it indicates that solar-driven variability in Indian Ocean-derived moisture onmulticentennial time scales dictated Nile discharge. However, it is surprising that the correlation betweenNile discharge and solar output is so consistent, when the record of SIM strength shows only intermittentcorrelation to Δ14Cres. We suggest that our Nile discharge record faithfully represents solar forcing, while theQunf Cave SIM record may be partly influenced by other factors dampening the solar signal. The Qunfδ18Ospeleothem record has been proposed to be influenced by Eurasian snow cover before ~8 cal kyr B.P.[Fleitmann et al., 2003], which interfered with continent-ocean pressure gradients and potentially restricted thetransmission of the monsoon onto the Arabian peninsula [Barnett et al., 1988; Overpeck et al., 1996].
The influence of solar variability on the Indian Ocean monsoon has been shown by studies of modernmeteorological data sets [Kodera, 2004] and inferred from climate reconstructions of the Holocene [e.g., Neffet al., 2001; Gupta et al., 2005]. The solar influence is mainly expressed through stratospheric conditions, which
Figure 5. Comparison of (a) atmospheric Δ14Cres used as proxy of solarvariability (more negative values relate to increased solar activity) (red)[Stuiver et al., 1998], (b) PS009PC δ18Oruber (blue), (c) PS009PC Ba/Al, and (d)PS009PC V/Al. PS009PC data have been detrended and notch filtered (seesection 3.5). All data are three-point moving averages. Grey-shaded areasindicate period of sapropel S1 formation, while S1a and S1b are also speci-fied. The periods of simultaneous relatively higher Ba/Al, higher V/Al, andmore negative δ18Oruber, during sapropel S1 formation, are marked I–V.
Paleoceanography 10.1002/2013PA002553
HENNEKAM ET AL. ©2014. American Geophysical Union. All Rights Reserved. 9

modulate equatorial tropospheric upwelling and thus the convective activity over the Indian Ocean sector[see Kodera, 2004; Gupta et al., 2005]. Solar activity has been characterized by higher-amplitude variability in theinterval ~11 to ~8 cal kyr B.P. than averagely observed during the Holocene [Solanki et al., 2004]. Thus, the solarinfluence on Indian Ocean-derived precipitation in the Nile catchment (and hence Nile River discharge) maywell have been larger during the early to middle Holocene.
5.4. Variable Nile Discharge and Sapropel S1 Formation
The start of sapropel S1 at ~10.1 cal kyr B.P. coincides with an increase of Nile discharge (shift to depletedδ18Oruber, Figures 3a, 3c, and 3d) and with a shift to maximum activity of the SIM during the early Holocene[Fleitmann et al., 2003] (Figure 4b). This correspondence may indicate that the increasing influence of IndianOcean-derived moisture, transmitted through the River Nile, was an important final trigger for the onset ofsapropel S1 formation [see also Marino et al., 2009].
Furthermore, throughout S1, Nile discharge (δ18Oruber) varies simultaneously on multicentennial time scaleswith (export) productivity (Ba/Al) and bottom water redox conditions (V/Al) (Figures 5b–5d). Five distinctintervals of increased Nile discharge, increased (export) productivity, and increased anoxia are observed at
Figure 6. (a) Wavelet analyses of time series. Top to bottom: atmospheric Δ14Cres relative to PS009PC δ18Oruber, Ba/Al, andV/Al records (all detrended and notch filtered). See section 3.5 for further details on wavelet analysis. Black horizontaldashed lines mark periods of relatively strong power in Δ14Cres, δ
18Oruber, Ba/Al, and V/Al in the ~500 year to ~1000 yearband (arbitrary). The cone of influence, under which boundary effects might become an issue [Hammer et al., 2001], isindicated by solid red line in each wavelet. (b) Comparison of detrended and filtered data (0.256–3.333 kyr) of the timeseries. Top to bottom: Solar activity Δ14Cres [Stuiver et al., 1998], PS009PC δ18Oruber (this study), Gulf of Guinea G. ruberBa/Ca [Weldeab et al., 2007], and Oman δ18Ospeleothem [Fleitmann et al., 2003]. Results of a running correlation are indi-cated in the same color (window width = 1005 year, shift increment = 5 year) of the “monsoon” time series to Δ14Cres. The99% confidence threshold is indicated by black horizontal dashed lines (note that these are sensitive to the resampling).The asterisk indicates that the running correlation of the Gulf of Guinea G. ruber Ba/Ca has a reversed y axis; for this record anegative correlation indicates a high coherence between increased solar activity and increased monsoon activity. Theperiods of simultaneous higher Ba/Al, higher V/Al, and negative G. ruber oxygen isotope values, during sapropel S1 for-mation in core PS009PC, are marked I–V (based on Figure 5).
Paleoceanography 10.1002/2013PA002553
HENNEKAM ET AL. ©2014. American Geophysical Union. All Rights Reserved. 10

~9.7, ~9.1, ~8.6, ~7.7, and ~6.6 cal kyr B.P. Wavelet analysis confirms that these three parameters also showsimilar spectra to that of Δ14Cres, with cyclicity in 500–1000 year band (Figure 6a). Hence, it appears that solar-driven variability in Nile discharge also controlled the intensity of sapropel formation in the southeastLevantine Basin on these time scales.
Increased Nile discharge may be expected to bring more nutrients to the Levantine Basin, increasing (export)productivity, thus also decreasing bottom water oxygen content through organic matter decay [Rohling andHilgen, 1991; De Lange et al., 2008]. However, decreased ventilation (forced by an increased Nile outflow)would also decrease the bottom water oxygen content [Rossignol-Strick et al., 1982; Rohling, 1994; De Langeet al., 2008]. Core PS009PC is taken at a depth of 552 m, close to the lower boundary of the LIW today[Schilman et al., 2003]. The impact of Nile discharge on LIW formation has been indicated by modeling resultswhich show that construction of the high Aswan Dam increased LIW formation by 30% due to the effect onsalinity in the eastern Mediterranean [Skliris and Lascaratos, 2004]. Hence, periods of increased Nile dischargemay have decreased LIW formation, and vice versa, influencing the residence time of water masses at thecoring site. Nile discharge could, therefore, plausibly influence both productivity and ventilation onmulticentennial time scales.
Solar forcing of ventilation of the eastern Mediterranean during S1 has been reported previously for a deep(3400m water depth) Ionian site [Jilbert et al., 2010], implying that the influence of variable Nile discharge,and the underlying Indian Ocean monsoon influence, may have been more far reaching than the LevantineBasin alone. However, an interesting finding is the consistent coupling between export productivity (Ba/Al) andredox conditions (V/Al) on multicentennial time scales in PS009PC. Partial decoupling of these parameters,especially at very short (multidecadal) time scales, was observed by Jilbert et al. [2010] in the Ionian Sea. Thiscontrast may be partly attributed to the differing controls on ventilation of the deep eastern Mediterraneanwith respect to the Levantine Basin. At deeper sites the hydrology of northern Mediterranean subbasins(and higher latitude climate) play an important role in controlling ventilation rates, through their influence onEMDW formation [Rohling et al., 2002; Marino et al., 2009; Jilbert et al., 2010], but do not necessarily regulatenutrient availability in the open eastern Mediterranean. Meanwhile, in the southeast Levantine Basin the Niledominates both direct nutrient availability and ventilation through LIW formation.
The interruption in sapropel formation at ~8.1 cal kyr B.P. is distinct from the multicentennial variabilitymarked I–V in Figure 5 and has been found before not only in this area [Almogi-Labin et al., 2009] but also inother eastern Mediterranean cores [e.g., Casford et al., 2003]. For this event, a relatively minor positiveexcursion in δ18Oruber is observed in core PS009PC, while variability in Ba/Al (and Corg) and V/Al are relativelylarge. Although Nile discharge was reduced, it seems not to be themain cause of this event. During this eventsurface water cooling has been observed in both Aegean and Adriatic Seas [De Rijk et al., 1999; Rohling et al.,2002]. Both basins are important for EMDW formation [Schlitzer et al., 1991; Roether et al., 1996]. This coolingevent can tentatively be correlated to the well-studied ~8.2 kyr B.P. cooling event in the NorthernHemisphere [Rohling and Pälike, 2005]. In our data, Ba/Al remains relatively high compared to pre/post-S1values, while Corg and V/Al show similar values to the pre/post-S1 intervals (Figures 3c–3e). This implies thatexport productivity remained relatively high during the interruption, while redox conditions became fullyoxic, leading to efficient remineralization of newly deposited Corg. A rapid increase in ventilation seems thelikeliest explanation for this anomalous event, possibly driven by severe winter cooling of SSTs in thenorthern part of the eastern Mediterranean [Casford et al., 2003]. This shows that the predominant control onvariability within the sapropel in the study region is Nile discharge, but that this variability is also influencedby major contributions from northern climate regimes.
6. Conclusions
Our δ18Oruber record from a high sedimentation rate site in the southeast Levantine Basin may be one of thebest records yet presented of Nile discharge during the early to late Holocene, showing significant variabilityin Nile discharge on (multi)centennial time scales. The early Holocene shift to maximum Nile discharge, at~9.5 cal kyr B.P., correlates with the Southwest Indian summer monsoon record, which is fueled by IndianOcean moisture. However, this does not correlate with the Atlantic Ocean-derived West African monsoonwith its maximum at ~11.3 cal kyr B.P. This finding implies that during this time the Indian Ocean was thepredominant moisture source for Nile outflow, whereas today the Atlantic Ocean is the main source. The
Paleoceanography 10.1002/2013PA002553
HENNEKAM ET AL. ©2014. American Geophysical Union. All Rights Reserved. 11
stronger influence of Indian Ocean-derived moisture made Nile discharge susceptible to solar-forcedvariability in Indian Ocean monsoon strength, leading to large variability in Nile discharge on multicentennialtime scales. This variability in Nile discharge also influenced (export) productivity and redox conditions in thesoutheast Levantine Sea during the formation of sapropel S1, by modulating nutrient inputs andintermediate water ventilation.
ReferencesAbell, P. I., and P. Hoelzmann (2000), Holocene palaeoclimates in northwestern Sudan: Stable isotope studies on molluscs, Global Planet.
Change, 26, 1–12.Abram, N. J., M. K. Gagan, Z. Y. Liu, W. S. Hantoro, M. T. McCulloch, and B. W. Suwargadi (2007), Seasonal characteristics of the Indian Ocean
Dipole during the Holocene epoch, Nature, 445, 299–302.Almogi-Labin, A., M. Bar-Matthews, D. Shriki, E. Kolosovsky, M. Paterne, B. Schilman, A. Ayalon, Z. Aizenshtat, and A. Matthews (2009), Climatic
variability during the last ~90 ka of the southern and northern Levantine Basin as evident frommarine records and speleothems,Quat. Sci.Rev., 28, 2882–2896.
Barnett, T. P., L. Dumenil, U. Schlese, and E. Roeckner (1988), The effect of Eurasian snow cover on global climate, Science, 239, 504–507.Beuning, K. R. M., K. Kelts, J. Russell, and B. B. Wolfe (2002), Reassessment of Lake Victoria—Upper Nile River paleohydrology from oxygen
isotope records of lake-sediment cellulose, Geology, 30, 559–562.Boaretto, E., H. K. Mienis, and D. Sivan (2010), Reservoir age based on pre-bomb shells from the intertidal zone along the coast of Israel, Nucl.
Instrum. Methods Phys. Res., Sect. B, 268, 966–968.Boer, W., G. D. van den Bergh, H. de Haas, H. C. de Stigter, R. Gieles, and T. C. E. van Weering (2006), Validation of accumulation rates in Teluk
Banten (Indonesia) from commonly applied 210Pb models, using the 1883 Krakatau tephra as time marker, Mar. Geol., 227, 263–277.Bond, G. C., B. Kromer, J. Beer, R. Muscheler, M. N. Evans, W. Showers, S. Hoffmann, R. Lotti-Bond, I. Hajdas, and G. Bonani (2001), Persistent
solar influence on North Atlantic climate during the Holocene, Science, 294, 2130–2136.Bowen, G. J., and B. Wilkinson (2002), Spatial distribution of delta O-18 in meteoric precipitation, Geology, 30, 315–318.Box, M. R., M. D. Krom, R. A. Cliff, M. Bar-Matthews, A. Almogi-Labin, A. Ayalon, and M. Paterne (2011), Response of the Nile and its catchment
to millennial-scale climatic change since the LGM from Sr isotopes and major elements of East Mediterranean sediments, Quat. Sci. Rev.,30, 431–442.
Casford, J. S. L., E. J. Rohling, R. H. Abu-Zied, C. Fontanier, F. J. Jorissen, M. J. Leng, G. Schmiedl, and J. Thomson (2003), A dynamic concept foreastern Mediterranean circulation and oxygenation during sapropel formation, Palaeogeogr. Palaeoclimatol. Palaeoecol., 190, 103–119.
Castañeda, I. S., E. Schefuss, J. Patzold, J. S. Sinninghe Damsté, S. Weldeab, and S. Schouten (2010), Millennial-scale sea surface temperature changesin the eastern Mediterranean (Nile River Delta region) over the last 27,000 years, Paleoceanography, 25, PA1208, doi:10.1029/2009PA001740.
Darbyshire, I., H. Lamb, and M. Umer (2003), Forest clearance and regrowth in northern Ethiopia during the last 3000 years, Holocene, 13(4),537–546.
De Lange, G. J., J. Thomson, A. Reitz, C. P. Slomp, M. Speranza Principato, E. Erba, and C. Corselli (2008), Synchronous basin-wide formationand redox-controlled preservation of a Mediterranean sapropel, Nat. Geosci., 1, 606–610.
De Rijk, S., A. Hayes, and E. J. Rohling (1999), Eastern Mediterranean sapropel S1 interruption: An expression of the onset of climatic dete-rioration around 7 ka BP, Mar. Geol., 153, 337–343.
Emerson, S. R., and S. S. Huested (1991), Ocean anoxia and the concentrations of molybdenum and vanadium in seawater, Mar. Chem., 34,177–196.
Essallami, L., M. A. Sicre, N. Kallel, L. Labeyrie, and G. Siani (2007), Hydrological change in the Mediterranean Sea over the last 30,000 years,Geochem. Geophys. Geosyst., 8, Q07002, doi:10.1029/2007GC001587.
Fleitmann, D., S. J. Burns, M. Mudelsee, U. Neff, J. Kramers, A. Mangini, and A. Matter (2003), Holocene forcing of the Indian monsoonrecorded in a stalagmite from Southern Oman, Science, 300, 1737–1739.
Fontugne, M. R., and S. E. Calvert (1992), Late Pleistocene variability of the carbon isotopic composition of organic matter in the easternMediterranean: Monitor of changes in carbon sources and atmospheric CO2 concentrations, Paleoceanography, 7(1), 1–20,doi:10.1029/91PA02674.
Fontugne, M., M. Arnold, L. Labeyrie, M. Paterne, S. E. Calvert, and J. C. Duplessy (1994), Paleoenvironment, sapropel chronology and NileRiver discharge during the last 20,000 years as indicated by deep-sea sediment records in the eastern Mediterranean, in Late QuaternaryChronology and Paleoclimates of the Eastern Mediterranean, edited by O. Bar-Yosef and R. S. Kra, pp. 75–88, Radiocarbon, Tucson.
Foucault, A., and D. J. Stanley (1989), Late Quaternary paleoclimatic oscillations in East-Africa recorded by heavy minerals in the Nile delta,Nature, 339, 44–46.
Garcin, Y., D. Melnick, M. R. Strecker, D. Olago, and J.-J. Tiercelin (2012), East African mid-Holocene wet–dry transition recorded in palaeo-shorelines of Lake Turkana, northern Kenya Rift, Earth Planet. Sci. Lett., 331–332, 322–334.
Gupta, A. K., M. Das, and D. M. Anderson (2005), Solar influence on the Indian summer monsoon during the Holocene, Geophys. Res. Lett., 32,L17703, doi:10.1029/2005GL022685.
Hamann, Y., W. Ehrmann, G. Schmiedl, S. Krüger, J. B. Stuut, and T. Kuhnt (2008), Sedimentation processes in the Eastern Mediterranean Seaduring the Late Glacial and Holocene revealed by end-member modelling of the terrigenous fraction in marine sediments,Mar. Geol., 248,97–114.
Hamann, Y., W. Ehrmann, G. Schmiedl, and T. Kuhnt (2009), Modern and late Quaternary clay mineral distribution in the area of the SEMediterranean Sea, Quat. Res., 71, 453–464.
Hammer, Ø., D. A. T. Harper, and P. D. Ryan (2001), Past: Paleontological statistics software package for education and data analysis,Palaeontol. Electron., 4, 9.
Hecht, A., and I. Gertman (2001), Physical features of the eastern Mediterranean resulting from the integration of POEM data with RussianMediterranean Cruises, Deep Sea Res., Part I, 48, 1847–1876.
Hennekam, R., and G. De Lange (2012), X-ray fluorescence core scanning of wet marine sediments: Methods to improve quality andreproducibility of high-resolution paleoenvironmental records, Limnol. Oceanogr. Methods, 10, 991–1003.
Jilbert, T., G. J. Reichart, P. Mason, and G. J. de Lange (2010), Short-time-scale variability in ventilation and export productivity during theformation of Mediterranean sapropel S1, Paleoceanography, 25, PA4232, doi:10.1029/2010PA001955.
Kebede, S., and Y. Travi (2012), Origin of the δ18O and δ
2H composition of meteoric waters in Ethiopia, Quat. Int., 257, 4–12.
Paleoceanography 10.1002/2013PA002553
HENNEKAM ET AL. ©2014. American Geophysical Union. All Rights Reserved. 12
AcknowledgmentsWe acknowledge the useful commentsof Associate Editor David Lea and threeanonymous reviewers, which werehelpful to improve the manuscript. Wethank Arnold van Dijk for analyticalassistance with the foraminiferal oxygenisotope and total organic carbon mea-surements at the University of Utrecht.For the age model we acknowledge Pietvan Gaever for
210Pb analyses at the
NIOZ and Tomasz Goslar for14C ana-
lyses at the Poznań RadiocarbonLaboratory. We thank Lucas Lourens ofthe University of Utrecht for help withnotch filtering of the proxy records. Thecores used in this study have beenrecovered during the PASSAP cruisewith the R/V Pelagia in May 2000, as partof the PASS2-project funded by NWO.The captain, crew, and scientific partici-pants are acknowledged for theironboard collaboration. Furthermore,Ahuva Almogi-Labin is acknowledgedfor discussion on the core site location.This paper is part of the PALM-project,funded by NWO. Data is made availableupon request.
Kodera, K. (2004), Solar influence on the Indian Ocean monsoon through dynamical processes, Geophys. Res. Lett., 31, L24209,doi:10.1029/2004GL020928.
Krom, M. D., R. A. Cliff, L. M. Eijsink, B. Herut, and R. Chester (1999), The characterisation of Saharan dusts and Nile particulate matter in surfacesediments from the Levantine Basin using Sr isotopes, Mar. Geol., 155, 319–330.
Krom, M. D., J. D. Stanley, R. A. Cliff, and J. C. Woodward (2002), Nile River sediment fluctuations over the past 7000 yr and their key role insapropel development, Geology, 30, 71–74.
Lascaratos, A., R. G. Williams, and E. Tragou (1993), A mixed-layer study of the formation of Levantine Intermediate Water, J. Geophys. Res.,98(C8), 14,739–14,749, doi:10.1029/93JC00912.
Laskar, J., P. Robutel, F. Joutel, M. Gastineau, A. C. M. Correia, and B. Levrard (2004), A long-term numerical solution for the insolationquantities of the Earth, Astron. Astrophys., 428, 261–285.
Lourens, L. J., R. Wehausen, and H. J. Brumsack (2001), Geological constraints on tidal dissipation and dynamical ellipticity of the Earth overthe past three million years, Nature, 409, 1029–1033.
Marino, G., E. J. Rohling, F. Sangiorgi, A. Hayes, J. L. Casford, A. F. Lotter, M. Kucera, and H. Brinkhuis (2009), Early and middle Holocene in theAegean Sea: Interplay between high and low latitude climate variability, Quat. Sci. Rev., 28, 3246–3262.
Mercone, D., J. Thomson, I. W. Croudace, G. Siani, M. Paterne, and S. Troelstra (2000), Duration of S1, the most recent sapropel in the easternMediterranean Sea, as indicated by accelerator mass spectrometry radiocarbon and geochemical evidence, Paleoceanography, 15,336–347, doi:10.1029/1999PA000397.
Mohamed, Y. A., B. J. J. M. van den Hurk, H. H. G. Savenije, and W. G. M. Bastiaanssen (2005), Hydroclimatology of the Nile: Results from aregional climate model, Hydrol. Earth Syst. Sci., 9, 263–278.
Neff, U., S. J. Burns, A. Mangini, M. Mudelsee, D. Fleitmann, and A. Matter (2001), Strong coherence between solar variability and themonsoonin Oman between 9 and 6 kyr ago, Nature, 411, 290–293.
Nicholson, S. E. (2009), A revised picture of the structure of the “monsoon” and land ITCZ over West Africa, Clim. Dyn., 32, 1155–1171.Nijenhuis, I. A., H. J. Bosch, J. S. S. Damste, H. J. Brumsack, and G. J. De Lange (1999), Organic matter and trace element rich sapropels and
black shales: A geochemical comparison, Earth Planet. Sci. Lett., 169, 277–290.Overpeck, J., D. Anderson, S. Trumbore, and W. Prell (1996), The southwest Indian monsoon over the last 18000 years, Clim. Dyn., 12, 213–225.Paillard, D., L. Labeyrie, and P. Yiou (1996), Macintosh Program performs time-series analysis, Eos Trans. AGU, 77(39), 379–379.Pinardi, N., and E. Masetti (2000), Variability of the large scale general circulation of the Mediterranean Sea from observations and modelling:
A review, Palaeogeogr. Palaeoclimatol. Palaeoecol., 158, 153–174.Pujol, C., and C. V. Grazzini (1995), Distribution patterns of live planktic foraminifers as related to regional hydrography and productive
systems of the Mediterranean Sea, Mar. Micropaleontol., 25, 187–217.Ramsey, C. B. (2009), Bayesian analysis of radiocarbon dates, Radiocarbon, 51(1), 337–360.Reimer, P. J., and F. G. McCormac (2002), Marine radiocarbon reservoir corrections for the Mediterranean and Aegean Seas, Radiocarbon,
44(1), 159–166.Reimer, P. J., et al. (2009), Intcal09 and Marine09 radiocarbon age calibration curves, 0–50,000 years cal BP, Radiocarbon, 51(4), 1111–1150.Rodrigues, D., P. I. Abell, and S. Kropelin (2000), Seasonality in the early Holocene climate of Northwest Sudan: Interpretation of Etheria
elliptica shell isotopic data, Global Planet. Change, 26, 181–187.Roether, W., B. B. Manca, B. Klein, D. Bregant, D. Georgopoulos, V. Beitzel, V. Kovačević, and A. Luchetta (1996), Recent changes in Eastern
Mediterranean Deep Waters, Science, 271, 333–335.Rohling, E. J. (1994), Review and new aspects concerning the formation of eastern Mediterranean sapropels, Mar. Geol., 122, 1–28.Rohling, E. J., and G. R. Bigg (1998), Paleosalinity and δ18O: A critical assessment, J. Geophys. Res., 103(C1), 1307–1318, doi:10.1029/97JC01047.Rohling, E. J., and F. J. Hilgen (1991), The eastern Mediterranean climate at times of sapropel formation: A review, Geol. Mijnbouw, 70, 253–264.Rohling, E. J., and H. Pälike (2005), Centennial-scale climate cooling with a sudden cold event around 8,200 years ago, Nature, 434, 975–979.Rohling, E. J., P. A. Mayewski, R. H. Abu-Zied, J. S. L. Casford, and A. Hayes (2002), Holocene atmosphere–ocean interactions: Records from
Greenland and the Aegean Sea, Clim. Dyn., 18, 587–593.Rossignol-Strick, M., W. Nesteroff, P. Olive, and C. Vergnaud-Grazzini (1982), After the deluge: Mediterranean stagnation and sapropel
formation, Nature, 295, 105–110.Saji, N. H., B. N. Goswami, P. N. Vinayachandran, and T. Yamagata (1999), A dipole mode in the tropical Indian Ocean, Nature, 401, 360–363.Schenau, S. J., M. A. Prins, G. J. De Lange, and C. Monnin (2001), Barium accumulation in the Arabian Sea: Controls on barite preservation in
marine sediments, Geochim. Cosmochim. Acta, 65, 1545–1556.Schilman, B., M. Bar-Matthews, A. Almogi-Labin, and B. Luz (2001), Global climate instability reflected by Eastern Mediterranean marine
records during the late Holocene, Palaeogeogr. Palaeoclimatol. Palaeoecol., 176, 157–176.Schilman, B., A. Almogi-Labin, M. Bar-Matthews, and B. Luz (2003), Late Holocene productivity and hydrographic variability in the eastern
Mediterranean inferred from benthic foraminiferal stable isotopes, Paleoceanography, 18(3), 1064, doi:10.1029/2002PA000813.Schlitzer, R., W. Roether, H. Oster, H. G. Junghans, M. Hausmann, H. Johannsen, and A. Michelato (1991), Chlorofluoromethane and oxygen in
the Eastern Mediterranean, Deep Sea Res. Part A, 38, 1531–1551.Schmuker, B., and R. Schiebel (2002), Planktic foraminifers and hydrography of the eastern and northern Caribbean Sea,Mar. Micropaleontol.,
46, 387–403.Schnetger, B., H. J. Brumsack, H. Schale, J. Hinrichs, and L. Dittert (2000), Geochemical characteristics of deep-sea sediments from the Arabian
Sea: A high-resolution study, Deep Sea Res., Part II, 47, 2735–2768.Siani, G., M. Paterne, E. Michel, R. Sulpizio, A. Sbrana, M. Arnold, and G. Haddad (2001), Mediterranean sea surface radiocarbon reservoir age
changes since the Last Glacial Maximum, Science, 294, 1917–1920.Skliris, N., and A. Lascaratos (2004), Impacts of the Nile River damming on the thermohaline circulation and water mass characteristics of the
Mediterranean Sea, J. Mar. Syst., 52, 121–143.Solanki, S. K., I. G. Usoskin, B. Kromer, M. Schussler, and J. Beer (2004), Unusual activity of the Sun during recent decades compared to the
previous 11,000 years, Nature, 431, 1084–1087.Stuiver, M., and T. F. Braziunas (1993), Sun, ocean, climate and atmospheric 14CO2: An evaluation of causal and spectral relationships,
Holocene, 3, 289–305.Stuiver, M., P. J. Reimer, E. Bard, J. W. Beck, G. S. Burr, K. A. Hughen, B. Kromer, G. McCormac, J. Van der Plicht, and M. Spurk (1998), INTCAL98
radiocarbon age calibration, 24,000-0 cal BP, Radiocarbon, 40(3), 1041–1083.Thomson, J., N. C. Higgs, T. R. S. Wilson, I. W. Croudace, G. J. De Lange, and P. J. M. Van Santvoort (1995), Redistribution and geochemical
behavior of redox-sensitive elements around S1, the most recent eastern Mediterranean sapropel, Geochim. Cosmochim. Acta, 59,3487–3501.
Paleoceanography 10.1002/2013PA002553
HENNEKAM ET AL. ©2014. American Geophysical Union. All Rights Reserved. 13
Thomson, J., D. Mercone, G. J. de Lange, and P. J. M. van Santvoort (1999), Review of recent advances in the interpretation of easternMediterranean sapropel S1 from geochemical evidence, Mar. Geol., 153, 77–89.
Tierney, J. E., S. C. Lewis, B. I. Cook, A. N. LeGrande, and G. A. Schmidt (2011), Model, proxy and isotopic perspectives on the East AfricanHumid Period, Earth Planet. Sci. Lett., 307, 103–112.
Van Santvoort, P. J. M., G. J. De Lange, J. Thomson, H. Cussen, T. R. S. Wilson, M. D. Krom, and K. Ströhle (1996), Active post-depositionaloxidation of the most recent sapropel (S1) in sediments of the eastern Mediterranean Sea, Geochim. Cosmochim. Acta, 60, 4007–4024.
Van Santvoort, P. J. M., G. J. De Lange, C. G. Langereis, M. J. Dekkers, and M. Paterne (1997), Geochemical and paleomagnetic evidence for theoccurrence of “missing” sapropels in eastern Mediterranean sediments, Paleoceanography, 12, 773–786, doi:10.1029/97PA01351.
Wang, Y., H. Cheng, R. L. Edwards, Y. He, X. Kong, Z. An, J. Wu, M. J. Kelly, C. A. Dykoski, and X. Li (2005), The Holocene Asian monsoon: Links tosolar changes and North Atlantic climate, Science, 308, 854–857.
Warning, B., and H. J. Brumsack (2000), Trace metal signatures of eastern Mediterranean sapropels, Palaeogeogr. Palaeoclimatol. Palaeoecol.,158, 293–309.
Wehausen, R., and H. J. Brumsack (1999), Cyclic variations in the chemical composition of eastern Mediterranean Pliocene sediments: A keyfor understanding sapropel formation, Mar. Geol., 153, 161–176.
Wehausen, R., and H. J. Brumsack (2000), Chemical cycles in Pliocene sapropel-bearing and sapropel-barren eastern Mediterranean sedi-ments, Palaeogeogr. Palaeoclimatol. Palaeoecol., 158, 325–352.
Weldeab, S., D. W. Lea, R. R. Schneider, and N. Andersen (2007), 155,000 years of West African monsoon and ocean thermal evolution, Science,316, 1303–1307.
Williams, M., M. Talbot, P. Aharon, Y. Abdl Salaam, F. Williams, and K. Inge Brendeland (2006), Abrupt return of the summer monsoon15,000 years ago: New supporting evidence from the lower White Nile Valley and Lake Albert, Quat. Sci. Rev., 25, 2651–2665.
Wüst, G. (1961), On the vertical circulation of the Mediterranean Sea, J. Geophys. Res., 66, 3261–3271, doi:10.1029/JZ066i010p03261.
Paleoceanography 10.1002/2013PA002553
HENNEKAM ET AL. ©2014. American Geophysical Union. All Rights Reserved. 14