Soils in the Bulia micro watershed of Gorontalo province ...
33
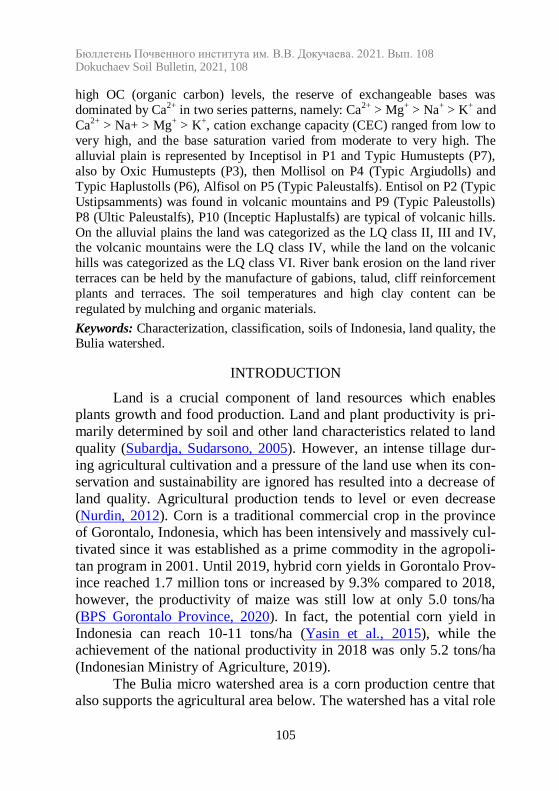
Бюллетень Почвенного института им. В.В. Докучаева. 2021. Вып. 108 Dokuchaev Soil Bulletin, 2021, 108 104 UDC 631.4 DOI: 10.19047/0136-1694-2021-108-104-136 Cite this article as: Nurdin, Rayes M.L., Soemarno, Sudarto, Listyarini E., Agustina C., Rahman R., Rauf A., Husain J., Soils in the Bulia micro watershed of Gorontalo province, Indonesia, and their quality assessment, Dokuchaev Soil Bulletin, 2021, V. 108, pp. 104-136, DOI: 10.19047/0136-1694-2021-108-104-136 Acknowledgments: We would like to pay our regards to the Faculty of Agriculture, Brawijaya University who has funded this research with a non-tax state revenue grant in accordance with the Budget Implementation List Number: DIPA- 042.01.2.400919/2019. Soils in the Bulia micro watershed of Gorontalo province, Indonesia, and their quality assessment © 2021 Nurdin 1* , M. L. Rayes 2 , Soemarno 2 , Sudarto 2 , E. Listyarini 2 , C. Agustina 2 , R. Rahman 1 , A. Rauf 3 , J. Husain 4 1 Department of Agrotechnology, Gorontalo State University, Prof. Dr. Ing. B. J. Habibie Str., Moutong Village, 96554 Bone Bolango, Indonesia, * https://orcid.org/0000-0001-5725-5694, e-mail: [email protected]. 2 Department of Soil Science, Brawijaya University, No. 54 Veteran Str., Lowokwaru, 65145 Malang, Indonesia. 3 Department of Agribussiness, Gorontalo State University, Prof. Dr. Ing. B. J. Habibie Str., Moutong Village, 96554 Bone Bolango, Indonesia. 4 Department of Soil Science, Sam Ratulangi University, No. 1 Kleak Bahu Str., Kleak, 95115 Manado, Indonesia. Received 12.07.2021, Revised 24.08.2021, Accepted 20.09.2021 Abstract: Ten representative pedons from the Bulia micro watershed of Gorontalo Province, Indonesia, were characterized and classified to determine its land quality (LQ) class. Angular blocky, sticky, plastic consistencies and a hard consistency prevailed in the soil structure. In the alluvial plains the soil texture is dominated by the clay fraction, while in the hills and volcanic mountains the sand fraction is dominated. The soils in the Bulia micro watershed also have acid to neutral reaction, with the range of very low to
-
Upload
khangminh22 -
Category
Documents
-
view
0 -
download
0
Transcript of Soils in the Bulia micro watershed of Gorontalo province ...
Бюллетень Почвенного института им. В.В. Докучаева. 2021. Вып. 108 Dokuchaev Soil Bulletin, 2021, 108
104
UDC 631.4
DOI: 10.19047/0136-1694-2021-108-104-136
Cite this article as:
Nurdin, Rayes M.L., Soemarno, Sudarto, Listyarini E., Agustina C., Rahman
R., Rauf A., Husain J., Soils in the Bulia micro watershed of Gorontalo
province, Indonesia, and their quality assessment, Dokuchaev Soil Bulletin, 2021, V. 108, pp. 104-136, DOI: 10.19047/0136-1694-2021-108-104-136
Acknowledgments:
We would like to pay our regards to the Faculty of Agriculture, Brawijaya
University who has funded this research with a non-tax state revenue grant in
accordance with the Budget Implementation List Number: DIPA-
042.01.2.400919/2019.
Soils in the Bulia micro watershed of Gorontalo
province, Indonesia, and their quality assessment
© 2021 Nurdin1*
, M. L. Rayes2, Soemarno
2, Sudarto
2,
E. Listyarini2, C. Agustina
2, R. Rahman
1, A. Rauf
3, J. Husain
4
1Department of Agrotechnology, Gorontalo State University,
Prof. Dr. Ing. B. J. Habibie Str., Moutong Village,
96554 Bone Bolango, Indonesia, *https://orcid.org/0000-0001-5725-5694, e-mail: [email protected].
2Department of Soil Science, Brawijaya University,
No. 54 Veteran Str., Lowokwaru, 65145 Malang, Indonesia. 3Department of Agribussiness, Gorontalo State University,
Prof. Dr. Ing. B. J. Habibie Str., Moutong Village, 96554 Bone Bolango, Indonesia.
4Department of Soil Science, Sam Ratulangi University,
No. 1 Kleak Bahu Str., Kleak, 95115 Manado, Indonesia.
Received 12.07.2021, Revised 24.08.2021, Accepted 20.09.2021
Abstract: Ten representative pedons from the Bulia micro watershed of
Gorontalo Province, Indonesia, were characterized and classified to determine
its land quality (LQ) class. Angular blocky, sticky, plastic consistencies and a
hard consistency prevailed in the soil structure. In the alluvial plains the soil
texture is dominated by the clay fraction, while in the hills and volcanic
mountains the sand fraction is dominated. The soils in the Bulia micro
watershed also have acid to neutral reaction, with the range of very low to
Бюллетень Почвенного института им. В.В. Докучаева. 2021. Вып. 108 Dokuchaev Soil Bulletin, 2021, 108
105
high OC (organic carbon) levels, the reserve of exchangeable bases was
dominated by Ca2+ in two series patterns, namely: Ca2+ > Mg+ > Na+ > K+ and
Ca2+ > Na+ > Mg+ > K+, cation exchange capacity (CEC) ranged from low to
very high, and the base saturation varied from moderate to very high. The
alluvial plain is represented by Inceptisol in P1 and Typic Humustepts (P7),
also by Oxic Humustepts (P3), then Mollisol on P4 (Typic Argiudolls) and
Typic Haplustolls (P6), Alfisol on P5 (Typic Paleustalfs). Entisol on P2 (Typic
Ustipsamments) was found in volcanic mountains and P9 (Typic Paleustolls)
P8 (Ultic Paleustalfs), P10 (Inceptic Haplustalfs) are typical of volcanic hills.
On the alluvial plains the land was categorized as the LQ class II, III and IV, the volcanic mountains were the LQ class IV, while the land on the volcanic
hills was categorized as the LQ class VI. River bank erosion on the land river
terraces can be held by the manufacture of gabions, talud, cliff reinforcement
plants and terraces. The soil temperatures and high clay content can be
regulated by mulching and organic materials.
Keywords: Characterization, classification, soils of Indonesia, land quality, the Bulia watershed.
INTRODUCTION
Land is a crucial component of land resources which enables plants growth and food production. Land and plant productivity is pri-
marily determined by soil and other land characteristics related to land
quality (Subardja, Sudarsono, 2005). However, an intense tillage dur-
ing agricultural cultivation and a pressure of the land use when its con-servation and sustainability are ignored has resulted into a decrease of
land quality. Agricultural production tends to level or even decrease
(Nurdin, 2012). Corn is a traditional commercial crop in the province of Gorontalo, Indonesia, which has been intensively and massively cul-
tivated since it was established as a prime commodity in the agropoli-
tan program in 2001. Until 2019, hybrid corn yields in Gorontalo Prov-ince reached 1.7 million tons or increased by 9.3% compared to 2018,
however, the productivity of maize was still low at only 5.0 tons/ha
(BPS Gorontalo Province, 2020). In fact, the potential corn yield in
Indonesia can reach 10-11 tons/ha (Yasin et al., 2015), while the achievement of the national productivity in 2018 was only 5.2 tons/ha
(Indonesian Ministry of Agriculture, 2019).
The Bulia micro watershed area is a corn production centre that also supports the agricultural area below. The watershed has a vital role
Бюллетень Почвенного института им. В.В. Докучаева. 2021. Вып. 108 Dokuchaev Soil Bulletin, 2021, 108
106
because it supplies irrigation water for agriculture and other activities
(Mahapatra et al., 2019). The corn cultivation in this watershed has ex-
ceeded the carrying capacity indicated for the corn planting on the slope of >25%, so that the land degradation often occurs. Soil erosion,
according to the corn agropolitan program of Gorontalo, reached 1,396
tons/ha/year (Husain et al., 2004). Meanwhile, the corn productivity in
this area is only 5.0 tons/ha (BPS Gorontalo Regency, 2020), which could happen due to the fact that the crop was cultivated on a non-
suitable land.
Soil characterization is essential because it provides some neces-sary information about the soil characteristics for growing plants (Devi
et al., 2015). For sustainable management of soil resources in agroeco-
logical areas we need timely monitoring of significant physical, chemi-
cal and biological soil characteristics and responses to the changes in land management (Supriya et al., 2019). These soil characteristics then
form the basis for land classification. Combining soil characterization
with classification is a powerful tool to develop management strategies for food security and environmental sustainability (Satish et al., 2018).
However, the efforts to link land characteristics and classification with
a specific land quality are still relatively rare. Land quality is a land ability to perform a specific function before the land is degraded (Bein-
roth et al., 2001). Understanding soil types and their distribution, its
limits and potential is essential for a proper management to increase
productivity and yields (Niranjana et al., 2011). The survey and mapping of soil resources in the Paguyaman wa-
tershed were carried out by the Soil and Agro-climate Research Centre
of the Indonesian Ministry of Agriculture (Puslittanak Research Team, 1995), however, the mapping scale was 1 : 50,000. In 2010, some re-
search was carried out on the development, classification and potential
of the paddy soils on toposequence (Nurdin, 2010), however, it only focused on the rainfed paddy soils, while the dry land was only com-
pared to the locations close to the soil pedon in the rice fields. Consid-
ering the high intensity of the land management and the massive corn
cultivation in this sub-watershed, this research has become significant.
MATERIALS AND METHODS
Study location
Бюллетень Почвенного института им. В.В. Докучаева. 2021. Вып. 108 Dokuchaev Soil Bulletin, 2021, 108
107
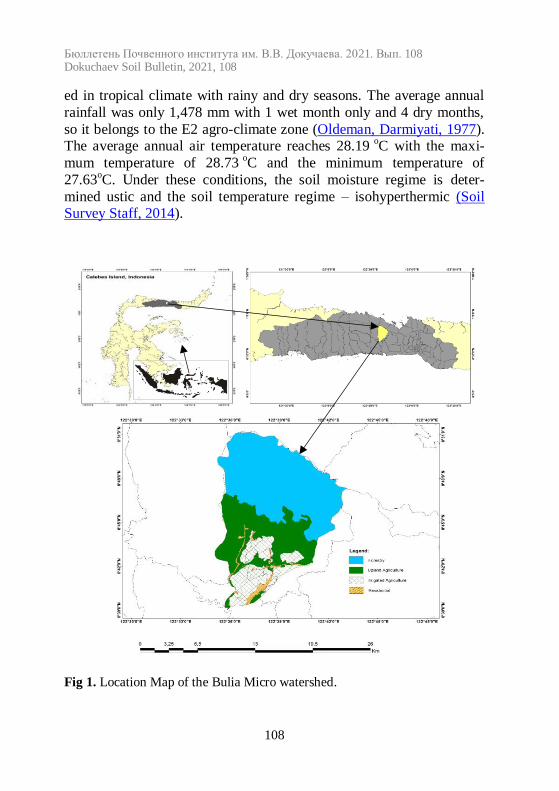
The Bulia micro watershed is a part of the Paguyaman
watershed located in the northern part, it covers Mootilango and
Boliyohuto District of Gorontalo Regency of Gorontalo Province, Indonesia (Figure 1). Geographically, the research location is between
0o39′123″ and 0
o51′321″ N, 122
o35′21″ and 122
o43′12″ S (Table 1),
which is 67 km from Gorontalo City, Indonesia.
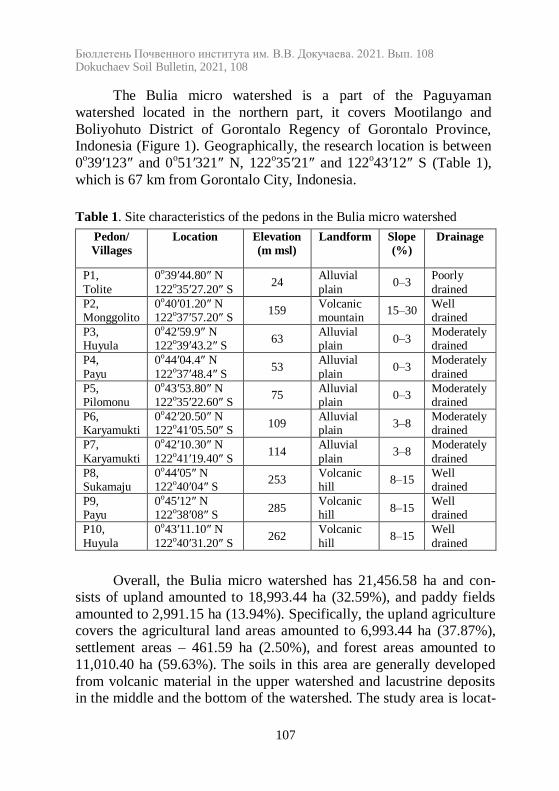
Table 1. Site characteristics of the pedons in the Bulia micro watershed
Pedon/
Villages
Location Elevation
(m msl)
Landform Slope
(%)
Drainage
P1,
Tolite
0o39′44.80″ N
122o35′27.20″ S 24
Alluvial
plain 0–3
Poorly
drained
P2, Monggolito
0o40′01.20″ N 122o37′57.20″ S
159 Volcanic mountain
15–30 Well drained
P3, Huyula
0o42′59.9″ N 122o39′43.2″ S
63 Alluvial plain
0–3 Moderately drained
P4,
Payu
0o44′04.4″ N
122o37′48.4″ S 53
Alluvial
plain 0–3
Moderately
drained
P5, Pilomonu
0o43′53.80″ N 122o35′22.60″ S
75 Alluvial plain
0–3 Moderately drained
P6, Karyamukti
0o42′20.50″ N 122o41′05.50″ S
109 Alluvial plain
3–8 Moderately drained
P7,
Karyamukti
0o42′10.30″ N
122o41′19.40″ S 114
Alluvial
plain 3–8
Moderately
drained
P8, Sukamaju
0o44′05″ N 122o40′04″ S
253 Volcanic hill
8–15 Well drained
P9, Payu
0o45′12″ N 122o38′08″ S
285 Volcanic hill
8–15 Well drained
P10,
Huyula
0o43′11.10″ N
122o40′31.20″ S 262
Volcanic
hill 8–15
Well
drained
Overall, the Bulia micro watershed has 21,456.58 ha and con-sists of upland amounted to 18,993.44 ha (32.59%), and paddy fields
amounted to 2,991.15 ha (13.94%). Specifically, the upland agriculture covers the agricultural land areas amounted to 6,993.44 ha (37.87%),
settlement areas – 461.59 ha (2.50%), and forest areas amounted to
11,010.40 ha (59.63%). The soils in this area are generally developed
from volcanic material in the upper watershed and lacustrine deposits in the middle and the bottom of the watershed. The study area is locat-
Бюллетень Почвенного института им. В.В. Докучаева. 2021. Вып. 108 Dokuchaev Soil Bulletin, 2021, 108
108
ed in tropical climate with rainy and dry seasons. The average annual
rainfall was only 1,478 mm with 1 wet month only and 4 dry months,
so it belongs to the E2 agro-climate zone (Oldeman, Darmiyati, 1977). The average annual air temperature reaches 28.19
oC with the maxi-
mum temperature of 28.73 oC and the minimum temperature of
27.63oC. Under these conditions, the soil moisture regime is deter-
mined ustic and the soil temperature regime – isohyperthermic (Soil Survey Staff, 2014).
Fig 1. Location Map of the Bulia Micro watershed.
Бюллетень Почвенного института им. В.В. Докучаева. 2021. Вып. 108 Dokuchaev Soil Bulletin, 2021, 108
109
Soil surveying, characterization and classification
Ten representative pedons were selected to conduct the soil sur-
vey. The description of soil morphology refers to the Soil Survey Man-ual (Soil Science Manual, 2017; Sukarman et al., 2017). According to
standard procedures, soil samples were taken at each horizon and their
physical and chemical properties were analyzed (Jackson, 1973;
Eviyati, Sulaeman, 2009). The morphological and the soil properties data obtained during the laboratory analysis are used for the soil char-
acterization together with the climate and the terrain conditions data,
according to Sukarman et al. (2017). The soil characteristics are used for soil classification according to the keys to soil taxonomy (Soil
Survey Staff, 2014).
Land quality assessment
Land quality (LQ) class assessment follows the method accord-ing to Beinroth et al. (2001). This method has been modified based on
availability of soil characteristics and classification data without in-
cluding local population data. Soil pedons (P), which were classified in taxa according to the Soil Taxonomy System (Soil Survey Staff, 2014),
were combined with a land unit (LU) basing on the similarity of the
criteria in taxa. Soil and pedoclimate information was used to place each LU into I to IX land quality classes with class I having the most
appropriate attributes and class IX having the least suitable ones for
crop production. The results of the land quality analysis are widely pre-
sented and described with the help of Arc GIS.
RESULTS AND DISCUSSION
Morphology and soil physical properties
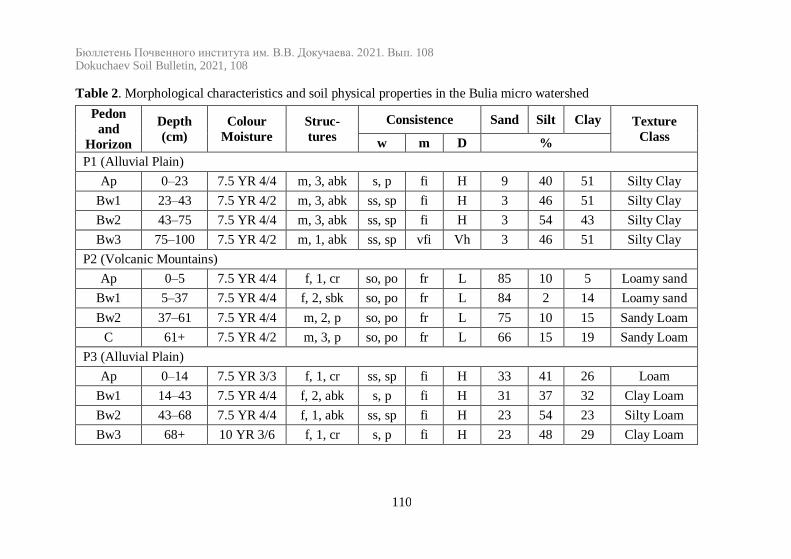
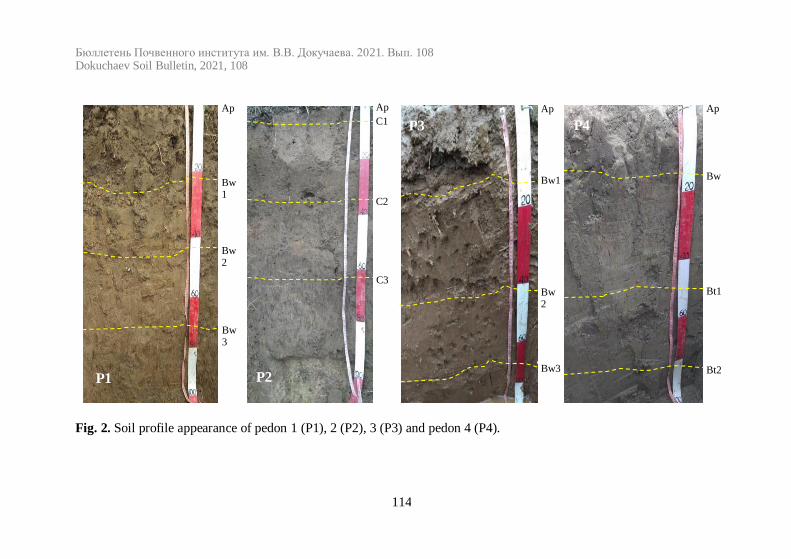
The results of field studies and the laboratory characterization of ten soil pedons were presented in Table 2, Figure 2. The soils in the
study area have been developed as indicated by the horizon structuring
(horizons A and B), with the depth of the soil solum varying from shal-low to very deep. The soil colour is only of 7.5YR and 10YR hue,
where 7.5YR is dominant. P1, P2, P3, P5, P8, P9 and P10 soil colour
varies from dark brown, brown to strong brown with hue 7.5YR, rang-
ing from 3 to 5, and chroma – from 1 to 6.
Бюллетень Почвенного института им. В.В. Докучаева. 2021. Вып. 108 Dokuchaev Soil Bulletin, 2021, 108
110
Table 2. Morphological characteristics and soil physical properties in the Bulia micro watershed
Pedon
and
Horizon
Depth
(cm)
Colour
Moisture
Struc-
tures
Consistence Sand Silt Clay Texture
Class w m D %
P1 (Alluvial Plain)
Ap 0–23 7.5 YR 4/4 m, 3, abk s, p fi H 9 40 51 Silty Clay
Bw1 23–43 7.5 YR 4/2 m, 3, abk ss, sp fi H 3 46 51 Silty Clay
Bw2 43–75 7.5 YR 4/4 m, 3, abk ss, sp fi H 3 54 43 Silty Clay
Bw3 75–100 7.5 YR 4/2 m, 1, abk ss, sp vfi Vh 3 46 51 Silty Clay
P2 (Volcanic Mountains)
Ap 0–5 7.5 YR 4/4 f, 1, cr so, po fr L 85 10 5 Loamy sand
Bw1 5–37 7.5 YR 4/4 f, 2, sbk so, po fr L 84 2 14 Loamy sand
Bw2 37–61 7.5 YR 4/4 m, 2, p so, po fr L 75 10 15 Sandy Loam
C 61+ 7.5 YR 4/2 m, 3, p so, po fr L 66 15 19 Sandy Loam
P3 (Alluvial Plain)
Ap 0–14 7.5 YR 3/3 f, 1, cr ss, sp fi H 33 41 26 Loam
Bw1 14–43 7.5 YR 4/4 f, 2, abk s, p fi H 31 37 32 Clay Loam
Bw2 43–68 7.5 YR 4/4 f, 1, abk ss, sp fi H 23 54 23 Silty Loam
Bw3 68+ 10 YR 3/6 f, 1, cr s, p fi H 23 48 29 Clay Loam
Бюллетень Почвенного института им. В.В. Докучаева. 2021. Вып. 108 Dokuchaev Soil Bulletin, 2021, 108
111
Pedon
and
Horizon
Depth
(cm)
Colour
Moisture
Struc-
tures
Consistence Sand Silt Clay
Texture
Class w m D
P4 (Alluvial Plain)
Ap 0–14 10 YR 3/3 m, 3, abk s, p fi H 27 26 47 Clay
Bw 14–50 10 YR 4/3 f, 1, abk s, p fi H 32 34 34 Clay Loam
Bt1 50–81 10 YR 3/2 f, 1, abk ss, sp fi H 12 24 64 Clay
Bt2 81+ 7.5 YR 4/1 f, 1, abk s, p fi H 16 25 59 Clay
P5 (Alluvial Plain)
Ap 0–21 7.5 YR 4/4 f, 2, sbk ss, sp fi H 23 43 34 Clay Loam
Bw 21–46 7.5 YR 4/4 f, 2, sbk ss, sp fi H 23 48 29 Clay Loam
Bt1 46–84 7.5 YR 4/3 f, 2, abk s, p fi H 25 35 40 Clay
Bt2 84–117 7.5 YR 4/6 m, 2, p s, p fi H 24 36 40 Clay
Btg 117+ 7.5 YR 5/8 m, 1, sbk ss, sp fi H 8 46 46 Silty Clay
P6 (Alluvial Plain)
Ap 0–12 10 YR 3/3 f, 1, abk s, p fi H 84 15 1 Loamy Sand
Bw1 12–34 10 YR 3/4 f, 1, abk s, p fi H 61 10 29 Sandy Clay
Loam
Bw2 34–71 10 YR 4/6 m, 3, abk ss, sp fi H 61 24 15 Sandy Loam
C 71–90 7.5 YR 5/8 f, 1, cr so, po fr L 84 5 11 Loamy Sand
Бюллетень Почвенного института им. В.В. Докучаева. 2021. Вып. 108 Dokuchaev Soil Bulletin, 2021, 108
112
Pedon
and
Horizon
Depth
(cm)
Colour
Moisture
Struc-
tures
Consistence Sand Silt Clay
Texture
Class w m D
P7 (Alluvial Plain)
Ap 0–6 7.5 YR 4/6 m, 1, abk s, p fi H 33 11 56 Clay
Bw1 6–17 10 YR 4/6 m, 3, sbk s, p fi H 29 20 51 Clay
Bw2 17–33 10 YR 3/6 m, 1, abk ss, sp fi H 21 20 59 Clay
Bt 33–49 10 YR 3/6 f, 1, p ss, sp fi H 19 15 66 Clay
BC 49+ 7.5 YR 4/6 f, 1, abk ss, sp fi H 18 29 53 Clay
P8 (Volcanic Hills)
Ap 0–7 7.5 YR 3/3 f, 1, abk ss, sp fi H 64 10 26 Sandy Clay
Loam
Bw 7–24 7.5 YR 3/3 m, 1, abk s, p fi H 47 24 29 Sandy Clay
Loam
Bt1 24–44 7.5 YR 4/6 f, 3, p s, p fi H 45 15 40 Sandy Clay
Bt2 44–63 7.5 YR 5/6 m, 3, abk s, p fi H 42 16 42 Clay
Bt3 63+ 7.5 YR 5/6 m, 1, abk s, p fi H 42 6 52 Clay
Бюллетень Почвенного института им. В.В. Докучаева. 2021. Вып. 108 Dokuchaev Soil Bulletin, 2021, 108
113
Pedon
and
Horizon
Depth
(cm)
Colour
Moisture
Struc-
tures
Consistence Sand Silt Clay
Texture
Class w m D
P9 (Volcanic Hills)
Ap 0–16 7.5 YR 3/2 m, 3, abk vs, vp vfi Vh 54 31 15 Sandy Loam
Bw 16–34 7.5 YR 3/3 m, 1, abk s, p fi H 42 24 34 Clay Loam
Bt 34+ 7.5 YR 4/4 m, 1, abk ss. sp fi H 50 15 35 Sandy Clay
P10 (Volcanic Hills)
Ap 0–20 7.5 YR 3/3 m, 3, abk ss, sp fi H 48 26 26 Sandy Clay
Loam
Bt1 20–44 7.5 YR 3/4 m, 3, abk s, p fi H 41 15 44 Clay
Bt2 44–76 7.5 YR 4/6 c, 3, sbk s, p fi H 42 14 44 Clay
BC 76+ 5 YR 4/6 c, 3, p vs, vp vfi Vh 31 2 67 Clay
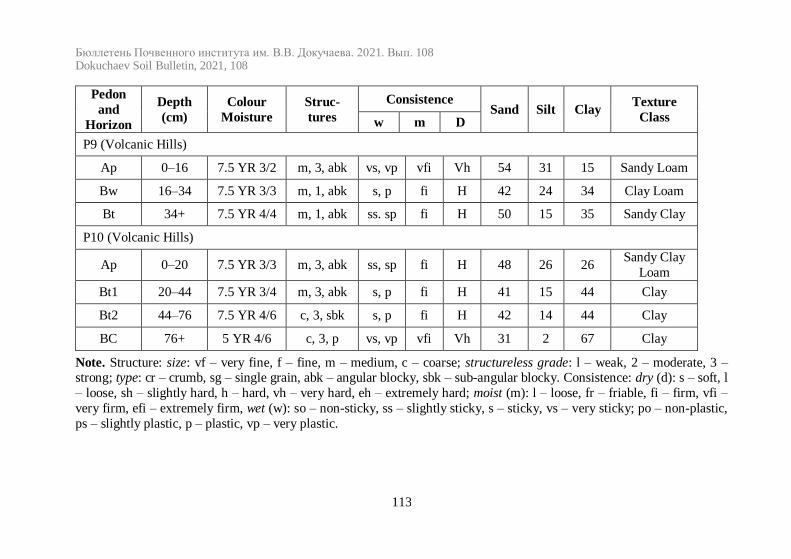
Note. Structure: size: vf – very fine, f – fine, m – medium, c – coarse; structureless grade: l – weak, 2 – moderate, 3 – strong; type: cr – crumb, sg – single grain, abk – angular blocky, sbk – sub-angular blocky. Consistence: dry (d): s – soft, l
– loose, sh – slightly hard, h – hard, vh – very hard, eh – extremely hard; moist (m): l – loose, fr – friable, fi – firm, vfi –
very firm, efi – extremely firm, wet (w): so – non-sticky, ss – slightly sticky, s – sticky, vs – very sticky; po – non-plastic,
ps – slightly plastic, p – plastic, vp – very plastic.
Бюллетень Почвенного института им. В.В. Докучаева. 2021. Вып. 108 Dokuchaev Soil Bulletin, 2021, 108
114
Fig. 2. Soil profile appearance of pedon 1 (P1), 2 (P2), 3 (P3) and pedon 4 (P4).
Ap
Bw3
Bw2
Bw1
Ap
C3
C2
C1
Ap
Bw3
Bw2
Bw1
Ap
Bt2
Bt1
Bw
P1 P2
P3 P4
Бюллетень Почвенного института им. В.В. Докучаева. 2021. Вып. 108 Dokuchaev Soil Bulletin, 2021, 108
115
While in P4, P6 and P7, soil colour varies from very dark gray-
ish brown, dark brown to dark yellowish-brown with hue 10YR, values
ranging from 3 to 4, and chroma – from 2 to 6. The colour of soil hori-zon A is darker than of horizon B due to the fact that the organic matter
content in horizon A is higher than in horizon B (Yatno et al., 2015).
The higher the organic matter content, the darker the soil colour is
(Suharta, 2007). Soil colour seems to be a function of chemical and mineralogical composition (Swarnam et al., 2004; Walia, Rao, 1997),
and the soil texture is influenced by topographic position and humidity
regimes (Walia, Rao, 1997). The soil structure varies from crumbs, angular blocky, sub angu-
lar blocky to prismatic, with the dominant angular blocky. P1, P3, P4,
P6, P7, P8, P9 and P10 were mostly of angular blocky structure with
the sizes varying from fine, medium to coarse, with weak and strong structural development. While the soil structures of P2 and P5 varies
between crumbs, angular blocky, sub angular blocky and prismatic
with the sizes ranging from fine, medium to coarse and the level of the soil structure development varying from weak, moderate to strong. The
angular blocky soil structures were strongly associated with higher clay
fractions (Devi et al., 2015). Crumbly soil structure indicates newly developed soil (Manik et al., 2017). Intensive soil tillage results in soil
structure disturbance (Jambak et al., 2017). The variation of soil struc-
ture will be consistently affecting the soil.
The soil consistency in wet conditions varies between non-sticky and non-plastic on Pedon 2, slightly sticky and slightly plastic, sticky
and plastic in the horizon on P1, P3, P4, P5, P6, P7, P8, P9 and P10,
very sticky and very plastic on the surface horizon (Ap) of P9 and the subsurface horizon (BC) of P10, however, slightly sticky and slightly
plastic consistencies prevail. While in moist conditions the consisten-
cies vary from loose, firm to very firm, the firm consistencies are still dominant. P1, P3, P4, P5, P6, P7, P8, P9 and P10 were dominated by
hard consistencies, while P2 – by loose ones. There is a very hard con-
sistency in P1 and P10 in the subsurface horizon (Bw and BC), while in
the surface horizon (Ap) a very hard consistency can be only found in P9. The consistency in dry conditions varies from loose, hard to very
hard, with a dominant hard consistency. P1, P3, P4, P5, P6, P7, P8, P9
and P10 were dominated by a hard consistency, however, in P1 and
Бюллетень Почвенного института им. В.В. Докучаева. 2021. Вып. 108 Dokuchaev Soil Bulletin, 2021, 108
116
P10 in the subsurface horizon (Bw3 and BC) one could notice a very
hard consistency, while in P9 precisely a very hard consistency was
found on the surface horizon (Ap). Sticky and plastic consistency might form due to a high clay content in the soil (Sarkar et al., 2001);
(Kadao et al., 2003), while non-sticky and non-plastic consistency
might form due to a very little clay content (Sireesha, Naidu, 2015;
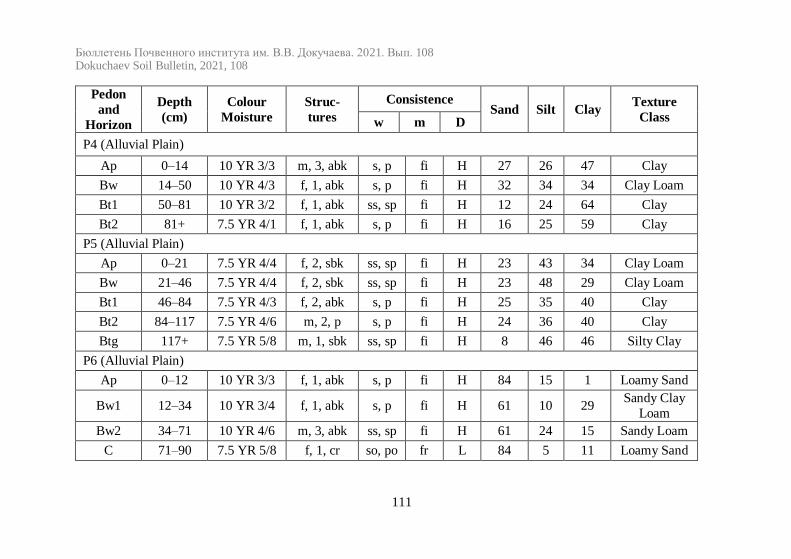
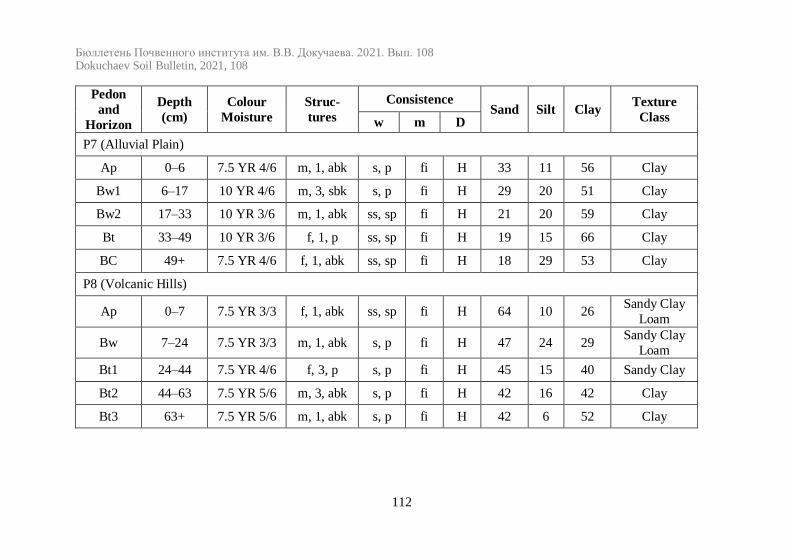
Devi et al., 2015). The soil texture of all pedons varies greatly between sandy clay
loam, sandy loam, loamy sand, sandy loam, silty loam, clay loam, silty
clay and clay, except for P7 that was of clay texture in all horizons. Wide variations of soil texture may be caused by the variations in par-
ent material, topography, in-situ weathering, translocation of clays by
eluviation and soil age (Satish et al., 2018). Apparently, the pedons
located in the alluvial group were more dominated by clay fractions, although the distribution patterns were irregular. The distribution of
irregular clay fractions was typical for sediment materials (Nurdin,
2010). While a sand fraction dominated the volcanic group, the distri-bution of sand and clay fractions shows the opposite pattern. A de-
crease in the sand fraction is due to the clay illuviation and in-situ min-
eral destruction process, which was characterized by a decline in the absolute amount of sand in the middle of the solum (Rachim, 1994).
The texture that is found in the subsurface horizon is caused by higher
weathering in the subsurface layer (Dutta, 2009). The clay content in
the solum middles (B-illuviation) was higher than in the upper horizon (A-eluviation) and in the lower layer horizon. This indicates the occur-
rence of a lessivage process with some clay skins seen, so that an argil-
lic horizon was formed in P4, P5, P8, P9 and P10. Although the pro-cess of eluviation and illuviation occurred, the pedon remained, but the
clay skins were not found, so the cambic and candic horizons were
formed. Soil chemical properties
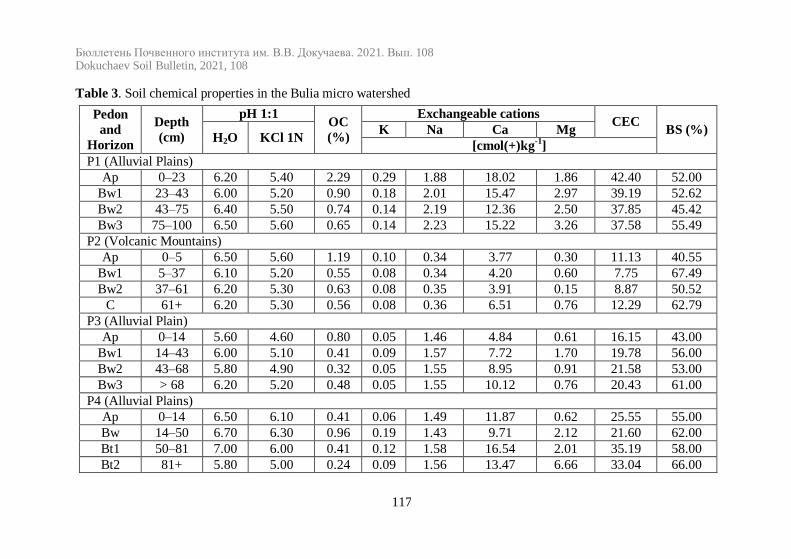
Soil chemical properties are presented in Table 3. Soil pH varies
from acid (pH 5.3) to neutral (pH 7.2). The pedons located on the upper
watershed or in volcanic groups (P2, P8, P9 and P10) have a lower pH than the ones located on the lower watershed or in alluvial groups (P1,
P3, P4, P5, P6, and P7).
Бюллетень Почвенного института им. В.В. Докучаева. 2021. Вып. 108 Dokuchaev Soil Bulletin, 2021, 108
117
Table 3. Soil chemical properties in the Bulia micro watershed
Pedon
and
Horizon
Depth
(cm)
pH 1:1 OC
(%)
Exchangeable cations CEC
BS (%) H2O KCl 1N
K Na Ca Mg
[cmol(+)kg-1
]
P1 (Alluvial Plains)
Ap 0–23 6.20 5.40 2.29 0.29 1.88 18.02 1.86 42.40 52.00
Bw1 23–43 6.00 5.20 0.90 0.18 2.01 15.47 2.97 39.19 52.62
Bw2 43–75 6.40 5.50 0.74 0.14 2.19 12.36 2.50 37.85 45.42
Bw3 75–100 6.50 5.60 0.65 0.14 2.23 15.22 3.26 37.58 55.49
P2 (Volcanic Mountains)
Ap 0–5 6.50 5.60 1.19 0.10 0.34 3.77 0.30 11.13 40.55
Bw1 5–37 6.10 5.20 0.55 0.08 0.34 4.20 0.60 7.75 67.49
Bw2 37–61 6.20 5.30 0.63 0.08 0.35 3.91 0.15 8.87 50.52
C 61+ 6.20 5.30 0.56 0.08 0.36 6.51 0.76 12.29 62.79
P3 (Alluvial Plain)
Ap 0–14 5.60 4.60 0.80 0.05 1.46 4.84 0.61 16.15 43.00
Bw1 14–43 6.00 5.10 0.41 0.09 1.57 7.72 1.70 19.78 56.00
Bw2 43–68 5.80 4.90 0.32 0.05 1.55 8.95 0.91 21.58 53.00
Bw3 > 68 6.20 5.20 0.48 0.05 1.55 10.12 0.76 20.43 61.00
P4 (Alluvial Plains)
Ap 0–14 6.50 6.10 0.41 0.06 1.49 11.87 0.62 25.55 55.00
Bw 14–50 6.70 6.30 0.96 0.19 1.43 9.71 2.12 21.60 62.00
Bt1 50–81 7.00 6.00 0.41 0.12 1.58 16.54 2.01 35.19 58.00
Bt2 81+ 5.80 5.00 0.24 0.09 1.56 13.47 6.66 33.04 66.00
Бюллетень Почвенного института им. В.В. Докучаева. 2021. Вып. 108 Dokuchaev Soil Bulletin, 2021, 108
118
Pedon
and
Horizon
Depth
(cm)
pH 1:1 OC
(%)
Exchangeable cations CEC
BS (%) H2O KCl 1N
K Na Ca Mg
[cmol(+)kg-1
]
P5 (Alluvial Plains)
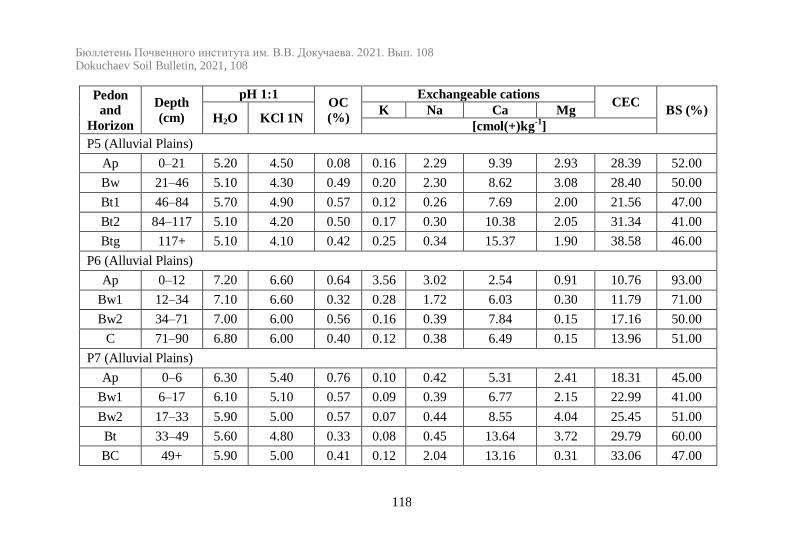
Ap 0–21 5.20 4.50 0.08 0.16 2.29 9.39 2.93 28.39 52.00
Bw 21–46 5.10 4.30 0.49 0.20 2.30 8.62 3.08 28.40 50.00
Bt1 46–84 5.70 4.90 0.57 0.12 0.26 7.69 2.00 21.56 47.00
Bt2 84–117 5.10 4.20 0.50 0.17 0.30 10.38 2.05 31.34 41.00
Btg 117+ 5.10 4.10 0.42 0.25 0.34 15.37 1.90 38.58 46.00
P6 (Alluvial Plains)
Ap 0–12 7.20 6.60 0.64 3.56 3.02 2.54 0.91 10.76 93.00
Bw1 12–34 7.10 6.60 0.32 0.28 1.72 6.03 0.30 11.79 71.00
Bw2 34–71 7.00 6.00 0.56 0.16 0.39 7.84 0.15 17.16 50.00
C 71–90 6.80 6.00 0.40 0.12 0.38 6.49 0.15 13.96 51.00
P7 (Alluvial Plains)
Ap 0–6 6.30 5.40 0.76 0.10 0.42 5.31 2.41 18.31 45.00
Bw1 6–17 6.10 5.10 0.57 0.09 0.39 6.77 2.15 22.99 41.00
Bw2 17–33 5.90 5.00 0.57 0.07 0.44 8.55 4.04 25.45 51.00
Bt 33–49 5.60 4.80 0.33 0.08 0.45 13.64 3.72 29.79 60.00
BC 49+ 5.90 5.00 0.41 0.12 2.04 13.16 0.31 33.06 47.00
Бюллетень Почвенного института им. В.В. Докучаева. 2021. Вып. 108 Dokuchaev Soil Bulletin, 2021, 108
119
Pedon
and
Horizon
Depth
(cm)
pH 1:1 OC
(%)
Exchangeable cations CEC
BS (%) H2O KCl 1N
K Na Ca Mg
[cmol(+)kg-1
]
P8 (Volcanic Hills)
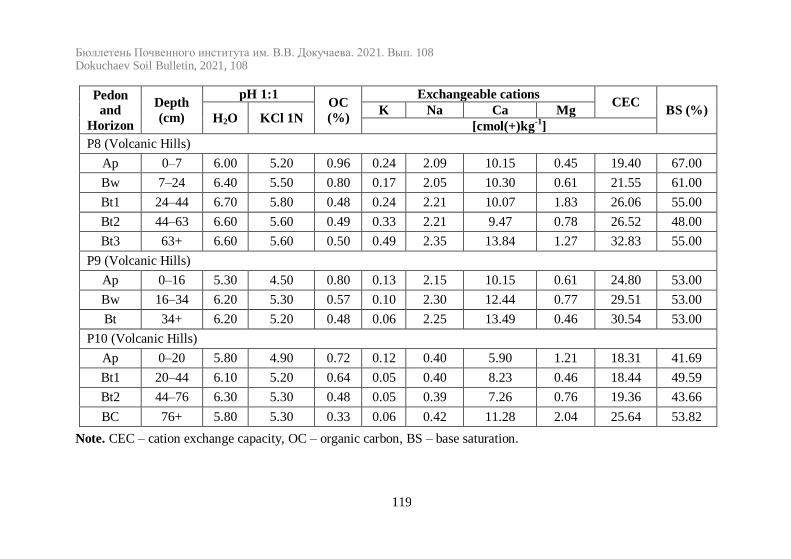
Ap 0–7 6.00 5.20 0.96 0.24 2.09 10.15 0.45 19.40 67.00
Bw 7–24 6.40 5.50 0.80 0.17 2.05 10.30 0.61 21.55 61.00
Bt1 24–44 6.70 5.80 0.48 0.24 2.21 10.07 1.83 26.06 55.00
Bt2 44–63 6.60 5.60 0.49 0.33 2.21 9.47 0.78 26.52 48.00
Bt3 63+ 6.60 5.60 0.50 0.49 2.35 13.84 1.27 32.83 55.00
P9 (Volcanic Hills)
Ap 0–16 5.30 4.50 0.80 0.13 2.15 10.15 0.61 24.80 53.00
Bw 16–34 6.20 5.30 0.57 0.10 2.30 12.44 0.77 29.51 53.00
Bt 34+ 6.20 5.20 0.48 0.06 2.25 13.49 0.46 30.54 53.00
P10 (Volcanic Hills)
Ap 0–20 5.80 4.90 0.72 0.12 0.40 5.90 1.21 18.31 41.69
Bt1 20–44 6.10 5.20 0.64 0.05 0.40 8.23 0.46 18.44 49.59
Bt2 44–76 6.30 5.30 0.48 0.05 0.39 7.26 0.76 19.36 43.66
BC 76+ 5.80 5.30 0.33 0.06 0.42 11.28 2.04 25.64 53.82
Note. CEC – cation exchange capacity, OC – organic carbon, BS – base saturation.
Бюллетень Почвенного института им. В.В. Докучаева. 2021. Вып. 108 Dokuchaev Soil Bulletin, 2021, 108
120
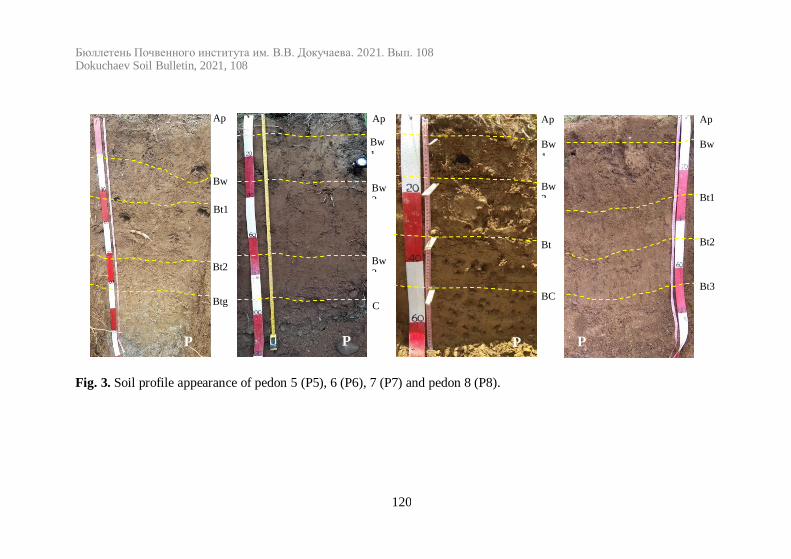
Fig. 3. Soil profile appearance of pedon 5 (P5), 6 (P6), 7 (P7) and pedon 8 (P8).
Ap
Btg
Bw
Bt1
Bt2
Ap
Bw
3
Bw
2
Bw
1
C
Ap
Bt
Bw
2
Bw
1
BC
Ap
Bt2
Bt1
Bw
Bt3
P
5
P
6 P
7
P
8
Бюллетень Почвенного института им. В.В. Докучаева. 2021. Вып. 108 Dokuchaev Soil Bulletin, 2021, 108
121
The pedon in the alluvial group represented a depressed area
which is the accumulation of the bases carried by washing water from
the hinterland section and the accumulation of more alkaline bases in soils with poorer drainage (Nurdin, 2010a). The pedons in the volcanic
group experienced more intensive washing during the rain due to a bet-
ter soil drainage. The trend of pH increasing with more depth may be
explained by the release of organic acids during the decomposition of organic matter, these acids may have lowered the pH at the soil surface
(Satish et al., 2018). The pH differences of KCl and the pH of H2O of
all pedons show negative values. This means that all pedons are domi-nated by negatively charged clay minerals (Suharta, 2007). The acid
and slightly acid soil pH values in P1, P3, P5, P9 and P10 indicated
that the soil had developed but the level of soil development was not
yet advanced, while the neutral soil pH in P2, P4, P6, P7, and P8 shows that the soil is relatively new.
Organic carbon (OC) varies from very low to high (0.08–
2.28%). The OC value was high in the surface horizon (Ap), except for P4 and P5. The OC value on the surface is higher due to the accumula-
tion of organic materials, while its low values in P4 and P5 were due to
the river flooding. The low OC value was also determined by a faster degradation of the organic material in the tropics and a low addition of
farmyard manure (Vedadri, Naidu, 2018). A high OC distribution pat-
tern on the surface and its dramatic decrease in horizon B in accord-
ance with the depth is a general soil development pattern (Prasetyo, 2007).
The reserve (sum) of exchangeable bases vary between very low,
low, medium, high and very high. Calcium cation is the dominating one in the exchangeable bases reserve, which ranges from 2.54–18.02
cmol(+)kg-1, while magnesium (Mg
+) ranges from 0.15-6.66
cmol(+)kg-1, sodium (Na
+) ranges from 0.26–3.02 cmol(+)kg
-1, potas-
sium (K+) ranges from 0.05–3.56 cmol(+)kg
-1. Based on a number of
bases, the P1, P5, P7, and P10 patterns follow the sequence: Ca2+
>
Mg+ > Na
+ > K
+. This series pattern was the same as Nurdin (2011) and
Satish et al. (2018) reported. At the same time P2, P3, P4, P6, P8 and P9 follow the sequence: Ca
2+ > Na
+ > Mg
+ > K
+. A high rate of ex-
changeable bases in the surface horizon (Ap) results from the fertiliza-
tion during corn cultivation, while in the lower layer rainfall washing
Бюллетень Почвенного института им. В.В. Докучаева. 2021. Вып. 108 Dokuchaev Soil Bulletin, 2021, 108
122
together with good drainage conditions make it possible to wash in the
soil solum.
The cation exchange capacity (CEC) varies from low (7.7 cmol(+)kg
-1) to very high (42.40 cmol(+)kg
-1). The CEC is influenced
by the levels of organic carbon and soil minerals (Prasetyo et al., 2007;
Suharta, 2007). It seems that CEC in P1, P3, P4, P5, P7, P8, and P9
were more influenced by OC content than by soil minerals. The higher the soil OC, the higher the soil CEC is (Suharta, 2007). While P2, P6
and P10 were thought to be more influenced by soil minerals, these
bases can be exchanged and this CEC will eventually affect base satu-ration. Base saturation (BS) varies from moderate (40.55%) to very
high (93%). All pedons generally have a medium and a high BS, except
P6, which has a very high BS on the surface horizon (Ap). The varia-
tions in BS may be caused by the variations in nature and/or the con-tent of soil colloids, and a relatively high base saturation in the surface
layers can be attributed to the recycling of cation base through vegeta-
tion (Devi, Kumar, 2010). In addition, if soil has a number of bases which are smaller than CEC, BS tends to be lower, whereas when the
soil has a number of bases close to or higher than CEC, BS tends to be
higher (Nurdin, 2010b). Soil classification
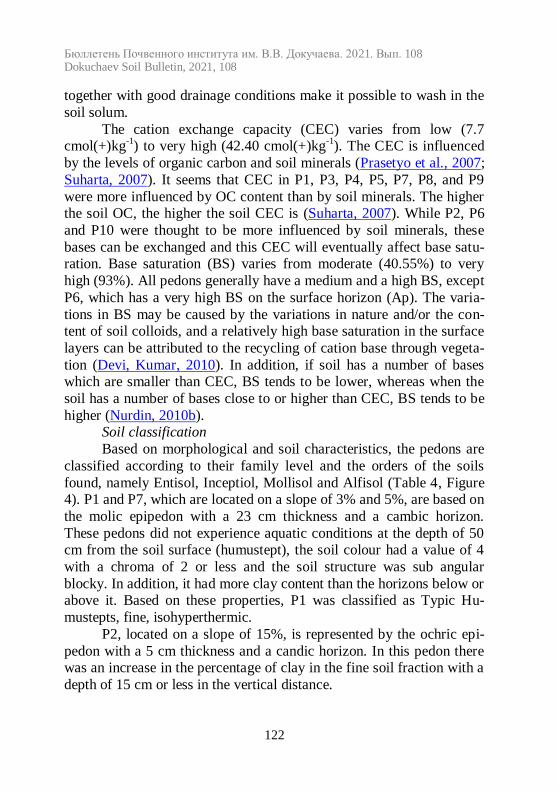
Based on morphological and soil characteristics, the pedons are
classified according to their family level and the orders of the soils
found, namely Entisol, Inceptiol, Mollisol and Alfisol (Table 4, Figure 4). P1 and P7, which are located on a slope of 3% and 5%, are based on
the molic epipedon with a 23 cm thickness and a cambic horizon.
These pedons did not experience aquatic conditions at the depth of 50 cm from the soil surface (humustept), the soil colour had a value of 4
with a chroma of 2 or less and the soil structure was sub angular
blocky. In addition, it had more clay content than the horizons below or above it. Based on these properties, P1 was classified as Typic Hu-
mustepts, fine, isohyperthermic.
P2, located on a slope of 15%, is represented by the ochric epi-
pedon with a 5 cm thickness and a candic horizon. In this pedon there was an increase in the percentage of clay in the fine soil fraction with a
depth of 15 cm or less in the vertical distance.
Бюллетень Почвенного института им. В.В. Докучаева. 2021. Вып. 108 Dokuchaev Soil Bulletin, 2021, 108
123
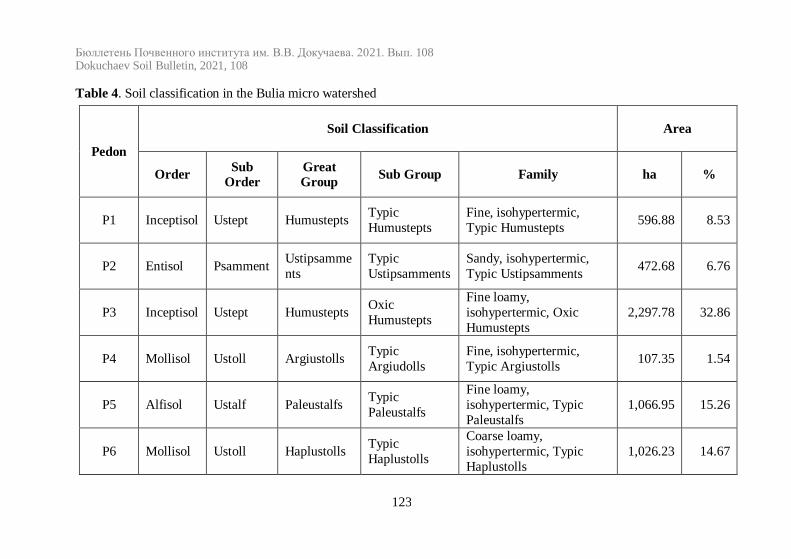
Table 4. Soil classification in the Bulia micro watershed
Pedon
Soil Classification Area
Order Sub
Order
Great
Group Sub Group Family ha %
P1 Inceptisol Ustept Humustepts Typic
Humustepts
Fine, isohypertermic,
Typic Humustepts 596.88 8.53
P2 Entisol Psamment Ustipsamme
nts
Typic
Ustipsamments
Sandy, isohypertermic,
Typic Ustipsamments 472.68 6.76
P3 Inceptisol Ustept Humustepts Oxic
Humustepts
Fine loamy,
isohypertermic, Oxic
Humustepts
2,297.78 32.86
P4 Mollisol Ustoll Argiustolls Typic
Argiudolls
Fine, isohypertermic,
Typic Argiustolls 107.35 1.54
P5 Alfisol Ustalf Paleustalfs Typic
Paleustalfs
Fine loamy,
isohypertermic, Typic
Paleustalfs
1,066.95 15.26
P6 Mollisol Ustoll Haplustolls Typic
Haplustolls
Coarse loamy,
isohypertermic, Typic
Haplustolls
1,026.23 14.67
Бюллетень Почвенного института им. В.В. Докучаева. 2021. Вып. 108 Dokuchaev Soil Bulletin, 2021, 108
124
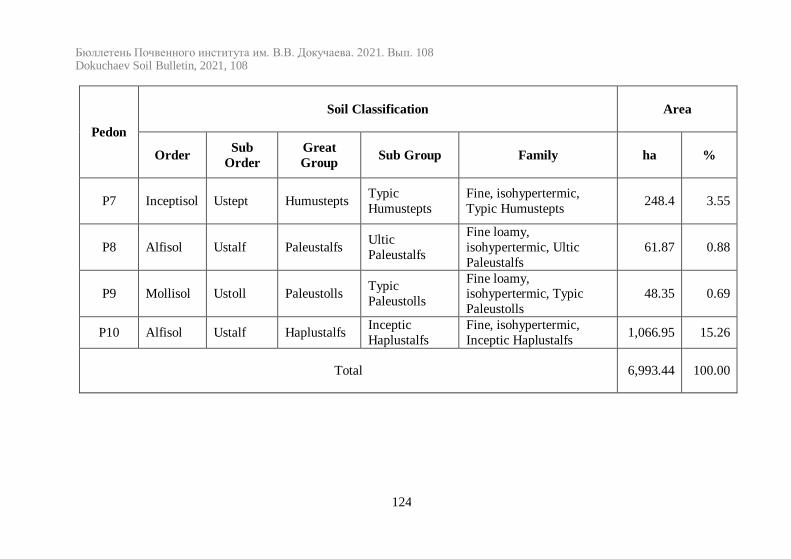
Pedon
Soil Classification Area
Order Sub
Order
Great
Group Sub Group Family ha %
P7 Inceptisol Ustept Humustepts Typic
Humustepts
Fine, isohypertermic,
Typic Humustepts 248.4 3.55
P8 Alfisol Ustalf Paleustalfs Ultic
Paleustalfs
Fine loamy,
isohypertermic, Ultic
Paleustalfs
61.87 0.88
P9 Mollisol Ustoll Paleustolls Typic
Paleustolls
Fine loamy, isohypertermic, Typic
Paleustolls
48.35 0.69
P10 Alfisol Ustalf Haplustalfs Inceptic
Haplustalfs
Fine, isohypertermic,
Inceptic Haplustalfs 1,066.95 15.26
Total 6,993.44 100.00
Бюллетень Почвенного института им. В.В. Докучаева. 2021. Вып. 108 Dokuchaev Soil Bulletin, 2021, 108
125
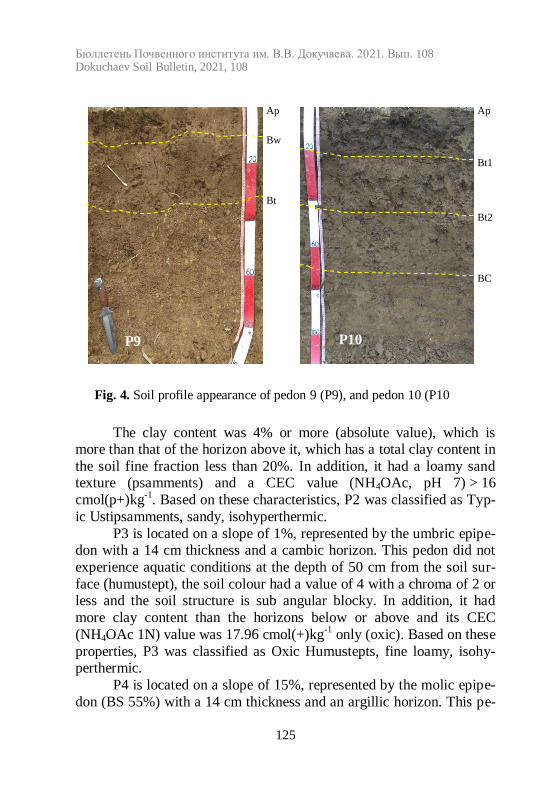
Fig. 4. Soil profile appearance of pedon 9 (P9), and pedon 10 (P10
The clay content was 4% or more (absolute value), which is more than that of the horizon above it, which has a total clay content in
the soil fine fraction less than 20%. In addition, it had a loamy sand texture (psamments) and a CEC value (NH4OAc, pH 7) > 16
cmol(p+)kg-1
. Based on these characteristics, P2 was classified as Typ-
ic Ustipsamments, sandy, isohyperthermic.
P3 is located on a slope of 1%, represented by the umbric epipe-don with a 14 cm thickness and a cambic horizon. This pedon did not
experience aquatic conditions at the depth of 50 cm from the soil sur-
face (humustept), the soil colour had a value of 4 with a chroma of 2 or less and the soil structure is sub angular blocky. In addition, it had
more clay content than the horizons below or above and its CEC
(NH4OAc 1N) value was 17.96 cmol(+)kg-1
only (oxic). Based on these
properties, P3 was classified as Oxic Humustepts, fine loamy, isohy-perthermic.
P4 is located on a slope of 15%, represented by the molic epipe-
don (BS 55%) with a 14 cm thickness and an argillic horizon. This pe-
Ap
Bt
Bw
Ap
BC
Bt2
Bt1
P9 P10
Бюллетень Почвенного института им. В.В. Докучаева. 2021. Вып. 108 Dokuchaev Soil Bulletin, 2021, 108
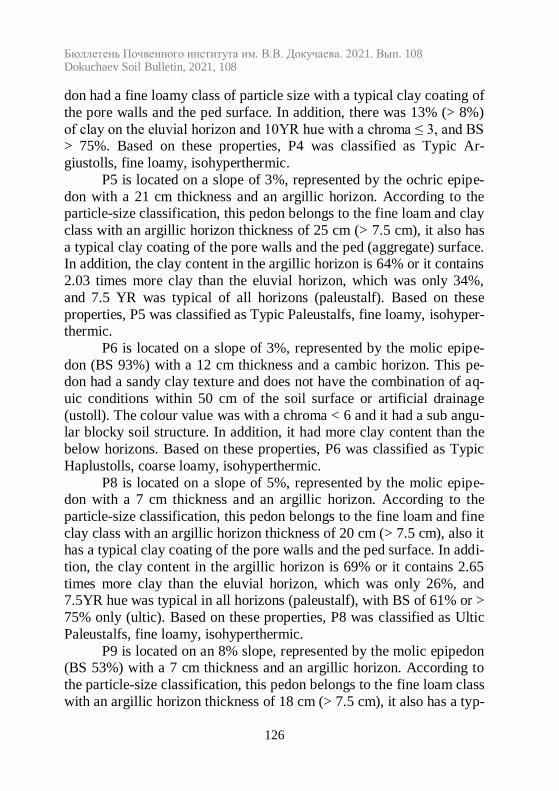
126
don had a fine loamy class of particle size with a typical clay coating of
the pore walls and the ped surface. In addition, there was 13% (> 8%)
of clay on the eluvial horizon and 10YR hue with a chroma ≤ 3, and BS > 75%. Based on these properties, P4 was classified as Typic Ar-
giustolls, fine loamy, isohyperthermic.
P5 is located on a slope of 3%, represented by the ochric epipe-
don with a 21 cm thickness and an argillic horizon. According to the particle-size classification, this pedon belongs to the fine loam and clay
class with an argillic horizon thickness of 25 cm (> 7.5 cm), it also has
a typical clay coating of the pore walls and the ped (aggregate) surface. In addition, the clay content in the argillic horizon is 64% or it contains
2.03 times more clay than the eluvial horizon, which was only 34%,
and 7.5 YR was typical of all horizons (paleustalf). Based on these
properties, P5 was classified as Typic Paleustalfs, fine loamy, isohyper-thermic.
P6 is located on a slope of 3%, represented by the molic epipe-
don (BS 93%) with a 12 cm thickness and a cambic horizon. This pe-don had a sandy clay texture and does not have the combination of aq-
uic conditions within 50 cm of the soil surface or artificial drainage
(ustoll). The colour value was with a chroma < 6 and it had a sub angu-lar blocky soil structure. In addition, it had more clay content than the
below horizons. Based on these properties, P6 was classified as Typic
Haplustolls, coarse loamy, isohyperthermic.
P8 is located on a slope of 5%, represented by the molic epipe-don with a 7 cm thickness and an argillic horizon. According to the
particle-size classification, this pedon belongs to the fine loam and fine
clay class with an argillic horizon thickness of 20 cm (> 7.5 cm), also it has a typical clay coating of the pore walls and the ped surface. In addi-
tion, the clay content in the argillic horizon is 69% or it contains 2.65
times more clay than the eluvial horizon, which was only 26%, and 7.5YR hue was typical in all horizons (paleustalf), with BS of 61% or >
75% only (ultic). Based on these properties, P8 was classified as Ultic
Paleustalfs, fine loamy, isohyperthermic.
P9 is located on an 8% slope, represented by the molic epipedon (BS 53%) with a 7 cm thickness and an argillic horizon. According to
the particle-size classification, this pedon belongs to the fine loam class
with an argillic horizon thickness of 18 cm (> 7.5 cm), it also has a typ-
Бюллетень Почвенного института им. В.В. Докучаева. 2021. Вып. 108 Dokuchaev Soil Bulletin, 2021, 108
127
ical clay coating of the pore walls and the ped surface. In addition, the
clay content in the argillic horizon is 69% or it contains 4.60 times
more clay than the eluvial horizon, which was only 18%, and 7.5YR hue with a chroma of ≤ 4, and BS of < 75% of all horizons (paleustoll).
Based on these properties, P9 was classified as Typic Paleustolls, fine
loamy, isohyperthermic.
P10 is located on a slope of 15%, represented by the molic epi-pedon (BS 57%, 50%) with a 23 cm thickness and an argillic horizon.
According to the particle-size classification, this pedon belongs to the
fine loam and fine clay class with an argillic horizon thickness of 24 cm (> 7.5 cm), it also has a typical clay coating of the pore walls and
the ped surface. In addition, the clay content in the argillic horizon is
88% or it contains 3.38 times more clay than the eluvial horizon, which
was only 24%, and 10YR hue with a chroma of ≤ 3, and BS > 75%. Based on these properties, P10 was classified as Inceptic Haplustalfs,
fine, isohyperthermic.
Land quality classes The land quality (LQ) of the Bulia micro watershed was present-
ed in Table 5 and Figure 5. The LQ of class II with the main factor de-
termining the land stress was high temperature and low organic matter. The high temperature factor with an isohyperthermic soil temperature
regime as an indicator was found on LU 3 (P3), while the low organic
matter factor with an ochric epipedon indicator was only on LU 5 (P5).
The LQ of class II is determined as good and this land has few prob-lems for sustainable production, its productivity is generally very high
and as a result, the response to management is high (Beinroth et al.,
2001). Land management through the addition of organic matter, in-cluding green manure, may be adopted along with the recommended
fertilizer doses (Sys et al., 1991; Singh et al., 2004; Mahaputra et al.,
2019) and mulching to stabilize temperatures and maintain soil mois-ture (Odjugo, 2008; Eruola et al., 2012; Damaiyanti et al., 2013), which
is of great importance. In addition, the use of rice straw mulch and
sawdust mulch influences soil properties by decreasing the value of
bulk density, increasing soil porosity and soil organic matter (Nasruddin, Hanum, 2015).
Бюллетень Почвенного института им. В.В. Докучаева. 2021. Вып. 108 Dokuchaev Soil Bulletin, 2021, 108
128
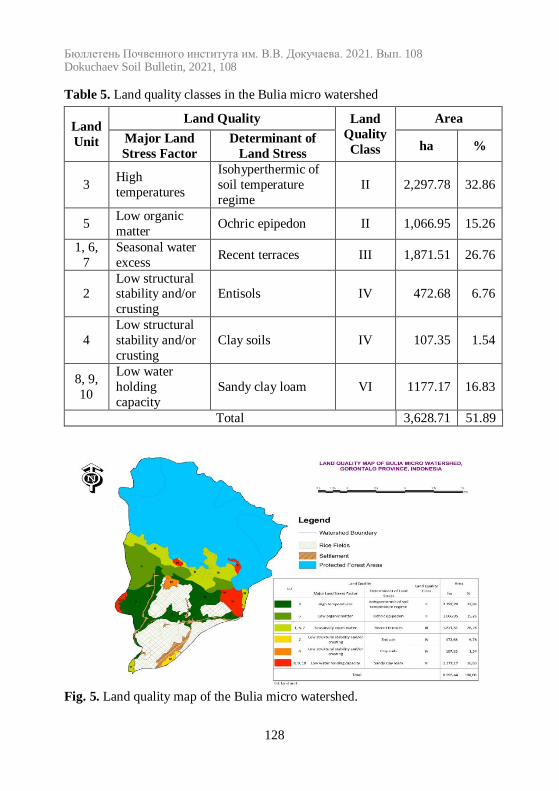
Table 5. Land quality classes in the Bulia micro watershed
Land
Unit
Land Quality Land
Quality
Class
Area
Major Land
Stress Factor
Determinant of
Land Stress ha %
3 High
temperatures
Isohyperthermic of
soil temperature
regime
II 2,297.78 32.86
5 Low organic
matter Ochric epipedon II 1,066.95 15.26
1, 6,
7
Seasonal water
excess Recent terraces III 1,871.51 26.76
2 Low structural stability and/or
crusting
Entisols IV 472.68 6.76
4
Low structural
stability and/or
crusting
Clay soils IV 107.35 1.54
8, 9,
10
Low water
holding
capacity
Sandy clay loam VI 1177.17 16.83
Total 3,628.71 51.89
Fig. 5. Land quality map of the Bulia micro watershed.
Бюллетень Почвенного института им. В.В. Докучаева. 2021. Вып. 108 Dokuchaev Soil Bulletin, 2021, 108
129
The LQ of class III with the main factor determining the land
stress was a seasonal excess of water. The indicators determining the
land stress in class III were new terraces spread over LU 1 (P1), LU 6 (P6) and LU 7 (P7). These new terraces are generally located around
the border or river meanders which were prone to erosion and river
bank landslides. The LQ of land class III was still considered good and
this land has few problems for sustainable production, but has the high-er risk of low input of corn production specifically, which results in a
response to high management (Beinroth et al., 2001). The land man-
agement through the manufacture of gabions and riverbanks (Rahman, 2013), planting river bank reinforcement plants and terraces (Suyana et
al., 2017) was of great importance. Bioengineering methods for river
bank erosion control commonly used include planting bamboo (Noor et
al., 2011). Fine plant roots play a significant role in increasing the shear strength of the soil (Ludwig et al., 2007). The effectiveness of
plants in reducing erosion rate is influenced by (1) the canopy or plant
canopy, (2) the organic material produced, (3) the root system and the ability of plants to cover the soil (Rachman et al., 2004). Vetiver plants
were useful for stabilizing river banks, irrigation canals, river erosion
control and coastal embankments, excavation slopes and embankments on highways, sand dunes, erosion on sloped agricultural land (Noor et
al., 2011). Vetiver grass, which has strong fibrous roots, holds the
ground (Susilawati, Veronika, 2016). Soil nailing was one of the most
economical techniques for slopes stabilization of retaining walls be-cause the system works quickly and does not require large space
(Sinarta, 2014; Noor et al., 2011).
The LQ of class IV with the main factors determining land stress was low structural stability and/or crusting. These main factors consist
of two indicators, namely clay soil and Entisol. The indicator of heavy
clay (> 50%) was scattered in LU 4 (P4). This indicator of clay soil was related to soil crusting which was shown by the average sub angu-
lar blocky soil structure, and the soil consistency under wet conditions
was very sticky and very plastic, while it was very hard under dry con-
ditions. Clay and organic matter are binding agents for aggregates (Rachim, 2007). Apparently, the influence of clay is more dominant
than of organic matter as an aggregate binding agent because the OC
content was very low. The Entisol indicators were spread on LU 2 (P2)
Бюллетень Почвенного института им. В.В. Докучаева. 2021. Вып. 108 Dokuchaev Soil Bulletin, 2021, 108
130
only. Entisol is a soil that is still young and underdeveloped (Rachim,
2007). The results of the morphological analysis of the soil indicated
that this Entisol has a granular structure (not solid), fine sized with a weak level of development, therefore the stability was relatively low.
In addition, the texture of Entisol was classified as loamy sand with the
sand of particle size which makes the soil structure stability relatively
low. This class requires major inputs from conservation management; since a lack of plant nutrition is a major obstacle, therefore a plan to
use good fertilizers should be adopted (Beinroth et al., 2001). Land
management through the addition of organic matter can be applied to-gether with recommended fertilizer doses (Sys et al., 1991; Singh et al.,
2004; Mahaputra et al., 2019). Provision of organic matter in soils with
clay texture can increase soil water content and available water capaci-
ty and reduce soil volume weight (Intara et al., 2011), increase soil porosity (Anastasia et al., 2014), increase N, P, and K uptake and crop
yields in Entisol soils (Afandi et al., 2015). Addition of manure, com-
post and beneficial bacteria technology (custom bio) can reduce soil content weight, soil density, increase aggregate stability, soil porosity
and moisture content in Entisol soil (Zulkarnain et al., 2013).
The LQ of class VI with the main factor determining the land stress was low water holding capacity. The indicators of the sandy clay
loam texture were spread on LU 8 (P8), LU 9 (P9) and LU 10 (P10).
The value of water available on the sandy clay loam texture was only
around 20.42 mm (Haridjaja et al., 2013). The available water (pF) un-der conditions of field capacity (pF 2.0) on LU 8, 9 and LU 10 was in-
dicated as 34 mm, 38 mm, and 37 mm respectively, and at permanent
wilting conditions (pF 4.2) 24 mm, 17 mm and only 19 mm respective-ly, therefore, causing a low water holding capacity. This land should
not be used for food production (i. e. corn) because this class requires
major inputs from conservation management; since a lack of plant nu-trition is a major obstacle, therefore a plan to use good fertilizers
should be adopted or this land can be used as a biodiversity zone
(Beinroth et al., 2001). However, if this land is used for agricultural
cultivation, then the land management should consider the addition of organic matter along with the recommended fertilizer dosage (Sys et
al., 1991; Singh et al., 2004; Mahaputra et al., 2019). Provision of or-
ganic material in soils with clay texture can increase soil water content
Бюллетень Почвенного института им. В.В. Докучаева. 2021. Вып. 108 Dokuchaev Soil Bulletin, 2021, 108
131
and available water capacity and reduce soil volume weight (Intara et
al., 2011), increase soil porosity (Anastasia et al., 2014).
CONCLUSIONS
Angular blocky, sticky, plastic consistencies, and hard consist-
encies prevailed in the soil structure of the Bulia micro watershed of
Gorontalo Province, Indonesia. In the alluvial plain, a sand fraction prevailed in Volkan mountains. The soils in the Bulia micro watershed
also react acid to neutral, with the range of very low to high OC levels,
the reserve of exchangeable bases was dominated by Ca2+
in two series patterns, namely: Ca
2+ > Mg
+ > Na
+ > K
+ and Ca
2+ > Na
+ > Mg
+ > K
+,
CEC ranged from low to very high, and the base saturation varied from
moderate to very high. The primary soils found were Entisol on P2 (Typic Ustipsamments), Inceptisol on P1 and P7 (Typic Humustepts),
and P3 (Oxic Humustepts), Mollisol on P4 (Typic Argiudolls), P6
(Typic Haplustolls), and P9 (Typic Paleustolls), and Alfisol on P5
(Typic Paleustalfs), P8 (Ultic Paleustalfs) and P10 (Inceptic Haplus-talfs). On the alluvial plains the land was categorized as the LQ class
II, III and IV, the volcanic mountains were the LQ class IV, while the
land on the volcanic hills was categorized as the LQ class VI. River bank erosion on the land river terraces can be held by the manufacture
of gabions, talud, cliff reinforcement plants and terraces. The soil tem-
peratures and high clay content can be regulated by mulching and or-
ganic materials.
REFERENCES
1. Afandi F.N., Siswanto B., Nuraini Y., Effect of giving various types of organic material on soil chemical properties on the growth and production of
sweet potato plants in Entisol Ngrangkah Pawon, Kediri, Soil and Land
Resources, 2015, Vol. 2(2), pp. 237–244, URL: http://jtsl.ub.ac.id.
2. Anastasia I., Izatti M., Suedy S.W.A., The effect of giving a combination
of solid organic fertilizer and liquid organic on soil porosity and spinach plant
growth (Amarantus tricolor L.), Biology Journal, 2014, Vol. 3(2), pp. 1–10.
3. Beinroth F.H., Eswaran H., Reich P.F., Global assessment of land quality,
sustaining the global farm, Selected papers from the 10th International Soil
Conservation Organization Meeting, 2001, pp. 569–574.
4. BPS Gorontalo Province, Gorontalo province in figure 2020, BPS
Бюллетень Почвенного института им. В.В. Докучаева. 2021. Вып. 108 Dokuchaev Soil Bulletin, 2021, 108
132
Gorontalo Province, 2020, 1102001.75(75560.2004), pp. 1–535.
5. BPS Gorontalo Regency, Gorontalo regency in figure 2020, BPS
Gorontalo Regency, 2020, 1102001.75(75020.2003), pp. 1–262.
6. Dutta M., Land use planning of Tipukjan watershed of Sivasagar district
using GIS and remote sensing technique: Ph.D. Thesis, Assam Agricultural
University, Jorhat, 2009.
7. Damaiyanti D.R.R., Aini N., Koesrihati, The study of organic mulch
application on the growth and yield of red pepper (Capsicum annuum L.),
Crop Production Journal, 2013, Vol. 1(2), pp. 25–32.
8. Devi P.A.V., Naidu M.V.S., Rao A.R., Characterization and classification of sugarcane growing soils in southern agro-climatic zone: A case study in
eastern mandals of Chittoor district in Andhra Pradesh, Journal of the Indian
Society of Soil Science, 2015, Vol. 63(3), pp. 245–258, DOI: 10.5958/0974-
0228.2015.00034.1.
9. Eruola A.O., Bello N.J., Ufoegbune G.C., Makinde A.A., Effect of
mulching on soil temperature and moisture regime on emergence, growth and
yield of white yam in a tropical wet-and-dry climate, International Journal of
Agriculture and Forestry, 2012, Vol. 2(1), pp. 93–100, DOI:
10.5923/j.ijaf.20120201.15.
10. Eviyati, Sulaeman, Analysis of soil, chemical, plants, water, and fertilizer,
Indonesia Centre of Soil Research, 2009, pp. 1–203.
11. Husain J., Luntungan J.N., Kamagi Y.E.B., Nurdin B., Conservation-based corn farming model in Gorontalo Province. Research Report. Research,
Development and Regional Environmental Impact Control Agency Gorontalo
Province, Gorontalo, 2004.
12. Haridjaja O., Baskoro D.P.T., Setianingsih M., Different levels of field
capacity by alhricks, free drainage, and pressure plate methods at different soil
texture and relation for sunflower growth (Helianthus annuus L.), Soil Science
and Environmental Journal, 2013, Vol. 15(2), 52 p, DOI:
10.29244/jitl.15.2.52-59.
13. Intara Y.I., Sapei A., Sembiring E.N., Djoefrie M.H.B., Affected of
organic matter application at clay and clay loam soil texture on water holding
capacity, Indonesian Agriculture Sciences Journal, 2011, Vol. 16(2), pp. 130–135.
14. Jambak M.K.F.A., Baskoro D.P.T., Wahjunie E.D., Characteristics of soil
physic on soil conservation tillage system (Case study of Cikabayan Research
Farm, Bogor), Soil and Land Bulletin, 2017, Vol. 1(1), pp. 44–50.
15. Jackson M.L., Soil chemical analysis, New Delhi: Prentice Hall of India
(Pvt.) Ltd., 1973, 498 p.
16. Kadao S.H., Prasad J., Gajbhlye K.S., Characterization and classification
of some typical banana growing soils of Wardha district of Maharashtra,
Бюллетень Почвенного института им. В.В. Докучаева. 2021. Вып. 108 Dokuchaev Soil Bulletin, 2021, 108
133
Agropedology, 2003, Vol. 13(2), pp. 28–34.
17. Ludwig A., Bradford P., David B., Anton W., Vegetation patches and
runoff-erosion as interacting ecohydrological processes in semiarid
landscapes, Ecology, 2007, Vol. 86, pp. 288–297, DOI: 10.1890/03-0569.
18. Mahapatra S.K., Nagdev R., Gopal R., Surya J.N., Meena R.K., Yadav
R.P., Singh S.K., Characterization and classification of the soils of Buraka
micro-watershed in Haryana for integrated development, Journal of the Indian
Society of Soil Science, 2019, Vol. 67(2), pp. 137–150, DOI: 10.5958/0974-
0228.2019.00015.X.
19. Manik H., Marpaung P., Sabrina T., The level of soil development based on the pattern of clay mineral distribution in Subdistric Lumbanjulu, Distric of
Toba Samosir, Agroteknologi FP USU, 2017, Vol. 5(2), pp. 422–433.
20. Nasruddin, Hanum H., Study of mulching effects on soil temperature, soil
property, and growth of patchouli (Pogostemon cablin Benth), Floratek, 2015,
Vol. 10, pp. 69–78.
21. Niranjana K.V., Ramamurthy V., Hegde R., Srinivas S., Koyal A., Naidu
L.G.K., Sarkar D., Characterization, classification and suitability evaluation of
banana growing soils of Pulivendla region. Andhra Pradesh, Journal of the
Indian Society of Soil Science, 2011, Vol. 59(1), pp. 1–5, URL:
https://www.indianjournals.com/ijor.aspx?target=ijor:jisss&volume=59&issue
=1&article=001.
22. Noor A., Vahlevi J., Fathurrozi., Slope stabilization for erosion control with soil bioengineering using vetiver grass, Poros Teknik, 2011, Vol. 3(2),
pp. 69–74.
23. Nurdin, Development, classification and rainfed paddy soils potency
derived from lacustrine materials in paguyaman, gorontalo. MSc Thesis
Bogor Agriculture University, 2010a. URL:
https://repository.ipb.ac.id/handle/123456789/57081.
24. Nurdin, The morfology, physics and soil chemistry of inceptisol derived
from lacustrine paguyaman of gorontalo relating to soil managements, Jurnal
Agroteknotropika, 2010b, Vol. 1(1), pp. 13–22.
25. Nurdin, Development and rainfed paddy soils potency derived from
lacustrine material in paguyaman, Gorontalo, J. Trop. Soils, 2011, Vol. 16(3), pp. 267–278, DOI: 10.5400/jts.2011.16.3.267.
26. Nurdin, Combination of soil conservation techniques and its effect on the
yield of maize and soil erosion of dry land in biyonga sub-watershed,
Gorontalo, J. Tek. Ling., 2012, Vol. 13(2), pp. 245–252.
27. Odjugo P.A.O., The effect of tillage systems and mulching on soil
microclimate, growth and yield of yellow yam (Dioscorea cayenensis) in
Midwestern Nigeria, African Journal of Biotechnology, 2008, Vol. 7(24), pp.
4500–4507, DOI: 10.4314/ajb.v7i24.59629.
Бюллетень Почвенного института им. В.В. Докучаева. 2021. Вып. 108 Dokuchaev Soil Bulletin, 2021, 108
134
28. Oldeman L.R., Darmiyati S., An agroclimatic map of Sulawesi scale 1 –
2.500.000, Center Research for Agriculture, 1977, p. 1.
29. Puslitanak Research Team, Survey and mapping of semi-detailed soil
resources (scale 1 : 50,000) in the North Sulawesi of Paguyaman area for the
development of irrigation and sugarcane commodities. Final report. Book III
Attachment of the Land Series. Center for Soil and Agro-climate Research,
Agency for Agricultural Research and Development, Indonesian Ministry of
Agriculture, Bogor, 1995.
30. Prasetyo B.H., Differentiation in Properties of vertisol from various parent
materials, Indonesian Agriculture Sciences Journal, 2007, Vol. 9(1), pp. 20–31.
31. Rachman A., Gantzer J., Anderson S.H., Soil hydraulic properties
influenced by stiff-stemmed grass hedge systems, Soil Science Society of
America Journal, 2004, Vol. 68(4), pp. 1386–1393, DOI:
10.2136/sssaj2004.1386.
32. Rachim D.A., Characterization os soils with low activity clay, and the
effect of iron oxides on some soil properties, PhD thesis, Bogor Agricultural
University, 1994, URL:
https://repository.ipb.ac.id/handle/123456789/2463?show=full.
33. Rachim D.A., The foundamentals of soil genesis. Bogor: Departemen of
Soil and Land Resources, Agriculture Faculty of Bogor Agriculture
University, 2007, 41p. 34. Rahman A., Geographic information system model for estimating flow
coefficient and its relationship with land cover in Riam Kanan River Basin of
South Kalimantan Province, Bumi Lestari, 2013, Vol. 13(1), p. 1–8.
35. Sys C., Rast E.V., Debaveye J., Land evaluation. Part II. Principles in land
evaluation and crop production calculations. International Training Centre for
Post-Graduate Soil Scientists, University of Ghent, 1991.
36. Sarkar D., Gangipodhyay S.K., Velayutham M., Soil toposequence
relationship and classification in lower outlier of Chhotanagpur plateau,
Agropedology, 2001, Vol. 11, pp. 29–36.
37. Swarnam T.P., Velmurugan A., Rao Y.S., Characterization and
classification of some soils from Shahibi basin in parts of Haryana and Delhi, Agropedology, 2004, Vol. 14, p. 114–122.
38. Singh C., Singh P., Singh R., Modern techniques of raising field crops,
New Delhi: Oxford and IBH Publishing Co. Pvt. Ltd., 2004, pp. 1–583.
39. Satish S., Naidu M.V.S., Ramana K.V., Munaswamy V., Reddy G.P.,
Sudhakar P., Characterization and classification of the soils of
Brahmanakotkur watershed in Kurnool district of Andhra Pradesh’, Journal of
the Indian Society of Soil Science, 2018, Vol. 66(4), pp. 351–361, DOI:
10.5958/0974-0228.2018.00044.0.
Бюллетень Почвенного института им. В.В. Докучаева. 2021. Вып. 108 Dokuchaev Soil Bulletin, 2021, 108
135
40. Sinarta I., Methods of handling landslides with soil nailing’, Paduraksa,
2014, Vol. 3(2), pp. 1–16.
41. Sireesha P.V.G., Naidu M.V.S., Clay mineralogy of soils developed from
granite-gneiss of Kurnool District in Andhra Pradesh’, Journal of the Indian
Society of Soil Science, 2015, Vol. 63(1), pp. 16–23, DOI: 10.5958/0974-
0228.2015.00003.1.
42. Soil survey manual, Soil Science Division Staff, United States Department
of Agriculture (USDA), 2017, pp. 1–145, URL:
https://www.iec.cat/mapasols/DocuInteres/PDF/Llibre50.pdf.
43. Soil Survey Staff, Keys to soil taxonomy, Soil Conservation Service – NRCS/USDA, 2014, Vol. 12, 360 p.
44. Subardja D., Sudarsono, The influence of land quality on productivity of
maize in soils derived from volcanic and sedimentary rocks in the bogor area,
Soil and Climate Journal, 2005, Vol. 23, pp. 38–46.
45. Suharta N., The characteristic of soil developed from felsic sediments in
west kalimantan province and its implication to land management, Soil and
Climate Journal, 2007, Vol. 25, pp. 11–26.
46. Sukarman S.R., Anda M., Suryani E., Guidelines for soil observation in
the field, Agricultural Research and Development Agency, Ministry of
Agriculture Republic of Indonesia, Bogor, 2017, pp. 1–149.
47. Supriya K., Naidu M.V.S., Kavitha P., Srinivasa M.R., Characterization,
classification and evaluation of soils in semi-arid region of Mahanandi Mandal in Kurnool district of Andhra Pradesh’, Journal of the Indian Society of Soil
Science, 2019, Vol. 67(2), pp. 125–136, DOI: 10.5958/0974-
0228.2019.00014.8.
48. Susilawati S., Veronika V., Vetiver grass study as a continuous slope
safety, Civil Engineering Communication Media, 2016, Vol. 22(2), p. 99,
DOI: 10.14710/mkts.v22i2.12886.
49. Suyana J., Sumarno, Supriyono, Lestariningsih N.P., Mulching and
strengthening of terraces in three types of plants against surface runoff,
erosion, growth and yield of plants in Andisols, Agrosains, 2017, Vol. 19(1),
p. 15, DOI: 10.20961/agsjpa.v19i1.20924.
50. Vedadri U., Naidu M.V.S., Characterization, classification and evaluation of soils in semi-arid ecosystem of Chillakur mandal in SPSR Nellore district
of Andhra Pradesh, Journal of the Indian Society of Soil Science, 2018, Vol.
66 (1), pp. 9–19, DOI: 10.5958/0974-0228.2018.00002.6.
51. Walia C.S., Rao Y.S., Characteristics and classification of some soils of
Trans-Yamuna plains, Journal of the Indian Society of Soil Science, 1997,
Vol. 45(1), pp. 156–162.
52. Yasin M.G.H., Langgi W.F., White grain maize as an alternative for staple
food, Iptek Tanaman Pangan, 2015, Vol. 9(2), pp. 108–117.
Бюллетень Почвенного института им. В.В. Докучаева. 2021. Вып. 108 Dokuchaev Soil Bulletin, 2021, 108
136
53. Yatno E., Mulyanto B., Characteristics of soils formed from schist and
their land suitability for cocoa crop in Kolaka and East Kolaka Regencies,
Southeast Sulawesi, Soil and Climate Journal, 2016, Vol. 39(2), pp. 109–118.
54. Zulkarnain M., Prasetya B., Soemarno, Effects of compost, manure, and
custom-bio on soil properties, growth and yield of sugarcane (Saccharum
officinarum L.) in Entisol Kebun Ngrangkah of Pawon, Kediri, Indonesian
Green Technology Journal, 2013, Vol. 2(1), pp. 45–52, URL:
https://igtj.ub.ac.id/index.php/igtj/article/view/103.