Mapping high-altitude vegetation in the Bale mountains, Ethiopia
Upload
independentCategory
view
1download
0
006) 335–344www.elsevier.com/locate/geoderma
Geoderma 135 (2
Soil organic carbon and total nitrogen stocks as affected bytopographic aspect and vegetation in the Bale Mountains, Ethiopia
Fantaw Yimer a,b,⁎, Stig Ledin b,1, Abdu Abdelkadir a,2
a Wondo Genet College of Forestry, P.O.Box, 128, Shashemane, Ethiopiab Department of Soil Sciences, Swedish University of Agricultural Sciences, P.O.Box 7014, S-750 07 Uppsala, Sweden
Received 6 September 2005; received in revised form 11 January 2006; accepted 19 January 2006Available online 2 May 2006
Abstract
Soil organic carbon (SOC) and total nitrogen (total N) stocks in 0–0.3 and 0.3–1.0m soil layers were estimated following thestandard procedures for three vegetation communities; Schefflera-Hagenia, Hypericum-Erica-Schefflera, and Erica arborea (shrubsize), at different topographic aspects (east-, west-, north- and south-facing) on the Bale Mountains in the south-eastern highlandsof Ethiopia. The results showed that SOC and total N in the top 0.3m depth varied significantly among vegetation communities(p<0.001) and aspects (p=0.003). At all aspects studied, the overall mean SOC and total N amounts to a depth of 1.0m rangedfrom 32.67 to 46.03kg C m−2 and 2.89 to 3.61kg N m−2 among the vegetation communities. The overall mean SOC and total Nstocks to a depth of 1.0m varied from 35.13 to 44.97kg C m−2 and 2.90 to 3.75kg N m−2 among aspects. Topographic aspectinduced microclimatic differences and vegetation community types were found to be important factors for the significant variationsin SOC and total N stocks in the Bale Mountains. About 45% of the SOC stock in the 0–1.0m layer of the mineral soil was held inthe top 0.3m of the soil, indicating the potentially large amount of CO2 that can be released from the top surface soils when thesevegetations are deforested and converted into grazing and cultivation.© 2006 Elsevier B.V. All rights reserved.
Keywords: Slope aspect; Carbon sequestration; Forest soils; Organic matter; Vegetation zonation
1. Introduction
Global concern has increased over greenhouse gasemissions and their potential impact on climate changeover the past decade. As a result, an international
⁎ Corresponding author. Wondo Genet College of Forestry, P.O.Box,128, Shashemane, Ethiopia. Tel.: +46 18 671225/251 461 109900; fax:+251 461 109983.
E-mail addresses: [email protected],[email protected] (F. Yimer), [email protected] (S. Ledin),[email protected] (A. Abdelkadir).1 Fax: +46 18 672795.2 Fax: +251 461 109983.
0016-7061/$ - see front matter © 2006 Elsevier B.V. All rights reserved.doi:10.1016/j.geoderma.2006.01.005
agreement, the Kyoto Protocol, was signed to mitigategreenhouse gas concentrations in the atmospherethrough improving the terrestrial carbon sinks. Thereare three main reservoirs regulating the carbon cycle onearth, namely the oceans, the atmosphere and theterrestrial systems. Recently soils have gained moreattention within the global change debate as the largestterrestrial carbon (C) pool (Perruchoud et al., 2000).Despite inconsistencies, the global estimate of soilorganic carbon ranges from 684 to 724 Pg of C in theupper 30cm, 1462 to 1548 Pg of C in the upper 100cm,and 2376 to 2456 Pg of C in the upper 200cm (Batjes,1996). Soil organic matter is a major component of
336 F. Yimer et al. / Geoderma 135 (2006) 335–344
terrestrial ecosystems, and any variation in its abun-dance and composition has substantial impacts on manyof the processes that take place within the system(Batjes, 1996). Estimation of the C stocks in soils atregional, national, and global levels is thus of paramountimportance in assessing changes in C fluxes (Batjes,1996; Morisada et al., 2004; Wang et al., 2004).
Several studies have been carried out to estimatedifferences in soil organic carbon (SOC) in relation tovegetation and soil properties, land uses and climate(Sombroek et al., 1993; Dahlgren et al., 1997; Klopateket al., 1998; Schjønning et al., 1999; Rhoades et al.,2000; Li and Zhao, 2001; Eshetu et al., 2004; Lemenihand Itanna, 2004). Although the impact of topographicaspect on soil properties (Hicks and Frank, 1984) andvegetation types (Bale et al., 1998) is widely recognized,relatively few studies have been conducted to examinethe role of aspect on SOC and total nitrogen (N) contentsglobally. Topographic aspect (hereafter referred to as‘aspect’) is a potentially significant factor in generatingdifferences in ecosystem characteristics (Bale andCharley, 1994; Bale et al., 1998). For example, thehydrological and solar energy regimes of mountainoustopography differ according to aspect, and suchdifferences may lead to divergence in composition anddistribution patterns of vegetation (Hartman and Lloyd,1969; Ganuza and Almendros, 2003), soil formation andorganic matter decomposition (Hicks and Frank, 1984).Aspect also induces local variation in temperature andprecipitation, which along with chemical and physicalcomposition of the substrate, are the main regulators ofdecomposition rates of soil organic matter (Hutchins etal., 1976; Swift et al., 1979; Brubaker et al., 1993; Chenet al., 1997; Dahlgren et al., 1997; Lisiki and Westman,1997; Trumbore, 1997; Casanova et al., 2000; Men-doza-Vega, 2002).
An adequate amount of SOC is considered essentialfor sustainable agriculture and mitigating C flux to theatmosphere. A decline in SOC generally decreases cropproductivity and alters the capacity of the soil to act asa sink for atmospheric CO2 and thus have an impact onglobal climate change (Rasmussen et al., 1998). Thus,understanding of SOC and total N pools underdifferent soil types and vegetation types as a functionof aspect is crucial to the understanding of ecosystemfunctioning and global climate changes (Ringrose etal., 1998).
The Bale Mountains represent one of the remnants ofAfromontane and Afro-alpine vegetation of Ethiopia.The vegetation is unique in character, remarkablyspecialized, and is exposed to a great diversity ofconditions with steep ecological gradients (Hillman,
1986; Friis and Lamesson, 1993) at different aspects.The upslope positions and/or higher altitudes of thesemountain ranges, with their more or less uniform parentmaterials and soil conditions, offer an excellentopportunity to study the effect of vegetation communitytypes on SOC and total N at different aspects.
For Ethiopia it is important to assess the carbon stockof forest soils because there is no comprehensiveorganic carbon inventory for forest soils in the highlandsin general, and the south-eastern highlands in particular,where large stocks of remnant Afromontane forests arefound. Moreover, in order to estimate the change in SOCand total N stocks of soils due to land use changes, it isfirst necessary to establish baseline data of SOC andtotal N stocks on regional scale. Small-scale analyses arenecessary to improve the accuracy of estimates fornational and global soil carbon stocks and fluxes to theatmosphere (Morisada et al., 2004). Thus, knowledge ofSOC and total N stocks under different vegetation zonesmay aid in estimation of the future release orsequestration of SOC. As Mann (1986) has indicated,it is possible to predict changes in carbon storage in anysoil if its initial carbon content is known.
The objective of this study was to estimate the SOCand total N stocks within the 0–1.0m soil layer alongvegetation zonation at different aspects of the BaleMountains. In addition, the relationship between meanannual temperature and SOC was examined, astopographic aspect influences temperature [and ofcourse precipitation] in the area which are the twomost important factors in regulating the soil organiccarbon content in natural ecosystems, by influencinglitter production and soil organic matter mineralization(Post et al., 1982; Alvarez and Lavado, 1998).
2. Materials and methods
2.1. Study site
The study was carried out in the Bale Mountains,south-eastern Ethiopia, along four topographic aspects.The Bale Mountains, one of the largest massifs, are partof the south-eastern highlands of the country situatedapprox. 6°45′N, 39°45′E (Fig. 1). The mountains form asharp transition zone from high mountain vegetation tohot savannah areas within the south-eastern highlandsand associated lowland physiographic regions ofEthiopia. Geologically, the study sites are of volcanicorigin welded with volcanic ash materials (Mohr, 1971;Berhe et al., 1987). In an earlier reconnaissance study,Andosols is considered as the most prevalent soil in thehigher parts of the Bale Mountains (Weinert and
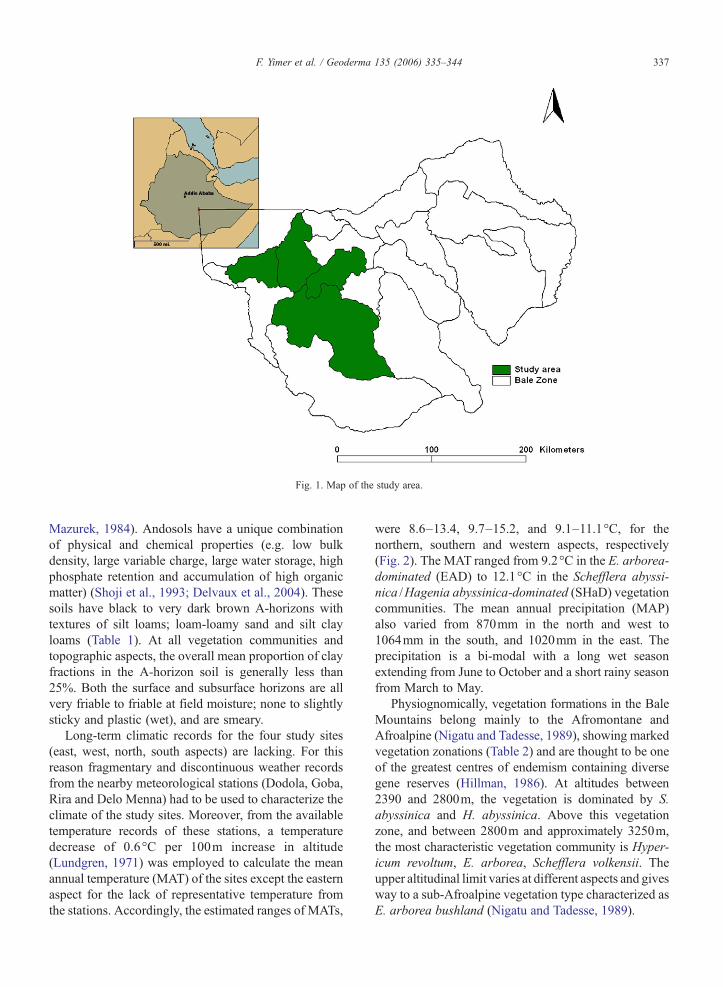
Fig. 1. Map of the study area.
337F. Yimer et al. / Geoderma 135 (2006) 335–344
Mazurek, 1984). Andosols have a unique combinationof physical and chemical properties (e.g. low bulkdensity, large variable charge, large water storage, highphosphate retention and accumulation of high organicmatter) (Shoji et al., 1993; Delvaux et al., 2004). Thesesoils have black to very dark brown A-horizons withtextures of silt loams; loam-loamy sand and silt clayloams (Table 1). At all vegetation communities andtopographic aspects, the overall mean proportion of clayfractions in the A-horizon soil is generally less than25%. Both the surface and subsurface horizons are allvery friable to friable at field moisture; none to slightlysticky and plastic (wet), and are smeary.
Long-term climatic records for the four study sites(east, west, north, south aspects) are lacking. For thisreason fragmentary and discontinuous weather recordsfrom the nearby meteorological stations (Dodola, Goba,Rira and Delo Menna) had to be used to characterize theclimate of the study sites. Moreover, from the availabletemperature records of these stations, a temperaturedecrease of 0.6°C per 100m increase in altitude(Lundgren, 1971) was employed to calculate the meanannual temperature (MAT) of the sites except the easternaspect for the lack of representative temperature fromthe stations. Accordingly, the estimated ranges of MATs,
were 8.6–13.4, 9.7–15.2, and 9.1–11.1°C, for thenorthern, southern and western aspects, respectively(Fig. 2). The MAT ranged from 9.2°C in the E. arborea-dominated (EAD) to 12.1°C in the Schefflera abyssi-nica /Hagenia abyssinica-dominated (SHaD) vegetationcommunities. The mean annual precipitation (MAP)also varied from 870mm in the north and west to1064mm in the south, and 1020mm in the east. Theprecipitation is a bi-modal with a long wet seasonextending from June to October and a short rainy seasonfrom March to May.
Physiognomically, vegetation formations in the BaleMountains belong mainly to the Afromontane andAfroalpine (Nigatu and Tadesse, 1989), showing markedvegetation zonations (Table 2) and are thought to be oneof the greatest centres of endemism containing diversegene reserves (Hillman, 1986). At altitudes between2390 and 2800m, the vegetation is dominated by S.abyssinica and H. abyssinica. Above this vegetationzone, and between 2800m and approximately 3250m,the most characteristic vegetation community is Hyper-icum revoltum, E. arborea, Schefflera volkensii. Theupper altitudinal limit varies at different aspects and givesway to a sub-Afroalpine vegetation type characterized asE. arborea bushland (Nigatu and Tadesse, 1989).
Table 1Surface soil colour and textural classes along the vegetation gradient atdifferent topographic aspects of the Bale Mountains
Aspect Vegetationcommunity⁎
Colour Texture
South SHaD Black/very darkbrown
Loam
HESD Black/very darkbrown
Silt loam/silt clay loam
EAD Black/very darkbrown
Silt loam/loam
North SHaD Black Silt loamHESD Black/dark brown Silt loam/silt clay loamEAD Black Silt loam
West SHaD Very dark brown/dark brown
Loam
HESD Black/very darkbrown
Silt loam/sandy loam
EAD Black Loam/sandy loamEast SHaD Black/very dark
brownLoam
HESD Black/very darkbrown
Silt loam
EAD Black Silt loam
⁎SHaD = Schefflera-Hagenia dominated, HESD = Hypericum-Erica-Schefflera dominated and EAD=Erica arborea (shrub-size) dominat-ed communities.
338 F. Yimer et al. / Geoderma 135 (2006) 335–344
2.2. Soil sampling and laboratory analysis
The vegetation was divided into three mainvegetation zones based on previous studies by Friis(1986), Nigatu and Tadesse (1989) and Bussmann(1997) with slight modification (Table 2) by includingthe shrub size E. arborea vegetation community as adistinct vegetation zone. At each stratified vegetationzone and in each of the four aspects, four sample plotsof 20×20m2 were randomly located, giving a total of48 sample plots.
Soil samples in each vegetation zone were taken andbulked from the five sampling points with ‘X’ designfrom the 0–0.3 and 0.3–1.0m soil depths. These depthsare commonly used in studies of soil organic carbon andtotal nitrogen pools (Eswaran et al., 1993; Sombroek etal., 1993; Batjes, 1996). The bulk samples from eachdepth were aggregated and pooled into a singlecomposite sample representing the sample plot. Priorto laboratory analysis, the samples were air-dried atroom temperature. Samples for chemical and physicalanalyses were passed through a 2mm soil sieve. SOCwas determined according to the Walkley and Blackmethod (Schnitzer, 1982), while total N was measuredfollowing the Kjeldahl method (Bremner and Mulva-ney, 1982) at the national soil research laboratory inAddis Ababa.
The results from five core samples from each depthclasses were taken and averaged to obtain representa-tive bulk density. SOC (kg C m−2) stock was computedusing the method described by Batjes (1996). In thefirst step, SOC stock (kg C m−2) was calculated bymultiplying percentage SOC, soil bulk density (g cm−3)and the defined depth classes (0–0.3 and 0.3–1.0m) foreach soil pit. The data were then grouped according tovegetation communities (vegetation zones) at differentaspects. Total nitrogen stock (kg N m−2) was alsocomputed employing a similar method to that used forSOC. Statistical differences were tested using two-wayanalysis of variance (ANOVA) following the general-ized linear model (GLM) procedure of SPSS version12.0.1 for Windows (Julie, 2001). Tukey's honestsignificance difference (HSD) test was used whenstatistically significant differences (p<0.05) wereobserved. To examine the relationship between SOCand MAT, linear regression analysis was performed.
3. Results
3.1. Soil organic carbon and total nitrogen stocks
The soil organic carbon stock for the first 0.3m depthvaried significantly with respect to aspect (p=0.003),vegetation community (p<0.001) and for the interactionterm (p=0.006). The amounts of soil organic carbon ofthe top 0.3m soil layer varied from 11.08 to 21.67kgm−2 (Table 3). For all vegetation communities, theorganic carbon stock was significantly higher for thesouthern aspect than the northern and western aspects(Table 3). In all topographic aspects, organic carbon wassignificantly higher for samples collected from the E.arborea-dominated vegetation community. In the sub-surface layer (0.3–1.0m depth), organic carbon showedsignificant variation among vegetation communities(p=0.001) and marginally significant with respect toaspect (p=0.05). SOC was higher for the southernaspect than for the northern, while the eastern andwestern aspects were more similar in SOC stock (Table3). Among vegetation communities, the E. arborea-dominated site had the largest SOC stock in thesubsurface soil. The derived mean SOC within the 0–1.0m depth (Table 3) also showed a significantdifference both with aspect (p=0.037) and vegetationcommunity (p<0.001).
Total nitrogen varied between 1.02kg m−2 and1.68kg m−2 in the surface soil (0–0.3m) and 1.61 and2.56kg m−2 within the lower (0.3–1.0m depth) soillayer (Table 4). In the top 0.3m, total nitrogensignificantly differed with aspect (p<0.001); higher

Fig. 2. Relationships between mean SOC and MAT in the 0–0.3m soil layer at different topographic aspects: south (a), west (b) and north (c). For theeastern aspect, representative MAT values were not available.
339F. Yimer et al. / Geoderma 135 (2006) 335–344
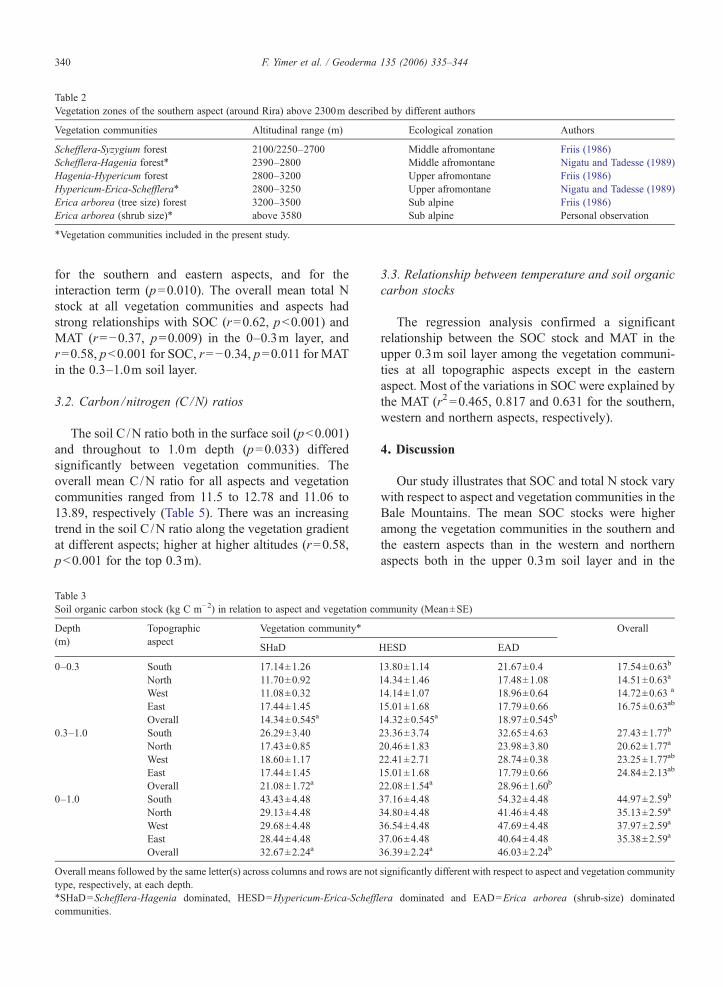
Table 2Vegetation zones of the southern aspect (around Rira) above 2300m described by different authors
Vegetation communities Altitudinal range (m) Ecological zonation Authors
Schefflera-Syzygium forest 2100/2250–2700 Middle afromontane Friis (1986)Schefflera-Hagenia forest⁎ 2390–2800 Middle afromontane Nigatu and Tadesse (1989)Hagenia-Hypericum forest 2800–3200 Upper afromontane Friis (1986)Hypericum-Erica-Schefflera⁎ 2800–3250 Upper afromontane Nigatu and Tadesse (1989)Erica arborea (tree size) forest 3200–3500 Sub alpine Friis (1986)Erica arborea (shrub size)⁎ above 3580 Sub alpine Personal observation
⁎Vegetation communities included in the present study.
340 F. Yimer et al. / Geoderma 135 (2006) 335–344
for the southern and eastern aspects, and for theinteraction term (p=0.010). The overall mean total Nstock at all vegetation communities and aspects hadstrong relationships with SOC (r=0.62, p<0.001) andMAT (r=−0.37, p=0.009) in the 0–0.3m layer, andr=0.58, p<0.001 for SOC, r=−0.34, p=0.011 for MATin the 0.3–1.0m soil layer.
3.2. Carbon /nitrogen (C /N) ratios
The soil C /N ratio both in the surface soil (p<0.001)and throughout to 1.0m depth (p=0.033) differedsignificantly between vegetation communities. Theoverall mean C/N ratio for all aspects and vegetationcommunities ranged from 11.5 to 12.78 and 11.06 to13.89, respectively (Table 5). There was an increasingtrend in the soil C /N ratio along the vegetation gradientat different aspects; higher at higher altitudes (r=0.58,p<0.001 for the top 0.3m).
Table 3Soil organic carbon stock (kg C m−2) in relation to aspect and vegetation co
Depth(m)
Topographicaspect
Vegetation community⁎
SHaD
0–0.3 South 17.14±1.26North 11.70±0.92West 11.08±0.32East 17.44±1.45Overall 14.34±0.545a
0.3–1.0 South 26.29±3.40North 17.43±0.85West 18.60±1.17East 17.44±1.45Overall 21.08±1.72a
0–1.0 South 43.43±4.48North 29.13±4.48West 29.68±4.48East 28.44±4.48Overall 32.67±2.24a
Overall means followed by the same letter(s) across columns and rows are nottype, respectively, at each depth.⁎SHaD=Schefflera-Hagenia dominated, HESD=Hypericum-Erica-Schefflcommunities.
3.3. Relationship between temperature and soil organiccarbon stocks
The regression analysis confirmed a significantrelationship between the SOC stock and MAT in theupper 0.3m soil layer among the vegetation communi-ties at all topographic aspects except in the easternaspect. Most of the variations in SOC were explained bythe MAT (r2 =0.465, 0.817 and 0.631 for the southern,western and northern aspects, respectively).
4. Discussion
Our study illustrates that SOC and total N stock varywith respect to aspect and vegetation communities in theBale Mountains. The mean SOC stocks were higheramong the vegetation communities in the southern andthe eastern aspects than in the western and northernaspects both in the upper 0.3m soil layer and in the
mmunity (Mean±SE)
Overall
HESD EAD
13.80±1.14 21.67±0.4 17.54±0.63b
14.34±1.46 17.48±1.08 14.51±0.63a
14.14±1.07 18.96±0.64 14.72±0.63 a
15.01±1.68 17.79±0.66 16.75±0.63ab
14.32±0.545a 18.97±0.545b
23.36±3.74 32.65±4.63 27.43±1.77b
20.46±1.83 23.98±3.80 20.62±1.77a
22.41±2.71 28.74±0.38 23.25±1.77ab
15.01±1.68 17.79±0.66 24.84±2.13ab
22.08±1.54a 28.96±1.60b
37.16±4.48 54.32±4.48 44.97±2.59b
34.80±4.48 41.46±4.48 35.13±2.59a
36.54±4.48 47.69±4.48 37.97±2.59a
37.06±4.48 40.64±4.48 35.38±2.59a
36.39±2.24a 46.03±2.24b
significantly different with respect to aspect and vegetation community
era dominated and EAD=Erica arborea (shrub-size) dominated

Table 4Total nitrogen stocks (kg N m−2) in relation to aspect and vegetation community (Mean±SE)
Depth(m)
Topographicaspect
Vegetation community⁎ Over all
SHaD HESD EAD
0–0.3 South 1.68±0.10 1.35±0.10 1.512±0.06 1.52±0.05c
North 1.18±0.06 1.29±0.06 1.33±0.08 1.27±0.05ab
West 1.02±0.08 1.09±0.08 1.38±0.09 1.16±0.05a
East 1.53±0.12 1.36±0.12 1.28±0.01 1.39±0.05bc
Over all 1.35±0.04 1.27±0.04 1.37±0.040.3–1.0 South 1.82±0.43 2.33±0.29 2.56±0.35 2.34±0.18
North 1.73±0.12 2.12±0.21 2.25±0.36 2.03±0.18West 1.79±0.21 2.16±0.12 2.53±0.28 2.16±0.18East 1.61±0.04 2.11±0.38 2.15±0.55 2.01±0.21Over all 1.75±0.17a 2.18±0.15ab 2.39±0.16b
0–1.0 South 3.50±0.37 3.68±0.37 4.08±0.37 3.75±0.21b
North 2.91±0.37 3.41±0.37 3.57±0.37 3.30±0.21ab
West 2.81±0.37 3.25±0.37 3.91±0.37 3.32±0.21ab
East 2.34±0.37 3.47±0.37 2.90±0.37 2.90±0.21a
Over all 2.89±0.18a 3.45±0.18ab 3.61±0.18b
Overall means followed by the same letter(s) across columns and rows are not significantly different with respect to aspect and vegetation communitytype, respectively at each depth.⁎SHaD = Schefflera-Hagenia dominated, HESD = Hypericum-Erica-Scheffleradominated and EAD=Erica arborea (shrub-size) dominatedcommunities.
341F. Yimer et al. / Geoderma 135 (2006) 335–344
subsurface layer from 0.3m down to 1.0m. This may bedue to lower organic carbon turnover rate resulting fromhigher mean annual precipitation (1064mm for thesouthern and 1021mm for the eastern aspects) and lowertemperature conditions favouring accumulation ofconsiderably higher amounts of organic matter in thesevegetation communities. This finding was consistentwith those of Post et al. (1982), Tremblay et al. (2002),
Table 5Carbon–nitrogen ratio (C :N) in relation to aspect 108 pect and vegetation c
Depth(m)
Topographicaspect
Vegetation community⁎
SHaD
0–0.3 South 10.50±0.29North 10.00±0.41West 11.25±0.95East 12.50±0.65Over all 11.06±0.43a
0.3–1.0 South 11.75±1.34North 10.25±1.03West 10.75±1.11East 13.50±0.50Over all 11.29±0.64
0–1.0 South 13.10±0.67North 10.10±0.67West 10.64±0.67East 11.80±0.67Over all 11.41±0.58ab
Overall means followed by the same letter(s) across columns and rows are nottype, respectively at each depth.⁎SHaD = Schefflera-Hagenia dominated, HESD = Hypericum-Erica-Schcommunities.
Ganuza and Almendros (2003), Lemenih and Itanna(2004) and Wang et al. (2004) who reported an increasein SOC levels with decreasing MAT. This is to beexpected in the High Mountain soils of Eastern Africa,where increasing altitude is associated with low MATand higher orographic precipitation and high organicmatter concentrations (Birch and Friend, 1956). Gener-ally, the higher SOC stocks in the soils of the southern
ommunity (mean±SE)
Over all
HESD EAD
10.25±0.48 14.5±0.65 11.75±0.4911.25±1.65 13.25±0.75 11.50±0.4913.00±0.71 14.00±1.08 12.75±0.4911.00±1.15 13.75±0.48 12.42±0.4911.37±0.43a 13.89±0.43b
10.00±0.71 12.50±1.19 11.42±0.6610.50±1.55 11.00±1.47 10.58±0.6610.25±0.95 11.75±0.95 10.92±0.6611.25±1.38 14.33±0.33 12.78±0.8010.50±0.57 12.27±0.6010.02±0.67 13.39±0.67 12.17±0.6710.60±0.67 11.85±0.67 10.85±0.6711.20±0.67 12.45±0.67 11.43±0.6711.06±0.67 14.01±0.67 12.29±0.6710.72±0.58a 12.92±0.58b
significantly different with respect to aspect and vegetation community
effleradominated and EAD=Erica arborea (shrub-size) dominated
342 F. Yimer et al. / Geoderma 135 (2006) 335–344
and eastern aspects, as compared to the northern andwestern aspects, may be explained by the influence of(micro) climate on the biomass and litter production onthe one hand, and the organic matter decomposingmicro-organisms on the other. In addition, as the soilswere derived from air-borne volcanic materials, higherSOC contents may be expected from these volcanicmaterials than in non-volcanic soils. The strong bondsbetween amorphous material constituents inhibit thedecomposition of the majority of the organic matter(Sombroek et al., 1993). As a whole, the mean SOCvalues (kg C m−2) at all aspects and vegetationcommunities were consistent with other studies (e.g.Sombroek et al., 1993; Batjes, 1996).
The distribution of SOC with depth showed that onaverage 40–45% of the SOC stock in the 0–1.0m layerof the mineral soil was held in the top 0.3m of the soil,indicating the potential for large amounts of CO2 to bereleased from the surface soil when these vegetationcommunities are deforested and converted into grazingand cultivation, as well as with changes in forestmanagement practices. The relative distribution be-tween the top layer and the layer below is comparablewith results for similar tropical and subtropical soils(Sombroek et al., 1993; Batjes, 1996) and Andosols ofthe Simen Mountains National Park, Ethiopia (Yimer,1996).
The general figure observed for the amount of totalN was higher in the southern and eastern aspects, whichfollowed the pattern of SOC stock distribution due tothe fact that most nitrogen forms part of the soil organicmatter (Ganuza and Almendros, 2003). The mean totalN stocks for the 0–0.3m and 0.3–1.0m soil layers at allaspects and vegetation communities were in agreementwith the ranges for the soils of Central and EasternEurope (Batjes, 1996) though there were slightly highertotal N stocks below 0.3m depths in this study. A C/Nratio above 12–14 is often considered indicative of ashortage of nitrogen in the soil (Batjes and Dijkshoorn,1999). The higher C /N ratios in our study areas couldbe related to a lower percentage proportion of clayfractions. According to Hassink et al. (1993), physi-cally protected organic matter [SOC] has a lower ratiothan organic matter [SOC] that is not physicallyprotected. An increasing trend in the C /N ratios fromthe Schefflera-Hagenia to E. arborea-dominated veg-etation communities at all aspects could partly be due toan increase in the mean annual precipitation and adecrease in the MAT, factors for mineralization ofhumus. The overall mean C/N ratios of the top 0.3mlayer at all aspects and vegetation communities werewithin the ranges for most temperate soils (Batjes,
1996) and High Mountain soils of Ethiopia (Yimer,1996).
On the slopes of the Bale Mountains, where meanannual precipitation varies between 870 and 1064mm, itis likely that moisture is a less limiting factor fordecomposition and therefore differences in temperatureare more likely to give rise to differences in breakdownrate. Over a range of increasing moisture contents andtemperatures, both factors lead to increasing decompo-sition rates, however, in areas where the precipitationrange remains small, the influence of temperaturebecomes more significant. Therefore at the BaleMountains one would expect the temperature to be thedominant decisive factor for the decomposition rate.With temperature decreasing with altitude, lowerdecomposition rate with altitude is to be expected inthe higher altitudes. Naturally, the amount of litterincorporated into the soil will also influence the amountof carbon found in the profile, and in a long-termperspective, soil C stocks will approach the ratiobetween litter input rate and decomposition rate (Andrénand Kätterer, 1997).
5. Conclusions
In the studied case of the Bale Mountains, higheraltitudes were seen to result in a higher amount ofcarbon stock in comparison with lower altitudes. SOCand total N accumulation in the soils of the BaleMountains are regulated mainly by aspect-induced sitedifferences in microclimatic factors such as the MATand the vegetation types through the rate and type oforganic residue incorporated into the soil system. Thus,determination of aspect-induced variations in SOC canbe used as an important parameter in prioritizing areasfor better ecosystem management practices and therebyimproving the potential of soils to sequester moreorganic carbon and mitigate climate change. Theempirical data obtained from this study show thataspect-induced differences in soil organic carbon stocksare highly variable between the vegetation communities.
Acknowledgements
This study was financed through SIDA support toWondo Genet College of Forestry, Ethiopia. Specialthanks to Dr. Mulualem Tigabu, Faculty of ForestSciences/SLU, Umeå, for his valuable comments on themanuscript. We also thank staff members of the BaleMountains National Park Head quarters, Mr. AkliluAmeha, Manager of the Adaba-Dodolla IntegratedForest Management Programme (IFMP)-GTZ, Mr.

343F. Yimer et al. / Geoderma 135 (2006) 335–344
Sileshi Kifle, and the communities around the studyareas for their assistance during the field work.
References
Alvarez, R., Lavado, R.S., 1998. Climate, organic matter and claycontent relationships in the Pampa and Chaco soils, Argentina.Geoderma 83, 127–141.
Andrén, O., Kätterer, T., 1997. ICBM—the Introductory CarbonBalance Model for exploration of soil carbon balances. Ecol. Appl.7 (4), 1226–1236.
Bale, C.L., Charley, J.L., 1994. The impact of aspect on forest floorcharacteristics in some eastern Australian sites. For. Ecol. Manag.67, 305–317.
Bale, C.L., Williams, B.J., Charley, J.L., 1998. The impact of aspect onforest structure and floristics in some Eastern Australian Sites. For.Ecol. Manag. 110, 363–377.
Batjes, N.H., 1996. Total carbon and nitrogen in the soils of the world.Eur. J. Soil Sci. 47, 151–163.
Batjes, N.H., Dijkshoorn, J.A., 1999. Carbon and nitrogen stocks inthe soils of Amazon Region. Geoderma 89, 273–286.
Berhe, S.M., Desta, B., Nicoletti, M., Teferra, M., 1987. Geology,geochronology and geodynamic implications of the Cenozoicmagmatic province in W and SE Ethiopia. J. Geol. Soc. 144,213–226.
Birch, H.F., Friend, M.T., 1956. The organic matter and nitrogen statusof East African Soils. J. Soil Sci. 7, 156–167.
Bremner, J.M., Mulvaney, C.S., 1982. Nitrogen-total. In: Page, A.L.,Miller, R.H., Keeney, D.R. (Eds.), Methods of Soil Analysis, vol.2. American Society of Agronomy, Madison, Wis., pp. 595–624.
Brubaker, S.C., Jones, A.J., Lewis, D.T., Frank, K., 1993. Soilproperties associated with landscape position. Soil Sci. Am. J. 57,235–239.
Bussmann, R., 1997. The forest vegetation of the Harenna Escarpment(Bale Province, Ethiopia)—syntaxonomy and phytogeographicalaffinities. Phytocoenologia 27 (1), 1–23.
Casanova, M., Messing, I., Joel, A., 2000. Influence of aspect andslope gradient on hydraulic conductivity measured by tensioninfiltrometer. Hydrol. Process. 14, 155–164.
Chen, Z.S., Hsieh, C.F., Jiang, F.Y., Hsieh, T.H., Sun, I.F., 1997.Relations of soil properties to topography and vegetation in a sub-tropical rain forest in southern Taiwan. Plant Ecol. 132, 229–241.
Dahlgren, A.R., Bottinger, L.T., Huntington, L.G., Amundson, A.R.,1997. Soil development along an elevation transect in the westernSierra Nevada, California. Geoderma 78, 207–236.
Delvaux, B., Strebl, F., Maes, E., Herbillon, A.D., Brahy, V.,Gerzabek, M., 2004. An andosol–cambisol toposequence ongranite in the Australian Bohemian Massif. Catena 56, 31–43.
Eshetu, Z., Giesler, R., Högberg, P., 2004. Historical land use affectsthe chemistry of forest soils in the Ethiopian highlands. Geoderma118, 149–165.
Eswaran, H., Van den Berg, E., Reich, P., 1993. Organic carbon in soilsof the world. Soil Sci. Soc. Am. J. 57, 192–194.
Friis, I., 1986. Zonation of the forest vegetation on the south slopes ofBale Mountains, South Ethiopia. Sinet, Ethiop. J. Sci. 9(supplement), 29–44.
Friis, I., Lamesson, J., 1993. Altitudinal zonation in the forest tree floraof Northeast tropical Africa. Opera Bot. 121, 125–127.
Ganuza, A., Almendros, G., 2003. Organic carbon storage in soils ofthe Basque Country (Spain): the effect of climate, vegetation typeand edaphic variables. Biol. Fertil. Soils 37, 154–162.
Hartman, R.E., Lloyd, W.J., 1969. The influence of aspect on forests ofthe Clarksville soils in Dent Country, Missouri. J. For. 67,178–182.
Hassink, J., Bouwman, L.A., Zwart, K.B., Bloem, J., Brussaard, L.,1993. Relationships between soil texture, physical protection oforganic matter, soil biota, and C and N mineralization in grasslandsoils. Geoderma 57 (1–2), 105–128.
Hicks, R.R., Frank, P.S., 1984. Relationship of aspect to soil nutrients,species importance and biomass in a forested watershed in westVirginia. For. Ecol. Manag. 8, 281–291.
Hillman, J.C., 1986. The Bale Mountains National Park: ManagementPlan. Wildlife Conservation Organization, Addis Abeba.
Hutchins, R.L., Hill, J.D., White, E.H., 1976. The influence of soil andmicroclimate on vegetation of forested slopes in eastern Kentucky.Soil Sci. 121, 234–241.
Julie, P., 2001. A Step by Step Guide to Data Analysis Using SPSS forWindows. Open University Press.
Klopatek, J.M., Conant, R.T., Francis, J.M., Malin, R.A., Murphy, K.L., Klopatek, C.C., 1998. Implications of patterns of carbon poolsand fluxes across a semiarid environmental gradient. Landsc.Urban Plan. 39, 309–317.
Lemenih, M., Itanna, F., 2004. Soil carbon stock and turnovers invarious vegetation types and arable lands along an elevationgradient in southern Ethiopia. Geoderma 123, 177–188.
Li, Z., Zhao, Q., 2001. Organic carbon content and distribution in soilsunder different land uses in tropical and subtropical China. PlantSoil 231, 175–185.
Lisiki, J., Westman, C.J., 1997. Carbon storage in forest soils ofFinland: II. Size and regional patterns. Biogeochemistry 36,247–261.
Lundgren, B., 1971. Soil studies in a montane forest in Ethiopia.Research notes Nr 11. Department of Forest Ecology and ForestSoils. Royal College of Forestry, Stockholm.
Mann, L.K., 1986. Changes in soil carbon storage after cultivation.Soil Sci. 142, 279–288.
Mendoza-Vega, J. 2002. The influence of land use/land cover and soiltypes on amounts of soil organic carbon and soil characteristics.Doctoral thesis. Swedish University of Agricultural Sciences,Uppsala, Sweden.
Mohr, P., 1971. The Geology of Ethiopia. Addis Ababa University,Addis Abeba.
Morisada, K., Ono, K., Kanomata, H., 2004. Organic carbon stock inforest soils in Japan. Geoderma 119 (1–2), 21–32.
Nigatu, L., Tadesse, M., 1989. An ecological study of the vegetation ofthe Harenna Forest, Bale, Ethiopia. Sinet, Ethiop. J. Sci. 12 (1),63–93.
Perruchoud, D., Walthert, L., Zimmermann, S., Lüscher, P., 2000.Contemporary carbon stocks of mineral forest soils in the SwissAlps. Biogeochemistry 50, 111–136.
Post, W.M., Emanuel, W.R., Zinke, P.J., Stangenberger, A.G., 1982.Soil carbon pools and world life zones. Nature 298, 155–159.
Rasmussen, P.E., Albrecht, S.L., Smiley, R.W., 1998. Soil C and Nchanges under tillage and cropping systems in semi-arid PacificNorthwest agriculture. Soil Tillage Res. 47, 197–205.
Rhoades, C.C., Eckert, G.E., Coleman, D.C., 2000. Soil carbondifferences among forest, agriculture and secondary vegetation inlower montane Ecuador. Ecol. Appl. 10, 497–505.
Ringrose, S., Matheson, W., Vanderpost, C., 1998. Analysis of soilorganic carbon and vegetation cover trends along the BotswanaKalahari Transect. J. Arid Environ. 38, 379–396.
Schjønning, R., Thomsen, I.K., Møberg, J.P., de Jonge, H., Kristensen,K., Christensen, B.T., 1999. Turnover of organic matter in

344 F. Yimer et al. / Geoderma 135 (2006) 335–344
differently textured soils: I. Physical characteristics of structurallydisturbed and intact soils. Geoderma 89, 177–198.
Schnitzer, M., 1982. Total carbon, organic matter, and carbon, In:Page, A.L., Miller, R.H., Keeney, D.R. (Eds.), Methods of SoilAnalysis. Part 2, 2nd Edition. Agronomy Monograph, vol. 9.American Society of Agronomy, Madison, WI, pp. 539–577.
Shoji, S., Dahlgren, R.A., Nanzyo, M., 1993. Genesis of volcanic ashsoils. In: Shoji, S., Nanzyo, M., Dahlgren, R.A. (Eds.), VolcanicAsh Soils: Genesis, Properties and Utilization. Elsevier, Amster-dam, pp. 37–71.
Sombroek, W.G., Nachtergaele, F.O., Hebel, A., 1993. Amounts,dynamics and sequestering of carbon in tropical and subtropicalsoils. Ambio 22 (7), 417–426.
Swift, M.J., Heal, O.W., Andersson, J.M., 1979. Decomposition inTerrestrial Ecosystems. Blackwell Scientific publications, Oxford.
Tremblay, S., Ouimet, R., Houle, D., 2002. Prediction of organiccarbon content in upland forest soils of Quebec, Canada. Can. J.For. Res. 32, 903–914.
Trumbore, S.E., 1997. Potential responses of soil organic carbon toglobal environmental change. Proc. Natl. Acad. Sci. 94,8284–8291.
Wang, S., Shao, M., Mickler, R., Ji, K.J., 2004. Vertical distribution ofsoil organic carbon in China. Environ. Manage. 33 (Supplement),200–209.
Weinert, E., Mazurek, A., 1984. Notes on vegetation and soil in BaleProvince of Ethiopia. Feddes Repert. 95, 373–380.
Yimer, F., 1996. An Assessment of the Status of Soils, SoilDegradation and Conservations in the Upper Catchments of theAnsiya Valley, Simen Mountains National Park, Gonder, Ethiopia.MSc Thesis, Addis Ababa University, Addis Abeba.
Copyright © 2022 FDOKUMEN