soil liquefaction hazard assessment along - University of Malaya
Upload
independentCategory
view
1download
0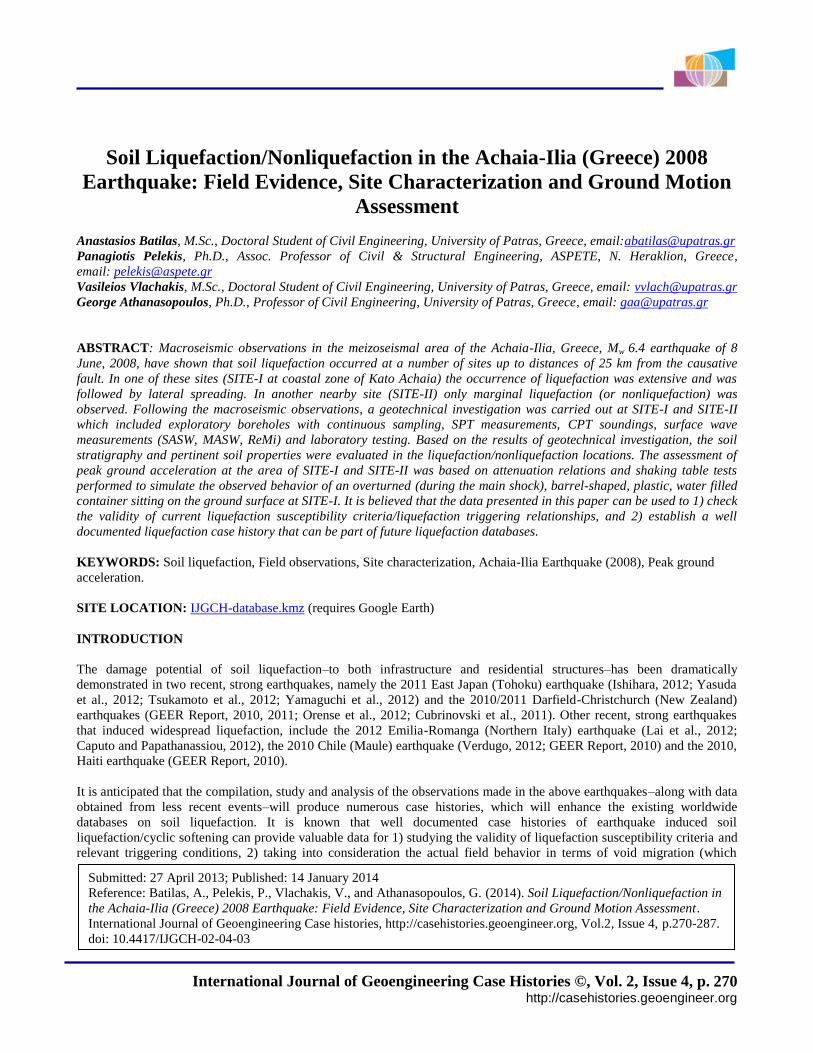
International Journal of Geoengineering Case Histories ©, Vol. 2, Issue 4, p. http://casehistories.geoengineer.org
270
Soil Liquefaction/Nonliquefaction in the Achaia-Ilia (Greece) 2008
Earthquake: Field Evidence, Site Characterization and Ground Motion
Assessment
Anastasios Batilas, M.Sc., Doctoral Student of Civil Engineering, University of Patras, Greece, email:[email protected]
Panagiotis Pelekis, Ph.D., Assoc. Professor of Civil & Structural Engineering, ASPETE, N. Heraklion, Greece,
email: [email protected]
Vasileios Vlachakis, M.Sc., Doctoral Student of Civil Engineering, University of Patras, Greece, email: [email protected]
George Athanasopoulos, Ph.D., Professor of Civil Engineering, University of Patras, Greece, email: [email protected]
ABSTRACT: Macroseismic observations in the meizoseismal area of the Achaia-Ilia, Greece, Mw 6.4 earthquake of 8
June, 2008, have shown that soil liquefaction occurred at a number of sites up to distances of 25 km from the causative
fault. In one of these sites (SITE-I at coastal zone of Kato Achaia) the occurrence of liquefaction was extensive and was
followed by lateral spreading. In another nearby site (SITE-II) only marginal liquefaction (or nonliquefaction) was
observed. Following the macroseismic observations, a geotechnical investigation was carried out at SITE-I and SITE-II
which included exploratory boreholes with continuous sampling, SPT measurements, CPT soundings, surface wave
measurements (SASW, MASW, ReMi) and laboratory testing. Based on the results of geotechnical investigation, the soil
stratigraphy and pertinent soil properties were evaluated in the liquefaction/nonliquefaction locations. The assessment of
peak ground acceleration at the area of SITE-I and SITE-II was based on attenuation relations and shaking table tests
performed to simulate the observed behavior of an overturned (during the main shock), barrel-shaped, plastic, water filled
container sitting on the ground surface at SITE-I. It is believed that the data presented in this paper can be used to 1) check
the validity of current liquefaction susceptibility criteria/liquefaction triggering relationships, and 2) establish a well
documented liquefaction case history that can be part of future liquefaction databases.
KEYWORDS: Soil liquefaction, Field observations, Site characterization, Achaia-Ilia Earthquake (2008), Peak ground
acceleration.
SITE LOCATION: IJGCH-database.kmz (requires Google Earth)
INTRODUCTION
The damage potential of soil liquefaction–to both infrastructure and residential structures–has been dramatically
demonstrated in two recent, strong earthquakes, namely the 2011 East Japan (Tohoku) earthquake (Ishihara, 2012; Yasuda
et al., 2012; Tsukamoto et al., 2012; Yamaguchi et al., 2012) and the 2010/2011 Darfield-Christchurch (New Zealand)
earthquakes (GEER Report, 2010, 2011; Orense et al., 2012; Cubrinovski et al., 2011). Other recent, strong earthquakes
that induced widespread liquefaction, include the 2012 Emilia-Romanga (Northern Italy) earthquake (Lai et al., 2012;
Caputo and Papathanassiou, 2012), the 2010 Chile (Maule) earthquake (Verdugo, 2012; GEER Report, 2010) and the 2010,
Haiti earthquake (GEER Report, 2010).
It is anticipated that the compilation, study and analysis of the observations made in the above earthquakes–along with data
obtained from less recent events–will produce numerous case histories, which will enhance the existing worldwide
databases on soil liquefaction. It is known that well documented case histories of earthquake induced soil
liquefaction/cyclic softening can provide valuable data for 1) studying the validity of liquefaction susceptibility criteria and
relevant triggering conditions, 2) taking into consideration the actual field behavior in terms of void migration (which
Submitted: 27 April 2013; Published: 14 January 2014
Reference: Batilas, A., Pelekis, P., Vlachakis, V., and Athanasopoulos, G. (2014). Soil Liquefaction/Nonliquefaction in
the Achaia-Ilia (Greece) 2008 Earthquake: Field Evidence, Site Characterization and Ground Motion Assessment.
International Journal of Geoengineering Case histories, http://casehistories.geoengineer.org, Vol.2, Issue 4, p.270-287.
doi: 10.4417/IJGCH-02-04-03
International Journal of Geoengineering Case Histories ©, Vol. 2, Issue 4, p. http://casehistories.geoengineer.org
271
cannot be simulated in laboratory testing), 3) for estimating the residual strength of liquefied material or checking the
accuracy of available predictive equations for lateral spreading displacements, and 4) for studying the effectiveness of
relevant mitigation measures (Idriss and Boulanger, 2008). It is recognized, however, that the value of relevant case
histories depends on the available amount of site characterization data (through in situ and laboratory testing) as well as on
information regarding the characteristics of earthquake ground motion at the liquefied site (Boulanger and Idriss, 2012;
Moss et al., 2011).
The subject of the present study is the presentation of a case history involving soil liquefaction/nonliquefaction and lateral
spreading in the coastal zone of Kato Achaia, about 6 km from the causative fault of the Achaia-Ilia (Greece) Mw 6.4
earthquake of June 8, 2008, (Margaris et al., 2008, 2010; Batilas et al., 2011). The Mw 6.4 earthquake of June 8, 2008 in
Achaia-Ilia prefecture near the city of Patras, Greece, caused severe damage to buildings and other engineered structures in
the meizoseismal area, as well as a variety of geotechnical failures within approximately 25 km from fault (Margaris et al.
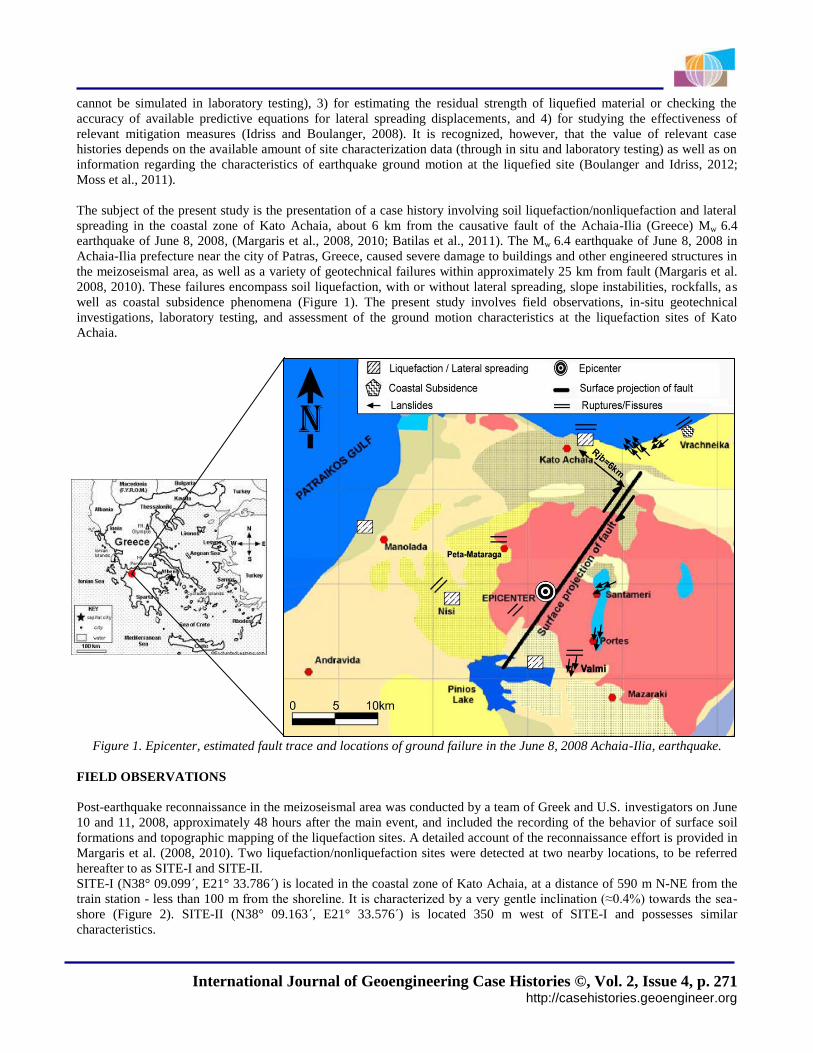
2008, 2010). These failures encompass soil liquefaction, with or without lateral spreading, slope instabilities, rockfalls, as
well as coastal subsidence phenomena (Figure 1). The present study involves field observations, in-situ geotechnical
investigations, laboratory testing, and assessment of the ground motion characteristics at the liquefaction sites of Kato
Achaia.
Figure 1. Epicenter, estimated fault trace and locations of ground failure in the June 8, 2008 Achaia-Ilia, earthquake.
FIELD OBSERVATIONS
Post-earthquake reconnaissance in the meizoseismal area was conducted by a team of Greek and U.S. investigators on June
10 and 11, 2008, approximately 48 hours after the main event, and included the recording of the behavior of surface soil
formations and topographic mapping of the liquefaction sites. A detailed account of the reconnaissance effort is provided in
Margaris et al. (2008, 2010). Two liquefaction/nonliquefaction sites were detected at two nearby locations, to be referred
hereafter to as SITE-I and SITE-II.
SITE-I (N38° 09.099΄, E21° 33.786΄) is located in the coastal zone of Kato Achaia, at a distance of 590 m N-NE from the
train station - less than 100 m from the shoreline. It is characterized by a very gentle inclination (≈0.4%) towards the sea-
shore (Figure 2). SITE-II (N38° 09.163΄, E21° 33.576΄) is located 350 m west of SITE-I and possesses similar
characteristics.
International Journal of Geoengineering Case Histories ©, Vol. 2, Issue 4, p. http://casehistories.geoengineer.org
272
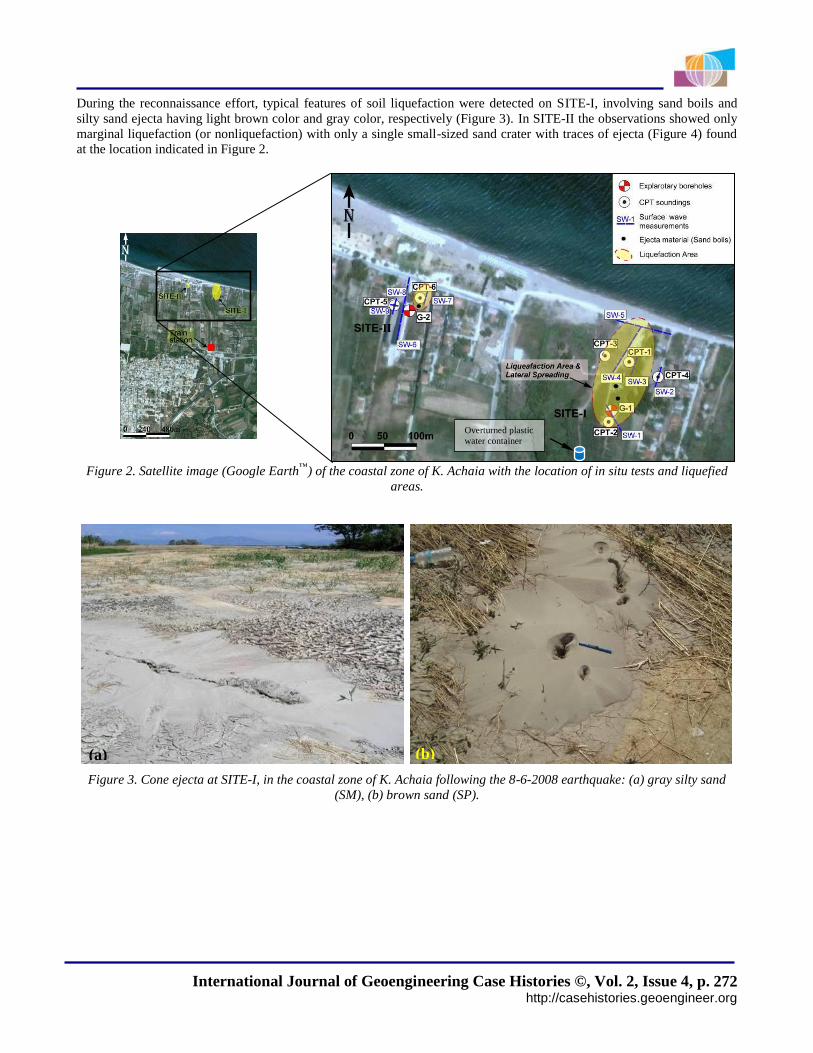
During the reconnaissance effort, typical features of soil liquefaction were detected on SITE-I, involving sand boils and
silty sand ejecta having light brown color and gray color, respectively (Figure 3). In SITE-II the observations showed only
marginal liquefaction (or nonliquefaction) with only a single small-sized sand crater with traces of ejecta (Figure 4) found
at the location indicated in Figure 2.
Figure 2. Satellite image (Google Earth
™) of the coastal zone of K. Achaia with the location of in situ tests and liquefied
areas.
Figure 3. Cone ejecta at SITE-I, in the coastal zone of K. Achaia following the 8-6-2008 earthquake: (a) gray silty sand
(SM), (b) brown sand (SP).
(a) (b)
Overturned plastic
water container
International Journal of Geoengineering Case Histories ©, Vol. 2, Issue 4, p. http://casehistories.geoengineer.org
273
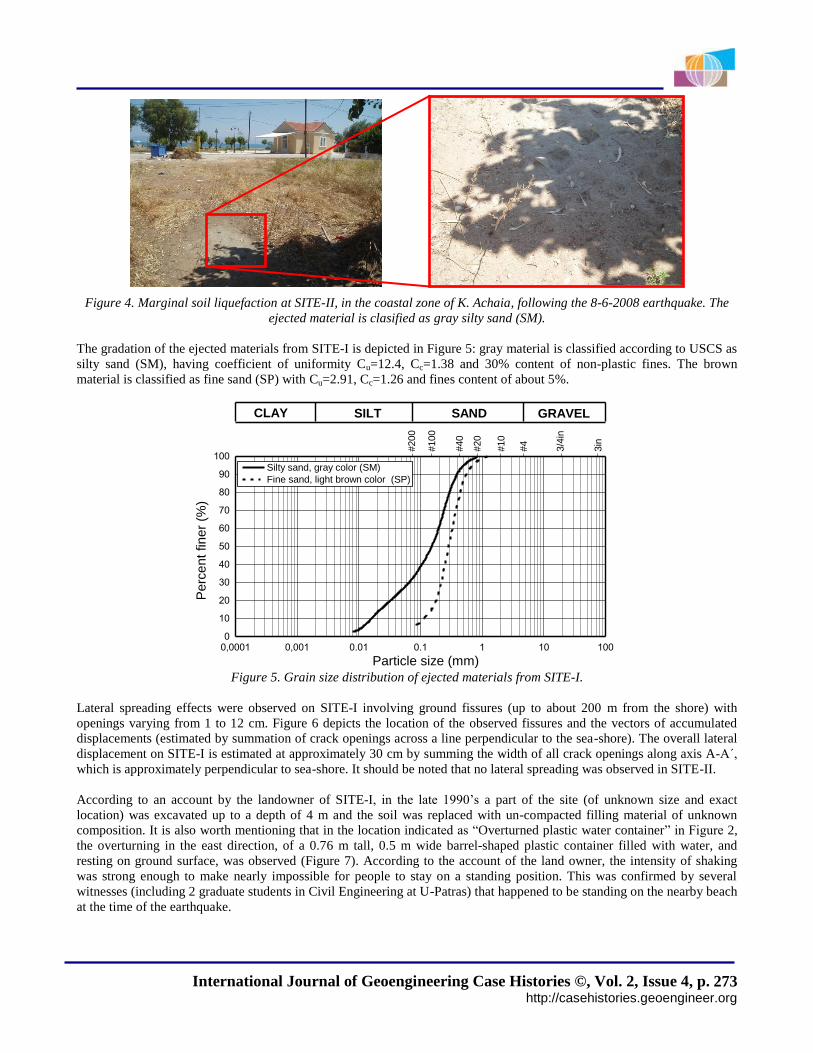
Figure 4. Marginal soil liquefaction at SITE-II, in the coastal zone of K. Achaia, following the 8-6-2008 earthquake. The
ejected material is clasified as gray silty sand (SM).
The gradation of the ejected materials from SITE-I is depicted in Figure 5: gray material is classified according to USCS as
silty sand (SM), having coefficient of uniformity Cu=12.4, Cc=1.38 and 30% content of non-plastic fines. The brown
material is classified as fine sand (SP) with Cu=2.91, Cc=1.26 and fines content of about 5%.
Figure 5. Grain size distribution of ejected materials from SITE-I.
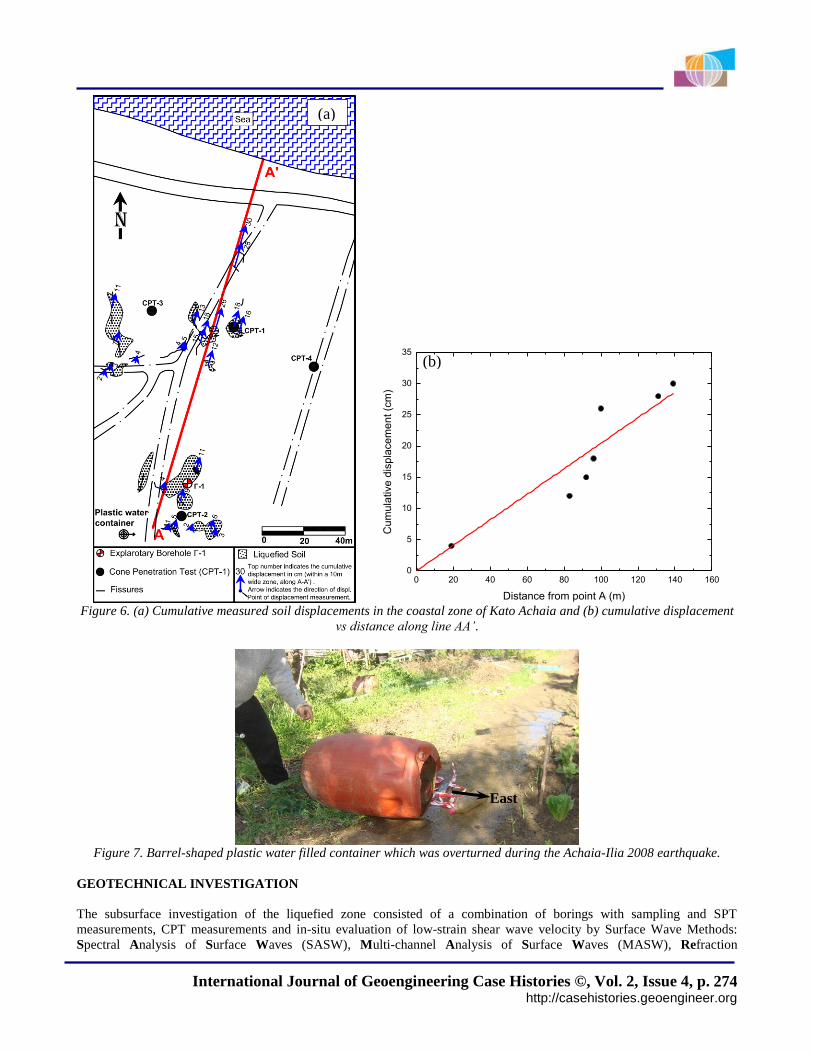
Lateral spreading effects were observed on SITE-I involving ground fissures (up to about 200 m from the shore) with
openings varying from 1 to 12 cm. Figure 6 depicts the location of the observed fissures and the vectors of accumulated
displacements (estimated by summation of crack openings across a line perpendicular to the sea-shore). The overall lateral
displacement on SITE-I is estimated at approximately 30 cm by summing the width of all crack openings along axis A-A΄,
which is approximately perpendicular to sea-shore. It should be noted that no lateral spreading was observed in SITE-II.
According to an account by the landowner of SITE-I, in the late 1990’s a part of the site (of unknown size and exact
location) was excavated up to a depth of 4 m and the soil was replaced with un-compacted filling material of unknown
composition. It is also worth mentioning that in the location indicated as “Overturned plastic water container” in Figure 2,
the overturning in the east direction, of a 0.76 m tall, 0.5 m wide barrel-shaped plastic container filled with water, and
resting on ground surface, was observed (Figure 7). According to the account of the land owner, the intensity of shaking
was strong enough to make nearly impossible for people to stay on a standing position. This was confirmed by several
witnesses (including 2 graduate students in Civil Engineering at U-Patras) that happened to be standing on the nearby beach
at the time of the earthquake.
0,0001 0,001 0.01 0.1 1 10 1000
10
20
30
40
50
60
70
80
90
100 Silty sand, gray color (SM)
Fine sand, light brown color (SP)
Perc
en
t fin
er
(%)
Particle size (mm)
#20
#100
#200
#40
#10
#4
3/4
in
3in
GRAVELSANDSILTCLAY
International Journal of Geoengineering Case Histories ©, Vol. 2, Issue 4, p. http://casehistories.geoengineer.org
274
Figure 6. (a) Cumulative measured soil displacements in the coastal zone of Kato Achaia and (b) cumulative displacement
vs distance along line AA’.
Figure 7. Barrel-shaped plastic water filled container which was overturned during the Achaia-Ilia 2008 earthquake.
GEOTECHNICAL INVESTIGATION
The subsurface investigation of the liquefied zone consisted of a combination of borings with sampling and SPT
measurements, CPT measurements and in-situ evaluation of low-strain shear wave velocity by Surface Wave Methods:
Spectral Analysis of Surface Waves (SASW), Multi-channel Analysis of Surface Waves (MASW), Refraction
0 20 40 60 80 100 120 140 1600
5
10
15
20
25
30
35
Cu
mu
lative
dis
pla
ce
me
nt (c
m)
Distance from point A (m)
East
(a)
(b)

International Journal of Geoengineering Case Histories ©, Vol. 2, Issue 4, p. http://casehistories.geoengineer.org
275
Microtremor (ReMi), as shown in Figure 2 (Tran and Hiltunen, 2008, Pelekis and Athanasopoulos, 2011). Classification
and shear strength laboratory tests were also conducted (Table 1). The actual delivered energy for each blow of the donut
type hammer (operated with a cathead and rope system) was measured using an SPT Analyzer system (Figure 8). The
results of the energy measurements show a mean energy ratio, ER (i.e. the ratio of measured impact energy to 100% of
theoretical energy) of about 48%. Thus, the correction factor CE, required in liquefaction triggering analyses, i.e. the ratio of
impact energy to 60% of theoretical free-fall energy, is CE=ER/60=0.8. It should be noted that the above value of CE
corresponds to the depth of formations susceptible to liquefaction (up to 12m depth in SITE-I) with no clear trend of CE vs
depth relation identified in the Kato Achaia site. To the extent of the authors knowledge this is the first time SPT energy
measurements is conducted in Greece. All data obtained from the in-situ tests, and additional information, is available in
digital form as accompanying files to this paper.
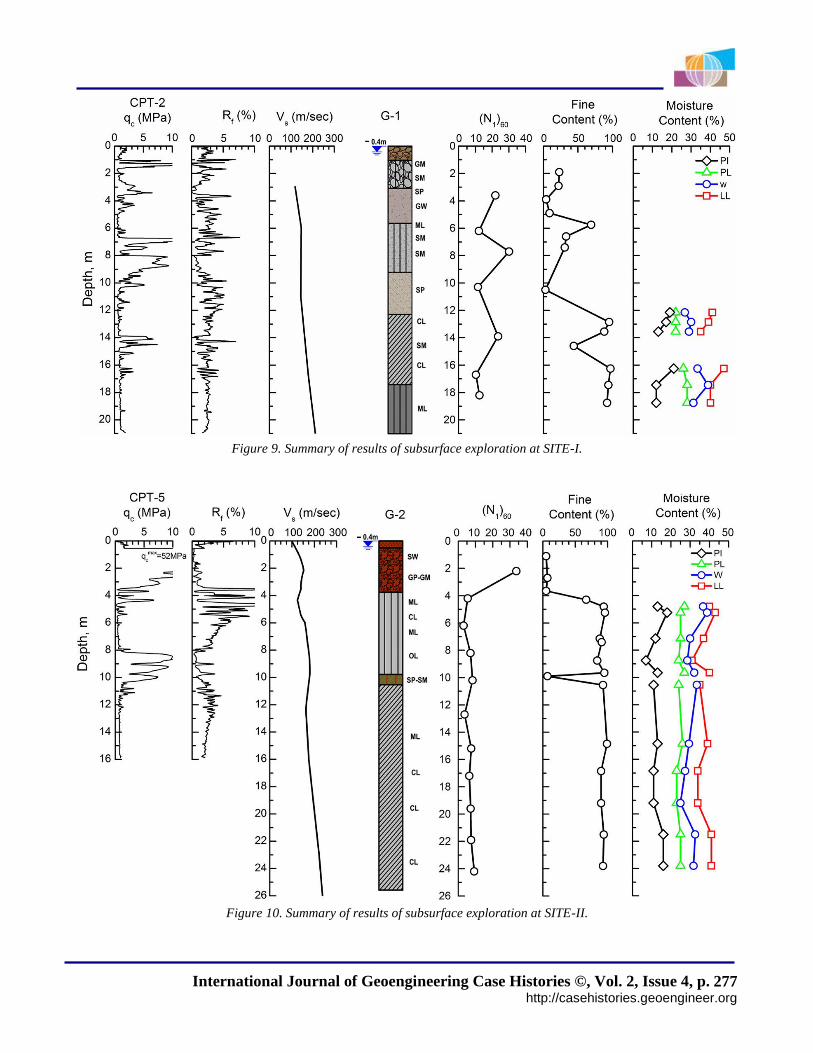
Results from this investigation are summarized in Figures 9 and 10. Figure 9 presents results for SITE-I, whose stratigraphy
and soil properties can be represented by borehole G-1, cone penetration test CPT-2, and an average Vs-depth profile
denoted as Vs-I. On the other hand, Figure 10 presents pertinent data for SITE-II, whose properties are represented by
borehole G-2, cone penetration test CPT-5, and Vs-II. The values of low-strain shear wave velocity, Vs, in this study were
measured by applying: 1) the SASW technique (utilizing APS-400 electromechanic vibrators and a pair of Wilcoxon 1 Hz
vertical seismic accelerometers), 2) the MASW technique (utilizing 12 vertical 4.5 Hz geophones and an impact source of
energy), and 3) the ReMi technique (utilizing ambient microtremor recorded by 12 vertical 4.5 Hz geophones). Several
surface wave measurements were performed at each of the two sites, as shown in Figure 2. At each site the variation
between different methods of measurement was insignificant, thus an average Vs-depth profile was derived, based on all
measurement methods and locations, denoted as Vs-I and Vs-II, for SITE-I and SITE-II, respectively.
It is observed that the soil profiles in SITE-I and SITE-II (Figures 9 and 10) exhibit similarities, but also noticeable
differences. Indeed, in both sites the stratigraphy involves a surface layer of coarse-grained material (sandy gravel) with a
small amount of fines, followed by a layer of cohesive material of medium plasticity and low strength. The thickness of
surface zone is different in two sites: about 12 m in SITE-I (including some non-plastic sand/silt layers with low fines
content) and 4 m in SITE-II. These layers are underlain by low-strength cohesive materials with large fines content. On
SITE-II, fine grained formations (FC up to 90%, PI = 7 to 18) are encountered below 4 m whereas similar formations are
encountered below 12 m in SITE-I. Results from SPT and CPT tests indicate that the strength of deep formations in SITE-I
is greater than corresponding strengths in SITE-II [(Ν1)60 ≈ 20 vs. 9 and qc ≈ 0.9 ΜPa vs. 0.6 ΜPa]. On the other hand, low-
strain shear wave velocities, Vs, do not exhibit significant differences in the two sites, being equal to approximately 150 m/s
in both profiles. Note that water table elevation in the area at the time of the tests (February 2009) was located 0.4 m below
the ground surface.
Figure 8. Field energy ratio measurements during SPT testing. (SPT Analyzer, Pile Dynamincs Inc.)

International Journal of Geoengineering Case Histories ©, Vol. 2, Issue 4, p. http://casehistories.geoengineer.org
276
Table 1. Results of borehole geotechnical investigation at SITE-I and SITE-II.
Gra
ve
ls
Sa
nd
Fin
es
Silt
Cla
y
LL
(%
)
PL
(%
)
PI (%
)
γw
et (
kN
/m3)
γd
ry (
kN
/m3)
G-1 #1 1.80-2.00 GM 39 38 23 19 4 333 10.09 - - -
G-1 #2 2.80-3.00 SM 15 63 22 18 4 63 - - - -
G-1 #3 3.85-4.00 SP 16 80 4 4 - 6 - - - -
G-1 #4 4.80-5.00 GW 49 46 9 9 - 6 - - - -
G-1 #5 5.50-6.00 ML 1 30 69 57 12 35 - - - -
G-1 #6 6.45-6.80 SM 26 41 33 9 150 - - - -
G-1 #7 7.30-7.50 SM 2 67 31 24 7 46 - - - -
G-1 #8 9.00-12.00 SP 4 93 3 3 - 3 - - - -
G-1 #9 12.00-12.30 - - - - - - - 26.77 41 22 19 19.29 15.22 122
G-1 #10 12.70-13.00 CL - 5 95 59 36 - 30.08 39 22 17 18.74 14.41 92
G-1 #11 13.40-13.70 CL - 12 88 61 27 - 28.94 35 22 13 19.68 15.26 83
G-1 #12 14.50-14.70 SM 1 55 44 33 11 64 - - - -
G-1 #13 16.00-16.50 CL - 3 97 40 57 - 33.36 47 26 21 19.88 14.91 71
G-1 #14 17.30-17.70 ML - 6 94 55 39 - 38.8 40 28 12 19.35 13.94 94
G-1 #15 18.50-19.00 ML - 8 92 60 32 - 31.18 40 28 12 19.14 14.59 96
G-2 #16 1.00-1.20 SW 37 58 5 5 - 21 - - - -
G-2 #17 2.45-2.80 GP-GM 47 46 7 7 - 54 - - - -
G-2 #18 3.50-3.80 SP 10 85 5 5 - 6 - - - -
G-2 #19 4.00-4.60 ML - 33 67 55 12 47 - - - -
G-2 #20 4.70-4.90 ML - 6 94 59 35 - 36.7 40 27 13 - 31
G-2 #21 5.00-5.50 CL - 4 96 55 41 - 38.79 43 25 18 19.69 14.19 48
G-2 #22 7.00-7.30 ML - 12 88 60 28 - 29.97 37 25 12 18.34 14.11 71
G-2 #23 7.30-7.50 OL - 9 91 60 31 - 43.36 37 25 12 18.69 13.04 85
G-2 #24 8.50-9.00 ML - 16 84 61 23 - 28.56 31 24 7 19.34 15.04 75
G-2 #25 9.50-9.80 OL - 5 95 55 40 - 32.15 40 27 13 19.84 15.01 84
G-2 #26 9.80-10.00 SP-SM - 92 7 3 4 22 - - - -
G-2 #27 10.45-10.65 CL - 7 93 50 43 - 33.43 35 24 11 19.65 14.73 73
G-2 #28 14.70-15.00 ML - 1 99 62 37 - 29.39 39 26 13 19.18 14.82 45
G-2 #29 16.30-16.50 - - - - - - - 29.63 - - - 20.05 15.47 65
G-2 #30 16.70-17.00 CL - 10 90 52 38 - 27.37 34 23 11 19.79 15.54 64
G-2 #31 19.00-19.40 CL - 10 90 59 31 - 24.89 34 23 11 19.43 15.56 113
G-2 #32 21.30-21.70 CL - 6 94 58 36 - 32.56 41 25 16 18.88 14.24 74
G-2 #33 23.60-24.00 CL - 7 93 54 39 - 31.73 41 25 16 19.18 14.56 95
SIT
E-I
SIT
E-I
ITable 1. Results of borehole geotechnical investigation at SITE-I and SITE-II.
Co
eff
icie
nt
of
un
ifo
rmit
y,
Cu
N.P.
N.P.
Un
co
nfi
ne
d
co
mp
res
sio
n s
tre
ng
th,
qu (
kP
a)
Bo
reh
ole
nu
mb
er
Sa
mp
le n
um
be
r
Sa
mp
le d
ep
th
Total weight
Cla
ss
ific
ati
on
US
CS Grain size distribution
Wa
ter
co
nte
nt,
w (
%) Atterberg limits
N.P.
N.P.
N.P.
N.P.
N.P.
N.P.
N.P.
N.P.
N.P.
N.P.
N.P.
N.P.
International Journal of Geoengineering Case Histories ©, Vol. 2, Issue 4, p. http://casehistories.geoengineer.org
277
Figure 9. Summary of results of subsurface exploration at SITE-I.
Figure 10. Summary of results of subsurface exploration at SITE-II.

International Journal of Geoengineering Case Histories ©, Vol. 2, Issue 4, p. http://casehistories.geoengineer.org
278
In the present study the availability of measured values of NSPT, qc and Vs at nearby locations in SITE-I and SITE-II,
provides an opportunity to check a number of empirical correlations, proposed by several investigators. The graph in Figure
11 compares measured values of NSPT with those predicted by available Vs- NSPT correlations. It is observed that in SITE-II
the Athanasopoulos (1995) and Hasancebi and Ulusay (2006) predictions are in good agreement with the measured values.
On the contrary, in SITE-I a disagreement is observed between measured and predicted values, which may be due to biased
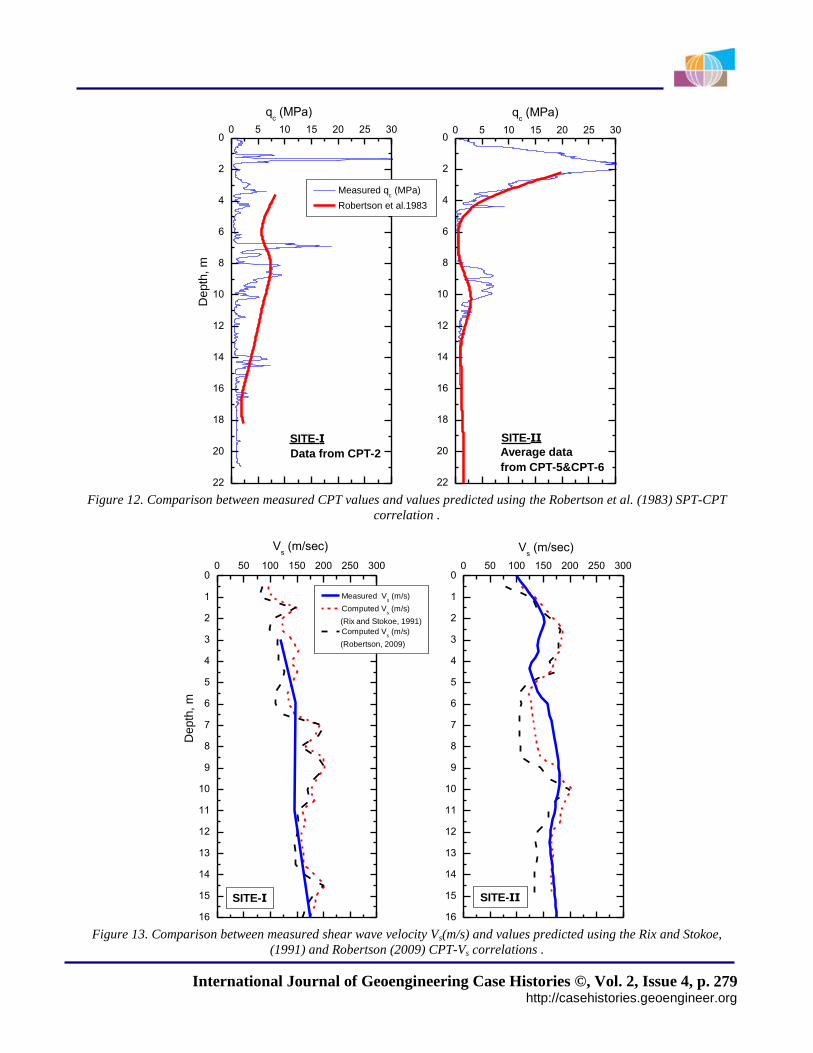
NSPT measurements caused by the presence of gravels. Another interesting comparison is depicted in Figure 12, where
measured values of qc are compared to predictions based on SPT-CPT correlations. It is observed that for SITE II the
agreement is indeed very good, whereas for SITE-I, significant deviations exist from 4 to 6 m and 11 to 14 m. This
discrepancy, again suggests that the SPT blow count may have been affected by the presence of gravels. Finally, a
comparison between measured values of Vs and estimates based on CPT soundings is shown in Figure 13. In this case, the
agreement is better for both sites – compared to NSPT correlations – indicating the greater potential of qc-Vs correlations for
estimating reliable Vs values from CPT results (in the particular area of SITE-I and SITE-II).
Figure 11. Comparison between measured NSPT blow count and corresponding values predicted using Vs-NSPT correlations.
26
24
22
20
18
16
14
12
10
8
6
4
2
00 10 20 30 40 50
26
24
22
20
18
16
14
12
10
8
6
4
2
00 10 20 30 40 50
Blow count, ΝSPT
Athanasopoulos (1995) -all soils
Athanasopoulos (1995)-clayey soils Kiku et al. (2001)
Hasancebi and Ulusay (2006) Unal Dikmen (2009)
(a)
SITE-II
(b)
NSPT
SITE-I
NSPT
Depth
(m
)
Depth
(m
)
International Journal of Geoengineering Case Histories ©, Vol. 2, Issue 4, p. http://casehistories.geoengineer.org
279
Figure 12. Comparison between measured CPT values and values predicted using the Robertson et al. (1983) SPT-CPT
correlation .
Figure 13. Comparison between measured shear wave velocity Vs(m/s) and values predicted using the Rix and Stokoe,
(1991) and Robertson (2009) CPT-Vs correlations .
22
20
18
16
14
12
10
8
6
4
2
00 5 10 15 20 25 30
22
20
18
16
14
12
10
8
6
4
2
00 5 10 15 20 25 30
Data from CPT-2
Measured qc (MPa)
Robertson et al.1983
Average data
from CPT-5&CPT-6
qc (MPa)
SITE-IISITE-I
qc (MPa)
Depth
, m
16
15
14
13
12
11
10
9
8
7
6
5
4
3
2
1
00 50 100 150 200 250 300
16
15
14
13
12
11
10
9
8
7
6
5
4
3
2
1
00 50 100 150 200 250 300
Measured Vs (m/s)
Computed Vs (m/s)
(Rix and Stokoe, 1991)
Computed Vs (m/s)
(Robertson, 2009)
SITE-IISITE-I
Vs (m/sec)
Depth
, m
Vs (m/sec)

International Journal of Geoengineering Case Histories ©, Vol. 2, Issue 4, p. http://casehistories.geoengineer.org
280
GROUND MOTION AT THE LIQUEFACTION SITE
Despite the fact that the Achaia-Ilia (2008) earthquake was recorded by 27 strong motion instruments (Margaris et al.,
2008), no strong motion recording of the main shock was obtained in the vicinity of the liquefied coastal site being
examined in the present study. Therefore, an estimate of peak horizontal acceleration in the greater area of Kato Achaia,
caused by the Achaia-Ilia 8 June 2008 earthquake, can be obtained 1) based on applying the NGA attenuation relation of
Boore and Atkinson 2008 (Figure 14) utilizing a suite of 18 acceleration time histories of the main event, recorded between
15 and 100 km from causative fault (Margaris et al 2008, 2010) and 2) based on the shakemap (Figure 15) reported by the
USGS (http://earthquake.usgs.gov/earthquakes/shakemap/global/shake/2008taaw/). The application of the above two
approaches gives similar results for the mean value of peak ground acceleration at the location of Kato Achaia: 0.33g from
the above attenuation relationship and 0.37g from the shakemap. The uncertainty associated with the mean values of PGA
according to the aforementioned USGS shakemap is shown to be below 0.5%g.
Figure 14. Boore and Atkinson (2008) attenuation of maximum horizontal surface acceleration with distance Rjb from fault;
the particular attenuation relationship is in good aggreement with the recorded surface accelerations in the Mw 6.4 Achaia-
Ilia 2008 earthquake (Margaris et al., 2010).
Figure 15. Shakemap for the 8 June 2008 event by USGS (http://earthquake.usgs.gov/earthquakes/shakemap/
global/shake/2008taaw/).
1 10 1001E-3
0.01
0.1
1
a=0.58g
a=0.18g
-σ
+σ
Achaia-Elia earthquake of
June 8, 2008 (Mw6.4)
Pea
k h
ori
zo
nta
l su
rfa
ce
acce
lera
tio
n a
ma
x (
g)
Distance to surface projection of fault Rjb (km)
a=0.33g
International Journal of Geoengineering Case Histories ©, Vol. 2, Issue 4, p. http://casehistories.geoengineer.org
281
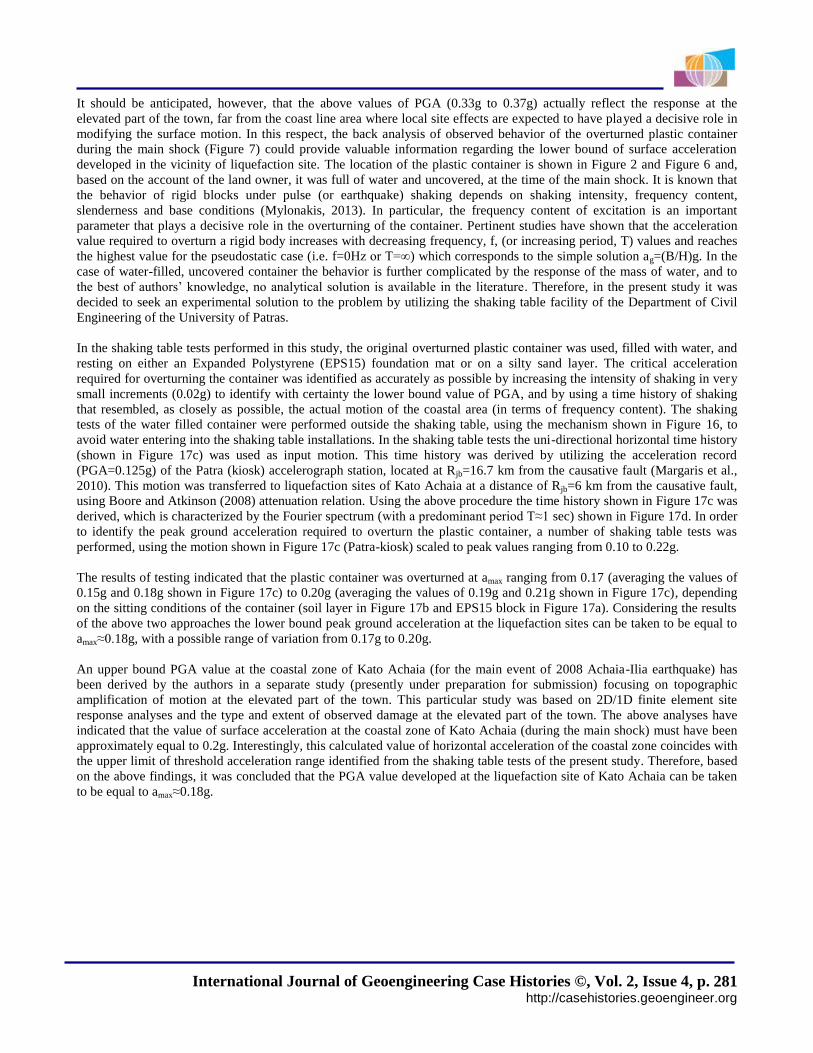
It should be anticipated, however, that the above values of PGA (0.33g to 0.37g) actually reflect the response at the
elevated part of the town, far from the coast line area where local site effects are expected to have played a decisive role in
modifying the surface motion. In this respect, the back analysis of observed behavior of the overturned plastic container
during the main shock (Figure 7) could provide valuable information regarding the lower bound of surface acceleration
developed in the vicinity of liquefaction site. The location of the plastic container is shown in Figure 2 and Figure 6 and,
based on the account of the land owner, it was full of water and uncovered, at the time of the main shock. It is known that
the behavior of rigid blocks under pulse (or earthquake) shaking depends on shaking intensity, frequency content,
slenderness and base conditions (Mylonakis, 2013). In particular, the frequency content of excitation is an important
parameter that plays a decisive role in the overturning of the container. Pertinent studies have shown that the acceleration
value required to overturn a rigid body increases with decreasing frequency, f, (or increasing period, T) values and reaches
the highest value for the pseudostatic case (i.e. f=0Hz or T=∞) which corresponds to the simple solution ag=(B/H)g. In the
case of water-filled, uncovered container the behavior is further complicated by the response of the mass of water, and to
the best of authors’ knowledge, no analytical solution is available in the literature. Therefore, in the present study it was
decided to seek an experimental solution to the problem by utilizing the shaking table facility of the Department of Civil
Engineering of the University of Patras.
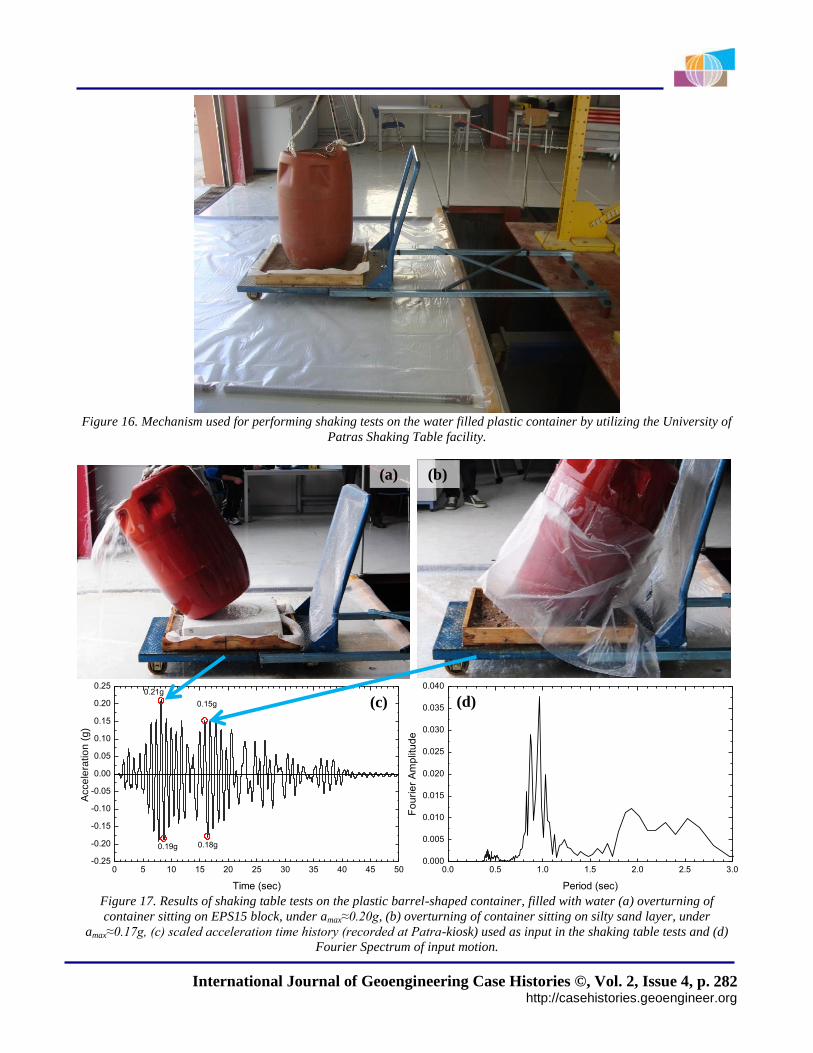
In the shaking table tests performed in this study, the original overturned plastic container was used, filled with water, and
resting on either an Expanded Polystyrene (EPS15) foundation mat or on a silty sand layer. The critical acceleration
required for overturning the container was identified as accurately as possible by increasing the intensity of shaking in very
small increments (0.02g) to identify with certainty the lower bound value of PGA, and by using a time history of shaking
that resembled, as closely as possible, the actual motion of the coastal area (in terms of frequency content). The shaking
tests of the water filled container were performed outside the shaking table, using the mechanism shown in Figure 16, to
avoid water entering into the shaking table installations. In the shaking table tests the uni-directional horizontal time history
(shown in Figure 17c) was used as input motion. This time history was derived by utilizing the acceleration record
(PGA=0.125g) of the Patra (kiosk) accelerograph station, located at Rjb=16.7 km from the causative fault (Margaris et al.,
2010). This motion was transferred to liquefaction sites of Kato Achaia at a distance of Rjb=6 km from the causative fault,
using Boore and Atkinson (2008) attenuation relation. Using the above procedure the time history shown in Figure 17c was
derived, which is characterized by the Fourier spectrum (with a predominant period T≈1 sec) shown in Figure 17d. In order
to identify the peak ground acceleration required to overturn the plastic container, a number of shaking table tests was
performed, using the motion shown in Figure 17c (Patra-kiosk) scaled to peak values ranging from 0.10 to 0.22g.
The results of testing indicated that the plastic container was overturned at amax ranging from 0.17 (averaging the values of
0.15g and 0.18g shown in Figure 17c) to 0.20g (averaging the values of 0.19g and 0.21g shown in Figure 17c), depending
on the sitting conditions of the container (soil layer in Figure 17b and EPS15 block in Figure 17a). Considering the results
of the above two approaches the lower bound peak ground acceleration at the liquefaction sites can be taken to be equal to
amax≈0.18g, with a possible range of variation from 0.17g to 0.20g.
An upper bound PGA value at the coastal zone of Kato Achaia (for the main event of 2008 Achaia-Ilia earthquake) has
been derived by the authors in a separate study (presently under preparation for submission) focusing on topographic
amplification of motion at the elevated part of the town. This particular study was based on 2D/1D finite element site
response analyses and the type and extent of observed damage at the elevated part of the town. The above analyses have
indicated that the value of surface acceleration at the coastal zone of Kato Achaia (during the main shock) must have been
approximately equal to 0.2g. Interestingly, this calculated value of horizontal acceleration of the coastal zone coincides with
the upper limit of threshold acceleration range identified from the shaking table tests of the present study. Therefore, based
on the above findings, it was concluded that the PGA value developed at the liquefaction site of Kato Achaia can be taken
to be equal to amax≈0.18g.
International Journal of Geoengineering Case Histories ©, Vol. 2, Issue 4, p. http://casehistories.geoengineer.org
282
Figure 16. Mechanism used for performing shaking tests on the water filled plastic container by utilizing the University of
Patras Shaking Table facility.
Figure 17. Results of shaking table tests on the plastic barrel-shaped container, filled with water (a) overturning of
container sitting on EPS15 block, under amax≈0.20g, (b) overturning of container sitting on silty sand layer, under
amax≈0.17g, (c) scaled acceleration time history (recorded at Patra-kiosk) used as input in the shaking table tests and (d)
Fourier Spectrum of input motion.
0 5 10 15 20 25 30 35 40 45 50-0.25
-0.20
-0.15
-0.10
-0.05
0.00
0.05
0.10
0.15
0.20
0.25
0.0 0.5 1.0 1.5 2.0 2.5 3.00.000
0.005
0.010
0.015
0.020
0.025
0.030
0.035
0.040
0.15g
0.18g 0.19g
Time (sec)
0.21g
Acce
lera
tio
n (
g)
Fo
uri
er
Am
plit
ud
e
Period (sec)
(a) (b)
(c) (d)

International Journal of Geoengineering Case Histories ©, Vol. 2, Issue 4, p. http://casehistories.geoengineer.org
283
PREDICTED VS. OBSERVED FIELD PERFORMANCE
The objective of the current study – as stated in the introduction – is the presentation of detailed geotechnical and
earthquake shaking data, along with descriptions of field performance in the case of Achaia-Ilia Mw 6.4 earthquake with the
intend to generate a well-documented liquefaction case history upon which further liquefaction analyses could be based in
the future. For the sake of completeness of the present work, however, a brief comparison of the observed performance to
that predicted by currently available liquefaction triggering charts is included in this section.
At present, the most widely used liquefaction triggering charts are based on in-situ testing results, namely, (a) the blow
count, NSPT, of the standard penetration test (SPT) (Cetin et al. 2004, Idriss and Boulanger 2008, Seed 2010), (b) the tip
resistance, qc , of cone penetration test (CPT) (Moss et al. 2006, Idriss and Boulanger 2008), and (c) the value of low-
amplitude shear wave velocity, Vs (Andrus and Stokoe 2000, Youd et al., 2001, Idriss and Boulanger 2008). It should be
noted that Kayen et al. (2013) have recently developed a probabilistic liquefaction triggering chart (in terms of the corrected
value of shear wave velocity Vs1) which will not be included in the comparisons performed in this section. As was
mentioned, the SPT measurements reported in the present study are likely affected by a significant amount of large size
gravels encountered in the borehole. For this reason, the comparisons presented are limited to only CPT and Vs
measurements.
In the diagrams of Fig. 18, all data points generated in the present study for sand-like materials (in terms of corrected /
normalized qc values and cyclic stress ratios CSR) for SITE I and SITE II are superposed to the Idriss and Boulanger (2008)
deterministic liquefaction triggering chart (which, for qc1Ncs<100, does not deviate significantly from the Moss et al., 2006
probabilistic chart). The comparison indicates that the development of liquefaction is clearly predicted for SITE I (with
only point #7 being marginal). On the other hand, the points corresponding to SITE II are either close to the boundary line
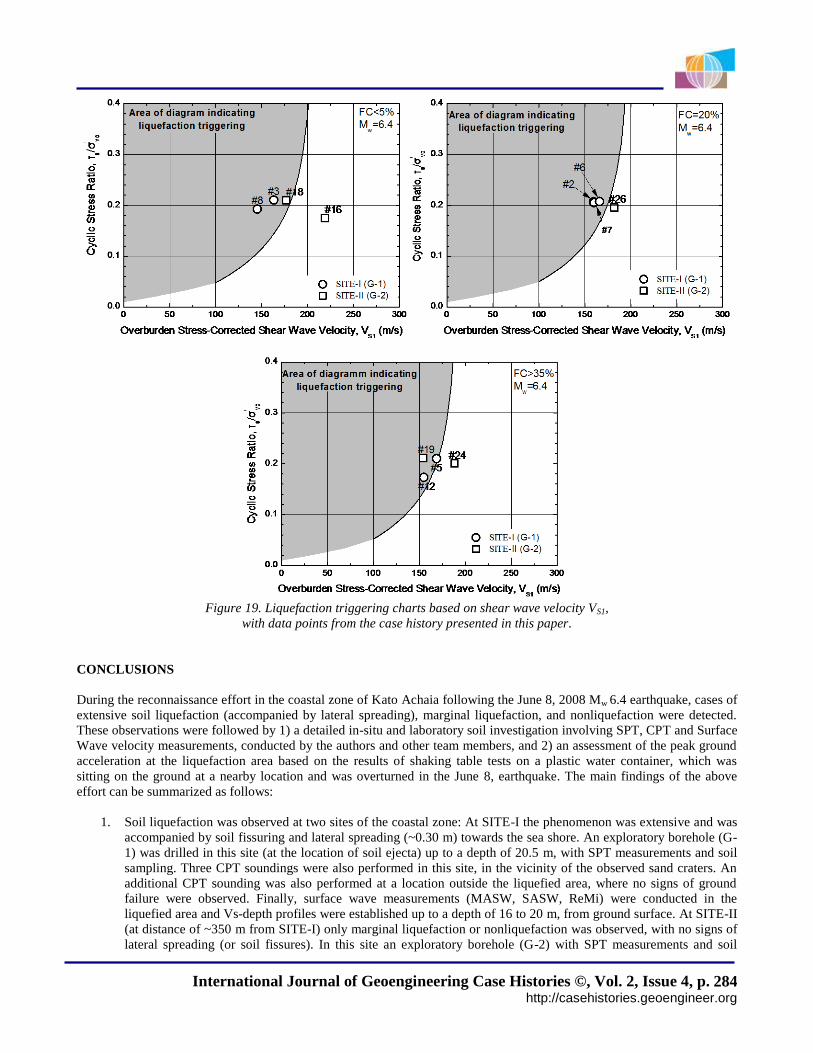
or entirely outside the liquefaction area of the diagram, indicating marginal or no liquefaction. Similarly, in the diagrams of
Fig. 19, depicting in a deterministic way the liquefaction triggering potential in terms of the corrected value of shear wave
velocity Vs1 (Youd et al., 2001), all data points for SITE I are located in the liquefaction triggering area of the diagrams,
whereas for SITE II, the corresponding data points, either fall in the vicinity of the boundary line or outside the liquefaction
area of the diagram. It may therefore be concluded that the currently available liquefaction triggering charts, in terms of in-
situ CPT and Vs data, have successfully predicted the observed field performance for the liquefied coastal zone of Kato
Achaia.
Figure 18. Liquefaction triggering chart based on CPT tip resistance qc1Ncs, with data points from the case history
presented in this paper.
International Journal of Geoengineering Case Histories ©, Vol. 2, Issue 4, p. http://casehistories.geoengineer.org
284
Figure 19. Liquefaction triggering charts based on shear wave velocity VS1,
with data points from the case history presented in this paper.
CONCLUSIONS
During the reconnaissance effort in the coastal zone of Kato Achaia following the June 8, 2008 Mw 6.4 earthquake, cases of
extensive soil liquefaction (accompanied by lateral spreading), marginal liquefaction, and nonliquefaction were detected.
These observations were followed by 1) a detailed in-situ and laboratory soil investigation involving SPT, CPT and Surface
Wave velocity measurements, conducted by the authors and other team members, and 2) an assessment of the peak ground
acceleration at the liquefaction area based on the results of shaking table tests on a plastic water container, which was
sitting on the ground at a nearby location and was overturned in the June 8, earthquake. The main findings of the above
effort can be summarized as follows:
1. Soil liquefaction was observed at two sites of the coastal zone: At SITE-I the phenomenon was extensive and was
accompanied by soil fissuring and lateral spreading (~0.30 m) towards the sea shore. An exploratory borehole (G-
1) was drilled in this site (at the location of soil ejecta) up to a depth of 20.5 m, with SPT measurements and soil
sampling. Three CPT soundings were also performed in this site, in the vicinity of the observed sand craters. An
additional CPT sounding was also performed at a location outside the liquefied area, where no signs of ground
failure were observed. Finally, surface wave measurements (MASW, SASW, ReMi) were conducted in the
liquefied area and Vs-depth profiles were established up to a depth of 16 to 20 m, from ground surface. At SITE-II
(at distance of ~350 m from SITE-I) only marginal liquefaction or nonliquefaction was observed, with no signs of
lateral spreading (or soil fissures). In this site an exploratory borehole (G-2) with SPT measurements and soil
International Journal of Geoengineering Case Histories ©, Vol. 2, Issue 4, p. http://casehistories.geoengineer.org
285
sampling was drilled up to a depth of ~24m. CPT soundings were also conducted, to a depth of 16 m as well as
surface measurements at four nonliquefaction locations.
2. A detailed soil investigation was performed at the two liquefaction sites (SITE-I and SITE-II), which included in-
situ (SPT, CPT, SASW, MASW, ReMi) and laboratory (classification, strength) testing to characterize the soil
formations at the two sites. The investigation showed a general similarity of conditions at the two sites with the
following differentiations: 1) the thickness of liquefiable sand-silty sand layers in SITE-I is much larger than in
SITE-II, which suggests that greater amount of ejecta would be expected in earthquake shaking in SITE-I
compared to SITE-II, 2) the existence of larger amount of gravels in SITE-I (from 4 to 12 m) may have affected
the NSPT values in this depth zone, making them less reliable for liquefaction triggering predictions. Finally, the
small amplitude shear above velocity, Vs, vs depth profiles at two sites, show only minor differentiation and may
be assumed that a single Vs-depth profile represents the conditions at both sites (SITE-I and SITE-II).
3. An assessment of peak ground acceleration at the liquefied/nonliquefied locations was based on (a) shaking table
simulation of the behavior of an overturned plastic, barrel-shaped container which, during the main shock, was
sitting (filled with water) on the ground surface in the liquefaction area and (b) the results of a separate study on
topographic amplification at the elevated part of Kato Achaia. Based on the results of shaking table tests and of
numerical response analyses, it was concluded that the ground acceleration at the coastal zone of Kato Achaia
(during the main shock of the Achaia-Ilia (Greece) Mw 6.4, 2008 earthquake) can be taken to be equal to
amax≈0.18g.
4. The data presented herein, can be used (a) for checking the validity of current liquefaction susceptibility criteria
and liquefaction triggering relationships (for this particular shallow crustal earthquake), and (b) for establishing a
well-documented liquefaction case history, which could augment the worldwide data bases in terms of SPT, CPT
and Vs data.
5. Results of preliminary comparisons indicate that currently available CPT– and Vs–based liquefaction triggering
charts, successfully predicted the field performance of the Kato Achaia coastal zone in the 2008 Achaia-Ilia Mw
6.4 earthquake.
ACKNOWLEDGMENTS
The authors thank Prof. N. Klimis, Prof. J. Stewart, Prof. G. Mylonakis and V. Efthymiadou, M.Sc, for their help during the
Kato Achaia reconnaisance effort, Dr. P. Kloukinas, and E. Pefani, M.Sc, for participating in the soil characterization tests,
and Dr. P. Psimoulis and doctoral student S. Likourgiotis for surveying the liquefied area at SITE-I. The authors are also
indebted to Assoc. Professor P. Bousias, and Post doc researcher Dr. E. Strepelias, Structures Laboratory, Dept. of Civil
Engineering, University of Patras, for their help in the shaking table tests of the present study.
REFERENCES
Andrus, R. D. and Stokoe K. H., II. (2000). “Liquefaction Resistance of Soils from Shear-Wave Velocity”, Journal of
Geotechnical and Geoenvironmental Engineering, ASCE, November 2000, Vol. 126, No. 11, 1015-1025.
Athanasopoulos, G.A. (1995). “Empirical Correlations Vso-NSPT for Soils of Greece: A Comparative Study of Reliability”,
Transactions the Wessex Institute, www.witpress.com, Paper DOI: 10.2495/SD950031, Proc. of Seventh International
Conference on Soil Dynamics and Earthquake Engineering, Chania, Greece, (Eds. A.S. Cakmak and C.A. Brebbia),
19-26.
Batilas, A., Pelekis, P., Vlachackis, V., Athanasopoulos, G., Mylonakis, G. (2008). “Soil liquefaction in the Achaia-Elia,
Greece, earthquake– field evidence, simplified analyses and EC-8 provisions”, Proceedings of ERTC-12 Workshop on
evaluation of EC-8, XV European Conference on Soil Mechanics & Geotechnical Engineering, Athens, September 11,
2011.
Boulanger, R. W., and Idriss, I. M. (2012). “Examination and Reevalaution of SPT-Based Liquefaction Triggering Case
Histories”, Journal of Geotechnical and Geoenvironmental Engineering, ASCE, 138(8), 898-909.
Caputo, R. and Papathanassiou, G. (2012). “Ground failure and liquefaction phenomena triggered by the 20 May 2012
Emilia-Romanga (Northern Italy) earthquake case study of Sant’Agostino-San Carlo-Mirabello zone”, Natural Hazards
and Earth System Sciences, 12, 3177-3180.
International Journal of Geoengineering Case Histories ©, Vol. 2, Issue 4, p. http://casehistories.geoengineer.org
286
Cetin, K. O., Seed, R. B., Der Kiureghian, A., Tokimatsu, K., Harder, L. F., Kayen, R. E., and Moss, R. E. S. (2004).
“Standard penetration test-based probabilistic and deterministic assessment of seismic soil liquefaction potential.”
Journal of Geotechnical and Geoenvironmental Engineering, ASCE, Vol. 130(12), 1314–1340.
Cubrinovski, M., Bray, I.D., Taylor, M., Giorgini, S., Bradley, B., Wotherspoon, L., and Zupan, I., (2011). “Soil
Liquefaction effects in the Central Business District during the February 2011 Christchurch earthquake”, Seismological
Research Letters, 82(6), 893-904.
GEER (2010). “Geotechnical Reconnaissance of the 2010 Darfield (New Zealand) Earthquake”, Version 1: 14 November
2010.
GEER (2010). “Geo-Engineering Reconnaissance of the February 27, 2010 Maule, Chile Earthquake”, Version 2: 25 May
2010.
GEER (2010). “Geotechnical Engineering Reconnaissance of the 2010 Haiti Earthquake”, Version 1: 22 February 2010.
GEER (2011). “Geotechnical Reconnaissance of the 2011 Christchurch, New Zealand Earthquake”, Version 1: 15 August
2011.
Hasancebi, N., and Ulusay, R. (2006). “Empirical correlations between shear wave velocity and penetration resistance for
ground shaking assessments”, Bull. Eng. Geol. Environ., 66, 203–213.
Idriss, I.M. and Boulanger, R.W. (2008). “Soil Liquefaction during Earthquakes”, Earthquake Engineering Research
Institute MNO-12, 242.
Ishihara, K. (2012). “Liquefaction in Tokyo Bay and Kanto Regions in the 2011 Great East Japan Earthquake”,
Proceedings of the International Symposium on Engineering Lessons Learned from the 2011 Great East Japan
Earthquake, March 1-4, 2012, Tokyo, Japan, 63-81.
Kayen, R., Moss, R.E.S., Thompson, E.M., Seed, R.B., Cetin, K.O., Der Kiureghian, A., Tanaka, Y. and Tokimatsu, K.
(2013). “Shear-Wave Velocity-Based Probabilistic and Deterministic Assessment of Seismic Soil Liquefaction
Potential” Journal of Geotechnical and Geoenvironmental Engineering, ASCE, Vol. 139(3), 407–419.
Kiku, H., Yoshida, N., Yasuda, S., Irisawa, T., Nakazawa, H., Shimizu, Y., Ansal, A., and Erkan, A. (2001). “In-situ
penetration tests and soil profiling in Adapazarı, Turkey”, Proc. ICSMGE/TC4 Satellite Conf. on Lessons Learned
from Recent Strong Earthquakes, 259–265.
Lai, C.G., Bozzoni, F., Mangriotis, M-D. and Martinelli, M. (2012). “Geotechnical Aspects of May 20, 2012 M5.1 Emilia
Earthquake, Italy”, EUCENTRE, July 2012.
Margaris, B. and 18 other authors (2008). “Preliminary Report on the Principal Seismological and Engineering Aspects of
the Mw=6.5 Achaia-Ilia (Greece) Earthquake on 8 June 2008”. GEER Association Report No. GEER-013, June 2008,
http://www.geerassociation.org/GEER_Post%20EQ%20Reports/Greece_2008/Cover_Greece2008.html.
Margaris, B., Athanasopoulos, G., Mylonakis, G., Papaioannou, C., Klimis, N., Theodoulidis, N., Savvaidis, A.,
Efthymiadou, V. and Stewart, J. (2010). “The 8 June 2008 Mw6.4 Achaia-Ilia, Greece Earthquake: Source
Characteristics, Ground Motions, and Ground Failure”, Earthquake Spectra, 26(2), 399-424.
Moss, R. E. S., Seed, R. B., Kayen, R. E., Stewart, J. P., Der Kiureghian, A., and Cetin, K. O. (2006). “CPT-Based
Probabilistic And Deterministic Assessment Of In Situ Seismic Soil Liquefaction Potential.” Journal of Geotechnical
and Geoenvironmental Engineering, ASCE, Vol. 132(8), pp. 1032–1051.
Moss R.E.S., Kayen, R.E., Tong, L.-Y., Liu, S.-Y., Cai, G.-J., and Wu, J. (2011). “Retesting of Liquefaction and
Nonliquefaction Case Histories from the 1976 Tangshan Earthquake”, Journal of Geotechnical and Geoenvironmental
Engineering, ASCE, 137(4), 334-343.
Mylonakis, G. (2013). Personal communication.
Orense R.P., Pender, M.J., and Wotherspoon, L.M. (2012). “Analysis of Soil Liquefaction during the recent Canterbury
(New Zealand) Earthquakes”, Geotechnical Engineering Journal of the SEAGS & AGSSEA, June, 2012, 43(2), 8-17.
Pelekis, P.C. and Athanasopoulos, G.A., (2011). “An Overview of Surface Wave Methods and a Reliability Study of a New
Simplified Inversion Technique”, Soil Dynamics and Earthquake Engineering, 31(12), 1654-1668.
Rix, G.J., and Stokoe, K.H. (1991). “Correlation of Initial Tangent Modulus and Cone Penetration Resistance”,
International Symposium on Calibration Chamber Testing. In Proceedings of ISOCCT-1, ed. A. B. Huang,. Elsevier
Publishing, New York, 351-362.
Robertson, P.K. (2009). “Interpretation of Cone Penetration Tests –a unified approach,” Canadian Geotechnical Journal,
46(11), 1337-1355.
Robertson, P.K., Campanella, R.G., and Wightman, A. (1983). “SPT-CPT Correlations”, Journal of Geotechnical
Engineering, 109(11), 1449-1459.
Seed, R.B. (2010). “Technical Review and Comments: 2008 EERI Monograph “Soil Liquefaction During Earthquakes (by
I.M. Idriss and R.W. Boulanger)”, Geotechnical Report No. UCB/GT-2010/01, University of California at Berkeley,
75.
International Journal of Geoengineering Case Histories ©, Vol. 2, Issue 4, p. http://casehistories.geoengineer.org
287
Tran, K.T. and Hiltunen, D.R. (2008). “A Comparison of Shear Wave Velocity Profiles from SASW, MASW, and ReMi
Techniques”, Geotechnical Earthquake Engineering and Soils Dynamics IV, Sacramento, CA, USA, 18-22 May, 2008,
ASCE, GSP 181.
Tsukamoto, Y., Kawabe, S., and Kokusho, T. (2012). “Soil liquefaction observed at the lower stream of Tonegawa river
during the 2011 off the Pacific Coast of Tohoku Earthquake”, Soils and Foundations, 52(5), 987-999.
Verdugo, R. (2012). “Comparing Liquefaction Phenomena Observed during the 2010 Maule, Chile, Earthquake and 2011
Great East Japan Earthquake”, Proceedings of the International Symposium on Engineering Lessons Learned from the
2011 Great East Japan Earthquake, March 1-4, 2012, Tokyo, Japan, 707-718.
Yamaguchi, A., Mori, T., Kazama, M., and Yoshida, N. (2012). “Liquefaction in Tohoku district during the 2011 off the
Pacific Coast of Tohoku Earthquake”, Soils and Foundations, 52(5), 811-829.
Yasuda, S., Harada, K., Ishikawa, K., and Kanemaru, Y. (2012). “Characteristics of liquefaction in Tokyo Bay area by the
2011 Great East Japan earthquake”, Soils and Foundations, 52(5), 793-810.
Youd, T. L., Idriss, I. M., Andrus, R. D., Arango, I., Castro, G, Christian, J. T., Dobry, R., Finn, W. D. L., Harder Jr., L. F.,
Hynes, M. E., Ishihara, K., Koester, J. P., Liao, S. S. C., Marcuson III, W. F., Martin, G. R., Mitchell, J. K., Moriwaki,
Y., Power, M. S., Robertson, P. K., Seed, R. B., and Stokoe II, K. H. (2001). “Liquefaction Resistance of Soils:
Summary Report from the 1996 NCEER and 1998 NCEER/NSF Workshops on Evaluation of Liquefaction Resistance
of Soils”, J. Geotechnical and Geoenvironmental Eng., ASCE, Vol. 127(10), 817-833.
The International Journal of Geoengineering Case Histories (IJGCH) is funded by:
Email us at [email protected] if your company wishes to fund the International Journal of Geoengineering
Case Histories.
Copyright © 2022 FDOKUMEN