Social Security Reform for Sustainability and Equity - IMF ...
20
143 Social Security Reform for Sustainability and Equity MAURICIO SOTO AND SANJEEV GUPTA CHAPTER 5 China’s population is aging rapidly. The old-age dependency ratio (the pop- ulation ages 65 and older as a share of the population 15–64) is projected to increase from 13 percent in 2015 to 47 percent in 2050. 1 This is a relatively fast increase compared to the rest of the world, where the old-age dependency ratio is expected to only double over this period. By 2050, China’s old-age dependen- cy ratio will be at about the level projected for the developed economies. Population aging will lead to pension spending pressures, with such spending projected to increase 6.2 percentage points to 10.1 percent of GDP over 2015– 50. Already today, benefits exceed contributions (excluding central government subsidies) in some provinces. These pressures are likely to get accentuated in the long term, unless major policy changes are implemented. Over 2015–50, the actuarial imbalance (present discounted value of benefits minus contributions) of the Chinese pension system is estimated at nearly 125 percent of 2015 GDP. Today, pension coverage is nearly universal, but not necessarily adequate—about 60 percent of the elderly receive annual average pensions that are about RMB1,000 (or 2½ percent of GDP per capita). Under these parameters, reforms would be needed to maintain fiscal sustainability and address adequacy. Recent reforms have focused on fostering gradual integration across pension schemes. However, the pension system remains fragmented and imposes impedi- ments on labor mobility, with separate schemes depending on the type of worker and location. Management of pension systems remains at the provincial level, and rules vary slightly across provinces and schemes. Furthermore, the social contri- bution rates are relatively high and regressive. In the medium term, reforms could help provide adequate incentives to contribute to the system and to allow porta- bility of benefits across regions and schemes. Sound and equitable pension reforms could also contribute to the rebalancing of the economy toward domestic consumption. By ensuring sustainability e authors would like to thank Professor ZHENG Bingwen, Director of the Social Security Center at the Chinese Academy of Social Sciences, for insightful comments and recommenda- tions on this chapter. e authors are also grateful for valuable suggestions from Csaba Feher and Philippe Wingender, and for the input and support from editors. 1 is chapter uses demographic projections from the United Nations (2015). ©International Monetary Fund. Not for Redistribution
-
Upload
khangminh22 -
Category
Documents
-
view
1 -
download
0
Transcript of Social Security Reform for Sustainability and Equity - IMF ...
143
Social Security Reform for Sustainability and Equity
Mauricio Soto and Sanjeev Gupta
CHAPTER 5
China’s population is aging rapidly. The old-age dependency ratio (the pop-ulation ages 65 and older as a share of the population 15–64) is projected to increase from 13 percent in 2015 to 47 percent in 2050.1 This is a relatively fast increase compared to the rest of the world, where the old-age dependency ratio is expected to only double over this period. By 2050, China’s old-age dependen-cy ratio will be at about the level projected for the developed economies.
Population aging will lead to pension spending pressures, with such spending projected to increase 6.2 percentage points to 10.1 percent of GDP over 2015–50. Already today, benefits exceed contributions (excluding central government subsidies) in some provinces. These pressures are likely to get accentuated in the long term, unless major policy changes are implemented. Over 2015–50, the actuarial imbalance (present discounted value of benefits minus contributions) of the Chinese pension system is estimated at nearly 125 percent of 2015 GDP. Today, pension coverage is nearly universal, but not necessarily adequate—about 60 percent of the elderly receive annual average pensions that are about RMB1,000 (or 2½ percent of GDP per capita). Under these parameters, reforms would be needed to maintain fiscal sustainability and address adequacy.
Recent reforms have focused on fostering gradual integration across pension schemes. However, the pension system remains fragmented and imposes impedi-ments on labor mobility, with separate schemes depending on the type of worker and location. Management of pension systems remains at the provincial level, and rules vary slightly across provinces and schemes. Furthermore, the social contri-bution rates are relatively high and regressive. In the medium term, reforms could help provide adequate incentives to contribute to the system and to allow porta-bility of benefits across regions and schemes.
Sound and equitable pension reforms could also contribute to the rebalancing of the economy toward domestic consumption. By ensuring sustainability
The authors would like to thank Professor ZHENG Bingwen, Director of the Social Security Center at the Chinese Academy of Social Sciences, for insightful comments and recommenda-tions on this chapter. The authors are also grateful for valuable suggestions from Csaba Feher and Philippe Wingender, and for the input and support from editors.
1This chapter uses demographic projections from the United Nations (2015).
©International Monetary Fund. Not for Redistribution
144 Social Security Reform for Sustainability and Equity
through gradual and transparent parametric reforms, retirement incomes would be more predictable, partly reducing the need for precautionary saving (Chamon, Liu, and Prasad 2013). Furthermore, by enhancing the adequacy of benefits for rural and urban residents, social security could help to redistribute income to older, lower-income households, which have higher propensity to consume (Yang, Zhang, and Zhou 2012).
This chapter reviews the pension system, followed by an examination of its demographic context and challenges in China. It considers ways to contain potentially higher pension costs, followed by conclusions.
PENSION SYSTEM LANDSCAPEChina’s segmented pension system has separate old-age insurance schemes for
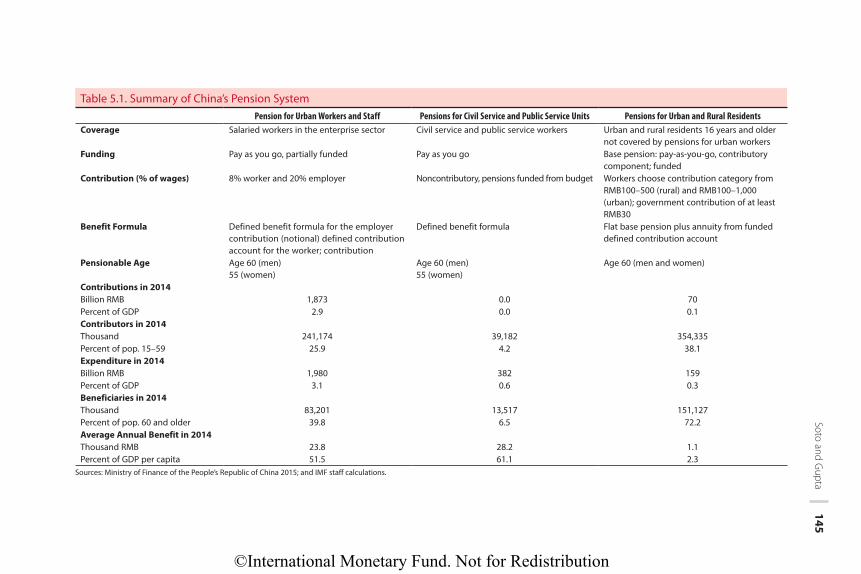
(1) salaried workers in the private and state-owned enterprise sectors (Pensions for Urban Workers and Staff), (2) employees in the government and public-affiliated entities (Pensions for Civil Service and Public Sector Units), and (3) the rest of nonsal-aried workers (Pensions for Urban and Rural Residents) (Table 5.1). The pension sys-tem is fragmented both across schemes (enterprise workers and urban and rural resi-dents) and geographically (although the central government provides guidelines and financing, the schemes are administered at the local, provincial, or prefecture levels).
• Pensions for Urban Workers and Staff function on a pay-as-you-go basis, with some partial prefunding (reflecting years with combined contributions from workers, employers, and the state). Under the schemes, pensions are contrib-utory, but the central government is responsible for covering any deficits. About 25 percent of the population ages 15–59 contributes to these schemes. At retirement, benefits are the sum of a traditional defined benefit formula plus a defined contribution portion, which in practice functions as a notional defined contribution pension (benefits depending on contributions and a notional return). Over 83 million people (40 percent of people ages 60 and older) receive benefits from the enterprise pension system (covering salaried workers). Average annual benefits are nearly 50 percent of GDP per capita. Individuals participating in the enterprise system often receive supplementary separation benefits financed by the enterprises. In 2014 total expenditure in this system was estimated at about 3 percent of GDP.
• Pensions for Civil Service and Public Unit Workers provide old-age insurance for workers in the government (civil service) and public service units, including schools and hospitals. Participants in this plan have traditionally not paid contributions, and pensions are fully funded by the budget. This scheme covers about 4 percent of the population ages 15–59. At retirement, after 35 years of service, pensions depend on a formula that provides 85 per-cent of the wage at retirement.2 Pensioners from this scheme are 6½ percent
2Before 2006, after 35 years of service, civil servants were entitled to a combination of 100 per-cent of the portion of the salary corresponding to the base and seniority and 82 percent of the post and position pay (Leckie 2009).
©International Monetary Fund. Not for Redistribution
Soto and G
upta 145
Table 5.1. Summary of China’s Pension SystemPension for Urban Workers and Staff Pensions for Civil Service and Public Service Units Pensions for Urban and Rural Residents
Coverage Salaried workers in the enterprise sector Civil service and public service workers Urban and rural residents 16 years and older not covered by pensions for urban workers
Funding Pay as you go, partially funded Pay as you go Base pension: pay-as-you-go, contributory component; funded
Contribution (% of wages) 8% worker and 20% employer Noncontributory, pensions funded from budget Workers choose contribution category from RMB100–500 (rural) and RMB100–1,000 (urban); government contribution of at least RMB30
Benefit Formula Defined benefit formula for the employer contribution (notional) defined contribution account for the worker; contribution
Defined benefit formula Flat base pension plus annuity from funded defined contribution account
Pensionable Age Age 60 (men) 55 (women)
Age 60 (men) 55 (women)
Age 60 (men and women)
Contributions in 2014Billion RMB 1,873 0.0 70Percent of GDP 2.9 0.0 0.1Contributors in 2014Thousand 241,174 39,182 354,335Percent of pop. 15–59 25.9 4.2 38.1Expenditure in 2014Billion RMB 1,980 382 159Percent of GDP 3.1 0.6 0.3Beneficiaries in 2014Thousand 83,201 13,517 151,127Percent of pop. 60 and older 39.8 6.5 72.2Average Annual Benefit in 2014Thousand RMB 23.8 28.2 1.1Percent of GDP per capita 51.5 61.1 2.3
Sources: Ministry of Finance of the People’s Republic of China 2015; and IMF staff calculations.
©International Monetary Fund. Not for Redistribution
146 Social Security Reform for Sustainability and Equity
of the population ages 60 and older with average benefits near 61 percent of GDP per capita. In 2014 expenditure in this system was about 0.6 percent of GDP. Since 2013 reforms have aimed to establish a fairer and more sus-tainable pension system for the public sector, including setting the princi-ples for a contributory scheme in 2015 (Li 2015).
• Pensions for Urban and Rural Residents combine a flat, pay-as-you-go “basic” pension (financed solely by the state) with an individual account component (intended to be fully financed by contributions and government subsidies). About 40 percent of the workforce contributes to this scheme. Individuals can choose their level of annual contributions in RMB100 increments, RMB100–500 for rural residents and RMB100–1,000 for urban residents. The govern-ment matches these contributions by at least RMB30 per year. The basic pension requires individuals to contribute for a minimum of 15 years to receive benefits. Over the past 5 years, the system expanded rapidly through special transition rules to provide basic pensions to the current elderly who never contributed.3 Today, about 150 million elderly (over 70 percent of the popula-tion ages 60 and older) receive basic pensions. Average benefits are modest, as noted, representing about 2½ percent of GDP per capita. This explains the relatively low expenditure (estimated at 0.3 percent of GDP in 2014).
Important reforms have been implemented over the past 20 years, largely aimed at ensuring long-term sustainability in Pensions for Urban Workers and Staff, increasing the traditionally low coverage of the system (in 1995, only about 20 percent of the elderly received pensions) and better integrating the different schemes. The 1997 and 2005 reforms changed the architecture and expected generosity of the Pensions for Urban Workers and Staff.4 Prior to 1997, workers with 35 years of contributions were generally eligible for pensions that replaced up to 80 percent of the average wage in the province from which they retired. The old formula was replaced by three components:
• The first intended to be a smaller version of the previous pensions, with ben-efits calculated as 0.5 percent of the base wage for each year of contribution. This component provides a degree of redistribution in the system (Li 2014).
• The second is estimated as 0.5 percent of the individual’s career-average wage for each year of contributions.
• The third component was an individual account funded with 8 percent of wages, where the benefits depended on the accumulation of the account and interest (generally the one-year bank rate) converted to a monthly pension at retirement dividing the balance by an annuity factor of 139.
This change in architecture reduced the generosity of the pension system: at retirement after 35 years of contribution, a worker who earns the average
3Other countries have expanded their pension systems rapidly. For example, Korea introduced the national pension in 1988, which became universal for all labor force participants by 1999 (Kim 2014).
4State Council 1997, 2005.
©International Monetary Fund. Not for Redistribution
Soto and Gupta 147
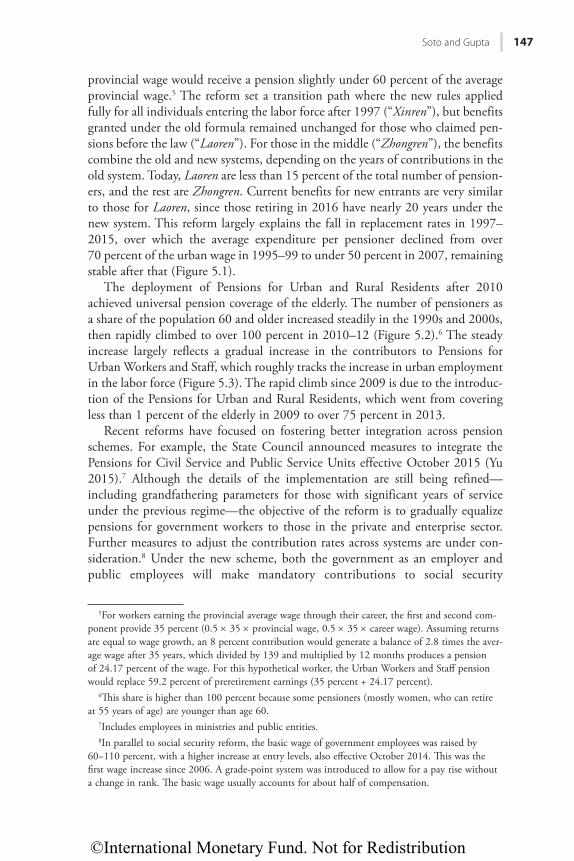
provincial wage would receive a pension slightly under 60 percent of the average provincial wage.5 The reform set a transition path where the new rules applied fully for all individuals entering the labor force after 1997 (“Xinren”), but benefits granted under the old formula remained unchanged for those who claimed pen-sions before the law (“Laoren”). For those in the middle (“Zhongren”), the benefits combine the old and new systems, depending on the years of contributions in the old system. Today, Laoren are less than 15 percent of the total number of pension-ers, and the rest are Zhongren. Current benefits for new entrants are very similar to those for Laoren, since those retiring in 2016 have nearly 20 years under the new system. This reform largely explains the fall in replacement rates in 1997–2015, over which the average expenditure per pensioner declined from over 70 percent of the urban wage in 1995–99 to under 50 percent in 2007, remaining stable after that (Figure 5.1).
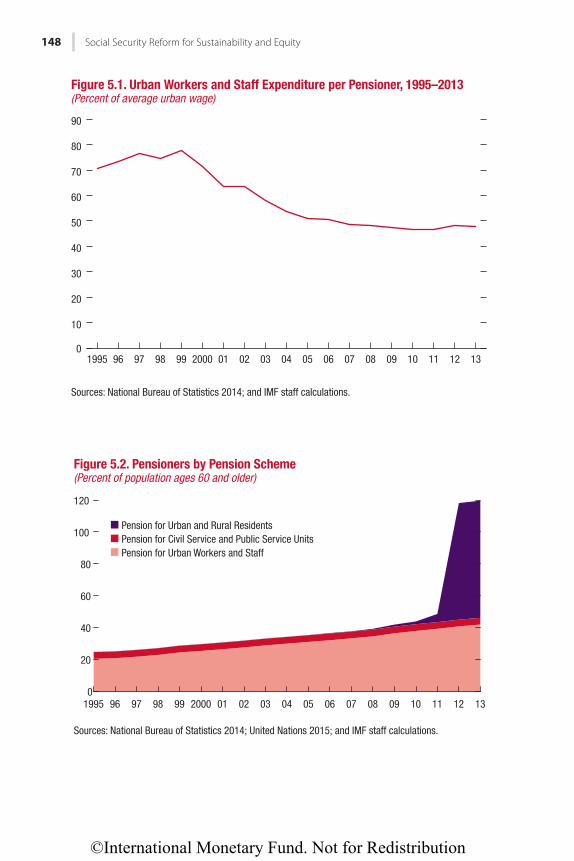
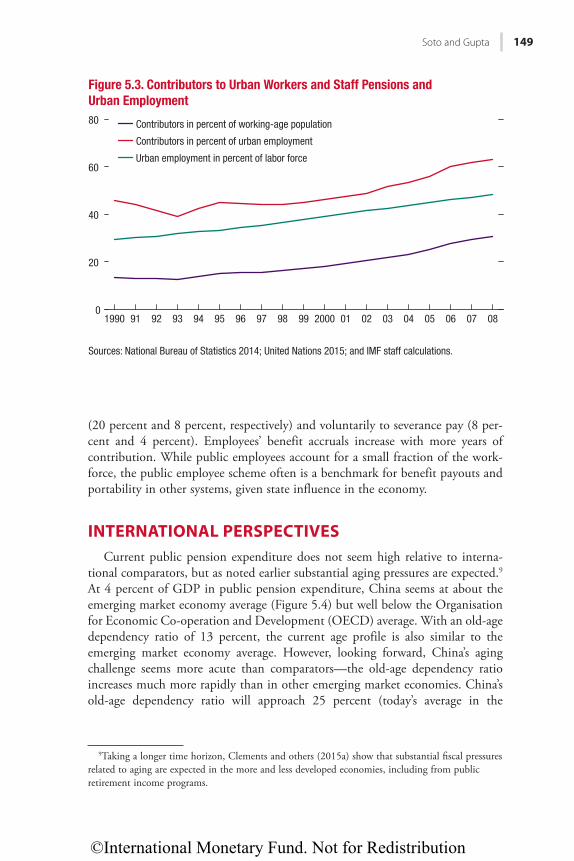
The deployment of Pensions for Urban and Rural Residents after 2010 achieved universal pension coverage of the elderly. The number of pensioners as a share of the population 60 and older increased steadily in the 1990s and 2000s, then rapidly climbed to over 100 percent in 2010–12 (Figure 5.2).6 The steady increase largely reflects a gradual increase in the contributors to Pensions for Urban Workers and Staff, which roughly tracks the increase in urban employment in the labor force (Figure 5.3). The rapid climb since 2009 is due to the introduc-tion of the Pensions for Urban and Rural Residents, which went from covering less than 1 percent of the elderly in 2009 to over 75 percent in 2013.
Recent reforms have focused on fostering better integration across pension schemes. For example, the State Council announced measures to integrate the Pensions for Civil Service and Public Service Units effective October 2015 (Yu 2015).7 Although the details of the implementation are still being refined—including grandfathering parameters for those with significant years of service under the previous regime—the objective of the reform is to gradually equalize pensions for government workers to those in the private and enterprise sector. Further measures to adjust the contribution rates across systems are under con-sideration.8 Under the new scheme, both the government as an employer and public employees will make mandatory contributions to social security
5For workers earning the provincial average wage through their career, the first and second com-ponent provide 35 percent (0.5 × 35 × provincial wage, 0.5 × 35 × career wage). Assuming returns are equal to wage growth, an 8 percent contribution would generate a balance of 2.8 times the aver-age wage after 35 years, which divided by 139 and multiplied by 12 months produces a pension of 24.17 percent of the wage. For this hypothetical worker, the Urban Workers and Staff pension would replace 59.2 percent of preretirement earnings (35 percent + 24.17 percent).
6This share is higher than 100 percent because some pensioners (mostly women, who can retire at 55 years of age) are younger than age 60.
7Includes employees in ministries and public entities. 8In parallel to social security reform, the basic wage of government employees was raised by
60−110 percent, with a higher increase at entry levels, also effective October 2014. This was the first wage increase since 2006. A grade-point system was introduced to allow for a pay rise without a change in rank. The basic wage usually accounts for about half of compensation.
©International Monetary Fund. Not for Redistribution
148 Social Security Reform for Sustainability and Equity
0
10
20
30
40
50
60
70
80
90
1995 96 97 98 99 2000 01 02 03 04 05 06 07 08 09 10 11 12 13
Figure 5.1. Urban Workers and Staff Expenditure per Pensioner, 1995–2013(Percent of average urban wage)
Sources: National Bureau of Statistics 2014; and IMF staff calculations.
0
20
40
60
80
100
120
1995 96 97 98 99 2000 01 02 03 04 05 06 07 08 09 10 11 12 13
Pension for Urban and Rural ResidentsPension for Civil Service and Public Service UnitsPension for Urban Workers and Staff
Figure 5.2. Pensioners by Pension Scheme(Percent of population ages 60 and older)
Sources: National Bureau of Statistics 2014; United Nations 2015; and IMF staff calculations.
©International Monetary Fund. Not for Redistribution
Soto and Gupta 149
(20 percent and 8 percent, respectively) and voluntarily to severance pay (8 per-cent and 4 percent). Employees’ benefit accruals increase with more years of contribution. While public employees account for a small fraction of the work-force, the public employee scheme often is a benchmark for benefit payouts and portability in other systems, given state influence in the economy.
INTERNATIONAL PERSPECTIVESCurrent public pension expenditure does not seem high relative to interna-
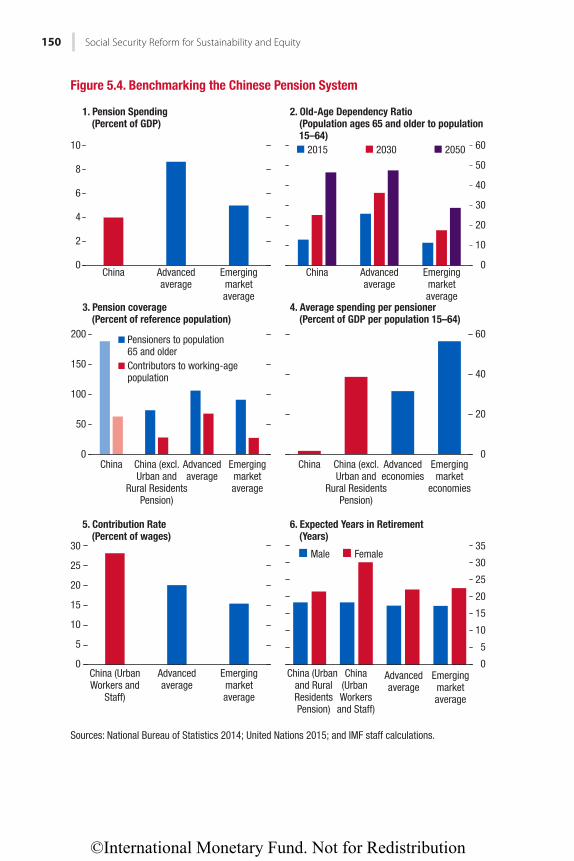
tional comparators, but as noted earlier substantial aging pressures are expected.9 At 4 percent of GDP in public pension expenditure, China seems at about the emerging market economy average (Figure 5.4) but well below the Organisation for Economic Co-operation and Development (OECD) average. With an old-age dependency ratio of 13 percent, the current age profile is also similar to the emerging market economy average. However, looking forward, China’s aging challenge seems more acute than comparators—the old-age dependency ratio increases much more rapidly than in other emerging market economies. China’s old-age dependency ratio will approach 25 percent (today’s average in the
9Taking a longer time horizon, Clements and others (2015a) show that substantial fiscal pressures related to aging are expected in the more and less developed economies, including from public retirement income programs.
0
20
40
60
80
1990 91 92 93 94 95 96 97 98 99 2000 01 02 03 04 05 06 07 08
Contributors in percent of working-age population
Contributors in percent of urban employment
Urban employment in percent of labor force
Figure 5.3. Contributors to Urban Workers and Staff Pensions and Urban Employment
Sources: National Bureau of Statistics 2014; United Nations 2015; and IMF staff calculations.
©International Monetary Fund. Not for Redistribution
150 Social Security Reform for Sustainability and Equity
0
2
4
6
8
10
China Advancedaverage
Emergingmarketaverage
China Advancedaverage
Emergingmarketaverage
Advancedaverage
Emergingmarketaverage
Advancedaverage
Emergingmarketaverage
0
10
20
30
40
50
602015 2030 2050
0
50
100
150
200
China China (excl.Urban and
Rural ResidentsPension)
Advancedeconomies
Emergingmarket
economies
China China (excl.Urban and
Rural ResidentsPension)
China (Urban and RuralResidentsPension)
Pensioners to population65 and olderContributors to working-agepopulation
0
20
40
60
0
5
10
15
20
25
30
China (UrbanWorkers and
Staff)
Advancedaverage
Emergingmarketaverage
China(Urban Workers
and Staff)
0
5
10
15
20
25
30
35Male Female
Figure 5.4. Benchmarking the Chinese Pension System
Sources: National Bureau of Statistics 2014; United Nations 2015; and IMF staff calculations.
1. Pension Spending(Percent of GDP)
2. Old-Age Dependency Ratio(Population ages 65 and older to population 15–64)
3. Pension coverage(Percent of reference population)
4. Average spending per pensioner(Percent of GDP per population 15–64)
5. Contribution Rate(Percent of wages)
6. Expected Years in Retirement(Years)
©International Monetary Fund. Not for Redistribution
Soto and Gupta 151
advanced economies) by 2030 and 47 percent (about the current level in Japan) by 2050.
China recently achieved universal pension coverage by providing relatively low benefits to pensioners through Pensions for Urban and Rural Residents. Coverage rates for both pensioners (190 percent of the population ages 65 and older) and contributors (63 percent of the population ages 15–64) is substantially higher than comparators in advanced and emerging market economies, with the differ-ence largely due to the recent expansion of the Pensions for Urban and Rural Residents.10 Excluding this scheme, pensioner coverage (74 percent) and contrib-utor coverage (27 percent) are at about the average in emerging market economies.
Benefits seem low, reflecting relatively modest benefits from Pensions for Urban and Rural Residents, which explains why China offers universal coverage at relatively low expenditure. Excluding Pensions for Urban and Rural Residents, benefit generosity is between the averages for advanced and emerging market economies, providing average pensions that are slightly above 40 percent of GDP per population ages 15–64.
Two key parameters of pension systems in China seem out of line with comparators. The contribution rate of the Pensions for Urban Workers and Staff (at 28 percent of wages on average) is well above the averages for advanced (20 percent of wages) and emerging market economies (15 percent of wages) and appears very regressive due to a high minimum threshold. This fact implies limited room to improve the sustainability of the system with additional revenue—increases in contribution rates could push the share of contributors in the working population lower. In addition, retirement ages are relatively low even after taking into account different life expectancy across countries. In particular, for Urban Workers and Staff and the Civil Service and Public Service Units, life expectancy at the retirement age is one year higher for men and 3½ years higher for women than in advanced and emerg-ing market economies.
BASELINE PROJECTIONS AND MEASURES OF SUSTAINABILITY
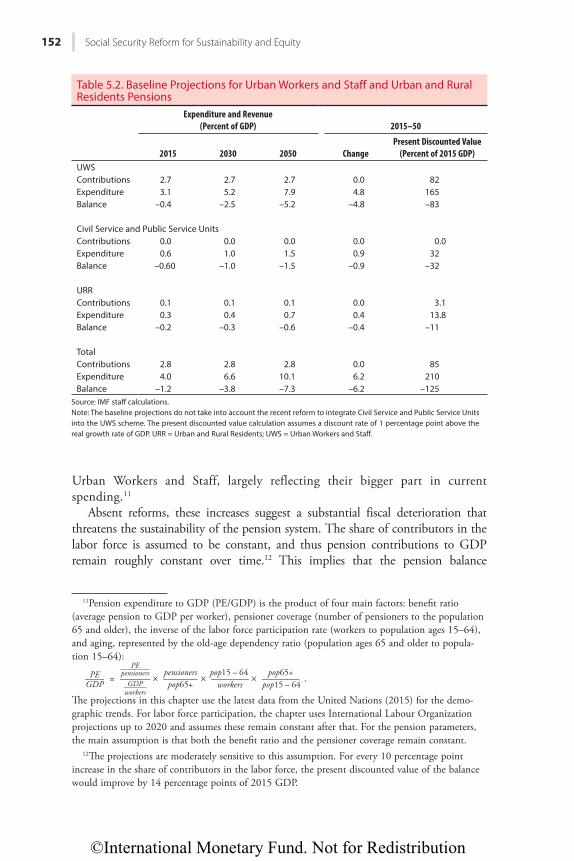
Public pension expenditure is projected to increase rapidly in 2015–50. Assuming unchanged benefit generosity and coverage of the different pension schemes, public pension expenditure is projected to increase, largely owing to aging, from 4.0 percent of GDP in 2015 to 10.1 percent of GDP in 2050 (Table 5.2). Most of this increase (4.8 percentage points) is due to Pensions for
10Pensioner coverage is substantially higher than 100 percent in China because individuals receive pensions as early as age 55 for women and 60 for men. In the advanced economies, the average is 107 percent.
©International Monetary Fund. Not for Redistribution
152 Social Security Reform for Sustainability and Equity
Urban Workers and Staff, largely reflecting their bigger part in current spending.11
Absent reforms, these increases suggest a substantial fiscal deterioration that threatens the sustainability of the pension system. The share of contributors in the labor force is assumed to be constant, and thus pension contributions to GDP remain roughly constant over time.12 This implies that the pension balance
11Pension expenditure to GDP (PE/GDP) is the product of four main factors: benefit ratio (average pension to GDP per worker), pensioner coverage (number of pensioners to the population 65 and older), the inverse of the labor force participation rate (workers to population ages 15–64), and aging, represented by the old-age dependency ratio (population ages 65 and older to popula-tion 15–64):
PE ____ GDP = PE ________ pensioners _______ GDP ______ workers
× pensioners ________ pop65+ × pop15 – 64 _______
workers × pop65+ _______
pop15 – 64 .
The projections in this chapter use the latest data from the United Nations (2015) for the demo-graphic trends. For labor force participation, the chapter uses International Labour Organization projections up to 2020 and assumes these remain constant after that. For the pension parameters, the main assumption is that both the benefit ratio and the pensioner coverage remain constant.
12The projections are moderately sensitive to this assumption. For every 10 percentage point increase in the share of contributors in the labor force, the present discounted value of the balance would improve by 14 percentage points of 2015 GDP.
Table 5.2. Baseline Projections for Urban Workers and Staff and Urban and Rural Residents Pensions
Expenditure and Revenue (Percent of GDP) 2015–50
2015 2030 2050 ChangePresent Discounted Value
(Percent of 2015 GDP)UWS Contributions 2.7 2.7 2.7 0.0 82Expenditure 3.1 5.2 7.9 4.8 165Balance –0.4 –2.5 –5.2 –4.8 –83
Civil Service and Public Service UnitsContributions 0.0 0.0 0.0 0.0 0.0Expenditure 0.6 1.0 1.5 0.9 32Balance –0.60 –1.0 –1.5 –0.9 –32
URRContributions 0.1 0.1 0.1 0.0 3.1Expenditure 0.3 0.4 0.7 0.4 13.8Balance –0.2 –0.3 –0.6 –0.4 –11
Total Contributions 2.8 2.8 2.8 0.0 85Expenditure 4.0 6.6 10.1 6.2 210Balance –1.2 –3.8 –7.3 –6.2 –125
Source: IMF staff calculations.Note: The baseline projections do not take into account the recent reform to integrate Civil Service and Public Service Units into the UWS scheme. The present discounted value calculation assumes a discount rate of 1 percentage point above the real growth rate of GDP. URR = Urban and Rural Residents; UWS = Urban Workers and Staff.
©International Monetary Fund. Not for Redistribution
Soto and Gupta 153
(contributions minus expenditure) is projected to worsen from −1.2 percent of GDP in 2015 to −7.3 percent of GDP in 2050. In present discounted value, the sum of the pension deficits over 2015–50 is nearly 125 percent of 2015 GDP—83 percent in the Urban Workers and Staff scheme, 32 percent in the Civil Service and Public Service Units scheme, and 11 percent in the scheme for Urban and Rural Residents. Roughly, if reforms are not implemented and pension deficits are financed by bor-rowing, public debt will increase by 125 percentage points over the next 35 years.13
OPTIONS FOR REFORMParametric Reforms to Enhance Pension Sustainability
There are no easy options to address the large pension imbalance—estimated at nearly 125 percent of 2015 GDP in present value terms. But a combination of a few options—for example, increasing retirement ages, modifying pension indexation, reviewing benefit formulas, and making the Civil Service and Public Service Units scheme contributory—could help address the bulk of the pension imbalance over the long term. These options can have a substantial fiscal impact—altogether, under reasonable assumptions, they could reduce the pen-sion imbalance from 125 percent to 31 percent of GDP (Table 5.3). Of course, these should be implemented gradually and evaluated carefully to ensure that the system remains not only fiscally sustainable, but also equitable and inclusive.14 Of these options, increasing retirement ages seems particularly attractive, as it can partly address sustainability concerns gradually without reducing replacement rates. Increasing retirement ages would also promote labor force participation at older ages, with a positive impact on growth.15 However, an increase in retirement ages alone will not be sufficient to ensure sustainability and inclusiveness of the social security system and would need to be accompanied by other reforms.
• Increasing retirement ages. One possibility is to aim to gradually raise statutory ages for men and women to age 67 by 2050 for all schemes.16 This increase would reduce pension expenditure by nearly 4 percentage points of GDP in
13Other researchers find similar estimates. Li and Zhang (2013) find the average of estimates by Chinese and international organizations for the “unfunded pension liability” of the Urban and Rural Residents Scheme at RMB3.5 trillion in 2010 (86 percent of 2010 GDP). Ma, Zhang, and Li (2012) estimate the actuarial imbalance of the Pensions for Urban Workers and Staff over 2013–50 at 83 percent of 2011 GDP (Zuo 2013).
14Using an overlapping generations model calibrated for China, Song and others (2015) show that a gradual approach to ensure sustainability is superior in terms of welfare relative to sudden adjustments. Their analysis compares a pure pay-as-you-go (where benefits are adjusted automati-cally but gradually to offset the impact of aging) with sudden adjustments to regain sustainability (both through sharp parametric reform or a shift through full funding where the government issues bonds to compensate for past contributions).
15Pension reforms can have an important impact on labor supply. He, Ning, and Zhu (2015) find that pension reforms explain 38 percent of the increase in labor supply in China since 1995.
16The Third Plenum blueprint aims to “study and implement a policy to progressively raise the retirement age” (Central Committee 2013).
©International Monetary Fund. Not for Redistribution

154 Social Security Reform for Sustainability and Equity
2050 and cut the present discount value of the pension imbalance by 61 per-centage points of GDP. A milder schedule of reforms (such as a more gradual and lower statutory retirement age at 65) will be less effective in addressing the sustainability of the pension system.17 After 2050, it seems appropriate to link the statutory age of retirement to life expectancy, which implies an approxi-mate increase of one year and three months per decade under current United Nations projections.18 Increases in retirement ages should be accompanied by
17Increases in retirement ages are underway in most OECD countries, with a clear trend to equalize retirement ages for men and women (OECD 2013). In the long term, at least 14 of 32 countries will have retirement ages between 67 and 69 (OECD 2012).
18There are different ways to link pensions to life expectancy, including through benefits (Finland, Germany), qualifying conditions (Denmark, France), and retirement ages (Denmark, Greece, Italy) (OECD 2011). Other countries have introduced automatic adjustments to link the indexation to the sustainability of the pension system (Canada, Spain) (OECD 2015).
Table 5.3. Parametric Reform Options to Improve Sustainability
2015 2030 2050
Present Discounted Value
(Percent of 2015 GDP)Baseline (Percent of GDP)Pension Contributions 2.8 2.8 2.8 85Pension Expenditures 4.0 6.6 10.1 210Balance –1.2 –3.8 –7.3 –125After Parametric Reforms to Improve Sustainability (Percent of GDP)Pension Contributions 2.8 2.9 2.9 88Pension Expenditures 4.0 3.5 4.7 119Balance –1.2 –0.6 –1.7 –31Impact of Parametric Reforms to Improve Sustainability (Percentage points of GDP)1. Increase Retirement Age to 67 by 20501
Urban Workers and Staff 0.0 –1.7 –3.2 –49Civil Service and Public Service Units 0.0 –0.3 –0.6 –9Urban and Rural Residents 0.0 –0.1 –0.2 –3Total 0.0 –2.1 –4.1 –612. Index Pensions Fully to Prices1
Urban Workers and Staff 0.0 –0.9 –1.4 –27Civil Service and Public Service Units 0.0 –0.2 –0.3 –5Urban and Rural Residents 0.0 –0.2 –0.2 –4Total 0.0 –1.3 –1.9 –363. Reduce Benefits by 5 Percent (excluding Urban and Rural Residents)1
Urban Workers and Staff 0.0 –0.3 –0.4 –8Civil Service and Public Service Units 0.0 –0.1 –0.1 –2Total 0.0 –0.3 –0.5 –94. Contributions to Civil Service and Public Service2
Civil Service and Public Service 0.0 0.1 0.1 3Source: IMF staff calculations.Note: The present discounted value calculation assumes a discount rate of 1 percentage point above the real growth rate of GDP.1Positive = increase in spending.2Positive = increase in revenue.
©International Monetary Fund. Not for Redistribution
Soto and Gupta 155
adequate provisions for the poor, whose life expectancy tends to be shorter than that of the general population. These include strengthening labor market regulations to ensure equal opportunities for older workers, retraining pro-grams, and the availability of disability pensions and social assistance for the most vulnerable (Clements and others 2015b).
• Modifying pension indexation. The current system is roughly indexed to a mix of wages and prices.19 Moving toward full price indexing, under which benefits are indexed to consumer prices once received for the first time, would reduce pension expenditure by 1.9 percentage points of GDP in 2050 and reduce the present discount value of the imbalance by 36 percent-age points of GDP.
• Reviewing the benefit formula. For example, changing the accrual rate from 1 percent per year of contributions to 0.95 percent in the scheme for Urban Workers and Staff and reducing benefits by 5 percent in the Civil Service and Public Service Units schemes would reduce pension expenditure by 0.5 percentage point in 2050 and reduce the present discount value of the imbalance by 9 percentage points of GDP.20
• Making the Civil Service and Public Service Units scheme contributory. This action is part of the ongoing reform. Since the Civil Service and Public Service Units scheme covers government employees, contributions of the government as an employer (20 percent of wages) do not have an impact on overall fiscal sustainability—contributions of government as an employer are both fiscal expenditure (part of the wage bill) and revenue (social contri-butions), which offset each other. This offsetting explains why, once com-pleted, this option would have only a modest impact on sustainability, reflecting the employee contribution of 8 percent of wages.
Reforms to Increase Adequacy and Boost Incentives to Contribute
In addition to improving fiscal sustainability, pension reforms can enhance efficient functioning of the pension system, including boosting adequacy, facili-tating labor market flexibility, and allowing for greater portability across regions.21 However, these options might exacerbate the funding imbalance of the pension system, widening the present discounted value of pension deficits by about 67 percentage points of 2015 GDP (Table 5.4).
19For Pensions for Urban Workers and Staff, this is because the portion of the pension that depends on the provincial average is fully indexed to regional wage growth while the portion that depends on the career-average wage is nominally fixed. In 2016 pensions were increased by 6.5 percent.
20Countries typically reduce benefits in indirect ways, for example by reducing the reference sal-ary used for pensionable earnings. These cuts can be across the board (Austria, Finland, Germany, Italy) or protecting those with low pensions (France, Portugal, Sweden) (D’Addio 2014).
21Complementary measures might also be helpful in enhancing the functioning of the pension system and increasing equity, including strengthening administrative capacity and labor reforms to promote formality and ensure employment opportunities for older workers (Clements, Feher, and Gupta 2015).
©International Monetary Fund. Not for Redistribution
156 Social Security Reform for Sustainability and Equity
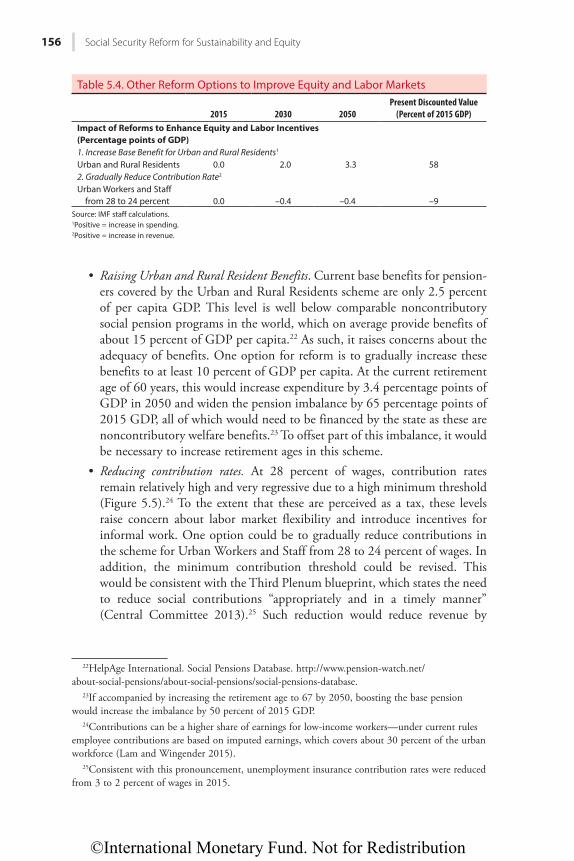
• Raising Urban and Rural Resident Benefits. Current base benefits for pension-ers covered by the Urban and Rural Residents scheme are only 2.5 percent of per capita GDP. This level is well below comparable noncontributory social pension programs in the world, which on average provide benefits of about 15 percent of GDP per capita.22 As such, it raises concerns about the adequacy of benefits. One option for reform is to gradually increase these benefits to at least 10 percent of GDP per capita. At the current retirement age of 60 years, this would increase expenditure by 3.4 percentage points of GDP in 2050 and widen the pension imbalance by 65 percentage points of 2015 GDP, all of which would need to be financed by the state as these are noncontributory welfare benefits.23 To offset part of this imbalance, it would be necessary to increase retirement ages in this scheme.
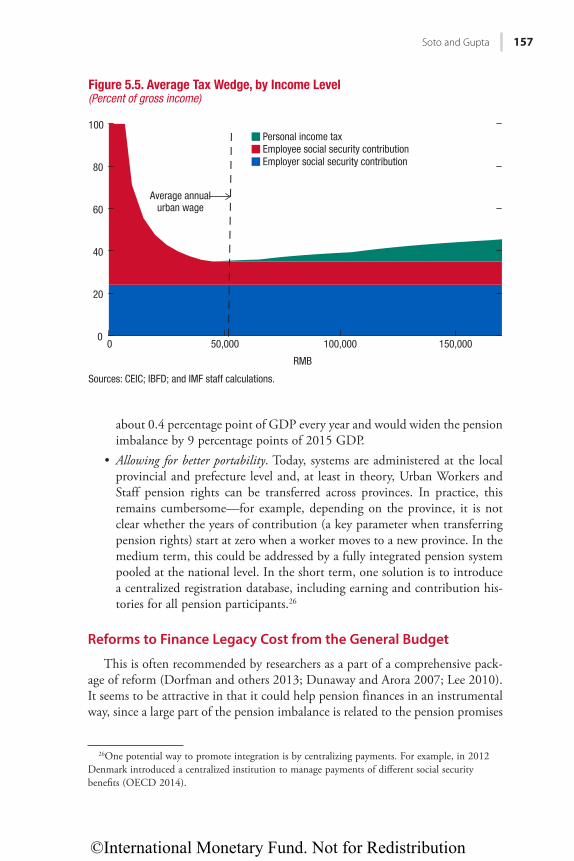
• Reducing contribution rates. At 28 percent of wages, contribution rates remain relatively high and very regressive due to a high minimum threshold (Figure 5.5).24 To the extent that these are perceived as a tax, these levels raise concern about labor market flexibility and introduce incentives for informal work. One option could be to gradually reduce contributions in the scheme for Urban Workers and Staff from 28 to 24 percent of wages. In addition, the minimum contribution threshold could be revised. This would be consistent with the Third Plenum blueprint, which states the need to reduce social contributions “appropriately and in a timely manner” (Central Committee 2013).25 Such reduction would reduce revenue by
22HelpAge International. Social Pensions Database. http://www.pension-watch.net/about-social-pensions/about-social-pensions/social-pensions-database.
23If accompanied by increasing the retirement age to 67 by 2050, boosting the base pension would increase the imbalance by 50 percent of 2015 GDP.
24Contributions can be a higher share of earnings for low-income workers—under current rules employee contributions are based on imputed earnings, which covers about 30 percent of the urban workforce (Lam and Wingender 2015).
25Consistent with this pronouncement, unemployment insurance contribution rates were reduced from 3 to 2 percent of wages in 2015.
Table 5.4. Other Reform Options to Improve Equity and Labor Markets
2015 2030 2050Present Discounted Value
(Percent of 2015 GDP)Impact of Reforms to Enhance Equity and Labor Incentives (Percentage points of GDP)1. Increase Base Benefit for Urban and Rural Residents1
Urban and Rural Residents 0.0 2.0 3.3 582. Gradually Reduce Contribution Rate2
Urban Workers and Staff from 28 to 24 percent 0.0 –0.4 –0.4 –9
Source: IMF staff calculations. 1Positive = increase in spending.2Positive = increase in revenue.
©International Monetary Fund. Not for Redistribution
Soto and Gupta 157
about 0.4 percentage point of GDP every year and would widen the pension imbalance by 9 percentage points of 2015 GDP.
• Allowing for better portability. Today, systems are administered at the local provincial and prefecture level and, at least in theory, Urban Workers and Staff pension rights can be transferred across provinces. In practice, this remains cumbersome—for example, depending on the province, it is not clear whether the years of contribution (a key parameter when transferring pension rights) start at zero when a worker moves to a new province. In the medium term, this could be addressed by a fully integrated pension system pooled at the national level. In the short term, one solution is to introduce a centralized registration database, including earning and contribution his-tories for all pension participants.26
Reforms to Finance Legacy Cost from the General Budget
This is often recommended by researchers as a part of a comprehensive pack-age of reform (Dorfman and others 2013; Dunaway and Arora 2007; Lee 2010). It seems to be attractive in that it could help pension finances in an instrumental way, since a large part of the pension imbalance is related to the pension promises
26One potential way to promote integration is by centralizing payments. For example, in 2012 Denmark introduced a centralized institution to manage payments of different social security benefits (OECD 2014).
0
20
40
60
80
100
0 50,000 100,000 150,000
RMB
Personal income taxEmployee social security contributionEmployer social security contribution
Average annualurban wage
Figure 5.5. Average Tax Wedge, by Income Level(Percent of gross income)
Sources: CEIC; IBFD; and IMF staff calculations.
©International Monetary Fund. Not for Redistribution

158 Social Security Reform for Sustainability and Equity
made to date. However, the potential size of the legacy cost is large—combined accrued liabilities from the schemes for Urban Workers and Staff and Civil Service and Public Service Units add up to 129 percent of 2015 GDP (Figure 5.6). To finance such costs, one would need additional annual revenue of 4.6 percent of GDP over 2015–50—an amount that would require substantial tax reforms and would likely displace other priority expenditure.
Of course, such a proposal should not be taken in isolation, but rather com-bined with the reforms above. With parametric reforms, it is possible to reduce the imbalance to a more manageable, but still challenging, amount—31 percent of 2015 GDP (equivalent to an annual flow of 1.1 percent of GDP in 2015–50). If, in addition to this, reforms to increase the adequacy of Urban and Rural Residents as well as those to reduce contribution rates are to be financed by gen-eral revenue, then this would require an additional 67 percent of 2015 GDP from general revenue (equivalent to an annual flow of 3.3 percent of GDP in 2015–50).
In sum, the pension system has a large imbalance, which would likely need a combination of parametric reforms and some level of general revenue financing. But the size of the former is likely to be large, requiring a careful analysis between the balance of revenue and expenditure consolidation measures (Lam and Wingender 2015) and parametric reforms.
108
21
129
57
11
68
0
50
100
150
200
250
Urban Workersand Staff
Civil Service andPublic Service Units
Total
Future accruals
Accrued
Figure 5.6. Present Discounted Value of Pension Expenditure 2015–50, Current and Future Accruals(Percent of 2015 GDP)
Sources: National Bureau of Statistics 2014; and IMF staff calculations.
©International Monetary Fund. Not for Redistribution
Soto and Gupta 159
CONCLUSIONSThe Chinese population is aging rapidly, with important implications for the
sustainability of the public pension system. Based on demographic projections from the United Nations, an increase in public pension expenditure of 6.2 per-centage points of GDP in 2015–50 is projected, assuming the main parameters of the system—benefit generosity and coverage—remain unchanged. In present discounted value, the imbalance of the pension system over this period is 125 per-cent of 2015 GDP.
Beyond fiscal pressures, the pension system remains fragmented and imposes impediments for labor mobility. Separate pension systems exist for workers of private and state-owned enterprises, rural and urban residents, and civil service and public service units. Pension systems are managed at the provincial level, and differences remain in terms of contributions, eligibility, and benefit rules across provinces and schemes.
Transition to a sound and equitable pension system will be critical to domestic rebalancing of the economy. Social security reforms have the potential to boost consumption and address inequality, and can reduce the need for household pre-cautionary savings, mitigate labor market distortions, and make growth more inclusive.
While some measures are in progress, comprehensive reform can go a long way in addressing these challenges. Among the available options to strengthen the finances of the pension system, raising retirement ages seems the most attractive. Statutory ages of retirement remain lower than in international comparators, particularly for women. Raising the retirement ages for men and women gradu-ally to age 67 would reduce the imbalance of the pension system by close to half. But that alone will not ensure sustainability; other reforms can include indexing benefits to prices and modifying benefit formulas slightly. Yet it seems that some degree of budget support might be required, at least to finance the distributive components of the system and to finance measures to raise the adequacy of Rural and Urban Resident Pensions and lower contribution rates.
Fostering greater integration of the system remains an important challenge, particularly in light of the continued transformation toward a more urban and skill-intensive labor market (Meng 2012; Lam, Liu, and Schipke 2015). One feasible option to facilitate this transition is to develop an integrated database of career earnings and contributions for scheme participants, as well as setting up clear and homogenous rules for transfers across provinces and schemes. This would go a long way toward developing a true, integrated, national social insur-ance system.
REFERENCESCentral Committee of the Communist Party of China (Central Committee). 2013. “Decision
on Some Major Issues Concerning Comprehensively Deepening the Reform.” Adopted at the Third Plenary Session of the 18th Central Committee of the Communist Party of China on November 12. http://www.china.org.cn/chinese/2014-01/17/content_31226494.htm.
©International Monetary Fund. Not for Redistribution
160 Social Security Reform for Sustainability and Equity
Chamon, Maros, Kai Liu, and Eswar Prasad. 2013. “Income Uncertainty and Household Saving in China.” Journal of Development Economics 105 (2013): 164–177.
Clements, Benedict, Kamil Dybczak, Vitor Gaspar, Sanjeev Gupta, and Mauricio Soto. 2015a. “The Fiscal Consequences of Shrinking Populations.” IMF Staff Discussion Note 15/21, International Monetary Fund, Washington.
Clements, Benedict, Ruud de Mooij, Sanjeev Gupta, and Michael Keen. 2015b. Inequality and Fiscal Policy. Washington: International Monetary Fund.
Clements, Benedict, Csaba Feher, and Sanjeev Gupta. 2015. “Equity Considerations in the Design of Public Pension Systems.” In Inequality and Fiscal Policy, edited by B. Clements, R. de Mooij, S. Gupta, and M. Keen. Washington: International Monetary Fund.
D’Addio, Anna Cristina. 2014. “Pension Reforms and Risks: Challenges for Pension Systems in Advanced European Economies.” In Sustainable and Equitable Pensions: Challenges and Experiences, edited by B. Clements, F. Eich, and S. Gupta, Washington: International Monetary Fund.
Dorfman, Mark C., Robert Holzmann, Philip O’Keefe, Dewen Wang, Yvonne Sin, and Richard Hinz. 2013. China’s Pension System: A Vision. Washington: World Bank.
Dunaway, Setegen, and Vivek Arora. 2007. “Pension Reform in China: The Need for a New Approach.” IMF Working Paper 07/109, International Monetary Fund, Washington.
He, Hui, Lei Ning, and Dongming Zhu. 2015. “Rapid Aging and Pension Reform: The Case of China.” Working Paper, Unpublished.
Kim, Seong Sook. 2014. “Providing Adequate Old-Age Pensions in the Republic of Korea.” In Sustainable and Equitable Pensions: Challenges and Experiences, edited by B. Clements, F. Eich, and S. Gupta. Washington: International Monetary Fund.
Lam, W. Raphael, Xiaoguang Liu, and Alfred Schipke. 2015. “China’s Labor Market in the ‘New Normal.’” IMF Working Paper 15/151, International Monetary Fund, Washington.
Lam, W. Raphael, and Philippe Wingender. 2015. “China: How Can Revenue Reforms Contribute to Inclusive and Sustainable Growth?” IMF Working Paper WP15/66, International Monetary Fund, Washington.
Leckie, Stuart H. 2009. “Civil Service and Military Pensions in China.” Paper presented in the workshop on Civil Service and Military Pension Arrangements in Selected Countries in Asia-Pacific, Institute of Economic Research, Hitotsubashi University, Tokyo.
Lee, Hung Yu. 2010. “Pension Reforms in the People’s Republic of China.” In Enhancing Social Protection in Asia and the Pacific: The Proceedings of the Regional Workshop, edited by S. W. Handayani. Manila: Asian Development Bank.
Li, Yan, and Xiaojing Zhang. 2013. “China’s Sovereign Balance Sheet Risks and Implications for Financial Stability.” In China's Road to Greater Financial Stability: Some Policy Perspectives, edited by U. Das, J. Fiechter, and T. Sun. Washington: International Monetary Fund.
Li, Yuanfang. 2015. “Pension Reform in China’s Public Sector: Motivation, Process and Impact.” Presented at Seminar on Assessing the Impact of Structural Reforms, Paris, June 1, 2015.
Li, Zhen. 2014. “The Basic Old-Age Insurance of China: Challenges and Countermeasures.” Unpublished.
Ma, Jun, Xiaomeng Zhang, and Zhiguo Li. 2012. A Study of China’s National Balance Sheet. Beijing: Social Sciences Academic Press.
Meng, Xin. 2012. “Labor Market Outcomes and Reforms in China.” Journal of Economic Perspectives 26 (4): 75–102.
Ministry of Finance of the People’s Republic of China. 2015. “National Social Insurance Fund Budget.” http://sbs.mof.gov.cn/zhengwuxinxi/gongzuodongtai/201505/t20150508_1229044.html.
National Bureau of Statistics. 2014. China Statistical Yearbook 2014. Beijing: China Statistics Press.
Organisation for Economic Co-operation and Development (OECD). 2011. Pensions at a Glance. Retirement Income Systems in OECD and G20 Countries. Paris: OECD Publishing.
©International Monetary Fund. Not for Redistribution
Soto and Gupta 161
———. 2012. OECD Pensions Outlook 2012. Paris: OECD Publishing. ———. 2013. Pensions at a Glance 2013 OECD and G20 Indicators. Paris: OECD Publishing. ———. 2014. OECD Pensions Outlook 2014. Paris: OECD Publishing. ———. 2015. Pensions at a Glance 2013 OECD and G20 Indicators. Paris: OECD Publishing. Song, Zheng, Kjetil Storesletten, Yikai Wang, and Fabrizio Zilibotti. 2015. “Sharing High
Growth across Generations: Pensions and Demographic Transition in China.” American Economic Journal: Macroeconomics 7 (2): 1–39.
State Council, People’s Republic of China. 1997. “Document No. 26: The Unified Basic Old Age Insurance System.” Beijing.
State Council, People’s Republic of China. 2005. “Document No. 38: Decision on the Urban Enterprise Pension System.” Beijing.
United Nations. 2015. World Population Prospects: The 2015 Revision. New York: United Nations.
Yang, Dennis Tao, Junsen Zhang, and Shaojie Zhou. 2012. “Why Are Saving Rates So High in China?” In Capitalizing China, edited by J. P. H. Fan and R. Morck. Chicago: Chicago University Press.
Yu, Zhou. 2015. “Reform of Pension System Worries Public Sector Workers.” Global Times. January 18. http://www.globaltimes.cn/content/902576.shtml.
Zuo, Xuejin. 2013. “Reforming Pensions to Ensure Equitable and Adequate Retirement Incomes in China.” In Sustainable and Equitable Pensions: Challenges and Experiences, edited by B. Clements, F. Eich, and S. Gupta. Washington: International Monetary Fund.
©International Monetary Fund. Not for Redistribution
©International Monetary Fund. Not for Redistribution