social networks, nutrient intake, nutritional - West Bromwich ...
301
SOCIAL NETWORKS, NUTRIENT INTAKE, NUTRITIONAL STATUS, AND PHYSICAL FUNCTION OF ETHNICALLY DIVERSE OLDER ADULTS: A LONGITUDINAL MIXED METHODS STUDY By EVANS ATIAH ASAMANE A thesis submitted to the University of Birmingham for the degree of DOCTOR OF PHILOSOPHY School of Sport, Exercise & Rehabilitation Sciences College of Life and Environmental Sciences University of Birmingham September 2019
-
Upload
khangminh22 -
Category
Documents
-
view
3 -
download
0
Transcript of social networks, nutrient intake, nutritional - West Bromwich ...

SOCIAL NETWORKS, NUTRIENT INTAKE, NUTRITIONAL
STATUS, AND PHYSICAL FUNCTION OF ETHNICALLY
DIVERSE OLDER ADULTS: A LONGITUDINAL MIXED
METHODS STUDY
By
EVANS ATIAH ASAMANE
A thesis submitted to the University of Birmingham
for the degree of DOCTOR OF PHILOSOPHY
School of Sport, Exercise & Rehabilitation Sciences
College of Life and Environmental Sciences
University of Birmingham
September 2019

ABSTRACT
The United Kingdom (UK) population is ageing and becoming more ethnically diverse. Ethnic
minorities experience higher health inequalities and increased prevalence of diet-related
diseases as compared to the general population. Social networks (SN), nutrition and physical
function are essential components of healthy ageing. Despite this, little is known about these
components of healthy ageing within ethnic minority older adults. In this PhD thesis, using a
longitudinal mixed-methods design, the profile and changes in social networks, nutrient intake
and physical function were explored in 100 community-dwelling, ethnically diverse older
adults living in a super-diverse city (Birmingham, UK). Additionally, how these variables were
related over time, and factors influencing these variables were examined. In study 1, most
participants experiencing changes in SN transitioned from an integrated SN to non-integrated
SN (63%), and more importantly, these changes occurred over a relatively short period of eight
months. These changes were identified by participants as having influenced their eating
behaviours and physical function. In study 2, it was observed that the intakes of most
micronutrients across the sample over time was lower than the UK Recommended Nutrient
Intakes (RNI), suggesting a potentially prolonged nutrient deficiency in this population. In
study 3, changes in the factors influencing eating behaviours and physical function were
intriguing and differed significantly by socio-demographic characteristics; more men reported
negative changes as compared to women at follow-up. Furthermore, most participants
considered healthy eating and physical function as separate entities with no relationship.
Overall, the findings of this thesis indicate that ethnic minority older adults may experience
rapid declines in SN, nutrition and physical function, which could inhibit healthy ageing. Steps
towards developing and implementing community and faith-based culturally acceptable
interventions to support healthy ageing are urgently needed.

ACKNOWLEDGEMENT
I am eternally grateful to the almighty God for protecting me and giving me the strength to
complete this PhD. I would like to also express my most profound appreciation to my
supervisory team. To my first supervisor, Prof J.L Thompson for her exceptional support and
inspiration in every stage of my PhD, she made me sail through even in the toughest times of
this PhD. Also, as a mentor, she cared and supported me to develop essential skills necessary
for my career progression, and most importantly, to maintain a very good work-life balance. I
am eternally grateful to you, Janice. To my second supervisor, Dr. C.A Greig, I will like to say
a big thank you for all your support in shaping my PhD, moulding me to be more attentive to
detail and providing insightful comments and suggestions throughout this PhD journey.
To the larger PANINI research family, I would like to thank all the PhD students and
supervisors that supported and collaborated with me in diverse ways during my PhD.
Specifically, I would like to thank Miss Belina Rodrigues and Dr. Nadine Santos for hosting
my secondment and collaborating with me to produce a host of exciting research. I would also
like to thank especially, the Birmingham PANINI PhD students, Paul Doody and Justin Aunger,
with whom I shared an office for three years. They were always there to cheer me up during the
tougher times of this journey.
To Dr. Robert Akparibo, who was there for me as a mentor and a big brother, supporting me in
every step of this PhD and my career development, I am much grateful for your support. To my
friends, Dr. Hibbah Osei-Kwesi, Dr. Sandra Agyapong-Badu, Dr. Gykari Ampofo, Mr. Andy
Owusu, Miss Rita Alale and to all my friends in Ghana, thank you very much for your support
throughout this PhD.

Lastly, I extend my warm gratitude to the community and faith leaders and participants that
made this study possible. Most notably, the West Bromwich African Caribbean Resource
Centre, Halesowen Asian Elders Association, Balsall Heath Church Centre, and Ward End
Asian Association for their support during the recruitment and data collection of my PhD study.

DEDICATION
I dedicate this work to my loving wife, Comfort Ayamga and adorable daughter, Somdolma
Asamane for their love and support during the challenging times of my PhD study.
FUNDING
Evans A. Asamane and the research herein was supported by the European Union’s Horizon
2020 research and innovation programme under the Marie Skłodowska-Curie grant agreement
no. 675003. http://www.birmingham.ac.uk/panini

LIST OF PEER-REVIEWED PAPERS
Publication in thesis (Chapter 3-5)
1. Asamane E.A, Greig C.A, Thompson, J.L. (Under review) Social networks and their
influences on nutrient intake, nutritional status and physical function in community-
dwelling ethnically diverse older adults: A mixed-methods longitudinal study. BMC
Public Health
2. Asamane E.A, Greig C.A, Thompson, J.L. (In preparation) The association between
nutrient intake, nutritional status and physical function of community-dwelling,
ethnically diverse older adults: A longitudinal study.
3. Asamane, E.A.; Greig, C.A.; Aunger, J.A.; Thompson, J.L. Perceptions and Factors
Influencing Eating Behaviours and Physical Function in Community-Dwelling
Ethnically Diverse Older Adults: A Longitudinal Qualitative Study. Nutrients 2019, 11,
1224. https://doi.org/10.3390/nu11061224
Collaborative publications during the PhD period
1. Whittaker AC, Asamane EA, Aunger JA, Bondarev D, Cabbia A, Doody PD, et al.
(Published). Physical Activity and Nutrition INfluences in Ageing: Current Findings
from the PANINI Project. Adv Geriatr Med Res. 2019;1:e190005.
https://doi.org/10.20900/agmr20190005
2. Doody P, Aunger J.A, Asamane E.A, Lord JM, Greig C.A, Whittaker A.C (Published).
Frailty Levels in Geriatric Hospital paTients (FLIGHT)- The prevalence of frailty
amongst geriatric populations within hospital ward settings: A systematic review
protocol” BMJ Open 2019;9:e030147. doi: 10.1136/bmjopen-2019-030147
3. Keenan A. Ramsey, Suey Y. Yeung, Anna Rojer, Noemie Gensous, Evans A.
Asamane, Justin Aunger, Dmitry Bondarev, et al. (Under review). Is Knowing Better

Doing Better? The relationship between knowledge of nutrition and physical activity
guidelines and physical function and activity in older adults. Prevention Science.
4. Aunger J.A, Asamane E.A, Davis E.T, Greaves C, Greig CA (Under review). A novel
behavioral INTErvention to Reduce Sitting Time versus usual care in older adults
undergoing orthopedic surgery (INTEREST): results of a randomized controlled
feasibility study. Annals of behavioural Medicine
5. Asamane, E.A; Ferreira-Rodrigues, B; Sousa, N; Santos, N.C; Thompson, J.L (In
preparation). The interplay of dietary fibre and social networks on the cognition
performance of community-dwelling older adults: A moderation model.
6. Asamane, E.A; Ferreira-Rodrigues, Paul Doody Carlos Portugal-Nunes B; Sousa, N;
Santos, N.C; Thompson, J.L (In preparation). Malnutrition in the community:
Combining tools to better assess nutritional status of community-dwelling older adults.
7. Rodrigues, B., Asamane E.A, Greig C.A, Thompson, J.L, Sousa N, Santos, N (In
preparation). Impact of dietary patterns on the age-related cognitive decline: A
systematic review and meta-analysis.

LIST OF CONFERENCE PRESENTATIONS/ABSTRACTS
The following conference abstracts were presented at various local and international
conferences during the period of postgraduate study within the School of Sport, Exercise and
Rehabilitation Sciences at the University of Birmingham.
1. Asamane, E.A., C.A. Greig, and J.L. Thompson. Nutrition in ageing. PANINI co-
created conference - “Healthy Ageing: New challenges”. University of Birmingham,
United Kingdom. June 2019. Oral Presentation
2. Asamane, E.A., C.A. Greig, and J.L. Thompson. Social networks and their association
with nutrient intake, nutritional status and physical function of community-dwelling
ethnically diverse older adults: A mixed methods study. UK Society for Behavioural
Medicine Annual Scientific Meeting. Birmingham, UK: December 2018. Oral
presentation.
3. Asamane, E.A., C.A. Greig, and J.L. Thompson. The role of social networks on
nutrition and physical function of ethnic minority older adults. 2nd PANINI Advanced
training meeting. Leiden, Netherlands. October 2018. Poster pitch.
4. Asamane, E.A., C.A. Greig, and J.L. Thompson. What are the key factors that influence
social networks, eating behaviours and physical function of community-dwelling
ethnically diverse older adults? Nutrition Society (NS) Student Conference, Reading,
UK. September 2017. Oral presentation.
5. Asamane, E.A., C.A. Greig, and J.L. Thompson. Dietary intake, eating behaviours and
physical function in community-dwelling ethnically diverse older adults: cultural
tailoring of assessment methods and identification of key social influences. 1st PANINI
Advanced training meeting. University of Jyvaskyla, Finland. April 2017. Oral
presentation.

TABLE OF CONTENTS
CHAPTER 1: GENERAL INTRODUCTION AND LITERATURE REVIEW ................ 1
1.0 General Background ............................................................................................................. 1
1.1 Health and diet profiles in community-dwelling, ethnically diverse older adults ................ 4
1.2 Aims and Research Questions .............................................................................................. 7
1.2.1 Research Aim .................................................................................................................... 7
1.2.2 Research Questions ........................................................................................................... 8
1.3 Literature Review ............................................................................................................... 10
1.3.1 Ageing and the concept of healthy ageing....................................................................... 11
1.3.2 Cultural understanding of healthy ageing in a super-diverse community ....................... 13
1.3.3 Diets and dietary needs of the ageing population ............................................................ 15
1.3.5 Social network typologies: size, density and composition of ethnic older minorities
living in super-diverse communities......................................................................................... 22
1.3.5.1 The use of the Wenger PANT .................................................................................... 26
1.3.5.2 Social networks on health of minority older adults ................................................... 28
1.3.6 Association of nutrition and social networks on physical function ................................. 30
1.4 The study rationale ............................................................................................................. 34
CHAPTER 2: METHODOLOGY ........................................................................................ 38
2.1 Philosophy of research ....................................................................................................... 38
2.1.1 Positivism ........................................................................................................................ 38
2.1.2 Anti-positivism, constructivist or the naturalist ideology ............................................... 39
2.1.3 Pragmatism ...................................................................................................................... 40
2.2 Study design: Longitudinal concurrent triangulation mixed methods design .................... 42
2.3 Participants, data collection and analysis ........................................................................... 44
2.3.1 Participants and recruitment ............................................................................................ 44
2.3.2 Ethical considerations ...................................................................................................... 46
2.3.3 Data protection and confidentiality ................................................................................. 47
2.4 Procedure and phases of data collection ............................................................................. 47
2.4.1 Phase 1 (Quantitative and Qualitative data) .................................................................... 48
2.4.2 Phase 2 (Quantitative and Qualitative data) .................................................................... 49
2.5 Measures and tools of data collection for phase 1 and phase 2 .......................................... 50
2.5.1 Socio-demographic and socio-economic questionnaire .................................................. 50
2.5.2 Dietary assessment .......................................................................................................... 51

2.5.3 Measurement of social networks ..................................................................................... 53
2.5.4 Anthropometric Data ....................................................................................................... 54
2.5.5 Nutritional status ............................................................................................................. 55
2.5.6 Physical function ............................................................................................................. 56
2.5.7 Semi-structured interviews and the use of interpreters ................................................... 59
2.5.8 The conceptual model guiding qualitative interviews ..................................................... 61
2.6 Techniques employed to increase participant commitment, data accuracy and reduce drop
out ........................................................................................................................................... 64
2.7 Data synthesis and analysis ................................................................................................ 65
2.7.1 Quantitative data analysis ................................................................................................ 66
2.7.2 Qualitative data analysis .................................................................................................. 67
2.8 Reflexivity .......................................................................................................................... 72
2.9 Rigour and Trustworthiness ............................................................................................... 76
2.10 Summary of chapter.......................................................................................................... 78
CHAPTER 3: SOCIAL NETWORKS AND THEIR INFLUENCES ON NUTRIENT
INTAKE, NUTRITIONAL STATUS AND PHYSICAL FUNCTION IN COMMUNITY-
DWELLING ETHNICALLY DIVERSE OLDER ADULTS: A MIXED-METHODS
LONGITUDINAL STUDY .................................................................................................... 79
3.0 Abstract ............................................................................................................................... 80
3.1 Background ......................................................................................................................... 81
3.2 Methods .............................................................................................................................. 84
3.2.1 Study design and study setting ........................................................................................ 84
3.2.2 Participants and recruitment ............................................................................................ 85
3.2.3.1 Social networks .......................................................................................................... 86
3.2.3.2 Energy and nutrient intake ......................................................................................... 88
3.2.3.3 Nutritional status ........................................................................................................ 89
3.2.3.4 Anthropometrics and physical function ..................................................................... 89
3.2.4 Quantitative analysis ....................................................................................................... 90
3.2.4 Qualitative interviews and analysis ................................................................................. 92
3.3 Results ................................................................................................................................ 93
3.3.1 Profile of social networks and their changes over eight months ..................................... 97
3.3.2 Perceived social changes and reasons for social network changes ............................... 102
3.3.2 Associations of social networks with physical function, nutrient intake and nutritional
status at baseline ..................................................................................................................... 104
3.3.3 Perceptions of the impact of social networks on eating behaviours and physical function
at baseline ............................................................................................................................... 107

3.3.4 The impact of social networks on changes in physical function (SPPB) and nutritional
status over time ....................................................................................................................... 108
3.3.5 Perceived influences of social network changes on eating behaviours and physical
function ................................................................................................................................... 110
3.4 Discussion ......................................................................................................................... 112
3.4.1 The association of social networks and health outcomes .............................................. 115
3.5 Strengths and limitations of the study .............................................................................. 118
3.6 Conclusion ........................................................................................................................ 119
3.7 References ........................................................................................................................ 121
CHAPTER 4: THE ASSOCIATION BETWEEN NUTRIENT INTAKE,
NUTRITIONAL STATUS AND PHYSICAL FUNCTION OF COMMUNITY-
DWELLING ETHNICALLY DIVERSE OLDER ADULTS: A LONGITUDINAL
STUDY ................................................................................................................................... 126
4.1 Abstract ............................................................................................................................. 127
4.2 Introduction ...................................................................................................................... 128
4.3 Methods ............................................................................................................................ 130
4.3.1 Study Design and Setting .............................................................................................. 130
4.3.2 Participants and Recruitment ......................................................................................... 130
4.3.3 Measures ........................................................................................................................ 131
4.3.4 Dietary Assessment ....................................................................................................... 131
4.3.5 Nutritional Status ........................................................................................................... 132
4.3.6 Physical Function .......................................................................................................... 133
4.3.7 Statistical Analysis ........................................................................................................ 133
4.4 Results .............................................................................................................................. 135
4.41 Energy and nutrient intakes ............................................................................................ 137
4.4.2 Micronutrients intake over time compared with RNIs .................................................. 142
4.4.3 Cross-sectional associations between nutrient intake, nutritional status and physical
function at baseline ................................................................................................................. 145
4.4.4 Longitudinal associations: Changes in nutritional status and physical function over time .
......................................................................................................................................... 148
4.5 Discussion ......................................................................................................................... 150
4.6 Implications for policy and practice ................................................................................. 156
4.7 Strengths and limitations .................................................................................................. 158
4.8 Conclusion ........................................................................................................................ 159
4.9 References ........................................................................................................................ 161
CHAPTER 5: PERCEPTIONS AND FACTORS INFLUENCING EATING
BEHAVIOURS AND PHYSICAL FUNCTION IN COMMUNITY-DWELLING
ETHNICALLY DIVERSE OLDER ADULTS: A LONGITUDINAL QUALITATIVE
STUDY ................................................................................................................................... 166
5.1 Abstract ............................................................................................................................. 167
5.2 Introduction ...................................................................................................................... 168
5.3 Materials and Methods ..................................................................................................... 170
5.3.1. Study Design and Setting ............................................................................................. 170
5.3.2. Participants and Recruitment ........................................................................................ 171
5.3.3. Theoretical Framework ................................................................................................ 172
5.3.4. Interviews ..................................................................................................................... 173
5.3.5. Data Analysis ................................................................................................................ 174
5.4. Results ............................................................................................................................. 176
5.4.1. The Differing Perceptions of Healthy Eating and Physical Function .......................... 180
5.4.1.1. Healthy Eating ........................................................................................................ 180
5.4.1.2. Physical Function .................................................................................................... 182
5.4.1.3. Priority and Association between Healthy Eating and Physical Function .............. 182
5.4.2. Factors Influencing Eating Behaviours and Physical Function .................................... 184
5.4.2.1. Personal Influences ................................................................................................. 184
5.4.2.1.1. Health Conditions ................................................................................................ 184
5.4.2.1.2. Pain ...................................................................................................................... 185
5.4.2.1.3. Body Image .......................................................................................................... 186
5.4.2.1.4. Age ....................................................................................................................... 187
5.4.2.1.5. Retirement ............................................................................................................ 187
5.4.2.2. Social Network Influences ...................................................................................... 189
5.4.2.3. Cultural and Environmental Factors ....................................................................... 191
5.4.3. Perceived Changes at Follow-Up ................................................................................. 195
5.5. Discussion ........................................................................................................................ 197
5.5.1. Perceptions of Healthy Eating and Physical Function ................................................. 197
5.5.2. Factors Influencing Eating Behaviours and Physical Function .................................... 199
5.5.3. Perceived Priority and Association of Healthy Eating and Physical Function............. 203
5.6. Implications for Policy and Practice ................................................................................ 204
5.7. Strengths and Limitations ................................................................................................ 205
5.8. Conclusions ..................................................................................................................... 206
5.9 References ........................................................................................................................ 207

CHAPTER 6: GENERAL DISCUSSION .......................................................................... 211
6.1 Summary of Key Findings (Chapters 3-5) ....................................................................... 211
6.2 Reflection of main findings and their contribution to the literature ................................. 212
6.2.1 Ethnic and Sex Differences in a Super-Diverse City .................................................... 212
6.2.2 The observed changes in SN, nutrient intake, nutritional status and physical function 214
6.2.3 The Observed Association of SN, Nutrient intake and Physical function over time .... 216
6.3 Strengths and Limitations ................................................................................................. 217
6.4 Implications and Recommendations of this PhD research ............................................... 222
6.4.1 Future research .............................................................................................................. 222
6.4.2 Policy and practice......................................................................................................... 224
6.5 Conclusion ........................................................................................................................ 226
6.6 References ........................................................................................................................ 228
APPENDICES ....................................................................................................................... 245
Appendix A: Chapter 3 Supplementary files .......................................................................... 245
Supplementary file A1: The differences in nutrient intake among the transitioned groups
of social networks at follow-up ...................................................................................... 245
Supplementary file A2: Association of social networks with MNA-SF, WC, HGS and
selected nutrients. Model 2 fully adjusted for sex, age, IMD, self-reported health,
educational status and number of diseases. .................................................................... 245
Supplementary file A3: Predictors of changes in nutritional status of community-
dwelling, ethnically diverse older adults (N=81) .......................................................... 249
Appendix B: Chapter 4 Supplementary files .......................................................................... 250
Supplementary file B1: Differences between participants that remained in the study
(n=81) and participants that dropped out (n=19) ........................................................... 250
Supplementary file B2: Differences in micronutrient intakes with and without
supplementation at baseline ............................................................................................ 251
Supplementary file B3: Differences in micronutrient intakes with and without
supplementation at follow-up ......................................................................................... 252
Supplementary file B4: Pairwise correlations ................................................................ 253
Supplementary file B5: Predictors of changes in physical function (SPPB) over time . 254
Appendix C: Chapter 5 Supplementary files .......................................................................... 255
Supplementary file C1: Complete coding matrix: Factors influencing physical function
........................................................................................................................................ 255
Appendix D1. Participant Information sheet .................................................................. 256
Supplementary file C2: Adapted Ecological model depicting the influences of eating
behaviours and among community-dwelling ethnically diverse older adults ................ 256
Appendix D: Participant information sheet and consent form, and data collection tools ...... 257

Appendix D2. Participant consent form ......................................................................... 257
Appendix D3. Socio-demographic questionnaire ........................................................... 263
Appendix D4. Physical measurement recording form ................................................... 267
Appendix D5. Mini-nutritional Assessment-Short Form (MNA-SF) ............................ 270
Appendix D6. Katz Index of Independence in Activities of Daily Living ..................... 272
Appendix D7. Wenger PANT Scoring Instrument for measuring social networks ....... 273
Appendix D8. 24-hour recall recording form ................................................................. 275
Appendix D9. Semi-structured questionnaire for interviews ......................................... 277

LIST OF TABLES
Chapter 1
Table 1: The research questions addressed in each empirical chapter and the methods used .... 9
Table 2: Categories and keywords for the literature search for this PhD thesis. ...................... 11
Table 3: Characteristics of social network types (Wenger, 1994) ............................................ 24
Chapter 2
Table 4: BMI cut-off for ethnic minority populations .............................................................. 54
Chapter 3
Table 5: Socio-demographic characteristics and other variables by social networks at baseline
(N=100) .................................................................................................................................... 95
Table 6: Profile of social networks and transition over time (N=81) ....................................... 97
Table 7: Socio-demographic characteristics, nutritional status and physical function of the
changes in social networks groups in community-dwelling ethnically diverse older adults
(N=81) .................................................................................................................................... 100
Table 8: Hierarchical multiple linear regression predicting SPPB, zinc, riboflavin, vitamin B6,
manganese and folate intakes in community-dwelling ethnic diverse older minorities at
baseline (N=100) .................................................................................................................... 106
Table 9: Predictors of changes in physical function of community-dwelling ethnically diverse
older adults (N=81) ................................................................................................................. 109
Chapter 4
Table 10: Socio-demographic characteristics and other health-related information at baseline
and 8-months’ follow-up. ....................................................................................................... 136

Table 11: Energy and Macronutrient intake of community-dwelling, ethnically diverse older
adults at baseline and follow-up (N=81) ................................................................................ 139
Table 12: Energy and Macronutrient contribution to energy by ethnicity over time ............. 141
Table 13: Hierarchical multiple regression predicting Short Physical Performance Battery
(SPPB) and handgrip strength scores ..................................................................................... 146
Table 14: Results from hierarchical linear regression analyses with socio-demographic, WC,
BMI and physical function as predictors of nutritional status (N= 100). ............................... 147
Table 15: Multinomial regression of factors predicting nutritional status membership at
follow-up (n=81) .................................................................................................................... 149
Chapter 5
Table 16: Socio-demographic characteristics of participants completing interviews at baseline
and 8-month follow-up ........................................................................................................... 178

LIST OF FIGURES
Chapter 1
Figure 1: Changes in the population of ethnic minorities and future projections within
Birmingham, UK ........................................................................................................................ 3
Figure 2: The structural illustration of the make-up of every social network (Source: Mitchell,
1969; House and Kahn, 1985). ................................................................................................. 23
Figure 3: Potential relationship between social networks, nutrition and physical function ..... 30
Chapter 2
Figure 4: Integration of concurrent quantitative and qualitative methods (Mixed methods
concurrent design concept) ....................................................................................................... 43
Figure 5: Flow chart summarising the data collection phases and visits over the 8-month
period. ....................................................................................................................................... 50
Figure 6: Perceived and measured physical functional status .................................................. 56
Figure 7: Image of the measures of SPPB assessing lower body physical function (Guralnik et
al., 1994). .................................................................................................................................. 57
Figure 8: Adapted Ecological model depicting the influences of eating behaviours among
minority older adults (Story et al., 2008). ................................................................................ 64
Figure 9: Complete coding matrix on eating behaviours ......................................................... 69
Figure 10: Section of coding matrix on eating behaviours ..................................................... 700
Figure 11: Coding matrix on Physical function...................... Error! Bookmark not defined.1
Figure 12: Section of coding matrix on physical function ..................................................... 722
Chapter 3
Figure 13: Flow chart summarising the data collection phases and visits over the 8-month
period. ..................................................................................................................................... 855

Figure 14: Flow chart of recruitment, data collection and reasons for dropouts. ................... 944
Figure 15: The distribution of energy and nutrient intakes by changes in social networks over
8-months in community-dwelling ethnically diverse older adults (N= 81). ........................ 1011
Chapter 4
Figure 16: Percentage nutrient intakes by UK RNI with and without supplements at baseline
.............................................................................................................................................. 1433
Figure 17: Percentage nutrient intakes by UK RNI with and without supplements at follow-
up .......................................................................................................................................... 1444
Chapter 5
Figure 18:Complete coding matrix on eating behaviours. ................................................... 1755
Figure 19: Influences on eating behaviours and physical function among community-dwelling
ethnically diverse older adults ................................................................................................ 175

LIST OF ABBREVIATIONS
BME Black and Minority Ethnic
BMI Body Mass Index
CAG Carolyn A. Greig
CI Confidence Interval
DWP Department for Work and Pensions
EU European Union
FFQ Food Frequency Questionnaire
GP General practitioner
HGS Handgrip strength
HSE Health Survey for England
IMD Index of multiple deprivation
JLT Janice L. Thompson
MNA-SF Mini-Nutritional Assessment-Short Form
ONS Office for National Statistics
OR Odds ratio
SD Standard deviation
SN Social Networks
SportExR Sport, Exercise & Rehabilitation Sciences

SPPB Short Physical Performance Battery
UK United Kingdom
UN United Nations
US United States of America
WC Waist circumference
WHO World Health Organization

DEFINING CONCEPTS
In this PhD study, community-dwelling, ethnically diverse older adults refer to free-living
ethnic minority older adults aged 60 years and older living in any setting within the community,
excluding those living in care homes/institutions or hospitals. The concept of ‘ethnic minority
older adults’ as used in this PhD refers mainly to migrant-origin groups, mainly first-generation
migrant groups that have settled in the UK or other parts of Europe and the US. Eating
behaviours refers to behaviours or habits that relate to grocery shopping, meal planning,
cooking, eating and all other behaviours and habits pertaining to food intake. Social Network
(SN) denotes all of the self-reported perceived/actual support received through the interpersonal
ties shared by participants and their families, friends and the wider community. Nutrient intake
throughout this thesis refers to the estimated amount of energy and nutrients calculated from
the assessment of diet carried out using multiple-pass 24-hour recalls with the addition of an
in-depth interview.
1
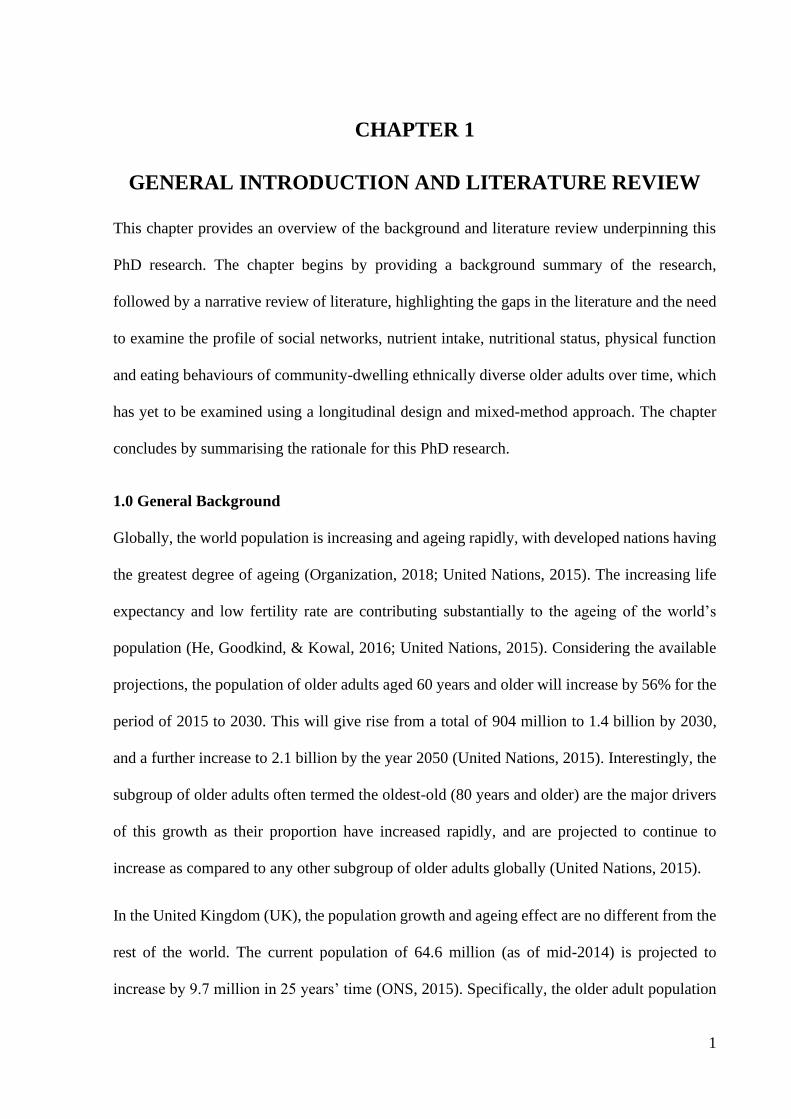
CHAPTER 1
GENERAL INTRODUCTION AND LITERATURE REVIEW
This chapter provides an overview of the background and literature review underpinning this
PhD research. The chapter begins by providing a background summary of the research,
followed by a narrative review of literature, highlighting the gaps in the literature and the need
to examine the profile of social networks, nutrient intake, nutritional status, physical function
and eating behaviours of community-dwelling ethnically diverse older adults over time, which
has yet to be examined using a longitudinal design and mixed-method approach. The chapter
concludes by summarising the rationale for this PhD research.
1.0 General Background
Globally, the world population is increasing and ageing rapidly, with developed nations having
the greatest degree of ageing (Organization, 2018; United Nations, 2015). The increasing life
expectancy and low fertility rate are contributing substantially to the ageing of the world’s
population (He, Goodkind, & Kowal, 2016; United Nations, 2015). Considering the available
projections, the population of older adults aged 60 years and older will increase by 56% for the
period of 2015 to 2030. This will give rise from a total of 904 million to 1.4 billion by 2030,
and a further increase to 2.1 billion by the year 2050 (United Nations, 2015). Interestingly, the
subgroup of older adults often termed the oldest-old (80 years and older) are the major drivers
of this growth as their proportion have increased rapidly, and are projected to continue to
increase as compared to any other subgroup of older adults globally (United Nations, 2015).
In the United Kingdom (UK), the population growth and ageing effect are no different from the
rest of the world. The current population of 64.6 million (as of mid-2014) is projected to
increase by 9.7 million in 25 years’ time (ONS, 2015). Specifically, the older adult population

2
in the UK has also increased tremendously in recent years and is forecast to increase further in
the coming decades (ONS, 2015; ONS, 2018). For example, in 2016, there was a total of 11.2
million people aged 65 years and older, representing 18% of the population (ONS, 2018). It is
projected that by 2030, one in five people in the UK will be aged 65 years and older, comprising
21.8% of the population, and with the proportion of those aged 75 years and older and 85 years
and older comprising 6.8% and 3.2% of the population, respectively (ONS, 2017). Although
life expectancy is increasing, the majority of older adults in the UK and other parts of the world
spend the last decades of their life in poor health with increased dependency (HSE, 2005;
Thompson, 2014; WHO, 2018). The added number of years versus the number of healthy years
contribute not only to reducing quality of life for these individuals, it also impacts significantly
on health and social care systems, the economy and the lives of family members (Age UK,
2017).
Another vital component directly increasing along with population growth and life expectancy
in the UK is the increasing super-diversified nature of the population (Lievesley, 2013;
Vertovec, 2007). Super-diversity refers to the unprecedented collection of different
nationalities, faiths, languages, cultures and ethnicities in the society (Vertovec, 2007).
Currently, the population of black and ethnic minorities in England forms 12% of the entire
population (ONS, 2012). In England and Wales, the population of ethnic minorities (non-white)
has increased from 14% (7 million) in 2001 to about 20% (11 million) in 2011, with further
projections of 30% by 2050 (Jivraj, 2012; ONS, 2012; Rees et al., 2012). Specifically, older
ethnic minorities aged 50 years and older has increased from 1.3 million in 2001 to 1.7 million
in 2007 and 2.4 million by 2016, and is projected to reach 3.8 million and 7.4 million by 2026
and 2051, respectively (Lievesley, 2013).
Specifically, within the Birmingham area, census data indicate that the population of ethnic

3
minority groups has increased from 30% in 2001 to 42.1% in 2011, whereby 2 of every 5 people
identify themselves with an ethnic group (Birmingham City Council, 2011b). Birmingham has
been defined as one of the youngest super-diverse cities in the UK, with the greatest collection
of nationalities, faiths, languages, cultures and ethnicities of migrants from over 170 countries
(Birmingham City Council, 2011a; Phillimore, 2013). Recent projections predict that by 2021,
more than 50% of the population in Birmingham will be comprised of ethnic minorities
(Birmingham City Council, 2018). Figure 1 illustrates the various ethnic groups residing in
Birmingham, and the projected changes in the population of these groups in the super-diverse
city of Birmingham, UK.
Figure 1: Changes in the population of ethnic minorities and future projections within
Birmingham, UK
(Source: Population forecasts for Birmingham, with an ethnic group dimension population
forecasts for Birmingham; Population forecasts for Birmingham CCSR Report.doc
http://hummedia.manchester.ac.uk/institutes/cmist/archive-publications/working-
papers/2007/2007-12-population-forecasts-for-birmingham.pdf)
0
2000
4000
6000
8000
10000
12000
14000
1991 2001 1996 2006 2011 2016 2021 2026
Pop
ula
tio
ns
by
nu
mb
er
Years
Birmingham ethnic minority populations and projections
Caribbean
Indian
Pakistani
Other
Bangladeshi
Chinese
African

4
The increasing super-diversity and the rise in the size of the older population are two important
factors that will affect the general health of the population in the 21st century and beyond
(Simpson, 2007; Vertovec, 2007). Given such growth, it is necessary for research to focus on
understanding the complexities and modalities that influence the ability of community-
dwelling, ethnically diverse older adults to age more healthily. This will improve the quality of
life and reduce the personal, social, and financial burdens on individuals, families, communities
and society.
1.1 Health and Diet profiles in Community-dwelling, ethnically diverse older adults
Ethnicity as a multi-faceted fluid model and subjective concept (ONS, 2012), comes from the
Greek word ‘Ethnos’ which means belonging to a nation. Ethnicity is sometimes used as a
synonym to mean the cultural grouping of people (Betancourt & López, 1993). By definition,
an ethnic population could be referred to a group of people that share similar language, customs,
values and race and are distinct from the rest of the population (Carlson, Kipps, & Thomson,
1984).
In the UK, many ethnic minority groups are often faced with low levels of economic status and
disproportionate health inequalities, predisposing them to lower quality of life and poorer health
than the white British population (Department for Work and Pensions, 2015; Evandrou, 2000;
Nazroo, 1997; Sproston & Mindell, 2006). Also, the high prevalence of sedentary behaviour
and low physical activity levels have been highlighted among older ethnic minorities in the UK
(Babakus & Thompson, 2012; Castaneda-Gameros, Redwood, & Thompson, 2018b). This is
evident in the higher trends of obesity, diabetes and other non-communicable diseases among
older minorities as compared to the white British population (Eastwood et al., 2015; Gilbert &
Khokhar, 2008; Leung & Stanner, 2011; Misra & Ganda, 2007; Sproston & Mindell, 2006).

5
Furthermore, there have been possible differences reported in dietary intakes which may
account for the higher incidence of diet-related diseases among ethnic minority groups
compared with their counterparts in the UK (Anderson et al., 2005; Leung & Stanner, 2011).
More so, accumulating evidence suggests that dietary habits of ethnic minority groups are
becoming unhealthy mainly due to food acculturation, age and years spent in the host country
(Gilbert & Khokhar, 2008; Leung & Stanner, 2011; Talegawkar et al., 2016). While recognising
the changes in dietary profiles and the ultimate role diet and food behaviours play in the overall
health of older adults, there are limited data on the factors affecting dietary changes (barriers),
specifically exploring the association of Social Networks (SN) and other key influences on diet
and physical function among this population over time.
There is a growing body of evidence that shows that adequate dietary intake, social networks
and physical function could remarkably influence morbidity, quality of life and mortality in
later life (Fiori & Jager, 2012; Gopinath et al., 2014; Hammond, 2010; Millen et al., 2005;
Milte & Mcnaughton, 2016; Munoz et al., 2008; Santini et al., 2015). For example, a double-
blind, randomised controlled trial, discovered that adequate dietary intake mainly focusing
intakes of whey protein, essential amino acids, and vitamin D, coupled with the right amount
of exercise improves muscle mass, strength and functional abilities of sarcopenic older adults
in a 12-week study (Rondanelli et al., 2016). Similarly, in the EPIC study of 74,607 of adults
aged 60 years or older, it was established that the stronger an individual’s adherence to the
Mediterranean diet, the lower the risk of mortality (Trichopoulou et al., 2005). Another study
exploring the adherence to Mediterranean diet also found that self-perceived mental and
physical health was directly associated with high adherence to Mediterranean diet (Munoz et
al., 2008).

6
In addition to the role of optimal nutrition for healthy ageing, evidence suggest that strong social
networks (including household size, the frequency of non-household contact with
family/friends and active involvement with the community) could have a significant influence
on healthy ageing. Community-dwelling older adults with strong social networks often have
good support to adapt comfortably to healthy lifestyles, leading to improved functionality and
quality of life (Barnett & Praetorius, 2015; Escobar-Bravo, Puga-González, & Martín-Baranera,
2012; Fiori & Jager, 2012; Park, Smith, & Dunkle, 2014; Santini et al., 2015). In the EPIC
study, it was found that older adults with strong social networks were more likely to adapt to
healthier eating habits of increased fruits and vegetables consumption compared with those
having weaker social network ties (Conklin et al., 2014). Another significant influence of social
networks (family ties) was found in a group of 50 older adults. In this study, it was discovered
that homebound older adults ate well (adequate calories) when mealtimes were with family
members (Locher et al., 2005). Additionally, a study examining the influence of social networks
on health outcomes among 4,170 Korean adults aged 65 years and older found that individuals
with more extensive social networks had higher levels of life satisfaction and lower depressive
symptoms than those with restricted networks (Park et al., 2014).
Given the above evidence, assessing dietary intake and social network influences among the
population forms an important asset to informing nutritional policies/interventions and
consequently improving healthy dietary intake, physical function and reduction in the trends of
non-communicable diseases. The current data are limited, and further research is needed to
enhance our understanding of dietary behaviour and nutrient intakes of community-dwelling
ethnically diverse older adults to ensure the provision of the necessary support for older adults
to adopt healthy lifestyle activities for healthy ageing. A well-conducted screening and
assessment of diets of older adults could improve our ability to detect risks of malnutrition

7
much earlier in older populations (Crombie et al., 2004). Also, Sharma (2011) highlighted the
need for an appropriate and timely screening and assessment of dietary intake and eating
behaviours, which could help to identify the link between certain foods and disease causation
(Sharma, 2011). Such vital information could inform policies, create network specific
interventions and monitor the progress of existing interventions.
To date, the assessment of diet in older adults have often been poorly conducted, and most of
the research has been done within predominately white populations. Even though there is
evidence that ethnic minorities are willing to participate in relevant research, they are often
underrepresented in both clinical and community health research (Gill et al., 2012; Redwood
& Gill, 2013). More so, the few researchers that explored dietary research into multicultural
and super diverse communities often fail to use culturally sensitive assessment methods, leading
to reduced participation and inaccurate results (Birmingham Policy Commission on Healthy
Ageing, 2013). As such, there is still a great deal to be learned about the influences on dietary
intake and how these impact on physical function and healthy ageing among ethnic minorities
living in super-diverse communities in the UK. Also, there is limited evidence examining the
effect of social networks typology (type, size and composition) and their changes on dietary
behaviours and physical function among community-dwelling, ethnically diverse older adults
living in a super-diverse city in the UK.
1.2 Aims and Research Questions
This section discusses the aims and the research questions of the PhD study.
1.2.1 Research Aim
This longitudinal mixed-methods PhD research sought to measure the profile of social
networks, nutrient intake, nutritional status and physical function, and explore the extent to

8
which these variables change over a period of eight months among community-dwelling,
ethnically diverse older adults. Also, this PhD research aimed to identify and contextualize the
influence of social networks and other key factors on nutrient intake, eating behaviours, and
physical function over time in ethnically diverse older adults in the super-diverse city of
Birmingham, UK. These aims were achieved by adapting already existing tools to ensure they
were culturally appropriate, more accurate and less burdensome for participants.
1.2.2 Research Questions
To achieve the aims of the study, the following research questions were developed. Table 1
shows the primary and secondary research questions and the corresponding methods to
address each, under the three main empirical chapters of this PhD research.
Primary questions
1. What is the profile of the social networks (SN) of community-dwelling ethnically, diverse
older adults living in a super-diverse city, and what are the influences of SN on nutrient
intake, nutritional status and physical function?
2. What are the changes in SN and do changes in SN influence dietary intake, eating
behaviours and physical function in ethnically diverse older adults over an 8-month
period? And if so, how?
3. What is the current nutrient intake, nutritional status, eating behaviours and physical
function of ethnically diverse older adults living in a super-diverse city? Is their nutrient
intake and nutritional status related to their physical function?

9
Table 1: The research questions addressed in each empirical chapter and the methods used
Empirical chapter Research questions addressed Methods
Chapter 3: Social networks and its influence on
nutrient intake, nutritional status and physical
function of community-dwelling ethnically
diverse older adults: A mixed methods
longitudinal study
1. What are the social network (SN) typologies of
community-dwelling ethnically diverse older
adults living in a super-diverse city?
2. Are there SN changes over the period of 8-
months in this population?
To what extent do social networks, and any
changes in these networks, influence nutrient
intake, nutritional status and physical function
over 8-months?
Longitudinal concurrent
mixed methods
Chapter 4: The association between nutrient
intake, nutritional status and physical function of
community-dwelling ethnically diverse older
adults: A longitudinal study
1. What is the profile of energy, macro- and
micronutrient intakes, and nutritional status in
community-dwelling ethnically diverse older
adults?
2. What are the changes in nutrient intakes and
nutritional status over an 8-month period?
3. What are the changes in physical function over
an 8-month period?
4. How is nutritional status related to their physical
function over time?
Longitudinal
quantitative design
Chapter 5: Eating behaviours and factors
influencing dietary and physical function
behaviours of community-dwelling ethnically
diverse older adults living in the United
Kingdom: A qualitative prospective.
1. What are the eating behaviours of community-
dwelling ethnically diverse older adults?
2. What are the main factors influencing dietary
and physical function behaviours?
Longitudinal qualitative
design
Analysis

10
1.3 Literature Review
Search strategy
Literature was searched using several databases during the study period. These included
Scopus, Medline, Pubmed, PsychInfo, Web of Science, CINHAL and Google Scholar. Books
and additional references were sought through FindIt@Birmingham, the University of
Birmingham library search tool. Other reports, books and papers were obtained from the
relevant government websites such as Office for the National Statistics (ONS), World Health
Organisation (WHO), Birmingham City Council, Age UK, and the United Nations. Also,
references of identified material were explored to find related articles to the subject area.
The search was divided into 4 main categories using years of published work as a guide. These
categories included:
• Ageing and super-diversity
• Diets and dietary assessment
• Social networks and healthy ageing
• Physical function
With a combination of keywords and phrases, literature within each category was sought (as
listed in table 2).

11
Table 2: Categories and keywords for the literature search for this PhD thesis.
Category Keywords or phrases
Ageing and super-diversity Age, old, elderly, super-diversity, diversity, ethnicity,
older, ‘ageing’, ‘ageing well’ ‘healthy ageing’,
‘successful ageing’
Diets and dietary assessment
‘diets’ ‘ethnic food’, ‘nutrient intake’, ‘dietary
assessment’, ‘dietary assessment method’, ‘ethnic
group’, ‘ethnic food’, ‘immigrant food’, ‘minority
group’ ‘dietary need’ ‘physiological’
Social networks and healthy ageing
‘social’, ‘networks’ ‘ties’, ‘social ties’, ‘family ties’,
‘friends’ ties’, ‘social support’, ‘health’
Physical function ‘physical capacity’, ‘physical function’, ‘fitness’,
‘functional capacity’, ‘functional decline’
1.3.1 Ageing and the Concept of Healthy Ageing
Ageing occurs as a result of the life-long biological changes, damages to the genome and the
inability of the body to adapt/repair these changes with time (Steves, Spector, & Jackson, 2012).
As this molecular damage occurs, it has the ability to cause cells and organs to malfunction,
hence the failure to produce energy and maintain other functional abilities with time (Steves et
al., 2012). This gradual decline in functionality predisposes the body to an increased risk of
diseases and subsequently death. The process of ageing is influenced significantly by many
factors such as genes, nutrition and the environment (Kirkwood, 2006; Steves et al., 2012).
The multi-dimensional impact on ageing explains the age and health disparities often noticed
within the same population irrespective of the chronological ageing spectrum (Marmot & Bell,
2012; Steves et al., 2012). Older adults that live in different environments with different socio-
economic status and dietary intake will age and die differently (Marmot & Bell, 2012;
Trichopoulou et al., 2005).
Over decades, there has been substantial debate on what and how to describe healthy ageing,

12
what constitutes it, or even how it can be measured (Bowling, 2006; Romo et al., 2013; WHO,
2015). There has also been considerable debate on the terms or phrases used to describe healthy
ageing. Some refer to it as active ageing, healthy ageing, ageing well, positive ageing or
successful ageing (Bowling, 2006; Romo et al., 2013; WHO, 2015). Given the current and
projected demographic changes, research into healthy ageing is becoming vital, with numerous
researchers looking at ways to effectively promote and sustain healthy ageing in both
community and institutionalised settings (WHO, 2015; World Health Organization, 2015). This
has led to the formation of working groups and commissions on healthy ageing globally, aimed
at generating feasible regulations and recommendations that will support older adults to age
healthily in safe and healthy communities (Birmingham Policy Commission on Healthy
Ageing, 2013; CFHD, 2006; WHO, 2015).
The definitions of healthy ageing continue to evolve and become more comprehensive, taking
a multi-dimensional approach to describing healthy ageing. Some of these definitions have been
based solely on two distinct theories, namely the biomedical perspective and that of the
psychosocial perspective of healthy ageing (Cosco et al., 2014). The dimension of an
individual’s physical health, functional and cognitive capacity and social activity forms the
biomedical aspect of healthy ageing, while that of the dimensions of social networks,
psychological well-being and the community support for healthy ageing forms the psychosocial
domain of healthy ageing. Following the earlier work of Rowe and Khan, they defined healthy
ageing as “the state of no disease and disease-related disability-free life with high functional
capacity and active life involvement” (Rowe & Kahn, 1997). While this definition comes with
many limitations, it has led to the unearthing of several definitions with a comprehensive
approach to healthy ageing. In a systematic review exploring the various descriptions of healthy

13
ageing, it was found that there are 105 operational definitions of healthy or successful ageing
currently in existence (Cosco et al., 2014).
The latest of these definitions is contained in the WHO recent report, “Ageing and Health
Report (2015).’’ WHO defined healthy ageing as “the process of building and sustaining the
functional ability that enables an individual’s well-being in older age’’ (WHO, 2015). While
examining this definition, the Birmingham Commission on Healthy Ageing found that the
feeling of how old one is, is not necessarily determined by chronological age or health status,
but rather a holistic array of many other factors surrounding the individual. This leads to a
description of healthy ageing as the components of daily activities one undertakes, the
environment in which one lives, the services one has access to, how valued and valuable one
feels and, importantly, the social networks of an individual (Birmingham Policy Commission
on Healthy Ageing, 2013). Besides these definitions, the Community and Family Health
Division (CFHD) (2006) working group on ageing also defined healthy ageing as the
development and maintenance of optimal mental, social and physical well-being and function
in older adults through safe communities, accessible health services and programmes to prevent
or reduce the burden of diseases. It has been suggested that the absence of uniformities in these
definitions impedes the progress of research, making adoption and comparison of policies
across populations difficult (Cosco et al., 2014).
1.3.2 Cultural understanding of Healthy Ageing in a Super-diverse community
After several decades of research into healthy ageing, evidence suggests that healthy ageing is
complex and very subjective to different individuals in different populations (Birmingham
Policy Commission on Healthy Ageing, 2013; Bowling, 2006; Cosco et al., 2014). This is
manifested by the differences within and across various cultures and individuals, the differing

14
approaches and interpretations by researchers, and the way we define and promote healthy
ageing (Cosco et al., 2014; Hung, Kempen, & De Vries, 2010).
As such, there is a great deal that still needs to be learned about the cultural perspective of
healthy ageing, especially within super-diverse communities (Uotinen, Suutama, & Ruoppila,
2003). Accumulating evidence suggests that lay people’s understanding of healthy ageing is
more holistic with components of healthy ageing outside the already existing theoretical models
of healthy ageing (Bergstrom & Holmes, 2000; Bowling, 2006; Guse & Masesar, 1999; Phelan
et al., 2004; Tate, Lah, & Cuddy, 2003; Von Faber et al., 2001). Bowling (2006), found that
lay older people’s understanding of healthy ageing was all-inclusive and varied across age
groups and social-demographic characteristics. For example, it was found that respondents who
were in ‘good’ health, rather than ‘not good’ health, had a significantly increased odds of
defining successful ageing in terms of social relationships, social activity, and psychological
factors, rather than defining it with regards to health (Bowling, 2006). While older adults that
were married, as opposed to unmarried, responded with an increased odds of mentioning
financial circumstances as part of successful ageing (Bowling, 2006). These findings are further
supported by Hung and colleagues (2010). In their study, it was found that lay views of healthy
ageing varied considerably within and between various cultures or ethnic groups (Hung et al.,
2010).
Given this, many studies have argued that the understanding of healthy ageing from the lay
views of older adults could help not only to understand how and what constitutes healthy
ageing, but also to design and implement a network-specific intervention to promote healthy
ageing (Bowling, 2006; Phelan & Larson, 2002). As the UK is becoming ethnically diverse,
there are limited data on how specific minority groups understand and experience ageing

15
especially in super-diverse communities (Fenton & Draper, 2014; Sin, 2007). The Birmingham
Commission for Healthy Ageing (2013) found that there existed many differences within and
between ethnic minority groups. This has led to calls for more research to explore how healthy
ageing is culturally understood and what influences healthy ageing in different populations
(Fenton & Draper, 2014). In light of this, this PhD research seeks to contribute to the
understanding of healthy ageing in super-diverse communities in Birmingham by identifying
key influences to the adoption of healthy lifestyle behaviours among community-dwelling,
ethnically diverse older adults.
1.3.3 Diets and Dietary needs of the Ageing Population
Physiological, physical and social changes occur as an individual age. These changes impact
on dietary behaviour (food intake), nutrient needs, nutritional status and sedentary behaviours
(WHO, 2015). More so, these changes are not uniform, as food intake, nutrient needs and
requirements, and the entire ageing process occur distinctive from person to person as they age.
For example, some overweight older adults might require less energy to avoid weight gain but
need to ensure adequate intake of micronutrients, while those older adults who are at risk of
underweight (including other diseases and concomitant infections) will require more energy
and nutrients to combat malnutrition (Houwing et al., 2003).
From a physiological perspective, the ageing process impacts on the body in many dimensions
that can impair the body’s ability to ingest, digest, absorb, process, distribute and store nutrients
over time (Morley, 1997). These changes have the tendency to affect the dietary behaviours and
nutritional status of older adults. Morley and Silver (1988) describe these changes with age that
could impair dietary behaviour and nutritional status as “the anorexia of ageing.’’

16
Additionally, the loss of dentition, sight, hearing and taste with age are considered to be the
primary drivers that can impact on food intake, nutritional status, prevalence of other diseases
and subsequently the quality of life among older adults (Boyce & Shone, 2006; De Marchi et
al., 2012; Petersen & Yamamoto, 2005; WHO, 2015). For example, the loss of teeth with age
affects the amount and quality of food consumed. This usually occurs as mealtimes are not
pleasurable, which results in the inability to eat a variety of nutritious meals due to chewing
difficulties encountered during mealtimes (N'gom & Woda, 2002). Specifically, most older
adults with impaired dentition are likely to avoid meat, fruits, vegetables and meals that require
proper use of the teeth, which will eventually lead to poor nutritional status (Hutton, Feine, &
Morais, 2002). In a study exploring dentition and nutrient intake (fat), De Marchi et al. (2012)
found that in 471 community-dwelling older adults, being toothless had higher odds for
inadequate body fat as compared to increased dentition. In a similar study, using the Mini
Nutritional Assessment (MNA), it was discovered that older adults that were edentulous
(lacking natural teeth) and wearing only one denture were more likely to have less adequate
food intake, thus presenting higher risks of malnutrition when assessed (De Marchi et al., 2008).
Similar results have been found with the loss of sight, hearing, taste and smell impacting on
dietary intake with age (Bautista et al., 2013; Rolls, 1986). Bautista and colleagues (2013)
demonstrated in a two-month cross-over intervention study that enhanced flavour foods led to
better nutritional status of nursing home older adults aged 60 years and older. In this study, the
addition of either 0.5g of monosodium glutamate or 0.5g of iodized salt, as compared to no
intervention, led to an increase in energy intake, most nutrients and body mass index (Bautista
et al., 2013). Other physiological changes that might influence food intake and nutrient needs
in older adults include impaired gastrointestinal function, increases in leptin levels which

17
decreases appetite, having the overall effect of decreasing the desire to eat as one ages
(Chapman, 2007; Landi et al., 2016).
Furthermore, the occurrence of low-grade chronic inflammation becomes more common as the
individual ages, and this eventually leads to a high oxidative stress, and subsequently increases
the risk of diseases such as atherosclerosis, chronic heart diseases, cancers etc. (Franceschi et
al., 2007). These diseases have the potential to impact on nutrient intake and needs of older
adults. Likewise, ageing is accompanied by decreased metabolic activity and decline in energy
expenditure due to the loss of muscle mass and proportional increase of fat mass (Kyle et al.,
2001). This decline in metabolic activity and energy expenditure could also be attributed to the
decline of physical activity with age (Caspersen, Pereira, & Curran, 2000; Elia, Ritz, & Stubbs,
2000). Given this, the amount of food intake reduces with time, leading to a low nutrient intake
(especially micronutrients) consequently causing malnutrition that could lead to a further
impact on metabolic rate and energy expenditure (Donini, Savina, & Cannella, 2003; Landi et
al., 2016).
Moreover, it has been shown that bone mineral mass declines faster with advancing age, thus
exposing older adults to a greater risk of osteoporosis (Eastell and Lambert, 2002). The onset
of osteoporosis also has the effect of destabilising energy expenditure, thus affecting food intake
and prompting a further loss of muscle mass with age (Morley, 1997).
In addition to these obligatory impacts of ageing on dietary behaviour, older people’s dietary
behaviour is influenced by a multi-dimensional array of factors such as gender, educational
level, socio-economic status, culture, food shopping environment and social support (social
networks) (Bloom et al., 2017; Conklin et al., 2014; Kamphuis, De Bekker-Grob, & Van
Lenthe, 2015; Locher et al., 2005). For example, there is accumulating evidence suggesting that

18
poor dietary behaviours and nutritional status are as a result of limited social networks in old
age (Conklin et al., 2014; Locher et al., 2005; Mcintosh, Shifflett, & Picou, 1989). In earlier
research, it was found that older adults in the USA that had extensive friendship networks had
good appetites, adequate dietary intake and good nutritional status as compared to their
counterparts with weaker social networks (Mcintosh et al., 1989). Similarly, Locher and
colleagues explored the diets of 50 homebound older adults and found that food intake was
significantly and positively influenced by the presence of family ties (Locher et al., 2005). Also,
it has been shown that the presence of good social networks increases the consumption of fruits
and vegetables among community-dwelling older adults (Conklin et al., 2014).
Even though current and past research studies have delved into the factors impacting on poor
dietary behaviours, adequate nutrient intake, and subsequently malnutrition, nutritional health
is still a major problem in old age. In Canada, a study exploring dietary profiles of older
minority groups found that 72.5% were at moderate to high risk of malnutrition (Johnson &
Garcia, 2003). In the UK, poor nutritional status in older adults often goes unnoticed,
unaccounted for, and hence untreated (Elia & Russell, 2009). Even with this assumption,
malnutrition still affects 3 million people of which 93% are community-dwelling individuals
(Elia & Russell, 2009). Older adults in the UK are faced with a double burden of malnutrition.
The double burden of malnutrition refers to the coexistence of undernutrition,
overweight/obesity, or diet-related non-communicable diseases among a population across all
spectrums of ages (WHO, 2016). In the UK, national statistics indicate that 0.3% and 1% of
older adults aged 65-74 years and >75 years, respectively, are underweight. While obesity, a
form of overnutrition, affects 35% of women and 52% of men aged 65 years and older (Bates
et al., 2014; Health and Social Care Information Centre, 2013).

19
1.3.4 Dietary assessment in ethnic minority older adults
As outlined earlier, dietary intake and behaviours of ethnic minorities have changed
considerably over time (Leung & Stanner, 2011). However, there is a paucity of data illustrating
the trend of dietary information in super-diverse communities. Dietary assessment in ethnically
diverse communities is limited, and the few assessments that are often done fail to use culturally
appropriate and sensitive tools, thus leading to incomplete and inaccurate nutritional data.
Dietary intake assessment refers to the assessment of food intake at either the national,
household and individual level for the purposes of research and interventions. The aim of
dietary assessment is to ascertain the habitual dietary intake of individuals or populations that
are being investigated at each point in time. For example, adequate nutritional data of patients
enables clinicians to assess the efficacy of treatment and tailor existing interventions.
Information at the population level could also be used to design policies and redefine the focus
of health care services, thus crafting new interventions to curb nutritional problems.
Similarly, at the country level, nutritional assessment could be used to ascertain food and
nutrition security that could aid in the formation of policies. As such, the choice of dietary
assessment method to be used at each level depends on a multitude of factors. For example, the
objective of the study, resources available and subjects in the study could determine the type of
dietary assessment to be used (Biro et al., 2002).
There is no perfect measurement tool for dietary assessment as all the tools come with inherent
merits and demerits, for example, some assessment tools at the individual or population level
are either cumbersome with high participant burden, inaccurate, or culturally inappropriate for
participants (Bingham, 1991). These challenges are more prominent among ethnic minority

20
groups, as most researchers have insufficient information about ethnic minority foods, recipes
or even how to estimate portion sizes (Garduño‐Diaz et al., 2014).
In the assessment of diets among ethnic minority populations, food frequency questionnaires
(FFQs) have been commonly used (Earland, Campbell, & Srivastava, 2010; Kassam‐Khamis
et al., 1999; Sharma et al., 1999). FFQs capture an individual’s acute or long-term dietary intake
through the format of asking participants to provide the frequency of dietary intake from an
already provided list of foods (Thompson & Byers, 1994). FFQs are relatively inexpensive,
quick to use and can be tailored for a group of people (Sharma et al., 1996). However, FFQs
may not be able to estimate true nutrient intakes, cooking method or even portion sizes, and
may not be appropriate to provide details of food combination among ethnic minority older
adults in a multi-ethnic community (Garduño‐Diaz et al., 2014). Also, the level of English
literacy varies widely across ethnically diverse populations, and as such this limits the accuracy
and reliability of using FFQs in these populations (Garduño‐Diaz et al., 2014). Lastly, FFQs
have been found to overestimate consumption levels when used with older adults. For example,
in the Newcastle 85+ study, it was found that the FFQ used in the study overestimated energy
and nutrient intakes in white British older adults when compared with the multiple pass 24-hour
recall method (Adamson et al., 2009).
In addition to FFQs, rood records are also commonly used to assess diet among community-
dwelling older adults. Food records refer to the collection of dietary intake using food diaries
(Thompson & Byers, 1994). Food records are usually completed over 3 to 7 days. Even though
this method is considered the most accurate among dietary assessment methods, it shares similar
difficulties like the FFQ, and can lead to participant fatigue and reducing the adherence of
participants to the entire study (Brunner, Juneja, & Marmot, 2001; Thompson & Byers, 1994).

21
Khokhar et al. (2013) worked with South Asian populations, and found this method to be more
demanding, invasive and due to the literacy level of participants, was not well understood.
Multiple-pass 24-hour dietary recalls have by far been considered as the most accurate tool to
measure dietary information among community-dwelling ethnically diverse older adults
(Garduño‐Diaz et al., 2014; Ngo et al., 2009). It is rapid and user-friendly with less participant
burden while ensuring participants’ interest in the process. It also requires less reliance on an
individual’s longer-term memory as the participant only has to recall all foods and drinks
consumed in the past 24-hours (Thompson and Byers, 1994). In the validation of the 24-hour
recalls as compared to the FFQ in older adults, it was found to be more appropriate as it yielded
more realistic energy and nutrient intakes with fewer errors (Adamson et al., 2009). A study
exploring the challenges in conducting dietary assessments among ethnic minority groups
concluded that multiple-pass 24-hour recall on two non-consecutive days was the most
appropriate method to measure habitual dietary intake and reduce the challenges accompanied
with dietary assessments within this group (Garduño‐Diaz et al., 2014).
However, the use of 24-hour recalls also comes with some limitations such relying on
participant’s memory to recall all foods and drinks consumed in the past 24 hours (Thompson
and Byers, 1994; Adamson et al., 2009). Also, this method requires the researcher to have a
good knowledge of foods, recipes and dietary styles of the targeted population to enable him/her
to make appropriate prompts to capture all foods and drinks eaten in the past 24-hour period
(Garduño‐Diaz et al., 2014; Thompson, 2014).
To estimate dietary intake of community-dwelling ethnically diverse older adults more
precisely, there is the need for these assessment methods to be tailored to make them culturally
sensitive and ensure a low participant burden (Ngo et al., 2009). This will give not only a more

22
accurate view of the diets of this population but will help to understand the wide variation of
factors that affect ethnic minority older adults from making healthy food choices. To augment
this knowledge gap, this PhD research tailored the multiple-pass 24-hour dietary recall and
coupled it with qualitative interviews to serve this purpose.
1.3.5 Social Network typologies: size, density and composition of Ethnic older
minorities living in Super-diverse communities
The inter-personal ties and relationship shared among a group of inhabitants in an environment
are termed social networks (Kahn, 1980; Mitchell, 1969). These ties offer a sense of identity,
support/solidarity and the feelings of belongingness to the people sharing it (House & Kahn,
1985; Walker, Macbride, & Vachon, 1977). As explored by Wenger, these networks could
either be supportive or non-supportive networks (Wenger, 1994), but in research, the emphasis
is mostly on the capacities of these networks to provide functional support and their consequent
influences on healthy ageing. In other words, the aspect of social support derived from any
network denotes the functional component of that network. Furthermore, older adults
sometimes value the content of social networks and often describe them as a better degree of
healthy ageing than merely physical health (Depp & Jeste, 2006).
In understanding social networks, the term ‘network typology’ is often used. This term refers
to the different characterization of the types of interpersonal ties that exist within a population
with regards to size, density and composition of each network group (Litwin, 2001). The
typology of social networks is not only unique but enables easy classifications to ascertain its
support capabilities and contribution to health. Below depicts the structural representation that
forms any social network.

23
Figure 2: The structural illustration of the make-up of every social network (Source: Mitchell,
1969; House and Kahn, 1985).
The use of network typologies started decades ago, with scientists describing different versions
under which an older adult’s social networks could be classified (Adams, 1986; Litwin, 1995;
Mugford, Kendig, & Kendig, 1986; Wenger, 1984; Wenger, 1989). Early work on network
typology used friendship ties to classify social networks of unmarried elderly women (Adams,
1986). Following this, Wenger (1989) developed a distinctive network typology for measuring
social networks of older adults, using three distinct criteria namely availability of local close
kin, the frequency of contact with family, friends and neighbours and the levels of social
integration of community and other voluntary groups. With further work, Wenger
systematically generated five different social networks for older adults representing different
lifestyles and varying degrees of support. (Wenger, 1991; Wenger, 1994). These include the
family dependent, locally integrated, local self-contained, wider community focussed, and
private restricted networks. The characteristics of these networks are detailed in table 2.
So
cial
net
wo
rks
content
size
density

24
Table 3: Characteristics of social network types (Wenger, 1994)
Characteristics Local Integrated Wider Community
focussed
Family dependent Local self-contained Private restricted
Local Kin Yes No Yes Yes No
Children Most times yes Most times yes Most times yes Most times no Most times no
Network size Larger (8+) Larger (8+) Small (1-4) Medium (5-6) Smallest
Marital Status Mostly married Mostly Married Sometimes
widowed
Single or widowed Mostly single or
widowed
Family members
contact
Regular and active Irregular but active Very regular Irregular and not
active
Irregular not active
Community/Voluntary
Involvement
Highest High Low Low Lowest
Risk Fewer fewer Few High Highest
Isolation, loneliness
and depression
Very low/absent Low Present but low High Highest
Representation in UK Common/ majority
of older people
Small older
population
Not common Small/ minority of the
population
Small

25
Considering these characteristics, the five social networks can easily be grouped under two
main domains; integrated social network and non-integrated social network. The locally
integrated and wider community focussed social networks forms the integrated social network.
While the remaining three, the family dependent, the local self-contained and the private
restricted forms the non-integrated social networks.
Further to Wenger’s network typology, Litwin (1995) created a version of network typology
using data of 259 elderly Russian-Jewish immigrants living in Israel. In this typology
construction, six variables were used to generate four distinct networks called the kin networks,
family-intensive networks, friend focused networks, and diffused networks. Most of these
typologies are often presented with challenges such as a high degree of inconclusiveness of
network type and misclassifications.
In the quest to address these challenges and increase the sensitivity of network typologies,
especially among ethnic minorities older adults living in multigenerational households, Burholt
and Dobbs (2014), developed a four-network typology. The establishment of this network
typology used data from 590 older South Asians living in multigenerational households in the
UK. The creation of these networks using nine network generation variables yielded the
following types: 1) multigenerational household-older integrated networks; 2)
multigenerational household-younger family networks; 3) family and friends networks; and 4)
non-kin restricted networks.
The categorisation of older adults into these social network typologies is predictable on socio-
demographic characteristics, physical health and other socio-economic factors (Knipscheer et
al., 1995; Wenger, 1994). For example, Fischer (1982) established that people with high
incomes and higher educational status tended to have large social networks compared to their

26
lower income, lower educated counterparts. Also, the prediction of individuals belonging to
these social networks could be linked to their marital status. Married older adults often have
larger social networks, while single older adults have small social networks (Knipscheer et al.,
1995). For physical health as a predictor in network typology classification, it has been
illustrated that reduction in physical health led to a reduction of network size (Newsom &
Schulz, 1996).
In order to aid in the classification of older adults into various social network types, specific
network measurement instruments have been created. Among these is the commonly used
Wenger Practitioners Assessment of Network Type (PANT) (Wenger, 1991; Wenger, 1994).
This was first developed in rural Wales in 1989 and validated in urban areas (Wenger, 1984).
Further modifications led to a simpler version comprising of eight distinct questions based on
the availability of close local kin (3 questions), the closeness of family, friends and neighbours
(3 questions), and level of interaction with community, voluntary and religious groups (2
questions) (Wenger, 1991; Wenger & Tucker, 2002).
1.3.5.1 The use of the Wenger PANT
The Wenger typology tool has been used extensively in both clinical and public health studies.
For example, it was used to identify network types of 51 older adults living in Sylhet,
Bangladesh, and Gwynedd, Wales (Burholt et al., 2000). The tool has also been used in India,
Nepal and China to identify older adults social network types (Burholt et al., 2003; Wenger &
Liu, 1999). Also, in the classification of migrant groups living in the UK, the tool has been used
to score network categorization of ethnic minority older adults. For example, the Wenger
typology tool was used to identify network types of 98 Bangladeshis living in London and
Liverpool (Burholt et al., 2000). In Dublin, Golden et al. (2009a), used the Wenger typology to

27
grade social networks of 1299 elderly men over the age of 65 years. In all these studies, the
Wenger typology produced a lower proportion of inconclusiveness of social networks of older
adults as compared to other network typologies. Additionally, the Wenger PANT has been
validated in many different populations (Burholt et al., 2000; Stephens et al., 2011; Szabo et
al., 2016; Thiyagarajan Jotheeswaran A., 2014; Wenger & Liu, 1999). The ease of use of the
Wenger typology in different geographical locations and ethnic groups, suggest its
appropriateness in the application of ethnic minority older adults living in the superdiverse city
of Birmingham.
Besides the Wenger PANT, other commonly used tools include the Litwin support network
typology, Burholt network typology questions and the Lubben support network scale (Burholt
& Dobbs, 2014; Lubben et al., 2006; Lubben & Gironda, 2004). The Lubben support network
scale is similar to the Wenger tool, as it contains easy-to-answer questions and thus could be
used to generate networks easily. Even though the Litwin support networks tool and the Burholt
support networks tool are specific to ethnic minority older adults, they require a complex
analysis of responses (e.g. Latent class analysis) to classify older adults network types (Burholt
& Dobbs, 2014; Litwin, 1995).
Despite the appropriateness and broad use of the Wenger typology in super-diverse
communities, Burholt and Dobbs (2014) suggested that the use of the Wenger typology tool in
older ethnic minorities living in multigenerational household fails to gauge the extent of social
support for individuals in these living arrangements. Studies have supported this, emphasising
that staying together in a multigenerational household or proximity of kin does not necessarily
mean social support is provided to the older members of the family (Berkman et al., 2000;
Burholt & Dobbs, 2014). Additionally, the Wenger PANT is limited in the assessment of

28
support received within a network as it fails to account for phone, internet and other modes of
communication either than the face-to-face contact. Hence it is appropriate for this tool to be
supplemented with additional questions (qualitative interviews) to account for these modes of
contact that might be providing informational support for older adults.
1.3.5.2 Social Networks on Health of Minority older adults
As previously stated, there are a limited number of studies exploring social network influences
on various components of the health of ethnic minority older adults living in the UK. The few
studies that have examined ethnic minority communities have found significant benefits to
health and wellbeing (Burholt, Dobbs, & Victor, 2018; Cook & Weigel, 1983; Kuo & Tsai,
1986; Prager, 1985). For instance, in Australia, it was found that social support networks
improved elderly Italians ‘help’-seeking behaviours (Roy & Hamilton, 1992). Similarly,
English minorities in Israel coped well with relocation as a result of social support networks
(Prager, 1985). Studies exploring the impact of social networks on specifically dietary
behaviours and physical function in ethnic minority older adults are rare.
Additionally, the abrupt and severely disruptive changes in social networks of older adults as
compared to younger individuals makes this an important area to explore. Older adults network
size is more likely to rapidly shrink than flourish, leading to the loss of support and
consequently negative impact on healthy ageing. These changes in network size might occur as
older adults undergo massive life course changes. These changes, as explained by the convoy
model of social networks, are mainly caused by situational and personal characteristics such as
retirement, ill-health, loss of a spouse, residential changes and other life events primarily
associated with ageing (Antonucci, Ajrouch, & Birditt, 2013; Cornwell, Laumann, & Schumm,
2008).

29
The social network profiles of community-dwelling ethnically diverse older adults vary
considerably to their white European counterparts. Studies have shown that the characteristics
of most ethnic minority groups are likely to have locally integrated or family support networks
or other network types with greater network size as opposed to their counterparts (Burholt &
Dobbs, 2014; Burholt et al., 2000; Litwin, 1995; Wenger, 1995). Burholt and colleagues’ study
of support networks of older Bangladeshis in London and Sylhet, reported that 54% and 34 %
of respondents in London and Sylhet, respectively, belonged to the locally integrated support
network, which had a higher network size and frequent contact with family, friends and
neighbours (Burholt et al., 2000).They also found that very few participants in these two
locations belonged to non-kin or private restricted network (A network with higher risk of
loneliness) Similarly, in the generation of a new network typology for multigenerational
households, Burholt and Dobbs found that only 18.1% of older adults belonged to the restricted
non-kin network (similar to Wenger’s private restricted network) (Burholt & Dobbs, 2014).
While this may be the case, other studies have also shown high prevalence of non-kin or
restricted networks among minority ethnic older adults, thus debunking the fact that all ethnic
minority older adults have robust networks and substantial informal support as compared to
their counterparts (Ajrouch, Antonucci, & Janevic, 2001; Barnes et al., 2004). For example, a
longitudinal study exploring social networks and engagement between black older adults and
white older adults aged 65 years and older in the United States (US) found that Blacks had
smaller social networks and engagements as compared to Whites over the study period (Barnes
et al., 2004). As such, it is important to explore the social networks of community-dwelling
ethnically diverse older adults and examine the influences of different social network typology
on healthy ageing.

30
1.3.6 Association of Nutrition and Social Networks on Physical Function
Healthy ageing is a multi-dimensional concept with a broad array of factors influencing it. As
depicted in figure 3, dietary intake influences physical function and vice versa in older adults
(Kimura et al., 2009; Kumagai et al., 2003; Rondanelli et al., 2016). Physical function declines
with age and so impacts on the quality of life, medical service use, institutionalisation and
mortality of older adults (Age UK, 2017; Beckett et al., 1996; Chou, Hwang, & Wu, 2012). As
demographic trends suggest an increase in the older population, it is necessary for studies to
explore factors influencing physical function and thus find interventions to curb the decline in
physical function with age. Given this, there has been little published evidence on the risk
factors of physical function decline in community-dwelling ethnically diverse older adults. The
limited studies published suggest that ethnic minority groups and older adults living in low
socio-economic environment often have low physical function as compared to their
counterparts in the same country (Louie & Ward, 2011; Williams et al., 2012).
Figure 3: Potential relationship between social networks, nutrition and physical function
Dietary intake and eating behaviors
• Energy intake and nutrient intake as compared to UK Dietary Reference Values
• Nutritional status and Body Mass Index
• Eating behaviors (Qualitative interviews)
Physical Function • Short Physical
Performance Battery (SPPB) score
• Handgrip strength
Social Networks • Local kin
• The frequency of contact with friends and neighbors
• Social integration of community and other voluntary groups

31
Furthermore, some studies exploring nutritional influences on physical function found positive
results suggesting that good nutritional health significantly improves the physical function of
community-dwelling older adults (Danielewicz, Barbosa, & Del Duca, 2014; Kimura et al.,
2009; Kumagai et al., 2003; Rondanelli et al., 2016). For example, Rondanelli and colleagues
(2016) in a double-blind, randomized controlled trial found that an individual dietary intake
coupled with exercise correlated with improved strength and functional abilities of sarcopenic
older adults. In addition, a 5-year longitudinal study (from 1992 to 1997) of 608 community-
dwelling older adults, found that adequate dietary intake (dietary variety) was associated with
a reduction in the risk of functional decline (Kumagai et al., 2003). To further support the
importance of good nutrition on physical function and quality of life, Kimura et al. (2009) found
that dietary diversity was closely linked to activities of daily living (functional capacity) in 689
community-dwelling older adults (65+ years). In summary, these studies suggest that the
improvement of dietary intake could significantly improve not only nutritional health, but can
consequently improve the physical function of community-dwelling older adults.
Besides the impact of nutrition on physical function, there are several studies that indicate that
good social networks are protective against physical functional decline, and at the same time
enhances adequate nutrition in later life (Avlund et al., 2004; Escobar-Bravo et al., 2012;
Mendes De Leon, Glass, & Berkman, 2003; Seeman, 2000). For instance, Escobar-Bravo, and
colleagues (2012) in a study of 1244 elderly Spanish individuals found that social networks
(active social life, the emotional support provided by friends and confidants) were protective
against the incidence and progression of disability. In a related study, it was discovered that the
social networks of 651 non-disabled community-dwelling older adults (75 years and older) were
highly associated with functional decline (disability) and mortality (Avlund et al., 2004). In

32
addition, this same study found that individuals with poorer social support networks had the
fastest decline in physical function and higher rates of mortality over time.
1.3.7 The interplay of nutrition, social networks, and physical heath on healthy ageing
While the argument surrounding the definitions and components of healthy or successful ageing
continue to linger, there is epidemiological evidence that supports the potential role of nutrition,
physical health and social networks as predictors of healthy ageing and mortality (Robinson et
al., 2013; Södergren, 2015; Sowa et al., 2016; Wannamethee et al., 2005). Healthy lifestyle
such as cessation of smoking, optimal nutrition and physical activity have been shown to
promote early recovery from diseases, higher quality of life and longevity in general (Robinson
et al., 2013; Vetter, 1999; Wannamethee et al., 2005).
Dietary intake and eating behaviours as independent variables have also been shown to
influence healthy ageing and mortality (Gopinath et al., 2014; Millen et al., 2005; Milte &
Mcnaughton, 2016; Trichopoulou et al., 2005). Adequate nutrition can also reduce the
occurrence of non-communicable diseases that are more prevalent in older age (Eriksen et al.,
2015; Lopez et al., 2006). In addition to this, physical activity behaviours have also been found
to influence the quality of life and longevity. The right amount of physical activity could be
protective against mental and non-communicable diseases, mobility and mortality. (Haveman-
Nies, De Groot, & Van Staveren, 2003; Sieverdes et al., 2012; Södergren, 2015). For example,
a multi-ethnic longitudinal study with 21 years of follow-up, found that poorer adherence to a
combination of healthy life choices (non-smoker, moderate alcohol intake, physically active
and frequent fruit and vegetable intake) was associated with an increased risk of cardiovascular
disease and coronary heart disease among 1090 Europeans and 1006 South Asians (40–69
years) (Eriksen et al., 2015). In addition to the findings of this study, the population attributable

33
fraction for CVD and CHD was almost twice as high in South Asians as compared to the
European cohort (Eriksen et al., 2015).
Besides these findings, the creation and maintenance of good social networks have been
similarly shown to improve healthy ageing and mortality (Fratiglioni, Paillard-Borg, &
Winblad, 2004; Hammond, 2010; Litwin, 1998). Good social networks do not only improve the
quality of life at this stage, but are often stated to have a continuous impact and significantly
predict health outcomes and mortality in later life (Fratiglioni et al., 2004; Hammond, 2010;
Litwin, 1998). Litwin and Shiovitz-Ezra (2006) in an analysis of 1997 national survey of adults
aged 60 and older (N=5,055), found that survival in later life is dependent on network type.
This study found that individuals with a poor social network type (restricted network) had a
high mortality rate as compared with individuals from the friend-focussed network or the
community-clan networks that had a lower risk of mortality. In a longitudinal study of 15-years
follow-up, a similar result was reported in that network type and size were protective against
the risk of premature mortality (Shye et al., 1995). Additionally, an international study of
13,891 older adults in eight developing countries discovered that individuals with integrated
social networks were more protected against premature all-cause mortality over three and half
years of follow-up as compared to those in restricted social networks (Santini et al., 2015).
Having emphasised the importance of nutrition, social networks, and physical function on
healthy ageing, there is the need to explore how these inter-relate in super-diverse communities
with different cultural views of healthy ageing. This study moves in this direction to create a
greater understanding of how these factors influence healthy ageing of community-dwelling,
ethnically diverse older adults living in Birmingham, UK.

34
1.4 The Study Rationale
As identified in this review, there is accumulating amount of evidence that suggests that social
networks, healthy dietary behaviours and physical function are potential indicators of an
individual’s overall health. There is also appropriate amount of evidence that demonstrates that
good social networks are associated with proper nutrition and the maintenance of optimum
physical function. Despite this, there is a paucity of literature examining the profile and
relationship of social networks, nutrition and physical function, particularly among ethnic
minority older adults. The increasing health inequalities and higher prevalence of diet related-
related non-communicable diseases in this group warrants a deeper understanding of the extent
to which each or the association of SN, nutritional intake and status and physical function
influences healthy ageing in super-diverse communities in the UK.
Considering the few studies that have explored social networks, diet and physical function in
community-dwelling older adults in the UK, this present study shares similar features with
them. For example, Castaneda-Gameros, Redwood, and Thompson (2018a) explored the
impact of dietary intake on frailty among 76 ethnically diverse older women living in super-
diverse communities in Birmingham. In this study, using a single 24-hour dietary recall, it was
found that physical function (frailty) was associated with the level of energy and nutrient intake.
Castaneda-Gameros and colleagues pointed out that among other things, dietary intake within
this sample was influenced by their cultural perceptions.
Besides this study, Bulholt and colleagues (2018) exploring the use of a new network typology
among 514 ethnic older minorities aged 55+ years living Birmingham reported that ethnic older
minorities with restricted Non-Kin networks were more prone to poorer health and loneliness
as compared to integrated networks (Burholt et al., 2018). Another study reported nutrients
intakes above the UK RNI in a sample of 39 African-Caribbean adults aged 19-65 years

35
(Earland et al., 2010). In the US, a study among ethnic minority populations aged 60 years and
older found that church attendance (frequency of contact with community members) was
associated with the total energy intake, fibre intake and obesity levels of participants (Phillips,
2006).
These studies share a common limitation of using a cross-sectional study design, which
prohibits a deeper insight to the extent to which social networks, nutrient intake and physical
function change overtime, and how these could have been related. In addition, some of these
studies had samples that were, on average, young to middle-aged, and were in some cases
studied as single ethnic minority group or gender, which makes it difficult to comprehensively
compare and understand how these factors differ among a heterogeneous older ethnic minority
population living in a super-diverse city like Birmingham.
Hence, unlike existing studies, this PhD research contributes to addressing these literature gaps,
by providing a more detailed longitudinal profile of dietary intake and eating behaviours over
an 8-month period by using a longitudinal concurrent mixed methods design. It also uniquely
explored the changes in social networks of community-dwelling ethnically diverse older adults
over the study period, and how these changes influenced their nutrient intake, eating behaviours
and physical function over the 8-month follow-up.
Furthermore, this study differed significantly from past research, by including both male and
female participants from the major ethnic minority groups living in super-diverse communities
to understand the potential differences in nutrient profiles by ethnicity and gender and ascertain
how these may influence healthy ageing in a super-diverse community. Also, as
gender/sexuality is reported as having a significant influence in behaviour modelling and a key
role in the success of health interventions, a good understanding of healthy ageing could help

36
design not only network specific interventions but gender-specific interventions within these
network groups (Liu et al., 2015).
As the population of ethnic minority groups continues to increase, so will the increase in
diversity of eating habits, food cultures and other lifestyle components among ethnic groups
and the general population (Khokhar et al., 2013). In view of this, it has become crucial for diet
assessment methods to be tailored to capture accurate data from ethnic minority groups
(Garduño‐Diaz et al., 2014; Ngo et al., 2009). As such, this study modified existing assessment
tools to make them culturally sensitive and less burdensome for participants. An already
validated 24-hour recall method was improved by using culturally recognised terms and using
a portion size booklet that contained clearer pictorial descriptions of many ethnic minority foods
consumed in the UK (Cheyette & Balolia, 2010). In addition to the generation of valuable data
from ethnic minorities, this study included strategies around building confidence with
participants and maintaining regular communication to improve on data quality and retention
of participants in the study (Garduño‐Diaz et al., 2014).
In summary, the increasing ethnic diversity, health inequalities, and the non-communicable
diseases among ethnic minority groups in the UK is concerning. It is therefore imperative to
explore in-depth the modifiers of choices of healthy lifestyle behaviours. That is, looking at the
barriers and facilitators that will enable the adoption of healthy lifestyle practices for healthy
ageing in these super-diverse communities. The findings reported in this PhD research will
contribute to a deeper understanding of the longitudinal patterns of social networks, dietary
intake and physical function among community-dwelling ethnically older adults living in super-
diverse communities. This information will aid the development of social network specific
interventions and policies to improve the ability of community ethnically diverse older adults

37
to make better lifestyle choices and promote healthy ageing.

38
CHAPTER 2
METHODOLOGY
The methodological approach of this longitudinal mixed methods study is described in this
chapter. First, the underpinning research philosophy of the methodology adopted to address the
research questions is discussed. This is followed by the description of the mixed research design
and the mixed methods approach. The rationale for the choices of methods utilised to collect
and analyse data to address the research questions are also described.
2.1 Philosophy of Research
A research paradigm simply refers to “the consensual set of beliefs and practice that guide a
field of study” (Morgan, 2007, p. 49). As beliefs and practices within the field of social science,
paradigms are essential to structure the research and can influence the belief of the nature of
reality (ontology), the nature of knowledge (epistemology), and lastly the manner in which
knowledge will be gathered (methodology) (Doyle, Brady, & Byrne, 2009; Teddlie &
Tashakkori, 2009). The research philosophy adopted plays a key role in influencing the
ontology, the epistemology and the methodology, thus influencing how the knowledge will be
generated (Gray, 2013; Neuman & Kreuger, 2003).
Mainly, there are three main philosophical positions adapted in the field of social and
behavioural sciences. These include the positivist, the anti-positivist and the pragmatic
positions (Doyle et al., 2009; Teddlie & Tashakkori, 2009). The next few sections will describe
these positions and the rationale for choosing the position that best fits the present PhD research.
2.1.1 Positivism
The positivist, as the foundation of quantitative research, believes that “facts speak for

39
themselves” (Bowling & Ebrahim, 2009). These thinkers believe true knowledge is based on
experience of senses and can be obtained either by observation or experiment. The approaches
associated with this paradigm are usually deductive and theory-driven (Teddlie & Tashakkori,
2009). As a means of knowledge generation for positivist, these thinkers are often associated
with realism (Flick, 2014). “the consequence of such a position is that social research is often
committed to ideas of measurement and objectivity, rather than reconstruction and
interpretation, thus the research situation is conceived as independent and separate from the
known and the knower, so that the “facts” can be collected in an objective way” (Flick, 2014).
To this end, these thinkers use only quantitative approaches to collect, analyse and present
findings (Doyle et al., 2009; Gelo, Braakmann, & Benetka, 2008). The positivist mode of
knowledge generation is often criticized as an impropriate/inadequate form to derive conclusive
findings as it often considers human behaviour to be influenced by only external factors without
considering the actions of the human beings themselves. They often see the human behaviour
as passive and controlled, which is far from reality (Doyle et al., 2009; Teddlie & Tashakkori,
2009).
2.1.2 Anti-positivism, Constructivist or the Naturalist ideology
Contrary to the positivist form of thinking is the anti-positivist, constructivist or the naturalist
ideology. As a foundation for qualitative research, they believe that social reality could only be
viewed and interpreted by the individual in that position (Doyle et al., 2009; Gelo et al., 2008).
They further argue that reality is seen as a multiple of complex layers and cannot be objectively
deduced (Cohen, Manion, & Morrison, 2013). Hence, the research conceived is dependent and
inseparable from the known and the knower (Doyle et al., 2009; Gelo et al., 2008). To this end,
this group of thinkers use qualitative approaches as the best means to collect, analyse and
present findings (Gelo et al., 2008). These thinkers are often criticized mainly on the fact that
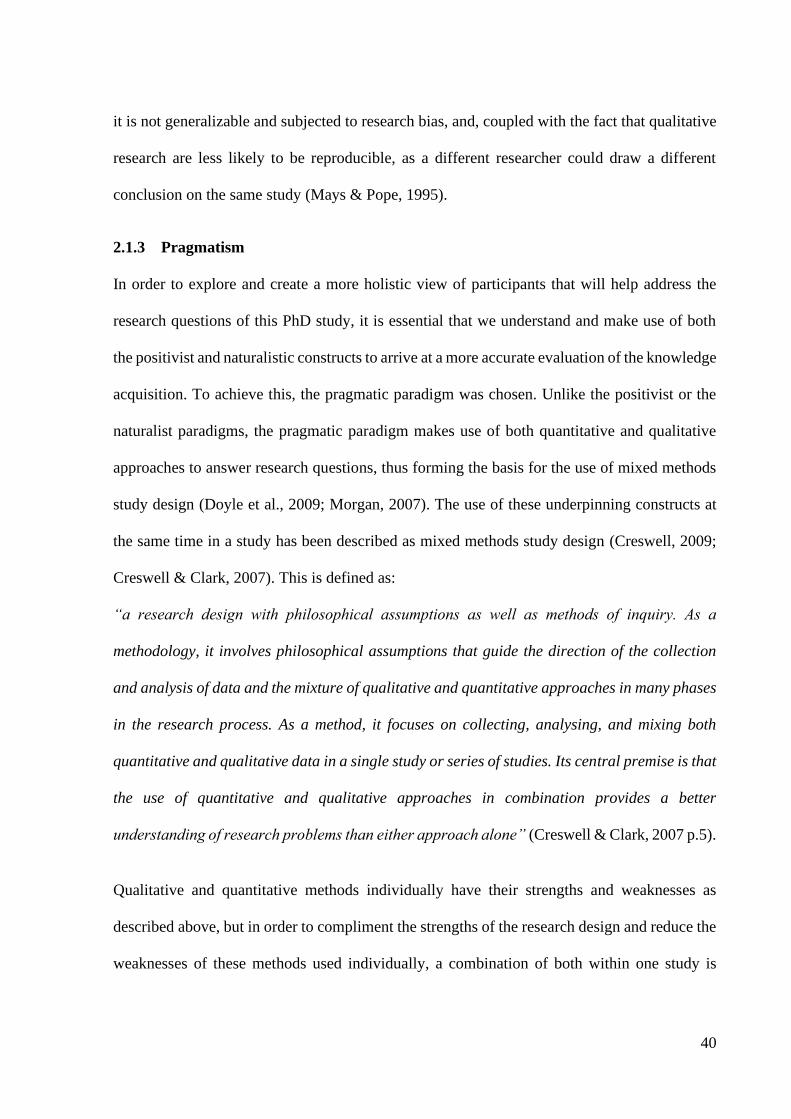
40
it is not generalizable and subjected to research bias, and, coupled with the fact that qualitative
research are less likely to be reproducible, as a different researcher could draw a different
conclusion on the same study (Mays & Pope, 1995).
2.1.3 Pragmatism
In order to explore and create a more holistic view of participants that will help address the
research questions of this PhD study, it is essential that we understand and make use of both
the positivist and naturalistic constructs to arrive at a more accurate evaluation of the knowledge
acquisition. To achieve this, the pragmatic paradigm was chosen. Unlike the positivist or the
naturalist paradigms, the pragmatic paradigm makes use of both quantitative and qualitative
approaches to answer research questions, thus forming the basis for the use of mixed methods
study design (Doyle et al., 2009; Morgan, 2007). The use of these underpinning constructs at
the same time in a study has been described as mixed methods study design (Creswell, 2009;
Creswell & Clark, 2007). This is defined as:
“a research design with philosophical assumptions as well as methods of inquiry. As a
methodology, it involves philosophical assumptions that guide the direction of the collection
and analysis of data and the mixture of qualitative and quantitative approaches in many phases
in the research process. As a method, it focuses on collecting, analysing, and mixing both
quantitative and qualitative data in a single study or series of studies. Its central premise is that
the use of quantitative and qualitative approaches in combination provides a better
understanding of research problems than either approach alone” (Creswell & Clark, 2007 p.5).
Qualitative and quantitative methods individually have their strengths and weaknesses as
described above, but in order to compliment the strengths of the research design and reduce the
weaknesses of these methods used individually, a combination of both within one study is

41
desirable as it allows for a holistic evaluation of all the research questions of the study, allowing
for the strengths of one to compliment the weaknesses of the other (Bryman, 2015; Creswell,
2009).
In this current research, a quantitative approach was chosen to examine the nutrient intake,
physical function and social networks of ethnically diverse older adults. This will partly
address some of the secondary research questions in this study:
• What is the profile of energy, macro- and micronutrient intakes in community-dwelling
ethnically diverse older adults?
• What are the changes in nutrient intakes, nutritional status and physical function over
an 8-month period?
• What are the social networks of ethnically diverse older adults over an 8-month period?
The qualitative approach was also chosen to explore eating behaviours, the influence of social
networks, and other key influences on dietary intake and physical function concurrently with
the quantitative evaluation. The qualitative approach at this stage will furthermore address the
remaining secondary research questions in the study:
• What are the perceptions of healthy eating and physical function among community-
dwelling, ethnically diverse older adults?
• What are the factors influencing eating behaviours and physical function in population?
• How do community-dwelling, ethnically diverse older adults perceive changes in
factors influencing eating behaviours and physical function over a period of 8-months?
• How do community-dwelling, ethnically diverse older adults perceive the influence of
variations in social networks on dietary intake, eating behaviours and physical function

42
over an 8-month period?
2.2 Study Design: Longitudinal Concurrent triangulation mixed methods design
This PhD research employed a longitudinal mixed method study design. The approach included
adapting already existing assessment methods to enable the measurement of dietary intake and
eating behaviours of community-dwelling ethnically diverse older adults at baseline and after
an 8-months follow-up. The rationale for choosing a longitudinal design was to enable the
exploration of any changes in dietary behaviours, physical function and social networks over
time, and their interactive effects. As a novel study, it was important to understand the possible
changes in dietary intake and physical function over time and most especially monitor the
changes in social networks and how this might influence eating behaviours and physical
function over time.
Given this longitudinal design, a mixed method concurrent triangulation approach was adopted
and considered appropriate, as it enabled the use of both quantitative and qualitative data to
more accurately explain the relationships of the variables of interest within the study (Castro et
al., 2010; Cresswell, 2003). The concurrent triangulation mixed method was also appropriate
as it allowed the researcher to explore at one phase of data collection the findings from both
qualitative and qualitative data to understand the research questions adequately. Unlike
concurrent nested designs, in this design, both quantitative and qualitative data collection were
given equal priority and resources (Cresswell, 2003). Given the uniqueness of the PhD study
population, data collection techniques were adapted to make the data collection process more
culturally appropriate and less burdensome on participants (Garduño‐Diaz et al., 2014). The
research design is illustrated in figure 5 below, detailing the qualitative and quantitative
measures and how the results were triangulated.

43
Figure 4: Integration of concurrent quantitative and qualitative methods (Mixed methods concurrent design concept)

44
2.3 Participants, Data collection and Analysis
The following sections will describe in detail the study participants, recruitment methods, data
collection procedures, and how data were analysed.
2.3.1 Participants and Recruitment
Recruitment was on a rolling basis and was designed to include participants that are ethnically
diverse, representing the major ethnic minorities in Birmingham: South Asians, Caribbean and
Africans. Recruitment was limited to these groups as they are well represented in Birmingham
and projected to rise substantially in the population in the coming years (Birmingham City
Council, 2011a; ONS, 2011; Simpson, 2007).
In this study, the age of 60 years and above was used to denote older adults in accordance with
previous studies that explored characteristics of migrants in the UK (Burholt, 2004b). The
rationale for choosing this age as a representation of older migrants in the UK within this study
stems from evidence that migrants in the UK have a lower life expectancy coupled with the
youthful age structure of ethnic minority population (Simpson, 2007; Burholt, 2004a, 2004b,
ONS, 2011; World Bank Group 2001). In addition to agreeing with this age range, Sin (2004),
argued that adult migrants are considered “older” at younger ages as compared to white
populations, since migrants are often faced with a combination of low socio-economic status,
poor living environments and health throughout life, which significantly contributes to
premature ageing.
To add to the age inclusion criteria, the study included community-dwelling older adults
identifying themselves as either being Black Caribbean, Black African, Indian, Pakistani or
Bangladeshi. Participants were permanent residents in the Birmingham area throughout the

45
duration of the study. Lastly, participants with no known diagnosis of dementia or any cognitive
disabilities which might affect their participation in the study were included.
Older adults who were institutionalized or hospitalised at the start of the study were excluded.
Also, individuals that were younger than 60 years, or were institutionalized during the study or
had medically diagnosed mental conditions such as dementia were excluded from partaking in,
or continuing with, the study.
As it is nearly impossible to recruit a representative sample of older adults via probability
sampling (Boneham et al., 1997), the study employed a number of non-probability sampling
techniques such as maximum variation and chain referral sampling to recruit participants across
the range of age, ethnicity, sex, religion/faith and socio-economic groups as reflective of the
ethnic minority population characteristics in Birmingham (Patton, 2002; Penrod et al., 2003;
Teddlie & Yu, 2007). This was guided by recent Birmingham census data and other relevant
literature (Birmingham City Council, 2011a; Simpson, 2007). Maximum variation sampling is
a form of purposive sampling where participants are selected across a wide spectrum relating
to the research questions the study seeks to answer (Patton; Teddlie & Yu, 2007). The objective
of using this technique was to create a more heterogeneous sample that will be characteristic of
community-dwelling ethnically diverse older adults living in Birmingham, UK (Birmingham
City Council, 2011a; Simpson, 2007). The traditional snowball technique was not used as it has
reported a likelihood of recruiting participants within the same network, thus preventing the
exploration of meaningful data from a wide range of social networks (Penrod et al., 2003).
In contrast to snowballing technique, chain referral sampling was used to gather data from
participants from varied social networks, hence expanding the scope of investigation and
enabling the researcher to test the relationships of variables of interest in different social

46
networks (Penrod et al., 2003; Teddlie & Yu, 2007). This type of sampling is often used in
qualitative studies involving hard to reach populations (Penrod et al., 2003; Suen, Huang, &
Lee, 2014).
Using these techniques, potential eligible participants were invited to take part in the study by
word of mouth. After the initial contact, participants were given the participant information
sheet detailing the purpose of the study and their involvement. Interested participants were
contacted after two weeks of receiving the participant information, to confirm interest and
provide informed consent before beginning participation in the study. Socio-demographic
characteristics of initial recruited participants (30 participants) were used to inform the
maximum variation strategy.
Participants were initially recruited through old age societies (Halesowen Asian Elders, Ward
End Asian Elders Welfare Association), faith/religious centres (churches, mosques and
Gurdwaras), community centres (West Bromwich Afro-Caribbean Centre, Kings Heath
Community Centre, Balsall Heath Community Centre), and other informal places. These places
of recruitment have been successful in recruiting ethnically diverse older adults in previous
studies (Burholt, 2004a; Burholt, Dobbs, & Victor, 2016; Castaneda-Gameros, Redwood, &
Thompson, 2017). These avenues of recruitment as compared to recruitment from General
Practice (GP) lists is reported to be more prudent and produces a closer representative sample
of ethnic groups than GP lists (Saunders et al., 1993; Sin, 2004).
2.3.2 Ethical Considerations
The study received approval of protocols by the University of Birmingham STEM committee
(ERN_17_1364). At the point of contact, participants had the opportunity to clarify anything
on the participant information sheet before agreeing to either take part in the study or not. All

47
participants signed a written informed consent sheet before the study could commence.
Recruited participants were also informed of the right to withdraw at any point from the study
without any reason or penalty. All data gathered from the participants within this study were
used to write up the thesis, with selected anonymised data shared with the research partners
within the Physical Activity and Nutrition INfluences In ageing (PANINI) research group,
within which the study was funded and sponsored.
2.3.3 Data Protection and Confidentiality
All data (questionnaires, 24-hr dietary recall data collection forms, interview transcripts and
audio-recordings) were kept in a locked filing cabinet in a locked office in the School of Sport,
Exercise and Rehabilitation Sciences (SportExR). In addition, the signed consent forms and
form linking the participant numeric ID with his/her personal information were stored in a
separate locked filing cabinet so that participants could not be identified.
With regards to electronic data (such as audio recordings, interview transcripts, databases, and
dietary intake data), all data were stored in a password-protected University computer and also
on an encrypted laptop. These documents were only accessible to the researcher and
supervisors. For confidentiality, all participants were immediately assigned a unique numeric
participant ID on the first day of contact (visit 1), and they were provided with details of how
the data would be protected and how their confidentially would be maintained.
2.4 Procedure and Phases of Data Collection
As one of the core components of this PhD was to make assessment tools and data collection
culturally sensitive and less participant burdensome, data collection visits were carried out at
times and places of convenience to participants, to make participants more comfortable and to
involve them more actively in the entire data collection process (Bassett, 2006; Bowling &

48
Ebrahim, 2009). After providing enough information about the study through the participant
information sheet and going through eligibility, most participants preferred their homes to
community centres or the University as places of meetings/assessments. At homes, most
interviews and assessments were done with the participant in a quiet space with little
interruption from family members. At the community centres, interviews were done in a private
room with the participant, separate from the community group activities. When data were
collected at the University, interviews and assessments were done in one of the quiet
laboratories and afterwards, participants were provided with hot drinks. The University’s lone
worker policy was adhered to during visits where the PhD researcher was alone; however, on a
number of occasions a second female researcher accompanied the PhD researcher to assist with
translation and to build rapport with female participants. Participant recruitment and subsequent
data collection took place from March 2017 to November 2018.
These data collection visits were structured into 2 phases scheduled 8 months apart, with each
phase having 2 visits. This was to provide time to gather sufficient data while also reducing the
burden of data collection on the participants. As most studies suggest a minimum of 14 days
apart for capturing consistent and habitual dietary intake (Dodd et al., 2006; Hoffmann et al.,
2002), a schedule of 14 days (2 weeks) between each visit within each phase was followed.
Figure 5 illustrates the details of the phases of data collection and the timelines within the study.
2.4.1 Phase 1 (Quantitative and Qualitative data)
In phase 1, visit 1 involved collection of demographic data using a questionnaire, dietary
assessment using multiple pass 24-hour recall, measurement of social networks using the
Wenger Practitioner Assessment of Network Type (PANT) and measurement of physical
function, and other anthropometric measurements. Additional questionnaires such as Mini-

49
Nutritional Assessment-Short Form (MNA-SF) and Katz Activities of Daily Living (ADL)
were also administered at this visit.
The second visit within phase 1 involved the second dietary assessment, again using the
multiple pass 24-hour recall plus an in-depth qualitative interview exploring eating behaviours,
physical function and the influences of social networks on eating behaviours and physical
function.
2.4.2 Phase 2 (Quantitative and Qualitative data)
In phase 2, the 3rd visit was similar to visit 2 of phase 1 as dietary intake was assessed again
using the multiple pass 24-hour recall, and afterwards an in-depth qualitative interview was
conducted to understanding eating behaviours and the changes in eating behaviours over the 8-
month period. This interview also explored the influences of social networks over time and the
changes in social networks over this time. The last visit in phase 2 and in the entire data
collection visits was the visit 4. Unlike any other visit, cognitive function was assessed in visit
4 using the Standardized Mini-Mental State Examination (SMMSE). Again, dietary assessment,
anthropometric and other physical function measures as carried out in visit 1 were repeated at
this visit.
Visit 1 and 4 lasted approximately 120 minutes while visit 2 and 3 lasted approximately 90
minutes. Considering the mixed literacy/educational levels within this population, all
questionnaires were administered by the researcher to enhance the quality of responses and to
avoid skipping questions.

50
Phase 1
Phase 2
Figure 5: Flow chart summarising the data collection phases and visits over the 8-month
period.
A participant tracker was also designed to track the amount of data collected per each
participant at each time point and for data completeness check to ensure all necessary data were
collected from all participants at the right time.
2.5 Measures and tools of data collection for phase 1 and phase 2
This section describes all the measurements and tools used in data collection for the entire study.
2.5.1 Socio-demographic and Socio-economic questionnaire
Using a simplified questionnaire, all demographic data were collected via self-report.
Demographic data included sex, religion, ethnicity, living arrangements, age, country of birth,
length of stay in the UK, alcohol intake, smoking and marital status. This questionnaire also
1st Visit
*24 hour dietary recall
*Demographic data and weight,
height and SPPB score, hand
grip, MNA-SF, Katz index
2nd Visit (Within 14 days
after Visit 1
*24 hour dietary recall
*Social networks (SN) and
eating behaviours qualitative
assessment
4th Visit (Within 14 days
after Visit 3
*24 hour dietary recall
*All measures in visit 1 will be
repeated
8 Months
(Participants
were contacted
during this
period to
arrange visit 3 3rd Visit
*24 hour dietary recall
*Qualitative interview on
eating behaviours with
changes in SN

51
captured participants’ postcodes which were used to generate the Index of Multiple Deprivation
(IMD), an indicator of the level of deprivation across all of England (Communities and Local
Government, 2015). In addition, all diagnosed medical conditions and current medications used
were collected using this form. This questionnaire was denoted as form 1 (Appendix D3).
2.5.2 Dietary Assessment
As illustrated above, each participant’s dietary information including food intake and eating
behaviours were collected at 4 different time points using the multiple pass 24-hour recall, and
supplemented with an interview to capture additional information on eating behaviours at each
of these visits to ensure the accuracy of the 24-hour recall.
The multiple pass 24-hour dietary recall was chosen as a preferred form of dietary assessment
as it has by far been considered the most accurate and often used tool to measure dietary
information among community-dwelling ethnically diverse populations (Garduño‐Diaz et al.,
2014; Holmes, Dick, & Nelson, 2008; Ngo et al., 2009). It is rapid and user-friendly with less
participant burden while ensuring keen participant interest in the process (Efsa, 2009;
Thompson & Byers, 1994). It also requires less reliance on individual’s memory, as the
participant only recalls all foods and drinks consumed in the immediate past 24 hours
(Thompson & Byers, 1994). In the validation of the 24-hour recall as compared to the FFQ in
older adults aged 85 years and older, the 24-hour recall was found to be more appropriate as it
yielded more realistic energy and nutrient intakes with fewer errors (Adamson et al., 2009).
At each of the visits, the multiple pass 24-hour recall was performed using standard procedures
(Adamson et al., 2009). To improve data accuracy and also to allow prompts to capture food
behaviours and meal preparations, all 24-hour recalls were conducted face-to-face and audio
recorded. In addition, as the primary aim of this study was to modify methods to be culturally

52
appropriate, a full-colour food portion booklet that contains over 1,700 ethnically diverse foods
eaten in the UK was used in the portion size estimations (Cheyette & Balolia, 2010). As this
portion size booklet contained traditional foods that are mostly eaten together, it provided useful
insights for the researcher to make relevant prompts to capture most commonly forgotten foods
during the multiple pass 24-hour recall interviews.
To finish up the multiple pass 24-hour recall interviews, participants were asked to describe
how different that day’s food and drink consumption was from the rest of the days of the week.
This was done to determine how close the captured dietary intake was from the rest of the days
of the given week. In instances that a participant indicated that they had fasted or had eaten
substantially differently than usual, that day’s dietary record was discarded, and a new 24-hour
recall interview was scheduled. Also, the use and rationale for the use of supplements were
captured during the multiple pass 24-hour recall. Brand names, dosage and frequency of use of
these supplements were also gathered (See Appendix D8).
The four multiple pass 24-hour recalls per participant were conducted on four non-consecutive
days, most including one weekend day (Sunday) and three (3) weekdays (see Figure 5).
Following the recommendation of the European Food Safety Authority (EFSA) on assessing
dietary intakes, it is recommended that dietary assessments done on 2 non-consecutive days is
more reflective of participants’ habitual dietary intake, thus reducing day-day variability in
dietary intake (EFSA, 2009; Garduño‐Diaz et al., 2014). A review of dietary statistics also
argued that at least 2 non-consecutive days of multiple pass 24-hour recall is needed to estimate
habitual dietary intakes (Dodd et al., 2006). Additionally, Hoffman and colleagues provided
evidence that shows that multiple pass 24-hour recalls collected on 2 non-consecutive days can
represent an individual’s habitual dietary intake (Hoffmann et al., 2002). Given this evidence,

53
2 non-consecutive days of multiple pass 24-hour recalls were collected each in phase 1 and
phase 2. These 2 non-consecutive days of dietary assessments were carried out within a 2-week
period (within 14 days).
After each visit, the multiple pass 24-hour recall data was checked for accuracy using the audio
information taken during dietary assessment before entering these data into a dietary software
analysis package, Dietplan 7.0 (Forestfield Software Ltd. Horsham, UK) for processing.
2.5.3 Measurement of Social Networks
The Wenger Practitioner Assessment of Network Type (PANT) was used to measure social
networks as it is easy to administer and has been used in previous studies within ethnic
minority populations to measure social networks (Burholt et al., 2000; Burholt et al., 2003;
Wenger & Liu, 1999). This tool was adapted by incorporating some questions from the
Burhort network typology tool for multigenerational households (Burholt & Dobbs, 2014).
Using the PANT and these supplementary questions, participants were classified into 5 distinct
typologies of social networks based mainly on the availability of close local kin (3 questions),
closeness of family, friends and neighbours (3 questions), and level of interaction with
community, voluntary and religious groups (2 questions) (Wenger, 1991). This tool has been
widely used and is well-validated (Szabo et al., 2016; Thiyagarajan Jotheeswaran A., 2014;
Wenger, 1994). It has also been used in previous studies in the UK, Bangladesh and other parts
of Europe and has yielded successful outcomes in the assessment of social networks (Burholt
et al., 2000; Burholt et al., 2003; Golden et al., 2009a; Golden, Conroy, & Lawlor, 2009).
The tool identifies 5 network types: the family dependent, the local integrated, the local self-
contained, the wider community focussed, and the private restricted networks. This form was
represented as form 5 (see Appendix D7).

54
2.5.4 Anthropometric Data
The weight and height of each participant were measured to the nearest 0.01kg and 0.1cm,
respectively, at two separate visits, visits 1 and 4 (see figure 5 above). Weight was measured
using the Secca 899 digital scale following standard techniques with participants wearing light
clothing and no shoes (Lee & Nieman, 1993). Height was measured using a Seca 213 portable
stadiometer and following standard techniques, with participants wearing no shoes and with
minimal headgear (Lee & Nieman, 1993).
The scales were standardised at baseline and at regular intervals throughout data collection
using a known weight. The body mass index (BMI) was calculated using the values obtained
for height and weight per the standard equation: weight by height squared to the nearest 0.1
kg/m.2 Pakistani, Indian and Bangladeshi participants’ BMI were classified using the WHO
BMI cut-points for Asian populations, while the standard WHO BMI cut-points were used for
African and Caribbean participants (WHO, 2004).
Table 4: BMI cut-off for ethnic minority populations
Classification BMI(kg/m2)
Standard cut-off points Additional cut-off points (e.g.
South Asian population)
Underweight <18.5 <18.5
Normal 18.5-24.99 18.5-22.99
Overweight ≥25.00 ≥23
Source: Adapted from WHO, 2004
Waist circumference was measured and recorded to the nearest 0.01cm using a flexible
retractable non-elastic tape, following standard techniques (Gibson, 2005) at two-time points
as indicated in figure 5 above. The tape was placed between the iliac crest and the lowest rib
margin and readings were taken after the end of expiration.

55
At each measurement time point, all measurements were taken two times to reduce
measurement error. In some cases, where these two readings were more than 0.5 cm or kg
different, a third reading was taken and the average of the two closest measures was used as the
final data point.
2.5.5 Nutritional Status
Participants’ nutritional status was assessed using the Mini-Nutritional Assessment-Short Form
(MNA-SF) (Appendix D5). This is a simple to use, sensitive and reliably validated tool for
rapid assessment of nutritional status of older adults (Vellas et al., 1999). Unlike the full MNA,
the short form has proved to be more rapid and equally reliable to the full MNA (Cuervo et al.,
2009; Rubenstein et al., 2001).
The MNA-SF is composed of six major items and has a scoring of 0-14 points, with 0-7
classified as malnourished, 8-11 classified as at risk of malnutrition, and 12-14 classified as
normal (Rubenstein et al., 2001). The MNA-SF can be completed within 10 minutes; hence it
was the preferred option to assess nutritional status as it reduces participant burden in the entire
data collection procedure. Besides this, most of the information on the full MNA such as dietary
information was being collected using the multiple pass 24-hour recall, hence the need for the
short version.
To complement the MNA-SF in assessing nutritional status, waist-to-height ratio was
calculated as waist circumference in cm divided by height in cm. As an accurate proxy indicator
of central adiposity, it has been proven to be a better indicator of nutritional status than BMI
alone across different populations (Ashwell & Hsieh, 2005; Gibson, 2005).

56
2.5.6 Physical Function
In this study, functional tests were performed either via self-report or by objective measures
using validated tools. Three different measures of physical function were carried out, the Short
Physical Performance Battery (SPPB), Hand Grip Strength (HGS) and the Katz Activities of
Daily Living (ADL). The SPPB and HGS formed the two objective measures of physical
function, and the Katz-ADL was the subjective measure of physical function. These are shown
in figure 6 below.
Figure 6: Perceived and measured physical functional status
2.5.6.1 Short Physical Performance Battery (SPPB)
Short Physical Performance Battery (SPPB) is a validated and reliable tool comprising a group
of measures used to ascertain and monitor older adults’ lower body extremity function (Gómez
et al., 2013; Guralnik et al., 2000; Guralnik et al., 1994). These measures include gait speed,
Objective
Subjective
Physical Function
Katz-ADL SPPB Handgrip

57
balance and the time taken to perform repeated chair rises (Guralnik et al., 1994). The gait speed
involves the measurement of the time taken for the participant to walk 4 metres on a straight
line unaided. The balance test includes the ability of the participant to maintain balance in 3
separate standing positions lasting 10 seconds each, the side-by-side, the semi-tandem and the
tandem positions. Lastly, the repeated chair rise involves the ability of the participant to sit up
and return to the chair 5 times as quickly as possible (Guralnik et al., 1994) (Figure 7). The total
achievable score is 12, a score 0 indicates worst performance while a score 12 indicates best
performance. A score of less than 7 indicates high risk for frailty and poor health outcomes.
Figure 7: Image of the measures of SPPB assessing lower body physical function (Guralnik et
al., 1994).

58
2.5.6.2 Handgrip Strength (HGS)
HGS was measured in kilogram (Kg) using a Jamar hand dynamometer per the NHANES
protocol for measuring handgrip in the standing position (CDC, 2011). Using this protocol,
handgrip strength was measured using participants’ dominant hand in a standing position, with
the elbow straight and fully extended at the side, and with head straight and participant looking
forward. Each measurement was done three times, with the highest value used for analyses. The
standing position was chosen as it has been shown to produce maximal grip strengths as
compared to the other positions in measuring HGS (El-Sais & Mohammad, 2014). During all
measurements, the Jamar handgrip dynamometer was adjusted to the second handle as this has
also been shown to produced maximal handgrip strengths with consistent and reliable results
(Roberts et al., 2011).
HGS measurements were done at baseline and repeated at the 8-months follow up. The hand
used during baseline measurement was noted and participants were reminded to used that same
hand again at the 8-month follow period to ensure consistency in measurement.
2.5.6.3 Activities of Daily Living (ADL)
Activities of Daily Living (ADL) was undertaken using a self-administered questionnaire, the
Katz Activities of Daily Living (ADL) questionnaire at baseline and at the 8-month follow-up
visit (See Appendix D6). This is a simple and quick functional tool used to assess the ability to
carry out basic activities of daily living among the elderly population. It is often used as a
screening tool to pave the way for a detailed physical function assessment of older adults who
are beginning to lose their physical ability. This tool scores ability of independence to perform
daily activities in 6 separate functions, including bathing, dressing, toileting, transferring,
continence and feeding (Katz et al., 1970). Each of these questions is answered yes or no, and

59
a total score of 6 designates full function, a score of 4 implies moderate impairment and a score
less than 2 implies severe functional impairment (Wallace & Shelkey, 2007).
As some of the questions within this form were very personal and might be uncomfortable for
some participants to answer, a culturally sensitive approach was used to make this process less
uncomfortable. This was done by engaging participants in a form of conversation and the
answers derived from these questions in the conversation and then use to complete this form.
This made it more comfortable as the participants described their activities that they could carry
out in a day with or without help.
2.5.7 Semi-structured interviews and the use of interpreters
As described above, two different face-to-face qualitative interviews were conducted
throughout the study, one at the second visit of phase 1 and the other at the last visit of phase 2
(see figure 5). Responsive interviewing techniques were used to enhance adequate participation
and trust of participants in the interviewing process. Rubin and Rubin described responsive
interviewing as:
“a style of qualitative interviewing that emphasises the importance of building a relationship
of trust between the interviewer and the interviewee that leads to more give and take in a
conversation. The pattern of questioning is flexible; questions evolve in response to what the
interviewees have just said, and new questions are designed to tap the experience and
knowledge of each interviewee.’’ (Rubin and Rubin, 2012, p.37).
Using a semi-structured questionnaire, the interview was divided into 4 different sections,
introduction, eating behaviour, physical function and social network questions (See appendix
D9). All these sections aimed at exploring current and past dietary and physical activity
behaviours, and also the social networks and other key influences on these behaviours. A semi-
structured questionnaire was determined to be the most appropriate tool as compared to the

60
other forms of interviewing, as it allows the researcher to guide the interviews and steer the
discussion towards relevant areas that will yield responses geared towards answering the
research questions (Bryman, 2015).
During interviews, an open-ended guide was used to start up the discussion on the participant’s
perceptions of healthy eating and physical function, and influences of social networks and other
key influences on eating behaviours and physical function. The use of this guide allowed for
flexibility, providing participants with the opportunity to contribute to the discussion naturally
(Gill et al., 2008). To facilitate comprehensive discussion of these topics, relevant probes were
used along the interview while bearing in mind culturally sensitive areas. Interviews range from
20-110 minutes in duration. All interviews were transcribed verbatim.
As described in section 2.7, participants were asked to choose the place and time of
convenience for interviews and assessments, ensuring participants felt comfortable and safe to
engage fully in the interviews (Bowling and Ebrahim, 2009; Bassett, 2006). Most interviews
and all other assessments were carried out at a participant’s home. Participants that were
recruited from age-well societies at community centres preferred the community centres to their
homes, as these places were their weekly meeting place. At the community centre, a separate
room or private area of a larger room was designated for assessments and interviews, giving
privacy to participants. Only 4 participants chose to come to the University for both assessments
and interviews. At the University, a quiet laboratory space was used.
Considering the poor English literacy levels of the some of the targeted participants and the
under-representation of these group of participants in research (Murray & Wynne, 2001), the
services of trained interpreters were employed to enable us to gather valuable data from these
participants. These trained interpreters were initially taken through the scope of the

61
questionnaires and the major sections of the qualitative interview guide to become familiarised
with the questions to be ask before the interviews and assessments. In doing this, some of the
words/ phrases that did not have direct translations in the local language were then rephrased
in the local language to allow participants to understand the concepts being explored, while
keeping the meaning of the word/phrase intact. Also, some of these interpreters also supported
recruitment of participants from the community and faith centres.
During interviews involving participants with limited English literacy, these interpreters
translated the questions in either Twi, Punjabi, Urdu, Gujarati or Bengali to the participants,
and the responses from participants were translated again from these languages back to English
for the PhD student researcher. All interviews were audio-recorded.
2.5.8 The Conceptual model guiding Qualitative interviews
A theory is defined as a “set of interrelated constructs (concepts), definitions, and propositions
that present a systematic view of phenomena by specifying relations among variables, with the
purpose of explaining and predicting phenomena” (Kerlinger, 1986, p. 9). An accumulative
amount of evidence has helped us to understand that healthy lifestyle activities such as healthy
eating and physical activity behaviours are influenced by a wide range of factors, including the
influence of the external environmental factors and that of personal factors (French, And, &
Jeffery, 2001). To aid in understanding more about these factors and their influences in relation
to healthy eating among ethnically diverse older adults, the PhD researcher adopted the model
of Story and colleagues (2008) to conceptualize and explore how these factors play a role in
influencing dietary and physical activity choices among ethnically diverse older adults living
within the Birmingham area (Story et al., 2008). Using this model, an enhanced understanding

62
could be gained particularly about the relationships between social networks and nutrient intake
and physical function within this population.
This model best fits this study as it explores multiple factors influencing eating behaviours, that
is from the personal level, to the social networks level, to the level of the immediate
environment and lastly to the macro-level environmental influences consisting of policies and
interventions (Story et al., 2008). Figure 8 depicts the adapted ecological framework of
influences to an individual eating behaviours and physical function.
According to Story and colleagues (2008), the first level of influence is attributed to personal-
level factors mainly the individual cognition, biological and demographic factors and other
behaviours. These could be manifested through the individual food attitudes, beliefs,
motivations and knowledge. The second level of influence within this model has to do with the
impact of social networks. This involves the social ties of the individual including family,
friends and the community social ties and how these intend influence the individual’s food
choices, norms, beliefs and knowledge over time (Story et al., 2008).
Beyond this social environment is that of the physical environment that plays a crucial role in
shaping the eating and physical function behaviours of an individual. This physical environment
is comprised of the settings where the individual purchases food or where the individual eats
(eating out), that is the barriers and opportunities within the community that can either promote
or hinder healthy eating or good physical activity behaviours. One example of this as described
in figure 8 is the availability and proximity of fast foods, local/traditional food stores or other
grocery stores. After the physical environment is that of the macro-environment, sometimes
described as ‘upstream’ factors. These factors, even though often labelled to play a distal and
indirect role, can have significant influences on an individual’s eating behaviours and physical

63
function. These factors may include policies and interventions regarding the marketing and
pricing of certain foods (Story et al., 2008).
This model, coupled with the use of relevant literature, was used to design the semi-structured
schedule for the interviews (Babakus & Thompson, 2012; Castaneda-Gameros et al., 2017;
Emadian & Thompson, 2017). The developed semi-structured interview schedule was pilot-
tested with eight participants, with revisions made based on this pilot-testing. Via an iterative
process, this interview schedule was further amended during the data collection process to make
it more suitable to capture relevant responses to address the research questions.

64
Figure 8: Adapted Ecological model depicting the influences of eating behaviours among
minority older adults (Story et al., 2008).
2.6 Techniques employed to increase Participant Commitment, Data accuracy and reduce
drop out
Considering the complexity of the targeted population, several techniques were employed to
recruit and obtain quality data, and also to reduce the drop-outs across the follow-up period.
Firstly, adopting insights from (Garduño‐Diaz et al., 2014), the PhD researcher established an
initial contact with community leaders and potential participants prior to the start of the study.
Social Network influences
(family, friends and
community
Physical Environments: Access,
availability, barriers and opportunities E.g
Proximity of parks or local stores
Personal influences
(Demographic and
Biological)
Macro-level Environment- Policies and Interventions
pertaining to healthy eating and Physical activity

65
This involved attending church services and other faith organization’s public events to get to
know potential participants and vice-versa. This was to build strong rapport and to increase
trust.
Secondly, during the initial meetings with community leaders asking for permission to recruit
from their organizations, the researcher encouraged the leaders who met the inclusion criteria
to partake in the study. The participation of these leaders was an encouragement for other
members to join the study, acting as role models. Again, the participation of the leaders also
served as a message that the study was genuine with all data collected solely for research
purposes.
Thirdly, like other studies within this population, it is found that constant communication and
incentives improve data collection (Garduño‐Diaz et al., 2014). As such, the researcher
maintained constant communication coupled with incentives by sending out research branded
seasonal greeting cards (birthdays, Ramadan, Christmas cards etc.). Participants were also
invited for two PANINI public engagement events at the University, where other researchers
working under the PANINI research network showcased their work to the public. At this event,
participants were given souvenirs such as branded shopping bags, pens and stress balls. Also,
to show gratitude at the end of the study (at the final visit of data collection), all participants
received PANINI branded shopping bags and mugs. All these factors may have increased
participant’s commitment, quality of data and reduced the drop-out rate.
2.7 Data synthesis and analysis
In this study, data synthesis and analysis were done concurrently with data collection. This
allows the improvement of the data collection process, tools and approach in subsequent
interviews (Pope, Ziebland, & Mays, 2000). It also allows the researcher to modify strategies

66
of gathering useful data in subsequent interviews that might have been omitted in previous
interviews to help answer all relevant research questions (Pope et al., 2000). Details of both
quantitative and qualitative data synthesis and analysis are described below.
2.7.1 Quantitative data analysis
Dietary information collected using the 24-hour recall was entered into Dietplan 7 (Forestfield
software Ltd. Horsham, UK). This software contains databases of single foods (e.g. Weetabix)
or information on complete dishes (e.g. Pakistani chicken curry) that could be easily selected
and entered using the estimated portion sizes described by the participant from the food portion
booklet.
Foods were entered using the already existing databases contained within the software. Also,
the ethnic minority food databases such as the South Asian foods were selected to give a wide
database of foods for complete data entry and analyses. This software allows for the addition
of other foods to the database, hence, some foods that were not found in all list of databases
contained within the software were manually entered using the nutritional information found
on the nutritional labelling of the package of the product. As each food item on the databases
could have different versions within the same software, a collection of all single or complete
dishes previously entered were kept in an Excel document and used for future data entries to
maintain consistency throughout the data entry process.
After entering all data, analyses were done within Dietplan 7 to calculate the energy, macro-
and micro-nutrient intakes of reported foods eaten by participants. These were then exported to
Statistical Package for the Social Sciences (SPSS) software for further analyses.
All other quantitative data including anthropometric and physical function data were entered
into an Excel worksheet after each data collection session. After completion of data collection,
67
all information on this worksheet were imported into SPSS for statistical analyses.
Descriptive statistics (means, standard deviations, and percentages) were carried out for the
socio-demographic variables. Using multiple logistic regression analysis, the association
between varying physical function, social networks and nutritional status compared with
various socio-demographic variables were tested. Independent t-test was used to compare any
differences of demographic variables in the main sample. Also, t-test was used to compare
significant differences in social network typology and nutritional status of baseline data and the
8-month follow up visits. Similarly, using t-test, differences between social networks and
physical function of participants was generated at these two-time points. Linear and
multinomial regression were also performed to ascertain the associations between variables of
interest. All statistical analyses were conducted using a statistical software package IBM SPSS
version 23 (IBM Corp, Armonk, NY, 2012). The p-value for significance was set at p<0.05.
2.7.2 Qualitative data analysis
As stated earlier, qualitative interviews were transcribed verbatim during the course of the data
collection. These interviews were then transported to QSR NVivo 12 Plus software for
reorganising and coding using the directed content analysis approach (Elo & Kyngäs, 2008;
Hsieh & Shannon, 2005; Qsr International, 2012).
Content analysis involves subjective interpretation of data using a systematic process of coding
and organising codes into categories or concepts (Hsieh & Shannon, 2005). As this form of
analysis focuses on the contextual meaning of the text (Budd, Thorp, & Donohew, 1967;
Lindkvist, 1981; McTavish & Pirro, 1990; Tesch, 1990) and the flexibility of use (Harwood &
Garry, 2003), it was considered the most appropriate method to analyse the detailed key

68
influences to eating behaviours and the impact of social networks on eating behaviours and
physical function within this population. Also, the use of directed content analysis has been
described to be the best fit for studies that have pre-existing research on the phenomenon that
is being tested (Hsieh & Shannon, 2005). In this case, there have been previous research studies
examining various influences on physical activity and dietary behaviours among ethnic
minority women (Babakus & Thompson, 2012) and men (Emadian & Thompson, 2017).
The process of directed content analysis as described by Hsieh and Shannon, (2005) is similar
to that of deductive content analysis described by Elo & Kyngas (2000). Using the process of
content analysis described by Elo & Kyngas (2000), the first step is the preparation phase. In
this phase, the main purpose was to become familiar with the data by reading and re-reading
the transcripts and field notes. This was to gain an initial understanding of the direction of the
content of the transcripts (Elo & Kyngas 2000) and the field notes. After this process, two main
coding matrices were developed, one on the social network and other key influences to eating
behaviours and the other on physical function (See figure 9 and 11). These coding matrices
were developed using existing relevant literature and insights from Story and colleagues (2008)
model that focuses on the key influences to eating behaviours and physical function (Babakus
& Thompson, 2012; Castaneda-Gameros et al., 2017; Emadian & Thompson, 2017).
The next step was to categorise the data deductively using the developed coding matrices as a
guide (Elo & Kyngäs, 2008). Acting as a translational device or scheme, the coding matrices
helped to systematically sort (code) all the transcripts into the identified categories on the
matrices (Elo & Kyngäs, 2008; Poole & Folger, 1981). As an iterative process, new categories
were assigned to emerging data that did not fit into the existing categories within the matrices
and other categories without data were also taken out in the process.

69
Figure 9: Complete coding matrix on eating behaviours
Perception of healthy
eating
Eatingbehaviours
Enjoyment at meal
times
Meal choice,
preparation and
shopping
Description of
healthy eating
Perception of
diet adequacy
Influences of
health advice and
current health
conditions
Geographical and
cultural factors
Social networks and
living arrangements
Household
Characteristics
Ease of food
preparation and
presentation of
food
Access and
affordability of
traditional foods
Gender and
GenerationFaith
Cultural
beliefs, values
and attitude
Living within
an ethnic
minority
neighbourhood
Frequency of
contact and
Network size
Qualityofrelationships/ties
Living alone or
with Family
Company during
meal times

70
Once the final coding matrices were revised and agreed by the research and academic team, all
data were revisited and coded appropriately under the main and sub-categories within each
matrix (Elo & Kyngäs, 2008). Reporting the data within these categories in a manner that will
answer the research questions of the study was the final step in the directed content analysis
(Elo & Kyngäs, 2008).
Eatingbehaviours
Meal choice, preparation
and shopping
Influences of health advice
and current health conditions
Ease of food
preparation and
presentation of
food
Access and
affordability of
traditional foods
MainCategory
GenericCategory
Sub-Category
Figure 10: Section of coding matrix on eating behaviours

71
Physicalfunction
Perceptionofphysicalfunction(PF)
SubjectiveviewofPFandpersonaldegreeofPF
Factorsattributableto
Family/friends/community
(Socialinfluences)
PhysicalEnvironment
Factorsattributabletooneself
(personalinfluences)
ImportanceofPFtogeneralhealth
EnablersBarriers
Barriers BarriersEnablers
Living arrangements
and Social networksNutritionalstatusandgeneralhealth
WillPowerSelf-
motivationtobehealthy
PApreferences/attitudestowardsPA
Pain
Otherexternal
motivationGroup
activities
Supportfromfamilyandfriends
Ill-health Weather
Proximityof
recreationalparks
Badweather/snow/rain
Cultural/traditionalnorms
Poorsocialnetworks
Age
Tirednessandpoorphysicalfunction
Enablers
Familyandfriendsnon-
interestinphysicalactivities
Accesstofacilities/amenitiese.g.gyms,Parks
Safetyofthe
environmente.g.highrateofcrime
Figure 11: Coding matrix on Physical Function

72
Figure 12: Section of coding matrix on physical function
2.8 Reflexivity
Having explored the research paradigm, the key objectives of this PhD research, and what and
how the data collection was carried out, it is important to discuss my background, perspectives
and assumptions that might have influenced knowledge generation and the arrival of key
findings in this study (Pope & Mays, 2009). As such, this section of the thesis is written in first
person.
I am a trained nutritionist, with experience in community health management of maternal and
child health nutrition. In the past, I have worked as a District Nutrition Officer (DNO) with the
Ghana Health Service (GHS), as part of a District Health Management Team (DHMT). In this
role, I led the design, implementation and evaluation of community nutrition interventions
geared towards reducing maternal and child health nutrition. I was also part of a United Nation
Physicalfunction
Factorsattributabletooneself
(personalinfluences)
EnablersBarriers
WillPower
Self-motivation
tobehealthy
PApreferences/attitudestowardsPA
Pain Ill-health AgeTirednessandpoorphysical
function
MainCategory
GenericCategory
Sub-SubCategory
Sub-Category

73
Child’s Fund (UNICEF) funded regional longitudinal survey team, the nutrition surveillance
system. This surveillance system assessed maternal and child health nutrition along the 2 major
seasons in Northern Ghana. Within this survey, using both quantitative and qualitative
measures, the main aim was to understand the major factors influencing the uptake and impact
of our current nutritional interventions. That is to understand how these interventions yielded
results at the household level and also to understand the major role family members and other
care-givers played in the nutrition rehabilitation process. In these surveys, the role of cultural
beliefs and the influence of other family members were major factors affecting the smooth
implementation of these programmes.
Afterwards, I worked in Zambia as part of my Masters’ programme research to explore the
nutritional and social importance of meat consumption among urban and rural young men. This
was a mixed method study that gave me the opportunity to interact with participants at homes,
work, and social places to understand the basic meanings they attached to the consumption of
meat and the main drivers of increase in meat consumption. One of the key findings from this
study was the strong influence of cultural or social factors that predicted dietary patterns within
this population.
Given these two research exposures in different populations, I had a strong opinion of how
traditional and cultural beliefs could impact on healthy lifestyles. With this in mind, I was
keener to understand how different this might be with community-dwelling ethnic older
minorities in Birmingham, hence the decision to conduct this research. Notwithstanding my
previous knowledge and my exposure to different populations, I had to consciously set aside
my assumptions and views to ensure I kept an open mind, and approached the participants and

74
the research as a unique scenario without allowing my previous knowledge to influence my
data collection, interpretation and reporting of the findings.
In the present study, I could easily relate to some of the cultural/traditional influences to dietary
intake to my personal life. Growing up in a community that upholds strong cultural and
traditional connotations to our traditional foods, I have been raised to appreciate the value of
traditional meals in the context of their health, moral and spiritual importance. I remember my
grandfather used to say I could not have chicken because I was the first born of my parents.
This was also applicable to all women with regards to chicken. This played a huge influence on
the amount of meat eaten by first born children and women in my rural community (Bongo-
Soe). Given this experience, I could easily relate when participants wanted me to understand
the importance of their traditional foods, with some strongly emphasising that their traditional
foods were like an identity and gave them strength as compared to any other food, and they do
not feel right if they fail to eat their traditional foods.
As an ethnic minority and a migrant myself, most of the participants’ stories of how their dietary
patterns have changed were very similar to what I have experienced over the years. Having
spent a few years in a western country, the UK, my dietary behaviours have been slightly
altered, thus resulting in the inclusion of some western foods in my dietary choices. With this
close relationship in mind during data collection, I used it to my advantage, by encouraging
participants to explore their eating behaviours, and the social networks and other influences to
their eating behaviours. My experience gave me a platform to relate and contribute to the
discussion, to build rapport, thus helping participants to feel more comfortable and to express
openly relevant information that will help me address my research questions. Even though this
served as an advantage, I was conscious throughout the interviews to bracket my assumptions

75
and opinions and to be as objective as possible during the interviews, to prevent leading
participants in their responses.
Furthermore, having a good knowledge of the foods/recipes within the African and Caribbean
homes was very helpful in assisting me with prompting participants for forgotten foods that
were eaten along with these foods, and I could show them the exact food item from the food
portion booklet for the right portion size estimation. There was also a limitation with this, as
most participants presumed, as being African (Ghanaian), I knew the food/the recipe, hence
they just mentioned the main food without its constituents. In order to address this, I avoided
making any assumptions and further prompted participants for every detail of a recipe or
complete dish even though I might be familiar with it.
Additionally, my identity as an ethnic minority, Ghanaian and a Christian might have accounted
for the high numbers of Christians and Caribbean (especially Jamaicans) within this present
study. There is an historic belief that Jamaicans originated (trace their roots) from present-day
Ghana in West African (Agorsah, 1993; Sarfo, 2010). This may help explain why most of the
Jamaicans I contacted were willing to take part in the study, with some stating that they see me
as one of them (‘an Insider’) and as such, they were willing to do everything in their power to
support my data collection (Mullings, 1999). So, this could explain the high numbers from this
ethnicity and the low rate of drop out from this population. Given this, using a maximum
variation approach, I targeted and recruited other participants that were different in ethnicity,
age, sex and religion from this group to achieve a closer representative sample of the
characteristics of ethnic older minorities living in Birmingham.
Besides my identity, I also took into consideration the fact that English is not my first language,
hence I made sure I rephrased questions or gave examples during times that participants could

76
not understand me due to my accent. Also, during data synthesis and analysis, I sought help
from other native English-speaking researchers when I had difficulty in interpreting information
correctly from the transcripts what some participants were expressing during the interviews. I
also contacted a South Asian female researcher fluent in Urdu during the times I was in doubt
of certain combinations of South Asian foods or gestures made by participants from this
background.
Lastly, considering the role of gender in qualitative interviews, it has been argued that
interviews might produce high quality, reliable and valid data when both the interviewee and
interviewer are of the same gender (Finch, 1993; Oakley, 1981). Interviewee and interviewer
being of the same gender allows them to feel more comfortable to share their experiences and
to have a lengthy and deep conversation about the subject without restrictions (Finch, 1993;
Oakley, 1981). Given these assumptions, to ensure gender balance, especially in the Muslim
communities with female participants, I employed the services of a female researcher or
chaperone to aid in this process. This assisted the female participants in feeling more
comfortable to share views and issues with regards to the research.
2.9 Rigour and Trustworthiness
Rigour refers to the process of being thorough and accurate, and without this research becomes
meaningless and valueless (“Oxford English Dictionary”, 2013; Morse et al., 2002). While that
of trustworthiness has to do with the degree readers could judge truthfulness of the findings
(Schmidt and Brown, 2015). As both rigour and trustworthiness ascertain the reliability and
validity of the research, these should be incorporated in the design, data collection and analysis
of the results of the study (Patton, 2002; Morse et al., 2002).Within this section, all strategies
adopted to ensure the trustworthiness of my data are discussed. Firstly, after the initial
development of the coding matrices, these were reviewed by the student’s research team using

77
the research questions, relevant literature, and the conceptual model adopted for the qualitative
interviews (Babakus & Thompson, 2012; Castaneda-Gameros et al., 2017; Emadian &
Thompson, 2017; Story et al., 2008). This allowed them to make minor adjustments to these
matrices. After the amendments, the coding matrices were subsequently reviewed by the
academic team (supervisor) and again further edits were made. Ten percent of random
transcripts from phase 1 (9) and phase 2 (8) were independently reviewed and coded using the
matrices developed by the researcher and two other PhD student researchers. As discussed by
Mays and Pope (1995), the level of agreement in reviewing and coding these transcripts
enhances the reliability of the research. Discussing the level of agreement by the researcher and
the student research team led to further adjustments to the coding matrices until consensus was
reached. All these processes were aimed at achieving triangulation of evidence from both the
research student and supervisory teams (Morse et al., 2002).
Besides triangulation of evidence, the role, assumptions, position and possible biases of the
researcher were thoroughly explored, and strategies implemented to reduce biases were
discussed within the reflexivity section above (Mays & Pope, 1995). All other information
related to these aspects were recorded throughout the study using reflective field journals.
There was also regular peer-debriefing from my supervisors, Prof. Janice L. Thompson and Dr.
Carolyn A. Greig, at all stages of this research. They provided relevant feedback and comments
that guided the data collection, analysis and findings in this study (Creswell & Miller, 2000).
Lastly, following the recommendations of Mays and Pope (1995), the rigour and
trustworthiness of the data was ensured by providing a rich and in-depth description of the
methodology, that is, the data collection procedures, data management and analysis explored
within the study to arrive at these findings. This allows the study to arrive at similar conclusions,

78
if conducted by a different researcher, and also, allows readers to make judgements of the
transferability of the study findings to other similar settings/population (Creswell & Miller,
2000; Mays & Pope, 1995).
2.10 Summary of Chapter
In this chapter, a detailed description and justification for the use of a mixed method design
have been provided, allowing for an exploration of the research questions that will be answered
by the quantitative and qualitative designs. This chapter further explored measures employed
to improve rigour and trustworthiness of the findings in this study. The findings from study 1,
2 and 3 of this PhD research are presented as chapter 3, 4 and 5 respectively.

79
CHAPTER 3
SOCIAL NETWORKS AND THEIR INFLUENCES ON
NUTRIENT INTAKE, NUTRITIONAL STATUS AND
PHYSICAL FUNCTION IN COMMUNITY-DWELLING
ETHNICALLY DIVERSE OLDER ADULTS: A MIXED-
METHODS LONGITUDINAL STUDY
This paper forms part of the first study of this PhD and is currently under review for
publication with the journal BMC Public Health as Asamane E.A, Greig C.A, Thompson,
J.L. Social networks and their influences on nutrient intake, nutritional status and physical
function in community-dwelling ethnically diverse older adults: A mixed-methods
longitudinal study.
The chapter seeks to answers the following research questions:
1. What is the profile of social networks among community-dwelling ethnically diverse
older adults?
2. To what extent do social networks change over time, and what accounts for these
changes among this population?
3. To what extent does social networks and their changes influence nutrient intake,
nutritional status and physical function within this population?

80
3.0 Abstract
Background: The United Kingdom population is ageing and becoming increasingly diverse;
thus, it is vital to develop and implement interventions supporting this population shift. Social
networks (SN) significantly impact health outcomes in later life, however relatively little is
known about SN of community-dwelling ethnically diverse older adults. This study aimed to:
1) profile SN and changes in SN in this population over eight months; 2) examine associations
between SN, dietary intake, nutritional status, and physical function.
Methods: SN were assessed using the Wenger Practitioner Assessment of Network Type.
Energy and nutrient intakes were measured using multiple-pass 24-hour recalls. The Mini
Nutritional Assessment-Short Form (MNA-SF) assessed nutritional status. Physical function
was measured using the Short Physical Performance Battery (SPPB) and handgrip strength.
Data were collected at baseline and 8-months. Correlation and regression analyses examined
relationships between SN, physical function, nutrient intake and nutritional status. Semi-
structured interviews were conducted at baseline (n=92) and follow-up (n=81) to identify
potential influences of SN. Interviews were transcribed verbatim and analysed using directed
content analysis.
Results: Quantitative data were obtained from 100 participants at baseline and 81 at follow-up.
Mean (SD) age was 70.8 (8.1) years (59% male), comprising African/Caribbean (60%), South
Asian (34%), and other ethnicities (6%). Five SN typologies were identified under two broad
areas: integrated-SN consisting of locally integrated (43%) and wider community (8%); and
non-integrated-SN consisting of family dependent (25%), local self-contained (18%), and
private restricted (6%). At follow-up, 37% remained in non-integrated networks, 19%
transitioned to non-integrated networks, 11% transitioned to, and 33% remained in, integrated
networks. Participants within integrated networks at baseline had higher SPPB scores at follow-

81
up. Compared to the private restricted, local self-contained SN significantly predicted zinc,
riboflavin and vitamin B6 intakes. Participants remaining in, or transitioning to, non-integrated
networks had low MNA-SF scores. Qualitative findings indicate that participants with
reductions in SN perceived it as causing poorer physical function and eating behaviours.
Conclusion: Relatively to non-integrated SN, integrated SN were associated with better
maintenance of physical function and nutritional status. These results can inform the design of
interventions to improve social networks, physical function and healthy nutrition within this
population.
3.1 Background
Social networks are described as inter-personal ties and relationships shared among a group of
inhabitants in an environment (1, 2). These ties often offer a sense of identity, support, solidarity
and feelings of belonging (3, 4). During later life, social networks are unstable, often with
severe disruptive changes such as bereavement, and are more likely to become smaller as
compared to middle life (5). These disruptions, as explained by the convoy model of social
networks, are mainly caused by situational and personal characteristics such as retirement, ill-
health, loss of a spouse, residential changes and other life events primarily associated with
ageing (5, 6). Evidence suggests that stronger social networks positively influence quality of
life, morbidity and mortality in later life (7-10). A study examining the influence of social
networks on health outcomes among 4,170 Korean adults aged 65 years and older found that
individuals with more extensive social networks had higher levels of life satisfaction and lower
depressive symptoms than those with restricted networks (11). Additionally, an international
study of 13,891 older adults in eight developing countries discovered that individuals with
integrated social networks were more protected against premature all-cause mortality over three
and half years of follow-up as compared to those in restricted social networks (9). Given this,

82
it is necessary to understand the types of social networks among diverse populations living in
diverse communities, and how these social networks influence healthy lifestyle choices over
time.
The UK population is ageing and becoming more ethnically diverse (12). Ethnic minorities
account substantially for the recent population growth, and are estimated to constitute over 30%
of the population by 2050 (12, 13). The majority of ethnic minorities live in areas of higher
deprivation and experience disproportionate health inequalities, predisposing them to a lower
quality of life and poorer health than the white British population (14, 15). Even though policies
and interventions have been implemented to try to address this gap, much still needs to be done
to support this rapidly growing portion of the population to age more healthily (16). A more in-
depth enquiry of social networks in this population could contribute to a wider understanding
of the relationship between social networks and health, and thus help in developing more
culturally sensitive community-based interventions with the potential to improve social
networks, and thereby help address the health disparities among this population.
It is often assumed that ethnic minorities live in multigenerational households that offer
continuous informal support for their older members, and hence have stronger social networks
than white older adults. However, this is often not the case, as growing evidence suggests that
multigenerational households do not translate into a continuous pool of support (17).
Additionally, there is evidence that ethnic minorities do not have extensive social networks or
a lower risk of loneliness as previously reported (18-21). For example, a longitudinal study
exploring social networks and engagement between Blacks and Whites aged 65 years and older
in the United States (US) found that Blacks had smaller social networks and engagements as
compared to Whites over the study period (21). While recognising these disparities between
ethnic minorities and the predominately white population, there is also evidence pointing to

83
differences in social networks among ethnic minorities themselves. For instance, a recent study
of social networks of immigrants aged 55 years and older in England and Wales found that
Black Caribbean and Chinese older immigrants had a higher proportion of restricted non-kin
social networks, at 30% and 22.3%, respectively, as compared to Pakistanis (12.1%),
Bangladeshis (6.7%), Indians (16.3%) and Black Africans (16.8%) (22). These differences
within and between ethnic minorities and white populations further cast doubt on the
assumptions that the majority of ethnic minorities have extensive social networks. These studies
also provide a rationale to explore and compare the social networks of older adults living in a
super-diverse city, with that of previous studies of ethnic minorities elsewhere. This could be
useful in broadening our understanding of social networks of ethnic minorities living in
different environmental contexts, and subsequently aid in the design and implementation of
tailored interventions to improve social networks.
There are relatively few studies that have explored the role of social networks on health
outcomes of ethnic minorities in later life (22-25). These studies have highlighted the critical
relationship between social networks and health outcomes. For example, in the US, a cross-
sectional study involving 700 South Asians aged 44-84 years found that increases in emotional
closeness of network members was associated with better self-rated health (23). Similarly, in
the UK, a study involving six ethnic minority groups (aged 55+ years) using quantitative
measures within a cross-sectional study design, found that older ethnic migrants with more
extensive family-oriented networks reported lower loneliness and higher quality of life than
those in restricted networks (22). Even though these studies have advanced our understanding
of the relationship of social networks and some health outcomes within ethnic minorities, they
are often cross-sectional in design, thus making it difficult to monitor changes in social
networks, and how these changes may subsequently influence health outcomes.

84
A longitudinal study design enables the disentangling of the temporality of associations and
helps to unravel the influence of changes in social networks on health outcomes over time.
Furthermore, considering the potential complex mechanisms of how social networks exert
influence, the use of only quantitative techniques, as done in previous studies, limits us from
understanding why these changes occur or how they might be influencing health. To address
these gaps in the literature, the present study uses a longitudinal concurrent mixed method
approach aimed to: 1) categorise and assess any changes in the social network profiles of
community-dwelling ethnically diverse older adults over 8-months; and 2) examine the extent
to which social networks, and any changes in these networks, influence nutrient intake,
nutritional status and physical function over 8-months.
3.2 Methods
3.2.1 Study design and study setting
A longitudinal concurrent mixed method approach was used to explore social networks and
their associations with nutrient intake, nutritional status and physical function at baseline and
8-month follow-up (26). Data were collected on four different occasions: two visits at baseline
(T1) and two visits at follow-up (T2) (see figure 13). The two visits within each time point were
carried out across a 14-day period to capture a closer representation of habitual intake of food
(27). All baseline data were collected from March 2017 to February 2018, and follow-up data
collection occurred approximately eight months later, from November 2017 to February 2019.
The study was conducted in Birmingham, UK, which is the second most populated city in the
UK. Recent projections predict that by 2021, more than 50% of the population in Birmingham
will be comprised of ethnic minorities (28). Given this, the present study setting was appropriate
to answer the research questions in this study.

85
Figure 13: Flow chart summarising the data collection phases and visits over the 8-month
period.
#SPPB= Short Performance physical battery; MNA-SF =Mini Nutritional Status-Short Form; Katz-ADL=Katz
Activity of Daily Living.
3.2.2 Participants and recruitment
Community-dwelling ethnically diverse older adults (≥60 years), living in Birmingham, and
self-identifying as African, Indian, Pakistani, Bangladeshi or Caribbean, took part in the study.
Potential participants were identified and approached at age-well societies, community centres,
faith centres and other informal social events across Birmingham. A total of 100 participants
were conveniently and purposively recruited to take part in the study. Recruitment excluded
older adults with a diagnosis of dementia or any cognitive disabilities that might affect their
participation. Using the Standard Mini Mental State Examination (SMMSE) test, a score of <19
was considered moderately cognitively impaired and hence not eligible to take part in the study
(29, 30). Furthermore, older adults that were institutionalised or hospitalised were excluded.
Maximum variation sampling and chain referrals were employed during the recruitment process
1st Visit
*24-hour dietary recall
*Demographic data and weight,
height and #SPPB score, hand grip, #MNA-SF, #Katz ADL
2nd Visit (Within 14 days after Visit
1)
*24-hour dietary recall
*Social networks (SN) and eating
behaviours, qualitative assessment
4th Visit (Within 14 days after visit 3)
*24-hour dietary recall
*All measures in visit 1 were
repeated
8 M
on
ths
3rd Visit
*24-hour dietary recall
*Qualitative interview on eating
behaviours with emphasis on
changes in SN
Baseline
Follow-up
86
to ensure broad representation across older age groups, ethnicities, sexes, religions/faiths and
socio-economic groups (31-33). Several techniques were incorporated to increase recruitment,
improve data quality and increase participant retention in the study. The authors established
initial contact with community leaders and potential participants prior to the start of the study.
In addition, EAA attended church services and public events held at faith centres to develop
rapport with community leaders and potential participants. This may have enhanced trust
between EAA and potential participants, which has been shown to improve the quality of data
collection (34). Community leaders who met the inclusion criteria were also encouraged to take
part in the study. By recruiting those serving as role models, more trust and credibility was
given to the study (34).
The study received ethical approval from the University of Birmingham Science, Technology,
Engineering, and Mathematics (STEM) ethical review committee (ERN_17_1364). All
participants provided written informed consent before data were collected.
3.2.3 Data collection
3.2.3.1 Social networks
Among the different social network typologies, two social network generation tools were
considered appropriate for this study: the Burholt et al. social network typology for people
living in multigenerational households and the Wenger Practitioner Assessment of Network
Type (PANT) (35-37). Although somewhat similar, these network typologies differ in the
number of network groups, the composition of typology and the ease of applicability (35). For
instance, the Burholt typology uses nine ‘network generator’ questions to derive four network
groups and has been tested and validated to more accurately identify restricted social networks
among people living in multigenerational households than the Wenger PANT (35). The Wenger
PANT includes five network groups, is easy to administer, and has been validated and used in

87
many populations in different countries, including ethnic minority populations in the UK (38-
41). Although data were collected using these two network typologies in the present study, the
Wenger PANT was used to categorise older adults’ social networks because of the low
proportion (5%) of multigenerational households in the study sample and its ease of
administration.
The Wenger PANT is composed of eight distinct questions based on the availability of close
local kin (3 questions), the closeness of family, friends and neighbours (3 questions), and level
of interaction with community, voluntary and religious groups (2 questions) (36, 37). This
scoring tool generates five social network types that describe the size, composition and function
of the social network. These five social networks include: locally integrated; wider community
focussed; family dependent; local self-contained; and the private restricted networks. These are
summarised below under two broad categories, integrated and non-integrated social networks:
Integrated social networks
1. The locally integrated social network is considered more robust and integrated,
providing an optimal level of support as compared to the other network types. It is often
larger than average (network size more than 8 members) and involves active
involvement with family, friends, neighbours and the wider community. This is the most
common network found in the UK (39, 42).
2. The wider community focussed network is also large (more than 8 members within the
network). It is characterised by high community involvement and no local kin (42).
Family members are always a distance from the individual but might visit occasionally.
There is a high dependence on friends and neighbours, and with low levels of isolation
(42).

88
Non-integrated social networks
3. The family dependent network is typically characterised by a small network size (1-4
members). It has high family involvement and low involvement with the community.
Individuals are usually living with an adult child or relative and are often widowed. The
family dependent social network has a high dependence on family members (39, 42).
4. The local self-contained network is characterised by low community involvement, and
family members might be present locally with low involvement. Individuals within this
network are generally reliant on neighbours for support. This network size tends to be
smaller than average (5-6 members), and presents high levels of isolation (39, 42).
5. The private restricted social network is less common in the UK as compared to the other
social networks; it is characterised by very low involvement with family, friends, and
the wider community (42). There are usually no local kin, and individuals within this
network are at high risk of isolation, loneliness, depression and low quality of life in
general (42).
3.2.3.2 Energy and nutrient intake
Repeated multiple pass 24-hour dietary recalls coupled with qualitative interviews were used
to assess energy and nutrient intakes on four different occasions (2 non-consecutive days each
at baseline and follow-up), including at least one weekend day following standard procedures
(43). EAA, a trained nutritionist with relevant expertise in conducting dietary assessments,
conducted all assessments with oversight from JLT, a Professor of Public Health Nutrition and
Exercise, who has extensive experience in dietary assessment among different populations. A
culturally sensitive full-colour food portion booklet containing over 1,700 ethnically diverse
foods eaten in the UK was used to aid in portion size estimations (44). The use of dietary

89
supplements was captured during the multiple pass 24-hour recalls. 24-hour recall records were
discarded when participants indicated that the previous day was not habitual, or they had fasted
(N=17), and an additional data collection session was completed to obtain the record. Before
data entry, recalls were cross-checked for accuracy using the digital audio-recorded interviews
before entering data into the Dietplan 7.0 dietary software analysis package (Forestfield
Software Ltd. Horsham, UK) for processing. West African food composition tables, food
manufacturing websites, and recipe books for ethnic minority groups were employed when a
food item could not be identified in the Dietplan 7.0 database (45).
3.2.3.3 Nutritional status
Participants’ nutritional status were assessed using the Mini-Nutritional Assessment-Short
Form (MNA-SF). This is a simple to use, sensitive, reliable and valid tool for rapid assessment
of the nutritional status of older adults (46). Unlike the full MNA, the short form is faster to
complete and equally reliable when compared to the full MNA (47, 48). Considering its ease
of administration, this was the preferred tool to assess nutritional status in the present study as
it reduces participant burden. Furthermore, most of the information on the full MNA (such as
dietary information) was collected using the multiple pass 24-hour recall, further justifying the
use of the short version. The MNA-SF is composed of six major questions and was administered
at visits 1 and 3 (see figure 13). The MNA-SF has a scoring of 0-14 points, with as score of 0-
7 classified as the malnourished group, 8-11 classified as at-risk-of malnutrition group, and 12-
14 classified as normal group (48).
3.2.3.4 Anthropometrics and physical function
Body weight was measured using a Seca 899 digital scale to the nearest 0.1kg, with participants
wearing light clothing and no shoes. Height was measured using a Seca 213 portable
stadiometer to the nearest 0.1cm, with participants wearing no shoes/minimal headwear. Body

90
Mass Index (BMI) was calculated using the standard equation, weight (kg)/height (m)2. Waist
circumference was measured using a flexible retractable non-elastic tape and recorded to the
nearest 0.01cm.
The Short Physical Performance Battery (SPPB) was used to measure participants’ lower body
extremity physical function (49-51). These measures include gait speed, balance and time taken
to perform five repeated chair rises (51). Handgrip strength was measured using a Jamar hand
dynamometer in the standing position (52). The standing position was chosen as it has been
shown to produce maximal grip strength as compared to other body positions (53). During all
measurements, the Jamar handgrip dynamometer was adjusted to the second handle as this has
also been shown to produce consistent and reliable maximal handgrip strength results (54).
Each measurement was completed three times and the highest recording used for analysis.
3.2.4 Quantitative analysis
SPSS version 25 (IBM Corp, Armonk, NY, 2017) was used to carry out all statistical analyses,
with significance set at a p-value set of 0.05. Bivariate analyses were conducted to ascertain the
difference between the baseline sample and the sample lost to follow-up (n=18). Descriptive
analyses were conducted to explore the frequencies and percentages of variables of interest by
social networks. Paired t-tests and chi-square tests were used to test for differences between
continuous variables and categorical variables, respectively. In instances where normality was
violated, the Wilcoxon signed-rank test was used instead of the paired t-test. One-way ANOVA,
with the addition of the Bonferroni multiple comparisons test, was used to test the differences
in continuous variables between social networks. Multiple logistic regressions were used to
assess the association of social networks with nutritional status, nutrients intake and physical
function (SPPB and handgrip strength). Change in physical function was computed as the mean
difference between baseline and follow-up scores and categorised as stable (no change),

91
declined or improved. Also, the change in nutritional status was calculated. First, the
malnourished group was combined with the at-risk-of malnutrition group forming the
malnourished/at-risk-of malnutrition group. Second, the changes in nutritional status at follow-
up was calculated as: 1) those that remained in the malnourished/at-risk-of malnutrition group
at follow-up; 2) those that changed from the normal nutrition group to the malnourished/at-risk-
of malnutrition group; 3) those that remained in normal nutrition status group; 4) those that
changed from the malnourished/at-risk-of malnutrition group to the normal nutritional status
group.
Social network typologies were first treated as categorical variables, where dummy variables
were created for locally integrated, wider community, local self-contained and private restricted
networks. The private restricted network was used as the reference category for cross-sectional
associations, while the remainder of the four dummy social networks served as predictor
variables in unadjusted and adjusted regression models to predict: a) baseline SPPB scores
(physical function); b) baseline nutritional status; and c) baseline nutrient intake (including
dietary supplements).
Considering previous literature (36, 55) and as described above, the locally integrated and wider
community social networks formed the integrated social network type, while family dependent,
local self-contained and private restricted social networks formed the non-integrated social
network type. Change in social networks was computed as maintenance or change of social
network group membership at follow-up in reference to the non-integrated social network
group. Four groups were formed: 1) those that remained in the non-integrated social network
group; 2) those that changed to the non-integrated social network group; 3) those that changed
to the integrated social network group; and 4) those that remained in the integrated social
network group. For longitudinal analyses, the baseline social network groups (the integrated

92
and non-integrated groups) served as independent predictors in multinomial regression analyses
to predict the changes in physical function and nutritional status at follow-up while controlling
for age, sex, IMD, self-rated health, number of diseases and educational attainment.
3.2.4 Qualitative interviews and analysis
A semi-structured interview schedule was used to guide in-depth qualitative interviews at
baseline and follow-up, using open-ended questions and following up with relevant probes. At
baseline, the interviews were focused on the perceived impact of social networks on eating
behaviours and physical function. At the 8-month follow-up, the interview guide was revised
to incorporate areas capturing perceived changes in social networks and their potential
influences on eating behaviours and physical function. Trained translators were employed in
instances where the participant had limited ability to communicate in English (n=19). All
interviews were digitally recorded and were 25-110 minutes in duration. Interviews were
transcribed verbatim, then entered into QSR NVivo 12 Plus software for reorganising and
coding (56).
Directed content analysis was used to analyse the qualitative data (57, 58). The directed content
analysis approach includes three main steps: preparation, organisation and reporting phases.
The preparation phase involved immersion in the data, where transcripts and field notes were
read several times to understand the pattern of the data. During the organisation phase, two
categorisation matrices were developed: 1) the influence of social networks and other key
factors on eating behaviours; and 2) the influence of social networks and other key factors on
physical function. Relevant literature and an ecological model of creating healthy environments
were used in the initial formation of these matrices (59-61).

93
Using an iterative process, the matrices were further restructured inductively based on the
findings arising (data-driven). To ensure rigour, trustworthiness and the ease of use of the
matrices, two independent researchers pre-tested the matrices using preliminary data (57).
Afterwards, discussions around the difficulty of use of the matrices and interpretations of the
categories were resolved by consensus, and the matrices further restructured. Following this
step, the remaining transcripts were coded by EAA using the updated categorisation matrices.
All findings were systematically presented in the reporting phase.
3.3 Results
At baseline, 100 community-dwelling ethnically diverse older adults took part in the study, with
a mean (SD) age of 70.8 (8.1) years (59% males). This sample comprised Africans/Caribbean
(60%), South Asians (34%) and other ethnicities (6%). More men were married (47%) as
compared to women (19%). Seven percent and 9% of men and women respectively were
widowed. At follow-up, data were available for 81% of the sample, with a mean (SD) age of
70.9 (8.1) years (62% males). Figure 14 displays the breakdown of recruitment and drop-outs
throughout the phases of data collection.

94
Five different social networks (SN) were identified at baseline and follow-up visit: locally
integrated (44% vs 37%), wider community (8% vs 9.9%), family dependent (25% vs 35.8%),
local self-contained (17% vs 9.9%), and private restricted (6% vs 7.4%). Participants belonging
to private restricted as compared to locally integrated networks had significantly lower SPPB
scores (p=0.014). There was a statistically significant association between living arrangements
and social networks (p=0.001). Furthermore, as compared to the private restricted network,
locally integrated social networks were associated with better self-rated health (p=0.02) (Table
5).
Figure 14: Flow chart of recruitment, data collection and reasons for dropouts.
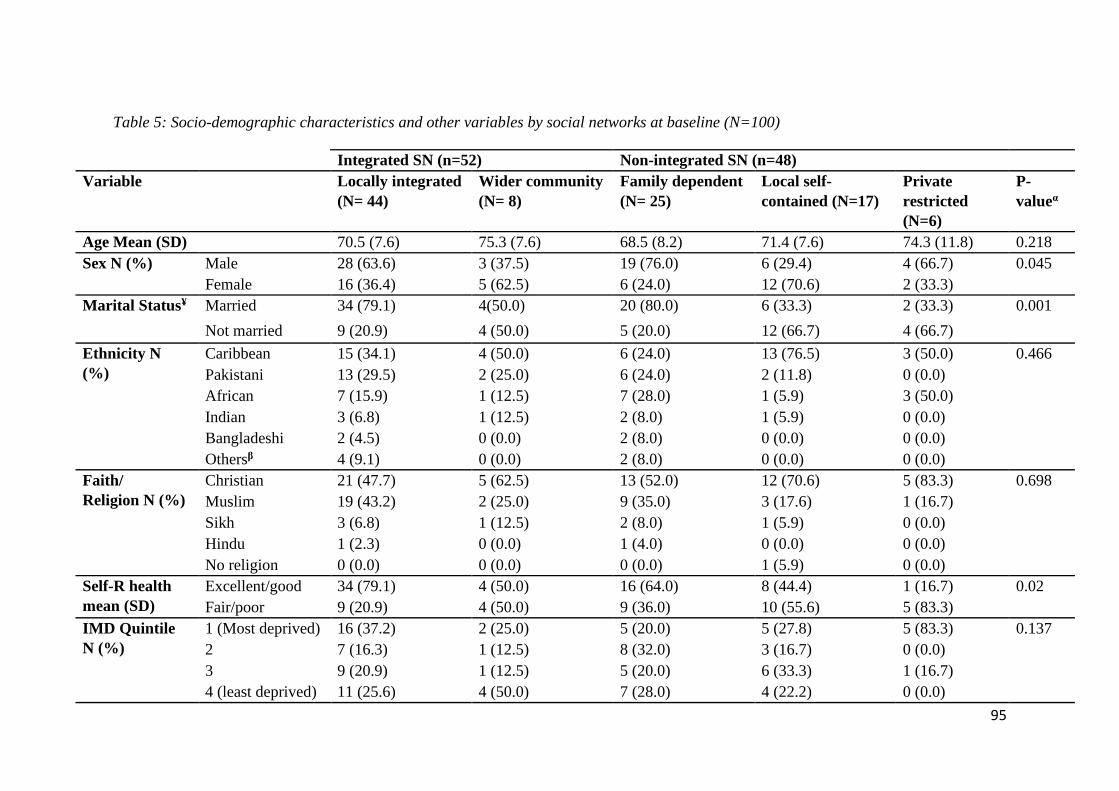
95
Table 5: Socio-demographic characteristics and other variables by social networks at baseline (N=100)
Integrated SN (n=52) Non-integrated SN (n=48)
Variable Locally integrated
(N= 44)
Wider community
(N= 8)
Family dependent
(N= 25)
Local self-
contained (N=17)
Private
restricted
(N=6)
P-
valueα
Age Mean (SD) 70.5 (7.6) 75.3 (7.6) 68.5 (8.2) 71.4 (7.6) 74.3 (11.8) 0.218
Sex N (%) Male 28 (63.6) 3 (37.5) 19 (76.0) 6 (29.4) 4 (66.7) 0.045
Female 16 (36.4) 5 (62.5) 6 (24.0) 12 (70.6) 2 (33.3)
Marital Status¥ Married 34 (79.1) 4(50.0) 20 (80.0) 6 (33.3) 2 (33.3) 0.001
Not married 9 (20.9) 4 (50.0) 5 (20.0) 12 (66.7) 4 (66.7)
Ethnicity N
(%)
Caribbean 15 (34.1) 4 (50.0) 6 (24.0) 13 (76.5) 3 (50.0) 0.466
Pakistani 13 (29.5) 2 (25.0) 6 (24.0) 2 (11.8) 0 (0.0)
African 7 (15.9) 1 (12.5) 7 (28.0) 1 (5.9) 3 (50.0)
Indian 3 (6.8) 1 (12.5) 2 (8.0) 1 (5.9) 0 (0.0)
Bangladeshi 2 (4.5) 0 (0.0) 2 (8.0) 0 (0.0) 0 (0.0)
Othersβ 4 (9.1) 0 (0.0) 2 (8.0) 0 (0.0) 0 (0.0)
Faith/
Religion N (%)
Christian 21 (47.7) 5 (62.5) 13 (52.0) 12 (70.6) 5 (83.3) 0.698
Muslim 19 (43.2) 2 (25.0) 9 (35.0) 3 (17.6) 1 (16.7)
Sikh 3 (6.8) 1 (12.5) 2 (8.0) 1 (5.9) 0 (0.0)
Hindu 1 (2.3) 0 (0.0) 1 (4.0) 0 (0.0) 0 (0.0)
No religion 0 (0.0) 0 (0.0) 0 (0.0) 1 (5.9) 0 (0.0)
Self-R health
mean (SD)
Excellent/good 34 (79.1) 4 (50.0) 16 (64.0) 8 (44.4) 1 (16.7) 0.02
Fair/poor 9 (20.9) 4 (50.0) 9 (36.0) 10 (55.6) 5 (83.3)
IMD Quintile
N (%)
1 (Most deprived) 16 (37.2) 2 (25.0) 5 (20.0) 5 (27.8) 5 (83.3) 0.137
2 7 (16.3) 1 (12.5) 8 (32.0) 3 (16.7) 0 (0.0)
3 9 (20.9) 1 (12.5) 5 (20.0) 6 (33.3) 1 (16.7)
4 (least deprived) 11 (25.6) 4 (50.0) 7 (28.0) 4 (22.2) 0 (0.0)

96
SPPB Mean (SD) 10 (2.0) 9 (3.0) 10 (3.0) 8 (4.0) 6 (5.0) 0.014
HGS Mean (SD) 27.7 (8.9) 24 (5.4) 29.1 (9.9) 22.8 (9.4) 26.3(14.3) 0.231
MNA-SF Mean (SD) 13 (2.0) 13 (1.0) 13 (1.0) 12 (2.0) 12 (3.0) 0.296
BMI
categories* N
(%)
Underweight 0 (0.0) 0 (0.0) 0 (0.0) 0 (0.0) 0 (0.0) 0.852
Normal 2 (4.5) 1 (12.5) 2 (8.0) 2 (11.8) 0 (0.0)
overweight 13 (29.5) 3 (37.5) 9 (36.0) 4 (23.5) 2 (33.3)
Obese 29 (65.9) 4 (50.0) 14 (56.0) 11 (64.7) 4 (66.7)
Number of Disease Mean (SD) 2 (1.0) 2.0 (2.0) 2 (1.0) 3 (2.0) 3 (2.0) 0.344
Length of stay in UK 47.7 (11.9) 50.6 (6.2) 34.7 (20.1) 45.7 (11.3) 20.5 (10.6) 0.001
Living alone % 11.6 50.0 8.0 55.6 66.7 0.001
Supplement use Yes 16 (37.2) 3 (37.5) 8 (32.0) 11 (61.1) 1 (16.7) 0.236
No 27 (62.8) 5 (62.5) 17 (68.0) 7 (38.9) 5 (83.3)
SD= Standard deviation; IMD= Index of Multiple Deprivation; MNA-SF= Mini-Nutritional Assessment-Short Form; SPPB= Short Physical Performance Battery HGS=
Handgrip strength; BMI= Body Mass Index
*WHO guidance on BMI thresholds for Asian populations (World Health Organization, 2004) was used to categorise BMI of South Asian participants, and the standard
BMI categories were used for Caribbean and African participants.
Note age is in years. ¥ This includes all those that are single, separated, divorced and widowed.
α Significant differences between social networks. β ‘Others’ referring to mixed ethnicities e.g. African Asians.

97
3.3.1 Profile of social networks and their changes over eight months
The total proportion of participants reporting locally integrated and local self-contained
networks was reduced by 8.7% and 6.1%, respectively, at follow-up (Table 6). However,
participants reporting private restricted, wider community and family dependent social
networks increased by 1.2%, 3.7% and 9.9%, respectively, at follow-up. The most dominant
social network was the locally integrated social network, and the least common was the private
restricted social network at both time points. Comparing the two time points, locally integrated
and family dependent networks were more stable with 62.2% and 66.7%, respectively, at
follow-up. At follow-up, 2.7% of those in the locally integrated social network at baseline
declined to the local self-contained network, with 27% in the locally integrated social network
declining to the family-dependent network. The most unstable network group was the local self-
contained, with only 23.1% retaining this category at follow-up. Additionally, 30% of those in
the local self-contained network at baseline changed to the private restricted social network at
follow-up.
Table 6: Profile of social networks and transition over time (N=81)
Social networks, follow-up
Social
networks,
baseline
N (%)
Locally
integrated
Wider
community
Family
dependent
Local
self-
contained
Private
restricted Total
Locally
integrated
23 (62.2) 3 (8.1) 10 (27.0) 1 (2.7) 0 (0.0) 37 (45.7)
Wider
community
1 (20.0) 2 (40.0) 1 (20.0) 1 (20.0) 0 (0.0) 5 (6.2)
Family
dependent
5 (23.8) 0 (0.0) 14 (66.7) 2 (9.5) 0 (0.0) 21 (25.9)
Local self-
contained
1 (7.7) 2 (15.4) 3 (23.1) 3 (23.1) 4 (30.8) 13 (16.0)
Private
restricted
0 (0.0) 1 (20.0) 1 (20.0) 1 (20.0) 2 (40.0) 5 (6.2)
Total 30 (37.0) 8 (9.9) 29 (35.8) 8 (9.9) 6 (7.4) 81 (100.0)

98
Table 7 shows the differences in demographic characteristics and outcome variables between
those who remained in the integrated network group, those who changed to the integrated
network group, those who remained in the non-integrated network group, and those who
changed to the non-integrated network group. The groups were not significantly different with
respect to age, sex, marital status, number of diseases, handgrip strength or waist circumference.
However, the groups differed in MNA-SF scores, SPPB scores, self-rated health and length of
stay in the UK. Those who remained in the non-integrated network group had significantly
lower SPPB scores at baseline (P=0.039) and follow-up (p=0.018), as compared with
participants who remained in the integrated network group. Similarly, at follow-up, participants
who changed to the non-integrated network group had the lowest MNA-SF scores (p=0.018).
Participants who remained in the non-integrated network group had lower self-rated health as
compared to those who remained in the integrated network (P=0.05).
One-way analysis of variance was conducted to ascertain the difference in energy and nutrient
intakes between the changes in social network groups at follow-up. The groups differed in the
intakes of folate, potassium, sodium, and percentage total energy (%TE) from saturated fat
(Figure 15). Compared to those who changed to the non-integrated network group, those who
remained in the integrated network group had lower intakes of %TE from saturated fat
(P=0.009) that were within the UK Recommended Nutrient Intakes (RNI) for %TE saturated
fat. Similarly, those who remained in the integrated network group had significantly higher
intakes of folate (133.3 µg.day-1) as compared to those who changed to the non-integrated
network group (94.8 µg.day-1) (P=0.045). Potassium intakes also differed significantly between
the groups (p=0.015). Those who changed to the integrated network group had higher intakes
(1959.5mg.day-1) as compared to those who changed to the non-integrated network group
(1412.1mg.day-1) and who remained in the non-integrated network group (1501.2mg.day-1)

99
(P=0.015). As compared with the age specific UK RNI for folate, 200 µg.day-1, and potassium
3500mg.day-1, the intakes of folate and potassium for all changes in social network groups as
shown in figure 15 were below the recommended intakes. Sodium intakes for all groups were
also below the UK RNI of 2400mg.day-1. However, those who changed to the integrated
network group had significantly higher intakes of sodium (1536mg.day-1) as compared to those
who changed to the non-integrated network group (895.3mg.day-1) and those who remained in
the integrated network group (1006.3mg.day-1) [see Supplementary file A1 for details].

100
Table 7: Socio-demographic characteristics, nutritional status and physical function of the changes in social networks groups in community-
dwelling ethnically diverse older adults (N=81)
Variable Total at follow-up
(N=81)
Remained
integrated
(N=27)
Changed to
integrated
(N=9)
Remained non-
integrated
(N=30)
Changed to
non-integrated
(N=15)
P-value*
Age Mean (SD) 70.9 (8.1) 71.3 (7.7) 72.4 (9.1) 69.8 (8.8) 71.3 (7.5) 0.808
Sex N (%) Male 50 (61.7) 16 (59.3) 6 (66.7) 19 (63.3) 9 (60.0) 0.975
Female 31 (38.3) 11 (40.7) 3 (33.3) 11 (36.7) 6 (40.0)
Marital status Married 55 (67.9) 23 (85.2) 5 (55.6) 18 (60.0) 9 (60.0) 0.137
Not married 26 (32.1) 4 (14.8) 4 (44.4) 12 (40.0) 6 (40.0)
Self-rated health Excellent 10 (12.3) 4 (14.8) 2 (22.2) 3 (10.0) 1 (6.7) 0.05
Good 42 (51.9) 21 (77.8) 4 (44.8) 11 (36.7) 6 (40.0)
Fair 18 (22.2) 2 (7.4) 2 (22.2) 8 (26.7) 6 (40.0)
Poor 11 (13.6) 0 (0.0) 1 (11.1) 8 (26.7) 2 (13.3)
Number of diseases Mean (SD) 2 (1.4) 1.7 (1.2) 1.6 (0.7) 2.3 (1.7) 2.1 (1.0) 0.303
MNA-SF Mean (SD) T1 12.6 (1.6) 12.7 (1.4) 13.0 (0.7) 12.5 (2.0) 12.1 (1.0) 0.572
T2 12.0 (1.8) 12.6 (1.6) 13.1 (0.9) 11.7 (1.9) 11.1 (1.9) 0.018
SPPB Mean (SD) T1 9.5 (3.2) 10.2 (2.1) 10.4 (2.6) 8.2 (4.1) 10.2 (2.2) 0.039
T2 8.6 (3.3) 9.7 (2.6) 9.8 (2.3) 7.1 (4.2) 9.0 (2.2) 0.018
HGS Mean (SD) T1 27.9 (9.6) 27.7 (8.6) 32.3 (9.1) 26.1 (11.3) 28.8 (7.3) 0.386
T2 27.2 (8.6) 28.5 (8.4) 29.9 (8.9) 24.4 (9.2) 28.8 (6.9) 0.171
WC Mean (SD) T1 100.2 (10.5) 99.5 (10.1) 98.6 (11.5) 100.2 (12.0) 102.3 (7.9) 0.822
T2 100.9 (10.7) 99 (7.7) 98.1 (12.3) 101.7 (13.6) 104.4 (6.6) 0.382
Length of stay in the UK mean (SD) years 43.3 (16.3) 51.2 (10.4) 43.8 (17.9) 34.5 (17.6) 46.1 (14.4) 0.001
SD= Standard deviation; MNA-SF= Mini-Nutritional Assessment-Short Form; SPPB= Short Physical Performance Battery; HGS= Handgrip strength; WC=
Waist circumference; *Mean difference between changes in social networks groups.
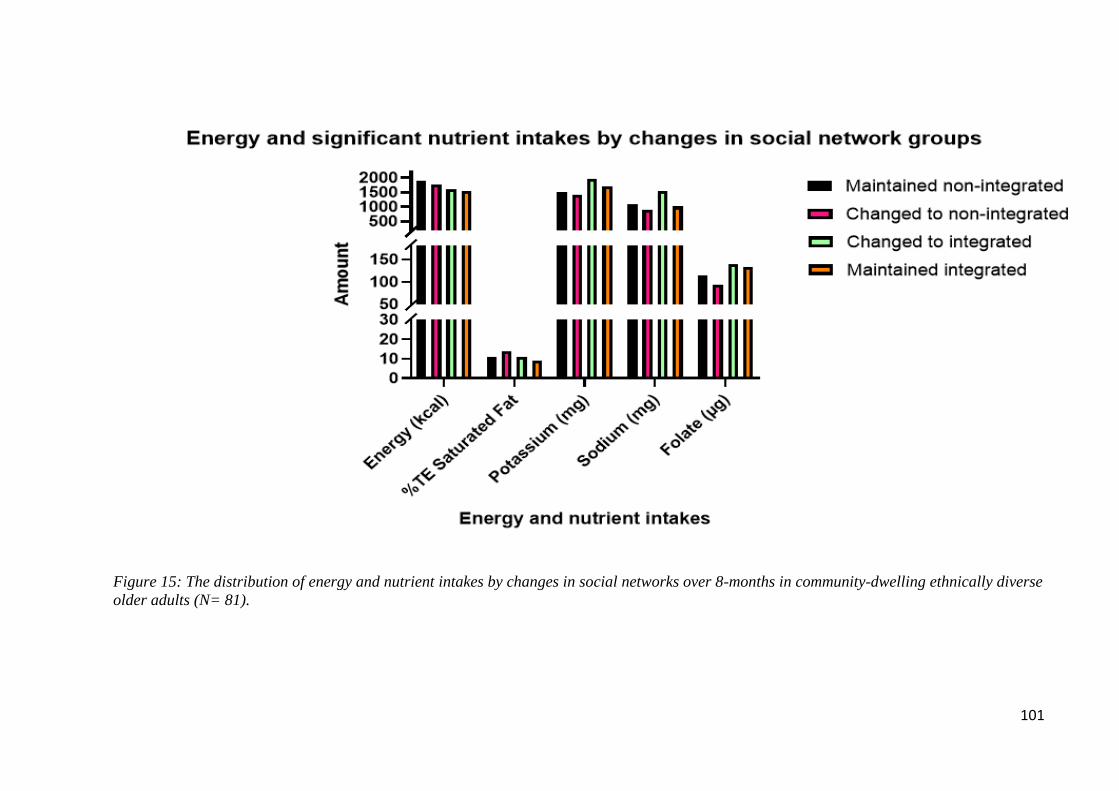
101
Figure 15: The distribution of energy and nutrient intakes by changes in social networks over 8-months in community-dwelling ethnically diverse
older adults (N= 81).

102
3.3.2 Perceived social changes and reasons for social network changes
Almost one-third (28%) of participants reported perceived changes in their social networks
during follow-up. Of those perceiving changes, the quantitative data supported these changes
in 18 (22%), indicating changes to non-integrated or integrated social network groups, as shown
in table 7. The majority (12; 67%) of those that changed to the non-integrated network, reported
perceived declines in their social networks. These participants cited changes in living
arrangements, and reduced frequency of contact from children, other relatives and friends as
the main reasons for the decline in network size and density. For instance, a woman living alone
and belonging to the ‘changed to the non-integrated social network group’ at follow-up
attributed the reduction in network size to the sudden, infrequent visits from her children as
compared to baseline:
“No, there’s no increases [in social networks], it has decreased since we met. I don’t know
why, but my children…. because some of them [children], when they have the partner, the
partner doesn’t like them to come and visit mum, I said to them it’s up to you, don’t let anybody
tell you, “oh you can’t go by your mum”. You should go by your mother, your mother gave
birth to you, but I can’t force someone to come… (P72, 68 years, Caribbean, Female).
Another participant explained that her network size had stayed the same over the study period,
however, the frequency of contact of network members (family and friends) had reduced.
“The network has stayed the same, but the frequency of contact has reduced” (P100, 64 years,
female, Caribbean).
Participants listed Illnesses that made them less mobile as one reason for experiencing declines
in their social networks. The decrease in physical function resulting from illness prevented them
from visiting their social groups as regularly as they used to. A participant recounted how his

103
ill-health during the study period kept him housebound, hence the reason she no longer sees
some of his friends.
“Yes, because I’m getting more immobile in my legs. My hip and my legs, I don’t know what is
causing it, maybe the sickness in this couple of months….that has made me not able to go there
again [community centre]…I don’t see my friends again as I used to” (P77, 68 years, female,
Caribbean).
Participants who remained in the non-integrated social network at follow-up described no
improvement in their social networks. In some cases, participants described their social
networks as poorer than before. For instance, a male participant reported that he is alone most
of the time, and the few friends that he used to spend time with are unwell.
“It is the same if not bad now, I don’t have my family here as I said, I am alone here……. I
have a few friends that I used to see from time to time, they are sick now, I am by myself most
times” (P18, 64 years, African, male).
Participants that remained in the integrated group were more likely to describe a stronger social
network, attributing it to the increase in family network size, for example, the presence of
grandchildren or the relocation of their children back to Birmingham. As explained by a male
participant living with his spouse and youngest daughter, he outlines how his network size has
improved over the study period.
“Oh, the size is increasing because the other one [son] has got two children now. Yeah, and
the relationship is getting even tighter because the children come here, their mum comes here
almost every day. So, the relationship is tight” (P37, 63 years, African, male).

104
3.3.2 Associations of social networks with physical function, nutrient intake and
nutritional status at baseline
Hierarchical multiple linear regressions were performed to determine the relationship of social
network types with physical function (SPPB), nutritional status, BMI, waist circumference and
nutrient intakes. Table 8 shows statistically significant predictors of fully adjusted models for
the outcome variables: SPPB, zinc, riboflavin, vitamin B6 and manganese. Models of social
networks and other independent variables predicting BMI, waist circumference, handgrip
strength, nutritional status and all other nutrients as outcome variables were not statistically
significant [See supplementary file A2].
With respect to physical function (as indicated by SPPB), the fully adjusted model shows that
age, sex, IMD, self-rated health, number of diseases, education and social networks were
significant predictors [F (10, 89)= 5.11, p<0.001], contributing to 36.5% of the variance in
SPPB scores. Older adults who belonged to the integrated network, wider community network
and family-dependent social networks had SPPB scores that were 3.06, 3.47 and 2.97 points
higher, respectively, than those in private restricted network (the reference group), social
networks explained an additional of 5.5% of the variance in SPPB. Also, within the fully
adjusted model, participants who were older and who self-reported poorer health were more
likely to have lower SPPB scores than the younger old with good self-reported health.
For zinc, the fully adjusted model was significant [F(10, 89)=2.302, p= 0.19], and the variables
age, sex, IMD, self-rated health, number of diseases, education and social networks explained
20.5% of the variance of zinc. Participants belonging to the local self-contained network
reported a 2.27mg/day higher zinc intake as compared to participants in private restricted
network, and this contributed to an additional 10.15% of the variance of zinc intake. Similarly,
for riboflavin intake, the model was significant, [F ( 10, 89)=2.668, p=0.07 and the variables

105
age, sex, IMD, self-rated health, education and social networks contributed a total of 23.1% of
the variance of riboflavin intake. Older adults belonging to the local self-contained network
reported a 0.51 mg/day higher riboflavin intake than the private restricted network, explaining
8.6% of the variance in riboflavin intake. A similar result was found for the fully adjusted model
for vitamin B6 [F(10, 89)=2.67, p=0.007], with age, sex, IMD, self-rated health, number of
diseases, education and social networks accounting for 23.1% of the variance in vitamin B6
intake. Older adults belonging to the local self-contained network as compared to the private
restricted network consumed 0.54 mg/day more vitamin B6, accounting for an additional 8.6%
of the variance.
For manganese intake, results differed in that the fully adjusted model was significant, [F(10,
89)=2.04, p=0.038], and the variables age, sex, IMD, self-rated health, number of diseases,
education and social networks explained 18.6% of the variance of manganese intake. Older
adults belonging to the wider community network had 1.64mg/day higher intakes of manganese
than the private restricted network, and this explained an additional of 11.4% of the variance of
manganese intake.

106
Table 8: Hierarchical multiple linear regression predicting SPPB, zinc, riboflavin, vitamin B6, manganese and folate intakes in community-
dwelling ethnic diverse older minorities at baseline (N=100)
SPPB Zinc Riboflavin Vitamin B6 Manganese
Sociodemographic
variables B (95%CI) SE B (95%CI) SE B (95%CI) SE B (95%CI) SE B (95%CI) SE
(Constant) 17.33 (10.8, 23.85)** 3.28 1.01 (-3.45, 5.47) 2.25 -0.34 (-1.54, 0.85) 0.60 0.09 (-1.07, 1.24) 0.58 0.99 (-2.03, 4.01) 1.52
Sex -0.36 (-1.50, 0.78) 0.57 0.26 (-0.51,1.04) 0.39 0.12 (-0.09, 0.33) 0.10 0.10 (-0.11, 0.30) 0.10 -0.04 (-0.57, 0.48) 0.27
Age -0.09 (-0.16, -0.02)* 0.03 -0.02 (-0.03, 0.06) 0.02 0.10 (-0.01, 0.02) 0.01 0.01(-0.01, 0.01) 0.01 0.01 (-0.02, 0.05) 0.02
IMD 0.05 (-0.23, 0.32) 0.14 0.01 (-0.19, 0.18) 0.09 0.10 (-0.05, 0.05) 0.03 -0.03 (-0.08, 0.02) 0.02 -0.04 (-0.16, 0.09) 0.06
Education -0.09 (-0.60, 0.43) 0.26 0.10 (-0.25, 0.46) 0.18 0.16 (0.06, 0.25)** 0.05 -0.17 (0.07,0.26)** 0.05 0.11 (-0.13, 0.35) 0.12
Self-rated health -1.57 (-2.29, -0.84)* 0.37 0.11(-0.39, 0.61) 0.25 0.04 (-0.09, 0.18) 0.07 0.01 (-0.14, 0.12) 0.07 0.10 (-0.24, 0.44) 0.17
Number of diseases -0.10 (-0.57, 0.37) 0.24 0.31 (-0.01, 0.63) 0.16 0.04 (-0.05, 0.12) 0.04 0.03 (-0.05, 0.12) 0.04 -0.12 (-0.33, 1.36) 0.11
Social networks
Locally integrated 3.06 (0.69, 5.44)* 1.20 1.29 (-0.33, 2.92) 0.82 0.14 (-0.30, 0.57) 0.22 0.16 (-0.29, 0.59) 0.21 0.26 (-0.84, 1.36) 0.55
Wider community 3.47 (0.45, 6.48)* 1.52 1.72 (-0.35,3.78) 1.04 0.12 (-0.43, 0.68) 0.28 0.13 (-0.40, 0.67) 0.27 1.67 (0.27, 3.06)* 0.70
Family dependent 2.97 (0.49, 5.45)* 1.25 0.56 (-1.14, 2.26) 0.85 0.07 (-0.38, 0.53) 0.23 0.22 (-0.22, 0.66) 0.22 -0.23 (-1.38, 0.92) 0.58
Local self-contained 2.25 (-0.30, 4.81) 1.29 2.27 (0.52, 4.02)* 0.88 0.50 (0.03, 0.96)* 0.24 0.54 (0.09, 0.99)* 0.23 0.38 (-0.81, 1.56) 0.60
Private restricted Ref Ref Ref Ref Ref R2 0.365 0.205 0.231 0.231 0.186
R2 change 0.055 0.101 0.080 0.086 0.114
F for change 1.942 2.829 2.324 2.477* 3.131*
Sex was coded as male=1, female=2; Education was coded no education, primary=2, secondary=3, college/university=4; self-rated health was coded as
excellent=1, good=2, fair=3 and poor= 4. IMD=Index of multiple deprivation. 1 is least deprived and 4 is most deprived. B =Unstandardized regression
coefficient; SE= Standard error of the coefficient; CI= Confidence interval; *P value <0.05; **P value <0.01.

107
3.3.3 Perceptions of the impact of social networks on eating behaviours and physical
function at baseline
It emerged that some participants (28%) perceived their current social networks ties to be
influencing their physical function and eating behaviours. Many of them expressed the changes
in living arrangements, especially the absence of children in the household as compared to
baseline, to be the key influence on their eating behaviours.
“As the children, all moved out, my diet has changed, yes, at that time, you know, there was
more salad, and yes, I usually did a little bit more extra…there was always more food, so I ate
more may be better but now...[shaking her head] no” (P19, 81 years, Caribbean, Female).
“Um, I wouldn’t say my eating habits have improved, because like when the children were at
home, we used to have a lot of eating times, but now I think it’s reduced cos we are alone now.
Also, I tend to be eating more now (laughs), because the excuse is, there’s more to eat, and I
don’t wanna waste it (laughs)” (P24, 81 years, Caribbean, Female).
A few (15%) also identified that changes in living arrangements and social networks impacted
on their physical function. They felt that the presence of the children or other social ties served
as motivation to be more physically active, as they used to do activities together.
“Well, we used to have exercises a lot when they [children] were home, you know, especially
when my daughter was at home because I used to have an exercise bike that we shared together.
I still got a few exercise equipment thrown in the cupboard in there, no motivation to bring
them out” (P28, 83 years, Caribbean, Female)
The social support received during commensality was mixed, with the majority (62%) of males
living with spouses preferring it, describing it as helping them to eat more healthily. Even
though females also preferred the act of commensality, some said it led them to consume larger

108
portion sizes than they would normally eat. However, a few women (6%) said it had no
influence on their portion sizes. These views are supported by the quotes presented below:
“Yeah, my, my wife supports me to eat healthily. Always reminding you about what you have
to eat especially when we eat together and even the times to eat and then, with exercises,
exercise also, she says “Oh, I haven't seen you step on this treadmill for some time.” she will
[be] saying it till you do it (laughs)” (P30, 64, African, Male).
“He’s [Husband] always telling me that I’m not eating enough carbohydrates, like this morning
he decided he was going to do egg and toast for us, and you should have seen the slice of the
bread he cut! ……Yes, it does influence as sometimes I tend to eat too much, just like this
morning” (P63, 62 years, Caribbean, Female).
Five percent of men living with their spouse preferred to eat alone and explained that eating
alone allowed them to eat what and when they wanted, without interference from their spouse
or other family members. As explained by a 60-year-old man:
“My wife is the one who jumps up and about, “Shouldn’t be eating this, this is not good.” I
don’t like it…I stubbornly still put it [the food] on my plate regardless and I say, “Look, I’m
going to die one day, let me die in style, at least you can say I went after eating what I enjoyed
best (laughs)” (P14, 60 years, Other, Male).
3.3.4 The impact of social networks on changes in physical function (SPPB) and
nutritional status over time
Multinomial logistic regression was conducted to ascertain the impact of baseline social
networks on changes in physical function (SPPB) and nutritional status. These analyses were
controlled for sex, age, IMD, self-reported health, educational status and number of diseases.

109
In table 9, sex, IMD, level of education and self-rated health had no effect on changes in
physical function. However, participants belonging to integrated social networks at baseline
were more likely to experience no decline in physical function as compared to participants
belonging to the non-integrated social network (OR=3.50 95% CI 1.02, 12.07). Additionally,
with every unit increase in age, participants were more likely to experience declines in physical
function (OR=0.88 95% CI 0.77, 1.43). There were no other statistically significant results
found in the analysis. The multinomial regression to determine the predictors of changes in
nutritional status showed no statistical significance (Results shown in supplementary file A3).
Table 9: Predictors of changes in physical function of community-dwelling ethnically diverse
older adults (N=81)
Stable (n=31) Improved (n=14)
Variable B SE OR (95% CI) B SE OR (95% CI)
Intercept 8.442 3.064 1.13 3.64
Social networks
Integrated 1.25 0.63 3.5 (1.02, 12.07)* -1.04 0.93 0.35 (0.06, 2.16)
Non-integrated 1 1
Age -0.12 0.04 0.88 (0.81, 0.96)* -0.02 0.05 0.99 (0.89, 1.09)
IMD 0.05 0.16 1.05 (0.77, 1.43) 0.13 0.17 1.14 (0.83, 1.59)
Sex
Male -0.67 0.61 0.51 (0.16, 1.70) -0.10 0.76 0.9 (0.21, 3.96)
Female 1 1
Education
No education -1.42 0.95 0.24 (0.04, 1.55) -0.96 1.28 0.38 (0.03, 4.67)
Primary 0.45 0.86 1.57 (0.29, 8.51) -0.39 1.30 0.68 (0.05, 8.57)
Secondary -0.64 0.86 0.53 (0.10, 2.85) 1.08 0.85 2.94 (0.56, 12.55)
University/College 1 1
Self-rated health
Excellent -0.363 1.15 0.70 (0.07, 6.64) -0.53 1.59 0.59 (0.03, 13.12)
Good -0.40 1.01 0.67 (0.09, 4.85) -2.07 1.62 0.13 (0.01, 3/02)
Fair 0.03 1.25 1.03 (0.09, 11.85) -0.53 1.69 0.59 (0.02, 16.31)
Poor 1 1
The reference category is: Declined (n=36). OR= Odds ratio. SE= Standard error. 95% CI= Confidence
interval. *P<0.05, R2=0.38 (Nagelkerke). Model X2 (20) =32.66, p= 0.037; Stable group refers to the
maintenance of SPPB score over time, Declined group refers to a higher score of SPPB at baseline as
compared to follow-up; Improved group refers to a low score of SPPB at baseline as compared to follow-up.

110
3.3.5 Perceived influences of social network changes on eating behaviours and physical
function
At follow-up, participants’ perceptions of the impact of changes in social networks on their
eating behaviours and physical function were explored. Out of the 28% of participants
perceiving changes to their social networks, men were more likely to describe these changes as
unfavourable as compared to women. Most men highlighted the decline in social networks to
be directly influencing their shopping, cooking and physical function. A male participant
described the loss of his spouse during the study period as impacting on his eating behaviours.
He highlighted that he now chooses to eat ‘ready to eat’ meals opposed to traditional meals,
citing a lack of cooking skills and a lengthy amount of time required to cook his traditional
foods.
“Well, it [eating behaviours] has changed quite a lot, to be honest. Because as I said, I used to
have my wife…my wife used to cook, but now I have to do all that myself and it is not easy
mainly because it’s me, shopping it myself is not easy…. I don’t know how to cook it [traditional
foods] myself and it takes long. So, I don’t eat them [traditional foods] like l used to….I just go
for the easy packaged ones [ready to-eat foods]” (P58, 65 years, Caribbean, Male).
Over the study period, participants that perceived a decline in social network attributed it as
part of the reasons for a decrease in their regular physical activities, eventually leading to a
reduction in physical function. One participant described how the recent decline in the
frequency of meeting with her friends is making her “lazy” and less likely to engage in her
regular physical activities as before.
It [social networks] has reduced. E and Z used to come around. They are my only friends now.
We used to visit the park or go for a meal. Things have changed, E is caring for her sick husband

111
now, and for Z I don’t know what is wrong with her. If I don’t ring, she will not ring. Well, I
don’t know much but I think that has probably made me a bit lazy…I don’t want to walk on my
own (P74, 61 years, African, female).
Contrary to participants expressing the decline in social networks influencing their eating
behaviours and physical function, a few participants (12%) reported a perceived increase in
social networks during follow-up. They described it to be positively influencing them to eat
well and to maintain their physical function. A participant recounted that during the follow-up
period, she had made new friends who motivated her to join cycling and other physical activity
groups in the community.
“More of an increase, really because I made new friends, this friend that came from London,
she's like this [slim]. So, she'll say, "Come on, we're doing a bike ride." And she'll say, "Come
on, we're going yoga." And she's very much active, because of her I have joined this evening
group in the last eight months, that we all do this walking” (P68, 60 years, Caribbean, female).
Within this group expressing improvement in social networks at follow-up, some discussed
how the improvement of social networks was linked to some improvements in their eating
behaviours, as expressed by a female participant below:
“Friends are maybe more now as compared to before, and when I’m saying ‘friends,’ I’m
thinking about church, especially my local church. We eat a lot at church this time [within the
8-months] and again, sometimes there is a swapping of ideas around food” (P51, 72 years,
Caribbean, Female).
Regular engagement in religious and community group meetings were perceived to be
influencing eating behaviours and physical function. These participants highlighted the

112
importance of these regular meetings, stating that it allowed them to meet with friends, share
food and other healthy eating tips. Participants also cited the regular group exercises at some of
these meeting centres to be important in maintaining their physical function, as explained by a
female participant below:
“Well coming here [community centre], you get to [do] your exercise, and then you can see
your friends as well, that’s very important. This motivates me to come. I mean, otherwise, you
won’t see them. And they keep your mind occupied as well. And you do, like, the exercise, you
lose one stone or two, you become fitter, it’s like killing two birds with one stone” (P88, 73
years, Indian, female).
3.4 Discussion
This is the first study to explore changes in social networks, and their association with
nutritional status, nutrient intake and objectively measured physical function monitored
longitudinally among community-dwelling ethnically diverse older adults in the UK.
Considering the growing population of ethnic minorities in the UK and the existing health
inequalities faced by these groups, the present findings form part of an essential process of
advancing our understanding of social network dynamics and their implications for a healthier
ageing trajectory in this population (12, 62). A clearer understanding of social networks could
help design and implement culturally sensitive community interventions to improve social
networks and promote healthy ageing.
We identified five social networks grouped under two major categories: 1) the integrated social
network, consisting of the locally integrated social network and the wider community network;
and 2) the non-integrated network, consisting of the family-dependent, the local self-contained
and the private restricted networks. While most participants at baseline (45.7%) and follow-up

113
(37.0%) belonged to the locally integrated social network, only a few at baseline (6.2%) and
follow-up (7.4%) belonged to the private restricted social network. This is consistent with
previous studies of social networks in the UK using similar network generation typologies (39,
55, 63). Even though there seemed to be high proportions of non-integrated social networks
among Caribbean and African participants, there were no significant differences in social
networks between ethnicities as reported by previous studies in ethnic minority populations in
the UK and elsewhere (22, 63). However, social networks differed by sex; despite the high
proportion of men being married, they had the significantly higher proportion of restricted
social networks than women. The present findings are not consistent with other studies which
reported that older married men had more extensive networks as compared to women that were
unmarried or widowed (64). As explained by our qualitative findings, women (both married
and widowed) expressed high community involvements with faith groups and other community
activities, thus accounting for a higher proportion of integrated social networks than their male
counterparts.
Furthermore, in contrast to previous findings, our findings indicated a small proportion of
restricted social networks at baseline and follow-up (6.2% and 7.4%, respectively) (22, 63, 65).
One possible explanation could be the different social network typologies used, that is, the use
of latent class, cluster analysis or name generation of network groups as compared with the
Wenger PANT tool. For instance, a study of changes in social networks among older Koreans
using latent class analysis to categorise older adults into groups found that at both study points,
the most prevalent social network group was the restricted social network [62]. In addition, the
recruitment strategy used in the present study could be accounting for these differences.
Participants in the presented study were recruited from community centres, faith groups and
other social events, while other published studies analysed large national or international

114
datasets of participants who were recruited using postal addresses, hospital registers or directly
from national records (65, 66).
Despite the small number of participants reporting restricted social networks, the present study
provides novel findings of the dynamics across social networks over time in ethnic minority
older adults. Within a relatively brief follow-up period, quantitative findings indicated that 24
(29.6%) participants reported changes in social networks. As compared to many studies with
longer follow-up periods, the finding of changes in social networks within eight months is
unique, providing valuable insights on the stability of social networks within this population
even over brief periods. Even though the direction of change was not always towards the non-
integrated social networks as anticipated, the majority of those that changed, 15 (62.5%), moved
from an integrated social network to a non-integrated social network.
This sharply contrasts with a study of social network changes among older Europeans, where
over a 4-year period, Europeans aged 65 years and older experienced an expansion of network
ties (66). Explained through the qualitative results, participants within the present study noticed
the changes to a more restrictive type, describing a reduction in network size and frequency
being due to less interaction with their children and friends. A striking finding was that sex,
age, marital status and IMD scores were not associated with changes in social network groups
at follow-up, which contrasts with previous studies (65, 66). For instance, a 2-year longitudinal
study exploring social network changes among adults aged 60 years and older found that sex,
age and self-rated health were significant predictors of changes in social networks at follow-up
[65] This study observed that participants who remained in the poorer social networks at follow-
up were typically females, older, having poorer socio-economic status and self-rated health
[65]. Also, unlike the present study, a recent 4-year longitudinal study of Europeans aged 65
years and older also found that women had relatively larger social networks at follow-up (66).

115
One possible explanation accounting for these differences in findings across studies is the
relatively small sample size (for quantitative analysis) of the present study as compared to the
other studies. However, in the present study, social network changes did differ significantly by
the length of stay in the UK, SPPB and MNA-SF scores. The maintained integrated group had
been living in the UK longer than the changed or maintained non-integrated groups. Length of
stay in the UK has been previously shown to vary among migrants in the UK, with Black
Caribbean people showing the longest stay in the UK as compared to other ethnicities (22). In
the present study, it is likely that the increased length of stay enabled older adults to form
stronger and more stable integrated networks as compared to those with shorter stays. This is
supported by studies elsewhere that found longer residence in the UK was associated with more
stable integrated social networks than in those with shorter stays (67, 68).
As explained by our qualitative findings, good health in terms of stronger physical function and
better nutritional status was essential to maintaining a stronger social network. This evidence
supports the theory of constraint of social networks, which explains that structural constraints
such as a decline in physical health and other changes associated with ageing cause a decline in
personal social networks. Hence, it was not surprising that participants remaining in, or
transitioning to, integrated networks had significantly higher SPPB and MNA-SF scores than
the participants who were in, or who transitioned to, non-integrated social networks.
Nevertheless, given the limited follow-up period of 8 months, further investigations are required
to confirm these factors associated with declines of social networks within this population over
time.
3.4.1 The association of social networks and health outcomes
The findings of the present study indicated that the locally integrated social network was
associated with increased SPPB scores when compared to the private restricted network, even

116
after adjusting for age, sex, IMD, self-rated health, number of diseases and education. During
the qualitative interviews, participants described poor social networks at baseline to be affecting
their eating behaviours and physical function. As expected and consistent with previous
findings, at follow-up, participants who remained in, or transitioned into, non-integrated
networks had significantly lower physical function scores as compared to those that maintained,
or transitioned to, integrated social networks (69). In the adjusted model, belonging to a non-
integrated social network at baseline and increased age were associated with lower physical
function. Participants perceiving declines in social networks at follow-up mentioned the decline
as contributing to poorer physical function and eating behaviours. These longitudinal mixed
methods findings suggest that integrated social networks might be protective against physical
function declines over time among community-dwelling ethnically diverse older adults. The
protective effect of large social networks on physical function has also been reported in
predominately white populations, with similar profile of non-communicable diseases (70).
In the UK, ethnic minorities report lower self-rated health as compared to the rest of the
population (71). For instance, in the 2004 Health Survey for England (HSE), 15% of
Bangladeshi men, 14% of Bangladeshi women, 10% of Pakistani men, and 15% of Pakistani
women reported poor health as compared to the 6% men and 7% women in general population
(71). In the present study, there were no differences in self-rated health among ethnic minorities,
with approximately one-third reporting fair or poor health. However, self-related health differed
by social networks. We found that social networks and changes in social networks were
significantly associated with self-rated health. Older ethnic minorities belonging to the non-
integrated social networks, as compared to integrated social networks, reported significantly
higher proportions of poor or fair health. Similarly, participants that transitioned from an
integrated social network to a non-integrated social network were more likely to report fair or

117
poor health as compared to the maintained integrated group. These findings are consistent with
studies in indigenous populations reported elsewhere (72).
Findings from the present study are consistent with the model of ‘social control’ on healthy
behaviours in old age (73). Participants with integrated social networks recounted the
importance of their spouse and the wider relationships on their eating behaviours and physical
function. The findings enlighten the direct path of ‘social control’ played by their spouses in
either providing healthy food or healthy eating messages as described in the ‘social control’
model (73). Outside the family, some participants that attended community centres or other
faith groups saw it as a valuable contribution to improving their eating behaviours and physical
function. As previously reported (74), the activities of these centres provide at least one of the
three broad components of social support: informational (the dietary advice received);
emotional (providing a sense of empathy); and instrumental support (exercise classes or free
medical assessment received). These findings further broaden understanding of the mechanism
related to how increased social ties might impact the health of older adults. The benefits of these
social groups as purported in this present study have also been reported by older Asian adults
living in the United States (23). Anecdotally, it was observed that even though these centres
provided this level of support, most of these centres were either closed or reduced their opening
days during the study period due to budget cuts, threatening the sustainability of these support
groups.
The lack of statistically significant differences in nutrient intakes between the most and least
robust social network groups within this study was unexpected and in contrast to existing
literature showing that more robust social networks were associated with healthier nutrient
intake (75, 76). However, the two least robust social networks (local self-contained compared
with private restricted) were found to be significant predictors of zinc, riboflavin and vitamin

118
B6 intakes. These two non-integrated networks are defined by having relatively reduced
frequency of contact and the absence of local kin (36, 42). Additionally, participants in the
present study reported less company during meals and minimal or no influence of family and
friends during mealtimes. One possible explanation for this unexpected finding could be the
higher intake of nutrient supplements reported among older adults in the local self-contained
social network (61%) as compared to the private restricted social network (16.7%).
Intakes of sodium, potassium, folate and %TE from saturated fat differed significantly by
changes in social network groups at follow-up. Older adults who remained in, or transitioned
to, the integrated network had significantly higher intakes of these nutrients (except sodium).
Despite the consumption of potassium and folate being below the UK RNI, these older adults
within the integrated networks could have been influenced by the ‘informational support’ at
their regular community meetings and even at home as evidenced by the qualitative findings.
Even though awareness does not necessarily translate into behaviour change, it is possible that
older adults attending these meetings that offer dietary advice and many times provide meals
benefit from this attendance, which could contribute to the difference in nutrient intakes
observed. Given the relatively small sample size (in relation to the quantitative analyses) and
limited follow-up time of eight months, these findings should be viewed with caution, and we
recommend that future studies should be designed with a longer follow-up period to carefully
examine these findings.
3.5 Strengths and limitations of the study
The study was conducted in an under-represented research population which is a significant
strength. Additionally, the longitudinal mixed methods element made it possible to explore the
changes in social networks, the participants’ perspectives of their social networks, and the
influence of these changes of social networks on physical function and nutritional status. The

119
sample size, although relatively small from a quantitative perspective, was large for a
qualitative study. Compared to previous studies using subjective measure of physical function,
the inclusion of objectively measured physical function (SPPB and handgrip test) provided a
more accurate representation of the relationship between social networks and physical function
in the present study. However, this study had limitations. Firstly, by design, the eight months
duration of follow-up was relatively short. This length of time was chosen due to the practicality
of the data collection within the timeframe of the project. Secondly, although the study
employed a maximum variation sampling technique to ensure a wider representation of the
sample, it was difficult to recruit South Asian women, particularly women of Bangladeshi
origin. Thirdly, this study shares a common limitation encountered within many studies
exploring dietary intake, which is the inherent limitations of self-reported nutrient intake. Even
though measures were put in place to enhance accurate self-recalls, it is still possible that some
participants under-reported or over-reported their nutrient intakes. Lastly, as most of the
recruitment was done through social gatherings, this made it difficult to recruit highly socially
isolated participants. This could have accounted for the high representation of integrated social
networks. It is recommended that future studies employ various recruitment approaches that
can enhance the recruitment of more isolated participants across diverse populations of older
ethnic minorities.
3.6 Conclusion
This longitudinal mixed methods study produced unique findings regarding the changes in
social networks among community-dwelling ethnic minority older adults over eight months.
Even though the direction of change was not always towards the non-integrated social networks
as expected, the majority moved from integrated to non-integrated social networks. Overall, the
findings indicated that integrated social networks at baseline were protective against declines

120
in physical function at follow-up and were associated with better self-rated health. These
findings further demonstrate the important role of stronger social networks in healthy ageing,
and the need to develop community-based interventions to support older ethnic minorities
embedded in restricted social networks to age more healthfully. Given the benefits of social
support derived from attending community groups found in this study, improving the access of
these centres and providing long-term financial support from interested organisations and
public funding sources could improve the sustainability of these ethnic and religious centres.
This could, in turn, support the maintenance of integrated social networks among community-
dwelling older adults. Additionally, the findings of this study could be used to tailor community
interventions to make them more culturally sensitive to support community-dwelling older
adults to age more healthily. Future studies with an extended follow-up within this population
are recommended to further elucidate the temporality and quality of changes in social networks
and their relationship with dietary intake and physical function in this population.

121
3.7 References
1. Kahn RL, Antonucci T C. Convoys over the life course: Attachments, roles and social
support. In: Baltes PB, Brim O, (eds.). Life-span Development and Behavior. (3, 253-286)
New York: Academic Press; 1980.
2. Mitchell JC. Social networks in urban situations: analyses of personal relationships in
Central African towns: Manchester University Press; 1969.
3. House JK, Kahn R. Measures and Concepts of Social Support. In: Syme SCaSL, editor. In
Social Support and Health New York: Academic Press; 1985.
4. Walker KN, MacBride A, Vachon ML. Social support networks and the crisis of
bereavement. Social Science & Medicine (1967). 1977;11(1):35-41.
5. Cornwell B, Laumann EO, Schumm LP. The social connectedness of older adults: A
national profile. American Sociological Review. 2008;73(2):185-203.
6. Antonucci TC, Ajrouch KJ, Birditt KS. The convoy model: Explaining social relations
from a multidisciplinary perspective. The Gerontologist. 2013;54(1):82-92.
7. Escobar-Bravo M-Á, Puga-González D, Martín-Baranera M. Protective effects of social
networks on disability among older adults in Spain. Archives of Gerontology and Geriatrics.
2012;54(1):109-16.
8. Fiori KL, Jager J. The impact of social support networks on mental and physical health in
the transition to older adulthood: A longitudinal, pattern-centered approach. International
Journal of Behavioral Development. 2012;36(2):117-29.
9. Santini ZI, Koyanagi A, Tyrovolas S, Haro JM, Fiori KL, Uwakwa R, et al. Social network
typologies and mortality risk among older people in China, India, and Latin America: A 10/66
Dementia Research Group population-based cohort study. Social Science & Medicine.
2015;147:134-43.
10. Seeman TE. Social ties and health: The benefits of social integration. Annals of
epidemiology. 1996;6(5):442-51.
11. Park S, Smith J, Dunkle RE. Social network types and well-being among South Korean
older adults. Aging and Mental Health. 2014;18(1):72-80.
12. Office for National Statistics. Ethnicity and National Identity in England and Wales 2011
2012 [Available from:
http://webarchive.nationalarchives.gov.uk/20160105160709/http://www.ons.gov.uk/ons/dcp1
71776_290558.pdf [Accessed June 10, 2019]
13. Rees P, Wohland P, Norman P, Boden P. Ethnic population projections for the UK, 2001–
2051. Journal of Population Research. 2012;29(1):45-89.
14. Nazroo JY. The health of Britain's ethnic minorities: findings from a national survey /
James Y. Nazroo. In: Policy Studies I, editor. London: Policy Studies Institute; 1997.
15. Evandrou M. Social inequalities in later life: the socio-economic position of older people
from ethnic minority groups in Britain. Population Trends London. 2000:11-8.
16. Department of Health. Tackling Health Inequalities: 2007 Status Report on the
Programme for Action 2008 [Available from:
https://webarchive.nationalarchives.gov.uk/20031221005110/http://www.doh.gov.uk/healthin
equalities/programmeforaction/programmeforaction.pdf. [Accessed June 10, 2019]
17. Stopes-Roe ME, Cochrane R. Support networks of Asian and British families:
Comparisons between ethnicities and between generations. Social Behaviour. 1990.
18. Gibson R, Jackson J. The health, physical functioning, and informal supports of the black
elderly. Health Policies and Black Americans. 1989:421-54.

122
19. Lee GR, Peek CW, Coward RT. Race differences in filial responsibility expectations
among older parents. Journal of Marriage and Family. 1998:404-12.
20. Ajrouch KJ, Antonucci TC, Janevic MR. Social networks among blacks and whites: The
interaction between race and age. The Journals of Gerontology Series B: Psychological
Sciences and Social Sciences. 2001;56(2):S112-S8.
21. Barnes LL, Mendes de Leon CF, Bienias JL, Evans DA. A longitudinal study of Black–
White differences in social resources. The Journals of Gerontology Series B: Psychological
Sciences and Social Sciences. 2004;59(3):S146-S53.
22. Burholt V, Dobbs C, Victor C. Social support networks of older migrants in England and
Wales: the role of collectivist culture. Ageing & Society. 2018;38(7):1453-77.
23. Kandula NR, Cooper AJ, Schneider JA, Fujimoto K, Kanaya AM, Van Horn L, et al.
Personal social networks and organizational affiliation of South Asians in the United States.
BMC Public Health. 2018;18(1):218.
24. Prager E. Older English-speaking immigrants in Israel: observations on their perceived
adjustment. Journal of Jewish Communal Service. 1985;61:209-18.
25. Roy P, Hamilton I. Family and social networks among elderly Italians in Gippsland.
Journal of Comparative Family Studies. 1992:267-84.
26. Castro FG, Kellison JG, Boyd SJ, Kopak A. A methodology for conducting integrative
mixed methods research and data analyses. Journal of Mixed Methods Research.
2010;4(4):342-60.
27. Ma Y, Olendzki BC, Pagoto SL, Hurley TG, Magner RP, Ockene IS, et al. Number of 24-
hour diet recalls needed to estimate energy intake. Annals of Epidemiology. 2009;19(8):553-
9.
28. Birmingham City Council. 2016 Population Based Projections 2018. Available from:
https://www.birmingham.gov.uk/downloads/file/4609/2016_population_based projections.
[Accessed May 27, 2019]
29. Molloy DW, Alemayehu E, Roberts R. Reliability of a standardized mini-mental state
examination compared with the traditional mini-mental state examination. Am J Psychiatry.
1991;148(1):102-5.
30. Molloy W, Clarnette R. Standardized Mini-mental State Examination [SMMSE]: A User's
Guide: New Grange Press; 1999.
31. Patton M. Qualitative research and evaluation methods 2002 Thousand Oaks. CA
SagePUBLICations. 2002.
32. Penrod J, Preston DB, Cain RE, Starks MT. A discussion of chain referral as a method of
sampling hard-to-reach populations. Journal of Transcultural Nursing. 2003;14(2):100-7.
33. Teddlie C, Yu F. Mixed methods sampling: A typology with examples. Journal of Mixed
Methods Research. 2007;1(1):77-100.
34. Garduño‐Diaz S, Husain W, Ashkanani F, Khokhar S. Meeting challenges related to the
dietary assessment of ethnic minority populations. Journal of Human Nutrition and Dietetics.
2014;27(4):358-66.
35. Burholt V, Dobbs C. A support network typology for application in older populations with
a preponderance of multigenerational households. Ageing & Society. 2014;34(7):1142-69.
36. Wenger GC. A network typology: From theory to practice. Journal of Aging Studies.
1991;5(2):147-62.
37. Wenger GC, Tucker I. Using network variation in practice: identification of support
network type. Health & Social Care in the Community. 2002;10(1):28-35.
123
38. Thiyagarajan JA. Price M, Webber M. Social support network typologies and health
outcomes of older people in low and middle income countries–a 10/66 dementia research
group population-based study. International Review of Psychiatry. 2014;26(4):476-85.
39. Burholt V, Wenger C, Scott A, Yahya B, Roy S. Bangladeshi immigration to the United
Kingdom: Older people's support networks in the sending and receiving countries. Quality in
Ageing and Older Adults. 2000;1(2):18-30.
40. Stephens C, Alpass F, Towers A, Stevenson B. The effects of types of social networks,
perceived social support, and loneliness on the health of older people: Accounting for the
social context. Journal of Aging and Health. 2011;23(6):887-911.
41. Wenger G, Liu J. Support networks in Beijing (China) and Liverpool (UK): Differences
and similarities. Hallym International Journal of Aging. 1999;1(2):47-57.
42. Wenger GC. Social networks and the prediction of elderly people at risk. Aging & Mental
Health. 1997;1(4):311-20.
43. Adamson A, Collerton J, Davies K, Foster E, Jagger C, Stamp E, et al. Nutrition in
advanced age: dietary assessment in the Newcastle 85+ study. European Journal of Clinical
Nutrition. 2009;63(S1):S6.
44. Cheyette C, Balolia Y. Carbs & Cals: A Visual Guide to Carbohydrate Counting &
Calorie Counting for People with Diabetes: Chello Pub; 2010.
45. Stadlmayr B, Charrondiere UR, Enujiugha V, Bayili RG, Fagbohoun EG, Samb B, et al.
West African food composition table. 2012.
46. Vellas B, Guigoz Y, Garry PJ, Nourhashemi F, Bennahum D, Lauque S, et al. The Mini
Nutritional Assessment (MNA) and its use in grading the nutritional state of elderly patients.
Nutrition. 1999;15(2):116-22.
47. Cuervo M, García A, Ansorena D, Sanchez-Villegas A, Martínez-González M, Astiasarán
I, et al. Nutritional assessment interpretation on 22 007 Spanish community-dwelling elders
through the Mini Nutritional Assessment test. Public health nutrition. 2009;12(1):82-90.
48. Rubenstein LZ, Harker JO, Salvà A, Guigoz Y, Vellas B. Screening for undernutrition in
geriatric practice: developing the short-form mini-nutritional assessment (MNA-SF). The
Journals of Gerontology Series A: Biological Sciences and Medical Sciences.
2001;56(6):M366-M72.
49. Gómez JF, Curcio C-L, Alvarado B, Zunzunegui MV, Guralnik J. Validity and reliability
of the Short Physical Performance Battery (SPPB): a pilot study on mobility in the Colombian
Andes. Colombia Medica. 2013;44(3):165-71.
50. Guralnik JM, Ferrucci L, Pieper CF, Leveille SG, Markides KS, Ostir GV, et al. Lower
extremity function and subsequent disability: consistency across studies, predictive models,
and value of gait speed alone compared with the short physical performance battery. The
Journals of Gerontology Series A: Biological Sciences and Medical Sciences.
2000;55(4):M221-M31.
51. Guralnik JM, Simonsick EM, Ferrucci L, Glynn RJ, Berkman LF, Blazer DG, et al. A
short physical performance battery assessing lower extremity function: association with self-
reported disability and prediction of mortality and nursing home admission. Journal of
Gerontology. 1994;49(2):M85-M94.
52. Centers for Disease Control and Prevention. National Health and Nutrition Examination
Survey Questionnaire (Muscle strength, Procedures Manual). 2011 [Available from:
https://www.cdc.gov/nchs/data/nhanes/nhanes_11_12/Muscle_Strength_Proc_Manual.pdf.
[Accessed June 10, 2019]
53. El-Sais WM, Mohammad WS. Influence of different testing postures on hand grip
strength. European Scientific Journal. 2014;10(36).

124
54. Roberts HC, Denison HJ, Martin HJ, Patel HP, Syddall H, Cooper C, et al. A review of
the measurement of grip strength in clinical and epidemiological studies: towards a
standardised approach. Age and ageing. 2011;40(4):423-9.
55. Golden J, Conroy RM, Lawlor BA. Social support network structure in older people:
underlying dimensions and association with psychological and physical health. Psychology,
Health & Medicine. 2009;14(3):280-90.
56. QSR International. NVivo qualitative data analysis software (Version 12). QSR
International Pty Ltd Victoria, Australia; 2012.
57. Elo S, Kyngäs H. The qualitative content analysis process. Journal of Advanced Nursing.
2008;62(1):107-15.
58. Hsieh H-F, Shannon SE. Three approaches to qualitative content analysis. Qualitative
Health Research. 2005;15(9):1277-88.
59. Bloom I, Edwards M, Jameson KA, Syddall HE, Dennison E, Gale CR, et al. Influences
on diet quality in older age: the importance of social factors. Age and Ageing.
2017;46(2):277-83.
60. Osei-Kwasi HA, Powell K, Nicolaou M, Holdsworth M. The influence of migration on
dietary practices of Ghanaians living in the United Kingdom: a qualitative study. Annals of
Human Biology. 2017;44(5):454-63.
61. Story M, Kaphingst KM, Robinson-O'Brien R, Glanz K. Creating healthy food and eating
environments: policy and environmental approaches. Annu Rev Public Health. 2008;29:253-
72.
62. Lievesley N. The ageing of the ethnic minority populations of England and Wales:
findings from the 2011 census. CPA, UK. 2013.
63. Burholt V, Dobbs C, Victor C. Transnational relationships and cultural identity of older
migrants. GeroPsych. 2016.
64. Harling G, Morris K, Manderson L, Perkins J, Berkman L. Age and gender differences in
social network composition and social support among older rural South Africans: Findings
from the HAALSI study. The Journals of Gerontology 2017.
65. Kim B, Park S, Antonucci TC. Longitudinal changes in social networks, health and
wellbeing among older Koreans. Ageing & Society. 2016;36(9):1915-36.
66. Schwartz E, Litwin H. Social network changes among older Europeans: the role of
gender. European Journal of Ageing. 2018;15(4):359-67.
67. Burholt V, Sardani AV. The impact of residential immobility and population turnover on
the support networks of older people living in rural areas: Evidence from CFAS Wales.
Population, Space and Place. 2018;24(4):e2132.
68. Wenger GC, St Leger F. Community structure and support network variations. Ageing &
Society. 1992;12(2):213-36.
69. Fiori KL, Antonucci TC, Cortina KS. Social Network Typologies and Mental Health
Among Older Adults. 2006. p. P25-P32.
70. Bisschop MI, Kriegsman DM, Van Tilburg TG, Penninx BW, van Eijk JTM, Deeg DJ.
The influence of differing social ties on decline in physical functioning among older people
with and without chronic diseases: The Longitudinal Aging Study Amsterdam. Aging Clinical
and Experimental Research. 2003;15(2):164-73.
71. Sproston K, Mindell J. Health Survey for England 2004. The health of minority ethnic
groups. 2006.
72. Youm Y, Laumann EO, Ferraro KF, Waite LJ, Kim HC, Park Y-R, et al. Social network
properties and self-rated health in later life: comparisons from the Korean social life, health,

125
and aging project and the national social life, health and aging project. BMC Geriatrics.
2014;14(1):102.
73. Umberson D. Gender, marital status and the social control of health behavior. Social
Science & Medicine. 1992;34(8):907-17.
74. Asamane EA, Greig CA, Aunger JA, Thompson JL. Perceptions and Factors Influencing
Eating Behaviours and Physical Function in Community-Dwelling Ethnically Diverse Older
Adults: A Longitudinal Qualitative Study. Nutrients. 2019;11(6):1224.
75. Dean M, Raats MM, Grunert KG, Lumbers M. Factors influencing eating a varied diet in
old age. Public Health Nutrition. 2009;12(12):2421-7.
76. Sahyoun NR, Zhang XL. Dietary quality and social contact among a nationally
representative sample of the older adult population in the United States. The Journal of
Nutrition, Health & Aging. 2005;9(3):177-83.

126
CHAPTER 4:
THE ASSOCIATION BETWEEN NUTRIENT INTAKE,
NUTRITIONAL STATUS AND PHYSICAL FUNCTION OF
COMMUNITY-DWELLING ETHNICALLY DIVERSE OLDER
ADULTS: A LONGITUDINAL STUDY
This paper forms part of the second study of this PhD research and is in preparation for
submission to the journal Health Behaviour and Education as Asamane E.A, Greig C.A,
Thompson, J.L. The association between nutrient intake, nutritional status and physical
function: A longitudinal study.
The chapter seeks to address the following research questions:
1. What is the dietary intake, nutritional status and physical function of community-
dwelling older adults over time?
2. Is there a relationship between physical function, nutritional status and nutrient intake
among community-dwelling ethnically diverse older adults?

127
4.1 Abstract
There is limited longitudinal data regarding nutrient intake, nutritional status and physical
function in community-dwelling ethnically diverse older adults. This study explored these
variables and their relationship at baseline (n=100) and 8-months’ follow-up (n=81) among
community-dwelling ethnically diverse older adults (≥60 years) in Birmingham, United
Kingdom. Multiple pass 24-hour dietary recalls and the Mini Nutritional Assessment-Short
Form assessed nutritional intake and status, respectively. Short Physical Performance Battery
(SPPB) and handgrip strength measured physical function. Linear and multinomial regressions
were used to predict relationships between physical function, nutritional status and nutrient
intake. Mean (SD) age was 70 (8.1) years (60% male), with 62% being obese. Significant
decreases in intakes of vitamin B6 (0.88-0.77mg/day, p=0.014); vitamin B1 (0.73-0.63mg/day,
p=0.029); iron (6.16-5.85mg/d, p=0.045); folate (113.23-106.66µg/d, p=0.043); and
magnesium (154.54-144.59mg/d, p=0.031) occurred over time. At both time points, across
sexes, daily intake of all micronutrients except vitamin B12, phosphorus and manganese were
below the Recommended Nutrient Intakes (RNI). SPPB scores (Z=-4.01, p<0.001) and
nutritional status (Z=-2.37,p=0.018) significantly declined over time. At baseline, younger age,
better nutritional status, and higher vitamin D and fibre intakes were associated with higher
SPPB scores. At follow-up, higher SPPB scores (OR=0.54 95% CI 0.35, 0.81) were associated
with a slower decline in nutritional status. The observed declines in nutritional status and
physical function, and the inadequate nutrient intakes in the absence of weight loss within an
8-month period pose serious challenges to healthy ageing, identifying an urgent need to re-
evaluate and tailor appropriate dietary advice for this population.
128
4.2 Introduction
The world population is increasing and ageing rapidly, with developed countries having the
highest proportion of ageing populations compared to developing countries1. In the United
Kingdom (UK), there was a total of 11.2 million people aged 65+ years, representing 18% of
the population in 2016 2. It is projected that by 2030, one in five people will be aged 65+ years
comprising 21.8% of the population, with the proportion of those aged 75+ and 85+ comprising
6.8% and 3.2% of the population, respectively3. Furthermore, the UK population is becoming
increasingly ethnically diverse, with ethnic minorities significantly ageing alongside the white
population4. It is estimated that the first generation of Black and minority ethnic (BME) that
arrived in the UK around the 1950s and 60s are now above 65+ years. Also, according to the
findings from the 2011 Office for National Statistics (ONS), it is projected that by 2051, there
will be 3.8 million BME people aged 65+ years and 2.8 million BME aged 70+ years4. The
ageing and increasing ethnic diversity of the UK population has implications not only to the
quality of life of the individual but significantly impacts on health and social care systems, the
economy and the lives of family members2,5,6.
In the UK, many BMEs are often faced with lower socio-economic status and disproportionate
health inequalities, which accounts for the differences in health outcomes among ethnic
minorities and the white European population 7-9. For instance, as evident in the findings of the
Health Survey England (HSE), the prevalence of obesity among Black African women is 38%
(risk ratio 2.0), and 32.1% among Black Caribbean women (risk ratio 1.43) compared to 23%
in the general white British population of women 10. While recognising these differences in
health outcomes, dietary habits of BMEs have been shown to become unhealthy mainly due to
financial constraints, language barriers, age, availability of traditional foods, and years spent in
the host country11-13. For instance, a study in the UK found that older BME women with a mean

129
age of 70.5 years had inadequate intakes of vitamin D, selenium, magnesium and potassium,
and attributed reasons such as age, reduced physical activity and dietary restrictions to be
influencing dietary intake 11. Considering the ultimate role of diet as a modifiable factor in
obesity and related chronic diseases, and the limited literature regarding it, it is essential to
study the trends in nutrient intake particularly in this population with a relatively high
prevalence of obesity and diet-related chronic diseases10. Most studies exploring nutrient
intakes in ethnic minorities have focused only on south Asian population, single ethnic groups,
or mainly one sex limiting a clearer understanding of the differences shared within and between
ethnic minorities11,14,15. The present study is an initial step towards increasing knowledge on
the heterogeneity and gender differences in nutrient intakes over time among ethnic minority
older adults living in the super-diverse city of Birmingham.
Besides nutrition, the promotion and maintenance of good physical function are crucial in
improving quality of life, nutrient intake and reducing institutionalisation, hospitalisation and
mortality among older adults 16-18. Ethnic minority groups and older adults living in lower socio-
economic environments often have a lower physical function as compared to the general
population 19,20. Despite this, there are few studies exploring the risk factors, specifically the
impact of nutrient intake and nutritional status on the maintenance of better physical function
levels in this population. Published findings from non-ethnic minority community-dwelling
older adults have shown that good nutrition can improve and maintain higher physical
function21,22. For instance, a 5-year longitudinal study of 608 community-dwelling older adults
with a mean age of 70.8 years, found that a wider dietary variety was associated with a reduction
in the risk of functional decline 23. Considering these and the relatively higher risk of physical
function limitations within this population, it has become more pertinent to explore the profile

130
of nutrition and physical function, and their association over time among community-dwelling,
ethnically diverse older adults.
The few studies that have examined these variables within this population are usually cross-
sectional, with many employing a subjective measure of physical function and providing
limited information on dietary intake and nutritional status. Additionally, the cross-sectional
nature of these studies also hinders a deeper understanding of the impact of the time element
on the relationships between diet, nutritional status, and objectively measured physical
function. The present study uses a longitudinal approach aimed to: 1) provide a clearer
understanding of the profile of nutrient intake, nutritional status and objectively measured
physical function over time; and 2) explore how nutrient intake and nutritional status are
associated with physical function over time in this population.
4.3 Methods
4.3.1 Study Design and Setting
An observational longitudinal quantitative approach was used to gather nutrition and physical
function data over 8-months. The study was conducted in the Birmingham area, West Midlands,
UK. In this geographical location, ethnic minorities (non-white) comprise 46.9% of the
population, with the largest group being South Asians (comprising 22.5% of the total
population), and it is projected that ethnic minorities will become the majority of the population
by 2021 24,25.
4.3.2 Participants and Recruitment
The sample included community-dwelling, ethnically diverse older adults aged 60 years and
older, and self-identifying as Pakistani, Indian, Bangladeshi, Caribbean and/or African. In
addition to these, other inclusion criteria encompassed residing in the Birmingham area, non-

131
institutionalised and with no known diagnosis of dementia or any mental illness that will impair
participation. A convenience sample of 100 participants were recruited through community
centres, age-well societies, faith/religious centres and other informal social events by word of
mouth. The rationale was to recruit a more representative sample, thus maximum variation
technique was introduced after recruiting 60 participants 26. Baseline data were collected from
March 2017 to May 2018, with follow-up assessments conducted from October 2017 to
February 2019.
4.3.3 Measures
There were four different contact points for data collection, two completed within 14 days at
baseline and repeated in the same format after eight months of follow-up. Socio-demographic
data including date of birth, sex, marital status, educational status, faith, ethnicity, and years
residing in the UK were collected using a bespoke questionnaire, at baseline and at follow-up.
The Index of Multiple Deprivation (IMD) was computed as an indicator of deprivation using
the participant’s postcode 27. Weight was measured to the nearest 0.1kg and height to the nearest
0.1 cm, using a Seca 899 digital scale and Seca 213 portable stadiometer, respectively. Body
Mass Index (BMI) was calculated using the standard equation; weight (kg)/height2 (m2). Waist
circumference (WC) was measured and recorded to the nearest 0.01cm using a flexible
retractable non-elastic tape.
4.3.4 Dietary Assessment
Dietary intake was assessed using the multiple pass 24-hour recall, following standard
procedures 28. EAA, a trained nutritionist with relevant expertise in conducting dietary
assessments, conducted all assessments with regular data checks from JLT, a Professor of
Public Health Nutrition and Exercise, with extensive experience in dietary assessments in
diverse populations. A culturally-appropriate food portion booklet containing ethnic minority

132
foods, accompanied by standard household food measures, were used to estimate portion sizes
29. In total, four 24-hour recalls were collected, two non-consecutive days each at baseline and
at follow-up. In instances where participants had fasted within the previous 24 hours, the record
was discarded, and a new day assigned to retake the record (n=17). All 24-hour recall interviews
were digitally recorded to enhance the quality of the data during data entry. Detailed recipes
were gathered for home-cooked meals, and brand names and cooking methods were recorded
during interviews. In addition, nutrient supplement usage was collected during dietary
assessments. After each visit, the multiple pass 24-hour recall data were checked for accuracy
using the interviews before entering these data for processing into a dietary software analysis
package, Dietplan 7.0 (Forestfield Software Ltd, Horsham, West Sussex, UK). Dietplan 7 was
appropriate as it utilises UK-specific databases such as McCance and Widdowson, as well as
relevant ethnic minority food databases. In instances that a food item could not be found in the
software databases, these were added to the database using food manufacturing websites and
other food composition tables. Nutrient data obtained from the analysis were compared with
the age and sex-specific UK Dietary Reference Values (DRV)30.
4.3.5 Nutritional Status
Participants’ nutritional status was assessed using the Mini-Nutritional Assessment-Short Form
(MNA-SF). This is a simple to use, sensitive, reliable, and valid tool for rapid assessment of
nutritional status of older adults 31. Unlike the full MNA, the short form is more rapid (can be
completed within 10 minutes) and equally reliable to the full MNA 32,33. Given the validity and
quick administration, it was the preferred option to assess nutritional status as it reduces
participant burden during data collection. The MNA-SF is composed of six major items and
has a scoring of 0-14 points, with 0-7 classified as malnourished, 8-11 classified as at risk of
malnutrition, and 12-14 classified as normal 33.

133
4.3.6 Physical Function
The Short Physical Performance Battery (SPPB) was used to measure participants’ lower body
extremity function 17,34. SPPB has been widely validated to measure accurate physical function
and serves as a prediction of mobility, disability and mortality in older adults 16. SPPB includes
a balance test conducted in side by side, semi-tandem, and tandem positions, as well as 4-metre
walk test at one’s self-selected ‘natural’ pace, and a test of their ability to rise 5 times from a
chair as quickly as possible. The maximum score from these three components makes up a total
score of 12 on the SPPB; a score of 0 indicates worst performance while a score of 12 indicates
the best performance.
Handgrip Strength (HGS) was also used to measure physical function. HGS was measured in
kilogram (Kg) using a Jamar hand dynamometer (Sammons Preston, Inc., Bolingbrook, IL) per
the NHANES protocol for measuring handgrip in the standing position, with arms by the side
35. Handle width was adjusted to hand size, and each measurement performed three times 36.
The standing position was chosen as it has been shown to produce maximal grip strength as
compared to the other positions in measuring HGS 37.
4.3.7 Statistical Analysis
Nutrient density was computed by dividing the nutrient intake by the total energy intake and
multiplying it by 1000kcal/day 38. Descriptive statistics were carried out to determine the mean
(SD) nutrient intake, nutritional status and physical function at baseline and follow-up.
Independent T-test and chi-square test were conducted to test for differences in continuous and
categorical variables, respectively, at both time points. The Wilcoxon signed-rank test was used
to test for median differences in instances where the continuous variables failed to meet the
assumptions for a t-test. Prior to conducting the above analyses, normality was tested using
Shapiro-Wilk test and Q-Q plots. Marital status was later regrouped as married and not married,

134
educational status was regrouped as educated and not educated, the number of diseases grouped
as number of diseases ≤2 and number of diseases >2, and ethnicities regrouped as South Asian
(Pakistanis, Indians and Bangladeshis), African-Caribbean (Africans and Caribbean), and
‘other ethnicity,’ (mixed ethnicities). Given the smaller numbers in each group, these
regroupings were done to satisfy the assumptions needed to run some of the analyses.
For energy and macronutrient intakes, both mean (SD) and median (IQR) were presented.
Micronutrient intakes and all other variables that satisfied normally distributed characteristics
were presented as mean (SD), while those that were not normally distributed were presented as
median (IQR). Categorical variables were presented as number (N) and percentages. The
percentage of nutrient intake of the RNI defined for that nutrient was computed to ascertain
whether the participant met the recommendations39. One-way ANOVA and Kruskal Wallis
were performed to examine any differences in nutrient intake by ethnicities.
To ascertain baseline associations, a pairwise correlation was conducted. Next, variables that
were correlated with physical function (p <0.05), were built into a hierarchical model to test the
predictors of physical function (SPPB and HGS) while controlling for variables of interest. For
longitudinal tests of associations, the difference in physical function between both time points
was computed and classified into the following groups: improved, declined and stable. In
logistic regression, the improved/stable and declined groups were used as outcome variables to
test factors predicting changes in physical function at follow-up.
Given the very small proportion of the malnourished group, the at-risk of malnutrition and the
malnourished groups were combined to form malnourished/at-risk of malnutrition group, while
the normal nutritional status group was maintained as originally defined. To assess alterations
in nutritional status at follow-up, changes were computed as either changing or maintaining

135
one’s classification within these two groups, the malnourished/at-risk of malnutrition and the
normal group. Given this, 4 groups were formed: 1) those who remained in the malnourished/at-
risk of malnutrition at follow-up; 2) those who declined from the normal to the malnourished/at-
risk of malnutrition group; 3) those who improved from malnourished/at-risk of malnutrition
to the normal group; and 4) those who remained in the normal group. In a separate multinomial
regression using changes in nutritional status as the dependent variable, physical function,
nutrient intake and other related variables were used to predict the group membership of
nutritional status at follow-up. All statistical analyses were conducted using IBM SPSS version
25 (IBM Corp, Armonk, NY, 2012) with significance set at p <0.05.
4.4 Results
Sociodemographic and other health-related data for participants at baseline and after 8 months
of follow-up are presented in table 10. Data were collected for 100 participants at baseline and
81 participants at follow-up. Of the 19 of participants who did not complete the study, 5 did not
continue due to sickness, 8 were no longer interested, and the remaining 6 could not be reached
during follow-up. At baseline the mean (SD) age was 70.8 (8.1), with 59% male. Most of the
participants were married and had a University or college degree.
Older adults that completed the study had a significantly higher SPPB (P=0.007), HGS
(p=0.027) and lower WC (p=0.036) as compared to those lost to follow-up (n=19). All other
variables of interest were not significantly different (See supplementary file B1).

136
Table 10: Socio-demographic characteristics and other health-related information at baseline
and 8-months’ follow-up.
Variables Baseline (n=100) Follow-up (n=81)
Age, years Mean (SD) 70.8 (8.1) 70.7 (8.2)
Male N (%) 59 (59.0) 50 (62.0)
Ethnicity N (%) Pakistani 23 (23.0) 15 (18.5)
Indian 7 (7.0) 5 (6.2)
Bangladeshi 4 (4.0) 2 (2.5)
Caribbean 41 (41.0) 38 (46.9)
African 19 (19.0) 15 (18.5)
Others 6 (6.0) 6 (7.4)
Marital status N (%) Single 4 (4.0) 3 (3.7)
Married 66 (66.0) 55 (67.9)
Divorced 14 (14.0) 12 (14.8)
Widowed 16 (16.0) 11 (13.6)
Faith/Religion N (%) No religion 1 (1.0) 1 (1.2)
Hindu 2 (2.0) 2 (2.5)
Sikh 7 (7.0) 4 (5.0)
Muslim 34 (34.0) 24 (29.6)
Christian 56 (56.0) 50 (61.7)
Education N (%) No education 16 (16.0) 11 (13.6)
Primary 16 (16.0) 14 (17.3)
Secondary 21 (21.0) 15 (18.5)
College/University 47 (47.0) 41 (50.6)
Self-rated health N (%) Excellent 18 (18.0) 16 (19.7)
Good 55 (55.0) 45 (55.6)
Fair 16 (16.0) 11 (13.6)
Poor 11 (11.0) 9 (11.1)
No. of diseases Mean (SD) 2.0 (1.4) 2.1 (1.4)
IMD Decile N (%) 1 (Most deprived) 33 (33.0) 29 (35.8)
2 19 (19.0) 19 (23.4)
3 22 (22.0) 11 (13.6)
4 (least deprived) 26 (26.0) 22 (27.2)
BMI categories* N (%) Normal 7 (7.0) 9 (11.1)
Overweight 31 (31.0) 21 (25.9)
Obese 62 (62.0) 51 (63.0) aNutritional status by
MNA-SF N(%)**
Malnourished 2 (2.0) 1 (1.2)
At- risk of malnutrition 22 (22.0) 29 (35.8)
Normal 76 (76.0) 51 (63.0)

137
aSPPB score Median (IQR) ** 11.1 (4.0) 10.0 (4.0)
HGS Mean (SD) 27.6 (9.8) 26.5 (9.5)
WC Mean (SD) 100.3 (10.6) 100.8 (10.6)
SD= Standard deviation; IQR= Interquartile range; IMD= Index of Multiple Deprivation; BMI= Body Mass
Index; MNA-SF= Mini-Nutritional Assessment-Short Form; HGS= Handgrip Strength; WC= Waist
circumference
*WHO guidance on BMI thresholds for Asian populations (World Health Organization, 2004) was used to
categorise BMI of South Asian participants, and the standard BMI categories were used for Caribbean and
African participants.
** p<0.05 a Wilcoxon Rank test used to examine median differences.
4.41 Energy and nutrient intakes
The Mean (SD) and median (IQR) values for energy and nutrient intakes are reported in table
11. There was no significant difference in energy intake over time (p=0.393 for males and
p=0.656 for females). In addition, the intakes for both sexes at both time points were below the
estimated average requirement based on the population with low physical activity levels. There
was a significant decrease in polyunsaturated fatty acids intakes for females only at 8-months’
follow-up (P=0.04) (Table 11). There were statistical median decreases for the following
micronutrients: vitamin B6 (0.88-0.77 mg/day, z=-2.45, p= 0.014); vitamin B1 (0.73-0.63
mg/day, z= -2.19, p= 0.029); iron (6.16-5.85 mg/day, z=-2.01, p=0.045); folate (113.23-106.66
µg/day, z=-2.01, p=0.043); and magnesium (154.54-144.59 mg/day, z=-2.16, p=0.031). All
other nutrient intakes were not significantly different over time. Macronutrient intakes at both
time points were compared with the UK Dietary Reference Values (DRVs). As shown in table
11, the mean percentage Total Energy (%TE) from carbohydrates at baseline and follow-up for
both sexes were slightly above the DRV. However, fibre intakes at both time points for both
sexes were below the DRV. At both time points, regardless of the sex, mean %TE from protein
was well above the DRV. Also, the %TE from fat at both time points for females were below
the DRV (31.3% and 32.3%, respectively, vs 35%). However, the %TE from fat for males at

138
baseline was below the DRV (34.3% vs 35%), and at follow-up was above the DRV (38.2% vs
35%).

139
Table 11: Energy and macronutrient intake of community-dwelling, ethnically diverse older adults at baseline and follow-up (N=81)
Baseline Follow-up
Nutrient intake Sex Mean (SD) Median (IQR) Mean (SD) Median (IQR) RNI ** P-values*
Energy Kcal/day Male 1884.6 (518.2) 1853.8 (609.6) 1965.0 (686.5) 1822 (797.8) 2103.3-2366.2 0.393
Female 1514.5 (428.3) 1358.5 (526.5) 1354.5 (498.5) 1243.5 (676.0) 1673.0-1888.1 0.065
Carbs g Male 230.2 (61.9) 223.8 (60.9) 248.9 (72.1) 234.8 (83.0) - 0.104
Female 195.4 (60.9) 201.1 (95.3) 178.2 (74.0) 161.8 (84.5) 0.189
%TE Carbs Male 50.2 (11.6) 48.2 (17.7) 53.5 (10.8) 52.7 (16.4) 50 0.101
Female 51.8 (8.9) 50.2 (9.2) 52.1 (9.2) 52.3 (14.5) 0.883
Fibre g/day Male 18.3 (7.3) 17.2 (10.0) 20.3 (10.8) 19.1 (10.5) 30 0.192
Female 17.1 (7.9) 15.0 (10.7) 14.1 (7.5) 12.8 (9.5) 0.084
Protein g Male 79.1 (25.3) 74.2 (28.7) 77.6 (34.4) 73.9 (41.5) 0.736
Female 68.0 (23.0) 57.5 (36.6) 58.6 (23.4) 53.2 (28.2) 0.070
Protein g/kg/day Male 1.02 (0.40) 0.94 (0.44) 0.98 (0.48) 0.90 (0.51) 1.0-1.2g/kg40 0.754
Female 0.93 (0.33) 0.86 (0.50) 0.80 (0.37) 0.76 (0.38) 0.183
%TE Protein Male 17.0 (3.9) 16.8 (5.3) 15.8 (4.2) 15.3 (3.9) 15 0.127
Female 18.1 (4.4) 17.7 (4.8) 18.0 (5.9) 18.0 (6.7) 0.912
Fats g Male 75.3 (40.8) 73.6 (49.2) 73.5 (44.7) 66.6 (39.5) - 0.816
Female 53.3 (20.2) 53.0 (33.7) 48.8 (22.4) 41.6 (29.9) 0.319
%TE Fats Male 34.3 (10.8) 36.3 (16.5) 38.1 (37.6) 32.4 (12.8) 35 0.453
Female 31.6 (8.6) 31.3 (14.4) 32.3 (7.0) 31.1 (10.3) 0.724
Saturated fats g Male 24.2 (14.5) 22.2 (17.5) 28.9 (28.0) 23.6 (17.2) - 0.203
Female 17.5 (8.9) 16.9 (12.4) 17.2 (10.7) 14.0 (8.5) 0.885
%TE Saturated
fats
Male 11.2 (4.8) 11.0 (6.7) 11.3 (4.3) 11.1 (6.0) 11 0.885
Female 10.4 (4.6) 9.7 (4.8) 11.2 (4.2) 10.8 (6.7) 0.445

140
MUFA g Male 24 (14.0) 22.8 (17.2) 24.8 (16.9) 20.6 (15.2) - 0.742
Female 17.6 (8.3) 17.9 (12.1) 16.1 (9.2) 14.6 (8.8) 0.385
%TE MUFA Male 11.1 (4.6) 11.3 (6.1) 10.3 (3.8) 10.6 (6.0) 12 0.310
Female 10.4 (3.9) 10.4 (4.8) 10.5 (36) 10.4 (3.6) 0.889
PUFA g Male 13.9 (10.2) 10.5 (8.8) 15.4 (14.6) 10.9 (13.5) 0.460
Female 8.9 (4.1) 9.7 (7.1) 7.2 (3.7) 6.2 (3.6) 0.040
% TE PUFA Male 6.3 (3.4) 5.7 (3.2) 6.7 (5.9) 5.5 (5.1) 0.626
Female 5.2 (2.0) 4.9 (3.0) 4.8 (1.7) 4.8 (2.5) 0.292
%TE= Percentage of Total Energy; RNI = reference nutrient intake SD = Standard deviation; IQR =interquartile Range; g= gram
*P values showing significant difference in nutrient intake for the two time points; ** Department of Health (1991) and Scientific Advisory Committee on
Nutrition (2012).
Additionally, one-way ANOVA and Kruskal Wallis for normally and non-normal distributed data, respectively, were performed to determine the
intakes of energy and macronutrients by ethnicities. The ethnicities within the study were combined to form three main ethnicities: South Asian,
comprised of Pakistanis, Indians and Bangladeshis; African-Caribbean, comprised of African and Caribbean; and ‘other,’ comprised of mixed
ethnicities. As shown in table 12, at both time points, South Asians reported significantly higher intakes of energy (p=0.003) and %TE PUFA
(p<0.001). Also, South Asians reported significantly higher intakes of %TE total fat at follow-up (p=0.048).

141
Table 12: Energy and Macronutrient contribution to energy by ethnicity over time
Baseline (n=100) Follow-up (n=81)
South Asian
(n= 34)
African/Caribbean
(n= 60)
Others
(n= 6) P-value
South Asian
(n= 22)
African/Caribbean
(n= 53)
Others
(n= 6) P-value
Energy kcal/day 1900.5 1615.8 1873.3 0.003 1969.8 1470.0 1641.5 0.003
%TE Carbs 48.6 49.0 43.9 0.625 48.3 55.4 53.0 0.141
%TE Sugars 12.1 15.1 17.4 0.119 14.9 17.4 20.5 0.056
%TE Protein 16.4 17.7 13.8 0.013 15.3 16.4 13.8 0.444
%TE Fats 37.6 32.4 42.8 0.019 36.6 30.1 31.3 0.048
%TE Saturated fats 10.0 10.8 13.0 0.687 12.0 10.7 12.1 0.329
%TE Monounsaturated 11.1 11.3 13.4 0.385 10.8 10.4 11.3 0.768
%TE Polyunsaturated 7.2 4.9 7.0 <0.001 8.1 4.3 5.6 <0.001
Fibre intake g/day 16.0 15.0 20.6 0.256 17.2 15.9 20.3 0.285

142
4.4.2 Micronutrients intake over time compared with RNIs
In total, 39% (56% Female) and 35% (54% females) of the participants reported taking
micronutrient supplements during baseline and follow-up assessments, respectively. The most
common supplements reported included multivitamins, vitamin C, vitamin D, iron and calcium.
A sensitivity analysis was conducted to ascertain differences in nutrient intakes with or without
supplement intakes at both time points. At baseline for females, there were significant
differences in intakes with and without supplementation in relation to vitamin D, vitamin A,
vitamin E, thiamine, riboflavin, niacin, vitamin B6, vitamin B12, folate and vitamin C intakes
(Supplementary file B2). For males, there were significant differences in the intakes of vitamin
A, vitamin D, vitamin E, vitamin C and folate between intakes with supplementation and
intakes without supplementation (Supplementary file B2). Similar to baseline, micronutrient
intakes with and without supplementation for females differed in vitamin A, vitamin D, vitamin
B1, vitamin E vitamin B6, vitamin B12, vitamin C and manganese intakes at follow-up
(Supplementary file B3). However, there were no significant differences in intakes with and
without supplementation for males at follow-up (Supplementary file B3).
The intakes with and without supplementation at both time points were compared with the UK
Recommended Nutrient Intakes (RNI), and represented in figures 16 and 17 as the percentage
of RNI intakes. Figure 16 shows baseline micronutrient intakes expressed as a percentage of
RNI; except for intakes of vitamin B12, phosphorus and manganese for both sexes, all other
micronutrient intakes were below the RNI. Females additionally met the RNI for vitamin A,
vitamin E, vitamin C, thiamine and niacin. At follow-up, the pattern was similar for both males
and females; except for phosphorus, manganese, vitamin C and vitamin B12, all other
micronutrients were below the RNI.

143
Pot
assium
mg/
day
Mag
nesium
mg/
day
Calcium
mg/
day
Iron
mg/
day
Zinc m
g/da
y
Selen
ium
µg/
day
Iodine
µg/
day
Sod
ium
mg/
day
Pho
spho
rusm
g/da
y
Cop
per m
g/da
y
Chlor
ine
mg/
day
Man
gane
se m
g/da
y
Folat
e m
g/da
y
Vita
min C
mg/
day
Vita
min A
(Ret
inol) µ
g/da
y
Vita
min D
µg/
day
Vita
min E
µg/
day
Thiam
ine
mg/
day
Ribof
lavin
mg/
day
Niacin
mg/
day
Vita
min B
6 m
g/da
y
Vita
min B
12 µ
g/da
y
0
50
100
150
200
Baseline nutrient intakes by percentage of RNI
Micronutrient intakes
Perc
enta
ge o
f R
NI
Male with supplementation
Male without supplementation
Female with supplementation
Female without supplementation
Figure 16: Percentage nutrient intakes by UK RNI with and without supplements at baseline

144
Pot
assium
mg/
day
Mag
nesium
mg/
day
Calcium
mg/
day
Iron
mg/
day
Zinc m
g/da
y
Selen
ium
µg/
day
Iodine
µg/
day
Sod
ium
mg/
day
Pho
spho
rusm
g/da
y
Cop
per m
g/da
y
Chlor
ine
mg/
day
Man
gane
se m
g/da
y
Folat
e m
g/da
y
Vita
min C
mg/
day
Vita
min A
(Ret
inol) µ
g/da
y
Vita
min D
µg/
day
Vita
min E
µg/
day
Thiam
ine
mg/
day
Ribof
lavin
mg/
day
Niacin
mg/
day
Vita
min B
6 m
g/da
y
Vita
min B
12 µ
g/da
y
0
100
200
300
400
Follow-up nutrient intakes by percentage of RNI
Micronutrient intakes
Perc
enta
ge o
f R
NI
Male with supplementation
Male without supplementation
Female with supplementation
Female without supplementation
Figure 18: Percentage nutrient intakes by UK RNI with and without supplements at follow-up
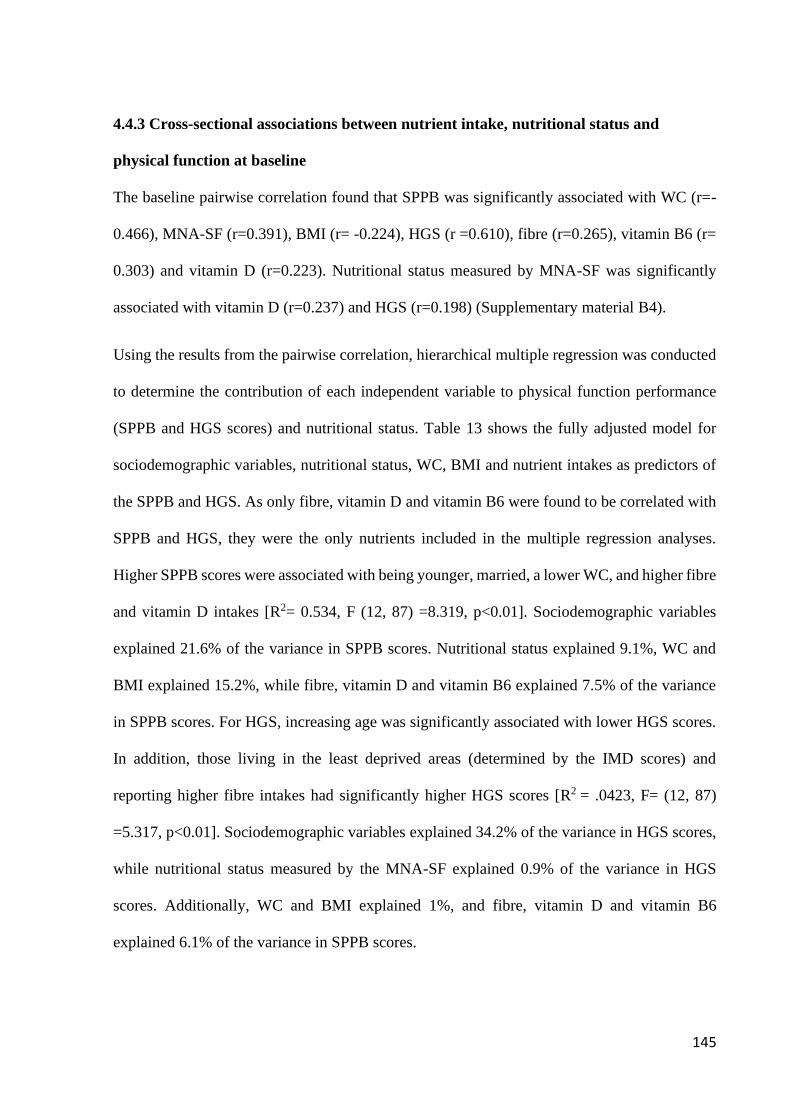
145
4.4.3 Cross-sectional associations between nutrient intake, nutritional status and
physical function at baseline
The baseline pairwise correlation found that SPPB was significantly associated with WC (r=-
0.466), MNA-SF (r=0.391), BMI (r= -0.224), HGS (r =0.610), fibre (r=0.265), vitamin B6 (r=
0.303) and vitamin D (r=0.223). Nutritional status measured by MNA-SF was significantly
associated with vitamin D (r=0.237) and HGS (r=0.198) (Supplementary material B4).
Using the results from the pairwise correlation, hierarchical multiple regression was conducted
to determine the contribution of each independent variable to physical function performance
(SPPB and HGS scores) and nutritional status. Table 13 shows the fully adjusted model for
sociodemographic variables, nutritional status, WC, BMI and nutrient intakes as predictors of
the SPPB and HGS. As only fibre, vitamin D and vitamin B6 were found to be correlated with
SPPB and HGS, they were the only nutrients included in the multiple regression analyses.
Higher SPPB scores were associated with being younger, married, a lower WC, and higher fibre
and vitamin D intakes [R2= 0.534, F (12, 87) =8.319, p<0.01]. Sociodemographic variables
explained 21.6% of the variance in SPPB scores. Nutritional status explained 9.1%, WC and
BMI explained 15.2%, while fibre, vitamin D and vitamin B6 explained 7.5% of the variance
in SPPB scores. For HGS, increasing age was significantly associated with lower HGS scores.
In addition, those living in the least deprived areas (determined by the IMD scores) and
reporting higher fibre intakes had significantly higher HGS scores [R2 = .0423, F= (12, 87)
=5.317, p<0.01]. Sociodemographic variables explained 34.2% of the variance in HGS scores,
while nutritional status measured by the MNA-SF explained 0.9% of the variance in HGS
scores. Additionally, WC and BMI explained 1%, and fibre, vitamin D and vitamin B6
explained 6.1% of the variance in SPPB scores.

146
Table 13: Hierarchical multiple regression predicting Short Physical Performance Battery (SPPB) and handgrip strength scores
SPPB Handgrip (kg)
Predictors B (95% CI) SE p-value R2 change B (95% CI) SE p-value R2 change
(Constant) 24.52 (16.40, 32.64) 4.09 <0.001 69.48 (42.33, 96.63) 13.66 <0.001
Sociodemographic variables
Male vs female -0.05 (-1.11, 1.01) 0.53 0.930 0.216 -3.02 (-6.56, 0.52) 1.78 0.093 0.342
Age -0.09 (-0.15, -0.03) 0.03 <0.001 -0.45 (-0.65, -0.25) 0.1 <0.001
Married vs not married -1.34 (-2.45, -0.24) 0.55 0.020 -0.53 (-1.30, 0.24) 0.39 0.177
IMD 0.14 (-0.09, 0.37) 0.12 0.240 -1.41 (-2.66, -0.15) 0.63 0.028
No education vs Education -1.23 (-2.64, 0.18) 0.71 0.090 1.17 (-3.54, 5.88) 2.37 0.623
Number of diseases -0.26 (-0.64, 0.11) 0.19 0.170 -2.87 (-6.56, 0.82) 1.85 0.125
Nutritional status (by MNA-SF) 0.39 (0.10, 0.67) 0.14 0.010 0.091 0.16 (-0.78, 1.10) 0.47 0.732 0.009
WC -0.15 (-0.22, -0.09) 0.03 <0.001 0.152 -0.05 (-0.52, 0.42) 0.24 0.834 0.010
BMI 0.12 (-0.02, 0.26) 0.07 0.090 -0.06 (-0.28, 0.16) 0.11 0.579
Nutrient intakes
Fibre 0.08 (0.02, 0.15) 0.03 0.010 0.075 0.28 (0.07, 0.50) 0.11 0.011 0.061
Vitamin D -0.04 (-0.12, 0.04) 0.04 0.340 -0.19 (-0.45, 0.08) 0.13 0.164
Vitamin B6 1.33 (0.35, 2.32) 0.49 0.010 1.33 (-1.95, 4.62) 1.65 0.421
Total R2 0.534 0.423
Note N=100; WC= Waist Circumference; IMD= Index of Multiple Deprivation; BMI= Body Mass Index; MNA-SF= Mini-Nutritional Assessment-Short
Form.

147
A hierarchical multiple regression was conducted to test the association of nutritional (MNA-
SF) and physical function while controlling for all confounders (see Table 14). This was to
determine the impact of nutrient intake and physical function (SPPB and HGS) as predictors of
nutritional status. SPPB was the only predictor of nutritional status, with no other variables
being significantly associated with nutritional status [R2 = .0278, F=(14, 85)=2.334, p=0.009].
After controlling for all confounders, higher SPPB scores were associated with better nutritional
status. Physical function explained 9.6% of the variance in nutritional status.
Table 14: Results from hierarchical linear regression analyses with socio-demographic, WC,
BMI and physical function as predictors of nutritional status (N= 100).
Predictors B (95%CI) SE P-value R2 change
(Constant) 8.50 (1.57, 15.44) 3.47 0.017
Sociodemographic variables
Male vs female 0.17 (-0.61, 0.96) 0.39 0.664 0.107
Age 0.02 (-0.03, 0.07) 0.02 0.379
Married vs not married -0.34 (-1.16, 0.49) 0.41 0.420
IMD -0.14 (-0.31, 0.03) 0.09 0.112
No education vs Education 0.27 (-0.78, 1.33) 0.53 0.607
Number of diseases -0.24 (-0.52, 0.03) 0.14 0.085
WC -0.02 (-0.04, 0.07) 0.03 0.535 0.017
BMI 0.01 (-0.11, 0.10) 0.05 0.953
Physical function
SPPB 0.25 (0.08, 0.42) 0.09 0.004 0.096
HGS -0.03 (-0.08, 0.03) 0.03 0.253
Nutrient intakes
Fibre 0.02 (-0.03, 0.06) 0.02 0.530 0.036
Vitamin D -0.05 (-0.11, 0.01) 0.03 0.092
Vitamin B6 -0.15 (-0.90, 0.59) 0.37 0.687
Total R2 0.256
WC= Waist Circumference; IMD= Index of Multiple Deprivation; BMI= Body Mass Index;
HGS= Handgrip strength; SPPB= Short Performance Physical Battery

148
4.4.4 Longitudinal associations: Changes in nutritional status and physical function over
time
There were significant changes in nutritional status measured using MNA-SF, and physical
function using SPPB scores over time, (Z=-2.37,p=0.018) and (Z=-4.01, p<0.001) respectively
(Table 10). Per the MNA-SF cut-offs, 24% were malnourished/at-risk of malnutrition, and the
remaining (76%) were normal at baseline. At follow-up, 37% were malnourished/at-risk of
malnutrition, and remaining (63%) were normal. In summary, the proportion of people
reporting normal status reduced, while those reporting malnourished/at-risk of malnutrition
increased by 13% at follow-up. The changes in nutritional status were: 1) those who remained
malnourished/at-risk of malnutrition at follow-up (12.3%); 2) those who changed to
malnourished/at-risk of malnutrition at follow-up (24.7%); 3) those who changed to normal at
follow-up (n=8.6%); and 4) those who remained normal at follow-up (54.3%). Using the
remained normal at follow up as the reference category in a multinomial regression (Table 15),
the results indicate no significant predictors were determining the likelihood of remaining
malnourished/at-risk of malnutrition as compared to the reference group. However, participants
with a higher SPPB score (OR= 0.61) were less likely to change to being malnourished/at-risk
of malnutrition. Conversely, participants with a higher BMI (OR=1.29) or WC (OR= 1.10) were
more likely to change to being malnourished/at-risk of malnutrition compared to the reference
group.

149
Table 15: Multinomial regression of factors predicting nutritional status membership at follow-up (n=81)
Remained at Risk/Malnourished Changed to at-Risk/Malnourished Changed to Normal
B SE OR (95% CI) B SE OR (95% CI) B SE OR (95% CI)
Intercept -0.14 11.2 1.39 7.29 -25.66 15.25
BMI 0.19 0.2 1.21 (0.81-1.80) 0.26 0.12 1.29 (1.01-1.65)* 0.29 0.31 1.34 (0.72-2.48)
HGS -0.08 0.1 0.92 (0.75-1.13) -0.16 0.07 0.85 (0.74-0.98) -0.16 0.13 0.85 (0.66-1.11)*
WC -0.12 0.1 0.89 (0.73-1.08) 0.09 0.06 1.10 (0.97-1.24)* 0.39 0.18 1.48 (1.04-2.10)
Age 0.06 0.09 1.07 (0.90-1.27) 0.12 0.06 1.13 (1.00-1.28) 0.36 0.14 1.43 (1.09-1.87)
IMD 0.21 0.46 1.23 (0.50-3.05) 0.40 0.19 1.49 (1.03-2.16)* 1 0.38 2.71 (1.30-5.68)*
SPPB -0.26 0.32 0.77 (0.41-1.45) -0.49 0.22 0.61 (0.40-0.94)* -0.85 0.45 0.43 (0.18-1.03)
Fibre -0.28 0.15 0.75 (0.56-1.02) -0.1 0.06 0.91 (0.81-1.02) -0.07 0.11 0.93 (0.75-1.15)
Vitamin D 0.16 0.13 1.18 (0.92-1.51) -0.05 0.1 0.95 (0.78-1.16) 0.12 0.18 1.13 (0.79-1.60)
Vitamin B6 1.17 1.53 3.23 (0.16-64.96) 0.05 0.78 1.05 (0.23-4.79) 0.11 1.44 1.12 (0.07-18.7)
Male 3.07 1.9 21.56 (0.52-892.87) 0.5 0.8 1.64 (0.34-7.90) -1.53 1.86 0.22 (0.01-8.31)
Female 1 1 1
Married 0.2 1.41 1.22 (0.08-19.22) 0.93 0.93 2.54 (0.41-15.67) 1.76 2.08 0.25 (0.10-3.43)
No married 1 1 1
Educated 2.55 1.9 12.85 (0.31-527.7) 1.20 1.07 3.32 (0.41-26.83) -16.41 0 0.743 (0.07-0.09)
No education 1 1 1
Number diseases ≤2 -0.54 1.81 0.59 (0.02-20.21) -1.28 0.93 0.28 (0.05-1.71) -2.18 1.9 0.25 (0.03-4.69)
Number diseases >2 1 1 1
Note Reference category: Remained Normal; OR= Odds Ratio, SE= Standard Error, 95% CI = Confidence Interval; SPPB=Short Physical Performance
Battery; IMD= Index of Multiple Deprivation; BMI= Body Mass Index; R2= 0.63 (Nagelkerke) **P value <0.01 *P value <0.05

150
Regarding SPPB at follow-up, 35.8% remained stable, 47% had a lower score, and 17.2%
improved their score. Computed into two groups, improved/stable and decline served as
outcome variables in a logistic regression performed to determine the significant predictors of
changes in SPPB at follow-up. Baseline MNA-SF scores, WC, sex, age, IMD, educational
status, marital status and nutrient intakes were entered as predictors. The results indicate that
with an increase in age (OR= 1.105, p= 0.005) or increase in the number of diseases reported
(OR= 1.63, P=0.033), participants were more likely to experience a decline in physical function
than to improve or remain stable. All other variables showed no significant association with the
changes in physical function (See details in supplementary file B5).
4.5 Discussion
This study provides unique and potentially useful evidence regarding the profile of nutrient
intakes, nutritional status, and physical function, and their relationships over time, in a sample
of ethnically diverse community-dwelling older adults. These findings are particularly relevant
as they add to existing literature to broaden our understanding of the relationship of diet and
components of healthy ageing within a population challenged with high health inequalities, and
a high prevalence of diet-related diseases as compared to the general population 8-10. These
findings are both timely and pertinent given the growing ethnic diversity in the UK and some
parts of Europe, highlighting the need to tailor culturally adapted interventions specifically
around diet and physical function to support this group to age more healthfully 4,41.
The intakes of energy and most nutrients remained unchanged, except decreases in the daily
intakes of magnesium, folate, vitamin B1, vitamin B6 and iron. The no differences observed
in energy intakes concurs with the findings of a 10-year longitudinal study of 25 South Asian
women (mean age of 54.2 years) in Glasgow 42. This study used a 7-day weighed food dairy
and found no significant difference in energy intake. However, the findings contrast sharply

151
with the Melbourne Chinese Cohort Study, composed of 262 Chinese adults with a mean age
>50 years 43. The authors found that intakes of energy, fats, fibre and protein increased
significantly over eight years among women, but not men. Among men, the only significant
change was a decrease in carbohydrate intake. This study utilised FFQ, which has been found
to overestimate nutrient in older adults 28. This coupled with the failure of the authors to account
for an increase in nutrient supplement intakes at follow-up, could be accounting for the
differences. Additionally, the relatively shorter duration of follow-up in the present study as
compared to the study above could also explain the differences. Furthermore, as previously
reported in this sample, eating patterns appears to be due to cultural and religious purposes
rather than health reasons, specifically in older adults, which could have accounted for the
stability of energy and macronutrient intakes over time44.
In the context of the broader literature, the energy intakes observed over time in this study were
comparable with those of the energy intakes of predominately white older adults in the UK aged
65+ years as reported in the National Diet and Nutrition Survey (NDNS) 45. Also, the energy
intakes of males in the present study (1853.8 kcal/day baseline and 1822 kcal/day follow-up)
were comparable to energy intakes of males in the Newcastle 85+ cohort (1848 kcal/day), but
those of females (1358.5 kcal/day baseline and 1243.5 kcal/day follow-up) were less than the
female energy intake values reported in the Newcastle 85+ cohort (1471 kcal/day) 46.
Additionally, the %TE from carbohydrates, protein, MUFA, and PUFA in the present study
were higher, while the %TE from saturated fat was lower than the Newcastle 85+ cohort 46. It
has been observed that the traditional foods of ethnic minorities, with the exception of South
Asian diets, are relatively higher in %TE from carbohydrate and lower in %TE from fats
(including saturated fats), as compared to western diets 47-49. Hence, this difference in food
composition between these ethnic groups and the disparity in age between the present sample

152
and the Newcastle 85+ cohort might be accounting for the differences in energy and
macronutrient intakes observed. The relatively high total energy and %TE from fats within the
South Asian diets were also confirmed in this study, with participants identifying as South
Asian having significantly higher intakes of total energy and %TE from fats as compared to
those identifying as being African-Caribbean.
Another key finding from the present study is the consumption of inadequate amounts of
micronutrients in community-dwelling, ethnically diverse older adults are consuming
inadequate amounts of many micronutrients. The intakes of these nutrients below the RNI were
consistent at follow-up, suggesting a prolonged micronutrient deficiency in this sample. Given
the importance of micronutrients for maintenance of good health, physical function and better
quality of life, the low intakes are of concern, particularly when one considers the relatively
high prevalence of non-communicable disease within this population 10. Furthermore, the
results of this study indicate that for both sexes at baseline and follow-up, only intakes of
manganese, phosphorus, vitamin C and vitamin B12 met the RNI. In addition, females, as
compared to males, consumed vitamin A, thiamine and niacin just slightly above the RNI only
at baseline. The inadequate intake of these nutrients among older ethnic minorities was found
to be consistent with previous studies in the UK and elsewhere 11,50. For instance, a study in the
UK found that ethnic minority women aged 60+ years had intakes of vitamin D, selenium,
magnesium and potassium below the UK RNI (11). However, in contrast to the present findings,
the results from Years 7 and 8 (combined) of the UK NDNS Rolling Programme (a sample
comprised of predominately white older adults), found that intakes of most micronutrients were
at the RNI or above the RNI45. Variations in the level of deprivation between these two samples
could be one factor accounting for these differences. It has been reported elsewhere that poverty
and other forms of deprivation lead to poorer diets, and subsequently a higher prevalence of

153
malnutrition, in both community and hospital settings51,52. Recently, the English Longitudinal
Study of Ageing reported that being non-white (OR: 3.8; 95% CI 2.39–6.05) and obese (OR:
1.32; 96% CI 1.09–1.58) were associated with a higher vitamin D deficiency53. These findings
further highlight the inequalities in nutrient intakes and the need for increasingly culturally
tailored community-focussed interventions to promote adequate nutritional intake and the
general health of community-dwelling, ethnically diverse older adults.
Despite the low intakes of most micronutrients recorded in this study, the intakes of sodium at
both time points met the RNI of less than 2400 mg/day. This is in contrast with the findings of
a study of 54 older immigrants in Canada aged 59-81 years, which found that across the sample,
sodium consumption was 200% of the Canadian dietary recommendations 50. The increased
sodium intakes among ethnic minorities, including the present study sample have been
previously attributed to the use of salty condiments and spices, and consumption of traditional
foods that are high in salt50. However, the access to health education leading to a reduction in
salt intake and the tendency to adopt healthier cooking methods, as reported by previous studies,
might be accounting for the lower sodium intake in the current sample 11,44. Also, given that the
additions of table salt were likely not adequately captured in this study, this could have resulted
in under-reporting of salt, leading to lower sodium intake in the present study.
The present study highlights novel findings, emphasising the importance of nutrient
supplementation in the older ethnic minority population. Throughout the sample at baseline,
supplementation was low, and was even lower at follow-up, indicating that older ethnic
minorities may not have a sustained or regularly practiced taking micronutrient supplements.
These low intakes are similar to a previous study examining nutrient intakes in 76 community-
dwelling, ethnically diverse women living in Birmingham, were it was found that only 39.5%
took supplements 11. In the present study, more females reported supplement intakes at both

154
time points than males. Supplementation at baseline significantly contributed to females
meeting the RNI for thiamine, niacin and vitamin E. Similarly, at baseline, supplementation
significantly contributed to males meeting the daily RNI for vitamin E. At follow-up, while
males had no significant difference between the intakes with and without supplementation,
females had significant differences in the intakes of vitamin A, vitamin D, vitamin B1, vitamin
E vitamin B6, vitamin B12, vitamin C and manganese. However, these differences did not
significantly contribute to meeting the RNIs for these nutrients. This was probably due to the
very low proportion (even lower for men) taking supplements at follow-up. Given the critical
role of supplementation and the tendency to poorer nutrition at later life, and subsequent
nutrient deficiencies, it is important to emphasise that older adults need to supplement in cases
where dietary intake is not sufficiently meeting their daily needs 54,55. For instance, a meta-
analysis of randomised controlled trials concluded that supplementation of 17.5–25 µg of
vitamin D daily reduces the risk of falls by 19% in older adults 55. Further studies explicitly
examining prolonged supplementation within this population is needed to confirm our findings.
Nutritional status measured using the MNA-SF declined significantly over the study period.
The findings showed an increase of 13% in the number of people classified as malnourished or
at-risk of malnutrition over the study period. These declines over a relatively short period are
disturbing, which highlights the need for timely nutritional assessment and appropriate
strategies to address malnutrition, preferably at the community level. Also, the prevalence of
malnutrition or at risk of malnutrition at both time points within this present study was more
than double the estimated prevalence of malnutrition in the UK. It is estimated that more than
3 million older adults suffer from malnutrition, which accounts for more than 10% of the
population aged 65 years and more 56,57. However, as seasonality is known to impact on eating
behaviours and physical function, the season in which data were collected could have affected

155
participants’ nutrient intake and subsequent nutritional status, leading to the high proportion of
malnourished/at risk of malnutrition among this sample44. Future studies should schedule
assessments of nutritional intake and status across various seasons to account for the potential
influence of seasonality. Despite this, the prevalence of malnutrition or at risk of malnutrition
of studies outside the UK reported considerably higher percentages than the current study 58-60.
For example, a study of 360 older adults aged 60 years and over in India found that 70% of the
sample were malnourished or at risk of malnutrition58.
Further examination of the association of nutritional intake and status with physical found that
individuals with a higher SPPB score (physical function) had better nutritional status scores. At
follow-up, this association was consistent. In addition, older adults living in higher deprived
areas, with higher baseline WC and BMI were more likely to change to the malnourished/at-
risk of malnutrition group as compared to the reference category, the remained normal group.
The relationship between physical function and nutritional status confirms the findings of
previous studies 61,62. One possible explanation for this relationship as highlighted by previous
findings, could be the difficulty in shopping and preparing food, especially their traditional
meals, due to physical limitations, which could eventually lead to inadequate dietary intake and
malnutrition 44,62. There was no significant relationship between sex and nutritional status. The
role of women in society and their relative financial dependency partly accounts for the
differences in nutritional status as reported by previous studies 58,63. However, within this study,
there was no difference in education and deprivation (IMD scores) between sexes, suggesting
that females may have been more comparable to males with regards to resources and access to
healthier foods, and hence could afford to cook and eat diets similar to their male counterparts.
Also, it could be assumed that by virtue of western economic culture and the availability of
supermarkets, females had fairly equal access to food as compared to traditional customs of

156
some cultures where men eat first, and older women tend to give their share of their food to
other family members, especially their grandchildren 62.
Physical function (SPPB) in later life has been shown to be critical in maintaining the overall
quality of life, and serves as a proxy indicator of disability and mortality 16. Given this, the
present findings indicated that physical function declined significantly over time. At follow-up,
almost half (47%) experienced at least one unit decrease in SPPB scores. It was observed in the
hierarchical linear regression analyses at baseline that individuals with better nutritional status,
higher intakes of fibre, who were younger and married, had higher SPPB scores. Also, a higher
IMD score and fibre intake were associated with higher HGS scores. This is consistent with
previous studies which have shown nutritional status and intake of B-vitamins (linked to higher
fibre intake) to be predictive of the functional performance of older adults 60,64. A study of 457
randomly selected older Bangladeshis living in rural communities found that poorer nutritional
status, increased age and co-morbidities, and being female were associated with functional
limitations 60. The significant declines in SPPB over the relatively short time of 8 months in the
present study is concerning. However, given these associations, it may be possible to mitigate
the sharp declines in physical function by promoting healthy eating among this population.
Though, given the low intakes of nutrients observed in this study, more tailored holistic
interventions around improving the healthy cultural and traditional practices of eating
behaviours need to be designed and implemented to support this population to eat healthily and
maintain a good nutritional status, which may eventually help to sustain or even improve their
physical function with time.
4.6 Implications for policy and practice
Given the declines in nutritional status and physical function observed within a relatively short
period, strategies around implementing a community-led programme around early nutritional

157
and physical function assessments at community and faith/religious centres will immensely
help to identify and treat malnutrition and physical function limitations before the further
deteriorate. The co-creation of such programmes with health care professionals and
community/faith leaders would be effective in increasing accessibility and acceptability of these
assessments, and also ensures that the same health messages are delivered across these meeting
places. Interventions that are co-created and run at these faith centres have been shown to
increase access and improve health outcomes 65,66. This could also provide a good incentive for
community-dwelling older adults to visit these meeting places to improve their social networks,
which is equally essential for a healthier ageing trajectory.
Additionally, qualitative findings from this same sample, reported elsewhere, indicated that
some ethnic minorities fast, skip meals, limit intakes of certain foods or drastically cut down
portion sizes with the goal to lose weight, manage their health conditions or for religious
reasons44. It was found that there was little useful health education around these practices;
hence, these participants concentrated more on reducing food intake than on optimising the
nutrient content of the food consumed. For instance, cutting down food intake to lose weight
without proper planning of nutritionally balanced meals throughout the day, increases the risk
of malnutrition. Given the possible impact of these practices on the observed inadequate
nutrient intakes found in this present study, there is an urgent need for health care professionals,
especially General Practitioners (GP) with more contact with this population, to be mindful of
these practices, and tailor appropriate dietary advice for this population. Clear, culturally
tailored messages around healthy fasting and healthier practices to lose weight while ageing
healthily would support these individuals to consume a diet adequate in nutrients.
The low nutrient supplement intakes among ethnic minority older adults reported in the present
study require serious attention, especially given the prolonged micronutrient deficiencies

158
observed. This population could benefit from a free supplementation programme given the low
nutrient intakes compared with recommendations 67. Castaneda-Gameros et al. observed that
most ethnic minorities saw their GPs/ health professionals as the primary trusted source of
information and would only consume supplements if they are prescribed by their GPs11. In view
of this, GPs/health professionals attending to older ethnic minorities could include a mandatory
dietary assessment and based on the results, prescribe free supplements, in line with safe intake
thresholds, to enhance acceptability and intake and to improve nutrient status among this
population68. This practice could be complemented with culturally tailored dietary education to
ensure that these supplements do not replace a well-balanced diet.
4.7 Strengths and limitations
The longitudinal design employed in this study is a significant strength, as it enabled the
exploration of changes in nutrient intake, nutritional status and physical function in community-
dwelling, ethnically diverse older adults. Furthermore, given the limited literature on dietary
information among ethnic minorities, this present study provided novel data on nutrient intake
and supplementation of a relatively under-researched population over time. The improved
dietary assessment also presents a strength of the study; unlike the use of a single 24-hour
dietary recall in previous studies previous studies which fails to account for day-to-day
variation, or the FFQ which has been found to overestimate energy and nutrient intakes in older
adults, the use multiple-pass 24-hour recall approach on four-non-consecutive days (including
a weekend day) might have been beneficial in providing a more closer habitual intake in this
sample 11,28,69. Despite this, it is important to acknowledge the high possibility of under-
reporting and recall bias in this study. Under-reporting contributes to a significant amount of
error in dietary reporting, and is even higher in overweight and obese populations such as those
participating in the present study70. Additionally, the number of days used in assessing diet in

159
this present study was insufficient to capture some nutrients, especially many micronutrients
accurately. Studies have reported a range of 3 to 9 days of 24-hour recalls to capture close to a
true representation of energy and macronutrients, and a much wider range of 4 to 160 days of
24-hour recalls to capture close to a true representation of micronutrient intakes 71. Even though
cumbersome and expensive, it is recommended that future studies should explore objective
measures of diet (e.g., dietary biomarkers) in older adults to provide a more accurate profile of
nutrient intake.
Furthermore, given the influence of seasonality and increasing age on dietary intake and
nutritional status, the eight months’ follow-up period within this present study may have been
relatively short o assess the changes in these variables accurately. Hence, these findings provide
limited insight into the potential changes in dietary trends and nutritional status over time within
this population. Future studies with more extended follow-up periods, which control for
seasonality, are required to investigate the dietary trends and nutritional status within this
population. Lastly, even though the maximum variation technique was used during sampling to
ensure a more representative sample, it was challenging to recruit South Asian females,
especially females self-identifying as Bangladeshi. Thus, the findings are not generalizable to
all ethnic minorities living in the UK and hence should be interpreted with caution.
4.8 Conclusion
The present findings indicate that community-dwelling, ethnically diverse older adults consume
most micronutrients below the UK RNI over time. In a relatively short period of follow-up,
there were significant declines in nutrient intakes (folate, vitamin B1, vitamin B6, magnesium
and iron), nutritional status and physical function among this population. These declines, and
the associations between nutritional status and physical function over time observed, highlight
the need for enhanced community programmes targeting early screening of nutritional status

160
and physical function to ensure most older adults are assessed and treated accordingly.
Additionally, the inclusion of dietary assessments, provision of free dietary supplements and
culturally tailored dietary education to GPs/health professionals’ consultations will improve
better nutritional intake among this population. Future studies with a longer follow-up period
design and large sample size are recommended to confirm the findings of this study.

161
4.9 References
1. United Nations. World population Ageing. 2015;
https://www.un.org/en/development/desa/population/publications/pdf/ageing/WPA201
5_Report.pdf. Accessed 25/04/2019.
2. Office for National Statistics. Living longer: how our population is changing and why
it matters. 2018;
https://www.ons.gov.uk/peoplepopulationandcommunity/birthsdeathsandmarriages/ag
eing/articles/livinglongerhowourpopulationischangingandwhyitmatters/2018-08-13.
Accessed 23/07/2019.
3. Office For National Statistics. National population projections: 2016-based-
Office for National Statistics. 2017;
https://www.ons.gov.uk/peoplepopulationandcommunity/populationandmigration/pop
ulationprojections/bulletins/nationalpopulationprojections/2016basedstatisticalbulletin
. Accessed 23/07/2019.
4. Lievesley N. The ageing of the ethnic minority populations of England and Wales:
findings from the 2011 census. CPA, UK. 2013.
5. Age UK. Briefing: Health and care of older people in England. 2017;
https://www.ageuk.org.uk/Documents/EN-GB/For-
professionals/Research/The_Health_and_Care_of_Older_People_in_England_2016.pd
f?dtrk=true.
6. Vertovec S. Super-diversity and its implications. Ethnic and racial studies.
2007;30(6):1024-1054.
7. Department for Work and Pensions. Households below average income: An analysis
of the income distribution 1994/95 to 2013/14. 2015;
https://assets.publishing.service.gov.uk/government/uploads/system/uploads/attachme
nt_data/file/437246/households-below-average-income-1994-95-to-2013-14.pdf.
Accessed 25/04/2019.
8. Evandrou M, Falkingham J, Feng Z, Vlachantoni A. Ethnic inequalities in limiting
health and self-reported health in later life revisited. J Epidemiol Community Health.
2016;70(7):653-662.
9. Nazroo JY. The health of Britain's ethnic minorities: findings from a national survey.
London: PSI; 1997.
10. Sproston K, Mindell J. Health Survey for England 2004. The health of minority ethnic
groups. 2006; https://lemosandcrane.co.uk/resources/National%20Statistics%20-
%20Health%20Survey%20for%20England%202004.pdf. Accessed 27/03/2019.
11. Castaneda-Gameros D, Redwood S, Thompson JL. Nutrient Intake and Factors
Influencing Eating Behaviors in Older Migrant Women Living in the United
Kingdom. Ecology of food and nutrition. 2018;57(1):50-68.
12. Gatineau M, Mathrani S. Ethnicity and obesity in the UK. Perspectives in public
health. 2011;131(4):159.
13. Gilbert PA, Khokhar S. Changing dietary habits of ethnic groups in Europe and
implications for health. Nutrition Reviews. 2008;66(4):203-215.
14. Emadian A, England CY, Thompson JL. Dietary intake and factors influencing eating
behaviours in overweight and obese South Asian men living in the UK: mixed method
study. BMJ open. 2017;7(7):e016919.
15. Garduno-Diaz S, Khokhar S. Eating habits and nutrient intake of migrant South
Asians in the UK. Public health. 2014;128(11):1043-1046.

162
16. Gómez JF, Curcio C-L, Alvarado B, Zunzunegui MV, Guralnik J. Validity and
reliability of the Short Physical Performance Battery (SPPB): a pilot study on mobility
in the Colombian Andes. Colombia Medica. 2013;44(3):165-171.
17. Guralnik JM, Simonsick EM, Ferrucci L, et al. A short physical performance battery
assessing lower extremity function: association with self-reported disability and
prediction of mortality and nursing home admission. Journal of Gerontology.
1994;49(2):M85-M94.
18. Landi F, Calvani R, Tosato M, et al. Impact of physical function impairment and
multimorbidity on mortality among community-living older persons with sarcopaenia:
results from the ilSIRENTE prospective cohort study. BMJ open. 2016;6(7):e008281.
19. Louie GH, Ward MM. Socioeconomic and ethnic differences in disease burden and
disparities in physical function in older adults. American journal of public health.
2011;101(7):1322-1329.
20. Williams ED, Tillin T, Whincup P, Forouhi NG, Chaturvedi N. Ethnic differences in
disability prevalence and their determinants studied over a 20-year period: a cohort
study. PLoS One. 2012;7(9):e45602.
21. Kimura Y, Wada T, Ishine M, et al. Food diversity is closely associated with activities
of daily living, depression, and quality of life in community‐dwelling elderly people.
Journal of the American Geriatrics Society. 2009;57(5):922-924.
22. Kumagai S, Watanabe S, Shibata H, et al. Effects of dietary variety on declines in
high-level functional capacity in elderly people living in a community. Japanese
Journal of Public Health. 2003;50(12):1117-1124.
23. Kumagai S, Watanabe S, Shibata H, et al. Effects of dietary variety on declines in
high-level functional capacity in elderly people living in a community. [Nihon koshu
eisei zasshi] Japanese journal of public health. 2003;50(12):1117-1124.
24. Birmingham City Council. Population and census. 2011;
https://www.birmingham.gov.uk/info/20057/about_birmingham/1294/population_and
_census/2. Accessed 27/03/2019.
25. Birmingham City Council. 2016 Population Based Projections. 2018;
https://www.birmingham.gov.uk/downloads/file/4609/2016_population_basedprojecti
ons. Accessed 27/03/2019.
26. Teddlie C, Yu F. Mixed methods sampling: A typology with examples. Journal of
Mixed Methods Research. 2007;1(1):77-100.
27. Communities and Local Government. English indices of deprivation. 2015;
https://www.gov.uk/government/statistics/english-indices-of-deprivation-2015.
Accessed 17/04/2019.
28. Adamson A, Collerton J, Davies K, et al. Nutrition in advanced age: dietary
assessment in the Newcastle 85+ study. European Journal of Clinical Nutrition.
2009;63(S1):S6.
29. Cheyette C, Balolia Y. Carbs & Cals: A Visual Guide to Carbohydrate Counting &
Calorie Counting for People with Diabetes. Chello; 2010.
30. Department of Health. Dietary reference values for food energy and nutrients for the
United Kingdom In: Report on Health and Social Subjects 41. Report of the Panel on
Dietary Reference Values of the Committee on Medical Aspects of Food Policy
London, UK: HMSO; 1991.
31. Vellas B, Guigoz Y, Garry PJ, et al. The Mini Nutritional Assessment (MNA) and its
use in grading the nutritional state of elderly patients. Nutrition. 1999;15(2):116-122.

163
32. Cuervo M, García A, Ansorena D, et al. Nutritional assessment interpretation on 22
007 Spanish community-dwelling elders through the Mini Nutritional Assessment test.
Public health nutrition. 2009;12(1):82-90.
33. Rubenstein LZ, Harker JO, Salvà A, Guigoz Y, Vellas B. Screening for undernutrition
in geriatric practice: developing the short-form mini-nutritional assessment (MNA-
SF). The Journals of Gerontology Series A: Biological Sciences and Medical Sciences.
2001;56(6):M366-M372.
34. Guralnik JM, Ferrucci L, Pieper CF, et al. Lower extremity function and subsequent
disability: consistency across studies, predictive models, and value of gait speed alone
compared with the short physical performance battery. The Journals of Gerontology
Series A: Biological Sciences and Medical Sciences. 2000;55(4):M221-M231.
35. Centre for Disease Control and Prevention. National Health and Nutrition
Examination Survey Questionnaire (Muscle strength, Procedures Manual). 2011;
https://www.cdc.gov/nchs/data/nhanes/nhanes_11_12/muscle_strength_proc_manual.
pdf. Accessed 09/06/2019.
36. Reijnierse EM, de Jong N, Trappenburg MC, et al. Assessment of maximal handgrip
strength: how many attempts are needed? Journal of cachexia, sarcopenia and muscle.
2017;8(3):466-474.
37. El-Sais WM, Mohammad WS. Influence of different testing postures on hand grip
strength. European Scientific Journal. 2014;10(36).
38. Willett WC, Howe GR, Kushi LH. Adjustment for total energy intake in
epidemiologic studies. The American Journal of Clinical Nutrition. 1997;65(4):1220S-
1228S.
39. Roberts HC, Denison HJ, Martin HJ, et al. A review of the measurement of grip
strength in clinical and epidemiological studies: towards a standardised approach. Age
and ageing. 2011;40(4):423-429.
40. Bauer J, Biolo G, Cederholm T, et al. Evidence-based recommendations for optimal
dietary protein intake in older people: a position paper from the PROT-AGE Study
Group. Journal of the american Medical Directors association. 2013;14(8):542-559.
41. Office for National Statistics. Ethnicity and National Identity in England and Wales
2011. 2012;
http://webarchive.nationalarchives.gov.uk/20160105160709/http://www.ons.gov.uk/o
ns/dcp171776_290558.pdf Accessed 26/11/2018, 26/11/2018.
42. Anderson A, Lean M. Healthy changes? Observations on a decade of dietary change in
a sample of Glaswegian South Asian migrant women. Journal of Human Nutrition
and Dietetics. 1995;8(2):129-136.
43. Zhang H, Hsu-Hage BH, Wahlqvist ML. Longitudinal changes in nutrient intakes in
the Melbourne Chinese Cohort Study. Public Health Nutrition. 2002;5(3):433-439.
44. Asamane EA, Greig CA, Aunger JA, Thompson JL. Perceptions and Factors
Influencing Eating Behaviours and Physical Function in Community-Dwelling
Ethnically Diverse Older Adults: A Longitudinal Qualitative Study. Nutrients.
2019;11(6):1224.
45. Caireen Roberts TS, Natalie Maplethorpe, Lorna Cox, Sarah, Meadows SN, Polly
Page, and Gillian Swan. National Diet and Nutrition Survey. Results from Years 7 and
8 (combined) of the Rolling Programme (2014/2015 to 2015/2016). Department of
Health and Food Standards Agency;2018.
164
46. Mendonça N, Hill TR, Granic A, et al. Macronutrient intake and food sources in the
very old: analysis of the Newcastle 85+ Study. British Journal of Nutrition.
2016;115(12):2170-2180.
47. Goff LM, Timbers L, Style H, Knight A. Dietary intake in Black British adults; an
observational assessment of nutritional composition and the role of traditional foods in
UK Caribbean and West African diets. Public Health Nutrition. 2015;18(12):2191-
2201.
48. Vyas A, Greenhalgh A, Cade J, et al. Nutrient intakes of an adult Pakistani, European
and African‐Caribbean community in inner city Britain. Journal of Human Nutrition
and Dietetics. 2003;16(5):327-337.
49. Anderson A, Bush H, Lean M, Bradby H, Williams R, Lea E. Evolution of
atherogenic diets in South Asian and Italian women after migration to a higher risk
region. Journal of Human Nutrition and Dietetics. 2005;18(1):33-43.
50. Johnson CS, Garcia AC. Dietary and activity profiles of selected immigrant older
adults in Canada. Journal of Nutrition for the Elderly. 2003;23(1):23-39.
51. The Scottish Government. Older People Living in the Community—Nutritional
Needs, Barriers and Interventions: A Literature Review. 2009;
http://www.scotland.gov.uk/Publications/2009/12/07101949/1. Accessed 02/07/2019.
52. Stratton RJ, Elia M. Deprivation linked to malnutrition risk and mortality in hospital.
British Journal of Nutrition. 2006;96(5):870-876.
53. Aspell N, Laird E, Healy M, Shannon T, Lawlor B, O’Sullivan M. The Prevalence and
Determinants of Vitamin D Status in Community-Dwelling Older Adults: Results
from the English Longitudinal Study of Ageing (ELSA). Nutrients. 2019;11(6):1253.
54. Beaudart C, Buckinx F, Rabenda V, et al. The effects of vitamin D on skeletal muscle
strength, muscle mass, and muscle power: a systematic review and meta-analysis of
randomized controlled trials. The Journal of Clinical Endocrinology & Metabolism.
2014;99(11):4336-4345.
55. Bischoff-Ferrari HA, Willett WC, Wong JB, et al. Prevention of nonvertebral fractures
with oral vitamin D and dose dependency: a meta-analysis of randomized controlled
trials. Archives of Internal Medicine. 2009;169(6):551-561.
56. ENHA BAPEN ILC-UK. Malnutrition among Older People in the Community: Policy
Recommendations for Change 2006;
https://www.bapen.org.uk/pdfs/malnut_in_the_community.pdf. Accessed 03/07/2019.
57. Elia M, Stratton RJ. Geographical inequalities in nutrient status and risk of
malnutrition among English people aged 65 y and older. Nutrition. 2005;21(11-
12):1100-1106.
58. Agarwalla R, Saikia AM, Baruah R. Assessment of the nutritional status of the elderly
and its correlates. Journal of Family & Community Medicine. 2015;22(1):39.
59. Damayanthi H, Moy F, Abdullah K, Dharmaratne S. Prevalence of malnutrition and
associated factors among community-dwelling older persons in Sri Lanka: a cross-
sectional study. BMC Geriatrics. 2018;18(1):199.
60. Ferdous T, Cederholm T, Razzaque A, Wahlin Å, Nahar Kabir Z. Nutritional status
and self-reported and performance-based evaluation of physical function of elderly
persons in rural Bangladesh. Scandinavian Journal of Public Health. 2009;37(5):518-
524.
61. Danielewicz AL, Barbosa AR, Del Duca GF. Nutritional status, physical performance
and functional capacity in an elderly population in southern Brazil. Revista da
Associação Médica Brasileira. 2014;60(3):242-248.

165
62. Kikafunda JK, Lukwago FB. Nutritional status and functional ability of the elderly
aged 60 to 90 years in the Mpigi district of central Uganda. Nutrition. 2005;21(1):59-
66.
63. Donini LM, Scardella P, Piombo L, et al. Malnutrition in elderly: social and economic
determinants. The journal of Nutrition, Health & Aging. 2013;17(1):9-15.
64. Struijk EA, Lana A, Guallar-Castillón P, Rodríguez-Artalejo F, Lopez-Garcia E.
Intake of B vitamins and impairment in physical function in older adults. Clinical
Nutrition. 2018;37(4):1271-1278.
65. DeHaven MJ, Hunter IB, Wilder L, Walton JW, Berry J. Health programs in faith-
based organizations: are they effective? American Journal of Public Health.
2004;94(6):1030-1036.
66. Sattin RW, Williams LB, Dias J, et al. Community trial of a faith-based lifestyle
intervention to prevent diabetes among African-Americans. Journal of community
health. 2016;41(1):87-96.
67. Dangour AD, Sibson VL, Fletcher AE. Hormones and supplements: do they work?
micronutrient supplementation in later life: limited evidence for benefit. The Journals
of Gerontology Series A: Biological Sciences and Medical Sciences. 2004;59(7):B659-
B673.
68. Food Standards Agency. Safe Upper Levels for Vitamins and Minerals. Report of the
Expert Group on Vitamins and Minerals. In: Food Standards Agency; 2003.
69. Earland J, Campbell J, Srivastava A. Dietary habits and health status of African‐
Caribbean adults. Journal of human nutrition and dietetics. 2010;23(3):264-271.
70. Rennie KL, Coward A, Jebb SA. Estimating under-reporting of energy intake in
dietary surveys using an individualised method. British Journal of Nutrition.
2007;97(6):1169-1176.
71. Tokudome Y, Imaeda N, Nagaya T, et al. Daily, weekly, seasonal, within-and
between-individual variation in nutrient intake according to four season consecutive 7
day weighed diet records in Japanese female dietitians. Journal of epidemiology.
2002;12(2):85-92.

166
CHAPTER 5
PERCEPTIONS AND FACTORS INFLUENCING EATING
BEHAVIOURS AND PHYSICAL FUNCTION IN
COMMUNITY-DWELLING ETHNICALLY DIVERSE OLDER
ADULTS: A LONGITUDINAL QUALITATIVE STUDY
This paper forms part of the third study of this PhD research and is published in the journal
Nutrients as Asamane, E.A.; Greig, C.A.; Aunger, J.A.; Thompson, J.L. Perceptions and
Factors Influencing Eating Behaviours and Physical Function in Community-Dwelling
Ethnically Diverse Older Adults: A Longitudinal Qualitative Study. Nutrients 2019, 11, 1224.
https://doi.org/10.3390/nu11061224
The following were the research questions answered.
1. What are the perceptions of healthy eating and physical function among community-
dwelling ethnically diverse older adults?
2. What are the factors influencing dietary behaviours and physical function within this
population, and how are they related?
3. What factors do community-dwelling ethnically diverse older adults perceive to be
causing changes in their eating behaviours and physical function over an 8-month
period?

167
5.1 Abstract
Ethnic minorities have a high prevalence of non-communicable diseases relating to unhealthy
lifestyle practices. Several factors have been identified as influencing unhealthy lifestyle
practices among this population; however, there is little evidence about how these factors differ
among a heterogeneous sample living in a super-diverse city. This study aimed to: (1) identify
and compare factors influencing eating behaviours and physical function among ethnic older
minorities living in Birmingham, United Kingdom; and (2) understand how these factors and
their association with healthy eating and physical function changed over 8-months. An in-depth
interviewing approach was used at baseline (n = 92) and after 8-months (n = 81). Interviews
were transcribed verbatim and analysed using directed content analysis. Healthy eating was
viewed as more important than, and unrelated to, physical function. Personal, social and
cultural/environmental factors were identified as the main factors influencing eating behaviours
and physical function, which differed by ethnicity, age, and sex. At 8-month interviews, more
men than women reported adverse changes. The study provides unique and useful insights
regarding perceived eating behaviours and physical function in a relatively large and diverse
sample of older adults that can be used to design new, and adapt existing, culturally-tailored
community interventions to support healthy ageing.
168
5.2 Introduction
The population in the United Kingdom (UK) is ageing and becoming more ethnically diverse
[1]. In England and Wales, the number of ethnic minority older adults aged 50 years and over
has increased from 1.3 million in 2001 to 2.4 million in 2016, and is projected to reach 7.4
million by 2051 [2]. It is also estimated that ethnic minorities will comprise one-third of the
total UK population by 2050 [1,3]. However, many ethnic minority groups live in areas of
higher deprivation and experience disproportionate health inequalities, predisposing them to a
lower quality of life and poorer health than the white British population [4–6].
The limited published evidence examining dietary intake in this population suggests that the
diets of ethnic minorities who immigrated to the UK are less healthy than when living in their
country of origin, due to acculturation [7,8]. The inclusion of diets high in saturated fat and
sugar such as pizza, pasties, cakes, sweets, French fries and potato chips as reported elsewhere
[9] contributes to these unhealthy eating practices among ethnic minorities. Also, there is
reported high prevalence of objectively measured sedentary behaviour and low levels of
physical activity among community-dwelling older ethnic minorities in the UK [10–12]. For
example, a recent study found that, in a sample of 76 community-dwelling older ethnic minority
women with a mean age of 70.8 years, only 15% met weekly physical activity
recommendations, while more than half were sedentary during waking hours [11]. Furthermore,
the prevalence of low physical activity in the UK, defined as the participation in less than one
30-minute moderate/vigorous activity session a week on the average was observed to be high
among ethnic minorities [6]. For instance, as compared with 32% in men and 37% women in
the general population, low activity levels were found in 51% in both Bangladeshi and Pakistani
men, and 68% in Bangladeshi and 52% in Pakistani women [6]. Together with the low physical
activity levels, ethnic minorities have an increased prevalence of obesity as compared to the

169
general population; 25% of Caribbean men are obese as compared to 23% in the general
population, and the risk ratio for obesity in African women, Caribbean women, and Pakistani
women stands at 2.0, 1.43 and 1.48 respectively, as compared to the general population [6].
Unhealthy dietary behaviours coupled with the low physical activity levels within this
population are contributors to their increased prevalence of obesity, type 2 diabetes and other
non-communicable diseases as compared to the general population [7,13,14].
This has significant social and economic implications for the nation, including increases in
health and social care costs, and the costs to individuals, families and communities [15]. As
such, it is necessary to understand and develop specific policies and interventions that will
support community-dwelling ethnic minority older adults to adopt lifestyle behaviours that
support them to age more healthily. However, because there are limited published data about
the factors influencing healthy lifestyle choices among community-dwelling ethnic minority
older adults, it is difficult to develop and deliver effective culturally-sensitive community
interventions. Evidence suggests that healthy lifestyle interventions that are
culturally/ethnically tailored and that incorporate strategies to optimise healthy eating and
physical activity have been shown to achieve significant improvements in lifestyle behaviours,
thus contributing to a reduction of the prevalence of non-communicable diseases [16–18].
To develop culturally tailored and appropriate interventions, it is imperative to have an in-depth
understanding of how the factors influencing dietary behaviours and physical function may
differ and interact in this population. There is some published evidence contributing to our
understanding of these factors among ethnic minority communities. For example, a study
exploring eating behaviours among 36 overweight and obese South Asian men (18–64 years)
found cultural factors, lack of time and motivation, and family and other social networks as
170
influencing eating behaviours [19]. Similarly, a study of Ghanaian immigrants aged 25 years
and older in the UK found that beliefs, perceptions, accessibility and affordability of food,
social networks, acculturation and cultural factors influenced eating behaviours [20]. In
addition, an investigation of eating behaviours among young Turkish and Moroccan immigrants
in the Netherlands found that religion, identity, hospitality and lifestyle changes were key
influences [21]. These studies had samples that were, on average, young to middle-aged, and
were in some cases studied as single ethnic groups, which makes it difficult to comprehensively
compare and understand how these factors differ among a heterogeneous older ethnic minority
population living in a super-diverse community. Furthermore, the cross-sectional nature of
these studies does not provide evidence as to if and how these influences may change over time.
As such, the present study is intended to fill these gaps in the literature.
The present study uses a longitudinal qualitative design to: (1) identify and compare factors
influencing eating behaviours and physical function among ethnic older minorities living in
Birmingham, United Kingdom; and (2) understand how these factors and their association with
healthy eating and physical function changed over 8 months. In addition to building on the
existing literature, the findings provide insights and novel information to aid stakeholders,
policy makers and health professionals in understanding, designing and implementing effective
culturally tailored interventions to support healthy ageing in community-dwelling ethnically
diverse older adults.
5.3 Materials and Methods
5.3.1. Study Design and Setting
A longitudinal qualitative approach was used to gather relevant data. This design was effective
in generating a rich dataset that supported an in-depth examination of lifestyle changes that

171
occurred in the target study sample over eight months, the factors that may account for these
changes, and the perceived impact of these changes on eating behaviours and physical function
[22]. The guidelines from the consolidated criteria for reporting qualitative studies were used
to guide this study [23].
The research was conducted in the wider Birmingham area, West Midlands, UK. In this
geographic area, ethnic minorities (non-white) comprise 46.9% of the population, with the
largest being South Asians (22.6%). The population of ethnic minorities increased in this region
by 12.4% from 2001 to 2011, and with the current projected population growth of 7.2% by
2026, the non-white population is expected to make up more than half of the entire population
by 2021 [24,25].
5.3.2. Participants and Recruitment
One hundred participants were recruited using purposive sampling coupled with chain referrals
and word of mouth. Inclusion criteria were an older adult aged 60 years or older living within
the Birmingham area who self-identified as African, Indian, Pakistani, Bangladeshi or
Caribbean. Participants were recruited through older age societies, community centres, faith
centres and various social events for ethnically diverse older adults across the Birmingham area.
Recruitment excluded older adults with a diagnosis of dementia or any cognitive disabilities
that might affect their participation in the study. Individuals residing outside of the Birmingham
area, institutionalised or hospitalised were also excluded. Maximum variation sampling was
employed during the recruitment process to ensure wide representation across older age groups,
ethnicities, sexes, religions/faiths and socio-economic groups [26–28].
Several techniques were employed to increase recruitment, obtain quality data and to increase
retention in the study. The first author (EAA) established initial contact with community leaders

172
and potential participants before the start of the study. EAA attended church services and other
faith centres’ public events to establish rapport with leaders and potential participants. This
enhanced trust between EAA and participants. Community leaders who met the inclusion
criteria were also encouraged to take part in the study. Acting as role models, this built trust
and enhanced credibility of the study [29]. This strategy was used to optimise participants’
commitment and retention, which in turn enhanced data quality.
The study received full ethical approval from the University of Birmingham Science,
Technology, Engineering, and Mathematics (STEM) Research Ethics Committee
(ERN_17_1364). All participants provided written informed consent before data were
collected.
5.3.3. Theoretical Framework
A constructivist paradigm, with a phenomenological philosophical underpinning, guided this
research. As such, the researchers shared an understanding that knowledge is not
comprehensively generated without the researcher and the participant [30,31]. This approach
enabled the team to set aside perceived assumptions, personal experiences and other biases, to
allow for a comprehensive understanding of the factors influencing eating behaviours and
physical function from each participant’s perspective. Furthermore, this approach enabled an
in-depth exploration of the narrative of factors influencing eating behaviours and physical
function, and how these factors changed over time.
Given the aim of this study, an ecological model was used to explore and conceptualise the
different levels in which factors influencing eating behaviours and physical function operate
[32]. This model best fits this study as it examines multiple factors at different levels influencing
eating behaviours and physical function; from the personal level, the social level, the level of

173
the immediate environment and lastly the level of the macro environmental impacts of factors
such as of policies and interventions [32]. In addition to these stages, the Bronfenbrenner’s
concept of chronosystem was added as the last level of the ecological model to conceptualise
the changes, and interactions, of the different levels of influence over time [33] [Adapted model
of the ecological model is attached as supplementary file C2].
5.3.4. Interviews
The conceptual framework coupled with the use of relevant literature was used to design the
semi-structured guide for the interviews [10,12,34]. The semi-structured interview guide was
divided into two main areas:
1. Eating behaviours and factors influencing eating behaviours.
2. Physical function and factors influencing physical function.
This interview guide was iteratively revised at follow-up to include:
3. Changes in factors influencing eating behaviours and physical function over the previous
eight months.
Using this interview guide, two in-depth qualitative interviews (baseline and 8-month follow-
up) were conducted. The use of this approach was most appropriate as it allowed us to guide
the interviews towards important areas that would yield relevant responses [35]. Additionally,
to enhance adequate participation and trust of participants during the interviewing process, the
responsive interviewing technique was adopted [36]. This technique is flexible and builds a
relationship of trust, leading to a give and take style of conversation. Trained translators were
employed in instances where the participant had limited ability to communicate in English (n =
19). Interviews were conducted from March 2017 to February 2019 at locations of preference

174
for participants including their home, community centres, or at the University. All interviews
were digitally recorded and lasted from 25–110 minutes.
5.3.5. Data Analysis
Interviews were transcribed verbatim during the data collection process. This allowed for the
reorganisation of some parts of the interview guide to explore in-depth areas of interest [37].
After transcription, the transcripts were uploaded to QSR NVivo 12 Plus software [38] for
reorganising and coding. Data analysis was conducted using directed content analysis [39,40]
due to its flexibility of use and its ability to explore a detailed analysis of factors influencing
eating behaviours and physical function within this population. Moreover, the use of this
approach is well-suited for studies in which there is pre-existing research on the phenomenon
being tested [40].
The directed content analysis approach involved preparation, organization and reporting
phases. The preparation phase involved full immersion into the data, where transcripts and field
notes were read and reviewed to understand the pattern of the data. During the organisation
phase, two categorisation matrices were developed: one regarding factors influencing eating
behaviours and the other regarding factors influencing physical function. A complete matrix
developed on eating behaviours is shown in Figure 18. The complete matrix on physical
function is shown in Supplementary file C1. These coding matrices were initially developed
deductively using insights from a conceptual framework [32] and existing relevant literature
[10–12,20,41]. Using an iterative process, these matrices (mainly the generic category and sub-
category) were further restructured inductively based on the emerging findings (data-driven)
[39].

175
Figure 19: Complete coding matrix on eating behaviours.

176
To ensure rigour, trustworthiness and the ease of use of the matrices, two researchers (JAA and
JLT) independently pre-tested the matrices using preliminary data [39]. Afterwards, all
discussions around the difficulty of use of the matrices, interpretations of the categories and the
data coded were resolved by consensus, and the matrices further restructured. Following this
step, the remaining transcripts were coded by EAA using the updated categorisation matrices.
During the final step, or the reporting phase of the analysis process, all findings were
systematically presented, showing the association between the various categories and sub-
categories of the matrices. Field notes taken during data collection were used to support the
interpretation of the data. The data were subjected to additional analysis. The use of
universalising and differentiating comparative analysis approaches made it possible to
understand the similarities and differences between responses by socio-demographic
characteristics and any variable of interest in each category [42]. This enabled us to build a
logical conclusion of data and to interpret the data more clearly.
5.4. Results
Table 16 presents the demographic profile of the respondents. Out of the 100 participants
recruited, 92 participants were interviewed at baseline and 81 at follow-up. Participant loss to
follow-up was due to sickness (n =4); loss of interest (n = 2); and unable to trace participant to
schedule the follow-up interview (n = 5). At baseline, the mean age (SD) of participants was
70.1 (8.1) with 24% living alone. The majority of the sample comprised of Caribbean and
Africans (60%), followed by South Asians (34%) and the smallest proportion were participants
identifying as ‘others’: a mixture of the two major ethnic minority groups (6%). Over half of
the sample had completed at least secondary school education (58%), while participants with
no formal education made up 15.2% of the sample.

177
The findings that emerged from the data are presented in detail under the categories below:
1. The differing perceptions of healthy eating and physical function.
2. The personal, social and cultural/environmental factors influencing eating behaviours and
physical function and how these factors differ among the sample.
3. Perceived changes to eating behaviours and physical function over the 8-month follow-up
period.

178
Table 16: Socio-demographic characteristics of participants completing interviews at baseline and 8-month follow-up
Variable
Baseline Follow-Up
Sex
N (%)
Male
57 (57.0)
Female
35 (35.0)
Total
92 (100)
Male
50 (62.0)
Female
32 (38.0)
Total
81 (100)
Age mean (SD) 71(7.0) 70 (9.0) 70.6 (8.1) 70 (8.0) 71 (9.0) 70.7 (8.2)
Ethnicity N (%) Caribbean 14 (24.6) 25 (71.4) 39 (42.4) 13 (26.0) 25 (80.6) 38 (46.9)
Pakistani 17 (29.8) 3 (8.6) 20 (22) 14 (28.0) 1 (3.2) 15 (18.5)
African 11 (19.3) 6 (17.1) 17 (18.5) 11 (22.0) 4 (12.9) 15 (18.5)
Bangladeshi 4 (7.0) 0 (0.0) 4 (4.3) 2 (4.0) 0 (0.0) 2 (2.5)
Indian 5 (8.8) 1 (2.9) 6 (6.5) 4 (8.0) 1 (3.2) 5 (6.2)
Others# 6 (10.5) 0 (0.0) 6 (6.5) 6 (12.0) 0 (0.0) 6 (7.4)
Marital status N
(%)
Married 46 (80.7) 16 (45.7) 62 (67.4) 40 (80.0) 15 (48.4) 55 (67.9)
Widowed 6 (10.5) 8 (22.9) 14 (15.2) 4 (8.0) 7 (22.6) 11 (13.6)
Divorced 4 (7.0) 8 (22.9) 12 (13.0) 5 (10.0) 7 (22.6) 12 (14.8)
Single 1 (1.8) 3 (8.6) 4 (4.3) 1 (2.0) 2 (6.5) 3 (3.7)
Faith/Religion N
(%)
Christian 23 (40.4) 30 (85.7) 53 (57.6) 22 (44.0) 28 (90.3) 50 (61.7)
Muslim 29 (50.9) 1 (2.9) 30 (32.6) 24 (48.0) 0 (0.0) 24 (29.6)
Sikh 3 (5.3) 3 (8.6) 6 (6.5) 2 (4.0) 2 (6.5) 4 (4.9)
Hindu 2 (3.5) 0 (0.0) 2 (2.2) 2 (4.0) 0 (0.0) 2 (2.5)
No religion 0 (0.0) 1 (2.9) 1 (1.1) 0 (0.0) 1 (3.2) 1 (1.2)
Education N (%) College/University 28 (49.1) 17 (48.6) 45 (48.9) 26 (52.0) 15 (48.4) 41 (50.6)
Secondary School 10 (17.5) 8 (22.9) 18 (19.6) 8 (16.0) 7 (22.6) 15 (18.5)
Primary School 9 (15.8) 6 (17.1) 15 (16.3) 9 (18.0) 5 (16.1) 14 (17.3)
No education 10 (17.5) 4 (11.4) 14 (15.2) 7 (14.0) 4 (12.9) 11 (13.6)
BMI categories N
(%)
Normal 4 (7.0) 2 (5.7) 6 (6.5) 6 (12.0) 3 (9.7) 9 (11.1)
Overweight 22 (38.6) 7 (20.0) 29 (34.5) 13 (26.0) 8 (25.8) 21 (25.9)

179
Obese 31 (54.4) 26 (74.3) 57 (62.0) 31 (62.0) 20 (64.5) 51 (63.0)
IMD Quartile * N
(%)
1 (Most deprived) 20 (35.1) 12 (34.3) 32 (34.8) 18 (36.0) 11 (35.5) 29 (35.8)
2 13 (22.8) 6 (17.1) 19 (20.7) 13 (26.0) 6 (19.4) 19 (23.5)
3 11 (19.3) 6 (17.1) 17 (18.5) 6 (12.0) 5 (16.1) 11 (13.6)
4 (least deprived) 13 (22.8) 11 (31.4) 24 (26.1) 13 (26.0) 9 (29.0) 22 (27.2)
Self-rated health
N (%)
Excellent 9 (15.8) 9 (25.7) 18 (19.6) 8 (16.0) 8 (25.8) 16 (19.8)
Good 35 (61.4) 17 (48.6) 52 (56.5) 31 (62.0) 14 (45.2) 45 (55.6)
Fair 7 (12.3) 6 (17.1) 13 (14.1) 5 (10.0) 6 (19.4) 11 (13.6)
Poor 6 (10.5) 3 (8.6) 9 (9.8) 6 (12.6) 3 (9.7) 9 (11.1)
Length of stay in the UK mean (SD)
(years)
41.9 (16.2) 43.8 (14.9) 42.71 (15.9) 41.5 (16.7) 45.9 (15.5) 43.2 (16.4)
BMI = Body Mass Index; IMD = Index of Multiple Deprivation; SD = Standard Deviation #Other ethnicity referring to East African Asians or Mixed ethnic minority group such as a Caribbean Asian
* WHO guidance on BMI thresholds for Asian populations (World Health Organization 2004) was used for categorizing BMI of South Asian
participants and standard BMI categories were used for Caribbean and African participants.

180
5.4.1. The Differing Perceptions of Healthy Eating and Physical Function
5.4.1.1. Healthy Eating
Perceptions of healthy eating differed by sex, ethnicity, the presence of disease condition(s),
religion or age. Among women, less than half (43%) perceived healthy eating as cutting down
fat, limiting portion sizes, and healthy cooking methods such as reducing the amount of salt and
oil during cooking or opting for steaming and baking as opposed to frying. Similarly, a third of
men (34%) shared all these views except perceptions around cooking methods. Across both
sexes, home cooked meals were commonly considered to be healthier compared with eating
out.
“I think for me, less fat in your diet and I’m thinking about my health as well. Less fat,
things that are not fried and smothered in fat when cooking, and a little bit more homemade
because then you know exactly what’s going into them is better” (P51, 62 years, Caribbean,
Female).
Among participants with diabetes, one-fifth (20%) reported healthy eating as cutting down on
amounts of food eaten, skipping snacks and avoiding sugary or fatty fats to manage their health
condition. Some (12%) also reported fruits as foods representing healthy eating, as they were
told by their health professionals to have enough fruits daily to manage their blood sugar.
“... I don’t eat…between meals, which is good. So, when I get it, at the right time, I eat and
eat everything at a go to help me with my sugar level, to control my sugar” (P30, 60 years,
African, Male).
Religious teachings, mainly among Muslim participants, were reported as guiding their
perceptions of healthy eating. This was reported by more than half (51%) of the Muslim
participants.

181
“Healthy eating means if you have hunger that much [demonstrating using his hand], you
eat only that much [demonstrating using his hand 3/4] and leave that much hunger there
[demonstrating using his hand 1/4]. And this is what Islam teaches. They say have a glass of
water with [your] meal…No, I don’t want it, because Islam says you don’t eat with water, is
not healthy eating” (P48, 69 years, Pakistani, Male).
Across both sexes, traditional foods were mostly considered as healthy foods and tasty as
compared to other foods. However, their views appear to differ by ethnicities. For instance,
Indian/Pakistani/Bangladeshi male participants with a University/College degree described
their traditional foods as being ‘fatty’, ‘greasy’ and “tasty with too much sugar”. In contrast,
Caribbean and African participants, across all levels of educational status, perceived their
traditional foods as healthier and lower in fat:
“…I don’t think it’s very healthy, the traditional Indian diet has got too much sugar in it,
too much oil, they fry a lot, it all makes it not healthy” (P50, 80 years, Indian, Male).
“That is the pivotal point in the West Indies food. I see it as healthy. It keeps you healthy
and even though you might not [be] feeling well like you have the flu or you have the pain and
everything, with our food, you are never sick too big to go to the hospital” (P19, 81 years,
Caribbean, Female).
Additionally, the satiation properties of food emerged among Pakistani/Indian women as an
important factor in considering food as healthy. As one participant described, not feeling hungry
even after hours of not eating was considered as being healthy for her. Hence, she considers the
traditional foods that could satiate her for longer hours as healthy foods.
“That [traditional foods] is healthy eating…. It’s more filling. So, [I] think it’s healthy to
eat that, as opposed to feeling hungrier” (P88, 73 years, Pakistani, Female).

182
5.4.1.2. Physical Function
Physical function was largely perceived as participation in exercise and general fitness level. It
was also labelled as ‘strength,’ which participants viewed as the ability to carry out activities
of daily living without difficulty.
“Physical function means how active you are. How active, how you can be independent.
How you can do things on your own. In terms of flexibility, how you can [be] flexible with your
body movement, and all of that” (P37, 63 years, African, Male).
The study also explored the description of older adults’ physical function levels compared with
their colleagues. Of the majority (53%) that commented on this, two-thirds rated themselves as
having a high physical function (at least eight on a 10-point scale). The remaining participants
reported low self-rated physical function and attributed it to increasing age, ill-health and pains
as illustrated in the quote below.
“I’m maybe below average, I’m not good, but I’m not very poor too, I think with the few
aches and pains now I will say I am about three out of 10” (P39, 70 years, Indian, Male).
Like healthy eating, the concept of improving physical function to manage health conditions
also emerged.
“If you want to keep mobile you have to keep your fitness [physical function], I tell you
everything is about my blood sugar, it [fitness] does affect your blood sugar and stuff like that”
(P63, 67 years, Caribbean, Female).
5.4.1.3. Priority and Association between Healthy Eating and Physical Function
Across educational status, most men (67%) considered healthy eating to be more important than
maintaining physical function. This was attributed mainly to the fact that due to age-related

183
decline in physical function, they believed nothing could be done about improving their
physical function levels, hence there was no need to prioritise it above healthy eating.
“To eat well is more important, with my age there is no running round about. I don’t bother
with the fitness [physical function] now because with my age, but when my daughter cooks me
good food, I can still eat well” (P52, 92 years, Caribbean, Male).
In contrast, a few (12%) women thought otherwise and explained that with changes in physical
activity level, they prioritised their physical function over healthy eating, as they believed this
would help them to maintain their activity level and a healthy weight.
“I think exercise is more important these days because you’re not doing any physical work,
because one time you used to eat and do physical work and that used to drain you out” (P45,
70 years, Caribbean, Female).
The perceived association between healthy eating and physical function was mixed, in that
some participants (34%) believed that they were independent of each other and had no
relationship, while a small number of participants (6%) described a relationship between these
two factors, stating that healthy eating supports them to maintain a good level of physical
function and vice-versa. More women self-identifying as Caribbean or African expressed the
latter view as compared to men or women from other ethnic minority groups, as illustrated by
the quotes below:
“I think eating well helps your physical function, but sometimes eating well, you still have
to do something with the physical function. No point in eating well and just sitting around, you
have to do both. They both complement each other” (P75, 62 years, Caribbean, Female).
“Between the physical function and eating? There’s no connection between them, just when
you’re tired you eat, I don’t see any link” (P61, 76 years, Bangladeshi, Male).

184
5.4.2. Factors Influencing Eating Behaviours and Physical Function
Personal, social, and cultural/environmental influences on eating behaviours and physical
function were reported. Participants’ responses suggested that these influences differed across
ethnicity, sex and socio-economic status. Figure 19 illustrates the main categories and the sub-
categories of those identified.
5.4.2.1. Personal Influences
Participants highlighted several personal factors influencing their eating behaviours and
physical function. As shown in Figure 19, these included current health conditions, pain, body
image, age, and retirement status.
Figure 19: Influences on eating behaviours and physical function among community-dwelling
ethnically diverse older adults.
5.4.2.1.1. Health Conditions
Some participants (24%) reported making changes to their eating behaviours such as changing
diet, eating patterns or cooking methods to manage their current health conditions. Others (6%)
also reported improving their physical function through walking and gardening to manage their
current health conditions. These responses differed by sex and disease severity. For instance,

185
13% of men reported the influence of health on their diet, stating they avoided sugary snacks
and reduced portion sizes. In contrast, women (11% of the total sample) reported changing their
cooking methods, substituting their regular (or staple) foods with healthier options, and
reducing portion sizes.
“… since I was diagnosed [with] this type 2 diabetes, I watch what I eat in between meals.
So, I don’t take anything sugary…I don’t eat between meals. So, when I get it [food], at the
right time, I eat and eat everything at a go to help me” (P37, 63 years, African, Male).
“…. No, I don’t cook with salt, and I don’t fry again, my cooking has changed, and I don’t
eat our [traditional] food sometimes…Well, your blood pressure, isn’t it? I’m on blood pressure
tablets, so I need to change. I am also diabetic too, I have to change [my diet] now” (P72, 68
years, Caribbean, Female).
The fear of losing independence and other consequences accompanying complications from
diabetes and other diet-related non-communicable diseases emerged as motivating factors for
some (12% of the sample) to eat healthily and maintain their physical function. As one
participant explained:
“Because I have type 2 diabetes and I’ve seen, [people] actually suffering. I don’t suffer
with it, but because I have seen what it can do and has done to members of my family, and I’m
not prepared to go there, that’s my impetus, that’s my motivation, that’s my drive. To eat
healthily, take a lot of regular physical activity to keep the complications at bay” (P67, 63
years, Caribbean, Male).
5.4.2.1.2. Pain
Pain resulting from health conditions was mostly described by participants to be inhibiting them
from doing activities to maintain their physical function.

186
“Also, like I’ve got a bit of a dodgy left knee mainly from my arthritis. Sometimes that
hinders me from doing a lot of walking… because of my knee pain, so I just stay put” (P65, 70
years, Caribbean, Female).
Pain was also reported to be affecting cooking and shopping, as most could not either stand to
cook or go about their regular shopping. A man living alone describes how pain from his knee
injury is inhibiting him from preparing traditional meals as they require much attention during
cooking, so he has resorted to consuming simple, ready-to-eat meals.
“I am not able to have that food [traditional food] as I will like [to]. Now I just have these
easy ones (ready-to-eat meals) as you can see.... buying it myself, it takes time to cook, it takes
time to prepare curry goat [traditional Caribbean soup], and with my bad knees, I would not
be able to stand for it” (P58, 65 years, Caribbean, Male).
5.4.2.1.3. Body Image
Body image also emerged as a factor influencing eating behaviours and physical function. More
women (23%) reported this as compared to males (8%), describing a healthy and ‘desirable’
weight as a means to good health and a way to manage their health conditions. These were
reported to influence their portion sizes, types of foods eaten and enjoyment at mealtimes.
“I don’t eat as much cheese as I used to, I used to love cheese, I used to love crackers, and
I very rarely eat that. I mean, you see, another thing, it’s not just eating to sustain me, I’m
trying to keep my weight down as well, so there’s that sort of consideration as well” (P65, 70
years, Caribbean, Female).
Maintaining a healthy body weight was also described by some (10%) women participants as a
motivator to keep up their physical activities, thus helping them to maintain physical function.

187
“If you walk, your joints are fine; you keep the weight, so you keep your body and your
muscles healthy, your physical function will not fall” (P74, 85 years, Caribbean, Female).
Interestingly, of the majority (93%) that reported having a diet-related non-communicable
disease(s), very few (8%) reported making efforts to improve their physical function or
commented on the importance of maintaining a healthy weight. However, the few that stated
making efforts to lose weight shared similar difficulties in achieving their weight loss goals.
5.4.2.1.4. Age
A third of the participants reported the influence of age on eating behaviours and physical
function. Those that recognized a decrease in appetite and decline in physical function attributed
it to age.. This participant explains how he is becoming more health conscious with age, hence
the need to make certain adjustments for better health.
“I think we are getting more health conscious, put it this way. As we get older, nowadays
me and my wife, both think before we eat. In other words, restrict, eat smaller portions” (P14,
60 years, African, Male).
More men living alone than women commonly expressed age-related declines in senses such
as taste to be affecting their food intake. As narrated by a man living alone, loss of taste makes
eating difficult and less enjoyable.
“I realise after spending a full day to cook food [to feed me] for three days, I eat the first
day, and there's no taste left…so it become[s] difficult to eat” (P14, 60 years, African, Male).
5.4.2.1.5. Retirement
Retirement was commonly identified as contributing to changes in lifestyle, in that participants
had more time for cooking, shopping or doing physical activities. Some (28%) participants

188
stated this had substantially changed their eating behaviours as compared to when they were
working:
“I didn’t have much time to watch what I was eating [while working], and I used just to
grab things and go because I was all [the] time working, I probably wouldn’t have bothered
with green stuff like spinach, I only used to have spinach occasionally. I have it more often
now” (P28, 82 years, Caribbean, Female).
In contrast, a few (5%) of recently retired participants thought otherwise. They described the
increased ‘free’ time to be causing them to eat more and resulted in them gaining weight as
compared to when they were working:
“Probably my style has changed because I’ve retired. When I used to work, I was going to
work with a cup of tea and one toast, and I would run away to work. Now I’m a bit relaxed, so
I have a good breakfast, a good lunch and a good dinner and that has put on my weight. I’ve
got all the time to eat” (P14, 60 years, African, Male).
Regarding physical function, only a few (15%) retired participants, predominantly women,
reported that with the increased amount of time available as compared to their working days,
they have time to spend doing activities that could improve their physical function.
“Yeah, I was sitting from the car to the office, sit down [through] meetings…I think I’ve
lost a bit of weight and fitter since I left work. I bought a bike and now [with] my friend who is
retired as well, we’d be out, probably get out in the park” (P68, 62 years, Caribbean, Female).
“Yeah, you know, when you go to work, especially Monday to Friday, and then you sit in
the car, it limits your physical function a bit because you aren’t able to exercise your body, but

189
now that I am home that is not an excuse. I have more time and I walk around” (P30, 61 years,
African, Male).
Contrary to this, four women and a man complained of lack of time after retirement, as they
have to either care for their grandchildren or have an abundance of social commitments relating
to their faith/religion and other social groups. Among participants still in active work, a few
(22%) across both sexes reported their work schedules as a hindrance to undertaking activities
that might improve their physical function.
“It [is] either to do with working too late….and then after I’ve worked, I’m so tired, and
after I’ve eaten, then it’s too late to get on the cross trainer or do walking…all I can do is just
eat and watch TV” (P75, 62 years, Caribbean, Female).
5.4.2.2. Social Network Influences
Social network influences included those of family, friends, and the community. Almost all
participants described how mealtimes were more enjoyable when the family size was large.
Participants indicated that reduced network size as they have aged, made it challenging to cook
often or to cook a variety of foods, due to greater likelihood of food waste.
“I don’t cook a lot ever since I am on my own, it has changed ever since my youngest
daughter left home to go to the university. Sometimes, I will prepare food and when I am
supposed to eat, and I don’t want it anymore… Because being on your own I am not looking
forward, I am not thinking about food…on my own, I will say ’why will I bother?’. So, I will go
for a fruit or anything and end up freezing the food…” (P3, 61 years, African, Female).
“I wouldn’t say my eating habits have improved, since the children all left I don’t cook that
again, when the children were at home, we used to have a lot of eating times, now it has

190
reduced.....because the excuse is, there’s more to eat when I cook and I don’t wanna waste it”
(P24, 61 years, Caribbean, Female).
However, Sunday dinners were described as a special day of the week where children and other
family members would visit. Some (30%) said they enjoyed eating and might eat more on these
days, as there is a variety of foods available. In contrast, others (6%, all women) reported that
the presence or lack of social interactions at meals had no effect on their eating behaviours.
“I tend to put in more effort in what I do and what I cook while if I am on own, I don’t do
that much. Yeah, I might just cook something simple but when they come [children] I make it
more special...I have more to eat when we are all seated” (P19, 81 years, Caribbean, Female).
“I don’t really mind. It’s nice to eat with people, but I’m quite content to eat on my own as
well. It’s not an issue whether people are there or not, I eat [the] same” (P75, 62 years,
Caribbean, Female).
It also emerged that a few (17%) men preferred the act of commensality, and attributed its
importance to the fact that their spouses and children supported them to eat healthily, especially
when eating together during the meal:
“Yeah, eating with them (family) impacts on my eating, it does, because you can see my
wife, she’s not a very big eater, and she’s very conscious of what kind of foods she puts in her
body whereas sometimes I’m not conscious. Eating with her I tend to eat healthier, I do, yeah”
(P60, 61 years, Caribbean, Male).
Some participants living alone reported that they had regular support with shopping and
cooking from their children or friends. They further explained that with a decline in physical
function, this was necessary as they could not shop or prepare their meals.

191
“She [daughter] does the cooking and [brings] it over to me...I do breakfast myself. But
the cooking I can’t stand that long to do it…my daughter does the shopping once a month for
me” (P29, 80 years, Caribbean, Female).
Regarding physical function, a few (11%) participants expressed the support and
encouragement received from family and friends as having a positive impact on their physical
function. Instrumental support, such as taking them to the gym, paying for personal trainers,
buying gym equipment, or providing them with information on how to improve their physical
function was highlighted as beneficial. Also, participants that attended community/age-well
society meetings considered this engagement as beneficial to maintaining their physical
function. At these meetings, some of the activities included leisure activities, board games and
occasionally exercise and nutrition classes.
“…So, when I joined here, it has help[ed] me [to] socialise, and the group exercise is
keeping me active, my [physical] function is improving” (P15, 75 years, Pakistani, Male).
5.4.2.3. Cultural and Environmental Factors
Across all ethnicities and age groups, the influence of various cultural (traditional) food
practices such as eating certain types of food and the food preparation were commonly
expressed by participants. Participants referred to these as their “identity”, “heritage” or
“culture” that were important in bringing back memories and providing a sense of comfort and
‘proximity’ to their home country.
“I will have to eat Caribbean foods, [it] makes you feel good, and makes you feel as if you
are home, [and] that’s part of you. Potatoes are not part of me, chapattis are not part of me.
So, I’ve got this [Caribbean foods] as part of me…. Sometimes when you eat it, it brings back

192
memories of certain things, so that’s why I do enjoy it when I cook it. I’ll cook it to remember
a lot of things” (P83, 71 years, Caribbean, Female).
It emerged that some participants did not like the format and content of some health education
messages relating to their traditional foods. While messages around reducing portion sizes were
regarded as feasible, messages involving the removal of their traditional food were heavily
criticised. For instance, eight participants (six males and two females) described dietary advice
that meant they should stop eating their traditional food completely as not realistic or feasible:
“A dietician once told a black woman from the Caribbean to cut out her Caribbean food
altogether. You never tell a white person to cut out their potatoes. To deny someone their culture
and heritage will not work for me…food is what makes a person what they are….” (P67, 63
years, Caribbean, Male).
The influence of the multi-cultural and super-diverse environment of Birmingham on access
and affordability of food was also raised by participants. In general, participants highlighted the
diversity in Birmingham as having an important role in ensuring accessibility to, and
affordability of, some of their traditional foods which was not the case in cities/areas with less
diversity. Besides accessibility and affordability, diversity was also reported as helping them to
feel comfortable when buying their traditional foods, as one participant recounted:
“It [diversity] has made myself very comfortable, I feel comfortable because I know they
are other people also having the same sort of food. At the market, I see people buying food like
me. It makes me feel happy and [at] one with the place” (P6, 62 years, African, Male).

193
“In Birmingham, you can get anything you want as far as African food is concerned. You
can get anything you want here. I think it has made us eat well as we can get yam, gari [flour
grains from cassava] or anything at any time” (P97, 72 years, African, Male).
As revealed above, participants considered themselves to be eating ‘healthily’ because they can
access the foods they prefer and value. Also, it was revealed that the diversity in the
Birmingham area had encouraged the major grocery chains to sell some traditional foods, thus
making it more accessible. Probing further, it emerged that most women, living in the most
deprived neighbourhoods per the UK Index of Multiple Deprivation (IMD) scale, described the
prices of traditional foods in these supermarkets as slightly more expensive compared with
those sold in their local corner shops or the budget market located in the city centre.
“Because of the diversity, you can now shop for traditional foods at the Asian shops, at
Tesco, at Lidl, at Asda, but it’s a bit dear as compared to the market at Bullring [budget market
in the city centre]” (P63, 67 years, Caribbean, Female).
Predominately, more African and Caribbean participants describe their traditional foods as
expensive as compared to South Asian participants. These responses were common among both
sexes and across the IMD quartiles. However, the influence of traditional food prices on food
choices was mixed among this sub-population. While a few (11%) reported that it had no effect,
more participants (32%) thought otherwise. As shown in the contrasting quotes below:
“Well, another thing again… provided it's good for you; I never think it's too expensive. I
never question that. It doesn't matter…. If I've seen it, want it, I'll buy it” (P96, 76 years,
African, Male).

194
“I don’t eat much of the Caribbean [food], we eat more rice and the other stuff because
the Caribbean food is very expensive. Rice is cheaper as compared to green bananas, yams,
and sweet potatoes…. Yes, I do enjoy these more, but we just have to manage with that rice,
because of the prices” (P20, 86 years, Male, Caribbean).
Exploring the importance of diversity further, a few (6%) of the African and Caribbean women
reported that the multicultural nature of Birmingham provides them with a platform to share
healthy practices across ethnicities. For instance, they reported sharing best practices with
friends and church members on healthy ingredients and other efficient ways to manage and
control chronic diseases with food.
“Very multicultural…. because especially with the Sikh community, because they tell me
about what things are good. My friend, she'll tell you how to use these powders. So, I think the
multicultural [environment], you pick up and share different ideas” (P68, 60 years, Caribbean,
Female).
Finally, some (32%) participants highlighted the effect of bad weather, notably increased snow
and rain, as making it unsafe and demotivating to participate in usual outdoor activities such as
walking or gardening. In general, the cold weather was reported as the main cause of an increase
in joint pain, making it more difficult to engage in physical activities.
“The only thing that would prevent me from going out is the weather. If the day is a normal
day, I'll visit a friend. Doing something to the car or something like that, keeping fit…but if it’s
raining or snowing, my knees start to hurt, I just stay in bed” (P66, 73 years, Caribbean, Male).

195
Besides the influence of the weather on maintaining physical function, it also emerged that with
the cold weather, eating patterns are disrupted as narrated by one participant, as she prefers
vegetables in the summer as compared to the winter:
“Like with my vegetables, in winter I really don’t like to eat vegetables, I don’t know why.
In the summer I will eat any amount of vegetables, but when it comes to winter, my mind just
blocks vegetables out. I don’t know why” (P72, 68 years, Caribbean, Female).
5.4.3. Perceived Changes at Follow-Up
At the 8-month follow-up, one-third of the participants reported significant changes in their
eating behaviours and physical function. The rest of the participants reported little or no
changes. Those reporting significant changes described recent sickness and hospitalisation,
falls/accidents, fasting, and changes in the level of support as factors influencing their eating
behaviours and physical function. The impact of these changes was mixed, while some (42%)
described the changes as positive, that is supporting them to either eat well or improve their
physical function, the majority (58%) considered these changes as negative, thus affecting their
physical function or eating behaviours. Predominantly, more men reported adverse changes
compared with women.
“Well, it [eating behaviours] has changed quite a lot, to be honest. Because as I said, I
used to have a wife…my wife used to cook, but now I have to do all that myself and it is not
easy. I don’t think I am eating that well” (P58, 65 years, Caribbean, Male).
Most men who reported these negative changes were living in the most deprived
neighbourhoods as per the UK IMD scores. However, this was not the same trend with most
women reporting positive changes, who lived in areas of lower deprivation. There were also
differences in responses by age among the men reporting changes. Men who were older than

196
70 years expressed more negative changes as compared to those aged less than 70 years.
However, this trend of responses again did not apply to women, as their responses to
experiencing changes were evenly distributed across the age range. Participants who engaged
in health education opportunities during the study described these as accounting for their
experiencing positive changes over the 8 months. A woman reporting a positive change,
explained how her recent visit to a clinic-based health education session during the study period
led her to make healthy dietary changes.
“To be fair, I have cut out sugar. That's one of the things I've done since I saw you, I did
go down from one [teaspoon of sugar] to half. Now, I can drink things. Well, I went to the
hospital and the nurse said a group of us who are pre-diabetic, that it will help….” (P68, 60
years, Caribbean, Female).
The introduction of fasting (both religious and non-religious) was also an important change
discussed by participants, especially those reporting sicknesses during the follow-up period. As
described by one participant, introducing fasting was perceived as an effective way to lose
weight and regain fitness:
“I’m putting on the weight, because of the drugs or because I was in the hospital or
whatever the reason might be. So, now I decided to start fasting. If I’m fasting, I feel lighter
with my weight and more energy” (P80, 84 years, Indian, Male).
Consistent with the baseline responses, changes in weather were repeated as influencing
physical function. Participants interviewed during the summer months at follow-up expressed
this as an enabling factor to maintaining their physical function and to getting out of the house,
engaging in activities, visiting community clubs and religious groups. In contrast, participants

197
interviewed during the winter perceived it as a barrier to maintaining their physical function as
they opted to stay in bed at most times.
“The weather, I will say yes. You see, like, when the weather [is] hot and nice [like] now,
it makes you want to come out of the house, and find different things to do but when you
[researcher] came in the winter, I was always in bed, you don’t want to go out, no, there is no
motivation to do anything” (P72, 68 years, Caribbean, Female).
5.5. Discussion
This study found diverse perceptions of healthy eating and physical function among ethnic
minority older adults that were in some cases shaped by socio-demographic characteristics. The
findings revealed that eating behaviours and physical function were influenced by a wide range
of factors, from personal, social to environmental factors. At follow-up, more men reported
negative changes to eating behaviours and physical function. The key findings are summarized
and discussed as follows.
5.5.1. Perceptions of Healthy Eating and Physical Function
Perceptions of healthy eating differed by sex, ethnicity, age and educational attainment.
Common perceptions of healthy eating were a reduction in portion sizes, cutting out fat and not
skipping meals. In addition to these, women perceived healthy eating to be related to cooking
methods. Some of these findings are consistent with previous studies conducted among ethnic
minorities and the white English population [43–45]. However, the comparison of perceptions
by socio-demographic characteristics within a large sample of ethnic minority groups makes
the findings of this study unique.
One of the significant findings is that South Asian women considered healthy eating to be eating
more satiating foods. In previous research, South Asian participants preferred traditional foods

198
for their satiating properties, however, they added that these were not healthy [8]. The study
also found that participants with a medical condition and having recently attended a relevant
health education session were likely to report making changes to their diets or improving their
physical function. Similar to the Hertfordshire study, older white British participants
commented on diets during their upbringing and the effort made to change later in life due to
health reasons, citing the influence of the media [46]. The reliance on the media was different
in the current study. Participants in this study relied mainly on health care providers for
information. This could be attributed to the relatively lower literacy rates among ethnic
minorities [47], or alternatively, to the fact that most media sources might not have culturally-
tailored messages targeting these populations.
Differing perceptions about traditional foods were present between ethnicities. Those self-
identifying as Indian or Pakistani perceived their foods to be generally unhealthy, whereas
African and Caribbean older adults viewed it otherwise. These findings are in contrast to a
comparative study of African and Caribbean women in the USA, in which African women were
more likely to consider their diets as unhealthy and hence made changes to foods and cooking
methods [48]. Consistent with this study, Caribbean women valued their traditional foods and
cooking practices and believed it kept them healthy [48]. The perception of Indian and Pakistani
older adults of the healthiness of their traditional foods within this study also resonates with the
findings of a study looking at perceptions of British-Pakistani older adults living in Bradford,
which found that they considered their traditional foods, among other things, to be heavy and
unhealthy [8]. Furthermore, African and Caribbean older adults in the present study also
considered their traditional foods expensive compared with their South Asian counterparts, and
therefore had to make uncomfortable dietary adjustments in some instances. This might have

199
implications for the enjoyment of meals and diet quality and should be investigated further in
future studies.
Most participants rated their physical function highly and perceived that physical function was
related to health/fitness, exercise, and the ability to carry out activities of daily living. The
present study found that participants’ self-rated health was in most cases opposite to self-rated
physical function. Previous research reported that the social and economic disadvantages
experienced over the life course partly accounts for low-self reported health [49], and that low
self-rated health was associated with limitations in activities of daily living [50]. In the present
study, participants commonly expressed a fear of losing independence, which could have
influenced the discrepancy between self-rated physical function and self-rated health. Some
recounted stories of family or friends losing their independence and having a poor quality of
life; this fear of loss of independence may have been a reason for the high self-rated physical
function, and a possible motivator to maintain physical function as explained in the extended
Health Belief Model (HBM) [51].
5.5.2. Factors Influencing Eating Behaviours and Physical Function
The present study found that at the personal level, health conditions, pain, age and retirement
were factors influencing eating behaviours and physical function. At the social level, changes
in social support, living arrangement and community involvement were identified as key
factors. At the cultural or environmental level, superdiversity, the cultural identity of food, and
the weather were identified. These factors also differed by socio-demographic characteristics
of participants and were in some instances consistent with previous studies [19–
21,34,46,52,53]. However, there were some unique differences compared with the existing
literature. For example, at the physical environment level, the influence of super-diversity was

200
quite novel. Super-diversity refers to the unprecedented collection of different nationalities,
faiths, languages, cultures and ethnicities in a society [54]. This study found that participants
living in super-diverse communities not only appreciated the accessibility and affordability of
traditional foods, but also, they described it as providing them with a comfortable environment
to eat and shop. This is in contrast to previous studies, where white British older adults
expressed shopping difficulties, such as access to supermarkets and being able to purchase
single portion foods [46,55]. Possibly, the influx of ethnic minority corner shops and
supermarkets due to the diversity of the geographic area might account for the differences found
between the present study and previously published research. Our findings also contrast with
those reported in a study from the Netherlands, in which young immigrants had difficulty in
reconciling lifestyle from their country of origin and the host country [21]. The increased length
of time that the older participants had lived in the UK may account for these differences.
Furthermore, the diverse environment was reported as enabling minority ethnic older adults to
share cultural practices. The multicultural nature of these communities was serving as a basket
of knowledge for them to share culinary skills and recipes for combating diseases. Thus, it
highlights more evidence of heterogeneity among ethnic minority communities. The differences
shared among and within these groups could be used in tailoring community-based
interventions to give the desired results as proven effective in previous interventions [16,18].
At the personal level, most of the findings were consistent with previous literature [41,56,57].
However, the comparative analysis of these factors revealed new insights. For example, not all
participants in this study saw retirement as impacting eating habits positively, as data from
white British older adults has previously found [46]. Some participants saw retirement as
negatively affecting their eating behaviours and physical function, as they either had more time

201
to ‘overeat’ or not get out of the house more to improve on their physical activities. In some
cases, increased religious and family commitments after retirement also affected eating
behaviours and physical function.
At the social level, the act of commensality was described as supporting older adults not only
to eat better but to enjoy meals more, and this is comparable with previous literature including
white British older adults [55,58]. Our data suggest that eating together might also be enhancing
the variety of meals, as participants reported eating more varied diets when with company. This
concurs with a study of factors influencing varied diets in community-dwelling older adults in
Europe [56]. Furthermore, the dietary advice and support received from family and friends
during meal times were also considered vital. This could contribute to diet quality as observed
in previous studies [46,56], but more investigation is needed in this population to confirm this
supposition. In addition to the family’s support in eating better, our data suggest that family
support also played a role in keeping some participants active through encouragement, buying
exercise equipment and buying gym memberships. This was different from other studies in
which family members were overprotective and in some cases prevented older adults from
engaging in physical activities due to fears for their safety and health [57]. One possible
explanation for this difference could be attributed to the fact that family and friends within this
study were reported to be physically active and interested in healthy eating, which may not have
been the case in previous studies.
The regular meetings of ethnic minority older adults at faith centres, clubs and community
centres were also reported as significant influences on eating behaviours and physical function.
These meeting places were expressed as an avenue to worship, exchange ideas, offer support
for colleagues during difficult times and engage in leisure activities with friends. Also, a few

202
of these gatherings offered meals, exercise classes or nutrition talks; these could form part of
the ‘active ingredients’ of how social networks influence health outcomes in later life. These
findings concur with previous research which found that increased social networks and greater
involvement in leisure activities did not only improve diet quality in older adults but also
enhanced resilience to cope with lifestyle changes [58,59].
Given that not all older adults experience the same level of changes in eating behaviours and
physical function as they age, this study provided novel findings with regards to perceived
changes with time and how these differed within this sample of ethnically diverse older adults.
Our results indicated that a third of the participants experienced changes within a rapidly short
period. Some of the changes during follow-up were the introduction of fasting (with the primary
goal of weight loss), changes in the level of support, sickness, accidents/falls and changes in
the weather. Men living in higher areas of deprivation were more likely to experience negative
changes perceived to be affecting their diet and physical function as compared to women.
Previous literature supports these findings as they suggest that men, especially those with poor
cooking skills, are likely to have negative changes to diet after losing their spouse, as most
meals were previously prepared by their spouse [60,61].
Considering that most participants in this study had one or more diet-related non-communicable
disease, it was surprising to note that at follow-up only a few participants reported making a
positive change to improve their health condition(s). This is contrary to previous findings,
where a majority attributed changing their diet due to their health conditions [52,62]. One
possible explanation for these differences could be the maintenance of eating behaviours for
reasons beyond health concerns among this population. The cultural identity of food appeared

203
to be more of a primary reason for eating habits than health, as participants purported a variety
of benefits of eating their traditional foods.
Perceived negative changes that affected both men and women were the change of weather.
Staying at home during these months may not only affect their physical function, but also makes
it difficult for participants to engage in other community activities, thus the likelihood of
experiencing declines in social ties. This is a commonly-reported issue affecting the ability of
adults to engage in regular physical activity across the lifespan [12,63].
5.5.3. Perceived Priority and Association of Healthy Eating and Physical Function
Our study revealed that community-dwelling ethnically diverse older adults are more likely to
consider healthy eating and physical function to be separate entities with no relationship.
Furthermore, participants commonly prioritised healthy eating over physical function for
general health. While more men prioritised healthy eating over physical function, some women
prioritised physical function, mostly for weight management reasons. However, more women
than men, especially from African/Caribbean backgrounds, viewed healthy eating and physical
function as related. This has implications for how they are likely to understand and adopt
healthy lifestyle practices based on the already existing generic health education messages.
Considering that this population is more sedentary, with some possibly having poorer dietary
habits due to acculturation [7,10,11], this justifies the need to build awareness of the
interrelation of healthy eating behaviours and physical function. This could serve as a primary
factor in increasing knowledge and informing strategies to assist these older adults in making
the adoption of healthy lifestyle practices more feasible.

204
5.6. Implications for Policy and Practice
Given the importance of the cultural significance of eating patterns, culturally tailored
educational messages about healthy eating using traditional foods as practical examples could
be designed by health care providers to ensure proper adherence to dietary advice. Additionally,
considering the differing perceptions and influences on eating behaviours and physical
function, community health interventions and health messages, when delivered, should consider
these heterogeneities between and within ethnicities to avoid broad generalizations and
stereotyping, and to celebrate and harness this diversity to develop and deliver programs that
can achieve the desired results.
Some participants were conscious of their health as they aged and ready to choose healthy
lifestyle options. Hence, resources highlighting the nutrient content of traditional foods, such
as the Ismaili nutritional data on traditional foods [64], could be made readily available. This
tool could also be used to equip health care providers to deliver quality dietary advice per the
UK recommendations, and could inform the development and dissemination of an ethnic
minority version of the Eat-Well plate [65]. Additionally, healthy traditional cooking classes
could be more evidence-informed in their design and content, and delivered at social, religious
and community centres to support older adults in adopting healthier cooking methods. The
addition of these activities to these accessible and ethnicity-specific meeting places would
encourage attendance with the potential of improving social networks and reducing the impact
of loneliness on eating behaviours and physical function found in this study.
Following health education, participants who reported they had been identified as having pre-
diabetes made significant efforts at follow-up to change their diet; thus, increased early
screening and dietary advice would be beneficial in this population. Also, given that some of

205
the meeting places for ethnic older minorities are willing to support these activities, health
authorities could better deliver assessments and health education at these centres to ensure
increased access and acceptability.
5.7. Strengths and Limitations
The inclusion of an under-represented population is a major strength of this study [66].
Moreover, the sample size of the present study was relatively large for a qualitative study, which
benefited the comparative analysis of ethnicities, sex and other socio-economic characteristics.
The study also benefited from a rigorous data analysis process that enhanced the reliability and
trustworthiness of the findings. Two experienced researchers independently coded a sub-sample
of interview transcripts using the developed categorisation matrices. This could have reduced
bias and misinterpretation of data [67]. The longitudinal qualitative design also adds strength
to the study.
Additionally, the diverse experiences of the research team were an advantage. JLT and CAG
are both senior female researchers with vast experience of working with older adults and
ethnically diverse communities. EAA is a doctoral researcher with expertise in qualitative
research in diverse populations. As a male researcher, he was able to recruit more men than
previous studies. However, we must recognise the potential limitations in how we interpret the
data due to the younger age, gender, and different ethnic backgrounds of the research team.
Likewise, the use of interpreters for 19 interviews could have introduced translation bias. We
felt it was essential to utilise trained interpreters to allow for the inclusion of participants with
low English literacy to ensure the sample was more representative of the current level of literacy
in Birmingham [24]. Recognising the potential of compromising validity and reliability of the
study due to the use interpreters, we adopted the following strategies to improve the quality of

206
the data [68,69]: (1) interpreters were carefully interviewed and selected, and were trained to
ensure they fully understood the interview process and their defined roles; and (2) a second
interpreter who understood the respective language of the participant reviewed and evaluated
the recording of the first interview conducted with the trained interpreter before any further
interviews were conducted. This enabled us to revise the interview guide and work with the
interpreter to improve the quality of the translation. These strategies should have contributed to
enhancing the reliability and validity of the data. Additionally, eight months of follow-up
maybe considered a relatively short period of time to observe particularly environmental
changes, hence the authors recommend future studies incorporating a longer follow-up period.
Lastly, despite efforts to recruit similar numbers of older adults across the major ethnic minority
groups living in the Birmingham area, the sample underrepresents older adults of Bangladeshi
origin and South Asian women. Hence, the findings should be interpreted with caution.
5.8. Conclusions
This longitudinal qualitative study found diverse perceptions of healthy eating and physical
function among ethnically diverse older adults. Traditional foods were highly regarded as
healthy foods by African and Caribbean older adults. The presence of super-diversity was
reported as positively influencing accessibility and affordability of traditional foods. Also,
diversity supported them to feel comfortable and encouraged to shop, eat and engage with other
cultures. More men than women perceived healthy eating and physical function to be unrelated,
and prioritised healthy eating over physical function. At follow-up visits, more men than
women reported adverse changes such as changes in the level of support (decline in social
networks), sickness and accidents/falls. These changes were perceived to negatively affect
eating behaviours and physical function.

207
5.9 References
1. Office for National Statistics. Ethnicity and National Identity in England and Wales.
2011. Availabe online:
http://webarchive.nationalarchives.gov.uk/20160105160709/http://www.ons.gov.uk/ons/d
cp171776_290558.pdf (accessed on 26 November 2018).
2. Lievesley, N. The Ageing of the Ethnic Minority Populations of England and Wales:
Findings from the 2011 Census; CPA: Bolton, UK, 2013.
3. Rees, P.; Wohland, P.; Norman, P.; Boden, P. Ethnic Population Projections for the Uk,
2001–2051. J. Popul. Res. 2012, 29, 45–89.
4. Evandrou, M. Social Inequalities in Later Life: The Socio-Economic Position of Older
People from Ethnic Minority Groups in Britain. Popul. Trends 2000, 101, 11–18.
5. Nazroo, J.Y. The Health of Britain's Ethnic Minorities: Findings from a National Survey;
PSI: London, UK, 1997.
6. Sproston, K.; Mindell, J. Health Survey for England 2004; The Health of Minority Ethnic
Groups: UK, 2006.
7. Gilbert, P.A.; Khokhar, S. Changing Dietary Habits of Ethnic Groups in Europe and
Implications for Health. Nutr. Rev. 2008, 66, 203–215.
8. Jamal, A. Food Consumption among Ethnic Minorities: The Case of British-Pakistanis in
Bradford, UK. Br. Food J. 1998, 100, 221–227.
9. Wyke, S.; Landman, J. Healthy Eating? Diet and Cuisine Amongst Scottish South Asian
People. Br. Food J. 1997, 99, 27–34.
10. Babakus, W.S.; Thompson, J.L. Physical Activity among South Asian Women: A
Systematic, Mixed-Methods Review. Int. J. Behav. Nutr. Phys. Act. 2012, 9, 150.
11. Castaneda-Gameros, D.; Redwood, S.; Thompson, J.L. Physical Activity, Sedentary
Time, and Frailty in Older Migrant Women from Ethnically Diverse Backgrounds: A
Mixed-Methods Study. J. Aging Phys. Act. 2018, 26, 194–203.
12. Emadian, A.; Thompson, J. A Mixed-Methods Examination of Physical Activity and
Sedentary Time in Overweight and Obese South Asian Men Living in the United
Kingdom. Int. J. Environ. Res. Public Health 2017, 14, 348.
13. Misra, A.; Ganda, O.P. Migration and Its Impact on Adiposity and Type 2 Diabetes.
Nutrition 2007, 23, 696–708, doi:10.1016/j.nut.2007.06.008.
14. Leung, G.; Stanner, S. Diets of Minority Ethnic Groups in the Uk: Influence on Chronic
Disease Risk and Implications for Prevention. Nutr. Bull. 2011, 36, 161–198,
doi:10.1111/j.1467-3010.2011.01889.x.
15. Age UK. Briefing: Health and Care of Older People in England; Age UK: London, UK,
2017.
16. Bhopal, R.S.; Douglas, A.; Wallia, S.; Forbes, J.F.; Lean, M.E.; Gill, J.M.; McKnight,
J.A.; Sattar, N.; Sheikh, A.; Wild, S.H. Effect of a Lifestyle Intervention on Weight
Change in South Asian Individuals in the Uk at High Risk of Type 2 Diabetes: A Family-
Cluster Randomised Controlled Trial. Lancet Diabetes Endocrinol. 2014, 2, 218–227.
17. Garvin, C.C.; Cheadle, A.; Chrisman, N.; Chen, R.; Brunson, E. A Community-Based
Approach to Diabetes Control in Multiple Cultural Groups. Ethn. Dis. 2004, 14, S1–S83.
18. Two Feathers, J.; Kieffer, E.C.; Palmisano, G.; Anderson, M.; Sinco, B.; Janz, N.;
Heisler, M.; Spencer, M.; Guzman, R.; Thompson, J. Racial and Ethnic Approaches to
Community Health (Reach) Detroit Partnership: Improving Diabetes-Related Outcomes
among African American and Latino Adults. Am. J. Public Health 2005, 95, 1552–1560.

208
19. Emadian, A.; England, C.Y.; Thompson, J.L. Dietary Intake and Factors Influencing
Eating Behaviours in Overweight and Obese South Asian Men Living in the Uk: Mixed
Method Study. Bmj Open 2017, 7, e016919.
20. Osei-Kwasi, H.A.; Powell, K.; Nicolaou, M.; Holdsworth, M. The Influence of Migration
on Dietary Practices of Ghanaians Living in the United Kingdom: A Qualitative Study.
Ann. Hum. Biol. 2017, 44, 454–463.
21. Nicolaou, M.; Doak, C.M.; van Dam, R.M.; Brug, J.; Stronks, K.; Seidell, J.C. Cultural
and Social Influences on Food Consumption in Dutch Residents of Turkish and
Moroccan Origin: A Qualitative Study. J. Nutr. Educ. Behav. 2009, 41, 232–241.
22. Corden, A.; Millar, J. Qualitative Longitudinal Research for Social Policy–Introduction
to Themed Section. Soc. Policy Soc. 2007, 6, 529–532.
23. Tong, A.; Sainsbury, P.; Craig, J. Consolidated Criteria for Reporting Qualitative
Research (Coreq): A 32-Item Checklist for Interviews and Focus Groups. Int. J. Qual.
Health Care 2007, 19, 349–357.
24. Birmingham City Council. Population and Census. Availabe online:
https://www.birmingham.gov.uk/info/20057/about_birmingham/1294/population_and_ce
nsus/2 (accessed on 27 March 2019).
25. Birmingham City Council. 2016 Population Based Projections. Availabe online:
https://www.birmingham.gov.uk/downloads/file/4609/2016_population_based_projection
s (accessed on 27 March 2019).
26. Patton, M. Qualitative Research and Evaluation Methods 2002 Thousand Oaks; Sage
Publications: Thousand Oaks, CA, USA, 2002.
27. Penrod, J.; Preston, D.B.; Cain, R.E.; Starks, M.T. A Discussion of Chain Referral as a
Method of Sampling Hard-to-Reach Populations. J. Transcult. Nurs. 2003, 14, 100–107.
28. Teddlie, C.; Yu, F. Mixed Methods Sampling: A Typology with Examples. J. Mix.
Methods Res. 2007, 1, 77–100.
29. Garduño‐Diaz, S.; Husain, W.; Ashkanani, F.; Khokhar, S. Meeting Challenges Related
to the Dietary Assessment of Ethnic Minority Populations. J. Hum. Nutr. Diet. 2014, 27,
358–366.
30. Denzin, N.K.; Lincoln, Y.S. The Sage Handbook of Qualitative Research; Sage:
Thousand Oaks, CA, USA, 2011.
31. Moustakas, C. Phenomenological Research Methods; Sage: Thousand Oaks, CA, USA,
1994.
32. Story, M.; Kaphingst, K.M.; Robinson-O’Brien, R.; Glanz, K. Creating Healthy Food and
Eating Environments: Policy and Environmental Approaches. Annu. Rev. Public Health
2008, 29, 253–272.
33. Bronfenbrenner, U. International Encyclopedia of Education, 2nd ed.; Husen, T.,
Postlethwaite, T., Eds.; Pergamon Press/Elsevier Science: Oxford, UK, 1994; Volume 3,
pp. 1643–1647.
34. Castaneda-Gameros, D.; Redwood, S.; Thompson, J.L. Low Nutrient Intake and Frailty
among Overweight and Obese Migrant Women from Ethnically Diverse Backgrounds
Ages 60 Years and Older: A Mixed-Methods Study. J. Nutr. Educ. Behav. 2017, 49, 3–
10.e11.
35. Bryman, A. Social Research Methods; Oxford University Press: Oxford, UK, 2015.
36. Rubin, H.J.; Rubin, I.S. Qualitative Interviewing: The Art of Hearing Data; Sage:
Thousand Oaks, CA, USA, 2011.
37. Pope, C.; Ziedland, S.; Mays, N. Qualitative Research in Health Care: Analysing
Qualitative Data. BMJ Br. Med. J. 2000, 320, 114.

209
38. QSR International. Nvivo Qualitative Data Analysis Software (Version 12); QSR
International Pty Ltd.: Victoria, Australia, 2012.
39. Elo, S.; Kyngäs, H. The Qualitative Content Analysis Process. J. Adv. Nurs. 2008, 62,
107–115.
40. Hsieh, H.-F.; Shannon, S.E. Three Approaches to Qualitative Content Analysis. Qual.
Health Res. 2005, 15, 1277–1288.
41. Castaneda-Gameros, D.; Redwood, S.; Thompson, J.L. Nutrient Intake and Factors
Influencing Eating Behaviors in Older Migrant Women Living in the United Kingdom.
Ecol. Food Nutr. 2018, 57, 50–68.
42. Thorne, S. Data Analysis in Qualitative Research. Evid. Based Nurs. 2000, 3, 68–70.
43. Brownie, S.; Coutts, R. Older Australians’ Perceptions and Practices in Relation to a
Healthy Diet for Old Age: A Qualitative Study. J. Nutr. Health Aging 2013, 17, 125–129.
44. de Rosso Krug, R.; Rodrigues Barbosa, A.; Aita Monego, E.; de Mello, F.; Schaefer,
A.L.; Francielle França, V. Perception of the Older Adults Regarding the Practise of
Physical Activity and Healthy Eating. Rev. De La Univ. Ind. De Santander Salud 2015,
47, 115–124.
45. Krahn, V.M.; Lengyel, C.O.; Hawranik, P. Healthy Eating Perceptions of Older Adults
Living in Canadian Rural and Northern Communities. J. Nutr. Gerontol. Geriatr. 2011,
30, 261–273.
46. Bloom, I.; Lawrence, W.; Barker, M.; Baird, J.; Dennison, E.; Sayer, A.A.; Cooper, C.;
Robinson, S. What Influences Diet Quality in Older People? A Qualitative Study among
Community-Dwelling Older Adults from the Hertfordshire Cohort Study, UK. Public
Health Nutr. 2017, 20, 2685–2693.
47. Office for National Statistics. 2011 Census: Detailed Analysis—English Language
Proficiency in England and Wales, Main Language and General Health Characteristics.
Availabe online:
https://www.ons.gov.uk/peoplepopulationandcommunity/culturalidentity/language/article
s/detailedanalysisenglishlanguageproficiencyinenglandandwales/2013-08-30 (accessed
on 27 March 2019).
48. Bramble, J.; Cornelius, L.J.; Simpson, G.M. Eating as a Cultural Expression of Caring
among Afro-Caribbean and African American Women: Understanding the Cultural
Dimensions of Obesity. J. Health Care Poor Underserved 2009, 20, 53.
49. Hudson, D.L.; Puterman, E.; Bibbins-Domingo, K.; Matthews, K.A.; Adler, N.E.; Race,
Life Course Socioeconomic Position, Racial Discrimination, Depressive Symptoms and
Self-Rated Health. Soc. Sci. Med. 2013, 97, 7–14.
50. Evandrou, M.; Falkingham, J.; Feng, Z.; Vlachantoni, A. Ethnic Inequalities in Limiting
Health and Self-Reported Health in Later Life Revisited. J. Epidemiol. Community
Health 2016, 70, 653–662.
51. Orji, R.; Vassileva, J.; Mandryk, R. Towards an Effective Health Interventions Design:
An Extension of the Health Belief Model. Online J. Public Health Inform. 2012, 4,
doi:10.5210/ojphi.v4i3.4321.
52. Ree, M.; Riediger, N.; Moghadasian, M. Factors Affecting Food Selection in Canadian
Population. Eur. J. Clin. Nutr. 2008, 62, 1255.
53. Horne, M.; Skelton, D.; Speed, S.; Todd, C. Attitudes and Beliefs to the Uptake and
Maintenance of Physical Activity among Community-Dwelling South Asians Aged 60–
70 Years: A Qualitative Study. Public Health 2012, 126, 417–423.
54. Vertovec, S. Super-Diversity and Its Implications. Ethn. Racial Stud. 2007, 30, 1024–
1054.

210
55. Whitelock, E.; Ensaff, H. On Your Own: Older Adults’ Food Choice and Dietary Habits.
Nutrients 2018, 10, 413.
56. Dean, M.; Raats, M.M.; Grunert, K.G.; Lumbers, M. Factors Influencing Eating a Varied
Diet in Old Age. Public Health Nutr. 2009, 12, 2421–2427.
57. Sriskantharajah, J.; Kai, J. Promoting Physical Activity among South Asian Women with
Coronary Heart Disease and Diabetes: What Might Help? Fam. Pract. 2006, 24, 71–76.
58. Bloom, I.; Edwards, M.; Jameson, K.A.; Syddall, H.E.; Dennison, E.; Gale, C.R.; Baird,
J.; Cooper, C.; Aihie Sayer, A.; Robinson, S. Influences on Diet Quality in Older Age:
The Importance of Social Factors. Age Ageing 2017, 46, 277–283.
59. Blane, D.; Wiggins, R.D.; Montgomery, S.M.; Hildon, Z.; Netuveli, G. Resilience at
Older Ages: The Importance of Social Relations and Implications for Policy. Icls
Occassional Pap. 2011, 3, 1–9.
60. Hughes, G.; Bennett, K.M.; Hetherington, M.M. Old and Alone: Barriers to Healthy
Eating in Older Men Living on Their Own. Appetite 2004, 43, 269–276.
61. McDonald, J.; Quandt, S.A.; Arcury, T.A.; Bell, R.A.; Vitolins, M.Z. On Their Own:
Nutritional Self-Management Strategies of Rural Widowers. Gerontologist 2000, 40,
480–491.
62. Kumanyika, S.; Tell, G.S.; Shemanski, L.; Polak, J.; Savage, P.J.; Group, C.H.S.C.R.
Eating Patterns of Community-Dwelling Older Adults: The Cardiovascular Health Study.
Ann. Epidemiol. 1994, 4, 404–415.
63. Salmon, J.; Owen, N.; Crawford, D.; Bauman, A.; Sallis, J.F. Physical Activity and
Sedentary Behavior: A Population-Based Study of Barriers, Enjoyment, and Preference.
Health Psychol. 2003, 22, 178.
64. Judd, P.A.; Khamis, T.K.; Thomas, J.E. The Composition and Nutrient Content of Foods
Commonly Consumed by South Asians in the UK; Aga Khan Health Board for the United
Kingdom: London, UK, 2000.
65. Buttriss, J. The Eatwell Guide Refreshed. Nutr. Bull. 2016, 41, 135–141.
66. Redwood, S.; Gill, P.S. Under-Representation of Minority Ethnic Groups in Research—
Call for Action. Br. J. Gen. Pract. 2013, 63, 342–343.
67. Mays, N.; Pope, C. Qualitative Research: Rigour and Qualitative Research. BMJ 1995,
311, 109–112.
68. Murray, C.D.; Wynne, J. Researching Community, Work and Family with an Interpreter.
Communitywork Fam. 2001, 4, 157–171.
69. Temple, B.; Young, A. Qualitative Research and Translation Dilemmas. Qual. Res. 2004,
4, 161–178.

211
CHAPTER 6
GENERAL DISCUSSION
The purpose of this PhD research was to explore profiles of SN, nutrition, and physical function,
and changes in these variables among community-dwelling ethnically diverse older adults at
baseline and after 8-months. The research also explored the key factors influencing eating
behaviours and physical function and the extent to which these change over an 8-month period
in this population. As such, a longitudinal mixed-method approach was used, with data
collection structured into two visits each at baseline and follow-up. The findings are novel and
particularly useful given the unique study design and the inclusion of both genders of ethnic
minority older adults from the major ethnic minority groups living in an ethnically diverse city,
Birmingham, UK. This final chapter discusses the unique and important contribution of this
research to the literature. It also explores the strengths and limitations of this PhD research and
concludes by discussing the implications and recommendations for research, policy and
practice.
6.1 Summary of Key Findings (Chapters 3-5)
As the first longitudinal mixed-methods study to explore the profile of, and changes in, SN,
nutrition and physical function in ethnic minority older adults, the findings present new insights
into the profile and dynamics of SN, nutrition and physical function within eight months. Most
participants experiencing changes transitioned from an integrated SN to non-integrated SN
(63%), and more importantly, these changes occurred over a relatively short period. Participants
were cognizant of the influence of these changes, and those who remained in, or transitioned
to, non-integrated SN had relatively higher declines in physical function and poorer nutrient
intakes. Specifically, intakes of most micronutrients across the sample over time were lower

212
than the UK RNI, suggesting a prolonged nutrient deficiency in this population. Similarly, there
were significant declines in nutritional status and physical function, identifying those with
higher physical function at baseline having a reduced rate of decline in nutritional status at
follow-up. Furthermore, this PhD research found that most participants considered healthy
eating and physical function as separate entities with no relationship, and considered super-
diversity as vital in aiding the accessibility and affordability, and the feeling of comfort when
eating and shopping for their traditional foods.
6.2 Reflection of main findings and their contribution to the literature
The following sections provide a deeper reflection on the main findings of this PhD and their
significant contribution to literature.
6.2.1 Ethnic and Sex Differences in a Super-Diverse City
In the context of the heterogeneity shared between and within ethnic minority groups, there is
evidence that good knowledge of gender and ethnic differences in factors influencing health
among ethnic minorities and the subsequent integration of these differences into health
interventions is vital in ensuring the success of public health interventions (Liu et al., 2015).
Despite this, the existing studies in ethnic minorities have often focussed on one specific ethnic
group (mostly South Asian or Caribbean populations) or simply just on a specific sex group
(Castaneda-Gameros et al., 2018a; Earland et al., 2010; Emadian, England, & Thompson, 2017;
Garcia & Da, 2011). For example, Earland and colleagues (2017) explored the nutrient status
and health outcomes of a single ethnic group, African-C aribbean aged 19-65 years in the UK.
Additionally, a recent study exploring dietary acculturation and factors affecting eating patterns
was conducted in a single ethnic group, Ghanaian immigrants aged 25 years and older (Osei-
Kwasi et al., 2017). It is also found that even though some studies included multi-ethnic
samples, the findings were not powered sufficiently to highlight the differences or similarities

213
shared by ethnicities (Castaneda-Gameros et al., 2018a; Terragni et al., 2014). For instance, a
study exploring the early phase of migration on food acculturation of 21 African and Middle
Eastern women aged 30-69 found collectively that the early phase of migration was
characterised by the fear of eating certain unknown foods, thus restricting to familiar or safe
foods. These previous studies have limited our understanding of how the factors influencing
eating behaviours and physical function contrast between and within ethnic minority groups,
especially when living together in a super-diverse city. In addressing this literature gap, this
PhD research recruited a much larger multi-ethnic sample (n=100), allowing the findings to be
contrasted clearly between ethnicities. The findings of ethnic differences in nutrient intake in
chapter 4 (study 2), were supported by the distinct perceptions of healthy eating, and factors
influencing eating behaviours such as the perceived price of traditional foods between South
Asians, Africans and Caribbean in Chapter 5 (study 3). This new information is vital, supporting
the heterogeneity shared within ethnic minorities and could be used to tailor interventions
accordingly.
Similarly, the fairly equal representation of gender (59% males and 41% females) in this PhD
research provided a deeper understanding of the potential differences in SN and nutrient profiles
by gender, and also how the factors influencing these, are shaped by gender, which was lacking
from previous research in single gender samples (Castaneda-Gameros et al., 2018a; Emadian
et al., 2017; Terragni et al., 2014) or in most studies that had poorer representation of males
(Earland et al., 2010). In this PhD research, chapter 3 (study 1) found that males had
significantly less integrated SN as compared to females. These findings explained the poorer
nutrient intakes and perceived negative changes of factors influencing eating behaviours and
physical function expressed by males in chapter (study 4) and chapter 5 (study 3), respectively.
These findings contrast with previous studies that observed that females were more likely to

214
experience poorer SN and poorer health outcomes (Burholt et al., 2018; Kim, Park, &
Antonucci, 2016). For example, a SN study in Birmingham among 590 ethnic older minorities
aged 55 years and older found that females had a lower odds of belonging to a Multigenerational
Household: Younger Family (an integrated SN) as compared to remaining in a restricted Non-
kin SN, and additionally being female was associated with a higher risk of loneliness (Burholt
et al., 2018). However, in the context of the broader literature in non-ethnic minority
populations, the findings of lower SN of men and their resultant impact observed throughout
this PhD research are consistent with other studies (Conklin et al., 2014; Schwartz & Litwin,
2018).
Overall, ethnic and gender differences in factors influencing eating behaviours and physical
function, and their consequential impact on nutrient intake over time observed has bridged an
important literature gap, and serves as an essential resource to design effective interventions for
better health outcomes in this population.
6.2.2 The observed changes in SN, nutrient intake, nutritional status and physical
function
The cross-sectional findings are consistent with the majority of SN literature in older adults that
highlight the importance of integrated SN for better health outcomes and quality of life (Burholt
et al., 2018; Santini et al., 2015; Seeman, 1996; Stephens et al., 2011). Also, regarding nutrient
intakes, the cross-sectional findings are consistent with other studies, highlighting the
inadequate nutrient intakes among ethnic minorities, which accounts partly for the higher
prevalence of diet-related non-communicable diseases among ethnic minorities as compared to
the general population (Bruins, Van Dael, & Eggersdorfer, 2019; Castaneda-Gameros et al.,
2018a; Garcia & Da, 2011; Johnson & Garcia, 2003; Sproston & Mindell, 2006; Vyas et al.,

215
2003; Zhang, Hsu-Hage, & Wahlqvist, 2002). Beyond these similarities in the findings shared
by the present PhD thesis and previous literature, the provision of detailed information on the
scope of changes in SN, nutrition, physical function, and how perceived factors influencing
these variables change over time, have contributed to the literature, which otherwise included
‘snapshot’ knowledge provided by the majority of cross-sectional studies in this population. It
has also contributed in dispelling a common belief, which indicates that all ethnic minorities
have stable integrated SN due to the presence of multigenerational households. This new
knowledge has important implications for the provision of formal and informal services to
support older adults embedded in non-integrated SN to improve their SN, eat well and maintain
a healthier ageing trajectory.
Regarding the direction of change, these PhD findings contrast with some longitudinal studies
exploring changes in SN, nutrient intake and physical function in either ethnic minority groups
or the general population of predominately white Europeans (Buttery et al., 2016; Schwartz &
Litwin, 2018; Zhang et al., 2002). In this PhD thesis, the majority of participants (63%)
experiencing changes declined from an integrated SN to a non-integrated SN over just 8-
months; in contrast, a study of older Europeans aged 65 years and older found a general trend
of network expansion over time, with participants having an increased proportion of family ties
and addition of new members over a period of 3 years (Schwartz & Litwin, 2018). Also, as
compared to the significant declines in some observed micronutrient intakes in the present PhD
research, an 8-year longitudinal study of 262 Chinese older adults in Melbourne (mean age at
follow-up 55+ years) reported a substantial increase in all nutrients over time (Zhang et al.,
2002). The study of Zhang and colleagues utilised the FFQ, which has been found to
overestimate nutrient, and the failure of the authors to account for increase supplements at
follow-up could be accounting for the differences (Adamson et al., 2009). In addition, the

216
differences in the follow-up time between the PhD research and previous literature could largely
be accounting for the differences in the direction of change. In general, the eight months follow-
up of this PhD research was greater than other studies (Newsom et al., 2003; Vinokur & Van
Ryn, 1993). For instance, a longitudinal study exploring changes in SN in relation to the positive
and negative exchanges of SN in 277 older adults used a brief follow-up period of 13 weeks
and found no changes in SN (Newsom et al., 2003). However, the majority of longitudinal
literature exploring SN, nutrient intake and physical function, incorporated a longer follow-up
period (minimum of two years), which makes this PhD follow-up time relatively short (Kim et
al., 2016; Schwartz & Litwin, 2018; Zhang et al., 2002). Despite the main differences in follow-
up, the negative changes observed in just eight months makes this PhD research particularly
note-worthy, suggesting the rapid instability of SN, which explained the decrease in nutrient
intakes, nutritional status and physical function. What will be interesting and could be an
important area of focus for future studies, is to examine over a longer follow-up whether these
changes are transient or potentially part of negative changes that persist over time in this
relatively under-researched population.
6.2.3 The Observed Association of SN, Nutrient intake and Physical function over time
Given the dearth of literature regarding how these variables are related among ethnic minority
older adults, the findings of integrated SN at baseline associated with higher physical function
at follow-up provided important insights to the literature. Additionally, the association of a
higher physical function with higher nutritional status at follow-up and most notably how
participants perceived these associations over time are very important in bridging the literature
gap. What is particularly crucial in this PhD research was the provision of knowledge that
explains why these changes occur over time. For instance, in chapter 3 (study 1), the qualitative
findings revealed that with declines in SN, participants were more reluctant to shop, cook and

217
eat healthy meals; hence the poorer nutrient intakes and the subsequent declines in nutritional
status and physical function observed in chapter 4 (study 2). Also in chapter 5 (study 3), some
perceived factors influencing eating behaviours demonstrate that ethnic minority choices of
meals are not primarily guided by health reasons but by a host of cultural, religious and
environmental reasons. This might partly explain the consistently lower nutrient intakes as
compared to the UK RNI or even in studies in predominately white population samples, in
chapter 4 (Study 2). Additionally, the perceived impact of social support on eating behaviours
and physical function in chapter 5 (study 3), enlightened the direct path of the mechanism of
impact of SN as described in the ‘social control’ model (Umberson, 1992).
Overall, the findings of this PhD research have contributed significantly in advancing the
literature on SN, nutrient intake, nutritional status and physical function of older ethnic minority
older adults. It has provided a more comprehensive knowledge of what, how and why these
changes occur in community-dwelling, ethnically diverse older adults over time.
6.3 Strengths and Limitations
Regardless of the unique findings observed in each study of this PhD thesis (Chapter 3-5), it is
essential to highlight the strengths and limitations of this PhD research to guide the
interpretation and use of the findings.
As what appears to be the first longitudinal mixed-method study to explore SN, nutrition and
physical function in community-dwelling, ethnically diverse older adults (based on existing
published literature), the findings are new and provide a deeper understanding of changes in
SN, nutrition and physical function that are lacking with the snapshot evidence provided by
previous cross-sectional studies in this population (Burholt et al., 2018; Burholt et al., 2000;
Earland et al., 2010; Emadian et al., 2017; Garduno-Diaz & Khokhar, 2014). Additionally, the

218
study design provided detailed information on the perceptions of factors influencing eating
behaviours and physical function, in particular how these factors change over time, which was
missing in the existing literature within this population.
Given the scarce literature about SN, nutrition and physical function in ethnic minorities,
especially among the older population, the inclusion of this relatively under-researched
population serves as a major strength of this PhD thesis. The sample size, although relatively
small from a quantitative perspective (chapter 4), was ample for the qualitative and mixed-
methods studies (chapter 3 and 5). As such, this PhD research was able to use a comparative
analysis to compare and contrast perceptions of, and key influences on, eating behaviours and
physical function by sociodemographic characteristics such as ethnicity and sex, which have
not been explored in most previous studies (Garcia & Da, 2011; Osei-Kwasi et al., 2017;
Terragni et al., 2014).
Furthermore, most previous studies in ethnic minority older adults have often included a
subjective measure of physical function (Garcia & Reyes, 2017; Ran et al., 2017); which when
compared to performance-based measures (SPPB and HGS) have an increased tendency to
misrepresent older adults’ physical function, thus giving inaccurate associations of physical
function with other health indicators such as mortality or the need for long term care (Cooper,
Kuh, & Hardy, 2010; Guralnik et al., 1989). As such, this PhD research included performance-
based measurements of physical function that provided a more accurate representation of
physical function over time and their relationship with social networks and nutrition.
The ethnic minority status (Ghanaian) and religious affiliation (Christian) of the student
researcher was vital in building rapport among community-dwelling ethnically diverse older
adults, especially African/Caribbean and Christians. This improved participant recruitment and

219
retention in the study significantly, and enhanced the trust and credibility of the researcher,
which has been shown to improve the quality of interviews with ethnic minorities (Garduño‐
Diaz et al., 2014). Participants often saw the student researcher as an ‘insider,’ thus their
overwhelming interest in the success of the study as evidenced in the qualitative interviews
(Mullings, 1999). Additionally, the male status of the ethnic minority researcher may have aided
in recruiting a high proportion of males as compared to previous ethnic minority studies that
encountered difficulty in recruiting them (Earland et al., 2010; Nicolaou et al., 2009). For
instance, a study of dietary intake and health status among African-Caribbean aged 19-65 years
in the UK managed to recruit only 15% of males (Earland et al., 2010). The balanced
representation of gender in the present findings provided new insights lacking in previous ethnic
minority studies that were over-represented by females (Earland et al., 2010; Nicolaou et al.,
2009).
Despite the advantage of the ethnic minority status of the student researcher as an “insider”,
there is a possibility that the student researcher’s previous knowledge and experiences of dietary
acculturation as a migrant could have influenced the interpretation of the qualitative findings
(study 1 and 3) (Kanuha, 2000). Also, given the nationality of the student researcher as a
Ghanaian, younger age and academic background, some participants might have viewed the
student researcher in such instances as an ‘outsider’ which could have influenced their
participation in the study and the depth of the data generated (Kanuha, 2000; Mullings, 1999).
To address these potential limitations, the student researcher attended regular community and
faith group meetings with potential participants prior to the start of the study. The remarkably
warm reception received by the student researcher, and the willingness of the community/faith
leaders and potential participants to support and take part in the study, could be strongly argued
as having reclassified the researcher as an ‘insider’ or a ‘highly acceptable outsider’, hence

220
improving data collection and the retention of participants in the study (Mullings, 1999).
Additionally, the student researcher had regular discussions and informal communications
regarding the interpretation of the data from community/faith leaders and also from an
ethnically diverse research team, comprised of a white British male and female, an Irish male,
a Ghanaian female and a white American female (with extensive experience in working with
diverse populations within and outside of the UK).
Limitations of this PhD research included the use of convenience sampling, the difficulty in
recruiting specifically Bangladeshi women, and the inability to include some ethnic minority
groups such as the Chinese or Arabs. This made the sample less reflective of the diversity of all
ethnic minority groups in Birmingham (Birmingham City Council, 2011b). Hence, these
findings may not be generalizable to all ethnic minority older adults living in super-diverse
communities in Birmingham and the UK. Also, the smaller representation of some of the SN
groups, specifically the privately restricted SN group and the local self-contained SN (study 3)
might have influenced the outcome of some of the analysis, hence the results should be
interpreted with caution.
A further limitation was the use of self-reported assessment of diet, which has the potential of
leading to under-reporting of nutrient intakes. Under-reporting contributes to a significant error
in dietary reporting, and is even higher in overweight and obese populations (Rennie, Coward,
& Jebb, 2007; Vyas et al., 2003). However, as compared to previous studies using a single 24-
hour recall which fails to account for day-to-day variation, or the FFQ which has been found to
overestimate energy and nutrient intakes in older adults, this study used an adapted interview
approach multiple-pass 24-hour recall approach on two-non-consecutive days (including a
weekend day) (Adamson et al., 2009; Castaneda-Gameros et al., 2018a; Earland et al., 2010;
Garcia & Da, 2011; Vyas et al., 2003). A well-conducted 24-hour recall on multiple days can

221
provide a closer habitual representation of energy and nutrient intakes than the FFQ (Adamson
et al., 2009; Hoffmann et al., 2002). As such, the four non-consecutive days of multiple-pass
24-hour recall in this PhD research might have minimised the errors of self-reporting of diets
in this study. Despite this, it is possible that the number of days used assessing diet in this
present study were insufficient to accurately capture some nutrients, especially many
micronutrients. The wide day-to-day variation of intake of some micronutrients requires many
days of assessment to capture a closer true representation. A study in Japan found that to capture
true estimates of energy and macronutrients, 3 to 9 days of 24-hour recalls are required, while
a much wider range of 4 to 160 days of 24-hour recalls are required for micronutrients
(Tokudome et al., 2002).
The relatively short follow-up time as compared to previous studies was another limitation and
might have influenced the outcome of the findings as earlier discussed (Buttery et al., 2016;
Kim et al., 2016; Schwartz & Litwin, 2018; Zhang et al., 2002). One must exercise caution
when interpreting these findings, as the changes observed may have been transient, and may
not be reflective of longer-term changes. In addition, seasonality has been found to account
largely for differences in nutrient intake and other activities (Suga et al., 2014; Tokudome et
al., 2002; Tucker & Gilliland, 2007). The design of this PhD data collection did not account for
the impact of seasonality, hence the potential influence of seasonality on the changes in SN,
nutrition or physical function cannot be ruled out.
The use of interpreters was an additional limitation, having the potential to compromise validity
and reliability of the qualitative data, mainly due to translation bias (studies 1 and 3). However,
the use of interpreters was also a strength, as utilising trained interpreters allowed for the
inclusion of participants with low English literacy to ensure the sample was more representative

222
of the mixed level of English literacy in Birmingham (Birmingham City Council, 2011b).
Measures were kept in place to improve the validity and reliability of the translated data. First,
the interpreters were carefully selected with help from the community or religious leaders to
ensure that they were capable of serving as interpreters. Second, they were trained by the
student researcher to ensure they fully understood the interview process and their defined roles.
Finally, before further interviews were conducted, a second interpreter who understood the
respective language of the participant reviewed and evaluated the interview recording done by
the first trained interpreter to ensure it reflected what was discussed.
6.4 Implications and Recommendations of this PhD research
The findings of this PhD study have significant practical implications for researchers working
in ethnic minority communities, and for health and social care professionals and policymakers.
6.4.1 Future research
The majority of SN research including this present thesis has often focussed on the activities
around the respondent (the ego), with little or no attention on the network members related to
the ego (the alters). Given the bidirectional nature of SN, this has often provided less
information on the extent of support (perceived or actual) that is given or received by the egos
and alters in the entire network (Ellwardt et al., 2019; Seale, 2004). To advance towards a
deeper understanding of SN in ethnic minority older population, it is recommended that future
studies should incorporate measures to explore the profile and changes of SN of the entire
network (ego and alters). Moreover, as some research has shown the ‘contagious nature’ of
behaviour, particularly depression, loneliness or changes in physical health in networks,
measuring SN from the perspective of the ego and their alters is essential to exploring the spread
of behaviours within the entire network, and to inform the design of appropriate interventions

223
to support behaviour change (Cacioppo, Fowler, & Christakis, 2009; Rosenquist, Fowler, &
Christakis, 2011).
As highlighted earlier, the potential influence of seasonality on the outcome of the findings
cannot be ruled out (Rossato et al., 2010; Tucker & Gilliland, 2007). Hence, if this study is to
be replicated, researchers could overcome this limitation by designing data collection in a
manner capable of accounting for the influence of seasonality and other important ethnic
minority festivals that could have the potential of influencing SN, nutrient intake or physical
function. This could be done by designing multiple waves of data collection across the year
(fall, spring, summer, winter data collection) to capture seasonal variation. Also, given the
instability of SN along with nutritional status and physical function found in this PhD thesis
within a relatively short period of follow-up, future prospective studies exploring these
variables could include a longer follow-up period to confirm if these changes persist for longer-
term or were just transient changes among this population.
As ethnic diversity continues to increase in the UK and parts of Europe, so will the increase in
the heterogeneity among ethnic minority groups and that of the general population. Hence, it
will be vital for future research in the UK to include more ethnic minority groups, such as East
Asians or Arabs to explore the differences in SN, nutrition and physical function shared among
ethnic minorities and that of the wider population. This resource will support them to age
healthily in an ethnically diverse country.
The design of the present thesis made it impossible to establish cause and effect between the
variables of interest. Future research in ethnic minority older adults should be interventional to
explore the impact of SN on improving healthy eating and physical function in this population.
Given the available evidence of the impact of SN interventions to changing behaviours, a

224
successful SN intervention in this population could be a key to improving the adoption of
healthier behaviours to support successful ageing of ethnic minority older adults (Latkin &
Knowlton, 2015; Shaya et al., 2014).
6.4.2 Policy and practice
The provision of informational (the dietary advice), emotional (providing a sense of empathy),
or instrumental support (exercise classes or free medical assessment) at a few existing ethnic
and religious centres were found to be important and promoted the maintenance of integrated
social networks (Chapter 5). Given these benefits, advertising the services offered at some of
these centres more widely to community-dwelling, ethnically diverse older adults could
improve access to these centres, which would subsequently provide them with the opportunity
to transition to more integrated social networks and thereby reduce their risk for social isolation.
As strategies, it is recommended that health and social care professionals could collaborate with
these centres to explore the services they render and signpost their clients to these centres.
Despite the benefits of social support from these centres, their sustainability was threatened due
to budget cuts, forcing some to shut down or reduce their opening days. Long-term financial
support provided by interested organisations and public funding sources could improve the
sustainability of these ethnicity-specific age-well societies and faith centres.
To improve the services offered at these centres, which could also support their sustainability,
health professionals could provide free nutritional and physical function assessments at these
centres. Given the observed significant declines in nutritional status and physical function, these
assessments would allow for the identification and subsequent treatment of malnutrition and
physical function limitations to help prevent further deterioration. In addition, conducting
regular assessments at these centres may serve as an incentive for community-dwelling older

225
adults to visit these meeting places, which could enhance their social networks. Also, as these
PhD findings suggest that these meeting places are willing to support these activities, the co-
creation of such programmes with health care professionals and community/faith leaders would
be effective in increasing accessibility and acceptability of these assessments, and further
enhance the health and wellbeing of older adults. Interventions that are co-created and run at
these faith centres have been shown to increase access and improve health outcomes (Dehaven
et al., 2004; Sattin et al., 2016).
Participants in this PhD research reported low nutrient intakes as compared to the RNI and in
comparison, to studies conducted with predominately white participants. Given the
heterogeneity in what is perceived as healthy and the cultural significance of dietary patterns
observed, it is evident that the traditional ‘one size fits all’ dietary education is not effective in
supporting this population to eat adequately to support healthy ageing. Personalised dietary
education and culturally tailored health education using traditional foods as practical examples
should be co-created between academic researchers, community leaders and health care
professionals. This could ensure better adherence to dietary advice, and that delivery of the
same messages are given at health care, and community, and faith centres. Also, to respect and
honour diversity, and achieve the desired impact of health interventions when delivering
community health interventions and health messages, the heterogeneities between and within
ethnicities should be considered to avoid broad generalisations and stereotyping.
A fear of gaining weight, and engagement in unhealthy practices to lose weight was observed
in some participants in this PhD research. The practice of fasting, skipping meals, or drastically
cutting down portion sizes without proper adherence to diet quality were common practices,
which contributed to the observed low nutrient intakes. While future studies are recommended

226
to explore this in detail, health professionals could change their advice and avoid generic
messages such as “you are overweight/obese, so you need to lose weight” and instead deliver
more specific messages to achieve weight loss using healthier practices, without it negatively
affecting the nutritional quality of their diets.
Additionally, given the importance of supplementation and the low supplement intakes
observed in this PhD research, this population could benefit considerably from a free
supplementation programme (Barnes et al., 2006; Blumberg et al., 2017; Talwar et al., 2007).
To increase compliance, such a programme could be integrated into existing community or faith
group activities. Additionally, health professionals, specifically nutritionists and dieticians
attending to older ethnic minorities, could include a mandatory dietary assessment and based
on the results, prescribe free supplements if needed, in line with safer intake thresholds, to
enhance acceptability and intake to improve nutrient status among this population (Food
Standards Agency, 2003). This practice could be complemented with appropriately tailored
dietary education to ensure that these supplements do not replace a well-balanced diet.
6.5 Conclusion
This PhD thesis has contributed significantly to the literature with regards to SN, nutrition and
physical function of community-dwelling, ethnically diverse older adults living in super-diverse
communities in Birmingham, UK. It has demonstrated that many ethnic minority older adults
do not have integrated networks as often assumed and might be experiencing rapid declines in
SN, which could lead to poorer nutritional status and reduced physical function. It is
recommended that culturally tailored interventions are better designed to support the
maintenance of integrated social networks and address the increasing health inequalities in this
population. Furthermore, the low micronutrient intakes, and the declines in nutritional status
and physical function over a relatively short time reported in this thesis suggest an urgent need

227
to implement early community nutrition and physical function screening to identify and treat
malnutrition and physical function limitations. Finally, this PhD thesis demonstrates that it is
possible to conduct mixed methods longitudinal research in this population, hence, it is
anticipated that these findings will encourage more research into community-dwelling
ethnically diverse older adults, a relatively under-researched group.

228
6.6 References
Adams, Rebecca G. (1986). Secondary friendship networks and psychological well-being
among elderly women. Activities, Adaptation & Aging, 8(2), 59-72.
Adamson, AJ, Collerton, J, Davies, K, Foster, E, Jagger, C, Stamp, E, . . . Kirkwood, T.
(2009). Nutrition in advanced age: dietary assessment in the Newcastle 85+ study.
European Journal of Clinical Nutrition, 63(S1), S6.
Age UK. (2017). Briefing: Health and care of older people in England. Retrieved from
https://www.ageuk.org.uk/Documents/EN-GB/For-
professionals/Research/The_Health_and_Care_of_Older_People_in_England_2016.pd
f?dtrk=true
Agorsah, E Kofi. (1993). Archaeology and resistance history in the Caribbean. African
Archaeological Review, 11(1), 175-195.
Ajrouch, Kristine J, Antonucci, Toni C, & Janevic, Mary R. (2001). Social networks among
blacks and whites: The interaction between race and age. The Journals of Gerontology
Series B: Psychological Sciences and Social Sciences, 56(2), S112-S118.
Anderson, AS, Bush, H, Lean, M, Bradby, H, Williams, R, & Lea, E. (2005). Evolution of
atherogenic diets in South Asian and Italian women after migration to a higher risk
region. Journal of human nutrition and dietetics, 18(1), 33-43.
Antonucci, Toni C, Ajrouch, Kristine J, & Birditt, Kira S. (2013). The convoy model:
Explaining social relations from a multidisciplinary perspective. The Gerontologist,
54(1), 82-92.
Ashwell, Margaret, & Hsieh, Shiun Dong. (2005). Six reasons why the waist-to-height ratio is
a rapid and effective global indicator for health risks of obesity and how its use could
simplify the international public health message on obesity. International journal of
food sciences and nutrition, 56(5), 303-307.
Avlund, Kirsten, Lund, Rikke, Holstein, Bjørn E, Due, Pernille, Sakari-Rantala, Ritva, &
Heikkinen, Riitta-Liisa. (2004). The impact of structural and functional characteristics
of social relations as determinants of functional decline. The Journals of Gerontology
Series B: Psychological Sciences and Social Sciences, 59(1), S44-S51.
Babakus, Whitney S, & Thompson, Janice L. (2012). Physical activity among South Asian
women: a systematic, mixed-methods review. International Journal of Behavioral
Nutrition and Physical Activity, 9(1), 150.
Barnes, Lisa L, Mendes de Leon, Carlos F, Bienias, Julia L, & Evans, Denis A. (2004). A
longitudinal study of Black–White differences in social resources. The Journals of
Gerontology Series B: Psychological Sciences and Social Sciences, 59(3), S146-S153.
Barnes, MS, Robson, PJ, Bonham, MP, Strain, JJ, & Wallace, JMW. (2006). Effect of vitamin
D supplementation on vitamin D status and bone turnover markers in young adults.
European Journal of Clinical Nutrition, 60(6), 727.
Barnett, Tracey Marie, & Praetorius, Regina T. (2015). Knowledge is (not) power: Healthy
eating and physical activity for African-American women. Social work in health care,
54(4), 365-382.
Bassett, Christopher. (2006). Qualitative research in health care: John Wiley & Sons.
Bates, Beverley, Lennox, Alison, Prentice, Ann, Bates, Christopher J, Page, Polly, Nicholson,
Sonja, & Swan, Gillian. (2014). National Diet and Nutrition Survey: Results from
Years 1, 2, 3 and 4 (combined) of the Rolling Programme (2008/2009-2011/2012): A
survey carried out on behalf of Public Health England and the Food Standards
Agency: Public Health England.

229
Bautista, EN, Tanchoco, CC, Tajan, MG, & Magtibay, EVJ. (2013). Effect of flavor
enhancers on the nutritional status of older persons. The journal of nutrition, health &
aging, 17(4), 390-392.
Beckett, Laurel A, Brock, Dwight B, Lemke, Jon H, De Leon, Carlos F Mendes, Guralnik,
Jack M, Fillenbaum, Gerda G, . . . Evans, Denis A. (1996). Analysis of change in self-
reported physical function among older persons in four population studies. American
journal of epidemiology, 143(8), 766-778.
Bergstrom, Mark J, & Holmes, Michael E. (2000). Lay theories of successful aging after the
death of a spouse: A network text analysis of bereavement advice. Health
Communication, 12(4), 377-406.
Berkman, Lisa F, Glass, Thomas, Brissette, Ian, & Seeman, Teresa E. (2000). From social
integration to health: Durkheim in the new millennium. Social Science & Medicine,
51(6), 843-857.
Betancourt, Hector, & López, Steven R. (1993). The study of culture, ethnicity, and race in
American psychology. American psychologist, 48(6), 629.
Bingham, Sheila A. (1991). Limitations of the various methods for collecting dietary intake
data. Annals of Nutrition and Metabolism, 35(3), 117-127.
Birmingham City Council. (2011a). Birmingham – A super diverse city. Retrieved from
Birmingham:
https://www.birmingham.gov.uk/download/.../census_2011_corporate_briefing.pdf
Birmingham City Council. (2011b). Population and census. Retrieved from
https://www.birmingham.gov.uk/info/20057/about_birmingham/1294/population_and
_census/2
Birmingham City Council. (2018). 2016 Population Based Projections. Retrieved from
https://www.birmingham.gov.uk/downloads/file/4609/2016_population_basedprojecti
ons
Birmingham Policy Commission on Healthy Ageing. (2013). Healthy Ageing in The 21st
Century: The Best Is Yet To Come. Retrieved from
https://www.birmingham.ac.uk/Documents/research/policycommission/healthy-
ageing/Healthy-Ageing-Policy-Commission-Report.pdf
Biro, G, Hulshof, KFAM, Ovesen, L, & Cruz, JA Amorim. (2002). Selection of methodology
to assess food intake. European Journal of Clinical Nutrition, 56(S2), S25.
Bloom, Ilse, Lawrence, Wendy, Barker, Mary, Baird, Janis, Dennison, Elaine, Sayer, Avan
Aihie, . . . Robinson, Sian. (2017). What influences diet quality in older people? A
qualitative study among community-dwelling older adults from the Hertfordshire
Cohort Study, UK. Public health nutrition, 20(15), 2685-2693.
Blumberg, Jeffrey, Frei, Balz, Fulgoni III, Victor, Weaver, Connie, & Zeisel, Steven. (2017).
Contribution of dietary supplements to nutritional adequacy in race/ethnic population
subgroups in the United States. Nutrients, 9(12), 1295.
Boneham, Margaret A, Williams, KE, Copeland, JRM, McKibbin, P, Wilson, K, Scott, A, &
Saunders, PA. (1997). Elderly people from ethnic minorities in Liverpool: mental
illness, unmet need and barriers to service use. Health & Social Care in the
Community, 5(3), 173-180.
Bowling, Ann. (2006). Lay perceptions of successful ageing: Findings from a national survey
of middle aged and older adults in Britain. European journal of ageing, 3(3), 123-136.
Bowling, Ann, & Ebrahim, Shah. (2009). Handbook of health research methods:
investigation, measurement and analysis: McGraw-Hill Education (UK).

230
Boyce, Jamie M, & Shone, GR. (2006). Effects of ageing on smell and taste. Postgraduate
medical journal, 82(966), 239-241.
Bruins, Maaike, Van Dael, Peter, & Eggersdorfer, Manfred. (2019). The role of nutrients in
reducing the risk for noncommunicable diseases during aging. Nutrients, 11(1), 85.
Brunner, Eric, Juneja, Maneesh, & Marmot, Michael. (2001). Dietary assessment in Whitehall
II: comparison of 7 d diet diary and food-frequency questionnaire and validity against
biomarkers. British Journal of Nutrition, 86(3), 405-414.
Bryman, Alan. (2015). Social research methods: Oxford university press.
Burholt, Vanessa. (2004a). The settlement patterns and residential histories of older Gujaratis,
Punjabis and Sylhetis in Birmingham, England. Ageing & Society, 24(3), 383-409.
Burholt, Vanessa. (2004b). Transnationalism, economic transfers and families’ ties:
intercontinental contacts of older Gujaratis, Punjabis and Sylhetis in Birmingham with
families abroad. Ethnic and racial studies, 27(5), 800-829.
Burholt, Vanessa, & Dobbs, Christine. (2014). A support network typology for application in
older populations with a preponderance of multigenerational households. Ageing &
Society, 34(7), 1142-1169.
Burholt, Vanessa, Dobbs, Christine, & Victor, Christina. (2016). Transnational relationships
and cultural identity of older migrants. GeroPsych.
Burholt, Vanessa, Dobbs, Christine, & Victor, Christina. (2018). Social support networks of
older migrants in England and Wales: the role of collectivist culture. Ageing &
Society, 38(7), 1453-1477.
Burholt, Vanessa, Wenger, Clare, Scott, Anne, Yahya, Bashar, & Roy, Sibani. (2000).
Bangladeshi immigration to the United Kingdom: Older people's support networks in
the sending and receiving countries. Quality in Ageing and Older Adults, 1(2), 18-30.
Burholt, Vanessa, Wenger, G Clare, Biswas, Abdul Awwal, Dave, Parul, Mallya, Indira,
Sodhi, NS, . . . Bangor, UK. (2003). Families and Migration: Older People from S.
Asia Department for International Development (DFID) Project ESA315.
Buttery, Amanda K, Du, Yong, Busch, MA, Fuchs, Judith, Gaertner, Beate, Knopf, Hildtraud,
& Scheidt-Nave, Christa. (2016). Changes in physical functioning among men and
women aged 50–79 years in Germany: an analysis of National Health Interview and
Examination Surveys, 1997–1999 and 2008–2011. BMC geriatrics, 16(1), 205.
Cacioppo, John T, Fowler, James H, & Christakis, Nicholas A. (2009). Alone in the crowd:
the structure and spread of loneliness in a large social network. Journal of personality
and social psychology, 97(6), 977.
Carlson, E, Kipps, M, & Thomson, J. (1984). Influences on the food habits of some ethnic
minorities in the United Kingdom. Human nutrition. Applied nutrition, 38(2), 85-98.
Caspersen, Carl J, Pereira, Mark A, & Curran, Katy M. (2000). Changes in physical activity
patterns in the United States, by sex and cross-sectional age. Medicine & Science in
Sports & Exercise, 32(9), 1601-1609.
Castaneda-Gameros, Diana, Redwood, Sabi, & Thompson, Janice L. (2017). Low nutrient
intake and frailty among overweight and obese migrant women from ethnically
diverse backgrounds ages 60 years and older: A mixed-methods study. Journal of
nutrition education and behavior, 49(1), 3-10. e11.
Castaneda-Gameros, Diana, Redwood, Sabi, & Thompson, Janice L. (2018a). Nutrient Intake
and Factors Influencing Eating Behaviors in Older Migrant Women Living in the
United Kingdom. Ecology of food and nutrition, 57(1), 50-68. doi:doi:
10.1080/03670244.2017.1406855

231
Castaneda-Gameros, Diana, Redwood, Sabi, & Thompson, Janice L. (2018b). Physical
Activity, Sedentary Time, and Frailty in Older Migrant Women From Ethnically
Diverse Backgrounds: A Mixed-Methods Study. Journal of aging and physical
activity, 26(2), 194-203. doi:10.1123/japa.2016-0287
Castro, Felipe González, Kellison, Joshua G, Boyd, Stephen J, & Kopak, Albert. (2010). A
methodology for conducting integrative mixed methods research and data analyses.
Journal of mixed methods research, 4(4), 342-360.
Chapman, Ian McPhee. (2007). The anorexia of aging. Clinics in geriatric medicine, 23(4),
735-756. doi:10.1016/j.cger.2007.06.001
Cheyette, Chris, & Balolia, Yello. (2010). Carbs & Cals: A Visual Guide to Carbohydrate
Counting & Calorie Counting for People with Diabetes: Chello.
Chou, Chih-Hsuan, Hwang, Chueh-Lung, & Wu, Ying-Tai. (2012). Effect of exercise on
physical function, daily living activities, and quality of life in the frail older adults: a
meta-analysis. Archives of physical medicine and rehabilitation, 93(2), 237-244.
Cohen, Louis, Manion, Lawrence, & Morrison, Keith. (2013). Research methods in
education: Routledge.
Communities and Local Government. (2015). English indices of deprivation. Retrieved from
https://www.gov.uk/government/statistics/english-indices-of-deprivation-2015.
Community and Family Health Division. (2006). Creating healthy communities for an aging
population: A report of a joint rural health advisory committee and state community
health services advisory committee work group. Retrieved from
https://www.leg.state.mn.us/docs/2009/other/090855.pdf
Conklin, Annalijn I, Forouhi, Nita G, Surtees, Paul, Khaw, Kay-Tee, Wareham, Nicholas J, &
Monsivais, Pablo. (2014). Social relationships and healthful dietary behaviour:
evidence from over-50s in the EPIC cohort, UK. Social Science & Medicine, 100, 167-
175.
Cook, Alicia S, & Weigel, Daniel J. (1983). Relocation and crisis: Perceived sources of
support. Family relations, 267-273.
Cooper, Rachel, Kuh, Diana, & Hardy, Rebecca. (2010). Objectively measured physical
capability levels and mortality: systematic review and meta-analysis. Bmj, 341, c4467.
Cornwell, Benjamin, Laumann, Edward O, & Schumm, L Philip. (2008). The social
connectedness of older adults: A national profile. American sociological review,
73(2), 185-203.
Cosco, Theodore D, Prina, A Matthew, Perales, Jaime, Stephan, Blossom CM, & Brayne,
Carol. (2014). Operational definitions of successful aging: a systematic review.
International psychogeriatrics, 26(3), 373-381.
Cresswell, John W. (2003). Qualitative inquiry and research design: Choosing among five
approaches. In: Sage Publications.
Creswell, John W. (2009). Research design: Qualitative, quantitative, and mixed methods
approaches: Sage publications.
Creswell, John W, & Clark, Vicki L Plano. (2007). Designing and conducting mixed methods
research.
Creswell, John W, & Miller, Dana L. (2000). Determining validity in qualitative inquiry.
Theory into practice, 39(3), 124-130.
Crombie, Iain K, Irvine, Linda, Williams, Brian, McGinnis, Alison R, Slane, Peter W, Alder,
Elizabeth M, & McMurdo, Marion ET. (2004). Why older people do not participate in
leisure time physical activity: a survey of activity levels, beliefs and deterrents. Age
and ageing, 33(3), 287-292.

232
Cuervo, Marta, García, A, Ansorena, Diana, Sanchez-Villegas, Almudena, Martínez-
González, MA, Astiasarán, Iciar, & Martínez, Jose Alfredo. (2009). Nutritional
assessment interpretation on 22 007 Spanish community-dwelling elders through the
Mini Nutritional Assessment test. Public health nutrition, 12(1), 82-90.
Danielewicz, Ana Lúcia, Barbosa, Aline Rodrigues, & Del Duca, Giovâni Firpo. (2014).
Nutritional status, physical performance and functional capacity in an elderly
population in southern Brazil. Revista da Associação Médica Brasileira, 60(3), 242-
248.
De Marchi, Renato José, Hugo, Fernando Neves, Hilgert, Juliana Balbinot, & Padilha, Dalva
Maria Pereira. (2008). Association between oral health status and nutritional status in
south Brazilian independent-living older people. Nutrition, 24(6), 546-553.
De Marchi, Renato José, Hugo, Fernando Neves, Hilgert, Juliana Balbinot, & Padilha, Dalva
Maria Pereira. (2012). Association between number of teeth, edentulism and use of
dentures with percentage body fat in south Brazilian community‐dwelling older
people. Gerodontology, 29(2), e69-e76.
DeHaven, Mark J, Hunter, Irby B, Wilder, Laura, Walton, James W, & Berry, Jarett. (2004).
Health programs in faith-based organizations: are they effective? American journal of
public health, 94(6), 1030-1036.
Department for Work and Pensions. (2015). Households below average income: An analysis
of the income distribution 1994/95 to 2013/14. Retrieved from
https://assets.publishing.service.gov.uk/government/uploads/system/uploads/attachme
nt_data/file/437246/households-below-average-income-1994-95-to-2013-14.pdf
Depp, Colin A, & Jeste, Dilip V. (2006). Definitions and predictors of successful aging: a
comprehensive review of larger quantitative studies. The American Journal of
Geriatric Psychiatry, 14(1), 6-20.
Dodd, Kevin W, Guenther, Patricia M, Freedman, Laurence S, Subar, Amy F, Kipnis, Victor,
Midthune, Douglas, . . . Krebs-Smith, Susan M. (2006). Statistical methods for
estimating usual intake of nutrients and foods: a review of the theory. Journal of the
American Dietetic Association, 106(10), 1640-1650.
Donini, Lorenzo M, Savina, Claudia, & Cannella, Carlo. (2003). Eating habits and appetite
control in the elderly: the anorexia of aging. International psychogeriatrics, 15(1), 73-
87.
Doyle, Louise, Brady, Anne-Marie, & Byrne, Gobnait. (2009). An overview of mixed
methods research. Journal of Research in Nursing, 14(2), 175-185.
Earland, J, Campbell, J, & Srivastava, A. (2010). Dietary habits and health status of African‐
Caribbean adults. Journal of human nutrition and dietetics, 23(3), 264-271.
Eastwood, Sophie V, Tillin, Therese, Chaturvedi, Nish, & Hughes, Alun D. (2015). Ethnic
differences in associations between blood pressure and stroke in South Asian and
European men. Hypertension, 66(3), 481-488.
EFSA, GUIDANCE OF. (2009). General principles for the collection of national food
consumption data in the view of a pan-European dietary survey.
El-Sais, Walaa M, & Mohammad, Walaa S. (2014). Influence of different testing postures on
hand grip strength. European Scientific Journal, 10(36).
Elia, M, Ritz, P, & Stubbs, RJ. (2000). Total energy expenditure in the elderly. European
Journal of Clinical Nutrition, 54(S3), S92.
Elia, M, & Russell, CA. (2009). Combating malnutrition: recommendations for action.
Nutrition Advisory Group on malnutrition led by BAPEN 2009.

233
Ellwardt, Lea, Wittek, Rafael PM, Hawkley, Louise C, & Cacioppo, John T. (2019). Social
network characteristics and their associations with stress in older adults: Closure and
balance in a population-based sample. The Journals of Gerontology: Series B.
Elo, Satu, & Kyngäs, Helvi. (2008). The qualitative content analysis process. Journal of
advanced nursing, 62(1), 107-115.
Emadian, Amir, England, Clare Y, & Thompson, Janice L. (2017). Dietary intake and factors
influencing eating behaviours in overweight and obese South Asian men living in the
UK: mixed method study. BMJ open, 7(7), e016919.
Emadian, Amir, & Thompson, Janice. (2017). A mixed-methods examination of physical
activity and sedentary time in overweight and obese South Asian men living in the
United Kingdom. International journal of environmental research and public health,
14(4), 348.
Eriksen, Anne, Tillin, Therese, O’Connor, Laura, Brage, Soren, Hughes, Alun, Mayet, Jamil, .
. . Forouhi, Nita G. (2015). The impact of health behaviours on incident cardiovascular
disease in Europeans and South Asians–a prospective analysis in the UK SABRE
study. PloS one, 10(3), e0117364.
Escobar-Bravo, Miguel-Ángel, Puga-González, Dolores, & Martín-Baranera, Monserrat.
(2012). Protective effects of social networks on disability among older adults in Spain.
Archives of gerontology and geriatrics, 54(1), 109-116.
Evandrou, Maria. (2000). Social inequalities in later life: the socio-economic position of older
people from ethnic minority groups in Britain. Population trends(101), 11-18.
Fenton, Sarah-Jane, & Draper, Heather (2014). ‘Cultural differences in ageing in the UK - A
significant knowledge gap.’. Retrieved from
https://www.birmingham.ac.uk/Documents/research/policycommission/healthy-
ageing/2-Cultural-differences-in-ageing-in-the-UK-a-significant-knowledge-gap.pdf
Finch, Janet. (1993). Ethics and politics of interviewing women. Social Research, Philosophy,
Politics and Practice, London: Open University/SAGE, 166-180.
Fiori, Katherine L, & Jager, Justin. (2012). The impact of social support networks on mental
and physical health in the transition to older adulthood: A longitudinal, pattern-
centered approach. International Journal of Behavioral Development, 36(2), 117-129.
doi:org/10.1177/0165025411424089
Fischer, Claude S. (1982). To dwell among friends: Personal networks in town and city:
University of chicago Press.
Flick, Uwe. (2014). An introduction to qualitative research: Sage.
Food Standards Agency. (2003). Safe Upper Levels for Vitamins and Minerals. Report of the
Expert Group on Vitamins and Minerals. In: Food Standards Agency.
Franceschi, Claudio, Capri, Miriam, Monti, Daniela, Giunta, Sergio, Olivieri, Fabiola, Sevini,
Federica, . . . Scurti, Maria. (2007). Inflammaging and anti-inflammaging: a systemic
perspective on aging and longevity emerged from studies in humans. Mechanisms of
ageing and development, 128(1), 92-105.
Fratiglioni, Laura, Paillard-Borg, Stephanie, & Winblad, Bengt. (2004). An active and
socially integrated lifestyle in late life might protect against dementia. The Lancet
Neurology, 3(6), 343-353.
French, Simone A, and, Mary Story, & Jeffery, Robert W. (2001). Environmental Influences
on Eating and Physical Activity. Annual Review of Public Health, 22(1), 309-335.
doi:10.1146/annurev.publhealth.22.1.309
Garcia, AC, & Da, WW. (2011). Nutrition and physical activity of older Chinese immigrants.
Asian Journal of Gerontology & Geriatrics, 6(2), 72-81.

234
Garcia, Marc A, & Reyes, Adriana M. (2017). Physical functioning and disability trajectories
by age of migration among Mexican elders in the United States. The Journals of
Gerontology: Series B, 73(7), 1292-1302.
Garduno-Diaz, SD, & Khokhar, S. (2014). Eating habits and nutrient intake of migrant South
Asians in the UK. Public Health, 128(11), 1043-1046.
Garduño‐Diaz, SD, Husain, W, Ashkanani, F, & Khokhar, S. (2014). Meeting challenges
related to the dietary assessment of ethnic minority populations. Journal of human
nutrition and dietetics, 27(4), 358-366.
Gelo, Omar, Braakmann, Diana, & Benetka, Gerhard. (2008). Quantitative and qualitative
research: Beyond the debate. Integrative psychological and behavioral science, 42(3),
266-290.
Gibson, Rosalind S. (2005). Principles of nutritional assessment: Oxford university press,
USA.
Gilbert, Penelope A, & Khokhar, Santosh. (2008). Changing dietary habits of ethnic groups in
Europe and implications for health. Nutrition reviews, 66(4), 203-215.
Gill, Paramjit S, Plumridge, Gill, Khunti, Kamlesh, & Greenfield, Sheila. (2012). Under-
representation of minority ethnic groups in cardiovascular research: a semi-structured
interview study. Family practice, 30(2), 233-241.
Golden, Jeannette, Conroy, Ronán M, Bruce, Irene, Denihan, Aisling, Greene, Elaine, Kirby,
Michael, & Lawlor, Brian A. (2009a). Loneliness, social support networks, mood and
wellbeing in community‐dwelling elderly. International journal of geriatric
psychiatry, 24(7), 694-700.
Golden, Jeannette, Conroy, Ronán M, & Lawlor, Brian A. (2009). Social support network
structure in older people: underlying dimensions and association with psychological
and physical health. Psychology, Health & Medicine, 14(3), 280-290.
Gómez, José Fernando, Curcio, Carmen-Lucía, Alvarado, Beatriz, Zunzunegui, María
Victoria, & Guralnik, Jack. (2013). Validity and reliability of the Short Physical
Performance Battery (SPPB): a pilot study on mobility in the Colombian Andes.
Colombia Medica, 44(3), 165-171.
Gopinath, Bamini, Russell, Joanna, Flood, Victoria M, Burlutsky, George, & Mitchell, Paul.
(2014). Adherence to dietary guidelines positively affects quality of life and functional
status of older adults. Journal of the Academy of Nutrition and Dietetics, 114(2), 220-
229.
Gray, David E. (2013). Doing research in the real world: Sage.
Guralnik, Jack M, Branch, Laurence G, Cummings, Steven R, & Curb, J David. (1989).
Physical performance measures in aging research. Journal of gerontology, 44(5),
M141-M146.
Guralnik, Jack M, Ferrucci, Luigi, Pieper, Carl F, Leveille, Suzanne G, Markides, Kyriakos S,
Ostir, Glenn V, . . . Wallace, Robert B. (2000). Lower extremity function and
subsequent disability: consistency across studies, predictive models, and value of gait
speed alone compared with the short physical performance battery. The Journals of
Gerontology Series A: Biological Sciences and Medical Sciences, 55(4), M221-M231.
Guralnik, Jack M, Simonsick, Eleanor M, Ferrucci, Luigi, Glynn, Robert J, Berkman, Lisa F,
Blazer, Dan G, . . . Wallace, Robert B. (1994). A short physical performance battery
assessing lower extremity function: association with self-reported disability and
prediction of mortality and nursing home admission. Journal of gerontology, 49(2),
M85-M94.

235
Guse, Lorna W, & Masesar, Mary Ann. (1999). Quality of life and successful aging in long-
term care: perceptions of residents. Issues in mental health nursing, 20(6), 527-539.
Hammond, Ross A. (2010). Social influence and obesity. Current Opinion in Endocrinology,
Diabetes and Obesity, 17(5), 467-471.
Harwood, Tracy G, & Garry, Tony. (2003). An overview of content analysis. The Marketing
Review, 3(4), 479-498.
Haveman-Nies, Annemien, De Groot, Lisette CPGM, & Van Staveren, Wija A. (2003).
Relation of dietary quality, physical activity, and smoking habits to 10-year changes in
health status in older Europeans in the SENECA study. American journal of public
health, 93(2), 318-323.
He, Wan, Goodkind, Daniel, & Kowal, Paul R. (2016). An aging world: 2015. Retrieved from
https://www.researchgate.net/profile/Paul_Kowal2/publication/317400495_An_Aging
_World/links/5c7fefca458515831f8b0033/An-Aging-World.pdf
Health and Social Care Information Centre. (2013). Personal social services: Expenditure and
unit costs, England 2012-13, provisional release. Retrieved from
https://files.digital.nhs.uk/publicationimport/pub11xxx/pub11644/pss-exp-eng-12-13-
prov-rpt.pdf
Health Survey England. (2005). Retrieved from
https://files.digital.nhs.uk/publicationimport/pub01xxx/pub01184/heal-surv-heal-old-
peo-eng-2005-rep-v5.pdf
Hilton, Jeanne M, Gonzalez, Carlene A, Saleh, Mahasin, Maitoza, Robyn, & Anngela-Cole,
Linda. (2012). Perceptions of successful aging among older Latinos, in cross-cultural
context. Journal of cross-cultural gerontology, 27(3), 183-199.
Hoffmann, K, Boeing, H, Dufour, A, & Volatier, JL. (2002). Estimating the distribution of
usual dietary intake by short-term measurements. European Journal of Clinical
Nutrition, 56(S2), S53.
Holmes, Bridget, Dick, Katie, & Nelson, Michael. (2008). A comparison of four dietary
assessment methods in materially deprived households in England. Public health
nutrition, 11(5), 444-456.
House, J; , & Kahn, R. ( 1985). Measures and Concepts of Social Support. In S. Cohen and S.
L Syme (Ed.), In Social Support and Health. . New York: Academic Press.
Houwing, RH, Rozendaal, M, Wouters-Wesseling, W, Beulens, JWJ, Buskens, E, &
Haalboom, JR. (2003). A randomised, double-blind assessment of the effect of
nutritional supplementation on the prevention of pressure ulcers in hip-fracture
patients. Clinical Nutrition, 22(4), 401-405.
Hsieh, Hsiu-Fang, & Shannon, Sarah E. (2005). Three approaches to qualitative content
analysis. Qualitative health research, 15(9), 1277-1288.
Hung, Li-Wen, Kempen, GIJM, & De Vries, NK. (2010). Cross-cultural comparison between
academic and lay views of healthy ageing: a literature review. Ageing & Society,
30(8), 1373-1391.
Hutton, Brian, Feine, Jocelyne, & Morais, José. (2002). Is there an association between
edentulism and nutritional state? Journal-Canadian Dental Association, 68(3), 182-
187.
Jivraj, Stephen. (2012). How has ethnic diversity grown 1991 2001 2011. Retrieved from
http://hummedia.manchester.ac.uk/institutes/code/briefings/dynamicsofdiversity/how-
has-ethnic-diversity-grown-1991-2001-2011.pdf
Johnson, C Shanthi, & Garcia, Alicia C. (2003). Dietary and activity profiles of selected
immigrant older adults in Canada. Journal of Nutrition for the Elderly, 23(1), 23-39.

236
Kahn, R. L., & Antonucci, T. C. . (1980). Convoys over the life course: Attachments, roles
and social support. In P. B. & Brim Baltes, 0 (Ed.), Life span development and
behavior (Vol. 3). New York: Academic Press.
Kamphuis, Carlijn BM, de Bekker-Grob, Esther W, & van Lenthe, Frank J. (2015). Factors
affecting food choices of older adults from high and low socioeconomic groups: a
discrete choice experiment. The American journal of clinical nutrition, 101(4), 768-
774.
Kanuha, Valli Kalei. (2000). “Being” native versus “going native”: Conducting social work
research as an insider. Social work, 45(5), 439-447.
Kassam‐Khamis, T, Nanchahal, K, Mangtani, P, dos Santos Silva, I, McMichael, A, &
Anderson, A. (1999). Development of an interview‐administered food‐frequency
questionnaire for use amongst women of South Asian ethnic origin in Britain. Journal
of human nutrition and dietetics, 12(1), 7-19.
Khokhar, Santosh, Ashkanani, Fatemah, Garduño-Diaz, Sara D, & Husain, Wafaa. (2013).
Application of ethnic food composition data for understanding the diet and nutrition of
South Asians in the UK. Food chemistry, 140(3), 436-442.
Kim, BoRin, Park, Sojung, & Antonucci, Toni C. (2016). Longitudinal changes in social
networks, health and wellbeing among older Koreans. Ageing & Society, 36(9), 1915-
1936.
Kimura, Yumi, Wada, Taizo, Ishine, Masayuki, Ishimoto, Yasuko, Kasahara, Yoriko, Konno,
Akiko, . . . Fujisawa, Michiko. (2009). Food diversity is closely associated with
activities of daily living, depression, and quality of life in community‐dwelling elderly
people. Journal of the American Geriatrics Society, 57(5), 922-924.
Kirkwood, TBL. (2006). Nutrition for a longer life. Nutrition Bulletin, 31(2), 88-92.
Knipscheer, Cornelis PM, Jong-Gierveld, J de, van Tilburg, Theo G, & Dykstra, Pearl A.
(1995). Living arrangements and social networks of older adults.
Kumagai, S, Watanabe, S, Shibata, H, Amano, H, Fujiwara, Y, Shinkai, S, . . . Yasumura, S.
(2003). Effects of dietary variety on declines in high-level functional capacity in
elderly people living in a community. [Nihon koshu eisei zasshi] Japanese journal of
public health, 50(12), 1117-1124.
Kuo, Wen H, & Tsai, Yung-Mei. (1986). Social networking, hardiness and immigrant's
mental health. Journal of health and social behavior, 133-149.
Kyle, UG, Genton, L, Hans, D, Karsegard, L, Slosman, DO, & Pichard, C. (2001). Age-
related differences in fat-free mass, skeletal muscle, body cell mass and fat mass
between 18 and 94 years. European Journal of Clinical Nutrition, 55(8), 663.
Landi, Francesco, Calvani, Riccardo, Tosato, Matteo, Martone, Anna, Ortolani, Elena, Savera,
Giulia, . . . Marzetti, Emanuele. (2016). Anorexia of aging: risk factors, consequences,
and potential treatments. Nutrients, 8(2), 69. doi:doi: 10.3390/nu8020069.
Latkin, Carl A, & Knowlton, Amy R. (2015). Social network assessments and interventions
for health behavior change: a critical review. Behavioral Medicine, 41(3), 90-97.
Lee, RD, & Nieman, DC. (1993). Nutritional Assessment. Brown & Benchmark. In: Oxford,
UK.
Leung, Georgine, & Stanner, Sara. (2011). Diets of minority ethnic groups in the UK:
influence on chronic disease risk and implications for prevention. Nutrition Bulletin,
36(2), 161-198.
Lievesley, N. (2013). The ageing of the ethnic minority populations of England and Wales:
findings from the 2011 census. CPA, UK.

237
Lievesley, N. . (2013). The ageing of the ethnic minority populations of England and wales:
Findings from the 2011 census A briefing paper from the centre for policy on Ageing.
. Retrieved from
https://www.runnymedetrust.org/uploads/publications/pdfs/TheFutureAgeingOfTheEt
hnicMinorityPopulation-ForWebJuly2010.pdf
Litwin, Howard. (1995). The social networks of elderly immigrants: An analytic typology.
Journal of Aging Studies, 9(2), 155-174.
Litwin, Howard. (1998). Social network type and health status in a national sample of elderly
Israelis. Social Science & Medicine, 46(4-5), 599-609.
Litwin, Howard. (2001). Social network type and morale in old age. The Gerontologist, 41(4),
516-524.
Litwin, Howard, & Shiovitz-Ezra, Sharon. (2006). Network type and mortality risk in later
life. The Gerontologist, 46(6), 735-743.
Liu, Jing Jing, Davidson, Emma, Bhopal, Raj, White, Martin, Johnson, Mark, Netto, Gina, &
Sheikh, Aziz. (2015). Adapting health promotion interventions for ethnic minority
groups: a qualitative study. Health promotion international, 31(2), 325-334.
Locher, Julie L, Robinson, Caroline O, Roth, David L, Ritchie, Christine S, & Burgio,
Kathryn L. (2005). The effect of the presence of others on caloric intake in
homebound older adults. The Journals of Gerontology Series A: Biological Sciences
and Medical Sciences, 60(11), 1475-1478.
Lopez, Alan D, Mathers, Colin D, Ezzati, Majid, Jamison, Dean T, & Murray, Christopher JL.
(2006). Global and regional burden of disease and risk factors, 2001: systematic
analysis of population health data. The Lancet, 367(9524), 1747-1757.
Louie, Grant H, & Ward, Michael M. (2011). Socioeconomic and ethnic differences in
disease burden and disparities in physical function in older adults. American journal of
public health, 101(7), 1322-1329.
Lubben, James, Blozik, Eva, Gillmann, Gerhard, Iliffe, Steve, von Renteln Kruse, Wolfgang,
Beck, John C, & Stuck, Andreas E. (2006). Performance of an abbreviated version of
the Lubben Social Network Scale among three European community-dwelling older
adult populations. The Gerontologist, 46(4), 503-513.
Lubben, James, & Gironda, Melanie. (2004). Measuring social networks and assessing their
benefits. Social networks and social exclusion: Sociological and policy perspectives,
20-34.
Marmot, Michael, & Bell, Ruth. (2012). Fair society, healthy lives. Public Health, 126, S4-
S10.
Mays, Nicholas, & Pope, Catherine. (1995). Rigour and qualitative research. BMJ: British
Medical Journal, 311(6997), 109.
McIntosh, W Alex, Shifflett, Peggy A, & Picou, J Steven. (1989). Social support, stressful
events, strain, dietary intake, and the elderly. Medical care, 140-153.
Mendes de Leon, Carlos F, Glass, Thomas A, & Berkman, Lisa F. (2003). Social engagement
and disability in a community population of older adults: the New Haven EPESE.
American journal of epidemiology, 157(7), 633-642.
Millen, Barbara E, Quatromoni, Paula A, Pencina, Michael, Kimokoti, Ruth, Nam, Byung-
HO, Cobain, Sonia, . . . D’Agostino, Ralph B. (2005). Unique dietary patterns and
chronic disease risk profiles of adult men: the Framingham nutrition studies. Journal
of the American Dietetic Association, 105(11), 1723-1734.
Milte, Catherine M, & McNaughton, Sarah A. (2016). Dietary patterns and successful ageing:
a systematic review. European journal of nutrition, 55(2), 423-450.

238
Misra, Anoop, & Ganda, Om P. (2007). Migration and its impact on adiposity and type 2
diabetes. Nutrition, 23(9), 696-708.
Mitchell, James Clyde. (1969). Social networks in urban situations: analyses of personal
relationships in Central African towns: Manchester University Press.
Morgan, David L. (2007). Paradigms lost and pragmatism regained: Methodological
implications of combining qualitative and quantitative methods. Journal of mixed
methods research, 1(1), 48-76.
Morley, John E. (1997). Anorexia of aging: physiologic and pathologic. The American
journal of clinical nutrition, 66(4), 760-773.
Morley, John E, & Silver, Andrew J. (1988). Anorexia in the elderly. Neurobiology of aging,
9, 9-16.
Morse, Janice M, Barrett, Michael, Mayan, Maria, Olson, Karin, & Spiers, Jude. (2002).
Verification strategies for establishing reliability and validity in qualitative research.
International journal of qualitative methods, 1(2), 13-22.
Mugford, Stephen, Kendig, H, & Kendig, HL. (1986). Ageing and families: A social networks
perspective.
Mullings, Beverley. (1999). Insider or outsider, both or neither: some dilemmas of
interviewing in a cross-cultural setting. Geoforum, 30(4), 337-350.
Munoz, Miguel-Angel, Fito, Montserrat, Marrugat, Jaume, Covas, Maria-Isabel, & Schröder,
Helmut. (2008). Adherence to the Mediterranean diet is associated with better mental
and physical health. British Journal of Nutrition, 101(12), 1821-1827.
Murray, C, & Wynne, J. (2001). Using an interpreter to research community, work and
family. Community, Work and Family, 4(2), 157-170.
N'Gom, Papa Ibrahima, & Woda, Alain. (2002). Influence of impaired mastication on
nutrition. The Journal of prosthetic dentistry, 87(6), 667-673.
Nazroo, James Y. (1997). The health of Britain's ethnic minorities: findings from a national
survey. London: PSI.
Neuman, William Lawrence, & Kreuger, Larry. (2003). Social work research methods:
Qualitative and quantitative approaches: Allyn and Bacon.
Newsom, Jason T, Nishishiba, Masami, Morgan, David L, & Rook, Karen S. (2003). The
relative importance of three domains of positive and negative social exchanges: a
longitudinal model with comparable measures. Psychology and aging, 18(4), 746.
Newsom, Jason T, & Schulz, Richard. (1996). Social support as a mediator in the relation
between functional status and quality of life in older adults. Psychology and aging,
11(1), 34.
Ngo, Joy, Gurinovic, Mirjana, Frost-Andersen, Lene, & Serra-Majem, Lluís. (2009). How
dietary intake methodology is adapted for use in European immigrant population
groups–a review. British Journal of Nutrition, 101(S2), S86-S94.
Nicolaou, Mary, Doak, Colleen M, van Dam, Rob M, Brug, Johannes, Stronks, Karien, &
Seidell, Jaap C. (2009). Cultural and social influences on food consumption in Dutch
residents of Turkish and Moroccan origin: a qualitative study. Journal of nutrition
education and behavior, 41(4), 232-241.
Oakley, Ann. (1981). Interviewing women: A contradiction in terms. Doing feminist research,
30(6), 1.
Office for National Statistics. (2012). Ethnicity and National Identity in England and Wales
2011. Retrieved from
http://webarchive.nationalarchives.gov.uk/20160105160709/http://www.ons.gov.uk/o
ns/dcp171776_290558.pdf

239
Office for National Statistics. (2015). National Population Projections: 2014-based Statistical
Bulletin. Retrieved from
https://www.ons.gov.uk/peoplepopulationandcommunity/populationandmigration/pop
ulationprojections/bulletins/nationalpopulationprojections/2015-10-29
Office For National Statistics. (2017). National population projections: 2016-based-
Office for National Statistics. Retrieved from
https://www.ons.gov.uk/peoplepopulationandcommunity/populationandmigration/pop
ulationprojections/bulletins/nationalpopulationprojections/2016basedstatisticalbulletin
Office for National Statistics. (2018). Living longer: how our population is changing and why
it matters. Retrieved from
https://www.ons.gov.uk/peoplepopulationandcommunity/birthsdeathsandmarriages/ag
eing/articles/livinglongerhowourpopulationischangingandwhyitmatters/2018-08-13
ONS. (2011). 2010-based Period and Cohort Life Expectancy tables. Retrieved from
http://webarchive.nationalarchives.gov.uk/20160105160709/http://www.ons.gov.uk/o
ns/dcp171780_238828.pdf.
Organization, World Health. (2018). World report on Ageing and Health. Retrieved from
https://apps.who.int/iris/bitstream/handle/10665/186463/9789240694811_eng.pdf;jses
sionid=40BCAF0B1D6C07C3D957EA2A6CDE8F2F?sequence=1
Osei-Kwasi, Hibbah Araba, Powell, Katie, Nicolaou, Mary, & Holdsworth, Michelle. (2017).
The influence of migration on dietary practices of Ghanaians living in the United
Kingdom: a qualitative study. Annals of human biology, 44(5), 454-463.
Park, Sojung, Smith, Jacqui, & Dunkle, Ruth E. (2014). Social network types and well-being
among South Korean older adults. Aging and Mental Health, 18(1), 72-80.
doi:org/10.1080/13607863.2013.801064
Patton, MQ. Qualitative research and evaluation methods 2002 Thousand Oaks. CA
SagePUBLICations.
Patton, MQ. (2002). Qualitative research and evaluation methods 2002 Thousand Oaks. CA
SagePUBLICations.
Penrod, Janice, Preston, Deborah Bray, Cain, Richard E, & Starks, Michael T. (2003). A
discussion of chain referral as a method of sampling hard-to-reach populations.
Journal of Transcultural nursing, 14(2), 100-107.
Petersen, Poul Erik, & Yamamoto, Tatsuo. (2005). Improving the oral health of older people:
the approach of the WHO Global Oral Health Programme. Community dentistry and
oral epidemiology, 33(2), 81-92.
Phelan, Elizabeth A, Anderson, Lynda A, Lacroix, Andrea Z, & Larson, Eric B. (2004). Older
adults' views of “successful aging”—how do they compare with researchers'
definitions? Journal of the American Geriatrics Society, 52(2), 211-216.
Phelan, Elizabeth A, & Larson, Eric B. (2002). “Successful aging”—where next? Journal of
the American Geriatrics Society, 50(7), 1306-1308.
Phillimore, Jenny. (2013). Housing, home and neighbourhood renewal in the era of
superdiversity: Some lessons from the West Midlands. Housing Studies, 28(5), 682-
700.
Phillips, Regina M. (2006). Social network and dietary intake in community dwelling elderly
women: A secondary analysis of the Third National Health and Nutrition Examination
Survey (Doctoral dissertation).
Poole, M Scott, & Folger, Joseph P. (1981). Modes of observation and the validation of
interaction analysis schemes. Small Group Behavior, 12(4), 477-493.

240
Pope, Catherine, & Mays, Nicholas. (2009). Qualitative research in health care: Wiley
Online Library.
Pope, Catherine, Ziebland, Sue, & Mays, Nicholas. (2000). Qualitative research in health
care: analysing qualitative data. BMJ: British Medical Journal, 320(7227), 114.
Prager, E. (1985). Older English-speaking immigrants in Israel: observations on their
perceived adjustment. Journal of Jewish Communal Service, 61, 209-218.
QSR International. (2012). NVivo qualitative data analysis software (Version 12). In: QSR
International Pty Ltd Victoria, Australia.
Ran, Lingyun, Jiang, Xiaodong, Li, Baogang, Kong, Hongqian, Du, Mengqi, Wang, Xiaolan,
. . . Liu, Qin. (2017). Association among activities of daily living, instrumental
activities of daily living and health-related quality of life in elderly Yi ethnic minority.
BMC geriatrics, 17(1), 74.
Redwood, Sabi, & Gill, Paramjit S. (2013). Under-representation of minority ethnic groups in
research—call for action. In: British Journal of General Practice.
Rees, Philip, Wohland, Pia, Norman, Paul, & Boden, Peter. (2012). Ethnic population
projections for the UK, 2001–2051. Journal of Population Research, 29(1), 45-89.
Rennie, Kirsten L, Coward, Andy, & Jebb, Susan A. (2007). Estimating under-reporting of
energy intake in dietary surveys using an individualised method. British Journal of
Nutrition, 97(6), 1169-1176.
Roberts, Helen C, Denison, Hayley J, Martin, Helen J, Patel, Harnish P, Syddall, Holly,
Cooper, Cyrus, & Sayer, Avan Aihie. (2011). A review of the measurement of grip
strength in clinical and epidemiological studies: towards a standardised approach. Age
and ageing, 40(4), 423-429.
Robinson, Siân M, Jameson, Karen A, Syddall, Holly E, Dennison, Elaine M, Cooper, Cyrus,
Aihie Sayer, Avan, & Group, Hertfordshire Cohort Study. (2013). Clustering of
lifestyle risk factors and poor physical function in older adults: the Hertfordshire
cohort study. Journal of the American Geriatrics Society, 61(10), 1684-1691.
Rolls, Barbara J. (1986). Sensory-specific satiety. Nutrition reviews (USA).
Romo, Rafael D, Wallhagen, Margaret I, Yourman, Lindsey, Yeung, Christie C, Eng,
Catherine, Micco, Guy, . . . Smith, Alexander K. (2013). Perceptions of successful
aging among diverse elders with late-life disability. The Gerontologist, 53(6), 939-
949.
Rondanelli, Mariangela, Klersy, Catherine, Terracol, Gilles, Talluri, Jacopo, Maugeri,
Roberto, Guido, Davide, . . . Lukaski, Henry. (2016). Whey protein, amino acids, and
vitamin D supplementation with physical activity increases fat-free mass and strength,
functionality, and quality of life and decreases inflammation in sarcopenic elderly. The
American journal of clinical nutrition, 103(3), 830-840.
Rosenquist, J Niels, Fowler, James H, & Christakis, Nicholas A. (2011). Social network
determinants of depression. Molecular psychiatry, 16(3), 273.
Rossato, Sinara Laurini, Olinto, Maria Teresa Anselmo, Henn, Ruth Liane, Anjos, Luiz
Antonio dos, Bressan, Ana Weigert, & Wahrlich, Vivian. (2010). Seasonal effect on
nutrient intake in adults living in Southern Brazil. Cadernos de saude publica, 26,
2177-2187.
Rowe, John W, & Kahn, Robert L. (1997). Successful aging. The Gerontologist, 37(4), 433-
440.
Roy, Parimal, & Hamilton, Ian. (1992). Family and social networks among elderly Italians in
Gippsland. Journal of comparative family studies, 267-284.

241
Rubenstein, Laurence Z, Harker, Judith O, Salvà, Antoni, Guigoz, Yves, & Vellas, Bruno.
(2001). Screening for undernutrition in geriatric practice: developing the short-form
mini-nutritional assessment (MNA-SF). The Journals of Gerontology Series A:
Biological Sciences and Medical Sciences, 56(6), M366-M372.
Santini, Ziggi Ivan, Koyanagi, Ai, Tyrovolas, Stefanos, Haro, Josep M, Fiori, Katherine L,
Uwakwa, Richard, . . . Prina, A Matthew. (2015). Social network typologies and
mortality risk among older people in China, India, and Latin America: A 10/66
Dementia Research Group population-based cohort study. Social Science & Medicine,
147, 134-143. doi:10.1016/j.socscimed.2015.10.061
Sarfo, A. (2010). Jamaica & Ghana One Blood -One Language? Kromanti Language of the
Jamaican Maroons Similar To Akan. Retrieved from
http://globalfusionproductions.com/uncategorized/jamaica-ghana-one-blood-one-
language-kromanti-language-of-the-jamaican-maroons-similar-to-akan/
Sattin, Richard W, Williams, Lovoria B, Dias, James, Garvin, Jane T, Marion, Lucy, Joshua,
Thomas V, . . . Narayan, KM Venkat. (2016). Community trial of a faith-based
lifestyle intervention to prevent diabetes among African-Americans. Journal of
community health, 41(1), 87-96.
Saunders, Paul A, Copeland, JRM, Dewey, ME, Gilmore, C, Larkin, BA, Phaterpekar, H, &
Scott, A. (1993). The prevalence of dementia, depression and neurosis in later life: the
Liverpool MRC-ALPHA Study. International Journal of Epidemiology, 22(5), 838-
847.
Schwartz, Ella, & Litwin, Howard. (2018). Social network changes among older Europeans:
the role of gender. European journal of ageing, 15(4), 359-367.
Seale, Clive. (2004). Researching society and culture: Sage.
Seeman, Teresa E. (1996). Social ties and health: The benefits of social integration. Annals of
epidemiology, 6(5), 442-451.
Seeman, Teresa E. (2000). Health promoting effects of friends and family on health outcomes
in older adults. American journal of Health promotion, 14(6), 362-370.
Sharma, Sangita. (2011). Development and use of FFQ among adults in diverse settings
across the globe. Proceedings of the Nutrition Society, 70(2), 232-251.
Sharma, Sangita, Cade, Janet, Jackson, Maria, Mbanya, JC, Chungong, S, Forrester, T, . . .
Cruickshank, J Kennedy. (1996). Development of food frequency questionnaires in
three population samples of African origin from Cameroon, Jamaica and Caribbean
migrants to the UK. European Journal of Clinical Nutrition, 50(7), 479-486.
Sharma, Sangita, Cade, Janet, Riste, Lisa, & Cruickshank, Kennedy. (1999). Nutrient intake
trends among African-Caribbeans in Britain: a migrant population and its second
generation. Public health nutrition, 2(4), 469-476.
Shaya, Fadia T, Chirikov, Viktor V, Howard, DeLeonardo, Foster, Clyde, Costas, Julian,
Snitker, Soren, . . . Kucharski, Kathrin. (2014). Effect of social networks intervention
in type 2 diabetes: a partial randomised study. J Epidemiol Community Health, 68(4),
326-332.
Shye, Diana, Mullooly, John P, Freeborn, Donald K, & Pope, Clyde R. (1995). Gender
differences in the relationship between social network support and mortality: a
longitudinal study of an elderly cohort. Social Science & Medicine, 41(7), 935-947.
Sieverdes, John C, Ray, Billy M, Sui, Xuemei, Lee, Duck-Chul, Hand, Gregory A, Baruth,
Meghan, & Blair, Steven N. (2012). Association between leisure time physical activity
and depressive symptoms in men. Medicine and science in sports and exercise, 44(2),
260-265.

242
Simpson, Ludi. (2007). Population forecasts for Birmingham, with an ethnic group dimension
population forecasts for Birmingham. Retrieved from
http://hummedia.manchester.ac.uk/institutes/cmist/archive-publications/working-
papers/2007/2007-12-population-forecasts-for-birmingham.pdf
Sin, Chih. (2007). Older people from white-British and Asian-Indian backgrounds and their
expectations for support from their children. Quality in Ageing and Older Adults, 8(1),
31-41.
Sin, Chih Hoong. (2004). Sampling minority ethnic older people in Britain. Ageing & Society,
24(2), 257-277.
Södergren, Marita. (2015). Lifestyle predictors of healthy ageing in men. Maturitas, 81(1),
117.
Sowa, Agnieszka, Tobiasz-Adamczyk, Beata, Topór-Mądry, Roman, Poscia, Andrea, & La
Milia, Daniele Ignazio. (2016). Predictors of healthy ageing: public health policy
targets. BMC health services research, 16(5), 289.
Sproston, Kerry, & Mindell, JE. (2006). Health Survey for England 2004. The health of
minority ethnic groups. Retrieved from
https://lemosandcrane.co.uk/resources/National%20Statistics%20-
%20Health%20Survey%20for%20England%202004.pdf
Stephens, Christine, Alpass, Fiona, Towers, Andy, & Stevenson, Brendan. (2011). The effects
of types of social networks, perceived social support, and loneliness on the health of
older people: Accounting for the social context. Journal of aging and health, 23(6),
887-911.
Steves, Claire Joanne, Spector, Timothy D, & Jackson, Stephen HD. (2012). Ageing, genes,
environment and epigenetics: what twin studies tell us now, and in the future. Age and
ageing, 41(5), 581-586.
Story, Mary, Kaphingst, Karen M, Robinson-O'Brien, Ramona, & Glanz, Karen. (2008).
Creating healthy food and eating environments: policy and environmental approaches.
Annu. Rev. Public Health, 29, 253-272.
Suen, Lee-Jen Wu, Huang, Hui-Man, & Lee, Hao-Hsien. (2014). A comparison of
convenience sampling and purposive sampling. Hu Li Za Zhi, 61(3), 105.
Suga, Hitomi, Asakura, Keiko, Sasaki, Satoshi, Nojima, Masanori, Okubo, Hitomi, Hirota,
Naoko, . . . Date, Chigusa. (2014). Effect of seasonality on the estimated mean value
of nutrients and ranking ability of a self-administered diet history questionnaire.
Nutrition journal, 13(1), 51.
Szabo, Agnes, Stephens, Christine, Allen, Joanne, & Alpass, Fiona. (2016). Construct
Validation of Wenger’s Support Network Typology. The Journals of Gerontology:
Series B, 73(7), 1244-1249.
Talegawkar, Sameera A, Kandula, Namratha R, Gadgil, Meghana D, Desai, Dipika, &
Kanaya, Alka M. (2016). Dietary intakes among South Asian adults differ by length of
residence in the USA. Public health nutrition, 19(2), 348-355.
doi:https://doi.org/10.1017/S1368980015001512
Talwar, Sonia A, Aloia, John F, Pollack, Simcha, & Yeh, James K. (2007). Dose response to
vitamin D supplementation among postmenopausal African American women. The
American journal of clinical nutrition, 86(6), 1657-1662.
Tate, Robert B, Lah, Leedine, & Cuddy, T Edward. (2003). Definition of successful aging by
elderly Canadian males: The Manitoba follow-up study. The Gerontologist, 43(5),
735-744.

243
Teddlie, Charles, & Tashakkori, Abbas. (2009). Foundations of mixed methods research:
Integrating quantitative and qualitative approaches in the social and behavioral
sciences: Sage.
Teddlie, Charles, & Yu, Fen. (2007). Mixed methods sampling: A typology with examples.
Journal of mixed methods research, 1(1), 77-100.
Terragni, Laura, Garnweidner, Lisa M, Pettersen, Kjell Sverre, & Mosdøl, Annhild. (2014).
Migration as a turning point in food habits: the early phase of dietary acculturation
among women from South Asian, African, and Middle Eastern Countries living in
Norway. Ecology of food and nutrition, 53(3), 273-291.
Thiyagarajan Jotheeswaran A., Martin Prince, Martin Webber (2014). Social support network
typologies and health outcomes of older people in low and middle income countries–a
10/66 dementia research group population-based study. International Review of
Psychiatry, 26(4), 476-485.
Thompson, Frances E., & Byers, Tim. (1994). Dietary assessment resource manual. The
Journal of nutrition, 124(11), 2245S.
Thompson, Janice. (2014). Ageing in a multicultural/superdiverse society: New challenges,
new dimensions. Birmingham Policy Commissions: University of Birmingham.
Tokudome, Yuko, Imaeda, Nahomi, Nagaya, Teruo, Ikeda, Masato, Fujiwara, Nakako, Sato,
Juichi, . . . Tokudome, Shinkan. (2002). Daily, weekly, seasonal, within-and between-
individual variation in nutrient intake according to four season consecutive 7 day
weighed diet records in Japanese female dietitians. Journal of epidemiology, 12(2),
85-92.
Trichopoulou, Antonia, Orfanos, Philippos, Norat, Teresa, Bueno-de-Mesquita, Bas, Ocké,
Marga C, Peeters, Petra HM, . . . Boffetta, Paolo. (2005). Modified Mediterranean diet
and survival: EPIC-elderly prospective cohort study. Bmj, 330(7498), 991.
Tucker, Patricia, & Gilliland, Jason. (2007). The effect of season and weather on physical
activity: a systematic review. Public Health, 121(12), 909-922.
Umberson, Debra. (1992). Gender, marital status and the social control of health behavior.
Social Science & Medicine, 34(8), 907-917.
United Nations. (2015). World population Ageing. Retrieved from
https://www.un.org/en/development/desa/population/publications/pdf/ageing/WPA201
5_Report.pdf
Uotinen, Virpi, Suutama, Timo, & Ruoppila, Isto. (2003). Age identification in the framework
of successful aging. A study of older Finnish people. The International Journal of
Aging and Human Development, 56(3), 173-195.
Vellas, Bruno, Guigoz, Yves, Garry, Philip J, Nourhashemi, Fati, Bennahum, David, Lauque,
Sylvie, & Albarede, Jean-Louis. (1999). The Mini Nutritional Assessment (MNA) and
its use in grading the nutritional state of elderly patients. Nutrition, 15(2), 116-122.
Vertovec, Steven. (2007). Super-diversity and its implications. Ethnic and racial studies,
30(6), 1024-1054.
Vetter, Norman J. (1999). The impact of smoking in elderly people. Reviews in Clinical
Gerontology, 9(3), 273-280.
Vinokur, Amiram D, & Van Ryn, Michelle. (1993). Social support and undermining in close
relationships: their independent effects on the mental health of unemployed persons.
Journal of personality and social psychology, 65(2), 350.
Von Faber, Margaret, Bootsma–van der Wiel, Annetje, van Exel, Eric, Gussekloo, Jacobijn,
Lagaay, Anne M, van Dongen, Els, . . . Westendorp, Rudi GJ. (2001). Successful

244
aging in the oldest old: who can be characterized as successfully aged? Archives of
internal medicine, 161(22), 2694-2700.
Vyas, Avni, Greenhalgh, Alyson, Cade, Janet, Sanghera, Baljit, Riste, Lisa, Sharma, Sangita,
& Cruickshank, Kennedy. (2003). Nutrient intakes of an adult Pakistani, European and
African‐Caribbean community in inner city Britain. Journal of human nutrition and
dietetics, 16(5), 327-337.
Walker, Kenneth N, MacBride, Arlene, & Vachon, Mary LS. (1977). Social support networks
and the crisis of bereavement. Social Science & Medicine (1967), 11(1), 35-41.
Wallace, Meredith, & Shelkey, Mary. (2007). Katz index of independence in activities of
daily living (ADL). Urol Nurs, 27(1), 93-94.
Wannamethee, S Goya, Ebrahim, Shah, Papacosta, Olia, & Shaper, A Gerald. (2005). From a
postal questionnaire of older men, healthy lifestyle factors reduced the onset of and
may have increased recovery from mobility limitation. Journal of clinical
epidemiology, 58(8), 831-840.
Wenger, Clare G. (1984). The supportive network: Coping with old age: George Allen &
Unwin.
Wenger, G Clare. (1989). Support networks in old age: Constructing a typology. Growing old
in the twentieth century, 166-185.
Wenger, G Clare. (1991). A network typology: From theory to practice. Journal of Aging
Studies, 5(2), 147-162.
Wenger, G Clare. (1995). A comparison of urban with rural support networks: Liverpool and
North Wales. Ageing & Society, 15(1), 59-81.
Wenger, G Clare, & Tucker, Ithwen. (2002). Using network variation in practice:
identification of support network type. Health & Social Care in the Community, 10(1),
28-35.
Wenger, G. Clare. (1994). Understanding support networks and community care: Network
assessment for elderly people: Ashgate Publishing.
Wenger, GC, & Liu, JM. (1999). Support networks in Beijing (China) and Liverpool (UK):
Differences and similarities. Hallym International Journal of Aging, 1(2), 47-57.
Williams, Emily D, Tillin, Therese, Whincup, Peter, Forouhi, Nita G, & Chaturvedi, Nishi.
(2012). Ethnic differences in disability prevalence and their determinants studied over
a 20-year period: a cohort study. PloS one, 7(9), e45602.
World Health Organization. Expert Consultation (2004). "Appropriate body-mass index for
Asian populations and its implications for policy and intervention strategies." Lancet
(London, England) 363.9403:157.
World Health Organization. (2015). World report on Ageing and health. . Retrieved from
https://apps.who.int/iris/bitstream/handle/10665/186463/9789240694811_eng.pdf?seq
uence=1
World Health Organization. (2016). Double burden of malnutrition. Retrieved from
https://www.who.int/nutrition/double-burden-malnutrition/en/
World Health Organization. (2018). Ageing and health. Retrieved from
https://www.who.int/news-room/fact-sheets/detail/ageing-and-health
Zhang, Hua, Hsu-Hage, Bridget HH, & Wahlqvist, Mark L. (2002). Longitudinal changes in
nutrient intakes in the Melbourne Chinese Cohort Study. Public health nutrition, 5(3),
433-439.
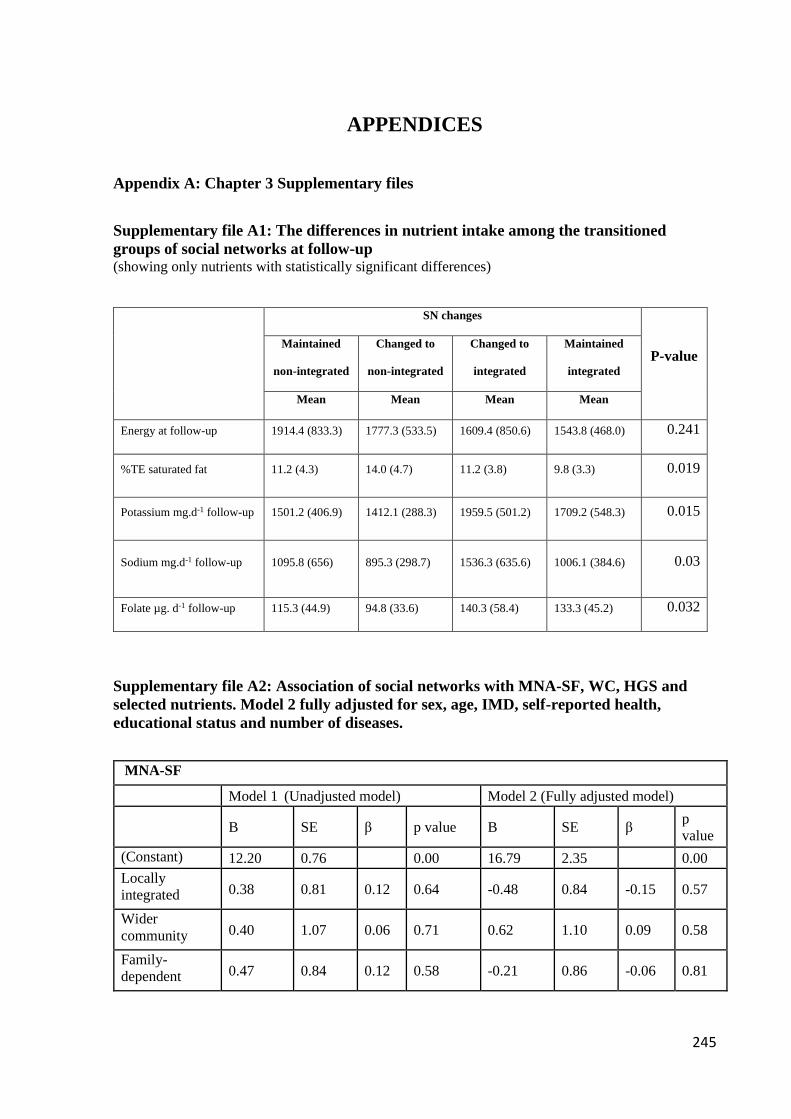
245
APPENDICES
Appendix A: Chapter 3 Supplementary files
Supplementary file A1: The differences in nutrient intake among the transitioned
groups of social networks at follow-up (showing only nutrients with statistically significant differences)
SN changes
P-value Maintained
non-integrated
Changed to
non-integrated
Changed to
integrated
Maintained
integrated
Mean Mean Mean Mean
Energy at follow-up 1914.4 (833.3) 1777.3 (533.5) 1609.4 (850.6) 1543.8 (468.0) 0.241
%TE saturated fat 11.2 (4.3) 14.0 (4.7) 11.2 (3.8) 9.8 (3.3) 0.019
Potassium mg.d-1 follow-up 1501.2 (406.9) 1412.1 (288.3) 1959.5 (501.2) 1709.2 (548.3) 0.015
Sodium mg.d-1 follow-up 1095.8 (656) 895.3 (298.7) 1536.3 (635.6) 1006.1 (384.6) 0.03
Folate µg. d-1 follow-up 115.3 (44.9) 94.8 (33.6) 140.3 (58.4) 133.3 (45.2) 0.032
Supplementary file A2: Association of social networks with MNA-SF, WC, HGS and
selected nutrients. Model 2 fully adjusted for sex, age, IMD, self-reported health,
educational status and number of diseases.
MNA-SF
Model 1 (Unadjusted model) Model 2 (Fully adjusted model)
B SE β p value B SE β
p
value
(Constant) 12.20 0.76 0.00 16.79 2.35 0.00
Locally
integrated 0.38 0.81 0.12 0.64 -0.48 0.84 -0.15 0.57
Wider
community 0.40 1.07 0.06 0.71 0.62 1.10 0.09 0.58
Family-
dependent 0.47 0.84 0.12 0.58 -0.21 0.86 -0.06 0.81

246
Local self-
contained 0.23 0.88 0.05 0.80 -0.31 0.89 -0.07 0.72
Handgrip kg
Model 1 (Unadjusted model) Model 2 (Fully adjusted model)
B SE β p value B SE β
p
value
(Constant) 25.24 4.22 0.00 82.68 10.92 0.00
Locally
integrated 3.63 4.51 0.19 0.42 -4.06 3.91 -0.21 0.30
Wider
community -2.26 5.97 -0.06 0.71 -0.06 5.12 0.00 0.99
Family-
dependent 5.27 4.70 0.24 0.27 -3.07 4.00 -0.14 0.45
Local self-
contained -1.27 4.92 -0.05 0.80 -5.29 4.12 -0.21 0.20
Waist circumference cm
Model 1 (Unadjusted model) Model 2 (Fully adjusted model)
B SE β p value B SE β
p
value
(Constant) 108.15 4.72 0.00 109.90 15.09 0.00
Locally
integrated -8.26 5.04 -0.39 0.11 -5.19 5.40 -0.25 0.34
Wider
community -7.05 6.68 -0.16 0.29 -6.83 7.07 -0.16 0.34
Family-
dependent -9.78 5.25 -0.41 0.07 -8.48 5.53 -0.36 0.13
Local self-
contained -7.56 5.50 -0.27 0.17 -6.11 5.70 -0.22 0.29
Energy kcal
Model 1 (Unadjusted model) Model 2 (Fully adjusted model)
B SE β p value B SE β
p
value
(Constant) 1902.60 233.72 0.00 2913.00 713.97 0.00
Locally
integrated -173.09 249.43 -0.17 0.49 -213.18 255.67 -0.21 0.41
Wider
community -240.30 330.53 -0.11 0.47 -231.26 334.58 -0.11 0.49
Family-
dependent -74.70 260.06 -0.06 0.78 -221.52 261.80 -0.19 0.40
Local self-
contained -280.81 272.28 -0.21 0.31 -262.92 269.56 -0.19 0.33

247
Carbohydrates g
Model 1 (Unadjusted model) Model 2 (Fully adjusted model)
B SE β p value B SE β
p
value
(Constant) 229.65 28.64 0.00 319.08 88.19 0.00
Locally
integrated -7.24 30.56 -0.06 0.81 -22.67 31.58 -0.18 0.48
Wider
community -24.11 40.50 -0.09 0.55 -28.28 41.33 -0.11 0.50
Family-
dependent -7.20 31.86 -0.05 0.82 -30.82 32.34 -0.21 0.34
Local self-
contained -36.03 33.36 -0.22 0.28 -44.34 33.30 -0.27 0.19
Fibre g
Model 1 (Unadjusted model) Model 2 (Fully adjusted model)
B SE β p value B SE β
p
value
(Constant) 20.91 3.40 0.00 20.23 9.36 0.03
Locally
integrated -3.39 3.62 -0.23 0.35 -6.49 3.35 -0.43 0.06
Wider
community 0.77 4.80 0.03 0.87 -1.87 4.39 -0.06 0.67
Family-
dependent -3.55 3.78 -0.21 0.35 -7.18 3.43 -0.42 0.04
Local self-
contained -4.04 3.96 -0.20 0.31 -7.10 3.53 -0.36 0.05
Protein g
Model 1 (Unadjusted model) Model 2 (Fully adjusted model)
B SE β p value B SE β
p
value
(Constant) 87.17 11.18 0.00 128.22 34.80 0.00
Locally
integrated -16.33 11.93 -0.33 0.18 -15.91 12.46 -0.32 0.21
Wider
community -12.40 15.81 -0.12 0.44 -12.41 16.31 -0.12 0.45
Family-
dependent -6.93 12.44 -0.12 0.58 -9.74 12.76 -0.17 0.45
Local self-
contained -14.49 13.02 -0.22 0.27 -11.65 13.14 -0.18 0.38

248
Fats g
Model 1 (Unadjusted model) Model 2 (Fully adjusted model)
B SE β p value B SE β p value
(Constant) 72.82 16.31 0.00 118.70 51.29 0.02
Locally
integrated -8.38 17.41 -0.12 0.63 -3.62 18.37 -0.05 0.84
Wider
community -8.74 23.07 -0.06 0.71 -5.59 24.04 -0.04 0.82
Family-
dependent 1.50 18.15 0.02 0.93 -1.48 18.81 -0.02 0.94
Local self-
contained -11.98 19.00 -0.13 0.53 -6.15 19.36 -0.07 0.75

249
Supplementary file A3: Predictors of changes in nutritional status of community-dwelling, ethnically diverse older adults (N=81)
Remained Malnourished/at-risk-of malnutrition Changed to Malnourished/at-risk-of
malnutrition Changed to Normal
B SE Sig. Exp(B)
95%
Confidence
Interval for
Exp(B) B SE Sig. Exp(B)
95%
Confidence
Interval for
Exp(B) B SE Sig. Exp(B)
95%
Confidence
Interval for
Exp(B)
Lower
Bound
Upper
Bound
Lower
Bound
Upper
Bound
Lower
Bound
Upper
Bound
Intercept -5.49 4.71 0.24 -7.59 3.14 0.02 -19.84 8.85 0.03
IMD 0.19 0.29 0.51 1.21 0.69 2.14 0.38 0.17 0.03 1.47 1.05 2.05 0.49 0.28 0.09 1.63 0.94 2.83
Age 0.06 0.07 0.37 1.06 0.93 1.21 0.08 0.04 0.05 1.09 1.00 1.18 0.26 0.12 0.03 1.30 1.03 1.64
Integrated 0.89 1.25 0.48 2.44 0.21 28.37 -0.51 0.65 0.43 0.60 0.17 2.13 1.12 1.61 0.49 3.05 0.13 71.76
Non-integrated 0b 0b 0b
Male 0.69 1.02 0.50 2.00 0.27 14.64 0.55 0.64 0.39 1.73 0.49 6.12 0.79 1.40 0.57 2.20 0.14 34.04
Female 0b 0b 0b
No education 1.02 1.31 0.44 2.77 0.21 36.06 1.15 0.90 0.20 3.17 0.54 18.44 -19.82 0.00 0.00 0.00 0.00
Primary 0.88 1.24 0.48 2.41 0.21 27.45 0.58 0.88 0.51 1.79 0.32 10.00 -1.18 1.79 0.51 0.31 0.01 10.31
Secondary 0.50 1.37 0.72 1.64 0.11 24.25 1.10 0.80 0.17 3.00 0.62 14.43 0.81 1.46 0.58 2.24 0.13 39.36
University/College 0b 0b 0b
Excellent -3.12 1.79 0.08 0.04 0.00 1.47 -1.36 1.29 0.29 0.26 0.02 3.25 -22.92 8895.23 1.00 0.00 0.00 .c
Good -3.64 1.65 0.03 0.03 0.00 0.66 -1.07 1.15 0.36 0.34 0.04 3.30 -5.14 2.42 0.03 0.01 0.00 0.68
Fair -1.95 1.75 0.27 0.14 0.01 4.43 0.06 1.32 0.97 1.06 0.08 13.91 -1.67 2.01 0.41 0.19 0.00 9.70
Poor 0b 0b 0b
a. The reference category is: Remained normal.
b. This parameter is set to zero because it is redundant.
c. Floating point overflow occurred while computing this statistic. Its value is therefore set to system missing.

250
Appendix B: Chapter 4 Supplementary files
Supplementary file B1: Differences between participants that remained in the study (n=81) and
participants that dropped out (n=19)
Variables
Completed study
(n= 81)
Lost to
follow-up
(n= 19) P-value
Age (median) 70 71 0.878
Sex (N) Males 50 9 0.252
Females 31 10
Marital status (N) Married 55 11 0.41
Not married 26 8
Education (N) Educated 70 14 0.175
Not educated 11 5
IMD (median) 2.7 3.1 0.121
Number of diseases (median) 2.0 2.1 0.141
BMI (mean) 29.5 29.7 0.882
WC (median) 99.2 106.1 0.036
MNA-SF (median) 13.1 13 0.404
SPPB (Median) 11.1 8 0.007
HGS (kg) (mean) 27.9 22.5 0.027
Energy kcal (median) 1733 1878 0.186

251
Supplementary file B2: Differences in micronutrient intakes with and without supplementation at baseline
Male (% of RNI) Female (% of RNI)
Micronutrients Supplements Without supplements p-value** Supplements Without supplements p-value**
Potassium mg/day 43.92 43.92 1.000 48.67 48.65 0.323 a
Magnesium mg/day 77.24 50.91 0.109 68.65 67.71 0.180
Calcium mg/day 76.07 53.48 0.109 71.37 70.12 0.144
Iron mg/day 80.09 78.24 0.119 79.48 74.82 0.068
Zinc mg/day 65.33 61.48 0.059 75.05 72.26 0.655
Selenium µg/day 32.26 32.26 1.000 47.43 46.85 0.317
Iodine µg/day 36.44 33.44 0.980 47.27 45.78 0.317
Sodium mg/day 68.31 68.31 1.000 a 65.31 65.31 1.00
Phosphorus mg/day 117.36 117.34 0.321 a 128.93 128.83 0.323 a
Copper mg/day 65.68 65.68 1.000 74.39 73.37 0.317
Chlorine mg/day 54.24 54.24 0.625 a 58.82 58.8 0.317
Manganese mg/day 166.59 166.59 0.998 176.48 174.04 0.317
Folate mg/day 62.38 58.77 0.043 81.01 68.05 0.012
Vitamin C mg/day 127.36 122 0.043 141.83 120.65 0.012
Vitamin A (Retinol) µg/day 62.49 57.14 0.043 123.2 104.92 0.008
Vitamin D µg/day 35.81 21.86 0.008 54.34 26.1 0.001
Vitamin E µg/day 99.83 83.83 0.018 107.71 68.83 0.003
Thiamine mg/day 88.14 93.43 0.066 114.63 96.34 0.011
Riboflavin mg/day 74 63 0.066 78.12 73.19 0.012
Niacin mg/day 69.74 65.9 0.068 102.3 86.77 0.012
Vitamin B6 mg/day 71.19 66.1 0.068 95.53 78.46 0.011
Vitamin B12 µg/day 175.93 173.56 0.066 205.37 176.75 0.011
**p-values were calculated using absolute values controlled for energy intake and not computed percentages a Normally distributed dated, p-values were calculated using paired t-test analysis.

252
Supplementary file B3: Differences in micronutrient intakes with and without supplementation at follow-up
Male (% of RNI) Female (% of RNI)
Micronutrients Supplements Without supplements p-value** Supplements Without supplements p-value**
Potassium mg/day 43.47 43.32 0.123 a 45.89 45.58 0.132 a
Magnesium mg/day 49.37 49.68 0.229 a 56.18 56.21 0.723 a
Calcium mg/day 55.38 55.01 0.237 a 58.73 57.2 0.322 a
Iron mg/day 74.3 72.45 0.455 70.46 69.13 0.212
Zinc mg/day 49.53 49.56 0.577 72.8 69.15 0.434
Selenium µg/day 30.98 30.86 0.987 43.98 43.17 0.280
Iodine µg/day 35.23 35.26 0.090 40.6 38.76 0.242
Sodium mg/day 59.95 61.05 0.462 72.65 72.08 0.932
Phosphorus mg/day 109.12 108.29 0.228 a 115.02 113.94 0.128 a
Copper mg/day 68.37 68.11 0.352 70.1 68.18 0.490
Chlorine mg/day 48.09 47.89 0.588 48.09 47.89 0.571
Manganese mg/day 166.91 166.56 0.521 311.34 307.71 0.017 a
Folate mg/day 55.32 54.79 0.541 a 60.19 57.36 0.122 a
Vitamin C mg/day 102.71 101.39 0.061 121.23 114.03 0.021
Vitamin A (Retinol) µg/day 65.75 63.05 0.256 94.92 82.05 0.027
Vitamin D µg/day 18.86 17.56 0.641 22.48 17.6 0.012
Vitamin E µg/day 83.96 83.63 0.795 81.18 78.68 0.025 a
Thiamine mg/day 84.13 78.46 0.914 95.19 91.63 0.005
Riboflavin mg/day 61.07 59.28 0.169 77.27 72.66 0.089
Niacin mg/day 61.59 53.79 0.102 85.63 80.95 0.174 a
Vitamin B6 mg/day 63.7 61.71 0.122 77.6 70.56 0.016 a
Vitamin B12 µg/day 151.7 147.13 0.195 214.67 111.74 0.031
**p-values were calculated using absolute values controlled for energy intake and not computed percentages a Normally distributed dated, p-values were calculated using paired t-test analysis.

253
Supplementary file B4: Pairwise correlations
1 2 3 4 5 6 7 8 9 10 11 12 13 14 15 16 17 18 19 20 21 22
1 BM1 1
2 HGS -.13 1
3 SPPB -.22* .61** 1
4 WC .67** -0.17 -.46** 1
5 MNA-SF -.07 .19* .39** -.18 1
6 Energy .06 .09 .08 .06 .03 1
7 Protein .01 -.03 .08 .01 -.10 .72** 1
8 Fibre -.07 .28** .26** -.06 .19 .23* .06 1
9 Potassium -.16 .10 .18 -.13 -.01 -.39** -.16 .39** 1
10 Calcium .08 -.01 -.01 .09 -.18 -.12 -.03 .61 .51** 1
11 Magnesium -.15 .11 .14 -.07 .10 -.36** -.25* .45** .75** .47** 1
12 Iron -.15 -.08 -.00 .05 -.14 -.16 -.08 .32** .48** .32** .61** 1
13 Zinc .00 -.18 -.12 .09 -.15 -.10 .25* -.08 .24* .20* .33** .45** 1
14 Vit A .08 -.04 .05 -.01 .06 .01 .11 .04 .01 .054 .12 .09 .11 1
15 Vit D -.03 .12 .22* -.08 .24* -.09 .07 .06 .02 .07 .00 -.21* -.14 .06 1
16 Riboflavin .07 .02 .11 .10 -.05 -.13 .08 -.01 .44** .61** .35** .22* .26** .28** .20* 1
17 Niacin -.07 .07 .18 -.07 .02 -.13 .28** -.07 .27** -.03 .08 .01 .12 -.06 .24* .41** 1
18 Vit B6 -.11 .16 .30** -.07 .17 -.284** -.04 .154 .62** .23* .49** .27** .17 -.05 .212* .58** .69** 1
19 Vit B12 -.08 -.08 .09 -.09 -.04 -.05 .31** -.14 .171 .16 -.111 -.05 .16 .25* .423** .34** .22* .08 1
20 Sodium .19 .01 -.16 .04 -.19 -.04 -.05 .02 .18 .23* .14 .13 -.02 .04 -.09 .11 .07 .04 -.03 1
21 Vit C -.15 .18 .15 -.13 .05 -.25* -.24* .38** .51** .19 .38** .33** .00 .02 .01 .27** .18 .49** .03 .19 1
22 Folate -.12 .15 .18 -.03 .03 -.23* -.16 .417** .49** .34** .61** .52** .11 .12 .08 .47** .21* .60** .03 .02 .49** 1

254
Supplementary file B5: Predictors of changes in physical function (SPPB) over time
OR 95% CI SE (B) P-value
Constant 0 5.26 0.007
Male vs Female 1.54 0.46-5.17 0.62 0.486
Age 1.1 1.03-1.18 0.04 0.005
Married vs Not married 0.91 0.25-3.34 0.66 0.885
IMD 1.02 0.78-1.33 0.14 0.908
Educated vs Not educated 1.98 0.35 -1.27 0.89 0.443
Number of diseases 1.63 1.04-2.55 0.23 0.033
WC 1.08 0.99-1.17 0.04 0.072
BMI 0.84 0.70-1.02 0.1 0.081
MNA-SF 1.21 0.84-1.74 0.19 0.302
Fibre 1.03 0.96-1.11 0.04 0.412
Vitamin D 1.05 0.95-1.15 0.05 0.373
Vitamin B6 0.99 0.35-2.86 0.54 0.994

255
Appendix C: Chapter 5 Supplementary files
Supplementary file C1: Complete coding matrix: Factors influencing physical function

256
Supplementary file C2: Adapted Ecological model depicting the influences of eating
behaviours and among community-dwelling ethnically diverse older adults

257
Appendix D: Participant information sheet and consent form, and data collection tools
Appendix D1. Participant Information sheet
(Information sheet)
Dietary intake, eating behaviours and physical function in community-dwelling
ethnically diverse older adults: cultural tailoring of assessment methods and
identification of key social influences.
You have been invited to take part in a research study. Before you decide whether or not to
participate, it is important that you understand what the research is about, why it is being done,
what it will involve and what role you will play in it. Please take time to read the following
information carefully.
WHAT IS THE PURPOSE OF THE STUDY? The study seeks to increase our
understanding of what and how older people eat and how this is related to their level of physical
function (which includes tests of balance, standing from a chair, and a short 4 metre walk). In
addition, we want to understand how your social networks i.e. friend, family, community
relationships might influence what and how you eat, and your physical function. We feel your
experiences will help us to understand how a person’s diet and social networks influences their
ability to age in a healthy way while living within varying cultural and religious groups in
communities in the UK
WHO IS ORGANIZING THE STUDY?
Evans A. Asamane, a doctoral researcher with the University of Birmingham, will carry out the
study with supervision from Professor Janice L. Thompson and Dr. Carolyn Greig.
INCLUSION CRITERIA:

258
• Self-identification as being: Black Caribbean, Black African, Indian, Pakistani, or
Bangladeshi
• At least 60 years of age
• Living in the Birmingham area
• No diagnosis of dementia or any cognitive or physical disabilities that might affect
participation
WHY ARE WE ASKING YOU TO PARTICIPATE?
We are asking you to participate as you have identified yourself as being at least 60 years of
age, and being Black Caribbean, Black African, Indian, Pakistani, or Bangladeshi. You have
also expressed an interest in the study. If you choose to participate, the experiences you share
during this study will help us better understand the key personal and social factors that can
affect what and how older adults eat, and their physical function while living in a super-diverse
community.
WHAT WILL WE ASK YOU TO DO?
If you agree to take part in this study, you will be asked to attend four (4) data collection
visits. These visits will be held at a time and place that you prefer. Each visit is described
below:
1. On the first visit, you will be asked to recall and describe all foods and drinks consumed
in the previous 24 hours. You will be shown photographs of foods and drinks to help
you describe the amounts you have consumed.
You will also be asked questions about your age, marital status, education, migration
history, faith beliefs, work status, health, medication use, and whether you smoke.
We will also ask you some questions about factors that may be affecting how you eat,
if you have recently lost weight, how well you can physically move around, and daily
activities you can do.
We will also take physical measurements, including height, weight, waist
circumference, and hand grip strength. We will also measure physical function using
the Short Physical Performance Battery test. This is a test of your ability to balance
while standing, how well you can sit and stand up from a chair, and the time taken to
walk for 4 metres (which is about 13 feet).
This visit is expected to take approximately 90 minutes.
2. The second visit will be scheduled about 14 days after the first visit, again at your
selected time and place of convenience. Similar to visit 1, you will be asked to recall
and describe all foods and drinks consumed in the previous 24 hours. In addition, you

259
will participate in an interview to understand the things that affect what and how you
eat, and how your social networks (friend, family, community relationships) might
affect your food intake and physical function.
This visit is expected to take approximately 60-90 minutes.
3. The third visit will be done about 8 months after Visit 2. You will be contacted by the
researcher to arrange this visit to suit your convenience. Similar to visits 1 and 2, all the
food and drinks consumed over the previous 24 hours will be recorded, and the
researcher will further have a discussion with you about why you eat the way you do
and how your social networks (friend, family, community relationships) might affect
your food intake and physical function.
This visit is expected to take 60-90 minutes.
4. The fourth visit will be arranged with you again to suit your time and place of
convenience, about 14 days after visit 3. At this visit, you will be asked to
recall and describe all foods and drinks consumed in the previous 24 hours. We will also
ask you the same questions as in visit 1 about factors that may be affecting how you eat,
if you have recently lost weight, how well you can physically move around, and daily
activities you can do.
Also, similar to visit 1, we will take physical measurements, including height, weight,
waist circumference, and hand grip strength, and will measure physical function using
the Short Physical Performance Battery test (ability to balance while standing, how well
you can sit and stand up from a chair, and the time to walk for 4 metres). On this last
occasion, you will be asked to answer some questions and to perform some tasks to test
your memory. As I am not a trained health professional conducting this test, the results
of the test do not represent a medical diagnosis of any cognitive impairment. You will
be provided with a copy of the results of the test at the end of the study. You will also
be advised to discuss the results further with your GP depending on the outcome of the
test.
This visit is expected to take 50-70 minutes.
During any visit, you can decline to answer any questions you do not want to answer or feel
uncomfortable about. There is no right or wrong answer. We will ask you to express yourself
freely at these visits. All interviews will be digitally recorded with your permission to allow us
to better understand your responses after the interview.
HOW WILL WE MAINTAIN YOUR PRIVACY AND CONFIDENTIALITY?

260
All information collected in this study will be kept private. The information obtained from you
will be anonymised and you will not be identified in any report. This means that we will assign
you with a number ID to protect your identity, so that you are not recognised in any reports or
publications. All records from this study will be kept in a locked cabinet in a locked room at
the University of Birmingham in the School of Sport, Exercise, and Rehabilitation Sciences. As
this study is part of an EU funded project called PANINI, your data will be processed and shared
confidentially with only researchers and partners on this project within Europe.
DO I HAVE TO TAKE PART?
Your participation in this study is entirely voluntary. It is solely based on your own decision. If
you do decide to take part, you will be required to sign a consent form at the beginning of visit
1.
You can withdraw from the study at any point in time for any reason. Your withdrawal will not
influence how you are treated as a participant, and will not affect any medical care you receive.
If you decide not to take part, you may withdraw from the study at any time without giving a
reason and also with no penalty or consequences of any kind.
If you choose to withdraw from the study at any point, we will retain all of the information
collected up to that point in time. This is because we would like to include this information in
analyses and reports. If you withdraw from the study and do not want any of your information
included in analyses and reports, you can inform us of this and we will delete all of your
information and it will not be used in any analyses or reports.
WHAT ARE THE RISKS AND BENEFITS OF MY PARTICIPATION?
We anticipate no risks to you participating in this study other than those encountered in
everyday life. It is up to you to decide what you want to share in these one to one interviews. If
you feel upset or uncomfortable about anything that is discussed, you can skip specific
questions or if necessary, the interview can be stopped straight away.
At the end of the study, information about the health level of your diet and your level of physical
function information will be available upon request. You may choose to share this information
with your health practitioner and/or family members.
The information you share with us during this study may help health professionals, researchers,
and policy makers develop culturally appropriate programmes to promote healthy ageing in our
communities.
CONTACT INFORMATION:

261
If you have any questions or concerns regarding the study, please contact Evans A. Asamane at
[email protected] or on 01214144125 or 07835781821. You may also contact the
supervisors on the project: Professor Janice L Thompson at [email protected] or on
01214143084; or Dr. Carolyn A. Greig at [email protected] or on 01214148743.
Thank you so much for considering to take part in this study
If you have any formal complaints about this research, you can contact Professor
Brett Smith (Head of Research) by email at [email protected] or Tel:
01214147981

262
Appendix D2. Participant consent form
School of Sport and Exercise Sciences
The University of Birmingham
Edgbaston
Birmingham
B15 2TT
Tel: 0121 414 4115
Dietary intake, eating behaviours and physical function in community-dwelling ethnically diverse
older adults: cultural tailoring of assessment methods and identification of key social influences.
Please write your initials in each box:
_____________________ _____________________ _____________________
Name of participant Date Signature
_____________________ _____________________ _____________________
Name of researcher Date Signature
If you have further questions about the study, please feel free to contact Evans Asamane at
[email protected] or at 01214144125 or 07835781821 or my lead supervisor Professor Janice
L. Thompson at [email protected] or at +44 (0) 121 414 3084
I confirm that I have read the participant information sheet (Or have had it read to me) and have
had the opportunity to discuss the study with the researcher for clarification
I understand that my participation in this study is entirely voluntary and that I am free to
withdraw at any time without penalty and without giving any reason
I agree to the audio-taping of the face-to-face interviews between myself and a researcher
I understand that I will be asked to provide information relating to my health, eating behaviors,
social networks, cognition, and physical function. This information will be gathered using
questionnaires, interviews and testing procedures
I understand that I will be assigned a unique numeric code/ID, which will be used to
confidentiality in publications and reports. I understand that sections of my interviews will be
transcribed and quoted, and used to write a doctoral thesis and will be used in academic journals.
I also understand that confidentiality will be maintained and it will not be possible to identify me
from this quoted material in reports and publications
I understand that the information collected about me will be stored on a password-protected
computer and locked in filing cabinets in a locked room in the School of Sport, Exercise and
Rehabilitation Sciences at the University of Birmingham.
I understand that at the last visit, I will be asked some questions to test my memory
I agree to take part in the above-titled research study.

263
Appendix D3. Socio-demographic questionnaire
Form 1
Participant ID: _________________ Date: _____________________
Interviewer: Please explain to the participant that the following questions are to gather general
information about her age, origin, education, household, and health. Please tick only one box for each
question.
1. GENERAL INFORMATION
Age: ____________________DOB:_________
Country of birth: _______________________
Ethnicity
Mixed/ Multiple ethnic backgrounds
White and Black Caribbean
White and Black African
White and Black Asian
Other __________________________
Asian
Indian
Pakistani
Bangladeshi
Other __________________________
Black/ African/ Caribbean
African
Caribbean
Other__________________________
Any other ______________________
Marital status
Single

264
Married
Separated
Divorced
Widowed
Number of children _________________________
How long have you been living in the UK? _____________
Education
No qualifications
Primary school
Secondary school
College
University/Higher education
Faith/Religion
Buddhist
Christian
Hindu
Jew
Muslim
Sikh
No religion
Other (please state)
2. HOUSEHOLD
Postcode _________________________
How long have you been living at this address?
How many people are currently living in your household, including yourself? ____________
Do you work for pay outside the home? ……………………
If yes, check the box that best corresponds to you
Yes No

265
Working full time ……………………………………………………
Working part time …………………………………………………..
Have you ever worked in the UK?
If yes, are you retired?
Yes No
Yes No
3. HEALTH
How would you describe your health compared to other persons
of your age?
Excellent …………………………………………………………….
Good …………………………………………………………………
Fair …………………………………………………………………...
Poor…………………………………………………………………..
Have you been diagnosed with any of these diseases in the past?
…..
Hypertension ……………………………………………………...
Diabetes ……………………………………………………………
Heart disease and stroke.………………………………………..
Hyperlipidaemia ……………………………………………………
Renal disease …………………………………………………….
Osteoporosis ………………………………………………………
Arthritis …………………………………………………………….
Cancer ……………………………………………………………..
Other: ____________________________________________
Yes No
Do you take any medication? Yes No
Description: ______________________________________________________________
Do you currently smoke?
Frequency_______cigarretes/week
Did you use to smoke? For how long (years)? _________
Yes No
Yes No

266
Do you consume drinks containing alcohol?
Frequency __________ /week Type________
Yes No

267
Appendix D4. Physical measurement recording form
Form 2
Participant ID: _________________ Date of assessment: _____________________
Physical Measurements
1. Weight (Kg) 1st________ 2nd________ 3rd________ Average of closest 2 values _____________
2. Height (cm) 1st________ 2nd________ 3rd________ Average of closest 2 values _____________
3. Waist circumference (cm) 1st________ 2nd________ 3rd________ Average of closest 2 values _____________
5. Hand Grip 1st ________ 2nd________ 3rd___________ Average to 2 highest values _____________
6. SPPB: Physical function tests recording sheet
4m walking speed
ATTEMPT ≤4.81s 4.82-6.20s 6.21-8.70s 8.71-59.99s >60s/Unable Aid used? (circle) Code non-attempt/fail Time (circle
best)
SCORE
#1 [4] [3] [2] [1] [0] No / Stick / Oth

268
#2 [4] [3] [2] [1] [0] No / Stick / Oth
Standing balance
Chair rise(s)
Side-by-side Semi-tandem Full tandem stand BALANCE SCORE (SUM)
< 10 s [0] END < 10 s [0] END < 3 s [0]
≥ 10 s [1] ≥ 10 s [1] 3-9.99 s [1]
≥ 10 s [2]
Time (record only if <10s)
Code non-attempt /fail [0]
Completed single chair
stand? (circle)
≤11.19s 11.20–
13.69s
13.70-
16.69s
16.70-
59.99s
>60s/Unable to complete 5
stands/used hands
Code non-
attempt/fail
Time SCORE
Yes / No / Used hands [0] [4] [3] [2] [1] [0]

269
CODES for non-attempt or failure
1 Tried but unable
2 Participant could not hold position/stand/walk unassisted
3 Not attempted, researcher felt unsafe
4 Not attempted, participant felt unsafe
5 Participant unable to understand instructions
6 Other (specify in tables above)
7 Participant refused
PARTICIPANT’S
FINAL SPPB SCORE

270
Appendix D5. Mini-nutritional Assessment-Short Form (MNA-SF)
Form 3
Participant ID: _________________ Date of assessment: _________________
SCREENING
A Has food intake declined over the past 3 months due to loss of appetite, digestive problems,
chewing or swallowing difficulties?
0 = severe decrease in food intake
1 = moderate decrease in food intake
2 = no decrease in food intake
B Weight loss during the last 3 months
0 = weight loss greater than 3 kg (6.6 lbs)
1 = does not know
2 = weight loss between 1 and 3 kg (2.2 and 6.6 lbs)
3 = no weight loss
C Mobility
0 = bed or chair bound
1 = able to get out of bed / chair but does not go out
2 = goes out
D Has suffered psychological stress or acute disease in the past 3 months?
0 = yes 2 = no
E Neuropsychological problems
0 = severe dementia or depression
1 = mild dementia
2 = no psychological problems
F1 Body Mass Index (BMI) (weight in kg) / (height in m)2
0 = BMI less than 19
1 = BMI 19 to less than 21
2 = BMI 21 to less than 23
3 = BMI 23 or greater

271
Screening score
(max. 14 points)
12-14 points: Normal nutritional status
8-11 points: At risk of malnutrition
0-7 points: Malnourished

272
Appendix D6. Katz Index of Independence in Activities of Daily Living
Form 4
Participant ID: _________________ Date of assessment: _________________
ACTIVITIES
POINTS (1 OR 0)
INDEPENDENCE:
(1 POINT)
NO supervision, direction or
personal assistance
DEPENDENCE:
(0 POINTS)
WITH supervision, direction,
personal assistance or total care
BATHING
POINTS: ___________
(1 POINT) Bathes self completely
or needs help in bathing only a
single part of the body such as the
back, genital area or disabled
extremity.
(0 POINTS) Needs help with
bathing more than one part of the
body, getting in or out of the tub or
shower. Requires total bathing.
DRESSING
POINTS: ___________
(1 POINT) Gets clothes from
closets and drawers and puts on
clothes and outer garments
complete with fasteners. May have
help tying shoes.
(0 POINTS) Needs help with
dressing self or needs to be
completely dressed.
TOILETING
POINTS: ___________
(1 POINT) Goes to toilet, gets on
and off, arranges clothes, cleans
genital area without help.
(0 POINTS) Needs help
transferring to the toilet, cleaning
self or uses bedpan or commode.
TRANSFERRING
POINTS: ___________
(1 POINT) Moves in and out of
bed or chair unassisted.
Mechanical transferring aides are
acceptable.
(0 POINTS) Needs help in moving
from bed to chair or requires a
complete transfer.
CONTINENCE
POINTS: ___________
(1 POINT) Exercises complete
self-control over urination and
defecation.
(0 POINTS) Is partially or totally
incontinent of bowel or bladder.
FEEDING
POINTS: ___________
(1 POINT) Gets food from plate
into mouth without help.
Preparation of food may be done
by another person.
(0 POINTS) Needs partial or total
help with feeding or requires
parenteral feeding.
TOTAL POINTS = ______ 6 = High (patient independent) 0 = Low (patient very dependent)

273
Appendix D7. Wenger PANT Scoring Instrument for measuring social networks
Form 5
Participant ID: _____________ Date of assessment: _____________________
Question Response Codes
Family
dependant
Locally
integrated
Local self-
contained
Wider
community
Private
Restricted
How far away in
distance does your
nearest relative
live? Excluding
spouse
1. Same house/1km
2. 1-5km
3. 6-15km
4. 16-50km
5. 50+ km
9. No relatives
1 2 3 3 4 4 5 4 5
If you have any
children, where
does your nearest
child live?
1. Same house/1 km
2. 1-5km
3. 6-15km
4. 16-50km
5. 50+ km
9. No children
1 2
1
2 3
3 4
9
5 5 9
If you have any
living sisters or
brothers, where
does your nearest
sister of brother
live?
1. Same house/1km
2. 1-5km
3. 6-15km
4. 16-50km
5. 50+ km
9. No siblings
1 2
1
2 3
2 3 4 5 9 5 9
How often do you
see any of your
children or other
relatives to speak
to?
1.Daily
2. 2-3 times a week
3. At least weekly
4. At least monthly
5. Less often
6. Never/no relatives
1 2 1 2 3 4 4 5 5 6
If you have friends
in this community/
neighbourhood,
how often do you
have a chat or do
something with
one of your
friends?
1.Daily
2. 2-3 times a week
3. At least weekly
4. At least monthly
5. Less often
6. Never/no friends
4 5
1 2
3
4 5
1 2
3
5 6
How often do you
see any of your
neighbours to have
1. Daily
2. 2-3 times a week
3. At least weekly
4. At least monthly
5. Less often
4
5 6
1 2
3
3 4 3 4 5 6

274
a chat with or do
something with?
6. No contact with
neighbours
Do you attend any
religious meetings?
1. Yes regularly
2. Yes occasionally
3. No
2 3 1 2 3 1 3
Network type
Highest circles
Burholt network generator questions
a) Who lives in this household with you? (household membership)
(b) How often do you have a chat or do something with one of your friends? After this question the
interviewer elicited information on up to five named friends.
(c) If you were ill and could not leave the house, is there someone who would look after you?
(d) Does anyone go to buy food for you?
(e) Does anyone cook for you?
(f) Does anyone help you with any other [than laundry or cooking] household chores?
(g) If you needed advice about money, is there someone you would ask?
(h) If you were feeling unhappy and just wanted someone to talk to, is there someone you would go
to?
(i) If you were worried about a personal problem, is there someone you would talk to?

275
Appendix D8. 24-hour recall recording form Form 6
Participant ID………………………… Date of assessment……………….....
Date and day food was consumed ……………………………….
Time and Place
AM/PM
Description of
food and Drinks
(fresh, frozen, low-
fat, etc
Amount (weight,
volume)
Method of
preparation and
cooking (baked,
boiled, grilled,
friend, etc.)
Where did
you eat it
Would you consider your intake of foods and beverages today to be typical of most days or was it
considerably more or less yes no?
Explain why if not typical?
Please do you take any supplements? If Yes

276
Supplements:
Type/ Brand Reason for taking Amount taken Frequency

277
Appendix D9. Semi-structured questionnaire for interviews
Form 7
Qualitative in-depth interviews
The topic guide is divided into 4 sections; introduction, eating behaviours, Physical function
behaviours, social networks, and other key personal and social influences on dietary intake, eating and
physical activity behaviours.
Prior to starting the interview, the researcher will confirm that the participant agrees to an audio-
recording of the interview. Once agree, the researcher will begin recording the interview.
1. Introduction to the interview (aim = to explain the topics that will be covered during
interview and to reassure the person being interviewed)
The interviewer will confirm that:
➢ The purpose of the study is to explore their eating behaviours and social network ties, and how
these influence healthy life choices.
➢ I (interviewer) am/is a Doctoral researcher at the University of Birmingham
➢ You are free to say as much or as little as you wish in response to any line of questioning.
➢ All information gathered in the interviews will be anonymous and confidential.
➢ A brief summary of the results of the study will be available after finalising your participation
in the study.
➢
2. Eating behaviours
The main rationale of this section of the interview is to find out more about eating behaviors
(all behaviors that relate to food intake namely, grocery shopping, meal planning and
preparation, and eating) of ethnically diverse older adults living in a super-diverse city. Some
of the major areas this section seeks to explore include:
• Eating behaviors and changes over the course of the year
• Perceptions of healthy eating
• Factors that facilitate and impede the perceived healthy eating behavior practices
Interviewer: Think about the questions I just asked you concerning your food and eating habits during
the 24-hour dietary recall interview. Please reflecting back on those responses, I will like to ask you to
tell me more about your eating behaviours.

278
• Please could you describe your eating profile in a typical day? Is this how you would
regularly eat? Or was this day unusual?
Probe: For snacks, fasting, alcohol, fruits and vegetables, eating with others?
• Do you enjoy eating? Why or why not?
• Do you commonly eat with others or are you more likely to eat alone? Do you prefer
either of these more than the other?
• To what extent have your eating behaviors changed over the course of your life?
• Can you identify any major changes in your dietary behaviours since you moved to this
country? Please can you describe these changes?
• How do you think these changes have influenced your eating and food choices?
Probe: in food selection, shopping and cooking.
• What does ‘healthy eating’ mean to you?
Probe: What do you consider healthy foods to be?
• Do you think that your diet is healthy?
Probe: healthy or adequate for your needs
• How often do you change or modify your meals to make them healthier?
Probe
• Do you think living in a super-diverse city has influenced your eating habits and food choices?
If yes, in what ways?
• How would you describe the ease or difficulty of eating healthfully in this city?
• Are you responsible for your own cooking? If no, who is responsible for your cooking? Has
this changed over time?
• Are you responsible for your own shopping? If no, do you have any input into what is bought
for you to eat and drink?
• In what way, do you think the foods you eat affects your physical function
Probe: By physical function, I mean your strength and energy, ease to get out and about
• Could you describe the importance that cultural traditions and norms have on your eating habits
and food choices? If these are important, how do you manage to keep those dietary traditions
living in Birmingham? If not important, why?
• If you do still consume traditional foods, do you find it difficult to locate and purchase your
traditional foods in Birmingham?
3. Physical Function
The main rationale of this part of the interview is to explore the perceptions of participants’ physical
function and how their social networks may influence it.

279
Now, if you think about physical function (your ability to balance, stand from a chair, and walk about
easily) This is the test that we did at our first meeting.
• What does ‘physical function’ mean to you?
• Would you consider yourself as having a good degree of physical function? Why?
Probe: Explain physical function to the participant.
• Could you please tell me how physical activities fits (or do not fit) into your life?
• What are the most important factors that influence whether you are active or inactive?
• Do you feel that what you eat and how physically active you are affects your physical
functioning? If yes, could you describe how? If not, why not?
Probe: by functioning I mean your walking speed, strength and energy, ease to get out and
about.
4. Social network, personal and social influences to healthy dietary intake and physical
activity
The purpose of this section is to explore how participants perceive the influences of social
networks to making decisions with regards to healthy eating and physical function in a super-
diverse community. The section will conclude by finding out how these influences might
change with any potential changes in social network structures over the 8-month period of
follow-up.
• How would you describe your network ties with family, friends and the community? How have
these ties influenced (positively or negatively) your eating behaviors?
• I would like you to think about what it would take to help you eat healthier and to improve on
your physical function.
Probe: Do you think family/friends and community social network ties will support you in
making these decisions?
• Has any of these ties changed over time, if yes how has it changed and how does this now
impact on the way you eat?
Probe: Movement/absence/addition of family members and friends (i.e. including those that
have died)
• Do you think your living arrangements has positively or negatively influenced your eating
patterns over the past 8 or so months? Please explain how your living arrangements may have
changed, and if/how this has influence your dietary intake.
• To what extent are you willing to adopt new strategies in order to eat healthier and be more
physically active? Do you feel that one is more important than the other?
Note: Explore if they value diet more than physical activity, or vice versa, and do they feel one
is easier to achieve than the other?

280
Additional questions to be asked at Visit 3 only to explore potential changes in eating behaviours with
possible changes in social networks:
• Have your ties with family, friends and the community changed for the past 8 months?
If yes:
o Have these changes affected your eating behaviors over this period of time?
What do you think contributed to these changes?
o What helps you to manage these changes?
o How do you feel about these changes?
5. Concluding questions
• Please do you have anything to add?
• Please do you have any question to ask me?
Thank you very much for participating in this interview