
Social, Communication, and Cortical Structural Impairments in Epac2-Deficient Mice
30
Social, communication, and cortical structural impairments in Epac2-deficient mice Deepak P. Srivastava 1,7,* , Kelly A. Jones 1,* , Kevin M. Woolfrey 1,* , Jeffrey Burgdorf 4 , Theron A. Russell 1 , Abigail Kalmbach 1 , Hyerin Lee 5 , Connie Yang 5 , Mazdak M. Bradberry 5 , David Wokosin 1 , Joseph R. Moskal 4 , Manuel F. Casanova 6 , Jack Waters 1 , and Peter Penzes 1,2,3,† 1 Department of Physiology, Northwestern University Feinberg School of Medicine, Chicago, IL 60611, USA 2 Department of Psychiatry and Behavioral Sciences, Northwestern University Feinberg School of Medicine, Chicago, IL 60611, USA 3 Lurie Cancer Research Center, Northwestern University Feinberg School of Medicine, Chicago, IL 60611, USA 4 Department of Biomedical Engineering, Northwestern University, Evanston, IL 60208, USA 5 Weinberg College of Arts and Sciences, Northwestern University, Evanston, IL 60208, USA 6 Department of Psychiatry, University of Louisville, Louisville, KY, 40292, USA 7 Department of Neuroscience & Centre for the Cellular Basis of Behaviour, The James Black Centre, King’s College London, Institute of Psychiatry, London, SE5 8AF, UK Abstract Deficits in social and communication behaviors are common features of a number of neurodevelopmental disorders. However, the molecular and cellular substrates of these higher order brain functions are not well understood. Here we report that specific alterations in social and communication behaviors in mice occur as a result of loss of the EPAC2 gene, which encodes a protein kinase A-independent cyclic AMP target. Epac2-deficient mice exhibited robust deficits in social interactions and ultrasonic vocalizations, but displayed normal olfaction, working and reference memory, motor abilities, anxiety, and repetitive behaviors. Epac2-deficient mice displayed abnormal columnar organization in the anterior cingulate cortex, a region implicated in social behavior in humans, but not in somatosensory cortex. In vivo two-photon imaging revealed reduced dendritic spine motility and density on cortical neurons in Epac2-deficient mice, indicating deficits at the synaptic level. Taken together, these findings provide novel insight into the molecular and cellular substrates of social and communication behavior. Keywords Rap; small GTPase; ultrasonic vocalization; autism spectrum disorders; minicolumn; neocortex; dendritic spine; intravital two-photon imaging † Corresponding author: Peter Penzes, [email protected]. * These authors contributed equally to the manuscript. The authors declare no conflicts of interest. NIH Public Access Author Manuscript J Neurosci. Author manuscript; available in PMC 2013 February 22. Published in final edited form as: J Neurosci. 2012 August 22; 32(34): 11864–11878. doi:10.1523/JNEUROSCI.1349-12.2012. $watermark-text $watermark-text $watermark-text
-
Upload
greenvillemed-sc -
Category
Documents
-
view
0 -
download
0
Transcript of Social, Communication, and Cortical Structural Impairments in Epac2-Deficient Mice

Social, communication, and cortical structural impairments inEpac2-deficient mice
Deepak P. Srivastava1,7,*, Kelly A. Jones1,*, Kevin M. Woolfrey1,*, Jeffrey Burgdorf4, TheronA. Russell1, Abigail Kalmbach1, Hyerin Lee5, Connie Yang5, Mazdak M. Bradberry5, DavidWokosin1, Joseph R. Moskal4, Manuel F. Casanova6, Jack Waters1, and Peter Penzes1,2,3,†
1Department of Physiology, Northwestern University Feinberg School of Medicine, Chicago, IL60611, USA2Department of Psychiatry and Behavioral Sciences, Northwestern University Feinberg School ofMedicine, Chicago, IL 60611, USA3Lurie Cancer Research Center, Northwestern University Feinberg School of Medicine, Chicago,IL 60611, USA4Department of Biomedical Engineering, Northwestern University, Evanston, IL 60208, USA5Weinberg College of Arts and Sciences, Northwestern University, Evanston, IL 60208, USA6Department of Psychiatry, University of Louisville, Louisville, KY, 40292, USA7Department of Neuroscience & Centre for the Cellular Basis of Behaviour, The James BlackCentre, King’s College London, Institute of Psychiatry, London, SE5 8AF, UK
AbstractDeficits in social and communication behaviors are common features of a number ofneurodevelopmental disorders. However, the molecular and cellular substrates of these higherorder brain functions are not well understood. Here we report that specific alterations in social andcommunication behaviors in mice occur as a result of loss of the EPAC2 gene, which encodes aprotein kinase A-independent cyclic AMP target. Epac2-deficient mice exhibited robust deficits insocial interactions and ultrasonic vocalizations, but displayed normal olfaction, working andreference memory, motor abilities, anxiety, and repetitive behaviors. Epac2-deficient micedisplayed abnormal columnar organization in the anterior cingulate cortex, a region implicated insocial behavior in humans, but not in somatosensory cortex. In vivo two-photon imaging revealedreduced dendritic spine motility and density on cortical neurons in Epac2-deficient mice,indicating deficits at the synaptic level. Taken together, these findings provide novel insight intothe molecular and cellular substrates of social and communication behavior.
KeywordsRap; small GTPase; ultrasonic vocalization; autism spectrum disorders; minicolumn; neocortex;dendritic spine; intravital two-photon imaging
†Corresponding author: Peter Penzes, [email protected].*These authors contributed equally to the manuscript.
The authors declare no conflicts of interest.
NIH Public AccessAuthor ManuscriptJ Neurosci. Author manuscript; available in PMC 2013 February 22.
Published in final edited form as:J Neurosci. 2012 August 22; 32(34): 11864–11878. doi:10.1523/JNEUROSCI.1349-12.2012.
$waterm
ark-text$w
atermark-text
$waterm
ark-text

INTRODUCTIONThe ubiquitous second messenger molecule cyclic adenosine monophosphate (cAMP) is animportant member of many signaling cascades in the central nervous system. cAMPsignaling has been shown to be crucial for many neuronal processes and modulates a broadrange of cognitive functions (Silva et al., 1999). Conversely, abnormal cAMP signaling hasbeen implicated in a range of neurodevelopmental and psychiatric disorders (Nestler et al.,2002; Kelley et al., 2008). cAMP signaling occurs via two main downstream pathways; oneis protein kinase A (PKA)-dependent and the other PKA-independent. PKA-independentcAMP targets are comprised of Epac (exchange protein directly activated by cAMP)proteins and cyclic-nucleotide-gated channels. While much attention has focused on the roleof the PKA-dependent pathway in vivo, relatively little is known about the roles of PKA-independent mechanisms in the brain.
The Epac proteins, Epac1 and Epac2 (also known as cAMP-GEFI and II, or RapGEF3 or 4),are guanine-nucleotide exchange factors (GEF) for the small GTPase Rap. Epac2 is highlyenriched postnatal cortex while Epac1 has much lower expression in cortex (Kawasaki et al.,1998). Epac2 is far more abundant than Epac1 in cortical neurons (Woolfrey et al., 2009), isthe major Epac protein beyond early developmental stages (Ulucan et al., 2007), and thusmight play a more prominent role in regulating cortical function. Epac2 bi-directionallyregulates dendritic spine shrinkage and motility in vitro (Woolfrey et al., 2009), and raremissense mutations found in individuals with autism (Bacchelli et al., 2003) affected Epac2Rap-GEF activity, synaptic protein distribution and spine morphology (Woolfrey et al.,2009). In addition, Epac2 is required for D1/D5 dopamine receptor-induced dendritic spinemorphogenesis and glutamate receptor trafficking. The postsynaptic adhesion proteinneuroligin-3 (NL3) forms a complex with Epac2, but not Epac1, and enhances its Rap-GEFactivity (Woolfrey et al., 2009). Interestingly, both dopamine and NL3 signaling have beenimplicated in disorders involving disrupted social and communication behaviors (Jamain etal., 2003; Hettinger et al., 2008). Previous studies utilizing the Epac-specific cAMP analog8-(4-chloro-phenylthio)-2′-O-methyladenosine-3′,5′-cyclic monophosphate (8-CPT) havefound that Epac activation can modulate synaptic plasticity (Gelinas et al., 2008) as well asmemory retrieval in mice (Kelly et al., 2009). Recent work has also shown that EPAC1/EPAC2 double null mice on a 129sv background exhibit deficits in spatial referencememory and social interactions (Yang et al., 2012b). However, the specific role of Epac2 incomplex behaviors remains unclear.
Because Epac2 is the major Epac form expressed in the cortex and modulates corticalneuron structure and function in vitro, we hypothesized that its loss may affect corticalphenotypes and complex behaviors. Using an Epac2 null mouse generated on a C57BL/6background (Shibasaki et al., 2007), we found unexpected roles for Epac2 in specificallyregulating social interactions, ultrasonic vocalizations, and cortical columnar organization ina brain region relevant for social behavior, in addition to regulating dendritic spine motilityin vivo. Our data not only provide novel insight into PKA-independent cAMP andneuroligin signaling in the cortex, but also identify molecular and cellular substrates ofsocial and communication behavior.
METHODSReagents
8-CPT was purchased from Tocris Bioscience (R&D Systems, Minneapolis, MN). Thefollowing antibodies were purchased: rabbit anti-HA polyclonal (Enzo Life Sciences,Farmingdale, NY), rabbit anti-Epac2 polyclonal and mouse anti-Epac2 monoclonal (CellSignaling Technology, Danvers, MA), rabbit anti-p-BRaf polyclonal (Abcam, Cambridge,
Srivastava et al. Page 2
J Neurosci. Author manuscript; available in PMC 2013 February 22.
$waterm
ark-text$w
atermark-text
$waterm
ark-text

MA), mouse anti-Epac1 monoclonal (Cell Signaling), rabbit anti-Rap polyclonal antibody(Millipore, Billerica, MA), mouse anti-β-actin monoclonal (Sigma), rabbit anti-neuroligin-3polyclonal (Santa Cruz Biotechnology, Santa Cruz, CA), rabbit anti-neuroligin-1 polyclonal(Santa Cruz), mouse anti-GluA2 monoclonal (Millipore), rabbit anti-VGAT polyclonal(Millipore), mouse anti-VGluT1 monoclonal (Millipore), rabbit anti-kalirin polyclonal(Millipore), mouse anti-PSD-95 monoclonal clone K28/43 (UC Davis/NIH NeuromabFacility, Davis, CA). The HA-Epac2-WT construct was a kind gift from Lawrence Quilliam(Indiana University).
Neuronal cultures and quantitative immunofluorescenceDissociated cultures of primary cortical neurons were prepared from P0-P1 mouse pupsfrom either EPAC2+/+ x EPAC2+/+ or EPAC2−/− x EPAC2−/− crosses, in a manner similar toembryonic rat cortical cultures described previously (Woolfrey et al., 2009). On DIV 21–23,neurons were transiently transfected for 4 hr with plasmid (1–3 μg DNA) usingLipofectamine 2000 (Invitrogen). Endogenous Epac2 was activated by incubating neuronsfor 1 hr at 37°C with 50 μM 8-CPT (Tocris) in artificial cerebrospinal fluid and then fixedimmediately, immunostained, and imaged by confocal microscopy as described previously(Woolfrey et al., 2009; Srivastava et al., 2011). Cultures that were directly compared werestained simultaneously and imaged with the same acquisition parameters. Experiments werecarried out blind to condition.
Cortical Tissue Preparation, Rap activation assay, and Western BlottingActivation of endogenous Rap1 in mouse cortical tissue was measured using the GST-Ral-GDS affinity resin (Millipore) as previously described (Woolfrey et al., 2009). Corticaltissue from 8-week-old male mice was dissected after euthanization, and homogenized using10 strokes of a Teflon-coated homogenizer, followed by sonication, in either Rap1Activation Lysis Buffer magnesium lysis buffer or RIPA buffer. Lysates were analyzedusing SDS-PAGE and Western blotting. Intensities of bands were quantified bydensitometry using ImageJ (http://imagej.nih.gov/ij/).
Behavioral tasksMutant mice lacking the EPAC2 gene (EPAC2 null mice) were generated by ProfessorSusumu Seino (Shibasaki et al., 2007). For each behavioral test, 5–14 animals (male) pergenotypes were assessed. Mice were 8–10 weeks of age at the start of testing.
Morris Water Maze—The Morris water maze procedures were described previously(Cahill et al., 2009). Briefly, the maze consisted of a pool 1.2 m in diameter filled withopaque water (maintained at 21°C), and was surrounded by spatial cues. Prior to testing, allanimals underwent training with a visible platform (2 days of training, 4 trials per day). Atrial-independent Morris water maze task was used to assess spatial reference memory.Animals were trained with a fixed platform location over a 5-day period with 6 trials perday, and path length to platform was measured with a video tracking system. Two hoursafter the final trial on the last testing day, a probe trial was conducted in which the platformwas removed, and the percentage of time animals seek the proper pool quadrant wasdetermined. To test learning flexibility, reversal learning was measured. Following the fifthday of training, the platform was moved to a different quadrant, and 6 trials per day for 2days were conducted with the platform in the new location. Impaired reversal learning isindicated by consistently higher path errors over reversal learning days. Path length errorover days and over trials were analyzed using a 3 (genotype) × 5 (day) or 3 (genotype) × 6(trial) mixed model ANOVA. Reversal learning was analyzed using a 3 (genotype) × 2 (day)mixed model ANOVA. Path length to visible platform, percent time floating, average swim
Srivastava et al. Page 3
J Neurosci. Author manuscript; available in PMC 2013 February 22.
$waterm
ark-text$w
atermark-text
$waterm
ark-text

speed, and probe trial data were analyzed using one-way ANOVA with Tukey post hoctests.
Social Approach—A social approach apparatus was used to quantify the tendency of anexperimental mouse to engage in social interaction with a novel mouse. The behavioraltesting apparatus was a glass rectangular box (76.2 cm long × 30.5 cm wide × 30.5 cm tall).A mesh cylinder (11.4 cm diameter) was placed at each end of the chamber. The meshcylinder allowed for air exchange and for animal auditory, visual, and olfactory interaction,but prevented fighting. For each animal, the assay consisted of a 5 min habituation phase, inwhich two empty mesh cylinders were present, a 5 min rest phase in a neutral cage, and a 5min testing phase in which a stimulus mouse was placed in one of the mesh cylinders (Fig.1C). The end of the arena containing the enclosed stimulus mouse was designated the socialside, and was alternated for each test mouse. All stimulus mice were 8-week-old wild-typemice, and a different stimulus mouse was used for each test mouse. Animal position waslogged via automated video tracking (LimeLight software, Actimetrics, Evanston, IL).During analysis, the arena was divided into three zones: social, non-social and intermediate.Time spent on each side during each phase of the test, and time spent in close proximity(within 5 cm) of the stimulus mouse during the test phase, was recorded for each mouse.
Ultrasonic Vocalizations—Using an established protocol (Wang et al., 2008),EPAC2+/+, EPAC2+/−, and EPAC2−/− males were paired with wild-type females in a neutralhome cage for five minutes. Both video and audio recordings of the sessions were made.From the video, mean interaction time was quantified. Testing took place in autoclavedrectangular polyethylene cages measuring 29×18×12.5 cm with standard bedding, coveredby a metal wire lid. Males and females were then introduced into this “neutral” cage andallowed to freely interact for five minutes. USVs were recorded from the high frequencyoutput of a Pettersson D980 bat detector and condenser microphone (Pettersson ElektronikAB, Sweden) by a Fostex FR2 field recorder (Boonton, NJ). Sonograms were producedusing SAS Lab Pro (Avisoft Bioacoustics, Germany). Discrete USVs were identified andcounted by an experienced blinded experimenter. Frequency-modulated USVs were definedas having a bandwidth greater than 5 kHz. Behavior was recorded using a video camera(Sony, Japan), and total length of contact was quantified by an experienced observed blindto condition. Social contact during the USV paradigm was defined as paw, nose, or bodycontact with the female mouse. Nine to 12 animals per genotype were analyzed.
Olfactory habituation/dishabituation—The ability of Epac2-deficient mice to smelland distinguish between different odors was tested using an olfactory habituation/dishabituation test (Yang et al., 2012a). Each test mouse was placed in a clean standardhousing cage with bedding, and was allowed to acclimate for 45 minutes. A clean, drycotton-tipped applicator was inserted through a hole in the lid during the acclimation period.After acclimation, odors were presented on cotton-tipped applicators inserted through thecage lid in 3 consecutive 2-min trials each, with 1-min inter-trial intervals. The odorpresentation order used was 3 x water, 3 x almond, 3 x strawberry, 3 x unfamiliar socialcage A, 3 x unfamiliar social cage B. Almond and strawberry extracts (Frontier NaturalProducts Co-op) were diluted 1:100 in distilled water. Unfamiliar social cage odors weregenerated by swiping the bottom of dirty cages containing mice that have never beenexposed to the test mice. Time spent sniffing the cotton-tipped applicator, indicated by themouse’s head being oriented toward the applicator and the nose within 2 cm, werequantified for each trial of each odor.
Digigait—Locomotion was analyzed using digital gait analysis system (Digigait, MouseSpecifics Inc., Boston, MA). Animals are placed on a transparent treadmill and filmed with
Srivastava et al. Page 4
J Neurosci. Author manuscript; available in PMC 2013 February 22.
$waterm
ark-text$w
atermark-text
$waterm
ark-text

a high-speed camera during locomotion. Software then isolated the animals’ paws from thevideo images and allowed quantification of stride frequency and length at belt speeds of24cm/s and 34 cm/s. 4 animals per genotype were tested.
Open field maze—Mice were placed in the center of an open field (56 × 56 cm), andambulation activity was collected by the LimeLight software (Actimetrics, Evanston, IL) forfive minutes. The software provides the total distance traveled as well as the percentage oftime/distance within different parts of the open field by dividing the open field into a 5 × 5grid of squares and defining outer, middle and inner regions. The mean percentage of timespent in each region for each genotype, normalized to the area of the zone, was calculated.
Zero maze—The zero maze (Cook et al., 2002) consisted of a round track (56 cmdiameter) divided into four sections of equal area by two sets of walls along the track,separated by 180 degrees around the track. Mice were placed on the track in the center of theopen area and were examined for a preference for the closed or open arms during a 5-minutesession using LimeLight software (Actimetrics, Evanston, IL). Mean time spent in theclosed quadrants was compared among genotypes.
Y-maze—Y-maze spontaneous alternations task was performed in a similar manner asdescribed previously (Cahill et al., 2009). Briefly, mice were placed in the Y-maze andallowed to enter any of the three arms for 5 min while being recorded by a video trackingsystem and LimeLight software. The order of arm entries was recorded and analyzed forspontaneous alternation. An alternation was scored for each set of three consecutive choiceswhere no repeated entries occur. The number of successive 3-arm alternations was dividedby the maximum number of arm entries within 5 min to yield the percentage of spontaneousalternations. Chance level of alternation is 50%. This task requires working memory, asanimals must maintain and update a mental log of recent arm entries.
Nissl StainingBehaviorally naïve mice were anesthetized with a ketamine/xylazine mixture and perfusedtranscardially with PBS followed by 4% paraformaldehyde in PBS. Brains were removed,postfixed overnight in 4% paraformadehyde/PBS, and cryoprotected in 30% sucrose/PBS.Brains were then cryosectioned at 50 μm and mounted on slides. Slides were passed througha graded series of ethanol solutions before being stained with a solution containing 0.625%cresyl violet acetate and 0.375% acetic acid. Slides were then dehydrated and mounted withPermount (Fisher Scientific).
Cortical column analysisCortical minicolumns were quantified using semiautomatic image analysis (Buxhoeveden etal., 2000). The anterior cingulate cortex (ACC) of 2 Nissl-stained sections (corresponding tobregma 1.70 and 1.94 mm), on either side of the midline, and the somatosensory cortex(corresponding to bregma −1.28 and −1.64 mm) were imaged with a 10x objective (N.A.0.17, lateral resolution 0.633 μm/pixel). Z-stacks of layers 1–3 of each section wereobtained using a Zeiss MRm CCD camera on a Zeiss LSM5 Pascal confocal microscope,and collapsed using the “Best Focus” stack arithmetic function in MetaMorph (MolecularDevices, Sunnyvale, CA). Analysis was performed remotely using ImageJ, with theexperimenter blind to conditions. Images of layer 2/3 from both brain regions were firstthresholded to separate neurons from background. Because of possible variations in staining,images were thresholded automatically on a per-image basis. Images were then made intobinary images; subsequently a Watershed algorithm was used to define cell borders. Thedensity of cells and the mean soma size within layer 2/3 of each image was quantified for
Srivastava et al. Page 5
J Neurosci. Author manuscript; available in PMC 2013 February 22.
$waterm
ark-text$w
atermark-text
$waterm
ark-text

each genotype. Both hemispheres from 2 sections for both the ACC and the somatosensorycortex were analyzed from 5–6 mice per genotype.
Minicolumn regions of interest (ROIs) were defined as having a width of 60 μm, twice thesize of minicolumns previous reported (Di Rosa et al., 2008). The density of cells withincolumn regions was automatically counted: only cells with an area of 100–350 μm2, andthose that did not touch the edges of the defined column, were included in quantification. Upto 10 ROIs per section, placed at regular, non-overlapping intervals across the image oflayer 2/3, were used, and the mean number of cells per column and cell spacing (defined asthe total area of somas divided by the total area of the defined column) were calculated foreach column. To calculate total path length ratio (TPLR), the total path length was firstdetermined by measuring the sum of Euclidean distances between consecutive cells within acolumn. The total path length was then divided by the linear depth of the column, such thatTPLR of a hypothetical column where all cells lie along a central line would be equal to 1.0,while TPLR of real columns is greater than 1.0 (Buxhoeveden et al., 2000).
A number of assumptions were made in our calculations. Firstly, our method requires avertical orientation of minicolumns. Due to the curvilinear nature of the cortex, it is likelythat minicolumns are not linear within our sections, and may even move between z-planes.Therefore, it is possible that our calculations are an underestimate of cell density withinminicolumns. Secondly, to restrict measurements to only include pyramidal neurons, onlysomas with an area of 100–350 μm2 were analyzed. This allowed for the filtering of non-pyramidal cells (glia and interneurons), and the removal of multiple cells too close togetherfor the Watershed algorithm to distinguish as separate cells. Finally, as minicolumns aredefined as a dense core of cell bodies, it is assumed that a decrease in the average number ofcells within these columns represents a disorganization of columns. Using this approach, it isnot possible to measure a number of other columnar parameters, such as the width ofcolumns and the neuropil space. However, it is possible to measure cell spacing (defined asthe total area of somas divided by the total area of the defined column).
In utero electroporationC57BL6 female mouse were checked for vaginal plugs (E0) and electroporation wasperformed at E14.5, as previously described (Srivastava et al., 2012). Briefly, after sedation,both uterine horns were removed and placed on sterile, warm and PBS-wetted pads. DNAsolution (either Epac2-shRNA or pGsuper as an empty vector control) was loaded intobeveled glass micropipettes and injected into the lateral ventricle through the uterus wallusing a nanojector (Drummond Nanoject II). 0.05% FastBlue was added to visualize DNA.DNA was electroporated into the neural precursor populations that reside on the ventricularzone by directed electroporation, by placing the (+) end of the electrode toward thedeveloping neocortex. Unipolar electric pulse of 40V was generated (BTX ECM830), and atotal of five 50 ms pulses at an interval of 100 ms were applied to the cerebral wall. Afterelectroporation, embryos were placed back into the abdominal cavity. At P0-P1, pups weresacrificed and their brains were removed and fixed overnight in 4% paraformaldehyde/4%sucrose in PBS. Fixed brains were embedded in agar and coronal sections at a thickness of50 μm were made and placed under coverslips. Electroporated sections were imaged using a10x objective (NA=0.17) and a Zeiss LSM5 Pascal confocal microscope. The efficiency ofthe Epac2-shRNA has been previously reported in vitro and in vivo (Woolfrey et al., 2009;Srivastava et al., 2012).
Surgical preparation for in vivo imagingEPAC2+/+,+/−,−/− mice (C57BL/6) expressing GFP under the control of the thy1 promoter ina subset of cortical layer 5 neurons were used (Tg(Thy1-GFPM)2Jrs/J transgenic line
Srivastava et al. Page 6
J Neurosci. Author manuscript; available in PMC 2013 February 22.
$waterm
ark-text$w
atermark-text
$waterm
ark-text

(Jackson Labs)). Animals were 4 weeks old (P28) at time of imaging. Mice wereanesthetized using 1.5% isoflurane, and a body temperature of 37°C maintained throughoutthe experiment. The skull was exposed, and M2 association cortex (frontal associationcortex) was identified according to stereotaxic coordinates (+2.8 mm bregma, +1 mmmidline). A skull plate was then fastened to the skull using dental acrylic, and was thenattached to metal base that connected directly to the microscope stage for imaging. The skullover the frontal cortex was thinned by using a high-speed dental drill (Osada) and thenremoved with forceps to create a small (2 × 2 mm) craniotomy. The skull was periodicallybathed in saline to keep brain from dehydrating during the procedure. Neurons could beimaged up to 5 hours postsurgery. The craniotomy was filled with 1.5% agar and sealed witha No. 0 coverslip to ensure stability during imaging. During imaging, anesthesia wasmaintained by a continuous supply of 1.5% isoflurane.
Two-photon imagingA custom-built two-photon laser scanning microscope and image acquisition software wasused for in vivo imaging (Jack Waters, Northwestern University). The microscope is basedon an optical rail, and consisted of a coherent laser (Ti;saphire laser) at a wavelength of 950nm. Fluorescence z-stack images were collected by photomultiplier tubes positioned in theepi-fluorescence beam path. The craniotomy over the frontal cortex was initially detectedunder low magnification (4X air lens; Zeiss), and areas with superficial dendrites wereidentified using a 40X water immersion lens (N.A. 0.8; Zeiss) by two-photon microscopy.The 40X lens with a digital zoom of X4, was used to collect images of dendritic spines.Only dendritic spines on dendrites 15–40 μm from the pia surface were imaged, to minimizeoptical aberrations in the z-plane. Z stacks (25–50 planes), at a pixel resolution of 400×400,were taken at 1 μm intervals every 5 minutes for 30 minutes. Two to 5 neurons per animal,and 3–4 animals per genotype, were imaged.
Analysis of dendritic spine motility in vivoImages were imported to ImageJ (http://rsbweb.nih.gov/ij/), aligned using the StackRegplugin, and each z-stack was collapsed as a 2D maximum projection image. Each time pointwas arranged as a stack of 2D images (each image equal a single time point), and spineswere then analyzed at each time point; movements of spines in the z dimension were notanalyzed. Spine motility was defined as the average change in length per unit time (μm/min). Dendritic spine length (base to tip) was measured for each spine at each time point inImageJ, and the absolute difference between each time point was calculated, and averagedfor each dendrite analyzed giving a motility index (μm/min). Only spines that were clearlyvisible were analyzed. No obvious rotational drift was seen.
Statistical AnalysisFor quantitative immunofluorescence, quantitative Western blotting, spine morphology, andcortical column analysis, differences among condition means were identified by Student’sunpaired t tests or one-way ANOVAs performed in GraphPad Prism and SPSS. Tukey orBonferroni post hoc analysis was used for multiple comparisons. For the social approachtask, olfactory behavior, Morris water maze, and open field measurements, mixed modelANOVAs were performed as indicated. For all other behavioral tasks, one-way ANOVAwith Tukey post hoc tests were used, unless otherwise stated. Data are represented as meansand SEM. Values of p < 0.05 were considered significant.
Srivastava et al. Page 7
J Neurosci. Author manuscript; available in PMC 2013 February 22.
$waterm
ark-text$w
atermark-text
$waterm
ark-text

RESULTSSpecific deficits in social and communication behaviors in Epac2-deficient mice
A general characterization of the EPAC2−/− mouse line used herein has been performedpreviously (Shibasaki et al., 2007); hence here we investigated only neurologicalphenotypes. EPAC2−/− mice were similar to wild-type (EPAC2+/+) in appearance and didnot display qualitatively abnormal gross morphology (Fig. 1A). We established EPAC2+/− XEPAC2+/− crosses to generate littermates of EPAC2+/+, EPAC2+/−, and EPAC2−/−
genotypes. These crosses were viable, bred normally, and exhibited normal Mendelian ratiosat weaning. Because Epac2 has been implicated in insulin secretion (Shibasaki et al., 2007),we examined body weight in Epac2-deficient mice. The trajectories of body weight ofEpac2-deficient mice (EPAC2+/− and EPAC2−/−) at 7–21 weeks of age was not significantlydifferent compared to EPAC2+/+ littermates (n = 4–9 mice; mixed model (genotype x age)ANOVA; genotype: F(2, 20) = 0.285, p = 0.755; age: F(6, 20) = 16.947, p < 0.0001;interaction: F(12, 20) = 1.484, p = 0.2100; Fig. 1B). Epac2 expression is low during earlypostnatal development and high after 3–4 weeks postnatal (Ulucan et al., 2007); thus, weperformed all behavioral experiments in 8-week-old littermate mice.
Because Epac2 is a downstream target of dopamine receptors and NL3, both of which havebeen implicated in social behaviors and communication (Burgdorf et al., 2007; Wang et al.,2008; Muller et al., 2009; Radyushkin et al., 2009), we hypothesized that Epac2 might alsobe involved in these behaviors. To determine whether Epac2-deficient mice displayedimpaired sociability, we measured the tendency of a subject mouse to approach anotherunfamiliar mouse and engage in social investigation in a modified social approach paradigm(Cahill et al., 2009; Silverman et al., 2010) (Fig. 1C). Following 5 minutes of habituation ofthe “test” mouse to the social approach arena, a “stimulus” wild-type (age-matched) mousewas placed within a wire chamber on one side of the social approach arena, and the amountof time the test mouse spent investigating the stimulus mouse was recorded during thissocial phase. As expected, wild-type mice spent more time within the social side during thesocial phase compared to the habituation phase. On the contrary, Epac2-deficient mice didnot spend more time within the social side during the social period compared to thehabituation period (social investigation, habit. vs. social (sec): EPAC2+/+, 87.1±7.6 vs.172.3±12.6; EPAC2+/−, 98.8±10.6 vs. 114.9±9.0; EPAC2−/−, 105.9±8.5 vs. 111.8±7.2;mixed model (genotype x test phase) ANOVA: genotype: F(2, 78) = 3.868, p = 0.025; testphase: F(1, 78) = 22.26, p < 0.0001; interaction: F(2, 78) = 10.78, p < 0.0001; Fig. 1D). Nopreference was seen in the amount of time spent in the non-social side between thehabituation and social periods for any of the genotypes. Measurement of the amount of timeeach animal spent in close interaction during the social phase revealed that wild-type micespent more time investigating the stimulus mouse compared to Epac2-deficient mice (socialinvestigation during social phase (sec): EPAC2+/+, 163.3±10.4; EPAC2+/−, 108.7±9.0;EPAC2−/−, 99.8±11.5; One-way ANOVA with Tukey post test; F(2, 39) = 11.01, p =0.0002; Fig. 1E). These data suggest that Epac2-deficient mice display impaired sociabilityrelative to wild-type mice.
Adult male mice emit ultrasonic vocalizations (USVs; 50–80 Hz) as a means forcommunication during social interactions and in courtship (Burgdorf et al., 2007; Fischer etal., 2011). Because the dopaminergic system and NL3 have been previously implicated inthe regulation of USVs (Burgdorf et al., 2007; Wang et al., 2008; Radyushkin et al., 2009;Fischer et al., 2011), we tested whether Epac2-deficient mice displayed altered USVs. Wepaired wild-type or Epac2-deficent mice, aged 8–12 weeks old, with age-matched wild-typefemales in a neutral home cage for five minutes, and recorded USVs emitted by the maleand social interactions between the male and female (Holy et al., 2005; Burgdorf et al.,2007). In agreement with our social approach data, Epac2-deficient male mice exhibited
Srivastava et al. Page 8
J Neurosci. Author manuscript; available in PMC 2013 February 22.
$waterm
ark-text$w
atermark-text
$waterm
ark-text
reduced social interactions with females relative to wild-type during the 5-minute USVrecording session (mean social contact time (sec)/5 min: EPAC2+/+, 172.2±7.9; EPAC2+/−,126.9±9.2; EPAC2−/−, 118.64±9.1; one-way ANOVA with Tukey post test; F(2, 29) =11.58; p < 0.01, 0.001; Fig. 1F). Furthermore, Epac2-deficient mice emitted significantlyfewer calls over a 5 minute session (Mean Ultrasonic Vocalizations/5 min: EPAC2+/+
204.6±14.1; EPAC2+/− 80.7±11.2; EPAC2−/− 75±8.8; one-way ANOVA with Tukey posttest; F(2, 29) = 39.33; p < 0.0001; Fig. 1G). In this paradigm, male mice typically producebouts of frequency-modulated USVs (Holy et al., 2005; Wang et al., 2008); therefore, wealso assessed the complexity of emitted calls. As expected, wild-type mice emitted complex,frequency-modulated calls. Conversely, calls emitted by Epac2-deficient mice were greatlysimplified (percentage frequency-modulated USVs: EPAC2+/+, 18.8±8.8; EPAC2+/−,1.1±0.4; EPAC2−/−, 1.7±0.5; Kruskal-Wallis test with Dunn’s multiple comparison test;Kruskal-Wallis statistic = 12.52; p = 0.0019; Fig. 1H), suggesting that not only were Epac2-deficient mice emitting fewer calls, but that the structure and complexity of these calls wereabnormal compared to wild-type mice.
Impairments in sociability could arise due to disabilities in detecting social olfactory cues.As Epac2 is expressed in the olfactory bulb, we tested EPAC2-deficient mice in a olfactoryhabituation/dishabituation task (Yang et al., 2012a). All genotypes exhibited similar abilitiesto detect and differentiate non-social and social odors (Fig. 1I). Two-way repeated measuresANOVA reveals a significant main effect of odor on sniff time, but no effect of genotype onsniff time (mixed model (genotype x odor) ANOVA; odor: F(14, 224) = 13.9, p < 0.0001;genotype: F(2, 224) = 1.007, p = 0.3896; interaction: F(28, 224) = 0.8157, p = 0.7337). Allthree genotypes exhibited dishabituation to the first exposure of social A compared to thethird exposure of strawberry, and EPAC2+/+ and EPAC2−/− mice exhibited significanthabituation to social A by the third exposure (p < 0.05; Bonferroni post test after mixedmodel ANOVA; Fig. 1I). These data suggest that loss of Epac2 does not disrupt thedetection of novel social odor cues and habituation to repeated exposures to the same socialodor.
Collectively, these data demonstrate that loss of Epac2 results in abnormal social interaction,assessed by social approach and male-female interactions, and that Epac2-deficient miceemit fewer and less complex USVs when paired with age-matched female mice, similar tothe effects observed in NL3 knockout mice (Radyushkin et al., 2009). Furthermore,impaired olfactory detection of novel social cues is not likely to contribute to altered socialbehaviors in Epac2-deficient mice.
Normal performance in spatial memory and anxiety tasks in Epac2-deficient miceBecause both cAMP and Rap signaling have been implicated in spatial learning and workingmemory (Morozov et al., 2003), and because Epac2 modulates spine morphology andsynaptic function (Woolfrey et al., 2009), we hypothesized that cognitive functions,including spatial working and reference memory, might be altered in Epac2-deficient mice.To test whether loss of Epac2 affected spatial reference learning and memory, we employedthe Morris water maze (Cahill et al., 2009). During initial training, there were no differencesacross genotypes in path error to the visible platform, percentage time floating, or swimspeed during the visible platform trials. Utilizing a trial-independent Morris water maze task(Cahill et al., 2009), we measured the ability of animals to find a hidden platform,represented as path error to locate the platform over 5 days of training with 6 trials per day.We found that while day had a significant effect on path error, there was no effect ofgenotype on path error across testing days (mixed model (genotype x day) ANOVA; day:F(4, 48) = 9.455; p < 0.0001; genotype: F(2, 48) = 1.282, p = 0.3130; Fig. 2A). During aprobe trial (platform removed from water maze) on the final day of testing, Epac2-deficientmice spent a similar amount of time in the target quadrant as wild-type mice (one-way
Srivastava et al. Page 9
J Neurosci. Author manuscript; available in PMC 2013 February 22.
$waterm
ark-text$w
atermark-text
$waterm
ark-text

ANOVA with Tukey post test; F(2, 10) = 1.047, p = 0.3864; Fig. 2B). To assess behavioralflexibility, we performed a reversal learning task using the Morris water maze: following thefifth day of training we moved the platform to a new quadrant, and calculated the path errorto locate the newly positioned platform over 2 additional days of training (6 trials per day).While day had a significant effect on time spent in target quadrant, there was no effect ofgenotype (mixed model (genotype x day) ANOVA; day: F(1, 12) = 6.867; p = 0.0224;genotype: F(2, 12) = 1.558; p = 0.2504; Fig. 2C). These data indicated that reversal learninghas occurred, and that all genotypes were able to learn a new target location to a similardegree.
We next assessed working memory using an arm recognition task in the Y-maze.Assessment of spontaneous alternation behavior revealed no difference across genotype(one-way ANOVA with Tukey post test; F(2, 25) = 0.3219, p = 0.7277; Fig. 2D), and allanimals entered a similar number of arms during the course of testing (one-way ANOVAwith Tukey post test; F(2, 25) = 2.623, p = 0.0924; Fig. 2E). Finally, to assess anxiety levelsin Epac2-deficient mice, we tested all genotypes in an elevated zero maze. Epac2-deficientmice spent a similar amount of time within the closed quadrants as wild-type mice (one-wayANOVA with Tukey post test; F(2, 12) = 1.595, p = 0.2430; Fig. 2F), and did not differ inthe total distanced traveled (one-way ANOVA with Tukey post test; F(2, 12) = 0.3105, p =0.7388; Fig. 2G). Taken together, these data demonstrated that Epac2-deficient mice hadnormal spatial reference learning and memory, had intact spatial working memory, anddisplayed normal levels of anxiety-related behaviors, suggesting that altered cognition orelevated anxiety is not likely to contribute to the observed alterations in social approach andUSVs.
Unaltered locomotor activity and repetitive behaviors in Epac2-deficient miceBecause Epac2 is highly expressed in the motor cortex, cerebellum, and striatum, weassessed motor function in Epac2-deficient mice. We tested wild-type and Epac2-deficientmice in an open field test, a combined test for general locomotor activity, exploratorybehavior, and anxiety. Epac2-deficient mice did not differ significantly from wild-type micein distance traveled in a 5 minute open field task (one way ANOVA with Tukey post test;F(2, 12) = 0.5271, p = 0.6034; Fig. 3A). Epac2-deficient mice also displayed similar levelsof thigmotaxis over a period of 5 minutes in the open field, with no differences acrossgenotypes in the time spent within the outer, middle, or inner regions of the open field(mixed model (zone x genotype) ANOVA; zone: F(2, 36) = 40.22, p < 0.0001; genotype:F(2, 36) = 0.5666, p =0.5724; Fig. 3B), suggesting that Epac2-deficient mice had intactexploratory behavior. Analysis of gait using an automated treadmill test (Digigait, MouseSpecifics Inc., Boston, MA) revealed that Epac2-deficient mice displayed normal stridefrequency and stride length (mixed model (genotype x paw) ANOVA; genotype: p > 0.05;Fig. 3C–D). Because previous studies have reported disruptions in cAMP and Rap1signaling in patients with obsessive-compulsive disorder (Tardito et al., 2001), wehypothesized that Epac2-deficient mice might display repetitive behaviors. We measured thenumber of grooming, wall leaning, and sitting events within a 5 minute period in an openfield (Silverman et al., 2010). However, we did not detect difference across genotypes inthese parameters (one-way ANOVA; grooming: F(2, 11) = 0.1011, p = 0.9046; wallleanings: F(2, 11) = 0.3770, p = 0.6944; sittings: F(2, 11) = 1.136, p = 0.3561; Fig. 3E–G).Collectively, these data suggest that Epac2-deficient mice have normal gait, locomotor andexploratory activity, and do not display repetitive behaviors, highlighting the specificity oftheir deficits in social and communication behaviors.
Srivastava et al. Page 10
J Neurosci. Author manuscript; available in PMC 2013 February 22.
$waterm
ark-text$w
atermark-text
$waterm
ark-text

Region-specific alterations in cortical organization in Epac2-deficient miceSpecific cortical regions, such as the frontal cortex in general and the anterior cingulatecortex (ACC) in particular, are thought to play an important role in social behavior and inthe control of vocalization in mammals (Rushworth et al., 2007; Jurgens, 2009; Fischer etal., 2011). It has been hypothesized that neurons organized into columns form the functionalworking unit within this area (Casanova et al., 2009; Rakic, 2009). We thus reasoned thatthe specific impairments in social and communication behaviors seen in Epac2-deficientmice may be associated with disruptions of cellular organization of the ACC. To examinethe cytoarchitecture of Epac2-deficient mice, we performed Nissl (cresyl violet) staining ofcoronal brain slices taken from age-matched EPAC2+/+, EPAC2+/−, or EPAC2−/−
littermates, and analyzed columnar organization in the ACC in these mice, as well as in thesomatosensory cortex as an internal control (Fig. 4A). We first examined gross anatomicalstructures in brains of these mice. Overall brain weight was similar across genotypes (one-way ANOVA with Tukey post test; F(2, 18) = 1.753, p = 0.2016; Fig. 4B), and nodifferences in the thickness of the ACC, somatosensory cortex, or hippocampus wereobserved between EPAC2+/+ and EPAC2−/− mice (Student’s t tests; p > 0.05; Fig. 4C–D).Based on previously established methodology (Buxhoeveden et al., 2000), we first assessedthe number of cells within a defined column in layer 2/3, a layer where columnarorganization is readily evident (Casanova et al., 2009; Oblak et al., 2011). Our workinghypothesis was that disruption of columnar organization would be represented by alterednumber of cells within these defined columns (see Methods for an expanded explanation ofmethodology). There were no differences in overall cell number or soma size within layer2/3 of the ACC or somatosensory cortex in EPAC2+/+, EPAC2+/−, or EPAC2−/− mice (one-way ANOVA; ACC: cells/mm2, F(2, 37) = 1.223, p = 0.3060; avg. soma size: F(2, 37) =1.189, p = 0.3158; somatosensory: cells/mm2, F(2, 34) = 0.9111, p = 0.4117; avg. soma size:F(2, 34) = 2.924, p = 0.0673; Fig. 4E–G). Subsequent examination of the number of cellswithin a defined column in layer 2/3 (see methods for an expanded explanation of analysisand assumptions made) revealed that EPAC2+/− and EPAC2−/− mice exhibited fewer cellswithin columns compared to EPAC2+/+ mice in the ACC (one-way ANOVA with Tukeypost test; F(2, 37) = 17.47, p < 0.0001; Fig. 5A–B). In addition, EPAC2+/− and EPAC2−/−
mice had significantly increased cell spacing within cell columns compared to EPAC2+/+
mice within the ACC (one-way ANOVA with Tukey post test; F(2, 37) = 14.33, p < 0.0001;Fig. 5C). Surprisingly, this result was specific to the ACC, as we found no difference in cellnumbers per column or spacing within columns in the somatosensory cortex (one-wayANOVA; cells per column: F(2, 31) = 0.3906, p = 0.6799; cell spacing: F(2, 32) = 0.2594, p= 0.7731; Fig. 5D–F). Taken together, these data suggest that cell column organization isdisrupted in the ACC, but not the somatosensory cortex, of Epac2-deficient mice.
To expand on these findings, we next measured the total path length ratio (TPLR) betweencells within a column, a measurement of linearity of cell columns (Buxhoeveden et al.,2000). The path between cells is divided by the linear depth of a column, and the assumptionis that an organized column would have a TPLR close to 1 (the TPLR of a hypotheticalcolumn where all the cells lie on a central line), whereas a disorganized column would havea TPLR larger than 1 (Buxhoeveden et al., 2000). This analysis revealed that EPAC2+/− andEPAC2−/− mice had a larger TPLR in cell columns from layer 2/3 of the ACC compared towild-type littermates (TPLR: EPAC2+/+, 1.2±0.02, EPAC2+/−, 1.5±0.02, EPAC2−/−,1.6±0.2; one-way ANOVA with Tukey post test; F(2, 39) = 36.21, p < 0.0001; Fig. 5G–H).We did not detect any differences in the TPLR of layer 2/3 cell columns in thesomatosensory cortex across genotypes (TPLR: EPAC2+/+, 1.3±0.02, EPAC2+/−, 1.3±0.2,EPAC2−/−, 1.3±0.2; one-way ANOVA with Tukey post test; F(2, 35) = 1.823, p = 0.1766;Fig. 5I–J).
Srivastava et al. Page 11
J Neurosci. Author manuscript; available in PMC 2013 February 22.
$waterm
ark-text$w
atermark-text
$waterm
ark-text

Abnormal organization of cortical columns may be caused by defects in neuronal migration(Torii et al., 2009). To investigate whether loss of Epac2 could affect neuronal migration,we compared the migration pattern of Epac2-deficient neurons with neurons expressingnormal Epac2 levels in the frontal association cortex. We in utero electroporated a plasmidencoding a previously described Epac2-specific shRNA (Epac2-shRNA) (Woolfrey et al.,2009), which co-expresses GFP, into the developing cortex of E14.5 embryos and examinedlocalization of GFP-expressing neurons at P0. We have previously shown that this shRNAconstruct effectively knocks down Epac2 expression both in vitro and in vivo (Woolfrey etal., 2009; Srivastava et al., 2012). We did not detect any obvious abnormal localization offluorescent neurons within the ventricular/subventricular zones, intermediate zone orcortical plate in Epac2-shRNA positive brains compared to control brains (Fig. 5K),suggesting that migration deficiencies are not likely to account for the observeddisorganized columnar organization.
Collectively, these data demonstrate that Epac2-deficient mice exhibit alterations incolumnar organization in the ACC, a cortical area implicated in social interactions, but notin the somatosensory cortex.
General characterization of cellular phenotypes in Epac2-deficient miceTo explore possible changes in Epac2-dependent signaling at the cellular level, we examinedEpac2, Epac1 and Rap1 expression in cortex of 8 week old wild-type and Epac2-deficientmice. As expected, Epac2 protein was not detectable in EPAC2−/− mice, while EPAC2+/−
mice had 50% of wild-type levels Epac2 (one-way ANOVA with Tukey post test; F(2, 6) =358.2, p < 0.0001; Fig. 6A–B). We did not observe differences in Epac1 or Rap1 expressionbetween genotypes, indicating the absence of compensatory mechanisms throughupregulation of either protein (one-way ANOVA; p > 0.05; Fig. 6A–B). Examination ofmajor synaptic proteins and Epac2-interacting proteins (Woolfrey et al., 2009) in wild-typeand EPAC2−/− mice did not detect overall changes in the levels of any of these proteins(Student’s t tests, p > 0.05; Fig. 6B).
As Epac2 is a GEF for the small GTPase Rap, we assessed the impact of Epac2 loss onlevels of total and active Rap1 in homogenates of frontal cortex of wild-type and Epac2-deficient mice (Fig. 6D–E). Surprisingly, we did not observe any differences in overall totalRap1 or Rap1-GTP levels between genotypes (one-way ANOVA; F(2, 9) = 0.2212, p =0.8058; Fig. 6D–E). To test in situ whether Epac1 could be activated to compensate forEpac2 loss in Epac2-deficient neurons, we treated mature cultured cortical neurons fromeither EPAC2+/+ or EPAC2−/− mice with 8-CPT (50 μM, 1 hr), and measured the levels ofphospho-BRaf (p-BRaf) immunofluorescence, an in situ readout for Rap and Ras activation(Woolfrey et al., 2009) (Fig. 6F–I). As expected, p-BRaf levels were significantly increasedin response to 8-CPT treatment in EPAC2+/+ neurons (one-way ANOVA with Tukey posttest; F(3, 15) = 42.26, p < 0.0001; Fig. 6F,G). Furthermore, overexpression of Epac2 wassufficient to increase basal levels of p-BRaf which could be further activated by 8-CPT (Fig.6F,G). In contrast, EPAC2−/− neurons were not responsive to 8-CPT treatment (one-wayANOVA with Tukey post test; F(3, 21) = 30.00, p < 0.0001; Fig. 6H,I), suggesting thatEpac1 function was not upregulated in Epac2-deficient mice. However, ectopic expressionof Epac2 in EPAC2−/− cultures increased basal levels of p-BRaf and rescued the lack of p-BRaf in response to 8-CPT treatment (Fig. 6H,I). These data indicate that Epac1 activity isnot compensating for Epac2 loss in Epac2-deficient neurons in response to 8-CPT,suggesting that the behavioral, morphological and molecular phenotypes observed inEPAC2−/− mice are due to the loss of Epac2 and not Epac1 upregulation.
Srivastava et al. Page 12
J Neurosci. Author manuscript; available in PMC 2013 February 22.
$waterm
ark-text$w
atermark-text
$waterm
ark-text

Abnormal dendritic spine dynamics in vivo in Epac2-deficient miceAbnormalities in excitatory synapse morphology have been reported in several transgenicmouse lines that also display social and communication deficits (Hines et al., 2008; Cahill etal., 2009; Bangash et al., 2011). Furthermore, dendritic spine numbers and morphology arethought to be important determinants of connectivity within and between cortical columns(Chklovskii, 2004). Because in cultured neurons Epac2 regulated dendritic spinemorphology and motility (Woolfrey et al., 2009), we hypothesized that Epac2 deficiencymight alter spine morphology and motility in vivo. We thus used intravital two-photonmicroscopy to examine the role of Epac2 in controlling dendritic spine dynamics in vivo.We crossed EPAC2−/− mice with a thy1-GFP-M strain of mice, which sparsely express GFPin cortical pyramidal neurons (Feng et al., 2000), for at least 7 generations to produceEPAC2+/−,GFP mice. EPAC2+/−,GFP x EPAC2+/−,GFP were established to generateEPAC2+/+,GFP, EPAC2+/−,GFP and EPAC2−/−,GFP littermate mice.
We first assessed dendritic spine morphology in mice by imaging apical tufts, perpendicularto the pia and lying between 15–40 μm from the pia surface, of GFP-positive neurons in thefrontal cortex of EPAC2+/+,GFP, EPAC2+/−,GFP and EPAC2−/−,GFP (Fig. 7A). Quantitativeanalysis of images revealed that EPAC2−/−,GFP mice had significantly reduced dendriticspine density compared to wild-type littermates (one-way ANOVA with Tukey post test;F(2, 33) = 3.818, p = 0.0322; Fig. 7A–B). Interestingly, when we examined linear densityaccording to spine classification (stubby, mushroom, thin and filopodia), we found that bothEPAC2+/−,GFP and EPAC2−/−,GFP mice had significantly fewer filopodia, and thatEPAC2−/−,GFP mice had significantly fewer thin spines (mixed model (genotype x spineclass) ANOVA with Bonferroni post test; genotype: F(2, 132) = 7.229, p = 0.001; spineclass: F(3, 132) = 70.44, p < 0.0001; interaction: F(6, 132) = 3.436, p = 0.0035; Fig. 7C).There were no changes in spine length, either by examining the total number of spines oraccording to spine class (one way ANOVA; F(2, 33) = 0.1178, p = 0.8892; mixed model(genotype x spine class) ANOVA; genotype: F(2, 699) = 2.844, p = 0.0589; Fig. 7D–E).
The morphology of spines often correlates with their dynamic properties. Thinner spines andfilopodia are highly dynamic and display high levels of motility, while stubby or largermushroom shaped spines are more stable and thus less motile (Holtmaat et al., 2006). AsEpac2 has been shown to control motility of spines in vitro (Woolfrey et al., 2009), and dueto the specific loss of thin and filopodia spines, we assessed the motility of dendritic spinesin vivo in all genotypes. All types of motility, including retraction, elongation andformation, were evident in wild-type animals. We calculated a motility index by determiningthe average absolute change in length per unit time: a high index represents a high level ofmotility, whereas a low index would indicate reduced motility. Time-lapse imaging ofdendritic spines revealed that EPAC2+/−,GFP and EPAC2−/−,GFP mice had significantlyreduced motility compared to EPAC2+/+,GFP mice (one-way ANOVA with Tukey post test;F(2, 708) = 33.05, p < 0.0001; Fig. 7F–G). When we examined motility according to spineclass, we observed a reduction in the motility of stubby, mushroom, and thin spine types inEPAC2+/−,GFP and EPAC2−/−,GFP mice (two-way ANOVA with Bonferroni post test;genotype: F(2, 693) = 25.92, p < 0.0001; spine class: F(3, 693) = 126.7, p < 0.0001; Fig.7H). Taken together, these data indicate that loss of Epac2 reduces spine numbers andimpairs spine motility in the frontal cortex.
DISCUSSIONHere we report that mice lacking one or both copies of the EPAC2 gene, encoding a PKA-independent cAMP target, exhibited specific impairments in social and communicationbehavior. In contrast, these mice did not show motor abnormalities, olfactory disruption,repetitive behaviors, working or reference memory deficits, or altered anxiety levels. Epac2-
Srivastava et al. Page 13
J Neurosci. Author manuscript; available in PMC 2013 February 22.
$waterm
ark-text$w
atermark-text
$waterm
ark-text

deficient mice also displayed specific alterations in cortical columnar organization in theACC, a cortical region associated with social and communication behavior, but not in thesomatosensory cortex. In addition, we observed reduced dendritic spine numbers andmotility in cortical neurons in Epac2-deficient mice. These findings point toward a role forEpac2 signaling in regulating social behaviors and cortical organization and connectivity,providing novel insight into the molecular and cellular substrates of social andcommunication behavior (Fig. 8).
The specificity of social behavioral deficits in Epac2-deficient mice, with intact spatialreference and working memory, was unexpected. Manipulations of a number of genes,including NLGN3 and SHANK3, have been linked to social and communication phenotypesin mice (Radyushkin et al., 2009; Peca et al., 2011; Wang et al., 2011). These mouse linesalso exhibit deficits in spatial and working memory, making it difficult to dissect therelationship between these phenotypes and the underlying genotypes. In contrast, in anenhanced polyubiquitinated Shank3 mouse model, mutant mice performed equally well aswild-type mice in cognitive tasks, but displayed deficits in social behaviors (Bangash et al.,2011), similar to Epac2-deficient mice. As Epac2-deficient mice exhibit specificimpairments in sociability, but not in cognitive or motor behaviors, our data might provideinsight into the molecular and cellular bases of social and communication behavior, distinctfrom other cognitive behaviors. Importantly, Epac2-deficient mice displayed normalresponses to both social and non-social odor cues. This finding suggests that abnormalsociability in Epac2-deficient mice does not occur at the level of olfaction, but may be dueto perturbations in higher level processing. Furthermore, our finding that both heterozygousand homozygous knockout genotypes displayed the same degree of deficits in sociabilitysuggests that near-wild-type levels of Epac2 signaling might be required to mediate normalsocial processing and behavioral output.
Epac2-deficient mice displayed region-specific alterations in the columnar organization ofthe cortex. Dysfunction and structural alterations of specific cortical regions have beenlinked to deficits in social and communication behaviors, in humans, non-human primatesand rodents (Casanova et al., 2009; Jurgens, 2009). A number of studies have demonstratedthat the frontal cortex, specifically the ACC, plays an important role both in social behaviorand control of vocalization in mammals (Rushworth et al., 2007; Jurgens, 2009; Fischer etal., 2011). It is hypothesized that neurons organized into columns, sometimes called“minicolumns”, form the functional working unit within this area (Casanova et al., 2009;Rakic, 2009). Indeed, several human post-mortem studies of subjects with ASD, disorderscomorbid with autism, or schizophrenia, have reported abnormalities in the columnarorganization of the ACC (Benes et al., 2001; Casanova et al., 2003). Minicolumnaralterations have also been reported in dyslexia (Casanova et al., 2002), suggesting apotential role in language circuits. Our cytoarchitectural data reveal an unexpected role forEpac2 in the organization of cortical columns specifically in the ACC, and suggest thatdisruption of cortical organization in this region might be related to social andcommunication behavioral deficits. The lack of any alteration in laminar organizationsupports our finding that neuronal migration was not altered in Epac2-deficient mice. Theconcordance of these data emphasizes the specificity of the alteration at the level ofcolumnar organization in Epac2-deficient mice.
The molecular underpinnings of spine motility and stability in vivo are not well understood.As differences in spine dynamics have been observed between in vitro and in vivoconditions, in vivo analysis is likely to provide a much more physiological indication ofspine plasticity. We observed that Epac2-deficient mice had fewer spines and significantlyreduced motility compared to wild-type mice. This is consistent with our previous findingsin vitro, where Epac2 bi-directionally regulates spine shrinkage and increased spine motility
Srivastava et al. Page 14
J Neurosci. Author manuscript; available in PMC 2013 February 22.
$waterm
ark-text$w
atermark-text
$waterm
ark-text
(Woolfrey et al., 2009). It is posited that spine morphology correlates with spine dynamicproperties; thinner and filopodia-like spines are more dynamic than stubby or mushroom-shaped spines (Holtmaat et al., 2006). Epac2-deficient mice displayed reduced motility in allspine types. This suggests that Epac2 plays a role in determining the overall level of motilityin all spine types, and that motility of more “mature” spine morphologies was still readilyobserved at 8 weeks postnatal in our preparation. In addition, loss of Epac2 in vivo causedspine loss, indicating a role for Epac2 in maintaining normal synapse density in vivo.Together these data indicate that Epac2-deficient mice display fewer dendritic spines andreduced overall spine motility in the frontal cortex, which may contribute to connectivity orbehavioral deficits seen in these mice. Furthermore, our data provide a molecularmechanism for spine motility in vivo, and further establish the link between PKA-independent cAMP and Rap signaling with spine dynamics.
A recently published study provided strong evidence supporting a role for Epac inhippocampal function. Loss of both EPAC1 and EPAC2 genes, in EPAC null mice, resultedin deficits in presynaptic release and LTP in the hippocampus, social interaction andjuvenile play, and spatial reference memory (Yang et al., 2012b). Interestingly, Yang andcolleagues did not observe any impairment in social interaction in EPAC2 null mice,contrasting from the results in the current study. Importantly, differences between thebackground strain used, and methodology used to test sociability may underlie thedifferences between the current study and Yang et al. Robust differences in sociabilitybetween C57BL/6 (background strain used in the current study) and 129sv (backgroundstain used by Yang et al.) mice have been reported. Specifically, C57BL/6 displayedsignificant levels of sociability, whereas 129sv mice did not (Moy et al., 2007). Lowsociability in 129sv mice may be due, in part, to high anxiety-like behaviors and lowexploratory locomotion (Moy et al., 2007). Thus, low sociability in the 129sv backgroundstrain may occlude all but the most drastic genetic effects on sociability, such as loss of bothEPAC genes. Furthermore, as Epac1 is expressed highly in the olfactory bulb (Kawasaki etal., 1998), it is not clear whether loss of this gene has an impact on olfaction, and thus onsociability, in EPAC null mice. Another distinction between the two studies is thedifferences seen in dendritic spine structure. No differences in spine density were seen inGolgi-Cox stained CA1 hippocampal neurons in EPAC null mice (Yang et al., 2012b). Onthe other hand, in the current study, intravital imaging of dendritic spines of cortical neuronsin the frontal association cortex demonstrated a reduction in spine density and reducedmotility in Epac2-deficient mice, consistent with previous in vitro studies (Woolfrey et al.,2009). It is likely that a combination of methodology used to image dendritic spines andbrain region examined are the basis for the differences in spine morphology between the twostudies.
Here we focus on cortical organization, cortical spine motility, and cortically-basedbehaviors. Additionally, we analyze spatial working memory, a behavior that relies on thefrontal cortex as well as the hippocampus in mice (Goldman-Rakic, 1995), and measurementof social contact and USVs in the context of naïve male-female interactions, providingadditional behavioral data that underscore the specificity and severity of social deficits inEPAC2-deficient mice. Furthermore, we find that while gross morphology of brain regions,including the hippocampus, was unaltered, detailed analysis revealed disruptions incolumnar organization in EPAC2+/− and EPAC2−/− mice in a particular cortical regionrelevant for social behaviors. Specifically, we find that organization and spacing of cellswithin cortical columns is altered in the absence of Epac2. Taken together with the evidencefor altered dendritic spine motility in vivo, these data emphasize a role for Epac2 inregulating cortical structure and function.
Srivastava et al. Page 15
J Neurosci. Author manuscript; available in PMC 2013 February 22.
$waterm
ark-text$w
atermark-text
$waterm
ark-text

The EPAC2 gene has been implicated in a number of psychiatric disorders. It is located at2q31-q32, a region identified by several genome-wide linkage studies as an importantautism susceptibility locus (Buxbaum et al., 2001; Shao et al., 2002). Recent studies alsoidentified several copy number variants (CNVs) in this region in patients with autism, aswell as enrichments of CNVs disrupting genes involved in GTPase/Ras signaling in autisticpatients (Marshall et al., 2008; Pinto et al., 2010). Several rare mutations in the EPAC2 genehave been identified in subjects with autism (Bacchelli et al., 2003), and interestingly,several of the mutations altered protein function and spine morphology (Woolfrey et al.,2009). Because abnormal social and communication behavior is characteristic for a numberof neurodevelopmental and neuropsychiatric disorders, understanding Epac2 function invivo may provide insight into the pathogenesis of these diseases.
AcknowledgmentsEPAC2 null mice were generated by Professor Susumu Seino (Kobe University Graduate School of Medicine).This work was supported by the Northwestern University Behavioral Phenotyping Core, and we thank JohnLinardakis for assistance with behavioral testing. We thank Katharine R. Smith and Natalie C. Tronson for criticalreading of this manuscript. This work was supported by the National Alliance for Autism Research (NAAR), theNational Alliance for Research on Schizophrenia and Depression (NARSAD), Alzheimer’s Association, BrainResearch Foundation, and NIH grants 2R01MH071316 and 1R01MH097216 to P.P., a pre-doctoral AmericanHeart Association (AHA) fellowship to K.M.W., a post-doctoral AHA fellowship, a NARSAD Young Investigatorsaward and a Royal Society International Exchange grant to D.P.S., NIH grant F31MH085362 to K.A.J., NIH grant1R01MH094835 to J.B., The Ralph and Marian Falk Medical Research Trust, Chicago, IL to J.R.M., NIH grants1R01MH-086784 and 1R01HD-065279 to M.F.C., NIH grant 5R21MH085117-02 and a Brain ResearchFoundation grant BRF SG 2010-13 to J.W., and a NINDS grant to the Northwestern University Multi-Photon Core(P30NS054850).
ReferencesBacchelli E, Blasi F, Biondolillo M, Lamb JA, Bonora E, Barnby G, Parr J, Beyer KS, Klauck SM,
Poustka A, Bailey AJ, Monaco AP, Maestrini E. Screening of nine candidate genes for autism onchromosome 2q reveals rare nonsynonymous variants in the cAMP-GEFII gene. Molecularpsychiatry. 2003; 8:916–924. [PubMed: 14593429]
Bangash MA, et al. Enhanced polyubiquitination of Shank3 and NMDA receptor in a mouse model ofautism. Cell. 2011; 145:758–772. [PubMed: 21565394]
Benes FM, Vincent SL, Todtenkopf M. The density of pyramidal and nonpyramidal neurons inanterior cingulate cortex of schizophrenic and bipolar subjects. Biol Psychiatry. 2001; 50:395–406.[PubMed: 11566156]
Burgdorf J, Wood PL, Kroes RA, Moskal JR, Panksepp J. Neurobiology of 50-kHz ultrasonicvocalizations in rats: electrode mapping, lesion, and pharmacology studies. Behav Brain Res. 2007;182:274–283. [PubMed: 17449117]
Buxbaum JD, Silverman JM, Smith CJ, Kilifarski M, Reichert J, Hollander E, Lawlor BA, FitzgeraldM, Greenberg DA, Davis KL. Evidence for a susceptibility gene for autism on chromosome 2 andfor genetic heterogeneity. Am J Hum Genet. 2001; 68:1514–1520. [PubMed: 11353400]
Buxhoeveden DP, Switala AE, Roy E, Casanova MF. Quantitative analysis of cell columns in thecerebral cortex. J Neurosci Methods. 2000; 97:7–17. [PubMed: 10771070]
Cahill ME, Xie Z, Day M, Photowala H, Barbolina MV, Miller CA, Weiss C, Radulovic J, Sweatt JD,Disterhoft JF, Surmeier DJ, Penzes P. Kalirin regulates cortical spine morphogenesis and disease-related behavioral phenotypes. Proc Natl Acad Sci U S A. 2009; 106:13058–13063. [PubMed:19625617]
Casanova MF, Buxhoeveden D, Gomez J. Disruption in the inhibitory architecture of the cellminicolumn: implications for autism. Neuroscientist. 2003; 9:496–507. [PubMed: 14678582]
Casanova MF, Trippe J 2nd, Tillquist C, Switala AE. Morphometric variability of minicolumns in thestriate cortex of Homo sapiens, Macaca mulatta, and Pan troglodytes. J Anat. 2009; 214:226–234.[PubMed: 19207984]
Srivastava et al. Page 16
J Neurosci. Author manuscript; available in PMC 2013 February 22.
$waterm
ark-text$w
atermark-text
$waterm
ark-text

Casanova MF, Buxhoeveden DP, Cohen M, Switala AE, Roy EL. Minicolumnar pathology indyslexia. Ann Neurol. 2002; 52:108–110. [PubMed: 12112057]
Chklovskii DB. Synaptic connectivity and neuronal morphology: two sides of the same coin. Neuron.2004; 43:609–617. [PubMed: 15339643]
Cook MN, Crounse M, Flaherty L. Anxiety in the elevated zero-maze is augmented in mice afterrepeated daily exposure. Behav Genet. 2002; 32:113–118. [PubMed: 12036108]
Di Rosa E, Crow TJ, Chance SA. Axon bundle spacing in the anterior cingulate cortex of the humanbrain. J Clin Neurosci. 2008; 15:1389–1392. [PubMed: 18974006]
Feng G, Mellor RH, Bernstein M, Keller-Peck C, Nguyen QT, Wallace M, Nerbonne JM, LichtmanJW, Sanes JR. Imaging neuronal subsets in transgenic mice expressing multiple spectral variantsof GFP. Neuron. 2000; 28:41–51. [PubMed: 11086982]
Fischer J, Hammerschmidt K. Ultrasonic vocalizations in mouse models for speech and socio-cognitive disorders: insights into the evolution of vocal communication. Genes Brain Behav. 2011;10:17–27. [PubMed: 20579107]
Gelinas JN, Banko JL, Peters MM, Klann E, Weeber EJ, Nguyen PV. Activation of exchange proteinactivated by cyclic-AMP enhances long-lasting synaptic potentiation in the hippocampus.Learning & memory (Cold Spring Harbor, NY. 2008; 15:403–411.
Goldman-Rakic PS. Cellular basis of working memory. Neuron. 1995; 14:477–485. [PubMed:7695894]
Hettinger JA, Liu X, Schwartz CE, Michaelis RC, Holden JJ. A DRD1 haplotype is associated withrisk for autism spectrum disorders in male-only affected sib-pair families. Am J Med Genet BNeuropsychiatr Genet. 2008; 147B:628–636. [PubMed: 18205172]
Hines RM, Wu L, Hines DJ, Steenland H, Mansour S, Dahlhaus R, Singaraja RR, Cao X, Sammler E,Hormuzdi SG, Zhuo M, El-Husseini A. Synaptic imbalance, stereotypies, and impaired socialinteractions in mice with altered neuroligin 2 expression. J Neurosci. 2008; 28:6055–6067.[PubMed: 18550748]
Holtmaat A, Wilbrecht L, Knott GW, Welker E, Svoboda K. Experience-dependent and cell-type-specific spine growth in the neocortex. Nature. 2006; 441:979–983. [PubMed: 16791195]
Holy TE, Guo Z. Ultrasonic songs of male mice. PLoS Biol. 2005; 3:e386. [PubMed: 16248680]
Jamain S, Quach H, Betancur C, Rastam M, Colineaux C, Gillberg IC, Soderstrom H, Giros B,Leboyer M, Gillberg C, Bourgeron T. Mutations of the X-linked genes encoding neuroliginsNLGN3 and NLGN4 are associated with autism. Nat Genet. 2003; 34:27–29. [PubMed:12669065]
Jurgens U. The neural control of vocalization in mammals: a review. J Voice. 2009; 23:1–10.[PubMed: 18207362]
Kawasaki H, Springett GM, Mochizuki N, Toki S, Nakaya M, Matsuda M, Housman DE, GraybielAM. A family of cAMP-binding proteins that directly activate Rap1. Science. 1998; 282:2275–2279. [PubMed: 9856955]
Kelley DJ, Bhattacharyya A, Lahvis GP, Yin JC, Malter J, Davidson RJ. The cyclic AMP phenotypeof fragile X and autism. Neurosci Biobehav Rev. 2008; 32:1533–1543. [PubMed: 18601949]
Kelly MP, Stein JM, Vecsey CG, Favilla C, Yang X, Bizily SF, Esposito MF, Wand G, Kanes SJ,Abel T. Developmental etiology for neuroanatomical and cognitive deficits in mice overexpressingGalphas, a G-protein subunit genetically linked to schizophrenia. Mol Psychiatry. 2009; 14:398–415. 347. [PubMed: 19030002]
Marshall CR, et al. Structural variation of chromosomes in autism spectrum disorder. Am J HumGenet. 2008; 82:477–488. [PubMed: 18252227]
Morozov A, Muzzio IA, Bourtchouladze R, Van-Strien N, Lapidus K, Yin D, Winder DG, Adams JP,Sweatt JD, Kandel ER. Rap1 couples cAMP signaling to a distinct pool of p42/44MAPKregulating excitability, synaptic plasticity, learning, and memory. Neuron. 2003; 39:309–325.[PubMed: 12873387]
Moy SS, Nadler JJ, Young NB, Perez A, Holloway LP, Barbaro RP, Barbaro JR, Wilson LM,Threadgill DW, Lauder JM, Magnuson TR, Crawley JN. Mouse behavioral tasks relevant toautism: phenotypes of 10 inbred strains. Behav Brain Res. 2007; 176:4–20. [PubMed: 16971002]
Srivastava et al. Page 17
J Neurosci. Author manuscript; available in PMC 2013 February 22.
$waterm
ark-text$w
atermark-text
$waterm
ark-text
Muller JM, Moore H, Myers MM, Shair HN. Dopamine’s role in social modulation of infant isolation-induced vocalization: II. Maternally modulated infant separation responses are regulated by D1-and D2-family dopamine receptors. Dev Psychobiol. 2009; 51:158–172. [PubMed: 19031490]
Nestler EJ, Barrot M, DiLeone RJ, Eisch AJ, Gold SJ, Monteggia LM. Neurobiology of depression.Neuron. 2002; 34:13–25. [PubMed: 11931738]
Oblak AL, Rosene DL, Kemper TL, Bauman ML, Blatt GJ. Altered posterior cingulate corticalcyctoarchitecture, but normal density of neurons and interneurons in the posterior cingulate cortexand fusiform gyrus in autism. Autism Res. 2011; 4:200–211. [PubMed: 21360830]
Peca J, Feliciano C, Ting JT, Wang W, Wells MF, Venkatraman TN, Lascola CD, Fu Z, Feng G.Shank3 mutant mice display autistic-like behaviours and striatal dysfunction. Nature. 2011;472:437–442. [PubMed: 21423165]
Pinto D, et al. Functional impact of global rare copy number variation in autism spectrum disorders.Nature. 2010; 466:368–372. [PubMed: 20531469]
Radyushkin K, Hammerschmidt K, Boretius S, Varoqueaux F, El-Kordi A, Ronnenberg A, Winter D,Frahm J, Fischer J, Brose N, Ehrenreich H. Neuroligin-3-deficient mice: model of a monogenicheritable form of autism with an olfactory deficit. Genes Brain Behav. 2009; 8:416–425. [PubMed:19243448]
Rakic P. Evolution of the neocortex: a perspective from developmental biology. Nat Rev Neurosci.2009; 10:724–735. [PubMed: 19763105]
Rushworth MF, Behrens TE, Rudebeck PH, Walton ME. Contrasting roles for cingulate andorbitofrontal cortex in decisions and social behaviour. Trends Cogn Sci. 2007; 11:168–176.[PubMed: 17337237]
Shao Y, Raiford KL, Wolpert CM, Cope HA, Ravan SA, Ashley-Koch AA, Abramson RK, WrightHH, DeLong RG, Gilbert JR, Cuccaro ML, Pericak-Vance MA. Phenotypic homogeneity providesincreased support for linkage on chromosome 2 in autistic disorder. Am J Hum Genet. 2002;70:1058–1061. [PubMed: 11875756]
Shibasaki T, Takahashi H, Miki T, Sunaga Y, Matsumura K, Yamanaka M, Zhang C, Tamamoto A,Satoh T, Miyazaki J, Seino S. Essential role of Epac2/Rap1 signaling in regulation of insulingranule dynamics by cAMP. Proc Natl Acad Sci U S A. 2007; 104:19333–19338. [PubMed:18040047]
Silva AJ, Murphy GG. cAMP and memory: a seminal lesson from Drosophila and Aplysia. Brain ResBull. 1999; 50:441–442. [PubMed: 10643474]
Silverman JL, Yang M, Lord C, Crawley JN. Behavioural phenotyping assays for mouse models ofautism. Nat Rev Neurosci. 2010; 11:490–502. [PubMed: 20559336]
Srivastava DP, Woolfrey KM, Penzes P. Analysis of dendritic spine morphology in cultured CNSneurons. J Vis Exp. 2011
Srivastava DP, Woolfrey KM, Jones KA, Anderson CT, Smith KR, Russell TA, Lee H, Yasvoina MV,Wokosin DL, Ozdinler PH, Shepherd GMG, Penzes P. An Autism-Associated Variant of Epac2Reveals a Role for Ras/Epac2 Signaling in Controlling Basal Dendrite Maintenance in Mice. PLoSBiol. 2012; 10:e1001350. [PubMed: 22745599]
Tardito D, Maina G, Tura GB, Bogetto F, Pioli R, Ravizza L, Racagni G, Perez J. The cAMP-dependent protein kinase substrate Rap1 in platelets from patients with obsessive compulsivedisorder or schizophrenia. Eur Neuropsychopharmacol. 2001; 11:221–225. [PubMed: 11418282]
Torii M, Hashimoto-Torii K, Levitt P, Rakic P. Integration of neuronal clones in the radial corticalcolumns by EphA and ephrin-A signalling. Nature. 2009; 461:524–528. [PubMed: 19759535]
Ulucan C, Wang X, Baljinnyam E, Bai Y, Okumura S, Sato M, Minamisawa S, Hirotani S, IshikawaY. Developmental changes in gene expression of Epac and its upregulation in myocardialhypertrophy. Am J Physiol Heart Circ Physiol. 2007; 293:H1662–1672. [PubMed: 17557924]
Wang H, Liang S, Burgdorf J, Wess J, Yeomans J. Ultrasonic vocalizations induced by sex andamphetamine in M2, M4, M5 muscarinic and D2 dopamine receptor knockout mice. PLoS One.2008; 3:e1893. [PubMed: 18382674]
Wang X, McCoy PA, Rodriguiz RM, Pan Y, Je HS, Roberts AC, Kim CJ, Berrios J, Colvin JS,Bousquet-Moore D, Lorenzo I, Wu G, Weinberg RJ, Ehlers MD, Philpot BD, Beaudet AL, Wetsel
Srivastava et al. Page 18
J Neurosci. Author manuscript; available in PMC 2013 February 22.
$waterm
ark-text$w
atermark-text
$waterm
ark-text

WC, Jiang YH. Synaptic dysfunction and abnormal behaviors in mice lacking major isoforms ofShank3. Hum Mol Genet. 2011; 20:3093–3108. [PubMed: 21558424]
Woolfrey KM, Srivastava DP, Photowala H, Yamashita M, Barbolina MV, Cahill ME, Xie Z, JonesKA, Quilliam LA, Prakriya M, Penzes P. Epac2 induces synapse remodeling and depression andits disease-associated forms alter spines. Nat Neurosci. 2009; 12:1275–1284. [PubMed: 19734897]
Yang M, Abrams DN, Zhang JY, Weber MD, Katz AM, Clarke AM, Silverman JL, Crawley JN. Lowsociability in BTBR T+tf/J mice is independent of partner strain. Physiol Behav. 2012a
Yang Y, Shu X, Liu D, Shang Y, Wu Y, Pei L, Xu X, Tian Q, Zhang J, Qian K, Wang Y-X, PetraliaRonald S, Tu W, Zhu L-Q, Wang J-Z, Lu Y. EPAC Null Mutation Impairs Learning and SocialInteractions via Aberrant Regulation of miR-124 and Zif268 Translation. Neuron. 2012b; 73:774–788. [PubMed: 22365550]
Srivastava et al. Page 19
J Neurosci. Author manuscript; available in PMC 2013 February 22.
$waterm
ark-text$w
atermark-text
$waterm
ark-text

Figure 1. Social approach behavior and ultrasonic vocalizations are disrupted in EPAC2-deficient miceA, EPAC2+/+ and EPAC2−/− mice are similar in gross morphology. B, Body weight isunchanged across genotypes. C, Schematic of social approach assay. A 5-minute habituationphase in the social approach apparatus, without the stimulus mouse present, was followed bya 5-minute rest phase in the home cage, and then followed by the test phase, in which thestimulus mouse was placed under the cage on the previously designated “social” side of theapparatus. Dashed lines indicate delineation of social, neutral (center), and non-socialregions during post-testing analysis. Time spent in each region (social, non-social, andneutral) was recorded. D, Quantification of time spent on social side of social approachapparatus during habituation and test phases. EPAC2+/+ mice spent more time on the socialside during the test phase of social approach than during the habituation phase, while timespent on social side during habituation phase and test phases did not differ in EPAC2+/− andEPAC2−/− mice. 3 (genotype) × 2 (phase) mixed model ANOVA with Bonferroni post tests.E, Quantification of time spent in close proximity to stimulus mouse during social phase ofsocial approach task. EPAC2+/− and EPAC2−/− mice spent less time socially investigatingthe stimulus mouse during the test phase than EPAC2+/+ mice. One-way ANOVA withTukey post hoc. F, Quantification of social contact time during ultrasonic vocalization
Srivastava et al. Page 20
J Neurosci. Author manuscript; available in PMC 2013 February 22.
$waterm
ark-text$w
atermark-text
$waterm
ark-text

measurement between males of all 3 genotypes with a wild-type female for 5 min in aneutral home cage. One-way ANOVA with Tukey post hoc. G, Quantification of number ofultrasonic vocalizations during 5 min of exposure to wild-type female mouse. One-wayANOVA with Tukey post hoc. H, Quantification of percentage of frequency-modulatedUSVs during 5 min of exposure to wild-type female mouse. Kruskal-Wallis test with Dunn’smultiple comparison test. I, Quantification of time spent sniffing non-social odors (water,almond, strawberry) and social odors (swabs of used cages of unfamiliar mice) during 3consecutive presentations of each odor. While odor had a significant effect (p < 0.0001),genotype has no significant effect on time spent sniffing (p > 0.05). Mixed model (genotypex trial) ANOVA with Bonferroni post tests. All three genotypes exhibited significantlyincreased sniff time during social A1 compared to strawberry 3 (i.e. dishabituation; “#”),while EPAC2+/+ and EPAC2−/− mice exhibited reduced sniff time upon the third exposureof social A compared the first (i.e. habituation; “*”). #, p < 0.05; *, p < 0.05; **, p < 0.01;***, p < 0.001. n = 6–14 animals/genotype.
Srivastava et al. Page 21
J Neurosci. Author manuscript; available in PMC 2013 February 22.
$waterm
ark-text$w
atermark-text
$waterm
ark-text

Figure 2. Loss of EPAC2 does not alter anxiety, spatial reference memory, or spatial workingmemoryA, Quantification of path error across days of training of EPAC2+/+ EPAC2+/−, andEPAC2−/− mice (8 weeks postnatal) in the Morris water maze spatial reference memory test(fixed platform). Data are means of 6 trials for each day. 3 (genotype) × 5 (day) mixedmodel ANOVA revealed a main effect of day on path error, but no difference acrossgenotype was observed. B, Water maze probe trail as a test of spatial reference memory atthe end of Day 5 shows the percentage of time animals search the target quadrant. Nodifference across genotypes in percentage of time searching in the target quadrant wasobserved (one-way ANOVA, p > 0.05). Dashed line indicates chance performance (25%). C,Quantification of path error of Morris water maze reversal learning task. After the 6th trialon the 5th day, the platform is moved to a different location from previous 5 trials, and 2additional trials are conducted. Mixed model ANOVA revealed a significant effect of day onpath error (p < 0.05), but no effect of genotype (p > 0.05). D, Quantification of percentage of3-arm alternation events during 5 min of Y-maze spontaneous alternation task. Lineindicates chance performance (50%). One-way ANOVA (p > 0.05). E, Quantification of thenumber of possible alternations during 5 min of Y-maze spontaneous alternation task, as ameasure of locomotor activity. One-way ANOVA (p > 0.05). F–G, Quantification of timespent in enclosed quadrants (F) and distance traveled (G) during 5 min in a zero maze task.One-way ANOVA (p > 0.05). n = 5 animals/genotype.
Srivastava et al. Page 22
J Neurosci. Author manuscript; available in PMC 2013 February 22.
$waterm
ark-text$w
atermark-text
$waterm
ark-text

Figure 3. Unaltered locomotor activity and repetitive behaviors in Epac2-deficient miceA, Quantification of distance traveled during 5 min in an open field. B, Quantification oftime spent in outer, middle, and inner zones of open field during 5 min, as a measure ofanxious behavior. Mixed model (zone x genotype) ANOVA revealed a significant effect ofzone (p < 0.0001), but no effect of genotype (p > 0.05) on time spent in each zone. C,Quantification of stride frequency at belt speeds of 24 and 34 cm/s revealed no effect ofgenotype. F, Quantification of stride length at belt speeds of 24 and 34 cm/s revealed noeffect of genotype. E–G, Grooming (E), wall leaning (F), and sitting (G) events during 5min of open field task were not different across genotypes. Error bars represent s.e.m. n = 5animals/genotype. One-way ANOVA.
Srivastava et al. Page 23
J Neurosci. Author manuscript; available in PMC 2013 February 22.
$waterm
ark-text$w
atermark-text
$waterm
ark-text

Figure 4. Gross cortical organization is not disrupted in Epac2-deficient miceA, Nissl-stained coronal sections from EPAC2+/+, EPAC2+/−, and EPAC2−/− mice. Yellowlines delineate anterior cingulate cortex, and red boxes indicate regions imaged for corticalcolumn measurements. B, Brain weight at 8 weeks postnatal is not different acrossgenotypes. One-way ANOVA. n = 11 animals/genotype. C, 4x images of Nissl-stainedcoronal sections from EPAC2+/+ and EPAC2−/− mice. Yellow boxes indicate regions usedfor cortical thickness measurements in D. Hippocampal regions in EPAC2+/+ and EPAC2−/−
mice have similar gross morphologies. D, Cortical thicknesses of frontal, somatosensory,and hippocampal regions in EPAC2+/+ and EPAC2−/− coronal sections are not changedbetween genotypes. Student’s t tests. E, Nissl staining and binarized images of anteriorcingulate cortex (left) and somatosensory cortex (right) from EPAC2+/+, EPAC2+/−, andEPAC2−/− mice. F, Cell density and average soma size do not differ across genotypes. One-way ANOVA. G, Quantification of cell density and average soma size in the somatosensory
Srivastava et al. Page 24
J Neurosci. Author manuscript; available in PMC 2013 February 22.
$waterm
ark-text$w
atermark-text
$waterm
ark-text

cortex. One-way ANOVA. n = 5–6 animals/genotype, 2 sections per animal. Scale bars, 1mm (A, C); 100 μm (E).
Srivastava et al. Page 25
J Neurosci. Author manuscript; available in PMC 2013 February 22.
$waterm
ark-text$w
atermark-text
$waterm
ark-text

Figure 5. Cortical columnar organization in the anterior cingulate cortex is disrupted in Epac2-deficient miceA, Layer 2/3 of Nissl staining (left) and binarized (right) images of anterior cingulate cortexin EPAC2+/+, EPAC2+/−, and EPAC2−/− mice. Red boxes indicate representative corticalcolumns from Fig. 4E. B, Average cell density per column in the ACC is reduced inEPAC2−/− compared to EPAC2+/+. One-way ANOVA with Tukey post hoc test. C, Cellspacing in the ACC is increased in EPAC2+/− and EPAC2−/− compared to EPAC2+/+. One-way ANOVA with Tukey post hoc test. D, Nissl staining (left) and binarized images (right)of layers 1–3 of somatosensory cortex from EPAC2+/+, EPAC2+/−, and EPAC2−/− mice.Red boxes indicate representative cortical columns from Fig. 4E. E, Average cell density percolumn in somatosensory cortex is not different across genotypes. One-way ANOVA withTukey post hoc test. F, Cell spacing in somatosensory cortex is not different across
Srivastava et al. Page 26
J Neurosci. Author manuscript; available in PMC 2013 February 22.
$waterm
ark-text$w
atermark-text
$waterm
ark-text
genotypes. One-way ANOVA with Tukey post hoc test. G, Cortical column analysis in theACC from EPAC2+/+, EPAC2+/−, and EPAC2−/− mice. Binarized images were filtered byarea for pyramidal cell bodies and excluded cell bodies that were touching the corticalcolumn edge. The total path-length ratio (TPLR) was calculated for cells within eachcolumn. H, Quantification of TPLR in the ACC revealed an increase in TPLR in EPAC2−/−
cortical columns. One-way ANOVA with Tukey post hoc tests. I, Binarized images ofcortical columns in the somatosensory cortex from EPAC2+/+, EPAC2+/−, and EPAC2−/−
mice. J, Quantification of TPLR in somatosensory cortex revealed no difference acrossgenotypes. One-way ANOVA with Tukey post hoc test. ***p < 0.001. 7–10 columns persection, 2 sections per animal, 5–6 animals per genotype. K, In utero electroporation ofcontrol vector or Epac2-shRNA, along with pCAG-eGFP, into EPAC2+/+ cortex reveals nochange in neuronal migration upon Epac2 knockdown. Animals were electroporated atE14.5, and fixed and sectioned at P0-P1. Scale bars, 100 μm (A,D,G,I), 500 μm (K).
Srivastava et al. Page 27
J Neurosci. Author manuscript; available in PMC 2013 February 22.
$waterm
ark-text$w
atermark-text
$waterm
ark-text

Figure 6. Loss of EPAC2 does not alter cortical Epac1 or Rap1 levels, but impairs 8-CPT-induced activation of BRaf in dendritesA, Epac2 protein levels are decreased in cortical lysates from EPAC2+/− mice and absent inlysates from EPAC2−/−mice. Epac1 and Rap1 protein levels are unchanged. B, Relativeintensity of Epac2, Epac1, and Rap1 protein levels in A. n = 3 animals/genotype. One-wayANOVA with Tukey post test (p < 0.0001). C, Quantification of synaptic protein levelsnormalized to β-actin in cortical lysates from mice with the indicated genotypes. Genotypehas no effect on levels of any proteins examined. Student’s t tests; n = 5 animals/genotype.D, Rap activation assay from cortical tissue reveals no change in active Rap levels withgenotype. E, Quantification of active Rap levels in C. One-way ANOVA; n = 3–6 animals/genotype. F–G, Treatment of cultured cortical neurons from EPAC2+/+ mice (P0 + DIV 24)with 8-CPT (1 hr, 50 μM) increased p-BRaf immunofluorescence intensity in dendrites.Epac2-WT overexpression in EPAC2+/+ neurons induced an enhancement of p-BRaffluorescence in response to 8-CPT treatment. One-way ANOVA with Tukey post test; n =4–6 cells/condition from 2 independent cultures. H–I, 8-CPT treatment of EPAC2−/−
neurons did not increase p-BRaf fluorescence. Overexpression of Epac2-WT in EPAC2−/−
neurons (P0 + DIV 24) increased p-BRaf intensity, and 8-CPT treatment induced anadditional increase in p-BRaf fluorescence in Epac2-WT-expressing EPAC2−/− neurons.One-way ANOVA with Tukey post test; n = 5–10 cells/condition from 2 independentcultures. # indicates comparison between Epac2-WT and Epac2-WT + 8-CPT. #,**, p <0.01; ***, p < 0.001. Error bars represent s.e.m. Scale bars, 5 μm (E, G).
Srivastava et al. Page 28
J Neurosci. Author manuscript; available in PMC 2013 February 22.
$waterm
ark-text$w
atermark-text
$waterm
ark-text
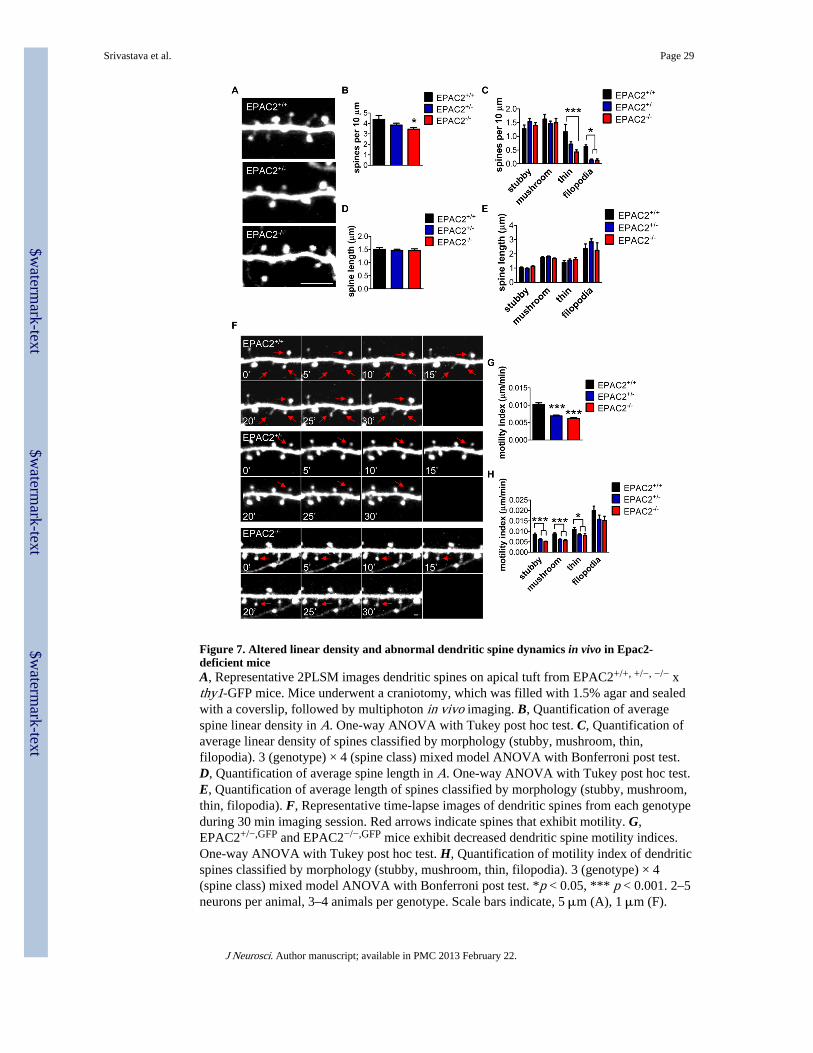
Figure 7. Altered linear density and abnormal dendritic spine dynamics in vivo in Epac2-deficient miceA, Representative 2PLSM images dendritic spines on apical tuft from EPAC2+/+, +/−, −/− xthy1-GFP mice. Mice underwent a craniotomy, which was filled with 1.5% agar and sealedwith a coverslip, followed by multiphoton in vivo imaging. B, Quantification of averagespine linear density in A. One-way ANOVA with Tukey post hoc test. C, Quantification ofaverage linear density of spines classified by morphology (stubby, mushroom, thin,filopodia). 3 (genotype) × 4 (spine class) mixed model ANOVA with Bonferroni post test.D, Quantification of average spine length in A. One-way ANOVA with Tukey post hoc test.E, Quantification of average length of spines classified by morphology (stubby, mushroom,thin, filopodia). F, Representative time-lapse images of dendritic spines from each genotypeduring 30 min imaging session. Red arrows indicate spines that exhibit motility. G,EPAC2+/−,GFP and EPAC2−/−,GFP mice exhibit decreased dendritic spine motility indices.One-way ANOVA with Tukey post hoc test. H, Quantification of motility index of dendriticspines classified by morphology (stubby, mushroom, thin, filopodia). 3 (genotype) × 4(spine class) mixed model ANOVA with Bonferroni post test. *p < 0.05, *** p < 0.001. 2–5neurons per animal, 3–4 animals per genotype. Scale bars indicate, 5 μm (A), 1 μm (F).
Srivastava et al. Page 29
J Neurosci. Author manuscript; available in PMC 2013 February 22.
$waterm
ark-text$w
atermark-text
$waterm
ark-text

Figure 8. Social, communication deficits and abnormal cortical structure and synapses in Epac2-deficient miceIn mice lacking Epac2 (EPAC2−/−), the link between cyclic AMP signaling and activation ofthe downstream target of Epac2, called Rap, is disrupted. Examination of a number ofbehavioral abilities of these mice revealed a specific deficit in social and communicationbehaviors, while learning and memory behaviors were intact. Furthermore, these miceexhibited disorganized cortical columns in a region of the brain that is thought to underliesocial behaviors. Finally, dendritic spines in mice lacking Epac2 were fewer in number andless motile than in normal mice, suggesting a structural disruption at the site of connectionsbetween neurons.
Srivastava et al. Page 30
J Neurosci. Author manuscript; available in PMC 2013 February 22.
$waterm
ark-text$w
atermark-text
$waterm
ark-text


![[Posterior cortical atrophy]](https://static.fdokumen.com/doc/165x107/6331b9d14e01430403005392/posterior-cortical-atrophy.jpg)