Smart Technologies for Precision Assembly - Springer LINK
371
123 Svetan Ratchev (Ed.) 9th IFIP WG 5.5 International Precision Assembly Seminar, IPAS 2020 Virtual Event, December 14–15, 2020 Revised Selected Papers Smart Technologies for Precision Assembly IFIP AICT 620
-
Upload
khangminh22 -
Category
Documents
-
view
1 -
download
0
Transcript of Smart Technologies for Precision Assembly - Springer LINK

123
Svetan Ratchev (Ed.)
9th IFIP WG 5.5 International Precision Assembly Seminar, IPAS 2020Virtual Event, December 14–15, 2020Revised Selected Papers
Smart Technologies for Precision Assembly
IFIP AICT 620

IFIP Advances in Informationand Communication Technology 620
Editor-in-Chief
Kai Rannenberg, Goethe University Frankfurt, Germany
Editorial Board Members
TC 1 – Foundations of Computer ScienceLuís Soares Barbosa , University of Minho, Braga, Portugal
TC 2 – Software: Theory and PracticeMichael Goedicke, University of Duisburg-Essen, Germany
TC 3 – EducationArthur Tatnall , Victoria University, Melbourne, Australia
TC 5 – Information Technology ApplicationsErich J. Neuhold, University of Vienna, Austria
TC 6 – Communication SystemsBurkhard Stiller, University of Zurich, Zürich, Switzerland
TC 7 – System Modeling and OptimizationFredi Tröltzsch, TU Berlin, Germany
TC 8 – Information SystemsJan Pries-Heje, Roskilde University, Denmark
TC 9 – ICT and SocietyDavid Kreps , National University of Ireland, Galway, Galway, Ireland
TC 10 – Computer Systems TechnologyRicardo Reis , Federal University of Rio Grande do Sul, Porto Alegre, Brazil
TC 11 – Security and Privacy Protection in Information Processing SystemsSteven Furnell , Plymouth University, UK
TC 12 – Artificial IntelligenceEunika Mercier-Laurent , University of Reims Champagne-Ardenne, Reims, France
TC 13 – Human-Computer InteractionMarco Winckler , University of Nice Sophia Antipolis, France
TC 14 – Entertainment ComputingRainer Malaka, University of Bremen, Germany

IFIP – The International Federation for Information Processing
IFIP was founded in 1960 under the auspices of UNESCO, following the first WorldComputer Congress held in Paris the previous year. A federation for societies workingin information processing, IFIP’s aim is two-fold: to support information processing inthe countries of its members and to encourage technology transfer to developing na-tions. As its mission statement clearly states:
IFIP is the global non-profit federation of societies of ICT professionals that aimsat achieving a worldwide professional and socially responsible development andapplication of information and communication technologies.
IFIP is a non-profit-making organization, run almost solely by 2500 volunteers. Itoperates through a number of technical committees and working groups, which organizeevents and publications. IFIP’s events range from large international open conferencesto working conferences and local seminars.
The flagship event is the IFIP World Computer Congress, at which both invited andcontributed papers are presented. Contributed papers are rigorously refereed and therejection rate is high.
As with the Congress, participation in the open conferences is open to all and papersmay be invited or submitted. Again, submitted papers are stringently refereed.
The working conferences are structured differently. They are usually run by a work-ing group and attendance is generally smaller and occasionally by invitation only. Theirpurpose is to create an atmosphere conducive to innovation and development. Referee-ing is also rigorous and papers are subjected to extensive group discussion.
Publications arising from IFIP events vary. The papers presented at the IFIP WorldComputer Congress and at open conferences are published as conference proceedings,while the results of the working conferences are often published as collections of se-lected and edited papers.
IFIP distinguishes three types of institutional membership: Country RepresentativeMembers, Members at Large, and Associate Members. The type of organization thatcan apply for membership is a wide variety and includes national or international so-cieties of individual computer scientists/ICT professionals, associations or federationsof such societies, government institutions/government related organizations, national orinternational research institutes or consortia, universities, academies of sciences, com-panies, national or international associations or federations of companies.
More information about this series at http://www.springer.com/series/6102

Svetan Ratchev (Ed.)
Smart Technologiesfor Precision Assembly9th IFIP WG 5.5International Precision Assembly Seminar, IPAS 2020Virtual Event, December 14–15, 2020Revised Selected Papers
123

EditorSvetan RatchevUniversity of NottinghamNottingham, UK
ISSN 1868-4238 ISSN 1868-422X (electronic)IFIP Advances in Information and Communication TechnologyISBN 978-3-030-72631-7 ISBN 978-3-030-72632-4 (eBook)https://doi.org/10.1007/978-3-030-72632-4
© The Editor(s) (if applicable) and The Author(s) 2021. This book is an open access publication.Open Access This book is licensed under the terms of the Creative Commons Attribution 4.0 InternationalLicense (http://creativecommons.org/licenses/by/4.0/), which permits use, sharing, adaptation, distributionand reproduction in any medium or format, as long as you give appropriate credit to the original author(s) andthe source, provide a link to the Creative Commons license and indicate if changes were made.The images or other third party material in this book are included in the book’s Creative Commons license,unless indicated otherwise in a credit line to the material. If material is not included in the book’s CreativeCommons license and your intended use is not permitted by statutory regulation or exceeds the permitted use,you will need to obtain permission directly from the copyright holder.The use of general descriptive names, registered names, trademarks, service marks, etc. in this publicationdoes not imply, even in the absence of a specific statement, that such names are exempt from the relevantprotective laws and regulations and therefore free for general use.The publisher, the authors and the editors are safe to assume that the advice and information in this book arebelieved to be true and accurate at the date of publication. Neither the publisher nor the authors or the editorsgive a warranty, expressed or implied, with respect to the material contained herein or for any errors oromissions that may have been made. The publisher remains neutral with regard to jurisdictional claims inpublished maps and institutional affiliations.
This Springer imprint is published by the registered company Springer Nature Switzerland AGThe registered company address is: Gewerbestrasse 11, 6330 Cham, Switzerland

Preface
Since its inception in 2003 the International Precision Assembly Seminar (IPAS) hascreated a strong international community which meets regularly to share new devel-opments in a wide range of assembly theory and practice, report exciting researchresults and discuss high-impact industrial applications. The seminar also provides aforum for debating new ideas and formulating new lines of research.
This book includes a selected set of papers presented at the 9th IPAS, which wasoriginally planned to take place in the beautiful winter surroundings of Kitzbühel,Austria between 15 and 17 March 2020. Due to the Covid-19 pandemic, it was insteadheld as a virtual seminar on 14 and 15 December 2020.
The main theme of the 9th IPAS seminar was the application of smart technologiesfor precision assembly with specific emphasis on human-centred assembly processesand systems. The book is structured into six sections: keynote paper, assembly designand planning, assembly operations, design of assembly cells and systems,human-centred assembly and assistive methods for assembly. The selected papersreflect on the dramatic impact of digital technologies in assembly with specific focus onhow such technologies can be leveraged to improve assembly process performance andpromote new types of human-in-the-loop assembly systems.
The seminar was sponsored by the International Federation of Information Pro-cessing (IFIP) WG5.5 and the International Institution of Production EngineeringResearch (CIRP). The organisers would like to express their gratitude to the membersof the International Advisory Committee for their support and guidance and to theauthors of the papers for their original contributions and enthusiastic and active par-ticipation in the seminar. We would like to thank Professor Hamideh Afsarmanesh,chair of the IFIP WG 5.5, and Prof. Dr.-Ing. Jörg Krüger, chair of the STC-A of CIRP,for their continuous support, encouragement and sponsorship of the seminar. Ourspecial thanks also go to Nancy Martin for her exceptional handling of the adminis-trative aspects of the seminar and for managing the communication with all delegates,organisers and publishers in what has been a very challenging time.
January 2020 Svetan RatchevChristian Wögerer

Organization
International Advisory Committee
J. Barata UNINOVA, PortugalA. Delchambre ULB, BelgiumM. Desmulliez Heriot-Watt University, UKM. Dickerhof Karlsruhe Institute for Technology, GermanyF. Dietrich TU, BerlinG. Dini University of Pisa, ItalyA. Drouot University of Franche-Comté, FranceK. Ehmann Northwestern University, USAI. Fassi STIIMA, ItalyP. Felli Free University of Bozen-Bolzano, ItalyM. Krieger CSEM, SwitzerlandP. Lambert ULB, BelgiumM. Lanz Tampere University, FinlandR. Leach University of Nottingham, UKP. Lutz ENSMM, FranceB. Nelson ETH, SwitzerlandM. Onori KTH, SwedenD. Pham University of Birmingham, UKG. Putnik University of Minho, PortugalA. Raatz Leibniz University of Hannover, GermanyJ. Segal University of Nottingham, UKM. Tichem TU Delft, NetherlandsT. Tolio Milan Polytechnic, Italy

Contents
Keynote Paper
Augmented Reality in Assembly Systems: State of the Artand Future Perspectives . . . . . . . . . . . . . . . . . . . . . . . . . . . . . . . . . . . . . . 3
M. Dalle Mura and G. Dini
Assembly Design and Planning
Application of a Standardized Design Procedure in the Developmentof Automated Micro-assembly Processes . . . . . . . . . . . . . . . . . . . . . . . . . . 25
Gordon Saunders and Tobias Müller
Towards the Automated Coverlay Assembly in FPCB Manufacturing:Concept and Preliminary Tests . . . . . . . . . . . . . . . . . . . . . . . . . . . . . . . . . 36
Marcello Valori, Vito Basile, Simone Pio Negri, Paolo Scalmati,Chiara Renghini, and Irene Fassi
Resource Interface Matchmaking as a Part of AutomaticCapability Matchmaking . . . . . . . . . . . . . . . . . . . . . . . . . . . . . . . . . . . . . 51
Niko Siltala, Eeva Järvenpää, and Minna Lanz
Investigation on the Convergence of the Genetic Algorithmof an Aerodynamic Feeding System Due to the Enlargementof the Solution Space . . . . . . . . . . . . . . . . . . . . . . . . . . . . . . . . . . . . . . . 63
Torge Kolditz, Caner-Veli Ince, and Annika Raatz
Assembly Operations
Indirect System Condition Monitoring Using Online BayesianChangepoint Detection. . . . . . . . . . . . . . . . . . . . . . . . . . . . . . . . . . . . . . . 81
Emil Tochev, Harald Pfifer, and Svetan Ratchev
Strategies for Dealing with Problems in Robotised Unscrewing Operations. . . 93Jun Huang, Duc Truong Pham, Ruiya Li, Kaiwen Jiang, Dalong Lyu,and Chunqian Ji
Improving Automated Insertion Task in Robotics by ReducingRegistration Error . . . . . . . . . . . . . . . . . . . . . . . . . . . . . . . . . . . . . . . . . . 108
Geraldine S. Cheok, Marek Franaszek, Karl Van Wyk,and Jeremy A. Marvel

Assembly Cells and Systems
Development of a Sensitive Winding Application Based on a Serial Robotand Integrated Torque Sensors . . . . . . . . . . . . . . . . . . . . . . . . . . . . . . . . . 125
A. Kanso, M. Vette-Steinkamp, and R. Müller
High-Load Titanium Drilling Using an Accurate RoboticMachining System. . . . . . . . . . . . . . . . . . . . . . . . . . . . . . . . . . . . . . . . . . 140
Robert Brownbill, Philip Silk, Peter Whiteside, Windo Hutabarat,and Harry Burroughes
Application of Advanced Simulation Methods for the Tolerance Analysisof Mechanical Assemblies . . . . . . . . . . . . . . . . . . . . . . . . . . . . . . . . . . . . 153
Konstantinos Bacharoudis, Atanas Popov, and Svetan Ratchev
Development of a Low-Cost, High Accuracy, Flexible Panel Indexing Cellwith Modular, Elastic Architecture . . . . . . . . . . . . . . . . . . . . . . . . . . . . . . 168
Robert Brownbill and Adam Roberts
Context-Aware Plug and Produce for Robotic Aerospace Assembly. . . . . . . . 184David Sanderson, Emma Shires, Jack C. Chaplin, Harvey Brookes,Amer Liaqat, and Svetan Ratchev
Data Capture and Visualisation on a Shoestring: Demonstrating the DigitalManufacturing on a Shoestring Project. . . . . . . . . . . . . . . . . . . . . . . . . . . . 200
Michael J. McNally, Jack C. Chaplin, Giovanna Martínez-Arellano,and Svetan Ratchev
Digital Innovation Hubs for Enhancing the Technology Transferand Digital Transformation of the European Manufacturing Industry . . . . . . . 210
Minna Lanz, Jyrki Latokartano, and Roel Pieters
Plenoptic Inspection System for Automatic Quality Control of MEMSand Microsystems . . . . . . . . . . . . . . . . . . . . . . . . . . . . . . . . . . . . . . . . . . 220
Moritz A. Kirschmann, Jörg Pierer, Alexander Steinecker,Philipp Schmid, and Arne Erdmann
Human Centred Assembly
Automated Information Supply of Worker Guidance Systems in SmartAssembly Environment . . . . . . . . . . . . . . . . . . . . . . . . . . . . . . . . . . . . . . 235
Gerhard Reisinger, Philipp Hold, and Wilfried Sihn
Towards Human and Robot Collaborative Ergonomic Handling of LongParts with a Loose Grip . . . . . . . . . . . . . . . . . . . . . . . . . . . . . . . . . . . . . . 249
Michael Hofmann, Markus Ganglbauer, Matthias Propst,Christian Wögerer, and Andreas Pichler
viii Contents

Human and Workcell Event Recognition and Its Application Areasin Industrial Assembly . . . . . . . . . . . . . . . . . . . . . . . . . . . . . . . . . . . . . . . 260
Matthias Propst, Sharath Chandra Akkaladevi, Michael Hofmann,Christian Wögerer, and Andreas Pichler
Cognitive Assistance to Support Maintenance and Assembly Tasks: Resultson Technology Acceptance of a Head-Mounted Device . . . . . . . . . . . . . . . . 276
Cornelia Gerdenitsch, Lisa Deinhard, Bettina Kern, Philipp Hold,and Sebastian Egger-Lampl
Usability Study of Learning-Based Pose Estimation of Industrial Objectsfrom Synthetic Depth Data . . . . . . . . . . . . . . . . . . . . . . . . . . . . . . . . . . . . 285
Stefan Thalhammer, Timothy Patten, and Markus Vincze
Assistance Methods in Assembly
Assistance Needs in Production Environments: A Contextual Explorationof Workers’ Experiences and Work Practices . . . . . . . . . . . . . . . . . . . . . . . 299
Thomas Meneweger, Verena Fuchsberger, Cornelia Gerdenitsch,Sebastian Egger-Lampl, and Manfred Tscheligi
Attention Analysis for Assistance in Assembly Processes . . . . . . . . . . . . . . . 310Lucas Paletta
Live Video Assistance Systems for Assembly Processes . . . . . . . . . . . . . . . 324Christian Kittl and Markus Streibl
Orchestration and Situation Awareness in an Assistance Systemfor Assembly Tasks. . . . . . . . . . . . . . . . . . . . . . . . . . . . . . . . . . . . . . . . . 332
Wernher Behrendt and Felix Strohmeier
Safety as Bad Cop of Physical Assistance Systems? . . . . . . . . . . . . . . . . . . 344Michael Rathmair and Mathias Brandstötter
The Consideration of Job Satisfaction in the Design of Assistance Systemsin Production . . . . . . . . . . . . . . . . . . . . . . . . . . . . . . . . . . . . . . . . . . . . . 358
Stelios Damalas, Norah Neuhuber, and Peter Mörtl
Author Index . . . . . . . . . . . . . . . . . . . . . . . . . . . . . . . . . . . . . . . . . . . . 369
Contents ix

Keynote Paper

Augmented Reality in Assembly Systems:State of the Art and Future Perspectives
M. Dalle Mura and G. Dini(B)
Department of Civil and Industrial Engineering, University of Pisa, 56122 Pisa, [email protected]
Abstract. Assembly represents a fundamental step in manufacturing, being atime-consuming and costly process, on which the final quality of the productmostly depends. Augmented Reality (AR) may represent a key tool to assistworkers during assembly, thanks to the possibility to provide the user of real-time instructions and information superimposed on the work environment. Manyimplementations have been developed by industries and academic institutions forboth manual and collaborative assembly. Among the most remarkable examplesof the last few years are applications in guidance of complex tasks, training of per-sonnel, quality control and inspection. This keynote paper aims to provide a usefulsurvey by reviewing recent applications of AR in assembly systems, describingpotential advantages, as well as current limitations and future perspectives.
Keywords: Augmented reality · Assembly systems ·Manual assembly ·Collaborative assembly
1 Introduction
Assembly represents a key element in the whole fabrication process. The total cost ofa product, the time requested for completing it and its quality strictly depend on theefficiency and accuracy of execution of the different assembly steps.
Very often, these operations can be complex and require fine adjustments in orderto obtain an acceptable final result. The sequence can be lengthy, with many parts tobe assembled together in a specific order, so as to assure the product to function as itshould.
For these reasons, theworkers should be skilled and trained to do that within the cycletime imposed by the production rate. In many cases, the sequence can be dependent onthe variant to be assembled and can request the consultation of paper manuals, referencetables that could lead to time inefficiencies, distractions and, therefore, safety problems.
Typically, in manual assembly, the tasks are performed by human operators aidedby tools or by semi-automated machines. Set up and maintenance operations should beprovided and planned in advance for all equipment, so as to allow workers a proper useand avoid problems related to unexpected breakdowns, with consequent inactivity of theproduction system.
© The Author(s) 2021S. Ratchev (Ed.): IPAS 2020, IFIP AICT 620, pp. 3–22, 2021.https://doi.org/10.1007/978-3-030-72632-4_1

4 M. Dalle Mura and G. Dini
A relevant problem in assembly is also represented by human errors. Obviously, anerror should be prevented by using different methods such as training sessions, sensingdevices or poka-yoke solutions. These approaches are often expensive and in manycases do not give a complete assurance of avoiding these inconveniences. Human errorsin assembly may result in increased production wastes or higher processing time andcosts, also worsening the quality level of products because of manufacturing defects. Toavoid possible damage to the entire production system, the probability of human errorsin assembly should be reduced.
That said, the need of integrating the traditional manual assembly with a tool ableto enhance the efficiency and the efficacy of the process becomes evident. The operatormust be supported and guided in his/her actions through the accomplishment of assemblyoperations by non-invasive devices, which allow the user not to deflect attention anddistract from the process. The tool should also be connectable to the hardware employedin the system, such as sensors, and able to access and consult software databases, inorder to help the operator in executing the tasks as efficiently and effectively as possible.
Augmented Reality (AR) technology could be particularly suitable to address theseissues. The possibility of replacing paper manuals with interactive instructions allowsthe worker to interact with both the real environment and the virtual information, alsoreceiving a feedback on the operations made.
2 Basics on Augmented Reality
Augmented Reality (AR) can be defined as a hardware-software system able to overlayvirtual images or objects on the real world visual, in order to give to the observerinformation that he could not obtain by using only the interaction of his/her physicalsenses with the workplace.
The main objective of an AR system is therefore to create virtual elements in theoptical path linking the user’s eyes with the real scene in front of him/her. To do that,the following steps have to be implemented:
– real image acquisition, through a video camera that captures the images from the realworld;
– tracking, necessary to identify and record the position and orientation of objects in theenvironment, so as to properly align the virtual image. Widely employed are vision-based tracking systems, namely fiducial marker identification, which uses artificialmarkers to identify components in space, and markerless identification, which usesobject features;
– virtual image generation, through a computer that uses 3D CAD models to createdigitized contents;
– composite image generation, obtained by combining the real images captured bythe camera with the virtual images generated by the computer, so as to produce theaugmented content.
2.1 AR Techniques
The composite image can be generated using 3 different approaches which deeplycharacterize and influence the performance of a specific application:

Augmented Reality in Assembly Systems 5
– optical see-through, virtual images are projected in a transparent display positionedbetween the user’s eyes and the real scene (Fig. 1a);
– video see-through, real and virtual images are mixed and visualized on a monitordisplay positioned in front of the user (Fig. 1b);
Fig. 1. Different approaches used to obtain the augmented real scene in front of the worker: (a)optical see-through; (b) video see-through; (c) image projection.
– image projection, virtual images are directly projected onto the surfaces of the objectsin the real world (Fig. 1c).
2.2 AR Devices
An AR device identifies the hardware tool by which an operator can visualize the realscene in front of him/her enriched by the virtual elements. This device represents a veryimportant element of the whole AR system since it constitutes the mean that gives to thehuman the perception of an augmented workplace.
In order to fulfill the previous conditions, an AR device should be:
– realistic: an AR system which operates interactively in real time and in threedimensions should give a “real” interpretation and sensation of the augmentedenvironment;
– immersive: virtual objects and information are integrated with the real environment,in order to give a 3D perception of the scene and therefore an immersive feeling tothe worker to be surrounded by a mixed real-virtual environment;
– comfortable: wearable devices must ensure portability and be non-invasive, so as notto detract the attention from the process.

6 M. Dalle Mura and G. Dini
Many solutions have been proposed in the last decade by different manufacturersand tested by researchers and industries. Four categories can be identified to be usedin a workplace, depending on their position with respect to the user and to the realenvironment:
– head mounted devices (HMD): these visual displays are worn on the user’s head.Advantages on using an HMD are that they are hands-free and give an immersiveperception to the user, since the display with AR scene is positioned to the eye-level,while a current drawback is that they may be uncomfortable and the user could sufferof eye strain, especially after prolonged use. Among most well-known HMD, thereare AR glasses, such as Microsoft HoloLens, Magic Leap One and Google Glasses;
– hand held devices (HHD): among these, there are smartphones and tablets. The mainadvantage with respect to an HMD is the possibility to be held only when necessary.However, they are less immersive, not hands-free and this could limit the worker inhis/her actions;
– spatial devices (SD): they consist of displays of different sizes placed statically withinthe environment, not suited for mobile solutions;
– projection devices (PD): these solutions have the advantage of giving a very goodmobility to the user. However, they need to be calibrated, they request flat and widesurfaces in the work area for projecting images and suffer of user obstructions.
Some of these types of devices are best suited to operate with certain visualizationapproaches of AR contents, as presented in Table 1. In particular HMDs can effectivelyoperate either in video see-through and optical see-through modes.
Table 1. AR devices capability to be used in the three composite image generation approaches.
Video see-through Optical see-through Image projection
Head mounted devices X X
Hand held devices X
Spatial devices X
Projection devices X
Other manufacturers are proposing innovative andmore powerful devices, nowadaysunder development, such as AR contact lenses (or smart lenses) to be used as accessoryto smartphones or as a separate device. Smart contact lens technology aims to projectimages into the wearer’s eyes, through little display, camera and antenna inside the lens,where sensors are controlled by wearer’s blinking [1]. Other researches are working onthe development of new AR hardware, such as head-worn projectors [2] and VirtualRetinal Displays (VRD), which create the augmented images by projecting laser lightdirectly into the worker’s eye.
These last solutions, even if they aim at obtaining a more immersive impact to theuser, at the current stage of development are far from a practical use and the absence ofrisks for the worker has to be proved.

Augmented Reality in Assembly Systems 7
2.3 AR Applications in Production Engineering
In recent years, AR techniques are spreading out in any field, from retail to military,from healthcare to education, gaming, travel, tourism, etc.
Production engineering, in particular, represents an area having a more and moreincreasing interest in this kind of tools able to be used in many activities, such as:
– worker support in performing complex operations, using virtual instructions duringparticular tasks and preventing the user from doing wrong actions that may involveerrors, with time-related costs;
– guided training, accomplished through AR tools for teaching procedures andinstructions conceived and addressed to unexperienced personnel;
– remote support and maintenance, thanks to the possibility of providing the compositeimage to the worker on the field and, remotely and simultaneously, to the expertmaintenance technicians [3];
– other potential applications, such as real-time factory diagnostics or colleaguecollaboration and communication.
As said before, assembly represents a typical area of production engineering wherethis kind of technique may be profitably used, due to the strong need of supports andinteractive tools in performing complex and articulated tasks, which can be encounteredin assembly procedures.
The aim of this survey is therefore to provide a comprehensive insight on the stateof the art of AR applications in assembly systems, as well as some current open issuesthat need to be overcome.
3 Applications in Manual Assembly Systems
Many applications have been experimented in manual assembly systems, mainly tosupport operators in performing correctly an assembly sequence. Extensive surveys havebeen published in 2012 and 2016 [4, 5], which demonstrate that from the beginning ofthis century, augmented reality is receiving increasing attention by researchers workingon assembly problems.
In this wide literature scenario, a first rough subdivision can bemade considering thatthe contributions can be addressed to “real industrial” and to “demonstrative” cases. Theformer concerns the implementation of an AR systems for supporting a real industrialproblem (e.g.: assembly of an engine or a car body) and represents the main topic ofthis survey paper, the latter represents the experimental demonstration of procedures byusing simple parts or toys, used as benchmarks.
These last contributions are often used to test specific hardware or software, such as in[6, 7], where the use of a smartphone, a Microsoft HoloLens and an Epson Moverio BT-200 smart glasses are compared with the use of paper-based instructions. Nevertheless,the contribution demonstrates that, on the one hand, users are able to solve the task ofassembly a Lego Duplo set fastest when using paper instructions, but, on the other, madefewer errors with AR support (Fig. 2).

8 M. Dalle Mura and G. Dini
Fig. 2. HMD used to support simple assembly tasks of LEGO® bricks (source: [7]).
Fig. 3. Guidance in taking an object from a bin (source: [9]).
Other “non-industrial” cases often concern the assembly of furniture, which are verygood as demonstrators, such as the research described in [8], where Microsoft HoloLensare used.The tests show that good results are achieved for assemblywith high complexity.
3.1 Guidance in Assembly Tasks – Optical and Video See-Through Approaches
Guidance in performing assembly tasks undoubtedly represents the typical objective ofmany AR applications. In most cases, optical or video see-through approaches are usedto guide assembly operations.
An example of a system used to substitute paper list in assembly operations is givenin [9] and illustrated in Fig. 3. TheAR application is developed for aMicrosoft HoloLenshardware and the information is presented to the worker via a head-mounted display.The system is able to show a virtual “tunnel” indicating to the worker the bin where thepart is placed, demonstrating its time-efficiency both for single kit and batch preparation.
Other applications concern the use of AR devices for guiding the correct executionof assembly operations. In [10], a prototype system is developed for providing differentmodality of guidance based on the different cognition phases of the user, i.e. perception,attention, memory and execution, in order to give appropriate information during assem-bly tasks. The prototype adopts an HMD and a 3D bare-hand interface, free from anydevices, such as mouse or keyboard. In experiments concerning a motorbike alternator

Augmented Reality in Assembly Systems 9
assembly, users proved to execute operations more quickly and accurately in comparisonto a digital documentation on an LCD.
The study presented in [11] is focused on an AR video see-through support that asso-ciates different visual features to explain assembly operations with different difficultylevel: the more the task to perform is complex, the easier to understand is the instructiongiven by the visual feature (Fig. 4). The results show that the method outperforms paperinstructions.
A voice-based interaction technique is integrated with an augmented reality systemfor car assembly and disassembly in the work proposed in [12]. The speech signalis used to interact with the augmented reality environment, made of the virtual car’scomponents visualized in the real scene. The voice commands, converted into textualcommands, leave both hands free, so as to allow the user to manipulate the variouscomponents.
Fig. 4. Example of instructions given to the worker concerning: a) a scheme of the assemblyoperation; b) the assembly location; c) information regarding the next step; d) the next part toassemble (source: [11]).
In addition to hearing, AR has been combined with other human senses to overcomesome drawbacks that may occur when only using this technology. An example is pre-sented in [13], where a real-time vibrotactile guidance method is developed to supportassembly tasks. The system uses a web camera, located on top of the workstation, torecognize components and user hands, and a vibrotactile wristband to give the user afeedback on the action made in the form of vibration.
3.2 Guidance in Assembly Tasks – Image Projection Approaches
Image projection is often used in assembly workplaces for its intrinsic capability ofleaving the worker free of moving without carrying AR devices on his/her body. Thesesystems, as the previous ones, eliminate the need for hard copy or monitor-based workinstructions, and create a sort of digital “operating canvas” on a work surface.

10 M. Dalle Mura and G. Dini
A projector-based AR tool is in general more simple with respect to a video see-through or an optical see-through system and also more intuitive as regards its use bythe operator, throughout every step of a manual process: what they have to do is followthe lights projected on the workbench or on the parts, as illustrated in Fig. 5 [14].
Fig. 5. Assembly instructions projected on the workbench and on the parts (source: [14]).
At Dassault Aviation, an image projection AR system named Diota’s [15] is usedto guide operators in complex assembly tasks performed inside the panels of fuselagestructures. Instructions related to operations to be performed and machine types to beused are displayed on the assembly. Figure 6 demonstrates how the system works, alsoshowing the obstruction generated by the presence of the worker, typical problem inthese kinds of systems.
Fig. 6. AR projection systems used at Dassault Aviation (source: [15]).
Another approach of image projection is shown inFig. 7 [16]. The systemuses a panelplaced near the operator, where instructions are projected to avoid major drawbacks ofan HMD, such as poor comfort, need for special versions for users who wear eyeglassesand limited field of view. To step through the assembly sequence and review previousinstructions, the worker uses foot pedals; in this way, hands are kept free from the ARdevice and the worker does not interrupt the assembly process.

Augmented Reality in Assembly Systems 11
Fig. 7. Presentation of picking information and assembly instruction on a projection-based ARassembly station (source: [16]).
3.3 Guidance in Complex Assembly Tasks
Guidance in complex assembly tasks is essential for performing this kind of operationsand for avoiding errors or time consuming procedures. Usually, these tasks are accom-plished by using reference manuals and forcing the worker to read several pages of paperinstructions.
Fig. 8. Head-mounted display used at NASA for assembling spacecraft parts (source: [17]).
Typical complex assembly tasks can be encountered in aerospace industry. NASAuses HoloLens AR headsets [17] to faster build a new spacecraft and assemble the crewcapsule Orion, as shown in Fig. 8. Boeing has developed smart glasses and an ARapplication for wiring harness operations. The system enables assemblers to easily seewhere the electrical wiring goes in the aircraft fuselage and this allows a significantreduction of errors and production time [18].
A particular situation of complex assembly is represented by performing operationsin areas not directly visible by the user. Thework proposed in [19] uses a trackingmethodto acquire information on the position of target objects in real time, to be combined withthe digitized model of parts and human hands in the invisible area, superimposed on theassembly scene (Fig. 9). The method demonstrated an improved efficiency and accuracycompared to the assembly without augmented reality assistance.

12 M. Dalle Mura and G. Dini
Fig. 9. Screw positioning, aided by AR system, inside a box in area not directly visible by theworker (source: [19]).
Complex assembly tasks can be also encountered in mounting electrical compo-nents. A tutoring system for motherboard assembly has been developed in [20]; theprototype uses an HMD to teach novice users the assembling of hardware componentson a computer motherboard.
3.4 Order Picking
Order picking is a fundamental process in any production plant, to find and take thecorrect parts and products from a warehouse, just before assembly tasks. Companies arecontinuously looking for new methods to improve such a costly process, for which ARcan represent an innovative solution.
In an application made in automotive industry, workers can automatically receive allthe information they need directly in their field of vision, such as storage locations orpart numbers, by using smart glasses (Fig. 10). The camera mounted in this device canbe also used as a barcode reader: when a worker selects the correct part, the barcode isshown in green, if not, it is illuminated in red [21].
Fig. 10. Smart glasses used in order picking operations (source: [21]).
3.5 Quality Control and Inspection
Quality control and inspection represent important steps in an assembly sequence. Inmany cases, they could request instruments and a comparison with reference values.

Augmented Reality in Assembly Systems 13
For these reasons, AR systems are very suitable for this kind of application and canefficiently support operator in this critical phase.
An example is reported in Fig. 11, where an HHD using a video see-through systemis employed to determine the correct position of the rear light of vehicle and its alignmentwith respect to the surrounding body panels [22].
Fig. 11. A video see-through method for inspection of parts after assembling (source: [22]).
Also Renault Trucks is using AR for quality control in assembly lines [23]. Qual-ity control operators wear Microsoft HoloLens smart glasses to improve inspectionoperations during engine assembly, as shown in Fig. 12.
Fig. 12. Microsoft HoloLens smartglasses used for quality control of Renault Trucks engines(source: [23]).
In the aerospace industry, an AR tool for quality control was developed by AirbusGroup, for fuselage section inspection during assembly. The tool consists of an HHDthat quickly detects errors, in order to optimize inspection time, while reducing the riskof deviations in conformity [24].
3.6 Integration with Sensing Devices
Since the sole use of AR could not provide feedback signals for a closed-loop controlon the tasks executed by the operator, in manual assembly lines AR-based systems are

14 M. Dalle Mura and G. Dini
strongly requested to be integrated with sensors, able to give to the user appropriatephysical values of the process [25]. Indeed, AR can be integrated with sensing devicesto create a synergistic system in which the limits of one may be filled by the other. ARcan thus be employed to guide the operator in carrying out the correct action and toprovide a support to recover any committed errors.
For this purpose, the contribution described in [26] proposes a configuration of amanual assembly workstation integrating the use of a sensing device and augmentedreality equipment, in order to guide the actions performed by the worker. Figure 13shows the scheme of the system obtained by the integration of a force sensor, able todetect a part of assembly errors not relievable by the AR camera.
Fig. 13. A workstation integrating AR with a force sensor for error detection during assembly(source: [26]).
3.7 Training
Starting from the consideration that an AR system, in principle, can be used both forguiding expertise workers and for training unexperienced users, the difference betweenthese two applications relies in the level of instructions given by the system.
In an AR system used for training, the sequence of instructions and the virtualobjects used to guide the operator take into account the fact that he/she does not haveany experience on a given assembly procedure. In this case, even very simple assemblytasks are explained in detail, showing also elementary information about the use of atool or safety principles.
For example, the assembly line shown in Fig. 14, equipped with AR projectors,provides different assembly instructions according to the skill level of workers [27].
Other examples are described in [28], where the training platform has been testedon an actuator assembly, and in [22, 29] where an HMD-based training system is usedat the BMW Group Production Academy on an engine assembly (Fig. 15).

Augmented Reality in Assembly Systems 15
Fig. 14. AR assembly line equipped with PDs (source: [27]).
Fig. 15. AR-assisted training developed at BMW Group Production Academy (source: [22]).
Training can be also efficiently performed through virtual assembly. An example ofaugmented reality system developed for training, which uses a low-invasiveness handtracking device, is reported in [30]. The proposed methodology enables the user tointeract with the virtual objects, acquiring the pose of all the fingers of both hands by amarkerless optical triangulation, as reported in Fig. 16.
4 Applications in Collaborative Assembly Systems
The recent introduction of collaborative robots in assembly lines has led to the devel-opment of new fields of study, mainly concerning the safety of the work environmentshared between human and robot. Also in this regard, ARmay be beneficial, particularlyin providing virtual information on the real workplace, to enhance situational awarenessfor the worker, to support spatial dialog among human and robot and to enable evenremote collaboration.

16 M. Dalle Mura and G. Dini
Fig. 16. Sequence of virtual assembly by augmented reality (source: [30]).
The main topics currently treated in the field of AR applications for human-robotcollaboration are in particular the development of Human Robot Interface (HRI) and theenhancement of worker’s safety perception.
An application of AR in Human-Robot-Interface is given in [31]. The researchfocuses on the study of an AR solution for increasing human confidence and trust in col-laborating with robots. The work describes the design and development of an interfacesystem that shows virtual animation of the robot movements to the operator in advanceon the real workplace, in order to improve human safety.
Fig. 17. Application of a see-through AR system to assist an operator in a cooperative work witha robot (source: [32]).
A typical application concerning the worker’s safety perception when working closeto an industrial robot is given in [32]. The main information provided by the system areassembly related instructions, robot workspace and trajectory visualization. The system,as illustrated in Fig. 17, was tested on a real case study derived from the automotiveindustry and demonstrated to optimize the time for assembly and the worker’s safetyperception in an HRC environment. Other examples can be found in [33], where an

Augmented Reality in Assembly Systems 17
AR system for collaborative cooperation between a robotic assembly unit and a humanworker has been developed by EON Reality, or in [34], where virtual instructions aregiven to workers to perform simple assembly tasks in cooperation with a robot (Fig. 18).
Fig. 18. Virtual instructions given during a collaborative work between a human and a robot(source: [34]).
5 Other Potential Areas of Application
AR techniques could be also useful in other areas concerning assembly process andassembly systems. Among them, the most promising and with the highest potential ofdevelopment are:
– assembly layout planning. AR devices could be used for: i) obtaining a graphicaloverlay of the new equipment onto the existing ones; ii) performing visual check forcollisions or for available spaces in transportation systems such as forklifts;
– workplace ergonomics, such as the detection of the reachability of objects in a manualassembly station using a digital human model superimposed on the real scene, orthe graphical overlay of different workspace zones containing all elements within agrasping distance, with no need to bend or walk forward;
– assembly process evaluation, in particular the evaluation of aspects such as the assem-bly sequencing, the assembly path visualization, the assembly accessibility with col-lision detection among parts, the ergonomic use of tools, the co-working, all of themto be made thanks to the integration with sensing devices (e.g.: haptic interfaces).
6 Open Issues and Future Perspectives
Despite the significant progress of AR technology and applications in recent years, somelimitations to be solved still occur. The main limits of AR implementation in assemblysystems concern the following aspects:

18 M. Dalle Mura and G. Dini
– hardware and software performance,– tracking methods,– user’s acceptance,– authoring procedure.
They represent limits but, consequently, issues to be enhanced by the research com-munity and therefore future perspectives for AR to more effectively assist assembly inthe near future.
6.1 Hardware and Software Performance
Hardware performance is a key-element for obtaining efficient solutions. Nowadaysthis aspect presents some limits, even if it is increasingly improving. Features such ascomfort for the user, wider field of view, comprehension of the environment, and, mostimportantly, more natural human machine interface through NLP (Natural LanguageProcessing), hand and eye tracking are very important and many manufacturers areworking on improving them.
Another open issue is “latency”, which refers to the error of misalignment amongvirtual objects resulting from the delay between themovement of the user and themomentin which the changed image is displayed, with respect to the new position of the user[11]. To solve this problem, Waegel and Brooks [35] developed a low latency inertialmeasurement unit (IMU) and proposed new 3D reconstruction algorithms.
6.2 Tracking Methods
Among tracking methods, AR systems for assembly applications mainly use the marker-based approach, thanks to its stable and fast detection of markers in the entire imagesequence. Valuable features are accuracy, flexibility, robustness, computation efficiencyas well as ease of use. However, significant drawbacks of this tracking method areincorrect registration in the field of view due to marker occlusion and impossibility ofusing markers on many industrial components for their small size.
Tracking should be enhanced to create a good orientation of virtual contents withrespect to the user’s field of view. For example, Microsoft HoloLens 2 has implementedsome tracking additions and improvements which are very beneficial to the workers.Gesture recognition, eye and hand tracking working together may provide to workers amore contextual interaction with virtual objects.
Marker-less tracking is considered the natural successor of marker-based approach.Among these techniques is Simultaneous Localization and Mapping (SLaM), whichallows to build up a map within an unprepared environment, simultaneously keepingtrack of the current location, by extracting scene features.
The importance of this issue is also demonstrated by another contribution [36], wherea method using the combination of point cloud and visual feature mechanical assemblysystem is used to create a tracking method. The accuracy is presented through a pumpassembly case study and the results show that the tracking trajectory estimated by the

Augmented Reality in Assembly Systems 19
method is very close to the real one and better than other methods, obtaining a goodalignment of objects.
6.3 User’s Acceptance
As far as the user’s acceptance is concerned, research conducted in real work environ-ment shows that operators could prefer AR over conventional methods of instruction[37]. Users generally give positive feedbacks when experiencing AR, especially forthe possibility for non-experts to perform complex tasks and for the reduced mentalworkload on the user. However, this applies to AR systems implemented with care andattention to details on the interface and the content within presented to the user [37].Moreover, to feel for the user that a task is worth using the AR support, its complexitymust be high enough, as discussed in [38].
6.4 Authoring Procedure
Another important open issue is represented by the complexity of authoring in ARapplications: an effective AR system requires a deep analysis of several aspects relatedto the assembly procedure (assembly sequence, instructions to be given to the operators,tools and fixtures, work environment, etc.) and its implementation in the AR platformand software.
A proposal of standard guidelines has been given in [39], with advantages to obtaintime saving, error reduction and accuracy improvement.
Another contribution in this field has been given in [37] with the creation of ARwork instructions for assembly using a new form of authoring, based on an expertrecorded performing the assembly steps, automatically processed to generate AR workinstructions.
An authoring tool has been also developed by BMW Group in order to support andsimplify the design of AR training programs [22].
7 Conclusions
This paper presents a comprehensive survey of AR research and development in assem-bly systems. Many successful implementations made by industries and academic insti-tutions, both for manual and collaborative assembly, are described, as well as currentopen issues to be overcome.
According to the analysis of the state of the art conducted, it is possible to con-clude that augmented reality, after an important and still existing experimental stage,is becoming increasingly utilized in industrial applications and the sector is in constantexpansion. The potential contribution of this technology to facilitate faster and correctoperations encourages the market to a continuous evolution of hardware and softwaresystems, including aspects related to the portability and comfort of AR devices, for abest users’ acceptance. Furthermore, the latest developments in tracking and authoringprocedures aim at more robust and sophisticated systems.

20 M. Dalle Mura and G. Dini
References
1. PerfectLens.ca Homepage. https://www.perfectlens.ca/articles/7-exciting-developments-augmented-reality-contacts Accessed 15 Nov 2019
2. Soomro, S.R., Urey, H.: Augmented reality 3D display using head-mounted projectors andtransparent retro-reflective screen. In: Advances in Display Technologies VII, vol. 10126,p. 101260E. International Society for Optics and Photonics (2017)
3. Dini, G., Dalle Mura, M.: Application of augmented reality techniques in through-lifeengineering services. Procedia Cirp 38, 14–23 (2015)
4. Nee, A.Y.C., Ong, S.K., Chryssolouris, G., Mourtzis, D.: Augmented reality applications indesign and manufacturing. CIRP Ann. Manuf. Technol. 61(2), 657–679 (2012)
5. Wang, X., Ong, S.K., Nee, A.Y.C.: A comprehensive survey of augmented reality assemblyresearch. Adv. Manuf. 4(1), 1–22 (2016)
6. Blattgerste, J., Strenge, B., Renner, P., Pfeiffer, T., Essig, K.: Comparing conventional andaugmented reality instructions formanual assembly tasks. In: Proceedings of the 10th Interna-tional Conference on PErvasive Technologies Related to Assistive Environments, pp. 75–82(2017)
7. Blattgerste, J., Renner, P., Strenge, B., Pfeiffer, T.: In-situ instructions exceed side-by-sideinstructions in augmented reality assisted assembly. In: Proceedings of the 11th PErvasiveTechnologies Related to Assistive Environments Conference, pp. 133–140 (2018)
8. Deshpande,A.,Kim, I.: The effects of augmented reality on improving spatial problem solvingfor object assembly. Adv. Eng. Inform. 38, 760–775 (2018)
9. Hanson, R., Falkenström, W., Miettinen, M.: Augmented reality as a means of conveyingpicking information in kit preparation for mixed-model assembly. Comput. Ind. Eng. 113,570–575 (2017)
10. Wang, X., Ong, S.K., Nee, A.Y.C.: Multi-modal augmented-reality assembly guidance basedon bare-hand interface. Adv. Eng. Inform. 30(3), 406–421 (2016)
11. Radkowski, R., Herrrema, J., Oliver, J.: Augmented reality-based manual assembly supportwith visual features for different degrees of difficulty. Int. J. Hum.-Comput. Interact. 31(5),337–349 (2015)
12. Aouam,D., Benbelkacem, S., Zenati, N., Zakaria, S.,Meftah, Z.:Voice-based augmented real-ity interactive system for car’s components assembly. In: 2018 3rd International Conferenceon Pattern Analysis and Intelligent Systems (PAIS), pp. 1–5 (2018)
13. Arbeláez, J.C., Viganò, R., Osorio-Gómez, G.: Haptic Augmented reality (HapticAR) forassembly guidance. Int. J. Interact. Des. Manuf. (IJIDeM) 13, 673–687 (2019)
14. Light Guide System Homepage. https://lightguidesys.com/blog/projector-based-augmented-reality-new-form-enterprise-ar/ Accessed 15 Sept 2019
15. Dassault Systems Homepage. https://blogs.3ds.com/delmia/2017/07/error-free-manufacturing-immersive-technologies-reduce-errors-and-detect-them-faster/ Accessed 15 Sept 2019
16. Funk, M., Kosch, T., Kettner, R., Korn, O., Schmidt, A.: An overview of 4 years of combiningindustrial assembly with augmented reality for industry 4.0. In: Proceedings of the 16thInternational Conference on Knowledge Technologies and Datadriven Business, p. 4 (2016)
17. TechnologyReviewHomepage. https://www.technologyreview.com/s/612247/nasa-is-using-hololens-ar-headsets-to-build-its-new-spacecraft-faster/ Accessed 15 Sept 2019
18. Assembly Magazine Homepage. https://www.assemblymag.com/articles/94979-the-reality-of-augmented-reality Accessed 13 Jan 2020
19. Wang, Z., Zhang, S., Bai, X.: Augmented reality based product invisible area assemblyassistance. In: 2018 3rd International Conference on Control, Automation and ArtificialIntelligence (CAAI) (2018)

Augmented Reality in Assembly Systems 21
20. Westerfield, G., Mitrovic, A., Billinghurst, M.: Intelligent augmented reality training formotherboard assembly. Int. J. Artif. Intell. Educ. 25(1), 157–172 (2015)
21. Assembly Magazine Homepage. https://www.assemblymag.com/articles/93129-vw-tests-smart-glasses-for-order-picking Accessed 13 Jan 2020
22. BMW Group Homepage. https://www.press.bmwgroup.com/global/article/detail/T0294345EN/absolutely-real:-virtual-and-augmented-reality-open-new-avenues-in-the-bmw-group-production-system?language=en Accessed 09 Sept 2019
23. Next Reality Homepage. https://hololens.reality.news/news/renault-trucks-tests-hololens-visualize-quality-control-engine-assembly-operations-0181282/ Accessed 15 Sept 2019
24. Aerocontact Homepage. https://www.aerocontact.com/en/aerospace-aviation-news/47138-the-assembly-of-the-future-is-already-a-reality-with-testia-s-sart-system Accessed 15 Sept2019
25. Iliano, S., Chimienti, V., Dini, G.: Training by augmented reality in industrial environments:a case study. In: Proceedings of 4th CIRP Conference on Assembly Technology and Systems,Ann Arbor (2012)
26. Dalle Mura, M., Dini, G., Failli, F.: An integrated environment based on augmented realityand sensing device for manual assembly worstations. Procedia Cirp 41, 340–345 (2015)
27. Funk, M., Bächler, A., Bächler, L., Kosch, T., Heidenreich, T., Schmidt, A.: Working withaugmented reality: a long-term analysis of in-situ instructions at the assembly workplace.In: Proceedings of the 10th International Conference on Pervasive Technologies Related toAssistive Environments, pp. 222–229 (2017)
28. Gavish, N., et al.: Evaluating virtual reality and augmented reality training for industrialmaintenance and assembly tasks. Interact. Learn. Environ. 23(6), 778–798 (2015)
29. Werrlich, S., Nitsche,K.,Notni, G.:Demand analysis for an augmented reality based assemblytraining. In: Proceedings of the 10th International Conference on PErvasive TechnologiesRelated to Assistive Environments, pp. 416–422 (2017)
30. Valentini, P.P.: Natural interface for interactive virtual assembly in augmented reality usingleap motion controller. Int. J. Interact. Des. Manuf. (IJIDeM) 12(4), 1157–1165 (2018)
31. Palmarini, R., Del Amo, I.F., Bertolino, G., Dini, G., Erkoyuncu, J.A., Roy, R., Farnsworth,M.: Designing anAR interface to improve trust in human-robots collaboration. Procedia CIRP70, 350–355 (2018)
32. Makris, S., Karagiannis, P., Koukas, S., Matthaiakis, A.S.: Augmented reality system foroperator support in human–robot collaborative assembly. CIRP Ann. 65(1), 61–64 (2016)
33. EON Homepage. https://www.eonreality.com/use-cases/augmented-virtual-reality-manufacturing/ Accessed 28 Aug 2019
34. Danielsson, O., Syberfeldt, A., Brewster, R., Wang, L.: Assessing instructions in augmentedreality for human-robot collaborative assembly by using demonstrators. Procedia CIRP 63,89–94 (2017)
35. Waegel, K., Brooks, F.P.: Filling the gaps: hybrid vision and inertial tracking. In: 2013 IEEEInternational Symposium on Mixed and Augmented Reality (ISMAR), IEEE (2013)
36. Wang, Y., Zhang, S., Wan, B., He, W., Bai, X.: Point cloud and visual feature-based trackingmethod for an augmented reality-aided mechanical assembly system. Int. J. Adv. Manuf.Technol. 99(9–12), 2341–2352 (2018)
37. Bhattacharya, B., Winer, E.H.: Augmented reality via expert demonstration authoring(AREDA). Comput. Ind. 105, 61–79 (2019)
38. Syberfeldt, A., Danielsson, O., Holm, M., Wang, L.: Visual assembling guidance usingaugmented reality. Procedia Manuf. 1, 98–109 (2015)
39. Chimienti, V., Iliano, S., Dassisti, M., Dini, G., Failli, F.: Guidelines for implementingaugmented reality procedures in assisting assembly operations. In: International PrecisionAssembly Seminar, pp. 174–179. Springer, Heidelberg (2010)

22 M. Dalle Mura and G. Dini
Open Access This chapter is licensed under the terms of the Creative Commons Attribution 4.0International License (http://creativecommons.org/licenses/by/4.0/), which permits use, sharing,adaptation, distribution and reproduction in anymedium or format, as long as you give appropriatecredit to the original author(s) and the source, provide a link to the Creative Commons license andindicate if changes were made.
The images or other third party material in this chapter are included in the chapter’s CreativeCommons license, unless indicated otherwise in a credit line to the material. If material is notincluded in the chapter’s Creative Commons license and your intended use is not permitted bystatutory regulation or exceeds the permitted use, you will need to obtain permission directly fromthe copyright holder.

Assembly Design and Planning

Application of a Standardized Design Procedurein the Development of Automated
Micro-assembly Processes
Gordon Saunders and Tobias Müller(B)
Fraunhofer Institut Für Produktionstechnologie, Aachen, [email protected]
1 Introduction
Automated precision assembly of e.g. optical systems requires development efforts inmanifold domains, such as part feeding, handling, alignment, bonding and quality con-trol. The use of systematic design procedure enables the rapid and complete developmentof new applications and use cases using existing equipment. Combined with modularequipment and subsystems, the use of a standardized design process significantly reducesdevelopment time and therefore costs. A generic methodology based on the functionaldecomposition of assembly task requirements and a coherent synthesis of functionalprocess building blocks can be an answer to reduced process ramp-up time, more stableprocesses and enable concurrent engineering for novel tool and process development.
The objective of this paper is to present a systematic design procedure for the devel-opment of automated production processes to the point of Technology Readiness Level5, or TRL 5, as defined by the European Union’s Horizon 2020 framework [1]. Thisdevelopment process includes the analysis of the assembly task, the identification andselection of promising process concepts, and the testing of said process concept feasi-bilities within the assembly environment. As a result, individual component processessolving themost substantial automation-specific issues are tested in a production-relevantenvironment. These results prove the practical validity of the assembly process on thecomponent-level, thereby fulfilling the TRL 5 criteria [2]. Ultimately, the results of thesecomponent validation tests are combined into a cohesive system, laying the groundworkfor the testing and validation of the entire process chain and paving the way to meetingTRL 6 criteria.
2 A Function-Based Design Procedure
An assembly task must be separated into its constituent parts to allow for a dynamicand complete concept generation phase. Doing so allows for the restructuring of a oncehomogenous and complicated problem intomany individual and clearly-defined subrou-tines. This clarity in purpose enables a more complete examination and problem-solvingprocess for each of the individual functions inherent within the assembly task withoutinadvertently omitting functional considerations by working on too complicated of a
© The Author(s) 2021S. Ratchev (Ed.): IPAS 2020, IFIP AICT 620, pp. 25–35, 2021.https://doi.org/10.1007/978-3-030-72632-4_2

26 G. Saunders and T. Müller
design problem. In this respect, the design procedure presenting in this paper aims todecompose a typical micro-assembly process chain into its constituent process blocks,subtasks, and functions. These functions support their associated process subtasks whichin turn make up their associated process blocks. Hence, these components can be viewedas hierarchical in nature and are depicted as such in Fig. 1 [3, 4].
Process Chain
Process Block Process Block
Subtask Subtask Subtask Subtask
Fun
ctio
n
Fun
ctio
n
Fun
ctio
n
Fun
ctio
n
Fun
ctio
n
Fun
ctio
n
Fun
ctio
n
Fun
ctio
n
Fun
ctio
n
Fun
ctio
n
Fun
ctio
n
Fun
ctio
n
Fun
ctio
n
Fun
ctio
n
Fun
ctio
n
Fun
ctio
n
Incr
easi
ng C
ompl
exity
Incr
easi
ng C
larit
y
Fig. 1. Functional decomposition hierarchy
This work follows an adapted procedural design strategy originally laid forth byUlrich and Eppinger (2013) [3]. Given a specific assembly task, this adapted strategyfollows a systematic and iterative procedure to develop a process design concept. That is,if the development process stalls at any given stage, work can be resumed at any previousstage using the same previously developed materials and preventing a complete restart.
The core principle of this design strategy revolves around the identification of cus-tomer needs and the hierarchical functional decomposition of the assembly task to gen-erate process concepts. Using these techniques allows for an adaptable problem-solvingprocedurewhile ensuring a complete solution via systematic functionmatching [4]. Eachstep of the overarching procedural design strategy is summarized in Fig. 2 and furtherclarified in the following descriptive text.
Identify Customer
Needs
Establish Targets
Generate Process
Concepts
Select Process
Concept(s)
Test Process
Concept(s)
Specify Final
Targets
Plan Develop-
ment
Given Assembly
Task
Develop Process Module
Fig. 2. Design procedure for use in process development
Identify Customer Needs - The identification of explicit and latent customer- and task-requirements through internal and external interviews, background research, as well asan examination of existing process concepts and the given assembly task.EstablishTargets - The transformation of previously identified customer and task require-ments into appropriate functional requirements that a successful assembly process mustsatisfy.Generate Process Concept(s) - The generation of process concept solutions that havethe potential to satisfy the functional requirements of the assembly task.

Application of a Standardized Design Procedure 27
Select Process Concept(s) - The refining of the pool of potential solutions by comparisonand analysis of the suitability of each solution with regards to the previously identifiedfunctional and customer requirements.Test Process Concept(s) - The feasibility testing of the subset of plausible processsolutions.Specify Final Targets - The determination of specifications for a complete process mod-ule and process chain based on the results of process concept testing and functionalrequirements.Plan Downstream Development - The planning of a construction and testing process fora prototype of the combined process module.
3 The Design Procedure in Practice
Ultimately, this procedure introduced in the previous section progresses from identifyingbasic needs of a given assembly task to providing a technically feasible proof of conceptfor the continued development of an automated micro-assembly process module. Thissection dissects and further explores each of these individual design steps in furtherdetail while discussing the tools and practical applications of each step as it relates to atheoretical process design challenge.
3.1 Identify Customer Needs
In order to fully understand the needs of the customer and therefore the requirements ofan automated micro-assembly process, the given assembly task must first be understoodwithin its context. In other words, knowledge of the status quo of both existing assemblyprocesses, as well as knowledge of automated micro-assembly systems in general, facil-itates a thorough analysis of the options present in micro-assembly automation. This isan exploratory role undertaken by the designer as the customer alone cannot provide orenumerate a complete and trustworthy list of his or her own needs. Rather, the customeris only aware of his or her own explicit requirements and may be unaware of their inter-pretationwithin the context of automatedmicro-assembly process. Research of the statusquo helps to reveal this hidden, or implicit, process requirements and, combined withknowledge of automated micro-assembly processes, provides a basis through whichfuture process concepts are generated as a component of the overarching proceduraldesign strategy in Fig. 2.
A review of the present status quo involves many approach vectors which can besimplified into two main categories: those pertaining to the given assembly task andthose pertaining to automated micro-assembly in general. First, the analysis of the givenassembly task can involve, among others, the inspection and documentation of the partto be assembled, the existing manual or semi-automatic assembly processes, the pro-duction processes of the component parts to be assembled, or the eventual use case ofthe assembly part. Such analysis should take care to document limitations and bottle-necks of existing process and interfaces. In particular, it must be noted that an automatedassembly process only serves to replace the existing assembly processes, leaving the pro-duction routines and customer use cases unaffected. Therefore, special attention should

28 G. Saunders and T. Müller
be given to first, how initial component error can be mitigated through module design,and second, that the part quality is preserved throughout use.
The second main approach to need identification involves needs based on automatedmicro-assembly processes in general. In this respect, designers must be well-educatedwith regards to process and equipment varieties present in the field of automated micro-assembly. This familiarity provides multiple benefits: not only does it assist in the gen-eration of concepts due to a breadth of options, but also allows the designer to interpretcustomer needs specific to automated micro-assembly and add additional unspokenneeds to support the new demands of automation.
This research of the status quo can be accomplished via multiple means. Both inter-nal and external interviews as well as site visits, academic background research, mar-ket research, and self-examination and experimentation with the existing process allassist the designer in the identification of customer needs. Additionally, limitations ofthe development or production environment can be considered as needs. Examples ofthese limitation-based needs include cost-limits, time-limits, and the reality of machineavailability.
3.2 Establish Target Specifications
A typical micro-assembly process chain can consist of five primary process blocks:part feeding, handling, alignment, bonding and handling again. Within the part feedingprocess block, parts to be assembled are first transported and delivered to the workingspace. Following this, the handling process involves the gripping and movement of partsinside the working space. Handling can be separated into two primary blocks to accountfor differences in functional demands—one pertaining to the the handling of multiplecomponents prior to joining and a second block pertaining to the handling of the joinedpart.
In contrast to the handling process, alignment focuses on the precise measurementand fine local manipulation of parts to match its desired configuration. The bondingprocess, performed in conjunction with the alignment process, involves the mechanicsused to join parts into a final assembly. Collectively, these five process blocks are picturedin Fig. 3 [5].
Part FeedingHandling
(Pre-Joining)Alignment Bonding
Handling(Post-Joining)
Fig. 3. Typical micro-assembly process chain
These process blocks allow for a simplified view of the process chain but are dividedon an inherently subjective basis. These overarching process blocks are too complexto allow for a thorough discussion of the inherent functional requirements present ineach. For this reason, the process blocks are further reduced into their subordinate tasks,offering a more nuanced lens through which to view the process chain.
A useful exercise to refine the process chain and therefore define subtasks is tocreate a process map. In such a map, blocks representing subtasks are characterized by

Application of a Standardized Design Procedure 29
the inputs, outputs, unique functional requirements of each and are connected by theflow of inputs and outputs to and from blocks. Subtasks are intentionally represented asgeneralized black boxes in order to avoid assuming process concepts, and are connectedby energy, material, and data flows with the use of arrows leading into and out ofvarious subtasks such as in Fig. 4. Through this exercise, the intricacies of the processdependencies are extracted. Furthermore, as this process map is a decomposition of thestandard micro-assembly process chain, it serves as a generalized foundation for micro-assembly solutions that can be further adapted to match the reality any given assemblytask.
Fig. 4. Subtask block with charted inputs and outputs for use in process maps
The benefits of using subtask identification as an intermediary tool are not immedi-ately shown but rather reflected later in the design chain. By refining and redefining theprocess chain using subtasks, functional requirements unique to a specific subtask areidentified that may have otherwise been overlooked. These constituent functions serveto continually narrow the scope of the each process step and form the basic buildingblock of the typical micro-assembly process chain. Functions at this level are single,task-specific, and solution-independent transformations of a given material, energy, ordata input into a prescribed output. These functions are required actions that a subtaskor process must fulfill and take the form of “the process module must ____.” Examplesof functions specific to the present assembly task include “the process module must gripthe part” or “the process module must calculate the required movement.”
The initial phase of function identification comes from three sources: the customer,the assembly task, and the decomposition of the subtasks found in the generalized processmap. Functions are created from customer needs through a transformation in perspective.In this vein, a customer need that requires “batch sizes of at least 25 parts” is representedin two functional requirements, that “the process module must accept a batch size of atleast 25 of each part” and “the process module must store at least 25 assembled tools”.Meanwhile, task-based functions stem from the technical requirements of the assemblytask aswell as the procedural and safety requirements of theworking environment. Thesefirst two sources account for the customization of the development process specific to agiven assembly task. Meanwhile, the third source, the standard functional decomposi-tion of typical micro-assembly subtasks, ensures that the customized requirements areimplementable within an automated assembly process. In later stages of development,specific solution configurations may require an additional fourth source of functions andreconsideration of the identified functional components.
Following the work of Galvao and Sato (2005), this body of functional parts canbe matched with their associated process subtasks and vice versa [6]. Should there be aperfect 1:1 matching of functions and subtasks, the marked intersections on the matrixwould lay perfectly on the diagonal. However, in most systems that is not the case.

30 G. Saunders and T. Müller
Portraying the function-subtask relationship in this way enables the analysis of subtaskand function interdependencies along the process chain. These interdependencies resultfrommultiple subtasks sharing an individual function or frommultiple functions sharingan individual subtask and are represented on the matrix by rows or columns with morethan one point of intersection. This results in vertical or horizontal sections that causeclumps or deviations from a perfect diagonal line, such as the identified regions in Fig. 5.These regions are of particular interest in the concept generation phase, as these areasof interdependency identify complex problem areas and require solutions that satisfymultiple requirements simultaneously. Shared functions and subtasks are accounted forin the design of process concepts by ensuring that the shared function is satisfied in allassociated subtasks and that subtask concepts balance the needs of multiple functions.
Source Sub
task
AS
ubta
skB
Sub
task
CS
ubta
skD
Sub
task
ES
ubta
skF
Sub
task
GS
ubta
skH
Sub
task
IS
ubta
skJ
Sub
task
KS
ubta
skL
Sub
task
MS
ubta
skN
Function 1 CustomerFunction 2 StandardFunction 3 CustomerFunction 4 StandardFunction 5 StandardFunction 6 StandardFunction 7 StandardFunction 8 StandardFunction 9 StandardFunction 10 StandardFunction 11 StandardFunction 12 TaskFunction 13 TaskFunction 14 StandardFunction 15 StandardFunction 16 StandardFunction 17 StandardFunction 18 TaskFunction 19 CustomerFunction 20 CustomerFunction 21 StandardFunction 22 CustomerFunction 23 CustomerFunction 24 StandardFunction 25 TaskFunction 26 TaskFunction 27 TaskFunction 28 CustomerFunction 29 Customer
Subtasks
Functions
Source Sub
task
AS
ubta
skB
Sub
task
CS
ubta
skD
Sub
task
ES
ubta
skF
Sub
task
GS
ubta
skH
Sub
task
IS
ubta
skJ
Sub
task
KS
ubta
skL
Sub
task
MS
ubta
skN
Function 1 CustomerFunction 2 StandardFunction 3 CustomerFunction 4 StandardFunction 5 StandardFunction 6 StandardFunction 7 StandardFunction 8 StandardFunction 9 StandardFunction 10 StandardFunction 11 StandardFunction 12 TaTT skFunction 13 TaTT skFunction 14 StandardFunction 15 StandardFunction 16 StandardFunction 17 StandardFunction 18 TaTT skFunction 19 CustomerFunction 20 CustomerFunction 21 StandardFunction 22 CustomerFunction 23 CustomerFunction 24 StandardFunction 25 TaTT skFunction 26 TaTT skFunction 27 TaTT skFunction 28 CustomerFunction 29 Customer
Subtasks
Functions
Area 1
Area 2
Area 3
Fig. 5. Areas of functional interdependence for further investigation
Therefore, a function-subtask matrix is the ultimate result of the functional decom-position of the assembly task and has a two-fold purpose in the design procedure. First,it is a listing of all identified functional requirements which serve as a basis for gener-ating and evaluating process concept solutions for their feasibility. Secondly, the matrixshows process interdependencies and identifies critical problem areas. As these areasof interdependent functions often form the most complex problems, they are the firstproblems to be accessed for feasibility in the development of a new process module.
3.3 Generate Process Concepts
The concept generation step of the design procedure is focused wholly around solvingthe identified functional requirements. These functions provide both a springboard fromwhich concept generation and discussion can begin as well as a metric by which theconcepts can be later evaluated. However, to maximize designer creativity and therefore

Application of a Standardized Design Procedure 31
novelty of the solution reached, the concept generation phase is a purely theoreticalphase wherein no idea is necessary false. Suitability determination and the developmentof in-depth testing procedures are omitted until the later selection and testing phasesrespectively.
Thus, for each identified critical problem area, existing solutions are identified andnew concepts are developed. This process can take place using a variety of differentapproaches including but not limited to individual or group brainstorming, interviewswith both internal and external experts, a search of published literature and patents,benchmarking of existing processes, or systematic exploration of technical solutions[3].
3.4 Select Process Concepts
In order to reduce the generated solutions to a testable process concept, the varioussolutions are screened via a qualitative selection matrix. The selection matrix is a novelapproach to decision making in an engineering design environment as it provides aquantitative evaluation method to interpret otherwise qualitative data. Furthermore, aselectionmatrix aims to select the optimal solution variant out of a given set by analyzingeach variant’s ability to fulfill the functional requirements specific to each process block[3]. Each solution is rated based on its satisfaction of the functional requirements relativeto the other variants. Rating each functional requirement on a scale and summing thegrades of each solution allows for the scoring of the each generated concept and thedetermination of the most suitable solution such as in Fig. 6.
PossibleSolutions
Conce
ptA
Conce
ptB
Conce
ptC
Conce
ptD
Conce
ptE
Conce
ptF
Conce
ptG
Function 1Function 2Function 3Function 4Function 5Function 6Function 7Testability 0Dependency Compatability 0.5Expert Opinion 1Totals 7.5 6 6 5 6 5 5.5
Key
Fig. 6. Example of a standard selection matrix with discrete grading
In addition to strictly functional requirements, the selection matrix can include addi-tional relevant metrics. In this way, the additional concepts of testability, compatibilitywith dependencies, and the consensus opinion of the experiment interviews are con-sidered in the solution narrowing procedure [4]. Doing so expands on the functionaladherence of the chosen process concept by ensuring that the process can be tested withthe available time and equipment, does not inhibit or hinder dependencies elsewhere in

32 G. Saunders and T. Müller
the process chain, and is considered a reasonable and plausible option by those withexperience in the field.
~Weights ~
Conce
ptA
Conce
ptB
Conce
ptC
Conce
ptD
Conce
ptE
Conce
ptF
Conce
ptG
Function 1 x2.0 0.7 0.2 0.4 0.4 0 1 0.5Function 2 x2.0 0.6 0 0.5 0.1 0.1 0.5 0.4Function 3 x2.0 0.2 0.2 0.6 0.3 0.9 0.4 1Function 4 x1.0 0.8 0.7 0.8 0.9 1 0.4 1Function 5 x1.0 0.5 1 1 1 1 1 1Function 6 x1.0 1 0.5 0.5 0.5 0.5 0.5 0.5Function 7 x1.0 1 1 1 1 1 0 0.5Testability x2.0 1 1 0 0.5 1 0 0Dependency Compatability x1.0 1 1 1 0.5 0.5 1 0.5Expert Opinion x1.0 1 0.5 0 0 0 0 0Totals 10.3 7.5 7.3 6.5 8 6.7 7.3
cont
inuo
us/
quan
tiativ
egr
adin
g
disc
rete
/qu
alita
tive
grad
ing
Fig. 7. Example of a selection matrix variation with varied grading and weighting
A major benefit in using a selection matrix is its customizability to the demands ofany given assembly task or development environment. This customization is achievedthrough three primary means. First, the variation of evaluation parameters such as theprevious examples of accounting for testability and dependencies allows for the consid-eration of any metric. Second, the grading scales can be adjusted based on each metric.In the example shown, a binary, discrete scale of 0, 0.5 and 1 was used to quantify sub-jective judgement of functional suitability. However, alternative grading systems suchas ranking, or the transformation of quantitative data into a continuous grade scale canalso be used. Lastly, functional requirements can be weighted with a blanket multiplierto denote those functional requirements of special importance such as in Fig. 7. Throughthese variations, selection matrices expand upon their ability to aid the designer but theparameters must be thoughtfully chosen as they affect the final selection.
3.5 Test Process Concepts
Following concept selection, functional requirements continue to be used as a basis anda metric by which process concepts are judged. Evaluating how test results adhere to theoriginal functional requirements ensures that a final processmodule using those conceptswill fulfill the functions required by the customer and the given assembly task. Thus,the previously selected concept variants that were determined to be most suitable fortheir associated functional requirements are implemented in prototypical processmodulesubsystems corresponding to each problem area. In order to fulfill TRL 5 criteria, thesesubsystem prototypes are implemented and tested in production-relevant conditions.
The evaluation methodology used to determine concept suitability varies depend-ing on the specific functional requirements of the subtask or subtasks the prototypicalsubsystem aims to fulfill. Thus, each problem area merits its own custom experimentalmethodology. However, in the design of these experiments, the determination of exactprocess uncertainties or production parameters are not the goal of these experiments.

Application of a Standardized Design Procedure 33
Rather, the testing phase seeks to determine only that the previously chosen concepts arefeasible in a production-ready environment and that its associated functional require-ments will be fulfilled. Thus, feasible results of these tests denote a production-readyproof of concept for the associated subsystem and enables the further development,integration, and refinement of the tested subsystem.
3.6 Specify Final Targets
In the specification of final targets the findings of each separate testing process are com-bined into a single, cohesive list of specifications a combined processmodulemust fulfill.This phase is a purely analytical phase of the development process wherein requirementsand dependencies inherent in the combined process module are identified by examin-ing the performed tests and revisiting the decomposition and definition of functionalrequirements and subtasks.
In these testing phase, certain equipment and processes are determined as being nec-essary for final process feasibility. As these demands are found separately, they must becombined along with their dependent inputs and outputs and be recorded in a systematicway to enable the expedient development of combined process module incorporatingthe required elements of all preliminary tests. In addition, these equipment and processdemands can impart additional functional requirements necessary for their functioningor impart changes to the subtaskmap relating to their place in the process chain. Thus, thedecomposition and definition of subtasks and functions should be revisited and reevalu-ated at this stage in the development process to ensure that these documents and metricsremain relevant to the evolving design.
3.7 Plan Development
The continued development of an assembly process module is facilitated by the devel-opment of a combined process module concept based on the consolidated demandsand requirements specified in the previous development phase. This combined processmodule represents one cohesive concept for the complete automated assembly pro-cess, including straightforward or standard solutions for the subtasks and functionalrequirements falling outside of the tested problem areas.
In the development of this combined process module, the competing demands ofprocesses and equipment must be weighted and judged, in order to tactfully design amodule without impeding previously solved functions. The determination of consistentreference frames, the minimization of travel times, and consideration of tool envelopescan all be deciding features in the combination of module subsystems with regards tophysical location. Similarly, the rudimentary order of subtask functioning must also bedetermined. Thus, a combined process module and process chain concept is producedas a result of this development step.
4 Conclusion
This paper introduces a systematic design framework that enables the flexible but thor-ough development of automated assembly processes based on identified customer- and

34 G. Saunders and T. Müller
task-specific needs and their associated functions. The first step of this design procedureinvolves the identification of the base functions of the assembly task through the decom-position of a generic automated assembly process chain. These functions are integratedwith the customer- and task-specific needs, forming a complete model of the require-ments of a final process module. From these functions, problem areas are identifiedfor testing by focusing on complex regions of interdependencies found within the pro-cess requirements. Process concepts corresponding to each of these problem areas aredeveloped via a three-step procedure. First, solution concepts are generated through theexploration of existing techniques and technologies. Second, these solutions are screenedby a qualitative evaluation of each concept’s fulfillment of the requirements. Finally, theremaining concepts are systematically tested and evaluated for each’s feasibility withinits process block. These process concepts are merged into a combined process moduleincorporating the required elements of all preliminary tests. This process module repre-sents one cohesive concept for the complete automated assembly process. Collectively,this investigation and practical validation of process components in a production-relevantenvironment determines a feasible automated assembly process concept and satisfies therequirements of Technology Readiness Level 5.
This module is not necessarily a production-ready design but rather a model forthe future development of a final process concept. In order to expand this process toTechnology Readiness Level 6 and beyond, the continued development of the moduleand assembly process involves the construction, testing, evaluation, and optimizationof the module concept based on its fulfillment of the functional requirements of thetask. Doing so validates the developed process on a system-wide level as opposed tothe compartmentalized component level tests done earlier in the development procedureand enables the realization of the assembly process in a production environment.
References
1. European Commission: G. Technology readiness levels (TRL), Horizon 2020—Work Pro-gramme 2014–2015. Extract from Part 19 - Commission Decision C(2014) 4995 (2014)
2. European Space Agency: Technology Readiness Levels Handbook for Space Applications, 1stedn. September 2008
3. Ulrich,K.; Eppinger, S.: ProductDesign andDevelopment, 5th edn., pp. 16, 118–164.McGraw-Hill Irwin, New York (2013)
4. Pahl, G., Beitz, W., Feldhusen, J., Grote, K.: Engineering Design: A Systematic Approach, 3rdedn. Springer, London (2007). https://doi.org/10.1007/978-1-84628-319-2
5. Bergs, T.; Sauer, S.; Hoeren, M.: Lecture 13, automated precision assembly of optical systems.lecture notes, high precision glass optics manufacturing, RWTH Aachen University, WinterSemester 2018–2019
6. Galvao, A.; Sato, K.: Affordances in Product Architecture: Linking Technical Functions andUsers’ Tasks. In: Proceedings of IDETC/CIE 2005, ASME 2005 International Design Engi-neering Technical Conference and Computers and Information in Engineering Conference.Long Beach, CA, 28.09.2005.

Application of a Standardized Design Procedure 35
Open Access This chapter is licensed under the terms of the Creative Commons Attribution 4.0International License (http://creativecommons.org/licenses/by/4.0/), which permits use, sharing,adaptation, distribution and reproduction in anymedium or format, as long as you give appropriatecredit to the original author(s) and the source, provide a link to the Creative Commons license andindicate if changes were made.
The images or other third party material in this chapter are included in the chapter’s CreativeCommons license, unless indicated otherwise in a credit line to the material. If material is notincluded in the chapter’s Creative Commons license and your intended use is not permitted bystatutory regulation or exceeds the permitted use, you will need to obtain permission directly fromthe copyright holder.

Towards the Automated Coverlay Assemblyin FPCB Manufacturing: Concept
and Preliminary Tests
Marcello Valori1(B) , Vito Basile1 , Simone Pio Negri1 , Paolo Scalmati2,Chiara Renghini2, and Irene Fassi3
1 Institute of Intelligent Industrial Technologies and Systems for Advanced Manufacturing,National Research Council, Via P. Lembo, 38/F, 70124 Bari, Italy
[email protected] Somacis S.p.A, Via del Lauro, 7, 20121 Milan, Italy{p.scalmati,c.renghini}@somacis.com
3 Institute of Intelligent Industrial Technologies and Systems for Advanced Manufacturing,National Research Council, Via A. Corti, 12, 20133 Milan, Italy
Abstract. Inmodern electronics, flexible and rigid-flex PCBs are largely used dueto their intrinsic versatility and performance, allowing to increase the available vol-ume, or enabling connection between unconstrained components. Rigid-flex PCBsconsists of rigid board portions with flexible interconnections and are commonlyused in a wide variety of industrial applications. However, the assembly process ofthese devices still has some bottlenecks. Specifically, they require the applicationof cover layers (namely, coverlays), to provide insulation and protection of theflexible circuits. Due to the variability in planar shape and dimensions, the cover-lay application is still performed manually, requiring troublesome manipulationsteps and resulting in undetermined time-cycle and precision.
This paper aims at the improvement of the industrial process currently per-formed, by proposing an approach for the automation of Kapton coverlay manip-ulation and application. Since these products are commercially provided as a filmwith a protective layer to be removed, the peeling issue is addressed, representinga challenging step of the automated process; the results of a systematic seriesof tests, performed in order to validate the peeling strategy, are reported in thepaper. The overall assembly strategy relies on the development of a customizedmulti-hole vacuum gripper, whose concept is presented and contextualized in theproposed assembly process by outlining a suitable workcell architecture.
Keywords: PCB assembly · Film manipulation · Flexible electronics
1 Introduction
Modern electronics is moving fast, chasing market demands, towards miniaturization,flexible and stretchable electronics [1], embeddedPCBs [2],molded interconnect devices(MIDs) and 3Delectronic devices [3], environment friendly electronics [4]. Among these
© The Author(s) 2021S. Ratchev (Ed.): IPAS 2020, IFIP AICT 620, pp. 36–50, 2021.https://doi.org/10.1007/978-3-030-72632-4_3

Towards the Automated Coverlay Assembly in FPCB Manufacturing 37
trends, flexible and rigid-flex PCBs are used inmany applications due to their advantagescompared to traditional rigid PCBs: by interposing flexible connections between rigidboard portions, complex 3D arrangements can be achieved, complying with demandingvolume constraints.
The main advantage obtained by the use of flexible printed circuit boards (FPCBs)is the possibility of 3D wiring, enabling the exploitation of the available volumes andcomplex routing requirements. In particular, exploiting their intrinsic lightweight andthe possibility to be deformed and constrained into narrow volumes, flexible circuits arecommonly used in biomedical applications [5], aerospace and smartphone industry. Onefundamental feature of flexible circuits is the necessity of mechanical protection of theconductors; in order to comply with this requirement, coverlays are applied in additionto the solder masks. Among the various types of coverlay (film, screen printable, pho-toimageable) [6], film coverlay is generally preferred, due to its mechanical propertiesin terms of strength and durability. However, it is the most complicated solution fromthe point of view of the automation possibilities. Film coverlay thickness can span from25μm to 127μm; the basematerial, polyimide (PI) or Polyethylene terephthalate (PET),is coated with an adhesive layer of epoxy resin or acrylic with thicknesses in the range25÷ 75μm. The adhesives are semicured, to be activated finally in the lamination phase.A further layer of release material is applied as adhesive layer protection for deliveryand handling before application.
Figure 1 shows an example of rigid-flexible PCB layer stack-up. Figure 2 shows twoexamples of rigid-flexible circuits developed by the PCB manufacturer Somacis, Italy,as well as the effects of a final “routing” phase, referred in this case to the full-thicknesstrimming of the external frame to actualize the flexibility. Light brown, flexible circuitscan be distinguished from green rigid circuits; the different color is due to coverlaysurface. In some cases, flexible circuits enable signal connections between rigid circuits(Fig. 2, a), while in other cases they embody sensors or other devices (Fig. 2, b).
Fig. 1. Rigid-flexible PCB stack-up. Left: schematic of the layers. Right: a detail of the assembledcircuit section acquired by a Zeiss Axio Imager M2m microscope. (Courtesy of Somacis, Italy).
In Fig. 3, a flexible circuit portion is shown, before and after the application of thecoverlay; as highlighted, coverlay application is limited to flexible areas of the circuit,specific for each board design. The actual flexibility is obtained when, furtherly, the

38 M. Valori et al.
Fig. 2. Rigid-flexible circuits. a) Industrial application board, 14 layers (10 rigid + 4 flexible),thickness 2 mm. b) Device for human epilepsy monitoring. c) and d) The external frame furtherlyeliminated, enabling the deformation of flexible circuits. (Courtesy of Somacis, Italy).
external frame, that is necessary for automated manipulation during the assembly of theother components, is removed. It is worth to highlight that the removal of the coverlayprotective film can be troublesome, increasing process time, thus production costs, andinducing visual and mental stress for the worker.
Fig. 3. Coverlay application. Flexible circuit before (a) and after (c) the application of the coverlay(b). In c) the red countour highlights the frame to be trimmed out and the blue line indicates theflexion axis of the final device. (Courtesy of Somacis, Italy). (Color figure online)
Flexible circuits layers are laminated together with rigid layers, according to thedesigned build-up (Fig. 4, left). In PCB fabrication, indeed, the layer stack-up is pre-assembled and then subjected to lamination and curing (pressure-heating cycle), aimedat the activation of the adhesive on coverlays and flexible circuits and the polymerizationof epoxy resin in prepreg foils (Fig. 4, right).
The state-of-the-art application process of film coverlays is characterized by thefollowing steps (Fig. 5): a) laser trimming of the specific contour, b) manual removalof the protective film, c) manual positioning on the PCB, d) manual application of one

Towards the Automated Coverlay Assembly in FPCB Manufacturing 39
Fig. 4. PCB fabrication: lamination and curing cycle. Pre-assembled stack-up (left) and 20positions loader of a Lauffer press. (Courtesy of Somacis, Italy)
or more welding points to avoid displacements, e) lamination and curing for adhesiveactivation and/or polymerization of prepreg layers. Another option for increasing processaccuracy is represented by the use of laser drilling after lamination: the coverlay filmis applied without pre-drilling; after lamination, laser drilling is performed in order toselectively eliminate the coverlay film and obtain the designed geometry [6]. However,with this approach, there are no advantages for the automation of the peeling phase.
Fig. 5. Coverlay assembly: state-of-the-art process phases.
In panel-based processes of electronics industry, automating the peeling of flexiblematerials still represents an issue [7]. In this paper, a new concept is proposed forautomated manipulation, positioning and assembly of coverlays in flexible and rigid-flexible circuit manufacturing, addressing in detail the peeling issue. Section 2 presentsthe conceived assembly procedure including gripping, peeling of the protective film andassembly on the current layer of the stack-up. Section 3 illustrates the concept of theautomated assembly system with its architecture and main equipment, including gripperarchitecture. Section 4 reports the experimental tests performed for the peeling step ofa typical coverlay and finally, conclusions are presented in Sect. 5.
2 The Proposed Assembly Approach
In this Section, a strategy for coverlay automated assembly is proposed, identifyingfirstly the process requirements, then the gripping features and the peeling strategy and,finally, the process phases are described.

40 M. Valori et al.
2.1 Requirements
The requirements of the assembly procedure are determined based on themanual processcurrently carried out and the material properties.
Flexible Component Manipulation. Film coverlays are characterized by extremelylow thickness. The system shall be able to manipulate these components, avoidingbending and ensuring flat positioning on FPCB surface.
Compliance to the Geometry. Depending on the specific FPCB design, coverlays arecharacterized by different dimensions and planar shapes, thus, the gripping strategy shallenable the compliance with a wide variety of geometries.
Removal of the Protection Film. In the assembly task, the protection film must beremoved before coverlay application; therefore, a methodology for the peeling of sucha film shall be implemented.
Thermal Bonding: Film coverlay shall be constrained to the FPCB by applying one ormore bonding points, by locally activating the epoxy resin with a soldering tool.
Performance. Accuracy and repeatability of the assembly process shall be lower thanthe accuracy limit determined for flexible circuits with High Density Interconnect (HDI)PCB (100 μm) [6].
2.2 Gripping
In the manipulation of flat surfaces characterized by extremely low thickness combinedwith low stiffness materials, thus, deformable, the issue of preserving component con-figuration, avoiding undesirable bending, arises. This aspect can be even more relevantduring the positioning phase, in which folds and air bubbles must be avoided. The useof a flat gripping surface as interface with the component represents a valid option toaddress these aspects.
Gripping strategy shall also comply with the requirement of the selective pick. Com-pliant grippers usually rely on the 3D shape of the object, in order to passively adaptto perform gripping, using different approaches and often implementing soft materials[8]; there are also commercial products available enabling the unconditional pick ofobjects with flat surfaces [9]. In the application dealt with in this paper, coverlays lie ona flat surface; due to the extremely low thickness, their 3D shape is not appropriate to bepassively distinguished from the background by a compliant gripper. Thus, the necessityof a strategy for gripper “pre-shaping” arises.
Basing on these considerations, the gripper specifically designed for coverlay “pick-peel-place” is characterized by a flat interface surface and based on vacuum principle;a pattern of holes, representing themselves a matrix of suction cups, is realized in theflat surface. In order to avoid the uncontrolled pick of other patches lying on the samesupport, as well as the possible vacuum loss due to uncovered condition of one or moreorifices, each suction cup is controlled individually, thanks to an upstream pneumaticvalve module.With this approach, gripping pattern can be set depending on each specificcoverlay contour, enabling the possibility of gripping different geometries.

Towards the Automated Coverlay Assembly in FPCB Manufacturing 41
2.3 Peeling Strategy
Peel strength represents one of the most important characteristics of coverlays, as it is ameasure of component integrity in determined loading conditions. DuPontTM Pyralux®
LF coverlay material, for example, based on a Kapton® polyimide film, exhibits a peelstrength of 1.6 kg/cm after curing, defined by the provider as per the applicable standard[10].
On the other hand, peeling represents also one phase of the assembly, as the coverlayis provided coupled with a release material; it is also the most demanding challenge toaddress in order to accomplish the whole task, due to the uncertainties in the peelingdynamics combined with the geometrical variability of the patches. Peeling dynamicshas been widely investigated by the scientific community, and there are a number ofpatented machines, designed to be implemented in roll-to-roll production for differentapplications, performing tape peeling. In themajority of cases, peeling is triggered by theaction of rolls [11] or insertion means acting as blades [12], combined with high bendingangles of the release material. However, circuit board industry is mostly characterized bypanel-based processing and coverlays may have very different shapes and dimensions.Therefore, the necessity of implementing a specific material removal method arises,studied for components characterized by planar dimensions in the order of few squarecentimeters.
In order to trigger the peeling of a film, adhering to another due to a substrate of abonding agent, a mechanical action should be applied. With decreasing thickness, thistask becomes more demanding, requiring precision and tools with appropriate edges.The detachment is achieved when the force, properly applied, is sufficient to triggerlocal fracture of the bonding agent. In the approach hereafter presented, the issue isaddressed by an inverted perspective: instead of applying a detaching force when precisepositioning occurs, the method relies on driving the film towards a source of mechanicalaction, working continuously at a high frequency; the approaching is stopped whendetachment takes place due to the contact randomly occurred between the film and thesource of the force.
In the practical implementation, a rotary tool with appropriate cutting profile canbe suitable. In our experiments, a rotary sanding drum was used as a trigger for thepeeling of the release material. As shown in Fig. 6, such a method, called hereafter “pre-peeling”, exploits abrasive surface roughness to collide with the release material surfaceand detach it from the coverlay, thanks to the impulsive force obtained by high grindingspeed and applied by one or more abrasive particles to the film to remove. Relying alsoon friction contact, mutual positions can be calibrated in order to guarantee that thisforce affects only the protective film. A specific setup, further described in this paper,was used to validate this method.
In Fig. 6, the most important process parameters are indicated. The a parameter isthe unsupported overhanging portion of the coverlay (cantilever configuration) out ofthe clamp jaws, while e is the distance, along the x-axis, of the coverlay tip from thegrinding tool axis, r is the radius of the sanding drum, rotating with angular speed ω andexerting a torque “T”. Parameter e is straightly related to the approach angle ϑ to thecylindrical grinding tool, since e= r cos(ϑ). These parameters have been chosen due totheir direct relation with the physics behind the peeling process. Indeed, a is related to

42 M. Valori et al.
Fig. 6. Peeling trigger based on a sanding tool: a) the surface of the protective film approachesthe rotating surface in a determined configuration; b) it is detached from the film coverlay. Amagnification of the contact zone clarifies the definition of some parameters, considering the realoperating conditions.
the coverlay flexural stiffness, so that stiffness decreases as a increases. Parameter e hasinfluence on the peeling mechanism as it directly affects the direction of the interactionforce applied by the tool on the component, due to the direct relation with angle ϑ. Thecombination of r and T determines the value of the force and ω affects the momentum.Finally, the whole process is closely linked to the roughness of the sanding drum.
Parameter h represents the distance, along the z-axis, between the sample and thegrinding tool. The optimal set [a, ϑ, h] uniquely identifies themost suitable configurationof the coverlay and the rotating sanding drum for the pre-peeling phase. Regarding thisaspect, it is relevant to point out that, in the practical implementation, coverlay samplespreserve the curvature of the original material reel. The real h values differ from the theo-retical value h*= r sin(ϑ) as they are affected by coverlay intrinsic curvature. Accordingto this, ϑ is to be considered as the angle spanned between the radius connecting thecenter of the sanding drum with the contact point P and the axis of the clamp (or, inthe automated task, of the end-effector), rather than the surface of the coverlay itself, asshown in the detail in Fig. 6-b).
2.4 Assembly Procedure
The assembly procedure is then defined in accordance with the chosen gripping andpeeling strategy. With reference to Fig. 7, the following phases are identified:
a) Gripper Setup.With reference to the specific geometry of the coverlay to manip-ulate, an off-line setup is performed in order to activate selectively the vacuum orifices,thus modeling the gripping surface.
b) Coverlay Pick. Once the position of the component to manipulate is detected byan external sensing source, i.e. a vision system, the gripper can approach it and performthe pick on the coverlay side. A portion of the coverlay is kept on purpose outside of thegripping envelope.
c) Pre-Peeling. The unconstrained component portion is approached to the grindingtool, by the protective film side, thus triggering the detachment of the two films.

Towards the Automated Coverlay Assembly in FPCB Manufacturing 43
Fig. 7. The phases of the proposed assembly procedure: a) Gripper setup, b) Coverlay pick, c)Pre-peeling, d) Peeling, e) Coverlay positioning, f) Thermal bonding.
d) Peeling. The whole protective film is pulled away by a suction cup, acting on thecomponent portion detached in the previous phase.
e) Coverlay Positioning. The coverlay is placed on the PCB.f) Thermal Bonding. The coverlay is bonded in one or more points in order to
guarantee constrained precise positioning before lamination.
3 Assembly System Architecture
Thewhole assembly systemunder study is basedon the approaches proposed for grippingand pre-peeling. In this section, a concept of the workcell and the design of the specificgripper for the task are presented.
3.1 Workcell Description
Theworkcell architecture for coverlay application, outlined in Fig. 8, is aimed at exploit-ing the proposed automation strategy to obtain the PCB assembly ready for laminationand curing. The inputs of the process are the flex or rigid-flex PCB with circuits andSMT (surface mounted technology) components installed in previous steps.
In the assembly concept, the task is customized off-line, depending on the coverlaycontour: a specific software tool is required for the pre-shaping phase. This setup isfundamental for task completion, since an appropriate portion of the picked coverlayhas to remain outside of the gripper envelope, enabling peeling triggering.
In the workcell concept there are two conveyors, one providing the laser-trimmedcoverlays and one sliding the flex or rigid-flex PCBs to assemble. The “pick-peel-place”task is performed by a commercial manipulator, equipped with the specifically designedgripper. The implementation of a collaborativemanipulator is foreseen, due to the advan-tages provided by including a human operator in the assembly environment [13], evenfor a mere on-site supervision. Within the collaborative robot scenario, several commer-cial models are suitable for the task, considering the extremely low payloads and theaccuracy required, assessed 100 μm in Sect. 2.1. As an instance, in Figs. 8 and 9 the

44 M. Valori et al.
Fig. 8. Possible architecture of the workcell for coverlay application in a generic assemblyscenario: a) top view and b) front view.
gripper is equipped on a Universal Robot UR5e. Regarding component pick and place,two vision systems are placed on top of the two conveyors, with appropriate fields ofview (FOVs) to detect, respectively, position and orientation of the coverlay to pick, andthe release position on the PCB. Within the robot reach, the pre-peeling and peelingstations are included, corresponding respectively to a rotating sanding drum and a fixedvacuum gripper; a vision system is necessary for gripping position check.
Fig. 9. Design of the specific gripper. On the left, the gripper equipped on a UR5e; on top, right,gripper components are highlighted: on bottom, right, the interface surface is indicated.
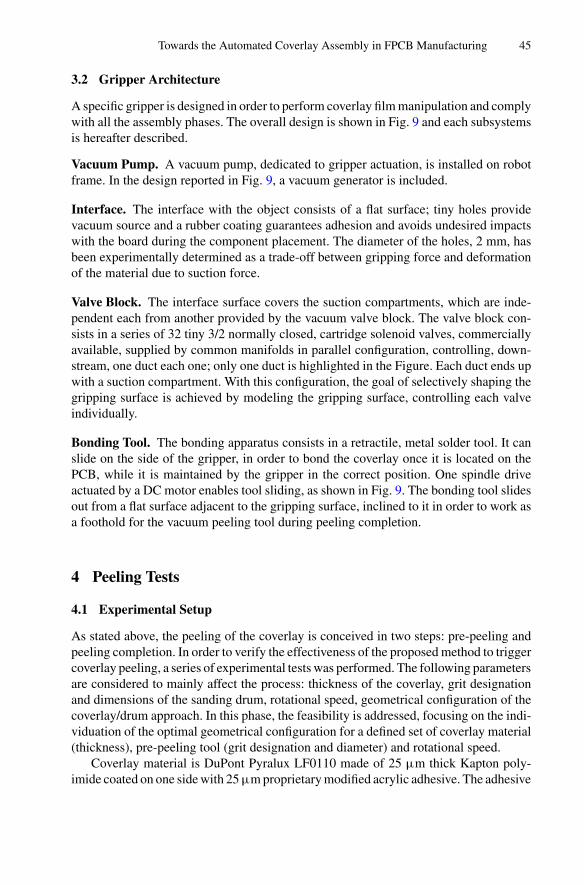
Towards the Automated Coverlay Assembly in FPCB Manufacturing 45
3.2 Gripper Architecture
A specific gripper is designed in order to perform coverlay filmmanipulation and complywith all the assembly phases. The overall design is shown in Fig. 9 and each subsystemsis hereafter described.
Vacuum Pump. A vacuum pump, dedicated to gripper actuation, is installed on robotframe. In the design reported in Fig. 9, a vacuum generator is included.
Interface. The interface with the object consists of a flat surface; tiny holes providevacuum source and a rubber coating guarantees adhesion and avoids undesired impactswith the board during the component placement. The diameter of the holes, 2 mm, hasbeen experimentally determined as a trade-off between gripping force and deformationof the material due to suction force.
Valve Block. The interface surface covers the suction compartments, which are inde-pendent each from another provided by the vacuum valve block. The valve block con-sists in a series of 32 tiny 3/2 normally closed, cartridge solenoid valves, commerciallyavailable, supplied by common manifolds in parallel configuration, controlling, down-stream, one duct each one; only one duct is highlighted in the Figure. Each duct ends upwith a suction compartment. With this configuration, the goal of selectively shaping thegripping surface is achieved by modeling the gripping surface, controlling each valveindividually.
Bonding Tool. The bonding apparatus consists in a retractile, metal solder tool. It canslide on the side of the gripper, in order to bond the coverlay once it is located on thePCB, while it is maintained by the gripper in the correct position. One spindle driveactuated by a DC motor enables tool sliding, as shown in Fig. 9. The bonding tool slidesout from a flat surface adjacent to the gripping surface, inclined to it in order to work asa foothold for the vacuum peeling tool during peeling completion.
4 Peeling Tests
4.1 Experimental Setup
As stated above, the peeling of the coverlay is conceived in two steps: pre-peeling andpeeling completion. In order to verify the effectiveness of the proposedmethod to triggercoverlay peeling, a series of experimental tests was performed. The following parametersare considered to mainly affect the process: thickness of the coverlay, grit designationand dimensions of the sanding drum, rotational speed, geometrical configuration of thecoverlay/drum approach. In this phase, the feasibility is addressed, focusing on the indi-viduation of the optimal geometrical configuration for a defined set of coverlay material(thickness), pre-peeling tool (grit designation and diameter) and rotational speed.
Coverlay material is DuPont Pyralux LF0110 made of 25 μm thick Kapton poly-imide coated on one sidewith 25μmproprietarymodified acrylic adhesive. The adhesive

46 M. Valori et al.
side is covered by a protective film with thickness of 40 μm. Coverlays are IPC certi-fied by the supplier. Coverlay geometries are determined on the basis of an industrialcase, currently object of study of the research group; such a geometry is rectangularwith dimensions 25 × 40 mm; further materials and dimensions will be investigated infollowing experimental surveys. The samples are trimmed, which means full-thicknesscut, by a 2D laser cut machine from a coverlay sheet with dimensions 610 × 454 mm,obtained by cutting a roll 610 mm wide and 76 meters long.
The laser trimming operation separates the coverlays from the sheet, then collectedand loaded on a conveyor for the subsequent operation. The testing equipment is com-posed by two main parts: 1) apparatus for coverlay positioning; 2) pre-peeling stage.With regard to the first component, the coverlays samples are mounted on a three-axeshigh precision metric stage, actuated by three micrometer screws, with travel range of15 mm on each axis and sensitivity 1 μm. The coverlay samples are held inside twosmall aluminum jaws mounted at the end of two cylindrical fixtures. In order to dis-tribute the clamping force on a higher coverlay surface, two stainless steel plates withthickness 0.45 mm are used as interfaces between the clamp jaws and the coverlays.The pre-peeling stage consists of an electrical drilling tool, mounted horizontally. Thesanding drum is a cylinder with an external diameter of 8.78 mm and height 12.7 mm(1/2 in.) used for smoothing applications, with grit designation P80, corresponding toaverage particle diameter of 201μm. The tool shaft has a diameter of 3.2 mm. The setupis showed in Fig. 10.
Fig. 10. Peeling initialization experimental set-up. Frontal (a), top (b), side view (c).
Preliminarily, the geometry of the set-up is verified: vertical stroke of the coverlay,alignments between grinding tool axis and coverlay profile, zeroing of the z-axis coin-cident to the first contact between the coverlay protective layer surface (bottom) andthe side of the cylindrical grinding tool, centered position of the grinding tool with thecoverlay width, etc.
The series of experimental tests was based on the variation of parameters a and e;ω was set at 800 rpm and the same sanding drum - thus, same radius and same sandinggrade - was used. a was set at 10 and 15 mm, while e was set at 0, 1, and 2 mm; fora = 10 mm also e = 1.5 mm was considered as a further set of variables. Each ofthe 7 parameter sets is tested with 5 repetitions (sample labels A, …, E). This value isreputed sufficient for the feasibility assessment. Each run is performed by setting theparameters (a and e) and driving the coverlay sample towards the grinding tool by slow

Towards the Automated Coverlay Assembly in FPCB Manufacturing 47
vertical motion (approximately 2 mm/min), as schematically shown in Fig. 6; verticalmotion is stopped when peeling is triggered. The outputs of each experiment are thepeeling triggering success, the peeled area and the recorded value of the parameter h;the standard deviation characterizing this value for each set of runs is indeed used toassess the repeatability of the process. For each successful pre-peeling test, an imagewascaptured and processed in order to calculate the peeled area, considered an importantparameter, since peeling completion relies on the gripping of a film portion alreadypeeled.
4.2 Results and Discussion
Figure 11 shows the results of image processing procedure previously described,obtained for two runs. The light brown portion of images are pre-peeled areas (Fig. 11,left). They have irregular contours which are identified by image processing algorithms(Fig. 11, right). The proposed procedure can also be automated and used real-time forpeeled area detection and characterization. Accuracy can be increased by illuminationand background optimization in the image acquisition step.
Fig. 11. Image processing applied to peeled samples. ROI (Region of Interest) original image(left) and processed image (right) for calculation of peeled area, in white. Runs reported: 100 A(a = 10; e = 0; sample A) on top and 150C (a = 15; e = 0, sample C) on bottom.
Table 1 reports the results obtainedwith the different parameter sets. At a first glance,it highlights that the grinding-based method can be a successful solution for peelingtriggering in several configurations. It is important to point out that all the successfulpre-peeling runs led to successful peeling completion, definitely validating the approachof splitting the peeling issue in two sub-phases.
Besides the validation of the approach, this preliminary series of tests was aimedat the definition of a reliable configuration for the automation of the pre-peeling phase,

48 M. Valori et al.
Table 1. Experimental results of peeling triggering.
a[mm]
e[mm]
ϑ
[deg]Success Index <h>
[mm]σh[mm]
<PA>
[mm2]<PA/TA>
%
10 0 90° 5/5 5,54 0,17 129 52%
10 1,0 77° 5/5 5,91 0,27 93 37%
10 1,5 70° 3/5 6,02 0,17 171 68%
10 2 63° 3/5 5,22 0,07 115 46%
15 0 90° 5/5 6,79 0,22 174 46%
15 1 77° 2/5 7,40 0,23 31 8%
15 2 63° 1/5 6,40 – 89 24%
Success Index: number of successful pre-peeling runs; PA: Peeled Area; TA: Total Area (limitedto the overhanging coverlay portion); <h>: mean h value and σh: standard deviation.
intended as the mutual position of an end-effector holding the coverlay and the grindingtool. The choice is the result of a hierarchical parameter analysis. The first parameterto consider is the Success Index: only configurations leading to 100% successful runswere considered. The Peeled Area PA (and, in particular, the ratio between PA and TA,the Total Area) was assessed as an important discriminating factor for the subsequentpeeling completion phase; however, as already stated, all the successful pre-peelingruns were followed by successful peeling completion. From the pre-peeling automationperspective, acquired position standard deviation σh is then relevant: since the h valueindicates a position suitable for the robot end-effector, a lower σh is directly translatedin a better repeatability of the process, that represents a fundamental indicator in anautomated task. According to this approach, the most suitable set of parameters for thebatch of coverlays currently under examination, is represented by the “100” series (a =10 mm; ϑ = 90°; h = 5.5 mm). It is worth to point out that, according to the discussionreported in Sect. 2.3, in the practical implementation, this particular configuration (ϑ =90°) does not correspond to the protective film surface tangential to the sanding drum,due to the coverlay intrinsic curvature. As a further remark, in all the successful runs,no damages were observed on coverlay inner surfaces.
In the proposed approach, the process is considered stochastic, relying on the sandparticles randomdistribution. The coverlay/particles contact frequency is directly relatedto the high rotational speed of the tool. Certain contacts lead to detachment, thus, suc-cess probability is strongly increased by high rotational speeds. However, coverlay/toolrelative configuration is a fundamental factor to enable the engagement of the only pro-tective film layer; in some cases, indeed, also the coverlay film is engaged itself, leadingto a process fail. The experimentation led to the optimal configuration for the specificcase-study.

Towards the Automated Coverlay Assembly in FPCB Manufacturing 49
5 Conclusions
The presented research activity deals with the automation of a specific task in electronicassembly, still performed manually. The topic is of outstanding interest, as it representsa critical phase in the production of flex and rigid-flex PCBs, whose implementation isincredibly growing in a wide range of application fields. Coverlays work as stiffeners,insulators and mechanical protection of the circuits; film coverlays present the mostsuitable mechanical properties, but they are characterized by low accuracy, as theirapplication relies on operator skills. Furthermore, the removal of the protective film istroublesome and stressing.
The automation of the coverlay application phase is addressed by proposing anapproach for the protective film peeling triggering, introducing a pre-peeling phase,based on a commonworkshop sanding tool. Thewhole assembly process is then outlinedand the concept design of a suitable gripper is presented. Finally, the results of a seriesof tests, aimed at validating the peeling strategy and defining an optimal position for theautomated pre-peeling phase, are reported.
The results demonstrate that the proposed peeling strategy can represent a successfulmethodology to be implemented in an automated process. Geometrical parameters needto be properly configured to ensure process reliability, defining the optimal relativeposition to promote the separation by engaging only the support material layer. In ourexperiments, indeed, some configurations led to 100% pre-peeling success, followed bysuccessful peeling completion.
In future developments, the results obtained will be further validated in other exper-imental surveys; in particular, the variation of tool rotation speed will be considered,as well as the use of different sanding drums, corresponding to the variation of toolradius and sanding grade, and different coverlay materials. At the same time, gripperdesign will be refined, followed by the supply of all the components and realization. Byequipping the gripper on a manipulator, it will be possible to validate the automation ofmost of process phases. Finally, the robot will be integrated in a complete workcell, asoutlined in the paper.
Acknowledgments. This research was funded by the Italian Government through the NationalOperative Program H2020 PON 2014-2020, within the project “High-performance electronicEmbedded Systems (HELMS)”, grant number F/050507/02-03/X32.
References
1. Wong, W.S., Salleo, A.: Flexible Electronics: Materials and Applications. Electronic Materi-als: Science & Technology. Springer, Boston (2009). https://doi.org/10.1007/978-0-387-74363-9
2. Jillek, W., Yung, W.K.C.: Embedded components in printed circuit boards: a processingtechnology review. Int. J. Adv. Manuf. Technol. 25(3–4), 350–360 (2005)
3. Franke, J.: Three-DimensionalMolded Interconnect Devices (3D-MID):Materials,Manufac-turing, Assembly and Applications for Injection Molded Circuit Carriers. Carl Hanser VerlagGmbH Co KG, Germany (2014)

50 M. Valori et al.
4. Canal Marquesa, A., Cabrera, J.M., de Fraga Malfatti, C.: Printed circuit boards: a review onthe perspective of sustainability. J. Environ. Manage. 131, 298–306 (2013)
5. Khan, Y., et al.: Flexible hybrid electronics: direct interfacing of soft and hard electronics forwearable health monitoring. Adv. Funct. Mater. 26, 8764–8775 (2016)
6. Coombs, C.F., Holden, H.T.: Printed Circuits Handbook, 6th edn. McGraw-Hill, New York,USA (2009)
7. Plovie, B., et al.: Stretchable mold interconnect optimization: peeling automation andcarrierless techniques. IEEE Trans. Compon. Packag. Manuf. Technol. 9(5), 955–962 (2019)
8. Shintake, J., Cacucciolo, V., Floreano, D., Shea, H.: Soft robotic grippers. Adv.Mater. 30(29),1707035 (2018)
9. Joulin Vacuum Handling. https://www.joulin.com/all-industries/standard/minigrip.html.Accessed on 30 Sep 2019
10. IPC-TM-650 Test Methods Manual, 2.4.9 - Peel Strength, Flexible Dielectric Materials. IPCAssociation Connecting Electronics Industries (2014)
11. Toyoda, Y., Nobuyuki, T. (NGK Spark Plug Co., Ltd.). United States Patent: Method andApparatus for Producing a Wiring Board including Film Peeling. US 7,481,901 B2 (2009)
12. Ahn, K.H. (Samsung Display Co., Ltd.). United States Patent: Method and Apparatus forPeeling Donor Film from Substrate. US 8,877,006 B2 (2014)
13. Ruggeri, S., Fontana, G., Basile, V., Valori, M., Fassi, I.: Micro-robotic handling solutionsfor PCB (re-)manufacturing. Proc. Manuf. 1, 441–448 (2017)
Open Access This chapter is licensed under the terms of the Creative Commons Attribution 4.0International License (http://creativecommons.org/licenses/by/4.0/), which permits use, sharing,adaptation, distribution and reproduction in anymedium or format, as long as you give appropriatecredit to the original author(s) and the source, provide a link to the Creative Commons license andindicate if changes were made.
The images or other third party material in this chapter are included in the chapter’s CreativeCommons license, unless indicated otherwise in a credit line to the material. If material is notincluded in the chapter’s Creative Commons license and your intended use is not permitted bystatutory regulation or exceeds the permitted use, you will need to obtain permission directly fromthe copyright holder.

Resource Interface Matchmaking as a Partof Automatic Capability Matchmaking
Niko Siltala(B) , Eeva Järvenpää , and Minna Lanz
Tampere University, Korkeakoulunkatu 6, 33014 Tampere, Finland{niko.siltala,eeva.jarvenpaa,minna.lanz}@tuni.fi
Abstract. This paper presents a case study for capability matchmaking methodand specifically focuses on interface matchmaking process. This method can beutilised during production system design or reconfiguration by system integratorsor end users. Theywill benefit from fast and automatic resource searches over largeresource catalogues. The paper binds together the process around the capabilityand interface matchmaking, which are presented more in detail in our earlierpublications. In this paper, the use of matchmaking process is exemplified, and averification of the method is provided with two test cases.
Keywords: Interface matchmaking · Assembly system design · Systemreconfiguration
1 Introduction
Responsiveness of manufacturing is an important strategic goal for manufacturing com-panies operating in a highly dynamic environment characterized by constant change.Such responsiveness and adaptivity is related to the need to reconfigure and adjust theproduction and corresponding production system as efficiently as possible to the requiredchanges in processing functions, production capacity, and the dispatching of the orders.[1, 2] To do this, the production system needs an inherent ability to facilitate continualand timely change in its structure and in its functional operations.
Traditionally, the production system design and reconfiguration has been time-consuming process done by the human designer. It includes search for suitable andconnectable resources, and it relies heavily on the expertise and tacit knowledge of thesystem integrators and the end users of the system [3]. Meeting the requirements of fastadaptation calls for new methods and solutions that would drastically reduce the timeand effort put into system design [2, 4], both in brownfield and greenfield scenarios.Plug and play interfaces, modern information and communication technologies, formalinformation models representing resources and products, as well as simulations andother computer-aided intelligent planning tools can all contribute to such methods andsolutions [2, 4]. During the system design and re-configuration, new structural configu-rations are built to fulfil the functional requirements set by the product [4]. Similar to thedesign of modular products [5] – consideration of interfaces plays an important role inenabling the interchangeability and independence of resource elements. Thus, in order
© The Author(s) 2021S. Ratchev (Ed.): IPAS 2020, IFIP AICT 620, pp. 51–62, 2021.https://doi.org/10.1007/978-3-030-72632-4_4

52 N. Siltala et al.
to achieve a feasible structural configuration, the combined production resources musthave compatible interfaces.
Within the past two decades, there have been multiple different projects and research[6–8] trying to provide computerized support for system design and reconfigurationplanning process. According to [6], the modular architecture paradigm for new pro-duction systems, which focuses on the clear functional decoupling of equipment mod-ule functionalities and the use of standardized interfaces to promote interchangeability,presents the possibility for developing automated system design and reconfigurationmethods. Important steps towards modular assembly equipment and standardized hard-ware and control interfaces was made, for example, in EU-funded project EUPASS [7].The recently finished project ReCaM [8], which results this paper also reports, aimed todevelop a set of integrated tools for rapid and autonomous reconfiguration of productionsystems. The approach relies on a formal unified functional description of resources[9], providing a foundation for rapid creation of new system configurations throughcapability-based matchmaking of product requirements and resource offerings [10].
This paper will present, through two case studies, how the capability matchmakingprocess operates. Emphasis is placed on the interface matchmaking. First objective isto present how the interface concept for production resources can be utilized as a partof the capability matchmaking [11] procedure. Secondly, we will present, through twocases, how the capability and interface matchmaking work in practise and how they sortout feasible resource combinations for the system designer.
The paper is organized as follows. Section 2 introduces shortly our overall capabilitymatchmaking approach and its associated concepts and datamodels. Section 3 focuses onthe interface matchmaking process in general. In Sect. 4 we present with two cases howthe matchmaking process advances and provides the matching resource combinations.Section 5 discusses howwe have verified the automatically gained matchmaking results.The specific focus is placed on interface matching viewpoint. In the Sect. 6 we concludethe work done.
2 Capability Matchmaking Process
2.1 Information Models Involved
The capability matchmaking relies on different information models that are used todescribe the resources and products in a formalized way. For each different resource, aresource description (RD) file (in XML format) is created and published by the resourceprovider. These files are saved to different catalogues, either global or local, from wherethe potential users, in this case the capability matchmaking software, can then utilize thedescriptions. The resource description represents the basic characteristics, capabilities,interfaces, and properties of the resource. It can contain links to documentation, CADmodels and to illustrative figures. One essential part in the resource description is thecapability description of the resource, which selects the relevant capabilities and theirparameters from the Capability Model.

Resource Interface Matchmaking 53
Central information model for the matchmaking is the Capability Model. The Capa-bility Model is a formal ontology model which is used to model capabilities and theirrelations. Capability consists of concept name, such as “Drilling”, “Milling”, “Moving”and so on, and parameters, such as “payload”, “speed” or “torque”. The model consistsof simple and combined capabilities, where combined capabilities are combinations ofsimple capabilities. For instance “Picking” is a combined capability which requires asan input “Moving”, and some sort of “Grasping” capability. The capability model formsa capability catalogue, which is a pool of capabilities that can be assigned to resourcesto describe their functionality. [12]
The Resource Model Ontology imports the Capability Model and is used to describemanufacturing resources and their capabilities. An instance ontology of ResourceModelcan be automatically created and populated by reading in the information fromRDs. TheResource Model can also be used to model systems composed of multiple resources.Based on the relationships between simple and combined capabilities, it is possible toidentify potential resource combinations that can have a certain combined capability.[12]
The Resource Model imports another ontology, called Resource Interface Model,which describes the resource interfaces in detail. It is used during the matchmaking forchecking the compatibility of the resources from interface perspective. In other words,it is utilized to assess if two resources can be connected physically together. It includesinformation about interface definition, including identifier, name, category, gender andpurpose of the interface; Interface standard and its characteristics and the standardisationorganization; Interface port implementation. [13]
Also, the product requirements are described using formal Product Model ontology.The Product Requirement Description (PRD) contains information about the parts, howthey are connected to assemblies and what kind of processes and process parametersshould be used. The Product Requirement Description uses the same concepts that areinvolved in the Capability Model. Thus, there is a link between the resource capabilitiesand process requirements of the product. [11]
2.2 Overview of Capability Matchmaking Process
Figure 1 represents the capability matchmaking process. The Capability Matchmakingis implemented as a service [14] that the System Designer may call through his desiredplanning system. When the designer wants to launch this service, he will have to give itcertain inputs, for example the matchmaking search space. This input includes descrip-tion of the resources that should be taken into consideration during the matchmaking,and description of the product (i.e. the PRD), for which a match will be looked for. Thus,the resources and product requirements need to be formally described before the capa-bility matchmaking process can be initialised. These resources in specific search spaceare automatically processed and read in from RDs to form a Resource Model instanceontology. The input related to the resources may be either a description of the existingsystem layout (i.e. a resource hierarchy building a system layout) or pool of resources

54 N. Siltala et al.
selected from one or various resource catalogues. In the latter case, the input is in formof a flat list of resources creating a resource pool. The Capability Matchmaking softwarewill then process these inputs and provide the matchmaking result to the designer. Theresult includes information about the resources and resource combinations matching foreach process step of the product requirement. This information can then be further pro-cessed in the system designer’s planning tool where the desired resources are selectedaccording to some company or situation specific criteria. [14, 15]
Resource Catalogue
RDRD
RD
RD
Capability Model
Capability Matchmaking
PRD
Matchmaking Result
System Designer selects
Output: suggested resource combinations to System Designer’s tool
Resource Pool
System Layout
Legend:RD = Resource DescriptionPRD = Product Requirements Description
System Designer
information
Fig. 1. Capability matchmaking process inputs and outputs
The capability matchmaking involves two aspects: Generation of new resource com-binations and matching the capabilities of these combinations with the product require-ments. The process flow is illustrated in Fig. 2 from left to right. First, the matchmakingsystem generates new resource combinations that have capabilities requested by theproduct, e.g. “Screwing”. Next, the interface compatibility of the resources is checkedbased on the interface matchmaking rules [13, 16]. After that, the combined capabilityparameters are calculated for the remaining resource combinations based on the com-bined capability rules. Finally, when the resource combinations have been created andtheir combined capabilities have been calculated, these combined capabilities are com-pared to the characteristics and requirements of the product. For this purpose, capabilitymatchmaking rules are used, which find out which resource combinations answer therequirements of the product. The combined capability rules have been introduced in [17]and matchmaking rules in [11]. Both have been implemented with SPIN rule language(SPARQL Inferencing Language).

Resource Interface Matchmaking 55
Fig. 2. Internal process phases in capability matchmaking
3 Interface Matching Process
The objective of the interface matching is to evaluate if a finite set of resources is con-nectable all together. The interface matching process and algorithm has been explainedin detail in [16], and data models, namely Resource Interface Model, and rules guidingthe interface matching process in [13]. The interface matching process is independentevaluation procedure working as one phase of capability matchmaking. Once capabilitymatchmaking finds a potential combination of resources, it calls the interface match-making procedure with the found resources as a set of tested resources. With the callcapability matchmaking provides populated Resource Model ontology as argument. Atthe end of the call, the interface matching procedure responses with simple true or falseresponse, if the given set of resources are connectable from interface point of view ornot.
The interface matchmaking algorithm has two main phases – coarse level and finelevel interface matching. The former focuses on the interface code and the gender.The first checks only that the string label representing the coded name of the interfacestandard is the same at both resource sides. The second defines the polarity of theinterface and evaluates it with simple rule – male and female or two neutrals can beconnected. Only the coarsely connected resources can continue to fine level interfacematching. It utilises the detailed interface characteristics. Each interface contains zeroto many additional characteristics. These are properties with name, value and operator,which describes a rule how this characteristic should be compared with a counterpartin order to have successful connection between the resources. Each characteristic isdefined as optional or mandatory. All mandatory ones must match with counterpartbefore resources are deduced connectable at fine level. If the interface does not have anyadditional characteristics defined, the coarse level match is directly valid at fine level.
The algorithm is implemented with Java. It makes several SPARQL queries toResource Model and Resource Interface Model ontologies, in order to collect infor-mation and reason out connectable resources. It also uses internal data structures, wherebuffered information and intermediate results are stored for later use. At the end of bothinterface matching levels, algorithm uses intermediate results to create network out of

56 N. Siltala et al.
tested resources. If and only if a single connected network containing all resources iscreated, it is determined that these resources are connectable. Detailed description of thealgorithm is provided in [16]. The software module implementing the interface match-making process is now integrated as integral part of overall capability matchmakingprocess.
4 Case Examples
Two case examples are used to illustrate the capabilitymatchmaking process, specificallyfocusing more deeply into the interface matchmaking phase. The first case focuses onscrew driving and the second on pick and place operations. In practice, capability match-making processes all product requirements i.e. each process step one by one and providesoutput results for each process step at once. For illustration and simpler representation,the cases presented here focus only on a single process step and its requirements andresults.
4.1 Screwdriving Solution
This case focuses on a single process step, which defines the requirement for fasteningtwo parts with a M6 sized screw with socket head cap (socket size 5 mm). The requiredend torque is 13..17 Nm. The matchmaking for this process step is illustrated in Fig. 3,which shows only a subset of our complete test data. First, the matchmaking will createnew resource combinations from the available resource pool for the required capability atcapability concept name level, i.e. resource combinations that could provide “Screwing”capability. The available resources in the resource pool are illustrated in the up left cornerin the figure, while the first phase presents four different combinations created by thematchmaking software. While creating these combinations, matchmaking software willsimultaneously check that the interfaces of the resources match at fine level, and thatthe resources can be physically connected. In case of the resource combination (b) onthe second phase, the tool bit does not fit into the screw driver’s tool interface and thusincompatible combination from interface perspective is filtered out.
After that, the matchmaking system will calculate the combined capability param-eters for the remaining combinations and check that the capability parameters matchwith the parametric requirements of the product. During the combined capability calcu-lation, the matchmaking system considers each individual resource and calculates theviable range for the whole combination. I.e. if a tool bit can bear only a certain torque, itcan be limiting the overall torque for the whole combination. The combined capabilitySPIN rules are used for inferring the combination parameters and matchmaking SPINrules are used to compare the parametric requirements of the product with the capabilityparameters. In this example case the matchmaking system will check that the screw typeand screw head size matches with the tool size and that the provided torque is withinthe range of the required torque. Unsuitable resources and resource combinations areagain filtered out. In this case the combination possibility (a) (in phase three) does notprovide enough torque, as it limits in maximum to 6 Nm, and it is eliminated from this

Resource Interface Matchmaking 57
++
+ +
++
+ +
Resources/Pool
1. Capability name level match resource combinations
++
+ +
++
+ +
2. Interface level matches
++
+ +
+ +
3. Capability parameters
Screwing torque = 1.8 .. 6 Nm
Screwing torque = 4 .. 15 Nm
++
+ +
4. Capability matchmaking result
Required capability: Screwing
Screw = M6, Socket head capRequired torque = 13..17 Nm
Screwing torque = 15 .. 150 Nm
a)
b)
c)
d)
Fig. 3. Capability matchmaking process for screwing case
result. In the end, only the two suitable resource combinations are left as suggestions inthe matchmaking result.
Within our practical test data, the resource pool used for this specific case had 68resources. 530 resource combinations providing “Screwing” capability where found,and 36 out of those was found compatible from the interface point of view. Combinedcapabilities were calculated for these and finally two resource combinations were foundfeasible for the given product requirement. These were presented in Fig. 3.

58 N. Siltala et al.
Table 1 shows interface details for the resources used in this case example. Interfaceport is a placeholder for interface(s) used for a specific function. Interface standard iden-tifies the code of the standard used. Gender sets the polarity of the interface implemen-tation. Additional interface characteristics define properties characterising the interface,such as size and shape in this example. Comparison operator defines how a characteristicshould be used in the compatibility evaluation. In this case operator is ‘SAME_SET’,which means that at both sides of the connection, the characteristic value(s) must be thesame to allow successful connection.
Table 1. Listing of resource, their interfaces and interface characteristics for screwdriving case.
Resource Port Interface standard Gender IF characteristics Operator
1. NXP pistolgrip nutrunner IF1 ISO_1173:2001 F C.Shape = HEXAGON SAME_SET
C.Size = 1–4 SAME_SET
IF3 HUMAN.INTERACTION.GENERAL M –
2. NXA right-angle nutrunner IF1 ISO_1173:2001 M C.Shape = SQUARE SAME_SET
C.Size = 3–8 SAME_SET
IF3 HUMAN.INTERACTION.GENERAL M –
3. Tightening system 350 - EC304 IF1 ISO_1173:2001 F C.Shape = HEXAGON SAME_SET
C.Size = 7–16 SAME_SET
IF3 COMP-A_MOUNT_0011 M –
IF5 HUMAN.INTERACTION.GENERAL M –
4. Tool bit for screwing - 1/4′ ′ - HexSocket 4 mm IF1 ISO_1173:2001 M C.Shape = HEXAGON SAME_SET
C.Size = 1–4 SAME_SET
IF2 ISO_4762:2004 M C.NominalKeySize = 4 SAME_SET
5. Tool bit for screwing - 1/4′ ′ - HexSocket 5 mm IF1 ISO_1173:2001 M C.Shape = HEXAGON SAME_SET
C.Size = 1–4 SAME_SET
IF2 ISO_4762:2004 M C.NominalKeySize = 5 SAME_SET
6. Tool bit for screwing - 3/8′′ - HexSocket 5 mm IF1 ISO_1173:2001 F C.Shape = SQUARE SAME_SET
C.Size = 3–8 SAME_SET
IF2 ISO_4762:2004 M C.NominalKeySize = 5 SAME_SET
7. Tool bit for screwing - 7/16′′ - HexSocket 5 mm IF1 ISO_1173:2001 M C.Shape = HEXAGON SAME_SET
C.Size = 7–16 SAME_SET
IF2 ISO_4762:2004 M C.NominalKeySize = 5 SAME_SET
8. Hammer IF1 HUMAN.INTERACTION.GENERAL M –
9. Human operator - expert IF1 HUMAN.INTERACTION.GENERAL F –
In Fig. 3. we have the first resource combination (a) from resources 1, 5 and 9. Theinterfaces allows the combination (See Table 1) – driver (1) has fitting interface (IF1)with the tool bit (5/IF1) at standard, gender and all interface characteristics. Driver (1)has also fitting interface (IF2) with the operator (9/IF1) moving the driver. But later,the combination (a) fails to fulfil the capability parameter requirement for generatingenough output torque. The second resource combination (1, 6 and 9) fails at interfacematching. The gender of driver (1/IF1) and tool bit (6/IF1) does not match, and even itwould, the interface characteristics are not fitting (See Table 1). This would be the caseif driver (1/IF1) is tried to connect with tool bit (7/IF1), when the interface characteristicC.Size will prevent the connection. In case of the resource combinations (c) and (d)both interface and capability parameter requirement are matching, leading to propose

Resource Interface Matchmaking 59
resource combinations (3, 7, 9) and (2, 6, 9) as a match and potential solution for thisproduct requirement.
4.2 Pick and Place Solution
Another case example focuses on pick and place case. Similar kind of case was discussedas test case in [13]. The handled part is cylinder shaped having diameter of 44 mm andlength of 30 mm and it weights 50 g. The product requirement defines following needsfor the process step: grasping is done externally, maximum allowed compressive forceis 10 N, transportation is needed in XYZ-directions (linear movements), and positioningaccuracy is 0.2 mm.
Within our practical test data, the same resource pool with 68 resources is used asin the previous case. It contains two grippes and seven moving devices. The capabilityname level matchmaking found 12 potential combinations providing “pick and place”capability, and four out of those were found compatible also from the interface pointof view. Combined capability parameters were calculated for these and finally threeresource combinations were found feasible for the given product requirement. In thiscase three different robot arms are found mating with one of the grippers. Resourcecombination (a) from resources 4 and 1; (b) from 5 and 1; and (c) from 6 and 1 (SeeTable 2). The resource (4) demonstrates use of several standard interfaces for sameinterface port. In this case the Schunk-SWS interface is implemented with help of anadapter plate, thus a tool fulfilling either of these standards can be connected to thisinterface port. In case of resource combination (c) the gripper has two interface portswhere the connection can take place – 6/IF2 and 6/IF3. The current version of interfacematchmaking does not count or reserve the interface ports, but match is returned ifthere is any suitable position for connection. The fourth resource combination (d) is amanipulator (3) mating with the gripper (2) (See Table 2), but it provides motion onlyin two degrees of freedom, thus getting neglected from the result.
5 Verification of Capability and Interface Matchmaking Results
Important part of our SW development process was testing and verification. We usedautomatic unit tests for our SW development, but the verification of the end results wasdone mainly manually. We defined manually the expected resource combinations, andinferred and calculated the combined capability parameters from the input resource pooland the product requirement in question. This defined a target result, which was thencompared with the result of automatic capability matchmaking process. The verificationcontained mainly two evaluation criteria: a) all resource combinations/resources com-pared to manually deduced matches are found, and b) no any false positive matchesare included. I.e. resource combination is included to the result, even it is not solvingthe product requirement from whatever perspective or its resources are not connectabletogether.
In the development phase, we verified separately and gradually the operation of thedifferent phases of our capability matchmaking process. I.e. starting from name levelmatchmaking and ensuring gradually, that correct sub-set or sub-result was passed on

60 N. Siltala et al.
Table 2. Listing of resources, their interfaces and interface characteristics for pick and place.
Resource Port Interface standard Gender IF characteristics Operator
1. Gripper1.1 IF1 Schunk_SWS F C.Size = 005 SAME_SET
C.Pneumatic = Pxx SAME_SET
IF3 General_Tool_TCP M –
2. Gripper-disc1 IF1 COMP-A_GRIPPER_0001 M C.Size = 30 SAME_SET
IF3 General_Tool_TCP M –
3. Lab_2-axis manipulator IF1 SHAPE.FLANGE.CIRCULAR N
IF2 COMP-A_GRIPPER_0001 F C.Size = 30 SAME_SET
4. UR_UR10 ind IF1 SHAPE.FLANGE.CIRCULAR N
IF2 ISO_9409-1:2004 F C.Pitch_circle_diameter = 50 SAME_SET
C.Number_of_thread_holes = 4 SAME_SET
IF2 Schunk_SWS M C.Size = 005 SAME_SET
C.Pneumatic = Pxx SAME_SET
5. UR_UR10 collaborative IF1 SHAPE.FLANGE.CIRCULAR N
IF2 ISO_9409-1:2004 F C.Pitch_circle_diameter = 50 SAME_SET
C.Number_of_thread_holes = 4 SAME_SET
IF2 Schunk_SWS M C.Size = 005 SAME_SET
C.Pneumatic = Pxx SAME_SET
6. Dual-arm robot IF1 SHAPE.FLANGE.CIRCULAR N
IF2 Schunk_SWS M C.Size = 005 SAME_SET
C.Pneumatic = Pxx SAME_SET
IF3 Schunk_SWS M C.Size = 005 SAME_SET
C.Pneumatic = Pxx SAME_SET
IF5 SHAPE FLANGE RECTANGLE 4HOLE M P.Hole_pitch_in_X = 0.042 SAME_SET
P.Hole_pitch_in_Y = 0.042 SAME_SET
7. Balancer device IF3 General_Tool_TCP M –
IF4 HUMAN.INTERACTION.GENERAL M –
8. Human operator - expert IF1 HUMAN.INTERACTION.GENERAL F –
the next phase. This was mandatory because of complexity of our system and eventuallytimely long run of complete capability matchmaking process.
The verificationwas comprehensive and truthful, because of the use of representativeresources even the amount of resources was limited. We had different kind of resourcesproviding the same simple capability, with goodmix of interfaces and capability parame-ter values. The finite set made it possible to determine and calculatemanually all possibleresource combinations and their combined parameter values. The processes (capabilityname matching, SPIN rules, and interface matching algorithm) are expected to operatedeterministically, thus the matchmaking should behave similarly and find correct resultswhen the search space (i.e. size of resource pool) is enlarged.
6 Discussion and Conclusions
This paper presented interface matchmaking process and how it can be used to sort outresource combinations as a part of capability matching process. We have integrated theinterface matching software module as integral part of the overall matchmaking process,and we have proven that the implementation of the prototype does work as desired. Inthis paper, the operation of the whole capability matchmaking process was demonstratedthrough two cases, focusing on interface matching. The presented cases illustrate how

Resource Interface Matchmaking 61
the capability matchmaking creates proposed resource combinations, and how interfaceand parametric matching filter out the non-fitting combinations, leaving eventually onlythe fitting matches as output. Sub-set of resources, which are involved within the cases,and the resources’ interface definitions were described in the paper. The verificationof results was discussed. The output of capability matchmaking corresponds with themanually deduced results for the given test resource pool containing 68 resources.
The capability matchmaking method can facilitate rapid system design and reconfig-uration planning, by allowing computerised methods to find feasible system configura-tion scenarios to different product requirements. Use of automatic matchmaking reducesand speeds up themanual design efforts, as the systemdesigner can focus his/her resourceselection to truly connectable and fit resources, instead of searching for resources, andanalysing their interfaces and properties. The matchmaking can be applied over largeresource catalogues containing thousands of resources and their variants, which canbe automatically screened to find the few appropriate resources and resource combina-tions. Additionally, the digital resource catalogues are expected to contain productionresources frommultiple vendors, which increases number of resources to study, but alsoincreases the number of available alternatives. Thus, matchmaking opens possibilitiesfor new and more innovative solutions to be found. The system designer is not boundto comfortable “old and known solution”, which is almost solving the requirements, buthe/she can select the optimum one.
As a future work, we have some ideas to continue the interface matchmaking proce-dure to still finer level of detail including resource matching at interface port level. Thiscan extend the matchmaking procedure for suggesting also physical layouts, not onlyresource combinations. Testing of capability matchmaking tools and processes will becontinued with more resources, and different assembly and manufacturing processes.
References
1. Koren, Y., Shpitalni, M.: Design of reconfigurable manufacturing systems. J. Manuf. Syst.29, 130–141 (2010). https://doi.org/10.1016/j.jmsy.2011.01.001
2. Wiendahl, H.-P., et al.: Changeable manufacturing - classification design and operation. CIRPAnn. 56, 783–809 (2007). https://doi.org/10.1016/j.cirp.2007.10.003
3. Rösiö, C., Säfsten, K.: Reconfigurable production system design – theoretical and practicalchallenges. J.Manuf. Technol.Manage.24, 998–1018 (2013). https://doi.org/10.1108/JMTM-02-2012-0021
4. Westkämper, E.: Factory transformability: adapting the structures of manufacturing. In:ReconfigurableManufacturing Systems and Transformable Factories, pp. 371–381. Springer,Berlin (2006). https://doi.org/10.1007/3-540-29397-3_19
5. Pakkanen, J., Juuti, T., Lehtonen, T.: Brownfield process: amethod formodular product familydevelopment aiming for product configuration. Des. Stud. 45, 210–241 (2016). https://doi.org/10.1016/j.destud.2016.04.004
6. Ferreira, P., Lohse, N., Ratchev, S.: Multi-agent architecture for reconfiguration of precisionmodular assembly systems. In: Ratchev, S. (ed.) IPAS 2010. LNCS, vol. 315, pp. 247–254.Springer, Berlin (2010). https://doi.org/10.1007/978-3-642-11598-1_29
7. EUPASS Consortium: EUPASS - Evolvable Ultra-Precision Assembly SystemS - Project.EU FP6, GA No 507978. https://cordis.europa.eu/project/rcn/75342/factsheet/en (2006).Accessed 11 Nov 2019

62 N. Siltala et al.
8. ReCaM - Rapid reconfiguration of flexible production systems through capability- basedadaptation, auto-configuration, integrated tools for production planning - project. EUHorizon2020, GA No 680759. http://www.recam-project.eu/ (2017). Accessed 11 Nov 2019
9. Siltala, N., Järvenpää, E., Lanz, M.: Formal information model for representing productionresources. In: Nääs, I. et al. (eds.) APMS 2016. IFIP Advances in Information and Communi-cation Technology, vol. 488, pp. 53–60. Springer, Cham (2016). https://doi.org/10.1007/978-3-319-51133-7_7
10. Järvenpää, E., Siltala, N., Hylli, O., Lanz, M.: Capability matchmaking procedure to supportrapid configuration and re-configuration of production systems. Procedia Manuf. 11, 1053–1060 (2017). https://doi.org/10.1016/j.promfg.2017.07.216
11. Järvenpää, E., Siltala,N.,Hylli, O., Lanz,M.: Productmodel ontology and its use in capability-based matchmaking. Procedia CIRP 72, 1094–1099 (2018). https://doi.org/10.1016/j.procir.2018.03.211
12. Järvenpää, E., Siltala, N., Hylli, O., Lanz, M.: The development of an ontology for describingthe capabilities of manufacturing resources. J. Intell. Manuf. 30, 959–978 (2019). https://doi.org/10.1007/s10845-018-1427-6
13. Siltala, N., Järvenpää, E., Lanz, M.: Creating resource combinations based on formallydescribed hardware interfaces. In: Ratchev, S. (ed.) Precision Assembly in the DigitalAge. IPAS 2018. IFIP Advances in Information and Communication Technology, vol. 530,pp. 29–39. Springer, Cham (2019). https://doi.org/10.1007/978-3-030-05931-6_3
14. Mital, A., Siltala, N., Järvenpää, E., Lanz, M.: Web-based solution to automate capabilitymatchmaking for rapid systemdesign and reconfiguration. ProcediaCIRP 81, 288–293 (2019).https://doi.org/10.1016/j.procir.2019.03.050
15. Järvenpää, E., Siltala, N., Hylli, O., Lanz, M.: Implementation of capability matchmakingsoftware facilitating faster production system design and reconfiguration planning. J. Manuf.Syst. 53, 261–270 (2019). https://doi.org/10.1016/j.jmsy.2019.10.003
16. Siltala, N., Järvenpää, E., Lanz, M.: A method to evaluate interface compatibility duringproduction system design and reconfiguration. Procedia CIRP 81, 282–287 (2019). https://doi.org/10.1016/j.procir.2019.03.049
17. Järvenpää, E., Hylli, O., Siltala, N., Lanz, M.: Utilizing SPIN rules to infer the parametersfor combined capabilities of aggregated manufacturing resources. IFAC-PapersOnLine 51,84–89 (2018). https://doi.org/10.1016/j.ifacol.2018.08.239
Open Access This chapter is licensed under the terms of the Creative Commons Attribution 4.0International License (http://creativecommons.org/licenses/by/4.0/), which permits use, sharing,adaptation, distribution and reproduction in anymedium or format, as long as you give appropriatecredit to the original author(s) and the source, provide a link to the Creative Commons license andindicate if changes were made.
The images or other third party material in this chapter are included in the chapter’s CreativeCommons license, unless indicated otherwise in a credit line to the material. If material is notincluded in the chapter’s Creative Commons license and your intended use is not permitted bystatutory regulation or exceeds the permitted use, you will need to obtain permission directly fromthe copyright holder.

Investigation on the Convergence of the GeneticAlgorithm of an Aerodynamic Feeding SystemDue to the Enlargement of the Solution Space
Torge Kolditz(B) , Caner-Veli Ince , and Annika Raatz
Institute of Assembly Technology, Leibniz Universitaet Hannover, 30823 Garbsen, [email protected]
Abstract. To meet the demands for flexible assembly technology, an aerody-namic feeding system has been developed. The system autonomously finds theoptimal configuration of four parameters – two angles of inclination, nozzle pres-sure and component speed – using a genetic algorithm, which has been presentedin earlier work. To increase the flexibility of the feeding system, an actuator wasimplemented, that enables the variation of the nozzle position orthogonally to themoving direction of the components. This paper investigates the effects of themore flexible flow against the components on their behavior when passing thenozzle. Additionally, the nozzle position was implemented into the genetic algo-rithm as a fifth parameter. Therefore, the impact of the enlargement of the solutionspace of the genetic algorithm due to the implementation of a fifth parameter isinvestigated in this paper as well.
Keywords: Assembly · Genetic algorithm · Aerodynamic feeding
1 Introduction
The buyer’s market is changing, which places new demands on products. These demandsinclude individual design, a high standard of quality and a minimum price. Added to thisis the shortening of the product’s lifespan [1]. Production must adapt to these demandswhile the industry is pursuing cost reduction in order to maximize profits. Secondaryprocesses that do not make a direct contribution to assembly must therefore be keptlean, reliable and inexpensive. Apart from organizational and constructive measures,automation is one way to rationalize assembly processes [2].
The costs of an automated production line are largely generated by feeding and trans-port systems. The actual assembly process is responsible for about 20% of the costs [3].Feeding plays an important role, as the objects are transported as bulk material for costreasons. Bulk material is cheaper and easier to handle [4]. For the following process,however, the objects are required in a defined position. For this reason, a targeted orien-tation from the bulk material must take place so that the next process can be performed[5]. The feeding process can be divided into four subtasks [3].
© The Author(s) 2021S. Ratchev (Ed.): IPAS 2020, IFIP AICT 620, pp. 63–77, 2021.https://doi.org/10.1007/978-3-030-72632-4_5

64 T. Kolditz et al.
• Separation: The objects are sorted from the bulk material.• Transport: The ordered objects must now be transported to the next process.• Orientation: After the ordering of the objects, each part has an arbitrary orientation.The orientation process aligns the objects into a defined orientation.
• Positioning: The objects are nowdesigned for the next process so that direct processingis possible.
Often, a vibratory bowl feeder is used to perform these tasks. It has a simple design, canbe used for a wide range of geometries and is robust in operation [2, 6]. Objects that arenot oriented correctly are returned to the process [7]. The configuration of the vibratorybowl feeder depends on the geometry of the objects and takes place experimentally,which is time intensive [8]. One reason for the high amount of time required is that itis not possible to make general statements about the behavior of objects in a vibratorybowl feeder [9]. Therefore, feeding technology has a high potential for optimization.
To meet the demands for a highly flexible and simultaneously efficient feeding tech-nology, an aerodynamic feeding system has been developed at the Leibniz University ofHanover [10–13]. The system uses a constant air jet to exert a force on the componentspassing the nozzle. Using a genetic algorithm, the system is designed to parameterizeitself for an optimal output rate. The principle of aerodynamic orientation as well as thegenetic algorithm will be elucidated in the following.
2 The Aerodynamic Feeding System
Basic Principle. The aerodynamic feeding system presented and used in this workoperates with only one air jet, which every component passes. In other work, systemshave been presented that use multiple nozzles or air cushions to orient and transportparts [14, 15]. Figure 1 shows the process of aerodynamic orientation in the describedfeeding system. It becomes clear that the component behaves differently depending onthe orientation it has when arriving at the nozzle. If the workpiece arrives in the wrongorientation, it is turned over by the air jet, as can be seen in Fig. 1a), whereas it keepsits orientation, if it already arrives in the correct orientation (Fig. 1b)). The reason forthe different behaviors of the component depending on the initial orientation lies in theshape and the mass distribution of the workpiece. The exemplary workpiece in Fig. 1 hasa varying projected area against the airflow. Therefore, the wider part of the componentexperiences a higher drag force than the thinner part, which results in a momentumgenerating the rotation of the component. In the example, the angle of inclination α
promotes clockwise rotation and hinders counterclockwise rotation, resulting in thesame output orientation regardless of the input orientation.
Apart from the angle of inclination α, the orientation process is primarily influencedby three additional parameters, seen in Fig. 1:
• Angle of inclination β
• Nozzle pressure p• Component speed v

Investigation on the Convergence of the Genetic Algorithm 65
The angle β influences the force of gravity acting on the component on the onehand and determines the impact of the friction between the component and the guidingplane. The nozzle pressure p directly affects the magnitude of drag force acting on theworkpiece. If it is set too low, the component might not rotate at all, whereas a higherpressure can lead to multiple and unpredictable rotations. Lastly, the component speed vdetermines, how fast a workpiece passes the air jet and therefore how long it is affectedby the drag forces. The parameter can be controlled by adjusting the speed of a conveyorlocated ahead of the nozzle.
Fig. 1. Illustration of the aerodynamic orientation process [10]
After the orientation process, each component’s orientation is determined using aline scan camera. By dividing the number of components in the right orientation bythe number of all components measured, an orientation rate between 0 and 100% iscalculated. In various experiments, it was shown that the nozzle pressure p has thehighest impact on the orientation rate, followed by the interaction between p and v aswell as p and β [16]. The identified main effects and interactions are shown in Fig. 2.Even though the effects of parameter changes on the orientation process are known,the parametrization of the feeding system for new components takes a lot of time andexpertise with the equipment. To tackle this disadvantage, a genetic algorithm has beenimplemented in the systems control, which will be presented in the following section.

66 T. Kolditz et al.
Fig. 2. Values of the main effects and interactions between parameters on the orientation rate [16]
Genetic Algorithm. Finding a set of parameters inducing a satisfactory orientation rate(e.g. >95%) constitutes a non-linear optimization problem. Additionally, the interrela-tion between input (the parameters) and the output (orientation rate) is not necessarily acontinuous function. Therefore, a genetic algorithm (GA) is used as an optimizer [10, 11,16]. The structure of the genetic algorithm is shown in Fig. 3. One generation contains4 individuals whose fitness is evaluated by the orientation rate. The parameters of theGA were optimized in previous studies carried out by busch [16]. The best individualis automatically taken over as parent individual in the next generation, the second par-ent individual is determined by roulette selection. Recombination is done via uniformcrossover and the mutation rate is 55%.
With the range and increments of the four “old” parameters, as shown in Table 1, alarge solution space with up to 14,214,771 possible configurations is spanned. Neverthe-less, the genetic algorithm has proven to be a very effective and time-saving regardingthe adjustment of the feeding system to new workpieces [16]. Taking into account thefifth parameter, the solution space would grow to up to 440,657,901 possible configura-tions. This shows, why it is important to investigate the effect of a fifth parameter to thesystem and the algorithm on the convergence of the very same.
Table 1. Range and Increments of the aerodynamic feeding systems parameters
Parameter Minimum value Maximum value Increment
α 20° 25° 0.1°
β 39° 50° 0.1°
p 0.1 bar 0.9 bar 0.01 bar
v 50 m/min 80 m/min 1 m/min
z 0 mm 30 mm 1 mm

Investigation on the Convergence of the Genetic Algorithm 67
Fig. 3. Structure of the genetic algorithm of the aerodynamic feeding system [10]
3 Implementation of the Nozzle Position as Fifth Parameter
Previously, a fixed nozzle position had to be manually selected for each component,which could be set via amanual positioning table. In the case of rotationally symmetricalcomponents, positioning the center of the nozzle half the diameter of the component awayfrom the guiding plane seems reasonable. This way, the workpiece should receive themaximum amount of drag force, which would lead to a minimal pressure needed. Inpractice, experiments show that, depending on the dimensions and geometry of the part,a centered air jet can cause an inflow paradox, where the component is aspirated and inconsequence slowed down by the air jet. The reason for this lies in Bernoulli’s principle,which states that increasing the speed of a flowing fluid is accompanied by a decrease ofthe pressure [17]. This effect can occur in the gap between the nozzle and the componentpassing it. Preliminary experiments show, that this effect can be significantly reducedby moving the nozzle orthogonally to the moving direction of the components.
Another problem occurs, when adapting the feeding system to more complex com-ponents that have irregular shapes. Manually adjusting the nozzle position can easilybecome an optimization problem of its own.
In order to expand the spectrum of components the feeding system can handle andreduce the effects of the inflow paradox a linear actor that can vary the position of thenozzle orthogonally to the moving direction of the components was implemented in thefeeding system. This parameter, called z, is shown in Fig. 4. Themagnitude of z (Table 1)is defined as the distance between the center of the nozzle and the guiding plane.
To automatically control parameter z, a motorized linear positioning table with apreloaded spindle drive was chosen. With this hardware, a positioning accuracy of0.01 mm can be reached. The stroke is 75 mm. The high precision and stroke are chosen

68 T. Kolditz et al.
to ensure that the actuator can continue to be used even in future modifications of thefeeding system. The position of the nozzle is controlled using an analog output withan output range of 0–10 V DC and a resolution of 16 bit. The trim range of the linearactuator can be specified via setup software. The position of the nozzle can be set eithermanually by the user or autonomously by the genetic algorithm.
The implementation of the nozzle position into the genetic algorithmwas achieved byexpanding the chromosomes from four to five alleles. The processes of selection, recom-bination and mutation also had to be adapted to the extended chromosomes while theprinciples – e.g. one-point-, two-point- and uniform-crossover – remained unchanged.
Fig. 4. Orientation process of exemplary workpieces with the parameters v (conveyor), p (nozzle)and z (linear positioning)
4 Effect of the Nozzle Position on the Orientation Process
To assess the effect of the variation of the nozzle position on the orientation process,the behavior of the workpieces at a varying inflow is evaluated. The entire orientationprocess of one workpiece, from the first contact with the air jet to the impact on thechute, takes about 0.2 s. To allow for the analysis of the orientation process, it is filmedwith a frame rate of 240 fps. This way, the behavior of the workpieces can be reviewedproperly. In the following, two exemplary components are examined for their behaviorunder different inflow conditions.
Pneumatic Plug. As first exemplary part, a plug for pneumatic pipes is used. The partcan be seen in Fig. 4. The workpiece is well suited for first experiments, as it has a

Investigation on the Convergence of the Genetic Algorithm 69
simple geometry due to the rotational symmetry. In addition, due to the strongly varyingprojected area, it is a component that is generally very well suited for aerodynamicorientation. The measurements of the component are shown in Fig. 5.
Fig. 5. Measurements of pneumatic plug
Since the nozzle pressure has the strongest influence on the orientation process, toreduce the testing effort, only the parameters p and z are varied. The step size of thepressure p is chosen relatively high, with 0.05 bar to reduce the testing effort. Usuallythe system controls p with a resolution of 0.01 bar, because the workpieces have alow weight and the orientation process is sensitive to pressure changes. The resultingexperimental plan is shown in Table 2. For each measurement, five workpieces weredelivered to the nozzle in the wrong orientation and five workpieces were delivered inthe right orientation. The orientation process of each workpiece is then evaluated todetermine the orientation rate presented in Table 2. Entries with a dash indicate, thatno orientation process takes place, which means, that neither the workpieces arriving atthe nozzle in the right orientation nor those arriving in the wrong orientation are rotatedby the air stream. A value of 0.9 means, for example, that 9 of 10 workpieces leave theorientation process in the right orientation.
Table 2. Orientation rate of pneumatic plug depending on nozzle pressure and nozzle positionwith α = 22°, β = 45 ° and v = 70 m/min
0 mm 2 mm 4 mm 6 mm 8 mm 10 mm
0.10 bar – – – – – –
0.15 bar – – 0.9 0.8 0.8 –
0.20 bar – 0.9 0.6 0.5 0.5 –
0.25 bar – 0.9 0.1 0.5 0.5 –
0.30 bar – 0.6 0.0 0.2 0.2 0.1
The examination of the results in Table 2 shows that good orientation rates canbe achieved even with the nozzle not aligned to the centerline of the workpiece. Thevariation of the nozzle position allows for high orientation rates even at nozzle pressuresthat would normally lead to poor orientation rates. This can be seen when comparing

70 T. Kolditz et al.
the second column of Table 2 (z = 2 mm) to the third column (z = 4 mm): While theorientation rate rapidly drops with pressures above 0.15 bar with z = 4 mm, a highorientation rate can be achieved at pressures of 0.2 and 0.25 bar, when the nozzle isat z = 2 mm. This leads to the conclusion that although the solution space becomeslarger due to the addition of a fifth parameter, new parameter combinations with a highorientation rate arise.
In addition to the evaluation of the orientation process via the orientation rate, aqualitative evaluation of the process is also carried out in the following by consideringthe trajectory of the components. Figure 6 shows the trajectories of four componentsduring the orientation process. They differ by the set of system parameters and theincoming orientation as described in the subframes.
Fig. 6. Trajectories of pneumatic plugs with different parameters p and z
It becomes clear, that the position of the nozzle has decisive influence on the tra-jectory of the workpieces. The comparison of Fig. 6a) and b) shows that a very stablereorientation of the component can be achieved even with a non-centered nozzle posi-tion. The fact that the component in Fig. 6a) does not lift off the chute is to be seen as amajor advantage. When the component hits the chute out of flight as seen in Fig. 6b), theimpact impulse can lead to uncontrolled jumping of the component on the chute, thuspreventing optimal exploitation of the orientation process.
Particularly noteworthy is the stable behavior of those components, which alreadyarrive at the nozzle in the correct orientation. It was observed in all tests, for whichFig. 6c) and d) are exemplary, that the components exhibit a much more predictableand reproducible behavior when the nozzle position is not centered. With a centerednozzle position, a small pressure range must be found in which the incorrectly arrivingcomponents are still reoriented but the correctly arriving components are not reorientedyet. With the non-centered nozzle position, on the other hand, the varying projected

Investigation on the Convergence of the Genetic Algorithm 71
area of the component against the inflow can be utilized much better. Therefore, a higherrange of nozzle pressure can be harnessed, which has a positive effect on the convergenceof the genetic algorithm.
Printed Sleeve. In addition to the pneumatic plugs, the effect of a flexible inflow wasalso investigatedonplastic sleeves.The sleeves are rotationally symmetrical parts aswell.However, in contrast to the pneumatic plugs, the sleeves have a completely homogenousprojected inflow surface. Because of these characteristics and the higher diameter, it wasexpected that the inflow paradox caused by Bernoulli’s principle would have an impacton the orientation process. This assumption was confirmed during the evaluation of thetests. The dimensions of the sleeves are shown in Fig. 7. The sleeves were manufacturedusing a 3D printer and the eccentricity is 10%.
Fig. 7. Measurements of plastic sleeve
The trajectories of the components during the orientation processes with differentparameter settings are shown inFig. 8. Tobetter illustrate the orientation of the cylindricalsleeves, the end with the center of mass has been digitally marked with a + symbol.Considering Fig. 8a), it becomes clear, that a nozzle pressure of 0.2 bar is enough toreorient the plastic sleeve with z = 2 mm. Nevertheless, with z = 6 mm (centered) noreorientation takes place (Fig. 8b). The different amounts of uplift on the componentsalso becomes clear by comparing Fig. 8c) and d): When the sleeve arrives at the nozzlepositioned 2 mm from the guiding plane, it is slightly lifted but does not rotate more thana few degrees. The component arriving with the nozzle centered (z= 6mm) passes abouthalf of its length over the nozzle without getting any lift. This circumstance is attributedto the Bernoulli Effect. When the sleeve passes over the nozzle, it creates a gap betweenitself and the nozzle carrier. Therefore, the flow path of the air jet is narrowed withresults in a higher velocity of the fluid. This, according to Bernoulli’s principle, leadsto a decrease of pressure between the sleeve and the carrier and results in the part beingdragged down.
This is contrasted by the behavior of the component when the nozzle position isnot centered. On the one hand, this increases the distance between the nozzle and theworkpiece. On the other hand, the air jet does not hit the workpiece inside the narrowgap between workpiece and nozzle carrier, which prevents the acceleration of the airflow and therefore a decrease of pressure.

72 T. Kolditz et al.
Fig. 8. Trajectories of plastic sleeves with different parameters p and z
Analysis of all trajectories of the experimentswith the pneumatic plugs and the plasticsleeves shows the advantages of the variable nozzle position even with geometricallysimple components. Essentially, four findings can be derived:
1. Even at higher pressures, the trajectory of the workpiece is lower when the nozzleposition is not centered. This is an advantage, because the impulse at the impact onthe slide is lower. This in turn leads to less jumping of the components on the slideand thus, finally, to a more stable and reliable feeding process.
2. Components that already arrive at the nozzle in the right orientation are reorientedeasily, when the nozzle position is aligned to their centerline. When the nozzleposition is not centered, components arriving in the right orientation have a muchlower risk of being inadvertently reoriented. The reason for that is, that the varyingprojected area of the component can be exploited much better, when the core ofthe air jet is not aligned with the centerline of the component. This way, duringthe passing of the thicker part, much more momentum is generated than during thepassing of the thinner part.
3. With the nozzle position at extreme values (z = 0 mm or z = 10 mm) very little liftis generated. Therefore, it is concluded that the nozzle bore must be positioned inthe range of the measurements of the fed component.
4. The unwanted effect of Bernoulli’s principle can be significantly reduced by varyingthe nozzle position. Reducing this effect leads to a more stable orientation processthat can be achieved with lower nozzle pressures.
5 Convergence of the Genetic Algorithm
In order to investigate and evaluate the impact of the fifth parameter on the convergenceand setting time of the genetic algorithm, additional trials needed to be carried out. To

Investigation on the Convergence of the Genetic Algorithm 73
do so, the genetic algorithm was run five times with and five times without a variablenozzle position. The tests were carried out alternately to compensate for the influenceof environmental influences like changes in ambient pressure or non-measurable vari-ables like pollution of the slide by dust or abrasion of the components. To determinethe orientation rate of one individual, the orientation of 100 components is measured.With a feeding rate of about 200 parts per minute for the experimental feeding system(limited by the centrifugal feeder) two individuals can be tested per minute. As exem-plary component, the pneumatic plug from previous testing was chosen. The range of theparameters α, β and vwas chosen according to Table 1. Based on the preliminary tests inSect. 4 the minimum and maximum values of p were set to 0.1 and 0.3 bar respectively.Also, the range of the nozzle position was set from 1 to 9 mm in accordance with theaforementioned preliminary testing.
Figure 9 shows the distribution of the number of individuals needed by the GA toreach an orientation rate of 95% or higher. It becomes clear, that with a variable nozzleposition, the genetic algorithm needs far fewer individuals to find a satisfying solution.The longest setting time with the variable nozzle position is about as long as the shortestsetting time with fixed nozzle position. Additionally, the deviation of the maximum andminimum setting time from the average setting time is much smaller with a variablenozzle position.
Fig. 9. Distribution of number of individuals needed by the GA to reach an orientation rate of95% or higher with fixed and variable nozzle position.
The advantages of the variable nozzle position as fifth parameter also become clearwhen looking at Table 3. The average number of individuals, which correspond directlyto the setting time is reduced by 64% with a variable nozzle position compared toa fixed nozzle position. Also, the maximum number of individuals of five runs withvariable nozzle position corresponds approximately to a third of the maximum numberof individuals of five runswithfixednozzle position. This is a huge advantage consideringthat the setting time is directly dependent on the number of individuals and that duringthe setting process the system is not productive. All in all the experiments clearly show,that adding the fifth setting parameter does not impair the convergence of the GA and

74 T. Kolditz et al.
therefore the setting time of the feeding system. On the contrary, the average setting timeis significantly reduced.
Table 3. Minimum, maximum and average number of individuals to convergence,Standard deviation and average orientation rate (OR)
Minimum Maximum Average Std.dev.
Av.OR
Fixed 43 128 82 36.6 0.958
Variable 8 44 29.4 12.4 0.970
Fig. 10. Distribution of the system parameters in case of convergence for fixed and variable nozzleposition.
Figure 10 shows the distribution of the system parameters at the end of each test run,when convergence (orientation rate≥ 95%) was reached. In each plot, the left box showsthe distribution for a fixed nozzle position, whereas the right box shows the distributionfor a variable nozzle position. While α and β show no significant differences, the nozzlepressure p (Fig. 10c)) is generally higher with a variable nozzle position. At the sametime, the range of p is also wider with the variable nozzle position. Considering that fora system configuration with only four parameters, the nozzle pressure p has the highesteffect on the orientation rate (c.f. Fig. 2), it is assumed, that the higher acceptable rangeof the pressure p significantly contributes to the shorter setting time.
Figure 10e) shows that all values for z are between 1 mm and 3 mm with a medianof 2 mm. This shows that the fixed nozzle position of 4 mmwas not the optimal position

Investigation on the Convergence of the Genetic Algorithm 75
and that – using the fifth parameter – the system is now able to determine the optimalnozzle position autonomously, which in turn reduces the setting time. The higher medianand range of the orientation rate at convergence (Fig. 10f)) is an indication for a higherprocess stability that can be achieved with a non-centered nozzle position.
6 Conclusion and Outlook
In this work, the extension of an aerodynamic feeding system was presented. In orderto increase the flexibility of the system, the position of the nozzle perpendicular to thedirection of movement of the components was introduced as fifth adjustment param-eter in addition to two angles, the nozzle pressure and the feeding speed. As a resultof the new parameter, the number of possible configurations of the system increasedsignificantly. In order to investigate the effects of the nozzle position on the autonomousadjustment algorithm (GA) of the aerodynamic feeding system, the behaviour of thecomponents in the orientation process was examined in detail. It was found that evenwith simple components, a flexible inflow can lead to an increased resilience againstvariation of nozzle and ambient pressure. Since the pressure has been identified as mainfactor determining the orientation rate, this higher resilience induces an elevated processreliability. In addition, the disturbing influence of Bernoulli’s effect could be reduced bymeans of a displaced inflow.
Subsequently, it was investigated how the setting time of the aerodynamic feedingsystem changes due to the enlarged solution space of the genetic algorithm. It was foundthat the adjustment time with a variable nozzle position can be reduced by more than60% on average compared to a fixed nozzle position, despite the larger solution space.The reason for this is the higher range of possible nozzle pressures, generating a highorientation rate and the higher process stability mentioned above.
Further experiments on the convergence of the GA are to be carried out in futurework. The component spectrum and complexity will be varied, expecting to show furtheradvantages of the variable nozzle position. In addition, the analysis of the parameter setsat convergence (Fig. 10) shows that the effects of the parameters on the orientation ratehave shifted. For example, the system’s sensitivity to pressure changes seems to be lower,while the nozzle position seems to have a high impact on the orientation process. It istherefore necessary to determine the effects of the system parameters on the orientationrate again, using Design of Experiments methods.
Acknowledgement. The authors would like to thank the German Research Foundation (DFG)for their financial support of the research project RA 1736/19-2.
References
1. Hsuan Mikkol, J., Skjøtt-Larsen, T.: Supply-chain integration. Implications for mass cus-tomization, modularization and postponement strategies. Prod. Planning Control 15(4),352–361 (2007). https://doi.org/10.1080/0953728042000238845

76 T. Kolditz et al.
2. Lotter, B., Wiendahl, H.-P.: Montage in der industriellen Produktion. Springer, BelinHeidelberg (2006)
3. Krüger, J., Lien, T.K., Verl, A.: Cooperation of human and machines in assembly lines. CIRPAnn. 58(2), 628–646 (2009). https://doi.org/10.1016/j.cirp.2009.09.009
4. Bohringer, K.-F., Bhatt, V., Goldberg, K.Y.: Sensorless manipulation using transverse vibra-tions of a plate. In: Proceedings of 1995 IEEE International Conference on Robotics andAutomation, Nagoya, Japan, pp. 1989–1996 (1995)
5. Warnecke, H.-J.: Die Fraktale Fabrik. Revolution der Unternehmenskultur. Springer, Berlin(1992). https://doi.org/10.1007/978-3-662-06647-8
6. Klocke, F., Pritschow, G.: Autonome Produktion. Springer, Berlin (2004). https://doi.org/10.1007/978-3-642-18523-6
7. Schroer, B.J.: Electronic parts presentation using vibratory bowl feeders. Robotics 3(3–4),409–419 (1987). https://doi.org/10.1016/0167-8493(87)90057-X
8. van der Stappen, A.Frank., Berretty, R.-P., Goldberg, K., Overmars, Mark H.: Geometryand part feeding. In: Hager, Gregory D., Christensen, H.I., Bunke, H., Klein, R. (eds.) SensorBased Intelligent Robots. LNCS, vol. 2238, pp. 259–281. Springer, Heidelberg (2002). https://doi.org/10.1007/3-540-45993-6_15
9. Ngoi, B.K.A., Lim, L.E.N., Ee, J.T.: Analysis of natural resting aspects of parts in a vibratorybowl feeder – validation of “drop test”. Int. J. Adv.Manufact. Technol. 13(4), 300–310 (1997).https://doi.org/10.1007/BF01179612
10. Busch, J., Blankemeyer, S., Raatz, A., Nyhuis, P.: Implementation and testing of a geneticalgorithm for a self-learning and automated parameterisation of an aerodynamic feedingsystem. Procedia CIRP 44, 79–84 (2016). https://doi.org/10.1016/j.procir.2016.02.081
11. Busch, J., Knüppel, K.: Development of a self-learning, automatic parameterisation of anaerodynamic part feeding system. AMR 769, 34–41 (2013). https://doi.org/10.4028/www.scientific.net/AMR.769.34
12. Fleischer, J., Herder, S., Leberle, U.: Automated supply of micro parts based on the microslide conveying principle. CIRP Ann. 60(1), 13–16 (2011). https://doi.org/10.1016/j.cirp.2011.03.004
13. Frädrich, T., Pachow Frauenhofer, J., Torsten, F., Nyhuis, P.: Aerodynamic feeding systems.An example for changeable technology. Assembly Autom. 31(1), 47–52 (2011). https://doi.org/10.1108/01445151111104164
14. Lorenz, B.-M.: Aerodynamische Zuführtechnik. In: Fortschritt-Berichte VDI; Reihe 2,Fertigungstechnik, vol. 524. VDI-Verlag, Düsseldorf (1999)
15. Rybarczyk, A.: Auslegung aerodynamischer Zuführverfahren. In: Berichte aus dem IFA 1,pp. 1–124. Produktionstechnisches Zentrum Hannover, Garbsen (2004)
16. Busch, J.: Entwicklung einer intelligenten aerodynamischen Zuführanlage für die Hochleis-tungsmontage. In: Berichte aus dem IFA 7/2016. PZH Verlag, Garbsen (2016)
17. Chattot, J.J., Hafez, M.M.: Theoretical and Applied Aerodynamics. Springer, Dodrecht(2015). https://doi.org/10.1007/978-94-017-9825-9

Investigation on the Convergence of the Genetic Algorithm 77
Open Access This chapter is licensed under the terms of the Creative Commons Attribution 4.0International License (http://creativecommons.org/licenses/by/4.0/), which permits use, sharing,adaptation, distribution and reproduction in anymedium or format, as long as you give appropriatecredit to the original author(s) and the source, provide a link to the Creative Commons license andindicate if changes were made.
The images or other third party material in this chapter are included in the chapter’s CreativeCommons license, unless indicated otherwise in a credit line to the material. If material is notincluded in the chapter’s Creative Commons license and your intended use is not permitted bystatutory regulation or exceeds the permitted use, you will need to obtain permission directly fromthe copyright holder.

Assembly Operations

Indirect System Condition Monitoring UsingOnline Bayesian Changepoint Detection
Emil Tochev(B) , Harald Pfifer , and Svetan Ratchev
University of Nottingham, Nottingham, [email protected]
Abstract. This paper presents amethod for online vibration analysis and a simpletest bench analogue for the solder pumping system in an industrial wave-solderingmachine at a Siemens factory. A common machine fault is caused by solder build-up within the pipes of the machine. This leads to a pressure drop in the system,which is replicated in the test bench by restricting the flow of water using agate valve. The pump’s vibrational response is recorded using an accelerometer.The captured data is passed through an online Bayesian Changepoint Detectionalgorithm, adapted from existing literature, to detect the point at which the changein flow rate affects the pump, and thus the PCB assembly capability of themachine.This information can be used to trigger machine maintenance operations, or toisolate the vibrational response indicative of the machine fault.
Keywords: Predictive maintenance · Bayesian changepoint detection ·Industrial application
1 Introduction
This paper is a follow up to an offline fault detection algorithm applied to the presentedmachine use case [1]. It describes an online, non-disruptive technique to detect amachinefault in a wave-soldering machine in Printed Circuit Board (PCB) manufacturing. Thismachine works by maintaining a constant flow of solder in the form of a set waveheight, over which PCBs are passed in order to connect large numbers of through-holecomponents efficiently. The fault in question is solder build-up in the machine pipes,which was considered the most common recurring machine fault in the wave-solderingprocess by Siemens Congleton. As time passes there is a buildup of solder dross in thepipes, which leads to a pressure drop and reduced solder flow rate. Due to the resultantreduced solder wave height, PCBs passing over the wave are left unsoldered, needingrepairs and touch ups. The response to these is manual adjustment of the wave heightby increasing the pump power. This can be performed a set number of times before fullmachine maintenance is performed. This process is reactive and repeated on a weekly tomonthly basis depending on the solder quality and machine uptime. The project brief setby Siemens requires a non-disruptive and low-cost solution to monitor the machine. Thegoal is to improve the fault detection rate and reduce the number of unsoldered products.
© The Author(s) 2021S. Ratchev (Ed.): IPAS 2020, IFIP AICT 620, pp. 81–92, 2021.https://doi.org/10.1007/978-3-030-72632-4_6

82 E. Tochev et al.
Awareness of a machine’s state at any given time is valuable for making predictivemaintenance decisions. Costly maintenance and machine downtime can be minimizedeffectively by implementing early and accurate fault detection [2]. This is particularlyvaluable during the current push towards Industry 4.0 (I4.0) [3] and is enabled by theincreased prevalence of Industrial Internet of Things (IIoTs) allowing for a greater abilityof factories to gather and process machine data [4]. However, the financial and timecosts of directly replacing and upgrading machines can dissuade a lot of companiesfrom investing in these technologies. As such, a “wrap and re-use” approach is generallytaken instead [5]. This concept of minimal disruption to existing machine setups andproduction lines, alongside the extraction of new data, without machine downtime is akey motivator for this paper and the proposed methodology.
Due to its age and the hostile internal environment, the wave-soldering machine usecase presented in this paper is significantly limited in the usable data that can be collectedfrom it. As such, pump vibrations are used for the vibration analysis in this paper asaccess to other components is effectively impossible. Pump vibration monitoring isnot unique, and many examples can be found in literature [6, 7]. Techniques includecomparing recorded pump vibrations against a model of the expected vibrations [8] andusing pump vibrations to predict cavitation by training an Artificial Neural Network(ANN) [9]. Similarly, time-frequency analysis of vibrations have been used to diagnosewear in pump valve plates [10]. These analyses can notifying operators when pumpmaintenance needs to take place.in a timely manner, and are particularly effective atdetecting issues such as cavitation, resonance and misaligned or warped components.
However, pump vibration analysis is not (to the author’s knowledge) used to monitorgeneral system health and predict faults that occur outside of the pump itself. This islargely assessed using pipe vibrations [11, 12], which can provide insights into generalsystem performance, or be used to locate discrete blockages downstream of pumps [13].In the motivating scenario, access to the pipes is unavailable, and solder build-up doesnot form a localized blockage. Any solution needs to have low complexity so that itcan be implemented on a low-cost microcontroller. Additionally, there is no pre-existingvibration data with which to establish baseline readings.
This paper uses online sequential Bayesian Changepoint Detection (BCD) based onan existing algorithm [14] and assesses its suitability on a test bench. The use case faultcan be presented as an unsupervised segmentation problem as the machine transitionsfrom a functional to a non-functional state. BCD is particularly suitable for this type ofproblem [15]. It provides a measurement of the probability that, based on the collectedinformation, a change in behaviour has occurred at a certain point [16, 17]. This can thendirectly notify machine operators of the change in machine state, or be used to isolate thevibrational response of the pump at the point where the solder build-up is affecting theflow rate. In rare cases where the deterioration of the pipe state is instantaneous ratherthan gradual (such as in the case of seal failure), the change in vibrational responsewill still be able to inform machine operators of the need for maintenance. Successfulapplications in literature include the assessment of climate records to locate changepointsin climate regimes [17], detecting faults and failures in valves in an Unmanned AerialVehicle (UAV) fuel system [18], and detecting changes in the behaviour of a user of a text-messaging service [16].Online applications ofBCDare used to process live data [19] and

Indirect System Condition Monitoring Using Online BCD 83
Solder Pump Vibrations
Bayesian Change point
Detection
Fault Detection
ComponentsWave Soldering Machine
Solder
Soldered PCBs
Instructions Machine datalogger
Standard machine processes
Non-disruptive data extraction and processing
Fig. 1. Wave SolderingMachine process diagram. Dotted arrows represent the movement of data.Solid arrows represent themovement of physical parts. The green box represents the non-disruptivepaper contribution. (Color figure online)
predict the likelihood of newly recorded data being part of a “current run” between twochangepoints. BCD has also been used for online signal segmentation of epileptic brainactivity [20] as well as activity recognition in a home [21]. The variety of applicationsdemonstrates the flexibility of BCD. Alongside the number of changepoints, BCD canalso provide an indication of the size of the changes [17], which can highlight significantevents. The computational cost of this approach increases as the number of time stepsincrease, although this can be managed by implementing a maximum length of timefor assessment, and storing and reusing previous calculations [14]. Another drawbackof this approach is a sensitivity to the prior distribution assigned to the changepointspresent in the system.
2 Methodology
The research methodology as illustrated in Fig. 1 aims to use data analytics for improvedprocess control inwave soldering. The data analytics approach is based on non-disruptivedata extraction and processing using online sequential Bayesian Changepoint Detection.A test bench setup has been developed to replicate the wave-soldering machine behavioras the industrial machine and environment is not suitable for development. To keep itmanageable in a laboratory environment, water is used instead of solder. The differencebetween the vibrational characteristics of water and solder should not affect the results ofthe BCD so long as the deterioration of the pipe leads to a change in measured vibrationsthat the BCD can detect. The experimental set-up and data collection are discussed inSects. 2.1 and 2.2. As this is virtually identical setup to the setup presented in [1], these

84 E. Tochev et al.
sections will largely remain as presented in that earlier work. The BCD formulation isdiscussed in Sect. 2.3.
2.1 Test Bench Setup
The test bench presented in this paper considers the behaviour of a pump moving waterthrough a closed system. The flow rate is controlled by a gate valve, which is closedin discrete increments and goes from completely open to completely closed. It mimicsthe effects of solder dross build up in a wave soldering machine, which takes place overseveral weeks. As such, the steady state behaviour of the pump is themost relevant to thisinvestigation. The schematic for this can be seen in Fig. 2, with a photo of the realisedtest bench in Fig. 3.
Accelerometer
Pump
Valve
Water Tank
Flowmeter
Processor
Fig. 2. Test bench schematic
Fig. 3. Test bench photo.Yellow: gate valve; blue: pump and accelerometer; red: flowmeter (Colorfigure online)
As the valve is closed, the change in the fluid’s flow rate is monitored using the flowrate sensor YF-S201, connected to an Arduino. The vibration of the pump is recorded,

Indirect System Condition Monitoring Using Online BCD 85
using an accelerometer (LSM9DS1), at each increment to build up its response profile.This data is then processed at a Raspberry Pi 3B, and the results can be displayed in realtime or uploaded to online networks, including any available IIoTs.
2.2 Data Collection from the Test Bench
The change in flowrate as the valve is closed is shown in Fig. 4. There is a small dropin the flow rate until the valve is approximately 70% before a transition period, and analmost linear drop to no flow from approximately 80% closed onwards. The minimalinitial change is a result of the lowflow rates used in this experiment. Pump vibrations arerecorded with a sampling rate of 350 Hz. Each collected sample is 10,000 data points insize. The accelerometer has a range of±2 g, a sensitivity of 0.061 mg/LSB, and collectssamples in the X, Y and Z axis. This is then converted into the absolute acceleration.
Fig. 4. Flow rate vs. valve closure
A fast Fourier transform (FFT) algorithm is used to extract the frequency and ampli-tude data from the vibrations [6]. Figures 5 and 6 show the results of the FFT on thevibration data recorded from an open and shut valve respectively. The difference betweenthe two is clearly visible, as the peak frequency shifts to the left. Additionally, it is clearthat a lot of noise is present in the system – as would be present in an industrial setting.The solder in the use case might result in different vibrational characteristics. Despitethis, the solder blockage should still result in a change in the recorded vibrations overtime, which can be detected by the BCD algorithm. This is a significant benefit of theproposed methodology: as long as the input changes in a way that can be detected, theBCD algorithm will be able to assess the probability that a changepoint has occurred ata given point in time. This reduces the need for calibration procedures, which can beexpensive and time consuming.

86 E. Tochev et al.
Fig. 5. FFT of pump vibrations while valve is open
Fig. 6. FFT of pump vibrations while valve is closed
2.3 Online Bayesian Changepoint Detection
Figure 7 presents some of the pump data gathered by the accelerometer. Analysis of thetime-domain vibration data has shown that it is not suitable for the analysis – it doesnot vary significantly enough across the different valve states to be a useful feature forpredicting the current state. The mean of the amplitude of the time-domain data is shownto remain roughly constant throughout. However, the plotted features extracted from theFFT (peak frequency and maximum amplitude) can be seen to respond to the change invalve state. As such, these are the features used in the BCD algorithm presented.
The algorithm is based on a simplified version of the sequential BCD algorithmdescribed in [14], modified to detect a single changepoint in the datasets used. Thesimplified equations are presented below, and [14] should be referenced for additionaldetail and an extended version of this algorithm. As the algorithm processes the peak

Indirect System Condition Monitoring Using Online BCD 87
Fig. 7. Data extraction from recorded pump vibrations
frequencies and maximum amplitudes in the same way, the following example will bepresented for only the amplitude. An initial assumption is made about the data model: inthis case, a linear regressionmodel is used to predict the distribution of the data. Notably,other models can be used, depending on experience with the data.
A =∑m
l=1βlVl + ε (1)
Equation (1) presents the linear regressionmodel used to represent the data gathered,where A is the amplitude of the pump vibrations and Vl is the level of valve closure. β l
is the lth regression coefficient and ε is the random error term. The assumptions madeabout β and ε are the same as in [14], with the same conjugate priors assigned here forboth.
f(Ai:j
) = f(Ai:j|V
)(2)
Assuming that this regression model applies to the data between the start of thedataset up until the changepoint, and from the changepoint to the end of the dataset, foreach possible subset of the data i:j, the probability of the data given the regression modelis calculated using Eq. (2) and stored.
P1(A1:j
) =∑j−1
v=1f (A1:v)f (Av+1:j) (3)
In Eq. (3), the probability density of the first j data points containing the changepointis calculated and stored. Starting at the beginning of the time series, two non-overlappingsubsets of data (assumed to be independent as per [22]) are pieced together. By mul-tiplying together the probabilities of the two subsets (calculated in (2)) and summingover all of the placements of the changepoint, the probability density of the data can becalculated.

88 E. Tochev et al.
The final quantity that needs to be specified is the prior distribution of the locationof the changepoint. By using an uninformative prior distribution which assumes thatthe location of the changepoint is equally likely at any datapoint, bias in the algorithmcan be avoided. From here, sampling from within the distributions defined above can beperformed to ascertain the location of the changepoint and the regression parameters forthe subsets of data either side of it.
This is extended in [14] to search for additional changepoints up to a defined max-imum number of changepoints kmax . This is outside of the scope of this paper, but isachieved by extending Eq. (3) such that the term f(A1:v) contains k-1 changepoints whencalculating the probability of the location of the kth changepoint. The prior distributionfor the number of changepoints is specified, and sampling for changepoints between 0and kmax takes places before sampling for the locations of the change ponts. Additionaltuning can be done based on the values of the linear regression model used, as describedin [14, 17]. A minimum distance between changepoints can also be specified.
The described algorithm will locate a changepoint in a single set of data of a setlength. To expand it efficiently to process incoming data points, the matrices storing theresults of Eqs. (2) and (3) are expanded. New rows and columns are added to hold thenew probabilities calculated for each newly generated subset of data (by Eq. (2)). A newcolumn is added for the new probability density P1(A1:N ) where N is the most recentlyadded datapoint. The full implementation details can be found in [14].
3 Results and Discussion
Figure 4 shows that the flow rate reduction as a result of the valve closure is minimaluntil the valve is approximately 70% shut. A short transition period can then be seenuntil the valve is about 80% shut. The flow rate reduction from that point on is nearlylinear until it reaches 0 l/s. During the experiment, a total of 260 pump vibration sampleswere collected as the valve went from completely open to completely closed.
Figure 8 plots the extracted amplitudes at against the resultant posterior probability ofthe changepoint’s location as calculated by the algorithm. It suggests that a changepointhas taken place as the valve is 70% closed and shows a high certainty over a small area.This corresponds with the start of the transitional flow rate period in Fig. 4. A plot ofthe linear model inferred by the algorithm can also be seen in green in Fig. 8. It followsthe collected data quite closely up until the last few readings. Had there been additionalsamples collected afterwards, the algorithm would have adjusted the inferred model tobetter match the data.
Performing the same analysis on the peak frequencies gives the results plotted inFig. 9. In this case, the changepoint is detected later, when the valve is approximated80% closed, and the posterior probability is lower and spread over a larger area. Itcorresponds more closely with the end of the transitional period of flow rate noted inFig. 4. The inferred model follows the extracted frequencies very closely.
Plotting the posterior probabilities of the changepoint as calculated from the ampli-tude and frequencies extracted from the pump vibrations against the flow rate producedby the pump as the valve is closed produces Fig. 10. By applying this algorithm to the twodifferent sources of data extracted from the pump vibrations, it has been demonstrated

Indirect System Condition Monitoring Using Online BCD 89
Fig. 8. Predicted changepoint based on extracted amplitudes. The inferred linear model isrepresented in green. (Color figure online)
Fig. 9. Predicted changepoint based on extracted frequencies. The inferred linear model isrepresented in green. (Color figure online)
that the state of this system can be assessed by the vibrational response of the pump.Using the amplitude leads to an earlier detection of a changepoint, which is valuable inprocesses sensitive to changes in the monitored parameters. The frequency leads to alater detection of the changepoint, more valuable in processes that do not require imme-diate maintenance or are less sensitive to changes. The wave soldering machine use casepresented in this paper falls into the former category and benefits from early detection

90 E. Tochev et al.
of a change in flow rate so that maintenance can be performed before faulty productsare released.
Flow RateChange Point – AmplitudeChange Point – Frequency
1
0.8
0.6
0.4
0.2
0
Fig. 10. Predicted changepoints plotted against the flow rate
4 Conclusions
Presented in this paper is an online BCD algorithm adapted from existing literature andapplied to an industrial use case. A test bench analogue is used to simulate pipe blockagedue to solder build-up in awave-solderingmachine. The pipe state is indirectlymonitoredusing a cheap, non-disruptive device that collects vibration data from the pump feedingthe system. The collected data has two features extracted from it, the maximum pumpvibrational amplitude and peak frequency as the valve is closed. The BCD algorithmthen generates the likelihood of a changepoint having occurred in the flow rate as a resultof the pipe blockage. This information is processed online and can be used to identify thecurrent machine state (differentiating between a faulty and non-faulty state) and informsmachine operators of the need for maintenance.
This work will be expanded upon in the future with data collected directly from thewave-soldering machine, to assess the suitability of the algorithm and non-disruptivemethodology in an industrial environment, as well as the accuracy of the test benchanalogue. Additional tests with an accelerometer capable of a faster sampling rate couldalso be valuable, to ensure that information isn’t being lost at higher frequencies thecurrent hardware cannot detect. Integration with local IIoT and cloud platforms is alsokey to ensuring the data is accessible and useful.
Acknowledgements. The authors would like to thank Siemens Congleton, especially Mr CarlGerman, for their helpful advice. This work is supported by the ESPRC iCASE entitled “Factoryof the Future – Flexible, adaptable and self-optimised manufacturing systems”.

Indirect System Condition Monitoring Using Online BCD 91
References
1. Tochev, E., Rengasamy, D., Pfifer, H., Ratchev, S.: System condition monitoring throughBayesian changepoint detection using pump vibrations. In: IEEE International Conferenceon Automation Science and Engineering, vol. 2020, pp. 667–672 (2020)
2. Chiang, L.H.,Russell, E.L., Braatz,R.D.: FaultDetection andDiagnosis in Industrial Systems,1st edn. Springer, London (2001). https://doi.org/10.1007/978-1-4471-0347-9
3. Wahlster, W., et al.: Recommendations for implementing the strategic initiative INDUSTRIE4.0 (2013)
4. Manyika, J., et al.: The Internet of Things: mapping the value beyond the hype. McKinseyGlobal Institute, p. 144 (2015)
5. Conway, J.: The Industrial Internet of Things: An Evolution to a Smart ManufacturingEnterprise. White Paper. Schneider Electric (2016)
6. Scheffer,C.: Pumpconditionmonitoring throughvibration analysis. In: PUMPSMaintenance,Design and Reliability Conference 2008 – IDC Technology, pp. 1–20 (2008)
7. Birajdar, R., Patil, R., Khanzode, K.: Vibration and noise in centrifugal pump - sourcesand diagnosis methods. In: Proceedings of the 3rd International Conference on Integrity,Reliability and Failure, pp. 20–24 (2009)
8. Rivera, D.L., Scholz, M.R., Fritscher, M., Krauss, M., Schilling, K.: Towards a predictivemaintenance system of a hydraulic pump. In: Proceedings of the 16th IFAC Symposium onInformation Control in Manufacturing (2018)
9. Siano, D., Panza, M.A.: Diagnostic method by using vibration analysis for pump faultdetection. Energy Procedia 148, 10–17 (2018)
10. Stojek, J.: Application of time-frequency analysis for diagnostics of valve plate wear inaxial-piston pump. Arch. Mech. Eng. 57(3), 309–322 (2010)
11. Kim, Y.I., Simpson, A.R., Lambert, M.F.: Behavior of orifices and blockages in unsteady pipeflows. In: 9th Annual Symposium onWater Distribution Systems Analysis, pp. 15–19 (2007)
12. Collet, Å.S.A., Källman, M.: Pipe Vibrations Measurement. Energiforsk (2017)13. Lile, N.L.T., Jaafar, M.H.M., Roslan, M.R., Azmi, M.S.M.: Blockage detection in circular
pipe using vibration analysis. Int. J. Adv. Sci. Eng. Inf. Technol. 2(3), 252 (2016)14. Ruggieri, E., Antonellis,M.: An exact approach toBayesian sequential changepoint detection.
Comput. Stat. Data Anal. 97, 71–86 (2016)15. Mohammad-Djafari, A., Féron, O.: A Bayesian approach to changepoints detection in time
series. Int. J. Imaging Syst. Technol. 16(5), 215–221 (2006)16. Davidson-Pilon, C.: BayesianMethods for Hackers: Probabilistic Programming andBayesian
Inference (Addison-Wesley Data and Analytics), 1st edn. Addison-Wesley Professional(2015)
17. Ruggieri, E.: A Bayesian approach to detecting changepoints in climatic records. Int. J.Climatol. 33(2), 520–528 (2013)
18. Niculita, O., Skaf, Z., Jennions, I.K.: The application of Bayesian changepoint detection inUAV fuel systems. Procedia CIRP 22(1), 115–121 (2014)
19. Adams, R.P., MacKay, D.J.C.: Bayesian online changepoint detection. Technical report,University of Cambridge (2007)
20. Malladi, R., Kalamangalam, G.P., Aazhang, B.: Online Bayesian changepoint detection algo-rithms for segmentation of epileptic activity. In: Asilomar Conference on Signals, Systemsand Computers, pp. 1833–1837 (2013)

92 E. Tochev et al.
21. Aminikhanghahi, S., Cook, D.J.: Using changepoint detection to automate daily activ-ity segmentation. In: 2017 IEEE International Conference on Pervasive Computing andCommunications Work in Progress, PerCom WiP 2017, pp. 262–267 (2017)
22. Barry, D., Hartigan, J.A.: A Bayesian analysis for changepoint problems. J. Am. Stat. Assoc.88(421), 309 (1993)
Open Access This chapter is licensed under the terms of the Creative Commons Attribution 4.0International License (http://creativecommons.org/licenses/by/4.0/), which permits use, sharing,adaptation, distribution and reproduction in anymedium or format, as long as you give appropriatecredit to the original author(s) and the source, provide a link to the Creative Commons license andindicate if changes were made.
The images or other third party material in this chapter are included in the chapter’s CreativeCommons license, unless indicated otherwise in a credit line to the material. If material is notincluded in the chapter’s Creative Commons license and your intended use is not permitted bystatutory regulation or exceeds the permitted use, you will need to obtain permission directly fromthe copyright holder.

Strategies for Dealing with Problemsin Robotised Unscrewing Operations
Jun Huang(B) , Duc Truong Pham , Ruiya Li , Kaiwen Jiang , Dalong Lyu,and Chunqian Ji
Department of Mechanical Engineering, School of Engineering, University of Birmingham,Birmingham B15 2TT, UK
{j.huang.1,d.t.pham,C.Ji}@bham.ac.uk, {rxl721,xj797,
dxl887}@student.bham.ac.uk
Abstract. Disassembly is the first step in a remanufacturing process chain withunscrewing being usually the most frequent task. In previously reported researchin the authors’ laboratory, a new method has been developed for using robots tounfasten screws. Uncertainties and variability in the physical condition of screwsinduced by dirt, rust, or mechanical damage pose difficulties for such robotisedunscrewing systems. There are three common failure modes: screwdriver missingscrew head, screwdriver slipping on screw head and screw too tight to remove.This paper presents strategies to handle these failuremodes, making the developedrobotised method more robust and reliable. The strategies include conducting asecond search and second unfastening trial as well as involving collaboration witha human operator. Tests were carried out to validate the proposed strategies. Theresults show that the strategies could deal with the failure modes, enabling 100%successful operation.
Keywords: Remanufacturing · Robotic disassembly · Automated unscrewing
1 Introduction
Remanufacturing is an increasingly significant part of a circular economy, deliveringeconomic, environmental and social benefits [1, 2]. In remanufacturing, disassembly ofend-of-life (EoL) products is a critical first step [3]. Disassembly is labour intensive andskill intensive and disassembly costs usually represent a substantial proportion of thecost of the remanufactured product. Robotic technology has been proposed for disas-sembly [4, 5], with a range of approaches having been explored for robotic disassemblyapplications [6–8]. For example, robot-assisted disassembly was used for dismantlingelectronic products as early as 1994 [9]. Robots have many advantages including highaccuracy, speed and repeatability and the ability to handle repetitive and tedious dis-assembly operations such as unscrewing [10]. Screws are very common mechanicalfasteners as they can be dismantled non-destructively for future maintenance, repair,remanufacturing and recycling [11]. However, unscrewing is difficult to be automated.This is due to uncertainties and variability in the location and the physical condition of
© The Author(s) 2021S. Ratchev (Ed.): IPAS 2020, IFIP AICT 620, pp. 93–107, 2021.https://doi.org/10.1007/978-3-030-72632-4_7

94 J. Huang et al.
screws in EoL products caused by corrosion, contaminants (grease and dirt), deformationand other forms of mechanical damage [12].
A robotic systemwas prototyped for automated screw removal frome-waste productssuch as laptops [13]. Computer vision and force sensing were employed to locate screwsautomatically. An accelerometer mounted on a screwdriver was used to detect when ascrew had been completely detached from a mating threaded hole. A screw removalsuccess rate of 96.5% was achieved, which was affected by the lighting conditionsof the computer vision system. A robotic workstation fitted with Kinect cameras wasdeveloped for autonomous disassembly of electric vehicle motors [14]. A detectionalgorithm was proposed to locate the position and determine the type of the screws tobe removed by the robot. A hybrid workstation with a collaborative robot was presentedfor performing unscrewing in EoL electric vehicles (EV) batteries which containedsubstances hazardous to human health [15, 16]. A bit holder was designed to allowthe robot to change different socket wrench bits. An electric screwdriver and a camera-based location detection systemwere also proposed for automatic unscrewing tasks [17].A spiral search strategy was designed for a robot to locate and engage a screw head,ensuring that no position was scanned twice [18]. In addition, a robotised screwing andunscrewing technique was developed for dismantling electronic devices [19]. A robotwas released by Apple in 2016 for removing screws on EoL iPhones to disassemblethem for remanufacturing and recycling to reduce e-waste [20].
The above research has mainly focused on methods and devices for automatedunscrewing. Few studies have considered the uncertain physical conditions of screws inEoL products. Four common conditions have been identified in automated unscrewingoperations [21]. They include three failure modes: (1) screwdriver missing screw head,(2) screwdriver slipping on screw head and (3) screw too tight to remove. In previouslyreported research in the authors’ laboratory, a newmethodwas developed for using a col-laborative robot to unfasten screws [22]. This paper presents strategies for handling theabove failure modes in robotised unscrewing operations, making the developed methodmore robust and reliable.
The remainder of this paper is organised as follows. Section 2 briefly introducesa human-robot collaborative disassembly cell built in the authors’ laboratory and theautomated unscrewingmethod implemented in that cell. Section 3 describes the proposedfailure handling strategies. Section 4 reports on tests carried out to validate the proposedstrategies. Section 5 concludes the paper and provides suggestions for future work.
2 Automated Unscrewing Method
2.1 A Human-Robot Collaborative Disassembly Cell
Figure 1 shows a human-robot collaborative disassembly cell for unfastening screws builtin the authors’ laboratory. The cell mainly composes a collaborative robot (KUKA LBRiiwa 14 R800), an electrical nutrunner (torque spindle, Georges Renault SASMC51-10)and a geared offset attachment (LUBBERING basic line 4-22-15). The nutrunner wasinstalled on the flange of robot. A spindle controller (Georges Renault SAS, 8216-CVICH-4) was used to control and programme the nutrunner. The geared offset attachment

Strategies for Dealing with Problems 95
mounted on the nutrunner could unfasten Hexagonal head bolts with flanges, as shownin Fig. 1. When connected, the robot could trigger and stop the nutrunner.
KUKA iiwa robot
Nutrunner (spindle)
Geared offset attachment
Hexagonal head bolts
Fig. 1. A robotic cell for automated unscrewing.
The robot has active compliance control using a Cartesian impedance controller.This facilitates human-robot collaboration for complex disassembly operations in thecell. A human operator can work alongside the robot directly without safety guarding,providing the cell with higher flexibility and adaptability and thus a better ability tohandle disassembly uncertainties.
2.2 Automated Unscrewing Process
Figure 2 shows the developed automated unscrewing process,which involves four stages:approach, search and engage, unfasten, and assess and leave. The control strategies oftorque, position and active compliance are adopted during the process. The correspond-ing control method of each stage is briefly introduced below. More details about theautomated unscrewing method could be found in [22].
1) Approach. The robot with a nutrunner moves to an estimated position above screwhead. The nutrunner rotates in the fastening direction at a low speed to ensure thatany loose screw will be tightened up before unfastening, making the followingstage easier to control. Then, the robot turns on its compliant mode. The compliantbehaviour of the robot is achieved by impedance control, which is modelled on avirtual spring-damper system with configurable stiffness and damping [23]. Thanksto compliance, the robot can avoid hard collisions with humans operating in itsworkspace.
2) Search and engage. Due to factors such as the uncertain mechanical condition ofscrews and the limited accuracy of robot motion, there is a position error between

96 J. Huang et al.
Fig. 2. Automated unscrewing process.
the hexagonal hole in the geared offset attachment and the hexagonal screw head.A spiral motion is designed for the robot to search for and engage the screw head.The equations of the spiral path employed are [22]:
⎧⎪⎪⎨
⎪⎪⎩
x = fsπ
√2πns5 t cos
(√2πns5 t
)
y = fsπ
√2πns5 t sin
(√2πns5 t
) (1)
where x and y are the coordinates along the X and Y axes, respectively. f s is the sizeof the hexagonal screw head chamfer. ns is the rotating speed of the tool and t issearch time.
3) Unfasten. Once the tool and screw head have engaged, the robot stops its searchmotion and the nutrunner rotates in the unfastening direction. Under the compliantmode, the robot can follow the movement of the screw during run-out.
4) Assess and leave. When the screw has been separated from the screw hole, the screwoscillates slightly along its axis due to the chamfer at the end of the screw threadsand continuous rotation of the tool. The position information of the robot along the

Strategies for Dealing with Problems 97
direction of the screw axis is employed to determine when the screw is completelyout. Finally, the separated screw is moved away.
3 Mitigating Strategies for Failure Modes
3.1 Strategies for Dealing with Failure Modes
Three common failure modes are identified in automated unscrewing operations, whichare: (1) screwdriver missing screw head, (2) screwdriver slipping on screw head and(3) screw too tight to remove [21]. Figure 3 illustrates the flow chat of the proposedstrategies to deal with these problems.
Start
End
Approach
Search
Unfasten
Assess and leave
Second search
Engage Robot leaves and calls the operator
Robot leaves and calls the operator
Robot leaves and calls the operator
Second trial
End
1. Screwdriver missing screw headFailure
Success
3. Screw too tight to remove
Failure
2. Screwdriver slipping on screw head
Success
First Search spiral path
Second Search spiral path
Fig. 3. The flow chart of the proposed strategies.
If the position error were without the spiral search range, the tool would miss thescrew head in its search motion (failure mode 1). Conducting a second spiral searchalong a path with a larger range and higher density is proposed as a strategy to handlethis problem, as shown in Fig. 3. If the second search succeeds, subsequent unscrewingsteps will proceed. Otherwise, human-robot collaboration will be implemented to copewith this screw in the human-robot collaborative disassembly cell. The robot will leaveits search position and call a human operator to come to dismantle the screw.
Due to rust, corrosion or mechanical damage to a screw, the tool may slip on thescrew head (failure mode 2). It is difficult for the robot to disassemble screws in such asituation. Once the situation is detected by the robot, the operator will again be called tohandle it. If a screw is too tightly fixed, the tool is unable to disassemble it because the

98 J. Huang et al.
required loosening torque exceeds the maximum capability of the tool (failure mode 3).Although the screw has not been successfully removed in the unfastening operation, theimpact force exerted by the tool might have loosened it. A second unfastening attemptis made to apply another impact force to try and release the screw. If this fails again, therobot will leave the current position and call the operator.
3.2 Detection Methods for Failure Modes
Before adopting the above strategies, it is critical for the robot to detect these failuremodes during automated unscrewing. Information regarding the position and torque ofthe robot is employed for this detection. Figure 4 shows how information on the positionof the robot tool is used to determine a search failure. Once the tool fits in the screwhead, its position along the Z axis will increase from Pz0 to Pz1. The following equationis used to determine if engagement has occurred:
Pz1 − Pz0 > �P (2)
Fig. 4. Detection of failure mode 1.
where Pz0 and Pz1 are the initial and end positions of the tool during search along theZ axis, respectively. �P is a set threshold value for position change and is related to thesize of the screw head. In the second search motion, the same way could be employedto determine whether the tool fits in the screw head or not, as shown in Fig. 4.

Strategies for Dealing with Problems 99
Robot’s torque information is employed to detect failure modes 2 and 3, as shownin Fig. 5. A target torque value (Tt0) is set to stop the search, once the tool engages thescrew head during a searching process. As shown in Eq. (3), the applied torque on thetool (Te) will increase once the tool engages the screw head due to its slow rotation infastening direction. However, if the tool slips on screw head, torque on the tool couldnot increase to the target value.
Fig. 5. Detections of failure modes 2 and 3.
Te > Tt0 (3)
If the screw is too tight to be removed, the applied torque on robot tool (Tu) willincrease and exceed the maximum safe torque value (Tt1), as expressed in Eq. (4).Therefore, the torque on robot tool during unfastening process could be used to detectthe failure mode 3.
Tu > Tt1 (4)
4 Experimental Tests and Results
The robot cell in Fig. 1 was implemented for experimental tests to validate the abovestrategies. Hexagon headed screws (M6× 16 mm) with flange were installed on a metalplate. Table 1 lists the set speed and torque values of the nutrunner in stages 2 and 3. Aflashing LED strobe light connected to robot controller was adopted to inform a humanoperator to handle the screws when the robot was unable to do that.

100 J. Huang et al.
Table 1. Parameters of the nutrunner.
Search and engage Unfasten
Rotating speed of the tool 25 r/min Rotating speed of the tool 100 r/min
Target fastening torque 14 Nm Maximum unfastening torque 25 Nm
4.1 Tests and Results for Dealing with Failure Mode 1
The proposed strategy of second search worked and successfully engaged the screwhead after the first search failed. Figure 6 presents selected image frames captured fromthe testing process. Figure 6(a) shows the robot with the nutrunner approaching anestimated position of the screw head. The failure of the first search can be seen inFig. 6(b). Figure 6(c) shows that the tool capturing and engaging the screw head withinthe second spiral search. The unfastening of the screw is shown in Fig. 6(d). Once theunfastening stage finished, the screw was taken away by the robot, as shown in Fig. 6(e).
(a) (b) (c) (d) (e)
Bolt BoltTool
Fig. 6. Strategy of conducting a second search: (a) approach, (b) the first search fails, (c) thesecond search succeeds, (d) unfasten, and (e) assess and leave.
Figure 7 shows the torque and position information measured by the robot duringthe unscrewing process. Four stages are illustrated clearly. The torque value of−2.5 Nmwas set as a threshold value to stop the search once the tool engaged the screw head.Position information was used to determine whether the first search was successful andwhen the screw was completely out during unfastening.

Strategies for Dealing with Problems 101
0 2 4 6 8 10 12 14-5
-4
-3
-2
-1
0
1
2
3
- 2.5 Nm
2nd search succeeds1st search fails
Search and engage
Time (s)
Torq
ue in
Z-d
irec
tion
(Nm
)
Approach Unfasten
Assess and leave
260
265
270
275
280
Pos
ition
in Z
-dir
ectio
n (m
m)
Fig. 7. Torque and position information recorded by the robot.
The strategy for dealing with the failure of both searches was tested. Figure 8 illus-trates the selected image frames captured from the unscrewing process. After the toolapproached the screw head (Fig. 8(a)), both the first and second searches failed, as shownin Fig. 8(b) and (c), respectively. Then, the robot left its current position and turned on thestrobe light to inform an operator (Fig. 8(d)). Figure 8(e) shows the operator unfasteningthe screw with a spanner. Figure 9 shows the measured torque and position informationby the robot during the unscrewing process. The maximum torque of the robot did notreach the threshold value of −2.5 or 2.5 Nm, which was used to stop the search oncethe tool engaged with the screw head.
(a) (b) (c) (d) (e)
Bolt Tool
Spanner
Fig. 8. Strategy for dealing with the failure of both searches, (a) approach, (b) the first searchfails, (c) the second search fails, (d) leave and inform an operator, and (e) handle the screw by theoperator.

102 J. Huang et al.
0 4 8 12 16 20 24
0.81
0.84
0.87
0.90
Time (s)
Torq
ue in
Z-d
irec
tion
(Nm
)
255
260
265
270
275
280
285
2nd search fails
1st search fails
Pos
ition
in Z
-dir
ectio
n (m
m)
Leave and inform an operator
ApproachSearch
Fig. 9. Torque and position information recorded by the robot.
4.2 Tests and Results for Dealing with Failure Mode 2
Figure 10 shows selected image frames captured from the testing of the strategy pro-posed for handling the failure mode associated with the tool slipping on the screw head.Figure 10(c) shows the tool slipped on the head of screw after the nutrunner approachedthe screw (Fig. 10(a)) and fitted in the screw head (Fig. 10(b)). Once slipping wasdetected, the robot left its current position and called the operator using the strobe light(Fig. 10(d)) to handle the screw with a special tool (Fig. 10(e)). Figure 11 depicts therecorded position and torque information by the robot. During slipping, the tool stayednearly in a fixed position with small fluctuations.
(a) (b) (c) (d) (e)
Bolt
Tool
Special tool
Fig. 10. Strategy for dealing with slipping, (a) approach, (b) search and fit in, (c) slip, (d) leaveand inform an operator, and (e) handle the screw by the operator.

Strategies for Dealing with Problems 103
0 1 2 3 4 5 6 7 8 9 10 11 12
0.81
0.84
0.87
0.90
0.93
Slipping
Time (s)
Tor
que
in Z
-dir
ectio
n (N
m)
Approach
Search Leave and inform an operator
255
260
265
270
275
280
Posi
tion
in Z
-dir
ectio
n (m
m)
Fig. 11. Torque and position information recorded by the robot.
4.3 Tests and Results for Dealing with Failure Mode 3
Figure 12 shows image frames captured in the test of the strategy to handle a screw thatis too tight to remove. Figure 12(a) depicts the tool approaching the screw head. Then,the tool searched for and engaged with the screw head, as shown in Fig. 12(b). However,the tool was unable to unfasten the screw because it was too tight (Fig. 12(c)). The toolleft its current position and turned on the strobe light (Fig. 12(d)). Finally, an operatorcame to disassemble the screw with a hammer and a spanner (Fig. 12(e)). Figure 13shows the recorded torque and position of the robot. Before the robot left, the positionof the tool almost did not change after engaging with the screw head.
(a) (b) (c) (d) (e)
Bolt
Tool
A hammer & a spanner
Fig. 12. Strategy for dealing with a screw that is too tight to remove, (a) approach, (b) search andengage, (c) the screw too tight to remove, (d) leave and inform an operator, and (e) handle thescrew by the operator.

104 J. Huang et al.
0.0 0.5 1.0 1.5 2.0 2.5
-4
-2
0
2
4
6 Quit and inform an operator
Too tight to unfasten
Search and engage
-2.5 Nm
Time (s)
Tor
que
in Z
-dir
ectio
n (N
m)
Approach
250
255
260
265
270
275
280
285
Pos
ition
in Z
-dir
ectio
n (m
m)
Fig. 13. Torque and position information recorded by the robot.
The proposed strategy involving a second unfastening attempt was tested. Figure 14illustrates the selected image frames captured during the test. After approaching thescrew (Fig. 14(a)), the robot searched for and engaged with the screw head (Fig. 14(b)). Figure 14(c) shows the first unfastening failed because the screw was too tight.The second unfastening trial succeeded as shown in Fig. 14(d). After the screw wasseparated from the screw hole, the robot moved the screw away (Fig. 14(e)). The largetorque fluctuations during the two unfastening trials are clearly captured, as shown inFig. 15.
(a) (b) (c) (d) (e)
BoltTool Bolt
Fig. 14. Strategy of conducting a second unfastening attempt, (a) approach, (b) search and engage,(c) the first attempt fails, (d) the second attempt succeeds, and (e) assess and leave.

Strategies for Dealing with Problems 105
0 2 4 6 8 10 12
-5
-4
-3
-2
-1
0
1
2 2nd trail succeeds
Assess and leave
Unfasten
Search and engage
Approach
Time (s)
Torq
ue in
Z-d
irec
tion
(Nm
)
1st ufasten fails
260
265
270
275
280
Posi
tion
in Z
-dir
ectio
n (m
m)
Fig. 15. Torque and position information recorded by the robot.
5 Conclusion
Unscrewing is one of the most common disassembly operations. Automating unscrew-ing can release people from tedious and repetitive work. Unlike the case of screwing inassembling a new product, unscrewing is difficult to automate due to the poor physicalconditions of screws in EoL products. This paper has presented strategies for handlingthe three main failure modes in automated unscrewing operations, namely, screwdrivermissing screw head, screwdriver slipping on screw head and screw too tight to remove.The strategies involve conducting a second search and second unfastening trial or collab-orating with a human operator. The paper has briefly introduced a robotic unscrewingmethod implemented in a human-robot collaborative disassembly cell. The unscrew-ing process has four stages: approach, search and engage, unfasten, and assess andleave. Experiments have been conducted to test and validate the proposed strategies.The results obtained have demonstrated the feasibility of the strategies which can beadopted to enhance the robustness and reliability of the robotised unscrewing methoddeveloped.
In the future, the proposed strategies will be integrated and further tests will beconducted to improve the robustness and efficiency of the robotised unscrewing method.The unscrewing system will also be adapted to make it suitable for different types ofscrews and bolts.
Acknowledgments. This research was supported by the Engineering and Physical SciencesResearch Council (EPSRC) (Grant. No. EP/N018524/1).

106 J. Huang et al.
Appendix
The automated unscrewing method presented in Sect. 2 was implemented in a tur-bocharger disassembly demonstration which can be viewed on YouTube at https://www.youtube.com/watch?v=kOwGe_LbLzs.
References
1. Kerin, M., Pham, D.T.: A review of emerging industry 4.0 technologies in remanufacturing.J. Cleaner Prod. 237, 117805 (2019)
2. Stahel, W.R.: The circular economy. Nat. News 531(7595), 435 (2016)3. Vongbunyong, S., Chen, W.H.: Disassembly Automation. Disassembly Automation.
SPLCEM, pp. 25–54. Springer, Cham (2015). https://doi.org/10.1007/978-3-319-15183-0_34. AUTOREMAN project. http://autoreman.altervista.org/index.html. Accessed 03 Oct 20195. Huang, J., Pham, D.T., Wang, Y., Ji, C., Xu, W., Liu, Q.: A strategy for human-robot
collaboration in taking products apart for remanufacture. FME Trans. 47, 731–738 (2019)6. Li, J., Barwood, M., Rahimifard, S.: Robotic disassembly for increased recovery of strategi-
cally importantmaterials from electrical vehicles. Robot. Comput. Integr.Manuf. 50, 203–212(2018)
7. Palmieri, G., Marconi, M., Corinaldi, D., Germani, M., Callegari, M.: Automated disas-sembly of electronic components: feasibility and technical implementation. In: ASME 2018International Design Engineering Technical Conferences and Computers and Information inEngineering Conference. American Society of Mechanical Engineers (2018)
8. Kristensen, C.B., Sørensen, F.A., Nielsen, H.B.D.B., Andersen, M.S., Bendtsen, S.P., Bøgh,S.: Towards a robot simulation framework for E-waste disassembly using reinforcement learn-ing. In: 29th International Conference on Flexible Automation and Intelligent Manufacturing(2019)
9. Weigl, A.: Requirements for robot assisted disassembly of not appropriately designed elec-tronic products: lessons from first studies. In: Proceedings of 1994 IEEE InternationalSymposium on Electronics and the Environment, pp. 337–342 (1994)
10. Huang, J., et al.: A screw unfastening method for robotic disassembly. In: the InternationalConference on Sustainable Smart Manufacturing (S2M 2019) (2019)
11. Jia, Z., Bhatia, A., Aronson, R.M., Bourne, D., Mason, M.T.: A survey of automated threadedfastening. IEEE Trans. Autom. Sci. Eng. 16(1), 298–310 (2019)
12. Gao, Y., Feng, Y., Wang, Q., Zheng, H., Tan, J.: A multi-objective decision making approachfor dealing with uncertainty in EOL product recovery. J. Cleaner Prod. 204, 712–725 (2018)
13. DiFilippo, N.M., Jouaneh, M.K.: A system combining force and vision sensing for automatedscrew removal on laptops. IEEE Trans. Autom. Sci. Eng. 15(2), 887–895 (2018)
14. Bdiwi, M., Rashid, A., Putz, M.: Autonomous disassembly of electric vehicle motors basedon robot cognition. In: Proceedings of the IEEE International Conference on Robotics andAutomation (ICRA 2016), pp. 2500–2505 (2016)
15. Chen, W.H., Wegener, K., Dietrich, F.: A robot assistant for unscrewing in hybrid human-robot disassembly. In: Proceedings of the IEEE International Conference on Robotics andBiomimetics (ROBIO 2014), pp. 536–541 (2014)
16. Gerbers, R., Wegener, K., Dietrich, F., Dröder, K.: Safe, flexible and productive human-robot-collaboration for disassembly of lithium-ion batteries. In: Kwade, A., Diekmann, J.(eds.) Recycling of Lithium-Ion Batteries. SPLCEM, pp. 99–126. Springer, Cham (2018).https://doi.org/10.1007/978-3-319-70572-9_6

Strategies for Dealing with Problems 107
17. Wegener, K., Chen, W.H., Dietrich, F., Dröder, K., Kara, S.: Robot assisted disassembly forthe recycling of electric vehicle batteries. Procedia CIRP 29, 716–721 (2015)
18. Gerbers, R., Mücke, M., Dietrich, F., Dröder, K.: Simplifying robot tools by taking advantageof sensor integration in human collaboration robots. Procedia CIRP 44, 287–292 (2016)
19. Mironov, D., Altamirano, M., Zabihifar, H., Liviniuk, A., Liviniuk, V., Tsetserukou, D.:Haptics of screwing and unscrewing for its application in smart factories for disassembly.Haptics Sci. Technol. Appl. 10894, 428–439 (2018)
20. How andwhyApple’s robot Liam disassembles iPhones. https://www.zdnet.com/article/how-and-why-apples-robot-liam-disassembles-iphones/. Accessed 2019
21. Apley, D.W., Seliger, G., Voit, L., Shi, J.: Diagnostics in disassembly unscrewing operations.Int. J. Flex. Manuf. Syst. 10(2), 111–128 (1998)
22. Li, R., et al.: Unfastening of hexagonal headed screws by a collaborative robot. IEEE Trans.Autom. Sci. Eng. 17, 1–14 (2020)
23. KUKA Sunrise.OS 1.11. http://www.oir.caltech.edu/twiki_oir/pub/Palomar/ZTF/KUKARoboticArmMaterial/KUKA_SunriseOS_111_SI_en.pdf. Accessed 03 Oct 2019
Open Access This chapter is licensed under the terms of the Creative Commons Attribution 4.0International License (http://creativecommons.org/licenses/by/4.0/), which permits use, sharing,adaptation, distribution and reproduction in anymedium or format, as long as you give appropriatecredit to the original author(s) and the source, provide a link to the Creative Commons license andindicate if changes were made.
The images or other third party material in this chapter are included in the chapter’s CreativeCommons license, unless indicated otherwise in a credit line to the material. If material is notincluded in the chapter’s Creative Commons license and your intended use is not permitted bystatutory regulation or exceeds the permitted use, you will need to obtain permission directly fromthe copyright holder.

Improving Automated Insertion Taskin Robotics by Reducing Registration Error
Geraldine S. Cheok1, Marek Franaszek1(B), Karl Van Wyk1,2, and Jeremy A. Marvel1
1 National Institute of Standards and Technology, Gaithersburg, MD 20899, USA{cheok,marek,jeremy.marvel}@nist.gov
2 NVIDIA, 4545 Roosevelt Way, Seattle, WA 98105, [email protected]
Abstract. A peg-in-hole operation is representative of common tasks performedin assembly lines by robots. It requires registration of the coordinate frame wherea part resides to the robot frame where it is acted upon. Poor registration causesmisalignment of the peg and the hole which will result in a failed insertion ofthe peg. In this study, the dependence of the outcome of the insertion task on thequality of registration is investigated. It was shown in earlier studies that RestoringRigid-Body Condition (RRBC) leads to decreased target registration error. Thisstudy quantifies the improvement in the Pass/Fail rate when the target registrationerror is reduced for a given peg-hole tolerance. A robot arm operated in positioncontrol mode was used to perform the insertion without performing any searchalgorithms or force/torque sensing. Results show that use of the RRBC methodyielded substantial reduction in failed insertions, especially for tighter tolerances.
Keywords: Peg-in-hole · Rigid-body registration · Target registration error
1 Introduction
Accurate knowledge of an object’s location is essential in manufacturing-based roboticapplications. This is particularly important for the peg-in-hole task, which is an exten-sively studied robotic problem and the basis for many common tasks in assembly lines[1]. Research to improve this task has been conducted, andmost of the proposedmethodsassume a peg can be initially tilted relative to the hole centerline and a search algorithmis used to guide the peg into the hole [2]. Many of the algorithms rely on feedbackfrom force/torque (F/T) sensors [3, 4]. The premise of these methods is to improve per-formance given the errors (systematic and random) of the hole and peg locations [5].The method described in this paper improves task performance by reducing the errorin the registered hole location by applying corrections to the points transformed fromworld to robot frame. The method reduces registration error by restoring the rigid-bodycondition (RRBC) for point-based rigid-body registration [6]. This approach is similarto the Volumetric Error Compensation (VEC) technique, but it is easier to use as noadvanced, analytical modelling of the error function is required [7–9]. It is reasonable to
This is a U.S. government work and not under copyright protectionin the U.S.; foreign copyright protection may apply 2021S. Ratchev (Ed.): IPAS 2020, IFIP AICT 620, pp. 108–121, 2021.https://doi.org/10.1007/978-3-030-72632-4_8

Improving Automated Insertion Task in Robotics 109
expect that improvement in the world-to-robot registration will have a positive impacton the peg-in-hole task; thus, increasing the likelihood for a successful insertion. How-ever, the level of expected improvement has not been quantified. This paper quantifiesthe improvement in the peg-in-hole task that can be achieved by reducing the regis-tration error. Recalibration of the perception system and/or remastering the robot arm(tasks which may require skills not readily available in small manufacturing companies)would reduce the registration error, but the method described in this paper is an easiertask. Unlike some other approaches [10], the RRBCmethod does not require installationof additional hardware such as F/T sensors as it merely corrects the endpoints of therobot’s path and no sensing is involved.
It was shown in [6] that RRBC method can substantially improve the quality ofregistration as gauged by the reduction of the Target Registration Error (TRE) – targetsare points of interest to which registration is applied. To assess how the reduction ofTRE improves the performance of a peg-in-hole task in a robotic application, threeexperiments were conducted. In these experiments, a robot arm, operated in positioncontrol mode, was commanded to move to a specified location and to insert a peginto a hole; that is, no modification of the preplanned path from a search algorithmor active force/torque feedback was used. This constitutes a very challenging test asthe success of such an insertion depends almost entirely on accurate initial positioning.The coordinates of the hole were obtained by registering a world coordinate frame tothe robot coordinate frame using a regular rigid-body registration. Then, automatedinsertions were performed using uncorrected hole locations and locations corrected bythe RRBCmethod. A Pass/Fail metric was used to determine if the implementation of theRRBC method would increase the number of successful insertions. The RRBC methodmay be beneficial for insertion tasks when feedback from force/torque sensors is notavailable or sufficiently reliable or for other types of tasks such as automated drilling[11] or welding [12] where accurate positioning is crucial.
This paper summarizes the experiments, results, and conclusions from the threepeg-in-hole experiments described in [13].
2 Related Work
Strategies used for peg insertion generally fall in two main categories: those which useactive feedback from force/torque sensors tomodify the preplanned path and thosewhichcomplete the insertion task without such feedback.
In the first category, the methods rely on an active compliance strategy [14]. Anexample of such an implementation was shown in [15] where a vision system was usedfor part location together with a neural network processing data from a force/torquesensor in the wrist joint. Jokesch et al. in [16] used a generic algorithm to automaticallyconnect electric vehicleswith charging stations using a robot in impedance controlmode.This task requires alignment of seven pins and an asymmetric peg and hole. Abdullahet al. [17] used data models created from F/T sensor data to search for the hole centerusing an algorithm based on human intuitive behavior. In [18], Bös et al. addressedlimitations of admittance control schemes caused by the dependence of contact forcesand torques on speed. Two iterative learning controllers were used to increase assembly

110 G. S. Cheok et al.
speed and to reduce contact forces. Jasim et al. [19] used Gaussian Mixtures Modeland F/T feedback in Contact-State modeling to identify accurate hole position. Xu et al.[20] divided the contact area around the hole into sixteen regions and used KD-Treemethod to detect the right region for insertion using force feedback. While the use offorce/torque sensors greatly improves insertion performance, this approach slows downthe process, increases the cost of hardware, and may not be feasible when complex [21]or large scale parts [22] are mated.
In the second category, a passive or hybrid compliance strategy is applied, anda search algorithm is based on the profile of insertion depth [23–27]. For this typeof strategy, rudimentary force feedback may be used only to ensure that a peg is ina constant contact with the surface of a part into which it is inserted. Strategies inboth categories actively modify the preplanned trajectory as the search progresses andtherefore, accuracy of the initial peg position is less critical for a successful insertion.However, an inaccurate starting point for the search algorithm will adversely affectthe time spent in searching [28]. This positional accuracy depends on the quality ofregistration between the two coordinate frames.
Point-based rigid-body regisUtration is a frequently used procedure to determinethe transformation, rotation R and translation τ, between two coordinate frames, forexample: world or perception system frame and the robot frame. This procedure requiresmeasurement of 3D commonpoints in both frames. The procedure assumes that the rigid-body condition is satisfied, i.e. the distance between any twopoints in one frame is exactlythe same as the distance between corresponding points in the second frame.However, dueto noise and possible bias, this condition may not be preserved and corrective methods,like mentioned earlier RRBC, must be used.
3 Description of the RRBC Method
In this report, the first coordinate frame, from which points are transformed, is calledthe working frame (X ). The second frame, to which points are transformed, is calledthe destination frame (Y ). If the transformation {R, τ } from X to Y is known, it can beapplied to the points of interest, TX (k), k = 1, . . . ,K , which are measured only in Xbut must be accessed in Y . We call these points target points. Due to registration error,targets transformed from the working frame are not mapped exactly in the destinationframe. To decrease the error of a transformed k-th target, a correction vector ε(TX (k))is added to the target measured in X
TX (k) = TX (k) + ε(TX (k)) (1)
where TX (k) is the corrected target location in X . In RRBC, the correction ε(TX (k)) isobtained by linear interpolation of corrections εn determined earlier at points Xn whichare close to target TX (k) and is given by
ε(TX (k)) =∑N
n=1wn(TX (k), Xn)εn(Xn) (2)
where weights wn are based on the proximity of Xn to TX (k), and∑
wn = 1.

Improving Automated Insertion Task in Robotics 111
Corrections εn can be calculated from points Xn, n = 1, . . . ,N , measured in theworking frame and the same points Yn measured in the destination frame
εn = RinvYn + τ inv − Xn (3)
where {Rinv, τ inv} is inverse of the registration transformation {R, τ }, i.e., Rinv = R′where R′ is the transposed rotation matrix and τ inv = −Rinvτ . Points measured in bothframes are called fiducials, and the registration transformation {R, τ } was determinedfrom at least three non-colinear fiducials using least-squares fitting algorithm [29].
If targets TY (k), k = 1, . . . ,K are also measured in the destination frame (as in thisresearch study), the Target Registration Error (TRE) can be calculated as
TRE(TX (k)) = RTX (k) + τ − TY (k) (4)
A reliablemetric of registration is based on a representative set of K targets measuredin both frames [30] and can be calculated as the Root Mean Square of TRE (RMST )
RMST =√√√√ 1
K
K∑
k=1
TRE2(k) (5)
4 Description of Experiments
A six degree of freedom (6DOF) collaborative robot arm (UR5) operating under highstiffness, in position control mode, was used to insert a peg into a series of holes. Thespeed of the robot was set to about 0.35 m/s (i.e., 35% of its maximum tool speed). Threeexperiments, Exp. 1 to 3, were conducted; each with slight variations. The coordinatesof the holes were determined by registering a world frame to a robot frame using con-ventional, rigid-body registration and three fiducials for Exp. 1 and 2 and five fiducialsfor Exp. 3 to obtain {R, τ }. After transforming the target locations from world frameto robot frame using {R, τ }, uncorrected hole locations and locations corrected by theRRBCmethod were sent to the robot controller. Insertion of a peg in each target hole wasattempted, and a simple Pass/Fail metric was used to determine the effectiveness of theRRBC method. A Pass meant that the robot in position control mode was able to fullyinsert the peg into the hole (as determined by monitoring the robot’s z axis coordinate)with a measured force less than 17 N; otherwise, it was considered a Fail. It was alsoconsidered to have failed if the peg was fully inserted but jammed while extracting thepeg.
Each of three experiments was repeated at least seven times. Before each experiment,the locations of all holes were re-measured with the robot in compliance mode and thetransformation matrix {R, τ } and corrections εn were calculated. Then, for each repeat,the insertion test was performed for two transformed, uncorrected and corrected, targetlocations. A third insertion test was performed using the raw measured positions of thetargets. These insertions reflect the time-consuming process of lead-through program-ming and were nominally expected to always be successful as these were the actual

112 G. S. Cheok et al.
measured positions in the robot coordinate frame. Any failed insertion in this categoryis attributed to a non-zero noise in robot which affects its repeatability. The performanceusing these insertions served as a baseline.
The purpose of these experiments was to determine the effect of the RRBC correctedvs. uncorrected position on the peg insertion rate. The main reason for the large numberof insertions (7 runs with 88 holes per run) was to check that any improvement is notdue to random effects such as noise and drift (see non-zero baseline curve in Fig. 3).The influence of systematic factors such as robot speed or stiffness was not investigatedin this study.
4.1 Equipment
In the experiments, a 12.675 mm (0.499 in) diameter peg was used and was rigidlyattached to the robot arm (see Fig. 1c). In practice, the pegs would likely not be rigidlymounted to the robot and would likely be held in a gripper. This removes a source ofvariability encountered in practice which can be either beneficial or detrimental to theinsertion task depending on the gripper.
Adapter
Peg
82°
12.7 mm (0.5 in) φ
(nom)
1.27 mm(0.05 in) 45°
a. Conical peg b. Flat peg
c. Flat peg and aluminum adapter
Fig. 1. Conical and flat pegs (a and b, respectively) and aluminum adapter (c).
For Exp. 1, the end of the peg was conical, and for Exp. 2 and 3, the end of the pegwas flat with a slight chamfer (see Fig. 1a and b). From observations in Exp. 1, the pegwas successfully inserted even though there was a visible initial misalignment of the pegand the hole; however, the “chamfer” of the conical peg allowed the peg to be insertedwithout exceeding the preset force threshold. After Exp. 1, it was decided that a flat pegmay make the distinction between Pass and Fail more definitive, and flat pegs are moretypical in practice.
The diameter of the hole allowed for a 0.051 mm (0.002 in) clearance with respectto the peg. The hole was drilled into a 28.575 mm (1–1/8 in) diameter cylindrical pieceof aluminum (Fig. 1c) and will be called an “adapter,” henceforth. Threaded holes at thebottom of the adapter enabled the attachment of the adapter to the optical plate.
The experiments were conducted using an optical breadboard plate mounted on arigid aluminum frame. The plate had threaded holes spaced on a grid at 25 mm (0.98 in)

Improving Automated Insertion Task in Robotics 113
intervals. The nominal locations of the holes were taken as ground truth locations. Thework volume was essentially 2D with 17 rows by 21 columns of holes (Fig. 2).
Fig. 2. Layout of the 17 × 21 grid of holes. Circles are fiducials used for registration. Dotsrepresent Fiducials and crosses represent Targets in the figure.
4.2 General Procedure and Concept of Experiments
Given themanufacturing tolerances of the pre-drilled holes, the ground truth locations ofthe holeswere set to the nominal locations of the holes in theworld coordinate frame. Thelocations of all holes, in robot coordinate frame, were obtained by manually insertingthe peg into the adapter with the robot in gravity compensation mode, and recording thevalues of
(x, y, z, ϑx, ϑyϑz
), where (x, y, z) is a Cartesian position, and
(ϑx, ϑyϑz
)
are Euler angles representing the peg orientation. Each position was measured once.These manual measurements were obtained prior to the start of each experiment, andthese measurements in robot frame along with the ground truth locations in world frameare required to calculate corrections εn in Eq. (3) for the RRBC method.
Since the experiments described in this paper are essentially 2D, only corrections tothe x- and y-coordinates were calculated, and the z-coordinate was unchanged from theraw measured value. No corrections were made to the peg orientations.
As seen in Fig. 2, targets were located in every other column and every other row,resulting in a total of 80 targets. Being a research study, the locations of the targets {TY }were measured beforehand in the robot coordinate frame using manual measurements– in practice, this may not be feasible and target locations are usually unknown. Targetlocations were treated as unknown positions in the calculations in this study to reflectpractice, and the surrounding, manually-obtained fiducial locations were used in the

114 G. S. Cheok et al.
calculations of corrections εn. The measured target locations {TY } were only used todetermine the registration error TRE in Eq. (4). The correction to a target location ε(TX )
was estimated using N = 8 corrections {ε}N of the fiducials closest to the target. Theweightswn in Eq. (2) were based on distances between the target andN nearest fiducials.In our experiments, the same set of weights was used for all targets, but in practicalapplications, the location of target TX relative to N nearest fiducials would vary.
The robot controller received(x, y, z, ϑx, ϑyϑz
)as destination poses for all 80 tar-
get locations, where (x, y)were either the raw, transformed uncorrected, or transformedcorrected Cartesian positions, and
(ϑx, ϑyϑz
)were either “Original” angles (raw mea-
sured values for a given position) or “Fixed” angles. The Fixed angles,−ϑxand
−ϑy, were
simply the average of all 357 raw angles for ϑx and ϑy, respectively, where ϑx and ϑy
determined the perpendicularity of the peg to the table. ϑz defined the rotation about thecenterline of the peg which was irrelevant in our setup as we used symmetric, cylindricalpeg.
A summary of the parameters used in the three experiments is given in Table 1.As noted in Table 1, each experiment consisted of either 7 or 12 runs. A run involvedinsertion of the peg into 80 hole locations.
Table 1. Summary of parameters in experiments.
Exp.#
# ofruns
Peg type Dp, Pegdiametermm (in)
Dh, Holediameter mm(in)
� = Dh − Dpmm
Angles(ϑx, ϑy
) # offiducials forregularregistration
1 7 Conical 12.675(0.499)
12.751–12.776(0.502–0.503)
(0.076–0.101) Original 3
2 7 Flat 12.675(0.499)
12.751–12.776(0.502–0.503)
(0.076–0.101) Original 3
7 Flat 12.675(0.499)
12.751–12.776(0.502–0.503)
(0.076–0.101) Fixed 3
3 7 Flat 12.675(0.499)
12.700–12.725(0.500–0.501)
(0.025–0.05) Fsixed 5
5 Flat 12.675(0.499)
12.700–12.725(0.500–0.501)
(0.025–0.05) Fixed 5
5 Results and Discussion
5.1 Failed Insertions: Uncorrected vs. Corrected Target Locations
For each run, the number of times the peg failed to be inserted was determined, and theratio of this number to the total number of insertions (80 targets) was calculated and

Improving Automated Insertion Task in Robotics 115
plotted. The plots of the percent Fails for the three experiments are shown in Fig. 3.The data from these plots are summarized in Table 2. The columns labeled Unc/Cor inTable 2 quantify the improvement in performance of insertion task due to the RRBCcorrections to the target locations. In Fig. 3 and Table 2, the baseline values are theresults of attempted insertions using the raw (recorded in the robot’s coordinate frame)positions. As mentioned in Sect. 4, there should be no failures for the baseline insertions,and the observed failures (about 2% to 6%) are likely due to measurement noise as theraw measurements were based on single measurements and to robot drift.
a. Experiment 1, Runs 1-7, Original angles, conical peg b. Experiment 2, Rums 1-7, Original angles, flat peg.
c. Experiment 2, Runs 1-7, Fixed angles, flat peg. d. Experiment 3, Runs 1-12, Fixed angles, flat peg.
Fig. 3. Percentage of failed insertions for Experiments 1–3.
Figure 3 shows that the RRBC increases the successful insertion rate as compared tothe uncorrected targets locations. The average improvement was a 2.4 times reductionin the failure rate for the insertions with the Original angles (Exp. 1 and 2) and wasapproximately 11 and 4 times reduction in the failure rate for the Fixed angles, Exp. 2and 3, respectively. This level of improvement should be analyzed in conjunction withthe tolerances reported in Table 1, columns Peg diameter and Hole diameter.
Another trend observed in Fig. 3 is the increase in the number of failures with time,observable even with the baseline trials. Some possible reasons for this increase werethermal effects as the daywore on and turning the robot on/off each day. Therefore, a thirdexperiment was conducted. The first seven runs in Exp. 3 (Runs 1–7) were conductedcontinuously in one shift without turning the robot off. However, as seen in Fig. 3d,

116 G. S. Cheok et al.
Table 2. Percentage of Failed Target Insertions.
Failed insertions
Original angles Fixed angles
Baseline(%)
Unc.(%)
Cor.(%)
Unc./Cor. Base-line(%)
Unc.(%)
Cor.(%)
Unc./Cor.
EXPERIMENT 1
Avg. 3.4 23.8 10.0 2.4
Std.Dev.
1.2 3.6 2.5 0.3
EXPERIMENT 2
Avg. 1.6 29.1 13.6 2.4 3.4 26.3 2.7 11.0
Std.Dev.
0.9 9.6 8.5 0.7 3.0 11.0 1.5 3.0
EXPERIMENT 3
Avg. 6.4 51.0 13.2 4.2
Std.Dev.
4.2 12.5 5.6 1.2
Runs 1–7, the number of failures still increased with time despite the robot not beingpower-cycled. This increase is therefore likely due to drift in the robot hardware, as it alsoaffects the baseline results, which do not depend on the quality of registration. At thistime, the only explanation that can be offered for this increased number of failures is thatthe robot, sensors, and mechanics, drift with the number of performed insertions. Theobserved drift should not be interpreted as a process of asymptotic approach to steadystate but rather as a systematic departure from initial conditions due to the performanceof a repeated task. However, even as the repeated use of robot increased the number offailures, the use of the RRBC was always beneficial.
After the initial seven runs in Exp. 3, five additional runs were performed over thenext three days. As seen in Fig. 3d, the number of failures did not seem to be levelingoff, and after 12 runs the percent of failures was about 70%. It needs to be stressedthat the slow drift of robot parameters makes the calculated corrections εn in Eq. (3)progressively less accurate and increases the failure rate. Given the tight tolerances ofthe insertions, this drift need not be large to impact trial performance, and insertionswith looser tolerances may not experience such failure growth trends.
5.2 Relationship Between Failures and TRE
In Fig. 4, the normalized failure values for each target are plotted against the differences
�TRE(TX ) = TRE(TX ) − TRE(TX
)where TRE(TX ) and TRE
(TX
)are the TREs
for the uncorrected and corrected targets locations, respectively. The normalized fail-ure value, �Fail,nom(TX ), is the difference between the number of failed insertions for

Improving Automated Insertion Task in Robotics 117
uncorrected target location TX and the number of failed insertions for corrected targetTX divided by the number of runs for that experiment. If �Fail,nom > 0 then more failedinsertions are observed at uncorrected target location TX and if�Fail,nom < 0 then morefailed insertions were observed for target locations corrected by RRBC. The plots aredivided into four quadrants:
1. Q-I, upper left: RRBC increases TRE, reduces failed insertions2. Q-II, upper right: RRBC reduces TRE, reduces failed insertions3. Q-III, lower left: RRBC increases TRE, increases failed insertions4. Q-IV, lower right: RRBC reduces TRE, increases failed insertions
a. Experiment 1, Original angles. b. Experiment 2, Original angles.
c. Experiment 2, Fixed angles. d. Experiment 3, Fixed angles.
Fig. 4. Failures and TRE.
As seen in Fig. 4, the RRBC method either did not adversely affect the number offailures, or it reduced number of failures (Quad II). Also, the RRBC method reducedTRE for a majority of the targets (targets with �TRE > 0).
For Quads I, III, and IV, two possible explanations are offered for why the RRBCmethod increases TRE and/or increases failures. One reason is that the correction for thetarget is estimated based on the data of neighboring points. As discussed in [6], the datacontains both noise and systematic bias. Although the noise is smaller than the bias, itaffects the calculated corrections. The other reason is that linear interpolation is used todetermine the corrections, and the correction may not be linear.

118 G. S. Cheok et al.
RMST (which is related to TRE) was calculated using Eq. (5) and is shown in Fig. 5.As seen in Fig. 5, the RRBC method reduces RMST and improves the registrationperformance. The average reduction of the RMST is about 60% when using the RRBCmethod compared to not using the RRBC.
Fig. 5. Comparison of RMST for Experiments 1–3.
5.3 Tighter Tolerances
Because of the drift in the failure rate with time as described in Sect. 5.1, a valid com-parison of failure rates between the corrected and uncorrected targets locations can onlybe made for the first runs in Exp. 2 and 3. From Fig. 3c, failure rates for Exp. 2 are 15%and 1% for the first run for the uncorrected and corrected by RRBC target locations,respectively. From Fig. 3d, failure rates for Exp. 3 are 37% and 10% for the first runfor the uncorrected and corrected locations, respectively. The higher failure rate for theuncorrected locations contradicts the expectation that the use of five fiducials (Exp. 3)would result in a better registration than the registration with three fiducials (Exp. 2). Areason for the higher rate of failures for the uncorrected locations in Exp. 3 was becausethe diameter of the hole in the adapter used in Exp. 2 was between 12.751 mm and12.776 mm (0.502 in and 0.503 in) while the diameters of the holes in the adaptersused for Exp. 3 ranged from 12.700 mm to 12. 725 mm (0.500 in to 0.501 in). Thediameter of the flat peg was 12.675 mm (0.499 in) at the start of Exp. 2 and 12.662 mm(0.4985 in) after Exp. 3. Thus, the higher failure rate for the uncorrected locations, anincrease of about 22%, in Exp. 3 can be attributed to the tighter tolerance – a decreaseof 0.025 mm (0.001 in). The tighter tolerance increased the failure percentage from 1%(1st run, Exp. 2) to 10% (1st run, Exp. 3) for the RRBC method.
The efficacy of the RRBC method applied to an insertion task depends strongly onthe difference � (see Table 1) between the hole and peg diameters and the correctedmean target registration error RMST . If the peg diameter Dp is very small relative to thehole diameter Dh, then there is no benefit to using the RRBCmethod as the insertion willalways be successful (unless there is a very large uncorrected error RMST comparablewith the hole diameter Dh). In the other extreme when Dp = Dh, the use of the RRBCmethod is futile because the insertion will always fail. Thus, the largest benefit of usingthe RRBC method to improve the insertion task is when the difference � is comparablewith the corrected RMST . In Exp. 1 and 2, the ratio �/RMST was between 0.536 and

Improving Automated Insertion Task in Robotics 119
0.842, for Exp. 3 the ratio was between 0.208 and 0.417, based on values of� in Table 1and values of RMST shown in Fig. 5.
Another observation is that in Exp. 3, the percent of failed insertions for the uncor-rected locations started out at about 37%. Since the baseline value was about 6% (i.e.,6% of the failures is due to noise), 31% of the Fails was due to the registration error. Thisrate of failure may be unacceptable for many applications. Thus, for insertions wheretight tolerances are needed, the RRBC method may have to be used, as only 4% of thefailure can be attributed to registration error, as shown in Fig. 3d, Run 1.
6 Conclusions
Peg-in-hole experiments were performed to quantify reduction in the failed insertionrate when the target registration error is reduced by using the RRBC method. No searchalgorithms or force/torque sensors were used to aid the insertion task. The successfulinsertion of the peg depended almost entirely on the accuracy of the hole location which,in turn, depends on the quality of world to robot registration.
The RRBC method improves registration by reducing the registration error, RMST ,by 60%when compared to uncorrected targets locations. This study shows that this levelof improvement in positional accuracy led to a 11-fold reduction in the failed insertionrate and a 4-fold reduction for a tighter tolerance.
Manufacturing tasks which require accurate positional data would be more efficientif the registration process was complemented by the application of small correctionsto the target locations. The use of the RRBC method may be especially useful for partassembly with tight tolerances where search algorithms are commonly used. Reducedregistration error should result in a starting point closer to the desired point, and thus, leadto a shorter search time and smoother assembly. Other tasks such as drilling, welding,or inspection where traditional control techniques based on force/torque feedback arenot available, should also benefit from reduced positional error.
7 Disclaimer
Certain commercial equipment are mentioned in this paper to specify the experimentalprocedure adequately. Such identification is not intended to imply recommendation orendorsement by the National Institute of Standards and Technology, nor does it implythat the equipment is necessarily the best available for the purpose.
References
1. Nevins, J.L., Whitney, D.E.: Computer-controlled assembly. Sci. Am. 238, 62–74 (1978)2. Abdullah, M.W., et al.: An approach for peg-in-hole assembling using intuitive search
algorithm based on human behavior and carried by sensors guided industrial robot.IFAC-PapersOnLine 48(3), 1476–1481 (2015)
3. Newman,W.S., Zhao, Y., Pao, Y.-H.: Interpretation of force andmoment signals for compliantpeg-in-hole assembly. In: International Conference on Robotics & Automation ICRA. IEEE,pp. 571–576 (2001)

120 G. S. Cheok et al.
4. Yamashita, T., et al. Peg-and-hole task by robot with force sensor: Simulation and experiment.In: Proceedings of the International Conference on IECON (1991)
5. Lin, L.L., et al.: Peg-in-hole assembly under uncertain pose estimation. In: Proceedings of11th World Congress on Intelligent Control and Automation. Shenyang, China (2014)
6. Franaszek, M., Cheok, G.S.: Improving rigid-body registration based on points affected bybias and noise. In: Ratchev, S. (ed.) Precision Assembly in the Digital Age, pp. 226–234.Springer, Chamonix, France (2018)
7. Bristow, D.A., Tharayil, M., Alleyne, A.G.: A survey of iterative learning control. IEEEControl Syst. Mag. 96–114 (2006)
8. Galetto, M., et al.: Volumetric error compensation for the MScMS-II. In: 12th CIRPConference on Computer Aided Tolerancing. Elsevier (2013)
9. Cajal, C., et al.: Efficient volumetric error compensation technique for additive manufacturingmachines. Rapid Prototyp. J. 22(1), 2–19 (2016)
10. Huang, S., et al.: Applying high-speed vision sensing to an industrial robot for high-performance position regulation under uncertainties. Sensors 16(8), 1195 (2016)
11. Zhu, W., et al.: An off-line programming system for robotic drilling in aerospace manufac-turing. Int. J. Adv. Manuf. Technol. 68, 2535–2545 (2013)
12. L.Tingelstad, et al.: Multi-robot assembly of high-performance aerospace components. In:10th IFAC Symposium on Robot Control, Dubrovnik, Croatia, pp. 670–675 (2012)
13. Cheok, G.S., et al.: Improving automated insertion applications by restoring rigid-body con-dition in point-based registration. National Institute of Standards and Technology ReportNISTIR 8198r1 (2017)
14. Whitney,D.E.: Quasi-static assembly of compliantly supported rigid parts. J. Dyn. Syst.Meas.Contr. 104(1), 65–77 (1982)
15. Navarro-Gonzalez, J.L., et al.: On-line incremental learning for unknown conditions duringassembly operations with industrial robots. Evolving Syst. 6(2), 101–114 (2015)
16. Jokesch,M., Suchý, J.,Winkler, A., Fross, A., Thomas, U.: Generic algorithm for Peg-In-Holeassembly tasks for pin alignments with impedance controlled robots. In: Reis, L., Moreira,A., Lima, P., Montano, L., Muñoz-Martinez, V. (eds.) Robot 2015: Second Iberian RoboticsConference.Advances in Intelligent Systems andComputing, vol. 418, pp. 105–117. Springer,Cham (2016) https://doi.org/10.1007/978-3-319-27149-1_9
17. Abdullah, M.W., et al.: Force/Torque data modeling for contact position estimation in Peg-in-Hole assembling application. In: Proceeding of 4th International Conference on Advancesin Mechanics Engineering. MATEC Web of Conferences (2015)
18. Bos, J., Wahrburg, A., Listmann, K.D.: Iteratively learned and temporally scaled force controlwith application to robotic assembly in unstructured environments. In: IEEE InternationalConference on Robotics and Automation (ICRA, Singapore, pp. 3000–3007 (2017)
19. Jasim, I.F., Plapper, P.W., Voos, H.: Position identification in force-guided robotic peg-in-hole assembly tasks. In: Conference on Assembly Technologies and Systems, Procedia CIRP.Elsevier (2014)
20. Xu, Y., Hu, Y., Hu, L.: Precision peg-in-hole assembly strategy using force-guided robot.In: 3rd International Conference on Machinery, Materials and Information TechnologyApplications (ICMMITA), Qingdao, China (2015)
21. Song, H.C., Kim, Y.L., Song, J.B.: Guidance algorithm for complex-shape peg-in-holestrategy based on geometrical information and force control. Adv. Robot. 30(8), 552–563(2016)
22. Liu, Z., et al.: Laser tracker based robotic assembly system for large scale peg-hole parts.In: Proceedings of 4th IEEE Annual International Conference on Cyber Technology inAutomation, Control, and Intelligent Systems, Hong Kong, China (2014)
23. Polverini, M.P., et al.: Sensorless and constraint based peg-in-hole task execution with adual-arm robot. In: ICRA, pp. 415–420. IEEE, Stockholm, Sweden (2016)

Improving Automated Insertion Task in Robotics 121
24. Park, H., et al.: Compliance-based robotic peg-in-hole assembly strategy without forcefeedback. IEEE Trans. Ind. Electron. 64(8), 6299–6309 (2017)
25. Luo, R.C., Chang, A., Li, C.: A novel peg-in-hole approach based on geometrical analysis forinclineduncertainty. In: IEEE InternationalConference onAdvanced IntelligentMechatronics(AIM), Munich, Germany. pp. 891–896 (2017)
26. Su, J.H., et al.: Study on dual peg-in-hole insertion using of constraints formed in theenvironment. Ind. Rob. Int. J. 44(6), 730–740 (2017)
27. Sharma, K., Shirwalkar, V., Pal, P.K.: Peg-in-hole search using convex optimizationtechniques. Ind. Rob. Int. J. 44(5), 618–628 (2017)
28. Wyk, K.V., et al., Comparative peg-in-hole testing of a force-based manipulation controlledrobotic hand. IEEE Trans. Rob. (2018)
29. Arun, K.S., Huang, T.S., Blostein, S.D.: Least-squares fitting of two 3-D point sets. IEEETrans. PAMI 9(5), 698–700 (1987)
30. Fitzpatrick, J.M., West, J.B., Maurer, C.R.: Predicting error in rigid-body point-basedregistration. IEEE Trans. Med. Imaging 17(5), 694–702 (1998)
Open Access This chapter is licensed under the terms of the Creative Commons Attribution 4.0International License (http://creativecommons.org/licenses/by/4.0/), which permits use, sharing,adaptation, distribution and reproduction in anymedium or format, as long as you give appropriatecredit to the original author(s) and the source, provide a link to the Creative Commons license andindicate if changes were made.
The images or other third party material in this chapter are included in the chapter’s CreativeCommons license, unless indicated otherwise in a credit line to the material. If material is notincluded in the chapter’s Creative Commons license and your intended use is not permitted bystatutory regulation or exceeds the permitted use, you will need to obtain permission directly fromthe copyright holder.

Assembly Cells and Systems

Development of a Sensitive WindingApplication Based on a Serial Robot and
Integrated Torque Sensors
A. Kanso(B) , M. Vette-Steinkamp, and R. Muller
ZeMA - Zentrum fur Mechatronik und Automatisierungstechnik gemeinnutzigeGmbH, Gewerbepark Eschberger Weg 46, Gebaude 9, 66121 Saarbrucken, Germany
http://www.zema.de
Abstract. Conventional winding technologies have already been imple-mented in the electrical and manufacturing industries. However, theadoption of such technology remains a challenge in the rubber indus-try, as sensitivity perception is required. A solution to this problem canbe achieved by making use of robots equipped with additional sensors.Sensitive robotic applications require accurate force/torque data acqui-sition. The integration of accurate force/torque sensors is unsatisfactory,moreover a novel method for the processing of the measured data is arequisite. In this paper, a concept for the development of a sensitivewinding application based on a serial sensitive robot is presented.
Keywords: Sensitive robot · Winding technology · 3D scanning ·Control system
1 Introduction and Approach of the Problem
The automation of the winding of flexible, limp components has always been achallenge in the industrial context. This poses a problem in the rubber indus-try, particularly for the production of rubber seals. Many winding applicationshave already been successfully implemented, such as, the winding of yarns in thewool industry or the winding of electric spools. Serial kinematics often form thecentral component in an automated winding process. In conventional windingapplications, the serial kinematics are programmed along a predefined path bya defined type of movement. In addition, known parameters such as the con-stant speed of the winding cylinder and product geometries are necessary forthe automation of these applications.
R. Muller—The results are part of the project “Entwicklung eines Versuchswicklers”,funded by the central innovation program in Saarland. Furthermore the research isfunded by the Interreg V A Großregion within Robotix-Academy project (no 002-4-09-001).
c© The Author(s) 2021S. Ratchev (Ed.): IPAS 2020, IFIP AICT 620, pp. 125–139, 2021.https://doi.org/10.1007/978-3-030-72632-4_9

126 A. Kanso et al.
Rubber seals are often used in the automotive industry to seal the chassisand doors of a vehicle. The manufacturing tolerances of these rubber sealingprofiles are high and the geometry is complex. This makes the winding of theseprofiles more demanding and impossible to solve with conventional systems. Ahomogeneous winding pattern is characterized by gapless layers between theindividual windings and low compressive forces. The development of sensitivewinding applications enables the winding of geometrically complex rubber sealson the body side even with high manufacturing tolerances. This article dealswith developing a new test winder for implementing a winding application forcomplex rubber seals on the body side. The basic components of the test winderare a sensitive robot, a winding tool, a laser line sensor and a winding cylinder.
2 State of the Art of the Winding Application
Winding technologies are widely used for simple endless products such as cables(see Fig. 1). The main area of application for winding technologies in industry isin the field of electrical manufacturing. The aim of this project is to transfer thistechnology to the winding of rubber seals. However, the complex cross-sections ofthe rubber profile and the high requirements due to their sensitivity to bendingand tensile force make winding very complex.
Fig. 1. Process principle of linear winding [1]
The winding process (see Fig. 2) starts with stockpiling on the supply cylin-der. Then, the profile runs through guiding elements and deflections to the wirebrake. Afterwards, the profile is guided along a predefined path which is depen-dent on the dimensions of the wire and the winding cylinder and also on therotational speed of the latter. The wire brake represents a central element forthe realization of homogeneous layer formation. With the wire brake the profilecan be accelerated and braked. Maintaining a constant wire tensile force is anessential prerequisite for meeting the predefined quality requirements for coilsand is of critical importance for both technological and economic reasons [2,3].Very low wire tensile forces, for example, have a particularly negative effect onthe winding structure. Moreover, excessive braking forces can cause the profileto tear. In addition, faulty winding patterns primarily come in the form of loosewindings, low filling levels, and disturbances in the winding pattern [1].

Sensitive Winding 127
Conventional winding applications are adopted in the rubber industry towind the door-side rubber as an endless profile. This enables the setup of aproduction line of endless rubber profiles. The basic components of the windingapplication are a serial kinematic, a linear axis, an active winding cylinder anda suitable measurement system.
Fig. 2. General structure of a winding process [1]
3 Process Development
According to the planning approach of the analysis of winding application atZeMA (see Fig. 3), the product is first analyzed, before the process is consideredmore closely. The information and boundary conditions resulting from the prod-uct and process analysis are elementary for the design and development of theproduction equipment.
Fig. 3. Planning approach for the development of sensitive winding application atZeMA
After analysis of the boundary conditions, a concept for a sensitive roboticsystem was developed (see Fig. 4). The basic components of this system area sensitive robot, a winding tool, safety elements, measuring modules and acontroller. In addition to the physical limitations of the product, there were afew other variables that needed to be taken into consideration: the control andoperating concept of the system, as well as the workplace design. The windingprocess and the measurement concept will be discussed in the coming sections.

128 A. Kanso et al.
Fig. 4. Structure and components of a sensitive robot system
3.1 Winding Process
During the winding process, the winding tool always occupies a predefined posi-tion and orientation above the winding cylinder as shown in Fig. 5. While thewinding cylinder rotates, the last two turns of the rubber seal are pressed againsteach other. This creates a winding force between the winding tool and the rubberprofile, which can be expressed as a force vector in the flange coordinate system.The resulting force will determined by evaluating the relevant torques on therobot axes.
The practiced force is oriented toward the rotation axis of the winding cylin-der (Z-axis of the winding cylinder coordinated system). The force measurementin the KUKA LBR iiwa [4] is composed of the measured torques of all sevenaxes, which significantly increases the uncertainty of measurements received.
Analysis of both the robot’s configuration and the experimental has leadto the conclusion that the seventh axis has always a lever arm with respect tothe reaction position of the exanimated force. Thus, the measurement data ofthe torque sensor integrated in the seventh axis (M7) will be considered as acontrol variable to the designed feedback controller. The designed external forcefeedback controller calculates the pose-offset of the flange pose of the robot inorder to achieve the desired torque or torque interval. Thus, the offset of therobot pose is considered as control input of the controller.

Sensitive Winding 129
Fig. 5. A winding tool guiding the rubber profile
A comparison between the determined force and the measured torque valueswill be discussed in Sect. 3.3. When the linear winding is used, a small gap willbe developed at the ends of each winding layer due to the dimensions of thewinding tool. Thus, it is useful to divide the winding process into two types(see Fig. 6). The linear winding can only be implemented far from the endingof the winding layer. In contrast, winding by rotating the robot hand can beimplemented at the ends of each layer to avoid the developing of gaps.
Fig. 6. Subdivision of the winding process according to the type of motion of the robot

130 A. Kanso et al.
Linear Winding. When winding a complete layer on the cylinder, two typesof robotic movement must be used. At the ending of the cylinder, the tool mustbe tilted due to its dimensions. In between the end points, the winding of theprofile is realized with a purely linear movement of the tool along the Z axis of thecylinder coordinate system. The tool coordinate system conserves its orientationby linear winding.
Winding by Rotation. The tool must be tilted at the edges of the cylinderas described above. This is done exclusively by changing the orientation of theflange coordinate system with respect to the robot base coordinate system. Thus,the flange coordinate system conserves its position during winding. In contrast,the position of the TCP coordinate system of the winding tool is adjusted bymodifying the orientation of the flange coordinate system. Two different posesof the flange coordinate system are defined. The rotational part of the posevector changes from one pose to the other, whereas the translational ones remainidentical. The initial orientation and the desired orientation at the transitionpoint between the rotation and linear winding are defined. Starting with theinitial predefined orientation of the robot hand, the robot changes the orientationof its hand to achieve the desired orientation.
The robot controller represents the orientation of the robot hand using theEuler angles convention, specifically the roll-pitch-yaw convention. These anglesare well known in aerospace engineering and computer graphics [5]. These con-ventions are numerically unstable [6], moreover, they are inconvenient in practice[7].
The interpolation between the two predefined poses will cause an unpre-dictable path if the roll-pitch-yaw convention is used. Therefore, the interpola-tion must be implemented by the quaternion, so that the rotation is described bya rotation about only one axis in the space. A program is developed and imple-mented on the robot controller in order to convert the roll-pitch-yaw angles tothe four quaternion parameters and vice versa. The interpolation is firstly solvedat the quaternion level. Secondly, the quaternion parameters are converted backto the roll-pitch-yaw angles. Thirdly, the robot movement is implemented.
3.2 Feedback Control System
In terms of control engineering, an attempt was made to solve the complexwinding task by means of a simple closed control loop. The controlled systemis given by the part of the plant where the control element acts on a physicalquantity to be controlled (the controlled variable) [8]. In the presented case, thecontrolled variable is formed by the contact forces between the last two windingsof the rubber seals. The control element in the control loop is often a technicalsystem which influences the controlled system and thus the controlled variableby changing its output variable(s). This function is carried out here by theKUKA iiwa. By moving the robot flange or TCP parallel to the Z-axis of the rollcoordinate system, the force between the last two windings can be influenced.

Sensitive Winding 131
The robot pose is thus the manipulated variable for the control process. TheKuka iiwa also functions as a measuring system, which is able to measure andoutput both the torques in its seven axes and the forces acting on the flangeor TCP in a user-defined coordinate system. Therefore, a control based on thetorques and the forces is possible.
Since the influence of disturbance variables is significant in the winding pro-cess and the exact attainment of the reference variable is irrelevant, it was ini-tially decided to start with a simple P-controller and then to expand or modifyit as required. However, initial tests with this system showed early on that thewinding process does not function stably with only one simple P-controller. Thiswas therefore coupled with a three-point controller [9].
Fig. 7. Block diagram of the three-point controller
Three-point controllers are often used for temperature control, but are alsoused in the field of actuators. Here, they are used to switch between clockwiseand counterclockwise rotation [10]. Such a controller is also recommended forprocesses in which the controlled variable is subject to noise due to disturbancesaround the set point (reference variable) [10]. This characteristic should alsostabilize the presented winding process, which is permanently affected by dis-turbances due to the rotation of the winding roll. The resulting characteristic ofthe new controller is determined by multiplying the characteristic of the three-step controller by that of the P controller (see Fig. 7). The resulting dead bandaround the center (setpoint) of the characteristic serves to raise the responsethreshold of the controller. Therefore two reference inputs are defined depend-ing of the set point and the dead band. An oscillation of the process due to noiseor measurement uncertainties is also prevented by the hystereses included in thethree-point controller (see Fig. 8).
However, the process described here also works for the opposite direction.If the winding forces are too low, the controller calculates a correction of the

132 A. Kanso et al.
tool position using the P component P2 (<0). In this way, the current windingis again pressed more strongly against the last winding, which increases thewinding forces in turn.
In terms of quantity, P1 is significantly larger than P2. This is due to the factthat the disturbance variable (rotation of the roll, winding of the rubber) alwaysoccurs on one side only and the winding force is thus constantly increasing. Thecontroller must therefore react faster to reduce the winding forces than to buildthem up, which requires a larger P component.
Fig. 8. Resulting controller characteristic curve, composed of the three-point controllerand P controller
3.3 Measurement Concept
Robot systems are usually equipped with measuring systems to realize therequired tasks. The measuring tasks within the winding system can be dividedinto three groups: First, the monitoring of the external force/torque vector inorder to implement the required sensitivity; Second, the measurement of thecomponents and tools; Third, the monitoring of the winding process and the 3Dinspection of the winding image.
Requirements for the Measuring System (Force/Torque). Sensitivewinding requires an exact measurement of the external force/torque. The robotas a component of the process is set as the control unit of the control circuit.The monitoring of the external force/torque will be carried out by the torquesensors integrated in the LBR iiwa. These sensors are integrated in the jointsof the robot. The investigation of the LBR iiwa as a measuring robot in theassembly process for the detection of external force and torques is presented in[11]. The wound rubber profile causes a winding force along the rotation axisof the winding cylinder. This results in a torque around the seventh axis of therobot that can be detected by the integrated torque sensor. The resulting forcewith respect to the flange coordinate system is then determined in the KUKAcontroller based on the torque measurement of the 7th axis (see Fig. 9). Theseare model based calculations, in which the sensor data is filtered in the first step.The torque measurement data, on the other hand, is made available as unfilteredraw data.

Sensitive Winding 133
Fig. 9. Winding force acting on the tool
The robot will first move linearly from the left side of the hole to the rightside without the presence of the winding force. This path lies along the wind-ing cylinder and demonstrates a possible process path. Based on the TCP/IPconnection, an interface for the transmission of forces/torques and robot datais developed. For this dynamic case, the measured torques and the determinedforces are recorded as a function of the robot position. The result can be seenin Fig. 10. This shows that the measured torque values are noisy. Force values,however, are not noisy, but they show peaks in certain poses. The two data sets(forces and moments) are not constant along the path and depend on the robot’sposition. This creates a great need for a low-pass filter to smooth the noisy mea-sured torques and for a look-up table in order to compensate the instability inthe obtained data.
Fig. 10. left: Measured torque along the y-coordinate of the robot pose with respectto the base coordinate system; right: Determined force (y-coordinated) along the y-coordinate of the robot pose with respect to the base coordinate system
A Butterworth filter, 2nd order low pass filter, is used to smooth the data.The filter is written in Java and integrated into the Sunrise controller to filterthe measurement data. The resulting smoothed trace is shown in Fig. 11.
The peaks of the forces must also be considered. In addition, the dispersionof the determined data is monitored and graphically displayed. This shows thatthe dispersion at the peaks is very large (up to 14 N) (see Fig. 12). In this pose,the robot is closer to a singularity that is responsible for the inaccuracies of

134 A. Kanso et al.
Fig. 11. Integration of the low-pass filter to smooth the measured curve of the torque
the forces. The calculation of the forces is based on the kinematic and dynamicmodel of the robot. Thus, singluarities affect the precision of the aforementionedcalculations.
Fig. 12. left: Measured force; right: force inaccuracy
The accuracy of the determined data is also considered. For this purpose, amass is mounted on the tool by means of a cable via a deflection pulley. The robotagain moves along the previous path. The forces and torques are determined andcompared with the previous measurements regarding the robot position. A differ-ence is formed to determine the external loads. The difference curve is constantin the torque measurement. In contrast, the difference of the forces decreases(see Fig. 13) close to singularities. Therefore, the torque measurements are morestable and can be used as control variable. The external torque is determined asthe difference between the filtered measured torque and the relevant torque fromthe look-up table based on the robot pose. The external force is then determinedby multiplying the external torque with the lever arm.
Fig. 13. left: Measured force difference; right: Measured torque difference (filtered)

Sensitive Winding 135
Calibration of the Winding Cylinder. The measurement of robotic tools,sensors and objects with respect to the robot is a basic task that must be per-formed during commissioning or after reconfiguration of a robot system. Thedesigned tool must be mounted on the robot flange and measured with respectto the flange coordinate system. This is done by applying the 4-point method,which is defined in the KUKA controller. A Tool Center Point (TCP) must bedefined on the tool as the mechanical interface between the tool and the work-ing object [12]. The TCP is then moved four times from different orientations ofthe robot hand to a predefined measuring point. The position of the TCP withrespect to the flange coordinate system can then be determined using the leastsquares methods. The orientation of the TCP coordinate system is then freelyselectable.
The measurement of the work object is an essential part when developingrobotic applications. The measurement of the winding cylinder with respect tothe robot coordinate system is a prerequisite for the execution of the windingprocess. The geometry of the winding tool and the high accuracy requirementsin the winding process do not allow the measuring of the winding cylinder byteach-in procedure. This problem can be solved with the help of non-contactsensors such as a camera or a laser line sensor. In addition, non-contact sensorsoffer shorter commissioning times than the teach-in method. Furthermore, theresulting winding pattern must be monitored and evaluated. Gaps between twowound profiles and the superposition of two profiles must be detected and local-ized. This solves the inspection problem and is discussed in Sect. 3.3. Camerasencounter difficulties in solving this inspection task because the winding patternis a result of several black profiles. Therefore, the laser line sensor is used in thewinding process.
The winding cylinder is at first roughly positioned with respect to the robot.Then it is measured precisely. A cylinder is mathematically defined by a lengthand a circle. The latter is defined in 3D space by a center, a radius and a normalvector. The calibration error of the sensor, the manufacturing tolerances of thecylinder and the robot accuracy lead to the fact that the circle must be over-determined interpolated. This means that at least four positions are required tomeasure the circle. The points are measured by the laser line sensor. The robotmoves towards one of the two ends of the cylinder. The sensor is monitoringthe surface and sends a signal to the robot as soon as an edge is detected. Thisprocedure is repeated at least four times, but with different poses. The circle isfitted after collecting the measuring data of the edges. Then the position and theorientation of the circle with respect to the robot base is determined. After that,the robot moves in the opposite direction and stops as soon as the second edgeis detected. Then the length of the cylinder is determined. The best fit methodfor calibration the winding cylinder is briefly discussed in [13].

136 A. Kanso et al.
Fig. 14. Section of a winding image measurement series using the laser line sensor
Inspection. The quality of the winding process can be evaluated on the basis ofthe winding pattern. Larger gaps and overlaps should be avoided. The windingimage is recorded with the aid of a laser line sensor so that 2D laser measurementvalues are recorded at a specified time.
The translational speed of the profile is determined based on the windingspeed and the winding radius. The winding speed can be monitored by the robotcontroller. The winding radius is calculated from the shortest distance betweenthe robot position and the axis of the measured winding cylinder. The alreadywound length of the profile between two successive measurements is determinedby multiplying the translational speed by the time difference of the measure-ments. Thus, the 2D measured values can be extended to the 3D space andthe winding image can be visualized and analyzed in the 3D space. Since only asection of the rubber profile can be recorded in the static state due to the limitedmeasuring range of the laser line sensor, it is necessary to record the measure-ment data along the winding cylinder. For this purpose, the data is transformedfrom the sensor coordinate system into the robot base coordinates during thewinding movement. The basic prerequisite for the data transformation is a mea-surement of the sensor with respect to the robot flange coordinate system. Therobot sensor calibration problem is solved in [14]. The entire winding patternresults from the overlapping of the different winding areas (see Fig. 14). Thewinding pattern of each winding cylinder is documented. The defects can belocalized and quantified.
4 Implementation and Validation
A demonstration bench is developed at ZeMA to simulate the production processof the rubber profile and to realize the developed winding process. Figure 15shows the experimental setup, which can be described as follows: The KukaLBR iiwa hangs upside down on an L-shaped steel structure attached above thewinding cylinder.

Sensitive Winding 137
Fig. 15. The developed winding demonstrator at ZeMA
As a replacement for the manufacturing process, the rubber seal is unwoundfrom a second winding cylinder. The production process of the winding cylinderis then simulated. A dancer between the two rollers serves to synchronize therotational speeds of the two cylinders. Since this synchronization did not functioncorrectly at high rotational speeds, the rubber seal was also temporarily woundup from the floor in front of the roll. This in turn led to the unfortunate issue ofthe profile swinging back and forth during the tests. However, the influence of thisoscillation on the winding process could not be observed clearly. Nevertheless,the weight of the profile hanging down in this way causes a torque around the7th axis depending on the position of the robot. As a result, the reference inputof the feedback controller takes an offset into account.
Winding tests are then implemented in order to identify the process parame-ters, such as the proportional gains of the feedback controller, the dead band andthe hysteresis width. The winding image is recorded by a 2D Laser liner sensor(see Fig. 16). The generated image is then process by a Canny Edge detectionAlgorithm in order to localize the winding faults. The identification process ofthe process parameters and the results of the signal processing algorithm will bediscussed in future works.

138 A. Kanso et al.
Fig. 16. Winding image of the last layer, captured by laser line sensor and processedby a developed python programm
5 Summary and Outlook
The tests carried out have shown that it is feasible to wind the rubber seal onthe body side with the aid of the sensitive application developed. A methodologyhas been established for this purpose. This includes the efficient programming ofthe robot and the acquisition of the process data, which consists of the followingpoints: measuring the components, the tool and the sensor, designing a low-passfilter to filter the torque data and determining the look-up table of each plane.Moreover, linear winding is robust and could be implemented at higher speed.The winding at the cylinder edges (winding by rotation), on the other hand, ismore sensitive and can be implemented at lower speeds. The lower speed at theedges could be compensated by higher speeds in the linear range.
The automated winding of a complex edge protection profile represents anessential further development in the production of ‘endless’ sealing profiles. Thisresearch project is intended to ensure the basic feasibility of winding a rubberprofile with a complex cross-section. For this purpose, a test winder is designed,constructed and manufactured. The results of the investigations have shownthat even a complex cross-section profile can be winded using a sensitive robot.The concerns mentioned at the beginning could be largely dispelled, so thatdevelopment of the continuous seal on the body side can be taken further.
References
1. Feldmann, K., Schoppner, V., Spur, G., (eds.): Handbuch Fugen, Handhaben, Mon-tieren, volume/hrsg. von Gunter Spur; 5 of Edition Handbuch der Fertigungstech-nik. Hanser, Munchen, 2, vollstandig neu bearbeitete auflage edn. (2014)
2. Manning, T.A.: Tension control during the coil winding process. In: Proceedings:Electrical Insulation Conference and Electrical Manufacturing and Coil WindingTechnology Conference (Cat. No. 03CH37480), pp. 527–530 (2003)
3. Manning, T.A.: Special problems incurred when manufacturing coils with fine mag-net wire. In: Proceedings Electrical Insulation Conference and Electrical Manufac-turing Expo 2005, pp. 251–254 (2005)

Sensitive Winding 139
4. Lbr iiwa - kuka ag5. Diebel, J.: Representing attitude: euler angles, unit quaternions, and rotation vec-
tors. Matrix 58(15–16), 1–35 (2006)6. Corke, P.: Robotics, Vision and Control: Fundamental Algorithms in MATLAB R©
Second Completely Revised, vol. 118. Springer, Cham (2017). https://doi.org/10.1007/978-3-319-54413-7
7. Muller, R., Vette, M., Kanso, A.: Comparison of practically applicable mathemat-ical descriptions of orientation and rotation in the three-dimensional Euclideanspace. In: Schuppstuhl, T., Tracht, K., Franke, J. (eds.) Tagungsband des 3.Kongresses Montage Handhabung Industrieroboter. Springer Vieweg, Heidelberg(2018). https://doi.org/10.1007/978-3-662-56714-2 14
8. Zacher, S., Reuter, M.: Regelungstechnik fur Ingenieure. Springer FachmedienWiesbaden, Wiesbaden (2017). https://doi.org/10.1007/978-3-658-17632-7
9. Weber, D.: Regelungstechnik: Wirkungsweise und Einsatz elektronischer Regler.Expert Verlag, Renningen (1993)
10. Samsom, A.G.: Regler und regelstrecken11. Blum, A., Muller, R., Scholer, M., Kanso, A.: P3.6 untersuchung eines prozess-
roboters als messroboter in der montage. Tagungsband, pp. 774–780 (2019)12. Rechtlinie, V.D.I.: 2861 blatt 1: Montage-und handhabungstechnik; kenngroßen fur
industrieroboter; achsbezeichnungen (1988)13. Muller, R., Vette-Steinkamp, M., Masiak, T., Kanso, A.: Best-fit method for the
calibration of 3D objects using a laser line sensor mounted on the flange of an artic-ulated robot. In: Schuppstuhl, T., Tracht, K., RoSSmann, J. (eds.) Tagungsbanddes 4. Kongresses Montage Handhabung Industrieroboter, pp. 207–216. SpringerVieweg, Heidelberg (2019). https://doi.org/10.1007/978-3-662-59317-2 11
14. Park, F.C., Martin, B.J.: Robot sensor calibration: solving AX = XB on theEuclidean group. IEEE Trans. Robo. Autom. 10(5), 717–721 (1994)
Open Access This chapter is licensed under the terms of the Creative CommonsAttribution 4.0 International License (http://creativecommons.org/licenses/by/4.0/),which permits use, sharing, adaptation, distribution and reproduction in any mediumor format, as long as you give appropriate credit to the original author(s) and thesource, provide a link to the Creative Commons license and indicate if changes weremade.
The images or other third party material in this chapter are included in thechapter’s Creative Commons license, unless indicated otherwise in a credit line to thematerial. If material is not included in the chapter’s Creative Commons license andyour intended use is not permitted by statutory regulation or exceeds the permitteduse, you will need to obtain permission directly from the copyright holder.

High-Load Titanium Drilling Using an AccurateRobotic Machining System
Robert Brownbill1(B) , Philip Silk2 , Peter Whiteside1 , Windo Hutabarat3 ,and Harry Burroughes2
1 Electroimpact UK Ltd., Manor Lane, Hawarden, Deeside CH5 3ST, UK{robertb,peterw}@electroimpact.com
2 The Advanced Manufacturing Research Centre - The AMRC, University of Sheffield,Factory 2050, Sheffield S9 1ZA, UK
{p.silk,h.burroughes}@amrc.co.uk3 Department of Automatic Control and System Engineering, University of Sheffield,
Portobello Street, Sheffield S1 3JD, [email protected]
Abstract. Robotic drilling systems have been used in the manufacture of largeaerospace components for a number of years. Systems have been developed byseveral systems integrators in order to accurately drill materials from CFRP toTitanium. These systems, however, have been unable to achieve large diameterholes in Titanium due to reduced structural stiffness and end effector capabili-ties. Typically, large holes are either drilled using large cartesian CNC-controlledmachines or drilled using automated drilling units (ADU). However, there is a pullfrom aerospace OEMS to move away from large monolithic machines, in favourof flexible robotic system. Flexible robotic systems provide a number of benefitsfor large structure assembly. The following report primarily outlines drilling tri-als conducted on the Accurate Robotic Machining System, during which holesfrom 25 mm to 32 mm ID were drilled in titanium implementing an empiricaltest schedule. Additionally, a discussion on the benefits of drilling large diameterholes using flexible robotic platforms.
Keywords: Robotic drilling · Titanium drilling · Robotic drilling systems ·Large hole titanium drilling · Heavy Duty Robot · Accurate robotics
1 Introduction
Robotic drilling systems have been used in the manufacture of aerospace componentsfor a number of years. There have been systems developed to accurately drill materialssuch as Aluminium, CFRP and Titanium.
To the best of the authors’ knowledge, the largest hole drilled by a robotic drillingsystem in titanium was 1.0′′ (25.4 mm) in diameter, although this was also carried outunder research conditions. Aerospace production holes drilled through Aluminium withrobotic drilling systems currently don’t typically exceed 5/8th′′ (15.88 mm).
© The Author(s) 2021S. Ratchev (Ed.): IPAS 2020, IFIP AICT 620, pp. 140–152, 2021.https://doi.org/10.1007/978-3-030-72632-4_10

High-Load Titanium Drilling 141
To achieve the hole quality demanded by the aerospace industry, it has been typicalthat all ‘large diameter’ holes are either drilled using CNC-controlled machines, expen-sive bespoke Cartesian drilling machines or drilled manually using automated drillingunits (ADUs).
There are huge benefits to using a robotic drilling system over a typical machiningcentre. The current industry move to ‘flexible’ and ‘elastic’ automation cells means thatre-tasking or repurposing the automation is essential to ensuring the overall equipmenteffectiveness (OEE) is maximized through the simple change of the end-effector. This,in most cases, can easily be an automated process requiring no human interaction.
Robotic systems require much simpler civil engineering works and have a muchsmaller ‘footprint’ for the sameworking volume than that of a traditional gantrymachine.These benefits coupled with much shorter lead time and reduced overall cost provide astrong business case for investment into this technology.
These systems, however, have been unable to achieve large diameter holes due tothe inherent reduced structural stiffness of the robot arm coupled with the limited robotpayload. This has meant that end-effector capabilities are typically not up to the samestandard as Cartesian CNC Milling Machines.
Large diameter drilling using robots is also challenging due to the positional accuracyof ‘off-the-shelf’ robot arm being in excess of ±0.5 mm. One way to resolve theseproblems is by improvements to the feedback system, such as theElectroimpactAccuratepackage. This Accurate package enable the system to achieve a positional accuracy of±0.25 mm or better across the robot’s working volume. The increase in accuracy alsodoes not require external metrology equipment feedback. Additionally, this also ensurethe robotic system remains accurate for multiple processes, without the requirement forlocalised datum feature relocation or re-teaching of positions.
Further complications are seen during drilling, whereby the thrust force causes therobot arm to flex, especiallywhen the loads are close to the limits of the robot system. Therobot’s rigidity is not enough to prevent ‘skidding’ of the tool tip across the workpiece,which subsequently leads to damage, poor quality parts and hole being drilled far outsideof positional tolerances.
Skidding can also be prevalent of the robot nosepiece during clamp up process. Asthe load is increased through the robot arm - a typical systemwith no secondary feedbackare unable to compensate for the arm flex resulting in the nose-piece skidding on thestructure causing damage and requiring expensive rework. The additional scales andenhanced kinematic model guarantee the “anti-skid” technology.
The pressure foot allows the system to remain clamped to the component through-out the drilling cycle and even when full retract pecks are used, there is no danger ofmovement of the system.
Titanium is used in aircraft structures for high-strength applications in high-stressareas such as around the Engine Pylons and Landing Gear attachment points. Fastenersizes of up to 1.25′′ (31.75 mm) are commonly seen in long-haul aircraft wing structuresin these areas. During themanufacture of thesewing structures there is the requirement todrill a large number of different holes in multiple stack assemblies. Stack assemblies canconsist of multiple layers or ‘stacks’ of different materials including CFRP, Aluminium

142 R. Brownbill et al.
and Titanium. This assembly process ensures the drilled holes are concentric on finalassembly of the components (Fig. 1).
Fig. 1. AMRC accurate robotic machining system
The following report outlines drilling trials conducted using empirical methods onthe Accurate Robotic Machining System, during which holes from 25 mm to 32 mmdiameter were drilled in titanium.
2 Related Works
As the size of the assemblies grows, the cost of a traditional gantry-style machinebecomes less economical compared to that of a robotic system with the same capabil-ities [1]. Industry demand for the drilling of large-scale aerospace components, whichcontain titanium, has increased. Robotic drilling of titanium using serial robots has beenattempted but high compliance is a major challenge [2]. Ways to improve the accuracyof robots using auxiliary devices such as external feedback sensors have been proposed[3], but the use of such robots to drill high-load large-diameter holes is not found inliterature.
No such works have been found exploring the use of articulated robots for largehole drilling, without the use of external thrust-reducing mechanisms (such as vibrationassistance). No internal research was carried out within Electroimpact as there was, untilnow, no direct request from a potential Customer for that requirement. This paper takesthat Customer request and directly addresses their requirements, filling in the knowledgegapof all parties involves into the large-hole pure drilling capability of the robotic system.

High-Load Titanium Drilling 143
3 Accurate Robot Architecture
With the addition of secondary feedback, high-order kinematic model, and a fully inte-grated conventional CNCcontrol, robotic technology can nowcompete on a performancelevel with customized high precision motion platforms. As a result, the articulated armcan be applied to a much broader range of assembly applications that were once limitedto custom machines [4].
Although Electroimpact’s accurate upgrade is not the only way to increase robotaccuracy, it provides multiple advantages over systems such as real-time metrologyfeedback. As part of the upgrade process from ‘off-the-shelf’ robot to Accurate Robot,Electroimpact fits high accuracy external scales to every axis of the robot structure(Fig. 3). The Accurate Robot system is controlled via industry standard Siemens 840DslCNCwhich handles all controls requirements and offers a familiar interface to program-mers and operators. Drawing from common axis configuration in machine tool design,the robot arm is integrated by Electroimpact with patented secondary position sensorsat the output of each axis.
Electrical Cabinets
Operator Station
Machine BedTool Changer
RobotEnd-Effector
Fig. 2. AMRC factory 2050, ARMS cell layout
The upgrade significantly improves the system enabling calibrated to accuracies tobe below ±0.25 mm over a large global volume. This patented solution has broadenedthe range of applications for unguided industrial robots in the aerospace industry toinclude high-precision single and dual-sided drilling and fastening, accurate materialremoval (trimming, milling), and accurate robotic fibre placement [5] (Fig. 2).
The system implemented at theAMRCutilizes aKUKATitan as the base architecturebefore the electronics were upgraded with the Accurate Package.
The end-effector in this application is a fixed spindle with small quill axis (~60 mm)allowing for milling and drilling operations.

144 R. Brownbill et al.
Although globally, Electroimpact will guarantee accuracies of ±0.25 mm over therobot’sworking envelope, the compensation routinewas optimized for use in themachin-ing volume over the fixed bed, this has seen the accuracy (for this application) improveto around ±0.17 mm.
ARMS is unique as it is currently, the only one to utilize the Accurate Robot archi-tecture. The robot used has a large working volume and medium load (750 kg). Othermodels are available, with shorter reach, increasing the maximum payload but reducingthe working volume. Below, details are provided on the modifications carried out tocreate ARMS.
3.1 Kinematic Model
The Electroimpact kinematicmodel utilizes the secondary feedback of external encodersas well as the robot-specific data to greatly improve accuracy. The kinematic model isable to compensate the robots commanded position for the full working envelope andfull working payload of the robot, ensuring that the actual position of the tool-point isalways accurate even during high load process.
The patented kinematic model uses the dual feedback of the motor encoder posi-tions and high accuracy secondary scales to adjust the robots commanded position andcompensate for structural flex and deflections in the system due to loading.
The compensation routine carried out during installation, is also taken into accountin the kinematic model to ensure that the robot is not only highly repeatable but, moreimportantly, highly accurate within the global reference system.
External Axis Scale
Fig. 3. External axis scale (secondary feedback) showing the encoder strip to gain an accurateposition of each joint.
The enhanced kinematic model takes into account the moments of inertia, gravityloads of the arm sections, payload droop and applied (clamp) force deflections to updatethe Siemens built-in robot kernel for motion. This enables accuracy across the entireworking volume. If required, the ‘working volume’ can be reduced and more data takenover a smaller volume to optimise and improve the accuracy of the system to suit a

High-Load Titanium Drilling 145
specific application. For ARMS, the accuracy package was optimised over the machinebed working volume.
The deflection model, measured by the scales, allows for real-time compensationfrom external forces. This uses the control system to effectively remove the backlasheffects and gives an (almost) infinitely stiff axis. This will also mean that accuracyand repeatability is greatly improves through an omni-directional routine, rather thanapproaching a datum point from the same approach direction. Figure 4 shows a real-timesnapshot of the commanded versus actual/measured position for the robot system.
Fig. 4. Kinematic model deflections
3.2 Spindle
The spindle chosen by the AMRC was GMN HCS 280 – 18000/60. This was the largestspindle available at the time fromGMNallowing for thewidest range of capabilities fromthis system. For a Research Technology Organization (RTO), testing on this system willallow research partners and companies to monitor different parameters (such as spindletorque and thrust load) and enable them to size their own systems appropriately.
3.3 Pressure Foot
A removable pressure foot was included in the system to allow for advanced drillingoperations. Although the accuracy and effective rigidity of the robot is greatly increaseddue to the accurate package, it is not sufficient to cope with drilling/peck loading. There-fore, a pressure foot is used to apply pre-load to the workpiece. This preload shouldbe greater than the peak drilling thrust load to prevent movement of the end-effectormid-cycle. Load cells within the pressure foot allow the robot to clamp to a user-definedpreload.

146 R. Brownbill et al.
Drill thrust load is alsomonitored and should the thrust load exceed a certain percent-age of the preload, the CNC will display an alarm – stopping the cycle and preventingdamage to the workpiece.
Although active normality correction is common on specific drilling system, there isno such feedback on ARMS. There is only passive normality correction of the pressurefoot by means of a swivel nose piece of “cup and cone” type design.
A proximity switch ensures that the controller is aware of the fitment of the pressurefoot to prevent collisions and damage to the system.
3.4 Additional Sensors/Data Sources/Systems
The system uses additional sensors to ensure better part quality. There are load cells thatallow the controller to measure the pressure foot applied force (clamp force). This forcecan be adjusted as per the user requirements.
There is a laser distance measurement that measures the distance travelled by thepressure foot and controller uses this data to adjust point the drilling tool centre pointfor the top of stock measurement.
Built into the spindle is a high-accuracy displacement sensor. This is vital andrequired for the best part quality. As the spindle heats up, the thermal expansion ofthe components results in a Z shift that must be accounted for in the controller.
There are also thru-bit and flood coolant system on the end-effector. These wererequired for the titanium drilling processes. These provide a superior finish on advancedmaterial compared toMQL. Although, the systemmay be adapted through minor designalterations to accept an MQL unit. The coolant may be disabled, and compressedair diverted to enable an air-blast cooling. The flexibility to choose the coolant tech-nique allows the AMRC and ARMS to tailor their research to suit each clients desiredapplication.
3.5 Programmable Drilling Parameters
Up to 16 separate parameters can be adjusted during a drilling procedure in order tooptimise the process. The parameters fall under one of the following categories.
• Feeds and speeds: RPM, mm/rev, mm/min• Peck cycle: distance and number of pecks• Allowable spindle thrust force: max/min• Auxiliary services: Coolant, air blast• Pressure foot load
4 Industrial Applications
As previously mentioned, robotic drilling solutions have been used in the aerospaceindustry for a number of years. The robotic systemdesigned and integrated into aerospaceproduction facilities up to date have only had the capability to drill hole which do not

High-Load Titanium Drilling 147
exceed 5/8th (15.88 mm) in diameter. However, across aerospace facilities there arerequirements to drill large holes.
Electroimpact have previously commissioned systems such as Gear Rib AutomatedWing Drilling Equipment (GRAWDE), which have been designed to drill holes upto 1.25 inch (31.75 mm) diameter in the A380 gear rib. This system however, is aCartesian machine and as such as limited flexibilities and a fix role. A similar Cartesiansystem produced by Electroimpact, the Horizontal AutomatedWing Drilling Equipment(HAWDE), allows for the drilling of wing assemblies with working envelopes of 42 m×8 m × 2 m [6]. The system is able to accurately position a drilling tool with 5 degrees offreedom. These cartesian systems highlight the need for large volume drilling systemscapable of drilling larger holes. Other such cartesian systems have been utilized on otherwing-box assembly lines for the latest generation aircraft programs frommultiple globalmanufacturers.
Although, both systems (GRAWDE, HAWDE) are able to meet the drilling require-ments of Airbus, they have been specifically designed for their roles. As such the reuti-lisation of such machinery is difficult and now that the production of the A380 has stopthe machinery is likely to be decommissioned, with no further use. Robotic systems areable to provide an alternative to this issue, as reutilisation a capable with the change/redesign of an end effector.
Developmental robotic systems such as ARMS at the AMRC demonstrate how suchrobotic architecture can achieve comparable large-hole drilling capability to the moreexpensive and constrained cartesian-machine counterparts.
5 Experimental Methods
ARMS was used to assess the feasibility of using an Electroimpact Accurate Robot todrill aerospace production holes in high-load areas of the aircraft structure. Althoughmetric drills were used, sizes were chosen to best match the equivalent imperial sizesthat would be typical of a production system.
Coupons of 45 mm thick 6Al4V Titanium were prepared to fit in a machinist vice.The test schedule was created to evaluate the system’s capabilities with increasing holediameter through the following sizes:
a) 27.5 mm One Shotb) 28.5 mm Ream (from 27.5 mm Downsize Hole)c) 29.5 mm One Shotd) 32.0 mm One Shot
Tests (a) & (b) are representative of a production hole. It was noted that reamingthrust loads and drill torques were much less than the one-shot pre-ream drill cycle.Therefore, tests (c) & (d) were not reamed. Capability to drill 32.0 mm one-shot hole isrepresentative of a 1¼′′ production hole.
Although in most industrial applications a solid carbide twist drill would be used todrill these holes, for the purposes of these drill trials, a Guehring RT800 3D tipped drillwas used as a cost-effective, representative example. The benefit of being able to quickly

148 R. Brownbill et al.
change the RT800WP (carbide, FireEX coated) drill tip meant the tool didn’t need to bereset in the holder and length re-measured for each size change – drastically speeding upthe testing process. The use of this tipped drill will provide a good baseline for feasibilitystudies for industrial applications, typically, tipped drills require more torque and morethrust loading than their solid carbide counterparts.
Furthers trials, around 12 months later, were carried out using a 27.54 mm diametersolid carbide twist drill, provided by an Industrial partner to prove process capability.It was observed that the drill thrust loads were approximately 10–20% lower using thesolid carbide twist drill over the tipped cutter.
Successful cycleswere runwith spindle speed ranges of 100–250RPMand feed ratesof 0.09 – 0.17 mm/rev. Clamp load was close to the robot’s maximum. A peck-drillingcycle was used with flood and thru-bit coolant active.
A 3-axis Dynamometer was used to measure drilling forces and monitor the processfor excessive vibrations. The vice was mounted to the dynamometer interface plate andforces in three dimensions measured.
Hole quality inspected using a CMM at Electroimpact’s facility along with a surfaceroughness indicator.
As ARMS doesn’t have local normality correction (as a production drilling robotwould have) and the titanium coupons were not perfectly flat, perpendicularity to the topsurface of the coupon was not as important as the hole-vector parallelism between allholes on the coupon. This was measured to assess if the drill had a tendency to ‘wander’away from the thrust axis.
The edge of the coupon was water cut from a larger titanium plate. With no datumfeature, hole position was measured relative to the first hole given the programmed holespacing.
6 Results and Discussion
The Accurate RoboticMachining Systemwas capable of drilling all the holes as detailedin the testing schedule to a very high standard, suitable to meet a typical aerospacemanufacturers machine specification (Fig. 5).
The tipped drill has ‘h7’ tolerance and was used as the reaming tool. Although notindicative of an industrial process, all drilling parameters were observed to be wellwithin the capabilities of the system. It was, however, observed that carrying out a ‘rapidretract’ once the reaming cycle was completed left a spiral score mark within the hole– this could be solved by feeding the tipped drill back out of the hole or using a specificmachine reamer.
Testing was repeated during a second session using a tipped machine reamer atthe 28.5 mm diameter (reaming from 27.5 mm downsize diameter) along with drillingusing a full-length solid carbide production cutter. Limited cycles were run using thesecutters to reduce unnecessary wear. Eight holes were drilled 27.5 mm one shot, threewere reamed thru and one was partially reamed (to measure concentricity – the systemsability to return to the same hole). The scoring that can be seen in hole #1 (top right)was due to a rapid retract command as part of the ream cycle – this was then changed toa feed retract on the subsequent two and a half holes and excellent surface finish resultswere seen (Fig. 6).

High-Load Titanium Drilling 149
Fig. 5. 32.0 mm test coupon a (guehring tipped drill)
Fig. 6. Production cutter coupon drill and ream holes (holes 1,2,3: One-shot drill 27.5 mm &Ream 28.5 mm, hole 4: Partial ream, holes 5,6,7,8: One-shot drill 27.5 mm)
6.1 Dynamometer Results
Good, consistent resultswere seen during the drilling processwith no unwanted vibrationobserved (Fig. 7).

150 R. Brownbill et al.
Fig. 7. Dynamometer force results
6.2 Hole Quality
Results were collated from 48 holes (in six coupons) as detailed in the test schedule. Theabove table of results is the range observed across all coupons and would meet a typicalAerospace Industry specification for holes of this diameter (Table 1).
Table 1. Collated results of the trial using tipped cutters.
Quality metric Result
Hole position ±0.25 mm
Diameter (drill) +0/+46 µm
Diameter (ream) −23/−18 µm*
Hole cylindricity 47 µm
Hole vector parallelism (to Hole 1) 0.15 mm
Hole surface finish quality (drill) <1.4 µm Ra
Hole surface finish quality (ream) <0.8 µm Ra
*Measurements fall within the tolerance band of the‘h7’ cutter.
In all cases, ARMSwas able to achieve the 32.0 mm (1.260′′) diameter holes, drilledone-shot through Titanium. Spindle torque loading was not observed to exceed 50%throughout drilling cycles, with no greater than 25% torque observed for the reamingcycles (Table 2).
The results from the limited trial of the production cutters and reamers show theimprovements in cylindricity, surface finish quality and vector parallelism as expected

High-Load Titanium Drilling 151
Table 2. Collated results of the trial using production cutters (27.5 mm/28.5 mm diameters only).
Quality metric Result
Hole position ±0.25 mm
Diameter (drill) −3/ +10 µm
Diameter (Ream) 0/−+3 µm
Hole cylindricity (Ream) 16 µm
Hole vector parallelism (to Hole 1) 0.019 mm
Hole#4 Concentricity (Drill/ream)Hole surface finish quality (drill)
0.026 mm<1.3 µm Ra
Hole surface finish quality (ream) <0.45 µm Ra
from the use of a solid carbide cutter. The increased stiffness of the tools and use of areaming cutter far exceeded the production requirements that were being assessed.
Spindle torque values were observed to be comparable to that of the tipped cutterswith a minor increase for the first drilled holes, as this was a brand-new cutter. Torquevalues were observed to return to those observed previously after the second hole.
The limiting factor throughout these trials was the pre-load clamp force available tocounter the drill thrust loading. This was close to the Robot’s maximum for the largestholes drilled.
7 Conclusions
Confidence has been proven that the Electroimpact Accurate Robot architecture is capa-ble of meeting aerospace production requirements for high-load fastener holes of up to1¼′′ diameter. However, this has been conducted, both in a favourable Robot pose andunder research condition.
ARMS is reaching the limits of its advanced material drilling capability due to thelimits of the clamping pre-load available. Should the drilling of larger holes be required,additional measures to reduce drill thrust load would be necessary.
The Electroimpact Accurate Robot package providing the controls-based stiffnesshas enabled this system to do something previously thought not possible.
The focus of future work will be to reduce the clamp up and thrust force required toproduce a large diameter hole in Titanium, primarily through process optimisation. Thiswill allow large diameter holes to be drilled where fixturing, orientation and access arenot optimum or vary in the case of production setups.
Acknowledgements. We gratefully acknowledge the support of Royal Academy of Engineering,Advanced Manufacturing Research Centre, Electroimpact UK Ltd, The University of Sheffield,HVM Catapult and Aerospace Technology Institute.

152 R. Brownbill et al.
References
1. Verl, A., Valente, A., Melkote, S., Brecher, C., Ozturk, E., Tunc, L.T.: Robots in machining.CIRP Ann. 68(2), 799–822 (2019)
2. Kim, S.H., et al.: Robotic machining: a review of recent progress. Int. J. Precis. Eng. Manuf.20(9), 1629–1642 (2019)
3. Bi, S., Liang, J.: Robotic drilling system for titanium structures. Int. J. Adv. Manuf. Technol.54(5), 767–774 (2011)
4. Saund, B., DeVlieg, R.: High accuracy articulated robots with CNC control systems. SAE Int.J. Aerosp. 6(2), 780–784 (2013)
5. DeVlieg, R.: Accurate robot technology (2019). https://electroimpact.com/Products/Robots/Overview.aspx. Accessed on 19 Dec 2019
6. Calawa, R., et al.: HAWDE Five Axis Wing Surface Drilling Machine (2004). https://www.electroimpact.com/WhitePapers/2004-01-2806.pdf. Accessed on 29 July 2020
Open Access This chapter is licensed under the terms of the Creative Commons Attribution 4.0International License (http://creativecommons.org/licenses/by/4.0/), which permits use, sharing,adaptation, distribution and reproduction in anymedium or format, as long as you give appropriatecredit to the original author(s) and the source, provide a link to the Creative Commons license andindicate if changes were made.
The images or other third party material in this chapter are included in the chapter’s CreativeCommons license, unless indicated otherwise in a credit line to the material. If material is notincluded in the chapter’s Creative Commons license and your intended use is not permitted bystatutory regulation or exceeds the permitted use, you will need to obtain permission directly fromthe copyright holder.

Application of Advanced Simulation Methodsfor the Tolerance Analysis of Mechanical
Assemblies
Konstantinos Bacharoudis(B) , Atanas Popov , and Svetan Ratchev
University of Nottingham, Nottingham NG7 2RD, [email protected]
Abstract. In the frame of a statistical tolerance analysis of complex assemblies,for example an aircraft wing, the capability to predict accurately and fast spec-ified, very small quantiles of the distribution of the assembly key characteristicbecomes crucial. The problem is significantly magnified, when the tolerance syn-thesis problem is considered in which several tolerance analyses are performedand thus, a reliability analysis problem is nested inside an optimisation one in afully probabilistic approach. The need to reduce the computational time and accu-rately estimate the specified probabilities is critical. Therefore, herein, a systematicstudy on several state of the art simulation methods is performed whilst they arecritically evaluated with respect to their efficiency to deal with tolerance analysisproblems. It is demonstrated that tolerance analysis problems are characterisedby high dimensionality, high non-linearity of the state functions, disconnectedfailure domains, implicit state functions and small probability estimations. There-fore, the successful implementation of reliability methods becomes a formidabletask. Herein, advanced simulationmethods are combinedwith in-house developedassembly models based on the Homogeneous Transformation Matrix method aswell as off-the-self Computer Aided Tolerance tools. The main outcome of thework is that by using an appropriate reliability method, computational time can bereduced whilst the probability of defected products can be accurately predicted.Furthermore, the connection of advancedmathematical toolboxeswith off-the-self3D tolerance tools into a process integration framework introduces benefits to suc-cessfully deal with the tolerance allocation problem in the future using dedicatedand powerful computational tools.
Keywords: Tolerance analysis · Uncertainty analysis · Monte Carlo simulation ·Stratified sampling techniques · Assembly design
1 Introduction
Lowvolume, high-valuemechanical assemblies e.g. an aircraftwingneeds a strict dimen-sionalmanagement procedure in place in order to control andmanage variation stemmingfrom the various manufacturing processes to fabricate the parts as well as to assemblethem and form the final product. This task is quite critical and should be treated at theearly stage of the design process in order to ensure functionality, high performance and
© The Author(s) 2021S. Ratchev (Ed.): IPAS 2020, IFIP AICT 620, pp. 153–167, 2021.https://doi.org/10.1007/978-3-030-72632-4_11

154 K. Bacharoudis et al.
low manufacturing costs of the designed product. The main core of any dimensionalmanagement methodology is the ability to perform tolerance analysis and synthesisat the early design stage and thus, to predict the variance or the entire distribution ofspecified assembly key characteristics (AKC) as well as to optimise and allocate designtolerances for the assembly features in the various parts by minimising manufacturingcost. For the latter case, several studies have been performed, e.g. in [1], in which theoptimisation problem in most of the cases was formulated using mainly one objectivefunction, the manufacturing cost, and constraint functions based on the worst case erroror on the root sum square variance of the AKC. Both formulations are given by
�A = ∂f
∂d1t1 + ∂f
∂d2t2 + · · · + ∂f
∂dntn (1)
σA =√(
∂f
∂d1
)2
σ 2d1
+(
∂f
∂d2
)2
σ 2d2
+ . . .
(∂f
∂dn
)2
σ 2dn
(2)
where the AKC is denoted by A and it can be expressed as a function of the contributorsdi, i.e. other dimensions on the parts of the assembly formulating the tolerance chain,as A = f (d1, d2, . . . , dn). The function f corresponds to the assembly model. ∂f
∂diis the
sensitivity of the AKC to the contributors di, ti is the tolerance i.e. the range that onedimension di can fluctuate about its respective nominal value dι and σ 2
diis the variance of
contributor di used in statistical tolerancing. Usually, in statistical tolerancing, the con-tributor can be expressed as a random variable with mean value the nominal dimensionvalue dι and standard deviation defined such that N-sigma standard deviations to resultin the tolerance range, i.e. ti = Nσdi . This N-sigma standard deviation spread is alsoknown as the natural tolerance range. Furthermore, considering geometrical tolerances,ti can be associated with more than one random variables, for example the positionaltolerance of a hole which is generally a function of two parameters, i.e. the magnitudeand the angle of the positional vector, that gives the location of the varied centre of thefeature with respect to (wrt) the feature frame in the nominal form. It is important tohighlight that, in the case of Eq. (2), the estimation of the variance of the AKC assumesa linearization of the assembly function f whilst the probability distribution of the AKCis not taken into account in the estimation.
In an attempt to consider more statistical information about the AKC as well as theactual type of the assemblymodel function to the tolerance synthesis problem, constraintfunctions of the optimisation problem can be expressed based on the probability ofdefected products i.e. products that cannot meet the specification limits. Lending theterminology from the structural reliability analysis field, the tolerance synthesis problemthus, can be formulated as a Reliability-Based Optimisation (RBO) problem [2], itsgeneral form is given by
minimise C(t)subject to PD
[gj(xm, di(t), SLs) ≤ 0
] ≤ Pt, j = 1, ..,m(3)
where t is the vector of the design variables of the problem either deterministicparameters or random variables. For the tolerance synthesis problem, it corresponds to

Application of Advanced Simulation Methods 155
the dimensional or geometrical tolerances on the features of the various parts and aredeterministic variables. C(t) is the objective function to be minimized and has beenmainly established by the manufacturing cost of the product including cost-tolerancerelationships for every applied tolerance. PD is the probability of defected products i.e.the probability of the event that the variation of the specified assembly key characteristic(AKC) do not conform to the specification limits, SLs, gj(xm, di(t), SLs) stands forthe limit state functions i.e. the relationship between the AKC and the specificationlimits, SLs. It is reminded that AKC is a function of the random variables d1, d2, . . . , dnand the design parameters t i.e. applied tolerances. The mathematical formulation ofthe limit state functions can be an explicit mathematical expression or can be givenimplicitly e.g. by the use of a Computer Aided Tolerance (CAT) tool. Pt is the targetprobability of defected products and is usually calculated by the yield, i.e. the probabilityof the complementary eventwhich generally equals to 99.7% following six-sigma qualityapproach. xm is the uncertainty to which may some of the model parameters can besubjected to.
It is clear from the formulation of Eq. (3) that tolerance synthesis is an optimizationproblemwith a nested reliability analysis problem in it, in which PD should be estimatedfor every specified AKC in every iteration of the optimization algorithm. Currently,state of the art commercial CAT tools, e.g. 3DCS [3], use Crude Monte Carlo (CMC)simulation to perform the tolerance analysis. It is already common that crude MonteCarlo method can become very time consuming when estimation of small probabilitiesis involved. This probably explains the fact that tolerance synthesis is still treated incommercial CAT tools by using linearized assembly models and linear optimisationtechniques e.g. in [3]. The problem of tolerance allocation becomes computationallyvery demanding whilst both appropriate optimization and reliability methods should beused to successfully deal with complex assemblies.
Thus, the focus of this work is on the tolerance analysis and the fast and accurateestimation of PD using advanced simulation methods. A lot of work has been performedtoward the development of advanced reliability techniques [4], nevertheless, mainlyin the field of the structural reliability analysis rather than on the tolerance analysisfield. Reliability methods can be categorized as approximate or gradient-based methods,simulation techniques and metamodeling based methods. It is interesting to notice thatfew of these methods have been implemented into the tolerance analysis field e.g. in [5]or more recently [6] whilst a systematic study needs to be carried out for their successfulimplementation in the field.
Therefore, in this work, state of the art reliability methods are explored in order toidentify either themost suitable one or the gaps for further development of the probabilis-tic methods applied to this type of problem. Three simulation methods, namely the LatinHypercube sampling technique (LH) [7], Quasi Monte Carlo simulation using Sobol’ssequences (QMCS) [8] and the Subset Simulation method (SS) [9] are implemented tosolve a tolerance analysis problem. The three methods are evaluated in terms of speedand accuracy against crude Monte Carlo simulation predictions. Initially, the case studyis presented for an assembly consisted of two parts adopted from [10]. Although theexample is elementary, it is adequate to highlight all the difficulties introduced in the

156 K. Bacharoudis et al.
estimation of the probability of defected products PD. The rationale behind the selec-tion of LH, QMCS and SS is explained by thoroughly examining the characteristics ofthe limit state function of the problem. A second case study is analysed in which thedevelopment of the assembly models is accomplished by building appropriate modelsusing the commercial CAT software, 3DCS variation analyst. The ability to speed up theprobability estimation of existed CAT tools using collaboratively off-the-self statisticaltools gives the benefits to exploit the capabilities of each software to the maximum.That is, very complex assemblies can be analysed using professional CAT tools takingadvantages of advanced mathematical toolboxes to implement the reliability analyses.This is the first step to establish a process integration and design optimization frameworkin order to deal with the more complex problem, the tolerance allocation one.
2 Tolerance Modelling
2.1 Case Study
Two examples were considered in this work to study and prove the efficiency of theselected reliability methods for tolerance analysis problems. More specifically, the firstassembly was adopted from [10] and concerns a simple arrangement of two parts ona fixture. The assembly sequence and indexing plan has been thoroughly presented in[10].
1’
a’
hole
slot
Part A
Fixture
Part B
Pin
M1
F2
Gx
yz
Pin
hole
Ax
yzF
x
yz
AKC
O xy
z
Sz
x
y
Fig. 1. Case study 1: two parts on a fixture along with the established frames and the AKC
The AKC of interest is depicted in Fig. 1 and comprises the distance between pointM1 in part A from the surface F2 in part B. Variation was introduced by assumingpositional tolerances for every assembly feature in the two parts and the fixture. In totaleight tolerances were considered. The tolerance values were taken the same for all thefeatures and are presented in Table 1.
For the second case study in which a 3DCSmodel has been built, a simple product oftwo parts was studied again. The two parts are presented in Fig. 2. The AKC is definedby the distance of the point M1 in part A to the surface F2 in part B. This example

Application of Advanced Simulation Methods 157
Table 1. Tolerance specifications for the parts/fixture, first case study
ID Parts Tolerance zone Value [mm]
tpos Part A/PartB/Fixture
Circular 0.4
is quite similar to the first one. It is presented, however, in order to test the successfulimplementation and collaboration of advanced reliabilitymethodswith commercial CATtools defined by implicit limit state functions. Positional tolerances were assumed forall the holes with a value given in Table 1.
AKC
Part A
Part B hole
hole
M1F2
F1
Fig. 2. Case study 2. Two pats forming the assembly in exploded view along with the definedAKC
2.2 Assembly Models
Assemblymodels were developed for both case studies. For the first example, themodelswere based on thematrix transformationmethod [11] and thus,mathematical expressionswere formulated and programmed into MATLAB [12]. Briefly, an assembly can bedescribed as a chain of frames [11] among the assembly features of the various partsusing homogeneous transformation matrices (HTM). An HTM is defined by
Tij =[Rij pij0T 1
](4)
where Rij is the 3 × 3 rotation matrix and pij the 3 × 1 translation vector. Variationis introduced using the Differential Transformation Matrix (DTM) [11] by multiplyingthe homogeneous transform Tij by
T′ij = TijDT j (5)

158 K. Bacharoudis et al.
where DTj is given by
DTj = I4×4 +
⎡⎢⎢⎣
0 δθ z δθy dx−δθ z 0 −δθx dy−δθy δθx 0 dz0 0 0 0
⎤⎥⎥⎦ (6)
where δθx, δθy and δθ z small rotations and dx, dy and dz small translations wrt framej representing variation from the nominal form. It can be shown that the AKC specifiedin Fig. 1 is a function of two homogeneous transforms given by
TvarGO = TGFTSFTF1′DT 1′T1′a′
(TAa′DTa′
)−1(TOA)−1 (7)
and
TvarGK = TGSTSFTF2′DT 2′T2′b′
(TBb′DTb′
)−1(TKB)−1 (8)
where TGS the homogeneous transform from the reference fixture frame S to theglobal frame G, TSF the homogeneous transform from the auxiliary frame F to thereference fixture frame S, TF1′ the homogeneous transform from the compound frame
1′to the auxiliary frame F, T1′a′ the homogeneous transform from the compound frame
on part A, a′, to the compound frame on fixture, 1
′, TAa′ the homogeneous transform
from the compound frame a′to the auxiliary frame A, TOA the homogeneous transform
from the auxiliary frame A to the reference frame A of part A and finally DT 1′ andDTa′ the DTMs that take into account variation in the position of the features on thefixture and the part A respectively. For Eq. (8), transformation matrices are similar tothe ones presented for part A by interchanging frames 2
′, b
′, B and K with 1
′, a
′, A and
O respectively. An in depth discussion about the derivation of the assembly models canbe found in [10]. It is important to notice that the AKC is a function of the imposedpositional tolerances expressed by the definition of the DTMs. The interpretation ofgeometric tolerances into the appropriate DTMmatrix format was performed accordingto [13].
For the second example, 3DCS variation analyst has been used to build implicitlythe assembly model defining appropriate features, moves, tolerances and measures.
2.3 Probability of Defected Products and Limit State Function
An example of the probability of defected products, that is, the products that do notconform into the specification limits can be observed in Fig. 3. It corresponds to the areabelow the red curves at the tails of the histogram plot and is defined by
PD = P(LSL > A ∪ USL < A) = P(g1 = A − LSL < 0) + P(g2 = USL − A < 0)(9)
USL is the Upper Specification Limit and LSL is the Lower Specification Limit usu-ally determined by customer requirements. Generally, the requirement for the assembly
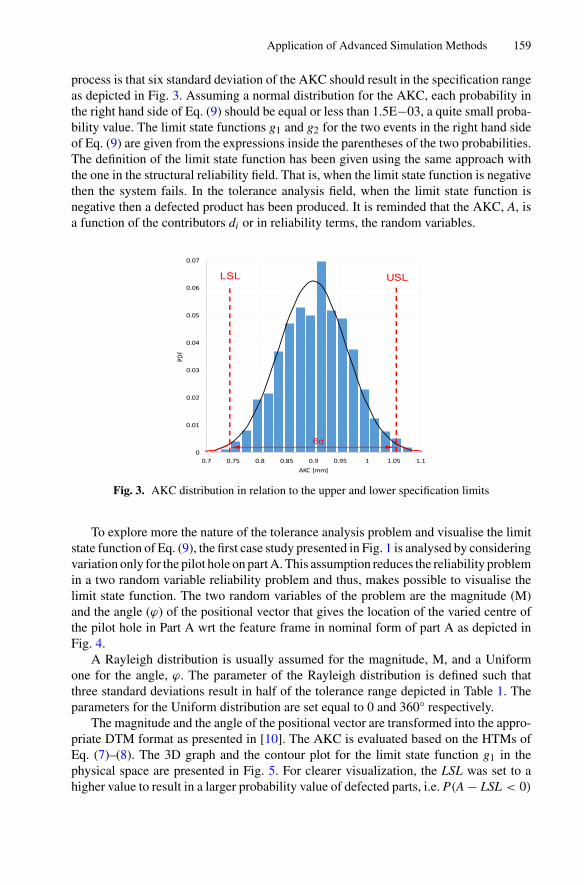
Application of Advanced Simulation Methods 159
process is that six standard deviation of the AKC should result in the specification rangeas depicted in Fig. 3. Assuming a normal distribution for the AKC, each probability inthe right hand side of Eq. (9) should be equal or less than 1.5E−03, a quite small proba-bility value. The limit state functions g1 and g2 for the two events in the right hand sideof Eq. (9) are given from the expressions inside the parentheses of the two probabilities.The definition of the limit state function has been given using the same approach withthe one in the structural reliability field. That is, when the limit state function is negativethen the system fails. In the tolerance analysis field, when the limit state function isnegative then a defected product has been produced. It is reminded that the AKC, A, isa function of the contributors di or in reliability terms, the random variables.
0
0.01
0.02
0.03
0.04
0.05
0.06
0.07
0.7 0.75 0.8 0.85 0.9 0.95 1 1.05 1.1
AKC [mm]
USLLSL
6σ
Fig. 3. AKC distribution in relation to the upper and lower specification limits
To explore more the nature of the tolerance analysis problem and visualise the limitstate function of Eq. (9), the first case study presented in Fig. 1 is analysed by consideringvariation only for the pilot hole on partA. This assumption reduces the reliability problemin a two random variable reliability problem and thus, makes possible to visualise thelimit state function. The two random variables of the problem are the magnitude (M)and the angle (ϕ) of the positional vector that gives the location of the varied centre ofthe pilot hole in Part A wrt the feature frame in nominal form of part A as depicted inFig. 4.
A Rayleigh distribution is usually assumed for the magnitude, M, and a Uniformone for the angle, ϕ. The parameter of the Rayleigh distribution is defined such thatthree standard deviations result in half of the tolerance range depicted in Table 1. Theparameters for the Uniform distribution are set equal to 0 and 360° respectively.
The magnitude and the angle of the positional vector are transformed into the appro-priate DTM format as presented in [10]. The AKC is evaluated based on the HTMs ofEq. (7)–(8). The 3D graph and the contour plot for the limit state function g1 in thephysical space are presented in Fig. 5. For clearer visualization, the LSL was set to ahigher value to result in a larger probability value of defected parts, i.e. P(A − LSL < 0)

160 K. Bacharoudis et al.
Nominal hole
Tolerance zone
Variedhole
++
φΜ
+ centre of varied hole
+ centre of nominal hole
Fig. 4. Nominal and varied form of pilot hole assuming circular tolerance zone
greater than 1.5E−03. Additionally, only two contour lines were plotted in Fig. 5 whilstthe axis limits were modified appropriately.
Failure domain
Fig. 5. 3D graph and contour plot of the limit state function g1
It is interesting to notice that the limit state function is a non-linear/non-convexfunction even for this simple example that involves just one geometrical tolerance. Thisis due to the sin and cos function of the angle component when describing the positionaltolerance in Fig. 4. Furthermore, the failure domain i.e. the design space where thelimit state function becomes negative, consists of several disconnected areas as can beseen in Fig. 5. Thus, to summarise the characteristics of the statistical tolerance analysisproblem, they are distinguished by the estimation of small probability values, involvinga moderate to high number of random variables when considering complex assembliesin which tens of tolerances will be included in the tolerance chain of the AKC, exhibitinghighly non-linear limit state functions as well as disconnected failure domains.

Application of Advanced Simulation Methods 161
3 Advanced Simulation Methods
In order to select an appropriate reliability method and successfully implemented it tosolve the tolerance analysis problem all the aspects discussed in Sect. 2.3 should beconsidered and addressed to some point. All the above mentioned observation make thistask quite difficult.
The estimation of the probabilities in Eq. (9) is equivalent to the computation ofspecific integrals. That is, generalising the problem, the probability of the event that thelimit state function g(X) is negative can be obtained by:
P(g(X) ≤ 0) =∫x∈F
fX (x)dx =∫x∈R
Ig(x)≤0(x)fX (x)dx (10)
where X is the vector of random variables (i.e. herein, the contributors di) with jointprobability density function fX and Ig(x)≤0(x) the indicator function inwhich Ig(x)≤0(x) =1 if g(x) ≤ 0 and Ig(x)≤0(x) = 0 otherwise and F = {g(X) ≤ 0} the failure domain.
Due to the disconnected failure domains of the tolerance analysis problem depictedin Fig. 5, typical gradient-based reliability methods e.g. the First or Second Order Relia-bility Methods [4] (FORM or SORM), were not considered in this analysis because theirtypical formulation is inappropriate to deal with this type of problems. Nevertheless, fur-ther development of this type ofmethods should be explored in the future because of theirfast probability estimation. Thus, herein, and as a first step, only advanced simulationtechniques were assessed. Meta-modelling based methods were not further considered.Additionally, Importance Sampling methods [4], although very efficient and suitablefor accelerating the probability estimations by sampling the design space at the regionthat contribute the most to the probability of interest i.e. probability of defected parts,they were not considered herein. This is because most of these methods consists of asearching algorithm based on the FORM and thus because of the nature of the failuredomain, the implementation of Importance Sampling will be inappropriate in its currentform. Further investigations need to be performed for this type simulation techniques aswell.
3.1 Crude Monte Carlo
The method used as a benchmark in this work is the CMC. CMC is based on the randomsampling of the vector of the random variables X. Samples of size N are formed forevery random variable and repetitive simulations are performed through the developedassembly models. A sample of output values for each limit state function is obtained.Thus, the probabilities of Eq. (9) can be estimated by
P(g(X) ≤ 0) = P∧
= Nfail
N(11)
where Nfail is the number of times that the limit state function becomes negative. Amajor step in implementing the CMC method is the random number generators. CMCanalysis was implemented, herein, using UQLab [14], an advanced general-purpose

162 K. Bacharoudis et al.
uncertainty quantification tool developed by ETHZurich. The tool is based onMATLABfunctions and thus, the respective generators were used. Although CMC is quite simplein its implementation and can handle complex, implicit and highly non-linear limit statefunctions, however, the coefficient of variation, CoV [·], of the probability estimator, P
∧
,in Eq. (11) i.e. the ratio of the standard deviation to the mean value of the probabilityestimator, depends on the probability that is being estimated and the sample sizeN . For adecent probability estimation, i.e. CoV [·] ≈ 10%, as a rule of thumb, P
100 samples are inneed. This indicates a large number of iterations to accurately estimate small probabilityvalues. Additionally, random sampling usually generates clusters and gaps as depictedin Fig. 6. This indicates that the random variable space is not efficiently searched. Fordisconnected failure domains as depicted in Fig. 5, this will introduce the need for moreiterations to cover efficiently the entire random variable space.
0
0.2
0.4
0.6
0.8
1
0 0.2 0.4 0.6 0.8 1
d 2
d1
0
0.2
0.4
0.6
0.8
1
0 0.2 0.4 0.6 0.8 1
d 2
d1
0
0.2
0.4
0.6
0.8
1
0.00 0.20 0.40 0.60 0.80 1.00
d 2
d1
Clusters
Gaps
CMC LH
QMCS
Fig. 6. Two sampled variables using different sampling techniques, namely random sampling(CMC), LH sampling and Sobol’ sequences (QMCS).
To alleviate the computational burden associated with Monte Carlo simulation, vari-ance reduction techniques have been proposed to deal with the issue [4]. Herein, astratified sampling technique was explored, namely the Latin Hypercube simulation aswell as a Quasi Monte Carlo simulation method based on Sobol’ sequences. Addition-ally, an adaptive Monte Carlo technique namely the Subset Simulation method was alsoinvestigated.
3.2 Latin Hypercube Simulation Method
The basic idea behind LH simulation is to sample the random variables more efficientlyby avoiding clusters and gaps generated in random sampling as depicted in Fig. 6.In order to achieve this, the range of each variable is divided into k non-overlappingintervals on the basis of equal probability. One value from each interval is selected at

Application of Advanced Simulation Methods 163
randomwith respect to the probability density in the interval. The k values obtain for thefirst random variable are paired in a random manner with the k values obtained for thesecond random variable and so on until k ∗ n samples are formed, where n is the numberof the random variables. It is important to mention that even the random variables aresampled independently and paired randomly, the final samples can be correlated. In orderto obtain samples with correlation coefficients matching the intended ones restrictionsin the paired method are usually employed. Finally, the efficiency of the LH simulationcan be improved by performing optimisation and iterating the LH method according tosome criterion e.g. maximising the minimum distance between any two points. Havingthe final samples for the n random variables, the probability estimator that the limitstate function is less than zero can be estimated by Eq. (11). UQlab has been used toimplement LH simulation and thus, Matlab algorithms were used.
3.3 Quasi Monte Carlo Simulation Based on Sobol’ Sequence
Sobol’ sequences belong to the family of low-discrepancy sequences [8]. Discrepancyis the measure that characterises the lumpiness of a sequence of points in a multi-dimensional space. Samples made from a finite subset of such sequences are calledquasi-random samples and they are as uniform as possible in the random variable spaceas depicted in Fig. 6. Thus, the random variable space is explored more efficiently, agood characteristic to deal with multiple failure domains. Additionally, the estimatedprobability in Eq. (10) is expected to converge faster than would the respective proba-bility based on random sampling [8]. The quasi-random samples can be analysed as anyother empirical data set and thus Eq. (11) can be used to determine the probability ofinterest. Herein, the sampling based on Sobol’ sequences as well as the randomisationof the sample, i.e. scrambling of the sequence, were performed using appropriate MAT-LAB functions. The transformation of the sample points of the unit hypercube into theappropriate sample with prescribed marginal distributions and correlation as well as theMonte Carlo simulation were set up using UQLab.
3.4 Subset Simulation Method
The basic idea behind the subset simulation method is that the estimation of a rareprobability, e.g. small probabilities involved in Eq. (9), can be performed by means ofmore frequent indeterminate conditional failure events Fj so that F1 ⊃ F2 ⊃ · · · ⊃FM = F . Thus, the probability of interest can be estimated as a product of conditionalprobabilities
P(g(X) ≤ 0) = P
(⋂M
j=1Fj
)=
∏M
j=1P(Fj|Fj−1
)(12)
where Fj = {g(X) ≤ yj
}the indeterminate conditional failure events, yj are decreas-
ing threshold values of the limit state function whilst their values need to be specified,F0 is the certain event and M the number of subsets. The threshold values yj can bechosen, so that the estimates of the conditional probabilities P
(Fj|Fj−1
), corresponds to

164 K. Bacharoudis et al.
a sufficiently large value po ≈ 0.1. Therefore, with an appropriate choice of the inter-mediate thresholds, Eq. (12) can be evaluated as a series of reliability analysis problemswith relatively high probabilities to be estimated. The trade-off is between minimizingthe number of subsets, M , by choosing relatively small intermediate conditional prob-abilities and maximizing the intermediate conditional probabilities so that they can beestimated accurately without much of computational burden. The probability P(F1|F0)
is estimated using CMC whilst the conditional probabilities P(Fj|Fj−1
)are typically
estimated using Markov Chain Monte Carlo based on Metropolis-Hastings algorithms[15, 16]. UQLab has already build-in functions to implement subset simulation method.
It is important to highlight that merging advanced statistical tools e.g. statisticaltoolbox of MATLAB or UQLab with off-the-self CAT software gives the capability toanalyse complex assemblies efficiently by implementing advanced statistical methodsto the problem at hand. Therefore, appropriate user defined interfaces were establishedherein by linking UQLab and 3DCS variation analyst. Taking advantage of the optionof user defined samples into 3DCS, vectorised computing capability was made possiblewhen linking UQLab and 3DCS for any type of simulation method. Therefore, runningCMC throughUQLabby calling externally 3DCS in a batchmode or using directly 3DCSsoftware resulted in approximately the same computational time. The efficient processintegration framework between advanced statistical tools and CAT software gives theopportunity to move one step forward, i.e. toward the direction of the implementationof the tolerance synthesis in terms of RBO.
4 Results and Discussion
To study the efficiencyof the proposed reliabilitymethods in tolerance analysis problems,the two case studies were analysed. Results are presented for the first case study in Fig. 7in which the probability P1 corresponds to the first probability of the right hand sideof Eq. (9) with limit state function g1. The graph in Fig. 7a depicts the CoV [·] of theprobability estimator against the number of model evaluations for the selected reliabilitymethods. The graph in Fig. 7b depicts the normalised mean value against the number ofmodel evaluations. The normalisation was performed with respect to the expectation ofthe probability estimator evaluated by CMC for 1E+06 iterations. For the second casestudy similar results are depicted in Fig. 8. The mean value, E[·], and the coefficientof variation CoV [·], of the probability estimator for each method were derived by anempirical approach. That is, hundreds reliability analysis were performed and samples ofthe probability values of Eq. (9)were, thus, generated and statistically analysed obtainingthe mean value and the coefficient of variation of each probability estimator.
It is apparent from Fig. 7 and Fig. 8 that advanced simulationmethods perform betterthan CMC. More specifically, SS has the best performance in terms of computationaleffort and accuracy of the prediction. More specifically, the predictions shown in Fig. 7aframed with the black box correspond to CoV [P1] ≈ 25%, a fair variation of the proba-bility estimator. In order to achieve this variation, it turns out that it should be executedapproximately 2,700model evaluations implementing the SSmethod, 5,500 simulationsusing LH and QMCS and almost 10,000 evaluations for CMC.

Application of Advanced Simulation Methods 165
(a) (b)
0
20
40
60
80
100
100 1000 10000 100000
CoV[
P 1]
Model evalua ons
CMC
LH
SS
QMCS
0.5
1.0
1.5
2.0
2.5
100 1000 10000 100000
E[P 1
]/E[
P 1,C
MC]
Model evalua ons
CMC
LH
SS
QMCS
Fig. 7. Descriptive statistics for the probability estimator,P(g1 ≤ 0), against the number ofmodelevaluations for the first case study: (a) coefficient of variation (b) normalized mean value
(a) (b)
0
20
40
60
80
100
100 1000 10000 100000
CoV[
P 1]
Model evalua ons
CMC
LH
SS
QMCS
0.8
0.9
1.0
1.1
100 1000 10000 100000
E[P 1
]/E[
P 1,C
MC]
Model evalua ons
CMC
LH
SS
QMCS
Fig. 8. Descriptive statistics for the probability estimator,P(g1 ≤ 0), against the number ofmodelevaluations for the second case study: (a) coefficient of variation (b) normalized mean value
Additionally, all the reliability methods converge to the CMC result (1E+06 itera-tions) as depicted in Fig. 7b. Similar results were obtained for the second probability P2of Eq. (9).
Figure 8 proves that advanced statistical tools can be linked successfully with pro-fessional CAT tools and further to accelerate the probability estimations. Similar obser-vations for the efficiency of the reliability methods made for the first example can bestated for the second one. Both problems are analogous. Fig. 7 and Fig. 8 reveal thatQMCS and LH methods produce quite similar results.
Finally, it should be stated that there is an advantage of the CMC, LH and QMCSmethod over the SS method with respect to their implementation. More specifically, forthe first group of reliabilitymethods, the sample generation procedure and the calculationof the AKC values need to be performed just one time, yet both probabilities P1 and P2of Eq. (9) as well as any other percentile of the distribution of the AKC can be estimatedquite fast. This is not the case for the SSmethod in its current form inwhich the assemblymodel should be evaluated for any new percentile that needs to be estimated. That is for

166 K. Bacharoudis et al.
Eq. (9), two different analyses should be performed to estimate the two probabilities ofEq. (9). Nevertheless, SS still remains the best option in any case.
5 Conclusions
One major outcome of this work is that statistical tolerance analysis of mechanicalassemblies can introduce multiple failure domains in the design space, i.e. separatedgroups of values of the contributors that result in defected products, as presented inFig. 5. This is due to the nonlinearity inserted by geometric tolerances such as positionaltolerances of cylindrical feature of size. In a fully probabilistic consideration of thetolerance allocation problem, this imposes serious issues on the selection of the mostappropriate uncertainty quantification method to proceed.
Therefore, for the first time, a comprehensive guidance was provided and three stateof the art simulation methods were critically evaluated with respect to their applicabil-ity to the tolerance analysis problems. From the analysis, the best option with a goodcompromise between performance and computational burden turns out to be the SubsetSimulation method. It was proved that for the same variability in the estimated prob-ability of defected products, the Subset Simulation performs 4 times faster than crudeMonte Carlo. Quasi Monte Carlo method based on Sobol sequences indicated a goodefficiency being approximately 2 times faster than crude Monte Carlo and followed byLatin Hypercube simulation technique.
Furthermore, thework indicated the successful connection of advance statistical toolssuch as UQLab with off the self CAT tools. The successful link realizes the possibilityto adopt advanced uncertainty quantification methods in real complex tolerance analysisproblem and accelerate the probability estimations. This makes feasible the reliabilitybased optimisation approach for the tolerance allocation problem.
The work is part of an ongoing research in which advanced reliability methodsneed to be studied further in combination with appropriate optimisation algorithm forthe identification of successful strategies to attack to the reliability based optimisationproblem.
Acknowledgements. This project has received funding from the Clean Sky 2 Joint Undertaking(JU) under grant agreement No. 738221. The JU receives support from the European Union’sHorizon 2020 research and innovation programme and the Clean Sky 2 JU members other thanthe Union.
References
1. Sandipan, K., Jhareswar, M.: A review on dimensional tolerance synthesis: paradigm shiftfrom product to process. Assem. Autom. 32(4), 373–388 (2012). https://doi.org/10.1108/01445151211262438
2. Valdebenito, M., Schuëller, G.: A survey on approaches for reliability-based optimization.Struct. Multi. Optim. 42, 645–663 (2010). https://doi.org/10.1007/s00158-010-0518-6

Application of Advanced Simulation Methods 167
3. Dimensional Control Systems, 3DCS variation analyst. www.3dcs.com4. Morio, J., Balesdent, M.: Estimation of Rare Event Probabilities in Complex Aerospace and
Other Systems: A Practical Approach. Woodhead Publishing, Sawston (2016)5. Nigam, S., Turner, J.: Review of statistical approaches to tolerance analysis. Comput. Aided
Des. 27(1), 6–15 (1995)6. Mazur, M.: Tolerance analysis and synthesis of assemblies subject to loading with process
integration and design optimisation tools. Ph.D. thesis, RMIT University (2013)7. McKay, M., Beckman, R., Conover, W.: A comparison of three methods for selecting values
of input variables in the analysis of output from a computer code. Technometrics 21, 239–245(1979)
8. Saltelli, A., et al.: Global Sensitivity Analysis: The Primer. Wiley, New York (2008)9. Au, S., Beck, J.: Estimation of small failure probabilities in high dimensions by subset
simulation. Probab. Eng. Mech. 16(4), 263–277 (2001)10. Bacharoudis, K., Bakker, O.J., Popov, A., Ratchev, S.: Trade-off study of a variation
aware determinate wing assembly against a traditional assembly strategy. In: MATEC WebConference (2018). https://doi.org/10.1051/matecconf/201823300008
11. Whitney, D.: Mechanical Assemblies: Their Design, Manufacture and Role in ProductDevelopment. Oxford University Press, Oxford (2004)
12. MATLAB R (2018b). The MathWOrks, Inc., Natick13. Desrochers, A., Riviere, A.: A matrix approach to the representation of tolerance zones and
clearances. Int. J. Adv. Manuf. Technol. 13, 630–636 (1997). https://doi.org/10.1007/BF01350821
14. Marelli, S., Sudret, B.: UQLab: a framework for uncertainty quantification in MATLAB.In: 2nd International Conference on Vulnerability and Risk Analysis and Management(ICVRAM), pp. 2554–2563 (2014)
15. Metropolis, N., Rosenbluth, A., Rosenbluth, M., Teller, A., Teller, E.: Equation of statecalculations by fast computing machines. J. Chem. Phys. 21(6), 1087–1092 (1953)
16. Hastings, W.: Monte Carlo sampling methods using Markov chains and their application.Biometrica 57(1), 97–109 (1970)
Open Access This chapter is licensed under the terms of the Creative Commons Attribution 4.0International License (http://creativecommons.org/licenses/by/4.0/), which permits use, sharing,adaptation, distribution and reproduction in anymedium or format, as long as you give appropriatecredit to the original author(s) and the source, provide a link to the Creative Commons license andindicate if changes were made.
The images or other third party material in this chapter are included in the chapter’s CreativeCommons license, unless indicated otherwise in a credit line to the material. If material is notincluded in the chapter’s Creative Commons license and your intended use is not permitted bystatutory regulation or exceeds the permitted use, you will need to obtain permission directly fromthe copyright holder.

Development of a Low-Cost, High Accuracy,Flexible Panel Indexing Cell with Modular,
Elastic Architecture
Robert Brownbill(B) and Adam Roberts
Electroimpact UK Ltd., Hawarden, UK{robertb,adamr}@electroimpact.com
Abstract. The global aerospace industry is driving a demand for flexible man-ufacturing systems to accommodate multiple programs with variable capacitieswithin a modular, economical production cell [1]. Traditional manufacturing cellsoften involve bespoke, monolithic hardware limited to single program use. Thisinherent restraint results in significant incurred costs and program disruptionwhenreacting to design and capacity changes. This paper describes the developmentof a reconfigurable panel-indexing cell with a dynamic cost architecture as analternative approach to established, monolithic tooling structures.
Keywords: Flexible manufacturing ·Modular architecture · Aerospace panelindexing · Reconfigurable tooling
1 Introduction
This paper narrates the mechanical design thought-processes of this fixture’s devel-opment. The best-practice approach discussed, champions the move away from high-complexity, high-cost, bespoke engineering solutions towards a design philosophy max-imizing the use of commercially available off-the-shelf components to reduce costand lead-time. In suitable applications, the reduction in capital expenditure and expe-dited time to enter production surpass the associated disadvantages. This reversal inengineering mindset should prove lucrative across all engineering disciplines.
Electroimpact are a world-leading supplier of automation and tooling systems forthe aerospace industry; supplying equipment and solutions to all of the major aerospacemanufacturers across the globe.
In addition to the supply of industrial solutions, Electroimpact (EI) are increas-ingly prioritising the collaboration of manufacturing research directly with industryand through partnerships with research and academic institutions. Such collaborationshave resulted in the development of industry leading technologies, most notably that ofAutomated Fibre Placement (AFP) [2] and Accurate Robot Technology [3].
More recently, a growing demand for flexible, elastic manufacturing systems hasbeen observed. The drivers behind this demand are primarily rate flexibility, programmeflexibility and modular architecture.
© The Author(s) 2021S. Ratchev (Ed.): IPAS 2020, IFIP AICT 620, pp. 168–183, 2021.https://doi.org/10.1007/978-3-030-72632-4_12

Development of a Low-Cost, High Accuracy, Flexible Panel 169
During the development phase of the Clean Sky 2, VADIS collaboration program [4],EI identified the opportunity to incorporate the indexing and metrology requirementsalongside flexible, modular architecture, allowing precise indexing capability within asingle, configurable tooling solution.
2 Objectives
2.1 Innovative Design Methodology
The design methodology used for this fixture was to reduce costs as far as practicablewithout compromising on accuracy, rigidity or functionality. This was done through theextensive use of commercially available off-the-shelf components from manufacturers.This is a reversal of the mindset from the 1990s/2000s where added complexity wasseen to be the way forward.
This price reduction thus enables a greater target market for the fixtures, enablesmore budget to be spent on other areas such as increased automation and facilitatesautomation avenues into lower-rate aircraft programs.
The use of an mass-produced metrology system to set the tooling points opposed toa jig-integrated PLC controller is more cost-effective as not only is a typical laser trackeraround half the price of a PLC control and servo system, the metrology equipment maybe utilized in other areas of the facility between uses. A semi-skilled operator is requiredto use the metrology system and the fixture positioning will have a slight increase in set-up time. However, these limitations are far outweighed for low to medium-rate aircraftprograms by the initial capital savings.
2.2 Functional Requirements
The initial requirement of the VADIS panel jigs in the early development phase wasto accurately index and clamp the upper and lower covers in nominal form during thescanning operation of the key datum features (the final metrology solution being theNikon MV331). With the context of this straightforward remit, initial concepts showedconventional tooling solutions with interchangeable indexing profiles, Fig. 1.
Fig. 1. Typical panel indexing concept using traditional rigid tooling methods

170 R. Brownbill and A. Roberts
As the component design development progressed, it quickly became clear that amore flexible solution would be required to accommodate a broader selection of panelsizes. The design requirements ultimately converged to the following key criteria:
• Three upper panel assemblies indexed and clamped to nominal form:
– Mid-Scale Upper Test Panel – 5 m × 1.4 m– Inboard Upper Panel – 5 m × 1.3 m– Outboard Upper panels – 4 m × 1 m
• High locational accuracy of indexing features with minimal tolerance stack betweenmetrology and contact features
• Integrated metrology reference system for both index setting and for laser radarpositional reference
• High structural and thermal stability• Controlled, measured clamping forces
2.3 Commercial and Schedule Constraints
Following on from the functional requirements and taking into consideration the con-straints of both the funding stream and the extended development time, EI expanded thedesign objectives to include:
• Manual adjustment of panel configuration (using a Laser Tracker)• Prioritisation the use of standard purchased components• Development a low-cost prototyping platform for the load cell monitoring
2.4 Modular Architecture
Once the functional and commercial requirements had been identified, EI realised theopportunity to integrate modularity and scalability within the tool design with thefollowing aims:
• Modular base design able to function as a stand-alone jig or as a multi-base cell• Upgradeability of drive systems allow future adaptation for semi-automated panelconfiguration
2.5 Cost Analysis
The following cost analysis is a rough order of magnitude (ROM) comparison betweenbespoke PLC-integrated fixtures and the low-cost altern ative discussed within the lattersections of this paper. Also included are scalability costs to double the space envelope.

Development of a Low-Cost, High Accuracy, Flexible Panel 171
Tooling Philosophy(Comparable Working Volume)
Cost*(GBP)
Lead Time(Months)
- Bespoke, semi-automated flexible panel indexing jig.
- Integrated PLC control.
- Servo driven actuators.
TOTAL £ 700 k–900 k 12–18
- Additional cost to double space envelope. £ 250 k–400 k
- Low-Cost, manually configurable, flexible panel indexing jig
- Integrated PLC position feedback.
TOTAL £ 400 k–650 k 9–14
- Additional cost to double space envelope. £ 200 k–300 k
- Low-Cost, manually configurable, flexible panel indexing jig
- Commercially Available Laser Tracker.
TOTAL £ 300 k–450 k 4–10
- Additional cost to double space envelope £ 100 k–200 k
* Correct ROM costs as of January 2020
3 Architecture
3.1 Overview
The modular concept of the jig’s architecture lends itself to being easily reconfigurable.The concept consists of a fabricated steel base of a fixed length, the concept has chosena nominal five metre base length. The base would be secured to the facility floor usingindustry standard, off the shelf, floor fixings. Each base would be capable of mountingup to four tooling posts.
A typical layoutwith three posts per base, Fig. 2, would be the recommendedmethod.Current industrial applications see typical post spacing between one and two meters, tocorrespond with assembly feature locations. Owing to the module nature of the jig,several of these bases may be bolted together to create a larger panel cell, Fig. 3.
3.2 Structure
Both the bases and the posts are of welded fabrication from two-dimensional profiles,cut from steel sheet metal. Sacrificial material has been included in the weldment designsuch that the posts are machined, post fabrication, to add the precision features requiredfor mounting the linear bearing rails, Y-drive supports and other tooling features.

172 R. Brownbill and A. Roberts
X
Y
Z
Fig. 2. Module base section with 3 tooling posts
Fig. 3. Modular larger-scale application
The tooling posts are located to the base by means of T-bolts secured in T-slots.These longitudinal slots allow for the post X-position to be easily changed betweenapplications by use of an overhead crane (2 lifting points are in the top of each postweldment). Positional tolerance of indexes in the span-wise, X direction, is typically an

Development of a Low-Cost, High Accuracy, Flexible Panel 173
order of magnitude higher than the requirements for the cross-sectional profile indexes(Y & Z directions). Although methods could be employed to enable high precisionlocation of each post in the X-direction, the posts would be set typically with a lasertracker and positioned using the overhead crane with some small manual input.
The before-mentioned concept would be that as implemented for an industrial appli-cation. Within the research budget allocated to the project, VADIS fixture posts weremounted directly to the floor, Fig. 4. This was chosen as the final installation locationwas a facility which includes floor mounted T-Slots. The industrial concept assumes aflat, basic concrete facility floor.
Fig. 4. VADIS fixture installed at electroimpact facility
The overarching function of the jig is to be flexible for a number of different panelsconfigurations, Figs. 5, 6 and 7. The working envelope for the posts is a vertical rangeof 350 mm–1820 mm in Y and a horizontal range of 350 mm in Z. Post spacing can,of course, be varied in X to suit each application. A common post spacing was deemedsuitable for the following three panels.
A thermal imaging camera was used on several occasions, in conjunction with acalibrated contact thermometer, to assess the thermal stability of the steel and aluminiumcomponents of the structure at several intervals during the day. It was found that on alloccasions the jig temperature remained stable and uniform, Fig. 8, this was unless theexternal facility doors were left open for an extended period of time. It is thereforerecommended that consideration be given to operations on the jig when any externaldoors are required to be open for extended periods.

174 R. Brownbill and A. Roberts
Fig. 5. Panel configuration 1
Fig. 6. Panel configuration 2
3.3 Drive Systems
One of the key objectives was to design the solution to be low-cost, as such, a highpriority was placed on the use of off-the-shelf (mass produced) components. Not onlyis this highly beneficial in reducing costs but, should there ever be a need to replaceor repair any of these components, the new parts can be on site in a matter of days. Ifthey were to be of custom design, there would be the associated manufacturing leadtime, typically in the order of four to eight weeks even for basic components. It was notpossible to construct these assemblies entirely from bought out parts and as such, those

Development of a Low-Cost, High Accuracy, Flexible Panel 175
Fig. 7. Panel configuration 3
Fig. 8. Infra-red image of the VADIS Jig
custom parts were constrained to housings and non-wearing components. One exampleis the custom gearbox for the Y-drive, Fig. 9, although this is a custom machined 4-axis part, this was able to be manufactured from aluminium reducing machining timeand costs as the rotating components selected were all off-the-shelf industry standardbearings.

176 R. Brownbill and A. Roberts
Fig. 9. Y drive gearbox
For the main Y-drive screws, it was chosen to select a trapezoidal thread form toreduce backlash as much as possible without the expense of ball screws. A bought-outscrew was purchased and custom end operations added to interface with the gearboxspindle and the tensioning thrust bearing bracket.
Each of the three Y-drive screws allows adjustment of its corresponding Z-sledassembly, Fig. 10. The same utilisation of off-the-shelf drive components whilst min-imising custom machined parts design methodology has been used here, two linear railsand trapezoidal drive screw assembly allow for adjustment in the Z-direction. These 2degrees of freedom, coupled with the swivel index assembly allow the Optical ToolingPoint (OTP) to be set to the panel
Fig. 10. Z-Sled indexing assembly

Development of a Low-Cost, High Accuracy, Flexible Panel 177
For the Y-drive assembly, the thread pitch of the drive screws along with the tension-ing thrust bearing at the top of the post and the weight of the sled create suitable frictionin the drive system to prevent the sleds from moving without the need for an interlock-ing brake. Whereas, on the Z-sled assemblies, their smaller screw diameter and higherapplied forces from the clamp/panel loads, it was decided that an off-the-shelf handclamp, shown orange, Fig. 10, would be required to prevent unintentional movementand creep during operation.
All adjustments can be made by the use of readily available metric tools in anystandard engineering tool kit. Both Y & Z adjustments can be done using a 17 mm or19 mm spanner/socket either by hand, ratchet spanner or with the use of power toolswith the correct socket drive attachment, Fig. 11.
Fig. 11. Manual adjustment of the VADIS fixture with use of common power tools
3.4 Indexing
The swivel indexes used on this jig are of a tried and tested Electroimpact design. The cupand sphere method enables the indexing hemi-sphere to be removed and a SphericallyMounted Retroreflector (SMR) to be directly located into the cup, Fig. 12, retained witha magnet. The closer the SMR is to the final tooling contact surface, the smaller thetolerance stack up and the higher the accuracy of the system.
Although shown on a project specific, sliding assembly, Fig. 12, the actual swivelindex mounts with a standard metric fine thread and is very compact assembly, Fig. 13.
As the SMR will set the centre point of the cup’s semi-sphere, corresponding to thecentre of the index hemi-sphere pad – this point only has to be on the surface of the part- no allowance needs to be made for the local angle of the panel at each location. Thehemi-sphere can swivel through an angle of 20° to allow for Y & Z angular compliance,Fig. 14.

178 R. Brownbill and A. Roberts
Fig. 12. Swivel index with SMR
Fig. 13. CAD scheme of EI swivel index
Fig. 14. EI swivel index assembly on the VADIS Jig

Development of a Low-Cost, High Accuracy, Flexible Panel 179
3.5 Metrology
As with all precision tooling cells, a robust and highly accurate metrology architectureis required to facilitate the high precision setting of the optical tooling points. Limitingthe tolerance stack up between the OTP and the contact surface greatly improves theaccuracy and repeatability of the system. Where possible the use of metrology toolinghas been removed. This has been achieved, as previously discussed, by enabling theSMR to be located directly into the Swivel Index nest and retained for setting. Anotherway of achieving this is to implement a similar scheme for the Jig Reference System(JRS). The JRS enables the laser tracker or metrology equipment to be located withinthe jig reference frame. The use of fixed nests, opposed to tooling holes requiring theuse of a pin nest, reduce the tolerance stack up. These nests are screwed into the jig baseand secured in place with high strength epoxy compound. An anodised aluminium ringwith laser etched point ID numbers was put around these nests, Fig. 15, to easily identifythe JRS points and protect the nests from damage during jig operation.
Fig. 15. Jig reference system nest and ID ring with SMR
To ensure a high quality JRS, the Unified Spatial Metrology Network (USMN)[5] feature in the Spatial Analyzer software was used to analyse the measurements ofthe actual JRS points from several stations. These point clouds were then run throughthe algorithm and scaled for temperature to obtain high accuracy values for the actualposition of the JRS points. It took seven stations, Fig. 16, to ensure that each point wasshot sufficient times to yield a reliable JRS valuation.
To set each of the swivel indexes the metrology operator would book into the JRSthen, with the SMR positioned in the swivel index cup, use the Y & Z adjustabilityto precisely position the OTP. This process would be repeated for all OTPs on thejig. Although this process would take longer than an automated system with inbuiltabsolute scales, a semi-skilled operator would be able to reconfigure the jig in a relativelyshort of time. It is currently estimated that with a competent operator the cell could bereconfigured with less than a thirty minutes disruption to production (for the VADISfixture or similar).

180 R. Brownbill and A. Roberts
Fig. 16. USMN analysis of the VADIS Jig
Other benefits are such that the cost for themanually adjustable jig and the associatedmetrology system (laser tracker) are more cost-effective than a semi-automated cell withthe added benefit that the metrology system is portable and can be used across multipleapplications in the same facility.
3.6 Force Sensing Clamps
Oneof the key requirements from theLeonardodesigndepartmentwas for the applicationof a controlled, measured clamping force at predetermined locations across the panels.
EI’s solution was a manually operated, screw-driven clamp assembly containing a500 lb-f load cell directly behind the clamping pad, Fig. 17. To monitor the load cellvalues, a portable load cell amplifier was developed using a commercially availableArduino microcontroller, using a standard USB-B male-male interface cable.
Using a single interface across multiple load cells required the controller, Fig. 18, tobe able to apply specific scaling factors to each individual load cell. Each clampwas givena unique identification (in this case, ‘Upper Jig 1’, ‘Lower Jig 2’ etc.) and is calibratedoffline using measured calibrated masses. The scaling factors are then calculated andstored to the Arduino’s internal non-volatile memory.

Development of a Low-Cost, High Accuracy, Flexible Panel 181
Fig. 17. Manual panel clamp with load cell feedback
Fig. 18. VADIS hand pendant design
4 Next Steps
Following the successful implementation of the VADIS panel cell, EI intend to explorethe subsequent developments:
Dynamic Cost Models. The jig architecture has been developed with scalability inmind. The configuration outlined within this paper is the most cost-effective solution,suitable for low rate with minimal configurations. EI propose the following levels ofscalability:

182 R. Brownbill and A. Roberts
• Manual configuration of index and clamp locations – using portable laser tracker• Semi-automated configuration using permanentlymounted laser tracker and handheldHMI
• Semi-automated configuration using integrated absolute scales, central PLC controland handheld HMI
• Fully automated configuration using integrated servos for each drive and a centralPLC control
Modular Panel Interfaces. This paper describes the use of swivel indexes in amodularsub-assembly to control panel contours. EI propose to develop interchangeable sub-assemblies to increase the range of indexing methods. Typical sub-assemblies wouldinclude stringer profile indexes, manhole clamping and datum hole pin locations.
Lateral Post Adjustment. One of themajor limitations of the proposed jig is the lateral(Z) adjustment of the drive systems. EI propose to pursue an additional drive systemwithin the post weldment base to allow lateral movement of the entire post assembly.This would increase the indexing envelope to include panels with significant sweepangles.
Non-contact Metrology Inspection. With the latest advancements of metrology hard-ware, high-accuracy non-contact measurement of key index locations is possible. Thisallows for remote measurement without the need for the operator to move an SMRto metrology features. Speeding up configuration time and whilst also allowing forin-process inspection of the component.
Smart Manufacturing. Within the development of flexible manufacturing systems isthe desire for Smart Manufacturing – gathering relevant manufacturing process data andusing advanced analytics to improve manufacturing efficiency [6]. EI have identifiedseveral features of the flexible jig which could be developed: recording of panel clampload data, panel identification, panel in-jig process time, panel configuration time, paretoof the major planned and unplanned downtime.
Acknowledgements. This project has received funding from the EuropeanUnion’s Horizon 2020research and innovation programme under grant agreement No 738221. We are incredibly proudto work as part of this consortium. These developments would not have been possible without thehardwork and support ofDr. JosephGriffin,Dr. KonstantinousBacharoudis, Dr. Alison Turner andProfessor SvetanRachev of the Centre for AerospaceManufacture at theUniversity ofNottinghamalong with Mr. Salvatore Cascella and his team at Leonardo Aircraft in Pomigliano d’Arco, Italy.

Development of a Low-Cost, High Accuracy, Flexible Panel 183
References
1. Millar, A., et al.: Reconfigurable Flexible Tooling for Aerospace Wing Assembly, AerospaceTechnology Conference and Exposition (2009)
2. Electroimpact Inc.: Composite Manufacturing. Electroimpact (2019). https://electroimpact.com/Products/Composites/Overview.aspx
3. DeVleig, R., et al.: Improved Accuracy of Unguided Articulated Robots. SAE International,Warrendale, PA (2009)
4. University of NottinghamCentre for AerospaceManufacturing, Leonardo Aircraft, Electroim-pact UKLtd.: VarianceAwareDeterminate assembly Integrated System (VADIS), Nottingham,Pomigliano D’Arco, Hawarden (2019). https://cordis.europa.eu/project/id/738221
5. New River Kinematics: Unified Spatial Metrology Network, New River Kinematics (2018).https://www.kinematics.com/spatialanalyzer/usmn.php
6. Davis, J., et al.: Smart manufacturing, manufacturing intelligence and demand-dynamicperformance. Comput. Chem. Eng. 47, 145–156 (2019)
Open Access This chapter is licensed under the terms of the Creative Commons Attribution 4.0International License (http://creativecommons.org/licenses/by/4.0/), which permits use, sharing,adaptation, distribution and reproduction in anymedium or format, as long as you give appropriatecredit to the original author(s) and the source, provide a link to the Creative Commons license andindicate if changes were made.
The images or other third party material in this chapter are included in the chapter’s CreativeCommons license, unless indicated otherwise in a credit line to the material. If material is notincluded in the chapter’s Creative Commons license and your intended use is not permitted bystatutory regulation or exceeds the permitted use, you will need to obtain permission directly fromthe copyright holder.

Context-Aware Plug and Produce for RoboticAerospace Assembly
David Sanderson1(B) , Emma Shires1, Jack C. Chaplin2 , Harvey Brookes3,Amer Liaqat3, and Svetan Ratchev2
1 Centre for Aerospace Manufacturing, University of Nottingham, Nottingham NG7 2PX, UK{david.sanderson,emma.shires}@nottingham.ac.uk
2 Institute for Advanced Manufacturing, University of Nottingham, Nottingham NG8 1BB, UK{jack.chaplin,svetan.ratchev}@nottingham.ac.uk
3 Airbus, Bristol, UK{harvey.brookes,amer.liaqat}@airbus.com
Abstract. Aerospace production systems face increasing requirements for flexi-bility and reconfiguration, along with considerations of cost, utilisation, and effi-ciency. This drives a need for systemswith a small number of automation platforms(e.g. industrial robots) that canmake use of a larger number of end effectors that arepotentially flexible or multifunctional. This leads to the challenge of ensuring thatthe configuration and location of each end effector is tracked by the system at alltimes, even in the face of manual adjustments, to ensure that the correct processesare applied to the product at the right time. We present a solution based on a DataDistribution Service that provides the system with full awareness of the contextof its automation platforms and end effectors. The solution is grounded with anexample use case fromWingLIFT, a research programme led by a large aerospacemanufacturer. The WingLIFT project in which this solution was developed buildson the adaptive systems approach from the Evolvable Assembly Systems project,with focus on extending and increasing the aerospace industrial applicability ofplug andproduce techniques. Thedesignof this software solution is described frommultiple perspectives, and accompanied by details of a physical demonstration cellthat is in the process of being commissioned.
Keywords: Aerospace assembly · Context awareness · Distributed data service ·Flexible manufacturing systems ·Manufacturing service bus ·Multi-agentsystems · Plug and produce · Robotic assembly
1 Introduction
Global air travel has seen significant growth in recent decades, doubling every 15 yearsand demonstrating strong demand for new aircraft. This delivers a challenge to aircraftmanufacturers to ramp up production to higher rates in order to keep pace with demand.One of the biggest challenges to the introduction of a new product is industrialising thenew automation technologies that enable the required ramp up to full production rate.The industrialisation process requires the development and validation of a wide variety
© The Author(s) 2021S. Ratchev (Ed.): IPAS 2020, IFIP AICT 620, pp. 184–199, 2021.https://doi.org/10.1007/978-3-030-72632-4_13

Context-Aware Plug and Produce for Robotic Aerospace Assembly 185
of technologies in a short period of time. This can be accomplished at a reduced costthrough flexible, reconfigurable, and modular production systems that enable multipleprocesses to be evaluated concurrently without large commissioning efforts. Such sys-tems also enable reduction in cost by enabling adaptation in the automated system tocope with component variation and process uncertainty. This supports delivery of auto-mated assembly processes (e.g. drilling, fastening etc.) to the correct location on theactual product. Such technology contributes to reduction in manufacturing costs, bothnon-recurring (e.g. production systems design and commissioning) and recurring (e.g.reduction in changeover, human intervention, and cycle time).
The WingLIFT project [1] has identified a number of specific aims in support of theindustry requirements when considering the assembly of aircraft wings. One aspectof these aims is the application of innovative information management technologyto optimise flow and distribution of both internal and external information across awing sub-assembly factory. Intelligent assembly systems are required to monitor thekey parameters of the entire manufacturing system, which supports quality assurance,geometric deviation awareness and control, and data feedback for real-time continuousimprovement.
The work presented in this paper contributes to this technology solution specificallyby monitoring the configuration of the system in real time. This technology is groundedin a specific use case that describes an automated assembly cell containing a set ofprocess end effectors, each with a potentially large set of possible configurations, thatare shared between a relatively small number of automation platforms.
This paper is organised as follows: Sect. 2 provides an overview of the current stateof the art in flexibility in manufacturing systems, with particular reference to previousprojects carried out at this institution in the area on which WingLIFT builds. Section 3describes the motivating use case for the work, before Sect. 4 develops the architecturalconcept for WingLIFT. Section 5 specifies the demonstration scenario that will be usedto validate the work, along with an outline of the solution developed. Finally, Sect. 6summarises the work presented.
2 Flexibility in Manufacturing Systems
2.1 Flexible and Reconfigurable Manufacturing Systems
In a manufacturing sector characterised by market unpredictability, increased globallabour costs, and growing consumer demand for highly personalised goods and ser-vices, producers are naturally pushed to remain competitive by maintaining shortertimes to market, increased product diversity and specialisation, and shorter product life-cycles. This has resulted in a growing body of research into production systems thatcan incorporate new technologies and provide high levels of robustness, resilience, andresponsiveness.
There are a number of approaches to delivering these characteristics, including flex-ible manufacturing systems [2, 3], reconfigurable manufacturing systems [4], automaticand adaptive control [5], and manufacturing systems modelling and simulation [6]. Onespecific technology that has been developed in this area is “plug and produce” [7], namedby analogy to the concept of “plug and play” in computing. The EU FP7 PRIME project

186 D. Sanderson et al.
[8] developed a multi-agent approach to plug and produce with commercially availablecomponents for simple robotic assembly tasks in a fixed system dealing with dynamicproduct changes and unexpected disruptions [9–11].
2.2 Evolvable Assembly Systems, Context Awareness, and WingLIFT
EPSRC Evolvable Assembly Systems (EAS) [12] was a fundamental research projectfollowing on from PRIME. It aimed to deliver adaptable and cost effective manufactureby enabling a compressed product life cycle through the delivery of robust and compli-ant manufacturing systems that can be rapidly configured and optimised. In turn, thisshould enable the reduction of production ramp-up times and programme switchovers.In summary the project proposed a multi-agent system [13] to provide manufacturingcontrol systems with the characteristics of agility, multi-functionality, adaptability, andresilience. Further information on the EAS project can be found elsewhere [14–17],but the remainder of this section focusses on how EAS viewed the concept of context-awareness in terms of intelligent production systems. One product of the EAS projectwas the concept of a context-aware cyber-physical production system, shown in Fig. 1and discussed in more detail in [18].
Distributed Intelligence
AdaptiveProcess
Correctness
Augmented Workforce
Pervasive Metrology
Digital Twin
Digital Thread
ModularProduction
System
Ubiquitous Context Awareness
Fig. 1. Conceptual framework for context-aware cyber-physical production systems

Context-Aware Plug and Produce for Robotic Aerospace Assembly 187
The basis of the concept is that of a shared context for the system, where the contextis knowledge about the system and its current state. This context allows all the elementsof the system to share the relevant knowledge and information required to accomplishthe system function. The foundation of the context is the digital information concerningthe system, starting with the information created at design and commissioning (“digitaltwin”), and added to throughout life by the operation of the system (“digital thread”).This contextual information is gathered and handled by distributed intelligence across aset of modular system components. Pervasive metrology1 allows for the highest qualityinformation at all times. The information can be used to allow the system to self-adaptand maintain its correct functioning. The final aspect of the concept allows for thehuman workforce and the automation to work together most effectively by assigningdecision-making and operations in a hybrid manner to best allocate responsibilities.In summary, the context-aware cyber-physical production systems concept enables thesmart integration of all equipment in order to best leverage the available information andthereby accomplish the production aims in the most efficient manner possible with theavailable resources.
WingLIFT focusses on a specific instantiation of part of this concept in order toprove its applicability in an industrial environment. The WingLIFT approach involvesthe aspects of data sharing that enable smart integration of dynamic modular productionsystems through the use of distributed intelligence. This distributed intelligence is pre-sumed to be based on multi-agent technology, but an agent is not a “hard requirement”for every resource in the system, as will be discussed later. Other parts of the WingLIFTproject include some aspects of pervasive metrology, but they will not be included inthis paper.
3 Use Case
3.1 High-Level Use Case Motivation
The high-level use case identified in the WingLIFT project for this work is as follows. Asemi-automated aerospace assembly cell exists in which a small number of automationplatforms (e.g. industrial robots) share a larger number of process end effectors (e.g.end effectors designed to either drill, fasten, seal, or position components). Each endeffector may have a large number of possible configurations (e.g. for the drilling endeffector, there may be a variety of cutting tool sizes; for the fastening end effector theremay be a variety of fastener diameters and lengths; and so on). These configurations maybe changed dynamically during operations either by the automation control system, orby the operator. Both the automation platforms and end effectors are expected to bemoveable around the cell through the use of automatic tool changers and either railsor moveable platforms. The system therefore requires some method for maintainingknowledge of the current configuration state of thewhole system, including the hardwareconfigurations and positions of both automation platforms and end effectors, and thesoftware configuration of the control system.
1 Pervasive metrology is where metrology is used throughout the system, named by analogy withpervasive computing [31], an offshoot of ubiquitous computing [32].

188 D. Sanderson et al.
3.2 Specific Use Case Scenarios
Further developing the high-level use case described above, the project defines a set ofspecific use case scenarios. The scenarios are as follows:
• Resource addition and resource removal• End effector pick-up and end effector drop-off• Configuration change (hardware) and configuration change (software)
For the purposes of this paper, we will describe in detail the end effector pick-up usecase and a generalised “configuration change” use case that combines both hardware andsoftware changes. The project utilises a multifunctional UML approach (i.e. accordingto the Object Management Group’s Unified Modeling Language [19]) to describe theuse cases and solution; for this paper we will describe each use case with a table.
End Effector Pick-Up. The end effector pick-up use case scenario shown in Table 1describes a situation where the system is required to change the currently equipped endeffector on a given automation platform (in this case a robot) to a specific end effector.This requires that the system is aware of the locations of the robot and end effector, andalso the current and desired configurations of the end effector.
Table 1. End effector pick-up use case scenario in tabular format
Name: End effector pick-up
Actors
• Existing production system• Existing robot requiring end effector• Existing end effector to be picked up• Operator/integrator
Pre-conditions
• System and all relevant resources are functioning correctly, support plug & produce, and have compatible interfaces• Robot is part of production system, is functioning correctly and has interfaces compatible with the end effector• End effector is part of production system, is functioning correctly and has interfaces compatible with the robot• End effector is not already on (any) robot, but is in a known location that is reachable by robot• End effector has (or can be given) definition of capabilities and configuration
Basic flow
1. Start: System requires end effector to be added to robot2. System identifies current (or last known) location of end effector3. Robot and end effector are brought to the same location and connected together. Details of this physical process are out of scope,
but this could happen in three ways:a. Robot moves to end effector and picks it upb. End effector is brought to robot, which picks it upc. Robot and end effector move to same location, where robot picks up end effector
4. Robot/system reads current configuration setting of end effector. The system becomes aware of the end effector configuration.The “Change Configuration” use case is executed – the configuration change is the joining of the robot and end effector
5. Robot and end effector are now considered “joined”6. System checks that end effector configuration matches expected configuration and notifies operator of successful pick up. Either:
a. Configuration is as expected – successb. Configuration is not as expected – a change is required
7. Completion: The end effector in the internal representation of the production system has been set as being joined to therepresentation of the robot: all resources in the system should be aware of the new capabilities/configuration andlocation/connectivity of the joint robot with end effector
Post-conditions
• The new end effector is part of the production system (attached to the robot); system and all relevant resources are functioningcorrectly, support plug & produce, and have compatible interfaces
• All resources in the system should be aware of the new end effector’s capabilities/configuration and location/connectivity• The new end effector can be given commands and generate output as expected

Context-Aware Plug and Produce for Robotic Aerospace Assembly 189
Configuration Change. The configuration change use case scenario shown in Table 2shows a situation where a change has been made to a resource (e.g. end effector) in thesystem that must be communicated to the rest of the system. Examples of this changecould include an end effector being mounted to a given robot (which updates both therobot configuration and the end effector configuration), an end effector being placed ina tool rack (which updates the “location” configuration of the end effector), or an endeffector setting being changed (for example the size of fastener being held).
Table 2. Configuration change use case scenario in tabular format
Name: Configuration change
Actors
• Existing production system• Existing resource to be configured• Operator/integrator
Pre-conditions
• System and all relevant resources are functioning correctly and support being configured• Resource to be configured is part of production system and is functioning correctly, but is not in the correct configuration• Resource to be configured can be given definition of capabilities and configuration• The change to the configuration is such that the rest of the system needs to be made aware of the change (i.e. it will impactplanning or production processes)
Basic flow
1. Start: A change is made to the configuration of a resource in the system that is significant enough to be communicated to the restof the system. The details of what this configuration change is are out of scope. It may include changes to the settings on an endeffector (e.g. which size bolt is loaded)
2. Resource reads new configuration. The details of this are out of scope, but examples include:a. Some resource in the system – or the system controller – requested a configuration change be applied, so already
communicated the change to the resourceb. The resource automatically detects the configuration change; this could be through specific sensors or because the resource
automatically determined the required configuration change so is already aware of itc. The operator adjusts hardware selector switches on the resource, which are read by the resource controllerd. The operator inputs the configuration change on an HMI, which is read by the resource controller or system (which would
then pass it to the resource controller)3. The resource updates its internal representation to reflect the new configuration4. The resource communicates its new configuration to the system, which notifies all relevant resources and incorporates the
change into its internal representation5. Completion: The resource has its new configuration reflected in its internal representation. The system and all relevant resources
are aware of the new configuration. This new information may be used by other resources as a trigger for other processes
Post-conditions
• System and all relevant resources functioning correctly and support configuration• Resource has new configuration; remainder of system is aware of new configuration as appropriate• Resource to be configured can be given definition of capabilities and configuration
4 Reference Architecture Concept
4.1 Generic Process Flow
Based on the use cases developed in the project discussed in Sect. 3, a generic processflow has been identified and is presented diagrammatically in Fig. 2 using the exampleof the “end effector pick-up” use case. This generic process flow allows a solution to bedesigned that will address the range of problem scenarios facing the system, where eachuse case is a specific example, rather than designing a solution specifically for each usecase and then attempting to combine them.

190 D. Sanderson et al.
Distributed System Context
Handle
Network
Local
Production Resource Pool
Production Cell Configuration
A C E
B D
A ED
Production Resource Pool
Production Cell Configuration
A C E
B D
A EDB
Update
Operator
Notify
End Effector Pick-Up
Operator
AB
TranslationLayer
ProductionResource
Embedded Intelligencewith Context
Production Hardware
End Effector
End Effector Hardware
Equipment Context
(Configuration,Location, etc)
Trigger
Fig. 2. Generic use case flow for WingLIFT, using the example of end effector pick-up
Each use case follows the following process:
1. Trigger: An event occurs to trigger the use case. In this case it is a requirement forthe end effector B to be fitted to the robot A.
2. Handle: An entity in the system either chooses to handle the event, or is assignedto handle it. In this case the WingLIFT software will gather the required data (e.g.end effector location) from the distributed system context and assign the specificrequired processes to the relevant robot controller.

Context-Aware Plug and Produce for Robotic Aerospace Assembly 191
3. Update: The system configuration is updated. This happens both at the local levelby each individual resource, and at the network level where the shared context isupdated. The robot controller configuration will be updated to include the new endeffector, and the end effector context will reflect its new location and configuration.
4. Notify: Once the use case has been completed, one or more entities in the system arenotified of the success or failure of the process. In this case, the operator is notifiedthrough an HMI.
4.2 Architectural Concept
Placing some of the terms used in the previous section into context, the top-level agent-oriented architectural concept, based on that of the EAS project, is shown in Fig. 3. Eachresource maintains a local internal model for low-level decision-making and control. Allresources in the system are connected to a shared context which forms a “joint model”from the many local internal models. High-level decision-making can be performed onthis joint model. The shared context is also the link to the wider enterprise and anyadditional external data sources or storage locations.
Resource and Agent
Multi-Agent Production System
System and Enterprise
Resource Controller
LocalInternal Model Enterprise Interface
High-Level Decision-Making
External DataAccess and Storage
Communication
Agent’sResource
OtherAgents
Distributed Shared Context
Fig. 3. Top-level agent-oriented architectural concept
Building on the EAS project, it is assumed that the majority of the resources in thesystem will be controlled by intelligent agents [13]. In Sect. 4.4, integration cases willbe discussed where no agent is present.
4.3 Data Communications Concept
The “distributed shared context” in the system is transmitted over a databus that performsthe functions of both a Manufacturing Service Bus and of an Enterprise Service Bus (ahybrid “manufacturing/enterprise service bus”). This “shared context” is effectively all

192 D. Sanderson et al.
relevant data that is collected from the system; it is a joint model of the system contextthat is generated by the collection of the internal models of all the system elements.Once on the bus, this data can be used as required by the actors in the system, or storedfor later use.
In terms of implementation, all inter-agent (or inter-resource) communication in thesystem is handled by a publish-subscribe databus implemented as a Data DistributionService (DDS, as specified by the Object Management Group (OMG) DDS standard)[20]. The publish-subscribe approach is one in which, rather than the data publishersending data to one or more specific recipients, the data is published to a channel.The data subscribers subscribe to a channel and receive data from that channel. Thisfrees publishers from keeping track of who is interested in their data, and subscribersfrom keeping track of data sources. The channel can also take care of communicationimplementation details, rather than requiring the agents to do so. Such details mayinclude quality of service requirements, caching or persistence, and so on.
4.4 Hardware/Software Stack
Physical hardware resources in the WingLIFT architecture are usually controlled byintelligent agents deployed on embedded computers. Each agent is connected to theresource using a resource-specific translation layer and to the rest of the system using aDDS. In the EAS project this was the most common type of stack, but WingLIFT aimsto address a wider range of resource types. Figure 4 shows this more complete view: thephysical resource may provide a software interface, or may require a hardware interface;the system can also interface with humans though software running on portable devices;and the system may include software services running on other computing hardware.There should be no difference to the architecture whether the resource being managedis physical automation, a human, or a software service.
Also shown in Fig. 4 are the data flows from the resources up to the databus, theoptions for where each piece of functionality is deployed in hardware terms, and thelikely division between provided and developed functionality. Resource hardware iscontrolled by its own controller as normal. That controller then interfaceswith the systemdatabus either through an agent on an embedded computer, an agent deployed directlyon the controller (in the case of a software PLC for example), or directly through itsown network application programming interface (API). In most cases some translationwill be required from vendor specific semantics to open common semantics for use onthe databus. Some resource hardware will provide an API and open communicationstandards for interfacing with. Some “legacy” resource hardware may require a morecomplex translation layer that features hardware technical interconnectivity as well assemantic translation. Human resources communicate with resource agents via human-machine interfaces (HMIs). In the case of resources that directly connect to the databusthrough their own network API without an agent, they can only act as publishers and/orsubscribers of data. If any decision-making takes place, it must either be handled entirelyinside the resource, or a separate agent must be deployed on the databus to act on thedata published and/or subscribed to by the resource.

Context-Aware Plug and Produce for Robotic Aerospace Assembly 193
Open Common Semantics
Resource /VendorSpecific
Dis
tribu
ted
Syst
em C
onte
xt o
n Da
tabu
s
Resource Hardware
Res
ourc
e C
ontr
ol
Cod
e
“Leg
acy
Reso
urce
”
Tran
slat
ion
Laye
r
(Incl
udin
g te
chni
cal
inte
rcon
nect
ivity
)
Embe
dded
Com
pute
r an
d Re
sour
ce A
gent
HM
I Cod
e
Prov
ided
API
Tran
slat
ion
Laye
r
Hum
an
Embe
dded
Com
pute
r an
d Re
sour
ce A
gent
Res
ourc
e C
ontr
ol
Cod
e
Embe
dded
Com
pute
r an
d Re
sour
ce A
gent
Res
ourc
e
Prov
ided
API
Tran
slat
ion
Laye
r
Res
ourc
e C
ontr
ol
Cod
e
Res
ourc
e A
gent
and
Tr
ansl
atio
n So
ftwar
e
Age
ntifi
ed
Res
ourc
e or
So
ftwar
e
Prov
ided
API
Res
ourc
e C
ontr
ol
Cod
e
Prov
ided
Net
wor
k A
PI
“Sm
art R
esou
rce”
or
Sof
twar
e
Dot
ted
boxe
s in
dica
te
hard
war
e se
para
tion
Whi
te b
oxes
indi
cate
de
velo
ped
prod
ucts
Gre
y bo
xes
indi
cate
pr
ovid
ed p
rodu
cts
Fig.4.Integrationapproaches
fordifferentresources
types

194 D. Sanderson et al.
5 Validation
5.1 Demonstration Scenario
In order to validate the proposed solution, we have developed a demonstration scenariobased around the project use cases. In this scenario, two robots share a number of endeffectors through the use of automatic tool changers as described in Sect. 3.1.
The aim of the demonstrator is to show how the two robots can share the end effectorsand how the system can maintain awareness of the current configuration of both therobots and the end effectors in the face of manual changes. A visual representation ofan example usage flow of the demonstrator is given in Fig. 5 in the format of a UMLactivity diagram.
Fig. 5. Example flow of the demonstrator in UML activity diagram format
This shows the example of an end effector pick-up: first the use case is triggeredby the operator making a selection on the HMI. This is handled by the software onceit receives the ChangeEEorToolCmd request. Once the end effector has been picked up,the status is updated locally (by the robot once the task is complete) and at the networklevel (when the robot publishes the context update). Finally, the operator is notified oncethe change is complete.

Context-Aware Plug and Produce for Robotic Aerospace Assembly 195
5.2 Outline Solution
Based on the WingLIFT architecture, databus concept, and integration approaches alldescribed in Sect. 4, Fig. 6 shows the overall logical structure of the demonstration celldescribed in this section. Each robot is controlled by its own controller, which is in turnconnected to aWingLIFT agent that is connected to the DDS databus. Also connected tothe databus is an HMI for the operator, and an agent connected to each end effector. Theend effector information is transmitted onto the bus through this agent. The bus carries allconfiguration and state information for all resources in the cell: the location of the robotsand end effectors, the configuration state of all end effectors, and which end effector isconnected to each robot. The remainder of this section describes the implementation ofthe cell in some more detail.
WingLIFT Agents
Controllers
Robots
HMI. . .End
Effectors
Operator
DDS databus
Fig. 6. WingLIFT demonstration cell architecture
Resource, Controller, and Code. Production resources must be orchestrated by theWingLIFT software. This is effectively a case of virtualising or servitising the pro-duction resource. Various approaches are possible, depending on the specific situation

196 D. Sanderson et al.
[21–23]: Industry 4.0 suggests an “administration shell” wrapper around the existingcontrol approach for example [24–26]. Some modern resources may already have suit-able interfaces. Others may facilitate the addition of a custom interface (e.g. a soft PLCon which a module can be installed to communicate with the agent). WingLIFT uses anintelligent agent to virtualise each resource.
Agent. TheWingLIFT architecture uses an agent-based approach to integrate resourcesthat do not support intelligent integration. Each agent is based around a streamlined ver-sion of the JADE agent platform [27]. The JADE Abstract Architecture and Applicationframeworks have been utilized, but theAgentCommunication andAgentMessageTrans-port has been replaced by the RTI Connext DDS Pro publish-subscribe databus. EachWingLIFT agent extends the abstract JADE agent class, to provide structure for agentdata management and behaviours.
Communication. The WingLIFT agent communicates along two main channels: viathe agent-resource translation layer, and via the inter-agent communication method (e.g.DDS):
• Agent-resource translation layer: This translation layer allows the agent to communi-cate with the resource it is controlling.Where the resource is anHMI, it also allows thesystem to communicate with the human operator. While the agent side of this transla-tion layer is common to all agents, the resource side of the layer must be customisedto some degree to the specific (type/brand/make/model of) resource. This allows theagent to deal with the specific datatypes required by whatever interface is available inthe resource in order to trigger operations and receive data.
• Inter-agent communication: Agents communicate with each other across a publish-subscribeRTIConnextDDSProdatabus [28]. This is basedon theOMGDDSstandard[20], with individual message formats defined in turn using the OMG Interface Def-inition Language (IDL) [29], part of Common Object Request Broker Architecture(CORBA) [30]. Connext Pro allows both the use of standard publish-subscribe com-munication and also request-replymessagingpatterns aswell.Weuse the request-replypattern where appropriate, for example when sending commands to specific resourcesand receiving the responses.
6 Summary
This paper has presented theWingLIFT approach to context-aware plug and produce forflexible robotic aerospace assembly based on a Data Distribution Service. This approachallows the system to accurately and dynamically track the configuration and status of theprocess end effectors in a flexible and reconfigurable production cell. This is groundedin an industrial use case where the potential end effector configurations far outnumber

Context-Aware Plug and Produce for Robotic Aerospace Assembly 197
the available automation platforms. The solution is presented as a set of design specifi-cations along with a summary of a physical demonstration cell based at the Universityof Nottingham.
Acknowledgements. The authors gratefully acknowledge the support provided by Innovate UKthrough the Aerospace Technology Institute WingLIFT project (project reference 113162).
References
1. UKResearch and Innovation:WingLean Innovative Future Technology (WingLIFT) - projectreference 113162 (2017)
2. Sethi, A., Sethi, S.: Flexibility inmanufacturing: a survey. Int. J. Flex.Manuf. Syst. 2, 289–328(1990). https://doi.org/10.1007/BF00186471
3. Browne, J., Dubois, D., Rathmill, K., et al.: Classification of flexible manufacturing systems.FMS Mag. 2, 114–117 (1984)
4. Koren, Y., Heisel, U., Jovane, F., et al.: Reconfigurable manufacturing systems. CIRP Ann.– Manuf. Technol. 48, 527–540 (1999). https://doi.org/10.1016/S0007-8506(07)63232-6
5. Monostori, L., Csáji, B.C., Kádár, B., et al.: Towards adaptive and digital manufacturing.Annu. Rev. Control 34, 118–128 (2010). https://doi.org/10.1016/j.arcontrol.2010.02.007
6. ElMaraghy, H., AlGeddawy, T., Azab, A.:Modelling evolution inmanufacturing: a biologicalanalogy. CIRP Ann. – Manuf. Technol. 57, 467–472 (2008). https://doi.org/10.1016/j.cirp.2008.03.136
7. Arai, T., Aiyama, Y., Maeda, Y., et al.: Agile assembly system by “plug and produce”. CIRPAnn. – Manuf. Technol. 49, 1–4 (2000). https://doi.org/10.1016/S0007-8506(07)62883-2
8. PRIME: PRIME project website (2014). http://www.prime-eu.com. Accessed 15 Nov 20149. Antzoulatos, N., Castro, E., Scrimieri, D., Ratchev, S.: A multi-agent architecture for plug
and produce on an industrial assembly platform. Prod. Eng. 8, 773–781 (2014). https://doi.org/10.1007/s11740-014-0571-x
10. Antzoulatos,N., Rocha,A., Castro, E., et al.: Towards a capability-based framework for recon-figuring industrial production systems. In: Proceedings of the 15th IFAC/IEEE/IFIP/IFORSSymposium INCOM2015 on InformationControl Problems inManufacturing, pp 2145–2150(2015)
11. Antzoulatos, N., Castro, E., de Silva, L., Ratchev, S.: Interfacing agents with an industrialassembly system for “plug and produce”: (demonstration). In: Proceedings of the 2015International Conference on Autonomous Agents and Multiagent Systems. InternationalFoundation forAutonomousAgents andMultiagent Systems, Richland, pp 1957–1958 (2015)
12. Ratchev, S.: Evolvable assembly systems - towards open, adaptable, and context-awareequipment and systems (grant reference EP/K018205/1) (2012)
13. Wooldridge, M., Jennings, N.R.: Intelligent agents: theory and practice. Knowl. Eng. Rev.10, 115–152 (1995)
14. Chaplin, J.C., Ratchev, S.: Deployment of a distributed multi-agent architecture for trans-formable assembly. In: Ratchev, S. (ed.) IPAS 2018. IAICT, vol. 530, pp. 15–28. Springer,Cham (2019). https://doi.org/10.1007/978-3-030-05931-6_2
15. Chaplin, J.C., Bakker, O.J., de Silva, L., et al.: Evolvable assembly systems: a distributedarchitecture for intelligentmanufacturing. IFAC-PapersOnLine 48, 2065–2070 (2015). https://doi.org/10.1016/j.ifacol.2015.06.393

198 D. Sanderson et al.
16. Sanderson, D., Chaplin, J.C., Ratchev, S.: Functional modelling in evolvable assembly sys-tems. In: Ratchev, S. (ed.) IPAS 2018. IAICT, vol. 530, pp. 40–48. Springer, Cham (2019).https://doi.org/10.1007/978-3-030-05931-6_4
17. de Silva, L., Felli, P., Chaplin, J.C., et al.: Synthesising industry-standard manufacturingprocess controllers. In: Proceedings of the International Joint Conference on AutonomousAgents andMultiagent Systems, AAMAS. International Foundation for Autonomous Agentsand Multiagent Systems, pp 1811–1813 (2017)
18. Sanderson, D., Chaplin, J.C., Ratchev, S.: Conceptual framework for ubiquitous cyber-physical assembly systems in airframe assembly. IFAC-PapersOnLine 51, 417–422 (2018).https://doi.org/10.1016/J.IFACOL.2018.08.331
19. Object Management Group Unified Modeling Language, UML. http://www.uml.org20. Object Management Group Data Distribution Service Specification (current). http://www.
omg.org/spec/DDS/Current21. Van Brussel, H., Wyns, J., Valckenaers, P., et al.: Reference architecture for holonic manufac-
turing systems: PROSA. Comput. Ind. 37, 255–274 (1998). https://doi.org/10.1016/S0166-3615(98)00102-X
22. Leitão, P., Restivo, F.: ADACOR: a holonic architecture for agile and adaptive manufacturingcontrol. Comput. Ind. 57, 121–130 (2006). https://doi.org/10.1016/j.compind.2005.05.005
23. Alam, K.M., El Saddik, A.: C2PS: a digital twin architecture reference model for the cloud-based cyber-physical systems. IEEE Access (2017). https://doi.org/10.1109/ACCESS.2017.2657006
24. Bundesministerium für Bildung und Forschung: Industrie 4.0 - Innovationen für dieProduktion von morgen (2014)
25. Wagner, C., Grothoff, J., Epple, U., et al.: The role of the Industry 4.0 asset administrationshell and the digital twin during the life cycle of a plant. In: IEEE International Conferenceon Emerging Technologies and Factory Automation, ETFA, pp 1–8 (2018)
26. Contreras, J.D., Garcia, J.I., Pastrana, J.D.: Developing of Industry 4.0 applications. Int. J.Online Eng. 13, 30–47 (2017). https://doi.org/10.3991/ijoe.v13i10.7331
27. Bellifemine, F., Poggi, A., Rimassa, G.: JADE—a FIPA-compliant agent framework. In: Pro-ceedings of the Fourth International Conference on Practical Applications Intelligent Agentsand Multi-Agent Technology (1999)
28. RTIRTIConnextDDSProfessional. https://www.rti.com/products/connext-dds-professional.Accessed 16 Sept 2019
29. Object Management Group: Interface Definition Language Specification v4.2 (2018). https://www.omg.org/spec/IDL/4.2/PDF. Accessed 16 Sept 2019
30. Object Management Group OMG IDL—CORBA. https://www.corba.org/omg_idl.htm.Accessed 16 Sept 2019
31. Henricksen, K., Indulska, J., Rakotonirainy, A.: Modeling context information in pervasivecomputing systems. In: Mattern, F., Naghshineh, M. (eds.) Pervasive 2002. LNCS, vol. 2414,pp. 167–180. Springer, Heidelberg (2002). https://doi.org/10.1007/3-540-45866-2_14
32. Weiser, M.: The computer for the 21st century. Sci. Am. 265, 94–104 (1991)

Context-Aware Plug and Produce for Robotic Aerospace Assembly 199
Open Access This chapter is licensed under the terms of the Creative Commons Attribution 4.0International License (http://creativecommons.org/licenses/by/4.0/), which permits use, sharing,adaptation, distribution and reproduction in anymedium or format, as long as you give appropriatecredit to the original author(s) and the source, provide a link to the Creative Commons license andindicate if changes were made.
The images or other third party material in this chapter are included in the chapter’s CreativeCommons license, unless indicated otherwise in a credit line to the material. If material is notincluded in the chapter’s Creative Commons license and your intended use is not permitted bystatutory regulation or exceeds the permitted use, you will need to obtain permission directly fromthe copyright holder.

Data Capture and Visualisation on aShoestring: Demonstrating the DigitalManufacturing on a Shoestring Project
Michael J. McNally(B), Jack C. Chaplin, Giovanna Martınez-Arellano,and Svetan Ratchev
Institute for Advanced Manufacturing, Advanced Manufacturing Building,University of Nottingham, Jubilee Campus, Nottingham NG7 2RD, UK
Abstract. The adoption of digital manufacturing in small to mediumenterprises (SMEs) in the manufacturing sector in the UK is low, yetthese technologies offer significant promise to boost productivity. Twomajor causes of this lack of uptake is the high upfront cost of digital tech-nologies, and the skill gap preventing understanding and implementation.This paper describes a common approach to data capture and visualisa-tion that is cheap and simple. Cheap through the utilisation of low costand readily available consumer technologies, and simple through the pre-defined flexible approaches that require a minimum of configuration. Thisapproach was implemented on three demonstrators to showcase the flex-ibility of the approach. These were a tool condition monitoring system,a job and machine status monitor, and a robotic process monitor. Thedevelopment process resulted in a software architecture where processeswere separated and communicated by message queues. We conclude thata service oriented architecture would be the best system for carrying for-ward the development process. This research was conducted as part ofthe wider EPSRC Digital Manufacturing on a Shoestring project.
1 Introduction
SMEs in the EU manufacturing sector account for 99% of companies, 58% ofemployees, but only 41% of value added [1]. Narrowing the productivity gapbetween small and large enterprises is a strong motivator for improving accessto digital technologies. In addition, according to the Made Smarter Report, effec-tive incorporation of digital technologies will bring not only benefits to the UKindustry itself (estimated £454BN over the next decade), but it is estimatedthat it will increase job satisfaction by 19%, significant C02 emissions reduction(estimated to 5.4 million tC02e), 70% less machinery breakdowns and 72,600workplace injuries avoided [2].
However, as well as the obvious quantitative factors, there are qualitative rea-sons for SMEs to improve digital skills. For example, product passports have beenproposed to enable greater product stewardship and end of life management [3];c© The Author(s) 2021S. Ratchev (Ed.): IPAS 2020, IFIP AICT 620, pp. 200–209, 2021.https://doi.org/10.1007/978-3-030-72632-4_14

Data Capture and Visualisation on a Shoestring 201
SMEs risk losing access to supply chains without adequate digital technologiesto participate. Conversely, with the right systems in place they have significantpotential for transition to sustainable eco-production [4].
One barrier to adoption faced by SMEs is that of justifying the capital expen-diture and a requirement for specialised personnel to implement and maintainthe digital technologies [5]. A critical challenge when supporting SMEs on theirdigital transformation is to introduce new methods and digital solutions that aresimple and low-cost, avoiding unnecessary investments of time and simplifyingthe business case [6]. In this context, the Digital Manufacturing on a Shoestringproject aims to enable a wider uptake of digital technologies in SMEs by chal-lenging traditional constructs of dedicated, pre-integrated technology to considerthe viability of simple, light-weight and lower cost approaches and providingguidelines to implement these [7].
Smaller firms commonly rely on manual skills for assembly tasks in particular,where capital costs of specialised assembly tools are prohibitive for the scale ofproduction: for example, PCB pick-and-place and reflow soldering equipment.In recognition of this, efforts have been made to introduce smart robotics forSME assembly and manufacturing needs [8], especially in complement to thetraditional reliance on hand work [9,10]. An example of a traditional manualtask is painting fastener heads, where a low cost approach has been demonstratedusing a specialised robot tool head and machine vision [11]. Additional researchhas focused on providing knowledge resources to workers, such as augmentedreality assisted systems [12] and the use of RFID to track progress of a partthrough a sequence of assembly processes [13]. Digitally enabled smart tools,like a low cost gap measurement microscope [14] offer new ways for workersto measure quality outcomes in assembly operations. Finally, widespread datacapture is essential to take advantage of the emerging ‘big-data’ methods inprecision assembly [15].
Underlying many of these technologies and systems is data capture and visual-isation. In this paper we describe a flexible cloud-based approach to data captureand visualisation that is applicable to the Shoestring project and works with dis-crete event, low frequency, and high frequency data. To validate the applicabilityof the approach, we deployed the data capture solution to three existing platforms.
Demonstration platforms were selected to represent a common range of datacollection problems in manufacturing with a variety of data types and frequen-cies. The base manufacturing platforms were chosen as examples of differentenvironments: an assembly line, a cooperative robot-human work cell, and aComputer Numerical Control (CNC) milling machine. These were then used tovalidate the application of one or more of the digital manufacturing technolo-gies identified as a priority by a series of focused workshops with manufacturingSMEs. The results of these workshops can be found in [16]. Data collection andvisualisation represents an important component of many of the identified solu-tions, illustrated in Table 1.
In order to approach the problem in line with the Shoestring ethos, ourdemonstrators had some additional requirements. Firstly, the solutions imple-mented needed to be incrementally scalable, so each solution would have minimal

202 M. J. McNally et al.
Fig. 1. Three demonstrators illustrate three different measurement types and use cases:(a) An assembly line produces discrete events representing the status of a particularstation or specific part on the line. (b) A multi-sensor monitoring system measures themotion of a robot, the vibration and temperature of a held product and the environ-mental conditions in the robot bay, generating low frequency continuous time seriesdata. (c) A 3-axis accelerometer mounted on a milling machine spindle produces highfrequency continuous data which is processed to deliver low frequency vibration, statusand condition data. All systems are connected to a cloud database and made accessibleto the user through a visualisation front-end.
requirements for other systems to be put in place. Following from this, solutionsneeded to be inter-operable, to facilitate introducing additional functionality tothe systems in discrete elements with minimum inter-dependency. Lastly, alldemonstrators were based on low-cost commercial- off-the-shelf microcomputers(Raspberry Pi) and hobbyist grade preassembled electronic modules.
Three demonstrators were prototyped:
1. A tool condition monitoring (TCM) system on a milling machine.2. A job and machine status tracker for an assembly line.3. A motion and environmental sensing suite for a robot arm.
2 Architecture
The design and implementation of the proposed architecture was driven by theShoestring vision, which introduced several constraints. Firstly, it should allowany implementation or solution to be incrementally scalable, so each solution

Data Capture and Visualisation on a Shoestring 203
Table 1. The demonstrators deployed and the solutions which they fulfill, either fully(dark grey), or partially (light grey). Solutions listed here are selected from the top 15solutions (of 52) identified through SME surveys [16].
Tool conditionmonitoring
Job & machinestatus tracking
Robotic processmonitoring
Real time tracking of internaljobs
Capacity monitoring ofresources
Optimisation of machine setuptimes
Predictive equipmentmaintenance
Condition monitoring ofequipment
Process monitoring(vibration/energy/temp ...)
would have minimal requirements for other systems to be put in place. This alsorequired any solutions to be interoperable, so that it was as simple as possibleto add additional discrete elements to generate new functionality.
Secondly, solutions needed to be cheap and widely used. Hence, all demon-strators used Raspberry Pi (model 3B+) microcomputers to log data from one ormore sensors, and upload this data to the cloud. This introduced another limita-tion: the limited hardware resources of the Raspberry Pi and the non real-timeoperating system.
A final requirement was to use a common architecture for each demonstrator,so that in principle a new solution could be rapidly developed on top of thisarchitecture.
The job status monitor recorded data from Programmable Logic Controllers(PLCs) from a Message Queue Telemetry Transport (MQTT) client over Eth-ernet, the robotic monitor had multiple modules all recording data from one ormore sensors connected via the Inter-Integrated Circuit (i2c) bus, and the toolcondition monitor recorded data from a sensor connected via Universal SerialBus (USB). Data rates ranged from approximately 200 bits per second (bps) forone message per second over MQTT to roughly 1 Mbps for 3-axis accelerometerdata encoded as byte strings and sent over USB serial. The higher data rateswere sufficient to block the reading threads - in the case of the sensors on i2c,even lower data rates could block the thread as the sensors required continuouspolling for data ready status.
To resolve these issues the program separate processes were used to readdata, analyse data, assemble messages and then post data to the cloud server.The principle is illustrated in Fig. 2. Code was written in Python, and eachthread was created using the multiprocess library. This spawns a new instanceof the python interpreter for each thread, which can now run in parallel on

204 M. J. McNally et al.
Fig. 2. Functional diagram of the sensor backend for all three demonstrators.
different cores of the Raspberry Pi, solving issues with limited processing powerand thread blocking. This general approach also meant that new adding a newsensor or functionality simply meant writing a new Python process which couldsend and receive data on message queues.
One input process handles an interface, reads data from the sensor device,parses out the data and tags it with the sensor name, a key, and a timestamp.This data is put onto a shared message queue. The shared queue is read by theprocessing thread which parses the key and then takes appropriate action. Afteranalysis, any results (e.g. cutting status) are put back on the message queue.All messages are eventually packaged into the correct string for database inputand then put in another message queue. The output process sends all messagesreceived out via http post to the cloud database.
Data is posted a database running on a cloud server. We used an InfluxDBdatabase running on an Amazon Web Services (AWS) Elastic Compute Cloud(EC2) instance. All data can be posted as plain-text using the InfluxDB Rep-resentational State Transfer (REST) Application Programming Interface (API)line protocol. This requires more bandwidth than raw data but is more flexiblefor different data types and labelling schemes. It can handle continuous numer-ical data as well as discrete tags for different categories (for example, assemblyline stations names or container numbers.)
The server also hosted a Grafana instance - an open source visualisationengine - which queried the InfluxDB instance for data. Queries were made withHyperText Transfer Protocol (HTTP) GET via InfluxDB REST API. Visuali-sations were manually built using the Grafana web interface, to summarise thestatus of each demonstrator. The full structure is illustrated in Fig. 3.

Data Capture and Visualisation on a Shoestring 205
Fig. 3. Outline block diagram of the connection between demonstrator end units, theplatform and end user browsers.
3 Demonstrator Functionality
3.1 Cloud Database and Visualisations
The most trivial level of interoperability was for the data recorded by all threedemonstrators to be stored and queried from the same database. To simplifydeployment in different locations in a large building, the database was locatedon a cloud server. Amazon Web Services was chosen for the cloud service andInfluxDB 1.x for the database. In both cases the decisions were made on existingfamiliarity with these tools within the research group.
Data was uploaded to the database using HTTP POST operations. Datawas queried from the database and displayed using Grafana open source webvisualisation software. This was chosen for flexibility and ease of use.
All demonstrators were therefore immediately inter-operable, as data fromany of them could be queried from the same database and displayed on the samescreen. Moreover this also enabled incremental development, as each solutioncould easily be added or removed without altering the functionality of any others.
3.2 Tool Condition Monitoring (TCM)
In manufacturing applications involving milling or cutting operations, estimatingthe total wear on the tool head allows use closer to it’s actual end of life. More-over, it can provide warning of an imminent tool failure or whether a process iscausing excessive tool wear.
The TCM system we implemented was deployed on a Hermle 5-axisCNC machine (Fig. 1c). Vibration data was captured using a LIS3DH 3-axisaccelerometer (ST-Microelectronics) connected to a microcontroller which pro-vided a USB interface. Data was recorded at 2.5 kHz in each axis.
Previous research within the group [17] had successfully applied mature deeplearning models to correlation matrix images of tool vibration data, and thisapproach was taken for tool wear inference. In previous work a high precisiondynamometer was used to measure vibrations, a full comparison between thetwo methods will be explored in upcoming work.
A Raspberry Pi was used to read messages from the USB, perform analysis,and upload the data and results to the cloud database.

206 M. J. McNally et al.
3.3 Job and Machine Status Tracking
The test-bed for job and status tracking was a Highly Automated System fromSMC International Training (SMC HAS-200 ), which is a assembly line environ-ment for training (Fig. 1a). The HAS-200 stations operate on barcoded contain-ers, whose codes contain the product information and so are used to determinethe station behaviour as each coded container moves through. The PLCs on eachstation were networked through an Ethernet switch, and were modified to out-put a simple MQTT message in response to: scanning a barcode and initiatingthe action, a change in station status, or a reject event (if a container failed atest.)
An MQTT broker was installed on a Raspberry Pi, to read MQTT messages,which were then parsed and the information posted to the database.
3.4 Robotic Process Monitoring
The robotics test-bed chosen was a KUKA industrial robot (Fig. 1b), modifiedwith a flexible fixturing for aerospace panel handling, and programmed to manip-ulate the panel into programmed positions for a worker to undertake assemblytasks. This was fitted with two sensor modules, with a further unconnected envi-ronment sensor module nearby.
Each sensor module consisted of a Raspberry Pi, a 5400 mAh Li-Ion bat-tery pack and the relevant sensors. The three different sensors were a motionmodule, a ranged module and an environment module, listed in Table 2. Sensorswere chosen to plug directly on the Raspberry Pi General Purpose Input/Ouput(GPIO) pins and were predominantly from the Mikroe ‘Click’ family of sensorboards, which are low-cost hobbyist grade boards.
Table 2. Table of sensor modules used in robotic process monitoring, including param-eters measured and the specific sensor products used.
Module Parameter Sensor
Environmental Temperature (◦C) pimoroni enviroPHat
Pressure (mbar)
Colour (RGBI)
Motion 3-axis acceleration (±2 g) IMU 6DoF 8 Click
3-axis gyroscope
3-axis acceleration (±100 g) Accel 3 Click
Ranged Laser Rangefinder LightRanger 2 Click
IR ranged thermometer IRThermo Click

Data Capture and Visualisation on a Shoestring 207
4 Discussion
The monitoring system has limitations owing to its nature as a proof-of-conceptdemonstration and prototyping platform. Firstly, the hardware implementationwas not suitable for full industrial deployment. The wireless sensor modules onthe robotic process monitor were battery powered from a 5400 mAh source.Based on specified current consumption of the Raspberry Pi and connected sen-sors we should not expect a lifetime over one day - unsuitable for a deployedapplication. However, many small, low-cost wireless sensor modules are availableand a future deployment would use these, potentially with another device as abridge to the cloud database, or to perform any analysis which is computation-ally expensive (and hence power hungry).
We used a cloud deployment for the database and visualisation. Though clouddata storage is commonly more secure than local data storage due to a robustbackup policy and regular security updates (depending on the cloud provider)it’s applicability to industrial circumstances does require some considerations.A future deployment will either need greater security or physical isolation frommission-critical industrial networks owing to the difficulty in securing and updat-ing large numbers of embedded devices. This is simple when using deployed sen-sors on their own network but will require new solutions for systems similar tothe MQTT monitor for assembly line monitoring.
A more prosaic problem with our specific implementation was the inflexibilityof the database to variable demand. It could easily accommodate continuouslywriting data from multiple sources. During live demonstrations when multipleusers were accessing data visualisations however, the database crashed due toinability meet multiple simultaneous requests for data. Future implementationswill also need to take advantage of flexible demand management and scalingtechnologies to maintain functionality.
Finally, whilst the software programs are broadly similar for each demonstra-tor, each is a bespoke solution with the sensor drivers, MQTT client, and dataparsing all coded in the same application. These could be separated into differ-ent programs for each function in a service-oriented architecture. In this schema,standalone Python software processes would be separated out into entirely dif-ferent programs which could communicate via publish/subscribe message queues(e.g. MQTT/Data Distribution Services etc.). This is a mature architecturealready proposed for low-cost industrial digitisation schemes [18].
5 Conclusions
We demonstrated how digital manufacturing technologies can be built fromcheap hobbyist-grade sensors and computers, can be quick and easy to install inprinciple, and require no changes in the operation of the equipment to function.
The system we have implemented is a simple low-cost industrial monitoringsolution. Operational and environmental data is gathered from a sensor systemmonitoring an aerospace panel fixturing, as a robot arm moves it a through a

208 M. J. McNally et al.
cycle of positions suitable for enabling a worker access to undertake assemblyprocedures. A tool condition monitoring system has been deployed on a 5-axisprecision machining centre which can capture high frequency vibration data, andreduce this to machine status and tool condition data. A job and part statusmonitor has been developed to track part progress and station status on anassembly line.
All data from these demonstrators is captured in a common cloud database,with an open-source visualisation engine providing access to graphs and analysisof this data from any location. Data can be presented as live values, such as cur-rent factory floor temperature; time series, for instance, robot arm 6-axis motion;or historic operational data, like a chart displaying the time spent cutting, idleor powered off.
The demonstrators produced so far show data capture and analysis for threedistinct use cases. However, a real manufacturing and assembly SME will requirereturns in terms of key metrics. To show value it will be essential to connectgathered operational and sensor data to product quality and assembly precision;process it into higher level inferences about machine utilisation, maintenance anddowntime; and potentially to tie these into business tools to synthesis complexquantities like return on investment from a process change.
Our future work will investigate low cost methods for collecting data onproduct quality, and develop analytic tools for linking the finished quality datato condition data acquired during manufactured. Similarly we will aim to buildtools linking manufacturing status data to business model, all within the DigitalShoestring ethos of low-cost flexibility, enabling SMEs to keep pace in a rapidlydeveloping industry.
References
1. Eurostat. Key size class indicators, manufacturing (NACE section c), EU-28.Annual enterprise statistics for special aggregates of activities (NACE Rev. 2)(2019)
2. Maier, J., et al.: Made smarter - review 2017. Accessed 08 Jan 20203. Jensen, J.P., Remmen, A.: Enabling circular economy through product steward-
ship. Procedia Manuf. 8, 377–384 (2017)4. Schlegel, A., Langer, T., Putz, M.: Developing and harnessing the potential of
SMEs for eco-efficient flexible production. Procedia Manuf. 9, 41–48 (2017)5. Mittal, S., Khan, M.A., Romero, D., Wuest, T.: A critical review of smart manu-
facturing & industry 4.0 maturity models: implications for small and medium-sizedenterprises (SMEs). J. Manuf. Syst. 49, 194–214 (2018)
6. Spena, P.R., Holzner, P., Rauch, E., Vidoni, R., Matt, D.T.: Requirements for thedesign of flexible and changeable manufacturing and assembly systems: a SME-survey. Procedia CIRP 41, 207–212 (2016)
7. McFarlane, D., et al.: Digital manufacturing on a shoestring: low cost digital solu-tions for SMEs. In: Borangiu, T., Trentesaux, D., Leitao, P., Giret Boggino, A.,Botti, V. (eds.) SOHOMA 2019. SCI, vol. 853, pp. 40–51. Springer, Cham (2020).https://doi.org/10.1007/978-3-030-27477-1 4

Data Capture and Visualisation on a Shoestring 209
8. Perzylo, A.: SMErobotics: smart robots for flexible manufacturing. IEEE Robot.Autom. Mag. 26(1), 78–90 (2019)
9. Zheng, C., Qin, X., Eynard, B., Bai, J., Li, J., Zhang, Y.: SME-orientedflexible design approach for robotic manufacturing systems. J. Manuf. Syst.53(September), 62–74 (2019)
10. Zheng, C., Zhang, Y., Li, J., Bai, J., Qin, X., Eynard, B.: Survey on designapproaches for robotic manufacturing systems in SMEs. Procedia CIRP 84, 16–21(2019)
11. Zhao, R., Drouot, A., Griffin, J., Crossley, R., Ratchev, S.: A low-cost automatedfastener painting method based on machine vision. In: Ratchev, S. (ed.) IPAS 2018.IAICT, vol. 530, pp. 92–100. Springer, Cham (2019). https://doi.org/10.1007/978-3-030-05931-6 9
12. Dassisti, M., Giovannini, A., Merla, P., Chimienti, M., Panetto, H.: An approachto support I4.0 adoption in SMEs: a core-metamodel and applications. IFAC-PapersOnLine 51(11), 42–47 (2018)
13. Minoufekr, M., Driate, A., Plapper, P.: An IoT framework for assembly trackingand scheduling in manufacturing SME. ICINCO 2019, 585–594 (2019)
14. Crossley, R., Ratchev, S.: Aerospace assembly gap measurement using low costsmart tools with machine vision. In: Ratchev, S. (ed.) IPAS 2018. IAICT, vol. 530,pp. 158–168. Springer, Cham (2019). https://doi.org/10.1007/978-3-030-05931-6 15
15. Schmitt, R., Dietrich, F., Droder, K.: Big data methods for precision assembly.Procedia CIRP 44, 91–96 (2016)
16. Schonfuß, B., McFarlane, D., Athanassopoulou, N., Salter, L., de Silva, L., Ratchev,S.: Prioritising low cost digital solutions required by manufacturing SMEs: ashoestring approach. In: Borangiu, T., Trentesaux, D., Leitao, P., Giret Boggino,A., Botti, V. (eds.) SOHOMA 2019. SCI, vol. 853, pp. 290–300. Springer, Cham(2020). https://doi.org/10.1007/978-3-030-27477-1 22
17. Martınez-Arellano, G., Terrazas, G., Ratchev, S.: Tool wear classification usingtime series imaging and deep learning. Int. J. Adv. Manuf. Technol. 104(9), 3647–3662 (2019). https://doi.org/10.1007/s00170-019-04090-6
18. Hawkridge, G., et al.: Tying together solutions for digital manufacturing: assess-ment of connectivity technologies approaches. In 2019 24th IEEE InternationalConference on Emerging Technologies and Factory Automation (ETFA), pp 1383–1387, September 2019
Open Access This chapter is licensed under the terms of the Creative CommonsAttribution 4.0 International License (http://creativecommons.org/licenses/by/4.0/),which permits use, sharing, adaptation, distribution and reproduction in any mediumor format, as long as you give appropriate credit to the original author(s) and thesource, provide a link to the Creative Commons license and indicate if changes weremade.
The images or other third party material in this chapter are included in thechapter’s Creative Commons license, unless indicated otherwise in a credit line to thematerial. If material is not included in the chapter’s Creative Commons license andyour intended use is not permitted by statutory regulation or exceeds the permitteduse, you will need to obtain permission directly from the copyright holder.

Digital Innovation Hubs for Enhancingthe Technology Transfer and DigitalTransformation of the European
Manufacturing Industry
Minna Lanz(B) , Jyrki Latokartano , and Roel Pieters
Tampere University, Tampere, [email protected]
https://www.tuni.fi
Abstract. The European manufacturers are dealing with shorter prod-uct life-cycles and smaller batch sizes. Especially, the high-value prod-ucts tend to be fully personalised, which makes the automatisation ofthe production difficult. However, the trend is that the production needsto be predictable and fully traceable to the process and even to the toollevel. This adds pressure to have better data collection methods and alsoto increase of automation in different levels of production. The emer-gence of new technologies in the field of robotics allows the utilisation ofautomation in flexible manner. Within all areas of robotics, the demandfor collaborative systems is rising as well. The level of desired collab-oration and increased flexibility will only be reached if the systems aredeveloped as whole e.g. perception, reasoning and physical manipulation.However, at the same time there is concerns on how to attract capablepersonnel to the factories. In order to fully implement and utilise the newrobotics technologies the industry needs capable resources. For answer-ing these needs there has been several attempts to build different typesof industrial ecosystems to facilitate better the technology and knowl-edge transfer, and share of expertise. The main aim of the paper is toreview recent actions regarding the robotics projects forming industrialecosystems in the Horizon 2020 framework programme, and then intro-duce the TRINITY Digital Innovation Hub (DIH) project approach toform an industrial ecosystem in the field of robotics.
Keywords: Digital innovation hubs · Robotics · ICT · Skills
1 Introduction
The demand for industrial robots (market) is anticipated to be growing to 65billion Euros by the year 2023 [13,31,34]. At the same time there is a rising needfor more flexibility and collaboration with robots and humans in the factoryfloor. The need for collaborative robots in the automation industry is acting as
c© The Author(s) 2021S. Ratchev (Ed.): IPAS 2020, IFIP AICT 620, pp. 210–219, 2021.https://doi.org/10.1007/978-3-030-72632-4_15

Digital Innovation Hubs 211
a driver for this market and is expected to serve as a market opportunity forfuture growth. In addition, various countries across the world are reviving theirelectronics and consumer goods industry, which is in turn contributing to thegrowing demand for collaborative robots. The continued rise of industrial robotscertainly seems to be an inevitability being driven by a variety of productiondemands, including the need for safer and more ‘simplified’ robotic technolo-gies to work in collaboration with humans, increased resource efficiency, andcontinued adaptation to the proliferation of automation and the IoT [13,31].
The use of industrial robots in large manufacturing companies is generallywell established and understood. However, In 2015, enterprises employing fewerthan 250 persons represented 99% of all enterprises in the EU. In manufacturingthe SMEs employ 57% of workforce [11]. In order to stay competitive, smallerscale and SME manufacturing need to embrace smart robotics to maintain effi-ciency and create jobs. Raising the output and efficiency of SME manufactur-ers will have a significant impact on Europe’s manufacturing and employmentcapacity. In turn this will increase overall employment as companies expandinto markets considered inaccessible given Europe’s comparative labour costs.Increasingly Europe will not only be competing against low wage economies butalso, increasingly, highly automated ones. Leadership in secure robotics technol-ogy will be a key differentiator of market share in many sectors.
1.1 Emerging Robotics Trends
The term ‘robot’ has also been undergoing a major change in the recent years.Robots are no longer standalone operation units such as in the 80’s. Today arobot is a part of a bigger system with multiple interfaces and related compo-nents such as flexible fixtures and grippers. Robots receive commands from theinternet and may even have no fixed sensors on their mechanical body, rathera combination of external sensors providing feedback to the mechanical systemdirectly or indirectly. The term ‘robot’ includes digital aspect, as robots embed-ded in cars/consumer electronics/mobile phones and any electronic appliancesthat can communicate through internet or other wired/wireless communication.This offers a huge business potential [20]. The next-generation robots that havethe potential to realise agile production processes are based on transformation ofindustrial robots to something that everyone can accept, understand, and utilize[13].
Human safety raises an issue. The footprint of the safety protected robot cellsare large, and static safety measures prevent reconfiguration of the cells, thusreducing the efficiency of work, especially small batch-size production. Note-worthy, the human-robot interaction research has been focusing world-wide onsmall, “human friendly” robots or inherently safe robot systems, such as Kukaiiwa, ABB YuMi and Baxter [6]. However, the future robotic systems will needcarry also large loads with long reach to serve better the European manufactur-ing industry [15]. These systems are designed to carry large loads with maximalspeed and a long range and at the same time the systems need to be highlyre-configurable [22] and adaptable to changing customer needs [27]. The level of

212 M. Lanz et al.
desired collaboration and increased flexibility will only be reached if the systemsare developed as a whole including perception, reasoning and physical manip-ulation. Industrial manufacturing is going through a process of change towardflexible and intelligent manufacturing, the Human-robot collaboration (HRC)will have a more prevalent role in future [26].
Traditionally fences prevent the operators from moving into the robots’ work-ing area. This evolution means breaking with the established safety proceduresas the separation of workspaces between robot and human operator is removed[18]. Also due to economic reasons, there is a need to decrease the factory foot-print, allow existence of shared workplaces, and maintain and reconfigure theproduction environment while production is running [15,36]. Hence, when con-sidering especially the large-sized robots with significant mass of inertia, allsensory solutions that help robots react to danger are useful now, not just yearsfrom now.
1.2 Ecosystems
Based on the discussion and vision papers from the European technology plat-forms and communities, the innovation ecosystems will play major role in futureresearch, development and innovation developments. In the visions the ecosys-tems are expected to contribute to economy and business creation from advancedtechnologies, building of innovation ecosystems, and facilitating the skills devel-opment in Europe [2,25].
Big Data Value Association and euRobotics [2] in their joint vision expectInnovation Ecosystems to have following features:
– European focal point for exchange and coordination of the AI, Data andRobotics innovation communities
– National and regional alignment– Engagement of Stakeholders
Manufacture Vision 2030 [25] described the future manufacturing ecosystemsto be complex, multi-facetted, highly networked and, dynamic socio-technicalsystem. The emerging technologies such as Artificial Intelligence (AI) and Dig-ital Security and Connectivity increase the vertical and horizontal integration,considering the whole life cycle of manufactured products. Physical productsand service offerings are fully integrated into the lifecycle, including design andengineering, embedded systems, process support systems, production technologyand support services. AI will enable increased levels of automation and humaninteraction, while Cyber Security will be a prerequisite for global collaborationand interaction. In this broad ecosystem, the manufacturing impact and strate-gic importance can be measured in terms of value added and created direct andindirect jobs.
1.3 Future Skills
In small and medium-sized enterprises (SMEs), training needs arise from theincreased use of modern digital manufacturing tools, cybersecurity new additive

Digital Innovation Hubs 213
manufacturing processes and novel engineering of intelligence solutions. As adirect result, workers need to develop new skills and competences to work effec-tively [16]. From an educational perspective. It is especially critical that peo-ple with few prior successful experiences in fully applying the key information-processing skills should obtain adequate comprehension to guide them in struc-tural changes in their future working lives. Human capital is the main enablerfor adopting the emerging technologies such as robotization and digitalization[23]. However, the number of science enrolments and graduates in Europe hasbeen slowing down over the last decade, declining from 24.3% in 2002 to 22.6%in 2011 according to Eurostat. The males still predominate the field of engineer-ing, by representing more than 80% of graduates in particular in the fields ofcomputing and engineering [10].
The key challenge in addressing the evolution of future education in themanufacturing sector involves developing skills and expertise as well as peda-gogical and technological approaches that match the changing needs of today’sand future workplaces [3,25]. While the discussion is indeed about the skills gapand how to improve existing skills, there is little attention paid to demographics.The population of Europe is not growing, and the decrease is expected to startaround 2040–2050 in Europe [14].
2 Review of Digital Innovation Hubs in Robotics
The Digital Innovation Hubs are expected to have both a local and Europeanfunctioning. Member States will be expected to co-invest in the hub throughfunding the facilities and services with a local impact in their regions/country,whereas the European dimension (opening up the facilities to all of Europe andimporting missing expertise) will be funded through a grant of Digital Europe.The main reason for developing the DIH concept is to facilitate the digitalisationof the European industry. The level of digitalisation of industry remains uneven,depending on the sector, country and size of company. Many organisations stillstruggle to make the most of digital opportunities due to lack of knowledgeor difficulties to find finance [9]. The need for enhanced technology transfer ishighlighted in both ManuFuture [25] and EuRobotics [2] Vision documents.
During the H2020 Framework Programme several Digital Innovation ramp-up projects were funded. The Fig. 1 shows the list of funded and/or currentlyrunning project. The state of the art review is based on material found fromCordis database [4]. The keywords used to find robotics projects were “robot”,“robotics”, “fstp”, “cascade”, “re-configuration”, “automation”. The search waslimited projects in Horizon 2020 programme within the H2020 Industrial Lead-ership - Leadership in enabling and industrial technologies - Information andCommunication Technologies (ICT).
Based on the review there is a number of Digital Innovation Hubs emergingoffering funding for SMEs with slightly different manners. The projects maturitylevel is defined by the call, which is Innovation Action. The expected technologyreadiness level (TRL) is mainly between 5 and 7, where the TRL5 stands for

214 M. Lanz et al.
Fig. 1. The analysis of DIH activities within past 5 years
‘technology validated in relevant environment (industrially relevant environmentin the case of key enabling technologies)’ and TRL7 for ‘system prototype demon-stration in operational environment’. In some cases the demonstrations can reachTRL 8 e.g. demonstration called in RobotUnion [32]. Most of these are dedicatedto publish smaller demonstrators that include training and set-up material to beused by companies later on. The Horse [19], L4MS [24] and Reconcell [29] werefunded under ICT Innovation for Manufacturing SMEs (I4MS) where the specialfocus was on robotics applications. ESMERA [12], COVR [5] and RobotUnion[32] had the special focus on System abilities, SME and benchmarking actions,safety certification. The TRINITY [35], DIHsquared [7], agROBOfood [1], RIMA[30] and DIH-Hero [17] were funded under H2020 Industrial Leadership with thefocus on building Digital Innovation Hubs for Robotics, with the special requestfor developing a marketplace and community for disseminating and exploitingresults post-project. The Coordination and Support Actions (CSA) RODIN [33]and DIHNET [8] are mentioned as they intent to facilitate the collaborationamong the cascade funded projects.
3 Trinity DIH - Concept and Approach
The main objective of TRINITY is to create a network of digital innovationhubs (DIHs) composed of Research Centers and University Groups specialisedin Advanced Robotics and Internet of Things (IoT), supported by a DIH withexperts in Robotics Cyber security to contribute to novel robotics solutions thatwill increase agility in production. The second objective is to continue this net-work after the ramp-up phase, by building a sustainable business model through-out the project lifetime. The third objective is to deliver a critical mass of use casedemonstrations in collaboration with industry to support the industrial mod-ernisation leading to more agile production and increase the competitiveness of

Digital Innovation Hubs 215
European companies. The modular and reconfigurable use case demonstrationswill show how to combine robotics, IoT and Cybersecurity together. Further-more, TRINITY will contribute to answer the European Industry demand foradvanced, highly flexible and collaborative robotic solutions to keep companiescompetitive. TRINITY aims to bring together top researchers and industry fromall over Europe with the objective of developing new, digital and human orientedrobotic technology for improving agility of European manufacturing and inno-vation capabilities.
3.1 Use-Case Demonstrations
The TRINITY-project aims to deliver 50 use-case demonstrations to the mar-ket. Each of the demonstrations include different technical solutions, called mod-ules. 20 of these are internal demonstrations that are openly disseminated. Partof these demonstrations are fully open source. The idea is that each moduleinterfaces are described as public specification document. Each internal use-casedemonstration module will in the end include set-up tutorials and training mate-rial associated to that particular technology.
Fig. 2. The positioning of internal use-case demonstrations in the TRINITY project
The approach for building use-case demonstrations is divided into 4 stages.
– The first 12 months of the TRINITY was dedicated to the research anddevelopment of the internal use case demonstrations. This stage ensured thatthe project’a Internal demonstrations meet the market requirements and areappealing to the small batch and mainstream manufacturing and roboticssectors.

216 M. Lanz et al.
– The internal use case demonstrations and their modules will be enhancedand modified to fit the companies interests during year 2. Extensive testingwill be carried out in all aspects related to the performance, effectiveness,deployability, and safety. This year is dedicated also for running the firstopen call and development of business plan for DIH and individual exploitableresults.
– In the third phase the new demonstrations from the open call will be includedto the digital catalog the TRINITY develops for marketing and disseminationpurposes. This is expected to increase the visibility of possible robotics-relatedsolutions among SMEs. During this year the second open call will be started.
– The final phase includes the finalisation of education management system andsecond round of 3rd party use-case demonstrations will be in the main focus.The results from both of these will be assessed and included to the businessplanning of DIH, internal demonstration and 3rd party demonstrations.
3.2 Concept for Approaching the Industrial Partners
The project aims to attract the new industrial companies by offering fundingopportunities via open calls. The main aim is bring together partners who havenot collaborated previously but wish to try collaboration in a European widescheme. The open call for demonstrations is done in collaboration with partic-ipating cluster organisations and with an external advisory board in order toensure that the maximum number of companies around Europe are reached.The consortium members will set up several web lectures on how to apply forfunding for the demonstrations. It is expected that in the first open call therewill be 30–50 applications for funding, majority focusing on the adoption and/ordevelopment of robotics technologies.
4 Conclusions
The main aim of the paper was to discuss of the future needs of the Euro-pean industry and of the possibilities for improved technology transfer methodsdeployed in previous years. According to the visions referred there is a strongbelief that with robotics European industry can increase the product quality, pro-duction capacity and production predictability, and with by applying IOT andAI the horizontal and vertical transparency of supply network could be increasedwhile non-value added time in order-delivery processes could be decreased. Thethird expectation for the emerging ecosystems is to support the technology trans-fer from science to industry, support the resource and capacity sharing amongthe companies, and support life-long learning of working personnel. The pop-ulation of the Europe is not growing, and at the same time there is a lack ofinterested and qualified workers coming to the markets. Partly this is becauseof demographics, and partly due to the decreasing interest towards STEM top-ics among younger generation. The Digital Innovation Hubs -concept in generalaims to support the knowledge, technology and competence transfer and sharingamong European SMEs.

Digital Innovation Hubs 217
This paper also provided a short overview of concrete and recent actionsregarding the robotics ecosystem building and/or building of Digital Innova-tion Hubs having (or supporting projects with) a cascade funding dimensionfor experiments and/or demonstrators. The time perspective was set to projectsfunded from 2016 onwards. As the Fig. 1 shows there is a good number of projectsrunning different types of cascade programs. The main idea in these is to bringH2020 framework programmes closer to the European SMEs and support themin digital transformation and adoption of emerging technologies. A more detailedoverview of the project TRINITY DIH project was included into the paper. TheTRINITY aims to increase the interest of the companies with different use-casedemonstrations (or prototypes) that could be replicated to industrial setting.While there are no concrete KPIs of the success the previous cascade fundingprojects show increasing interest from the SMEs. Secondly the TRINITY DIHproject intents to deliver both realistic use-cases and associated training materialfor using novel robotics technologies in the manufacturing.
Acknowledgements. This project has received funding from the European Union’sHorizon 2020 research and innovation programme under grant agreement No 825196.
References
1. DIH agROBOfood - Business-Oriented Support to the European Robotics andAgri-food Sector, towards a network of Digital Innovation Hubs in Robotics, GA825395. https://agrobofood.eu/
2. BDVA - euRobotics, Joint Vision Paper for an Artificial Intelligence Public PrivatePartnership (AI PPP), p. 7 (2019)
3. Chryssolouris, G., Mavrikios, D., Rentzos, L.: The teaching factory: a manufac-turing education paradigm. In: 49th CIRP Conference on Manufacturing Systems,Procedia CIRP (2014)
4. European Commission, Statistics. https://cordis.europa.eu. Accessed 31 Jan 20205. COVR - Being safe around collaborative and versatile robots in shared spaces, GA
779966. https://safearoundrobots.com/. Accessed 30 Jan 20206. De Santis, A., Siciliano, B., De Luca, A., Bicchi, A.: An atlas of physical human-
robot interaction. Mech. Mach. Theory 43(3), 253–270 (2008)7. DIHsquared. https://dih-squared.fundingbox.com/8. DIHNET - Next Generation European DIH Network, GA 825640. http://www.
dihnet.eu. Accessed 31 Jan 20209. European Commission, DG Connect, Digital Innovation Hubs, Draft (2018).
https://ec.europa.eu/futurium/en/system/files/ged/digital innovation hubs indigital europe programme final2 december.pdf
10. European Commission, DG on Directorate-General for Education, Youth, Sportand Culture, 2019, Education and Training, MONITOR 2019, Country analy-sis. https://ec.europa.eu/education/sites/education/files/document-library-docs/volume-2-2019-education-and-training-monitor-country-analysis.pdf
11. Eurostat Explained, Manufacturing statistics - NACE Rev. 2 (2019). https://ec.europa.eu/eurostat/statistics-explained/index.php/Manufacturing statistics -NACE Rev. 2#Sectoral analysis

218 M. Lanz et al.
12. Esmera - European SMEs Robotics Applications, GA 780265. http://www.esmera-project.eu/welcome/. Accessed 31 Jan 2020
13. euRobotics, Robotics 2020 - Strategic Research Agenda for Robotics in Europe, p.100 (2013)
14. European Commission, People in the EU - statistics on demographicchanges. https://ec.europa.eu/eurostat/statistics-explained/index.php/People inthe EU - statistics on demographic changes
15. Halme, R.-J., Lanz, M., Kamarainen, J., Pieters, R., Latokartano, J., Hietanen,A.: Review of vision based safety systems for human-robot collaboration. In: CIRPCMS 2018, Procedia Manufacturing, Stockholm, May 2018
16. Hamalainen, R., Wever, B., Malin, A., Cincinnato, S.: Education and workinglife: VET adults’ problem-solving skills in technology-rich environments. Comput.Educ. 88(October), 38–47 (2015)
17. DIH Hero - Digital Innovation Hubs in Healthcare Robotics, GA 825003. https://dih-hero.eu. Accessed 31 Jan 2020
18. Hietanen, A., Pieters, R., Lanz, M., Latokartano, J., Kamarainen, J.-K.: AR-based interaction for human-robot collaborative manufacturing. J. Robot. Comput.Integr. Manuf. 63, 18 (2019)
19. Horse - Smart integrated Robotics system for SMEs controlled by Internet ofThings based on dynamic manufacturing processes, GA 680734. http://www.horse-project.eu/. Accessed 31 Jan 2020
20. International Federarion of Robotics, Statistics, 2017 report (2017). https://ifr.org21. International Labour Office, A Skilled Workforce for Strong, Sustainable and Bal-
anced Growth: A G20 Training Strategy, ISBN 978-92-2-124278-9 (2010)22. Jarvenpaa, E., Siltala, N., Lanz, M.: Implementation of capability matchmaking
software facilitating faster production system design and reconfiguration planning.J. Manuf. Syst. 53, 261–270 (2019)
23. Lanz, M., Jarvenpaa, E.: Social sustainability and continuous learning in the cir-cular economy framework. Leal Filho, W., Azul, A., Brandli, L., Ozuyar, P., Wall,T. (eds.) Responsible Consumption and Production, Encyclopedia of the UN Sus-tainable DevelopmentGoals. Springer, Cham (2019). https://doi.org/10.1007/978-3-319-71062-4 35-1
24. L4MS - Logistics for Manufacturing SMEs, GA 767642. http://www.l4ms.eu/.Accessed 26 Jan 2020
25. Manufuture, ManuFUTURE Vision 2030 - A Competitive, Sustainable andResilient European Manufacturing, Report of the ManuFUTURE ? EU High-LevelGroup, p. 37, April 2018
26. Michalos, G., Makris, S., Tsarouchi, P., Guasch, T., Kontovrakis, D., Chryssolouris,G.: Design considerations for safe human-robot collaborative workplaces. ProcediaCIRP 37, 248–253 (2015)
27. Michalos, G., Fysikopoulos, A., Makris, S., Mourtzis, D., Chryssolouris, G.: Multicriteria assembly line design and configuration - an automotive case study. CIRPJ. Manuf. Sci. Technol. 9, 69–87 (2015)
28. Micro-ROS - Platform for seamless integration of resource constrained devices inthe robot ecosystem, GA 780785. https://micro-ros.github.io. Accessed 31 Jan2020
29. Reconcell - A Reconfigurable robot workCell for fast set-up of automated assemblyprocesses in SMEs, GA 680431. http://www.reconcell.eu/index.html. Accessed 26Jan 2020
30. DIH Rima - Robotics for Infrastructure Inspection and MAintenance, GA 824990.https://rimanetwork.eu/. Accessed 31 Jan 2020

Digital Innovation Hubs 219
31. Robotics Tomorrow, Collaborative Robots Market - Shifting Technologyfrom Robots to Cobots http://www.roboticstomorrow.com/news/2016/11/03/collaborative-robots-market-shifting-technology-from-robots-to-cobots/9049/(2016)
32. RobotUnion - Stimulate ScaleUps to develop novel and challenging TEchnologyand systems applicable to new Markets for ROBOtic soLUTIONs, GA 779967.https://robotunion.eu. Accessed 31 Jan 2020
33. RODIN - RObotics Digital Innovation Network, GA 825263. https://rodin-robotics.eu/. Accessed 29 Jan 2020
34. EmerJ, Global Competition Rises for AI Industrial Robotics (2019). https://emerj.com/ai-sector-overviews/global-competition-rises-ai-industrial-robotics/
35. TRINITY - Digital Technologies, Advanced Robotics and increased Cyber-securityfor Agile Production in Future European Manufacturing Ecosystems, GA 825196.https://www.trinityrobotics.eu
36. Vogel, C., Walter, C., Elkmann, N.: Safeguarding and supporting future human-robot cooperative manufacturing processes by a projection- and camera-based tech-nology. Procedia Manuf. 11(June), 39–46 (2017)
Open Access This chapter is licensed under the terms of the Creative CommonsAttribution 4.0 International License (http://creativecommons.org/licenses/by/4.0/),which permits use, sharing, adaptation, distribution and reproduction in any mediumor format, as long as you give appropriate credit to the original author(s) and thesource, provide a link to the Creative Commons license and indicate if changes weremade.
The images or other third party material in this chapter are included in thechapter’s Creative Commons license, unless indicated otherwise in a credit line to thematerial. If material is not included in the chapter’s Creative Commons license andyour intended use is not permitted by statutory regulation or exceeds the permitteduse, you will need to obtain permission directly from the copyright holder.

Plenoptic Inspection System for AutomaticQuality Control of MEMS and Microsystems
Moritz A. Kirschmann1(B), Jörg Pierer1, Alexander Steinecker1, Philipp Schmid1,and Arne Erdmann2
1 CSEM SA, Gründlistrasse 1, 6055 Alpnach Dorf, [email protected]
2 Raytrix GmbH, Schauenburgerstr. 116, 24118 Kiel, Germany
Abstract. Optical quality control of MEMS and microsystems is challenging asthese structures are micro-scale and three dimensional. Here we lay out differentoptical systems that can be used for 3D optical quality control in general andfor such structures in particular. We further investigate one of these technologies– plenoptic cameras and characterize them for the described task, showing advan-tages and disadvantages. Key advantages are a huge increase in depth of field com-pared to conventional microscope camera systems allowing for fast acquisition ofnon-flat systems and secondly the resulting total focus images and depth maps.Finally we conclude that these advantages render plenoptic cameras a valuabletechnology for the application of quality control.
Keywords: Optical inspection · Lightfield camera · Plenoptic camera ·Automatic defect recognition · 3D inspection
1 Introduction
1.1 MEMS and Typical Defects
Advancements in manufacturing techniques of micro-electro-mechanical systems(MEMS) andmicrosystems such as deep reactive ion-etching further increased the rangeof possible applications of these systems. Bridging the world of electronics and mechan-ics, MEMS are used for applications as micro actuators, generating sound, vibration andliquid flow in microfluidic pumps, while micro sensors turn acceleration, gyroscopicforces, inertia, pressure, sound waves et cetera into electric signals. These actuators andsensor are used in many industries such as mobile computing, automotive, VR/AR, elec-tronic entertainment, pharma and medical. To achieve high production yield and qualityof the final products quality control is key. Functional testing of MEMS is often onlypossible in a further integrated assembly. Yet it is desirable to assess product quality asearly as possible to avoid assembly of defect components into integrated systems ren-dering a whole assembly worthless. To assess quality in an early stage avoiding further
© The Author(s) 2021S. Ratchev (Ed.): IPAS 2020, IFIP AICT 620, pp. 220–232, 2021.https://doi.org/10.1007/978-3-030-72632-4_16

Plenoptic Inspection System for Automatic Quality Control 221
assembly, optical quality control is one possibility. However,MEMS have a key propertythat makes optical quality control specially challenging: functional structures of MEMSare intrinsically extended in depth (see Fig. 1, Fig. 2 and Fig. 3).
Fig. 1. Schematic cross-section of a Capacitive Micromachined Ultrasonic Transducer (CMUT)device (top-left), optical microphotographs of CMUT devices in top view (lower-left) and (right) acol-or-coded depthmap acquired by holographicmicroscopy (image curtesy of Philips ElectronicsNederland B.V.).
Fig. 2. Microphotograph of CMUTs with typical defects highlighted by white arrows: MissingCMUT disks (left) and dust, resist or other particles (right); (image curtesy of Philips ElectronicsNederland B.V.).
An optical quality control system for MEMS must therefore fulfill three require-ments: (1) Micrometer-scale features must be resolved in all three spatial dimensions.Production defects such as a displaced transducer bridge or wire bond may only bedetectable by utilizing height data captured by the optical system. (2) The relevant depthof the product must be acquired at sufficient resolution. (3) The system’s throughputmust be high enough to allow for real-time inspection of produced units.

222 M. A. Kirschmann et al.
Fig. 3. Aselection of failures and defects that can occur during the fabrication of the Flex-to-Rigidstructures (image curtesy of Philips Electronics Nederland B.V.).
1.2 State of the Art (3D) Inspection Technology
Different optical acquisition systems can be used for quality control in general but onlya few are suitable forMEMS inspection. The straightforward approach is the applicationof conventional wide field microscopy. Considering a typical microscope objective withsub-micrometer resolution a Field of View (FoV) in the range of 0.3 mm2 might be

Plenoptic Inspection System for Automatic Quality Control 223
captured with one image. Capturing the area of an eight-inch wafer (30’000mm2) wouldalready require 100’000 images. The typicalDepth of Field (DoF) of the same lens coversmaximally 2 in height [1]. For MEMS with 3D structures covering a thickness rangingfrom sub-micrometer up to several 100 µm, a technique called “focus stacking” may beused to expand the DoF and acquire depth data [2]. For very common structures 100µmin height the eight-inch wafer required an amount of 5 million images. Even with afast camera enabling 100 fps (frames per second) and a manipulation system matchingthis speed for repositioning the wafer it would take 14 h to capture the 3D data, notyet considering any kind of image analysis. While 2D inspection is a very commontechnique, 3D by focus stacking is not employed in industry for MEMS inspection.
Another possibility to obtain 3D depth information are stereo camera images byanalyzing shift of parallax of image features.However, parts of an image that are occludedfrom one view lack parallax information. This renders inference of the depth impossibleat these places. Systemswithmore camerasmitigate this issue as the chance of occludingparts of the image for all but one camera decreases with the number of cameras [3].However, the complexity and bulkiness of the system also increases with the numberof cameras. The need for two lenses and cameras imaging the same FoV limits theapplication to macroscopic lenses. Thus the limited achievable resolution, laterally aswell as in height, so far prohibits the application of stereo camera systems for MEMSinspection (Fig. 4).
Fig. 4. Stereo camera system offered by Ensenso GmbH [4].
Laser Line Triangulation (LLT) illuminates the sample by swiping a projected laserline from an angle to the viewing direction [5]. Depth displacement in the imaged sampleshifts the apparent laser line position. On uniform samples such systems deliver precisedepth maps quickly [6] but samples with strong differences in reflectivity and absorptioncan cause artefacts. The lateral resolution of such systems ismostly limited by diffractionproperties of the projected laser beam (several µm) while the depth resolution is afunction of incidence angle, sensor pixel size and lens magnification. Common systemsrange from µm to several 10 µm. LLT systems do not generate photo-like images andtherefore need to be combined with microscope cameras in order to deliver image anddepth map.

224 M. A. Kirschmann et al.
A very similar technology probably in direct competition to plenoptic cameras isstructured illumination microscopy. It probably also is the most versatile technologyranging from moiré fringe exploitation [7] to various kind of pattern projection and 3Dinformation extraction [8]. In the first case the superposition of a well-defined illumi-nation pattern with the structure of the object generates a beat pattern otherwise knownas moiré fringes. The scene has to be captured several times with slightly re-orientedor phase shifted pattern. The simpler pattern projection relies on known geometric rela-tions between camera and projector with the advantage to need only one image per scene,depending on the actual pattern. In both cases subsequent processing of the image(s)enables the generation of 3Ddata.With proper computational hardware and a fast cameraseveral 3D images might be obtained per second. In terms of DoF, FoV and resolutionthe same constraints as for any other optical system apply (Fig. 5).
Fig. 5. Schematics of (left) laser line triangulation [5] and (right) structured light illumination[8].
Imaging based on holography employing laser interference (DHM Digital Holo-graphic Microscopy) offers outstanding depth resolution around 20 nm and simultane-ously a considerable DoF of up to a few 100 µm [9–11]. The latter one, however, isonly true for rather continuous structures. As soon as steps and sharp edges are involvedthose numbers get down to sub-um up to a few um. The lateral resolution as well as theFoV are limited by laws of physics just as for the other optical imaging technologiesas well. Even so this technology has some drawbacks, it offers very high performancein terms of 3D imaging. Unfortunately, this comes literally at costs at least an order ofmagnitude higher than any of the other systems (Fig. 6).
OCT (Optical Coherence Tomography) as a 3D imaging technology shall be men-tioned as well. Although an interferometric principle as holography it relies on a shortcoherence length of broadband light sources such as superluminescent LEDs [12]. Typ-ical depth resolution achieved goes down to the sub-micrometer range. The DoF of anOCT system depends on either a mechanical movement of a mirror in the reference arm(Time Domain OCT) or the wavelength sweeping of the source (Frequency Domain

Plenoptic Inspection System for Automatic Quality Control 225
Fig. 6. Typical outline of a Digital Holographic Microscopy system [11].
OCT) and is for TD-OCT at least in theory only limited by size constraints. Lateralresolution again is limited by physics, depending on the lens used. Besides the needfor depth scanning which increases the acquisitions time the small number of pixels ofavailable cameras with smart pixels (e.g. 280 × 292 [13]) limits the FoV and therewithfurther increases the acquisition time. It shall be mentioned that standard cameras maybe used as well but demand a way more complex setup [14].
2 3D Real-Time Imaging with Plenoptic Camera
In the following the hard- and software technology of plenoptic cameras and theirapplications in our context of inspection systems are described.
2.1 Principle of Plenoptic Camera Technology
The general principle of a plenoptic, also known as light field camera dates back toLeonardo Da Vinci and he even described the principle of a pinhole camera to capturethe light field [15]. The first multi-lens concept and actual camera was described anddeveloped by physicist Gabriel Lippmann in 1908 [16] although the term “light field”was not used at this time. In 1992 Edward Adelson and John Wang published an articledescribing the plenoptic camera concept as, in its basic principle, is used until today[17].
Conventional 2D digital cameras use objectives which images an object onto a 2-dimensional array of photosensitive elements. In a plenoptic camera, as Adelson andWang described, a microlens array is placed between main lens and the photosensitivecamera chip. Hereby the main lens generates an intermediate image which subsequentlyis imaged by the microlenses onto subsegments of the photosensitive part of the chip[18] (see Fig. 7).

226 M. A. Kirschmann et al.
Fig. 7. Schematic representation of imaging with standard (left) and plenoptic camera (right).(Color figure online)
As depicted by the small red respectively yellow arrow on the right side of Fig. 7, theobject point will be imaged on a different camera pixel with respect to the optical axisof the corresponding microlens. Based on that not only the position of the object pointin space can be determined but as well the direction wherefrom the light rays originated.Adjacent microlenses are producing sub-images with are partially overlapping FoVs.Knowing the configuration of main lens, microlens array and camera chip it is possibleto computationally reconstruct a 2D image and a depth map [19] (Fig. 8) which togetherare used to form the 3D image as depicted in Fig. 9.
Fig. 8. Computational reconstructed image (bottommiddle) from raw image (left). Themicrolenssub-images are visible in the enlarged image (top middle). The image on the top right shows thecolor-coded depth map for high contrast areas while below the same map is filled.

Plenoptic Inspection System for Automatic Quality Control 227
Fig. 9. Real-time 3D image as obtained by Raytrix light field camera.
2.2 Application of Plenoptic Cameras for MEMS and Microsystems Inspection
As summarized above many 3D imaging technologies exist, each having its strengthsand weaknesses. The same is true for plenoptic cameras. Due to redundant imaging ofobject points on several microlens sub-images the reconstructed 2D image loses planarresolution by a factor of 2-times in every direction. This may be countered by use oflarge pixel count camera chips. However, this increases the amount of data to be handledby the camera interface, the computational hardware and finally by means of storage.Actually these are the main reasons why plenoptic cameras became available for realworld applications only during the last decade. Modern GPU hardware made real-timereconstruction of high pixel count light field camera images manageable.
Plenoptic cameras of Raytrix offer unique advantages for industrial applications. Asonly one camera with a standard main lens is needed, the entire setup becomes ratherlean and consumes little space. Assuming a fast interface, e.g. Camera Link, acquisitionof full 3D images at 80 frames per second is feasible. As a side effect of the specialRaytrix technology using microlenses with different focal lengths on each of the arrays[19], the DoF is increased by a factor of 6 compared to a standard cameras. The probablybiggest advantage compared to many of the other 3D imaging technologies is the almosttotal lack of occlusion. As can be seen in Fig. 10 this enables inspection of devises withhigh aspect ratios and steep edges.

228 M. A. Kirschmann et al.
Fig. 10. Upper left: raw image from a plenoptic camera, Lower left: detail crop from the areamarked by the red rectangle. Round sub-images created by the microlenses are visible. Note theduplication of features in neighboring sub-images. Lower right: algorithmically reconstructedsharp image. Right: 3D rendering of the image. (Color figure online)
Within a European project “CITCOM”1 we are investigating in detail the 3DMEMSinspection using light field cameras. We used and assessed two different plenopticcamera-main lens combinations during development of an automatic optical quality-control system. Specs of those are provided in Table 1. Shown in Fig. 11 is the test setup
Table 1. Main specifications of used plenoptic cameras
Raytrix R26 Raytrix R12
Working distance 48 mm 20 mm
Field of View 7.8 × 7.8 mm2 0.65 × 0.44 mm2
Lateral resolution 3 µm 0.7 µm
Depth of Field 1.1 mm 60 µm
Depth resolution 2.5 µm 0.4 µm
Frame rate (max) 81 fps 30 fps
1 www.citcom.eu; This project has received funding from the European Union’s HORIZON 2020research and innovation program under Grant Agreement no. 768883.

Plenoptic Inspection System for Automatic Quality Control 229
Fig. 11. Development setup with two plenoptic cameras Raytrix R26 (left) and R12 (right).
(no cabling) with a Raytrix R26 camera and 3× telecentric lens on the left side and aR12 in microscope configuration employing a 20× main lens.
The R26 setup enables very fast capturing of an entire eight-inch wafer. Consid-ering an overlap of 10% to enable stitching of the images only about 600 images areneeded which might be acquired in less than 10 s. In practice, however, not the speedof the camera is limiting the acquisition time but the movement of the stages. Whilethe 3D reconstruction of a single image can be obtained at the maximal frame rate onPCs employing 4 GPUs (Graphic Processing Units), image stitching and automatedrecognition of defects and anomalies have to be considered as well.
While most of the typical defects and anomalies might be found with this setup,some demand for higher resolution in both, lateral as well as vertical direction. For thosecases a second camera, an R12 in combination with a microscope objective, are used onspecific areas of interest. Scanning the entire wafer with this camera is neither usefulconsidering the necessary 130’000 images at 30 fps (frames per second) taking morethan one hour at best, nor is it needed. With a FoV covering less than 0.3 mm2, mostof the wafer or substrate area appears as a plain, feature-less surface, while in specificareas a closer look might be highly appreciated.
Images taken with the setup described above are presented in Fig. 12 allowing formetrology in all spatial dimensions on a sub-micrometer scale.
An actual disadvantage that accounts for other techniques as well is the inability tocomputationally reconstruct the depth map at locations with missing contrast. Howeverthis can be mitigated by illuminating with a light patterned as depicted in Fig. 13. Thoseimages were generated within a Bachelor thesis [20] initiated and supervised by CSEM.This structured illumination reveals the surface topology and allows a 3D reconstructioneven if contrast is lacking.

230 M. A. Kirschmann et al.
Fig. 12. Left: total focus image of PCB captured with Raytrix R26 and a 3x tele-centric lens.Right: 3D rendered image (bottom) with color coded depth map overly (top).
Fig. 13. Imaging of component with partially low contrast resulting in lack of depth informa-tion (left). Patterned illumination projection mitigates the effect of contrast-arm surfaces (right).Colored images depict the color-coded depth maps of the 3D objects. Images by [20].
As the reconstructed total focus images and depth maps can be exported as 2Dimage data, existing software for quality control, fault detection and anomaly detectioncan directly process and analyze these images. In order to achieve a proper performanceof the system, parameters for reconstruction of total focus and depth maps need to beadapted for different inspection scenarios.
3 Conclusion
Real-time 3D inspection is not needed for every application. However, where it is thecase multiple technologies might be considered ranging from simple stacking of 2D

Plenoptic Inspection System for Automatic Quality Control 231
images over stereo camera configuration all the way to interferometric systems. As usualcomplexity and cost are increasingwithmore demanding needs. Plenoptic camerasmightnot be perfect and certainly will not replace every other inspection technology. However,as is the case for MEMS and other microsystems in general, plenoptic cameras have ahuge potential whenever the following criteria seem to be advantageous:
• 6-times larger Depth of Field compared to standard camera• occlusion-free 3D imaging• real-time 3D image acquisition up to 80 frames per second• simple implementation due to single camera/lens configuration• cost efficient compared to competing technologies with similar performance• simple combination with other means of inspection, e.g. electrical probing possible
Plenoptic cameras are a valuable instrument for the inspections of MEMS becauseof its unique advantages at their competitive price.
References
1. EdmundOptics Ltd: 20×Mitutoyo PlanApo InfinityCorrected LongWDObjective. EdmundOptics Ltd. (2019). https://www.edmundoptics.de/p/20x-mitutoyo-plan-apo-infinity-corrected-long-wd-objective/6625/. Accessed 16 Sept 2019
2. Ens, J., Lawrence, P.: An investigation of methods for determining depth from focus. IEEETrans. Pattern Anal. Mach. Intell. 15(2), 97–108 (1993)
3. Wilburn, B., et al.: High performance imaging using large camera arrays. ACMTrans. Graph.24(3), 765–776 (2005)
4. Ensenso GmbH: www.ensenso.com. Ensenso GmbH (2018). https://www.ensenso.com/.Accessed 12 Sept 2019
5. Callen, D.: Vision-Spectra.com: Coherent Inc., May 2017. https://www.photonics.com/Article.aspx?AID=62061. Accessed 11 Sept 2019
6. Micro-Epsilon: Micro Epsilon Laser Triangulation system.MICRO-EPSILONUK& IrelandLtd. (2019). https://www.micro-epsilon.co.uk/service/glossar/Laser-Triangulation.html
7. Gustafson, M.G.L.: Surpassing the lateral resolution limit by a factor of two using structuredillumination microscopy. J. Microsc. 198(2), 82–87 (2000)
8. Geng, J.: Structured-light 3D surface imaging: a tutorial. Adv. Opt. Photonics 3(2), 128–160(2011)
9. Lyncée Tec: www.lynceetec.com. https://www.lynceetec.com/. Accessed 11 Sept 201910. Pagliarulo, V., Russo, T., Miccio, L., Ferraro, P.: Numerical tools for the characterization of
microelectromechanical systems by digital holographic microscopy. J. Micro/Nanolithogr.MEMS MOEMS 14(4), (2015)
11. Wikipedia Contributors: Digital holographic microscopy. Wikipedia, The Free Encyclope-dia, 28 August 2019. https://en.wikipedia.org/w/index.php?title=Digital_holographic_microscopy&oldid=912841452. Accessed 12 Sept 2019
12. Wikipedia Contributors: Optical coherence tomography. Wikipedia, The Free Encyclopedia,11 July 2019. https://en.wikipedia.org/w/index.php?title=Optical_coherence_tomography&oldid=905735980. Accessed 12 Sept 2019
13. Heliotis AG: www.heliotis.ch. https://www.heliotis.ch/index.html. Accessed 12 Sept 201914. Dunsby, C., Gu, Y., French, P.M.W.: Single-shot phase-stepped wide-field coherence-gated
imaging. Opt. Express 11(2), 105–115 (2003)

232 M. A. Kirschmann et al.
15. LightField Forum: History of light field photography (timeline). http://lightfield-forum.com/what-is-the-lightfield/history-of-light-field-photography-timeline/. Accessed 13 Sept 2019
16. Lippmann, G.: Épreuves réversibles donnant la sensation du relief. J. Phys. Theor. Appl. 7(1),821–825 (1908)
17. Adelson, E.H., Wang, J.Y.A.: Single lens stereo with a plenoptic camera. IEEE Trans. PatternAnal. Mach. Intell. 14(2), 99–106 (1992)
18. Lumsdaine, A., Georgiev, T.: Full resolution lightfield rendering. Indiana University andAdobe Systems (2008)
19. Perwass, C., Wietzke, L.: Single lens 3D-camera with extended depth-of-field. Proc. SPIE8291, 4- (2012)
20. Ammann, S., Gilson, O.: Pattern Illumination for Lightfield Camera. InterstaatlicheHochschule für Technik Buchs, Buchs (2019)
Open Access This chapter is licensed under the terms of the Creative Commons Attribution 4.0International License (http://creativecommons.org/licenses/by/4.0/), which permits use, sharing,adaptation, distribution and reproduction in anymedium or format, as long as you give appropriatecredit to the original author(s) and the source, provide a link to the Creative Commons license andindicate if changes were made.
The images or other third party material in this chapter are included in the chapter’s CreativeCommons license, unless indicated otherwise in a credit line to the material. If material is notincluded in the chapter’s Creative Commons license and your intended use is not permitted bystatutory regulation or exceeds the permitted use, you will need to obtain permission directly fromthe copyright holder.

Human Centred Assembly

Automated Information Supply of WorkerGuidance Systems in Smart Assembly
Environment
Gerhard Reisinger1,2(B), Philipp Hold1,2, and Wilfried Sihn1,2
1 Fraunhofer Austria Research GmbH, Theresianumgasse 7, 1040 Vienna, Austria{gerhard.reisinger,philipp.hold,wilfried.sihn}@fraunhofer.at
2 Institute of Management Sciences, Vienna University of Technology,Theresianumgasse 27, 1040 Vienna, Austria
Abstract. The global megatrends of digitization and individualization substan-tially affectmanufacturing enterprises.Assemblyworkers are exposed to increasedprocess complexity resulting in physical and cognitiveworkload.Worker guidancesystems (WGS) are used to overcome this challenge through output of informa-tion regarding what should be done, how it should be done and why it shouldbe done. An unsolved scientific challenge in this context is efficient informa-tion supply of WGS. Information such as worker’s instruction texts, pictures or3D representations are created by employees of the work preparation departmentand transferred to the WGS. Manual information supply is a time-consumingand complex process, which requires a high (non-value-adding) effort as wellas comprehensive knowledge in handling 3D CAD modelling and software pro-gramming. This paper presents a novel approach to reduce the required manualeffort in information supply process. A knowledge-based model is proposed thatenables an automated information supply ofWGS in smart assembly environmentby means of algorithms and self-learning expert systems, which pursues a holisticand consistent approach without media breaks. The automated approach assistsemployees of work preparation department, which means they can concentrateon their essential core competencies instead of being busy, for example, creat-ing assembly plans, instruction texts or pictures for individual WGS. Finally, thetechnical implementation as a software-based proof-of-concept demonstrator andsub-sequent integration into the IT environment of TUWien Pilot Factory Industry4.0 is outlined.
Keywords: Digital assistance ·Worker guidance · Smart assembly ·Human-machine interaction · Assembly planning · Algorithms · Pilot factory
1 Introduction: Background and Definitions
Production systems and especially assembly systems in developed industrial countriesare faced with the challenge of tackling rising product and process complexity in termsof individualized customer needs as well as productivity at the same time [1]. This is
© The Author(s) 2021S. Ratchev (Ed.): IPAS 2020, IFIP AICT 620, pp. 235–248, 2021.https://doi.org/10.1007/978-3-030-72632-4_17

236 G. Reisinger et al.
particularly true in the area of precision assembly, where workers must perform man-ual assembly processes precisely, cost-effectively and with high quality. By networkeddata and modern forms of information and communication technologies with physicalproduction processes, so called cyber-physical production systems (CPPS) will becomereal. Cyber-physical systems are described as a combination of physical objects (“phys-ical”) and an embedded digital system (“cyber”). This embedded system collects andprocesses data and interacts with surrounding environment via actuators. By integrat-ing equipment with CPS characteristics into an assembly environment, cyber-physicalassembly systems (CPAS) are established [2].
In addition to cost pressure in global competition, more frequent changes of workcontents as a result of higher product variance, reduced lot sizes (lot size 1 production)and shortened product life-cycles make it more difficult for operators to build-up taskroutine [2]. This leads to increasing cognitive workload of operators and increasing riskof human errors and product quality problems [3].
Worker guidance systems (WGS), connected tools and systems in the work envi-ronment collaborating with human workers, have been used already in the past e.g.to automate certain tasks for improved production and assembly as well as to reliefoperators from rough and strenuous working conditions [4, 5]. In this way, informationprovision was used to deliver operators with instructions and details required to suc-cessfully fulfil manually executed tasks [6]. Today CPPS and CPAS are characterizedby increasing digitalization and automated information flow. Thereby information sys-tems control technical processes (e.g. plants, tools) and orchestrate the interaction withoperators on the shop floor in a holistic way [7].
One of the central challenges here is to provide various decentralized database sys-tems with up-to-date information and control commands at all times. Connection andinteroperation with higher-level planning and control systems is seen by industry as asuccessful solution. However, even higher-level planning and control systems show asignificant bottleneck of information supply and their granularity in order to orches-trate work systems and to illustrate operators the right information at the right time inthe right quality regarding the right work task [8]. In order to enable a comprehensiveuse of intelligently networked CPPS and CPAS, work preparation departments are con-fronted with the challenge of incorporating missing and supplementary information intocorresponding systems. Thereby the manual effort and waste of (human) resources isrelatively high [9].
Taking the above discussion into account, this paper presents a design concept and asoftware-based implementation of an automatic information supply of WGS as an inter-face between construction, planning and control systems aswell as decentral informationdatabases of various production and assembly technologies.
2 Related Work
2.1 Worker Guidance Systems
Digital assistance systems (DAS) are used within a CPAS as interface between humansand technical systems [10]. The primary goal is to provide optimal worker support to

Automated Information Supply of Worker Guidance Systems 237
increase productivity, reduce execution times, minimize error rates and enable end-to-end traceability [11]. DAS comprise basic functions including documentation of pro-cess data, monitoring of processes, decision support and information output [12]. Forinformation output, the term “worker information systems” (WIS) is used in literatureof production management. WIS provide information such as step-by-step assemblyinstructions, security hints or warnings of potential errors without the need of printedpaper media [13].
For step-by-step guidance of workers through assembly processes, also the termworker guidance, respectivelyWGS is used.WGSallowworkers to overcome difficultiesin performing complex precision assembly processes and reduce cognitive burden inassembling small lot sizes of ever increasing product variants [14]. The most significantdifference between WIS and WGS is the feedback loop: WIS only supply informationassistance according to a given set of rules, while WGS additionally support the inputof information and data manually through graphical user interfaces or automaticallythrough different sensors [15]. Aehnelt et al. stated that “information assistance in formof guiding can be understood as an informal way of mediating and learning facts (what),procedures (how) and concepts (why) required for a specific assembly task”. Therefore aworker has to remember, understand and apply the information to execute the assemblytask [16].
Lušic et al. differ between static and dynamic provision of information as well asreal versus virtual information. Text and pictures are time-invariant and therefore staticinformation, leading to additional cognitive load of the worker. Dynamic provision ofinformation, e.g. videos or 3D animations lead to less cognitive load, but the durationof these have to be adapted to individual worker’s needs. Real information require realobjects for their creation and include recorded photos or videos,while virtual informationcan be derived digitally e.g. using a 3D Computer-Aided Design (CAD) software [17].
2.2 Information Supply of WGS
The information provided by WGS can be in form of texts, pictures, videos, virtual3D objects or simple light signals and must be prepared, programmed and transferredto databases or storage media of an individual target system prior to production [18].This preparation process is very time consuming and usually requires a specializedknowledge in programming and 3D CAD modelling [19]. In case of a small or singlelot size production, the described preparation process has to be carried out often andrepresents a significant cost factor, which furthermore prevents an efficient usage ofWGS [20]. To cope with the aforementioned challenges, different approaches have beenpresented in recent studies, which can be clustered into following categories:
(i) automation of assembly sequence planning [21], (ii) automation of instructioninformation creation [22], (iii) automated entry of created information into target systems[23] and (iv) support the human assembly planner where automation is not possible [24].These four categories are described in detail:
(i) Automation of assembly sequence planning: Since the early 1990s, variousalgorithms and heuristics have been developed to automatically derive feasible assemblysequences of a product variant from product data or 3D CADmodels, e.g. [25, 26]. Thisresearch area evolved with more computing power: The original approaches considering

238 G. Reisinger et al.
a simple listing of assembly sequences were developed successively, so that modernsolutions allow an automatic feasibility study with regard to stability and available spaceat the joining position of each part [27], but also the average required assembly time canbe calculated [28]. All of the aforementioned approaches relate to the general assemblyplanning process, but are not designed to create, process or distribute information forWGS.
(ii) Automation of instruction information creation: Mader et al. describe anapproach to be able to automatically create work instructions in textual form and aspictures based on geometry and workstation data [22]. More recent work describes thepreparation of videos and assembly animations using virtual prototypes [13]. Sääskiet al. describe a concept to automatically create 3D objects for Augmented Reality (AR)worker guidance. Hereby the focus has been set on the integration of a wide variety ofinformation systems as consistently as possible [29]. The created information has to beentered manually into databases of target WGS using a graphical user interface (GUI).This step is also associated with high manual workload during preparation phase.
(iii) Automated entry of created information into target systems:To ensure that assembly workers on shop floor can use the created instruction infor-
mation, it must be entered into the database of WGS through software interfaces. Mülleret al. describe an exchange of information between agents and modules. While a WGScan be seen as a module, an “agent acts as a mediator or coordinator” between thesemodules and the virtual assembly planning environment [23]. A similar approach ispursued by Fischer et al., who describe the data flow between virtual assembly planningand the WIS database. Data is exported from the planning environment, translated intothe desired target structure via an associative array and can be imported into the WGS[30].
(iv) Support the human assembly planner where automation is not possible:Zauner et al. describe the use of domain specific wizards, so-called “authoring wizards”in order to create visual information in a user-friendly way and without any program-ming knowledge [31]. Through a GUI, an assembly planner defines the required assem-bly information, such as assembly sequence, parameters and required tools [32]. Thedescribed approach is widely used in context of AR solutions and is applied in researchand industry [33]. Despite support by means of authoring software, high manual effortremains in creation and entry of the information for each product variant. In addition,these software packages are usually limited to AR worker guidance and are designedfor specific output devices or an individual WGS solution. Sensors for detecting depthinformation and movements enable teach-in of work instruction content at the assem-bly stations directly [34]. Funk et al. have developed a projection based WGS, whichallows a complex assembly process to be trained by experienced workers. During theassembly process, the system recognizes the required part containers as well as joiningpositions and derives all the information required for projection-based worker guidanceautomatically. However, the authors themselves point out that this system is not matureand further development must be made, e.g. optimization of workpiece detection [20]. Inaddition, such a system cannot be used in lot size 1 production, since the entire assemblyprocess has to be taught in with at least one piece.

Automated Information Supply of Worker Guidance Systems 239
In summary, the state of the art includes partial solutions, which favour a reductionof expenses in the supply of instructional information e.g. through automation of prepa-ration tasks or support of human assembly planners. However, the lack of a holistic andconsistent approach in order to achieve a fully configured WGS even at complex prod-ucts and small lot size is evident. In this paper, we present an approach for the automatedinformation supply of worker guidance systems, which helps to significantly reduce con-tent creation efforts and to relieve assembly planning staff, especially in smart assemblyenvironments. The approach differs from the state of the art by a continuous processingchain from product development to the output of digital content information on assemblyshop floor. The activities of information supply of worker guidance systems are dividedbetween human and computer according to their respective strengths and weaknesses.While human planners contribute product-, process- and resource-knowledge by meansof optimally designed input interfaces, a computer takes over time-consuming creationactivities for instruction elements, e.g. texts, pictures or optimised 3D models for AR.In order to further relieve assembly planners, they are supported by machine learningat the time-consuming task of planning assembly sequences. Case-based reasoning isused to derive assembly sequences for the new product variant based on earlier planningknowledge of similar product variants automatically. The following sections describe aconceptual design for an automated information supply and the technical implementationin a test environment.
3 Conceptual Design for Automated Information Supply
3.1 Automated Information Supply of WGS
In the context ofWGS, the authors propose a definition for the term “information supply”as combination of “information creation” and “information entry”. Hereby, the task ofinformation creation contains the following subtasks:
• Definition of assembly plan, including assembly sequence, relevant parts andsubassemblies as well as tools to be used.
• Derivation of virtual instructional information, including screenshots (static), anima-tions (dynamic), textual descriptions (static) as well as 3D data for worker guidancethrough AR (static or dynamic).
• Creation of real instructional information, including photos (static), videos (dynamic)as well as recorded – e.g. spoken – textual descriptions (dynamic).
In order to provide instructions to workers on the shop floor, the instructional infor-mation has to be transferred into a database or file system of the target WGS.MostWGSprovide a backend editor or a similar GUI, which can be used by assembly plannersin order to convert created information to the required format and to enter it into thedatabase. The information supply process should be carried out for each individual prod-uct variant and thus leads to high manual effort and costs for small lot sizes. This paperproposes a holistic knowledge-based approach,which includes entire information supplyprocess, taking over routine tasks through algorithms and supporting assembly plannerswith a self-learning expert system. The result is a division of tasks between human and

240 G. Reisinger et al.
algorithm. While humans provide their domain and process knowledge, algorithms takerepetitive tasks such as derivation of virtual information as well as transfer of createdinstruction information to databases.
Figure 1 illustrates the approach and describes how data is processed so that a 3DCADmodel of a product variant can be used to adequately supply information to aWGS.The blue boxes symbolise automated algorithms, while green boxes designate GUIs forinteraction with human planners. The approach builds upon earlier developments byReisinger et al. [35] and has been extended by additional concepts to further reducemanual effort.
Fig. 1. Proposed approach for automated information supply of WGS
3.2 Authoring Process
In first step “Authoring Process”, human assembly planners define assembly sequence(“what has to be done”) and work methods (“how is it done”). An authoring tool with3D user interface is provided and visualizes the 3D CAD model of current productvariant. By selecting parts and subassemblies, assembly steps as well as an assemblysequence are defined. Individual steps can be enriched with additional information, e.g.required tools, screwing torques or parts. Furthermore, the assembly planner specifiesintermediate steps that cannot be automatically extracted from a 3D CAD model, e.g.missing parts like springs or pipes. During this authoring process, the assembly planneris assisted through various functions, e.g. suggestion of correct torque depending ondimension of the screw. In summary, the main purpose of the authoring process is toenter process- and resource-knowledge of human assembly planners in an efficient way.Previous work in literature describing similar authoring tools – e.g. [31, 36] or [24] –show a significant weakness: The authoring process has to be conducted for each productvariant, even in case of similar 3D product models. This leads to a high manual effortfor assembly planners and thus a low efficiency is resulting.
3.3 Assisting Assembly Planning
To deal with the described weakness of conventional authoring processes, additionalsystem features in planning new product variants are considered:

Automated Information Supply of Worker Guidance Systems 241
• Case-Based Assembly Planning (CBAP): In advance to the authoring process, sim-ilarity between the new product variant and earlier planned product variants is mea-sured. In case of high similarity, the assembly plan from similar earlier product variantis reused for the new product variant. This is done through a rigorous allocation ofparts and subassemblies of the new product variant by comparing more than 30 geo-metrical features. The computer reasoning method “Case-based Reasoning” [37] hasbeen adapted for assembly planning. This is part of a self-learning expert systemwhich assists human assembly planners. At the beginning of the authoring process,the assembly planner receives information, which earlier product variant was selectedas case, a list of parts the algorithm was able to allocate automatically as well as a listof parts the algorithm was not able to allocate automatically. The human assemblyplanner can build upon the pre-generated process plan and allocate missing parts andsubassemblies, leading to a significant saving of manual effort.
• Assembly Sequence Planning (ASP): If CBAP is not possible, multiple methodsfromASP are used to propose the optimal assembly sequence for parts and subassem-blies of new products [38]. The number of possible assembly sequences increaseswith the number of parts exponentially. Thus, even for a simple product, millions ofdifferent assembly sequences are possible, whereby 25–40% can be eliminated byreason of geometrical constraints. Including criteria such as stability and handling,only 5–15% of these remain as feasible assembly sequences. By evaluating remainingpossibilities with regard to the required assembly time, a final assembly sequence canbe selected and proposed to the assembly planner [21].
3.4 Creation of Instruction Information
Creating virtual instruction information for individual assembly steps is conductedautomatically and requires the following domain knowledge elements:
• Product knowledge can be derived from 3D CAD model, e.g. geometries, structureof the product, required special treatment of parts or options like colours and mate-rial. Additional data can be gathered from external sources like Product LifecycleManagement (PLM) or Enterprise Resource Planning (ERP) systems.
• Process knowledge is entered manually by the assembly planner using the authoringtool. The assembly planner can use his/her experience concerning optimal sequence,required intermediate steps as well as evaluating, if the proposed process is realisticfor assembly.
• Resource knowledge is provided by the assembly planner, e.g. which tools, measuringinstruments and additional equipment to be used.
The textual description of individual assembly steps is automatically derived usingpreviously manually defined text modules and contains information about assem-bled components, the operation and needed tools. Defined colour codes enable adifferentiation of small and big parts, standard parts as well as a differentiation of tools.
The pictures for worker guidance are automatically derived as CAD screenshots foreach assembly step and relevant components are highlighted in colour. To ensure optimalvisibility of every component, pictures are derived from two different perspectives: A

242 G. Reisinger et al.
fixed position and viewing angle, in order to provide overall orientation to the assemblyworker, as well as a picture from a view perspective previously defined in the “AuthoringProcess”. To guarantee a high standardization of instructions, the colour coding of thepictures is the same that is used for the textual descriptions.
3.5 Entry of Instruction Information
The required information for worker guidance has to be prepared and entered into adatabase or file system of the target WGS so that worker guidance information on shopfloor can be used to support assembly workers. The data structure of the database andfile system is defined differently for each WGS and no standardized interface for enter-ing worker information exists. At this point, the principle of post-processing is takenfrom Computer-Aided Manufacturing (CAM) information chain [39] and we proposethe following definition analogously for WGS: A post-processor in context of workerguidance systems is an algorithm for automated translation of prepared worker informa-tion (assembly sequence, texts, pictures) and entry of these information into a databaseor file system of a targetWGS. A post-processor is developed once for each target systemand has to be adapted in regard to new data structures in case of updates. The develop-ment requires direct writing access to the respective database or file system as well as agood knowledge of data structure of the WGS.
4 Technical Implementation
In order to make the concept applicable, it was implemented as a software-based proof-of-concept demonstrator (PoCD) and integrated in the laboratory of TU Wien PilotFactory Industry 4.0 (PFI40) with existing information systems and WGS.
4.1 Software-Based Proof-of-Concept Demonstrator
During implementation, individual modules have been developed using suitable pro-gramming languages and existing frameworks, e.g. authoring tool, generator for textsand pictures as well as post-processors. In order to ensure an efficient planning pro-cess, attention was paid to easy maintainability of the data structures as well as a highuser-friendliness of the GUI.
Figure 2 presents the GUI of the developed authoring tool, which is used by theassembly planner to enter process- and resource-related information. The open sourcesoftware “FreeCAD” is used to provide a 3D environment. FreeCAD and authoringwindow together form the authoring tool. Through python scripts as well as a providedApplication Programming Interface (API), FreeCAD is able to communicate with thedeveloped authoring window, which is displayed at the right side of above screenshot.The parts and components of the product variant are selected by the assembly plannerfor each assembly step through a list or by directly clicking parts and components in 3Denvironment. Screws are automatically identified by part name and appropriate screwingparameters such as torque, depth and pitch are suggested.

Automated Information Supply of Worker Guidance Systems 243
Fig. 2. GUI of developed authoring tool, using FreeCAD as 3D environment
Once the authoring process is completed and the information is released, it is passedto a virtual machine connected to local area network (LAN) via a Representational StateTransfer (REST) API. The virtual machine acts as a container for various algorithmsrunning automatically aswell as a SQLdatabase for data storage. Theworker informationis automatically processed as described in previous chapter. The automatic generationof instruction texts is carried out by algorithms, which have been implemented in JavaProgramming Language. The creation of instruction pictures is done by a self-developedmedia generator. Because of high resource usage, the media generator is implementedas a cloud service and can be controlled via a REST API. The assembly plan in XMLform (created by authoring tool) and a 3D CAD model of the product variant to beassembled serve as input for the media generator. The output are generated pictures fromdifferent perspectives, which are automatically downloaded after the creation process iscompleted.
4.2 Integration in TU Wien Pilot Factory Industry 4.0
The developed software-based PoCD has been integrated into PFI40 and linked withexisting information systems and WGS. The PFI40 is located in Vienna (Austria) and“serves both as a research platform and a teaching and training environment with regardto a human-centered cyber-physical production system” for lot size 1 production [40].It combines development and testing of prototypes (Pilot Factory), demonstration andcommunication of findings (Demonstration Factory) and transfer of knowledge to stu-dents and course participants from practice (Learning Factory). The production of aplastic 3D printer is demonstrated in a realistic environment of approximately 900 m2
space. Industrial machines, 3D printers, logistics systems and a cyber-physical assem-bly line are available [41]. The assembly line of PFI40 consists of four cyber-physicalassembly stations, which in turn consist of various assistance systems, including visualworker guidance, an intelligent screwing system as well as collaborative robots.

244 G. Reisinger et al.
Figure 3 shows the integration of the software based PoCD in the IT landscapeof PFI40 [42]. Red coloured elements represent already existing systems of the PFI40and contain an ERP system, a 3D CAD environment as well as two WGS of differentmanufacturers. The green ellipse indicates the virtual machine and contains a centraldatabase of the PoCD, implemented algorithms as well as passive and active interfacesfor communication with the system environment. The authoring window is not partof the virtual machine but is executed on desktop computer of the assembly plannerand communicates with 3D CAD environment FreeCAD and via a REST API with thevirtual machine. After successful planning and preparation of the worker information, itis transferred towards two target WGS “Armbruster ELAM” [43] and “Sarissa QA” [44]using developed post-processors. Precision assembly staff on shop floor is now able touse these instructions for step-by-step worker guidance.
Fig. 3. Integration of software based PoCD in PFI40 IT landscape (Color figure online)
5 Conclusion and Future Research Agenda
5.1 Conclusion and Recommendations
This paper presents a novel knowledge-based approach to reduce the required man-ual effort in information supply process by dividing preparation tasks between humanand machine. This involves the use of pre-defined rule-based algorithms for generat-ing instructions, self-learning expert systems for transferring assembly plans to similarproduct variants and agent-based interfaces (post-processors) for automated entry of cre-ated information. The development of the proposed post-processors requires intensiveknowledge of the data structure of the target WGS. Therefore, we recommend that themanufacturer of WGS should do the development of the post-processors.
The approach has been implemented as a software-based PoCD, integrated into ITenvironment of PFI40 and is used for information supply of twoWGSof a cyber-physical

Automated Information Supply of Worker Guidance Systems 245
assembly line. Previous findings show that preparation efforts per product variant couldbe reduced significantly and the system works efficiently even if there are computation-ally intensive algorithms. A comprehensive user study with both experienced and inex-perienced participants is planned in order to measure actual effects, such as a reductionin planning times or an increase in worker satisfaction.
5.2 Limitation and Outlook
The approach presented in this paper is limited to providing information to WGS forassembly activities. Due to a recognizable evolution of conventional assembly systemsinto cyber-physical assembly systems, we recommend further research in the field ofautomated information supply of these environments. In addition to WGS, this alsoincludes creation and linking of configuration sets for devices, tools, machines and mea-suring equipment. A further starting point for development is the expansion of the fieldof application so that, in addition to assembly activities, WGS can also be automaticallysupplied with information for manual maintenance, set-up and servicing processes. Theapproach presented here can also be used formutual (reciprocal) learning betweenhumanand machine. For example, a machine (e.g. algorithm) can learn from human (e.g. pro-cess planner) how to plan precision assembly processes and how to create associatedworker instructions for WGS. Furthermore, a precision assembly worker can also learnfrom the machine by using the instructions of the WGS [45]. A transfer and adaptationof the presented approach towards the creation of CNC machine tool code is also worthresearching and would make work preparation of cutting machine tools more efficient.
Acknowledgment. This research is funded by the Austrian Research Promotion Agency (FFG)in the project MMAssist II, grant no. 858623 as well as in the project TAI-VW, grant no. 870667.The TUWien Pilot Factory Industry 4.0 is also partly funded by the Austrian Research PromotionAgency (FFG) and several private industrial companies.
References
1. Dombrowski, U., Wagner, T., Riechel, C.: Analyse eines Konzepts zur Montageplanung aufBasis cyber-physischer Systemmodule. ZWF 108(5), 344–348 (2013)
2. Hold, P., Ranz, F., Sihn, W., Hummel, V.: Planning operator support in cyber-physicalassembly systems. IFAC PapersOnLine 49, 60–65 (2016)
3. Bubb, H.: Human reliability: a key to improved quality in manufacturing. Hum. Factors Man.(2005). https://doi.org/10.1002/hfm.20032
4. Krüger, J., Lien, T.K., Verl, A.: Cooperation of human and machines in assembly lines. CIRPAnn. Manuf. Technol. (2009). https://doi.org/10.1016/j.cirp.2009.09.009
5. Drust, M., Dietz, T., Pott, A., Verl, A.: Production assistants: the rob@work family. In: IEEEISR 2013 (2013)
6. Wiesbeck, M.: Struktur zur Repräsentation von Montagesequenzen für die situationsorien-tierte Werkerführung. Dissertation (2013)
7. Ansari, F., Hold, P., Sihn, W.: Human-centered cyber physical production system: how doesIndustry 4.0 impact on decision-making tasks? In: IEEE TEMSCON 2018 (2018)

246 G. Reisinger et al.
8. Johansson, P.E.C., Malmsköld, L., Fast-Berglund, Å., Moestam, L.: Enhancing future assem-bly information systems – putting theory into practice. Procedia Manuf. (2018). https://doi.org/10.1016/j.promfg.2018.10.088
9. Wang, X., Ong, S.K., Nee, A.Y.C.: A comprehensive survey of augmented reality assemblyresearch. Adv. Manuf. 4, 1–22 (2016)
10. Hold, P., Erol, S., Reisinger, G., Sihn, W.: Planning and evaluation of digital assistancesystems. Procedia Manuf. 9, 143–150 (2017)
11. Romero, D., et al.: Towards an operator 4.0 typology. A human-centric perspective on thefourth industrial revoluation technologies. In: 46th International Conference on Computers& Industrial Engineering 2016 (2016)
12. Keller, T., Bayer, C., Bausch, P.,Metternich, J.: Benefit evaluation of digital assistance systemsfor assembly workstations. Procedia CIRP 81, 441–446 (2019)
13. Fischer, C., Bönig, J., Franke, J., Lušic, M., Hornfeck, R.: Worker information system tosupport during complex and exhausting assembly of high-voltage harness. In: 5th InternationalElectric Drives Production Conference (EDPC) (2015)
14. Galaske, N., Anderl, R.: Approach for the development of an adaptive worker assistancesystem based on an individualized profile data model. In: Schlick, C., Trzcielinski, S. (eds.)Advances in Ergonomics ofManufacturing:Managing the Enterprise of the Future. Advancesin Intelligent Systems and Computing, vol. 490, pp. 543–556. Springer, Cham (2016). https://doi.org/10.1007/978-3-319-41697-7_47
15. Teubner, S., Merkel, L., Reinhart, G., Hagemann, F., Intra, C.: Improving worker information- proposal of a dynamic and individual concept. In: International Conference on CompetitiveManufacturing, COMA 2019 (2019)
16. Aehnelt,M.,Bader, S.: From information assistance to cognitive automation: a smart assemblyuse case. In: Duval, B., van den Herik, J., Loiseau, S., Filipe, J. (eds.) ICAART 2015. LNCS(LNAI), vol. 9494, pp. 207–222. Springer, Cham (2015). https://doi.org/10.1007/978-3-319-27947-3_11
17. Lušic, M., Fischer, C., Bönig, J., Hornfeck, R., Franke, J.: Worker information systems.State of the art and guideline for selection under consideration of company specific boundaryconditions. Procedia CIRP (2016). https://doi.org/10.1016/j.procir.2015.12.003
18. Hold, P., Ranz, F., Sihn, W.: Konzeption eines MTM-basierten Bewertungsmodells für digi-talen Assistenzbedarf in der cyber-physischen Montage. Megatrend Digitalisierung - Poten-ziale der Arbeits- und Betriebsorganisation – Berlin (2016). https://doi.org/10.15358/9783800645466
19. Wolfartsberger, J., Zenisek, J., Silmbroth, M., Sievi, C.: Towards an augmented reality andsensor-based assistive system for assembly tasks. In: Proceedings of the 10th InternationalConference on PErvasive Technologies Related to Assistive Environments, PETRA 2017,pp. 230–231 (2017)
20. Funk, M., Lischke, L., Mayer, S., Shirazi, A.S., Schmidt, A.: Teach Me How! InteractiveAssembly Instructions Using Demonstration and In-Situ Projection. In: Huber, J., Shilkrot,R., Maes, P., Nanayakkara, S. (eds.) Assistive Augmentation, pp. 49–73. Springer, Singapore(2018). https://doi.org/10.1007/978-981-10-6404-3_4
21. Bahubalendruni, M.R.A., Biswal, B.B.: A review on assembly sequence generation and itsautomation. Proc. Inst. Mech. Eng. Part C: J. Mech. Eng. Sci. (2016). https://doi.org/10.1177/0954406215584633
22. Mader, S., Urban, B.: Creating instructional content for augmented reality based on controllednatural language concepts. In: International Conference on Artificial Reality and Telexistence(ICAT) (2010)
23. Müller, R., Vette, M., Hörauf, L., Speicher, C.: Consistent data usage and exchange betweenvirtuality and reality to manage complexities in assembly planning. Procedia CIRP (2016).https://doi.org/10.1016/j.procir.2016.02.126

Automated Information Supply of Worker Guidance Systems 247
24. Li, B., Dong, Q., Dong, J., Wang, J., Li, W., Li, S.: Instruction manual for product assemblyprocess based on augmented visualization. In: Chinese Automation Congress (CAC) 2018(2018)
25. Homem deMello, L.S., Sanderson, A.C.: A correct and complete algorithm for the generationof mechanical assembly sequences. IEEE Trans. Robot. Autom. (1991). https://doi.org/10.1109/70.75905
26. Hadj, R.B., Belhadj, I., Trigui, M., Aifaoui, N.: Assembly sequences plan generation usingfeatures simplification. Adv. Eng. Softw. (2018). https://doi.org/10.1016/j.advengsoft.2018.01.008
27. Bedeoui, A., Benhadj, R., Trigui, M., Aifaoui, N.: Assembly plans generation of complexmachines based on the stability concept. Procedia CIRP 70, 66–71 (2018)
28. Pintzos, G., Matsas, M., Triantafyllou, C., Papakostas, N., Chryssolouris, G.: An integratedapproach to the planning of manual assembly lines. In: ASME 2015 International MechanicalEngineering Congress and Exposition (2015). https://doi.org/10.1115/IMECE2015-52962
29. Sääski, J., Salonen, T., Hakkarainen, M., Siltanen, S., Woodward, C., Lempiäinen, J.: Integra-tion of design and assembly using augmented reality. In: Ratchev, S., Koelemeijer, S. (eds.)IPAS 2008. IIFIP, vol. 260, pp. 395–404. Springer, Boston (2008). https://doi.org/10.1007/978-0-387-77405-3_39
30. Fischer, C., Lušic, M., Bönig, J., Hornfeck, R., Franke, J.: Webbasierte Werkerinforma-tionssysteme. Datenaufbereitung und -darstellung für die Werkerführung im Global CrossEnterprise Engineering (2014)
31. Zauner, J., Haller, M., Brandl, A., Hartmann, W.: Authoring of a mixed reality assemblyinstructor for hierarchical structures. In:TheSecond IEEEandACMInternational Symposiumon Mixed and Augmented Reality 2003 (2003)
32. Knöpfle, C., Weidenhausen, J., Chauvigne, L., Stock, I.: Template based authoring for ARbased service scenarios. In: IEEE Virtual Reality 2005 (2005)
33. Roberto, R.A., Lima, J.P.,Mota, R.C., Teichrieb, V.: Authoring tools for augmented reality: ananalysis and classification of content design tools. In: Marcus, A. (ed.) DUXU 2016. LNCS,vol. 9748, pp. 237–248. Springer, Cham (2016). https://doi.org/10.1007/978-3-319-40406-6_22
34. Bannat, A.: Ein Assistenzsystem zur digitalen Werker-Unterstützung in der industriellenProduktion. Dissertation (2014)
35. Reisinger, G., Komenda, T., Hold, P., Sihn, W.: A concept towards automated data-drivenreconfiguration of digital assistance systems. Procedia Manuf. 23, 99–104 (2018)
36. Franke, J., Risch, F.: Effiziente Erstellung, Distribution und Rückmeldung von Werkerinfor-mationen in der Montage. ZWF 104(10), 822–826 (2009)
37. Aamodt, A., Plaza, E.: Case-based reasoning: foundational issues, methodological variations,and system approaches. AI Commun. 7, 39–59 (1994)
38. Sunil, D.T., Devadasan, S.R., Thilak, V.M.M., Vinod, M.: Computer aided design-basedassembly sequence planning: a next stage in agile manufacturing research. Int. J. BusinessExcellence 16(4), 454–477 (2018)
39. Xu, X.W., He, Q.: Striving for a total integration of CAD, CAPP, CAM and CNC. Robot.Comput.-Integr. Manuf. 20, 101–109 (2003)
40. Abele, E., et al.: Learning factories for future oriented research and education in manufactur-ing. CIRP Ann. (2017). https://doi.org/10.1016/j.cirp.2017.05.005
41. Hennig, M., Reisinger, G., Trautner, T., Hold, P., Gerhard, D., Mazak, A.: TU Wien pilotfactory industry 4.0. Procedia Manuf. (2019). https://doi.org/10.1016/j.promfg.2019.03.032
42. Erol, S., Jäger, A., Hold, P., Ott, K., Sihn,W.: Tangible industry 4.0. a scenario-based approachto learning for the future of production. Procedia CIRP (2016). https://doi.org/10.1016/j.procir.2016.03.162

248 G. Reisinger et al.
43. Armbruster Engineering: ELAM-Software (2020). http://www.armbruster.de/. Accessed 28Jan 2020
44. Sarissa: Quality Assist (2020). https://www.sarissa.de/. Accessed 28 Jan 202045. Ansari, F.,Hold, P.,Mayrhofer,W., Schlund, S.:Autodidact: introducing the concept ofmutual
learning into a smart factory industry 4.0. In: 15th International Conference on Cognition andExploratory Learning in Digital Age (CELDA 2018) (2018)
Open Access This chapter is licensed under the terms of the Creative Commons Attribution 4.0International License (http://creativecommons.org/licenses/by/4.0/), which permits use, sharing,adaptation, distribution and reproduction in anymedium or format, as long as you give appropriatecredit to the original author(s) and the source, provide a link to the Creative Commons license andindicate if changes were made.
The images or other third party material in this chapter are included in the chapter’s CreativeCommons license, unless indicated otherwise in a credit line to the material. If material is notincluded in the chapter’s Creative Commons license and your intended use is not permitted bystatutory regulation or exceeds the permitted use, you will need to obtain permission directly fromthe copyright holder.

Towards Human and Robot CollaborativeErgonomic Handling of Long Parts with a
Loose Grip
Michael Hofmann(B) , Markus Ganglbauer , Matthias Propst ,Christian Wogerer , and Andreas Pichler
Profactor Gmbh, Steyr, [email protected]
http://profactor.at
Abstract. The concept of robots collaborating with humans has gaineda lot of interest in the recent years. The pure use of the robot to followthe human’s actions involves several important components, which haveto fullfil economic, ergonomic, safety and usability aspects. This paperpresents a setup build with recent hardware and taking economic, safetyand usability aspects into account. A concept is introduced how theergonomics of a human worker is actively influenced by the system.
Keyword: Human robot interaction
1 Introduction
The concept of robots cooperating with humans has gained a lot of interest inrecent years, in both domestic and industrial areas. Combining the cognitivestrength of humans together with the physical strength of robots can lead tonumerous applications [1]. For example, in industrial scenarios a certain assemblyprocesses requires the worker’s strenuous effort of lifting heavy objects, operatingin non-ergonomic positions etc., which lead to negative long-term effects. Thisis becoming increasingly important also because of the aging work-force [1] andthe fact that there is a trend to automate such work-places even if it does notlead to additional short-term profits [2]. The preferred solution for these workplaces is a robotic assistant to interact and aid a human operator rather than afully automated system. Combining the flexibility of adapting in humans with thephysical strength and efficiency of the robots/machines will potentially transformlife and work practices, raise efficiency and safety levels and provide enhancedlevels of service [1,3].
Human robot interaction (HRI) is a challenging field that combines robotics,artificial intelligence, cognitive science, computer science, engineering, humancomputer interaction, psychology and social science [4]. One of the primary goalsof this research is to find an intuitive way in which humans can communicate andinteract with a robot [5]. The essential components of HRI include evaluating thec© The Author(s) 2021S. Ratchev (Ed.): IPAS 2020, IFIP AICT 620, pp. 249–259, 2021.https://doi.org/10.1007/978-3-030-72632-4_18

250 M. Hofmann et al.
capabilities of humans and robots and designing the technologies and trainingthat produce desirable interactions between them [6]. Humans in general haveperception and cognitive functions and are able to act and react with respect toa given situation. Characterizing and understanding a situation, to describe anddetect a situation and often predict the next steps, comes naturally to humans.Whereas, to develop a robotic system with ‘Context Awareness’ or in other wordsto enable a robotic system to understand the circumstances under which theyoperate and react accordingly in a cooperative fashion is a challenging task [7].
Human robot interaction can be realized in various forms. A binary input(e.g. yes or no) from the human to the robot can be seen as an interaction inits simplest form. Depending on the kind of interaction [8], HRI in industrialscenarios can be partitioned into:
– human robot coexistence – where both agents (human and robot) operate ina close proximity on different tasks
– human robot assistance – where the robot passively aids the human in a task(helping in lifting heavy objects)
– human robot cooperation – where both agents simultaneously work on thesame work piece (each agent has their own task to do on the work piece)
– human robot collaboration – where both agents perform coordinated actionson the same task (for e.g., robot handing over a work piece to the humanoperator, who then completes the coordination by taking the work piece)
2 Problem Formulation and Approach
The ability to use the robot to manipulate a part with a robot has been seenin many different ways. While the robot has to be designed to function withthe applied task, the perception of the humans intend if of high importance.Latest implementations are using the position and actions of the body, to directlycontrol the robot [9], with the drawback of accumulated errors. But also other,indirect control mechanisms like force measurement at the gripper has beenshown [10] to work properly. The crucial part of the system is the measurementof the position deviation introduced from the human.
For part handling with force measurement, the measurement of forcesstrongly depends on the rigid grasp of the robot. Typically, this is achieved witha parallel gripper applying a high force to the part. There are several reasons,why a grasp with high forces is not possible for certain parts. For example if thepart is not allowed to be deformed or the part, variation is too high. Anotherreason to not use an actual gripper at all is, if the costs for such a gripper is toohigh. Another problem is the high leverage of a long part, which is handled. Theestimation of the actual deviation at the workers side is strongly effected by thenoise produces by the force-torque sensor at the robots flange.
Therefore, this paper will try to avoid the measurement of forces and theneed for rigid grasps. The approach taken is to measure the actual deviationat the workers side. Similar approaches have been seen in the domain of remotecontrolling robots. There have been several approaches to utilize low cost devices

Human Robot Manipulation 251
to control industrial robots. Approaches lead from skeleton tracking based onRGBD sensor to inertial tracking of the human arm movement and vision basedtracking technologies. For industrial solution, the stability of the tracking is ofcritical importance. Therefore, vision based tracking systems, which are affectedby changing light conditions, are not suitable. Therefore a tracking system isused which uses modulated infrared light in combination with a special receiver.
There are several values of using a robot as the second side of a long part. Oneis the reduction of persons needed to actual handle a long part. The distributionof cognition and work force is divided between human a machine, where thehuman does the cognition. The revenue of this setup has to be evaluated by theindustrial use case.
To increase the value of such a system, an additional perspective is intro-duced, the ergonomic. The common ergonomy argument of a shared handlingapproach with a robot is the high force capabilities of a robot. This is true, aslong as safety regulations are not considered. The problem with safety regula-tions are, that a robot which is capable of lifting high loads is also capable ofhurting a human and therefore is not safe to use in a human robot collaborationtask. To overcome this issue, an other ergonomic benefit is discussed, to assistthe human to do the lifting in a more ergonomic way by analyzing the humanposture.
3 Handling of Long Parts
The basic setup of a human robot collaborative handling task is to control therobot via the human movements. The robot takes the role of mirroring thegrasp position of the human to its own grasp position. The basic idea is to letthe robot compensate the deviation made bad the human. The target controlvalue is the angle of the part, relative to the floor. In Other words, the part hasto be horizontally aligned.
There are four critical parts [11] to enable this setup to for human robotcollaboration. First, the control loop has to be closed. The control loop startswith the tracking of the deviation of the human. The tracking system has tocalculate the correction action within a strict latency. Therefore, the correctionactions have to be transferable to the robot within a deterministic latency. Thenext step is for the robot to apply the correction actions to the handled partin a safe way for the human. The part itself has to be rigid. Otherwise, theapplied corrections by the robot are not transferred back to the human. Thehuman closes the loop by sensing the correction, and if desired, continuous tomanipulate the part. The full setup is seen in Fig. 1. These components will bediscussed in the following section.
3.1 Tracking System
The tracking system is the main interaction system for the human. The humanintend has to be measured by the tracking system. Intends which are lost, will

252 M. Hofmann et al.
RobotWorker
Realtime-
Controller
PID-
ControllerTracking
Fig. 1. PID overview.
not be able to reconstruct in the later system. For vision-based system, this couldhappen if some occlusions happen between sender and receiver. Another issueis the latency and accuracy of the human measurement, if the latency increasestoo much, the human experience is lost. It has been shon in [12] that latenciesabove 300 ms would significantly increase the error rate of a teleoperated robot.In addition, the accuracy of the measurement has to be accurate enough, to benot noticeable by the human.
To cope with these issues, a consumer tracking system is used, the HTC-Vive.Beside the fact, that it is comparable cheap, it also copes with the discussedissues. Accuracy and latency are within tolerable ranges, for a human robotcollaboration [13,14]. In addition, the stability of the system is high, becausetwo measurements are used, first an optical measurement is done, to get anabsolute positioning of the device, second an inertia measurement is done toscope with occlusions and to detect fast orientation changes.
3.2 Grasping the Part
The connection of the robot to the part is a very important aspect of a humanrobot collaboration task. Depending on how rigid the connection is the pos-sibilities of what the human can do changes. The scale goes from very rigidconnections, where the robot controls the actual movement of the parts, to softrigid connections, where the part can be moved without any movement of therobot.
In general connection with high rigidness are desirable [15], if the part canbe moved to much, it could be possible, that the part slips out of the robotgripper and a collaboration is not possible anymore. The payoff of a high rigidconnection is the need for a good gripper, which is capable of performing a highrigid grasp.
As one of the scopes of the setup is to reduce the complexity, a pure mechan-ical connection of part and robot has been chosen. The outline of the connectioncan be seen in Fig. 2. The robot only holds the part with a spine, which preventsslipping of the part in two directions. The human handles the third direction.

Human Robot Manipulation 253
This dramatically reduces the complexity and const of the grasping system, butit presumes that the part has an adequate counterpart to the spine. The samegripper has been implemented for the worker, including the tracker, shown inFig. 3
End of Part Gripper
Fig. 2. Gripper construction.
Tracker
Activation of Robot
Fig. 3. Worker tool with tracker.
The chosen construction introduces a low rigid connection between part androbot. Therefore, the part can be easily moved around, without the need forthe robot to actual move. In this case, this is a desired behaviour, because thedeviation between part and robot is observed at the human side of the handling.Due the size of the part a significant deviation of the human and robot positionis introduced which allows the tracking system to measure it accurately.

254 M. Hofmann et al.
3.3 Realtime-Control of Robot
Similar to the tracking system, the real time control of the robot is a crucialpart for the user experience. As described earlier, latencies above 300 ms [12]can influence the task performance negatively if a human is involved.
The accumulated latency in the setup has to respect the tracking, pid-controller, robot-communication and robot-controller. Based on common imple-mentation the latency of the system can be calculated. The summary of thelatencies is shown in Table 1, the dominant latency is the network connection tothe universal robot [16], which not a realtime connection.
Our implementation is based on the newer version of the universal robotscontroller, which including a realtime network interface [17] working 125 Hz.The usage of this network interface rapidly increases the latency of the systemto latency below 50 ms, our results are shown in Table 2. Additional latencymeasurements inside the system have been done and are shown in Fig. 4.
Table 1. Accumulated latency of tracker to robot control.
Component Time Reference
HTC-Vive 22 ms [13]
PID-Controller 8 ms
UR10-Communication 160 ms [16]
UR10-Controller 8 ms [16]
Sum 198 ms
Table 2. Optimized latency of tracker to robot control.
Component Time
HTC-Vive 22 ms
UR data capture and receive network data 8 ms
Domain role is HTC-Vive 22 ms
PID-Controller 8 ms
UR send network data 8 ms
UR10-Controller 8 ms
Sum 46 ms
3.4 Safety-Constraints
The collaboration scenario described in this paper is a collaboration of humanrobot in with a common task and workspace [18]. Therefore the safety require-ments for have to be respected. The safety requirements for industrial robots are

Human Robot Manipulation 255
Fig. 4. Latency-Measurement in 8 ms steps. Status values directly from RTDE(actual q 0) and values read from URScript and transferred via RTDE (out-put double register).
described in ISO 10218-1:2011 and ISO 10218-2:2011 [19,20], which also includestandards for collaborative robots.
The assessment of the setup has shown, that the part extends the robotflange. The danger of the robot is reduced by limiting the robot to only X/Y-axis movement. This increases the safety of the system, because the robot cannotproduce any force in the direction of the human. To ensure the safe behaviourof the robot, a safety plane has been configured inside the robot controller [21].Figure 5 shows the available workspace of the robot, the visible plane cannot beleft in either Z-axis direction.
3.5 Discussion
This section has shown the crucial parts of handling long parts in a human robotcollaboration task. The described setup is designed to reduce costs as much aspossible, while keeping the performance of the system. The operation of thesystem is designed to work within safety regulations.

256 M. Hofmann et al.
y
x
Trackable Device
y
x
WorkerPlane
RobotPlane
RobotWorker
Tracking Sensor
Fig. 5. Limitation of the robot movement to a plane.
4 Ergonomic Handling of Long Parts
In this section, a concept to optimize the ergonomics of a human robot collabo-ration task is described. As described in the previous section, the human takesthe control of the setup. The roles of the human and the robot are clear, thehuman known which task has to be done, while the robots helps the human toperform the task.
The proposed setup introduces a second role schema, where the robot tries toimprove the ergonomics of the human. This can be done, by introducing limitedautonomy in the collaboration setup. The improvement of the ergonomy shouldhappen subliminal, which means, no display or other direct communication ofthe intend of the robot is communicated to the robot. The only way to influencethe human is how the collaboration task is executed. This means, that the robotcan influence the human by e.g. pushing the part higher, which should lead to abetter attitude of the human. A graphical representation of the setup is shownin Fig. 6.
The main part of the setup is the evaluation of the human in real time. Apossible evaluation assessment is RULA (rapid upper limb assessment), whichis a survey method for use ergonomics investigations of workplaces where work-related upper limb disorders are reported [22]. It has shown that RULA can becalculated in real time with a color and depth camera [23]. The RULA-score ofthe worker has to be optimized. A fitting algorithm for this task has to be found,or a fitting AI setup has to be defined [24].

Human Robot Manipulation 257
RobotWorker
Realtime-
Controller
AI-
ErgonomyPID-
ControllerTracking
RULA-
Score
Fig. 6. RULA overview.
5 Conclusions and Future Work
This paper presented a human robot collaboration setup using well-establishedconsumer and industrial components. It has been shown that with using recenthardware can drastically reduce the latency. The usage of consumer hardwareand the implementation of a simple but effective strategy to establish the han-dling at the robots side has shown to reduce the overall financial effort to betaken to build the system.
As basis for the future work, a concept has been presented, to increase theergonomics of the human robot collaboration task.
Acknowledgements. This research is funded by the project MMAssist II (FFG,858623).
References
1. euRobotics AISBL, robotics 2020 strategic research agenda for robotics in Europe2014–2020. Accessed 1 Oct 2019
2. LLP PricewaterhouseCoopers. The new hire: How a new generation of robots istransforming manufacturing. Delaware limited liability partnership (2014)
3. Corrales, J.A., Garcia Gomez, G.J., Torres, F., Perdereau, V.: Cooperative tasksbetween humans and robots in industrial environments. Int. J. Adv. Robot. Syst.9(3), 94 (2012)
4. Dautenhahn, K.: Methodology & themes of human-robot interaction: a growingresearch field. Int. J. Adv. Robot. Syst. 4(1), 15 (2007)
5. Scassellati, B.: Theory of mind for a humanoid robot. Auton. Robot. 12(1), 13–24(2002)

258 M. Hofmann et al.
6. Goodrich, M.A., Schultz, A.C., et al.: Human-robot interaction: a survey. Found.Trends R© Hum. Comput. Interact. 1(3), 203–275 (2008)
7. Schmidt, A.: Implicit human computer interaction through context. Pers. Technol.4(2–3), 191–199 (2000)
8. Shen, Y.: System fur die Mensch-Roboter-Koexistenz in der Fließmontage, vol.305. Herbert Utz Verlag (2015)
9. Wandelbots gmbh. http://www.wandelbots.com. Accessed 1 Oct 201910. Bruyninckx, H.: OROCOS: design and implementation of a robot control software
framework. In: Proceedings of IEEE International Conference on Robotics andAutomation. Citeseer (2002)
11. Wogerer, C., Bauer, H., Rooker, M., Ebenhofer, G., Rovetta, A., Robertson, N.,Pichler, A.: LOCOBOT - low cost toolkit for building robot co-workers in assemblylines. In: Su, C.-Y., Rakheja, S., Liu, H. (eds.) ICIRA 2012. LNCS (LNAI), vol.7507, pp. 449–459. Springer, Heidelberg (2012). https://doi.org/10.1007/978-3-642-33515-0 45
12. Chen, J.Y.C., Haas, E.C., Barnes, M.J.: Human performance issues and user inter-face design for teleoperated robots. IEEE Trans. Syst. Man Cybern. Part C (Appl.Rev.) 37(6), 1231–1245 (2007)
13. Niehorster, D.C., Li, L., Lappe, M.: The accuracy and precision of position andorientation tracking in the HTC Vive virtual reality system for scientific research.i-Perception 8(3), 2041669517708205 (2017)
14. Borges, M., Symington, A., Coltin, B., Smith, T., Ventura, R.: HTC Vive: anal-ysis and accuracy improvement. In: 2018 IEEE/RSJ International Conference onIntelligent Robots and Systems (IROS), pp. 2610–2615. IEEE (2018)
15. Lawitzky, M., Mortl, A., Hirche, S.: Load sharing in human-robot cooperativemanipulation. In: 19th International Symposium in Robot and Human InteractiveCommunication, pp. 185–191. IEEE (2010)
16. Andersen, T.T.: Optimizing the universal robots ROS driver (2015)17. Real-time data exchange (RTDE) guide - 22229. https://www.universal-robots.
com/how-tos-and-faqs/how-to/ur-how-tos/real-time-data-exchange-rtde-guide-22229/. Accessed 1 Oct 2019
18. Michalos, G., Makris, S., Tsarouchi, P., Guasch, T., Kontovrakis, D., Chryssolouris,G.: Design considerations for safe human-robot collaborative workplaces. ProcediaCIrP 37, 248–253 (2015)
19. ISO ISO. 10218–1: 2011-robots and robotic devices-safety requirements forindustrial robots-part 1: Robots (2011). http://www.iso.org/iso/iso catalogue/catalogue tc/catalogue detail.htm
20. ISO ISO. 10218–2: 2011: Robots and robotic devices-safety requirements for indus-trial robots-part 2: Robot systems and integration. International Organization forStandardization, Geneva, Switzerland (2011)
21. Chitturi, N.C., Ganglbauer, M., Plasch, M., Kulha, P., Pichler, A.: HolisafeHRC:holistic safety concepts in human-robot collaboration. Chest 25, 40 (2019)
22. McAtamney, L., Nigel Corlett, E.: RULA: a survey method for the investigationof work-related upper limb disorders. Appl. Ergon. 24(2), 91–99 (1993)
23. Manghisi, V.M., Uva, A.E., Fiorentino, M., Bevilacqua, V., Trotta, G.F., Monno,G.: Real time RULA assessment using Kinect v2 sensor. Appl. Ergon. 65, 481–491(2017)
24. Xiang, Y., Arora, J.S., Rahmatalla, S., Marler, T., Bhatt, R., Abdel-Malek, K.:Human lifting simulation using a multi-objective optimization approach. Multi-body Syst. Dyn. 23(4), 431–451 (2010)

Human Robot Manipulation 259
Open Access This chapter is licensed under the terms of the Creative CommonsAttribution 4.0 International License (http://creativecommons.org/licenses/by/4.0/),which permits use, sharing, adaptation, distribution and reproduction in any mediumor format, as long as you give appropriate credit to the original author(s) and thesource, provide a link to the Creative Commons license and indicate if changes weremade.
The images or other third party material in this chapter are included in thechapter’s Creative Commons license, unless indicated otherwise in a credit line to thematerial. If material is not included in the chapter’s Creative Commons license andyour intended use is not permitted by statutory regulation or exceeds the permitteduse, you will need to obtain permission directly from the copyright holder.

Human and Workcell Event Recognitionand Its Application Areas in Industrial
Assembly
Matthias Propst(B) , Sharath Chandra Akkaladevi , Michael Hofmann ,Christian Wogerer , and Andreas Pichler
Profactor Gmbh, Steyr, Austria{matthias.propst,sharath.akkaladevi,michael.hofmann,
christian.woegerer,andreas.pichler}@profactor.athttp://profactor.at
Abstract. Assistance systems in production gain increased importancefor industry, to tackle the challenges of mass customization and the demo-graphic change. Common to these systems is the need for context aware-ness and understanding of the state of an assembly process. This paperpresents an approach towards Event Recognition in manual assemblysettings and introduces concepts to apply this key technology to theapplication areas of Quality Assurance, Worker Assistance, and ProcessTeaching.
Keywords: Event recognition · Manual assembly processes ·Knowledge representation
1 Introduction
Todays production industry is facing an ongoing paradigm shift, from mass pro-duction towards mass customization and tailoring of highly individualized prod-ucts. Moreover, production systems and work cells are equipped with sensorsystems and interconnected to realize efficient information transport. Due tothese facts, the information density and complexity is increasing, which meanshigher mental workload and stress to human workers in the loop. There is ademand for cognitive assistance provided to human workers in order to reducestress, the probability of mistakes, and to keep motivation and concentration ata high level. Such assistance systems need to be aware of the production contextas well as of the state of the environment and the behavior of the human worker.This paper focuses on description of an approach to classify events performed bya human worker, including smart tools, in a manual assembly setting. Moreover,three potential application fields of event recognition, as an enabling technology,will be introduced and discussed. The paper concludes with a description of thecurrent state of development and future work items.
c© The Author(s) 2021S. Ratchev (Ed.): IPAS 2020, IFIP AICT 620, pp. 260–275, 2021.https://doi.org/10.1007/978-3-030-72632-4_19

Event Recognition in Assembly 261
2 Problem Statement
Perceiving the environment of an assembly workplace and making a meaningof the current assembly status and activities is a very challenging task. Thefirst challenge is to perceive all relevant information from the environment, andcombine this data to meaningful events. This requires a clear definition of theway events are characterized, which has to correlate with the representation ofthe domain knowledge of Assembly Processes (henceforth: AP). Additionally tothe abstraction of events and AP knowledge, algorithms and rules are required tostore, retrieve and reason about the exiting knowledge. This publication discussesmethods and implementation to create a framework for classifying events inan AP setting. The proposed framework shall serve as enabling technology torealize domain relevant applications, including a) Quality Assurance, b) WorkerAssistance, and c) Process Teaching and Configuration.
A manual assembly setup/workplace, as schematically depicted in Fig. 1, isproposed as platform for implementation and verification of the approaches andmethods. It is assumed that the assembly workplace is realized as a work table,including parts or objects (see objects A, B, C), and smart tools (e.g. wirelessscrewing devices) the human worker can use. Smart tools provide interfaces tocommunicate tool status and configuration data e.g. received from Manufactur-ing Execution Systems (MES). An information screen is available to provideinstructions and hints to the worker in order to reduce probability of assemblymistakes. In order to perceive the environment, 2D and 3D vision sensors areapplied to observe the work table including the human worker, objects and thesmart tools. The sensor data needs to be evaluated accordingly using percep-tion modules, including Tool Proprioception (TP), Action Recognition (AR), andObject Recognition (OR). These subordinate perception modules provide inputto the Event Recognition system. As depicted in Fig. 1 above, event recognitionalso requires domain knowledge and rules to make a meaning of the perceptiondata. The goal of this publication is to present how event recognition can berealized in assembly settings and how it can contribute in solving the functionalchallenges of potential application fields as described below.
2.1 Quality Assurance
Manual APs include steps that are very critical to ensure high quality of theproduct. In some cases, these steps include actions that involve non-rigid partsor there is no application of tools required but the worker’s hands only. Missingsuch process steps yields the need of disassembling parts of the product again.It is a challenge to realize a sensor based detection, without requiring manualconfirmation of each process step through the worker. Event recognition can helphere, to monitor critical process steps during manual assembly.
2.2 Worker Assistance
This application area includes modular assistance systems, that can be tailoredand configured based on the given AP requirements and the current process

262 M. Propst et al.
AB
C
EventRecogni on(Key Technology)
InstruconA
B
InstruconA
B
OR
AR
TP
Applica on Areas
QualityAssurance
WorkerAssistance
Process Teachingand Configura on
Applica on Areas
QualityAssurance
WorkerAssistance
Process Teachingand Configura on
Assembly Workcell
Knowledge Representa
on and Models
Assembly Process
Assembly Process
Assistance Needs
Assistance Needs
Logical RulesLogical Rules
Knowledge Representa
on and Models
Assembly Process
Assistance Needs
Logical Rules
AB
C
EventRecogni on(Key Technology)
InstruconA
B
OR
AR
TP
Applica on Areas
QualityAssurance
WorkerAssistance
Process Teachingand Configura on
Assembly Workcell
Knowledge Representa
on and Models
Assembly Process
Assistance Needs
Logical Rules
Fig. 1. Event Recognition and its applications in assembly settings.
context. A major challenge in this field is given through the required collabo-ration between assistance system and human worker. The interaction needs tohappen intuitively and seamlessly to ensure worker acceptance on the one hand,and to keep performance on a high level. Assistance systems need to interpretand understand what is happening in the environment. In this context eventrecognition can provide valuable information inputs to understand the situationof environment and the human worker.
2.3 Process Teaching and Configuration
High product variation and flexibility require a significant reduction of setup andramp-up times for production systems. However, todays automation systems,especially when including robot technology, require a substantial programmingeffort to adapt to changes. The challenging problem of reducing the programmingeffort for complex tasks, by using modes that are natural to humans, is an opentopic in R&D. This paper will discuss an approach, where event recognitionis applied to enable programming of robots based on demonstration of stepsthrough human workers.
3 State of the Art
3.1 Event Recognition
Event recognition in relation to an AP in an industrial setting could be defined asidentifying the activities or interactions of agents in the environment. The termsgestures, actions, activities, and events have been used interchangeably [1]. Anaction, denoting a sequence of movements, that involves an agent interactingwith an object is defined as an Event. Events are high-level activities which arederived not directly from the sensor data, but from the interpreted information.In literature, to recognize complex activities several hierarchical approaches are

Event Recognition in Assembly 263
proposed and can be broadly divided into three categories depending on therecognition process involved. They are: Statistical approaches use statisti-cal state-based models to recognize activities (usually two layers) e.g. HiddenMarkov Models (HMM) and Bayesian Networks (DBN) [2,3]. For each model,the probability of the model generating a sequence of observations (i.e., actions)is calculated. This step is followed by either a maximum likelihood estimation(MLE) or the maximum a posteriori probability (MAP) classifier to classify thecomplex activity. Syntactic approaches model human activities as a string ofsymbols, where each symbol corresponds to a low-level action. These approachesgenerally use a grammar syntax such as stochastic context free grammar (SCFG)to model activities [4]. Description-based approaches maintain the temporal,spatial and logical relationships between low-level actions to describe complexactivities. In other words, a complex activity is described as an occurrence of itscomposed low level actions which satisfy a certain relation (logical, temporal,spatial) [5]. Event recognition in industrial scenarios has not yet been widelyresearched. There are few approaches that show promise in this direction. Anextensive review of event recognition approaches is given in [6]. Most approacheswith task driven goals only consider object localization for manipulation (oftenwith simple structure). Thereby, they do not consider the problems associatedwith dynamic environments, such as tracking and manipulation of real worldobjects (exceptions include [7,8]).
3.2 Object Recognition and Tracking
Localization of objects in the assembly workcell is required to understand the sta-tus of APs and to classify events. 3D object recognition systems return the posi-tions and orientations of objects of interest. Algorithms of common approachesare based on depth data and CAD models of the objects of interest (see e.g. [9,10]or [11]). Object tracking systems ([10,12]) can help to increase performance andstability of detections in highly dynamical environments. A further performanceboost can be achieved by adding process context information to object localiza-tion and tracking systems [13,14]. In [15] earlier work on 3D object tracking isextended, by combining a object tracking system with a cognitive architecturein a dynamic Human Robot Collaboration (HRC) assembly scenario. Such anarchitecture also supports reasoning about the current state of an AP.
3.3 Smart Tools in Assembly Settings
Todays industrial manual assembly workcells are often equipped with SmartTools, which include communication interfaces to local control systems (e.g.screwing controllers [16,17]) and superordinate control systems for configurationand process and status data exchange. The authors in [18] present an real-timecapable, event-driven architecture to efficiently integrate smart tools within amodern factory. A special case of smart tools is given by Instrumented Toolsas introduced in [19]. These tools are equipped with sensors to measure process

264 M. Propst et al.
data, and a wireless tracking system in order to enable recording of the toolsmotion trajectories. An example outline of such a tool is depicted in Fig. 2.
Fig. 2. Hardware setup of the Instrumented Tool, including tracking and force/torquesensors [19].
3.4 Semantic Knowledge Representation and Processing
Databases like MongoDB [20] or CouchDB [21] make use of W3C standards,e.g. JSON or JSON-LD, to organize contents using document based manage-ment systems. Standard features include free-text based searching, distributionof data, and built-in data analysis algorithms. AllegroGraph [22] combines doc-ument based approaches with graph databases, is compliant with W3C/ISOstandards including JSON, RDF(S), OWL [23] for expression of knowledge, andprovides built-in OWL and RDFS reasoning engines. A similar technology combi-nation is supported by Neo4j [24] and GraphScale [25]. GraphScale enhances thegraph-database Neo4j with OWL reasoning [26]. Within the domain of robotics,Knowrob [8] builds on a OWL/RDF knowledge representation, combined withenhanced reasoning and inference capabilities based on Prolog rules. OWL andRDF graph based knowledge management systems [26] require thorough under-standing or modelling techniques. GraknAI [27] uses higher level schema toexpress knowledge based on hyper-graphs. The developers explain [28] that thismodeling schema is more intuitive and scalable for DB design. At the sametime, built in algorithms enable similar reasoning features than possible withOWL/RDF [29].
4 Methods
This section deals with the development of a methodology to implement an eventrecognition framework, applicable to the application fields stated in Sect. 2.
4.1 Events and Semantic Representation of Domain Knowledge
As mentioned in Sect. 3.1 an Event describes an interaction of an agent, based ona detected Action, with a physical object. In previous work [7], the definition wasextended to also cover interactions with other agents (e.g. human or robot). This

Event Recognition in Assembly 265
modification was necessary in order to describe the potential of events affectingthe environment more clearly. Moreover, this adaptation include the possibilityto associate a temporal-condition with the event-related action, which needs tobe fulfilled to satisfy the event definition. For example an event-related humanaction “pick” needs to be executed for a duration of ten seconds. We proposeto describe temporal-conditions using Allen’s Interval Algebra [30], due to theirgeneralized structure and simplicity. By using a representation according to [7],events can be considered as “semantic entities” that relate individual states ofan Assembly Process.
In its simplest form, APs can be described as a series of (process) States, aset of Events, and a set of Relations. A State describes a certain, stable stageof an AP including the status of smart tools, and objects (spatial relations).A Relation describes how an event drives the progress of an AP further, bysemantically relating two AP states with a corresponding event (see Fig. 3). Aformal description of APs is provided in previous work [19,31]. Referring to theevent description in [7], events issued through smart tools cannot be abstracted.However, we argue that similar to human actions (see definition in Sect. 3.1),smart tool actions can be defined. These actions include for example screwing(screwing device), or movement along a trajectory (trackable lifting assistancetool). Similarly, smart tools can interact with objects. Therefore, the definitionof events is still sound, also if applied to smart tools.
As events affect the AP an abstraction of these effects, that conforms with thedata structures of an AP, is necessary. We introduce the concept of Consequencesto describe changes in spatial-configurations of objects (e.g. “on-top-of”, “inside-of”, or displacement), and changes of the “internal” state of tools or agents(see csqSpatial and csqActStateChange in Fig. 3). It is assumed that an eventcan generate an arbitrary number of consequences. Consequences “physically”advance the AP to a subsequent state. Finally, we introduce logical Rules todefine in which “logical sequence” the generation of consequences will happen.
We summarize: An event is characterized through a) an related human ortool action including an optional temporal-condition to be satisfied, b) conse-quences it generates, and c) logical rules describing the sequence of consequencegeneration. Figure 3 depicts a simplified schema for event definition as explainedand referred to above, modelled using GraknAI [27].
4.2 Conception of the Event Recognition System
Referring to the overview in Fig. 1, and to the event definition concepts inSect. 4.1, event recognition relies on the perception data of the perception sys-tems Tool Proprioception (TP), Object Recognition (OR) and (Human) ActionRecognition (AR). Moreover, the definitions of events (offline defined) areacquired from the available AP domain knowledge. Figure 4 depicts a schematicoverview of the Event Recognition (ER) System. The main functionality of theER system is to continuously observe the perception data streams, and to evalu-ate the Logical Rules describing an event. A common problem of such recognition

266 M. Propst et al.
Fig. 3. Knowledge representation for event definitions, consequences and the AP.
systems is to determine the correct point in time, when to start an event evalua-tion. In our previous work [31] the assumption as follows was made to overcomethis problem: Both AR and TP perception sources serve as triggers for theevaluation procedure. We emphasize that events are related to the execution ofactions, which in turn justifies this assumption. Therefore the beginning/endingof a detected human or smart tool action will activate evaluation procedures assummarized below.
Fig. 4. Outline of the Event Recognition System.
1) Loading of Event Definitions: The event definitions (according toSect. 4.1), are loaded from the AP knowledge.
2) Reference Data Acquisition: An initial detection of the start of an action,advances the event recognition to request the current depth image frame fromthe OR. Similarly, the TP and AR data will be stored for reference includingtimestamps. This data serves as reference data.
3) Comparison Data Acquisition: Upon detection of the end of the currentaction (i.e. different action detected), the same type of data will be acquiredserving as comparison data.

Event Recognition in Assembly 267
4) Evaluation of Logical Rules: All logical rules for the given event definitionsare evaluated in the defined sequence. The event definition having all rulesfulfilled will be returned as classified.
5) Generation of parameterized event: Based on the classified event, anevent instance configuration is created and returned, including parameteriza-tion. The event recognition process is continued at step 2 (repetition).
Evaluation of Logical Rules: The evaluation of logical rules (see Sect. 4.1) inorder to classify offline defined events, is performed on based on comparison oper-ations. While matching event-related human or tool action type requires a simplecomparison of action type identifiers, the evaluation of spatial-consequences andtemporal-conditions is more complex. This is because recorded reference dataand comparison data needs to be considered. Given the case of spatial-relations,the exact POSES (positions and orientations) of the relevant objects of interestsare required. These are obtained by triggering the OR to recognize objects inboth 3D depth frames of the reference and comparison data set. The returnedPOSE results are then used to compute spatial-relations for pairs of objectsbased on euclidean operations. A spatial-consequence is then derived by e.g.comparing the spatial-relation of “Object A” towards “Object B” for the refer-ence and comparison data set. Temporal-conditions are evaluated by comparingthe timestamps of action beginnings and endings, again obtained from the ref-erence and comparison data sets.
5 Applying Event Recognition to Selected ApplicationAreas
In Sect. 2, potential application areas of industrial assembly were identified,where event recognition is considered a valuable technology, to solve challengingrealization problems. Common to these application is the major goal of provid-ing cognitive assistance and support to the human in the loop. Each applicationposes different requirements to event recognition, and variations in the systemarchitecture. This section focuses on the specificities of applying event recogni-tion to each application area.
5.1 Quality Assurance
The purpose of this application is to track whether certain steps during an APdid happen, in order to ensure high quality of the product and to avoid necessarydisassembling actions at a later time. All steps necessary to be tracked can berepresented as events to be modelled in the domain knowledge base, followingthe event definition methods. Based on the defined events, the main idea is topresent the relevant events to the human worker, using a graphical user interface(GUI). Figure 5 depicts a mock-up of the visualization and shows the applicationconcept. In general the visualization presents a configurable list of steps (i.e.

268 M. Propst et al.
events) that need to happen during the AP. One can distinguish among twophases. During the first phase, “Continuous Event Detection” the user can querydetailed information about the steps. All steps are highlighted in yellow colourin the beginning, meaning that the related events are not yet detected. Duringthe process execution, the event recognition system tries to observe relevantevents. Upon detection, the respective step is coloured green. At the end of theAP, during the “Process Review” phase, the human worker gets notified aboutevents that were not detected. After checking, the user needs to manually confirmremaining events.
Fig. 5. Visualization mock-up of the Quality Assurance system. (Color figure online)
Specifics of the System Architecture: In terms of process knowledge, offlineevent definitions are required. The event recognition system observes all possibleperception sources as given in Fig. 1. A GUI frontend is necessary to visualizethe status intuitively for the user.
Requirements: Strict avoidance of “false-positive” detections, i.e. markingas “green” events, which did not happen, is considered the worst case. A lownumber of “true-negative” detections is preferred as asking the human toconfirm undetected events impacts efficiency of the entire process. Process stepsof interest often include non-rigid objects (e.g. cables, foils), thus resulting ina major challenge for OR systems.
Perception Sources: The required perception sources for event recognitioninclude primarily AR and OR, but also TP systems. Having an AR systemwith high detection quality available can compensate OR detections with lowconfidence. All process steps including smart tools, profit from generally stabletool status detections.

Event Recognition in Assembly 269
5.2 Worker Assistance
This application deals with modular assistance systems, configurable based onthe given AP requirements context. Such an assistance system requires a cogni-tive architecture that is capable of perceiving, reasoning and to plan assistanceactions [31]. Figure 6 shows the outline of the proposed architecture.
Fig. 6. Specific system architecture for the Worker Assistance application.
Specifics of the System Architecture: The core of this cognitive systemarchitecture is formed through an Situation Recognition system, that reasonsabout the current state of the AP and the environment. The main goal is to iden-tify situations, where the human worker needs support to complete the commongoal, i.e. the AP. In order to achieve such a behavior additional domain knowl-edge, especially the description of (Human) Assistance Needs and AssistanceFunctions are required. The identification of assistance needs and functions isone of the main research questions targeted in the project MMAssist II [32].Assistance functions refer to configurable capabilities of Assistance Units thatare used to fill cognitive or physical gaps of the human operator in order tocomplete the task.
Requirements: The main requirements include extensive AP knowledge, toenable reasoning a) about the current process state, b) capabilities of the human,c) capabilities of the assistance units and d) effects of assistance functions. Rea-soning about the current process state, requires stable perception systems inorder generate proper hypotheses. Process knowledge can be used to providecontext information to perception systems, e.g. to OR systems to locate objectsthat are of current interest in a given process state. Approaches are introducedby [13] and [14]. Our previous work [15] describes a method to enable contextenhanced tracking of object in a cognitive architecture for AP reasoning.

270 M. Propst et al.
Perception Sources: All introduced perception sources are of interest inthis application area. The application of context information for enhancedparametrization is proven to increase confidence and stability of vision basedperception systems.
5.3 Process Teaching and Configuration
Teaching an AP to robot system is a tedious task. The aim of this applicationis to combine aspects of Learning by Demonstration (LbD) and Learning byInteraction (LbI), as demonstrated in our recent work [19], to significantly reduceprogramming effort. Figure 7 shows the outline of the proposed architecture.
Fig. 7. Specific system architecture for the Process Teaching and Configuration appli-cation.
Specifics of the System Architecture: The teaching process founds on twoapproaches as described in [19]: a) LbD using smart tools (TP), that are instru-mented with sensors to capture trajectories and process data (e.g. force/torque),and b) LbI by applying visual event recognition (OR, AR) to capture coarse pro-cess knowledge. An important concept for the second approach is Skill Transferand Parameter Refinement. Skill transfer refers to the problem of “mapping” asequence of detected and parametrized events (see step 5 in 4.2) to equivalentrobot skills. This requires extended process knowledge of robot skills that aresimilarly described as events, i.e. based on Consequences (see Sect. 4.1). Theparametrization of the robot skills is initially derived from the parametrizedevents, by mapping equally typed parameters. In this context, parameter refine-ment refers to fine-tuning of a) initially derived robot skill parameters or b)additional process parameters (e.g. gripping force) required. This adaptationstep is carried out based on GUI interaction with the human actor [19].
Requirements: The level of confidence and accuracy of visual event recognitionis less critical than in the other applications (see Sects. 5.1 and 5.2). Due to

Event Recognition in Assembly 271
the interactive behavior of the proposed process, the LbI system can query thehuman to resolve ambiguities of detected events. Robot skill definitions as wellas parameterization templates for these skills are additionally required to bedefined in the domain knowledge.
Perception Sources: All introduced perception sources are of interest in thisapplication area in order to realized both learning aspects: LbD and LbI. Spe-cialized, trackable smart tools enable further possibilities of perception, such asphysical parameters and motion trajectories. An implementation of such a toolis described in our recent work [19].
6 Implementation and Results
This section provides brief details on the implementation of relevant conceptsand systems that were introduces in Sect. 4, and refers to the authors previouswork.
6.1 Abstraction of Domain Knowledge
As mentioned earlier, abstraction of domain knowledge is a challenging andtedious task. In previous work [31] the Knowrob knowledge processing frame-work [8] was applied to abstract AP knowledge for a HRC assembly setting.Moreover, the built in reasoning infrastructure was extended and utilized to real-ize an architecture similar to Fig. 6. In recent work [19], GraknAI [27] is appliedto abstract domain knowledge and to implement reasoning functionalities forhuman to robot skill mapping.
6.2 Action Recognition (AR)
Action recognition plays an important role to classify human events in an indus-trial assembly setting. The approach used in this work is based on Deep Learningand applies 3-dimensional DenseNets in Pytorch [33]. Densely Connected Con-volutional Networks (DenseNet [34]) are extended into 3D DenseNet by addinga temporal dimension to all internal convolutional and pooling layers. For eachlayer, the feature maps of all previous layers are used as input, and customfeature maps are used as input to all subsequent layers. Feature extraction isrealized using OpenPose [35], that enables real-time person-tracking and POSEestimation based on 2D image data. A total of five action classes (Pick, Place,Insert, Screw and Idle) were defined and classified with the AR module. In thetraining phase, a record is created by capturing multiple videos of the assemblycovering the action classes. The videos are then “labeled” and split accordingly.The 3D DenseNet Model Network implemented in Pytorch will then be trainedwith the recorded data set. Once the model is trained, it can be used to pre-dict the actions taken during a live stream or recorded video. Figure 8 showsan example result for an “Insertion” action of one object into another (see redcircle in image). Test results show that the network is able to predict the actionclasses from the trained data. The maximum achievable accuracy is about 97%.

272 M. Propst et al.
Fig. 8. Example output of the Action Recognition system for object insertion (see left).The right-hand side of the figure shows the feature extraction based on OpenPose andthe classified result.
6.3 Event Recognition System
The Event Recognition System is implemented as a Python based module in ROS(Robot Operating System), reflecting the architecture introduced in Sect. 4.2.ROS message filters are applied in order to synchronize the perception datainputs originating from the AR, OR [15], and TP [19] modules. During startup ofthe application, a connection to the AP knowledge base is established in order toretrieve the available event definitions. Therefore, the event recognition is onlineconfigurable based on the current contents of the knowledge base. An open topicis the application of AP context (current state) to improve the confidence andstability of event detections.
7 Conclusion and Future Work
Reasoning about the current status of an industrial AP, is a true challenge andan important issue when researching context aware assistance systems for theproduction industry. This work discusses methods to realize event recognitionin industrial assembly settings, and identified application areas that potentiallybenefit from this key technology. We can conclude that, despite the differentapplication targets, there are only little differences in the proposed architecturesto realize the considered applications. The existing results of the core technolo-gies presented, encourage further development and improvement. The presentedsuggested approaches to apply event recognition in the considered applicationsare currently at a concept level, and implementation is part of present work.Therefore, the validation of these approaches and evaluation based on user stud-ies, is a logical next step.
Acknowledgements. This research is funded by the projects MMAssist II (FFG,858623), ASKRob (Austrian Institute of Technology), Bridge-Human Robot Interac-tion (TeachBots), Smart Factory Lab and DigiManu (funded by the State of UpperAustria).

Event Recognition in Assembly 273
References
1. Poppe, R.: A survey on vision-based human action recognition. Image Vis. Comput.28(6), 976–990 (2010)
2. Jalal, A., Kim, Y.-H., Kim, Y.-J., Kamal, S., Kim, D.: Robust human activityrecognition from depth video using spatiotemporal multi-fused features. PatternRecogn. 61, 295–308 (2017)
3. Raman, N., Maybank, S.J.: Activity recognition using a supervised non-parametrichierarchical HMM. Neurocomputing 199, 163–177 (2016)
4. Pei, M., Jia, Y., Zhu, S.-C.: Parsing video events with goal inference and intentprediction. In: 2011 International Conference on Computer Vision, pp. 487–494.IEEE (2011)
5. Zhu, Y., Nayak, N.M., Roy-Chowdhury, A.K.: Context-aware activity recognitionand anomaly detection in video. IEEE J. Sel. Top. Sign. Process. 7(1), 91–101(2012)
6. Ramirez-Amaro, K., Yang, Y., Cheng, G.: A survey on semantic-based methods forthe understanding of human movements. Robot. Auton. Syst. 119, 31–50 (2019)
7. Akkaladevi, S.C., Plasch, M., Pichler, A., Rinner, B.: Human robot collaborationto reach a common goal in an assembly process. In: STAIRS, pp. 3–14 (2016)
8. Tenorth, M., Beetz, M.: Representations for robot knowledge in the KnowRobframework. Artif. Intell. 247, 151–169 (2017)
9. Thalhammer, S., Patten, T., Vincze, M.: SyDPose: object detection and pose esti-mation in cluttered real-world depth images trained using only synthetic data. In:2019 International Conference on 3D Vision (3DV), pp. 106–115. IEEE (2019)
10. Akkaladevi, S., Ankerl, M., Heindl, C., Pichler, A.: Tracking multiple rigid sym-metric and non-symmetric objects in real-time using depth data. In: 2016 IEEEInternational Conference on Robotics and Automation (ICRA), pp. 5644–5649.IEEE (2016)
11. Wu, C.H., Jiang, S.Y., Song, K.T.: CAD-based pose estimation for random bin-picking of multiple objects using a RGB-D camera. In: 2015 15th InternationalConference on Control, Automation and Systems (ICCAS), pp. 1645–1649. IEEE(2015)
12. Joseph Tan, D., Tombari, F., Ilic, S., Navab, N.: A versatile learning-based 3D tem-poral tracker: scalable, robust, online. In: Proceedings of the IEEE InternationalConference on Computer Vision, pp. 693–701 (2015)
13. Amores, J., Sebe, N., Radeva, P.: Context-based object-class recognition andretrieval by generalized correlograms. IEEE Trans. Pattern Anal. Mach. Intell.29(10), 1818–1833 (2007)
14. Dinh, T.B., Vo, N., Medioni, G.: Context tracker: exploring supporters and dis-tracters in unconstrained environments. In: CVPR 2011, pp. 1177–1184. IEEE(2011)
15. Akkaladevi, S.C., Plasch, M., Eitzinger, C., Pichler, A., Rinner, B.: Towards a con-text enhanced framework for multi object tracking in human robot collaboration.In: 2018 IEEE/RSJ International Conference on Intelligent Robots and Systems(IROS), pp. 168–173. IEEE (2018)
16. Deprag Schulz. Screwdriving controllers (2019). https://www.deprag.com/en/screwdriving-technology/products/control-technology/
17. Atlas Copco. Atlas copco power focus (2019). https://www.atlascopco.com/en-uk/itba/products/assembly-solutions/electric-assembly-systems/powerfocus-6000

274 M. Propst et al.
18. Umer, M., Mahesh, B., Hanson, L., Khabbazi, M.R., Onori, M.: Smart power tools:an industrial event-driven architecture implementation. Procedia CIRP 72, 1357–1361 (2018)
19. Akkaladevi, S.C., Pichler, A., Plasch, M., Ikeda, M., Hofmann, M.: Skill-basedprogramming of complex robotic assembly tasks for industrial application. e & iElektrotechnik und Informationstechnik 136(7), 326–333 (2019). https://doi.org/10.1007/s00502-019-00741-4
20. Chodorow, K.: MongoDB: The Definitive Guide: Powerful and Scalable Data Stor-age. O’Reilly Media, Inc., Sebastopol (2013)
21. CouchDB Team. Couchdb 2.0 reference manual (2015)22. Inc Franz. Allegrograph: Semantic graph database (2017). https://allegrograph.
com/products/allegrograph/23. OWL Working Group et al.: Owl 2 web ontology language document overview:
W3C recommendation, 27 October 2009 (2009)24. Neo4J Developers. Neo4j. Graph NoSQL Database (2012)25. Liebig, T., Vialard, V., Opitz, M., Metzl, S.: GraphScale: adding expressive reason-
ing to semantic data stores. In: International Semantic Web Conference (Posters& Demos) (2015)
26. Ehrlinger, L., Woß, W.: Towards a definition of knowledge graphs. SEMANTiCS(Posters, Demos, SuCCESS) 48, 1–4 (2016)
27. Enterprise Grakn Labs. Graknai: A knowledge graph (2019). https://grakn.ai/about
28. Pribadi, H.: The grakn.ai ontology: Simplicity and maintainability (2017). https://blog.grakn.ai/the-grakn-ai-ontology-simplicity-and-maintainability-ab78340f5ff6
29. Klarman, S.: A closer look at grakn.ai’s hypergraph datamodel (2017). https://blog.grakn.ai/modelling-data-with-hypergraphs-edff1e12edf0
30. Allen, J.F.: Maintaining knowledge about temporal intervals. In: Readings in qual-itative reasoning about physical systems, pp. 361–372. Elsevier (1990)
31. Akkaladevi, S.C., Plasch, M., Maddukuri, S., Eitzinger, C., Pichler, A., Rinner, B.:Toward an interactive reinforcement based learning framework for human robotcollaborative assembly processes. Front. Robot. AI 5, 126 (2018)
32. Wogerer, C., Plasch, M., Tscheligi, M., Lampl, S.E.: Industrial assistance as anI4.0 topic—MMAssist: assistance in production in the context of human–machinecooperation. In: Ball, P., Huaccho Huatuco, L., Howlett, R.J., Setchi, R. (eds.)KES-SDM 2019. SIST, vol. 155, pp. 399–410. Springer, Singapore (2019). https://doi.org/10.1007/978-981-13-9271-9 33
33. Paszke, A., et al.: Automatic differentiation in pytorch (2017)34. Huang, G., Liu, Z., Van Der Maaten, L., Weinberger, K.Q:. Densely connected
convolutional networks. In: Proceedings of the IEEE Conference on ComputerVision and Pattern Recognition, pp. 4700–4708 (2017)
35. Cao, Z., Hidalgo, G., Simon, T., Wei, S.E., Sheikh, Y.: OpenPose: real-time multi-person 2D pose estimation using part affinity fields. arXiv preprintarXiv:1812.08008 (2018)

Event Recognition in Assembly 275
Open Access This chapter is licensed under the terms of the Creative CommonsAttribution 4.0 International License (http://creativecommons.org/licenses/by/4.0/),which permits use, sharing, adaptation, distribution and reproduction in any mediumor format, as long as you give appropriate credit to the original author(s) and thesource, provide a link to the Creative Commons license and indicate if changes weremade.
The images or other third party material in this chapter are included in thechapter’s Creative Commons license, unless indicated otherwise in a credit line to thematerial. If material is not included in the chapter’s Creative Commons license andyour intended use is not permitted by statutory regulation or exceeds the permitteduse, you will need to obtain permission directly from the copyright holder.

Cognitive Assistance to SupportMaintenance and Assembly Tasks:
Results on Technology Acceptance of aHead-Mounted Device
Cornelia Gerdenitsch1(B) , Lisa Deinhard1, Bettina Kern1 , Philipp Hold2,and Sebastian Egger-Lampl1
1 AIT Austrian Institute of Technology GmbH, Vienna, Austria{cornelia.gerdenitsch,lisa.deinhard,bettina.kern,
sebastian.egger-lampl}@ait.ac.at2 Fraunhofer Austria Research GmbH, Vienna, Austria
http://ait.ac.at, http://www.fraunhofer.at
Abstract. This paper presents a study investigating the user accep-tance (i.e. the perceived ease of use, willingness to use the system overtime, and perceived usefulness) of a smart head-mounted device that canbe used as assistive technology for maintenance and assembly. In partic-ular, we focus on the head-mounted display named HMT-1 from Real-Wear. The uniqueness of this technology is, among other things, thatit offers the possibility to fold away the display with the instructions,allowing more control over the appearance of assistive content than inother head-mounted displays. Overall, 48 participants took part in thisinterview study. They mentioned some advantages (e.g., that the handsare free and that one can see the instructions while working on some-thing else at the same time) and disadvantages of the technology (such asusability issues). They also suggested that the technology is suitable fornon-routine tasks and tasks of medium-to-high complexity. Our findingshighlight that a cognitive assistive technology is perceived as positivewhen direct assistance is available (in the visual field of the worker) witha possibility to control the system.
Keywords: Technology acceptance · Work assistance · HMD ·Cognitive assistance · Assembly · Maintenance
1 Introduction
Digital technologies are increasingly used in maintenance and assembly use caseswith the aim of cognitively guiding employees. Thus far, various augmentedreality solutions, instructions on mobile devices, or projections, such as in situinstructions, have been developed, implemented, and evaluated [1,9,12].
c© The Author(s) 2021S. Ratchev (Ed.): IPAS 2020, IFIP AICT 620, pp. 276–284, 2021.https://doi.org/10.1007/978-3-030-72632-4_20

Acceptance of an Assistive Technology 277
A more recent example of cognitive assistive technology is the RealWearhead-mounted tablet (HMT-1). The HMT version 1 device, depicted in Fig. 1,is a head-mounted device that provides visual information through a screen andauditory information through a headset and is suitable for workers requiringtheir hands to be free for tasks. It has been developed for industrial use, whichis why the 380 g device can be combined with a safety helmet and safety goggles.This weight includes a 3250 mAh battery with an 8-h charge life. Active noisesuppression of up to 90 dB is designed to ensure reliable speech recognitioneven in noisy environments. Furthermore, the HMT-1 is waterproof, shockproof,dustproof, and can be used in temperatures from −20 ◦C to 50 ◦C. The colourmicrodisplay with a resolution of 854 × 480 pixels can be worn over the left orright eye (realwear.com). A unique feature of this technology is that the cognitivesupport (i.e., the information that is displayed) can be physically retrieved orfolded away. Thus, the user has good control over the display technology in hisor her field of view, and can fold it away before becoming distracted or annoyedby the displayed information.
Fig. 1. A visualisation of the Head-Mounted Tablet 1 (right) and an illustration of thearm with the information given (left); copyright RealWear (2018)
The aim of this study is to investigate the acceptance of a head-mounteddevice named HMT-1, which can be used as cognitive assistance for assemblyand maintenance. To investigate the technology acceptance it is essential todetermine which aspects of the technology are perceived as useful and easy touse and which aspects of this device still require improvement. Within semi-structured interviews we could provide input for developers of head-mounteddevices in designing the system but also for industries that aim to use head-mounted displays as assistance for their worker.
In the following sections, we describe the theoretical background of this studyby focusing on empirical and theoretical research concerning technology accep-tance. Next, we present the methodology of our interview study, including asample description and the procedure of the study. In the findings section, wepresent the main findings of the interviews separately for the two core dimen-sions of technology acceptance: perceived ease of use and perceived usefulness.Lastly, we discuss these findings and review the limitations and ideas for future

278 C. Gerdenitsch et al.
research. Within the practical limitations and conclusion section, we derive rec-ommendations for the design, development, and implementation of cognitiveassistive technologies in the context of assembly and maintenance work.
2 Background
2.1 Head-Mounted Devices for Cognitive Assistance
Industrial workplaces are increasingly digitised. In line with this, new technolo-gies are being introduced to support employees in their work tasks. These tech-nologies can support employees cognitively (e.g., by providing information aboutproducts or by supporting complex analyses) or physically (e.g., using robots orexoskeletons that support carrying heavy loads). For cognitive assistance, head-mounted devices have been developed, which are widely used to provide infor-mation to employees. This technology originated in 1950 and 1960 when MortonHeilig telesphere mask was patented [11]. A current innovation is the RealWearHMT-1 published in March of 2017, which has previously been introduced.
Previous research on user acceptance of HMDs has revealed differences inacceptance between usage scenarios [13] and differences in technology properties[8]. For instance, [13] analysed augmented reality smart glasses and their rolein work assistance in electronics manufacturing in two use cases (order pickingin warehouse logistics and assembly machine setup). They conducted a surveyinvestigating the users’ expectations in terms of usability, usefulness, and useracceptance. The findings demonstrated that the overall user expectations weremore positive in the second use case than in the first case among all aspectsof usability and acceptance. The authors explained these results with a task-technology fit approach (see also [4,5,7]). The results of this study highlightthe necessity to consider potential properties of use cases in which new assistivetechnologies should and should not be used.
2.2 Technology Acceptance
Technology acceptance is usually assessed based on the widely acknowledgedtechnology acceptance model (TAM; [3,14,15]). The model proposes two rele-vant variables predicting the intention to use technologies: i) perceived ease ofuse and ii) perceived usefulness. Perceived ease of use is described as the degreeto which a user thinks that using the technology is free of physical and mentaleffort. Perceived usefulness describes that the user thinks that using the tech-nology increases his/her task performance. Perceived ease of use and perceivedusefulness are fundamental determinants of actual system use. The fulfilment ofboth is [3].
3 Interview Study: Method and Procedure
As part of a larger research study, we invited individuals to the TU pilotfactory Industrie 4.0 at the Vienna University of Technology (pilotfab-rik.tuwien.ac.at/en) and asked them to assemble a workpiece using a screen or

Acceptance of an Assistive Technology 279
an augmented reality solution. After this task we presented the HMT-1 to theseparticipants as another solution that can help with assembly. The participantswere invited to a separate room where they had the opportunity to try it out.We then conducted interviews with them and asked them about their generalimpression and their assessment of the perceived usefulness and ease of use.
The sample consisted of 48 participants: 30 were female, and 18 were male.The age of the participants ranged from 18 to 44 years (M = 24.81, SD = 5.54).Regarding the highest level of education attained, 30 participants stated thatthey had passed the Matura/Abitur, and 18 indicated that they had obtainedan academic degree.
The semi-structured interviews addressed the advantages and disadvantages,perceived usefulness, and appropriate work contexts for the HMT-1. The inter-views lasted between 4 and 27 min (M = 11:53; SD = 4:02). The interviewswere conducted by three interviewers (two of whom are co-authors) guided bythe interview guidelines. All interviews were conducted in German. The inter-views have been transcribed and analysed by summarising the content aboutthe two technology acceptance dimensions: perceived ease of use and perceivedusefulness. Based on the approach of Mayring’s qualitative content analysis [10],we categorised the statements into broader categories that should cluster andrepresent the original statements properly.
3.1 Findings
In the following sections, we present the findings separately for the perceived easeof use and perceived usefulness. In terms of perceived ease of use we describementioned advantages and disadvantages of the technology; for perceived useful-ness we describe despite statements about the general perceived usefulness alsosuitable use cases that have been mentioned by the study participants.
Perceived Ease of Use. Participants mention initial advantages and disad-vantages of the technology which we have categorised into three categories: i)user experience, ii) ergonomics, iii) device characteristics. The following twotables (Table 1 and Table 2) summarise the advantages and disadvantages forthese three dimensions. The numbers in parentheses indicate the frequency ofthe respective statement.
In general, the most frequently mentioned advantage of HMT-1 was thatit is perceived as suitable in terms of the display (location) and the relatedadjustability. Participants for instance mentioned the advantage that the armcan be located directly in front of the workers’ eyes (14 times). In connectionto that, they reported that their field of view is unrestricted (5 times). Theyfurther highlighted the adaptivity and controllability (that the boom arm canbe folded back and forth with one hand (10 times) and the possibility to movefreely (10 times) as advantages.
Disadvantages primarily concern the hardware and quality of experience withrespect to (media) the display abilities of the technology. For instance, 26 par-ticipants mentioned that the display is very small. Similarly, participants also

280 C. Gerdenitsch et al.
Table 1. Most frequently mentioned advantages; numbers in parentheses indicate thefrequency
Category Formulated advantages
User experience Location: display is located in the worker’s field of view (14)
Adaptivity and control: the boom arm can be folded back and
forth with one hand (10)
Mobility: to move freely (10)
Support: see instructions and do something else at the same
time (6)
Field of view: hardly restricted (5)
Pleasure: funny and interesting (5)
Ergonomics Comfort: pleasant wearing comfort (2)
Individually adjustable (1)
Device characteristics Broad application areas: Useful for several workstations (2)
Input and output: voice control and sound reproduction (2)
Table 2. Most frequently mentioned disadvantages; numbers in parentheses indicatethe frequency
Category Formulated disadvantages
User experience Quality: blurred, fuzzy, pixelated image (11), not possible to
see the complete screen content (13), voice control (1)
Familiarity: unfamiliar (6)
Ergonomics Health: pressure on the head leading to headache (8 times),
strenuous for the eyes (12)
Discomfort: uncomfortable (5), annoying feeling to always have
something on the head (4), always in the field of view (9)
Device characteristics Hardware: display is very small (26)
Physical stability: perceived as unstable (18)
mentioned disadvantages related to health at work, for example, that workingwith the small display may be strenuous for the eyes (12 times) or that the weightof the technology may lead to headache (8 times). Further, regarding the qualityof the visualisation, participants mentioned that the image is blurred, fuzzy, andpixelated (11 times) or that the voice control is not precise enough (once). Wewant to mention here that participants did not evaluate the finished system witha visualisation that has been properly developed and tested; therefore, some ofthese statements are expected.
Perceived Usefulness. In terms of perceived usefulness, 15 participantsreported that the device is useful. One participant stated, “that it would enrichthe workflow” and that ‘it gives the impression of efficiency’ (Participant ID 2).However, others did not assess the device as useful. For example, it was statedthat ‘in any case, it would hinder me more’ (Participant ID 42). We furtherasked participants about suitable use cases for HMT-1. A total of 34 suggestionswere made. According to the interviewees, HMT-1 is appropriate for non-routinetasks and for tasks of medium-to-high complexity. Furthermore, it is consideredpractical ‘when you have to manufacture something big and complex and haveto move around a lot’ (Participant ID 10). In addition to the implementation

Acceptance of an Assistive Technology 281
of the technology in manufacturing (e.g. for quality control; participants withIDs 17, 29, and 30), it could also be used in logistics, for instance as a ‘naviga-tion device for truck drivers or for crane or forklift drivers in larger warehouses’(Participant ID 23).
3.2 Discussion
In our interview study we investigated user acceptance of a head-mounted devicecalled HMT-1, which is designed to support users by presenting information(e.g. visualizations) in the visual field. The information is shown on a foldabledisplay. We had two main results that are relevant for both the assembly andthe maintenance context. Firstly, we found that besides the possibility to movefreely, the participants mentioned that it is of central advantage to have thedisplay in their field of view, combined with the autonomy to decide whereand when the visualization is given. In particular, the users reported that theposition of the display and the adaptability and control of the extension armto which the display belongs were mentioned as advantages. The ability to foldaway the information distinguishes the HMT-1 from other HMDs. Thus, thistechnology allows to support the workflow while avoiding possible distractions orinterruptions. The individual control of the employee is thus maintained, whichhas proven to be limited when using other HMDs (see e.g. [2]). Secondly, theresults showed that HMT-1 contains functionalities that both support and hinderthe workflow. These results are consistent with the results of the study reportedby [8]. Therefore, as with any technology, when introducing the technology intoan organization, it is necessary to invest time in considering appropriate worktasks in order to benefit from the technology. For example, the participants inthis sample mentioned that HMT-1 is particularly suitable for non-routine tasksand tasks of medium to high complexity.
Limitation and Future Research. A limitation of our study is that the sam-ple consisted mainly of students using the device for the first time, rather thanassembly or maintenance workers. However, to create the industrial context, weintegrated the study into a larger project that took place in a pilot factory. Still,our results only give a first impression of the acceptance of the technologies bynon-professionals. A further limitation is that the technology was not tested withsuitable ready-made software. The comments on the quality of the presentationare also due to this fact; however, the physical or display characteristics of thedevice (screen size, resolution, etc.) are also independent of content and havebeen mentioned negatively in this respect. Overall, the study results alreadygive an indication of the perceived advantages and disadvantages of the technol-ogy and are thus valuable when it comes to further developing the technology.For further studies, we recommend conducting them with employees in real con-texts. Thereby we suggest focussing on investigating for which specific use casesor working tasks this device can be supportive (for instance in terms of higherwell-being, safety, productivity) and for which not.

282 C. Gerdenitsch et al.
Practical Implications and Conclusion. Our study provides recommenda-tions to increase user acceptance in terms of perceived ease of use and perceivedusefulness of the HMT-1. First, because the hands-free operability and the possi-bility to adapt and control the technology were described as particularly positive,we recommend maintaining this design. Second, we recommend focusing on aproper visualisation on the display. Third, we suggest - as for every technologythat will be introduced at work - assessing suitable use cases and work tasksand defining when and how long the technology can and should be used. Withthese adjustments, we conclude that user acceptance can be increased and thatthe device can be beneficial for workers and organisations.
Finally, as regards the implementation of head-mounted devices in general,we recommend that the positive aspect of control over the technology should bemaintained. For example, if organizations require employees to pretend to havetheir arm in front of their head at all times, these positive effects will disappear.As some ergonomic aspects have also been mentioned, we also recommend thatthe occupational physician be involved in the implementation. It is importantto decide how and for how long the technology can and should be used. Forexample, maximum usage times can then be defined in cooperation (for furtherrecommendations on how to implement assistive technologies see [6]). Such rulesof use, appropriate for the specific workplace and workers, can minimise thepotential negative effects on health and well-being and support comfort.
Acknowledgements. This work is supported by the project MMAssistII (FFG No.858623) as part of the “Produktion der Zukunft” funding program that is operatedby the Austrian Research Promotion Agency FFG. The financial support by the Aus-trian Ministry for Transport, Innovation and Technology is gratefully acknowledged.This work is further supported by the TU Wien Pilotfabrik Industrie 4.0, which hasbeen partly funded by the public through the Austrian Research Promotion Agency(FFG) and several private industrial firms. The interviews have been conducted at thislocation. Finally, we thank Yvonne Krivanek for supporting this study.
References
1. Buttner, S., Funk, M., Sand, O., Rocker, C.: Using head-mounted displays andin-situ projection for assistive systems: a comparison. In: Proceedings of the 9thACM International Conference on PErvasive Technologies Related to AssistiveEnvironments, pp. 44:1–44:8. PETRA 2016, ACM, New York (2016). https://doi.org/10.1145/2910674.2910679. http://doi.acm.org/10.1145/2910674.2910679
2. C, G., Meneweger, T., Stockreiter, C., Butterer, P., Halbwachs, M., Scheiblhofer,D.: Autonomy and responsibility in an AR supported assembly task. In: Transdis-ciplinary Workplace Reserach Conference (2020)
3. Davis, F.D.: Perceived usefulness, perceived ease of use, and user acceptanceof information technology. MIS Q. 13(3), 319 (1989). https://doi.org/10.2307/249008. https://www.jstor.org/stable/249008?origin=crossref

Acceptance of an Assistive Technology 283
4. Edwards, J.R., Cable, D.M., Williamson, I.O., Lambert, L.S., Shipp, A.J.: Thephenomenology of fit: linking the person and environment to the subjective expe-rience of person-environment fit. J. Appl. Psychol. 91, 802–827 (2006). https://doi.org/10.1037/0021-9010.91.4.802. http://doi.apa.org/getdoi.cfm?doi=10.1037/0021-9010.91.4.802
5. Fuller, R.M., Dennis, A.R.: Does fit matter? the impact of task-technologyfit and appropriation on team performance in repeated tasks. Inf. Syst.Res. Linthicum 20(1), 2–17, 155 (2009). http://search.proquest.com/docview/208165333/abstract/1D046F2AAD6D4C53PQ/1
6. Gerdenitsch C., Bunner, J., Tscheligi, M.: Digitale assistenz in der produktion:empfehlungen aus perspektive des arbeitnehmerinnenschutzes [digital assistancein production: recommendations from the perspective of worker protection]. In:PASIG. p. Salzburg (2018)
7. Goodhue, D.L.: Development and measurement validity of a task-technologyfit instrument for user evaluations of information system. Decis. Sci. 29(1),105–138 (1998). https://doi.org/10.1111/j.1540-5915.1998.tb01346.x. https://onlinelibrary-wiley-com.uaccess.univie.ac.at/doi/abs/10.1111/j.1540-5915.1998.tb01346.x
8. Grauel, B.M., Terhoeven, J.N., Wischniewski, S., Kluge, A.: Erfassung akzep-tanzrelevanter merkmale von datenbrillen mittels repertory grid technik.Zeitschrift fur Arbeitswissenschaft 68(4), 250–256 (2014). https://doi.org/10.1007/BF03373926
9. Hou, L., Wang, X., Berold, L.E., Love, P.E.: Using animated augmented realityto cognitively guide assembly. J. Comput. Civil Eng. 27, 439–451 (2013). https://doi.org/10.1061/(ASCE)CP.1943-5487.0000184
10. Mayring, P.: Qualitative Inhaltsanalyse: Grundlagen und Techniken [QualitativeContent Analysis: Basics and Techniques], 8th edn. Deutscher Studien Verlag,Weinheim (2008)
11. Sural, I.: Mobile augmented reality applications in education. Mobile Technologiesand Augmented Reality in Open Education. IGI Global, United States (2017).https://doi.org/10.4018/978-1-5225-2110-5.ch010
12. Tang, A., Owen, C., Biocca, F., Mou, W.: Comparative effectiveness of aug-mented reality in object assembly. In: Proceedings of the SIGCHI Conferenceon Human Factors in Computing Systems, pp. 73–80. CHI 2003, ACM, NewYork (2003). https://doi.org/10.1145/642611.642626. http://doi.acm.org/10.1145/642611.642626
13. Terhoeven, J., Schiefelbein, F.P., Wischniewski, S.: User expectations on smartglasses as work assistance in electronics manufacturing. Procedia CIRP 72, 1028–1032 (2018). https://doi.org/10.1016/j.procir.2018.03.060. https://linkinghub.elsevier.com/retrieve/pii/S2212827118301628
14. Venkatesh, V., Bala, H.: Technology acceptance model 3 and a research agenda oninterventions. Decis. Sci. 39, 273–315 (2008)
15. Venkatesh, V., Davis, F.D.: A theoretical extension of the technology accep-tance model: four longitudinal field studies. Manage. Sci. 46(2), 186–204 (2000).https://doi.org/10.1287/mnsc.46.2.186.11926. http://pubsonline.informs.org/doi/abs/10.1287/mnsc.46.2.186.11926

284 C. Gerdenitsch et al.
Open Access This chapter is licensed under the terms of the Creative CommonsAttribution 4.0 International License (http://creativecommons.org/licenses/by/4.0/),which permits use, sharing, adaptation, distribution and reproduction in any mediumor format, as long as you give appropriate credit to the original author(s) and thesource, provide a link to the Creative Commons license and indicate if changes weremade.
The images or other third party material in this chapter are included in thechapter’s Creative Commons license, unless indicated otherwise in a credit line to thematerial. If material is not included in the chapter’s Creative Commons license andyour intended use is not permitted by statutory regulation or exceeds the permitteduse, you will need to obtain permission directly from the copyright holder.

Usability Study of Learning-Based PoseEstimation of Industrial Objects from
Synthetic Depth Data
Stefan Thalhammer(B) , Timothy Patten , and Markus Vincze
Faculty of Electrical Engineering and Information Technology, TU Wien,1040 Vienna, Austria
{thalhammer,patten,vincze}@acin.tuwien.ac.at
Abstract. For visual assistance systems deployed in an industrial set-ting, precise object pose estimation is an important task in order tosupport scene understanding and to enable subsequent grasping andmanipulation. Industrial environments are especially challenging sincemesh-models are usually available while physical objects are not or areexpensive to model. Manufactured objects are often similar in appear-ance, have limited to no textural cues and exhibit symmetries. Thus,these are especially challenging for recognizers that are meant to providedetection, classification and pose estimation on instance level. A usabil-ity study of a recent synthetically trained learning-based recognizer forthese particular challenges is conducted. Experiments are performed onthe challenging T-LESS dataset due to its relevance for industry.
Keywords: Pose estimation · Deep learning · Synthetic data ·Rendering · Augmentation · Depth data
1 Introduction
Typical tasks for visual assistance systems designed for industrial use cases areobject detection and pose estimation. In order to minimize costs, training rec-ognizers from synthetic data is desired since the data generation process caneasily be automated. To automate these processes, objects models in the formof meshes are required.
While classical approaches are designed to strongly rely on the availabilityof mesh models of the objects of interest to train their recognizers, learning-based approaches require huge amounts of annotated images [2]. Object modelsare usually given since they are available in the company’s resource planningsystem. If not, they can be easily acquired through reconstructing the physicalobject instances. This is a strong advantage over task-specific learning-basedapproaches that require real-world training images.
While traversing from synthetic training data to real-world test data with-out a decrease in performance is easy for classical approaches, learning-based
c© The Author(s) 2021S. Ratchev (Ed.): IPAS 2020, IFIP AICT 620, pp. 285–296, 2021.https://doi.org/10.1007/978-3-030-72632-4_21

286 S. Thalhammer et al.
approaches do not traverse that easily. In order to circumvent this so called real-ity gap, methods need to be applied for the domain transition such as GenerativeAdversarial Networks (GAN), feature space mapping or randomized augmenta-tions [3–8].
The authors of SyDPose [7] showed that using a randomized camera modelcombined with randomized augmentations on depth data leads to suitable recog-nizers for texture-less objects with considerable diversity in shape [9,10]. How-ever, the datasets used in the investigation are not designed to evaluate thechallenges relevant in industry. Typical challenges of industrial use cases includelittle inter-class variations, little to no texture and symmetries. Recently theauthors of [11] introduced the T-LESS dataset, which is designed to mimic thespecifically challenging industrial object recognition setting. SyDPose is appliedon the T-LESS dataset to evaluate the usability of depth data for learning-basedobject pose estimation using only synthetic data.
Handling symmetries is a general problem in pose estimation. All 30objects in the T-LESS dataset exhibit either an axis of rotational symmetryor one to multiple planes of symmetry. Symmetry handling with learning-basedapproaches is usually performed during training data annotation, during trainingtime or during the evaluation itself [1,10,12–14]. The first two approaches areoften necessary to allow learning-based approaches to converge. Problems canoccur when two or more distinct views visually appear similar but have differentannotation, therefore, hindering the learning process and consequently slowingthe convergence rate. Approaches that propose multiple hypotheses are agnosticto the problem, thus symmetry handling can be entrusted to the evaluation.In this work, symmetry handling during training data annotation is formalized.Although the training data has been generated without symmetry awareness,the symmetries of objects are known within the local reference frames and thisinformation is exploited.
Our contributions are the following:
– We substantiate the usability of learning-based pose estimators trained usingonly synthetic depth data for challenging, industrially relevant, texture-lessobjects.
– We provide guidelines to train Convolutional Neural Networks (CNN) for poseestimation of objects with rotational symmetries or one plane of symmetry.
The remainder of the paper is structured as follows. Section 2 summarizesrelated work. Section 3 presents the approach. Section 4 gives insights regardingtraining and presents the results. Section 5 concludes with a discussion.
2 Related Work
Estimating object poses from single-shot images using learning-based approachesgained considerable attention recently [4–7,12–18]. Many of these methodsrequire annotated real-world data for training directly, or must learn the map-ping from synthetic to real world [8,13,15–18]. Some methods train using onlysynthetic data, either from RGB [4,6] or depth data [7,16].

Usability Study of Learning-Based Pose Estimation 287
Fig. 1. The network is trained end-to-end in a multi-task fashion. For training, onlyaugmented synthetic depth data is used. During deployment, estimations are made onreal-world data with additional PnP for control point projection and ICP for refine-ment. RGB is used for visualization.
Methods that are trained using only synthetic data are highly desired byindustry because data acquisition and annotation is leveraged through processesthat can easily be automated. While the reality gap is quite considerable forthe RGB domain it is smaller when using depth data. Consequently, SyDPose isdesigned for depth data, trained from rendered and augmented synthetic data [7].
A promising stream of object pose estimation research focuses on the predic-tion of correspondences between object models and a given input image. Thesemethods can be categorized by dense [8,12,17] or sparse [7,13,15,18]. Commonto all these methods is that they use the predictions to estimate the object posesby re-projecting to 3D. This is done using variants of the Perspective-n-Pointsalgorithm (PnP).
Handling symmetries of objects of interest is especially challenging forlearning-based approaches. This results from the necessity to incorporate sym-metry handling already in the training process in order to guarantee success-ful convergence. Two main streams of symmetry handling are popular. Firstly,object poses are annotated such that ambiguous views with different poses areavoided [6,13]. Secondly, symmetry handling is taken into account while calculat-ing the loss during training time [12,14]. For the task at hand, it is assumed thatonly mesh models are given. Thus, rules have to be formalized to disambiguatesymmetric views of objects with rotational or discrete symmetries.
3 Approach
This section describes the approach for object detection and pose estimationusing only synthetic depth data for training. An overview is given in Fig. 1.
Synthetic depth images are rendered from a virtual scene. These images areaugmented using a randomized camera model and used as training data. Objectposes are presented to the network in the form of discrete feature locationsprojected to 2D control points. The network learns to regress potential objectlocations in image space, the corresponding class and control points. The out-puts are used to estimate the poses of the objects of interest in 3D space via

288 S. Thalhammer et al.
re-projection using PnP. Additional pose refinement is performed using the Iter-ative Closest Point (ICP) algorithm [19]. RetinaNet1 [20] is used with ResNet-50 [21] backbone, pretrained on ImageNet [22] as feature extractor and detector.An additional network head that is parallel to the classification and detectionbranches regresses 3D control point locations.
In the remaining of this section, the network architecture is described in moredetail and the method for handling object symmetries is elaborated.
3.1 Network Architecture
RetinaNet consists of a backbone network that slides over the image comput-ing convolutional feature maps over multiple scales. These feature maps arepassed to subsequent networks for classification and bounding box regression.Translation invariant anchors are constructed using the parameters describedin [20] to construct spatial positions. This procedure is coherent with slidingwindow approaches. For each of the anchor positions, the backbone network cal-culates features maps. The feature activation outputs of the third, fourth andfifth residual block of the ResNet-50 backbone are used to construct rich, multi-scale features by the Feature Pyramid Network [23]. These multi-scale featuresare passed to the classification and bounding box regression branches, whichpredict class probabilities and the bounding box offset from the correspondinganchor center when an object is present. The input feature map is additionallypassed to a control point regression branch.
Control points are regressed in image space as proposed by [24]. Points canbe chosen arbitrarily in the object’s coordinate frame and must not representactual meaningful features. Using the camera intrinsics and the calculated cor-responding object pose these points are projected into image space.
The control point estimation branch consists of four convolutional layers usedfor pose-specific feature extraction, with Rectified Linear Units (ReLu) used asactivations, and one final convolution layer with linear activation for coordinateprediction. The last convolutional layer predicts 16 values representing the x andy components of the eight defined control points location in image space. Addi-tionally, l2 regularization of every layer’s weights with the hyperparameter setto 0.001 is used in order to help the network learn a more general representation.
3.2 Symmetry Handling
Symmetry handling in the context of deep learning is necessary to not hinderthe learning process while training the network. This can be done by only show-ing symmetrical objects from certain views in order to obtain only unambiguousannotations. A different line of research incorporates the object’s symmetry intothe loss calculation [13]. Disambiguating the loss calculation by calculating sym-metry aware losses prevents the network training from being hindered [12,14].
The case when object models and annotations regarding symmetries are givenis considered.1 https://github.com/fizyr/keras-retinanet.

Usability Study of Learning-Based Pose Estimation 289
Fig. 2. Calculated versus desired angle error for loss calculation of object 17, of T-LESS, revolved around its axis of symmetry.
Objects with continuous symmetries can be rotated arbitrarily around theaxis of symmetry resulting in an infinite number of similar, thus ambiguousviews. When training these cases without employing special measures to keepthe angle error between the predicted and the ground truth pose near zero, thetraining process is hindered. Figure 2 shows the calculated angle error and thedesired angle error for the loss calculation of objects with continuous symmetries.In order to disambiguate these views, the annotated object pose is transformedby rotating the object along its axis of symmetry. The rotation is stopped whenthe plane spanned by an arbitrary axis orthogonal to the plane of symmetryand the axis of symmetry passes through the camera center. As such, optimizingfor the object rotation around its axis of symmetry is omitted. Leading to nohindrance of the network’s convergence process.
When handling objects with one plane of symmetry, views that can be mir-rored at the plane of symmetry can hinder the training process. Figure 3 com-pares the calculated and the desired angle error for the loss calculation of objectswith a plane of symmetry. The desired absolute angle error vanishes for similarviews. In order to disambiguate these cases, object pose annotations are mir-rored such that the normal of the plane of symmetry always points to the sameside of the image, i.e., to the positive or negative x-direction of the image frame.Consequently, the same control points are consistently either on the right or onthe left side of the object during training. This results in a valid solution thatdoes not hinder network convergence during training.
The proposed transformations can already be applied during rendering. Theycan also be applied during training data annotation if at the time the data isrendered without the knowledge of symmetry annotation.

290 S. Thalhammer et al.
Fig. 3. Calculated versus desired angle error for loss calculation of object 9, of T-LESS,revolved around its z-axis.
4 Experiments
In order to substantiate the usability of deep architectures for pose estimationof industrially relevant objects, SyDPose is trained only on synthetic data andthe performance is evaluated on challenging texture-less objects. As a prerequi-site for training, only non-textured meshes of the objects of interest are needed.Evaluation is done on the T-Less dataset. The dataset objects have no discrimi-native color, little texture, are often similar in shape and some objects are partsof other objects [11].
4.1 Network Training
Synthetic training images are rendered from a scene depicting the variationsof real-world images. The generally applicable approach of domain randomiza-tion [25] is used for dataset creation and rendering.
Synthetic depth data of a virtual scene resembling the area of deployment isrendered using Blender2. These data are subsequently augmented and annotatedusing a randomized noise model and are used for supervised training as pro-posed by [7]. Domain randomization, i.e. diverse scene setups and various back-ground information, produces training data with high variation regarding viewsand occlusion patterns. Additionally, noise heuristics are applied. An augmenteddomain Xa that creates a superset Xa ⊇ Xr of the variations in real-world scansis created. Care is taken that Xa does not diverge far from Xr by choosing vari-ations that do not violate the sampling theory. This has been shown to generatehigh-quality data to train deep architectures for object detection, classificationand pose estimation in depth images.2 www.blender.org.

Usability Study of Learning-Based Pose Estimation 291
Fig. 4. Qualitative pose estimation results on T-LESS. The blue boxes indicate esti-mated poses and the green boxes indicate ground truth poses. (Color figure online)
Approximately 25,000 training images of virtual scenes exhibiting theexpected variations regarding camera views, object poses and occlusion patternsare rendered. During training, annotations of objects with bounding boxes orcontrol points outside of the image space are discarded. Annotations of objectswith visibility of less than 50% are discarded as well.
The remaining objects are annotated with a bounding box, a class labeland virtual control points representing the pose. Only one model is trained forall dataset objects combined in contrast to the state-of-the-art methods thattrain individual networks for each object [6,13,14,18]. This is done in order toshow industrial applicability by keeping the computational resources and timeconsumption low. As a consequence, SyDPose performs pose estimation with aframe rate of more than five frames per second. Model training is done for 100epochs with the Adam optimizer with adaptive learning rate initialized at 10−5.
4.2 Evaluation Metrics
For evaluation, the Visual Surface Discrepancy (VSD) metric proposed by Hodanet al. [1] is used. In order to calculate the score for an estimate, object modelsare rendered in the ground truth and the estimated pose to calculate distancemaps. These are subsequently applied to the scene to obtain visiblity masks. Forevery visible object pixel the l1 distance between ground truth and estimateddistance map is calculated. If the distance is below a tolerance τ the pixel error is0 otherwise it is 1. An estimated pose is consider correct if the average distanceof all visible pixels is below the threshold θ. τ = 20 mm and θ = 0.3 is used asproposed by [1].
4.3 Results
Exemplary qualitative results for the estimated poses on the T-LESS datasetare provided in Fig. 4. Blue boxes represent estimated and green boxes groundtruth poses. For objects with rotational symmetries, poses can diverge along theaxis of symmetry and still minimize the VSD-score. Such cases are visible in theleft and the right image. The middle image shows accurate results for objectsthat are parts of others.

292 S. Thalhammer et al.
Fig. 5. RGB and depth images of the objects 2 and 6 from the T-LESS dataset,respectively. Many of the small cues are not observable in the depth modality whileeasily observable in RGB.
In order to evaluate the suitability of synthetic depth data for precisionassembly tasks, a comparison is done to the state-of-the-art method for learning-based pose estimation from synthetic data [6]. Real-world data is used to trainthe detector. This approach uses RGB data in contrast to SyDPose that usesdepth data. Only synthetic data is used for training.
Table 1 presents a comparison in terms of pose estimation recall using theVSD-metric. Since the detection network (not pose estimation) of Sundermayeret al. [6] is trained on real-world data, the approach exhibits a detection recallthat is approximately almost twice as high as SyDPose that achieves only 47.49%.Consequently, when comparing the pose estimation recall from the network out-put the depth-based results are inferior to the RGB-based method. Since it is safeto assume that depth-based approaches have access to the raw depth input, refin-ing results using ICP is viable. This is not the case for RGB-based approaches.Thus, comparing both methods under the assumption of availability of only onemodality comparable results are achieved. Object 27 is excluded from evaluationsince it exhibits three planes of symmetry.
One advantage of the depth modality compared to the RGB domain is thatRGB is in general more challenging due to the broad variety of variations affect-ing the appearance of the captures scene. Thus, transitioning from syntheticto real-world data is easier in the depth domain due to the comparably lim-ited influence of environmental conditions. Depth data also gives strong cuesabout the object’s shape and scale. Both of these aspects are advantageous forpose estimation. However, a strong limitation is that the sampling noise is veryhigh in the depth domain. Consequently, when using RGB, strong cues can beextracted for inference that cannot be captured by depth data. Figure 5 presentsthe crops of two T-LESS objects from the test set captured with the PrimesenseCarmine 1.09. The depth images are scaled to have 8 bit range. In the RGBimages, cues that are relevant for classification and pose disambiguation are eas-ily observable. While in the depth images these are mostly not observable due tothe sampling noise. These limitations, however, can be overcome by using depthimaging devices that induce less noise.

Usability Study of Learning-Based Pose Estimation 293
Table 1. Object pose estimation recall on T-LESS, using the VSD-metric.
Object Sundermeyer et al. [6] SyDPose SyDPose + ICP
1 8.87 5.13 15.81
2 13.22 7.00 23.56
3 12.47 12.22 19.44
4 6.56 5.25 14.68
5 34.8 13.65 30.65
6 20.24 5.33 13.29
7 16.21 1.40 8.81
8 19.74 0.26 5.16
9 36.21 3.40 10.28
10 11.55 4.68 18.72
11 6.31 1.19 12.17
12 8.15 4.17 19.51
13 4.91 7.47 9.72
14 4.61 9.02 18.32
15 26.71 6.19 30.56
16 21.73 13.40 31.75
17 64.84 1.29 16.14
18 14.3 3.54 18.72
19 22.46 4.00 10.17
20 5.27 3.20 12.55
21 17.93 3.86 16.87
22 18.63 2.84 15.61
23 18.63 2.00 18.01
24 4.23 6.98 26.19
25 18.76 4.51 34.03
26 12.62 3.40 24.80
28 23.07 1.33 15.34
29 26.65 2.46 31.25
30 29.58 6.99 44.44
Mean 18.25 5.04 19.54
5 Conclusion
This work provides evidence for the usability of synthetic depth for learning-based pose estimation. However, methods working with RGB can potentiallyaccess cues that are not available for depth when targeting low cost sensor setups.RGB sensors come with comparably low cost relative to the sensors precision.

294 S. Thalhammer et al.
Current state of the art for learning based pose estimation shows decent per-formance for the RGB and the depth modality when trained on synthetic data.Consequently, future work will address combining the RGB and the depth modal-ity in order to exploit the advantages of both domains and improve performanceover each modality individually.
Acknowledgements. This work has been supported by the Austrian Research Pro-motion Agency in the program Production of the Future funded project MMAssist II(FFG No. 858623), the Austrian Ministry for Transport, Innovation and Technology(bmvit) and the Austrian Science Foundation (FWF) under grant agreement No. I3969-N30 (InDex).
References
1. Hodan, T., et al.: BOP: benchmark for 6D object pose estimation. In: Proceedingsof European Conference on Computer Vision, pp. 19–35 (2018)
2. Krizhevsky, A., Sutskever, I., Hinton, G.: ImageNet classification with deep convo-lutional neural networks. In: Advances in Neural Information Processing Systems,pp. 1097–1105 (2012)
3. Bousmalis, K., Silberman, N., Dohan, D., Erhan, D., Krishnan, D.: Unsupervisedpixel-level domain adaptation with generative adversarial networks. In: Proceed-ings of Conference on Computer Vision and Pattern Recognition, pp. 3722–3731(2017)
4. Kehl, W., Manhardt, F., Tombari, F., Ilic, S., Navab, N.: SSD-6D: making RGB-based 3D detection and 6D pose estimation great again. In: Proceedings of IEEEInternational Conference on Computer Vision, pp. 1521–1529 (2017)
5. Rad, M., Oberweger, M., Lepetit, V.: Feature mapping for learning fast and accu-rate 3D pose inference from synthetic images. In: Proceedings of IEEE Conferenceon Computer Vision and Pattern Recognition (2018)
6. Sundermeyer, M., Marton, Z., Durner, M., Brucker, M., Triebel, R.: Implicit 3Dorientation learning for 6D object detection from RGB images. In: Proceedings ofEuropean Conference on Computer Vision, pp. 699–715 (2018)
7. Thalhammer, S., Patten, T., Vincze, M.: SyDPose: object detection and pose esti-mation in cluttered real-world depth images trained using only synthetic data. In:Proceedings of International Conference on 3D Vision, pp. 106–115 (2019)
8. Zakharov, S., Planche, B., Wu, Z., Hutter, A., Kosch, H., Ilic, S.: Keep it unreal:bridging the realism gap for 2.5D recognition with geometry priors only. In: Pro-ceedings of International Conference on 3D Vision, pp. 1–11 (2018)
9. Brachmann, E., Krull, A., Michel, F., Gumhold, S., Shotton, J., Rother, C.: Learn-ing 6D object pose estimation using 3D object coordinates. In: Fleet, D., Pajdla,T., Schiele, B., Tuytelaars, T. (eds.) ECCV 2014. LNCS, vol. 8690, pp. 536–551.Springer, Cham (2014). https://doi.org/10.1007/978-3-319-10605-2 35
10. Hinterstoisser, S., et al.: Multimodal templates for real-time detection of texture-less objects in heavily cluttered scenes. In: Proceedings of International Conferenceon Computer Vision, pp. 858–865 (2011)
11. Hodan, T., Haluza, P., Obdrzalek, S., Matas, J., Lourakis, M., Zabulis, X.: T-LESS:an RGB-D dataset for 6D pose estimation of texture-less objects. In: Proceedingsof Winter Conference on Applications of Computer Vision, pp. 880–888 (2017)

Usability Study of Learning-Based Pose Estimation 295
12. Park, K., Patten, T., Vincze, M.: Pix2Pose: pixel-wise coordinate regression ofobjects for 6D pose estimation. In: Proceedings of International Conference onComputer Vision (2019)
13. Rad, M., Lepetit, V.: BB8: a scalable, accurate, robust to partial occlusion methodfor predicting the 3D poses of challenging objects without using depth. In: Pro-ceedings of IEEE International Conference on Computer Vision (2017)
14. Xiang, Y. Schmidt, T., Narayanan, V., Fox, D.: PoseCNN: a convolutional neuralnetwork for 6D object pose estimation in cluttered scenes. Proc. Robot. Sci. Syst.(2018)
15. Oberweger, M., Rad, M., Lepetit, V.: Making deep heatmaps robust to partialocclusions for 3D object pose estimation. In: Proceedings of European Conferenceon Computer Vision (2018)
16. Park, K., Patten, T., Prankl, J., Vincze, M.: Multi-task template matching forobject detection, segmentation and pose estimation using depth images. In: Pro-ceedings of International Conference on Robotics and Automation, pp. 7207–7213(2019)
17. Peng, S., Liu, Y., Huang, Q., Bao, H., Zhou, X.: PVNet: Pixel-wise voting networkfor 6DoF pose estimation. In: The IEEE Conference on Computer Vision andPattern Recognition, pp. 4561–4570 (2019)
18. Tekin, B., Sinha, S., Fua, P.: Real-time seamless single shot 6D object pose predic-tion. In: Proceedings of Conference on Computer Vision and Pattern Recognition,pp. 292–301 (2018)
19. Besl, P., McKay, N.: Method for registration of 3-D shapes. In: Sensor Fusion IV:Control Paradigms and Data Structures, pp. 586–607 (1992)
20. Lin, T., Goyal, P., Girshick, R., He, K., Piotr, P.: Focal loss for dense objectdetection. In: Proceedings of IEEE International Conference on Computer Vision,pp. 2999–3007 (2017)
21. He, K., Zhang, X., Ren, S., Sun, J.: Deep residual learning for image recognition.In: Proceedings of IEEE Conference on Computer Vision and Pattern Recognition,pp. 770–778 (2016)
22. Russakovsky, O., et al.: ImageNet large scale visual recognition challenge. Int. J.Comput. Vis. 115, 211–252 (2015)
23. Lin, T., Dollar, P., Girshick, R., He, K., Hariharan, B., Belongie, S.: Feature pyra-mid networks for object detection. In: Proceedings of IEEE Conference on Com-puter Vision and Pattern Recognition, pp. 2117–2125 (2017)
24. Crivellaro, A., Rad, M., Verdie, Y., Yi, K., Fua, P., Lepetit, V.: A novel representa-tion of parts for accurate 3D object detection and tracking in monocular images. In:Proceedings of IEEE International Conference on Computer Vision, pp. 4391–4399(2015)
25. Tobin, J., Fong, R., Ray, A., Schneider, J., Zaremba, W., Abbeel, P.: Domainrandomization for transferring deep neural networks from simulation to the realworld. In: International Conference on Intelligent Robots and Systems, pp. 23–30(2017)
26. Perlin, K.: Improving noise. ACM Trans. Graph. 21, 681–682 (2002)

296 S. Thalhammer et al.
Open Access This chapter is licensed under the terms of the Creative CommonsAttribution 4.0 International License (http://creativecommons.org/licenses/by/4.0/),which permits use, sharing, adaptation, distribution and reproduction in any mediumor format, as long as you give appropriate credit to the original author(s) and thesource, provide a link to the Creative Commons license and indicate if changes weremade.
The images or other third party material in this chapter are included in thechapter’s Creative Commons license, unless indicated otherwise in a credit line to thematerial. If material is not included in the chapter’s Creative Commons license andyour intended use is not permitted by statutory regulation or exceeds the permitteduse, you will need to obtain permission directly from the copyright holder.

Assistance Methods in Assembly

Assistance Needs in ProductionEnvironments: A Contextual
Exploration of Workers’ Experiencesand Work Practices
Thomas Meneweger1(B) , Verena Fuchsberger1 , Cornelia Gerdenitsch2 ,Sebastian Egger-Lampl2 , and Manfred Tscheligi1,2
1 Center for Human-Computer Interaction, University of Salzburg, Salzburg, Austria{thomas.meneweger,verena.fuchsberger,manfred.tscheligi}@sbg.ac.at
2 AIT Austrian Institute of Technology GmbH, Vienna, Austria{cornelia.gerdenitsch,sebastian.egger-lampl,manfred.tscheligi}@ait.ac.at
http://hci.sbg.ac.at, http://ait.ac.at
Abstract. This paper presents assistance needs in production environ-ments for assembly processes from a workers’ perspective, i.e. what kindof assistance assembly workers would need to enhance their everydaywork experience and to better cope with challenges coming along with anincreasing digitization in these work environments. Within a large-scaleempirical field study in central Europe, we interviewed assembly workersand observed everyday work situations in different production environ-ments (e.g., automotive domain) to understand workers’ experiences andwork practices in increasingly connected and automated production envi-ronments. Based on the insights gained in this study, we describe severalassistance needs for assembly workers that serve as a guidance for futureworker-centric designs of assistance systems in production environments.
Keywords: Assistance needs · Assembly work practices · Experiencewith technology · Production environments · Automation
1 Introduction
Production environments are often characterized by a strong focus on tech-nologies and machinery that they are equipped with. While this is certainlyimportant when it comes to productiveness, efficiency, and competitiveness, thisemphasis on technological systems may overshadow those that work with them,such as assembly workers. Although it has been widely recognized that humansare essential in “all phases of factory operations from the planning through theoperation to the maintenance and repair services” [15, p. 136], little is known ofthe workers’ needs and practices.
To address this gap, we investigated such needs and practices, aiming toanswer the following research questions: RQ1: What are humans’ work practicesc© The Author(s) 2021S. Ratchev (Ed.): IPAS 2020, IFIP AICT 620, pp. 299–309, 2021.https://doi.org/10.1007/978-3-030-72632-4_22

300 T. Meneweger et al.
and work experiences in assembly work contexts? and RQ2: What assistanceneeds to they have? Our work is positioned at the intersection of smart facto-ries (and in particular assembly work), system design, and Human-ComputerInteraction (HCI).
Influenced by this positioning, we contribute a perspective on humans work-ing at assembly lines to (a) provide insights into everyday work practices andworkers’ assistance needs, and (b) inform the design of future assembly systemsand processes. The paper starts by providing a brief overview of the backgroundto this work, including challenges of increasingly digitized work environments.Afterwards, we describe the approach and methods used to explore situatedpractices in three different factories and continue by depicting the results of thestudy. In particular, we detail assistance needs for assembly work and discusshow they could be met.
2 Background
Assembly work requires workers to conduct a set of physical and mental oper-ations [11] in which they may or may not need support. To provide such sup-port, various attempts exist (either in form of concepts, prototypes, or imple-mented systems) and are referred to as assistive systems, i.e., technologies aim-ing to support employees within their working tasks [3,13]. Examples for thesedevelopments are collaborative robots operating alongside human workers [4],exoskeletons aiming to reduce physical workload [8], (mobile) information andcommunication technologies showing assembly instructions [1], or mixed realityapplications using projections to provide work instructions [6]. In assembly work,technologies such as Augmented Reality (AR) or collaborative robots seem tobe particularly promising [13] to reduce the physical and mental burden for theworkers, and of course to enhance efficiency and productivity as well. Conse-quently, these systems increasingly invade factories. However, there are only afew studies that reveal how they actually assist assembly workers during theireveryday work (e.g., [14]).
This is even more timely since increasingly digitized work environments bearseveral challenges that influence the way of working in such environments. Forexample, due to the growing demand to customize products, assembly work isaccelerating and tasks become more complex. Furthermore, interacting with dig-ital technologies on the shop floor becomes a challenge in itself, being demand-ing for human workers, who are surrounded by more and more automated andconnected systems [9]. These systems have the potential to assist workers, butalso to shape everyday work practices [14]. Designing successful assistive tech-nologies implies first to meet user needs, which can be ensured by adopting auser-centered design approach [12].
To contribute an understanding of the needs of assembly workers, that caninform the development and implementation of assistive technologies of thefuture, this work is positioned within the realm of HCI, a field that engageswith humans in their situated interplay with technology in a particular context.

Assistance Needs in Production Environments 301
The approach we are pursuing in this study, which is described in the following,starts from empirical observations of assembly work in three factories to drawconclusions for the design of interactive systems to support assembly workerswithin their daily working routines.
3 Approach and Methods
3.1 Context of Research
The research at hand was conducted within the national flagship project MMAs-sist II 1 in Austria, Europe. The goal of this project is to explore the charac-teristics of assistance in production contexts and develop modular assistancesystems for workers in future factories. The outcomes and insights, we reportin this paper, were part of a large-scale empirical field study aiming to identifyassistance needs from a workers’ point of view, which provides the basis for theconceptualisation and implementation of assistance systems. Besides assemblywork, the project also explores other domains of industrial work: service andmaintenance of machines as well as operating autonomous machines. In thispaper we only report on the insights related to assembly work.
Within the empirical field study, we investigated three use cases of assemblywork in three different factories: (a) assembly of powertrains, (b) assembly ofconstruction machines, and (c) assembly of battery charging systems. In thefirst two use cases, the workers are working on assembly lines. Cycle times varybetween 1,5 min for the powertrains and 20 min for the construction machines.In use case (a) the powertrains are carried on automated guided vehicles (AGVs)that are constantly moving and connected with the tools and control system. Inuse case (b) the construction machines are carried on carriages that need to bemanually pushed by the workers to the next work station after a cycle time hasexpired (a sound signal indicates the end of each cycle time). In use case (c)each worker assembles an entire workpiece at her/his work station. In all threeuse cases, connected tools like smart screwdrivers are used.
3.2 Methods and Procedure
The overarching goal of this study was to identify and describe workers’ assis-tance needs for assembly work to provide a basis for the implementation offuture assistance systems. Following a worker-centered approach, putting work-ers’ experiences and work practices in the center of attention, we conducted afield study exploring workers’ everyday work in real assembly work contexts (seeFig. 1 for an overview of the research process). The field study mainly aimed at:(a) understanding current work practices and work experiences in the context ofassembly work, (b) identify challenges and problems assembly workers currentlyhave to deal with, as well as (c) how they cope with these challenges.
1 https://www.mmassist.at.

302 T. Meneweger et al.
Fig. 1. Procedure of the field study and applied methods.
Data Gathering. To address our research goal, we conducted participant obser-vations on the shop floor and qualitative interviews with assembly workers. Addi-tionally, we conducted interviews with stakeholders that are familiar with theshop floor but not directly performing assembly tasks (e.g. shift leaders). Thesestakeholder interviews mainly focused on challenges and assistance needs forassembly work. Our data gathering approach was following the principles of“contextual inquiry” [7], a well-established approach in HCI, the technique of“shadowing” [10], as well as qualitative interviewing [5].
During the participant observations, two researchers slipped into the role of atrainee and accompanied each assembly worker as if she/he was their instructor,i.e., observing them and asking questions about their work. To document theobserved work practices, the researchers were taking field notes as well as pic-tures. Each assembly worker was accompanied for half a day and during or afterthe observations, a qualitative interview was conducted with each worker. Theinterviews with workers took about one hour, the interviews with stakeholdersabout 45 min, and the informants gave their informed consent. The researchersused an observation and interview guideline to guide the focus of observationsand (interview) questions.
Study Participants. We stayed for two days at each factory and observed andinterviewed 11 assembly workers in total. Five of them were male and six female,their age ranged from 22 to 57 and they had been working at the observed shopfloor between just recently and 23 years. Additionally, we conducted 14 stake-holder interviews with people working as shift leaders, production managers, ITpersonnel, as well as members of the works council. 13 of them were male, onefemale (representing the gender imbalance in these positions), and they werebetween 23 and 43 years old.
Data Analysis and Interpretation. After the field notes were digitized ateam of two researchers (one of them was involved in gathering the data, theother one supervised the study) applied an affinity diagramming technique [7]

Assistance Needs in Production Environments 303
to structure and analyze the data gained from the participant observationsand interviews with assembly workers. The analysis was guided by the goal todescribe assembly work practices and experiences, as well as related assistanceneeds.
Within several affinity diagramming sessions the field notes, as well as pic-tures from the shop floor, were clustered in order to reveal themes (i.e., patternswithin the data) [2], that describe work practices and experiences as well asrelated challenges of the assembly work we have observed. In parallel, anotherteam of researchers analyzed the interviews with stakeholders. Finally, withina joint interpretation session, a team of four researchers contrasted the insightsgained from exploring the assembly workers with the ones from the stakeholdersin order to come up with a merged set of assistance needs for assembly work aswell as how they can be addressed. In the next section we describe the resultsgained from this process (see Fig. 2 for an overview of this process and the gainedresults).
Fig. 2. Overview of the field study results.
4 Results
4.1 Assembly Workers’ Experiences and Work Practices
In this chapter, we describe the assistance needs for assembly work that wehave identified based on the observed work practices and related experiences ofassembly work.
In a first step and as a basis for further interpretation, we generated themesfrom studying the assembly workers as well as stakeholders. The themes - rel-evant aspects for assembly work - gained from the observations and interviews

304 T. Meneweger et al.
with assembly workers reach from work experiences, challenges related to assem-bly work, to current work practices. In total, our analysis revealed 15 themes.These themes are concerned with: Organisation of the work station, work envi-ronment, tools, work material, customizing the work station, time, work prac-tices, training, routines and workarounds, static information, dynamic informa-tion, documentation, dealing with errors, social setting at the workplace, andrelation to the product. Within the scope of this paper, we will not discuss eachof the themes in detail but focus on the revealed assistance needs (see below).The insights gained from interviewing the stakeholders, mainly centered aroundassistance needs and comprised the following issues: The mental workload andtime pressure due to short cycle time, which is very demanding and stressful; thephysical challenges due to high physical load, e.g., standing in the same position,unhealthy body posture, or carrying heavy loads; the need for digital assemblymanuals; as well as that already a lot of optimization is happening on the shopfloor. Based on these themes and issues related to assembly work, we furtherinterpreted the data and identified the following assistance needs for assemblywork.
4.2 Assistance Needs for Assembly Work
Dynamic Adaptation to the Worker. We observed that an individual orga-nization of the work station is crucial for the assembly workers. Especially asdifferent workers are working at the same work station (e.g. in different shifts),the workers adapt and customize their work station based on personal needs.Often this is done to improve the ergonomic position, e.g., placing tools andmaterials in best reach for the worker. Due to time pressure (e.g., short cycletimes) this isn’t always possible or just inconvenient and cumbersome. Conse-quently, the lack of time to adapt the work station leads to ergonomic problemsand increased physical workload over time, e.g., as workers are standing on tip-toes over a longer period of time because the workpiece is positioned slightly toohigh, or they are repeatedly tiptoeing because of fixed working heights, as wellas that different assembly steps would require different working heights.
For these reasons, dynamic and automated adaptations to the worker wouldbe beneficial for enhancing the assembly workers’ experiences. Adaption andcustomization could be done, for example, related to body size or arm length.It would also be beneficial to allow the workers to actively adapt and changeergonomic settings and positions to avoid one-sided physical strain. This couldbe supported by smart and adaptive assembly lines, e.g. concerning workingheight, or with customized physical assistance.
Heavy Bodily Work and Physical Assistance. Assembly work is heavyphysical work. Depending on the specific assembly work environment, the inten-sity of work can vary based on different circumstances, such as assembly work-ers might have to lift or position heavy materials and workpieces. Further, weobserved that unergonomic activities and body posture, that are performed over

Assistance Needs in Production Environments 305
a longer time, are quite common and additional reasons for the increased phys-ical workload. Often, this comes along with standing for a long period at thesame place, performing constantly the same movements (often related to liftingsome more or less heavy load), or working in a bent-over posture. These issuescan also increase the risk of injuries or physical complaints.
Therefore, physical assistance to support assembly workers performing heavybodily tasks would be beneficial. Further, assembly workers would also benefitfrom the reduction or even avoidance of unergonomic activities as well as fromvariations of body postures. Smart assistance systems could provide assistancefor heavy physical tasks (e.g., fixing screws that are difficult to reach and there-fore require an unergonomic posture, or ergonomic assistance for lifting work-pieces). Smart and adaptive assembly lines and work stations (e.g., concerningworking heights) might also address these issues. Additionally, assembly manu-als could be extended with instructions and guidance for better or varying bodypostures.
Individual Configuration of Work Stations. Our observations showed thatan individual configuration of the work station is essential for assembly work-ers to increase their efficiency and to cope, for example, with the cycle timesand required speed of work. This is especially relevant for repeated and timedactivities and movements (e.g., on assembly lines with short cycle times). Acustomized configuration of the work station is concerned with the handling ofdifferent kinds of stuff, e.g., tools, work materials, and equipment, but also withthe handling of the water bottle for hydration purposes. Constantly changingwork stations (e.g., due to shift changes and job rotation) even supports thesepractices and needs. Further, we observed that some assembly workers are defi-nitely motivated to optimize their work station for the longer term. This is done,for example, by organizing specific tools or equipment that is not contained inthe standard setup of the work station (e.g., a worker organized a vacuum cleanerfor his/her work station).
To support these practices, assembly workers should be assisted in easily con-figuring their work station in order to set up a comfortable workstation as well asto allow practical handling of the work materials and tools. Therefore, assemblywork stations should allow customization, or at least to customize parts of the workstation. Additionally, this could be supported by participatory approaches as wellas by providing incentives for workers to innovate and optimize their workplace.
Sense (“Gespur”) as Means of Quality Assurance. Assembly workers,especially very experienced ones, have developed a certain sense (“Gespur”) andskillfulness (“Geschicklichkeit”) related to the product, the materials, the tools,as well as their handling. For assembly workers, it is crucial to develop thissense to subjectively assess the quality of the assembled product and parts ofit. Further, it is essential to cultivate this sense of skillfulness for a variety ofmanual activities, such as handling and assembling small and filigree pieces, orto fix and adjust certain pieces (e.g., with a certain pressure or tension, such

306 T. Meneweger et al.
as chains in powertrains). This set of skills is further applied for haptic checksof surfaces (e.g., to check that there are no scratches), to attach labels, andto position wires. Sense and skillfulness evolve based on bodily experiences ofworking on the shop floor over time.
As this specific set of skills is hard to grasp and often not-well acknowledgedor overseen, the first step to support it is to admit it and explicitly acknowl-edged it as an important part of assembly work. To make skillfulness and senseexplicit, assembly workers could be provided by the possibility to feed-back theirsubjective sense of a certain piece, e.g., trough a system capturing the subjectivehaptic sense. Further, assembly workers should be assisted in developing certainuseful senses and skillfulness, e.g., by providing reference objects to get a sensefor a certain skillful assembly activity.
Routines and Interruptions. For assembly workers, it is crucial to developroutines and to internalize activities and movements to cope with time pres-sure and cycle times. On the other hand, routines are constantly broken andhave to be shaped anew, e.g., with each product change. Assembly workers haveto deal with these interventions and the need to constantly (re)shape routines.Thereby, routines are developed on a cognitive as well as motoric level. Currently,there are different ways of dealing with this issue. For example, we observed thedeployment of pick-by-light assistance systems to guide the workers to grab therequired part that needs to be assembled for the current product (if there areseveral containers with similar pieces). This top-down approach should reducethe mental load for the workers. However, we also observed work practices devel-oped by the workers themselves (bottom-up) in order to deal with this issue ofintervening routines. For example, a worker covered certain components of tools- a single bit within a bit set, that is currently, and for this specific product, notused - with tape, so that she/he restricts him-/herself to accidentally grab thisbit when changing bits.
From the perspective of enhancing assembly workers’ experiences, the workersshould be supported in preserving autonomy, which might have positive impactsregarding compliance as well. The deployment of assistance systems should notonly allow workers to passively react to interruptions of routines, e.g. related totop-down deployed systems. Assistance should be a choice for workers and theyshould have the possibility to opt-out from receiving support. Workers couldbe further supported by offering varying and alternating multisensory ways ofintervening routines.
Assembly Instructions. Assembly instructions and manuals are an essentialsource of knowledge for assembly workers. Due to the increasing complexityand variety of products, it becomes more and more relevant to assist assemblyworkers with appropriate assembly instructions. Within our study, we observedthat assembly instruction, as well as interactions with them, are currently verydifferent concerning depth and quality. For example, current assembly instruc-tions reflect the discrepancy between standard and “real-world” procedures not

Assistance Needs in Production Environments 307
sufficiently. Thus, existing assembly instructions are currently rather inflexible,mainly representing standard-ideal cases and procedures. This is reasonable, asassembly work is mainly characterized by standardized procedures. However,assembly work is at the same time also diverse and characterized by (some-times minor) deviations from these standardized processes. Related to that, weobserved the usage of digital assembly instructions that are guiding the workerthrough the assembly process also by enabling or disenabling the usage of con-nected smart tools (e.g., screwdrivers). However, the system does not reflectdeviations from standard assembly procedures, e.g., as it is the case for repaircases, where disassembling and re-assembling procedure slightly differ from thestandard assembly procedure. Therefore, the workers developed practices of cir-cumventing and hacking the instruction system.
To support assembly workers, digital instructions should be flexible anddynamically adapt to different assembly procedures. This could be the case byproviding situational instructions, e.g., representing standard vs. repair case; orby providing instructions based on experience, i.e., inexperienced workers mightneed more (in-depth) information compared to experienced workers. Further,assembly workers should have the possibility to feed back to the system, e.g.,through annotating instructions and creating experience-based instructions theworkers would be supported in learning from each other, additionally, the assem-bly instructions would become interactive. Assembly workers would also benefitfrom an assistance system that combines required and suggested assembly steps.Based on that, smart and adaptive assembly instructions systems could learn themost frequently used assembly steps to extract and provide the most commonneeded assembly steps.
5 Conclusions and Discussion
With this study, we contribute a worker-centric understanding of assistanceneeds of assembly workers based on everyday work practices and experiences.The aforementioned assistance needs point to a variety of opportunities for thedesign of future systems, environments, and work practices. Assistance mayrelate to physical assistance (such as to support ergonomics and heavy work),to workplace preparations (such as individual configurations of equipment), tothe development of skilfulness (such as for quality assurance), or to the way thatassembly instructions are presented.
What the identified assistance needs unanimously highlight is the individualityof the human worker. If we take assistance at the workplace seriously, we need totake individual characteristics, needs and levels of experience into account - bothas an offer for the human worker to individualize their workplace on their own andas “automated” customization by technological systems to adapt to the worker.
Apart from these design opportunities, there are several further conclusionsto be drawn from the insights we gained from our investigations of assemblywork. First, in assembly work, lacking individualization may often be an issuedue to missing time. Thus, if possibilities for individualization were provided,

308 T. Meneweger et al.
they will only be helpful if there is sufficient time to carry them out - or if theywon’t require extra time at all. The benefit of facilitating individualization maybe twofold: first, individualization may positively impact work efficiency, sinceit may build upon workers’ experiences and knowledge that potentially havebeen gained over the years. Second, creating an atmosphere that encouragesindividualization may, at the same time, motivate to share thoughts and ideasfor advancing the overall assembly line, contributing to innovation.
Another aspect that seems to be of utmost importance for workers is therequirement to preserve autonomy, to not lose control of one’s work. This includesautonomy in regard to work practices, workplaces, and interaction with tech-nologies and machinery. Thus, future systems may be designed in a way to notovertake as much as possible, but provide a balance for the worker to remain incontrol of crucial activities and decisions.
Finally, it is to be emphasized that workplaces are dynamic both in terms ofworkers and technology. This may be relevant, for instance, in the developmentof assembly instructions, in which workers can adapt to the specific needs of thesituation in order to account for the particular conditions of a given situation.
Acknowledgments. This work is supported by the project MMAssist II (FFG No.858623) as part of the program “Produktion der Zukunft” that is operated by theAustrian Research Promotion Agency FFG. The financial support by the AustrianMinistry for Transport, Innovation, and Technology is gratefully acknowledged. Fur-ther, we want to thank David Fisslthaler and Nicole Mirnig for supporting the fieldresearch.
References
1. Blazevski, B., Haslwanter, J.D.H.: User-centered development of a system to sup-port assembly line worker. In: Proceedings of the 19th International Conference onHuman-Computer Interaction with Mobile Devices and Services. MobileHCI 2017,ACM, New York, NY, USA (2017). https://doi.org/10.1145/3098279.3119840
2. Braun, V., Clarke, V.: Using thematic analysis in psychology. Qual. Res. Psychol.3(2), 77–101 (2006)
3. Buttner, S., et al.: The design space of augmented and virtual reality applicationsfor assistive environments in manufacturing: a visual approach. In: Proceedings ofthe 10th International Conference on PErvasive Technologies Related to AssistiveEnvironments. PETRA 2017, pp. 433–440, ACM, New York, NY, USA (2017).https://doi.org/10.1145/3056540.3076193
4. El Makrini, I.: Working with Walt: how a cobot was developed and inserted on anauto assembly line. IEEE Robot. Autom. Mag. 25(2), 51–58 (2018). https://doi.org/10.1109/MRA.2018.2815947
5. Flick, U.: An Introduction to Qualitative Research, 6th edn. Sage PublicationsLimited, California (2018)
6. Funk, M., Lischke, L., Mayer, S., Shirazi, A.S., Schmidt, A.: Teach me how! inter-active assembly instructions using demonstration and in-situ projection. In: Huber,J., Shilkrot, R., Maes, P., Nanayakkara, S. (eds.) Assistive Augmentation, pp. 49–73. Springer, Singapore (2018). https://doi.org/10.1007/978-981-10-6404-3 4

Assistance Needs in Production Environments 309
7. Holtzblatt, K., Beyer, H.: Contextual design: evolved. Synth. Lect. Hum. CenteredInform.7(4), 1–91 (2014). https://doi.org/10.2200/S00597ED1V01Y201409HCI024
8. de Looze, M.P., Bosch, T., Krause, F., Stadler, K.S., O’Sullivan, L.W.: Exoskele-tons for industrial application and their potential effects on physical workload. Ergonomics 59(5), 671–681 (2016). https://doi.org/10.1080/00140139.2015.1081988
9. Ludwig, T., Kotthaus, C., Stein, M., Pipek, V., Wulf, V.: Revive old discussions!socio-technical challenges for small and medium enterprises within industry 4.0. In:Proceedings of 16th European Conference on Computer-Supported CooperativeWork - Exploratory Papers. Reports of the European Society for Socially Embed-ded Technologies, vol. 2, no. 1 (2018). https://doi.org/10.18420/ecscw2018 15
10. McDonald, S.: Studying actions in context: a qualitative shadowing method fororganizational research. Qual. Res. 5(4), 455–473 (2005). https://doi.org/10.1177/1468794105056923
11. Neumann, U., Majoros, A.: Cognitive, performance, and systems issues foraugmented reality applications in manufacturing and maintenance. In: Pro-ceedings. IEEE 1998 Virtual Reality Annual International Symposium (Cat.No.98CB36180), pp. 4–11, March 1998. https://doi.org/10.1109/VRAIS.1998.658416
12. Norman, D.: The Design of Everyday Things: Revised and Expanded Edition,expanded edn. Basic Books, New York (2013)
13. Wolfartsberger, J., Hallewell Haslwanter, J.D., Lindorfer, R.: Perspectives on assis-tive systems for manual assembly tasks in industry. Technologies 7(1), 12 (2019).https://doi.org/10.3390/technologies7010012
14. Wurhofer, D., Meneweger, T., Fuchsberger, V., Tscheligi, M.: Reflections on opera-tors’ and maintenance engineers’ experiences of smart factories. In: Proceedings ofthe 2018 ACM Conference on Supporting Groupwork. GROUP 2018, pp. 284–296.ACM, New York, NY, USA (2018). https://doi.org/10.1145/3148330.3148349
15. Zuehlke, D.: Smartfactory - towards a factory-of-things. Ann. Rev. Control 34(1),129–138 (2010). https://doi.org/10.1016/j.arcontrol.2010.02.008
Open Access This chapter is licensed under the terms of the Creative CommonsAttribution 4.0 International License (http://creativecommons.org/licenses/by/4.0/),which permits use, sharing, adaptation, distribution and reproduction in any mediumor format, as long as you give appropriate credit to the original author(s) and thesource, provide a link to the Creative Commons license and indicate if changes weremade.
The images or other third party material in this chapter are included in thechapter’s Creative Commons license, unless indicated otherwise in a credit line to thematerial. If material is not included in the chapter’s Creative Commons license andyour intended use is not permitted by statutory regulation or exceeds the permitteduse, you will need to obtain permission directly from the copyright holder.

Attention Analysis for Assistance in AssemblyProcesses
Lucas Paletta(B)
DIGITAL – Institute for Information and Communication Technologies, JOANNEUMRESEARCH Forschungsgesellschaft MbH, 8010 Graz, Austria
Abstract. Human attention processes play a major role in the optimization ofhuman-machine interaction (HMI) systems. This work describes a suite of inno-vative components within a novel framework in order to assess the human factorsstate of the human operator primarily by gaze and in real-time. The objective isto derive parameters that determine information about situation awareness of thehuman collaborator that represents a central concept in the evaluation of interac-tion strategies in collaboration. The human control of attention provides measuresof executive functions that enable to characterize key features in the domain ofhuman-machine collaboration. This work presents a suite of human factors anal-ysis components (the Human Factors Toolbox) and its application in the assem-bly processes of a future production line. Comprehensive experiments on HMIare described which were conducted with typical tasks including collaborativepick-and-place in a lab based prototypical manufacturing environment.
Keywords: Human factors analysis · Intuitive assistance · Dynamic attention
1 Introduction
Human-machine interaction in manufacturing has recently experienced an emergenceof innovative technologies for intelligent assistance [1]. Human factors are crucial inIndustry 4.0 enabling human and machine to work side by side as collaborators. Human-related variables are essential for the evaluation of human-interaction metrics [2]. Towork seamlessly and efficiently with their human counterparts, complex manufacturingwork cells, such as for assembly, must similarly rely on measurements to predict thehuman worker’s behavior, cognitive and affective state, task specific actions and intentto plan their actions. A typical, currently available application is anticipatory controlwith human-in-the-loop architecture [3] to enable robots to perform task actions thatare specifically based on recently observed gaze patterns to anticipate actions of theirhuman partners according to its predictions.
In order to characterize the human state by means of quantitative measurementtechnologies we expect that these should refer to performance measures that repre-sent psychologically relevant parameters. Executive functions [18] were scientificallyinvestigated to represent activities of cognitive control, such as, (i) inhibition in selec-tive attention, (ii) task switching capabilities, or (iii) task planning. These functions are
© The Author(s) 2021S. Ratchev (Ed.): IPAS 2020, IFIP AICT 620, pp. 310–323, 2021.https://doi.org/10.1007/978-3-030-72632-4_23

Attention Analysis for Assistance in Assembly Processes 311
dependent on dynamic attention and are relevant too many capability requirements inassembly. (i) appropriate focus at the right time to manual interaction, (ii) switchingattention between multiple tasks at the same time, and (iii) action planning in short timeperiods for optimized task performance. Consequently, measuring and modeling of thestate of cognition relevant human factors aswell as the current human situation awarenessare mandatory for the understanding of immediate and delayed action planning. How-ever, the state-of-the-art does not yet sufficiently address these central human cognitivefunctions to an appropriate degree. This work intends to contribute to fill this gap by pre-senting a novel framework for estimating important parameters of executive functions inassembly processes by means of attention analysis. On the basis of mobile eye trackingthat has been made available for real-time interpretation of gaze we developed softwarefor fast estimation of executive function parameters solely on the basis of eye trackingdata. In summary, this work describes a review of novel methodologies developed atthe Human Factors Lab of JOANNEUM RESEARCH to measure the human factorsstates of the operator in real-time with the purpose to derive fundamental parametersthat determine situation awareness, concentration, task switching and cognitive arousalas central for the interaction strategies of collaborative teams. The suite of gaze basedanalysis software is referred as Human Factors Toolbox (Fig. 1).
Fig. 1. Human-robot collaboration and intuitive interface (HoloLens, eye tracking, markers forOptiTrack localization) for the assessment of human factors state to characterize key features in thecollaboration domain. HRC within a tangram puzzle assembly task. (a) The operator collaborateswith the robot in the assembly (only robot can treat ‘dangerous’ pieces). (b) Egocentric operatorview with augmented reality based navigation (arrow), piece localization, gaze (blue sphere),current state of mental load (L) and concentration (C) in the HoloLens display. (c) Recommendedpiece (arrow) and gaze on currently grabbed puzzle piece.

312 L. Paletta
Human situation awareness is determined on the basis of concrete measures of eyemovements towards production relevant processes that need to be observed and evaluatedby the human. Motivated by the theoretical work of [4] on situation awareness thepresented work specifically aims at dynamically estimating (i) distribution of attentionalresources with respect to task relevant ‘areas of interaction’ over time, determined byfeatures of 3D gaze analysis and a precise optical tracking system, and (ii) derive fromthis human factors in real-time, such as, (a) human concentration on a given task, (b)human mental workload, (c) situation awareness and (d) executive functions relatedmeasure, i.e., task switching rate. Gaze in the context of collaboration is analyzed interms of - primarily, visual - affordances for collaboration. In this work we demonstratethe relevance of considering eye movement features for a profound characterization ofthe state of human factors in manufacturing assembly cells by means of gaze behavior,with the purpose to optimize the overall human-machine collaboration performance.
In the following, Sect. 2 provides an overview on emerging attention analyses tech-nologies in the context of manufacturing human-machine interaction. Section 3 providesinsight into the application of a learning scenario in an assembly working cell. Section 4provides conclusions and proposals for future work,
2 Human Factors Measurement Technologies for Human-MachineInteraction
2.1 Intuitive Multimodal Assistive Interface and Gaze
In the conceptual work on intuitivemultimodal assistive interfaces, the interaction designis fully aligned with the user requirements on intuitive understanding of technology [5].For intuitive interaction, one opts for a human-centered approach and starts from inter-human interactions and the collaborative process itself. The intuitive interaction systemis based on the following principles:
• Natural interaction: Mimicking human interaction mechanisms a fast and intuitiveinteraction processes has to be guaranteed.
• Multimodal interaction: Implementation of gaze, speech, gestural, and Mixed-Reality interaction offers as much interaction freedom as possible to the user.
• Tied modalities: Linking the different interaction modalities to emphasize theintuitive interaction mechanisms.
• Context-aware feedback: Feedback channels deliver information regarding task,environment to the user. One has to pay attention at what is delivered when andwhere.
A central component entitled ‘Interaction Model’ (IM) acts as interaction controland undertakes the communication with the periphery system. The IM also links thefour interaction modalities and ensures information exchange between the components.It triggers any form of interaction process, both direct and indirect, and controls thecontext-sensitivity of the feedback. It is further responsible for dialog management andinformation dispatching.

Attention Analysis for Assistance in Assembly Processes 313
In human factors and ergonomics research, the analysis of eye movements enablesto develop methods for investigating human operators’ cognitive strategies and for rea-soning about individual cognitive states [6]. Situation awareness (SA) is a measure of anindividual’s knowledge and understanding of the current and expected future states of asituation. Eye tracking provides an unobtrusive method to measure SA in environmentswhere multiple tasks need to be controlled. [7] provided first evidence that fixation dura-tion on relevant objects and balanced allocation of attention increases SA. However,for the assessment of executive functions, the extension of situation analysis towardsconcrete measures of distribution of attention is necessary and described as follows.
2.2 Recovery of 3D Gaze in Human-Robot Interaction
Localization of human gaze is essential for the localization of situation awareness withreference to relevant processes in the working cell [8]. Firstly proposed 3D informationrecovery of human gaze with monocular eye tracking and triangulation of 2D gazepositions of subsequent key frames within the scene video of the eye tracking system.Santner et al. [9] proposed gaze estimation in 3D space and achieved accuracies ≈1 cmwith RGB-D based position tracking within a predefined 3D model of the environment.In order to achieve the highest level of gaze estimation accuracy in a research study,it is crucial to track user’s frustum/gaze behavior with respect to the worker’s relevantenvironment. Solutions that realize this include vision-based motion capturing systems:OptiTrack1 can achieve high gaze estimation accuracy (≈0.06 mm).
2.3 Situation Awareness
Based on the cognitive ability, flexibility and knowledge of human beings on the one handand the power, efficiency and persistence of industrial robots on the other hand, collab-oration between both elements is absolutely essential for flexible and dynamic systemslike manufacturing [10]. Efficient human-robot collaboration requires a comprehensiveperception of essential parts of the working environment of both sides. Human decisionmaking is a substantial component of collaborative robotics under dynamic environmentconditions, such as, within a working cell. Situation awareness and human factors arecrucial, in particular, to identify decisive parts of task execution.
In human factors, situation awareness is principally evaluated through question-naires, such as, the Situational Awareness Rating Technique (SART [11]). Psychologi-cal studies on situation awareness are drawn in several application areas, such as, in airtraffic control, driver attention analysis, or military operations. Due to the disadvantagesof the questionnaire technologies of SART and SAGAT, more reliable and less invasivetechnologies were required, however, eye tracking as a psycho-physiologically based,quantifiable and objective measurement technology has been proven to be effective [7,12]. In several studies in the frame of situation awareness, eye movement features,such as dwell and fixation time, were found to be correlated with various measuresof performance. [13, 14] have developed measurement/prediction of Situation Aware-ness in Human-Robot Interaction based on a Framework of Probabilistic Attention, andreal-time eye tracking parameters.
1 http://www.naturalpoint.com/optitrack.

314 L. Paletta
2.4 Cognitive Arousal and Concentration Estimation
For quantifying stress we used cognitive arousal estimation based on biosensor data. Inthe context of eye movement analysis, arousal is defined by a specific parametrization offixations and saccadic events within a time window of five seconds so that there is goodcorrelation (r = .493) between the mean level of electro-dermal activity (EDA) and theoutcome of the stress level estimator [15] (Fig. 2).
Fig. 2. Measure of attentional concentration on tasks. (a) Concentration level during a sessionwithout assistance (red line is the mean; red is standard deviation), and (b) concentration levelduring the sessionwith assistance.On average, the concentration increasedwhen using the intuitiveassistance. (Color figure online)
For the estimation of concentration or sustained attention, we refer to the areas ofinteraction (AOI) in the environment as representing the spatial reference for the taskunder investigation. Maintaining the attention on task related AOI is interpreted as theconcentration on a specific task [16], or on session related tasks in general. Variousdensities of the fixation rate enable the definition of a classification of levels of actualconcentration within a specific period of time, i.e., within a time window of five seconds.
2.5 Estimation of Task Switching Rate
Task switching, or set-shifting, is an executive function that involves the ability to uncon-sciously shift attention between one task and another. In contrast, cognitive shifting isa very similar executive function, but it involves conscious (not unconscious) changein attention. Together, these two functions are subcategories of the broader cognitiveflexibility concept. Task switching allows a person to rapidly and efficiently adapt todifferent situations [17].
In a multi-tasking environment, cognitive resources must be shared or shiftedbetween the multiple tasks. Task switching, or set-shifting, is an executive functionthat involves the ability to unconsciously shift attention between one task and another.Task switching allows a person to rapidly and efficiently adapt to different situations.The task-switching rate is defined by the frequency by which different tasks are actuallyoperated. The difference between tasks is defined by the differences in the mental model

Attention Analysis for Assistance in Assembly Processes 315
which is necessary to represent an object or a process in the mind of the human opera-tor. Mental models are subjective functional models; a task switch requires the changeof the current mental model in consciousness and from this requires specific cognitiveresources and a load.
In the presented work, processing of a task is determined by the concentration ofthe operator on a task related area of interaction (AOI). Interaction is defined by areasin the operating environment where the operator is manipulating the location of puzzleobjects, i.e., grabbing puzzle pieces from a heap of pieces, or putting pieces onto afinal position in order to form a tangram shape. Whenever the gaze of the operatorintersects with an AOI that belongs to a specific task, then it is associated with anon-going task. The task switch rate is then the number of switches between tasks perperiod of time, typically the time of a whole session (see Fig. 3 for a visualization). Taskswitching has been proposed as a candidate executive function along with inhibition,the maintenance and updating of information in working memory, and the ability toperform two tasks at the same time. There is some evidence not only that the efficiency ofexecutive functions improves with practice and guidance, but also that this improvementcan transfer to novel contexts. There are demonstrable practice-related improvements inswitching performance [18–20].
2.6 Cognitive Arousal and Attention in Multitasking
Stress is defined in terms of psychological and physical reactions of animate beings inresponse to external stimuli, i.e., by means of stressors. These reactions empower theanimate to cope with specific challenges, and at the same time there is the impact ofphysical and mental workload. [21, 22] defined stress in terms of a physical state of loadwhich is characterized as tension and resistance against external stimuli, i.e., stressorswhich refers to the general adaptation syndrome. Studies confirm that the selectivityof human attention is performing better when impacted by stress [35] which representsthe ‘narrowing attention’ effect. According to this principle, attention processes wouldperform in general better with increasing stress impact.
Executive functions are related to the dynamic control of attention which refers toa fundamental component in human-robot collaboration [36]. Executive functions referto mechanisms of cognitive control which enable a goal oriented, flexible and efficientbehavior and cognition [37, 38], and from this the relevance for human everyday func-tioning is deduced. Following the definition of [23], executive functions above all includeattention and inhibition, taskmanagement or control of the distribution of attention, plan-ning or sequencing of attention, monitoring or permanent attribution of attention, andcodification or functions of attention. Attention and inhibition require directional aspectsof attention in the context of relevant information whereas irrelevant information andlikewise actions are ignored. Executive functions are known to be impacted by stressonce the requirements for regulatory capacity of the organism are surpassed [24, 40].An early stress reaction is known to trigger a saliency network that mobilizes excep-tional resources for the immediate recognition and reactions to given and in particularsurprising threats. At the same time, this network is down-weighted for the purpose ofexecutive control which should enable the use of higher level cognitive processes [41].

316 L. Paletta
Fig. 3. Task switching between collaborative and the single task. (a) Placing a puzzle piece togoal area in the collaborative task. (b) The operator places a puzzle piece to the goal area of singletask. (c) Switch between collaborative task (S1, above, green) and single task (S2, below, red).Task duration is determined by the human gaze being focused within an AOI related to the specifictask. (Color figure online)
This executive control network is particularly important for long-term strategies and itis the first that is impacted by stress [25].
In summary, impact of stress can support to focus the selective attention processesunder single task conditions, however, in case of multiple task conditions it is knownthat stress impacts in a negative way the systematic distribution of attention onto sev-eral processes and from this negatively affects the performance of executive functions.Evaluation and prevention of long-term stress in a production work cell is a specificapplication objective. Stress free work environments are more productive, provide moremotivated co-workers and error rates are known to be lower than for stressed workers.The minimisation of interruption by insufficient coordination of subtasks is an importantobjective function which has executive functions analysis as well as impact by stress asimportant input variables.
Multi-tasking, Executive Functions and Attention. Multi-tasking activities are inindirect relation with executive functions. Following Baddeley’s model of a centralexecutive in the working memory [38] there is an inhibitor control and cognitive flexi-bility directly impacting the (i) multi-tasking, (ii) the change between task and memory

Attention Analysis for Assistance in Assembly Processes 317
functions, (iii) selective attention and inhibition functions. The performance in relationto an activity becomes interrupted once there is a shift between one to the other (“taskswitch”). The difference between a task shift which particularly requires more cognitiveresources, and a task repetition is referred to as ‘switch cost’ [26] and in particular ofrelevance if the task switch is more frequently, and also referring to the frequency ofinterruptions afterwhich the operator has to continue the activity from amemorized pointwhere the switch started. Task switches in any case involve numerous executive functionprocesses, including shift of focus of attention, goal setting and tracking, resources fortask set reconfiguration actions, and inhibition of previous task groups. Multi-Taskingand the related switch costs define and reflect the requirements for executive functionsand from this the cognitive control of attention processes, which provides highly relevanthuman factors parameters for the evaluation of human-robot collaboration systems.
The impact of executive functions on decision processes was investigated in detailby [27]. Specifically they researched on aspects of applying decision rules based oninhibition and the consistency in the perception of risk in the context of ‘task shifting’.The results verify that the capacity to focus and therefore to inhibit irrelevant stimulirepresents a fundamental prerequisite for successful decision processes. At the sametime, the change between different contexts of evaluation is essential for consistentestimation of risk (Fig. 4).
Fig. 4. Bio-sensor and eye tracking glasses setup in the Human Factors Lab at JOANNEUMRESEARCH. (a) Bio-sensor setup with EDA sensor, HRV and breathing rate sensors. (b, c) Eye-hand coordination task interrupted by a robot arm movement. (d) Target areas with holes and gazeintersections centered around the center as landing point of eye-coordination task.

318 L. Paletta
Measurements of Emotional and Cognitive Stress. Stress or activity leads to psy-chophysiological changes, as described by [28]. The body provides more energy tohandle the situation; therefore the hypothalamic-pituitary-adrenal (HPA) axis and thesympathetic nervous system are involved. Sympathetic activity can be measured fromrecordings of, for example, electro-dermal activity (EDA) and electrocardiogram (ECG).Acute stress leads to a higher skin conductance level (SCL) and also tomore spontaneousskin conductance reactions (NS.SCR). [29] showed in his summary of EDA research thatthese two parameters are sensitive to stress reactions. In a further step, [30] examinedthe reaction of stress by measuring EDA with a wearable device, during cognitive load,cognitive and emotional stress, and eventually classified the data with a Support VectorMachine (SVM) whether the person received stress. The authors conclude that the peakhigh and the instantaneous peak rate are sensitive predictors for the stress level of a per-son. The SVM was capable to classify this level correctly with an accuracy larger than80%. The electrocardiogram shows a higher heart rate (HR) during stress conditionsmeanwhile the heart rate variability (HRV) is low [31], and the heart rate was found tobe significantly higher during cognitive stress than in rest. [32] found in their survey thatthe HRV and the EDA are the most predictive parameters to classify stress. [33] useda cognitive task in combination with a mathematical task to induce stress. Eye activitycan be a good indicator for stressful situations as well. Some studies report more fixa-tions and saccades guided by shorter dwell time in stress, other studies reported fewerfixations and saccades but longer dwell time. Many studies use in addition the pupildiameter for classification of stress, such as reported. In the survey from [32], the pupildiameter achieved good results for detecting stress. A larger pupil diameter indicatesmore stress. In the study of [34], blink duration, fixations frequency and pupil diameterwere the best predictors for work load classification (Fig. 5).
Fig. 5. Measurement of stress using eye movement features in relation to EDA measures. (a)The relative increase and decrease of EDA and ‘stress level’ method based output are correlatedwith Pearson r = .493 and from this the gaze based method provides an indication of arousal asmeasured by EDA. (b) The stress level measured with higher and lower cognitive stress (NC andSC condition) very well reflects the required cardinal ranking.
Stress Level Estimation. Eye movement based classification method, i.e., the ‘stresslevel’ estimation method, very well estimates the EDA arousal level, as well as the cardi-nal ranking for different levels of stress impact. The stress level estimation is computed

Attention Analysis for Assistance in Assembly Processes 319
by thresholds on the number of saccades and the mean dwell time during an observationwindow of 5000 ms. For level 2 the number of saccades should be between 15 and 25,and mean dwell time below 500 ms, For level 3, more than 25 saccades and mean dwelltime below 250 ms is requested.
Sample Study on Stress and Attention in Multitasking Human-Robot Interaction.The presented work aimed to investigate how the impact of cognitive stress would affectthe attentional processes, in particular, the performance of the executive functions thatare involved in the coordination of multi-tasking processes. The study setup for theproof-of-concept involved a cognitive task as well as a visuomotor task, concretely,an eye-hand coordination task, in combination with an obstacle avoidance task that ischaracteristic in human-robot collaboration. The results provide the proof that increasedstress conditions can actually be measured in a significantly correlated increase ofan error distribution as consequence of the precision of the eye-hand coordination.The decrease of performance is a proof that the attentional processes are a product ofexecutive function processes. The results confirm the dependency of executive functionsand decision processes on stress conditions and will enable quantitative measurementsof attention effects in multi-tasking configurations.
3 Use Case for Real-Time Human Factors Measurementsin Assembly Work Cells
The use case for an assembly work cell is depicted in Fig. 6. The worker learns about toassemble a transformer with its individual components, interacting with various areas inits environment, e.g., to pick up a component from one area of a table and to place it toanother part of a table.
The learning scenario demonstrates the feasibility of the concentration measurementtechnology. (1a) View on theworker with focus onwork (1a, 3a) and being interrupted bya chatwith a colleague (2a).Accordingly, the level of concentrationmeasureddrops downduring the chat (2c) but is high during focused work (1c, 3c). (1b, 2b, 3b) demonstratesthe egocentric view of the worker by means of the HoloLens headset with gaze cursor(blue) and concentration (orange) and stress (yellow) measurement bars.
The development of the demonstrator about the learning scenario is in progress. It isoverall based on the human factors measurement technologies described above. Uponcompletion, a supervisor worker will be capable to select specific tasks from a novelassembly work and investigate how well a rooky worker is performing in comparison toexpert datawhich arematched towards the novel data from the rooky. A distance functionwill finally provide insight into parts of the interaction since with substantial distance tothe expert profile and from this enable to put the focus on parts of the sequence that mostneed training. Furthermore, the pattern of interaction, i.e., gaze on objects and followinginteractions, is further investigated for additional optimisations if applicable.

320 L. Paletta
(1a)
(1b)
(1c)
(2a)
(2b)
(2c)
(3a)
(3b)
(3c)
Fig. 6. Learning scenario demonstrating the feasibility of the concentration measurement tech-nology. (1a) View on the worker with focus on work (1a, 3a) and being interrupted by a chat witha colleague (2a). Accordingly, the level of concentration measured drops down during the chat(2c) but is high during focused work (1c, 3c). (1b, 2b, 3b) demonstrates the egocentric view ofthe worker by means of the HoloLens headset with gaze cursor (blue) and concentration (orange)and stress (yellow) measurement bars. (Color figure online)
4 Conclusions and Future Work
This work presented innovative methodologies for the assessment of executive functionsto represent psychologically motivated quantitative estimations of human operator per-formance in assembly processes. We estimated dynamic human attention from mobilegaze analysis with the potential to measure, such as, attention selection and inhibition, aswell as task switching ability, in real-time. We presented a suite of different componentswith gaze based human factors analysis that is relevant for the measurement of cogni-tive and psychophysiological parameters. In this manner, this work intends to provide anovel view on human operator state estimation as a means for the global optimizationof human-machine collaboration.

Attention Analysis for Assistance in Assembly Processes 321
Within a typical learning scenario of a human operator within an assembly workcell and the study setup including application of state-of-the-art intuitive assistancetechnology for the performance of collaborative tasks, we illustrated the potential ofinterpretation from gaze based human factors data in order to evaluate a collaborativesystem.
In future work we will study the potential of more complex eye movement features,such as, for planning processes, to enable a more detailed analysis of the dynamicdistribution of attentional resources during the tasks.
Acknowledgments. This work has been supported by the Austrian Federal Ministry for Cli-mate Action, Environment, Energy, Mobility, Innovation and Technology (BMK) within projectsMMASSIST (no. 858623) and FLEXIFF (no. 861264).
References
1. Saucedo-Martínez, J.A., et al.: Industry 4.0 framework for management and operations: areview. J. Ambient Intell. Humaniz. Comput. 9, 1–13 (2017)
2. Steinfeld, A., et al.: Common metrics for human-robot interaction. In: Proceedings of theACM SIGCHI/SIGART Human-Robot Interaction (2006)
3. Huang, C.-M., Mutlu, B.: Anticipatory robot control for efficient human-robot collaboration.In: Proceedings of the ACM/IEEE HRI 2016 (2016)
4. Endsley, M.R.: Toward a theory of situation awareness in dynamic systems. Hum. Factors37(1), 32–64 (1995)
5. Paletta, L., et al.: Gaze based human factors measurements for the evaluation of intu-itive human-robot collaboration in real-time. In: Proceedings of the 24th IEEE Conferenceon Emerging Technologies and Factory Automation, ETFA 2019, Zaragoza, Spain, 10–13September 2019 (2019)
6. Holmqvist, K., Nyström, M., Andersson, R., Dewhusrt, R., Jarodzka, H., van de Weijler, J.:Eye Tracking –AComprehensive Guide toMethods andMeasures, p. 187. Oxford UniversityPress, Oxford (2011)
7. Moore, K., Gugerty, L.: Development of a novel measure of situation awareness: the case foreye movement analysis. Hum. Factors Ergon. Soc. Ann. Meet. 54(19), 1650–1654 (2010)
8. Munn, S.M., Pelz, J.B.: 3D point-of-regard, position and head orientation from a portablemonocular video-based eye tracker. In: Proceedings of the ETRA 2008, pp. 181–188 (2008)
9. Santner, K., Fritz, G., Paletta, L., Mayer, H.: Visual recovery of saliency maps from humanattention in 3D environments. In: Proceedings of the ICRA 2013, pp. 4297–4303 (2013)
10. Heyer, C.: Human-robot interaction and future industrial robotics applications. In: Proceed-ings of the IEEE/RSJ IROS, pp. 4749–4754 (2010)
11. Taylor, R.M.: Situational awareness rating technique (SART): the development of a tool foraircrew systems design. In: Situational Awareness in Aerospace Operations, pp. 3/1–3/17(1990)
12. Stanton, N.A., Salmon, P.M., Walker, G.H., Jenkins, D.P.: Genotype and phenotype schemataand their role in distributed situation awareness in collaborative systems. Theoret. IssuesErgon. Sci. 10, 43–68 (2009)
13. Dini, A., Murko, C., Paletta, L., Yahyanejad, S., Augsdörfer, U., Hofbaur, M.: Measurementand prediction of situation awareness in human-robot interaction based on a framework ofprobabilistic attention. In: Proceedings of the IEEE/RSJ IROS 2017 (2017)

322 L. Paletta
14. Paletta, L., Pittino, N., Schwarz, M., Wagner, V., Kallus, W.: Human factors analysis usingwearable sensors in the context of cognitive and emotional arousal. In: Proceedings of the4th International Conference on Applied Digital Human Modeling, AHFE 2015, July 2015(2015)
15. Paletta, L., Pszeida, M., Nauschnegg, B., Haspl, T., Marton, R.: Stress measurement in multi-tasking decision processes using executive functions analysis. In: Ayaz, H. (ed.) AHFE 2019.AISC, vol. 953, pp. 344–356. Springer, Cham (2020). https://doi.org/10.1007/978-3-030-20473-0_33
16. Bailey, B.P., Konstan, J.A.: On the need for attention-aware systems: Measuring effects ofinterruption on task performance, error rate, and affective state. Comput. Hum. Behav. 22(4),685–708 (2006)
17. Monsell, S.: Task switching. Trends Cogn. Sci. 7(3), 134–140 (2003)18. Miyake, A., Friedman, N.P., Emerson, M.J., Witzki, A., Howerter, A., Wager, T.D.: The unity
and diversity of executive functions and their contributions to complex ‘frontal lobe’ tasks: alatent variable analysis. Cogn. Psychol. 41, 49–100 (2000)
19. Jersild, A.T.: Mental set and shift. Arch. Psychol. 89 (1927)20. Kramer, A.F., Hahn, S., Gopher, D.: Task coordination and aging: explorations of executive
control processes in the task switching paradigm. Acta Psychol. 101, 339–378 (1999)21. Selye, H.: A syndrome produced by diverse nocuous agents. Nature 138(32) (1936)22. Folkman, S.: Stress: Appraisal and Coping. Springer, New York (1984). https://doi.org/10.
1007/978-1-4419-1005-9_21523. Smith, E., Jonides, J.: Storage and executive processes in the frontal lobes. Science 283,
1657–1661 (1999)24. Dickerson, S., Kemeny, M.: Acute stressors and cortisol responses: a theoretical integration
and synthesis of laboratory research. Psychol. Bull. 130, 355–391 (2004). https://doi.org/10.1037/0033-2909.130.3.355
25. Diamond, A.: Executive functions. Annu. Rev. Psychol. 64, 135–168 (2013). https://doi.org/10.1146/annurev-psych-113011-143750
26. Meyer, D.E., et al.: The role of dorsolateral prefrontal cortex for executive cognitive processesin task switching. J. Cogn. Neurosci. 10 (1998)
27. Del Missier, F., Mäntyla, T., Bruine de Bruin, W.: Executive functions in decision making:an individual differences approach. Think. Reason. 16(2), 69–97 (2010)
28. Cannon, W.B.: The Wisdom of the Body. Norton, New York (1932)29. Boucsein, W.: Electrodermal Acivity. Plenum, New York (1992)30. Setz, C., Arnrich, B., Schumm, J., La Marca, R., Tröster, G., Ehlert, U.: Discriminating stress
from cognitive load using a wearable EDA device. IEEE Trans. Inf Technol. Biomed. 14(2),410–417 (2010)
31. Taelman, J., Vandeput, S., Spaepen, A., Van Huffel, S.: Influence of mental stress on heartrate and heart rate variability. In: Vander Sloten, J., Verdonck, P., Nyssen, M., Haueisen, J.(eds.) 4th European Conference of the International Federation for Medical and BiologicalEngineering, vol. 22, pp. 1366–1369. Springer, Heidelberg (2009). https://doi.org/10.1007/978-3-540-89208-3_324
32. Sharma, N., Gedeon, T.: Objective measures, sensors and computational techniques for stressrecognition and classification: a survey. Comput.Methods Program. Biomed. 108, 1287–1301(2012)
33. Sun, F.-T., Kuo, C., Cheng, H.-T., Buthpitiya, S., Collins, P., Griss, M.: Activity-aware mentalstress detection using physiological sensors. In: Gris, M., Yang, G. (eds.) MobiCASE 2010.LNICST, vol. 76, pp. 211–230. Springer, Heidelberg (2012). https://doi.org/10.1007/978-3-642-29336-8_12
34. Van Orden, K.F., Limbert, W., Makeig, S.: Eye Activity Correlates of Workload during aVisuospatial Memory Task. Hum. Factors: J. Hum. Factors Ergon. Soc. 43, 111–121 (2001)

Attention Analysis for Assistance in Assembly Processes 323
35. Chajut, E., Algom, D.: Selective attention improves under stress: implications for theories ofsocial cognition. J. Pers. Soc. Psych. 85, 231–248 (2003)
36. Bütepage, J., Kragic, D.: Human-robot collaboration: from psychology to social robotics(2017). arXiv:1705.10146
37. Baddeley, A.D., Hitch, G.: Working memory. In: Bower, G.A. (ed.) The Psychology ofLearning and Motivation: Advances in Research and Theory, vol. 8, pp. 47–89 (1974)
38. Lezak, M.D.: Neuropsychological Assessment. Oxford University Press, New York (1995)39. Koolhaas, J.M., Bartolomucci, A., Buwalda, B., De Boer, S.F., Flügge, G., Korte, S.M.,
et al.: Stress revisited: a critical evaluation of the stress concept. Neurosci. Biobehav. Rev. 35,1291–1301 (2011)
40. Hermans, E.J., Henckens, M.J.A.G., Joels, M., Fernandez, G.: Dynamic adaptation of large-scale brain networks in response to acute stressors. Trends Neurosci. 37, 304–314 (2014)
Open Access This chapter is licensed under the terms of the Creative Commons Attribution 4.0International License (http://creativecommons.org/licenses/by/4.0/), which permits use, sharing,adaptation, distribution and reproduction in anymedium or format, as long as you give appropriatecredit to the original author(s) and the source, provide a link to the Creative Commons license andindicate if changes were made.
The images or other third party material in this chapter are included in the chapter’s CreativeCommons license, unless indicated otherwise in a credit line to the material. If material is notincluded in the chapter’s Creative Commons license and your intended use is not permitted bystatutory regulation or exceeds the permitted use, you will need to obtain permission directly fromthe copyright holder.

Live Video Assistance Systems for AssemblyProcesses
Christian Kittl1(B) and Markus Streibl2
1 Evolaris Next Level GmbH, Graz, [email protected]
2 Know-Center GmbH, Research Center for Data-Driven Business and Big Data Analytics,Graz, Austria
Abstract. Work processes and assembly processes are increasingly gaining incomplexity in the industrial context and demand a wealth of knowledge fromassembly employees, as well as from service and maintenance personnel. Thearticle describes a system developed in order to support assembly workers using alive video assistance system in combination with “wearables” - in particular smartglasses - in complex assembly processes by experts and reports findings from anacceptance analysis study.
Keywords: Assembly processes · Digital assistance system ·Wearables · Videosupport system
1 Introduction and Motivation
Production processes, which significantly contribute to the company’s success and thecompetitiveness of a company, have becomemore complex and, not least due to digitiza-tion in industry, are demanding a change in the training and qualification of employees.Digital assistance systems provide an interface for human-machine interaction and aredesigned to support employees in complex tasks. TheGraz innovation centerEVOLARISis developing, among other things as part of the MMASSIST II research project, a sys-tem that supports the shop floor worker in such a way that, when complex installation ormaintenance work occurs, experts use live video to monitor and guide the work process,thereby being able to successfully manage high complexity of the task. This on one handshould lead to decreased time that an expert is required to be on site to fix a problemresulting especially in reduced time-to-fix, availability, travel costs, and CO2 footprint,and on the other hand improve overall process quality. Systems likeWhatsApp or Skypecan be used on some cases, but often production companies require dedicated solutions,which work with industry grade hardware including smart glasses, have a specialisedset of functionalities that are really required by professional workers and easy to usein stress situations, where data can be stored on serviced on premise or in a local datacenter, and/or the solutions can be personalized/white labelled. Since such systems arestill new and there is little experience in practice with regard to their acceptance in the
© The Author(s) 2021S. Ratchev (Ed.): IPAS 2020, IFIP AICT 620, pp. 324–331, 2021.https://doi.org/10.1007/978-3-030-72632-4_24

Live Video Assistance Systems for Assembly Processes 325
target group and the impact on process efficiency they have, a study was conducted in asurvey of users who have already had several months of experience with such a systemduring a pilot phase.
2 Digital Assistance Systems in Production Processes
Since the eighteenth century, the industry has been undergoing constant change, whichhas currently reached its peak with the fourth industrial revolution, the networking ofintelligent technical systems known as cyber-physical systems (CPS). The basic ideabehind networked production was to make it more efficient and flexible by means offorecasts and forecasts. From the data obtained from assembly processes and the asso-ciated systems, decision-critical information can be obtained for the company with theappropriate data quality. Digital assistance systems apply this information to assist work-ers in their actions and their extended use in human-machine interaction, with humansincreasingly taking on a supervisory role (Haase et al. 2015). In parallel to the increasinghuman-machine inter-action, however, the need for rapid knowledge transfer betweenspecialists is also increasing, in order to be able to quickly clarify special questions in theuse of increasingly complex machines. The innovation center EVOLARIS is developingsuch an assistance system, which supports the strategy of “networked” employees vialive video remote support.
2.1 Live Video Assistance System EVOCALL
Live Video Assistance Systems enable real-time communication between people in dif-ferent locations, using cameras in parallel with the audio channel and transmitting theirimages in real-time to the remote station. Often, smart glasses are used in which infor-mation is displayed in the field of view of the user, and a camera is integrated to recordand transmit the view range which is currently being focused on to the communicationpartner (cmp. Fig. 1).
EVOLARIS’ live video remote system EVOCALL uses an open source real-timecommunication technology called Web Real-Time Communication (WebRTC), whichis designed to work in conjunction with the most popular consumer devices. The datatransfer takes placebymeansof theDTLSprotocol (DatagramTransportLayerSecurity),which makes a “man in the middle” attack on the open channel, or a manipulationof the data impossible. As can be seen in Fig. 1, the actual WEBRTC server is onlyneeded for the initial connection setup between the individual subscribers. The actualcommunication,which is additionally secured by SRTP (secure real-time protocol) videoand audio encryption, takes place via a separate media server (Fig. 2).

326 C. Kittl and M. Streibl
Fig. 1. Smart glasses as part of industrial live video assistance systems
Fig. 2. System architecture of the EVOLARIS live video support system usingWebRTC protocol

Live Video Assistance Systems for Assembly Processes 327
2.2 Live Video Assistance Systems in Assembly Processes
In the field of production, there is an increasing complexity of the systems working inthe collaborative system, as well as their influence on the work to be carried out andthe necessary training and qualification of the service/maintenance staff and assemblyemployees (Spöttl 2017). Streibl (2017) cite the potential application of Live VideoAssistance Systems for unscheduled repair with high complexity, thereby restoring sys-tem availability in the shortest possible time. The assembly or service or maintenancepersonnel set up an audio-visual connection with experts with the aid of a smart glasses(cmp. Fig. 1) with the digital system EVOCALL as a basic system. These subject expertsreceive the live stream of the employees on site from a “first-person view” on the respec-tive terminal. The system now offers the ability to not only describe and guide complexissues using an audio channel, but to capture them in a still image that can be generatedfrom the live video.
2.3 Live Video Assistance Systems for Shadow-Working
In this context, the system can be used by new employees or leasing workers who,for example, have to carry out a complex conversion process for the first time. Themachine operator, who is positioned at a different location, has the same machine in hisline and now has the possibility, using the Live Video Remote System, to carry out thenecessary steps and to transfer these to the data glasses of the employees. The “first-person view” and the additional audio stream enable employees to imitate the activitiesto be performed. By changing the streaming direction, whereby the video transmittedby the machine expert is no longer displayed in the data glasses of the employees, butnow the employees transmit the live video, new possibilities open up in the context ofthe “shadow-working” process, which is also used in the Field of assembly processes(Frohberg et al. 2009; Pimmer and Pachler 2014).
3 Acceptance of Live Video Remote Support Systems
This section presents the results of an online survey on system acceptance, which wasconducted as part of a master thesis accompanying the system development. The surveywas aimed at employees in the areas of production, service and maintenance from 15well-known Austrian, internationally operating companies on their experience with theuse of the EVOCALL live video remote support system. The companies were selectedaccording to the criteria of the necessary knowledge transfer, as well as an on-sitepresence of experts to fulfil the service offered. The participating companies fulfilled bothcriteria to a high degree andwhere given access to the EVOCALL system for the durationof 6 months in a trial phase. Of the 200 target people addressed, 50 (25%) participatedin the survey. The findings presented here relate in a first step to the dimension of theservice in terms of the usefulness and usability of the system, but also in relation to theefficiency and the effectiveness of the processes when using such a digital assistancesystem. As can be seen in Fig. 3, of more than 70% of the participants, the dimensionof perceived usefulness is rated on a five-point scale, where 1 means “applies strongly”

328 C. Kittl and M. Streibl
and 5 “does not apply at all”, to 1 or 2. The points of view of perceived usefulnessinclude a comparison between the experiences made and the expectations (Question 1),the usefulness of the system (Question 2), the simplicity of the system (Question 3), andthe usability of the system (Question 4).
Fig. 3. Perceived Usefulness of the EVOCALL remote video support system
These results suggest a very high perceived benefit and high acceptance of the livevideo assistance system by the participants.
The next two questions related to the degree of goal achievement, the result comparedto the original goal (effectiveness) and the degree of efficiency, aswell as the result versuseffort (efficiency) (Fig. 4). More than 90% of respondents believe that using EVOCALLcan increase their effectiveness. More than 80% of the respondents that EVOCALL canincrease efficiency. The effectiveness in this context refers to problems that exceededthe abilities of the employees and could still be solved through the use of EVOCALLvia the assistance of colleagues. The efficiency refers to an accelerated problem-solvingcycle and the resulting increase in plant availability.
Further results of the online survey showed that service and maintenance work ischaracterised by complex and varied activities and that the employees require extensivetraining. This complexity of the plant requires distinctive communication on differentchannels when assistance is needed. These channels, however, have limitations withregard to delayed or unclearly assignable responses due to asynchronous communicationchannels (e-mail or WhatsApp), or more difficult problem identification with regard toproblem description due to lack of qualifications by local staff and language barriers(telephone). This results in an increased presence of experts on site, which is reflectedin the duration of the repair time and thus in the availability of the system.

Live Video Assistance Systems for Assembly Processes 329
Fig. 4. Efficiency and effectiveness of the EVOCALL remote video support system
As can be seen from the answers reflected in the two figures above, the effectivenessand efficiency of the work processes can be positively influenced by the use of EVO-CALL. Synchronous audio-visual communication enables the employees to carry outmore highly qualified work processes under the guidance of experts via EVOCALL,which can lead to a reduced on-site presence of experts according to the results of thesurveys.
4 Summary and Conclusion
The change in the industry and its effects on prevailing assembly processes as well ason the changed qualification needs of employees requires the use of new methods andtechnologies such as digital assistance systems as an interface for a human-machineinteraction or as an interface between employees. The analysis of the live video remotesupport system EVOCALL as such a digital assistance system has shown that the use ofproduction and service processes can be positively influenced. The results from compa-nies that have already tested EVOCALL indicate that live video remote support systemshave a high perceived value for users and have a positive impact on the efficiency andeffectiveness of task completion. Summarizing the collected results, they clearly indicatethat EVOCALL has a positive impact on the current service and maintenance processes,improving communication, reducing the need for on-site presence of experts, and hav-ing a positive impact on the problem-solving cycle and the problem-solving skills ofservice and maintenance personnel. The survey provides new insights by quantifyingthe extent to which users, who had the opportunity to experience a live video remotesupport system in practice over a longer period in time (6-monthly trial).

330 C. Kittl and M. Streibl
However, due to the relatively small number of cases (n = 50) and the specificityof the tested system, the findings ca not be generalized without further notice. Muchdepends in practice on the actual implementation of a live video remote support systemand how easy it is for the users to use or what features are actually supported and howthe integration into the general enterprise IT takes place. Through studies with largercase numbers and through the comparative analysis of various systems, a more generaland even better reliable statement about the benefits of such digital assistance systems inproduction is to be made possible in the future, or the existing findings will be verified.
Acknowledgements. This work was created with support from the ‘Production of the Future’program of the Austria Research Promotion Agency (FFG) in the course of the lighthouse projectMMASSIST II and the Know-Center within the COMET K2 - Competence Center for ExcellentTechnologies program of the AustrianMinistry for Transport, Innovation and Technology (bmvit),the Austrian Ministry for Digital and Economic Affairs (bmdw), the Austria Research PromotionAgency and the Styrian Research Promotion Agency (SFG).
References
Abicht, L., Spöttl, G.: Qualifikationsentwicklung durch das Internet der Dinge (Developmentof Qualification through the Internet of Things). W. Bertelsmann Verlag GmbH & Co. KG,Bielefeld (2012)
Brandl, P., Aschbacher, H., Hösch, S.: Mobiles Wissensmanagement in der Industrie 4.0 (Mobileknowledge management in the Industry 4.0). In: Mensch und Computer 2015 –Workshopband,pp. 225–232. De Gruyter Oldenbourg, Berlin (2015)
Frohberg, D., Goth, C., Schwabe, G.: Mobile learning projects: a critical analysis of the state ofthe art. J. Comput. Assist. Learn. 25, 307–331 (2009)
Haase, T., Termath,W., Schumann, M.: Integrierte Lern- und Assistenzsysteme für die Produktionvon morgen (Integrated learning and assistance systems for the production of tomorrow). In:Lehren und Lernen für die moderne Arbeitswelt, Berlin, pp. 183–207 (2015)
Pimmer, C., Pachler, N.: Mobile learning in the workplace: unlocking the value of mobile technol-ogy for work-based education. In: Increasing Access through Mobile Learning, pp. 193–203.Athabasca University (2014)
Reichel, J., Müller, G., Mandelartz, J.: Betriebliche Instandhaltung (Operational Maintenance).Springer, Heidelberg (2009). https://doi.org/10.1007/978-3-642-00502-2
Streibl,M.: Einsatz einesLive-Video-Assistenzsystem imProblemlösungszyklus vonService- undInstandhaltungspersonal (Application of a live video assistance system in the problem solvingcycle of service and maintenance personnel). Master thesis, University of Applied SciencesCampus02, Graz (2017)
Spöttl, G.: Industrie 4.0 - Herausforderung für Lehrbetriebe (Industry 4.0 – Challenges for trainingcompanies). In: Frenz, M., Schlick, C., Unger, T. (eds.), Wandel der Erwerbsarbeit, pp. 60–75.LIT Verlag Münster (2017)

Live Video Assistance Systems for Assembly Processes 331
Open Access This chapter is licensed under the terms of the Creative Commons Attribution 4.0International License (http://creativecommons.org/licenses/by/4.0/), which permits use, sharing,adaptation, distribution and reproduction in anymedium or format, as long as you give appropriatecredit to the original author(s) and the source, provide a link to the Creative Commons license andindicate if changes were made.
The images or other third party material in this chapter are included in the chapter’s CreativeCommons license, unless indicated otherwise in a credit line to the material. If material is notincluded in the chapter’s Creative Commons license and your intended use is not permitted bystatutory regulation or exceeds the permitted use, you will need to obtain permission directly fromthe copyright holder.

Orchestration and Situation Awarenessin an Assistance System for Assembly Tasks
Wernher Behrendt(B) and Felix Strohmeier
Salzburg Research, Salzburg, Austria{wernher.behrendt,felix.strohmeier}@salzburgresearch.at
Abstract. We report on the design, specification and implementation of a situa-tion awareness module used for assistive systems in manufacturing, in the contextof Industry 4.0. A recent survey of research done in Germany and Europe, con-cerning assistive technology in industry shows a very high potential for “intelligentassistance” by combining smart sensors, networking and AI. While the state ofthe art concerning actual technology in industrial use points more towards user-friendly, speech-based interactionwith personal assistants for information retrieval(typically of in-house documentation), the research presented here addresses anenterprise-level assistance system that is supported by a number of specializedAssistance Units that can be customized to the end users’ specifications and thatrange from tutoring systems to tele-robotics. Key to the approach is situationawareness, which is achieved through a combination of a-priori, task knowledgemodelling and dynamic situation assessment on the basis of observation streamscoming from sensors, cameras and microphones. The paper describes a workingfragment of the industrial task description language and its extensions to coveralso the triggering of assistive interventions when the observation modules havesent data that warrants such interventions.
Keywords: Assembly tasks · Situation awareness · Assistance systems · Processlanguage
1 The Concept of Assistance in Industry 4.0
One of the tenets of Industrie 4.0 is the digitization of all processes, assets and artefacts inorder to be able to virtualize and simulate production and to achievemaximumflexibilityand productivity. While much of the innovation effort is aimed at outright automation,it is also obvious that for the foreseeable future, human-to-machine interaction willremain an important element of any production. With an aging workforce and productsthat are becoming less standardized (lot-size 1) the notion of assistance has been gettingsignificant attention. In an Austrian “lighthouse-project” the idea of “Assistance-Units”is put forward. This paper presents a taxonomy and internal structure of these units anda proposed formal language to specify their desired interaction with humans when anassistance need arises. It should be noted that the proposed language acts as a mediationlayer between higher level business process descriptions (e.g., an order to manufacture
© The Author(s) 2021S. Ratchev (Ed.): IPAS 2020, IFIP AICT 620, pp. 332–343, 2021.https://doi.org/10.1007/978-3-030-72632-4_25

Orchestration and Situation Awareness in an Assistance System 333
a product) and machine-specific programming constructs that are still needed to operatee.g. a welding robot. The purpose of our task description language is to orchestratehuman workers, robotic assistance as well as informational assistance, in order to keepthe factory IT in sync with progress on the shop-floor.
1.1 Motivation and State of the Art
While there is plenty of research work on collaborative robotics, exoskeletons, andinformational assistance through e.g. virtual reality headsets, less work has been doneon bringing these diverse forms of assistance under a common roof. A recent study [1]also took a broad view that included assistance systems for both services and industry.There, the authors distinguish three kinds of (cognitive) assistance: (1) Helper systemsproviding digital representations of e.g. manuals, teaching videos, repair guides, orother elements of knowledge management. (2) Adaptive Assistance systems that areable to take into account some situational context, e.g. through sensors, and that canthen provide relevant information that is adapted to the specific situation. (3) TutoringAssistance systems are also adaptive, but address explicitly, the need for learning in thework context.
The study forecasts a very high market potential for the use of AI in assistive tech-nology and this is of relevance to the category of “machines and networked systems”which gives the closest fit with manufacturing. The study also lists a number of Germanresearch projects broadly addressing digital assistance, in the years 2013–2017.
Looking at the current state of the art in industrial use of assistive technology, thereis a prevalence of personal digital assistants based on speech recognition engines suchas Apple Siri, Microsoft Cortana, Amazon Alexa, or Google’s Assistant with its cloudspeech tool. These are often combined with VR or AR headsets, or with tablets or smartphones depending on the use case. It should be noted that any user-activated assistance(e.g. by speech recognition) is reactive, i.e. it has no option of pro-actively helping theuser. A pro-active approach requires the system to somehow know where worker andassistive machinery are, in the overall task. The following example comes from one ofour industrial use cases for which a demonstrator is being built.
Motivating Example – Assembly. The use case comes from a manufacturer of elec-trical equipment for heavy duty power supply units as used for welding at constructionsites. There are detailed documents available describing the assembly process and theparts involved. The actual assembly process is done by referring to a paper copy of theassembly manual. There are also CAD drawings available that can be used to derivethe physical dimensions of the main parts. There are a number of important steps in theassembly process where the worker has to verify e.g. the correct connection of cables, orwhere he or she has to hold and insert, a part in a certain way. Furthermore, the assemblysteps are associated with typical timings in order to ascertain a certain throughput perhour. The purpose of the associated Assistance Unit (we will use the abbreviation A/U)is to help inexperienced workers learn the process quickly and to remind experiencedworkers to double-check the critical steps. It should also be possible for the worker toask for assistance at any point, through speech interaction and the A/U should be ableto detect delays in a process step, as well as errors in the order of steps when the orderof steps is important for the assembly process.

334 W. Behrendt and F. Strohmeier
Further use cases not discussed in this paper address maintenance, repair, re-tooling,working on several machines simultaneously, and physical (robotic) assistance withlifting of heavy parts.
1.2 Structure, Usage and Purpose of Assistance Units
The research into assistance units started with a hypothetical structure that was deemeduseful to define amethodology for creating and customizing different kinds of assistanceunits (Table 1):
Table 1. Initial structure of assistance units.
Characteristic feature Example
Description of the assistance unit E.g. Assembly-Assistant
Type of assistance Cognitive, physical or hybrid
Knowledge resources E.g. data or media files required
Input format E.g. speech interface, user interface
Input device(s) E.g. microphone.
Output format E.g. video explaining the assembly process
Output device(s) E.g. tablet and in-built speaker
Looking at the concept from a technical perspective, however, it is difficult to refinethis structure sufficiently, in order to use it as a taxonomic discriminator: the Descrip-tion points at a potentially significant set of user requirements that are not covered inthe specification. Likewise, distinguishing between cognitive and physical assistance isa binary decision that can be rewritten as “content management” (for cognitive needs ofthe user/worker) or “robotics” (addressing physical needs of the end user/worker). Inputformat and device, and analogously, output format and device are somewhat depen-dent entities because speech interfaces require microphones and video output requiresa screen of some sort. The “knowledge resources” are worth a more detailed investiga-tion with two possible technical approaches: firstly, one could think of the resources asmedia content that is searchable and through appropriate tagging, can be triggered incertain circumstances. The second approach would be to endow the assistance unit witha detailed model of the task and thus, make the unit capable of reasoning over the stateof the task in order to assess progress or any deviations. This latter approach involvesArtificial Intelligence techniques for knowledge representation and reasoning.
Usage as a Distinguishing Feature? It is clear that in principle, there may be as manykinds of assistance units as there are kinds of manufacturing tasks. So one approach toclassification could be high level distinctions of usage. Initially, we classified our usecases as being either assembly or maintenance or re-tooling, but in each of the cases, thedistinguishing features only show themselves in the content of the knowledge resourcesor in the knowledge based model of the actual activity, without having a structuralmanifestation in the assistance unit itself.

Orchestration and Situation Awareness in an Assistance System 335
Purpose (of Interaction) to the Rescue? The main reason for wanting a distinctionbetween different kinds of assistance units is to have clearly separable methodologiesfor their development and deployment. Ideally, one should be able to offer pre-structuredassistance “skeletons” that can be parameterized and customized by experts in the appli-cation domain, rather than requiring ICT specialists for bespoke programming. Havingbeen dissatisfied with the previous attempts at structuring, we then looked at the way inwhich human and machine (aka assistance unit) were supposed to interact and this ledto a proposed model that distinguishes eight forms of interaction or purpose, for usingan assistance unit, with distinctive capabilities specified for each kind of unit (Table 2).
Table 2. Taxonomy of assistance units according to purpose of interaction
Purpose Capabilities (A/U = Assistance Unit)
Mediator A/U enables connection to/with a remote expert
Tutor A/U explains a certain procedure
Trouble-shooter A/U helps to localize a specific problem
Guard A/U observes a situation and reports observations
Savior A/U is called to clear up a known failure condition
Helper A/U takes over physical sub-tasks in collaboration
Interpreter A/U finds situation-relevant information from diverse sources, inan ill-defined problem space
Avatar (for tele-presence) A/U enables an expert to act in a remote location (requires e.g.tele-robotics and situation awareness)
The above taxonomyhas the advantage that it requires an increasing set of capabilitiesgoing from mediator to avatar. In other words, the distinguishing features allow one todefine capabilities on an ordinal scale (Mediator< Tutor< Trouble-shooter< etc.). It isof course questionable whether the mediator role qualifies at all, as an assistance unit inits own right, but we may accept that a combination of on-line manuals, plus the abilityto call an expert, all packaged in some smart-phone app, is sufficient functionality for alow-hanging fruit w.r.t. assistance units.
1.3 Assistance Units as Actors on the Shop-Floor
One of the defining features of any assistance unit is the ability to recognize when it isneeded. This presupposes some form of situational awareness which can be obtainedeither by explicitly being called by the worker or by some sensory input triggering theA/U. Situational awareness requires explicit knowledge about the environment, knowl-edge about desirable sequences of actions (e.g. the steps of an assembly task) and it alsorequires some planning capability unless we can afford the system to learn by trial anderror – an unlikely option in a competitive production environment.

336 W. Behrendt and F. Strohmeier
Formal and semi-formal production planning methods are already being used inmany manufacturing firms. Hagemann [4] gives the example of Event-Process-Chainsfor planning assembly lines in the automotive sector, but for assistance, one would needa more granular level of description. At the level of robotic task execution, there areexamples such as the Canonical Robot Command Language [6] that provides vendor-independent language primitives to describe robotic tasks.
In the field of production optimization, many firms rely on some variety ofmeasurement-time-method (MTM). There are different variants of MTM offering dif-ferent granularity [3, 5, 7, 9] but the main problem is that the method is not well suited toformally describing purposeful, planned processes with inputs and outputs, but instead,focusses on the description of isolated actions and their time- and effort-related param-eters. The method is also propagated rather exclusively, by a community of consultantsbelonging to the MTM association which keeps control over the intellectual property ofpracticing the art of MTM analysis.
So, while there are clearly potential connecting points with process planning atlarge, and with action-based productivity measurement at the more detailed level, onestill requires an orchestration formalism that can distinguish between actors, can nameinputs and outputs of processes, and can describe the manufacturing process as well asany assistive measure that one may want to add to the manufacturing process. To achievethis goal, we used – as a starting point – the agent model of Russell and Norvig [2] asshown below (Fig. 1).
Fig. 1. Simple reflex agent according to Russell and Norvig [2].
The important issue to note is that we distinguish Environment and Agent, the latterconsisting of sensors to perceive observations from the environment, effectors to manip-ulate entities in the environment and some form of rationality expressed in a worldmodel and in a rule system that predetermines what actions the agent will take, undercertain conditions. For a simple reflex agent as shown above, there is a direct relationshipbetween singular observations and according actions. This is definitely not a sufficient

Orchestration and Situation Awareness in an Assistance System 337
model for what we would call “intelligent” behavior, and so we should extend the basicmodel, as shown in the next figure.
As can be seen, the second model introduces a memory for the agent to store a stateof the perceived world, and a planning mechanism to reason about the effects of possibleactions. This means that the agent can nowmake decisions concerning its actions, on thebasis of some utility function included in the planning mechanism. This agent-modelgives us now a better handle on the original structural interpretation of the assistanceunit: the input devices are a subset of all sensory input to the A/U and the associatedformats are the data structures of those observations (also known as “percepts”). Theoutput devices are a subset of all effectors of the A/U and quite clearly, for these to workin an intelligent way, a reasoning engine of some sort is required between the input andthe output mechanisms of the A/U – as illustrated in Fig. 2.
Fig. 2. Agent with explicit goals and reasoning, according to Russell and Norvig [2].
2 Situational Awareness and Assistance
The next step is to apply the agent-based Assistance Units to situations where timelyinterventions are required by the A/Us that are monitoring the shop-floor processes. Wenow bring observations, knowledge resources and collaborative activities into play, asproposed in the following conceptual model: in order for the A/U and the worker tobe able to collaborate they must be in agreement with respect to the process in whichthey are involved. They also need to have some mutual understanding what knowledgeis relevant for the process at the current step, and at least the A/U should have a basicunderstanding which knowledge can be assumed as given, for the worker. A concreteassistive intervention would then be to ask the worker whether he/she needs additionalinformation for this step, or the next step, or whether they need any other form ofassistance. Figure 3 below illustrates such a situation.

338 W. Behrendt and F. Strohmeier
Fig. 3. Establishing a mutual focus of attention between human worker and assistance unit (Colorfigure online)
The diagram of Fig. 3 shows knowledge items that may come from observationsor from prior knowledge, as triangles. The triangles outside the focus of attention (inred) could be any input that is recognized by the sensors of the actors, but which isnot having any relevance to the current situation. There could also be red trianglesinside the current situation, but outside the mutual focus of attention – these would thenrepresent knowledge items that are not yet, or no longer, of immediate relevance. Thearrow going from the yellow triangle of the A/U to the (green) frame of a triangle in themutual focus of attention, indicates that an assistive intervention is occurring, i.e. theassistance unit is transferring knowledge to the worker, e.g., by reminding him/her tocheck the polarity of some electrical connection. The objects named “Resource” referto repositories accessible to the workers and/or the A/Us. In the case of the worker, aprinted manual would qualify as a resource, whereas in the case of an A/U we wouldrequire digital assets preferably accessible via a URL.
Note that the diagram represents a snapshot at a particular time step in the manufac-turing process. The intersection of Assistance Unit, Worker and current overall situationconstitutes the mutual focus of attention. It shows one green triangle representing rele-vant knowledge that the worker has and a green frame of a triangle representing a pieceof knowledge that the worker is missing and that the Assistance Unit can bring intoplay (yellow triangle with arrow to green frame). Going back to the assembly use caseintroduced earlier, this could be the situation where the worker is reminded to checkthe polarity of an electrical connection and wants to reassure him-/herself by asking theassistance unit to display the connection diagram.

Orchestration and Situation Awareness in an Assistance System 339
3 Process Description as Frame for Situational Awareness
Having amodel of the overall manufacturing task is necessary for the A/U to be synchro-nized with the human worker w.r.t. the manufacturing process in which the assistance issupposed to happen. This may look like paying a high price (i.e. heavy modelling) forthe sole purpose of getting a reminder to check some quality feature. However, behindthe simple example is a more ambitious objective, namely to develop a process mod-elling methodology that can be used not only for simple assistive interventions, but alsofor highly synchronized collaborative work, as would be required when a collaborativerobot helps a worker to place a truck engine in a chassis frame.
In the use case of the power unit assembly, four sensory inputs are used and relatedto the manufacturing process in question: (1) a video camera is analyzing the worker’smovement in order to recognize certain actions, such as picking a screw and tighteningit. (2) a second video stream recognizes artefacts on the work table, such as the sidepanels of the power unit. (3) A third video stream comes from a Hololens used by theworker, detecting the worker’s gaze (direction of viewing) and also recognizing thoseartefacts that are directly in view of the worker. (4) A microphone picks up utterancesof the worker, e.g. when he/she requests additional information, such as the procedurefor assembling a specific part of the power unit. The detection systems of these foursensor streams translate the raw data into discrete observations that can then be used bythe situational awareness module. In the next section we specify the modelling languagethat is able to merge process knowledge with observational knowledge, in order to arriveat the required situational awareness.
3.1 Pseudo-Natural Language for Process Steps, Observations and Interventions
The following is an example of the orchestration language for collaboration and assis-tance on the manufacturing shop floor. It has some syntactic sugar to make it look like astructured natural language, but it has a direct translation into a logic based programmingformalism:

340 W. Behrendt and F. Strohmeier
<Assembly>
Assembling product [PowerUnit-1] involves steps:
place () material [Base] on equipment [Worktable] with step-
range <10-15s>,
place () material [Bottom_cover] on top of [Base] with step-
range <10-15s>,
place (from the right), component [Powersupply] on top of
[Bottom_cover]
on trigger (show-how) show user (tutorial “Powerunit-1/Pow-
ersupply.mp3”);
on trigger (delay) ask user (need-help-in-task?)
on trigger (behaviour) ask user (are-you-sure?)
else do either:
place (from the left), material [Side_panel_left] on side
of assembly then
place (from the right), material [Side_panel_right];
or
place (from the right), material [Side_panel_right] then
place (from the left), material [Side_panel_left];
place () material [Housing] on top of assembly [PowerUnit-1];
inform about [Bottom_cover]: myfirm/PowerUnit-1/Connect-
ors_bottom_cover.jpg;
inform about [Powersupply]: ]: myfirm/PowerUnit-1/Powersup-
ply.mp3;
inform about [PowerUnit-1]: myfirm/PowerUnit-1/Assembly.mp3;
assist on demand [PowerUnit-1]: Lifting_robot_Lifty;
in_panic_do [PowerUnit-1]: emergency_plan_call_the_doc-
tor.help
</Assembly>
A similar description is conceivable for another task, e.g. the packaging of the powersupply unit after assembly1 :
<Packaging>
Packing product [PowerUnit-1] involves steps:
Pick () material [cardboard-VPK1] and place it1 on equipment
[worktable],
Transform [cardboard-VPK1] through [make-PU1-box] into mate-
rial [PU1-box],
Place (bottom down) product [PowerUnit-1] into [PU1-box],
[…] </Packaging>
Here, the constructtransform [X] through [P] allows us to declare a subtaskmake-PU1-box which needs to be further specified elsewhere.
At this stage, our task description language is not complete yet, but the fragmentabove has been formalized and used for the demonstration of the assembly use case. In
1 We allow simple anaphoric references: “and place it” refers to the cardboard.

Orchestration and Situation Awareness in an Assistance System 341
the research implementation, we have focused on the formal constructs and it would bethe task of productization, to add a compiler/interpreter that transforms the structurednatural language into the respective formal constructs.
The following table summarizes our current set of constructs. The middle columnshows the language construct, on the right we give examples or comments and onthe left we explain the function of the construct for the purpose of expressing eithermanufacturing task steps or interventions by the assistance unit (Table 3).
Table 3. Constructs of the task description language for assistance units
Meta-language explanation Language construct Examples/Comments
Assistance trigger trigger (show-how | delay |behavior | panic)
Show-how is initiated by the worker; delaygets triggered when the time is used up;behavior is used when a deviation is observed;panic triggers a defined emergency procedure
A/U Intervention control On trigger T <action> … else If trigger T is raised then do […], else do […]
Object product [ID] We associate assembly tasks with products,e.g. PowerUnit-1 with some catalogue-ID
Object equipment [ID] Instrumental objects such as tools, e.g. ascrewdriver or a workbench, or an info-screen
Object material [ID] A part made of homogeneous material, e.g. ametal base of some product
Object component [ID] A specific functional part of a product thatmay itself be a subassembly or product
Object assembly [ID] A non-functional intermediate state of aproduct during the manufacturing process
Object user [ID] A human worker involved in the task
Action place (+ qualifiers) E.g. place (from the left) …
(More actions will need to be defined) pick X from Y E.g. taking a screw from a container
(do) show X [to user] What the A/U should display to the user
(do) ask [user] What the A/U should ask the user
(do) help [user] Refers to physical or reasoning help
A high- level action pointing to anothertask specification
Transform [X] through [P] into<object> newX
References a sub-process P, which transformsX into a new shape or form “NewX” e.g.creating a box out of some sheet of cardboard
Spatial qualifiers on top of These are qualifiers that have a localinterpretation from the worker’s point of view
from the rightfrom the left below, from below
They must be used carefully because they arerelative to the worker’s assumed position
Domain-specific terms [Dom-Spec-Term] E.g. material [Bottom-cover] – the referencedobjects must be recognizable for theassistance system through some identificationmechanism (e.g. RFID, image recognition)
At present, the domain-specific language only uses the action constructs “pick”,“place” and “insert” for assembly tasks. This corresponds to the fact that the observationalmodules cannot distinguish any further activities, e.g. “gluing” or “screwing” etc. Assoon as we extend the scope of manufacturing activities to e.g. machine re-tooling or tomachine maintenance, we will have to extend the vocabulary, e.g. to express that somemachine part may have to be disassembled. However, such distinctions only make senseif they can be detected by the observational modules. One simple “fallback”-detectionmechanism is of course, to require the worker to confirm that step X has been done.Whatshould become clear though is, thatwe already have a sufficient set of language constructs

342 W. Behrendt and F. Strohmeier
to combine actors’ task specifications, observations and triggered interventions, as theminimally required vocabulary.
4 Summary, Work in Progress and Beyond
Wehave presented a conceptualmodel and an orchestration language for specifying taskson a manufacturing shop floor. The language allows the user to also specify assistiveinterventions in relation to observations that come as information streams from differentsensory channels. At the time of writing, a software demonstrator for the describedassembly use case is being implemented by the research partners and will be validatedby the industrial use case partner.
The implementation of the situation awareness module is inspired by the SituationCalculus, a modelling approach for cognitive robotics pioneered in the works of Reiter[14], Levesque, Lesperance et al. [13].We use theword “inspired” because at present, wedo not make full use of e.g. the IndiGolog programming environment developed by thatgroup at theUniversity of Toronto [15]. Instead,we remainwith themore straightforwardtask specification and use the unification algorithm of Prolog to activate the assistancetriggers when certain conditions in the observation streams are met. In a future project,we plan to map our task specifications to equivalent actions and preconditions/postconditions as required by the Situation Calculus.
Acknowledgement. This work has been co-funded by the Austrian Research Promotion Agency(FFG) and by the Austrian Ministry for Transport, Innovation and Technology (bmvit), throughthe project “MMAssist II” (FFG No.: 858623) within the research program “Production of theFuture”. We are grateful to the anonymous reviewers for pointing out weaknesses and givingadvice on related work.
References
1. Apt, W., Schubert, M., Wischmann, S.: Digitale Assistenzsysteme - Perspektiven und Her-ausforderungen für den Einsatz in Industrie und Dienstleistungen. In: Hrsg.: Institut für Inno-vation und Technik (iit)in der VDI/VDE Innovation+ Technik GmbH, WeApWi 2018, p. 80(2018)
2. Russell, S., Norvig, P.: Artificial Intelligence – A Modern Approach, 3rd edn. Prentice Hall,Upper Saddle River (2012)
3. Hold, P., Ranz, F., Sihn, W.: Konzeption eines MTM-basierten Bewertungsmodells fürdigitalen Assistenzbedarf in der cyber-physischen Montage (2016)
4. Hagemann, S: Optimierung des Fertigungsplanungsprozesses im Karosseriebau durch dieEntwicklung eines Konzepts zur automatisiertenGenerierung von Fertigungsanlagenmithilfeeines wissensbasierten Systems, p. 202. Master-Arbeit, Otto von Guericke Univ. Magdeburg(2016)
5. Bokranz, R., Landau, K.: Handbuch Industrial Engineering: Produktivitätsmanagement mitMTM. Schäfer-Peschel (2012)

Orchestration and Situation Awareness in an Assistance System 343
6. Proctor, F.M., Balakirsky, S.B., Kootbally, Z., Kramer, T.R., Schlenoff, C.I., Shackleford,W.P.: The canonical robot command language (CRCL). Ind. Robot. 43(5), 495–502 (2016).https://doi.org/10.1108/IR-01-2016-0037
7. Kelterborn, D.: Erweiterung eines Systems vorbestimmter Zeiten zur Bewertung der körper-lichen Belastung in der Produktionslogistik. Dissertation, TU München (2016). http://www.fml.mw.tum.de/fml/images/Publikationen/Kelterborn.pdf
8. Mertens, A., Schlick, C.: Vorlesungsfolien 2016/17. RWTH Aachen, IAW. https://www.iaw-aachen.de/files/iaw/vorlesungen/Winter/2017/IEE/IEE_LE05_WiSe17_Slides.pdf
9. Benter, M.: Analyse von Arbeitsabläufen mit 3D-Kameras. Dissertation (2018). https://tore.tuhh.de/bitstream/11420/1920/1/Dissertation_BenterMartin.pdf
10. Hengstebeck,A.,Weisner, K., Klöckner,M., Deuse, J., Kuhlenkötter, B., Roßmann, J.: Formalmodelling of manual work processes for the application of industrial service robotics. In: 48thCIRP Conference on MANUFACTURING SYSTEMS - CIRP CMS 2015, Procedia CIRP,vol. 41, pp. 364–369 (2016)
11. Bauer, S.: Prozesssprachenbasiertes System zur Ansteuerung digitaler Menschmodelle alsTeilkomponente einer Software zur Planung und Visualisierung menschlicher Arbeit in derDigitalen Fabrik. Dissertation (2015). https://monarch.qucosa.de/api/qucosa%3A20388/attachment/ATT-0/
12. Korn, O.: Context-aware assistive systems for augmented work - a framework using gami-fication and projection (2014). http://www.oliver-korn.de/wp-content/uploads/2014/05/Context-Aware-Assistive-Systems-for-Augmented-Work.-A-Framework-Using-Gamification-and-Projection_WEB.pdf
13. Levesque, H., Reiter, R., Lespérance, Y., Lin, F., Scherl, R.: GOLOG: a logic programminglanguage for dynamic domains. J. Logic Program. 31, 59–84 (1997)
14. Reiter, R.: Knowledge in Action. Logical Foundations for Specifying and ImplementingDynamical Systems. MIT Press, Cambridge (2001)
15. De Giacomo, G., Lespérance, Y., Levesque, H.J., Sardina, S.: IndiGolog: a high-level pro-gramming language for embedded reasoning agents. In: El Fallah Seghrouchni, A., Dix, J.,Dastani, M., Bordini, R.H. (eds.) Multi-Agent Programming, pp. 31–72. Springer, Boston,MA (2009). https://doi.org/10.1007/978-0-387-89299-3_2
Open Access This chapter is licensed under the terms of the Creative Commons Attribution 4.0International License (http://creativecommons.org/licenses/by/4.0/), which permits use, sharing,adaptation, distribution and reproduction in anymedium or format, as long as you give appropriatecredit to the original author(s) and the source, provide a link to the Creative Commons license andindicate if changes were made.
The images or other third party material in this chapter are included in the chapter’s CreativeCommons license, unless indicated otherwise in a credit line to the material. If material is notincluded in the chapter’s Creative Commons license and your intended use is not permitted bystatutory regulation or exceeds the permitted use, you will need to obtain permission directly fromthe copyright holder.

Safety as Bad Cop of Physical AssistanceSystems?
Michael Rathmair(B) and Mathias Brandstotter
ROBOTICS, Institute for Robotics and Mechatronics, JOANNEUM RESEARCHForschungsgesellschaft mbH, 9020 Klagenfurt am Worthersee, Austria
{Michael.Rathmair,Mathias.Brandstoetter}@joanneum.at
Abstract. Constantly increasing variety of products and customer-specific requirements lead to more complex assembly lines in the shopfloors. These new demands require novel systems and technologies suchas flexible assembly lines, track and trace systems or assistive systems. Inthis paper, supporting systems on the physical level are analyzed and inparticular robot assistance systems with respect to their safety aspectsare discussed. Moreover, the current standards and guidelines in the fieldof robot safety and their development focus are presented. It is intendedto provide a comprehensive overview of what role safety actually playswith assistance systems and how ongoing research may affect it in future.
Keywords: Safety · Collaborative robots · Human-robot interaction
1 Introduction and Motivation
Physical assistive systems in the context of this paper have the goal to sup-port humans in a highly flexible and volatile industrial production environment.Besides already implemented fully automatic workplaces (e.g. for welding) thereare still many semi-automatic assembly stations within a modern productionline. Especially due to Industry 4.0 requirements as the increased need for flex-ible machines that can be adapted to fulfill smaller lot sizes under changingproduction conditions quickly and efficiently. For this reason, the number ofassembly stations using advances of collaborative robotic systems as productionassistance equipment even rises. A common vision is to develop an enhancedindividual robotic assistive system replacing the today’s cordless electric screw-driver. However, in this paper we identify and discuss several challenges witha special focus on robotics safety that explain why this replacement is not assimple as it may seem at first glance.
Collaborative robotic assistance systems on the first side support workersin complex assembly tasks but on the other side they also provide valuableservices in the automated manipulation of workpieces or perform intralogistictasks (e.g. machine tending). However, the collaborative robots (mobile robotsand serial manipulators) in a production facility, are not operated behind anyphysically separating protective devices but act in a workspace which is largelyc© The Author(s) 2021S. Ratchev (Ed.): IPAS 2020, IFIP AICT 620, pp. 344–357, 2021.https://doi.org/10.1007/978-3-030-72632-4_26

Safety as Bad Cop? 345
shared between humans and machines. This has the consequence, that collisionsbetween robotic equipment and human body parts are no longer avoidable. Onthe contrary, physical interaction/contact between the robot and the human canbe used to further increase the performance of the assistive function and enhanceeasy operation features.
As already reported within this paper we illustrate current challenges,approaches to manage them and give an overview to future research trendsin the field of industrial assistive systems. Our focus is robot safety which hasan increased significance in fanceless robot operation. In industrial manufac-turing, there is an increasing need for flexible machines that are able to workautonomously and can be adapted to changing production conditions quicklyand efficiently.
2 State of the Art Safety Standards and Guidelines forIndustrial Assistive Systems
Assistive systems in the context of this work are permanently used in an indus-trial environment and require properties as robustness, reliability, precision andavailability similar to classical industrial robots. Thus, industrial assistive sys-tems face different safety requirements in contrast to service robot applications.In addition to the EC Machinery Directive 2006/42/EC [1], specific standardsand regulations for robot safety, in particular for serial manipulators the ENISO 10218 (Robots And Robotic Devices - Safety Requirements For IndustrialRobots) [2,3], define the regulatory framework for safe cooperation betweenhumans and robots in an industrial application context. For human-robot col-laboration the since 2011 the ISO 10218 defines four clearly defined scenarios:
– Safety-rated monitored stop: The movements of a robot is stopped duringhuman-machine interactions within the shared space. Such a state is safety-rated monitored with the consequence that the robot’s drives can remainenergized.
– Hand guiding: The safety is given by manual physical guiding of the robotunder appropriately reduced speed.
– Speed and separation monitoring: Movements and speed parameters areadjusted in a way to keep a safeguard space between the operator and anypart of the robot.
– Power and force limiting by design or control: Power and force controlparameters are set in a way that in case of an occurring contact between ahuman and the robot given limits are not exceeded.
Taking into account the rapid development of collaborative robotics in 2016, thetechnical specification ISO/TS 15066 [4] as an extension to the ISO 10218 waspublished. On the first side, the specification includes more technical and organ-isational details especially about the power and force limiting operation mode.On the other side, ISO/TS 15066 holds a table specifying limits for accept-able force and pressure values in the case of a human-robot contact situation.

346 M. Rathmair and M. Brandstotter
The given bio-mechanical load limits are derived from in-depth studies carriedout with human volunteers under a strictly defined experimental set-up. At thetime of writing (Nov. 2019) the ISO 10218-1/2 (part 1 and part 2) standards areunder revision by the ISO/TC 299/WG 3 committee. The official release of bothparts is scheduled by end of 2021. A major improvement in the perspective ofcollaborative robots is that two informative annexes based on the ISO/TS 15066will be integrated. These Sections, Annex N: Limits for quasi-static and transientcontact and Annex O: Power and force limited robot applications – Pressureand force measurements, are already integrated and released for comments inthe ISO/CDrev3 10218 (committee draft revision 3) document developed at the11th committee meeting in Waldkirch. Besides that, substantial changes e.g. insafety functions performance requirements are planned for the 2021 versions ofthe new ISO 10218-1/2.
Assistive systems based on mobile robots so called AGVs (automated guidedvehicles) are also clearly regulated by the European machinery directive. Addi-tionally, a national and an international standards are in place. First, the EN1525:1997 (Safety of industrial trucks - Driverless trucks and their systems) [6]which is due to its release date of 1997 not longer representing state of the arttechnology. Second, the ISO/FDIS 3691-4 [5] which is currently in FDIS (FinalDraft International Standard) state (Nov. 2019) will replace EN 1525:1997. Aslong as the standard is not officially published, manufacturers are obliged todirectly fulfill the requirements given by the machinery directive without havinga corresponding state of the art Type C standard [23].
Mobile manipulators are assistive systems where a robotic arm is mounted ona mobile platform. Depending on the purpose of the arm standards for mobilerobots and/or stationary industrial robots have to be applied. There are nofully-compliant standards, guidelines or design proposals for this type of robot.However, in the US RIA (Robotic Industries Association) in cooperation withANSI (American National Standards Institute) are working on the national stan-dard ANSI/RIA R15.08 (Draft) which has the goal to bridge any gaps betweenregulations for AGVs, robot arms and mobile manipulators [24]. The R15.08 isin draft state since 2017 and consists of three parts. Part 1 will specify safetyrequirements for the manufacturer, part 2 will describe requirements for design-ers and integrators and part 3 will define safety requirements for the end-userof industrial mobile robots. Part 1 was scheduled for being published in 2019,followed by part 2 and 3 in 2020 as soon as the committee completed all revisionand balloting processes.
In Austria, the national standardisation authority Austrian Standards isreacting to the described trends in modern assistive production systems bysetting up a new committee for “Smart Manufacturing” [12]. The group willsupport the international technical committees ISO/TC 184 - Automation sys-tems and integration [14] and IEC/JWG 21 - Smart Manufacturing ReferenceModel(s) [15]. A large number of well-known Austrian companies and researchcentres have already expressed their interest in participating. The official launchof the smart manufacturing committee is planed in early 2020 [13].

Safety as Bad Cop? 347
3 Safety Measures Implemented in Industrial AssistiveSystems
Assistive systems have already been successfully installed in numerous modernindustrial production sites. This has the consequence, that they can be suffi-ciently secured by arbitrary technical and/or organisational measures even toget them CE certified. Basis of any safety measure implemented within a collab-orative robotic assistive system is a comprehensive risk analysis which is never-theless required according to the ISO 10218-2:2011 [3] standard. A risk analysisin general should accompany a project in every phase of life and provide appro-priate measures in order to reduce the probability of dangerous situations to anacceptable residual level of risk [25].
In the perspective of technical measures, inherent safety can be achieved bythe design of the robot, its manipulation tool, external support equipment, theworkpiece or other machine parts that are moved within the collaboration area.Besides that a wide product palette of auxiliary equipment as light barriers, laserscanners, safety matts, etc. offered by different vendors are available to solvealmost any safety issue. The goal is to avoid/reduce identified risks occurring atpotential contacts between a human and a robot, by an emergency stop triggeredby complementary functional safety hardware [25]. The challenge for designersand safety engineers is to find a requirements fulfilling solution at a good balancebetween efficiency, cost and installation complexity.
If no technical solution is applicable under reasonable effort the accordingstandard ISO 12100:2010 [7] provides organisational measures for risk reduc-tion (see Fig. 1). For example these are pictograms and written warning signson machines, comprehensive training for competence acquisition, working pro-cedures, supervision, the use of personal protective equipment, etc.
Fig. 1. Measures to reduce risk according to ISO 12100 and a selected example
A particular scenario which is very interesting for risk analysis and the asso-ciated measures for reduction is placing a robotic assistive system in a public

348 M. Rathmair and M. Brandstotter
open space as exhibitions, art projects, makerspaces, etc. Within such an environ-ment systems impose higher risks of unintended human-robot contacts comparedto well-studied shop floor applications. Moreover, collaborative assistive robotsin public spaces are difficult to validate, as relevant standards and directives(e.g. EC Machinery Directive 2006/42/EC) are not sufficiently applicable. Thisopen space context is investigated in detail in the research project CoMeMak1.New approaches for risk assessment and corresponding reduction are developedthrough novel combinations and structured methodologies of measures.
4 Safety - State of the Art Challenges, Best Practicesand Future Trends
Companies and users partially perceive the safety awareness in the field of col-laborative robotics as exaggerated. This impression is often not misleading, asthe safety assessment in the end can be the decisive factor in not being able toput a plant into operation in the desired form. In the following section we try tolook at this circumstance one step deeper, to point out the causes and to sketchout solution attempts.
4.1 Possibility of Modifications
Every modification of a plant or process has an impact on safety and can affectthe operational risk. According to the current state of the art, an automationsystem must be recertified after any modification. However, this process is time-consuming and always associated with additional costs. Hence, there is a lackof practicable flexibility for collaborative robot systems in case a modification isdemanded.
The research project DR.KORS2 is focused on defining safe modificationlimits for a known robot application. By the approach developed a user is ableto make modifications to the robot system or process and still operate in awell-defined safe system configuration. Numerous essential modification dimen-sions can be identified for a plant or a physical assistance system, whereby theirrelevance always depends on the application. Examples for such modificationdimensions are the workpiece dimensions, the distance of a safety sensor to therobot base and the robot speed. This means that a generous safety evaluation isaccomplished during the design time and statistical and dynamic models are usedto evaluate any variation along a modification dimension during runtime [26].
1 CoMeMak – Cobot Meets Makerspace is funded by the FFG (grant agreement No.871459).
2 DR.KORS – Dynamic reconfigurability of collaborative robot systems is funded bythe FFG (grant agreement No. 864892).

Safety as Bad Cop? 349
4.2 Applications Are Slow and Bulky
At physically interacting robot assistants where the operation modes separa-tion monitoring or power and force limiting (see Sect. 2) are used, movementsof robot parts and humans might be completely dynamic, uncertain and thus insome cases also unforeseeable. As a result, an accurately performed risk analy-sis prescribes extremely low speed and acceleration values for robot movements.Collaborative applications thus become increasingly inefficient in terms of pro-duction cycle times and the resulting effectiveness. Strictly speaking, the chal-lenge is to avoid unforeseeable risky contact situations resulting in requestedslow robot movements with the consequence of low production efficiency.
Classically, organisational and technical solutions for (subsequent) securingassistive systems as discussed in Sect. 3 are applied. Alliteratively, enhancedeffort can be shifted to application-analysis processes during the designtime. Comprehensive safety-goal oriented optimizations, design reviews, semi-automatic tuning algorithms, etc. may beneficially influence safety behavior evenunder decreasing production cycle times. Such processes will be generally con-ducted with a detailed analysis of existing workflows, possible dimensions offlexibility as well as customized guidance though production steps. Thereforeillustrative software packages as described in the next Subsection offer greatpossibilities of production visualization and demonstration of collaborative work-flows including humans and machines.
The Horizon2020 project RobMoSys3 has the goal of an model-driven designmethodology for robotic applications as well as assistive systems by using com-positions of hard- and software elements with managed, assured and maintainedsystem-level properties. Such properties may range from production character-istics concerning cycle time, human machine interactions and optimized integra-tion of assistive applications into a workflow, to safety properties derived fromnormative requirements. However, the vision of such model-driven approach isthat an application designer has the ability to optimize and adapt a roboticassistive system and the associated workflows at a very early development stagein a way that the safest handling of the robot trends to be the most efficient.
4.3 Complex Risk Analysis
Risk analysis for the safety of any type of machinery and the general principlesfor design are basically regulated in the type A standard ISO 12100:2010 [7]and its applicable practical guide ISO/TR 14121:2012 [8]. However, caused byincreased dynamic behavior and application flexibility the principles given in theguidance document become harder and harder to follow in a practical way. Theeffort for assessing and documenting risks in spreadsheets will be significantlyincreasing. Research projects and the associated developed tools trend to semi-automize risk assessment processes to overcome this challenge.
3 RobMoSys is an European Horizon2020 project (grant agreement No. 732410) -https://robmosys.eu/.

350 M. Rathmair and M. Brandstotter
The research project eITUS4 [29] develops methodologies for a more intuitiverisk assessment based on a model-based system design approach. The core con-cept is to apply fault injection simulations using high level models specified inthe Papyrus for robotics Modeling Framework [27] which is fully compliant withthe model-based RobMoSys design methodology (see previous subsection) [28].Software developed in eITUS configures, executes and analyses simulation resultsfor automatic generation of commonly used risk analysis documents as Hazardand Operability Analysis (HZOP), Failure Modes and Effects Analysis (FEMA)and Fault Tree Analysis. Model-based design of assistive systems in combina-tion with fault injection simulation embedded in a virtual environment poses anapplicable approach for risk assessment which is a salable solution even undersequentially increasing system complexity.
Model based design methods are a promising approach to develop modernhigh performance assistance systems. Abstract models, however, are difficultto handle and potentially unsuitable for domain experts or lead to a lack ofclarity in their symbolic/mathematical abstraction. Engineers attempt to makemodels more illustrate via virtual reality or virtual digital twins. Plant simulationsoftware packages like Siemens Tecnomatix 5, Arena6, and ema Work Designer7
represent useful tools. In addition to the mechanical and human process flow,handling tasks of robot systems can be simulated.
For collaborative workplaces, some of these tools can also provide force esti-mation in critical contact situations. Figure 2 shows an example of a report resultfrom ema Work Designer. It returns unacceptable contact scenarios if the per-missible force limit according to ISO/TS 15066:2016 [4] for a contact is exceeded.
4.4 Safety Test and Verification Processes Are Not that Accurate,Reliable and High Performance
In agile systems and software development processes, testing as well as verifi-cation and validation are significant accompanying activities during the wholedesign phase. However, testing safety related properties in highly complex sys-tems is becoming more and more challenging and exhaustive testing covering allpossible scenarios is not possible. This means, that test cases have to be carefullyselected and designed to ensure an appropriate functional safety coverage.
A further critical issue in the perspective of test and verification processes ofany modern technical application is the focus of an appropriate level of abstrac-tion the system under test is described, modeled and inspected. A layer modelapplicable for assistive systems is illustrated in Fig. 3. The given layers define ageneralized behavioral description implemented as a composition of application
4 eITUS – Experimental Infrastructure Towards Ubiquitously Safe Robotics Systemsis cascaded funded by European Horizon2020 project RobMoSys (grant agreementNo. 732410).
5 https://www.plm.automation.siemens.com/global/de/products/tecnomatix/.6 https://www.arenasimulation.com/.7 https://imk-ema.com/workdesigner.html.

Safety as Bad Cop? 351
Fig. 2. Exemplary report on the virtual collision evaluation in ema Work Designer.
dependent as well as commercial hard- and software elements (examples of adescription are given on the right side in the figure). A coarse description at ahigh level of abstraction hides specific details with the consequence that verifi-cation runs fast but may suffer under low expressiveness. Vice versa, a low levelof abstraction requires highly detailed, complex and large models which allowsvery detailed and expressive specification of tests. However, the challenge is toabstract systems in a clever way so that verification and testing is affordable andsafety critical situations are detected in an early project phase. This ensures aclear top-down (in reality, meet in the middle) design approach, even with theadvantage that errors, bugs as well as safety critical system properties can bedetected and corrected cheaply. For verifying the safety property defined in thered box we aim a model of the skill “pick up screws” refined by a more spe-cific refined model of the implemented robot arm in order to estimate contactforces at collisions between human body parts and a part of the robot. Furtherrefinements to individual joint dive models or specific more controller hardwareproperties in this case would make the model unnecessarily complex and thusthe verification slow. However, if a verification engineer is in particular interestedin an highly accurate contact force model we recommend using the methodologyobjective-drive system analysis methodologies as discussed in [11]. Here a specificfocus is set on a verification goal when switching to a lower level of abstractionin order to obtain a statement for a system (safety) property that is as preciseas requested.
An innovative approach for verification developed in the ForSAMARA8
project is the utilization of formal methods for safety verification of roboticassistive systems. Such methods, in particular symbolic model checking, result
8 ForSAMARA – Formal safety analysis in modular robotic applications is cascadedfunded by European Horizon2020 project RobMoSys (grant agreement No. 732410).

352 M. Rathmair and M. Brandstotter
Fig. 3. Levels of abstraction to classify behavioral descriptions, models and verificationapproaches of an assistive system.
in a mathematical verification proof, while conventional verification approachesare based on test scenarios (informal methods) just selectively increase the con-fidence of the system [19–22]. As illustrated in Fig. 4, informal verification runsdepend on specifically defined test cases, which target single selected issues. Inthe figure test cases tc1 to tc3 verify features f4, f6 and f3 which may representfor example specific skill definitions at a certain level of abstraction (see Fig. 3).Model checking is able to act more comprehensively by verifying if a formulatedproperty (as the safety property specified in natural language in Fig. 3) is ful-filled on a composition of features. However, a natural language specificationhas to be formalized in a unambiguous machine-readable presentation (e.g. rep-resented as p1 in the Figure). The formalized property p1 it then verified on acomposition of system features f4, f5, f7 and f8 using a model checking tool suchas NuSMV [16], Spin [17] or UPPAAL [18].
Fig. 4. Comparison between a test-based (left) and model checking-based (right) ver-ification approach.
4.5 Safety Verification in Highly Dynamic, AI and Deep LearningRobotic Applications
Of course, assistive systems also benefit from forefront technological innovations.They already rely on machine learning (ML), artificial intelligence (AI), and

Safety as Bad Cop? 353
context-aware (context aware assistive systems - CAAS [30]) components. Amajor advantage is that these systems react very quickly and flexibly to changesin their environment and application conditions by learning and optimizing newbehavioral patterns online during the operation of the system. Thus, testingand verification against safety properties in a classical way before deployment isincreasingly challenging. Strictly speaking, it must be proven that safe operationcan be guaranteed even under any possible learning evolution of the system [31].
An approach to overcome that challenge might be runtime verification whereformally defined properties as explained in the latter subsection are compiledto monitors (hardware or software) executed during the system operation. Thecreation as well as the integration of monitor structures can be highly automated,offering a well scalable verification methodology. The verification of a safetyproperty can be executed independently of the implemented functional behavior.A property violation is reported and the system can be potentially steered backto a save operation state [32,33].
4.6 Physical Measurement Is More Tricky Than It Seems to Be
Placing an industrial assistive application using the power and force limitationmode into the market, requires compliance with the force and pressure limitsspecified by ISO/TS 15066. However, the technical specification defines only thelimits that must not be exceeded but holds no information about an associatedmeasurement method. The most important (and only) guideline, implementing aso called biofidel measurement method for the evaluation of human-robot contactsituations, has been published by the Deutschen Gesetzlichen Unfallversicherung(DGUV) in 2017. Biofidel in this context means that the affected human bodypart is imitated by a specific combination of a metal spring and damping materialplaced on the force sensor element.
Measuring instruments to evaluate the described contact situations arebecoming highly affordable and commercial. As a result of this continuing trend,system integrators and operators of assistive systems will increasingly switch overto buying their own devices and performing measurements. However, many thendiscover that executing measurements, in particular under high quality assur-ance measures such as those required for a test laboratory according to ISO17025, entails significant challenges:
– As already reported the procedure defined by the DGUV have an informa-tional and not a normative character. As long as this DGUV document isunder revision for being integrated into the new ISO 10218-2 standard a SOP(standard operating procedure) has to be defined as a basis for the biofidelicmeasurement process, Nevertheless a clear measurement instruction docu-ment is strictly required for being certified by an accreditation body.
– A significant challenge during the design and execution of measurements isto place and configure a measurement device as well as the robot systemaccurately. This includes among others the selection of a contact situationaccording a provided risk analysis, localization and biofidel configuration of

354 M. Rathmair and M. Brandstotter
the measurement device, ensure repeatable accuracy of robot movements andthe associated reproducible measured values, documentation of measurementresults as well as a comprehensive description of the robot system for whichthe performed evaluation is unambiguously valid, etc.An example is shown in Fig. 5 where a Franka Emika Panda robot performs apick task of a cylindrical workpiece. Both illustrated poses of the robot enablesto lower the gripper at the same constant speed to pick up the object. How-ever, the kinematic configuration has a significant impact on the sensitivityof the robot [10]. Identical movements of the gripper leads in the elbow-upconfiguration (left) to a transient contact force of 318 N, whereas the elbow-down configuration (right) only 133 N have been evaluated. Also humans usethis property, rising the elbow to a horizontal position if we want to pressan object powerfully. The limit according to ISO/TS 15066:2016 for such atransient clamping situation of the hand (280 N) is thus fulfilled only at theelbow-down configuration. As a consequence, on the first side this exampleshows the possibility of inherent risk reduction by design modifications asdescribed in Sect. 3. On the other side the tight dependency between the con-figuration of the robot system and the evaluated biofidel force measurementresults are highlighted.
– Having an accredidated calibration certificate for a measurement device andconsidering the associated uncertainty is good, but only an extremely lim-ited way of considering uncertainty. A significantly higher impact to the totaluncertainty budget is given by the integration of the measurement device intothe fully specified evaluation process. Several other impact factors as envi-ronmental parameters, placement of the device, repeatability of contacts, etc.suddenly become highly relevant. Moreover, their evaluation of measurementuncertainty has to be divided into a static and dynamic load characteristicrepresenting clamping situations and free space contacts respectively.
– Since there is no structured comparison between inspection bodies offeringbiofidel measurements at the moment, it is hard to validate human skillsof a measurement engineer as well as the properties of a specifically usedmeasurement device. The research project CoHoMe, which got a cascadedfunding award by the EU project COVR, focuses on closing this gap. Withinthe project several evaluation rounds including inter-laboratory comparisonexperiments at an increasing complexity, are defined. The participants ofthis study get immediate feedback as well as pass and fail assessment of theexecuted tests.
This is just a list of the selective challenges that the authors had to over-come during the accreditation process of their inspection facility REL - RoboticsEvaluation Lab9. Within this test center JOANNEUM RESEARCH offers robotsafety evaluation through applied biofidel measurements according to the ISO17025 quality standard [9].
9 https://rel.joanneum.at/.

Safety as Bad Cop? 355
Fig. 5. Due to the redundant geometry of the Panda robot (7 degrees of freedom) theposition to pick up the cylindrical workpiece can be reached under various positions ofthe elbow joint.
5 Conclusion
The working environment and task for an employee should be as appropriate,structured and, above all, safe as possible. Obviously, this also applies to collabo-rative workplaces where the feeling of overprotection of the employee sometimesarises. An essential reason to be careful with freely acting cobots is based on theforces that occur application-specifically. In particular, the gripping technologyused as well as the manipulated workpieces are the greatest uncertainty factorfor classifying a priori collaborative robot applications as safe. Quite apart fromthese obvious influencing factors, some other aspects may have an influence asdiscussed in this work.
In order to tackle safe operation of modern industrial physical assistive sys-tems, a large number of not directly technical challenges must also be solved. Onthe one hand, the conformity with current standards and as the highest directivevalid laws have to be fulfilled. On the other hand, the aim is to not reduce theeffectiveness of production by placing requirements on the operational safety ofassistance systems. If these requirements are not met, safety issues can quicklydevelop into a serious bad cop.

356 M. Rathmair and M. Brandstotter
Acknowledgements. This work is part of the funded project MMAssist II (Assis-tance Systems in Production in the Context of Man – Machine Cooperation) supportedby the Austrian Research Promotion Agency (FFG) and the Austrian Ministry forTransport, Innovation and Technology (bmvit) under grant agreement number 858623.
References
1. Directive 2006/42/EC of the European Parliament and of the Council of the Euro-pean Union - Machinery Directive, 17 May 2006
2. ISO 10218-1:2011 - Robots and Robotic Devices - Safety Requirements For Indus-trial Robots - Part 1: Robots
3. ISO 10218-2:2011 - Robots And Robotic Devices - Safety Requirements For Indus-trial Robots - Part 2: Robot systems and integration
4. ISO/TS 15066:2016 - Robots and robotic devices—Collaborative robots5. ISO/FDIS 3691-4 - Industrial trucks—Safety requirements and verification—Part
4: Driverless industrial trucks and their systems6. DIN EN 1525:1997-12 - Safety of industrial trucks - Driverless trucks and their
systems7. ISO 12100:2010 - Safety of machinery—General principles for design—Risk assess-
ment and risk reduction8. ISO/TR 14121-2:2012 - Safety of machinery—Risk assessment—Part 2: Practical
guidance and examples of methods9. DIN ISO 17025-1:2003-05, General requirements for the competence of testing and
calibration laboratories (ISO/IEC 17025:2017)10. Wahrburg, A., Robertsson, A., Matthias, B., Dai, F., Ding, H.: Improving contact
force estimation accuracy by optimal redundancy resolution. In: IEEE/RSJ Inter-national Conference on Intelligent Robots and Systems (IROS), pp. 3735–3741(2016)
11. Rathmair, M.: Insight in analog systems: a semi-symbolic approach using enhanceddeviation traceability. Ph.D. thesis, TU-Wien, Institute for computer Technology(2018)
12. Standards sind entscheidend, damit Industrie 4.0 funktioniert. https://www.austrian-standards.at/infopedia-themencenter/specials/2-fachkongress-industrie-40/standards-sind-entscheidend-damit-industrie-40-funktioniert/. Accessed Nov2019
13. Internal Austrian Standards Committee Document - N0467, 08 March 201914. Technical Committee ISO/TC 184 - Automation systems and integration. https://
www.iso.org/committee/54110.html. Accessed Nov 201915. IEC/TC 65 - Industrial-process measurement, control and automation. https://
tinyurl.com/r3psfg4. Accessed Nov 201916. NuSMV: a new symbolic model checker. http://nusmv.fbk.eu/. Accessed Mar 201917. SPIN Verifying Multi-threaded Software with Spin. http://spinroot.com/spin/
whatispin.html. Accessed Mar 201918. UPPAAL - an integrated tool environment for modeling, validation and verification
of real-time systems. http://www.uppaal.org/. Accessed Mar 201919. Brinkmann, R., Kelf, D.: Formal verification—the industrial perspective. In: Drech-
sler, R. (ed.) Formal System Verification, pp. 155–182. Springer, Cham (2018).https://doi.org/10.1007/978-3-319-57685-5 5
20. Baier, C., Katoen, J.P.: Principles of Model Checking. MIT Press, Cambridge(2008)

Safety as Bad Cop? 357
21. Webster, M., et al.: Toward reliable autonomous robotic assistants through formalverification: a case study. IEEE Trans. Hum.-Mach. Syst. 46(2), 186–196 (2016)
22. Rathmair, M., Luckeneder, C., Kaindl, H.: Minimalist qualitative models for modelchecking cyber-physical feature coordination. In: 2016 23rd Asia-Pacific SoftwareEngineering Conference (APSEC 2016), pp. 233–240 (2016)
23. Markis, A., Papa, M., Kaselautzke, D., Rathmair, M., Sattinger, V., Brandstotter,M.: Safety of mobile robot systems in industrial applications. In: 2019 Proceedings ofARW & OAGM Workshop (2019). https://doi.org/10.3217/978-3-85125-663-5-04
24. RIA - Robotics Industries Association: Industrial mobile robot safety standardson the forefront. https://www.robotics.org/content-detail.cfm?content id=6710.Accessed Nov 2019
25. Platbrood, F., Gornemann, O.: Safe robotics - safety in collaborative robot systems,White Paper 2018-06. https://tinyurl.com/yayepzxt. Accessed Nov 2019
26. Brandstotter, M., et al.: Versatile collaborative robot applications through safety-rated modification limits. In: Berns, K., Gorges, D. (eds.) RAAD 2019. AISC,vol. 980, pp. 438–446. Springer, Cham (2020). https://doi.org/10.1007/978-3-030-19648-6 50
27. Papyrus for Robotics. https://www.eclipse.org/papyrus/components/robotics/.Accessed Nov 2019
28. Composable models and software for robotic systems. https://robmosys.eu/.Accessed Nov 2019
29. Experimental Infrastructure Towards Ubiquitously Safe Robotic Systems UsingRobMoSys. https://robmosys.eu/e-itus/. Accessed Nov 2019
30. Korn, O., Funk, M., Abele, S., Horz, T., Schmidt, A.: Context-aware assistivesystems at the workplace: analyzing the effects of projection and gamification. In:Proceedings of the 7th International Conference on Pervasive Technologies Relatedto Assistive Environments (PETRA 2014). ACM, New York (2014)
31. Huang, X., Kwiatkowska, M., Wang, S., Wu, M.: Safety verification of deep neuralnetworks. In: Majumdar, R., Kuncak, V. (eds.) CAV 2017. LNCS, vol. 10426, pp.3–29. Springer, Cham (2017). https://doi.org/10.1007/978-3-319-63387-9 1
32. Huang, J., et al.: ROSRV: runtime verification for robots. In: Bonakdarpour, B.,Smolka, S.A. (eds.) RV 2014. LNCS, vol. 8734, pp. 247–254. Springer, Cham (2014).https://doi.org/10.1007/978-3-319-11164-3 20
33. Dong, Z., et al.: Runtime verification on robotics systems. IJRAT 3, 23–40 (2015)
Open Access This chapter is licensed under the terms of the Creative CommonsAttribution 4.0 International License (http://creativecommons.org/licenses/by/4.0/),which permits use, sharing, adaptation, distribution and reproduction in any mediumor format, as long as you give appropriate credit to the original author(s) and thesource, provide a link to the Creative Commons license and indicate if changes weremade.
The images or other third party material in this chapter are included in thechapter’s Creative Commons license, unless indicated otherwise in a credit line to thematerial. If material is not included in the chapter’s Creative Commons license andyour intended use is not permitted by statutory regulation or exceeds the permitteduse, you will need to obtain permission directly from the copyright holder.

The Consideration of Job Satisfactionin the Design of Assistance Systems
in Production
Stelios Damalas(B), Norah Neuhuber, and Peter Mortl
Smart Production and Human-Centered Solutions, Virtual Vehicle Research GmbH,Graz, Austria
{steliosandreas.damalas,norah.neuhuber,peter.moertl}@v2c2.at
Abstract. Assistance systems designed to help workers in their jobs areincreasingly used in industry. Technological progress makes these systemsmore powerful and extensive, but often nobody questions the extent towhich they actually support the users and do not patronize them. Forthe development of such systems, we found the requirement analysisto be rather complex because human factors and social constraints aremore difficult to determine than technical requirements. To counteractthese difficulties, we pursue in our approach the involvement of people asknowledge carriers in the development of new technologies. In this paperwe outline our framework how human factors aspects of acceptance andjob satisfaction can be taken into account in the conception and designof assistance systems.
Keywords: Human-centered · Industry 4.0 · Job satisfaction ·Evaluation · Assistance systems
1 Introduction and Motivation
The trend towards ever greater connectivity, higher speeds, and more complexproducts and production processes in industrial developments has led to anincreasing use of cognitive and physical assistance systems in industrial enter-prises. Such systems assist users in their actions and their extended use results inincreased human-machine interaction, with machines gaining more automationand humans increasingly taking on a supervisory role (see [5] and [6]).
Two different directions of human-machine interaction can be distinguished.On the one hand, user assisting interactions of the assistance system are thosethat support the user. On the other hand, assistance system assisting interac-tions are those with which the user must prepare and discontinue the assistancesystem for support (Fig. 1). However, these preparation interactions are oftendifficult to visualize through planned investigations of workers under real work-place conditions but may be an additional burden.
In many cases, the users who do the preparatory work are not those who ben-efit from the system. Since not only the assistance system supports the workersc© The Author(s) 2021S. Ratchev (Ed.): IPAS 2020, IFIP AICT 620, pp. 358–367, 2021.https://doi.org/10.1007/978-3-030-72632-4_27

Consideration of Job Satisfaction 359
but also vice versa, they need to be integrated into the overall process. Humansare seen as a central element in the production of the future (see [16]) and it isimportant to put them at the center of the development of these new technologiesin order to focus on aspects of job satisfaction, stress and strain on employees,and to avoid negative effects of automation as much as possible.
Fig. 1. Difference between user and assistant supportive interactions of assistancesystems
Based on these insights we set the focus on figuring out the interdependenciesbetween assistance systems, their acceptance and job satisfaction. When design-ing Software applications and services in manufacturing environments, workersneeds and expectations in particular have to be considered in order to achievesmooth work flows.
The paper initially provides psychological literature on work-related theoriesin advance. Furthermore, design studies on the effects of assistance systems onaspects of job satisfaction are examined. After that we present the developedframework and its proper application, which deals with the integration of aspectsof job satisfaction into the design of assistance systems. Finally, the summaryconcludes the findings.
2 Relationship Between Job Satisfaction, Acceptance andAssistance
Before we can think about the relationship between assistance and job satisfac-tion, we outline which factors, and to what extent, can influence job satisfaction,and what options are available to evaluate and assess that.

360 S. Damalas et al.
2.1 Concepts for the Design of Work
The design of the work has been a focus of work psychological research fordecades. In particular, with the steady development of new automated systems,this area is becoming increasingly important. The literature shows that a varietyof factors influence constructs such as job satisfaction or the overall well-beingof employees. One of the basic theories for the beneficial design of work is theJob Characteristics Model (see [7]), which focuses on the core job dimensions ofskill variety, task identity, task significance, autonomy and feedback. Over time,the central factors have been expanded and knowledge-based characteristics andphysical aspects were also included (for an overview see [12] and [15]).
Another theory is the two-factor theory according to Herzberg et al. [11],which distinguishes between motivators and hygiene factors. Hacker [8] describesfurther key aspects for the design of beneficial work, whereby the completenessof the work is emphasized here. An activity is complete when the employee isinvolved in all phases (organizing, planning, executing and controlling), whichHacker also calls “sequentially complete” work. Another aspect, the “hierarchi-cal completeness”, describes task profiles, which include both complex and lesscomplex activities. According to Hacker, central aspects to be considered whenassessing a job are monotony, problem-solving ability, the ability to learn towork and the importance of control and autonomy. If the completeness of workis not given, the learning and development opportunities of the worker are lim-ited, which in turn has a negative effect on motivation, well-being and personaldevelopment of the worker.
Karasek [13] describes the Job Demand & Control model, which deals withthe relationship between job demands and job decision latitude in relation tothe general experience of stress and strain in the work context. According tothe model, job demands and job decision latitude can vary independently and,depending on the relation to each other, lead to the employee’s stress or positiveexperience of the activity.
From the literature above, the central aspects of designing conducive workhave been summarized for the MMAssist project (https://www.mmassist.at/).Based on the approach of the evaluation framework in the FACTS4WORKERSproject (https://facts4workers.eu/, see [9]), which referred to the dimensions ofautonomy, competence, variety, relatedness, protection, efficiency and quality,we presented the dimensions in a more differentiated manner, based on the workof Morgenson and Humphrey (see [12] and [15]). As a result, we have used for ourframework the dimensions of task level (variety of tasks, autonomy in termsof decisions, temporal and content organization of the task, etc.), knowledgelevel (complexity of the task, problem-solving skills, variety of skills, informationprocessing, etc.), social level (social support, interaction with colleagues) andwork context (physical requirements, working environment) for the descriptionof the work-related factors.

Consideration of Job Satisfaction 361
2.2 Effects of Assistance Systems on Aspects of Job Satisfaction
Previous work design studies describe a variety of factors to consider when(re)designing work, as is the case with the introduction of new technologies.The difference between assistance systems and high-automation systems is thatthe first support people at work, while the second need people as supporters. Asthis publication concentrates on assistance systems rather than high-automationsystems, the human factor problems are not to be seen in the area of monitoringand transition problems, but rather in designing the assistance systems so thatthey can offer usable support. The approach to the development of assistancesystems is therefore even more directly bounded to the human user and requiresthe understanding of what exactly should be supported.
Effects of automated systems on various outcome variables, such as employeejob satisfaction, have been studied for decades (see [10]). Basic theoretical for-mulations were postulated by Wall et al. [17], who saw four major areas influ-enced by the introduction of automated systems: employee autonomy (temporal,methodical and task control), cognitive requirements (monitoring and problem-solving skills), Change of responsibilities and social interactions. The direction ofthe effects (positive or negative) depends mainly on the design of the automatedsystem and the way it is connected.
Similarly, Cascio and Montealegre [4] describe the relationship between auto-mated systems and employee demands. Reduced control and autonomy of theemployee while at the same time perceived increased work demands threatento bring negative effects to the introduction of automated systems. Likewise,Baethge-Kinsky and Tullius [2] highlight the change in the requirement struc-ture, which relates in particular to analytical and problem-solving compe-tence, but also requires additional knowledge of operational processes, social-communicative and self-organizational skills.
Based on the historical development of assistance systems, Mital and Pen-nathur [14] argue that technological developments tend to de-qualify workersrather than helping people achieve more self-determination and more fulfillingwork. They therefore see the further development of the abilities of the employeesas a central point, which must be considered when introducing new systems.
Experimental studies, such as Bala and Venkatesh [3], report negative effectsof assistance systems on the experience of employees in terms of requirement andfreedom of action - especially in the initial implementation phase of assistancesystems - which in turn reflected reduced levels of employee job satisfaction.However, these effects were dependent on the system characteristics of the assis-tance system.
2.3 Introduction of an Assistance System and Interactions with theUsers
Especially with the introduction of assistance systems, it requires the conver-sion and the support of the workers in order to prepare and adapt the system

362 S. Damalas et al.
accordingly. Such often quite flexible and adaptive activities are difficult to pre-scribe and more likely to emerge through experimentation and active recognitionof customization options. These interactions require a positive, interested, andopen attitude towards the system, so a high system acceptance. This makes itpossible not to perceive change and restructuring as a threat, but to face it withconfidence and participation.
Above all, the connection between the changing role of workers resultingfrom assistance and job satisfaction is essential. For example, a shift in rolesmay result from a shift in activity towards increased supervision activities ofworkers, which could be positively or negatively evaluated by them, therebyhaving an impact on overall job satisfaction. Another case could be that whileworkers prepare the assistance for other workers, they do not receive benefitsthemselves. The addition of such new activities without own benefits could havea slightly negative impact on workers acceptance and job satisfaction and shouldbe considered (Fig. 2).
Fig. 2. Relationship between job satisfaction, acceptance and successful introductionof assistance
3 Framework for Considering Job Satisfaction in theDesign of Assistance Systems
Based on the theoretical content described above and the previous EU projectsFACTS4WORKERS and SCOTT (https://scottproject.eu/) we developed a jobsatisfaction framework to explain the sequential processes that will be used in theMMAssist II project to embed aspects of job satisfaction into the developmentprocess of assistance systems. At the beginning, the requirements for the specificassistance systems are surveyed by the respective industrial partners. The focus

Consideration of Job Satisfaction 363
here is on the specific problems that occur, the people who are going to use thesystem, the respective work activities and the nature of the environment andorganization.
Aspects of job satisfaction are gradually being introduced in three phases(Fig. 3):
i At the beginning of the process, “Guidance Questions” are formulated for theassistance system development team, which provide initial recommendationsfor the consideration of job satisfaction aspects in the conceptual developmentof assistance systems. These questions serve as the first basic orientationand should help developers to consider these disciplinary considerations indevelopment work. The questions relate to the four dimensions of task level,knowledge level, social level and work context, as described in Sect. 2.1, andserve to differentiate the respective aspects of job satisfaction.
ii After the assistance systems have been fundamentally specified in consulta-tion with employees, industry partners and technical developers, and Guid-ance Questions have already been taken into account, the formulation of spe-cific recommendations will be made in a second phase. These recommenda-tions are addressed to developers.For this purpose the persona-scenario-goal methodology is used, that com-bines goal orientation with the persona method to negotiate conflicting goals[1]. Operational scenarios with personas are formulated, which describe theassistance systems in the usage context in more detail. Subsequently, theanticipated effects of the recommended measures on the job satisfaction ofthe employees are estimated on the basis of an assessment matrix.Finally, recommendations are formulated to consider aspects of job satisfac-tion, which are passed on to the development and industry partners. Thecontent of the recommendations is based on the basic aspects of job satisfac-tion described above and the interaction between introduction of the system,role change, job satisfaction and acceptance.
iii In the third phase, the respective assistance systems are subjected to an itera-tive evaluation. For this purpose, baseline measurements are carried out withspecially developed survey methods before the assistance systems are intro-duced.Our approach pursues both a quantitative evaluation (using a question-naire) and a qualitative evaluation (using interviews). Questionnaires have theadvantage of being easily quantifiable and efficient. Interviews, on the otherhand, provide valuable insight into the workers’ view of the assistance sys-tems. A combination of both methods is therefore preferable in order to obtaina differentiated picture. The questionnaire also relates to the four dimensionsdescribed in Sect. 2.1. During the project, repeated measurements are thencarried out, which in turn inform the further development of the assistancesystems in an iterative process.

364 S. Damalas et al.
Fig. 3. Framework for integrating aspects of job satisfaction into the development ofassistance systems (MMAssist II Framework)
4 Application of the Framework
As part of the requirement analysis, we issued a short questionnaire to theemployees participating in the project in order to record the actual status interms of job satisfaction and use it as a baseline. It became clear that the timerequired for the requirements analysis was already relatively high for the employ-ees and therefore the issue of an additional questionnaire was often limited oreven partially impossible.
In order to be able to adequately support the conception of assistance sys-tems with regard to job satisfaction, we developed “Guidance Questions” andsent them to the development team in summer 2018. In addition, we participatedin workshops to further define the assistance units to provide input on importantaspects of job satisfaction, by using the assessment matrix. Finally, in April 2019,we conducted two initial evaluations at our industrial partner, where the surveyinstruments (questionnaire and interview) were used and tested. The focus herewas on the assistance units “digital instructiois” (“EvoAssist” system), “docu-mentation” (“Workheld” system) and “communication with experts” (“EvoCall”system). The systems address two different positions: engineer in the repair cen-ter and service technician.
The evaluation interviews show that positive effects can be expected throughthe introduction of the assistance systems, such as a reduction in complexity andan increase in the problem-solving abilities of employees. However, the alreadymentioned necessary preparatory activities, the potential effects on the roles ofthe employees and the associated organizational changes must be highlightedhere. Specifically, when creating videos for the EvoAssist assistance system, itcan be seen that the worker who has to create these instructional videos, on theone hand, needs time resources for this and, on the other hand, does not actuallybenefit from the system, or only indirectly and to a lesser extent (e.g. becausethere are fewer queries to answer by phone). This problem will now be tried tocounteract, in the next steps.

Consideration of Job Satisfaction 365
At the end of the process we will again conduct a survey to determine thestatus of job satisfaction and compare it with the results from the first session,to make a statement about the overall impact of the assistance system on jobsatisfaction of the employees.
5 Summary and Conclusion
In this paper the conception of a work satisfaction framework is presented, whichis used in the context of the development of cognitive and physical assistancesystems in production. It is used in all phases of the project, whereby it is recom-mended to focus on the needs of the workers and to look at the overall system,especially during the requirements analysis. The results obtained so far and theexperience gained from the previous projects FACTS4WORKERS and SCOTTconfirm that the successful introduction of assistance systems must be accom-panied by comprehensive considerations of the organizational and managementframework.
Since workers often are not included in the development of the systems inadvance, negative consequences such as lack of acceptance and the resultingnon-use of the systems can be expected. This relationship clearly points to theimportance of the human-centered design process, involving workers in the devel-opment process. The entire system (including the area “under the water” thatcannot be seen by the developers) can only be visualized by a human-centeredapproach. The main contribution of this paper is to demonstrate a way howsuch human-centered approach can be realized in real-world developments ofindustrial assistant systems.
Acknowledgements. This work was created at the VIRTUAL VEHICLE ResearchGmbH in Graz, Austria. The authors would like to express their gratitude for thesupport of the COMET K2 - Competence Center for Excellent Technologies program ofthe Austrian Ministry for Transport, Innovation and Technology (bmvit), the AustrianMinistry for Digital and Economic Affairs (bmdw), the Austria Research PromotionAgency (FFG) and the Styrian Research Promotion Agency (SFG).
The MMAssist II project is funded as a flagship project by the program “Productionof the Future - 18th Call” of the Austrian Research Promotion Agency (FFG) andthe Austrian Ministry for Transport, Innovation and Technology (bmvit) - (FFG No.:858623).
References
1. Aoyama, M.: Persona-scenario-goal methodology for user-centered requirementsengineering. In: 15th IEEE International Requirements Engineering Conference(RE 2007), pp. 185–194. IEEE (2007)
2. Baethge-Kinsky, V., Tullius, K.: Produktionsarbeit und Kompetenzentwicklungin der Automobilindustrie-was geben flexibel standardisierte Produktionssystemefur den Ein-satz qualifizierter Fachkrafte her. SOFI-Mitteilungen 33(2005), 39–53(2005)

366 S. Damalas et al.
3. Bala, H., Venkatesh, V.: Changes in employees’ job characteristics during an enter-prise system implementation: a latent growth modeling perspective. MIS Q. 37(4)(2013)
4. Cascio, W.F., Montealegre, R.: How technology is changing work and organizations.Ann. Rev. Organ. Psychol. Organ. Behav. 3, 349–375 (2016)
5. Dombrowski, U., Riechel, C., Evers, M.: Industrie 4.0-Die Rolle des Menschen inder vierten industriellen Revolution. Industrie 4, 129–153 (2014)
6. Haase, T., Termath, W., Schumann, M.: Integrierte Lern-und Assistenzsystemefur die Produktion von morgen. Lehren und Lernen fur die moderne Arbeitswelt,Berlin, pp. 183–207 (2015)
7. Hackman, J.R., Oldham, G.R.: Development of the job diagnostic survey. J. Appl.Psychol. 60(2), 159 (1975)
8. Hacker, W.: Allgemeine Arbeitspsychologie. Psychische Regulation von Wissens-,Denk- und korperlicher Arbeit (2., vollst. uberarb. und erg. Aufl.). Huber, Bern(Schriften zur Arbeitspsychologie, 58) (2005)
9. Hannola, L., Lacuera-Perez, F.J., Steinhuser, M., Kokkonen, K., Ojanen, V.,Schafler, M.: An evaluation framework for worker-centric solutions in productionenvironments. In: DEStech Transactions on Engineering and Technology Research(ICPR) (2017)
10. Hardin, E.: Computer automation, work environment, and employee satisfaction:a case study. ILR Rev. 13(4), 559–567 (1960)
11. Herzberg, F., Mausner, B., Snyderman, B.B.: The motivation to work. Wiley, NewYork (1959)
12. Humphrey, S.E., Nahrgang, J.D., Morgeson, F.P.: Integrating motivational, social,and contextual work design features: a meta-analytic summary and theoreticalextension of the work design literature. J. Appl. Psychol. 92(5), 1332 (2007)
13. Karasek Jr., R.A.: Job demands, job decision latitude, and mental strain: implica-tions for job redesign. Adm. Sci. Q. 24, 285–308 (1979)
14. Mital, A., Pennathur, A.: Advanced technologies and humans in manufacturingworkplaces: an interdependent relationship. Int. J. Ind. Ergon. 33(4), 295–313(2004)
15. Morgeson, F.P., Humphrey, S.E.: The work design questionnaire (WDQ): devel-oping and validating a comprehensive measure for assessing job design and thenature of work. J. Appl. Psychol. 91(6), 1321 (2006)
16. Spath, D., Ganschar, O., Gerlach, S., Hammerle, M., Krause, T., Schlund, S.:Pro-duktionsarbeit der Zukunft-Industrie 4.0. D. Spath (Ed.). Fraunhofer Verlag,Stuttgart (2013)
17. Wall, T.D., Corbett, J.M., Clegg, C.W., Jackson, P.R., Martin, R.: Advanced man-ufacturing technology and work design: towards a theoretical framework. J. Organ.Behav. 11(3), 201–219 (1990)

Consideration of Job Satisfaction 367
Open Access This chapter is licensed under the terms of the Creative CommonsAttribution 4.0 International License (http://creativecommons.org/licenses/by/4.0/),which permits use, sharing, adaptation, distribution and reproduction in any mediumor format, as long as you give appropriate credit to the original author(s) and thesource, provide a link to the Creative Commons license and indicate if changes weremade.
The images or other third party material in this chapter are included in thechapter’s Creative Commons license, unless indicated otherwise in a credit line to thematerial. If material is not included in the chapter’s Creative Commons license andyour intended use is not permitted by statutory regulation or exceeds the permitteduse, you will need to obtain permission directly from the copyright holder.

Author Index
Akkaladevi, Sharath Chandra 260
Bacharoudis, Konstantinos 153Basile, Vito 36Behrendt, Wernher 332Brandstötter, Mathias 344Brookes, Harvey 184Brownbill, Robert 140, 168Burroughes, Harry 140
Chaplin, Jack C. 184, 200Cheok, Geraldine S. 108
Dalle Mura, M. 3Damalas, Stelios 358Deinhard, Lisa 276Dini, G. 3
Egger-Lampl, Sebastian 276, 299Erdmann, Arne 220
Fassi, Irene 36Franaszek, Marek 108Fuchsberger, Verena 299
Ganglbauer, Markus 249Gerdenitsch, Cornelia 276, 299
Hofmann, Michael 249, 260Hold, Philipp 235, 276Huang, Jun 93Hutabarat, Windo 140
Ince, Caner-Veli 63
Järvenpää, Eeva 51Ji, Chunqian 93Jiang, Kaiwen 93
Kanso, A. 125Kern, Bettina 276Kirschmann, Moritz A. 220Kittl, Christian 324Kolditz, Torge 63
Lanz, Minna 51, 210Latokartano, Jyrki 210Li, Ruiya 93Liaqat, Amer 184Lyu, Dalong 93
Martínez-Arellano, Giovanna 200Marvel, Jeremy A. 108McNally, Michael J. 200Meneweger, Thomas 299Mörtl, Peter 358Müller, R. 125Müller, Tobias 25
Negri, Simone Pio 36Neuhuber, Norah 358
Paletta, Lucas 310Patten, Timothy 285Pfifer, Harald 81Pham, Duc Truong 93Pichler, Andreas 249, 260Pierer, Jörg 220Pieters, Roel 210Popov, Atanas 153Propst, Matthias 249, 260
Raatz, Annika 63Ratchev, Svetan 81, 153, 184, 200Rathmair, Michael 344Reisinger, Gerhard 235Renghini, Chiara 36Roberts, Adam 168
Sanderson, David 184Saunders, Gordon 25Scalmati, Paolo 36Schmid, Philipp 220Shires, Emma 184Sihn, Wilfried 235Silk, Philip 140Siltala, Niko 51

370 Author Index
Steinecker, Alexander 220Streibl, Markus 324Strohmeier, Felix 332
Thalhammer, Stefan 285Tochev, Emil 81Tscheligi, Manfred 299
Valori, Marcello 36Van Wyk, Karl 108Vette-Steinkamp, M. 125Vincze, Markus 285
Whiteside, Peter 140Wögerer, Christian 249, 260