Taxonomy of cultivated potatoes (Solanum section Petota: Solanaceae)
Upload
independentCategory
view
1download
0
lable at ScienceDirect
Soil Biology & Biochemistry 40 (2008) 2468–2473
Contents lists avai
Soil Biology & Biochemistry
journal homepage: www.elsevier .com/locate/soi lb io
Short communication
Small-scale heterogeneity in carbon dioxide, nitrous oxide and methaneproduction from aggregates of a cultivated sandy-loam soil
Benjamin K. Sey a, Ameur M. Manceur a, Joann K. Whalen a,*,Edward G. Gregorich b, Philippe Rochette c
a Department of Natural Resource Sciences, Macdonald Campus, McGill University, 21,111 Lakeshore Road, Ste-Anne-de-Bellevue, Quebec, Canada H9X 3V9b Agriculture and Agri-Food Canada, Central Experimental Farm, Ottawa, Ontario, Canada K1A 0C6c Agriculture and Agri-Food Canada, 2650 Hochelaga Boulevard, Quebec City, Canada G1V 2J3
a r t i c l e i n f o
Article history:Received 6 February 2008Received in revised form 5 May 2008Accepted 12 May 2008Available online 11 June 2008
Keywords:AcetyleneCarbon dioxideDenitrificationMethaneNitrificationNitrous oxideOxygen diffusionRespirationSoil aggregate fractionSoil gas production
* Corresponding author. Tel.: þ1 514 398 7943; faxE-mail address: [email protected] (J.K. Wha
0038-0717/$ – see front matter � 2008 Elsevier Ltd.doi:10.1016/j.soilbio.2008.05.012
a b s t r a c t
Spatial variability in carbon dioxide (CO2), nitrous oxide (N2O) and methane (CH4) emissions from soil isrelated to the distribution of microsites where these gases are produced. Porous soil aggregates maypossess aerobic and anaerobic microsites, depending on the water content of pores. The purpose of thisstudy was to determine how production of CO2, N2O and CH4 was affected by aggregate size and soilwater content. An air-dry sandy loam soil was sieved to generate three aggregate fractions (<0.25 mm,0.25–2 mm and 2–6 mm) and bulk soil (<2 mm). Aggregate fractions and bulk soil were moistened(60% water-filled pore space, WFPS) and pre-incubated to restore microbial activity, then graduallydried or moistened to 20%, 40%, 60% or 80% WFPS and incubated at 25 �C for 48 h. Soil respirationpeaked at 40% WFPS, presumably because this was the optimum level for heterotrophic microorgan-isms, and at 80% WFPS, which corresponded to the peak N2O production. More CO2 was produced bymicroaggregates (<0.25 mm) than macroaggregate (>0.25 mm) fractions. Incubation of aggregatefractions and soil at 80% WFPS with acetylene (10 Pa and 10 kPa) and without acetylene showed thatdenitrification was responsible for 95% of N2O production from microaggregates, while nitrificationaccounted for 97–99% of the N2O produced by macroaggregates and bulk soil. This suggests that oxygen(O2) diffusion into and around microaggregates was constrained, whereas macroaggregates remainedaerobic at 80% WFPS. Methane consumption and production were measured in aggregates, reaching1.1–6.4 ng CH4–C kg�1 soil h�1 as aggregate fractions and soil became wetter. For the sandy-loam soilstudied, we conclude that nitrification in aerobic microsites contributed importantly to total N2Oproduction, even when the soil water content permitted denitrification and CH4 production in anaer-obic microsites. The relevance of these findings to microbial processes controlling N2O production atthe field scale remains to be confirmed.
� 2008 Elsevier Ltd. All rights reserved.
Soil aggregates are a dynamic component of the soil fabric,formed when soil minerals bind to organic matter and disrupted byerosive forces (wind and water) as well as human activities (e.g.,tillage). Macroaggregates (>0.25 mm diameter) form around plantroots, fungal hyphae and coarse organic fragments. Macroaggre-gates are less structurally stable than microaggregates (<0.25 mmdiameter), which result from clay and silt particles binding toextracellular polysaccharides of microbial origin (Tisdall and Oades,1982). Water and gases circulate through macroaggregates viamacropores (>10 mm diameter), while micropores with diametersless than 10 mm permit the transport of aqueous substances anddiffusion of gases in microaggregates (Jocteur-Monrozier et al.,
: þ1 514 398 7990.len).
All rights reserved.
1991). Although macroaggregates and microaggregates may belocated side by side in soils, they represent distinct microhabitatsand thus contribute to small-scale heterogeneity in microbiallymediated processes.
Information about the distribution and magnitude of microbialactivity within soil aggregates could lead to the identification of‘‘hotspots’’ of CO2, N2O and CH4 production in agricultural fields(Parkin, 1987). However, there is contradictory evidence about theeffect of aggregate size on the production of these greenhousegases. Gupta and Germida (1988) reported less CO2 productionfrom microaggregates than macroaggregates, but the oppositerelation was observed by several authors (Seech and Beauchamp,1988; Beauchamp and Seech, 1990; Drury et al., 2004). Schutter andDick (2002) did not find a relationship between CO2 production,nitrogen mineralization and aggregate size, probably due totemporal variation in substrate availability and microbial biomass
B.K. Sey et al. / Soil Biology & Biochemistry 40 (2008) 2468–2473 2469
within aggregates. Dry-sieved macroaggregates produced less N2Ofrom denitrification than microaggregates (Seech and Beauchamp,1988; Manucharova et al., 2001), but the denitrification rateincreased as the wet-sieved aggregate size increased (Beauchampand Seech, 1990). In contrast, Drury et al. (2004) reported more N2Olost through denitrification in dry-sieved macroaggregates thanmicroaggregates, and the trend was reversed when aggregateswere ground. In rice paddy and marshland soils, macroaggre-gates (0.2–2 mm diameter) produced more CH4 than micro-aggregates (Ramakrishnan et al., 2000; Manucharova et al., 2001).We are not aware of literature that examines how aggregationaffects CH4 production in non-flooded agricultural soils.
The inconsistent relationships between soil aggregate sizes andgreenhouse gas production in the literature may be due to (1)differences in soil microbial communities among aggregate frac-tions (Mummey et al., 2006); (2) unequal concentrations ofmineralizable C and other substrates among aggregate fractions, asdiscussed by Beauchamp and Seech (1990); and (3) soil prepara-tion, aggregate separation methods and the effect of repackingaggregates with similar sizes (Ashman et al., 2003; Uchida et al.,2008). A further challenge is to select an upper size limit formacroaggregates, which varied in diameter from 5 mm (Schutterand Dick, 2002) to 8 mm (Gupta and Germida, 1988; Drury et al.,2004) and 20 mm (Seech and Beauchamp, 1988; Beauchamp andSeech, 1990) in various studies. Artificial and natural macro-aggregates with �8 mm diameter possess anaerobic cores, sur-rounded by an aerobic outer layer with higher potentialnitrification rates (Greenwood and Goodman, 1967; Sexstone et al.,1985; Hoffmann et al., 2007). Such macroaggregates may simul-taneously provide a microhabitat for heterotrophic microorgan-isms and facultative or obligate anaerobes like denitrifiers andmethanogens, depending on substrate availability and O2 diffusionto microbial cells.
The objective of this work was to examine how soil watercontent affected small-scale variation in CO2, N2O and CH4
production associated with macroaggregates (0.25–6 mm) andmicroaggregates (<0.25 mm). We hypothesized that microbiallymediated processes within these aggregates are controlled princi-pally by O2 diffusion through pores when other factors (microbialbiomass, substrate availability and aggregate separation method)were similar.
The soil used in this study was a sandy loam Typic Endoaquentcontaining 700 g sand kg�1 and 160 g clay kg�1 with 15.4 gorganic C kg�1, 1.24 g total N kg�1 and pH 6.1, from the Macdonald
Table 1Gas production during 48 h pre-incubation (n¼ 24; standard error of the mean in bracketsperiod (n¼ 3; standard error of the mean in brackets)
Bulk soil
Gas productiona
CO2–C (mg kg�1 h�1) 0.93 (0.04)aN2O–N (mg kg�1 h�1) 0.53 (0.22)b,cCH4–C (ng kg�1 h�1) 4.3 (0.44)b
Soil analysesa
NO3–N (mg kg�1)b 39.0 (1.5)bNH4–N (mg kg�1)b 3.9 (0.2)bMineral N (mg kg�1)b 42.9 (1.6)bDissolved organic N (mg kg�1)c 9.7 (1.8)a,bMicrobial biomass N (mg kg�1)d 13.9 (1.5)aDissolved organic C (mg kg�1)e 21.8 (1.8)a
a Within a row, values followed by the same letter are not significantly different basedb 0.5 M K2SO4 extracts measured with a flow-injection autoanalyzer (Lachat Instrumenc Alkaline persulfate digest of 0.5 M K2SO4 extract (Cabrera and Beare, 1993).d Chloroform fumigation–direct extraction, followed by alkaline persulfate digestion, ce Wet combustion of 0.5 M K2SO4 extract at 680 �C (Shimadzu TOC-V analyzer, Kyoto,
Research Farm of McGill University, Ste-Anne-de-Bellevue, Quebec,Canada (45�28’ N, 73�45’ W). Soil (0–10 cm depth) was collectedwith a shovel from a cultivated, uncropped buffer (12 m wide)between corn and soybean research plots described by Sey et al.(2008). The buffer was harrowed (10 cm depth) with an offset diskabout six weeks before soil collection in early September 2004.When collected, the soil contained 150 g H2O kg�1. After sieving(<6 mm mesh) in the field, soil was air-dried (20 �C) in the labo-ratory for one week, then spread evenly on top of sieves with 2 mmand 0.25 mm openings, placed in a mechanical rotary sieve andshaken for 30 s to generate three aggregate fractions: 2–6 mm,0.25–2 mm and <0.25 mm. The bulk soil used in this experimentwas also sieved (<2 mm mesh).
The experiment used a factorial design to determine how gasproduction by soil microbiota was affected by two factors: aggre-gate size (2–6 mm, 0.25–2 mm, <0.25 mm and bulk soil (<2 mm))and water content (20%, 40%, 60% and 80% WFPS). Each factorialcombination (4 aggregate sizes� 4 water contents) was replicated12 times, for a total of 192 experimental units. The experimentalunit was a 160-mL serum bottle containing 40 g of air-dry soil oraggregates, moistened to 60% WFPS by misting with distilled waterand gently tapped to achieve a bulk density of 1.1 g cm�3. Fiveempty bottles were also prepared to serve as blanks for theexperiment. Bottles were sealed with a septa and metal cap andpre-incubated at 25 �C for 48 h to re-establish soil microbialactivity. Headspace gas was sampled from half of the bottles(n¼ 96) after 48 h to measure the pulse in gas production thatoccurs when dry soils are rewetted (Godde and Conrad, 1999).
After the pre-incubation period, septa and metal caps wereremoved from all bottles, including blanks. Three replicates fromeach of the 16 factorial treatments (48 bottles) were removed forsoil analysis (Table 1). In the remaining 144 bottles, the watercontent was adjusted gradually (during 1 week) to 20%, 40%, 60% or80% WFPS by air-drying or adding distilled water, based on therelationship:
Mw ¼ DWFPS�Ms ��
rs � rb
rsrb
�(1)
where Mw is the mass of water added or lost through air-drying (g),DWFPS is the difference between the treatment WFPS and theactual WFPS (60%), Ms is the air-dry soil mass (40 g), rb is the soilbulk density (about 1.1 g cm�3, checked by measuring the soilheight and calculating the soil volume within each bottle) and rs isthe soil particle density (2.65 g cm�3). All bottles were then sealed
) and characteristics of bulk soil and aggregate fractions following the pre-incubation
Aggregate fraction
2–6 mm 0.25–2 mm <0.25 mm
0.86 (0.09)a 0.64 (0.02)b 0.75 (0.01)a,b0.96 (0.22)b 0.18 (0.23)c 4.03 (0.74)a0.43 (0.38)c 7.6 (0.41)a 7.8 (0.86)a
52.9 (1.5)a 35.1 (1.8)b,c 30.3 (1.5)c2.7 (0.2)c 6.2 (0.2)a 6.9 (0.2)a
55.6 (1.6)a 41.3 (2.0)b 37.2 (1.6)b6.8 (1.8)b 12.9 (2.2)a,b 16.4 (1.8)a8.3 (1.8)a,b 7.2 (1.8)a,b 4.8 (1.8)b
14.7 (1.8)b 26.2 (3.5)a 21.9 (1.8)a
on a post-hoc Tukey’s HSD test at a¼ 0.05.ts, Milwaukee, WI). Mineral N¼NO3–NþNH4–N.
orrected for extraction efficiency with KEN¼ 0.54 (Brookes et al., 1985).Japan).
B.K. Sey et al. / Soil Biology & Biochemistry 40 (2008) 2468–24732470
with a septa and metal cap. Each factorial treatment (n¼ 16) hadthree replicate bottles without acetylene, three replicate bottleswith 10 Pa (0.01% v v�1) of acetylene and three replicate bottleswith 10 kPa (10% v v�1) of acetylene. For bottles with acetylenetreatment, we first extracted 0.01% or 10% of the air using a gas-tight syringe and injected acetylene to replace the volume of airextracted from the headspace plus soil pore space. All bottles werethen incubated at 25 �C for 48 h before headspace gases weresampled.
Gas samples (20 mL) were taken with a gas-tight syringe,injected into evacuated 12 mL exetainers (Labco, Wycombe, UK)and analyzed with a gas chromatograph (Varian Model 3800,Walnut Creek, CA) equipped with automated valve injectors tosimultaneously quantify CO2, N2O and CH4 concentrations inppm v v�1 units (Rochette and Hutchinson, 2005). The productionof CO2, N2O and CH4 in the headspace was calculated based onHolland et al. (1999), after converting gas concentrations from ppm(equivalent to cm3 m�3) to mass per volume concentrations (d, g ofC or N m�3) with the ideal gas equation and the molecular mass (M,g mol�1) and C or N content (a, g mol�1) of each gas (e.g.,CO2¼12 g C mol�1 CO2):
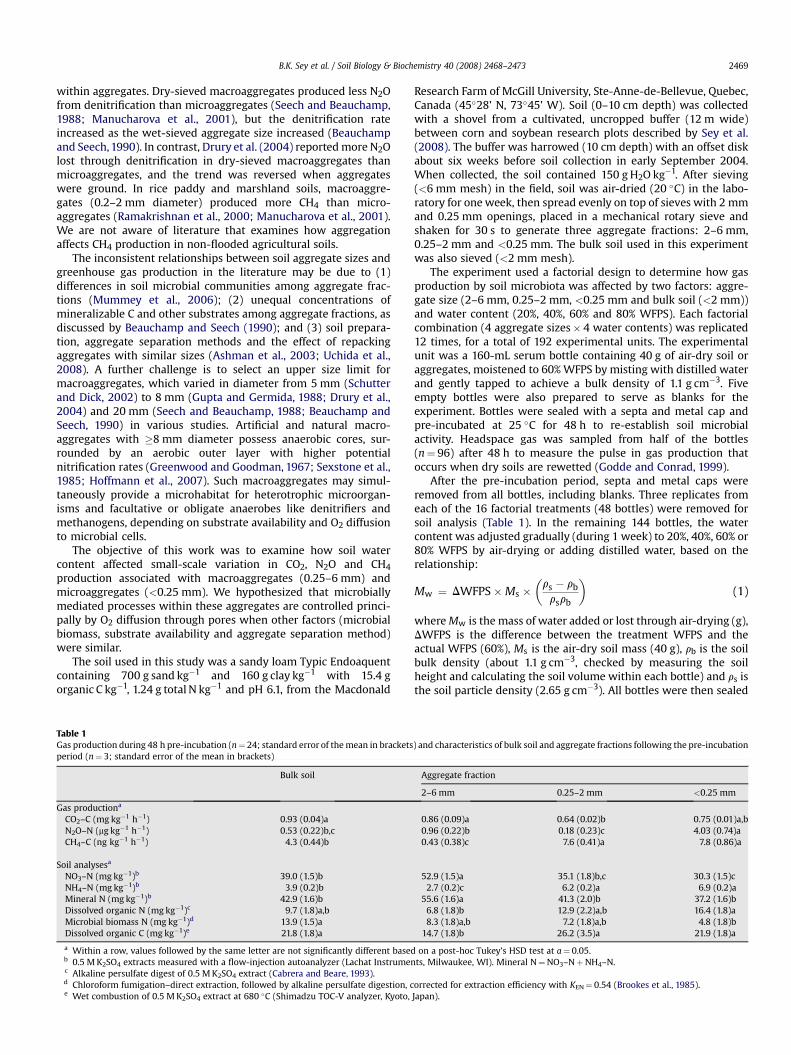
Fig. 1. Carbon dioxide and nitrous oxide production from (A) bulk soil and (B) aggregate framean and standard error (n¼ 3).
d ¼ MaPRT
(2)
where P is atmospheric pressure (z1 atm), R is the ideal gas con-stant (82.06 atm cm3/mol K) and T is the incubation temperature(298 K). Multiplying d (g of C or N m�3) by the headspace volume(z1.24�10�4 m3) gave the mass (C1) of CO2–C, N2O–N or CH4–Cinside the bottle (mg bottle�1) at the end of the incubation. Gasproduction f (i.e., mg CO2–C kg�1 soil h�1) was then estimated as:
f ¼ ðC1 � C0Þðm� tÞ (3)
where C0 is the gas concentration in the blanks, m is the mass of air-dry soil in each bottle (0.04 kg), and t is the incubation period(48 h).
Acetylene added at 10 kPa (10% v v�1) was assumed to inhibitN2O production from nitrification and prevent N2O reduction to N2
(Yoshinari et al., 1977; Davidson et al., 1986; Garrido et al., 2002).The 10 Pa (0.01% v v�1) acetylene treatment was assumed to inhibitnitrification, but not N2O reduction to N2 (Davidson et al., 1986).
ctions, as affected by soil water content (water-filled pore space, WFPS). Values are the
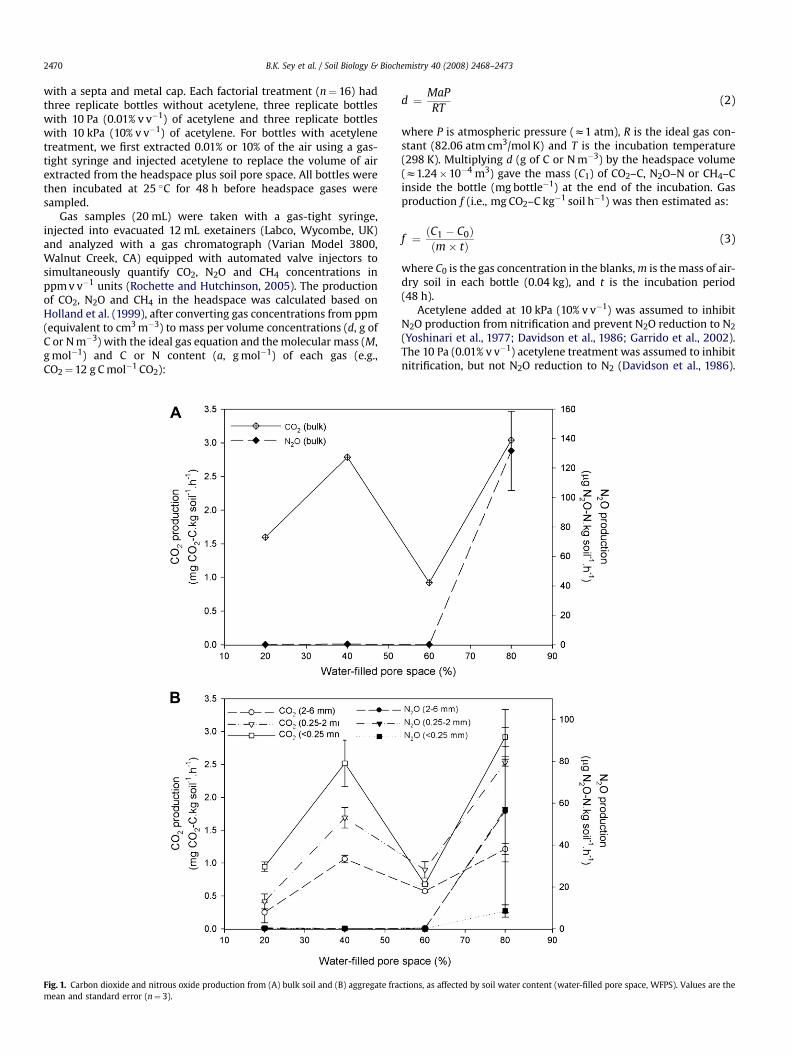
Fig. 2. Nitrous oxide production from denitrification and nitrification processes, de-termined after bulk soil and aggregate fractions were exposed moistened to 80% WFPSand 10 kPa (n¼ 3) or 10 Pa acetylene (n¼ 3) for 48 h. Standard error bars represent thevariation associated with the dominant process that produced N2O in each soilfraction.
B.K. Sey et al. / Soil Biology & Biochemistry 40 (2008) 2468–2473 2471
Production of N2O by the denitrification process was estimatedfrom the N2OþN2 (accumulated as N2O) in the headspace ofbottles treated with 10 kPa acetylene. Production of N2O by thenitrification process was estimated as the difference in N2Oconcentration between bottles treated with 10 Pa acetylene andthose without acetylene addition. Bottles containing bulk soil oraggregate fractions moistened to 20%, 40% or 60% WFPS generatedless than 0.1 ng N2O–N g�1 h�1 when incubated in the presence of10 kPa or 10 Pa of acetylene, so denitrification and nitrificationprocesses were examined in bottles with bulk soil or aggregatefractions moistened to 80% WFPS.
The CO2 and N2O production data were transformed witha (lnþ 1) function, and CH4 production data was transformed witha square root function. The normal distribution and homogeneity ofvariance of the transformed data was verified with a Shapiro–Wilkstest using the PROC UNIVARIATE function of SAS statistical software(version 9.1, SAS Institute Inc., Cary, NC) before proceeding withanalysis of variance (ANOVA). The effect of aggregate size on gasproduction and soil analyses during the pre-incubation period wasevaluated with one-factor ANOVA using the PROC GLM function ofSAS. When treatment effects were significant (P< 0.05), meanswere compared with a post-hoc Tukey’s Honestly SignificantlyDifferent test (Tukey’s HSD) at the 95% confidence level. The effectof aggregate size and soil water content on gas production wastested with two-factor analysis of variance using the PROC MIXEDfunction of SAS with the appropriate random error term. Modelresiduals were normally distributed (PROC UNIVARIATE, Shapiro–Wilks test) and significance tests corrected for heterogeneousvariance (Littell et al., 2006).
Gas production during the pre-incubation period indicateda pulse of microbial activity that produced as much as 0.93 mg CO2–C kg�1h�1, between 0.18 and 4.03 mg N2O–N kg�1 h�1 and up to7.81 ng CH4–C kg�1 h�1 (Table 1). During the pre-incubation, N2Oproduction was evident especially from the <0.25 mm fraction(Table 1). The 2–6 mm fraction produced less CH4 than the bulk soiland aggregate fractions <2 mm (Table 1). At the end of the pre-incubation period, there was more microbial biomass N in bulk soilthan the <0.25 mm fraction, with intermediate microbial biomassN concentrations in the 2–6 mm and 0.25–2 mm fractions (Table 1).
The pre-incubated bulk soil and aggregate fractions contained2.7–6.9 mg NH4–N kg�1 and at least 30 mg NO3–N kg�1 (Table 1).Nitrification is limited when the NH4–N concentration falls below0.5 mg N kg�1 (Garrido et al., 2002), while NO3–N concentrationsless than 20 mg N kg�1 may limit denitrification (Myrold andTiedje, 1985a,b). Hence, nitrification and denitrification processesin bulk soil and aggregate fractions were probably not limited by Nsubstrates. The DOC pool was similar for bulk soil and aggregatefractions <2 mm (Table 1). The DOC pool is related to CO2
production (Seto and Yanagiya, 1983) and the availability of Csubstrates was identified as a limiting factor for nitrification anddenitrification processes (Burford and Bremner, 1975; Myrold andTiedje, 1985a; Seech and Beauchamp, 1988; Stevens et al., 1997). Wesuggest that the available C pool was similar in bulk soil andaggregate fractions <2 mm after the pre-incubation period.
The CO2 production was affected by aggregate size (F3,47¼ 54,P< 0.0001), and was greater from bulk soil than aggregate fractions(Fig. 1a, b). As expected, soil water content affected the CO2 pro-duction (F3,47¼121, P< 0.0001), with peaks at 40% and 80% WFPS(Fig. 1a, b). The relationship between CO2 production and soil watercontent was not consistent with Linn and Doran (1984), whoreported that O2 consumption, CO2 production and nitrification byaerobic microorganisms reached a plateau between 40% and 60%WFPS and declined as soils became progressively more anaerobic.Our results indicate that aerobic microorganisms were most activewithin a narrower range of soil water (around 40% WFPS), possiblybecause O2 diffusion to sites of microbial activity was constrained
as soils became wetter. Skopp et al. (1990) noted that soil respira-tion is optimal near 60% WFPS for many soils, but could be lower ifsoil microbial growth was limited due to insufficient substrates, theremoval of toxic byproducts or by interactions with other micro-biota, e.g., predation or parasitism. The peak in CO2 production at80% WFPS corresponded to an exponential increase in N2O pro-duction, suggesting that CO2 was from the N2O-producing bacteria.
The greatest N2O production was measured at 80% WFPS(Fig. 1a, b), which is consistent with other reports (Linn andDoran, 1984; Myrold and Tiedje, 1985a). When no acetylene wasadded to block N reduction, the <0.25 mm fraction had thelowest N2O production, probably because complete de-nitrification (N2O / N2) occurred in this fraction (Fig. 1b). Whenacetylene was added to block N reduction, total N2O production(from denitrification plus nitrification) was similar among bulksoil and aggregate fractions (F3,11¼1.47, NS), but it was apparentthat denitrification generated most of the N2O produced by the<0.25 mm fraction while nitrification was the dominant processin bulk soil and aggregates >0.25 mm (Fig. 2). One explanation,which is consistent with our hypothesis, is that there was moreO2 diffusion from the headspace into the pores of macroaggre-gates >0.25 mm than microaggregates. Air contained in theheadspace was about 21 kPa O2 during the 48 h incubation. Horn(1994) reported that an artificial sandy-loam soil had an O2
partial pressure of about 7 kPa when the soil water potentialwas �10 kPa. The sandy-loam soil (bulk soil) in this study hada water potential of about �5 kPa at 80% WFPS, so the O2 partialpressure was likely less than 7 kPa, but probably not lower than0.35 kPa, the critical level for nitrification (Khalil et al., 2004). Wecannot rule out the possibility that ammonium oxidizers,denitrifiers and their substrates were spatially segregated,with ammonium oxiders most abundant in macroaggregates(>0.25 mm) and a dominant denitrifier community in micro-aggregates (<0.25 mm). In artificial aggregates, anaerobic zoneswere preferentially colonized by denitrifiers, but the indigenousdenitrifier community was similar at the surface and in the centreof a 30 mm macroaggregate (Philippot et al., 1996). Mummeyet al. (2006) showed that the Gemmatimonadetes and Actino-bacteria subdivision Rubrobacteridae were most abundant withinmicroaggregates, while Acidobacteria were associated with mac-roaggregates (>0.25 mm), but whether these bacteria function asammonium oxiders or denitrifiers was not discussed.
B.K. Sey et al. / Soil Biology & Biochemistry 40 (2008) 2468–24732472
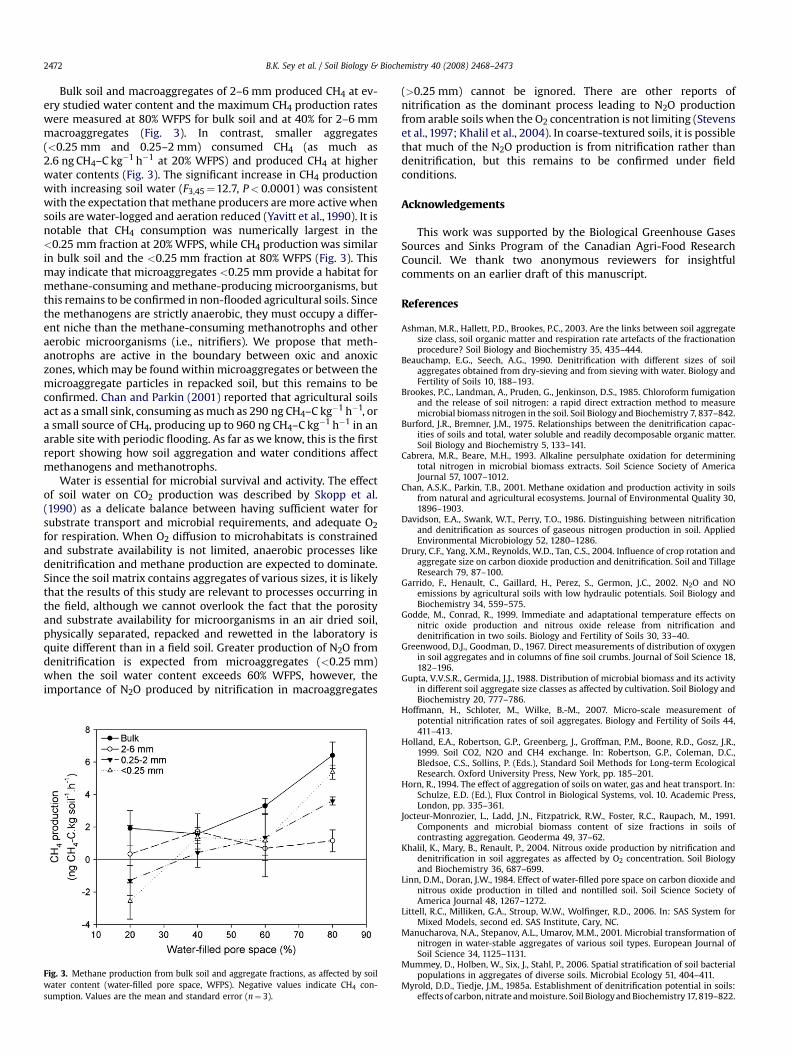
Bulk soil and macroaggregates of 2–6 mm produced CH4 at ev-ery studied water content and the maximum CH4 production rateswere measured at 80% WFPS for bulk soil and at 40% for 2–6 mmmacroaggregates (Fig. 3). In contrast, smaller aggregates(<0.25 mm and 0.25–2 mm) consumed CH4 (as much as2.6 ng CH4–C kg�1 h�1 at 20% WFPS) and produced CH4 at higherwater contents (Fig. 3). The significant increase in CH4 productionwith increasing soil water (F3,45¼12.7, P< 0.0001) was consistentwith the expectation that methane producers are more active whensoils are water-logged and aeration reduced (Yavitt et al., 1990). It isnotable that CH4 consumption was numerically largest in the<0.25 mm fraction at 20% WFPS, while CH4 production was similarin bulk soil and the <0.25 mm fraction at 80% WFPS (Fig. 3). Thismay indicate that microaggregates <0.25 mm provide a habitat formethane-consuming and methane-producing microorganisms, butthis remains to be confirmed in non-flooded agricultural soils. Sincethe methanogens are strictly anaerobic, they must occupy a differ-ent niche than the methane-consuming methanotrophs and otheraerobic microorganisms (i.e., nitrifiers). We propose that meth-anotrophs are active in the boundary between oxic and anoxiczones, which may be found within microaggregates or between themicroaggregate particles in repacked soil, but this remains to beconfirmed. Chan and Parkin (2001) reported that agricultural soilsact as a small sink, consuming as much as 290 ng CH4–C kg�1 h�1, ora small source of CH4, producing up to 960 ng CH4–C kg�1 h�1 in anarable site with periodic flooding. As far as we know, this is the firstreport showing how soil aggregation and water conditions affectmethanogens and methanotrophs.
Water is essential for microbial survival and activity. The effectof soil water on CO2 production was described by Skopp et al.(1990) as a delicate balance between having sufficient water forsubstrate transport and microbial requirements, and adequate O2
for respiration. When O2 diffusion to microhabitats is constrainedand substrate availability is not limited, anaerobic processes likedenitrification and methane production are expected to dominate.Since the soil matrix contains aggregates of various sizes, it is likelythat the results of this study are relevant to processes occurring inthe field, although we cannot overlook the fact that the porosityand substrate availability for microorganisms in an air dried soil,physically separated, repacked and rewetted in the laboratory isquite different than in a field soil. Greater production of N2O fromdenitrification is expected from microaggregates (<0.25 mm)when the soil water content exceeds 60% WFPS, however, theimportance of N2O produced by nitrification in macroaggregates
Fig. 3. Methane production from bulk soil and aggregate fractions, as affected by soilwater content (water-filled pore space, WFPS). Negative values indicate CH4 con-sumption. Values are the mean and standard error (n¼ 3).
(>0.25 mm) cannot be ignored. There are other reports ofnitrification as the dominant process leading to N2O productionfrom arable soils when the O2 concentration is not limiting (Stevenset al., 1997; Khalil et al., 2004). In coarse-textured soils, it is possiblethat much of the N2O production is from nitrification rather thandenitrification, but this remains to be confirmed under fieldconditions.
Acknowledgements
This work was supported by the Biological Greenhouse GasesSources and Sinks Program of the Canadian Agri-Food ResearchCouncil. We thank two anonymous reviewers for insightfulcomments on an earlier draft of this manuscript.
References
Ashman, M.R., Hallett, P.D., Brookes, P.C., 2003. Are the links between soil aggregatesize class, soil organic matter and respiration rate artefacts of the fractionationprocedure? Soil Biology and Biochemistry 35, 435–444.
Beauchamp, E.G., Seech, A.G., 1990. Denitrification with different sizes of soilaggregates obtained from dry-sieving and from sieving with water. Biology andFertility of Soils 10, 188–193.
Brookes, P.C., Landman, A., Pruden, G., Jenkinson, D.S., 1985. Chloroform fumigationand the release of soil nitrogen: a rapid direct extraction method to measuremicrobial biomass nitrogen in the soil. Soil Biology and Biochemistry 7, 837–842.
Burford, J.R., Bremner, J.M., 1975. Relationships between the denitrification capac-ities of soils and total, water soluble and readily decomposable organic matter.Soil Biology and Biochemistry 5, 133–141.
Cabrera, M.R., Beare, M.H., 1993. Alkaline persulphate oxidation for determiningtotal nitrogen in microbial biomass extracts. Soil Science Society of AmericaJournal 57, 1007–1012.
Chan, A.S.K., Parkin, T.B., 2001. Methane oxidation and production activity in soilsfrom natural and agricultural ecosystems. Journal of Environmental Quality 30,1896–1903.
Davidson, E.A., Swank, W.T., Perry, T.O., 1986. Distinguishing between nitrificationand denitrification as sources of gaseous nitrogen production in soil. AppliedEnvironmental Microbiology 52, 1280–1286.
Drury, C.F., Yang, X.M., Reynolds, W.D., Tan, C.S., 2004. Influence of crop rotation andaggregate size on carbon dioxide production and denitrification. Soil and TillageResearch 79, 87–100.
Garrido, F., Henault, C., Gaillard, H., Perez, S., Germon, J.C., 2002. N2O and NOemissions by agricultural soils with low hydraulic potentials. Soil Biology andBiochemistry 34, 559–575.
Godde, M., Conrad, R., 1999. Immediate and adaptational temperature effects onnitric oxide production and nitrous oxide release from nitrification anddenitrification in two soils. Biology and Fertility of Soils 30, 33–40.
Greenwood, D.J., Goodman, D., 1967. Direct measurements of distribution of oxygenin soil aggregates and in columns of fine soil crumbs. Journal of Soil Science 18,182–196.
Gupta, V.V.S.R., Germida, J.J., 1988. Distribution of microbial biomass and its activityin different soil aggregate size classes as affected by cultivation. Soil Biology andBiochemistry 20, 777–786.
Hoffmann, H., Schloter, M., Wilke, B.-M., 2007. Micro-scale measurement ofpotential nitrification rates of soil aggregates. Biology and Fertility of Soils 44,411–413.
Holland, E.A., Robertson, G.P., Greenberg, J., Groffman, P.M., Boone, R.D., Gosz, J.R.,1999. Soil CO2, N2O and CH4 exchange. In: Robertson, G.P., Coleman, D.C.,Bledsoe, C.S., Sollins, P. (Eds.), Standard Soil Methods for Long-term EcologicalResearch. Oxford University Press, New York, pp. 185–201.
Horn, R., 1994. The effect of aggregation of soils on water, gas and heat transport. In:Schulze, E.D. (Ed.), Flux Control in Biological Systems, vol. 10. Academic Press,London, pp. 335–361.
Jocteur-Monrozier, L., Ladd, J.N., Fitzpatrick, R.W., Foster, R.C., Raupach, M., 1991.Components and microbial biomass content of size fractions in soils ofcontrasting aggregation. Geoderma 49, 37–62.
Khalil, K., Mary, B., Renault, P., 2004. Nitrous oxide production by nitrification anddenitrification in soil aggregates as affected by O2 concentration. Soil Biologyand Biochemistry 36, 687–699.
Linn, D.M., Doran, J.W., 1984. Effect of water-filled pore space on carbon dioxide andnitrous oxide production in tilled and nontilled soil. Soil Science Society ofAmerica Journal 48, 1267–1272.
Littell, R.C., Milliken, G.A., Stroup, W.W., Wolfinger, R.D., 2006. In: SAS System forMixed Models, second ed. SAS Institute, Cary, NC.
Manucharova, N.A., Stepanov, A.L., Umarov, M.M., 2001. Microbial transformation ofnitrogen in water-stable aggregates of various soil types. European Journal ofSoil Science 34, 1125–1131.
Mummey, D., Holben, W., Six, J., Stahl, P., 2006. Spatial stratification of soil bacterialpopulations in aggregates of diverse soils. Microbial Ecology 51, 404–411.
Myrold, D.D., Tiedje, J.M., 1985a. Establishment of denitrification potential in soils:effects of carbon, nitrate and moisture. Soil Biology and Biochemistry 17, 819–822.
B.K. Sey et al. / Soil Biology & Biochemistry 40 (2008) 2468–2473 2473
Myrold, D.D., Tiedje, J.M., 1985b. Diffusional constraints on denitrification in soil.Soil Science Society of America Journal 49, 651–657.
Parkin, T.B., 1987. Soil microsites as a source of denitrification variability. SoilScience Society of America Journal 51, 1194–1199.
Philippot, L., Renault, P., Sierra, J., Henault, C., Clays-Josserand, A., Chenu, C.,Chaussod, R., Lensi, R., 1996. Dissimilatory nitrite-reductase provides a com-petitive advantage to Pseudomonoas sp. RTC01 to colonize the centre of soilaggregates. FEMS Microbiology Ecology 21, 175–185.
Ramakrishnan, B., Lueders, T., Conrad, R., Friedrich, M., 2000. Effect of soil aggregatesize on methanogenesis and archaeal community structure in anoxic rice fieldsoil. FEMS Microbiology Ecology 32, 261–270.
Rochette, P., Hutchinson, G.L., 2005. Measuring soil respiration using chambertechniques. In: Hatfield, J., Baker, J.M. (Eds.), Micrometerology in AgriculturalSystems. Agronomy Monographs 47. Agronomy Society of America, Madison,WI, USA, pp. 247–286.
Schutter, M.E., Dick, R.P., 2002. Microbial community profiles and activities amongaggregates of winter fallow and cover-cropped soil. Soil Science Society ofAmerica Journal 66, 142–153.
Seech, A.G., Beauchamp, E.G., 1988. Denitrification in soil aggregates of differentsizes. Soil Science Society of America Journal 52, 1616–1621.
Seto, M., Yanagiya, K., 1983. Rate of carbon dioxide evolution from soil in relation totemperature and amount of dissolved organic carbon. Japanese Journal ofEcology 33, 199–206.
Sexstone, A.J., Revsbech, N.P., Parkin, T.P., Tiedje, J.M., 1985. Direct measurement ofoxygen profiles and denitrification rates in soil aggregates. Soil Science Societyof America Journal 49, 645–651.
Sey, B.K., Whalen, J.K., Gregorich, E.G., Rochette, P., Cue, R.I., 2008. Carbon dioxideand nitrous oxide content in soils under corn and soybean. Soil Science Societyof America Journal 72, 931–938.
Skopp, J., Jawson, M.D., Doran, J.W., 1990. Steady-state aerobic microbial activity asa function of soil water content. Soil Science Society of America Journal 54,1619–1625.
Stevens, R.J., Laughlin, R.J., Burns, L.C., Arah, J.R.M., Hood, R.C., 1997. Measuring thecontributions of nitrification and denitrification to the flux of nitrous oxidefrom soil. Soil Biology and Biochemistry 29, 139–151.
Tisdall, J.M., Oades, J.M., 1982. Organic matter and water-stable aggregates. Journalof Soil Science 33, 141–163.
Uchida, Y., Clough, T.J., Kelliher, F.M., Sherlock, R.R., 2008. Effects of aggregate size,soil compaction and bovine urine on N2O emissions from a pasture soil. SoilBiology and Biochemistry 40, 924–931.
Yavitt, J.B., Downey, D.M., Lang, G.E., Sexstone, A.J., 1990. Methane consumption intwo temperate forest soils. Biogeochemistry 9, 39–52.
Yoshinari, T., Hynes, R., Knowles, R., 1977. Acetylene inhibition of nitrous oxidereduction and measurement of denitrification and nitrogen fixation in soil. SoilBiology and Biochemistry 9, 177–183.
Copyright © 2022 FDOKUMEN