Extractive Industries in Arid and Semi-Arid Zones - IUCN Portal
Upload
independentCategory
view
1download
0
The contribution of agricultural practices to nitrous oxideemissions in semi-arid Mali
J . Dick1 , B. Kaya
2 , M. Soutoura3 , U. Skiba
1 , R. Smith1 , A. N iang
2 & R. Tabo4
1Centre for Ecology and Hydrology, Edinburgh, Bush Estate, Penicuik, EH26 0QB, UK, 2ICRAF Sahel Program, The World
Agroforestry Centre, PO Box 320, Bamako, Mali, 3Institut d’Economie Rurale, BP258, Rue Mohamed V, Bamako, Mali, and4International Crops Research Institute for the Semi Arid Tropics, ICRISAT Niamey, PO Box 12404, Niamey, Niger
Abstract
The yield and flux of nitrous oxide (N2O) emitted from continuous cereals (with and without urea),
legumes ⁄ cereal in rotation and cereal ⁄ legume in rotation all with or without organic manure was moni-
tored from January 2004 to February 2005. All treatments except continuous cereals had phosphate
added. The cereal grown July–October in 2003 and 2004 was pearl millet (Pennisetum glaucum) and the
legume was a bean (Phaseolus vulgaris). The 10 m · 10 m plots were established in a semi-arid climate
in Mali. The addition of organic manure and both inorganic fertilizers increased yield and N2O emis-
sions. Continuous cereals treated with both organic manure and urea emitted significantly less N2O
(882 g N ⁄ha per year) than plots receiving no organic manure(1535 g N ⁄ha per year). Growing N-fixing
crops in rotation did not significantly increase N2O emissions. This study supports the new practice of
growing cereal and legumes in rotation as an environmentally sustainable system in semi-arid Mali.
Keywords: Crop yield, nitrous oxide, semi-arid soils, Africa, manure, tillage, on farm experiment
Introduction
The emission of greenhouse gases, and their implications for
global warming, are important in the desert margins of
Africa where climatic variability is particularly critical for
livelihoods (Sanchez, 2000). Since 1988, the Intergovernmen-
tal Panel on Climate Change (IPCC) has reviewed scientific
research and provided governments with summaries and
advice on climate problems. This Panel has consistently
called for additional information, especially from developing
countries, in order to make more accurate predictions (IPCC,
2001; Ringius, 2002). Data are necessary to formulate sensi-
ble mitigation and adaptation policies, and to allow Africa
to take advantage of the international funds established to
support such policies (Beg et al., 2002; Bouwnam et al.,
2002; Niles et al., 2002; Ringius, 2002; Dessai & Schipper,
2003).
There are a few reported studies of greenhouse gas
emissions from soil in Africa. but most studies have either
measured emission rates in the laboratory from soil collected
in African countries (Dick et al., 2001, 2006) or measured
emissions in the field for short periods (Leroux et al., 1995;
Cofer et al., 1996; Levine et al., 1996; Zepp et al., 1996;
Scholes et al., 1997; Serca et al., 1998; Otter et al., 1999;
Andersson et al., 2002).
The prediction that the African agricultural sector will
become more intensive through the use of biological nitro-
gen-fixing crops either in agroforestry systems, improved fal-
lows or by the use of leguminous crops in rotation has led to
the suggestion that the continent may become a larger emit-
ter of nitrous oxide (N2O) (Bagayoko et al., 2000; Alvey
et al., 2001; Sanginga, 2003). Short-term laboratory studies
have suggested that while the use of nitrogen-fixing trees in
African plantations does increase N2O emissions by up to
four times (Dick et al., 2001), the same is not true for nitro-
gen-fixing crops (Dick et al., 2006). Long-term greenhouse
gas monitoring studies of the new agricultural rotations
in situ have not been reported.
The aim of this study was to determine the difference in
N2O emissions from field plots of continuous cereals, the
most common land use in the parklands of Mali, and plots
of the cereal ⁄ legume rotations recommended by regional
researchers (Bationo et al., 1998; Bagayoko et al., 2000).
The effects of adding organic manure and urea applied at
Correspondence: J. Dick. E-mail: [email protected]
Received May 2008; accepted after revision May 2008
Editor: Bryan Davies
Soil Use and Management, September 2008, 24, 292–301 doi: 10.1111/j.1475-2743.2008.00163.x
292 ª 2008 The Authors. Journal compilation ª 2008 British Society of Soil Science

commonly recommended rates were also monitored because
they are known to increase N2O emissions (Skiba et al.,
1998; Martin-Olmedo & Rees, 1999; Vallejo et al., 2005).
Materials and methods
Study area
The site selected was close to the village of Siribougou,
35 km from the town of Segou and about 250 km northeast
of the Mali capital, Bamako. At the site the Tropical Soil
Biology and Fertility Programme has sponsored a long-term
experiment investigating improved water and nutrient man-
agement technology to sustain food production and reduce
degradation in Sub-Saharan Africa. Three cropping systems
were selected for this study (continuous cereals, legume ⁄ cerealand cereal ⁄ legume in rotation) and the effects of both
organic manure (8000 kg dry matter ⁄ha) urea (50 kg ⁄ha)and 20 kg phosphate ⁄ha) were monitored. Three farm fields
were selected within a 500 m2 area. The soils were typical
alfisols with a sandy texture derived from polycycled and
preweathered Continental Terminal sandstone bedrocks The
organic matter content in the upper horizon (0–20 cm) is
typically less than 0.5%. Each field was subdivided into
10 m · 10 m plots and one treatment randomly assigned to
each plot. The legume ⁄ cereal rotation treatment commenced
with the legume crop planted in July 2003 and the cereal
planted the following July 2004, while the plots allocated to
the cereal ⁄ legume rotation treatment were planted with the
cereal in 2003 and the legume crop in 2004. The land was
extensively grazed by cows, sheep and goats during the dry
seasons of both years (May–September). N2O emissions were
monitored from January 2004 to February 2005.
The cereal grown in both years was pearl millet (Pennisetum
glaucum) and the legume haricot beans (Phaseolus vulgaris).
The pearl millet sown was a local variety improved at the
Cinzana research station (Mali) named ‘Totoniou’. It is
adapted for low rainfall (400–800 mm) and has a growth cycle
of 100–110 days. The yield potential is 2000 kg ⁄ha. The hari-
cot beans selected was an improved variety (IT89KD-245)
from IITA, Nigeria locally called ‘Sangaraka’. It is adapted to
low rainfall (400–800 mm) with a growth cycle of 75–85 days.
This variety has a yield potential of 1500–2000 kg ⁄ha and a
residue fodder yield potential of 2000 kg ⁄ha. Crops were
harvested and grain weights determined by ICRAF.
Dry organic and inorganic fertilizer was spread by hand
between 8 and 12 July 2004. Organic fertilizer (cow dung
and goat ⁄ sheep droppings, collected during the dry season)
was spread at a rate of 8000 kg dry matter ⁄ha and mineral
fertilizer was spread at a rate of 50 kg urea ⁄ha and 20 kg
phosphate ⁄ha. All plots were ploughed by oxen following
manure application (10–14 July 2004) and the crop was sown
by hand immediately after cultivation Throughout this paper
continuous cereals cropping is denoted by Cer and the rota-
tion treatments are denoted by the order of the rotation,
i.e. CerLeg denotes the plots were sown with cereal in 2003
and leguminous crop in 2004. The additions of organic fer-
tilizer, urea and phosphate are denoted by M, N and P
respectively.
Nitrous oxide emissions
The measurement of emissions was established in two phases.
Sixteen circular chambers (2 farms · 8 treatments) con-
structed of stainless steel (40 cm depth and 40 cm diameter)
with a 3 cm flange were dug into the ground in January 2004
each enclosing an area of 0.126 m2. A third field was
included in February 2004 giving a total of 24 chambers (3
replicates · 8 treatments). The chambers remained in place
throughout the measurement period except when the land
was cultivated. They were replaced following cultivation and
as near to the original position as possible. A secure fitting
lid (43 cm diameter with 35 mm self adhesive draught)
was held by four to six bulldog clips creating an airtight seal
during measuring events.
Air samples (12 mL) were extracted from the headspace of
the chamber (25.4 ± 0.5 L) via a 2 cm hole in the lid fitted
with a grommet and a three-way air tight tap. Duplicate
samples were collected monthly (after 1 h closure) during the
dry season and more frequently during the wet season in
evacuated glass vials (839 ⁄WGL; Labco Exetainer, Bucking-
hamshire, UK). Ambient air samples (2 per farm) were col-
lected when sealing the chambers. Air temperature inside the
chambers was recorded before closing and after opening.
The samples were analysed at CEH Edinburgh within
5–10 days of collection. N2O concentration was determined
using electron capture gas chromatography (Crompack
CP9000A, London, UK). The N2O flux was calculated as the
product of the increase in N2O concentration above ambient
air and the volume of the headspace divided by the time the
chamber was sealed and the soil surface area. The annual
emissions were calculated from the arithmetic mean flux of
the first 15 measurements (between January 2004 and
January 2005) and converted to g N ⁄ha per year.
Soil respiration
Carbon dioxide emission from the soil was measured once in
January 2004 within 1–2 m of the chambers (2 per chamber),
using the PP System EGM2 Soil Respiration probe – 8.
Soil analysis
Five soil samples (0–10 cm) were taken from around each of
the 24 chamber sites in January 2004 (middle of dry season).
The samples were air dried and bulked before analysis at
CEH Edinburgh, by standard methods for soil NH4+ and
NO3) extracted in 1 m KCl (Crooke & Simpson, 1971;
N2O emissions in Mali 293
ª 2008 The Authors. Journal compilation ª 2008 British Society of Soil Science, Soil Use and Management, 24, 292–301
Henriksen & Slemar-Olsen, 1970). Loss on ignition (LOI)
was used to determine soil carbon (C) (Rowell, 1994).
Statistical analysis
As the experiment was not balanced, a one-way ANOVA
with a block effect (Field) and a treatment effect with levels
to model the eight individual treatment combinations allows
the use of contrasts (linear combinations of the treatment
factor levels). These estimate individual effects and provide
tests of statistical significance (Genstat 8, VSN International
Ltd, Hemel Hempstead, UK). The contrasts use all the infor-
mation available, e.g. for cereal, the cereal-only data are
combined with data from the cereal in rotation plots. When
necessary, data were log-transformed to meet assumptions of
normal distribution and homogeneity of variance.
Results
Grain yield
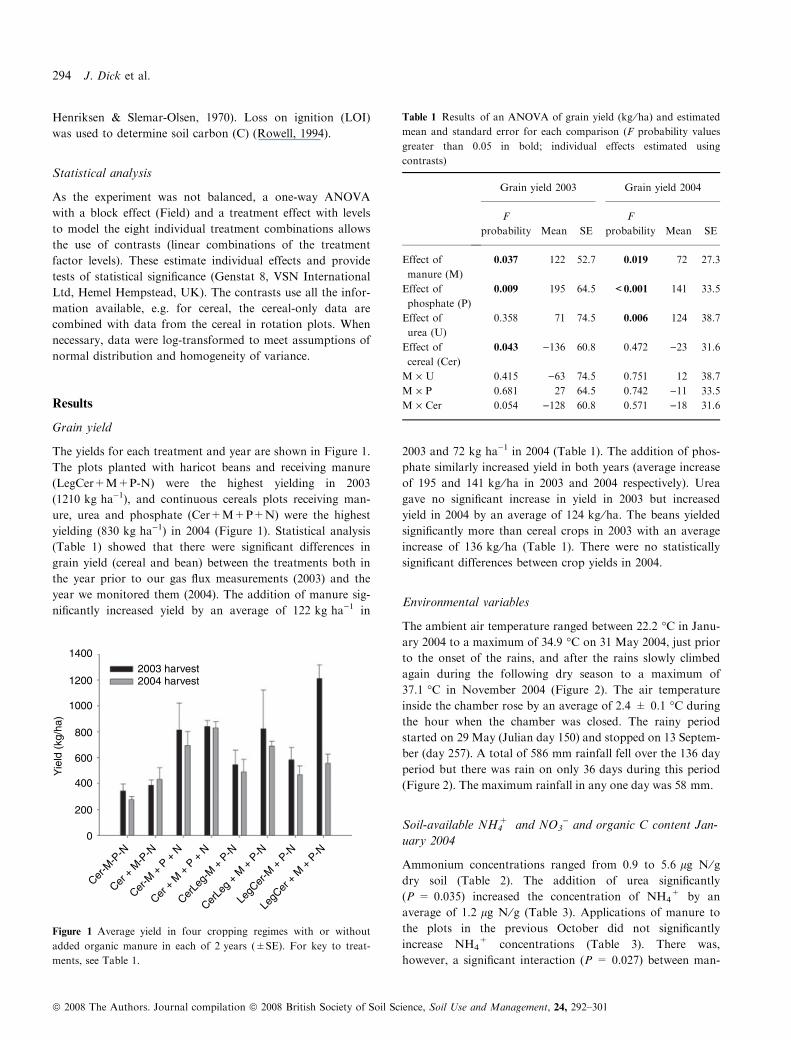
The yields for each treatment and year are shown in Figure 1.
The plots planted with haricot beans and receiving manure
(LegCer+M+P-N) were the highest yielding in 2003
(1210 kg ha)1), and continuous cereals plots receiving man-
ure, urea and phosphate (Cer+M+P+N) were the highest
yielding (830 kg ha)1) in 2004 (Figure 1). Statistical analysis
(Table 1) showed that there were significant differences in
grain yield (cereal and bean) between the treatments both in
the year prior to our gas flux measurements (2003) and the
year we monitored them (2004). The addition of manure sig-
nificantly increased yield by an average of 122 kg ha)1 in
2003 and 72 kg ha)1 in 2004 (Table 1). The addition of phos-
phate similarly increased yield in both years (average increase
of 195 and 141 kg ⁄ha in 2003 and 2004 respectively). Urea
gave no significant increase in yield in 2003 but increased
yield in 2004 by an average of 124 kg ⁄ha. The beans yielded
significantly more than cereal crops in 2003 with an average
increase of 136 kg ⁄ha (Table 1). There were no statistically
significant differences between crop yields in 2004.
Environmental variables
The ambient air temperature ranged between 22.2 �C in Janu-
ary 2004 to a maximum of 34.9 �C on 31 May 2004, just prior
to the onset of the rains, and after the rains slowly climbed
again during the following dry season to a maximum of
37.1 �C in November 2004 (Figure 2). The air temperature
inside the chamber rose by an average of 2.4 ± 0.1 �C during
the hour when the chamber was closed. The rainy period
started on 29 May (Julian day 150) and stopped on 13 Septem-
ber (day 257). A total of 586 mm rainfall fell over the 136 day
period but there was rain on only 36 days during this period
(Figure 2). The maximum rainfall in any one day was 58 mm.
Soil-available NH4+ and NO3
) and organic C content Jan-
uary 2004
Ammonium concentrations ranged from 0.9 to 5.6 lg N ⁄ gdry soil (Table 2). The addition of urea significantly
(P = 0.035) increased the concentration of NH4+ by an
average of 1.2 lg N ⁄ g (Table 3). Applications of manure to
the plots in the previous October did not significantly
increase NH4+ concentrations (Table 3). There was,
however, a significant interaction (P = 0.027) between man-
1400
2003 harvest2004 harvest
Yie
ld (
kg/h
a)
1200
1000
800
600
400
200
0
Cer-M
-P-N
Cer +
M-P
-N
Cer-M
+ P
+ N
Cer +
M +
P +
N
CerLe
g-M
+ P
-N
CerLe
g +
M +
P-N
LegC
er +
M +
P-N
LegC
er-M
+ P
-N
Figure 1 Average yield in four cropping regimes with or without
added organic manure in each of 2 years (±SE). For key to treat-
ments, see Table 1.
Table 1 Results of an ANOVA of grain yield (kg ⁄ ha) and estimated
mean and standard error for each comparison (F probability values
greater than 0.05 in bold; individual effects estimated using
contrasts)
Grain yield 2003 Grain yield 2004
F
probability Mean SE
F
probability Mean SE
Effect of
manure (M)
0.037 122 52.7 0.019 72 27.3
Effect of
phosphate (P)
0.009 195 64.5 <0.001 141 33.5
Effect of
urea (U)
0.358 71 74.5 0.006 124 38.7
Effect of
cereal (Cer)
0.043 )136 60.8 0.472 )23 31.6
M · U 0.415 )63 74.5 0.751 12 38.7
M · P 0.681 27 64.5 0.742 )11 33.5
M · Cer 0.054 )128 60.8 0.571 )18 31.6
294 J. Dick et al.
ª 2008 The Authors. Journal compilation ª 2008 British Society of Soil Science, Soil Use and Management, 24, 292–301

ure and urea application. The plots receiving both manure
and urea had a lower ()1.2 lg N ⁄ g dry soil) than expected
NH4+ concentration. A similar trend in NO3
) concentra-
tions was observed but was not statistically significant
(Table 3). Nitrate concentrations ranged from 0.51 to
3.47 lg N ⁄ g dry soil (Table 2). There was no significant
treatment effect on soil C. Organic carbon as measured by
LOI, was low in all soils (0.16–0.20% C).
Soil respiration and nitrous oxide emissions January 2004
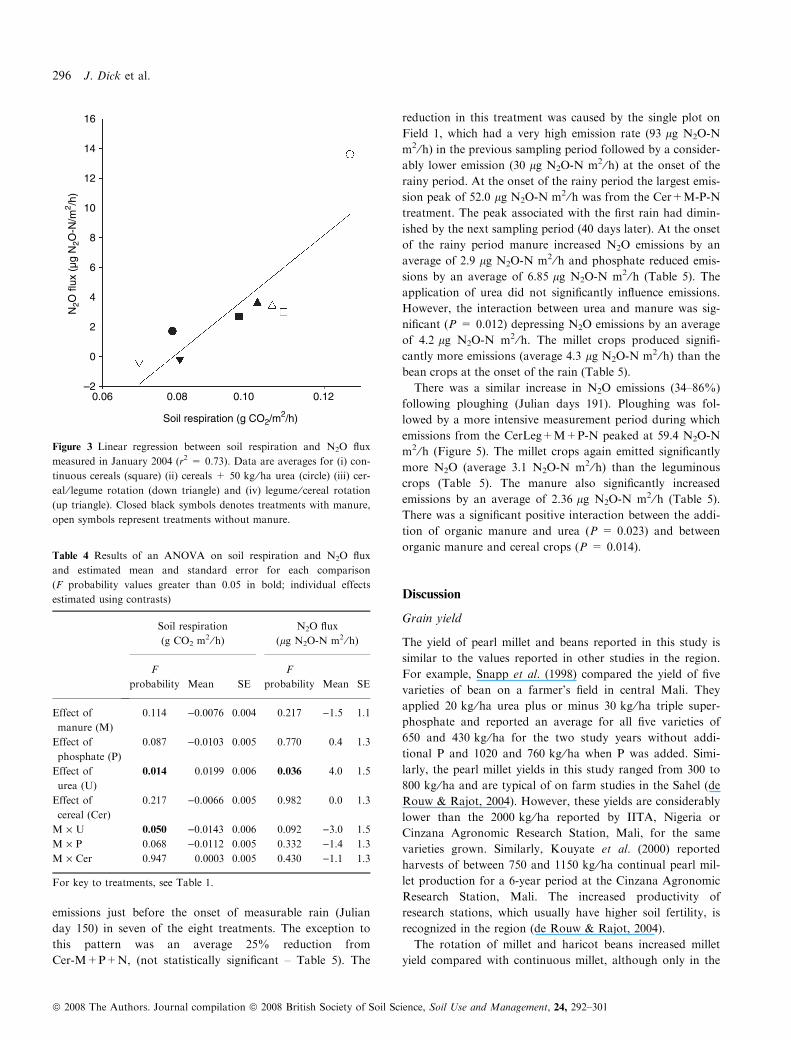
There was a direct relationship (P = 0.007) between soil res-
piration and N2O flux during the dry season in January 2004
(Figure 3). The plots treated with urea and phosphate (Cer-
M+P+N) produced the highest flux of both N2O and CO2.
There was a significant residual effect of the urea applied in
July 2003 on both N2O and CO2 emissions (Table 4). On
average, the addition of urea increased N2O and CO2 emis-
sions by 4.0 lg N2O-N m2 ⁄h and 0.012 g CO2 m2 ⁄h respec-
tively. There was also a significant interaction (P = 0.05)
between the plots which had received urea and organic man-
ure with the addition of manure significantly depressing soil
respiration (Table 4). N2O flux was also lower but the inter-
action term was only significant at the 0.1% probability level.
There was a significant linear relationship between mineral
N and C content of soil and the flux of both CO2 and N2O
(Figure 4). The relationship between N2O flux and soil N
and C was strongly influenced by the cereal plus urea treat-
ment (Cer-M+P+N). In January 2004, a high emission of
both CO2 and N2O was associated with large total nitrogen
and C content in the soil.
Nitrous oxide flux measurements
All treatments had broadly similar patterns of N2O emissions
during the year (Figure 5). There were increases (45–80%) in
40(a)
(b)
35
30
25
20
50
40
30
20
10
050 100 150 200 250 300 350 400
Julian days
Rai
nfal
l (m
m)
Tem
pera
ture
(°C
)
Figure 2 Air temperature at each of the 16 sampling periods and the
daily rainfall pattern in 2004.
Table 2 Mean and standard error of ammonium and nitrate concen-
trations and carbon content of soil samples (0–10 cm) taken in Janu-
ary 2004 around each of the 24 nitrous oxide flux monitoring
chambers
Manure Treatment code
NH4+
(lg N ⁄ gdry soil)
NO3)
(lg N ⁄ gdry soil) LOI (%)
Mean SE Mean SE Mean SE
No
manure
Cer-M-P-N 1.09 0.27 1.26 0.40 0.16 0.013
Cer-M+P+N 5.62 2.56 3.47 1.47 0.18 0.017
CerLeg-M+P-N 0.86 0.41 0.51 1.72 0.14 0.021
LegCer-M+P-N 1.96 0.22 2.20 0.16 0.18 0.008
Organic
manure
Cer+M-P-N 2.42 0.05 2.33 0.07 0.19 0.017
Cer+M+P+N 1.14 0.21 0.71 0.08 0.16 0.013
CerLeg+M+P-N 1.28 0.46 0.52 0.25 0.16 0.015
LegCer+M+P-N 1.98 0.20 1.82 0.29 0.20 0.023
LOI, loss on ignition. For key to treatments, see Table 1.
Table 3 Results of an ANOVA on NH4+ and NO3
) concentrations
in soil estimated mean and standard error for each comparison
(F probability values greater than 0.05 in bold; individual effects
estimated using contrasts)
NH4+ NO3
)
F
probability Mean SE
F
probability Mean SE
Effect of
manure (M)
0.269 )0.40 0.35 0.475 )0.21 0.28
Effect of
phosphate (P)
0.595 0.23 0.43 0.489 )0.25 0.35
Effect of
urea (U)
0.035 1.16 0.49 0.072 0.79 0.40
Effect of
cereal (Cer)
0.671 0.17 0.40 0.28 )0.37 0.33
M · U 0.027 )1.23 0.49 0.108 )0.69 0.40
M · P 0.071 )0.84 0.43 0.103 )0.61 0.35
M · Cer 0.796 )0.11 0.40 0.674 )0.14 0.33
N2O emissions in Mali 295
ª 2008 The Authors. Journal compilation ª 2008 British Society of Soil Science, Soil Use and Management, 24, 292–301
emissions just before the onset of measurable rain (Julian
day 150) in seven of the eight treatments. The exception to
this pattern was an average 25% reduction from
Cer-M+P+N, (not statistically significant – Table 5). The
reduction in this treatment was caused by the single plot on
Field 1, which had a very high emission rate (93 lg N2O-N
m2 ⁄h) in the previous sampling period followed by a consider-
ably lower emission (30 lg N2O-N m2 ⁄h) at the onset of the
rainy period. At the onset of the rainy period the largest emis-
sion peak of 52.0 lg N2O-N m2 ⁄h was from the Cer+M-P-N
treatment. The peak associated with the first rain had dimin-
ished by the next sampling period (40 days later). At the onset
of the rainy period manure increased N2O emissions by an
average of 2.9 lg N2O-N m2 ⁄h and phosphate reduced emis-
sions by an average of 6.85 lg N2O-N m2 ⁄h (Table 5). The
application of urea did not significantly influence emissions.
However, the interaction between urea and manure was sig-
nificant (P = 0.012) depressing N2O emissions by an average
of 4.2 lg N2O-N m2 ⁄h. The millet crops produced signifi-
cantly more emissions (average 4.3 lg N2O-N m2 ⁄h) than the
bean crops at the onset of the rain (Table 5).
There was a similar increase in N2O emissions (34–86%)
following ploughing (Julian days 191). Ploughing was fol-
lowed by a more intensive measurement period during which
emissions from the CerLeg+M+P-N peaked at 59.4 N2O-N
m2 ⁄h (Figure 5). The millet crops again emitted significantly
more N2O (average 3.1 N2O-N m2 ⁄h) than the leguminous
crops (Table 5). The manure also significantly increased
emissions by an average of 2.36 lg N2O-N m2 ⁄h (Table 5).
There was a significant positive interaction between the addi-
tion of organic manure and urea (P = 0.023) and between
organic manure and cereal crops (P = 0.014).
Discussion
Grain yield
The yield of pearl millet and beans reported in this study is
similar to the values reported in other studies in the region.
For example, Snapp et al. (1998) compared the yield of five
varieties of bean on a farmer’s field in central Mali. They
applied 20 kg ⁄ha urea plus or minus 30 kg ⁄ha triple super-
phosphate and reported an average for all five varieties of
650 and 430 kg ⁄ha for the two study years without addi-
tional P and 1020 and 760 kg ⁄ha when P was added. Simi-
larly, the pearl millet yields in this study ranged from 300 to
800 kg ⁄ha and are typical of on farm studies in the Sahel (de
Rouw & Rajot, 2004). However, these yields are considerably
lower than the 2000 kg ⁄ha reported by IITA, Nigeria or
Cinzana Agronomic Research Station, Mali, for the same
varieties grown. Similarly, Kouyate et al. (2000) reported
harvests of between 750 and 1150 kg ⁄ha continual pearl mil-
let production for a 6-year period at the Cinzana Agronomic
Research Station, Mali. The increased productivity of
research stations, which usually have higher soil fertility, is
recognized in the region (de Rouw & Rajot, 2004).
The rotation of millet and haricot beans increased millet
yield compared with continuous millet, although only in the
16
14
12
10
8
6
4
2
0
–20.06 0.08 0.10 0.12
Soil respiration (g CO2/m2/h)
N2O
flux
(µg
N2O
-N/m
2 /h)
Figure 3 Linear regression between soil respiration and N2O flux
measured in January 2004 (r2 = 0.73). Data are averages for (i) con-
tinuous cereals (square) (ii) cereals + 50 kg ⁄ ha urea (circle) (iii) cer-
eal ⁄ legume rotation (down triangle) and (iv) legume ⁄ cereal rotation(up triangle). Closed black symbols denotes treatments with manure,
open symbols represent treatments without manure.
Table 4 Results of an ANOVA on soil respiration and N2O flux
and estimated mean and standard error for each comparison
(F probability values greater than 0.05 in bold; individual effects
estimated using contrasts)
Soil respiration
(g CO2 m2 ⁄ h)
N2O flux
(lg N2O-N m2 ⁄ h)
F
probability Mean SE
F
probability Mean SE
Effect of
manure (M)
0.114 )0.0076 0.004 0.217 )1.5 1.1
Effect of
phosphate (P)
0.087 )0.0103 0.005 0.770 0.4 1.3
Effect of
urea (U)
0.014 0.0199 0.006 0.036 4.0 1.5
Effect of
cereal (Cer)
0.217 )0.0066 0.005 0.982 0.0 1.3
M · U 0.050 )0.0143 0.006 0.092 )3.0 1.5
M · P 0.068 )0.0112 0.005 0.332 )1.4 1.3
M · Cer 0.947 0.0003 0.005 0.430 )1.1 1.3
For key to treatments, see Table 1.
296 J. Dick et al.
ª 2008 The Authors. Journal compilation ª 2008 British Society of Soil Science, Soil Use and Management, 24, 292–301

first year was the increase statistically significant. This
increase accords with that reported in Mali over an 8-year
period (Kouyate et al., 2000). As in our study the authors
found annual variation resulting in cereal grain yield
increases ranging from )2% to 92% depending on growing
conditions. Similarly, manure and N and P has been found
to significantly increase yields of both pearl millet and hari-
cot beans in semi-arid parts of the region (Snapp et al., 1998;
de Rouw & Rajot, 2004).
Field trace gas fluxes
Nitrous oxide production is controlled by many factors
which either directly or indirectly influence nitrifying and
denitrifying bacteria (Potter et al., 1996; Freney, 1997). In
our study, rainfall, manure, urea, phosphate and tillage
affected N2O emission. It is well known that manure and
inorganic fertilizers increase N2O emissions (Skiba et al.,
1997; Pinto et al., 2004; Vinther et al., 2004). In this study
manure increased both grain yield (42% in 2003 and 30% in
2004) and N2O emissions (15% in 2004). The increase in
yields and N2O emissions was associated with increased total
N content of the soils (Davidson, 1991; Skiba et al., 1998;
Diez et al., 2004).
Although the main factors influencing N2O production
were as expected, an interaction between manure and inor-
ganic fertilizers was not expected. The statistical analysis
indicates that the application of urea, phosphate and manure
together significantly reduced the emissions of N2O, soil res-
piration rates and soil-available NH4+ in the dry season fol-
lowing application. This finding is counterintuitive and at
variance with other studies which have combined manure
and inorganic fertilizers (Dittert et al., 2005). The mechanism
responsible for this effect is not clear. One study conducted
on a low organic C agricultural soil (0.8%) in Spain also
reported that the application of a range of organic fertilizers
resulted in lower emissions of N2O and NO, compared to
emissions from adjacent soils only treated with urea (Vallejo
et al., 2005). The authors suggested that the addition of eas-
ily decomposable C compounds favours complete denitrifica-
tion to N2 and therefore reduced the emissions of N2O and
NO. Another possible explanation is that the simultaneous
addition of easily available C and N to a soil deficient in C
and N was more efficiently immobilized by the existing
microbial biomass than when N alone was applied. This
mechanism is supported by the decrease in soil respiration
rate measured in the same treatment. Further work would be
needed to decide between these two hypotheses. It should be
borne in mind that as the organic matter was collected dur-
ing the dry season little loss of C or N would have occurred
prior to spreading.
The rates of soil respiration measured in January 2004
were typically low and similar to those reported by Hall
et al. (2006) for the same time of year in a continuous
cropped plot in Mali. A recent review of CO2 efflux from
soils distinguished five important biogenic sources: root res-
piration, rhizo-microbial, decomposition of plant residues,
the priming effect induced by root exudation and basal
(a) (b)
(c) (d) 0.16
0.14
0.12
0.10
0.08
0.06
0.16
0.14
0.12
0.10
0.08
0.06
r2 = 0.89
P = 0.0002
r2 = 0.56
P = 0.019
r2 = 0.75 P = 0.003
r2 = 0.41
P = 0.052
Total mineral N (µg N/g dry soil)
µg
N2O
-N/m
2 /hg
CO
2/m
2 /h
g C
O2/
m2 /h
0 2 4 6 8 10 12 14
Total mineral N (µg N/g dry soil)
0 2 4 6 8 10 12 14
16
14
12
10
8
6
4
2
0
–2
% Carbon (LOI)
0.15 0.200.19 0.18 0.17 0.16
% Carbon (LOI)
0.15 0.20 0.19 0.18 0.17 0.16
µg
N2O
-N/m
2 /h
16
14
12
10
8
6
4
2
0
–2
Figure 4 Linear regressions between mineral
nitrogen and carbon content of soil and
N2O (a, b) and CO2 flux measured in
January 2004 (c, d). Data are averages for
(i) continuous cereals (square) (ii) cereal +
50 kg ⁄ ha urea (circle) (iii) cereal ⁄ legume
rotation (down triangle) and (iv) legume ⁄cereal rotation (up triangle). Closed black
symbols represent treatments with manure,
open symbols represent treatments without
manure.
N2O emissions in Mali 297
ª 2008 The Authors. Journal compilation ª 2008 British Society of Soil Science, Soil Use and Management, 24, 292–301

respiration produced by microbial decomposition of soil
organic matter (Kuzyakov, 2006). In our study the latter
source is considered the most important as there was extre-
mely sparse vegetation cover at the end of the dry season.
Pulsing effect
Biogeochemical cycles in arid and semi-arid ecosystems
depend upon the ability of soil microbes to respond to the sud-
den availability of resources. Brief periods of high activity gen-
erally occur after precipitation that provides access to
nutrients for soil organisms. Such a stimulation of N2O emis-
sions, known as the ‘Birch effect’ (Birch, 1958) or ‘pulsing’, is
caused by the reactivation of water-stressed bacteria following
a dry period which readily decomposes and mineralizes the
labile organic matter fraction in the soil. There was an increase
(45–80%) in N2O emission at the onset of the rains. Such an
increase in emissions following wetting and drying cycles in
African soils has been measured in many studies both in the
laboratory and in the field with natural rainfall events and arti-
ficial irrigation (Scholes et al., 1997; Dick et al., 2001, 2006;
Andersson et al., 2002; Breuer et al., 2002).
The magnitude of emission prior to the pulse was similar
to that measured by Andersson et al. (2002) in Ghana during
the dry season in January (0–1.56 lg N2O-N m2 ⁄h) com-
pared with )0.2 to 3.4 lg N2O-N m2 ⁄h for most of the treat-
ments in this study. As for all nitrogen-cycling processes,
the spatial heterogeneity of nitrogen flux from terrestrial
ecosystems is large (Smith et al., 1994; Leroux et al., 1995;
Christensen et al., 1996; Lafolie et al., 2005).
Tillage effect
Similar to the effect of rainfall, N2O emissions increased by
34–86% following soil tillage. The release of N2O following
ploughing has been observed in several studies (Skiba et al.,
1992, 2002; Estavillo et al., 2002; Vellinga et al., 2004). It is
believed that when soil is disturbed by tillage, organically
bound C and N are released, providing substrates for nitri-
fying and denitrifying micro-organisms (Skiba et al., 2002;
Pinto et al., 2004).
Annual emissions
Compared to continuous millet with no additional fertilizer
(595 g N2O-N ⁄ha per year) we found a 158% increase in
annual N2O emission (Table 6) from continuous cereals with
added urea (1535 g N2O-N ⁄ha per year) and a 63% increase
60 (a)
(b)
(c)
(d)
40
20
0
µg
N2O
-N/m
2 /hµ
g N
2O-N
/m2 /h
µg N
2O-N
/m2 /h
µg N
2O-N
/m2 /h
20
0
60
40
20
0
60
40
20
0
0 60 120 180 240 300 360
LegCer + M + P-NLegCer-M + P-N
CerLeg + M + P-NCerLeg-M + P-N
Cer + M + P + NCer-M + P + N
Cer + M-P-NCer-M-P-N
420
Julian day
60
40
Figure 5 Emission of N2O from four cropping treatments (for key
to treatments see Table 1), with and without manure application
(open and closed symbol respectively). Onset of measurable rains
denoted by broken arrow and the solid arrows denote when the
fields were ploughed (tilled).
Table 5 Results of an ANOVA on N2O flux (lg N2O-N m2 ⁄ h) at
the onset of the rains (Julian day 150) and immediately following
ploughing (Julian day 191) and manure application – estimated mean
and standard error for each comparison (F probability values greater
than 0.005 in bold; individual effects estimated using contrasts)
Rainfall Tillage ⁄manure
F
probability Mean SE
F
probability Mean SE
Effect of
manure (M)
0.014 2.9 0.8 0.033 2.4 0.9
Effect of
phosphate (P)
<0.0001 )6.8 0.9 0.260 1.4 1.2
Effect of
urea (U)
0.589 0.6 1.1 0.100 )2.4 1.3
Effect of
cereal (Cer)
0.005 4.3 0.9 0.019 3.1 1.1
M · U 0.012 )4.2 1.1 0.023 3.6 1.3
M · P 0.001 )6.3 0.9 0.232 1.5 1.2
M · Cer 0.787 0.3 0.9 0.014 3.3 1.1
For key to treatments, see Table 1.
298 J. Dick et al.
ª 2008 The Authors. Journal compilation ª 2008 British Society of Soil Science, Soil Use and Management, 24, 292–301
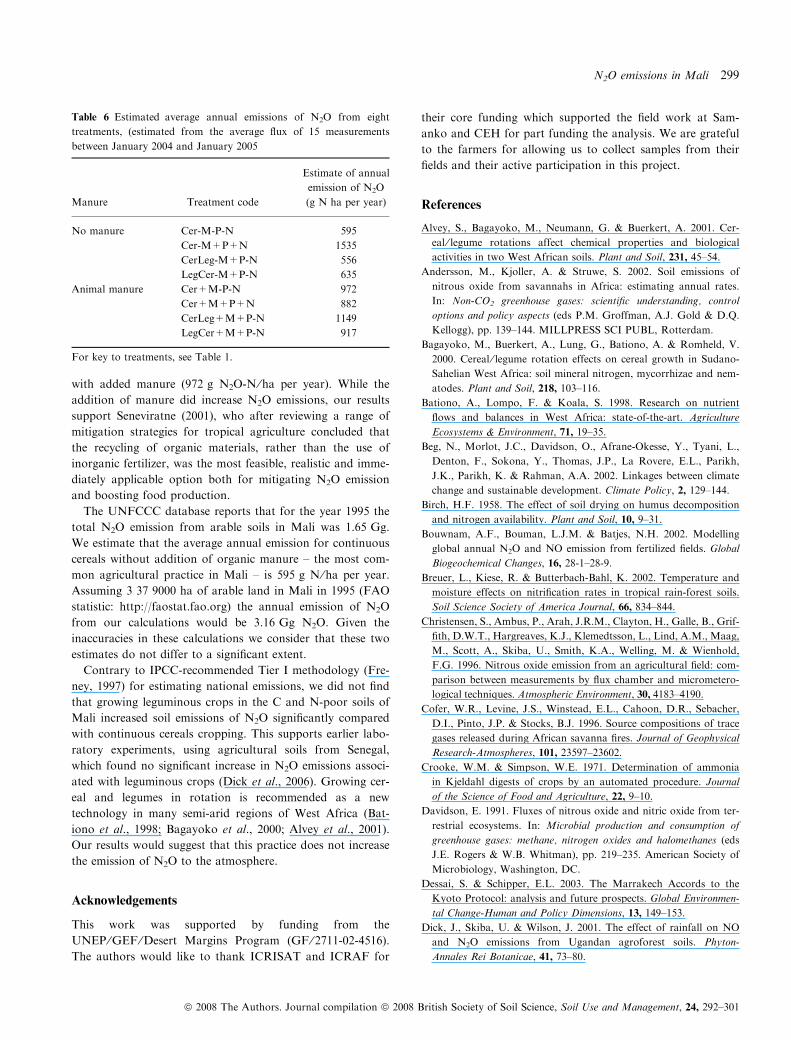
with added manure (972 g N2O-N ⁄ha per year). While the
addition of manure did increase N2O emissions, our results
support Seneviratne (2001), who after reviewing a range of
mitigation strategies for tropical agriculture concluded that
the recycling of organic materials, rather than the use of
inorganic fertilizer, was the most feasible, realistic and imme-
diately applicable option both for mitigating N2O emission
and boosting food production.
The UNFCCC database reports that for the year 1995 the
total N2O emission from arable soils in Mali was 1.65 Gg.
We estimate that the average annual emission for continuous
cereals without addition of organic manure – the most com-
mon agricultural practice in Mali – is 595 g N ⁄ha per year.
Assuming 3 37 9000 ha of arable land in Mali in 1995 (FAO
statistic: http://faostat.fao.org) the annual emission of N2O
from our calculations would be 3.16 Gg N2O. Given the
inaccuracies in these calculations we consider that these two
estimates do not differ to a significant extent.
Contrary to IPCC-recommended Tier I methodology (Fre-
ney, 1997) for estimating national emissions, we did not find
that growing leguminous crops in the C and N-poor soils of
Mali increased soil emissions of N2O significantly compared
with continuous cereals cropping. This supports earlier labo-
ratory experiments, using agricultural soils from Senegal,
which found no significant increase in N2O emissions associ-
ated with leguminous crops (Dick et al., 2006). Growing cer-
eal and legumes in rotation is recommended as a new
technology in many semi-arid regions of West Africa (Bat-
iono et al., 1998; Bagayoko et al., 2000; Alvey et al., 2001).
Our results would suggest that this practice does not increase
the emission of N2O to the atmosphere.
Acknowledgements
This work was supported by funding from the
UNEP ⁄GEF ⁄Desert Margins Program (GF ⁄ 2711-02-4516).The authors would like to thank ICRISAT and ICRAF for
their core funding which supported the field work at Sam-
anko and CEH for part funding the analysis. We are grateful
to the farmers for allowing us to collect samples from their
fields and their active participation in this project.
References
Alvey, S., Bagayoko, M., Neumann, G. & Buerkert, A. 2001. Cer-
eal ⁄ legume rotations affect chemical properties and biological
activities in two West African soils. Plant and Soil, 231, 45–54.
Andersson, M., Kjoller, A. & Struwe, S. 2002. Soil emissions of
nitrous oxide from savannahs in Africa: estimating annual rates.
In: Non-CO2 greenhouse gases: scientific understanding, control
options and policy aspects (eds P.M. Groffman, A.J. Gold & D.Q.
Kellogg), pp. 139–144. MILLPRESS SCI PUBL, Rotterdam.
Bagayoko, M., Buerkert, A., Lung, G., Bationo, A. & Romheld, V.
2000. Cereal ⁄ legume rotation effects on cereal growth in Sudano-
Sahelian West Africa: soil mineral nitrogen, mycorrhizae and nem-
atodes. Plant and Soil, 218, 103–116.
Bationo, A., Lompo, F. & Koala, S. 1998. Research on nutrient
flows and balances in West Africa: state-of-the-art. Agriculture
Ecosystems & Environment, 71, 19–35.
Beg, N., Morlot, J.C., Davidson, O., Afrane-Okesse, Y., Tyani, L.,
Denton, F., Sokona, Y., Thomas, J.P., La Rovere, E.L., Parikh,
J.K., Parikh, K. & Rahman, A.A. 2002. Linkages between climate
change and sustainable development. Climate Policy, 2, 129–144.
Birch, H.F. 1958. The effect of soil drying on humus decomposition
and nitrogen availability. Plant and Soil, 10, 9–31.
Bouwnam, A.F., Bouman, L.J.M. & Batjes, N.H. 2002. Modelling
global annual N2O and NO emission from fertilized fields. Global
Biogeochemical Changes, 16, 28-1–28-9.
Breuer, L., Kiese, R. & Butterbach-Bahl, K. 2002. Temperature and
moisture effects on nitrification rates in tropical rain-forest soils.
Soil Science Society of America Journal, 66, 834–844.
Christensen, S., Ambus, P., Arah, J.R.M., Clayton, H., Galle, B., Grif-
fith, D.W.T., Hargreaves, K.J., Klemedtsson, L., Lind, A.M., Maag,
M., Scott, A., Skiba, U., Smith, K.A., Welling, M. & Wienhold,
F.G. 1996. Nitrous oxide emission from an agricultural field: com-
parison between measurements by flux chamber and micrometero-
logical techniques. Atmospheric Environment, 30, 4183–4190.
Cofer, W.R., Levine, J.S., Winstead, E.L., Cahoon, D.R., Sebacher,
D.I., Pinto, J.P. & Stocks, B.J. 1996. Source compositions of trace
gases released during African savanna fires. Journal of Geophysical
Research-Atmospheres, 101, 23597–23602.
Crooke, W.M. & Simpson, W.E. 1971. Determination of ammonia
in Kjeldahl digests of crops by an automated procedure. Journal
of the Science of Food and Agriculture, 22, 9–10.
Davidson, E. 1991. Fluxes of nitrous oxide and nitric oxide from ter-
restrial ecosystems. In: Microbial production and consumption of
greenhouse gases: methane, nitrogen oxides and halomethanes (eds
J.E. Rogers & W.B. Whitman), pp. 219–235. American Society of
Microbiology, Washington, DC.
Dessai, S. & Schipper, E.L. 2003. The Marrakech Accords to the
Kyoto Protocol: analysis and future prospects. Global Environmen-
tal Change-Human and Policy Dimensions, 13, 149–153.
Dick, J., Skiba, U. & Wilson, J. 2001. The effect of rainfall on NO
and N2O emissions from Ugandan agroforest soils. Phyton-
Annales Rei Botanicae, 41, 73–80.
Table 6 Estimated average annual emissions of N2O from eight
treatments, (estimated from the average flux of 15 measurements
between January 2004 and January 2005
Manure Treatment code
Estimate of annual
emission of N2O
(g N ha per year)
No manure Cer-M-P-N 595
Cer-M+P+N 1535
CerLeg-M+P-N 556
LegCer-M+P-N 635
Animal manure Cer+M-P-N 972
Cer+M+P+N 882
CerLeg+M+P-N 1149
LegCer+M+P-N 917
For key to treatments, see Table 1.
N2O emissions in Mali 299
ª 2008 The Authors. Journal compilation ª 2008 British Society of Soil Science, Soil Use and Management, 24, 292–301
Dick, J., Skiba, U., Munro, R. & Deans, J.D. 2006. Effect of
N-fixing trees and crops on NO and N2O emissions from Senegal-
ese soils. Journal of Biogeography, 33, 416–423.
Diez, J.A., Hernaiz, P., Munoz, M.J., de la Torre, A. & Vallejo, A.
2004. Impact of pig slurry on soil properties, water salinization,
nitrate leaching and crop yield in a four-year experiment in Cen-
tral Spain. Soil Use and Management, 20, 444–450.
Dittert, K., Lampe, C., Gasche, R., Butterbach-Bahl, K., Wachendorf,
M., Papen, H., Sattelmacher, B. & Taube, F. 2005. Short-term
effects of single or combined application of mineral N fertilizer and
cattle slurry on the fluxes of radiatively active trace gases from grass-
land soil. Soil Biology & Biochemistry, 37, 1665–1674.
Estavillo, J.M., Merino, P., Pinto, M., Yamulki, S., Gebauer, G.,
Sapek, A. & Corre, W. 2002. Short term effect of ploughing a
permanent pasture on N2O production from nitrification and
denitrification. Plant and Soil, 239, 253–265.
Freney, J.R. 1997. Emission of nitrous oxide from soils used for
agriculture. Nutrient Cycling in Agroecosystems, 49, 1–6.
Hall, N.M., Kaya, B., Dick, J., Skiba, U., Niang, A. & Tabo, R.
2006. Effect of improved fallow on crop productivity, soil fertility
and climate-forcing gas emissions in semi-arid conditions. Biology
and Fertility of Soils, 42, 224–230.
Henriksen, A. & Slemar-Olsen, A.R. 1970. Automatic methods for
determining nitrate and nitrite in water and soil extracts. Analyst,
95, 514–518.
IPCC. 2001. The scientific basis. Cambridge University Press,
Cambridge.
Kouyate, Z., Franzluebbers, K., Juo, A.S.R. & Hossner, L.R. 2000.
Tillage, crop residue, legume rotation, and green manure effects
on sorghum and millet yields in the semiarid tropics of Mali. Plant
and Soil, 225, 141–151.
Kuzyakov, Y. 2006. Sources of CO2 efflux from soil and review of
partitioning methods. Soil Biology & Biochemistry, 38, 425–448.
Lafolie, F.O., Renault, P., Dudal, Y., Debroux, M., Haudin, C.S.,
Dassonville, F., Pautremat, N., Cannavo, P., Hdadi, K., Sevenier,
G. & Mohrath, D. 2005. Composition of soil and soil water:
effects of microbial activities and microbial transfers. La Houille
Blanche – Revue internationale de l’eau, 3, 24–32.
Leroux, X., Abbadie, L., Lensi, R. & Serca, D. 1995. Emission of
nitrogen monoxide from African tropical ecosystems – control of
emission by soil characteristics in humid and dry savannas of West
Africa. Journal of Geophysical Research-Atmospheres, 100, 23133–
23142.
Levine, J.S., Winstead, E.L., Parsons, D.A.B., Scholes, M.C., Scho-
les, R.J., Cofer, W.R., Cahoon, D.R. & Sebacher, D.I. 1996. Bio-
genic soil emissions of nitric oxide (NO) and nitrous oxide (N2O)
from savannas in South Africa: the impact of wetting and burning.
Journal of Geophysical Research-Atmospheres, 101, 23689–23697.
Martin-Olmedo, P. & Rees, R.M. 1999. Short-term N availability in
response to dissolved-organic- carbon from poultry manure, alone
or in combination with cellulose. Biology and Fertility of Soils, 29,
386–393.
Niles, J.O., Brown, S., Pretty, J., Ball, A.S. & Fay, J. 2002. Potential
carbon mitigation and income in developing countries from
changes in use and management of agricultural and forest lands.
Philosophical Transactions of The Royal Society of London Series
A. Mathematical Physical and Engineering Sciences, 360, 1621–
1639.
Otter, L.B., Yang, W.X., Scholes, M.C. & Meixner, F.X. 1999.
Nitric oxide emissions from a southern African savanna. Journal
of Geophysical Research-Atmospheres, 104, 18471–18485.
Pinto, M., Merino, P., del Prado, A., Estavillo, J.M., Yamulki, S.,
Gebauer, G., Piertzak, S., Lauf, J. & Oenema, O. 2004. Increased
emissions of nitric oxide and nitrous oxide following tillage of a
perennial pasture. Nutrient Cycling in Agroecosystems, 70, 13–22.
Potter, C.S., Matson, P.A., Vitousek, P.M. & Davidson, E.A. 1996.
Process modeling of controls on nitrogen trace gas emissions from
soils worldwide. Journal of Geophysical Research-Atmospheres,
101, 1361–1377.
Ringius, L. 2002. Soil carbon sequestration and the CDM: opportu-
nities and challenges for Africa. Climatic Change, 54, 471–495.
de Rouw, A. & Rajot, J.L. 2004. Nutrient availability and pearl mil-
let production in Sahelian farming systems based on manuring or
fallowing. Agriculture Ecosystems & Environment, 104, 249–262.
Rowell, D.L. 1994. Soil science: methods and applications. Pearson
Education Ltd., Essex, UK.
Sanchez, P.A. 2000. Linking climate change research with food secu-
rity and poverty reduction in the tropics. Agriculture, Ecosystems
& Environment, 82, 371–383.
Sanginga, N. 2003. Role of biological nitrogen fixation in legume
based cropping systems; a case study of West Africa farming sys-
tems. Plant and Soil, 252, 25–39.
Scholes, M.C., Martin, R., Scholes, R.J., Parsons, D. & Winstead,
E. 1997. NO and N2O emissions from savanna soils following the
first simulated rains of the season. Nutrient Cycling in Agroecosys-
tems, 48, 115–122.
Seneviratne, G. 2001. Mitigating nitrous oxide emission in tropical
agriculture: myths and realities. Current Science, 80, 117–118.
Serca, D., Delmas, R., Le Roux, X., Parsons, D.A.B., Scholes,
M.C., Abbadie, L., Lensi, R., Ronce, O. & Labroue, L. 1998.
Comparison of nitrogen monoxide emissions from several African
tropical ecosystems and influence of season and fire. Global Bio-
geochemical Cycles, 12, 637–651.
Skiba, U., Hargreaves, K.J., Fowler, D. & Smith, K.A. 1992. Fluxes
of nitric and nitrous oxides from agricultural soils in a cool tem-
perate climate. Atmospheric Environment Part a-General Topics,
26, 2477–2488.
Skiba, U., Fowler, D. & Smith, K.A. 1997. Nitric oxide emissions
from agricultural soils in temperate and tropical climates: sources,
controls and mitigation options. Nutrient Cycling in Agroecosys-
tems, 48, 139–153.
Skiba, U.M., Sheppard, L.J., MacDonald, J. & Fowler, D. 1998.
Some key environmental variables controlling nitrous oxide emis-
sions from agricultural and semi-natural soils in Scotland. Atmo-
spheric Environment, 32, 3311–3320.
Skiba, U., van Dijk, S. & Ball, B.C. 2002. The influence of tillage on
NO and N2O fluxes under spring and winter barley. Soil Use and
Management, 18, 340–345.
Smith, K.A., Clayton, H., Arah, J.R.M., Christensen, S., Ambus, P.,
Fowler, D., Hargreaves, K.J., Skiba, U., Harris, G.W., Wienhold,
F.G., Klemedtsson, L. & Galle, B. 1994. Micrometeorological and
chamber methods for measurement of nitrous-oxide fluxes between
soils and the atmosphere – overview and conclusions. Journal of
Geophysical Research-Atmospheres, 99, 16541–16548.
Snapp, S., Aggarwal, V. & Chirwa, R. 1998. Note on phosphorus
and cultivar enhancement of biological nitrogen fixation and
300 J. Dick et al.
ª 2008 The Authors. Journal compilation ª 2008 British Society of Soil Science, Soil Use and Management, 24, 292–301
productivity of maize ⁄ bean intercrops in Malawi. Field Crops
Research, 58, 205–212.
Vallejo, A., Garcia-Torres, L., Diez, J.A., Arce, A. & Lopez-Fernan-
dez, S. 2005. Comparison of N losses (NO3), N2O, NO) from sur-
face applied, injected or amended (DCD) pig slurry of an irrigated
soil in a Mediterranean climate. Plant and Soil, 272, 313–325.
Vellinga, T.V., van den Pol-van Dasselaar, A. & Kuikman, P.J. 2004.
The impact of grassland ploughing on CO2 and N2O emissions in
the Netherlands. Nutrient Cycling in Agroecosystems, 70, 33–45.
Vinther, P.F., Hansen, E.M. & Olesen, J.E. 2004. Effects of plant
residues on crop performance, N mineralisation and microbial
activity including field CO2 and N2O fluxes in unfertilised crop
rotations. Nutrient Cycling in Agroecosystems, 70, 189–199.
Zepp, R.G., Miller, W.L., Burke, R.A., Parsons, D.A.B. & Scho-
les, M.C. 1996. Effects of moisture and burning on soil-atmo-
sphere exchange of trace carbon gases in a southern African
savanna. Journal of Geophysical Research-Atmospheres, 101,
23699–23706.
N2O emissions in Mali 301
ª 2008 The Authors. Journal compilation ª 2008 British Society of Soil Science, Soil Use and Management, 24, 292–301
Copyright © 2022 FDOKUMEN