Nanopore Characterization and Optical Modeling of Transparent Polycrystalline Alumina

Sa
AMa
Pb
c
S
a
ARRA
KNPCX
1
ctncew(maaio
do
0d
Materials Chemistry and Physics 131 (2011) 362–369
Contents lists available at SciVerse ScienceDirect
Materials Chemistry and Physics
journa l homepage: www.e lsev ier .com/ locate /matchemphys
mall-angle X-ray scattering (SAXS) study of porous anodic alumina—A newpproach
bdul Waheeda, Mazhar Mehmooda,∗, Robert Benfieldb, Jamil Ahmada, Heinz Amenitschc,uhammad Aslama, Abdur Raufa, Mujtabaul Hassana
National Centre for Nanotechnology & Department of Metallurgy and Materials Engineering & Department of Physics and Applied Mathematics,akistan Institute of Engineering and Applied Sciences, Islamabad 45650, PakistanFunctional Materials group, School of Physical Sciences, University of Kent, CanterburyCT2 7NR, UKInstitute of Biophysics and Nanosystems Research, Austrian Academy of Sciences, Schmiedelstrasse 6, A-8042 Graz, Austriac/o Sincrotrone Trieste,tradaStatale14, km 163.5, 34012 Basovizza (TS), Italy
r t i c l e i n f o
rticle history:eceived 27 April 2011eceived in revised form 19 August 2011ccepted 24 September 2011
eywords:anostructuresorous alumina
a b s t r a c t
Small angle X-ray scattering (SAXS) has been performed on porous anodic alumina prepared at 10, 20and 30 V. These were prepared by two-step anodizing to have uniform through-thickness structure. Thethickness of the membranes was of the order of 100–200 �m. The scattering has been explained onthe basis of structure factor; the magnitude of scattering vectors (q) corresponding to well-establishedpeaks being multiples of 2�/d, where d is the inter-pore distance. The usually studied form factor hasnot been found to play any profound role to determine the scattering response of anodic alumina. Alarge number of experiments have been performed with various geometries of the anodic alumina with
hemical synthesis-ray scattering
respect to the incident beam. The scattering has been extremely anisotropic, where q always lies at about90◦ with respect to the sample’s normal. A deviation from this angle which is limited to about ±2◦ hasbeen due to scatter of the pore axis with respect to sample’s normal, which is caused by occasional poreturning, branching and annihilation events. The analysis and methodology adopted in this study has alsobeen suggested as extremely useful for determining the orientation of high-aspect ratio objects in ananisotropic sample along with assessing the degree of misalignment.
. Introduction
It is well understood that characteristics of materials and objectsan be considerably modified by restrictions in geometrical size onhe scale of up to a few tens of nanometers. Owing to this fact,anostructured materials exhibit interesting physical [1–4] andhemical [5,6] properties, and in some cases totally new phenom-na are observed that are non-existent in the ordinary counterpartsith relatively larger structural features. Porous anodic alumina
PAA) with hexagonally arranged cylindrical pores is one of theost exhilarating nanomaterials being employed for a variety of
pplications [7–10]. The most significant use of PAA has been astemplate for confinement of materials in cylindrical pores, for
nstance, to form nanowires, nanotubes and necklaces of metals,xides, polymers, colloids and composites, etc. [7,8,11–18].
While the direct imaging techniques can be conveniently used toraw some structural information of the nanomaterials, they covernly a limited region of the sample and the information obtained
∗ Corresponding author. Tel.: +92 51 2207813; fax: +92 51 2208070.E-mail address: [email protected] (M. Mehmood).
254-0584/$ – see front matter © 2011 Elsevier B.V. All rights reserved.oi:10.1016/j.matchemphys.2011.09.057
© 2011 Elsevier B.V. All rights reserved.
from the surface or a fractured/prepared cross-section may nottruly reveal structural details of the bulk of the sample. X-ray scat-tering is known to provide information from the bulk of the sample.In recent years Small angle X-ray scattering (SAXS) has been exten-sively employed to study the structural details of nanostructuredmaterials, owing to its high spatial resolution which fits well withthe dimensions of the nanoscale objects [19–21] and nanoporousmaterials [22–27] and can be employed to study size, shape, con-nectivity and orientation of the nanoscale objects (or pores) lyingin a material in simple and relatively complex systems.
PAA has been structurally and morphologically characterizedmostly by direct imaging techniques [20–25]. In spite of its extra-ordinary significance as a nano-template that can host a variety ofnanomaterials as well, SAXS studies on PAA are still very limited.Ridgen et al. [22] performed SAXS studies on PAA and observedscattering for a limited range of sample’s orientation with respect toincident beam suggesting strong anisotropy in scattering. This workwas further extended by some of the present authors [28], who
observed scattering by the pores in the whole range of orientationsof the sample. The rings and arcs formed by the scattered beamon the detector in the range of 0–80◦ from the face-on positionconverted into dots at an angle of 80–90◦.
A. Waheed et al. / Materials Chemistry and Physics 131 (2011) 362–369 363
Fs3
dpalsttipnt
sstdttpsc
tTpp
Fa
ig. 1. A Schematic diagram defining various parameters associated with thecattering vector, q and sample orientation vector, in the Cartesian coordinates;-dimensional view.
Recently, Engel et al. [29] have performed a well-explainedetailed study on polycarbonate samples with cylindrical poreserpendicular to the sample’s surface. The pores in these samplesre randomly spaced with respect to each other and with a mucharger interpore distance in comparison with pore diameter. Thesetructural features are much different from PAA which usually con-ain regularly spaced cylindrical pores with interpore distance ofhe order of pore diameter. Martin et al. also performed a lim-ted study on porous anodic alumina with hexagonally arrangedores. Possibly due to various contributing factors, small thick-ess of the alumite sample or particular preparation conditions,he peaks intensity was not much distinct from the background.
With the help of through-thickness oxidation of aluminumheet [30], the present authors grow significantly thick alumiteamples with almost complete consumed metallic aluminum. Fur-hermore, two-step anodizing facilitates formation of samples thato not morphologically change during anodic oxidation from topo bottom. Hence, due to large thickness (scattering volume) ofhe alumite sample and uniform structure for most of the sam-le, large scattering intensity is expected with clear intense peaksuch that the structural information may be obtained with a greateronfidence.
In the present work, thick PAA samples were prepared bywo-step anodizing on well-polished aluminum surfaces [31].
hrough-thickness oxidation was achieved to prepare alumite sam-les of about 100–200 �m thickness. This gave intense scatteringeaks. The samples were prepared at non-ordering conditions toig. 2. Typical cross-sectional SEM view of sample prepared by through-thicknessnodic oxidation of aluminum sheet at anodizing voltage of 30 V.
Fig. 3. Typical top-view SEM of samples prepared at anodizing voltage of 20 V (a),typical cross-sectional views are presented in (b) for 20 V and in (c) for 30 V.
avoid lattice effects. A complete picture of sample’s orientationwith respect to X-ray beam has been considered in the analysis.The methodology suggested in this report can be extended to obtainstructural information of other high aspect ratio anisotropic sam-ples.
2. Experimental
Aluminum sheet with a purity of 99.99% and a thickness of 1 mm was employedin this work. The samples of 1 cm × 3 cm were cut and annealed at 500 ◦C for a periodof five days for obtaining large grain size with a minimum possible defect density.
The samples were degreased in ultrasonic cleaner for about 25 min in analyticalgrade acetone. Electropolishing was performed at 20 V in perchloric acid-alcoholsolution (with a ratio of 1:4 by volume) at 0–10 ◦C for about 30 min. The sampleswere then anodized for 10 h at 0 ± 1 ◦C at a constant voltage of 10, 20, or 30 V. Theelectrolyte was 0.3 M sulfuric acid (H2SO4) for anodizing at 10 and 20 V, and 0.3 M
364 A. Waheed et al. / Materials Chemistry and Physics 131 (2011) 362–369
F p ano1
oi(dtw
sfi(a
cXiatawS
3
ad
q
ig. 4. SAXS intensity profile at 2-D detector, for a typical sample prepared by 2-ste0◦ (f) 8◦ (g) 6◦ (h) 4◦ (i) 2◦ (j) 0◦ , face-on.
xalic acid (C2H2O4·2H2O) for 30 V. The anodic alumina formed during first anodiz-ng was dissolved in a mixture of chromic acid (0.2 M CrO3·H2O) and phosphoric acid0.4 M H3PO4) at about 70 ◦C for 2 h. The samples were anodized again for sufficienturation to get about 100–200 �m through-thickness oxide under the same condi-ions as employed for the 1st anodizing. At the end of each treatment, the samplesere rinsed excessively in distilled water.
The electropolishing and anodizing were performed using programmable powerupplies (GW INSTEK PSP-603 and GW INSTEK PSP-405) with two electrode con-guration. Samples were characterized by Scanning Electron Microscope (SEM)JSM-5910, JEOL), Field Emission SEM (JSM-6700F, JEOL), and SAXS whose detailsre given in the following paragraph.
The SAXS experiments were performed on the 5.2L beamline at Elettra Syn-hrotron Light Laboratory, Trieste, Italy. The energy and wavelength of the incident-ray beam were 8 KeV and 1.54 A respectively. In the beamline, there was a mount-
ng system (Newport motion controller), which allowed a lateral movement (defineds y-axis) and a vertical movement (z-axis) by remote control; the x-axis being alonghe beam. Third degree of freedom was available to rotate the sample around verticalxis (z-axis). Beam of size 2 mm × 0.8 mm with a photon flux of 5 × 10¹² photons s−1
as employed. The SAXS intensity was measured on a 2D CCD detector (Photoniccience, Oxford).
. Theory
In SAXS, the incident beam is diffracted by the sample at a small
ngle of 2�. Thus the magnitude of the scattering vector, q, may beescribed as follows:= 4�
�sin �∼4�
��
dizing at 20 V, � was about 4◦ and ϕ was: (a) 90◦ , edge-on, (b) 70◦ (c) 50◦ (d) 30◦ (e)
The value of q also equates with 2�/r, where r denotes the phys-ical dimensions in the sample responsible for scattering at 2�.
Due to small scattering angle, the wave vector for the primaryX-ray beam (ki) and that for the scattered beam (kf) remain paral-lel to each other (along x-axis). On the other hand their magnitudesare also considered to be same (i.e., ki = kf). Therefore, the scatter-ing vector, q, can be fairly considered as perpendicular to the X-raybeam or in the in the y–z plane (the plane of the detector). If thesample is isotropic, the diffracted beam would trace a circle (orsemicircle) on the detector. Under some limiting conditions (foranisotropic sample), the diffracted beam may shine the detectoronly at a spot. A unit vector, n1, may be used to express the ori-entation of q, which lies in y–z plane making an angle of 180 − ˛(in degrees) with z-axis (or ˛ with negative z-axis), as defined inFig. 1. Another unit vector, n2, the sample orientation vector, hasbeen defined as perpendicular to the anodic alumina sheet. The unitvector n2 makes an angle of 90 − � with z-axis (or � with its pro-jection in the X–Y plane); while the projection makes an angle ϕwith x-axis, as defined in Fig. 1. It may be worth-noting that rotat-ing the sample around z-axis will change ϕ, while � would remainconstant. It is possible to shine the sample edge-on at ϕ = 90◦. For
ϕ = 0◦ and � = 0◦, the X-ray beam will shine the sample edge-on.For non-zero small values of � the sample will not be exactly at aface-on position even for ϕ = 0◦, although we will call it as a face-onposition for simplicity.
istry and Physics 131 (2011) 362–369 365
r
c
td
mma
oawn
P
lip
q
wb
4
bT
porptiabic
p
0.0 0.1 0.2 0.3 0.4 0.5 0.6 0.7100
1000
Inte
nsity
(a.u
.)
q (nm-1)
φ = 4° φ = 6°φ = 8°φ = 10°φ = 20°φ = 30°φ = 40°φ = 50°
A. Waheed et al. / Materials Chem
The angle between n2 and n1 can be defined as ˇ, which can beelated with � , ϕ and ˛ through following relation:
os ˇ = cos � sin ϕ sin ˛ − sin � cos ˛ (1)
For given � and ϕ, the orientation of the sample with respect tohe scattering vector (ˇ) can be determined by measuring ˛ on theetector.
Intensity of the scattered beam from inhomogeneous materialay be a contribution of form factor and structure factor; eitheray predominate depending on the concentration/or mutual inter-
ction of the scattering objects [28].The pores in the present porous anodic alumina are in the form
f cylinders. For a cylindrical object (or pore), with its axis makingn angle of ˇ with q, the form factor has been defined in Ref. [32],hich can be modified to the following equation (Eq. (2)) if ˇ doesot vary significantly in a given sample:
(q) = Constant.
[sin(qL cos ˇ)J1(qR sin ˇ)
(qL cos ˇ)(qR sin ˇ)
]2
sin ˇ (2)
The structure factor of an assembly of objects is based on short orong range interaction between scattered objects. The correspond-ng q values at which (maximum) constructive interference takeslace would satisfy the following relation [33]:
= m2�
d
here m is an integer and d is the mean distance among the neigh-oring objects (without exhibiting a long-range order).
. Results and discussion
Fig. 2 shows a cross-sectional view of a typical sample preparedy through-thickness anodic oxidation of aluminum sheet at 30 V.hickness is of the order of 150 �m.
Fig. 3(a) shows a typical top-view SEM image of a PAA samplerepared at 20 V. Fig. 3(b) and (c) show typical cross-sectional viewsf alumite samples prepared at anodizing voltages of 20 and 30 V,espectively. The interpore spacing is about 50 nm for the samplerepared at 20 V and 75 nm for 30 V, which is in agreement withhe well-known ratio of interpore distance to anodizing voltage,.e., 2.5 nm V−1. It may be noticed that the pores run through thelumite sample almost parallel to each other with occasional poreranching and annihilation events, typically marked by A and B
n Fig. 3(c). Also the pores tend to form wavy patterns with smallurvatures, as typically marked by C (Fig. 3(c)).
Fig. 4 shows typical X-ray scattering images of a sample pre-ared at anodizing voltage of 20 V, for different values of ϕ. As
0 20 40 60 80 100
0
20
40
60
80
100β = 90°β = 89°β = 88°β = 87°β = 86°β = 85°
α
φ°
γ = 0°
(a) (b
Fig. 6. Theoretically calculated ˛ vs. ϕ as
Fig. 5. Integrated intensity profile as a function of q, for different values of ϕ for atypical sample prepared at 20 V.
shown in Fig. 4(a), the scattered beams form spots at the detec-tor when the incident beam shines the sample at edge-on position(ϕ ∼ 90◦), ˛ is approximately 5◦. Rotating the sample away fromthe edge-on position, ˛-values (for maximum intensity) tend toincrease coming close to about 90◦ at face on position (ϕ ∼ 0◦).Furthermore, the dots tend to smear out in the form of arcs or semi-circles at ϕ ∼ 10◦ and below, i.e., close to the face-on position of thesample with respect to the incident beam.
Integrated intensity (corresponding to Fig. 4) has been shownin Fig. 5, as a function of ϕ and q-values. Various peaks are formed,and it may be noticed that the positions of the peaks remain almostunchanged, which suggests that the origin of the X-ray scatteringremains unchanged irrespective of the orientation of the samplewith respect to the incident beam.
For an isotropic X-ray scattering, the scattered beams, formingcones around the incident beam axis, should intersect the detec-tor plane forming complete circles. Accordingly, X-ray scatteringby porous alumina is highly anisotropic, as obviously seen forϕ ∼ 90–10◦.
Eq. (3) has been used to determine the relationship between ˛and ϕ, for various values of ˇ (between 85 and 90◦) and � as shownin Fig. 6. It may be noticed that the dependence of ˛ on ϕ varies withthe values of ˇ and � . Fig. 6(a) shows the behavior for � = 0, i.e., z-axis passes through the sample, and the sample’s normal (sampleorientation vector) remains perpendicular to the axis of rotation of
the sample. For ˇ = 90◦, ˛ remains zero except for ϕ = 0◦. For othervalues of ˇ, a minor but noticeable variation in ˛ takes place atlarge values of ϕ ∼ 90–10◦ and increasingly pronounced variation0 20 40 60 80 100
020
)
406080
100120140160180200
α°
φ°
β = 90°β = 89°β = 88°β = 87°β = 86°β = 85°
γ = 4°
a function of ˇ at various � values.

366 A. Waheed et al. / Materials Chemistry and Physics 131 (2011) 362–369
0 20 40 60 80 1000
20
40
60
80
100α
°
φ°
30V
Experimentally measured αTheoretically predicted α at β = 90°
0 20 40 60 80 100
0
20
40
60
80
100
α°
φ°
Theoretically Predicted α
Experimentally Measured α at β = 90°
20V
0 20 40 60 80 1000
(a) (b)
(c)
30
60
90
α°
φ°
Experimentally Measured α
Theoretically Predicted α at β =90°
10 V
F c) 30 Va ◦ .
toa
2cFon
Xdp
ig. 7. Plots between ˛ and ϕ for typical samples prepared at (a) 10 V, (b) 20 V and (greement with the calculated (theoretical) values of ˛ as a function of ϕ for ˇ = 90
akes place when ϕ value is reduced further. For non-zero valuesf � Fig. 6(b), a bit more pronounced dependence of ˛ on ϕ is seenlso for ˇ = 90◦.
The ˛-value for maximum intensity of scattered beam on the-D detector, ˛max, was determined and compared with ˛ valuesalculated for ˇ = 90◦, and an excellent match is seen as shown inig. 7. This shows that maximum intensity of scattered beam isbserved at the scattering vector that makes 90◦ with the sample’sormal.
Above analysis thoroughly explains the anisotropic behavior of-ray scattering by porous anodic alumina along with clear evi-ence that the maximum intensity of the scattered beam is in thelane of the sample. As the pores grow perpendicular to the plane
1008060402000
10
20
30
40
50
60
70
80
90
100 φ = 0° φ = 2° φ = 4° φ = 6° φ = 8° φ = 10° φ = 20° φ = 30° φ = 40° φ = 50° φ = 60° φ = 70° φ = 80° φ = 90°
Δα ∼22°For φ = 10°, β = 90°±2°
Δα ∼ 54° For φ = 2°, β = 90°±2°
α°
β°
γ = 4°
Fig. 8. Calculated values of ˛ plotted as a function of ˇ for various values of ϕ at � =
. ˛ was determined for the maximum intensity. The experimental data shows close
of the samples, it is clearly evident that most of the scatteringtakes place perpendicular to the pore axis. Nevertheless, a questionremains as why the dots tend to turn into curves or incomplete cir-cles close to the face-on position, i.e., ϕ < 10◦ in the present results(Fig. 4) (or in certain cases when the sample’s orientation is quiteaway from the face-on position, i.e., ϕ ∼ 0–80◦ [28]. Fig. 8 showsvariation in ˛, as a function of ˇ for various values of ϕ. Two verti-cal lines at ˇ = 88◦ and ˇ = 92◦, bind the region for ˇ = 90 ± 2◦. Theselines intersect with a given curve at a pair of points that determines
�˛, for the scattered beam shining the detector. It may be noticedthat �˛ increases significantly at low values of ϕ with �ˇ stillunchanged. Accordingly, the dots in the scattering pattern convertinto curves due to scatter in the ˛ values, �˛, which may be large10090807060500
2
4
6
8
10
12
14 φ = 0° φ = 2° φ = 4° φ = 6° φ = 8° φ = 10° φ = 20° φ = 30° φ = 40° φ = 50° φ = 60° φ = 70° φ = 80° φ = 90°
γ = 4°
Δα ∼ 4°For φ = 90°, β = 90°±2°
Δα ∼ 5°For φ = 50°, β = 90°±2°
α°
β°
4◦ . Depending on ϕ, the same range �ˇ gives rise to a large variation in �˛.
A. Waheed et al. / Materials Chemistry and Physics 131 (2011) 362–369 367
0 10 20 30 40 50 60 70 80 90 100
0
10
20
30
40
50
60
70Δα
°
φ°
Δα (Εxperimental) Δα (Theoretical)
F�
ehivvoo
ur
0.0 0.2 0.4 0.6
100
1000
Inte
nsity
(a.u
.)
q(nm-1)
Pore widened Without pore widening
20 V
Fig. 11. Comparison between SAXS intensity profiles, as a function of scatteringvector (q), for the sample prepared at anodizing voltage of 20 V, with or without
F2
ig. 9. Comparison between the calculated and experimentally measured values of˛ plotted against ϕ, for a typical sample (Fig. 5).
nough at low values of ϕ in spite of very small variance in ˇ. �˛as been determined (as shown in Fig. 4 (g and h)) for the scatter-
ng pattern based on the intensity falling to about 5% of the peakalues, and has been found to be comparable with the calculatedalues (as shown in Fig. 9) of �˛ for �ˇ ∼ 2◦. Accordingly, variancef the pore axes with respect to the sample’s normal is of the order
f 2◦.When the pores are not aligned parallel to each other which issually the case for initial stages of 1st anodizing or due to originallyough aluminum surface, �ˇ would be large. This would give rise to
0.0 0.1 0.
10
100
0.169
0.084
3
Inte
nsity
(a.u
.)
q (nm
For Interp
0.0 0.2 0.4 0.6 0.8 1.0
100
(a)
(c)
10000.420
0.211 10 V
Inte
nsity
(a.u
.)
q (nm-1)
For Inter-pore distance = 28 nm
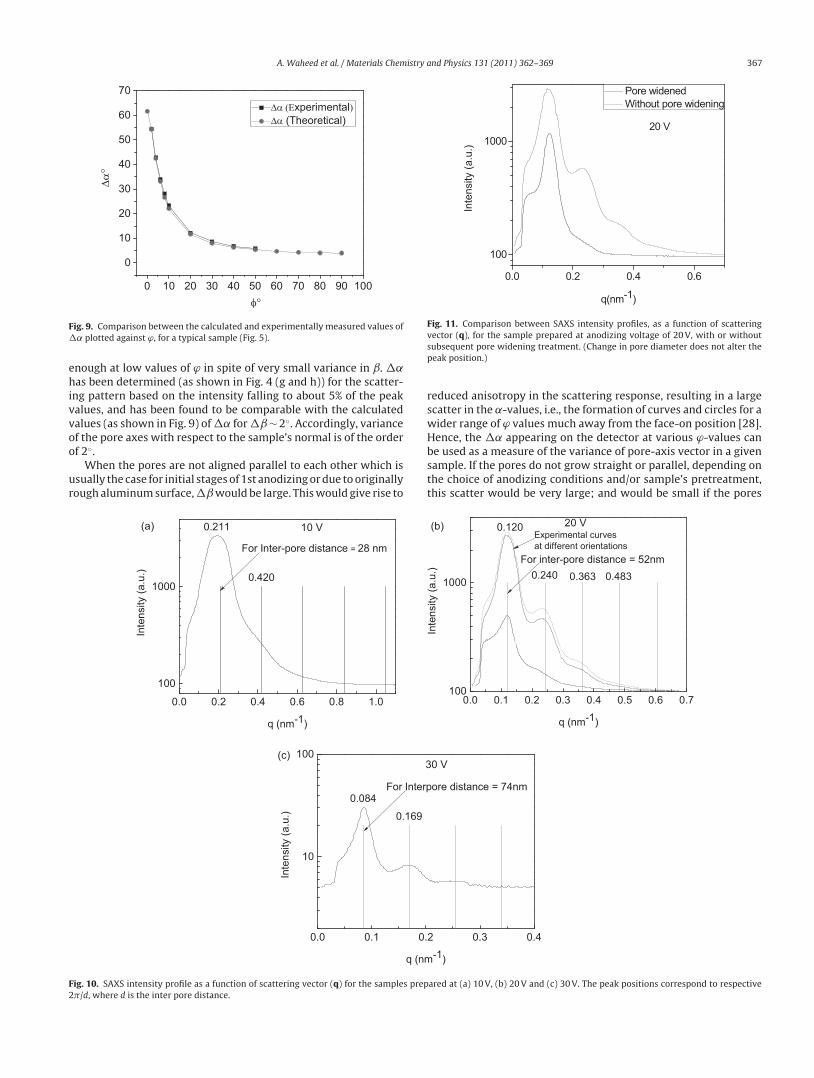
ig. 10. SAXS intensity profile as a function of scattering vector (q) for the samples prep�/d, where d is the inter pore distance.
subsequent pore widening treatment. (Change in pore diameter does not alter thepeak position.)
reduced anisotropy in the scattering response, resulting in a largescatter in the ˛-values, i.e., the formation of curves and circles for awider range of ϕ values much away from the face-on position [28].Hence, the �˛ appearing on the detector at various ϕ-values can
be used as a measure of the variance of pore-axis vector in a givensample. If the pores do not grow straight or parallel, depending onthe choice of anodizing conditions and/or sample’s pretreatment,this scatter would be very large; and would be small if the pores2 0.3 0.4
0 V
-1)
ore distance = 74nm
(b)
0.0 0.1 0.2 0.3 0.4 0.5 0.6 0.7100
1000
Experimental curvesat different orientations
For inter-pore distance = 52nm
20 V
Inte
nsity
(a.u
.)
q (nm-1)
0.120
0.240 0.363 0.483
ared at (a) 10 V, (b) 20 V and (c) 30 V. The peak positions correspond to respective

368 A. Waheed et al. / Materials Chemistry and Physics 131 (2011) 362–369
0.80.70.60.50.40.30.20.1
1
10
100
Inte
nsity
(a.u
.)
q (nm-1)
q (nm-1)q (nm-1)
Pore radius = 12.5 nm
Form factorTheoretically calculated
30 V
1.21.00.80.60.40.20.0
10
100
1000
10000 20 VPore radius = 8 nm
Form factorTheoretically calculated
Inte
nsity
(a.u
.)
1.61.41.21.00.80.60.40.2
10
100
1000
10000(a) (b)
(c)
Form factorTheoretically calculated
10V Pore radius = 4 nm
Inte
nsity
(a.u
.)
F lculateo
gp
hi0c7tthip
fttacs(tliswis
cim
ig. 12. Comparison between the SAXS intensity profile function of q, with the cabvious mismatch is clearly revealed.
row straight, with minor to-and-fro deviation from their straightath.
Intensity of the scattered X-rays for samples prepared at 10–30 Vas been shown in Fig. 10 as a function of q values. The most
ntense peaks are seen at q values of 0.20 nm−1, 0.120 nm−1, and.084 nm−1 for the samples prepared at 10, 20 and 30 V, whichorrespond to d values (inter-pore distance) of 30 nm, 52 nm, and4 nm in the real space. The other low intensity peaks appear athe q-values that are almost simple multiples of the q-values ofhe main peak in a given pattern. Hence, these may be merelyigher order peaks/reflections. Comparing these d-values with SEM
mages shown in Fig. 3, it has been noticed that the most intenseeak arises from the interpore distance.
For comparison, a sample with pore widened in 0.3 M Oxalic acidor a period of 30 min was also employed for SAXS studies. Thisreatment is known to increase the pore diameter to about two-imes its original value. Fig. 11compares integrated intensity profiles a function of q-values. The peak position of the sample does nothange after pore widening, which is in agreement with our pre-umption that the peaks have not originated from the form factorthe pore diameter); by contrast they have simply originated fromhe structural factor or the inter pore spacing. For small objects witharge distances (dilute samples), Form Factor is known to predom-nate in SAXS intensity. On the other hand for interacting/closelypaced objects, structural factor is known to predominate. Hence,e consider that the contribution of the form factor is negligible
n comparison with the structure factor in SAXS studies of PAAamples.
Martin et al. [29] showed the contribution of form factor in thease of track-etched polycarbonates [8,15]. Due to etching the poresn the polycarbonate membranes, pore size (diameter) are almost
onodisperse, therefore, form factor was clearly revealed. The
d Form Factor, for realistic values of pore radii; (a) 10 V, (b) 20 V and (c) 30 V. An
contribution of form factor to SAXS intensity decreases withincrease of polydispersity in the pore diameter [20]. The alumitemembranes used for this study have been prepared at non-orderingconditions to avoid lattice effects; they have greater extent of poly-dispersity as compared to the polycarbonates. The negligible roleof form factor to the SAXS intensity of the alumite samples may beattributed to the polydispersity of the pore diameters.
For further confirmation of our view, peak positions for the formfactor have also been calculated and compared with the experimen-tal data. As has been described earlier, interpore distance in caseof doubly anodized samples increases linearly with the anodizingvoltage at 2.5 nm V−1 [34]. Pore diameter is generally around 33%(one third) of inter-pore distance and pore radius is one-sixth ofthe inter-pore distance [34]. Accordingly, the pore radius for thesamples prepared at anodizing voltage of 10 V, 20 V and 30 V isabout 4, 8 and 12 nm, respectively. Form factor for these pore radiihas been calculated (using Eq. (2)) at ˇ = 90◦ and compared withthe SAXS intensity profile, as shown in Figs. 12, which shows com-plete disagreement. Even if substantially different pore diametersare assumed, although not shown here, the form factor does not fitwith the peak positions of the experimental data.
5. Conclusions
(i) SAXS study of thick (more than 100 �m) porous anodic alu-mina prepared by two-step anodizing at 10 V, 20 V and 30 Vhave been performed giving clear and sharp peaks. The peakpositions correspond to multiples of 2�/d, where d is inter-
pore distance. The spectra clearly suggest that the form factorhas almost negligible role in the analysis of the SAXS responseof alumite membranes and structure factor predominates. Itmay also be concluded that the SAXS response of a sample
istry a
(
(
(
A
(nE
[[
[
[
[
[[
[[
[[
[
[
[
[[
[
[
[
[
[
[
[
A. Waheed et al. / Materials Chem
containing mutually interacting particles/pores is dominatedby structure factor.
(ii) The form factor has negligible role in the SAXS response of thealumite samples. This may be attributed to polydispersity inthe pore diameter.
iii) The SAXS response has been extremely anisotropic; however,intense scattered beam has been obtained, irrespective of thealignment of the samples with respect to beam axis. Whenthe incident beam shines the sample almost at face-on (i.e.,ϕ ∼ 0◦), the scattering response appears on the 2-D detector inthe form of rings or curves. These curves or rings center thebeam axis suggesting the same q-value along a given ring orcurve. Moving away from the face-on position (ϕ ∼ 0◦) towardsedge-on position, the curves contract into the form of dots atabout ϕ ∼ 10◦, above which the dots move along the detec-tor, without affecting the q-values, i.e. origin of the reflectionsis the same. Therefore, sample may be characterized at anyorientation between face-on and edge-on orientations.
iv) A detailed analysis has clearly revealed that the scattering vec-tor, q, always lies in the plane of the sample or perpendicular tosamples normal, with minor deviation of about ±2◦. Depend-ing on the orientation of the sample, this small scatter in thescattering vector with respect to samples normal gives rise tolarge variation in the ˛ values close to the face-on position,which can be exploited to study the variation in the pore axis.In well-developed templates prepared in the present work,deviation of the pore axis with respect to the sample’s nor-mal has been found predominantly to be about ±2◦, which hasbeen attributed to the wavy growth patterns of the pores, oradjustment of inter-pore distance after pore annihilation ormultiplication events. Based on the present methodology andanalysis; for less developed PAA templates or other anisotropicsystems where high aspect ratio/cylindrical objects are not per-fectly aligned with each other, scanning through or employinga suitable orientation of the sample with respect to the inci-dent beam can be successfully exploited to study the mutualvariation in the axis of the cylindrical objects.
(v) The maximum intensity of scattered beam is found for the scat-tering vector that makes 90◦ with the sample’s normal, i.e. inthe plane of sample.
vi) If sample is not perfectly vertical, variation in the angular posi-tion of scattering vector on the surface of the detector with thevariation in the orientation of sample from edge-on to face-on,is much more pronounced. Based on the mathematical modelpresented, vertical misalignment can be predicted in case of asample which is not perfectly vertical.
cknowledgements
The authors are thankful to Higher Education CommissionHEC), Government of Pakistan for financial support to carry outecessary experimental work. The authors are also thankful tolettra Synchrotron Light Source, Italy, for providing with the
[
[
nd Physics 131 (2011) 362–369 369
opportunity to work on the SAXS beamline, and Dr. Abdus SalamInternational Center of Theoretical Physics (ICTP) for the travellinggrant.
References
[1] R. Rizwan, M. Mehmood, M. Imran, J. Ahmad, M. Aslam, J.I. Akhter, Mater. Trans.48 (2007) 1558.
[2] A.G. Cullis, L.T. Canham, P.D.J. Calcott, J. Appl. Phys. 82 (1997) 909.[3] G. Herzer, IEEE Trans. Magn. 25 (1989) 3327.[4] J.L. Duvail, S. Dubois, S. Demoustier-Champagne, Y. Long, L. Piraux, Int. J. Nan-
otechnol. 5 (2008) 838.[5] M. Mehmood, B.P. Zhang, E. Akiyama, H. Habazaki, A. Kawashima, K. Asami, K.
Hashimoto, Corros. Sci. 40 (1998) 1.[6] H. Habazaki, M. Yamasaki, A. Kawashima, K. Hashimoto, Appl. Organomet.
Chem. 14 (2000) 803.[7] H. Chik, J.M. Xu, Mater. Sci. Eng., R 43 (2004) 103.[8] C.R. Martin, Science 266 (1994) 1961.[9] C.R. Martin, Chem. Mater. 8 (1996) 1739.10] S. Tajima, Electrochim. Acta 22 (1977) 995.11] G. Hornyak, M. Kroll, R. Pugin, T. Sawitowski, G. Schmid, J.O. Bovin, G. Karsson,
H. Hofmeister, S. Hopfe, Chem. Eur. J. 3 (1997) 1951.12] C.A. Huber, T.E. Huber, M. Sadoqi, J.A. Lubin, S. Manalis, C.B. Prater, Science 263
(1994) 800.13] D. Routkevitch, A.A. Tager, J. Haruyama, D. Almawlawi, M. Moskovits, J.M. Xu,
IEEE Trans. Electron Devices 43 (1996) 1646.14] D. Routkevitch, T. Bigioni, M. Moskovits, J.M. Xu, J. Phys. Chem. 100 (1996)
14037.15] J.C. Hulteen, C.R. Martin, J. Mater. Chem. 7 (1997) 1075.16] M. Sun, G. Zangari, M. Shamsuzzoha, R.M. Metzger, Appl. Phys. Lett. 78 (2001)
2964.17] G. Schmid, J. Mater. Chem. 12 (2002) 1231.18] G.S. Cheng, L.D. Zhang, Y. Zhu, G.T. Fei, L. Li, C.M. Mo, Y.Q. Mao, Appl. Phys. Lett.
75 (1999) 2455.19] W. Ruland, B. Smarsly, J. Appl. Crystallogr. 38 (2005) 78.20] B. Smarsly, H. Kaper, W. Ruland, Nucl. Instrum. Methods Phys. Res., Sect. B 246
(2006) 249.21] A.B.A. Gibaud, D.A. Doshi, C.J. Brinker, L. Yang, B. Ocko, Europhys. Lett. 63 (2003)
833.22] J.S. Rigden, J.C. Dore, A.N. North, Determination of Anisotropic Features in
Porous Materials by Small-Angle X-Ray-Scattering, in: J. Rouquerol, et al. (Eds.),Characterization of Porous Solids III, Elsevier Science Publ B V, Amsterdam,1994, p. 263.
23] T.R. Pauly, Y. Liu, T.J. Pinnavaia, S.J.L. Billinge, T.P. Rieker, J. Am. Chem. Soc. 121(1999) 8835.
24] P. de Moor, T.P.M. Beelen, R.A. van Santen, J. Phys. Chem. B 103 (1999) 1639.25] G. Van den Bossche, R. Sobry, F. Fontaine, J.M. Clacens, Z. Gabelica, J. Appl.
Crystallogr. 30 (1997) 1065.26] S. Dourdain, J.F. Bardeau, M. Colas, B. Smarsly, A. Mehdi, B.M. Ocko, A. Gibaud,
Appl. Phys. Lett. 86 (2005).27] S. Mascotto, D. Wallacher, A. Brandt, T. Hauss, M. Thommes, G.A. Zickler, S.S.
Funari, A. Timmann, B.M. Smarsly, Langmuir 25 (2009) 12670.28] J.C. Dore, R.E. Benfield, D. Grandjean, G. Schmid, M. Kroll, D. Le Bolloc’h,
Structural studies of mesoporous alumina membranes by small angle X-rayscattering, in: F. RodriguezReinoso, et al. (Eds.), Characterization of PorousSolids Vi, Elsevier Science Publ B V, Amsterdam, 2002, p. 163.
29] M. Engel, B. Stuhn, J.J. Schneider, T. Cornelius, M. Naumann, Appl. Phys. Mater.Sci. Process 97 (2009) 99.
30] M. Mehmood, A. Rauf, M.A. Rasheed, S. Saeed, J.I. Akhter, J. Ahmad, M. Aslam,Mater. Chem. Phys. 104 (2007) 306.
31] A. Rauf, M. Mehmood, M.A. Rasheed, M. Aslam, J. Solid State Electrochem. 13(2009) 321.
32] I. Livsey, J. Chem. Soc., Faraday Trans. I 83 (1987) 1445.
33] T.Z.P. Lindner, Neutron, X-rays and light, scattering methods applied to soft con-densed matter, Second ed., North-Holland Delta Series, ELSEVIER, Amsterdam,2004.
34] K. Nielsch, J. Choi, K. Schwirn, R.B. Wehrspohn, U. Gosele, Nano Lett. 2 (2002)677.
Copyright © 2022 FDOKUMEN