Slip vectors of the surface rupture of the 1999 Chi-Chi earthquake, western Taiwan
15
Slip vectors of the surface rupture of the 1999 Chi-Chi earthquake, western Taiwan Yuan-Hsi Lee a, * , Meng-Long Hsieh b , Shih-Ding Lu a , Tung-Sheng Shih a , Wei-Yu Wu a , Yuichi Sugiyama c , Takashi Azuma d , Yoshihiko Kariya e a Central Geological Survey, ROC, PO Box 968, Taipei, Taiwan, ROC b Department of Geosciences, National Taiwan University, No. 1, Sec. 4, Roosevelt Rd., Taipei, Taiwan, ROC c Geological Survey of Japan, 1-1 Higashi, Tskuba, Ibaraki 3058567, Japan d Prime Minister’s Office, 3-8-1 Ka-sumigashki, Chiyoda-ku, Tokyo 100-0031, Japan e Graduate School of Science and Technology, Chiba University, 1-33 Yayoi, Inage-Ku, Chiba 263-8522, Japan Received 7 July 2001; received in revised form 28 January 2003; accepted 6 February 2003 Abstract About 100 slip vectors were surveyed along the 1999 Chi-Chi earthquake rupture (100 km long), western Taiwan, to understand the coseismic reverse-faulting processes. The surveyed slip azimuths vary locally (over 808) where the rupture is irregular or associated with flexure. Even where the rupture is straight and has consistent slip azimuths, the fault-scarp heights, horizontal slips and fault dip-angles oscillate in a distance of hundreds of meters along the rupture. Despite these local variations, the net slip (up to 11.5 m), vertical and horizontal slips are significant greater in the north, on which maximum shortening (6 m; by pure thrust) and strike slip (8 m; by left-lateral fault) occur in association with the bend of the rupture. The slip azimuths also progressively rotate from north/northwest in the north to west/southwest in the south. These patterns generally agree with those revealed by GPS surveys, except that the slips by GPS in the south move to the west/northwest and have values unexpectedly smaller than our measurements. Our obtained SW-directed slips resulted in dominantly right-lateral faulting (up to 2.4 m) where the rupture ends to the southeast. This, however, does not correspond to focal mechanisms of any main shocks or aftershocks. q 2003 Elsevier Ltd. All rights reserved. Keywords: Slip vector; Surface rupture; Chi-Chi earthquake; Thrust fault 1. Introduction The September 21, 1999 Chi-Chi earthquake (M w ¼ 7.6), a consequence of on-going collision between the Philippine Sea plate and Eurasian plate (Fig. 1), produced a surface rupture about 100 km long in western Taiwan. The rupture has a throw of up to 10 m, one of the largest coseismic displacements ever documented on a reverse fault. Most of the rupture traversed urban areas and farmed fields, and consequently offset many artificial structures such as city streets, water pipes and fences. These deformed structures record the characteristics of the faulting (e.g. Sharp, 1975) and provide a rare opportunity to examine near-surface reverse-faulting processes during a great earthquake. In this paper, we present surveyed slip vectors and their associated faulting parameters such as shortening, strike-slip components and fault-dip angles, for 98 sites on this rupture. Our obtained slip vectors and faulting parameters show significant local variations, along with changes in orien- tation and/or geometry of the rupture. These variations highlight the complexity of the rupturing processes near the surface, a feature perhaps common on reverse faults. Still, our data show distinct regional patterns. We believe that with the number and the quality of the data, these patterns are of significance and should reflect the properties of the fault in the deeper crust. These data are then compared with known earthquake source parameters derived from seismo- logical records (Kao and Chen, 2000; Mori and Ma, 2000; Ma et al., 2001) and with the syn-earthquake rock move- ment data from GPS surveys (Yu et al., 2001). 0191-8141/03/$ - see front matter q 2003 Elsevier Ltd. All rights reserved. doi:10.1016/S0191-8141(03)00039-7 Journal of Structural Geology 25 (2003) 1917–1931 www.elsevier.com/locate/jsg * Corresponding author. Tel.: þ886-2-2946-2793 ext.245; fax: þ 886-2- 2942-9291. E-mail address: [email protected] (Y.H. Lee).
Transcript of Slip vectors of the surface rupture of the 1999 Chi-Chi earthquake, western Taiwan

Slip vectors of the surface rupture of the 1999 Chi-Chi earthquake,
western Taiwan
Yuan-Hsi Leea,*, Meng-Long Hsiehb, Shih-Ding Lua, Tung-Sheng Shiha, Wei-Yu Wua,Yuichi Sugiyamac, Takashi Azumad, Yoshihiko Kariyae
aCentral Geological Survey, ROC, PO Box 968, Taipei, Taiwan, ROCbDepartment of Geosciences, National Taiwan University, No. 1, Sec. 4, Roosevelt Rd., Taipei, Taiwan, ROC
cGeological Survey of Japan, 1-1 Higashi, Tskuba, Ibaraki 3058567, JapandPrime Minister’s Office, 3-8-1 Ka-sumigashki, Chiyoda-ku, Tokyo 100-0031, Japan
eGraduate School of Science and Technology, Chiba University, 1-33 Yayoi, Inage-Ku, Chiba 263-8522, Japan
Received 7 July 2001; received in revised form 28 January 2003; accepted 6 February 2003
Abstract
About 100 slip vectors were surveyed along the 1999 Chi-Chi earthquake rupture (100 km long), western Taiwan, to understand the
coseismic reverse-faulting processes. The surveyed slip azimuths vary locally (over 808) where the rupture is irregular or associated with
flexure. Even where the rupture is straight and has consistent slip azimuths, the fault-scarp heights, horizontal slips and fault dip-angles
oscillate in a distance of hundreds of meters along the rupture. Despite these local variations, the net slip (up to 11.5 m), vertical and
horizontal slips are significant greater in the north, on which maximum shortening (6 m; by pure thrust) and strike slip (8 m; by left-lateral
fault) occur in association with the bend of the rupture. The slip azimuths also progressively rotate from north/northwest in the north to
west/southwest in the south. These patterns generally agree with those revealed by GPS surveys, except that the slips by GPS in the south
move to the west/northwest and have values unexpectedly smaller than our measurements. Our obtained SW-directed slips resulted in
dominantly right-lateral faulting (up to 2.4 m) where the rupture ends to the southeast. This, however, does not correspond to focal
mechanisms of any main shocks or aftershocks.
q 2003 Elsevier Ltd. All rights reserved.
Keywords: Slip vector; Surface rupture; Chi-Chi earthquake; Thrust fault
1. Introduction
The September 21, 1999 Chi-Chi earthquake
(Mw ¼ 7.6), a consequence of on-going collision between
the Philippine Sea plate and Eurasian plate (Fig. 1),
produced a surface rupture about 100 km long in western
Taiwan. The rupture has a throw of up to 10 m, one of the
largest coseismic displacements ever documented on a
reverse fault. Most of the rupture traversed urban areas and
farmed fields, and consequently offset many artificial
structures such as city streets, water pipes and fences.
These deformed structures record the characteristics of the
faulting (e.g. Sharp, 1975) and provide a rare opportunity to
examine near-surface reverse-faulting processes during a
great earthquake. In this paper, we present surveyed slip
vectors and their associated faulting parameters such as
shortening, strike-slip components and fault-dip angles, for
98 sites on this rupture.
Our obtained slip vectors and faulting parameters show
significant local variations, along with changes in orien-
tation and/or geometry of the rupture. These variations
highlight the complexity of the rupturing processes near the
surface, a feature perhaps common on reverse faults. Still,
our data show distinct regional patterns. We believe that
with the number and the quality of the data, these patterns
are of significance and should reflect the properties of the
fault in the deeper crust. These data are then compared with
known earthquake source parameters derived from seismo-
logical records (Kao and Chen, 2000; Mori and Ma, 2000;
Ma et al., 2001) and with the syn-earthquake rock move-
ment data from GPS surveys (Yu et al., 2001).
0191-8141/03/$ - see front matter q 2003 Elsevier Ltd. All rights reserved.
doi:10.1016/S0191-8141(03)00039-7
Journal of Structural Geology 25 (2003) 1917–1931
www.elsevier.com/locate/jsg
* Corresponding author. Tel.: þ886-2-2946-2793 ext.245; fax: þ886-2-
2942-9291.
E-mail address: [email protected] (Y.H. Lee).

Fig. 1. Geological map of central Taiwan (modified from Chinese Petroleum Corporation (1974, 1982, 1986)), location of the surface rupture during the 1999
Chi-Chi earthquake (based on Central Geological Survey (1999)), syn-earthquake slip revealed by GPS measurements on the hanging-wall side of the rupture
(summarized from Yu et al. (2001)) and epicenters of the earthquake sequence (in equal-area projection with the compressional quadrants darkened; after Kao
and Chen (2000)). Inset shows map location and tectonic setting of Taiwan. Bold arrow with rate shows the current movement of the Philippine Sea plate
relative to the Eurasian plate (Yu et al., 1997).
Y.-H. Lee et al. / Journal of Structural Geology 25 (2003) 1917–19311918

2. Regional setting and the 1999 Chi-Chi earthquake
2.1. Geological setting
The 1999 Chi-Chi earthquake was due to slip on the
Chelungpu fault—a major north-striking thrust fault in the
fold-thrust belt in western Taiwan (Fig. 1). The fault thrusts
Miocene to mid-Pleistocene sedimentary rocks on the
hanging wall over Quaternary conglomerate on the footwall
(Chang, 1971) and roughly coincides with the mountain
front that defines the eastern margin of the Taichung basin
(Fig. 1). The strata on the hanging-wall side of the
Chelungpu fault generally dip at 20–308 to the east but
.408 near the fault (Chinese Petroleum Corporation, 1974,
1982). These strata are truncated to the south by secondary
faults, including the NW-trending Luliao fault, in the
Choushui River basin (Fig. 1). From here, the Chelungpu
fault (or the Tachienshan fault of Chinese Petroleum
Corporation (1986)) enters the hills and bends south-
westward (Fig. 1).
2.2. Trace of the surface rupture
The rupture extends from the Taan River in the north to
the Chingshui River (tributary of the Choushui River) in the
south (note that, for simplicity, we collectively term all the
coseismic deformation resulting in recognizable offset in
the field as rupture, although in many places it is expressed
as a flexure without breaking the surface). About 60% of
this rupture (and its secondary branches) is located within a
few hundred meters from the mountain-front escarpment
bounding the Taichung basin (Fig. 1). In the north, the
rupture bends to the east away from the mountain front (and
the Chelungpu fault) at the mouth of the Tachia River valley
(Fig. 1). From here, the rupture diverges into several sub-
paralleling branches, accompanied by a 1–2-km-wide fold
belt, and continues northeastward to the Taan River valley
(Fig. 1). In the south, the rupture enters the hills about 4 km
south of the Choushui River valley, continuously follows
the Chelungpu fault (or the Tachienshan fault), and ends
around Tungtou (Fig. 1). In the hills south of the Choushui
River valley, the earthquake also generated secondary
ruptures, en echelon-aligned domes and abundant landslides
along the Luliao fault for several kilometers.
2.3. Geophysical data
Using high-quality teleseismic records, Kao and Chen
(2000) divided the main shock of the 1999 earthquake into
five successive subevents, each representing the average
properties of a portion of the fault rupture at depth (Fig. 1).
The rupture initiated about 15 km east of the mouth of the
Choushui River valley on a fault plane dipping 508 to the
east (Subevent 1; Fig. 1). The rupture then propagated
northward along a dominant, 20–308 east dipping plane
down to a depth of about 15 km (Subevents 2–4; Fig. 1).
Finally, the rupture shifted eastward beneath the high
mountainous area about 35 km east of the mountain front
Fig. 2. Four types of objects surveyed in this study (schematic). Type A is bedrock-bounded fault plane exposed on a fault scarp or in a trench. Type B is an
object that was translated during faulting. As shown, the roof of the structure remained intact, which allows us to restore the steel rack A0 to its original position
A to obtain the slip vector of the rupturing. Type C is an offset linear feature with original length (AB0) preserved. Type D is a pair of the nearby, non-parallel
linear features.
Y.-H. Lee et al. / Journal of Structural Geology 25 (2003) 1917–1931 1919

Fig. 3. Examples of determining slip vectors and other faulting parameters from (a) type C and (b) type D objects on graphs; fault azimuths are assumed to have
uncertainties of ^58 and ^108 in (a) and (b), respectively. In (a), the linear feature (L) is almost perpendicular to the fault trace, and its position on the graph is
less affected by the irregularity of the fault trace. This results in a small uncertainty in slip azimuth. In (b), the linear feature (L1) makes a small angle with the
rupture and its position on the graph is sensitive to the uncertainty of the azimuth of the rupture. This yields a greater uncertainty in slip azimuth (shaded
parallelogram).
Y.-H. Lee et al. / Journal of Structural Geology 25 (2003) 1917–19311920

(Subevent 5; Fig. 1). In this sequence, the slip on the rupture
rotated from southwest-west (P-axis: 798) in the south
(Subevent 1) to northwest in the region east of Wufeng
(Subevent 4) and then to due north (Subevent 5) (Fig. 1).
The amount of the slip also increased northward to a
maximum of 10 m near the Tachia River valley (Mori and
Ma, 2000). Here, the strong-motion records documented the
maximum vertical offset of 8 m (Ma et al., 2001).
Near where the surface rupture ended, the aftershock
sequences defined two strike-slip nodal planes (Kao and
Chen, 2000): the ENE-trending right-lateral plane in the
north and the NW-trending left-lateral plane in the south.
These data indicate that the main rupture ended laterally in
strike-slip fault zones that accommodated the westward slip
of the thrust block (Kao and Chen, 2000).
The coseismic slip of the thrust block shown by GPS
surveys was dominantly toward the northwest (except for a
SW-directed slip south of the Choushui River valley) (Yu
et al., 2001) (Fig. 1). The slip rotated counter-clockwise to
the north and increased in amount both to the north and to
the west, with a maximum of 9.1 m in the area several
kilometers south of the Tachia river valley (Fig. 1). The GPS
data also showed that the region on the footwall side of the
rupture consistently slipped to the southeast or to the east
during the earthquake. This slip (0.1–1.5 m) is much
smaller than the slip of the thrust block on the hanging-
wall side (Yu et al., 2001).
3. Methods
We focused our study on determining the slip vector
(including azimuth, amounts of vertical and horizontal
slips), shortening, strike-slip component and fault dip-angle
of the rupture. All measurements were made in the hanging
wall relative to the footwall. The vertical slip (i.e. the height
of a fault scarp) is the most readily measured element. It is
defined as the vertical distance between the level part of the
hanging-wall surface (i.e. behind pressure ridges, if any) and
the base of the fault scarp (Fig. 2b and c). For the other
faulting parameters, four types of objects were surveyed.
Type A objects are the bedrock-bounded fault planes
Fig. 4. Surveyed slip vectors in the Taan and Tachia river valleys (for location see Fig. 1). Earthquake ruptures (and flexures) are modified from Central
Geological Survey (1999). Surveyed fault-scarp height, horizontal slip and fault dip-angle along the western part of fault IV are also shown. Uncertainties of
.108 in slip azimuth or .0.5 m in horizontal slip are given as parallelograms or thin bars. Letters with numbers refer to the number of survey sites shown in
Appendix A.
Y.-H. Lee et al. / Journal of Structural Geology 25 (2003) 1917–1931 1921

exposed on fault scarps or in trenches (Fig. 2a). We directly
measured the fault plane attitudes and determined the slip
azimuths from slickensides. Type B objects are those, such
as equally spaced building pillars, that were translated
during the earthquake (Fig. 2b). We obtained the slip
vectors by restoring the objects to their original positions.
Type C objects are offset linear features such as city streets
or concrete fences. These objects are rigid and the lengths
before the faulting can be readily measured, which allowed
us to calculate slip vectors of the rupture (Fig. 2c). In some
places, the original lengths of the objects are unknown. Still,
we obtained slip azimuths where the objects were offset
only vertically. Type D objects are pairs of nearby, non-
parallel linear features that were offset by the rupture (Fig.
2d). We were rarely able to directly determine slip vectors
from types C and D objects in the field. Instead, we
measured the azimuth of the rupture, the azimuths and
apparent lateral offsets of the objects, and determined the
slip vectors graphically (Fig. 3).
Our measurements have differing degrees of uncertainty
for each type of object and are affected by the orientations of
the objects with respect to the rupture. The direct
measurement of fault attitude and/or slip azimuth from
type A and B objects is the most accurate. Where the
exposed fault plane of Type A object is irregular, we
measured more than one value to obtain the range of the
fault attitude and slip azimuth.
For type C and D objects, we found that the differences in
orientation between the offset linear features on the
hanging-wall side of the fault and their counterparts on
the footwall side are all within 1 or 28 (i.e. almost no near-
surface rotation on the rupture). These measurements,
together with those for lateral offsets of the linear features
and heights of fault scarps, can be assumed to be precise.
The major source of uncertainty is in determining the
azimuth of the fault trace, which is usually a ruptured zone
rather than a perfectly straight line on the field scale. We
assume that our measured fault azimuth has an uncertainty
of ^58 where the fault trace appears to be straight, and of
^108 when the fault trace is rather irregular or is composed
of multiple closely-spaced branches. This yields uncertainty
in determining the positions of the offset objects on the
graphs (Fig. 3). The obtained slip azimuth thus can have an
uncertainty of over 208 where the fault has a large strike-slip
component or where the offset linear feature makes a small
angle with the fault (Fig. 3). This uncertainty can also result
in uncertainties in determining shortening and strike-slip
component (and thus fault-dip angle) of over 50%. Fig. 3
Fig. 5. Surveyed slip vectors on the earthquake ruptures north of the Wu River valley (for location see Fig. 1). Bars for vertical slip are dashed where they are
the summation of the heights of two nearby fault scarps. Legend and other notes as in Fig. 4.
Y.-H. Lee et al. / Journal of Structural Geology 25 (2003) 1917–19311922

shows examples of how we determined the faulting
parameters and their possible ranges, given the uncertainties
of fault azimuths.
4. Results
4.1. Local variations
Our obtained faulting parameters show significant local
variations, from which we were able to appreciate the
complexity of the near-surface reverse-faulting processes.
The faulting patterns are especially complicated where the
rupture is irregular in traces and is associated with flexure.
For example, along the northwestern branch of the rupture
in the Taan River valley (Fault VI; Fig. 4), a total of six
measured slip vectors vary from 256 to 3418 in azimuths in a
distance of 500 m. The net slips of these vectors also vary
from 1.0 to 5.9 m, and fault dip-angles from 14 to 748.
In some places the trace of the rupture is relatively
straight and the measured slip-azimuths are consistent. Still,
the fault-scarp heights and horizontal slips oscillate along
the rupture, with wavelengths of several hundred meters to
1 km. Examples of this case are shown on the rupture on the
southern bank of the Tachia River (Fault IV; Fig. 4) and the
rupture north of the Wu River (Fig. 5). In both places,
the fault-scarp heights and their correspondent horizontal
slips appear to show positive correlations (Figs. 4 and 5).
However, the measured fault dip-angles show as much as
208 variations (Figs. 4 and 5), which make the prediction of
horizontal slips from known fault-scarp heights imprecise.
The complexity of faulting processes is also shown on
ruptures that are dominated by lateral slips. The rupture in
Tungtou is an example (Fig. 6). Here, although the rupture is
straight and has a relatively uniform height, the lateral slip
changes by 2.4 m in a distance of 40 m (Fig. 6).
Our observed local variations of faulting parameters
suggest that the rupture is composed of multiple segments,
Fig. 6. Deformation of a tea farm near Tungtou. The middle lines between two rows of tea trees were surveyed by total station to document the detailed
characteristics of the faulting. Inset (for location see Fig. 1) shows location (E4). Legend and other notes as in Fig. 4. Note the local change of horizontal slip
vector, although the fault scarp appears to be straight and has a relatively uniform height.
Y.-H. Lee et al. / Journal of Structural Geology 25 (2003) 1917–1931 1923
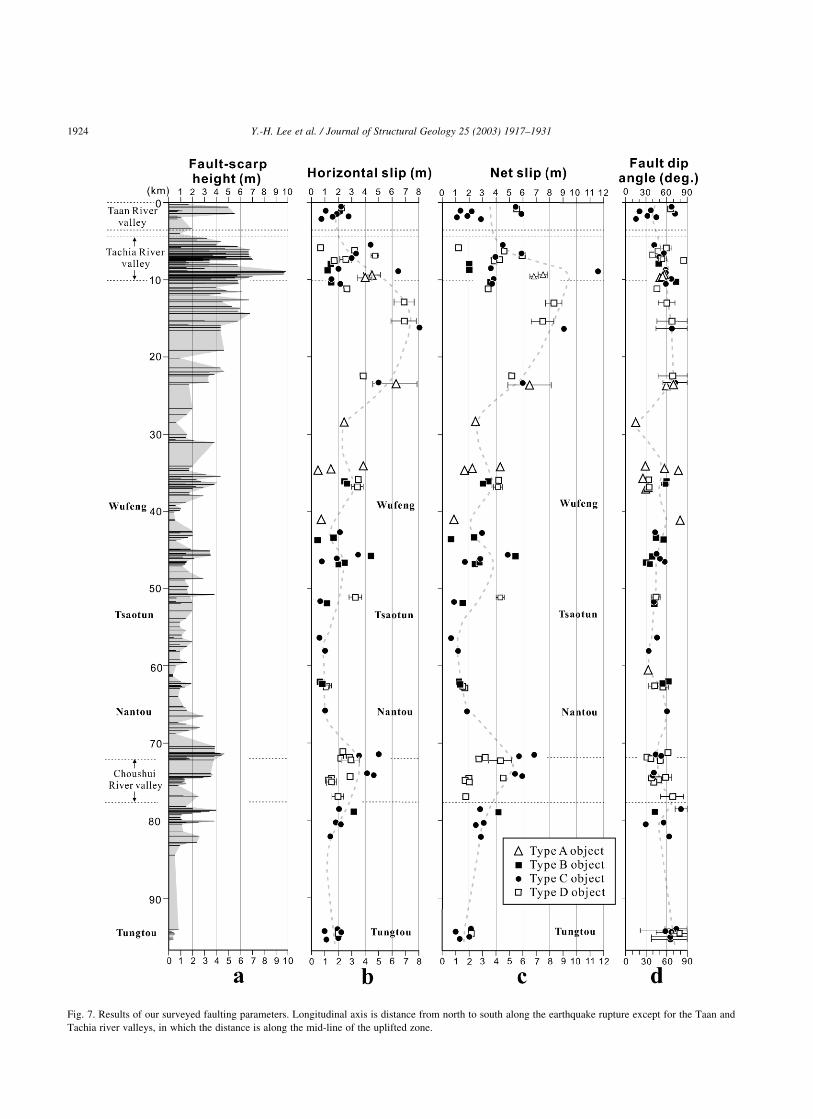
Fig. 7. Results of our surveyed faulting parameters. Longitudinal axis is distance from north to south along the earthquake rupture except for the Taan and
Tachia river valleys, in which the distance is along the mid-line of the uplifted zone.
Y.-H. Lee et al. / Journal of Structural Geology 25 (2003) 1917–19311924
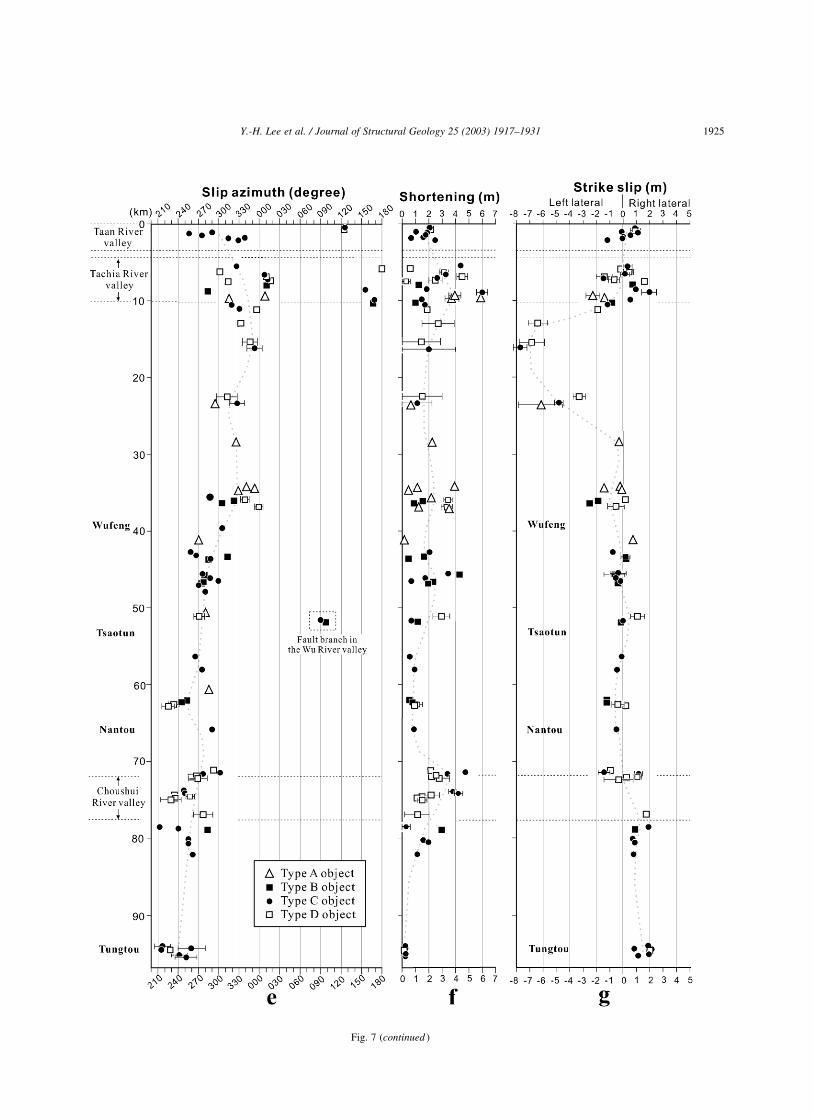
Fig. 7 (continued )
Y.-H. Lee et al. / Journal of Structural Geology 25 (2003) 1917–1931 1925
even if it appears to be continuous or uniform on a broader
scale. The origins of these diversities have yet to be made
clear. This nonetheless highlights the importance of survey
quantity to reduce potential bias upon regional patterns of
the faulting parameters.
4.2. Regional patterns
(1) Vertical slip. We obtained more than 300 values of
fault-scarp height (Fig. 7a). They are greater (maximum:
10 m) in the Taan and Tachia river valleys, decrease to the
south (,4.5 m), and appear to have lower values (,2 m) in
Tsaotun-Nantou and around Tungtou (Fig. 7a).
(2) Horizontal slip. Horizontal slip varies from ,1 to
6.5 m along the fault branches in the Taan and Tachia river
valleys (Figs. 4 and 7b). The values reach a maximum of
8 m about 6 km south of the mouth of the Tachia River
valley (Fig. 7b). From here to the south, the horizontal slip is
generally less than 4 m and appears to have lower values
(,2 m) in Tsaotun-Nantou and around Tungtou (,2.5 m)
(Fig. 7b).
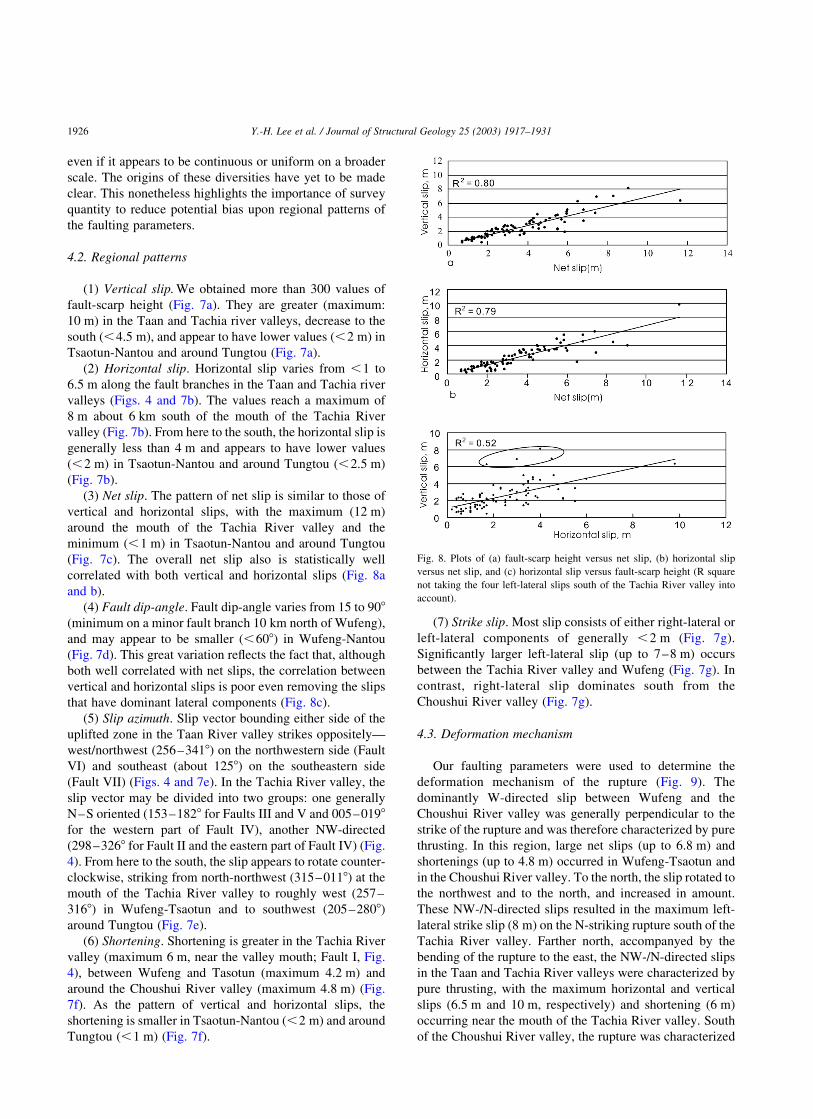
(3) Net slip. The pattern of net slip is similar to those of
vertical and horizontal slips, with the maximum (12 m)
around the mouth of the Tachia River valley and the
minimum (,1 m) in Tsaotun-Nantou and around Tungtou
(Fig. 7c). The overall net slip also is statistically well
correlated with both vertical and horizontal slips (Fig. 8a
and b).
(4) Fault dip-angle. Fault dip-angle varies from 15 to 908
(minimum on a minor fault branch 10 km north of Wufeng),
and may appear to be smaller (,608) in Wufeng-Nantou
(Fig. 7d). This great variation reflects the fact that, although
both well correlated with net slips, the correlation between
vertical and horizontal slips is poor even removing the slips
that have dominant lateral components (Fig. 8c).
(5) Slip azimuth. Slip vector bounding either side of the
uplifted zone in the Taan River valley strikes oppositely—
west/northwest (256–3418) on the northwestern side (Fault
VI) and southeast (about 1258) on the southeastern side
(Fault VII) (Figs. 4 and 7e). In the Tachia River valley, the
slip vector may be divided into two groups: one generally
N–S oriented (153–1828 for Faults III and V and 005–0198
for the western part of Fault IV), another NW-directed
(298–3268 for Fault II and the eastern part of Fault IV) (Fig.
4). From here to the south, the slip appears to rotate counter-
clockwise, striking from north-northwest (315–0118) at the
mouth of the Tachia River valley to roughly west (257–
3168) in Wufeng-Tsaotun and to southwest (205–2808)
around Tungtou (Fig. 7e).
(6) Shortening. Shortening is greater in the Tachia River
valley (maximum 6 m, near the valley mouth; Fault I, Fig.
4), between Wufeng and Tasotun (maximum 4.2 m) and
around the Choushui River valley (maximum 4.8 m) (Fig.
7f). As the pattern of vertical and horizontal slips, the
shortening is smaller in Tsaotun-Nantou (,2 m) and around
Tungtou (,1 m) (Fig. 7f).
(7) Strike slip. Most slip consists of either right-lateral or
left-lateral components of generally ,2 m (Fig. 7g).
Significantly larger left-lateral slip (up to 7–8 m) occurs
between the Tachia River valley and Wufeng (Fig. 7g). In
contrast, right-lateral slip dominates south from the
Choushui River valley (Fig. 7g).
4.3. Deformation mechanism
Our faulting parameters were used to determine the
deformation mechanism of the rupture (Fig. 9). The
dominantly W-directed slip between Wufeng and the
Choushui River valley was generally perpendicular to the
strike of the rupture and was therefore characterized by pure
thrusting. In this region, large net slips (up to 6.8 m) and
shortenings (up to 4.8 m) occurred in Wufeng-Tsaotun and
in the Choushui River valley. To the north, the slip rotated to
the northwest and to the north, and increased in amount.
These NW-/N-directed slips resulted in the maximum left-
lateral strike slip (8 m) on the N-striking rupture south of the
Tachia River valley. Farther north, accompanyed by the
bending of the rupture to the east, the NW-/N-directed slips
in the Taan and Tachia River valleys were characterized by
pure thrusting, with the maximum horizontal and vertical
slips (6.5 m and 10 m, respectively) and shortening (6 m)
occurring near the mouth of the Tachia River valley. South
of the Choushui River valley, the rupture was characterized
Fig. 8. Plots of (a) fault-scarp height versus net slip, (b) horizontal slip
versus net slip, and (c) horizontal slip versus fault-scarp height (R square
not taking the four left-lateral slips south of the Tachia River valley into
account).
Y.-H. Lee et al. / Journal of Structural Geology 25 (2003) 1917–19311926

Fig. 9. Comparison between horizontal slip surveyed in this study and slip of the thrust block by GPS. Percentage (in parenthesis) adjacent to slip vector on the
rupture is the proportion of the slip to the slip recorded at the nearest GPS station on the hanging-wall side of the rupture (projected to the same azimuth).
Legend and other notes as in Figs. 1 and 4. Note the apparent discrepancy between the slip on the earthquake rupture and the slip by GPS south of the Choushui
River valley. Inset summarizes the deformation mechanism of the surface rupture.
Y.-H. Lee et al. / Journal of Structural Geology 25 (2003) 1917–1931 1927

by oblique, SW-directed thrust with a right-lateral com-
ponent (maximum: 1.9 m). The right-lateral slips (maxi-
mum: 2.4 m) dominated at the southern end of the rupture
(striking northeast) near Tungtou.
5. Discussion and conclusions
5.1. Discrepancy with GPS data
Our data are consistent with the seismological and GPS
data in that the slip vector of the earthquake rupture
progressively rotates and increases in amount to the north
(Fig. 9; Kao and Chen, 2000; Mori and Ma, 2000; Yu et al.,
2001). We obtained the maximum values of horizontal slip
south of the Tachia River valley, which is the place where
the maximum slip was recorded by GPS. Also, the fault
scarp is higher in the north. This is consistent with the GPS
data (Yu et al., 2001) and is comparable with those from
near-source strong motion records (Ma et al., 2001).
Our measured slip vectors, however, appear to cover a
wider range of azimuth than the slip revealed by GPS
surveys (i.e. the slip on the rupture makes a greater rotation
from one end to the other end of the rupture than the entire
thrust block) (Fig. 9). This difference is particularly shown
in the area south of the Choushui River valley where the
dominantly W-/SW-directed slips on the rupture are only
locally recorded at a GPS station (Fig. 9). Yu et al. (2001)
suspected that the data recorded at this station might involve
artificial errors. Our data, however, argue that this may not
be the case, and that the area slipped to the southwest during
the earthquake.
It is possible that we missed measuring some horizontal
slips that are greater than our measurements (for example,
not all of our measurements were made on the rupture that
has local maximum scarp heights). Also, there likely exist
coseismic folds or minor, undetected thrust faults behind the
rupture. Given these, it is expected that our obtained
horizontal slip should not be greater than the slip recorded at
GPS stations that are away from the rupture. Indeed, all of
our obtained horizontal-slip values north of the Choushui
River valley are smaller than those recorded at GPS stations
(Fig. 9). The area south of the Choushui River valley,
however, shows different results. Here, not only are the
azimuths inconsistent as mentioned above, but many of our
horizontal-slip measurements are larger than the slip values
from nearby GPS stations (Fig. 9). This is true even
considering the slip recorded at the GPS stations on the
footwall side (,1 m; Fig. 9) for the total slip across the
rupture.
We suspect that this discrepancy could reflect the
differential movement of the thrust block during the
earthquake sequences (Fig. 10). As shown by the seismo-
logical data (Fig. 1), the thrusting initiated in the south (to
southwest-west) and progressively rotated and propagated
to the north (Kao and Chen, 2000). We propose that under
this process much of the thrust block in the south had rotated
and moved to the north after its initial SWW-directed
motion (Fig. 10). The accumulated slips of this movement
were recorded by GPS, which was surveyed on the thrust
block away from the surface rupture (i.e. where the thrust
block is relatively thick). In contrast, it is unlikely that any
rotation of the thrust block could have occurred on the
surface rupture, which is irregular and apparently has
greater friction. In other words, our measured slip vectors
are likely to record only the initial movement of the thrust
block (Fig. 10). This explains why the measured slip
azimuths along the southern part of the rupture are more
consistent with the seismological data (i.e. Subevent 1) than
GPS data. Also, in this region, as the interior thrust block,
Fig. 10. Cartoon showing the proposed deformation sequence of the thrust
block during the 1999 Chi-chi earthquake. (a) The southern part of the
thrust block moved to the west/southwest (Subevent 1 in Fig. 1). (b) As the
rupture propagated northward (Subevents 2–4 in Fig. 1), the entire thrust
block was drawn to the northwest. The GPS data surveyed away from the
surface rupture record the accumulated slip of this sequence. The slip on the
surface rupture, however, was unlikely to rotate after the movement. This
results in the contrast between our measured slip azimuth (and amount) and
that by GPS in the southern part of the thrust block.
Y.-H. Lee et al. / Journal of Structural Geology 25 (2003) 1917–19311928

Table 1
Site no.a Long.
(E)
Lat.
(N)
Type
(Fig. 2)
Fault azimuth
(8)
Vertical slip
(m)
Hori. slip
(m)
Net slip
(m)
Fault dip-angle
(8)
Slip azimuth
(8)
Shortening
(m)
Strike slipb
(m)
A1 120.8341 24.2996 C 235–245 5.0 2.1–2.3 5.4–5.5 66–69 126–127 1.9–2.2 0.7–1.1
A2 120.8341 24.2996 D 235–245 5.0 2.1–2.5 5.4–5.6 64–69 122–128 1.9–2.4 0.6–1.3
A3 120.8247 24.3003 C 009–019 0.8 1.0–1.1 1.3–1.4 36–39 290–291 1.0–1.1 (20.2)–0.0
A4 120.8245 24.3018 C 011–021 0.7 2.1–2.2 2.1–2.3 19–22 256–257 1.7–2.0 0.9–1.3
A5 120.8235 24.2998 C 017–027 5.5 1.8–2.0 5.8–5.9 71–74 273–275 1.6–1.9 0.4–0.8
A6 120.8234 24.2995 C 055–065 1.0 1.6 1.9 32 314 1.6 (20.1)–0.1
A7 120.8220 24.2981 C 051–061 0.7 0.7–0.8 1.0–1.1 41–49 325–332 0.6–0.8 (20.1)–0.0
A8 120.8213 24.2975 C 038–048 0.7 2.6–2.9 2.7–3.0 14–18 335–341 2.2–2.7 (21.4)–(21.0)
A9 120.7903 24.2840 C 055–065 4.0 4.4 4.5 42–43 326 4.3–4.4 0.0–0.7
A10 120.7900 24.2740 D 240–260 1.0 0.5–0.8 1.1–1.3 51–68 178–182 0.4–0.8 (20.3)–(20.1)
A11 120.7871 24.2807 D 040–050 3.4 3.0–3.4 4.5–4.8 45–51 298–304 2.8–3.4 0.2–0.8
A12 120.7819 24.2805 C 095–105 4.8 3.2–3.4 5.8–5.9 55–57 006–009 3.1–3.4 (20.2)–0.5
A13 120.7810 24.2805 D 078–088 3.7 4.4–5.0 5.7–6.2 37–42 009–011 4.1–4.9 (22.0)–(20.8)
A14 120.7780 24.2800 C 065–075 3.0 3.0 3.9–4.0 48–50 012 2.5–2.7 (21.6)–(21.4)
A15 120.7750 24.2796 D 087–097 3.4 2.1–3.0 4.0–4.5 49–60 015–019 2.0–3.0 (21.1)–(20.3)
A16 120.7700 24.2787 B 065–075 1.4 1.4 2.0 47–52 010 1.1–1.3 0.6–0.8
A17 120.7749 24.2879 D 119–129 3.4 1.5–1.9 3.7–3.9 80–90 310–318 0.0–0.6 1.5–1.8
A18 120.7619 24.2804 C 270–280 3.0 1.9–2.1 3.6–3.7 56–62 153–158 1.6–2.0 0.8–1.1
A19 120.7604 24.2858 B – 1.6 1.2 2.0 – 283 – –
A20 120.7605 24.2844 C 085–095 9.8 6.1–6.5 11.5–11.8 57–60 341–343 5.6–6.4 1.4–2.5
A21 120.7528 14.2822 A 068 6.0 3.9–5.1 7.1–7.9 54–60 005–011 3.5–4.3 (22.8)–(21.8)
A22 120.7528 24.2822 A 024 5.5 3.4–4.5 6.5–7.1 51–58 315 3.2–4.2 (21.6)–(21.2)
A23 120.7572 24.2860 A 065 7.0 – – 50 – 5.9 –
A24 120.7520 24.2790 C 270–280 3.5 1.5–1.6 3.8 67–68 168–169 1.4–1.5 0.3–0.6
B1 120.7490 24.2760 B 031–041 3.3 1.4 3.6 73 168 1.0 (20.9)
B2 120.7469 24.2743 C 325–335 3.0 1.9–2.3 3.6–3.8 57–62 318–319 1.6–1.9 (21.3)–(21.1)
B3 120.7447 24.2713 C 020–040 4.0 – – – 330 – –
B4 120.7445 24.2711 D 037–047 2.0 2.5–2.8 3.2–3.4 44–50 353–359 1.7–2.1 (22.1)–(21.8)
B5 120.7372 24.2560 D 345–355 4.5 6.2–7.7 7.7–8.9 49–72 330–337 1.5–3.9 (27.1)–(25.7)
B6 120.7284 24.2379 D 340–000 3.0 5.9–7.8 6.6–8.3 46–90 335–358 0.0–2.9 (27.8)–(25.9)
B7 120.7260 24.2370 C 350–010 4.0 7.9–8.3 8.9–9.2 45–90 341–004 0.0–4.0 (28.2)–(27.2)
B8 120.7268 24.1750 D 323–343 3.3 3.6–4.1 4.9–5.3 48–90 297–328 0.0–3.0 (23.7)–(22.8)
B9 120.7258 24.1749 C 323–343 3.3 4.9–5.1 5.9–6.1 55–90 316–339 0.0–2.3 (25.1)–(24.5)
B10 120.7254 24.1759 A 300 1.7 4.6–7.9 4.9–8.1 65–75 294 0.5–0.8 (27.9)–(24.6)
B11 120.7309 24.1341 A 044 0.6 2.3–2.4 2.3–2.5 15 322–329 2.2 (20.4)–(20.2)
B12 120.7169 24.0883 A 065 2.0 3.8 4.3 28 340 3.8 20.3
B13 120.7231 24.0883 A 045 1.7 1.4 2.2 57 352 1.1 21.4
B14 120.7280 24.0880 A 045 1.7 0.4 1.7 77 327 0.4 20.1
B15 120.7144 24.0820 C 065–075 2.0 – – – 287 – –
B16 120.7145 24.0817 A 047 1.0 – – 25 – 2.1 –
B17 120.7131 24.0788 D 055–065 2.3 3.3–3.7 4.0–4.4 32–37 332–342 3.1–3.7 (21.0)–0.4
B18 120.7134 24.0791 B 355–005 2.7 2.4 3.4 59–61 322 1.5–1.6 (21.8)–(22.0)
B19 120.7136 24.0800 B 319–329 1.4 2.7 3.0 52–63 304 0.7–1.1 (22.4)–(22.6)
B20 120.7134 24.0791 D 075–085 2.3 3.0–3.7 3.8–4.4 32–38 353–005 2.9–3.7 (21.2)–0.1
B21 120.7134 24.0790 A 000 2.0 – – 30 – 3.5 –
C1 120.0963 24.0630 C 355–005 1.0 – – – 305 – –
C2 120.0930 24.0546 A 082 0.5 0.7 0.9 80 269 0.1 0.7
C3 120.6901 24.0451 C 323–333 2.0 2.1–2.2 2.9–3.0 42–46 257–259 1.9–2.2 (21.0)–(20.5)
C4 120.6903 24.0447 C 351–001 2.0 – – – 266 – –
C5 120.6898 24.0411 B 040–060 1.6 1.7 2.3 43–45 312 1.6–1.7 (20.1)–0.5
C6 120.6898 24.0412 C 035–045 1.0 – – – 287 – –
C7 120.6700 24.0415 B 044–054 0.6 0.4 0.7 56 285 0.4 0.2
C8 120.6896 24.0250 C 350–010 3.5 3.5 4.9 45–46 276 3.4–3.5 (21.0)–0.2
C9 120.6904 24.0267 B 350–010 3.5 4.3 5.5 39–40 279 4.1–4.3 (21.4)–0.1
C10 120.6884 24.0200 C 355–005 2.1 1.8–1.9 2.8 49–51 287–288 1.7–1.8 (20.7)–(20.4)
C11 120.6883 24.0208 C 008–018 1.5 2.6 3.06 28 299–300 2.25 1.3
C12 120.6884 24.0206 B 355–005 1.4 2.4 2.8 30–31 278 2.3–2.4 (20.5)–(20.1)
C13 120.6884 24.0205 B 350–000 1.4 2.0 2.4 36–37 275 1.9–2.0 (20.5)–(20.2)
C14 120.6884 24.0207 C 345–355 1.2 – – – 270 – –
C15 120.6883 24.0150 C 015–025 1.7 – – – 274 – –
C16 120.6821 23.9816 D 017–027 2.8 2.8–3.7 4.0–4.6 38–51 263–279 2.3–3.6 0.7–1.6
(continued on next page)
Y.-H. Lee et al. / Journal of Structural Geology 25 (2003) 1917–1931 1929

but not its frontal part, had moved (to the north) opposite to
its initial motion (to the southwest-west), the net slip values
of this thrust block (by GPS) may be smaller than those
surveyed on the surface rupture.
5.2. Discrepancy with seismological data
Although diverging, the fault dip-angles we obtained
(mostly .308; Fig. 7d) are apparently larger than the dip-
angle of the seismogenic fault (20–308) based on earth-
quake fault plane solutions (Kao and Chen, 2000). The
surface rupture was commonly associated with a broad
anticlinal fold on the hanging-wall side. The entire short-
ening across the rupture thus could be underestimated at
many sites. This would yield an apparent, larger fault-dip
angle (e.g. Fig. 3). On the other hand, we observed that
the fault plane of the rupture was commonly parallel to the
bedding of the bedrock, where exposed adjacent to the
rupture. Note that near the rupture the strata generally dip at
.408, which are comparable with most of the fault-dip
angles we calculated. We thus argue that the error of our
obtained fault dip-angle is minor and cannot account for the
total difference in dip-angle between the surface and
seimogenic faults. Instead, we believe that the seimogenic
fault steepens as it propagated to the surface.
Perhaps the greatest inconsistency between the surface
rupture measurements and the seismological data occurs
where the rupture ends to the north and to the south.
Apparently, there is no surface rupture related to the final
subevent of the main shock determined by Kao and Chen
(2000). In addition, the strike-slip fault zones defined by the
aftershock sequences (Kao and Chen, 2000), which may
serve as lateral ramps of the thrust block in depth, are
unclear on the surface. In the Tachia and Taan river valleys
in the north, our data suggest that the regionally NNW-
directed thrusting by GPS was partitioned into two parts,
Table 1 (continued)
Site no.a Long.
(E)
Lat.
(N)
Type
(Fig. 2)
Fault azimuth
(8)
Vertical slip
(m)
Hori. slip
(m)
Net slip
(m)
Fault dip-angle
(8)
Slip azimuth
(8)
Shortening
(m)
Strike slipb
(m)
C17 120.6814 23.9888 C 007–017 1.6 – – – 280 – –
C18 120.7048 23.9775 C 175–185 0.6 0.7 0.9 41 90 0.7 (20.1)–0.1
C19 120.7045 23.9775 B 175–185 1.0 1.1 1.5 42 97 1.1 (20.2)–(20.1)
C20 120.6942 23.9473 C 335–345 0.4 0.6 0.7 34–39 265 0.5–0.6 (20.2)–(20.1)
C21 120.6999 23.9346 C 332–342 0.6 1.0 1.2 31–37 274–276 0.8–1.0 (20.5)–(20.4)
C22 120.6969 23.9130 A 010 – – – 30 285 – –
C23 120.7005 23.8978 B 305–325 1.0 0.6 1.2 59–63 252 0.5–0.6 (20.4)–(20.1)
C24 120.7005 23.8977 B 305–325 1.0 0.8 1.3 51–55 245 0.7–0.8 (20.4)–(20.1)
C25 120.7750 23.8976 D 300–320 1.0 0.9–1.5 1.3–1.8 34–51 225–241 0.8–1.5 (20.8)–0.1
C26 120.7021 23.8956 D 322–332 1.3 0.9–1.2 1.6–1.8 47–62 216–234 0.7–1.2 (20.1)–0.4
C27 120.7067 23.8760 C 345–355 1.5 1.0–1.1 1.8–1.9 59–62 290 0.8–0.9 (20.6)–(20.4)
D1 120.7017 23.8327 D 351–001 3.9 2.2–2.5 4.5–4.6 58–64 292 1.9–2.4 (21.2)–(20.7)
D2 120.7021 23.8355 C 010–020 4.6 5.0 6.8 43–45 302 4.6–4.9 (21.8)–(21.0)
D3 120.7017 23.8324 C 020–030 4.4 3.6 5.7 51–53 276 3.3–3.5 0.8–1.5
D4 120.7011 23.8311 D 015–025 1.5 2.6–3.0 3.0–3.4 28–34 265–268 2.2–2.8 0.7–1.4
D5 120.7011 23.8308 D 350–000 1.7 2.0–2.4 2.6–2.9 35–40 258–259 2.0–2.4 0.0–0.5
D6 120.7019 23.8275 D 341–001 3.8 2.3–3.7 4.4–5.3 46–54 255–283 2.0–3.7 (21.4)–0.7
D7 120.6981 23.8098 C 359–009 3.5 4.0–4.3 5.3–5.5 40–45 247–249 3.5–4.1 1.5–2.2
D8 120.6981 23.8097 C 359–009 3.7 4.5–4.9 5.8–6.1 39–43 249–251 3.9–4.6 1.6–2.2
D9 120.6891 23.9095 D 357–017 3.5 2.6–3.1 4.4–4.7 51–68 230–239 1.4–2.8 1.5–2.3
D10 120.6983 23.8081 D 344–354 1.2 1.3–1.7 1.8–2.1 35–43 251–264 1.3–1.7 (20.3)–0.3
D11 120.6983 23.8080 D 344–354 1.2 1.0–1.4 1.6–1.8 43–53 230–240 0.9–1.3 0.4–0.8
D12 120.6983 23.8074 D 305–315 1.3 1.2–1.8 1.8–2.2 36–47 214–244 1.2–1.8 (20.7)–0.3
D13 120.7006 23.7936 D 055–075 2.5 1.6–2.4 3.0–3.5 51–85 263–291 0.2–2.0 1.5–2.0
D14 120.7014 23.7772 C 025–035 2.0 1.9–2.0 2.8 73–90 212–223 0–0.6 1.9
D15 120.7026 23.7785 C 345–355 4.0 – – – 240 – –
D16 120.7010 23.7768 B 025–035 2.7 3.1 4.1 42–43 283 2.9–3.0 0.6–1.2
D17 120.7004 23.7698 C 005–015 2.5 1.8 3.1 56–57 255 1.6–1.7 0.6–0.9
D18 120.7004 23.7697 C 005–015 1.1 2.2 2.5 29–30 255 1.9–2.0 0.7–1.1
D19 120.6947 23.7486 C 020–030 2.5 1.3–1.5 2.8–2.9 61–67 257–265 0.9–1.4 0.7–0.9
E1 120.6540 23.6578 C 025–035 0.8 1.9–2.0 2.1–2.2 58–90 205–229 0.0–0.5 1.8–2.0
E2 120.6535 23.6574 C 060–070 0.2 0.9–1.0 0.9–1.0 22–90 240–280 0.0–0.5 0.7–1.0
E3 120.6524 23.6562 C 025–035 0.4 2.2 2.2 45–90 215 0.0–0.06 2.3–2.4
E4 120.6507 23.6543 D 041–051 0.5 2.36 2.41 68–90 240 0.05 2.36
E5 120.6486 23.6517 C 050–060 0.4 2.0 2.0 39–90 230–254 0.0–0.5 1.9–2.0
E6 120.6481 23.6515 C 055–065 0.4 1.1–1.2 1.1–1.3 39–90 235–268 0.0–0.5 1.0–1.1
a A1–A8: Taan River valley; A9–A24: Tachia River valley; B1–B21: Tachia River valley-Wufeng; C1–C27: Wufeng-Nantou; D1–D19: around Choushui
River valley; E1–E6: around Tungtou.b Positive: right-lateral slip; negative: left lateral slip.
Y.-H. Lee et al. / Journal of Structural Geology 25 (2003) 1917–19311930

one N-directed and another NW-directed; both are charac-
terized by pure thrusting along distinct segments of the
rupture (Figs. 4 and 9). In the south, the seismogenic NW-
trending left-lateral fault may link to the deformations along
the Luliao fault. However, these deformations are recog-
nized for only several kilometers in length, much shorter
than the seismogenic fault that extends for 50 km (Kao and
Chen, 2000). The surface rupture in fact bends south-
westward before it ends. The dominant right-lateral slip
there does not appear to correspond to any right-lateral focal
mechanisms from subevents of the main shock or
aftershocks.
The lack of the surface expression of the seismogenic
faults to the north and to the south suggests that the
movement of these faults in the deeper crust is accom-
modated by wide deformational zones as they propagate to
the surface. On the other hand, both the ending parts of the
surface rupture may initiate at a relatively shallow crust.
They may be triggered by the major seismogenic burst and
move ‘passively’ during the earthquake. The characteristics
of these portions of the surface rupture thus could reflect the
strain condition of the crust shallower than the seismogenic
zone. Still, how and why the strain in the shallow crust
accumulated before the earthquake remains unclear.
Acknowledgements
This study is sponsored by the Central Geological
Survey, ROC and National Science Council, Taiwan,
ROC. We greatly thank Dr Hui-Cheng Chang of the
Geological Survey for his kindly support and helpful
discussion. We also thank Dr Tom Fumal and Dr James
Evans of Utah State University for their kindly review of
this paper. Gratitude is also due to Mr Richard Heermance
of Utah State University and Miss Hui-chi Kuo of National
Taiwan Normal University for proof reading the manuscript
of this paper.
Appendix A
See Table 1.
References
Central Geological Survey, 1999. Report of the Geological Survey of the
1999 Chi-Chi Earthquake. Central Geological Survey, Ministry of
Economic Affairs, ROC (in Chinese).
Chang, S.L., 1971. Subsurface geologic study of the Taichung basin.
Petroleum Geology of Taiwan 8, 21–45.
Chinese Petroleum Corporation, 1974. Geological map of Miaoli. Chinese
Petroleum Corporation, ROC, scale 1:100,000.
Chinese Petroleum Corporation, 1982. Geological map of Taichung.
Chinese Petroleum Corporation, ROC, scale 1:100,000.
Chinese Petroleum Corporation, 1986. Geological map of Chaiyi. Chinese
Petroleum Corporation, ROC, scale 1:100,000.
Kao, H., Chen, W.P., 2000. The Chi-Chi earthquake sequence: active, out-
of-sequence thrust faulting in Taiwan. Science 288, 2346–2439.
Ma, K.F., Mori, J., Lee, S.J., Yu, S.B., 2001. Spatial and temporal
distribution of the slip for the 1999 Chi-Chi earthquake. Bulletin of
Seismological Society of America 91 (5), 1068–1087.
Mori, J., Ma, K.F., 2000. Review of seismological results from the 1999
Chichi, Taiwan, earthquake. American Geophysical Union 2000 Fall
Meeting Abstract, F873.
Sharp, R.V., 1975. Displacement on tectonic ruptures. California Division
Mines and Geology Bulletin 196, 187–194.
Yu, S.B., Chen, H.Y., Kuo, L.C., 1997. Velocity field of GPS stations in the
Taiwan area. Tectonophysics 274, 41–59.
Yu, S.B., Kuo, L.C., Hsu, Y.J., Su, H.H., Liu, C.C., 2001. Preseismic
deformation and coseismic displacements associated with the 1999 Chi-
Chi, Taiwan earthquake. Bulletin of Seismological Society of America
91 (5), 995–1012.
Y.-H. Lee et al. / Journal of Structural Geology 25 (2003) 1917–1931 1931