Skip the Trip: Air Travelers' Behavioral Responses to Pandemic Influenza
10
Skip the Trip: Air Travelers’ Behavioral Responses to Pandemic Influenza Eli P. Fenichel 1 *, Nicolai V. Kuminoff 2 , Gerardo Chowell 3,4 1 Yale School of Forestry and Environmental Studies, New Haven, Connecticut, United States of America, 2 Department of Economics, Arizona State University, Tempe, Arizona, United States of America, 3 School of Human Evolution and School Change, Arizona State University, Tempe, Arizona, United States of America, 4 Division of Epidemiology and Population Studies, Fogarty International Center, National Institutes of Health, Bethesda, Maryland, United States of America Abstract Theory suggests that human behavior has implications for disease spread. We examine the hypothesis that individuals engage in voluntary defensive behavior during an epidemic. We estimate the number of passengers missing previously purchased flights as a function of concern for swine flu or A/H1N1 influenza using 1.7 million detailed flight records, Google Trends, and the World Health Organization’s FluNet data. We estimate that concern over ‘‘swine flu,’’ as measured by Google Trends, accounted for 0.34% of missed flights during the epidemic. The Google Trends data correlates strongly with media attention, but poorly (at times negatively) with reported cases in FluNet. Passengers show no response to reported cases. Passengers skipping their purchased trips forwent at least $50 M in travel related benefits. Responding to actual cases would have cut this estimate in half. Thus, people appear to respond to an epidemic by voluntarily engaging in self- protection behavior, but this behavior may not be responsive to objective measures of risk. Clearer risk communication could substantially reduce epidemic costs. People undertaking costly risk reduction behavior, for example, forgoing nonrefundable flights, suggests they may also make less costly behavior adjustments to avoid infection. Accounting for defensive behaviors may be important for forecasting epidemics, but linking behavior with epidemics likely requires consideration of risk communication. Citation: Fenichel EP, Kuminoff NV, Chowell G (2013) Skip the Trip: Air Travelers’ Behavioral Responses to Pandemic Influenza. PLoS ONE 8(3): e58249. doi:10.1371/journal.pone.0058249 Editor: Maciej F. Boni, University of Oxford, Vietnam Received October 18, 2012; Accepted February 5, 2013; Published March 20, 2013 Copyright: ß 2013 Fenichel et al. This is an open-access article distributed under the terms of the Creative Commons Attribution License, which permits unrestricted use, distribution, and reproduction in any medium, provided the original author and source are credited. Funding: U.S. Airways Corporation generously provided data and background information on the airline industry. This publication was made possible by grant number 1R01GM100471-01 from the National Institute of General Medical Sciences (NIGMS) at the National Institutes of Health. Its contents are solely the responsibility of the authors and do not represent the official views of NIGMS or US Airways. The funders had no role in study design, data collection and analysis, decision to publish, or preparation of the manuscript. Competing Interests: The authors have declared that no competing interests exist. * E-mail: [email protected] Introduction There has been a rapid rise in interest in how behavioral change in response to the risk of contracting an infectious disease influences epidemiological dynamics and public health outcomes [1–5]. Measuring behavioral responses is important for testing theories and for informing public health policy. Moreover, measuring behavioral responses is important in its own right to evaluate public health communication strategies and measure the cost of epidemics. One type of response that may be particularly important is a change in the behavior of air travelers [6]. Air travelers have the potential to rapidly spread infectious disease over long distances [7,8]. Moreover, air travel is perceived to be a risky behavior with respect to infectious diseases such as influenzas. There has been considerable interest in the role of air travel, and possible air travel restrictions, on the spread of an infectious disease such as avian or 2009 A/H1N1 influenza, commonly called swine flu [7,9,10]. Previous studies have concluded that the net benefits to society of air travel restrictions are at best small [11–13], but most models rely on assumptions that have not been confronted with data [14]. What does seem clear is that flying increases the likelihood of air travelers contracting an infectious disease conditional on there being on infectious person on the airplane [15,16], and that the public links flying with infection risk. Air travel may increase private infection risk beyond an acceptable level, and public health interventions related to travel and airport surveillance programs may benefit travelers [17,18]. In this paper, we take advantage of the high cost of flying and the high perceived risk of infection associated with flying along with a novel dataset of flight records to investigate whether travelers changed their travel decisions in response to a pandemic influenza. Then we quantify a lower bound on the cost of such adjustments. We also contrast travelers’ responsiveness to subjec- tive measures of public concern for the epidemic with their responsiveness to objective measures of the state of the epidemic. Air travel is a unique activity. Tickets are often purchased weeks in advance, are non-refundable and non-transferable, and represent non-trivial expenditures. Economic theory suggests that an individual values a trip at a value at least as great as the price paid for the ticket. It follows that individuals who choose not to use a pre-paid ticket, as a result of an ongoing infectious disease epidemic, value the perceived reduction in infection risk at least as much as the cost of canceling their flight. Travelers who use their tickets may still value a reduction in health risk, but the value they assign to this reduction must be less than the cost of forgoing a pre- paid trip. Johansson et al. [14] assert that the value of a trip is often much greater than the health benefits of forgoing a trip and PLOS ONE | www.plosone.org 1 March 2013 | Volume 8 | Issue 3 | e58249
-
Upload
independent -
Category
Documents
-
view
0 -
download
0
Transcript of Skip the Trip: Air Travelers' Behavioral Responses to Pandemic Influenza

Skip the Trip: Air Travelers’ Behavioral Responses toPandemic InfluenzaEli P. Fenichel1*, Nicolai V. Kuminoff2, Gerardo Chowell3,4
1 Yale School of Forestry and Environmental Studies, New Haven, Connecticut, United States of America, 2 Department of Economics, Arizona State University, Tempe,
Arizona, United States of America, 3 School of Human Evolution and School Change, Arizona State University, Tempe, Arizona, United States of America, 4 Division of
Epidemiology and Population Studies, Fogarty International Center, National Institutes of Health, Bethesda, Maryland, United States of America
Abstract
Theory suggests that human behavior has implications for disease spread. We examine the hypothesis that individualsengage in voluntary defensive behavior during an epidemic. We estimate the number of passengers missing previouslypurchased flights as a function of concern for swine flu or A/H1N1 influenza using 1.7 million detailed flight records, GoogleTrends, and the World Health Organization’s FluNet data. We estimate that concern over ‘‘swine flu,’’ as measured by GoogleTrends, accounted for 0.34% of missed flights during the epidemic. The Google Trends data correlates strongly with mediaattention, but poorly (at times negatively) with reported cases in FluNet. Passengers show no response to reported cases.Passengers skipping their purchased trips forwent at least $50 M in travel related benefits. Responding to actual caseswould have cut this estimate in half. Thus, people appear to respond to an epidemic by voluntarily engaging in self-protection behavior, but this behavior may not be responsive to objective measures of risk. Clearer risk communicationcould substantially reduce epidemic costs. People undertaking costly risk reduction behavior, for example, forgoingnonrefundable flights, suggests they may also make less costly behavior adjustments to avoid infection. Accounting fordefensive behaviors may be important for forecasting epidemics, but linking behavior with epidemics likely requiresconsideration of risk communication.
Citation: Fenichel EP, Kuminoff NV, Chowell G (2013) Skip the Trip: Air Travelers’ Behavioral Responses to Pandemic Influenza. PLoS ONE 8(3): e58249.doi:10.1371/journal.pone.0058249
Editor: Maciej F. Boni, University of Oxford, Vietnam
Received October 18, 2012; Accepted February 5, 2013; Published March 20, 2013
Copyright: � 2013 Fenichel et al. This is an open-access article distributed under the terms of the Creative Commons Attribution License, which permitsunrestricted use, distribution, and reproduction in any medium, provided the original author and source are credited.
Funding: U.S. Airways Corporation generously provided data and background information on the airline industry. This publication was made possible by grantnumber 1R01GM100471-01 from the National Institute of General Medical Sciences (NIGMS) at the National Institutes of Health. Its contents are solely theresponsibility of the authors and do not represent the official views of NIGMS or US Airways. The funders had no role in study design, data collection and analysis,decision to publish, or preparation of the manuscript.
Competing Interests: The authors have declared that no competing interests exist.
* E-mail: [email protected]
Introduction
There has been a rapid rise in interest in how behavioral change
in response to the risk of contracting an infectious disease
influences epidemiological dynamics and public health outcomes
[1–5]. Measuring behavioral responses is important for testing
theories and for informing public health policy. Moreover,
measuring behavioral responses is important in its own right to
evaluate public health communication strategies and measure the
cost of epidemics. One type of response that may be particularly
important is a change in the behavior of air travelers [6].
Air travelers have the potential to rapidly spread infectious
disease over long distances [7,8]. Moreover, air travel is perceived
to be a risky behavior with respect to infectious diseases such as
influenzas. There has been considerable interest in the role of air
travel, and possible air travel restrictions, on the spread of an
infectious disease such as avian or 2009 A/H1N1 influenza,
commonly called swine flu [7,9,10]. Previous studies have
concluded that the net benefits to society of air travel restrictions
are at best small [11–13], but most models rely on assumptions
that have not been confronted with data [14]. What does seem
clear is that flying increases the likelihood of air travelers
contracting an infectious disease conditional on there being on
infectious person on the airplane [15,16], and that the public links
flying with infection risk. Air travel may increase private infection
risk beyond an acceptable level, and public health interventions
related to travel and airport surveillance programs may benefit
travelers [17,18].
In this paper, we take advantage of the high cost of flying and
the high perceived risk of infection associated with flying along
with a novel dataset of flight records to investigate whether
travelers changed their travel decisions in response to a pandemic
influenza. Then we quantify a lower bound on the cost of such
adjustments. We also contrast travelers’ responsiveness to subjec-
tive measures of public concern for the epidemic with their
responsiveness to objective measures of the state of the epidemic.
Air travel is a unique activity. Tickets are often purchased weeks
in advance, are non-refundable and non-transferable, and
represent non-trivial expenditures. Economic theory suggests that
an individual values a trip at a value at least as great as the price
paid for the ticket. It follows that individuals who choose not to use
a pre-paid ticket, as a result of an ongoing infectious disease
epidemic, value the perceived reduction in infection risk at least as
much as the cost of canceling their flight. Travelers who use their
tickets may still value a reduction in health risk, but the value they
assign to this reduction must be less than the cost of forgoing a pre-
paid trip. Johansson et al. [14] assert that the value of a trip is often
much greater than the health benefits of forgoing a trip and
PLOS ONE | www.plosone.org 1 March 2013 | Volume 8 | Issue 3 | e58249

assume that infection risk does not affect flying behavior. In this
paper, we test the hypothesis that indices of infection risk
influenced the number of passengers changing travel plans,
forgoing pre-paid tickets, and missing flights using data from 1.7
million flights operated by a major US air carrier.
For people to adapt their behavior to an epidemic, they must be
informed about the epidemic. Prior research focused on how the
media and information influence epidemics [19–22]. We use a
Google Trends index of the intensity of internet searches for the
phrase ‘‘swine flu’’ as a potential proxy for the public’s perceived
risk of infection. Google Trends is distinct from Google Flu
Trends. Google Trends has been shown to track public sediment
in other social areas, such as consumer confidence [23].
Furthermore, the search index we use is highly correlated with
the volume of news stories on the swine flu epidemic (R = 0.98), as
reported by Google. We compare travelers’ responses to the
Google Trends index to travelers’ responses to the number of
reported confirmed A/H1N1 cases in the World Health Organi-
zation’s FluNet database.
Our results suggest that a subset of passengers, who had already
purchased tickets, chose not to fly in response to swine flu. Equally
important, we demonstrate that this avoidance behavior did not
track the incidence curve of reported confirmed A/H1N1 cases.
Travelers appear to have responded to the incidence of media
attention to swine flu, which was generally weakly, and at times
negatively, correlated with objective measures of risk. We use data
on flight prices to estimate a lower bound of the value of
eliminating infection risk to air passengers, and a lower bound on
the value of communications strategies that more accurately track
cases. Our analysis has two broad implications. First, some people
make costly changes in behavior to avoid infection, even without
government mandated policies for social distancing [24–28]. It
follows that people may also make less costly adjustments without
government mandates, and these behavioral adjustments may
influence disease dynamics. Such behavioral changes would make
current approaches to estimating transmission parameters biased
and inconsistent [29]. Second, media attention to epidemics is a
poor measure of actual cases, and can lead to mal-adaptive
behavior. This finding suggests that there is value in developing
easily accessible sources of spatially delineated information on the
localized risk of contracting infectious diseases (e.g. websites or
apps reporting infection rates by city).
Methods
The dataU.S. Airways Corporation provided access to proprietary data
on individual coach (economy) class flights covering all flights from
April 1, 2008 to March 31, 2010. Equivalent data are available
from IATA, www.iata.org. U.S. Airways was the fifth largest
commercial carrier in the United States during this period and had
a 7.22% market share (U.S. Department of Transportation,
Research and Innovation Technology Administration, http://
www.transtats.bts.gov). U.S. Airways offers extensive connections
within the United States as well as international connections to
Mexico, the Caribbean, Latin and South America, Europe, Israel,
and Canada. The U.S. Airways customer base consists almost
entirely of U.S. residents. For each flight, we observe the number
of passengers booked as of 24 hours prior to departure, the
number of passengers flown, the number of passengers with
connecting flights, aircraft seating capacity, the mean and median
prices paid by coach passengers on each flight, the flight’s origin,
and its destination. Table 1 presents summary statistics for the
dataset used in our analysis.
The original data provided by U.S. Airways came from gate
agent records, and these records are not always entered correctly
when aircrafts change and passengers are rebooked by the airline
at the last minute. As a result there were some obvious coding
errors. Such records were removed prior to beginning analysis
(removed records are not included in the statistics in Table 1); e.g.,
negative passengers flown or zero capacity, a median ticket price
per flight of zero, or where more than 40% of the booked
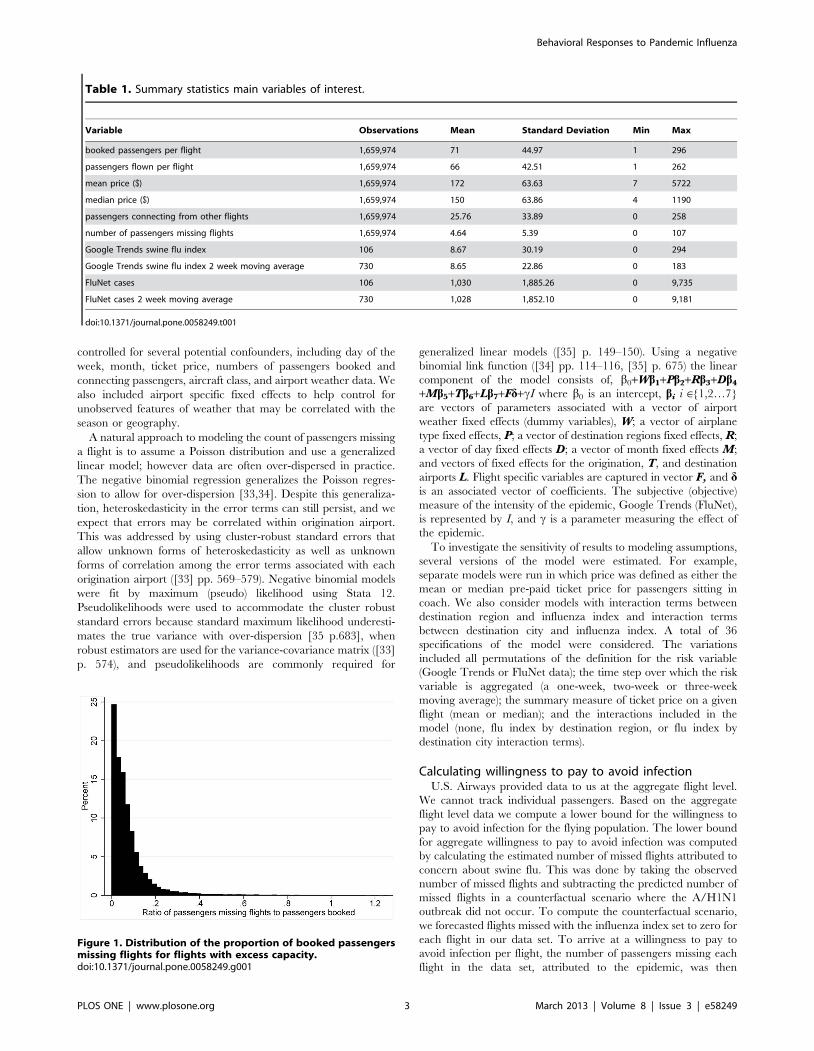
passengers missed the flight. A large share of passengers missing a
flight could occur when a large number of passengers rebook on a
flight to the same destination when the originally booked flight was
substantially delayed. The 40% threshold was chosen by visually
inspecting the distribution of the proportion of passengers missing
flights and substantial support dissipates around 40% (Figure 1).
40% was 3.6 standard deviations above the mean. Overall our
measure of missed flights corresponds to a lower bound on the
number of passengers missing flights. We focused our research on
flights with at least one available seat to avoid data truncation
issues.
U.S. Airways flies 20 different aircraft types that can be
classified into groups of aircraft that are used for qualitatively
similar types of flights. Aircraft types can be recovered from the
aircraft seating capacity reported in each flight record (http://
www.usairways.com/en-US/aboutus/pressroom/fleet.html). We
grouped all aircrafts into seven categories: small express (#50
seats); large express (50–87 seats); small mainline (88 seats);
standard mainline (89–138 seats); large mainline (139–176 seats);
small international (177–188 seats); and large international (.188
seats). We classified flight destinations into eight regions: the
continental US, Hawaii, Alaska, Mexico, Canada, Latin and
South America, the Caribbean, and Europe and Israel.
We investigated two measure of the A/H1N1 epidemic. First,
the Google Trends index of browser search intensity for the phrase
‘‘swine flu’’ (Fig 2). In prior work, Google Flu Trends, an index
created by Google to track flu, has been shown to follow closely
influenza epidemics in the United States [30,31] and, after an
adjustment, the A/H1N1 epidemic [32]. Our purpose is slightly
different. We wish to measure public knowledge about the
epidemic, and an index of searches for information should be a
good proxy measure of concern. It is important to note that
concern does not have to correlate with actual cases. ‘‘Swine flu’’
was the most searched news story on Google in the spring quarter
of 2009 (http://www.google.com/intl/en_us/press/
zeitgeist2009/overview.html), and ‘‘swine flu’’ was the third top
trending search on Microsoft Bing in 2009, behind only ‘‘Michael
Jackson’’ and ‘‘Twitter’’. Our second measure is reported A/
H1N1 cases in the World Health Organization’s FluNet database,
http://gamapserver.who.int/GlobalAtlas/home.asp (Fig 2).
Google and FluNet data are only available at the weekly time
step so the data had to be smoothed to apply measurements to
flights on specific days. Also, we are unsure of the time frame
during which passengers would have chosen to abandon their
original flight plans. We consider different approaches to matching
the weekly Google Trends and FluNet data to the daily flight data;
only applying the index value for the given day applied from its
week, a two-week (Fig 2), and three-week moving average.
Estimating the effect of the epidemicThe number of passengers missing a flight was measured as the
difference between the number of passengers booked on a flight
and the number of passengers who actually flew. This measure of
missed flights is derived from passenger counts and ranges from 0
to 107 in our data. Missed flights can be affected by many factors
aside from concern for infection. Therefore, we statistically
Behavioral Responses to Pandemic Influenza
PLOS ONE | www.plosone.org 2 March 2013 | Volume 8 | Issue 3 | e58249
controlled for several potential confounders, including day of the
week, month, ticket price, numbers of passengers booked and
connecting passengers, aircraft class, and airport weather data. We
also included airport specific fixed effects to help control for
unobserved features of weather that may be correlated with the
season or geography.
A natural approach to modeling the count of passengers missing
a flight is to assume a Poisson distribution and use a generalized
linear model; however data are often over-dispersed in practice.
The negative binomial regression generalizes the Poisson regres-
sion to allow for over-dispersion [33,34]. Despite this generaliza-
tion, heteroskedasticity in the error terms can still persist, and we
expect that errors may be correlated within origination airport.
This was addressed by using cluster-robust standard errors that
allow unknown forms of heteroskedasticity as well as unknown
forms of correlation among the error terms associated with each
origination airport ([33] pp. 569–579). Negative binomial models
were fit by maximum (pseudo) likelihood using Stata 12.
Pseudolikelihoods were used to accommodate the cluster robust
standard errors because standard maximum likelihood underesti-
mates the true variance with over-dispersion [35 p.683], when
robust estimators are used for the variance-covariance matrix ([33]
p. 574), and pseudolikelihoods are commonly required for
generalized linear models ([35] p. 149–150). Using a negative
binomial link function ([34] pp. 114–116, [35] p. 675) the linear
component of the model consists of, b0+Wb1+Pb2+Rb3+Db4
+Mb5+Tb6+Lb7+Fd+cI where b0 is an intercept, bi i M{1,2…7}
are vectors of parameters associated with a vector of airport
weather fixed effects (dummy variables), W; a vector of airplane
type fixed effects, P; a vector of destination regions fixed effects, R;
a vector of day fixed effects D; a vector of month fixed effects M;
and vectors of fixed effects for the origination, T, and destination
airports L. Flight specific variables are captured in vector F, and dis an associated vector of coefficients. The subjective (objective)
measure of the intensity of the epidemic, Google Trends (FluNet),
is represented by I, and c is a parameter measuring the effect of
the epidemic.
To investigate the sensitivity of results to modeling assumptions,
several versions of the model were estimated. For example,
separate models were run in which price was defined as either the
mean or median pre-paid ticket price for passengers sitting in
coach. We also consider models with interaction terms between
destination region and influenza index and interaction terms
between destination city and influenza index. A total of 36
specifications of the model were considered. The variations
included all permutations of the definition for the risk variable
(Google Trends or FluNet data); the time step over which the risk
variable is aggregated (a one-week, two-week or three-week
moving average); the summary measure of ticket price on a given
flight (mean or median); and the interactions included in the
model (none, flu index by destination region, or flu index by
destination city interaction terms).
Calculating willingness to pay to avoid infectionU.S. Airways provided data to us at the aggregate flight level.
We cannot track individual passengers. Based on the aggregate
flight level data we compute a lower bound for the willingness to
pay to avoid infection for the flying population. The lower bound
for aggregate willingness to pay to avoid infection was computed
by calculating the estimated number of missed flights attributed to
concern about swine flu. This was done by taking the observed
number of missed flights and subtracting the predicted number of
missed flights in a counterfactual scenario where the A/H1N1
outbreak did not occur. To compute the counterfactual scenario,
we forecasted flights missed with the influenza index set to zero for
each flight in our data set. To arrive at a willingness to pay to
avoid infection per flight, the number of passengers missing each
flight in the data set, attributed to the epidemic, was then
Table 1. Summary statistics main variables of interest.
Variable Observations Mean Standard Deviation Min Max
booked passengers per flight 1,659,974 71 44.97 1 296
passengers flown per flight 1,659,974 66 42.51 1 262
mean price ($) 1,659,974 172 63.63 7 5722
median price ($) 1,659,974 150 63.86 4 1190
passengers connecting from other flights 1,659,974 25.76 33.89 0 258
number of passengers missing flights 1,659,974 4.64 5.39 0 107
Google Trends swine flu index 106 8.67 30.19 0 294
Google Trends swine flu index 2 week moving average 730 8.65 22.86 0 183
FluNet cases 106 1,030 1,885.26 0 9,735
FluNet cases 2 week moving average 730 1,028 1,852.10 0 9,181
doi:10.1371/journal.pone.0058249.t001
Figure 1. Distribution of the proportion of booked passengersmissing flights for flights with excess capacity.doi:10.1371/journal.pone.0058249.g001
Behavioral Responses to Pandemic Influenza
PLOS ONE | www.plosone.org 3 March 2013 | Volume 8 | Issue 3 | e58249

multiplied by the median price paid for that flight. The aggregate
lower bound willingness to pay was then scaled up to represent the
national airline market. The resulting measure is best interpreted
as a lower bound for three reasons. First, passengers who bought
tickets must have done so because they valued the flight at the
purchase price or higher. Thus, abandoning the planned flight
costs the passenger the purchase price, plus any surplus that the
passenger would have received from taking the flight. Second,
passengers who did not miss flights may have been willing to pay
to reduce the probability of catching swine flu, but were only
willing to pay less than the cost of skipping the flight. Finally,
missing a flight is a relatively large consumer decision. If
consumers make such extreme behavioral decisions, then it follows
that they may also make additional, less costly, adjustments to
daily routines influencing their social contacts which, in turn, may
locally affect pathogen transmission dynamics.
Results
Google swine flu estimation resultsThe negative binomial count data model fit the data well for all
specification at all standard confidence levels. For models that only
included main effects, i.e., no interaction terms, the two-week
moving average Google Trends index of internet search intensity
for ‘‘swine flu’’ with median ticket prices had the greatest log
pseudolikelhood (Table 2). This model is treated as the base
specification, with results presented in Tables 3 and 4. Baseline
results were found to be robust to most modeling decisions. Results
for other specifications are discussed only when they differ from
the base specification. Complete results from all specifications will
be provided upon request.
Correlations between observed and predicted values are the
appropriate way to assess goodness of fit for count-data models
[33]. The predicted missed flights showed a 0.32 correlation with
observed missed flights, and a Spearman’s rank correlation of 0.59.
For both correlations the p-value,0.0001 (null hypothesis of no
correlation), and correlations results were not meaningfully altered
by alternative specifications. Tests for over-dispersion suggest that
the over-dispersion parameter was significantly different from zero
(Table 4).
The parameters for statistical controls were generally signifi-
cantly different from zero and had the expected signs (Tables 3
and 4). For all of the specifications that we tested, passengers
booked, and poor weather in airports CLT, PHI, JFK, and ORD
had statistically significant positive effects on the number of missed
flights. Weather in LAS and PHX did not have significant effects.
This can be explained by the fact that poor weather is relatively
rare in LAS and PHX, tends to occur later in the day, and has less
scope to reverberate through the airline’s network due to the 3-
hour time difference with the east coast. Ticket price and number
of inbound connecting passengers had significant negative effects,
suggesting that passengers who paid more for flights were more
likely to show up and that, all else equal, passengers in the system
were less likely to miss a connecting flight. Passengers were
significantly less likely to miss flights on aircrafts serving
international routes or large domestic aircraft used on longer
routes. Furthermore, passengers were more likely to miss flights on
small aircrafts serving mainline flights. These commuter flights are
dominated by business travelers. There are typically multiple
connections a day for these routes; it is reasonable to expect that
this class of service would have a greater rate of missed flights. Day
of the week and month had intuitive effects. Relative to passengers
flying on Sunday, passengers were more likely to miss flights on
Monday and Friday and less likely to miss flights on other days.
Mondays and Fridays are generally busier travel days and
associated with more business travelers who may not personally
incur the cost of missing a flight and are more prone to changing
their travel plans. Taking the base month as January, passengers
were more likely to miss flights in December, which is associated
with heavy holiday travel and poor local weather, which may not
be controlled fully with our weather dummies. This is particularly
true for 2008–2009 and 2009–2010. These years experienced
highly disruptive late December snow storms. Passengers were less
likely to miss flights in other months. There are 230 airports
included in the data set, and a number of these origins and
destinations had significant fixed effects. Only the Caribbean,
Figure 2. The proportion of passengers missing flights (grey bars), the two-week moving average of FluNet reported cases (bluesolid line), and the two-week moving average of Google Trends swine flu index (black dotted line) and H1N1 index (red dashedline). Google Trends indices are scaled by 235 for easy comparison with the FluNet data. A graph with the total of passengers missing flights asopposed to proportion of passengers looks qualitatively similar. Online version in color.doi:10.1371/journal.pone.0058249.g002
Behavioral Responses to Pandemic Influenza
PLOS ONE | www.plosone.org 4 March 2013 | Volume 8 | Issue 3 | e58249
Canadian, and Alaskan destinations had significant regional effects
relative to the continental US destinations, and these effects were
negative.
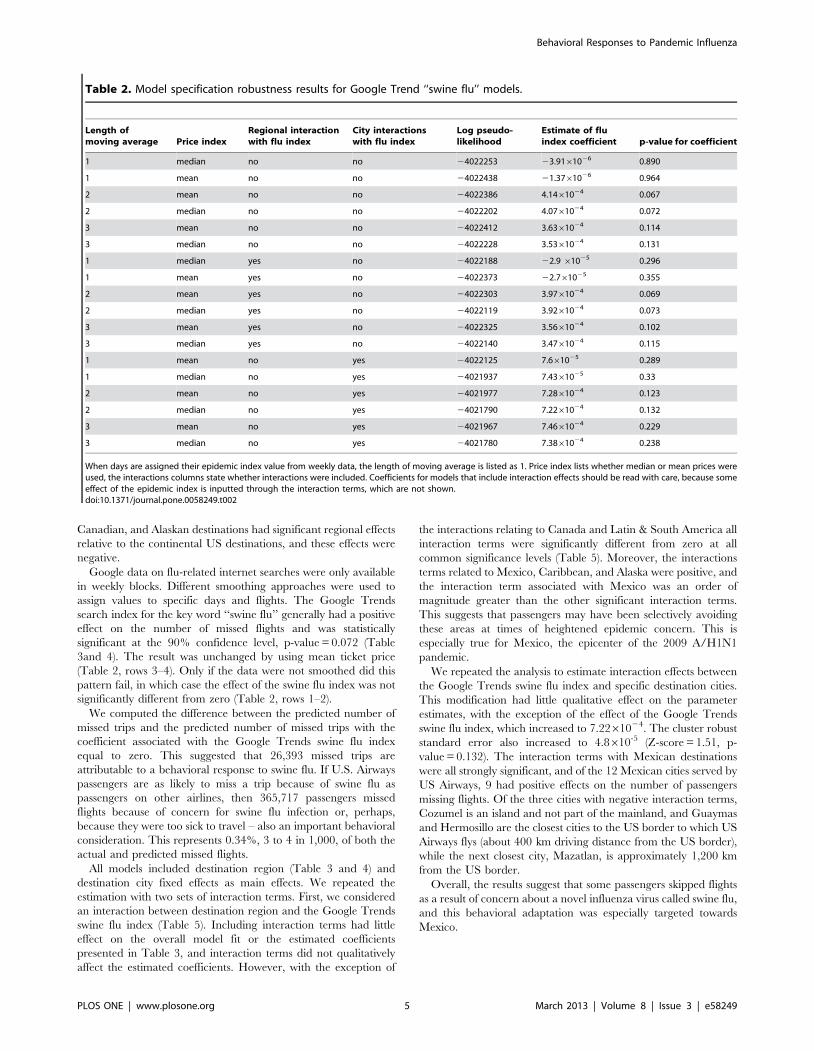
Google data on flu-related internet searches were only available
in weekly blocks. Different smoothing approaches were used to
assign values to specific days and flights. The Google Trends
search index for the key word ‘‘swine flu’’ generally had a positive
effect on the number of missed flights and was statistically
significant at the 90% confidence level, p-value = 0.072 (Table
3and 4). The result was unchanged by using mean ticket price
(Table 2, rows 3–4). Only if the data were not smoothed did this
pattern fail, in which case the effect of the swine flu index was not
significantly different from zero (Table 2, rows 1–2).
We computed the difference between the predicted number of
missed trips and the predicted number of missed trips with the
coefficient associated with the Google Trends swine flu index
equal to zero. This suggested that 26,393 missed trips are
attributable to a behavioral response to swine flu. If U.S. Airways
passengers are as likely to miss a trip because of swine flu as
passengers on other airlines, then 365,717 passengers missed
flights because of concern for swine flu infection or, perhaps,
because they were too sick to travel – also an important behavioral
consideration. This represents 0.34%, 3 to 4 in 1,000, of both the
actual and predicted missed flights.
All models included destination region (Table 3 and 4) and
destination city fixed effects as main effects. We repeated the
estimation with two sets of interaction terms. First, we considered
an interaction between destination region and the Google Trends
swine flu index (Table 5). Including interaction terms had little
effect on the overall model fit or the estimated coefficients
presented in Table 3, and interaction terms did not qualitatively
affect the estimated coefficients. However, with the exception of
the interactions relating to Canada and Latin & South America all
interaction terms were significantly different from zero at all
common significance levels (Table 5). Moreover, the interactions
terms related to Mexico, Caribbean, and Alaska were positive, and
the interaction term associated with Mexico was an order of
magnitude greater than the other significant interaction terms.
This suggests that passengers may have been selectively avoiding
these areas at times of heightened epidemic concern. This is
especially true for Mexico, the epicenter of the 2009 A/H1N1
pandemic.
We repeated the analysis to estimate interaction effects between
the Google Trends swine flu index and specific destination cities.
This modification had little qualitative effect on the parameter
estimates, with the exception of the effect of the Google Trends
swine flu index, which increased to 7.2261024. The cluster robust
standard error also increased to 4.8610-5 (Z-score = 1.51, p-
value = 0.132). The interaction terms with Mexican destinations
were all strongly significant, and of the 12 Mexican cities served by
US Airways, 9 had positive effects on the number of passengers
missing flights. Of the three cities with negative interaction terms,
Cozumel is an island and not part of the mainland, and Guaymas
and Hermosillo are the closest cities to the US border to which US
Airways flys (about 400 km driving distance from the US border),
while the next closest city, Mazatlan, is approximately 1,200 km
from the US border.
Overall, the results suggest that some passengers skipped flights
as a result of concern about a novel influenza virus called swine flu,
and this behavioral adaptation was especially targeted towards
Mexico.
Table 2. Model specification robustness results for Google Trend ‘‘swine flu’’ models.
Length ofmoving average Price index
Regional interactionwith flu index
City interactionswith flu index
Log pseudo-likelihood
Estimate of fluindex coefficient p-value for coefficient
1 median no no 24022253 23.9161026 0.890
1 mean no no 24022438 21.3761026 0.964
2 mean no no 24022386 4.1461024 0.067
2 median no no 24022202 4.0761024 0.072
3 mean no no 24022412 3.6361024 0.114
3 median no no 24022228 3.5361024 0.131
1 median yes no 24022188 22.9 61025 0.296
1 mean yes no 24022373 22.761025 0.355
2 mean yes no 24022303 3.9761024 0.069
2 median yes no 24022119 3.9261024 0.073
3 mean yes no 24022325 3.5661024 0.102
3 median yes no 24022140 3.4761024 0.115
1 mean no yes 24022125 7.661025 0.289
1 median no yes 24021937 7.4361025 0.33
2 mean no yes 24021977 7.2861024 0.123
2 median no yes 24021790 7.2261024 0.132
3 mean no yes 24021967 7.4661024 0.229
3 median no yes 24021780 7.3861024 0.238
When days are assigned their epidemic index value from weekly data, the length of moving average is listed as 1. Price index lists whether median or mean prices wereused, the interactions columns state whether interactions were included. Coefficients for models that include interaction effects should be read with care, because someeffect of the epidemic index is inputted through the interaction terms, which are not shown.doi:10.1371/journal.pone.0058249.t002
Behavioral Responses to Pandemic Influenza
PLOS ONE | www.plosone.org 5 March 2013 | Volume 8 | Issue 3 | e58249

FluNet estimation resultsThe analyses were repeated using FluNet weekly A/H1N1
counts as an objective measure of the intensity of the epidemic.
This is also only an index measure as underreporting is common.
The estimates for all parameters from the negative binomial count
model using FluNet data in the place of Google Trends data were
qualitatively identical, and point estimates and standard errors
were often quite close to the model using Google Trends data
(Table 3 and 4) with two important exceptions. First, the estimate
of the constant changed substantially, for example using the two-
week moving average of the FluNet data with median price the
constant term was substantially lower at 57.37 (standard error
25.63, Z-score 2.24, p-value 0.025). Second, the estimated effect of
the epidemic on missed flights was nearly zero. Using the two-
week moving average of the FluNet data with median price, the
coefficient on FluNet case reports was 21.361025 (Table 6). The
standard error was also small, 2.061026, yielding a Z-score 6.69
and a p-value<0. The model suggests that the epidemic reduced
missed flights. There is no reason that a direct response to the
epidemic should cause people to miss fewer flights. We offer three
possible explanations. First, people delayed travel and did not
purchase tickets early in the epidemic, but then traveled later in
the epidemic, which coincided with greater prevalence. Second,
though unlikely, a substantial number of travelers attempted to
escape the epidemic [36]. Third, and most likely, public concern is
better measured by Google Trends than by the FluNet reported
incidence. Therefore, the model using FluNet had to compensate
for the ‘‘extra’’ missed flights early in the epidemic (Fig 2) by fitting
a negative coefficient. Focusing on data after April 1, 2009 the
correlation coefficient between the 2 week moving averages of the
FluNet and Google Trends swine flu data is 0.15 (p-
value,0.0001), and focusing on data from the first wave, when
the Google Trends index was greatest (4/1 to 8/1 of 2009), the
correlation coefficient between the two epidemic indices was
negative (R = 20.21, p-value,0.0001). This pattern holds regard-
less of the smoothing process.
Generalizing the model beyond main effects to include a set of
FluNet cases-by-destination region and case-by-city interaction
terms had no qualitative effect on parameter estimates, with one
important exception: for some specifications the FluNet case
Table 3. Parameter estimates based on a negative binomial regression using median price and a two-week moving average of theGoogle Trends swine flu index (first part).
Variable EstimateCluster robustStandard Error Z-score p-value
Constant 125.83950 21.28549 5.91 0
Google Trends swine flu index2 week moving avg
0.00041 0.00023 1.8 0.072
Flight specific variables
booked passengers 0.01406 0.00098 14.35 0
median price 20.00066 0.00023 22.91 0.004
inbound connections 20.00360 0.00125 22.89 0.004
Weather variables
weather Phoenix (PHX) 20.00791 0.01029 20.77 0.442
weather Philadelphia (PHI) 0.08189 0.01891 4.33 0
weather Chicago (ORD) 0.01280 0.00209 6.12 0
weather Las Vegas (LAS) 0.00384 0.00691 0.56 0.578
weather New York (JFK) 0.08015 0.01601 5.01 0
weather Charlotte (CLT) 0.05706 0.01927 2.96 0.003
Aircraft type
large express 0.02164 0.02416 0.9 0.371
small mainline 0.16461 0.02743 6 0
standard mainline 0.00489 0.03413 0.14 0.886
large mainline 20.32912 0.05060 26.5 0
small international 20.48461 0.06032 28.03 0
large international 20.83046 0.06323 213.13 0
Destination region
Mexico 20.11871 0.15826 20.75 0.453
Latin & South America 20.15440 0.16639 20.93 0.353
Hawaii 20.23949 0.16782 21.43 0.154
Europe & Israel 0.21284 0.15120 1.41 0.159
Caribbean 20.58451 0.22634 22.58 0.01
Canada 20.24884 0.06394 23.89 0
Alaska 22.14877 0.16360 213.13 0
doi:10.1371/journal.pone.0058249.t003
Behavioral Responses to Pandemic Influenza
PLOS ONE | www.plosone.org 6 March 2013 | Volume 8 | Issue 3 | e58249
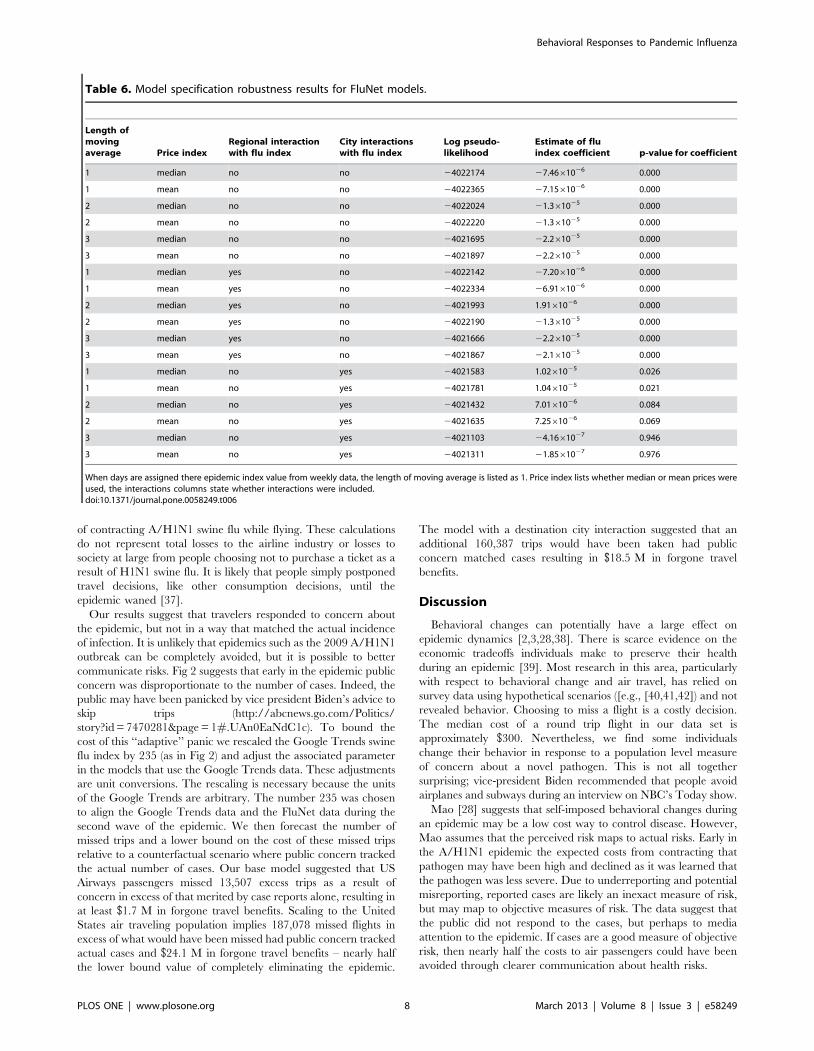
coefficient was significant and had a positive sign, but in these
cases the coefficient remained relatively small in magnitude
(Table 6). Taken together, these models suggest that passengers
did not skip flights in response to reported A/H1N1 cases.
Furthermore, evidence that people responded to Google Trends,
but not to an index of actual cases, suggests that those missing
flights in response to the Google Trends swine flu index engaged in
avoidance behavior and were not missing their flights because they
were sick.
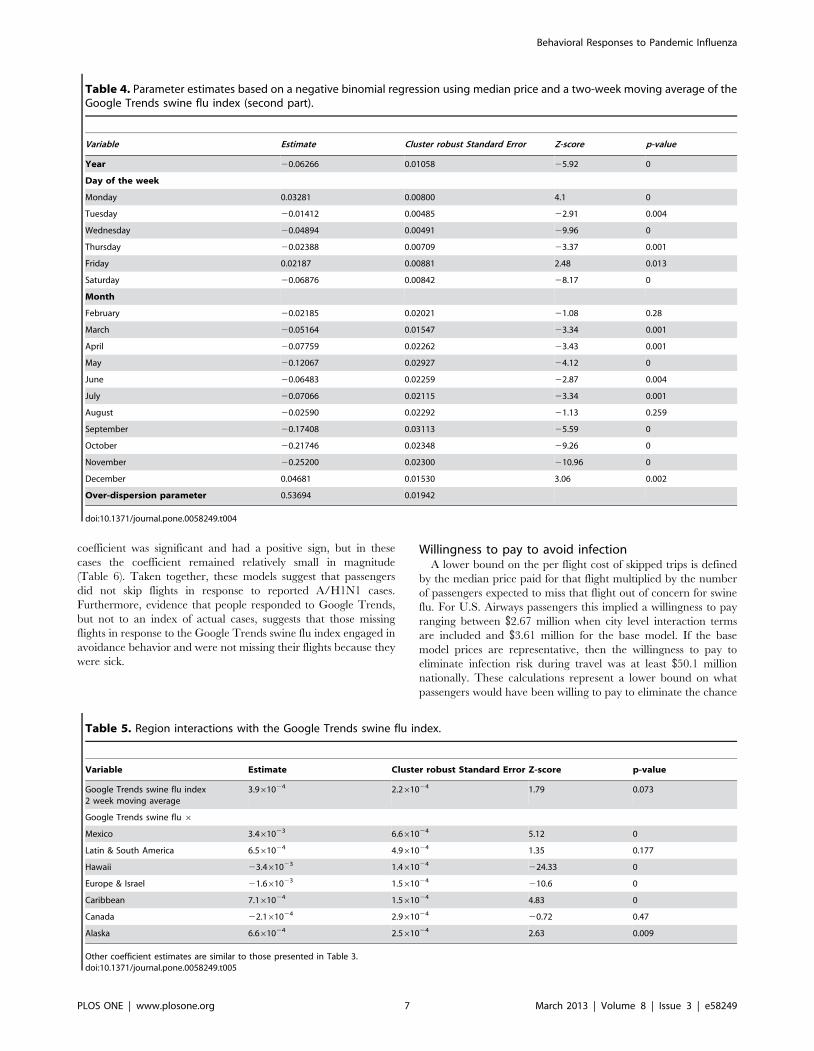
Willingness to pay to avoid infectionA lower bound on the per flight cost of skipped trips is defined
by the median price paid for that flight multiplied by the number
of passengers expected to miss that flight out of concern for swine
flu. For U.S. Airways passengers this implied a willingness to pay
ranging between $2.67 million when city level interaction terms
are included and $3.61 million for the base model. If the base
model prices are representative, then the willingness to pay to
eliminate infection risk during travel was at least $50.1 million
nationally. These calculations represent a lower bound on what
passengers would have been willing to pay to eliminate the chance
Table 4. Parameter estimates based on a negative binomial regression using median price and a two-week moving average of theGoogle Trends swine flu index (second part).
Variable Estimate Cluster robust Standard Error Z-score p-value
Year 20.06266 0.01058 25.92 0
Day of the week
Monday 0.03281 0.00800 4.1 0
Tuesday 20.01412 0.00485 22.91 0.004
Wednesday 20.04894 0.00491 29.96 0
Thursday 20.02388 0.00709 23.37 0.001
Friday 0.02187 0.00881 2.48 0.013
Saturday 20.06876 0.00842 28.17 0
Month
February 20.02185 0.02021 21.08 0.28
March 20.05164 0.01547 23.34 0.001
April 20.07759 0.02262 23.43 0.001
May 20.12067 0.02927 24.12 0
June 20.06483 0.02259 22.87 0.004
July 20.07066 0.02115 23.34 0.001
August 20.02590 0.02292 21.13 0.259
September 20.17408 0.03113 25.59 0
October 20.21746 0.02348 29.26 0
November 20.25200 0.02300 210.96 0
December 0.04681 0.01530 3.06 0.002
Over-dispersion parameter 0.53694 0.01942
doi:10.1371/journal.pone.0058249.t004
Table 5. Region interactions with the Google Trends swine flu index.
Variable Estimate Cluster robust Standard Error Z-score p-value
Google Trends swine flu index2 week moving average
3.961024 2.261024 1.79 0.073
Google Trends swine flu 6
Mexico 3.461023 6.661024 5.12 0
Latin & South America 6.561024 4.961024 1.35 0.177
Hawaii 23.461023 1.461024 224.33 0
Europe & Israel 21.661023 1.561024 210.6 0
Caribbean 7.161024 1.561024 4.83 0
Canada 22.161024 2.961024 20.72 0.47
Alaska 6.661024 2.561024 2.63 0.009
Other coefficient estimates are similar to those presented in Table 3.doi:10.1371/journal.pone.0058249.t005
Behavioral Responses to Pandemic Influenza
PLOS ONE | www.plosone.org 7 March 2013 | Volume 8 | Issue 3 | e58249
of contracting A/H1N1 swine flu while flying. These calculations
do not represent total losses to the airline industry or losses to
society at large from people choosing not to purchase a ticket as a
result of H1N1 swine flu. It is likely that people simply postponed
travel decisions, like other consumption decisions, until the
epidemic waned [37].
Our results suggest that travelers responded to concern about
the epidemic, but not in a way that matched the actual incidence
of infection. It is unlikely that epidemics such as the 2009 A/H1N1
outbreak can be completely avoided, but it is possible to better
communicate risks. Fig 2 suggests that early in the epidemic public
concern was disproportionate to the number of cases. Indeed, the
public may have been panicked by vice president Biden’s advice to
skip trips (http://abcnews.go.com/Politics/
story?id = 7470281&page = 1#.UAn0EaNdC1c). To bound the
cost of this ‘‘adaptive’’ panic we rescaled the Google Trends swine
flu index by 235 (as in Fig 2) and adjust the associated parameter
in the models that use the Google Trends data. These adjustments
are unit conversions. The rescaling is necessary because the units
of the Google Trends are arbitrary. The number 235 was chosen
to align the Google Trends data and the FluNet data during the
second wave of the epidemic. We then forecast the number of
missed trips and a lower bound on the cost of these missed trips
relative to a counterfactual scenario where public concern tracked
the actual number of cases. Our base model suggested that US
Airways passengers missed 13,507 excess trips as a result of
concern in excess of that merited by case reports alone, resulting in
at least $1.7 M in forgone travel benefits. Scaling to the United
States air traveling population implies 187,078 missed flights in
excess of what would have been missed had public concern tracked
actual cases and $24.1 M in forgone travel benefits – nearly half
the lower bound value of completely eliminating the epidemic.
The model with a destination city interaction suggested that an
additional 160,387 trips would have been taken had public
concern matched cases resulting in $18.5 M in forgone travel
benefits.
Discussion
Behavioral changes can potentially have a large effect on
epidemic dynamics [2,3,28,38]. There is scarce evidence on the
economic tradeoffs individuals make to preserve their health
during an epidemic [39]. Most research in this area, particularly
with respect to behavioral change and air travel, has relied on
survey data using hypothetical scenarios ([e.g., [40,41,42]) and not
revealed behavior. Choosing to miss a flight is a costly decision.
The median cost of a round trip flight in our data set is
approximately $300. Nevertheless, we find some individuals
change their behavior in response to a population level measure
of concern about a novel pathogen. This is not all together
surprising; vice-president Biden recommended that people avoid
airplanes and subways during an interview on NBC’s Today show.
Mao [28] suggests that self-imposed behavioral changes during
an epidemic may be a low cost way to control disease. However,
Mao assumes that the perceived risk maps to actual risks. Early in
the A/H1N1 epidemic the expected costs from contracting that
pathogen may have been high and declined as it was learned that
the pathogen was less severe. Due to underreporting and potential
misreporting, reported cases are likely an inexact measure of risk,
but may map to objective measures of risk. The data suggest that
the public did not respond to the cases, but perhaps to media
attention to the epidemic. If cases are a good measure of objective
risk, then nearly half the costs to air passengers could have been
avoided through clearer communication about health risks.
Table 6. Model specification robustness results for FluNet models.
Length ofmovingaverage Price index
Regional interactionwith flu index
City interactionswith flu index
Log pseudo-likelihood
Estimate of fluindex coefficient p-value for coefficient
1 median no no 24022174 27.4661026 0.000
1 mean no no 24022365 27.1561026 0.000
2 median no no 24022024 21.361025 0.000
2 mean no no 24022220 21.361025 0.000
3 median no no 24021695 22.261025 0.000
3 mean no no 24021897 22.261025 0.000
1 median yes no 24022142 27.2061026 0.000
1 mean yes no 24022334 26.9161026 0.000
2 median yes no 24021993 1.9161026 0.000
2 mean yes no 24022190 21.361025 0.000
3 median yes no 24021666 22.261025 0.000
3 mean yes no 24021867 22.161025 0.000
1 median no yes 24021583 1.0261025 0.026
1 mean no yes 24021781 1.0461025 0.021
2 median no yes 24021432 7.0161026 0.084
2 mean no yes 24021635 7.2561026 0.069
3 median no yes 24021103 24.1661027 0.946
3 mean no yes 24021311 21.8561027 0.976
When days are assigned there epidemic index value from weekly data, the length of moving average is listed as 1. Price index lists whether median or mean prices wereused, the interactions columns state whether interactions were included.doi:10.1371/journal.pone.0058249.t006
Behavioral Responses to Pandemic Influenza
PLOS ONE | www.plosone.org 8 March 2013 | Volume 8 | Issue 3 | e58249

It is not clear that the early response was irrational. The
observation that the two flu indices primarily diverge early in the
epidemic suggests that most behavioral changes happened in the
early days of the epidemic. Fenichel and Wang [22] suggest that
epidemiological forecasts based on reproductive number theory
(e.g., R0) may lead to excessive risk reducing behavior if the
estimators do not account for how behavioral responses affect the
epidemic. Reproductive number theory is the standard in modern
epidemiology, and there were many attempts to forecast the A/
H1N1 epidemic using reproductive number theory early in the
epidemic ([e.g., [43,44,45]). Developing the next generation of
epidemiological forecasting tools requires integrating estimation of
human responses to disease risk with estimation of the basic
epidemiological parameters [2]. The current paper advances that
goal by providing a quantitative analysis of human behavioral
responses to a rapidly disseminating disease.
An important policy question is where to invest scarce resources
to reduce the economic damages of an epidemic. It is important
that public health measures are less costly than the epidemic itself
[37,46]. We do not know the cost of improving risk communi-
cation, but our calculations suggest that better communication of
actual risk can provide substantial cost savings. For example, the
U.S. Environmental Protection Agency has developed AirNow.
gov, an online site and mobile app that provides real time spatially
explicit air quality data to help people make decisions about
outdoor activities that may interact with air quality to affect health.
Others are developing similar applications for infectious disease.
Finally, air travel has been targeted as a venue for non-
pharmaceutical interventions [9]. We estimate the willingness to
pay by the air traveling public to eliminate the risk of contracting
swine flu while traveling to be on the order of at least $50 M over
the two year period bracketing the swine flu outbreak. In
comparison, Epstein et al. [10] estimate the cost of a complete
US air travel shut down in terms of lost consumer surplus to
prevent flu to be $93-$100B/yr. Our estimate does not consider
the willingness to pay of non-travelers to reduce the probability
that air travelers will spread the disease more quickly. However,
[11–13] argue that air travel restrictions at best are likely to have
modest effects on the spread of infectious disease. Airport
screening programs represent a non-pharmaceutical intervention.
Bitar et al. [18] review the literature on the use of infrared
detection systems in airports to detect travelers with fever, and find
these systems to be ineffective. Dell’Omodarme and Prati [47]
suggest that from a statistical standpoint such surveillance is
unlikely to be effective. If such scanners could be improved to fully
prevent passengers from catching flu, then given our lower bound
estimates and the current price of $2,500 per scanner [48], one
could purchase just over 20,000 scanners to serve the United
States’ approximately 430 commercial airports, approximately 50
per airport not including labor costs or the costs of passenger
delays. This number would be approximately cut in half if
communication strategies were improved first. This suggests that
technological innovation in flu scanning could, in principle, be cost
effective, but clear risk communication and accounting for the
public response to this information may be more cost effective,
especially in the short to medium run.
Our findings suggest that people do respond to epidemiological
risks with behavioral change. The effect of these behavioral
responses on epidemic spread is an area of ongoing research.
Furthermore, the nature of the feedback from disease spread to
human behavior appears to be tightly connected to information
about the epidemic, and that information may only be loosely
connected to facts on the ground. This ‘‘noise’’ complicates
developing forecasting models that account for behavioral-
epidemiological feedbacks, which remains an important area for
continued research. Nevertheless, the results suggest a clear need
to enhance risk communication strategies related to infectious
diseases. Infectious diseases are scary, but clear communication
appears to have substantial potential to lessen the hardships caused
by an epidemic.
Acknowledgments
Dan Muzich and Antonia Kozarova Fenichel provided background
context related to air travel and airlines. Sean Cohmer and Quentin
Gunn provided research assistance. U.S. Airways Corporation generously
provided data.
Author Contributions
Conceived and designed the experiments: EPF. Performed the experi-
ments: EPF NVK GC. Analyzed the data: EPF NVK GC. Contributed
reagents/materials/analysis tools: EPF NVK GC. Wrote the paper: EPF
NVK GC.
References
1. Ferguson N (2007) Capturing human behaviour: Understanding the dynamics of
infectious-disease transmission demands a holistic approach, yet today’s models
largely ignore how epidemics change individual behaviour. Nature 446: 733.
2. Fenichel EP, Castillo-Chavez C, Ceddia MG, Chowell G, Gonzalez Parra PA, et
al. (2011) Adaptive human behavior in epidemiological models. Proceedings of
the National Academy of Sciences 108: 6306–6311.
3. Funk S, Salathe M, Jansen VAA (2010) Modelling the influence of human
behaviour on the spread of infectious diseases: a review. Journal of the Royal
Society Interface 7: 1247–1256.
4. Epstein JM, Parker J, Cummings D, Hammond RA (2008) Coupled contagion
dynamics of fear and disease: mathematical and computational explorations.
PloS ONE 3: e3955.
5. Reluga TC (2010) Game theory of social distancing in response to an epidemic
PLoS Computational Biology 6: e1000793.
6. Meloni S, Perra N, Arenas A, Gomez S, Moreno Y, et al. (2011) Modeling
human mobility responses to the large-scale spreading of infectious diseases.
Scientific Reports 1: 62.
7. Grais RF, Ellis JH, Kress A, Glass GE (2004) Modeling the spread of annual
influenza epidemics in the US: the potential role of air travel. Health Care
Management Science 7: 127–134.
8. Fraser C, Donnelly CA, Cauchemez S, Hanage WP, Van Kerkhove MD, et al.
(2009) Pandemic potential of a strain of influenza A (H1NA): early finds. Science
324: 1557–1561.
9. Brownstein JS, Wolfe CJ, Mandl KD (2006) Empirical evidence for the effect of
airline travel on inter-regional influenza spread in the United States. PLoS
Medicine 3: e401.
10. Epstein JM, Goedecke DM, Yu F, Morris RJ, Wagener DK, et al. (2007)
Controlling pandemic flu: the value of international air travel restrictions. PloS
ONE 2: e401.
11. Viboud C, Miller MA, Grenfell BT, Bjornstad ON, Simonsen L (2006) Air travel
and the spread of influenza: important caveats. PLoS Medicine 3: 2159–2162.
12. Cooper BS, Pitman RJ, Edmunds WJ, Gay NJ (2006) Delaying the international
spread of pandemic influenza. PLoS Medicine 3: e212.
13. Bajardi P, Poletto C, Ramasco JJ, Tizzoni M, Colizza V, et al. (2011) Human
mobility networks, travel restrictions, and the global spread of 2009 H1N1
pandemic. PloS ONE 6: e16591.
14. Johansson MA, Arana-Vizcarrondo N, Biggerstaff BJ, Erin SJ, Gallagher N, et
al. (2011) On the treatment of airline travelers in mathematical models. PloS
ONE 6: e22151.
15. DeHart RL (2003) Health issues of air travel. Annual Review of Public Health
24: 133–151.
16. Wagner BG, Coburn BJ, Blower S (2009) Calculating the potential for within-
flight transmission of influenza A (H1N1). BMC Medicine 7: 81.
17. Cowling BJ, Lau LL, Wu P, Wong HW, Fang VJ, et al. (2010) Entry screening to
delay local transmission of 2009 pandemic influenza A (H1N1). BMC Infectious
Diseases 10: 82.
Behavioral Responses to Pandemic Influenza
PLOS ONE | www.plosone.org 9 March 2013 | Volume 8 | Issue 3 | e58249
18. Bitar D, Goubar A, Desenclos JC (2009) International travels and fever
screening during epidemics: a literature review on the effectiveness and potentialuse of non-contact infrared thermometers. Eurosurveillance 14: 1–5.
19. Cui J, Sun Y, Zhu H (2008) The impact of media on the control of infectious
disease. Journal of Dynamics and Differential Equations 20: 31–53.20. d’Onofrio A, Manfredi P (2009) Information-related changes in contact patterns
may trigger oscillations in the endemic prevalence of infectious disease. Journalof Theoretical Biology 256: 473–478.
21. Chen FH (2009) Modeling the effect of information quality on risk behavior
change and the transmission of infectious disease. Mathematical Biosciences 217:125–133.
22. Fenichel EP, Wang X (2013) The mechanism and phenomenon of adaptivehuman behavior during an epidemic and the role of information. In: d’Onofrio
A, Manfredi P, editors. Modeling the Interplay between Human Behavior andSpread of Infectious Diseases. New York: Springer. pp. 153–170.
23. Vosen S, Schmidt T (2011) Forecasting private consumption: survey-based
indicators vs. Google Trends. Journal of Forecasting 30: 565–578.24. World Health Organization (2006) Nonpharmaceutical interventions for
pandemic influenza, national and community measures. Emerging InfectiousDiseases 12: 88–94.
25. Kelso JK, Milne GJ, Kelly H (2009) Simulation suggests that rapid activation of
social distancing can arrest epidemic development due to a novel strain ofinfluenza. BMC Public Health 9: 117.
26. Glass RJ, Glass LM, Beyeler WE, Min HJ (2006) Targeted social distancingdesign for pandemic influenza. Emerging Infectious Diseases 12: 1671–1681.
27. Stern AM, Markel H (2009) What Mexico taught the world about pandemicinfluenza preparedness and community mitigation strategies. Journal of the
American Medical Association 302: 1221–1222.
28. Mao L (2011) Evaluating the combined effetiveness of influenza controlstrategies and human preventive behavior. PloS ONE 6: e24706.
29. Geoffard P, Philipson T (1995) The empirical content of canonical models ofinfectious diseases: the proportional hazard specification. Biometrika 82: 101–
111.
30. Ginsberg J, Mohebbi MH, Patel RS, Brammer L, Smolinski MS, et al. (2009)Detecting influenza epidemics using search engine query data. Nature 457:
1012–1015.31. Dugas AF, Hsieh Y-H, Levin SR, Pines JM, Mareiniss DP, et al. (2012) Google
flu trends: correlation with emergency department influenza rates and crowdingmetrics. Clinical Infectious Diseases 54: 436–439.
32. Cook S, Conrad C, Fowlkes AL, Mohebbi MH (2011) Assessing Google flu
trends performance in the United States during the 2009 influenza virus A(H1N1) pandemic. PloS ONE 6: e23610.
33. Cameron AC, Trivedi PK (2010) Microeconometrics Using Stata, revisededition. College Station, Texas: Stata Press
34. Gelman A, Hill J (2007) Data Analysis Using Regression and Multilevel/
Hierarchiacal Models. New York: Cambridge University Press.35. Cameron AC, Trivedi PK (2005) Microeconometrics methods and applications.
New York: Cambridge University Press.
36. Mesnard A, Seabright P (2009) Escaping epidemics through migration?Quarantine measures under incomplete information about infection risk.
Journal of Public Economics 93: 931–938.37. Smith RD, Keogh-Brown MR, Barnett T, Tait J (2009) The economy-wide
impact of pandemic influenza and the UK: a computable general equilibrium
modelling experiment. BMJ 339:b4571.38. Galvani AP, Reluga TC, Chapman GB (2007) Long-standing influenza
vaccination policy is in accord with individual self-interest but not with theutilitarian optimum. Proceedings of the National Academy of Sciences 104:
5692–5697.39. Caley P, Philips DJ, McCracken K (2007) Quantifying social distancing arising
from pandemic influenza. Journal of the Royal Society Interface 5: 631–639.
40. Dickmann P, Rubin GJ, Gaber W, Wessely S, Wicker S, et al. (2010) NewInfluenza A / H1N1 (‘‘Swine Flu’’): information needs of airport passengers and
staff. Influenza and Other Respiratory Viruses 5: 39–46.41. Lau JTF, Yang X, Tsui H, Pang E, Kim JH (2004) SARS preventive and risk
behaviours of Hong Kong air travellers. Epidemiological Infection 132: 727–
736.42. Leggart PA, Brown LH, Aitken P, Speare R (2010) Level of concern aand
precaution taking among Australians regarding travel during pandemic (H1N1)2009: Results from the 2009 Queensland Social Survey. Journal of Travel
Medicine 17: 291–295.43. Chowell G, Bertozzi SM, Colchero MA, Alpuche-Aranda C, Hernandez M, et
al. (2009) Severe Respiratory Disease Concurrent with H1N1 Influenza
Circulation. The New England Journal of Medicine 361: 674–679.44. Fraser C, Donnelly CA, Cauchemez S, Hanage WP, Van Kerkhove MD, et al.
(2009) Pandemic Potential of a Strain of Influenza A (H1N1): Early Findings.Science 324: 1557–1561.
45. Nishiura H, Castillo-Chavez C, Safan M, Chowell G (2009) Transmission
potential of the new influenze A(H1N1) virus and its age-specificity in Japan.Eurosurveillance 14: 1–4.
46. Keogh-Brown MR, Wren-Lewis S, Edmunds WJ, Beutels P, Smith RD (2010)The possible macroeconomic impact on the UK of an influenza pandemic.
Health Economics 19: 1345–1360.47. Dell’Omodarme M, Prati MC (2005) The probability of failing in detecting an
infectious disease at entry points into a country. Statistics in Medicine 24: 266–
2679.48. Nguyen AV, Cohen NJ, Lipman H, Brown CM, Molinari N-A, et al. (2010)
Comparison of 3 infrared thermal detection systmes and self-report for massfever screening. Emerging Infectious Diseases 16: 1710–1717.
Behavioral Responses to Pandemic Influenza
PLOS ONE | www.plosone.org 10 March 2013 | Volume 8 | Issue 3 | e58249