Size-fractionated phytoplankton biomass and primary production in the Gerlache and south Bransfield...
11
Size-fractionated phytoplankton biomass and production in the tropical Atlantic ENRIQUE MORENO-OSTOS 1 , ANA FERNÁNDEZ 2 , MARÍA HUETE-ORTEGA 2 , BEATRIZ MOURIÑO-CARBALLIDO 2 , ALEJANDRA CALVO-DÍAZ 3 , XOSÉ ANXELU G. MORÁN 3 and EMILIO MARAÑÓN 2 1 Departamento de Ecología y Geología, Universidad de Málaga, 29071 Málaga, Spain. E-mail: [email protected] 2 Departamento de Ecoloxía e Bioloxía Animal, Universidade de Vigo, 36310 Vigo, Spain. 3 Instituto Español de Oceanografía, Centro Oceanográfico de Xixón, 33212 Xixón, Spain. SUMMARY: Two meridional transects were conducted in the tropical and subtropical Atlantic to describe (i) the spatial variability of total and size-fractionated (picophytoplankton and phytoplankton >2 mm) chlorophyll a (chl a) concentration and primary production, (ii) the relative contribution of each phytoplankton size fraction to total biomass and carbon fixation, and (iii) the spatial variability of size-fractionated phytoplankton growth rate (P/B) and assimilation number (P/chl a) in the ocean. The highest chl a for both size fractions was observed in the Western Tropical Atlantic province (WTRA), while the lowest chl a was found in the upper mixed layer (UML) of the South Atlantic Tropical gyre (SATL). A similar pattern was found for carbon fixation. Within the SATL, the highest picophytoplankton contribution to total production was recorded at the Deep Chlorophyll Maximum (DCM), while the contribution of phytoplankton >2 mm was higher in the UML. Additionally, the relative contribution of large phytoplankton to total integrated primary production was higher than its contribution to total biomass. Both size fractions depicted maximum P/B and P/chl a in WTRA surface waters. In the SATL province, phytoplankton >2 mm showed the highest P/B and P/chl a along the UML, while picophytoplankton P/B and P/chl a peaked around the DCM. We suggest that the differential impact of light on small and large phytoplankton may help to explain the contrasting dynamics of the two size classes. Keywords: phytoplankton, cell size, spatial variability, oligotrophic subtropical gyres, primary production, biomass. RESUMEN: Biomasa y producción en diferentes clases de tamaño de fitoplancton en el Atlántico tropical. – Se realizaron dos transectos latitudinales en el Atlántico tropical y subtropical para describir (i) la variabilidad espacial de la concentración de clorofila a (chl a) y de la producción primaria total y fraccionada en clases de tamaño de fitoplancton (pi- cofitoplancton y fitoplancton >2 mm), (ii) la contribución relativa de cada clase de tamaño a la biomasa y fijación de carbono total, y (iii) la variabilidad espacial de la tasa de crecimiento (P/B) y del número de asimilación (P/chl a) para cada clase de tamaño en el océano. Las dos clases de tamaño consideradas presentaron la máxima chl a en el afloramiento ecuatorial y la mínima en la capa de mezcla del giro oligotrófico del Atlántico Sur. Se encontró un patrón similar en el caso de la fijación de carbono. En el giro oligotrófico del Atlántico Sur la mayor contribución del picofitoplancton a la producción total se registró en torno al máximo profundo de clorofila, mientras que la contribución de la fracción >2 mm fue mayor en la capa de mezcla. Además, la contribución relativa del fitoplancton >2 mm a la producción primaria total fue mayor que su contribución a la biomasa total. Ambas clases de tamaño presentaron máximos valores de P/B y P/chl a en las aguas superficiales del aflora- miento ecuatorial. En el giro oligotrófico del Atlántico Sur la fracción de fitoplancton >2 mm mostró máximos valores de P/B y P/chl a en la capa de mezcla, mientras que los mayores valores de P/B y P/chl a de picofitoplancton se registraron en torno al máximo profundo de clorofila. Nuestros resultados sugieren que el impacto diferencial de la radiación solar sobre el pico- fitoplancton y el fitoplancton >2 mm puede contribuir a explicar las diferencias en la dinámica de estas dos clases de tamaño. Palabras clave: fitoplancton, tamaño celular, variabilidad espacial, giros oligotróficos subtropicales, producción primaria, biomasa. SCIENTIA MARINA 75(2) June 2011, 379-389, Barcelona (Spain) ISSN: 0214-8358 doi: 10.3989/scimar.2011.75n2379
-
Upload
independent -
Category
Documents
-
view
4 -
download
0
Transcript of Size-fractionated phytoplankton biomass and primary production in the Gerlache and south Bransfield...

Size-fractionated phytoplankton biomass and production in the tropical Atlantic
ENRIQUE MORENO-OSTOS 1, ANA FERNÁNDEZ 2, MARÍA HUETE-ORTEGA 2, BEATRIZ MOURIÑO-CARBALLIDO 2, ALEJANDRA CALVO-DÍAZ 3,
XOSÉ ANXELU G. MORÁN 3 and EMILIO MARAÑÓN 2
1 Departamento de Ecología y Geología, Universidad de Málaga, 29071 Málaga, Spain. E-mail: [email protected] Departamento de Ecoloxía e Bioloxía Animal, Universidade de Vigo, 36310 Vigo, Spain. 3 Instituto Español de Oceanografía, Centro Oceanográfico de Xixón, 33212 Xixón, Spain.
SUMMARY: Two meridional transects were conducted in the tropical and subtropical Atlantic to describe (i) the spatial variability of total and size-fractionated (picophytoplankton and phytoplankton >2 mm) chlorophyll a (chl a) concentration and primary production, (ii) the relative contribution of each phytoplankton size fraction to total biomass and carbon fixation, and (iii) the spatial variability of size-fractionated phytoplankton growth rate (P/B) and assimilation number (P/chl a) in the ocean. The highest chl a for both size fractions was observed in the Western Tropical Atlantic province (WTRA), while the lowest chl a was found in the upper mixed layer (UML) of the South Atlantic Tropical gyre (SATL). A similar pattern was found for carbon fixation. Within the SATL, the highest picophytoplankton contribution to total production was recorded at the Deep Chlorophyll Maximum (DCM), while the contribution of phytoplankton >2 mm was higher in the UML. Additionally, the relative contribution of large phytoplankton to total integrated primary production was higher than its contribution to total biomass. Both size fractions depicted maximum P/B and P/chl a in WTRA surface waters. In the SATL province, phytoplankton >2 mm showed the highest P/B and P/chl a along the UML, while picophytoplankton P/B and P/chl a peaked around the DCM. We suggest that the differential impact of light on small and large phytoplankton may help to explain the contrasting dynamics of the two size classes.
Keywords: phytoplankton, cell size, spatial variability, oligotrophic subtropical gyres, primary production, biomass.
RESUMEN: Biomasa y producción en diferentes clases de tamaño de fitoplancton en el Atlántico tropical. – Se realizaron dos transectos latitudinales en el Atlántico tropical y subtropical para describir (i) la variabilidad espacial de la concentración de clorofila a (chl a) y de la producción primaria total y fraccionada en clases de tamaño de fitoplancton (pi-cofitoplancton y fitoplancton >2 mm), (ii) la contribución relativa de cada clase de tamaño a la biomasa y fijación de carbono total, y (iii) la variabilidad espacial de la tasa de crecimiento (P/B) y del número de asimilación (P/chl a) para cada clase de tamaño en el océano. Las dos clases de tamaño consideradas presentaron la máxima chl a en el afloramiento ecuatorial y la mínima en la capa de mezcla del giro oligotrófico del Atlántico Sur. Se encontró un patrón similar en el caso de la fijación de carbono. En el giro oligotrófico del Atlántico Sur la mayor contribución del picofitoplancton a la producción total se registró en torno al máximo profundo de clorofila, mientras que la contribución de la fracción >2 mm fue mayor en la capa de mezcla. Además, la contribución relativa del fitoplancton >2 mm a la producción primaria total fue mayor que su contribución a la biomasa total. Ambas clases de tamaño presentaron máximos valores de P/B y P/chl a en las aguas superficiales del aflora-miento ecuatorial. En el giro oligotrófico del Atlántico Sur la fracción de fitoplancton >2 mm mostró máximos valores de P/B y P/chl a en la capa de mezcla, mientras que los mayores valores de P/B y P/chl a de picofitoplancton se registraron en torno al máximo profundo de clorofila. Nuestros resultados sugieren que el impacto diferencial de la radiación solar sobre el pico-fitoplancton y el fitoplancton >2 mm puede contribuir a explicar las diferencias en la dinámica de estas dos clases de tamaño.
Palabras clave: fitoplancton, tamaño celular, variabilidad espacial, giros oligotróficos subtropicales, producción primaria, biomasa.
Scientia Marina 75(2)June 2011, 379-389, Barcelona (Spain)
ISSN: 0214-8358doi: 10.3989/scimar.2011.75n2379

380 • E. MORENO-OSTOS
SCI. MAR., 75(2), June 2011, 379-389. ISSN 0214-8358 doi: 10.3989/scimar.2011.75n2379
INTRODUCTION
A full understanding of carbon cycling in the open ocean requires a detailed knowledge of the spatial and temporal variability of phytoplankton biomass and primary production. In addition, the size distribution of phytoplankton biomass and production should also be known, as it is a major biological factor governing the dynamics and function of the pelagic ecosystem, significantly influencing the rate of carbon export from the upper layers to the ocean’s interior (Malone, 1980; Azam et al., 1983; Legendre and Le Fèvre, 1991; Tremblay and Legendre, 1994; Marañón et al., 2001).
Although many studies have focused on the size-fractionated chlorophyll a (chl a) and primary pro-duction in different marine environments (Tremblay and Legendre, 1994; Legendre and Rassoulzadegan, 1996), only a small fraction of the available size-frac-tionated phytoplankton information has been recorded from open ocean waters and over large spatial scales (Marañón et al., 2001; Pérez et al., 2006; Morán et al., 2004; Poulton et al., 2006). Marañón et al. (2001) described the main patterns of size-fractionated chl a and carbon fixation in the Atlantic Ocean and showed a marked discrepancy between the relative contribu-tion of picophytoplankton to total chl a and primary production, particularly in the oligotrophic gyres (see also Teira et al., 2005). In these ecological domains, the relative contribution of picophytoplankton to total carbon incorporation was lower than its rela-tive contribution to total chl a. The potential causes of this pattern were explored by Fernández et al. (2003), who concluded that a higher light utilization efficiency of the larger phytoplankton fraction in the oligotrophic waters could enhance its contribution to primary production in comparison with that of pico-phytoplankton. In addition, it has been demonstrated that solar radiation induces considerable cell damage and mortality in the subtropical Atlantic (Llabrés and Agustí, 2006; Agustí and Llabrés, 2007), and Teira et al. (2005) hypothesized that a considerable fraction of the picophytoplankton biomass should correspond to damaged and non-viable cells, thus resulting in dis-crepancies between their contribution to biomass and carbon fixation.
Pérez et al. (2006) characterized the vertical vari-ability of phytoplankton biomass, size structure, pro-duction and growth in the Atlantic subtropical gyres. However, more information is needed on the large-scale distribution of size-fractionated phytoplankton biomass and carbon fixation in order to improve our knowledge of the dynamics of open ocean ecosystems. In this context, although picophytoplankton abundance and spatial distribution has been described previously within the tropical Atlantic (Zubkov et al., 1998; Tarran et al., 2006), few studies have combined such measure-ments with size-fractionated primary production deter-minations (i.e. Marañón et al., 2003). Consequently, we still lack a large-scale picture of the vertical and
latitudinal patterns of size-fractionated phytoplankton growth rate (P/B) and the assimilation number (P/chl a) in the Atlantic Ocean.
Here we report the results of two surveys con-ducted over a latitudinal range spanning>6000 km in the central Atlantic Ocean, covering the North Atlantic Tropical Drift (NATR), the Western Tropi-cal Atlantic (WTRA) and the South Atlantic Tropical gyre (SATL) biogeographic provinces (Longhurst, 1998). We first describe the spatial (vertical and lati-tudinal) variability of total and size-fractionated chl a and primary production, and explore the relative contribution of each phytoplankton size fraction to total chl a and primary production along the transects. We then analyse the spatial variability of the size-fractionated phytoplankton P/B and P/chl a. Finally, we investigate the role of light climate in controlling the size-fractionated phytoplankton dynamics in the Atlantic Ocean.
MATERIALS AND METHODS
Study area and general hydrography
Two meridional transects were conducted in the Atlantic Ocean on board the R/V Hespérides as part of the Trynitrop (‘Trichodesmium and N2 fixation in the tropical Atlantic’) project (Fig. 1a). The cruises took place in November-December 2007 (Trynitrop 1) and April-May 2008 (Trynitrop 2) and a total of 33 sites were visited, covering the NATR (25°N-15°N), WTRA (15°N-6°S) and SATL (6°S-30°S) biogeographic prov-inces defined by Longhurst (1998). At each sampling station, vertical profiles of temperature, salinity and fluorescence were obtained from the surface to 300 m depth using a CTDSBE911 probe attached to a rosette sampler equipped with 24 Niskin bottles. The begin-ning of the thermocline was defined as the depth at which the thermal gradient was >0.1ºC m-1 (Pérez et al., 2006).
Light climate and water samples collection
Water samples for the determination of nutrients, size-fractionated chl a and primary production were collected before dawn from 6-9 depths in the upper 200 m of the water column. Sampling depths were selected at each site after examining the fluorescence CTD pro-files and corresponded to optical depths ranging from 100% to 0.5% of surface irradiance. Vertical profiles of photosynthetically active radiation (PAR) were ob-tained at noon with a Satlantic OCP-100FF radiometer at a total of 16 stations. We found a highly significant relationship between the depth of the 1% PAR level (Zeu) and the depth of the deep chl a maximum DCM (ZDCM): Zeu=9.3+0.98×ZDCM (r2=0.87; P<0.001; n=16). This relationship was used to calculate Zeu and the light extinction coefficient (Kd) at each station where pri-mary production was measured.

PHYTOPLANKTON BIOMASS AND PRODUCTION IN THE ATLANTIC • 381
SCI. MAR., 75(2), June 2011, 379-389. ISSN 0214-8358 doi: 10.3989/scimar.2011.75n2379
Nutrient concentrations
Nanomolar concentrations of nitrate were deter-mined on-board on fresh samples using a segmented-flow automatic analyser (Technicon/Bran Luebbe) and following the method of Raimbault et al. (1990). To determine the concentration of dissolved reactive phos-phate, water samples were collected and stored frozen at –20°C until analysed in the laboratory with the same segmented-flow automatic analyser, following standard colorimetric methods (Grasshoff, 1976). The nitracline was defined as the depth at which nitrate concentra-tion reached 1 mmol L-1 (Robinson et al., 2006) and the phosphocline as the depth at which phosphate concen-trations reached 0.2 mmol L-1. We assumed that silicate was not a limiting factor for phytoplankton dynamics in the oligotrophic Atlantic.
Size-fractionated chlorophyll a concentration and primary production
For the determination of chl a concentration we fol-lowed the method proposed by Welschmeyer (1994). For this study, 250 ml of seawater was filtered sequen-tially through 2 and 0.2 mm polycarbonate filters using low vacuum pressure. After filtration, filters were kept in 5-10 ml of 90% acetone at –20°C overnight. Chl a flu-orescence was determined on the acetone extract using a Turner Designs fluorometer which had been previously calibrated with pure chl a. Total chl a concentration was determined as the sum of the chl a concentration in the two considered phytoplankton size classes, picophyto-plankton (<2 mm) and phytoplankton larger than 2 mm.
For the determination of size-fractionated primary production, four 75-ml volume polystyrene cell culture flasks (3 transparent and 1 dark bottle) were filled with seawater from each of the 6-9 sampling depths. Bottles were inoculated with 360-540 KBq (10-15 mCi) NaH-14CO3 and then incubated from dawn to dusk in on-deck flow-through incubators provided with neutral density and blue (Lee Mist Blue) filters that simulated the PAR levels experienced by the phytoplankton in their natural location within the water column. The incubators were refrigerated with running seawater pumped from the surface (for the samples from the upper mixed layer, UML) or with water circulating through a refrigera-tor (for the samples collected below the UML); it was ensured that all water samples were incubated at an in situ temperature ±2°C. After incubation, water samples were filtered at very low vacuum pressure (<50 mm Hg) through the same type of filters as those described for size-fractionated chl a determinations. In order to remove the unassimilated 14C, filters were exposed to concentrated HCl fumes for 10-12 hours. After adding 4 ml of liquid scintillation cocktail to each filter, we de-termined radioactivity on board using a Wallac liquid scintillation counter. Dark-bottle disintegrations per minute (dpm) values were subtracted from the values measured in the light samples.
Size-fractionated phytoplankton biomass
The biovolume of picophytoplankton in the water samples was determined on-board on fresh samples us-ing a Becton-Dickinson FACSCalibur flow cytometer. Picophytoplankton biovolume was then transformed
Fig. 1. – Cruise tracks and location of the sampling stations (a). Crosses, Trynitrop 2007; white circles, Trynitrop 2008. Contour plots repre-sent water temperature (ºC), the dotted line indicates the nitracline and white circles indicate the phosphocline during the Trynitrop 2007 (b) and Trynitrop 2008 (c) cruises. Marks in the top axis of the contour plots show the CTD stations. SATL: South Atlantic Tropical gyre; WTRA:
Western Tropical Atlantic province; NATR: North Atlantic Tropical gyre.

382 • E. MORENO-OSTOS
SCI. MAR., 75(2), June 2011, 379-389. ISSN 0214-8358 doi: 10.3989/scimar.2011.75n2379
to biomass following the conversion factors proposed by Worden et al. (2004): 230 fg C mm-3 for Synechoc-occus spp., 240 fg C mm-3 for Prochlorococcus spp. and 237 fg C mm-3 for picoeukaryotes. The biomass of phytoplankton larger than 2 mm was estimated from the size-fractionated chl a data using the C:chl a ratio calculated by Pérez et al. (2006) for this phytoplankton size class from a large data set collected from 94 oli-gotrophic stations in the Atlantic Ocean: 186 mg C mg chl a-1 in the UML and 58 mg C mg chl a-1 in the DCM.
RESULTS
General hydrography
The main hydrographic features (thermal structure, nitracline depth and phosphocline depth) recorded on the 2007 and 2008 cruises are shown in Figures 1b and 1c, respectively. Surface water was colder at lati-tudes higher than 20°N and 20°S. The warmest surface temperature and the most intense thermal stratifica-tion were observed within the WTRA province. As a consequence of summer warming within the SATL province, water temperature was higher and thermal stratification was more intense during the 2008 cruise than during the 2007 cruise (mean surface temperature was 23.3°C±2.3 in 2007 and 24.5ºC±2.5 in 2008; mean temperature difference between 10 and 150 m depth was 4.2°C m-1±2.4 in 2007 and 6.4°C m-1±1.3 in 2008).
Nitracline and phosphocline depth covaried strong-ly and their latitudinal variations followed those of the thermocline (Fig. 1b and 1c). In agreement, the equa-torial upwelling was evidenced by shallow nitracline and phosphocline depths (60 and 55 m, respectively during the 2007 survey, and 50 m in both cases dur-
ing the 2008 survey), while the deepest nitracline and phosphocline depths were found around 25°S within the SATL province (170 and 150 m during the 2007 survey, and 200 and 150 m during the 2008 survey).
Size-fractionated chl a
Highest levels of phytoplankton chl a concentration were observed between the equator and 15°N. In contrast, the oligotrophic gyres, especially the SATL province, showed the lowest chl a concentration, with values below 0.2 mg m-3 throughout the UML (Fig. 2). A similar pattern was described by Fernández et al. (2010) for Trichode-smium spp. abundance during the two Trynitrop cruises. A distinct DCM was located at the base of the UML in the tropical regions. As a consequence of the equatorial upwelling, the DCM was shallower between the equator and 15ºN (69 m in 2007 and 67.5 in 2008). The depth of the DCM roughly coincides and was significantly cor-related with the thermocline depth (r=0.80; P<0.0001; n=30; slope=1.3), the nitracline depth (r=0.91; P<0.0001; n=30; slope=1.2) and the phosphocline depth (r=0.84; P<0.0001; n=30; slope=1.1).
Figure 3 depicts the spatial distribution of size-fractionated chl a concentration. As a general trend, the chl a concentration of phytoplankton >2 mm (nano- and microplankton) was lower than that of picophytoplank-ton. The spatial distribution of chl a concentration in the two size classes covaried strongly. Both size frac-tions had their minimum chl a concentration in the UML of the SATL province, where the picophyto-plankton contribution to total chl a was below 60%. The contribution of picophytoplankton to total chl a in the SATL province was greater (above 70%) below ~100 m depth.
Fig. 2. – Latitudinal distribution of total chl a (mg m-3). a) Trynitrop 2007; b) Trynitrop 2008

PHYTOPLANKTON BIOMASS AND PRODUCTION IN THE ATLANTIC • 383
SCI. MAR., 75(2), June 2011, 379-389. ISSN 0214-8358 doi: 10.3989/scimar.2011.75n2379
Figure 4 shows the latitudinal variability of the total chl a integrated over the euphotic zone and the rela-tive contribution of the fraction >2 mm. Integrated chl a concentration values ranged between 18 and 35 mg m-2, with the highest values recorded within the equato-rial upwelling zone. The contribution of phytoplankton >2 mm to total biomass was always low, reaching peak values (ca. 40%) at some stations within the equatorial region. Picophytoplankton constituted the dominant size fraction on both cruises, accounting for between 58% and 75% of total integrated chl a. No significant correlation was found between total integrated chl a concentration and the contribution of picophytoplank-ton or phytoplankton >2 mm to total chl a.
Size-fractionated primary production
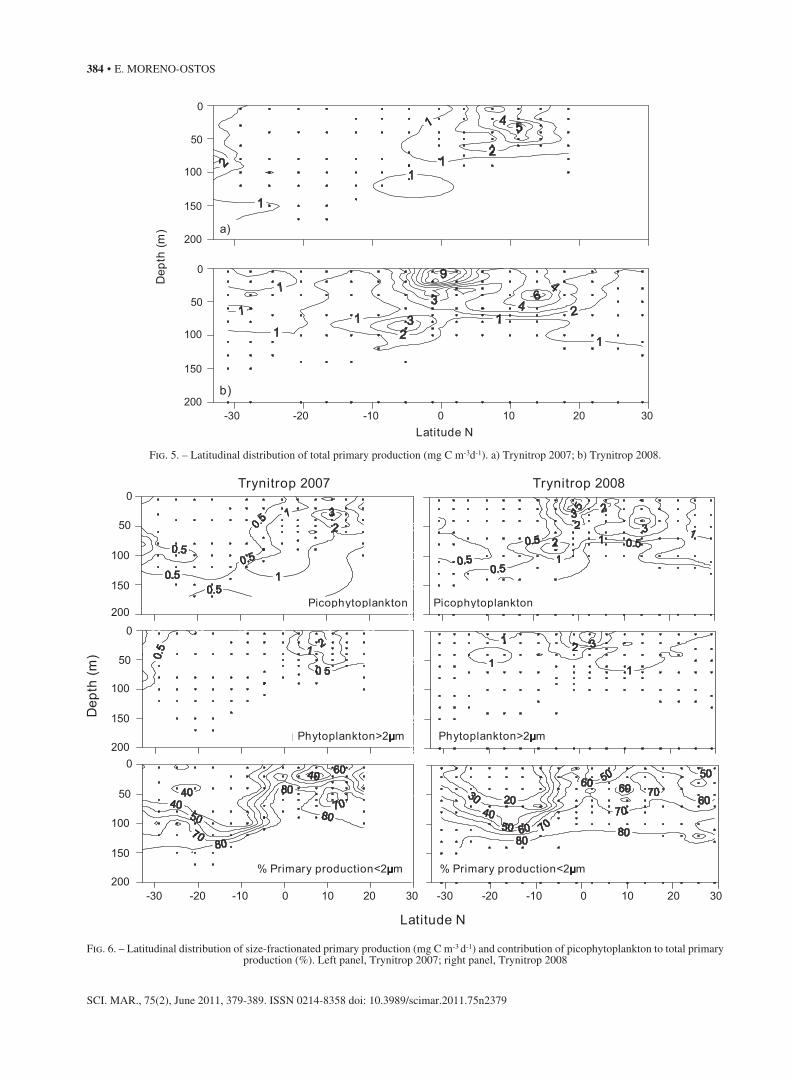
The latitudinal distribution of primary production depicted a similar pattern to that of total chl a concen-tration. The highest primary production rates (5 mg C m-3 d-1 in 2007 and 9 mg C m-3 d-1 in 2008) were recorded in subsurface waters around the equatorial upwelling and they significantly decreased within the oligotrophic NATR province and especially the SATL province (Fig. 5).
Figure 6 shows the spatial variability of size-frac-tionated primary production. Both picophytoplank-ton and large phytoplankton depicted maximum
Fig. 3. – Latitudinal distribution of size-fractionated chl a (mg m-3) and contribution of picophytoplankton to total chl a (%). Left panel, Trynitrop 2007; right panel, Trynitrop 2008.
Fig. 4. – Latitudinal distribution of total integrated chl a (white circles, mg m-2) and the relative contribution of phytoplankton >2 mm to total integrated chl a (BL:BT, black circles, %). a) Trynitrop
2007; b) Trynitrop 2008.
384 • E. MORENO-OSTOS
SCI. MAR., 75(2), June 2011, 379-389. ISSN 0214-8358 doi: 10.3989/scimar.2011.75n2379
Fig. 5. – Latitudinal distribution of total primary production (mg C m-3d-1). a) Trynitrop 2007; b) Trynitrop 2008.
Fig. 6. – Latitudinal distribution of size-fractionated primary production (mg C m-3 d-1) and contribution of picophytoplankton to total primary production (%). Left panel, Trynitrop 2007; right panel, Trynitrop 2008

PHYTOPLANKTON BIOMASS AND PRODUCTION IN THE ATLANTIC • 385
SCI. MAR., 75(2), June 2011, 379-389. ISSN 0214-8358 doi: 10.3989/scimar.2011.75n2379
primary production in the surface and subsurface waters of the equatorial upwelling zone, where pico-phytoplankton contribution to total primary produc-tion was above 60%. The highest picophytoplankton contribution to total production (above 80%) was al-ways recorded around the DCM depth. By contrast, primary production in the SATL province UML was dominated by the >2 mm size fraction (~60% in 2007 and ~80% in 2008).
Total integrated primary production over the eu-photic layer peaked in the equatorial upwelling region (242 mg C m-2 d-1 in 2007 and 402 mg C m-2d-1 in 2008) and was lower within the oligotrophic SATL (48 mg C m-2 d-1 in 2007 and 92 mg C m-2 d-1 in 2008) and NATR (38 mg C m-2 d-1 and 133 mg C m-2 d-1) (Fig.7). The relative contribution of picophytoplank-ton to total integrated primary production was above 50% in the NATR province (62.4%±10.1 in 2007; 64.5%±5.4 in 2008) and showed maximum values in the WTRA province (72.2%±7.5 in 2007; 71.64%± 9.4 in 2008). By contrast, it decreased in the SATL province (48.1%±5.6 in 2007 and 35.1%±9.4 in 2008), especially during the 2008 transect when it showed the minimum value of 23.6%.
The relative contribution of large-size phytoplankton to total biomass and primary production
The combined analysis of the results shown in Figure 4 and Figure 7 revealed that in the equatorial region the relative contribution of large-sized phyto-plankton to total integrated biomass (BL:BT) and total integrated production (PL:PT) was similar. However, in the oligotrophic gyres of both hemispheres (espe-cially in the SATL province) the relative contribution of large phytoplankton to total production (average 54%±6 in SATL 2007 and 65%±5 in SATL 2008) was higher than its contribution to total biomass (average 34%±3 in SATL 2007 and 31%±4 in SATL 2008). The most intense mismatch was recorded dur-ing the 2008 cruise in the SATL province, especially at 16º60´S, where the relative contribution of the >2 mm fraction to total phytoplankton biomass was 33%, while its contribution to total primary production was 76%. Conversely, picophytoplankton significantly contributed to total integrated biomass in the ultraoli-gotrophic SATL province (average values 66%±3 in 2007 and 69%±3 in 2008), while its relative contribu-tion to total integrated primary production in this area was low (average values 46%±6 in 2007 and 35%±5 in 2008).
Size-fractionated phytoplankton growth rate (P/B) and assimilation number (P/chl a)
The size-fractionated phytoplankton growth rate (P/B) was characterized by a marked latitudinal and vertical heterogeneity (Fig. 8). Picophytoplankton
highest P/B values (up to 0.6 d-1) were measured both in the WTRA surface layers and, interestingly, around the DCM within the SATL province, while the lowest P/B (<0.1 d-1) were detected throughout the UML in the SATL province. On the other hand, phytoplankton >2 mm maximum P/B values ranged between 0.1 and 0.2 d-1 and were recorded in the upper water layers of the equatorial upwelling.
Phytoplankton >2 mm sustained higher assimilation numbers (P/chl a) than picophytoplankton throughout the two cruises (data not shown). The maximum P/chl a values for both phytoplankton >2 mm (40 µgC µgchl a-1 d-1 in 2007 and 56 µgC µgchl a-1 d-1 in 2008) and picophytoplankton (17 µgC µgchl a-1 d-1 in 2007 and 43 µgC µgchl a-1 d-1 in 2008) were measured in surface waters within the equatorial upwelling region. In addition, within the SATL province, phytoplankton >2 mm showed the highest P/chl a values (up to 12 µgC µgchl a-1 d-1 in 2007 and up to 35 µgC µgchl a-1 d-1 in 2008) in the UML, where picophytoplankton P/chl a remained lower than 5 µgC µgchl a-1 d-1. A deep and less intense picophytoplankton P/chl a peak (6.5 µgC µgchl a-1 d-1 in 2007 and 5.5 µgC µgchl a-1 d-1 in 2008) was recorded close to the DCM depth, where >2 mm P/chl a was very low.
Fig. 7. – Latitudinal distribution of total integrated primary produc-tion (white circles, mg C m-2 d-1) and relative contribution of phy-toplankton >2 mm to total integrated primary production (PL:PT,
black circles, %). a) Trynitrop 2007; b) Trynitrop 2008.

386 • E. MORENO-OSTOS
SCI. MAR., 75(2), June 2011, 379-389. ISSN 0214-8358 doi: 10.3989/scimar.2011.75n2379
The influence of light climate on the size-fractionated phytoplankton growth rate
We used the light vertical extinction coefficient (Kd) to describe the spatial variability in the light cli-mate experienced by the phytoplankton throughout the transects (Fig. 9). Maximum Kd values (0.067 m-1) were always recorded within the WTRA province, while minimum Kd were found within the SATL prov-ince (0.026 m-1 in 2007 and 0.031 m-1 in 2008).
During the two Trynitrop cruises a direct and sig-nificant correlation (r=0.70; P<0.0001; n=31) was evi-denced between Kd and the surface picophytoplankton growth rate (Fig. 10a). However, no significant corre-lation was found between Kd and phytoplankton >2mm growth rate (Fig. 10b).
Fig. 8. – Latitudinal distribution of the size-fractionated growth rate (d-1). Left panel, Trynitrop 2007; right panel, Trynitrop 2008
Fig. 9. – Latitudinal distribution of Kd (m-1). Black circles, Tryni-trop 2007; White circles, Trynitrop 2008
Fig. 10. – Relationship between Kd (d-1) and surface size-fractionat-ed phytoplankton growth rate. a) picophytoplankton; b) phytoplank-
ton >2 mm

PHYTOPLANKTON BIOMASS AND PRODUCTION IN THE ATLANTIC • 387
SCI. MAR., 75(2), June 2011, 379-389. ISSN 0214-8358 doi: 10.3989/scimar.2011.75n2379
DISCUSSION
The spatial distribution pattern of total chl a dur-ing the two latitudinal surveys fits well with those ob-served during previous cruises along similar transects (i.e. the AMT programme, see Marañón et al., 2000; Marañón et al., 2001; Poulton et al., 2006), and was characterized by very low chl a in the NATR and SATL provinces (<0.1 mg m-3) and increased chl a at depth to form a basin scale subsurface chl a maximum. The highest chl a was recorded in the WTRA province at the DCM (0.8 mg m-3). The DCM constitutes a wide-spread feature in the world oceans and may be formed through a variety of mechanisms, including accumula-tion of cells from overlying water layers, differential phytoplankton sinking rates, physiological photoac-climatation and enhanced in situ growth sustained by nutrient diffusion through the thermocline (Marañón et al., 2000). The DCM was characterized by chl a con-centrations between 0.2 and 0.8 mg m-3, a similar range to that measured by Marañón et al. (2000) in AMT-1 to AMT-3. As reported by former studies (Herbland and Voituriez, 1979; Cox et al., 1982; Agustí and Duarte, 1999), the location of the DCM was strongly associated with the thermocline depth. Additionally, in agreement with Herbland and Voituriez (1979), an inverse and significant relationship was evidenced be-tween the depth of the DCM and its intensity (r=0.86; P<0.0001; n=31), with the highest chl a concentration located around the equator at relatively shallow depths. The higher magnitude of the DCM is likely to result from the enhanced nutrient supply by vertical diffusion in these regions, in turn due to the existence of a more intense vertical gradient in nutrient concentration near the base of the euphotic layer.
In agreement with Marañón et al. (2000), we did not find any statistically significant correlation between the depth of the DCM and the depth of the total pro-duction maximum (r=0.35; P>0.1; n=31). However, this pattern changes when the different phytoplankton size fractions are considered separately. In fact, DCM depth and the depth of picophytoplankton maximum primary production were strongly correlated for DCM depths deeper than 110 m (r=0.87; P<0.0001; n=12). Similarly, the DCM depth and the picophytoplankton maximum P/B depth were also correlated for DCM deeper than 110 m (r=0.88; P<0.0001; n=12). Fur-thermore, maximum picophytoplankton P/B values were recorded both in WTRA surface waters (where Synechococcuss and picoeukaryotes constituted the main picophytoplankton populations) and at the DCM depth in the SATL province, where Prochlorococcus is the dominant population. By contrast, the DCM depth and the depth of maximum carbon fixation rate and maximum P/B ratio were not significantly correlated in the case of the phytoplankton >2 mm. Maximum P/B and chl a values for this phytoplankton size fraction were typically found in the UML. A study of in situ phytoplankton growth rate for different size classes in
the two Atlantic subtropical gyres (Pérez et al., 2006) also found that picophytoplankton showed significant-ly higher growth rates in the DCM than in the UML, while the opposite occurred in the larger size fraction. Pérez et al. (2006) suggested that picophytoplankton should perform better than larger cells in the DCM, where light is low but nutrient availability is higher than in the UML. Similar results were obtained in the SATL province by Huete-Ortega et al. (unpublished data) when they analyzed the vertical variability of the metabolic size scaling of phytoplankton.
Thus, contrary to previous assumptions based on bulk phytoplankton measurements of a low primary production and slow turnover for the phytoplankton populations inhabiting the DCM (Marañón et al., 2000), our results suggest that the DCM should be con-sidered as a physiologically active layer for picophyto-plankton in the Atlantic Ocean, especially in the ultra-oligotrophic SATL province. The mean contribution of the DCM to total integrated primary production was high in the oligotrophic subtropical gyres (29.9%±12.7 in NATR and 30.6%±7.3 in SATL), but lower in the WTRA province (18.8%±8.3).
In agreement with previous studies (Behrenfeld et al., 2005; Marañón, 2005; Pérez et al., 2006), the P/B values obtained for both phytoplankton size fractions in the upper layers of the subtropical gyres were gen-erally very low, and always lower than the maximum theoretical growth rates (1.5 d-1) suggested by Eppley (1972) for unicellular algae of surface waters in the subtropical gyres. As a consequence, in agreement with Marañón (2005), our data strongly suggest that not only the standing stocks of phytoplankton but also their growth rates are limited in the surface layer of the oligotrophic subtropical gyres. The nutrient limitation of phytoplankton physiology and productivity in the oligotrophic Atlantic Ocean has been unequivocally demonstrated (Moore et al., 2008).
Regarding the size-fractionated primary produc-tion to chlorophyll a ratio, our results demonstrate that higher assimilation numbers were associated with larg-er cells in the UML. A similar pattern was described by Poulton et al. (2006) for the Atlantic Ocean. In the case of picophytoplankton the assimilation number was lower, reaching maximum values both in WTRA surface waters and around the DCM in the SATL prov-ince. Although previous studies have reported a higher photosynthetic efficiency for the phytoplankton >2 mm in a wide range of marine environments including the subarctic pacific (Hashimoto and Shiomoto, 2002), coastal ecosystems (Madariaga and Fernández, 1990; Cermeño et al., 2005) and the Atlantic oligotrophic gyres (Fernández et al., 2003), these results are unex-pected from the current knowledge of size-dependent variability in resource acquisition and photon-harvest-ing capacities of phytoplankton.
Picophytoplankton have a smaller package effect and a higher surface-to-volume ratio, and are there-fore able to use resources more efficiently than larger

388 • E. MORENO-OSTOS
SCI. MAR., 75(2), June 2011, 379-389. ISSN 0214-8358 doi: 10.3989/scimar.2011.75n2379
phytoplankton (Raven, 1998). In agreement, many size-fractionated P-E experiments generally conclude that picophytoplankton show higher photosynthetic efficiency and assimilation numbers than larger cells (Platt et al., 1983; Joint and Pomroy, 1986; Frenette et al., 1996). Nevertheless, Fernández et al. (2003) pointed out that only a few such measurements were conducted in the open oligotrophic ocean. In this regard, Teira et al. (2005) suggested that the higher photosynthetic ef-ficiency of larger phytoplankton in the surface waters of the North Atlantic subtropical gyre occur mainly during periods of low nutrient concentration, high irradiance and stable thermal stratification, pointing out that the high irradiance levels could reduce photosynthesis and damage the picophytoplankton cells. Accordingly, it has previously been argued that the small size of picophy-toplankton should be a disadvantage under high solar radiation exposure as pico-sized organisms may find it difficult to accommodate within their cells sufficient photoprotective substances to avoid photosyntheti-cally active radiation and ultraviolet radiation damage (García-Pichel, 1994; Finkel et al., 2010). Llabrés and Agustí (2006) have demonstrated that natural levels of visible and ultraviolet radiation induce considerable picophytoplankton cell mortality in the subtropical At-lantic Ocean. In addition, Agustí and Llabrés (2007) reported that picophytoplankton experience high cell death rate due to exposure to natural underwater levels of solar radiation in the UML.
In this context, Raven et al. (2005) pointed out the amplified photoinhibition effect of high PAR lev-els on picophytoplankton cells. Furthermore, recent studies have demonstrated that a significant fraction of the picophytoplankton community in the surface oligotrophic waters is non-viable, i.e. incapable of cell division (Veldhuis et al., 2001), while viability of pico-phytoplankton cells increases significantly at the DCM depth (Veldhuis et al., 2005). In agreement, our results demonstrate that picophytoplankton surface P/B was positively correlated with Kd, thus revealing the nega-tive effect of high solar radiation on picophytoplank-ton metabolic dynamics, especially in the oligotrophic oceanic tropical waters, where nutrient scarcity should also negatively affect the picophytoplankton capacity to resist solar radiation and repair associated damages (Banaszak, 2003).
As a consequence, we could conclude that a rel-evant fraction of the quite constant picophytoplankton biomass in the UML of the oligotrophic Atlantic Ocean (especially the SATL province) must be composed of damaged, non-viable or even dead cells. However, variability in Kd did not significantly influence the P/B of surface phytoplankton >2 mm, which typically have a higher package effect, lower susceptibility to photoinactivation and better photosynthetic perform-ance in surface waters under high irradiance levels (Hashimoto and Shiomoto, 2002; Raven et al., 2005; Cermeño et al., 2005; Finkel et al., 2010). Therefore, the phytoplankton in this larger size class are likely to
incur lower costs to endure exposures to high light, especially under conditions that limit metabolic rates (Key et al., 2010; Finkel et al., 2010).
Our results evidence a marked disagreement be-tween the relative contribution of phytoplankton larger than 2 mm to total chl a biomass and their contribution to total primary production, especially in the ultra-oli-gotrophic SATL province, indicating that a dominance of picophytoplankton in terms of biomass frequently co-occurred with a dominance of the phytoplankton >2 mm in terms of production. A similar pattern has been previously reported for the Atlantic Ocean by Marañón et al. (2001), Fernández et al. (2003), Teira et al. (2005), and Poulton et al. (2006). These authors concluded that the observed mismatch was related, among other factors, to the higher photosynthetic ef-ficiency of larger phytoplankton, and they pointed out that this discrepancy is greater in areas and seasons characterized by low nutrient availability and high ir-radiance levels (i.e. within the ultraoligotrophic gyres in summer). Under these circumstances, a considerable fraction of picophytoplankton cells would be damaged and, consequently, the chl a concentration and even carbon biomass would not necessarily indicate the bio-mass of viable cells, thus explaining the discrepancies between the relative contribution of picophytoplankton to total biomass and total primary production (Teira et al., 2005). Consequently, the phytoplankton size frac-tion larger than 2 mm must play a greater role in carbon fixation within low nutrient open ocean environments than could be expected from their relative contribution to total chl a (Poulton et al., 2006).
ACKNOWLEDGEMENTS
This work was funded by the Spanish Ministry of Education through grant CTM2004-05174-C02 to E. Marañón. We thank J. Escánez and J. F. Domínguez for the nutrient analyses, P. Chouciño and P. Cermeño for assistance during the work at sea, and J. Rodríguez, J.M. Blanco and F.X. Niell for valuable comments on data analysis. We also thank the officers and crew of the R/V Hespérides, as well as the staff of the Marine Technical Support Unit (UTM), for their support dur-ing the cruises. B. Mouriño-Carballido was supported by the Isidro Parga Pondal programme of the Galician government.
REFERENCES
Agustí, S. and C.M. Duarte. – 1999. Phytoplankton chlorophyll a distribution and water column stability in the central Atlantic Ocean. Oceanol. Act., 22: 193-203.
Agustí, S. and M. Llabrés. – 2007. Solar radiation-induced mortality of marine pico-phytoplankton in the oligotrophic ocean. Photo-chem. Photobiol., 83: 793-801.
Azam, F., T. Fenchel, J.G. Field, J.S. Gray, L.A. Meyer-Reil and F. Thingstad. – 1983. The ecological role of water-column mi-crobes in the sea. Mar. Ecol. Prog. Ser., 10: 257-263.
Banaszak, A.T. – 2003. Photoprotective physiological and biochem-ical responses of aquatic organisms. In: E.W. Helbling and H. Zagarese (eds.), UV effects in aquatic organisms and ecosys-

PHYTOPLANKTON BIOMASS AND PRODUCTION IN THE ATLANTIC • 389
SCI. MAR., 75(2), June 2011, 379-389. ISSN 0214-8358 doi: 10.3989/scimar.2011.75n2379
tems, pp. 329-356. Royal Society of Chemistry, Cambridge. Behrenfeld, M.J., E. Boss, D.A. Siegel and D.M. Shea. – 2005.
Carbon-based ocean productivity and phytoplankton physiol-ogy from space. Glob. Biogeochem. Cycles., 19, GB1006. doi 10.1029/2004GB002299.
Cermeño, P., E. Marañón, J. Rodríguez and E. Fernández. – 2005. Large-sized phytoplankton sustain higher carbon-specific pho-tosynthesis than smaller cells in a coastal eutrophic ecosystem. Mar. Ecol. Prog. Ser., 297: 51-60.
Cox, J.L., P.H. Wiebe, P. Ortner and S. Boyd. – 1982. Seasonal development of subsurface chlorophyll maxima in Slope Water and Northern Sargasso Sea of the Northwestern Atlantic Ocean. Biol. Oceanogr., 1: 271-285.
Eppley, R.W. – 1972. Temperature and phytoplankton growth in the sea. Fish. Bull., 70: 1063-1085.
Fernández, A., B. Mouriño-Carballido, A. Bode, M. Varela and E. Marañón. – 2010. Latitudinal distribution of Trichodesmium spp. and N2 fixation in the Atlantic Ocean. Biogeosciences, 7: 3167-3176.
Fernández, E., E. Marañón, X.A.G. Morán and P. Serret. – 2003. Po-tential causes for the unequal contribution of picophytoplankton to total biomass and productivity in oligotrophic waters. Mar. Ecol. Prog. Ser., 254: 101-109
Finkel, Z.V., J. Beardall, K.J. Flynn, A. Quigg, T.A.V. Rees and J.A. Raven. – 2010. Phytoplankton in a changing world: cell size and elemental stoichiometry. J. Plankton Res., 32(1): 119-137.
Frenette, J.J., S. Demers, L. Legendre and M. Boulé. – 1996. Size-related photosynthetic characteristics of phytoplankton during periods of seasonal mixing in an oligotrophic multibasin lake system. J. Plankton Res., 18: 45-61.
García-Pichel, F. – 1994. A model for internal self-shading in planktonic organisms and its implications for the usefulness of ultraviolet screen. Limnol. Oceanogr., 39: 1704-1717.
Grasshoff, K. – 1976. Methods of seawater analysis. Verlag Chemie, Winheim and New York.
Hashimoto, S. and A. Shiomoto. – 2002. Light utilization efficiency of size-fractionated phytoplankton in the subarctic Pacific, spring and summer 1999: high efficiency of large-size diatom. J. Plankton Res., 24(1): 83-87.
Herbland, A. and B. Voituriez. – 1979. Hydrological structure analysis for estimating the primary production in the Tropical Atlantic Ocean. J. Mar. Res., 37(1): 87-101.
Joint, I.R. and A.J. Pomroy. – 1986. Photosynthetic characteristics of nanoplankton and picoplankton for the surface mixed layer. Mar. Biol., 92: 465-474.
Key, T., A. McCarthy, D.A. Campbell, C. Six, S. Roy and Z.V. Finkel. – 2010. Cell size trade-offs govern light exploitation strategies in marine phytoplankton. Environ. Microbiol., 12(1): 95-104.
Legendre, L. and J. Le Fèvre. – 1991. From individual plankton cells to pelagic marine ecosystems and to global biogeochemi-cal cycles. In: S. Demers (ed.), Particle analysis in oceanogra-phy, pp. 261-300. Springer-Verlag, Heidelberg.
Legendre, L. and F. Rassoulzadegan. – 1996. Food-web mediated export of biogenic carbon in the oceans. Mar. Ecol. Prog. Ser., 145: 179-193.
Llabrés, M. and S. Agustí. – 2006. Picophytoplankton cell death induced by UV radiation: Evidence for oceanic Atlantic com-munities. Limnol. Oceanogr., 51: 21-29.
Longhurst, A. – 1998. Ecological geography of the sea. Academic Press, San Diego, CA.
Madariaga, I. and E. Fernández. – 1990. Photosynthetic carbon metabolism of size-fractionated phytoplankton during an ex-perimental bloom in marine microcosms. J. Mar. Biol. Assoc. UK, 70: 531-543.
Malone, T.C. – 1980. Size-fractionated primary productivity of marine phytoplankton. In: P.G. Falkowski (ed.), Primary pro-ductivity in the sea, pp. 301-319. Plenum Press, New York.
Marañón, E. – 2005. Phytoplankton growth rates in the Atlantic subtropical gyres. Limnol. Oceanogr., 50(1): 299-310.
Marañón, E., P.M. Holligan, M. Varela, B. Mouriño and A.J. Bale. – 2000. Basin-scale variability of phytoplankton biomass, pro-duction and growth rate in the Atlantic Ocean. Deep-Sea Res. I, 47: 825-857.
Marañón, E., P.M. Holligan, R. Barciela, N. González, B. Mouriño, M.J. Pazó and M. Varela.-2001. Patterns of phytoplankton size structure and productivity in contrasting open-ocean environ-
ments. Mar. Ecol. Prog. Ser., 216: 43-56.Marañón, E., M.J. Behrenfeld, N. González, B. Mouriño and M.V.
Zubkov. – 2003. High variability of primary production in oli-gotrophic waters of the Atlantic Ocean: uncoupling from phy-toplankton biomass and size structure. Mar. Ecol. Prog. Ser., 257: 1-11.
Moore, C.M., M.M. Mills, R. Langlois, A. Milne, E.P. Achterger, L. La Roche and R.J. Geider. – 2008. Relative influence of nitro-gen and phosphorus availability on phytoplankton physiology and productivity in the oligotrophic sub-tropical North Atlantic Ocean. Limnol. Oceanogr., 53: 291-305.
Morán, X.A.G., E. Fernández and V. Pérez. – 2004. Size-fractionated primary production, bacterial production and net community pro-duction in subtropical and tropical domains of the oligotrophic NE Atlantic in autumn. Mar. Ecol. Prog. Ser., 274: 17-29.
Pérez, V., E. Fernández, E. Marañón, X.A.G. Morán and M.V. Zub-kov. – 2006. Vertical distribution of phytoplankton biomass, production and growth in the Atlantic subtropical gyres. Deep-Sea Res. I, 53: 1616-1634.
Platt, T., D.V. Subba Rao and B. Irwin. – 1983. Photosynthesis of picoplankton in the oligotrophic ocean. Nature, 301: 702-704.
Poulton, A.J., P.M. Holligan, A. Hickman, Y-N. Kim, T.R. Adey, M.C. Stinchcombe, C. Holeton, S. Root and E.M.S. Woodward. – 2006. Phytoplankton carbon fixation, chlorophyll-biomass and diagnostic pigments in the Atlantic Ocean. Deep-Sea Res. II, 53: 1593-1610.
Raimbault, P., G. Slawyk, B. Coste and J. Fry. – 1990. Feasibility of using an automated colorimetric procedure for the determina-tion of seawater nitrate in the 0 to 100 nM range: examples from field and culture. Mar. Biol., 104: 347-351. Raven, J.A. – 1998. The twelfth Tansley Lecture. Small is beautiful: the picophyto-plankton. Funct. Ecol., 12: 503-513.
Raven, J.A. – 1998. The twelfth Tansley Lecture. Small is beautiful: the picophytoplankton. Funct. Ecol., 12: 503-513.
Raven, J.A., Z.V. Finkel and A.J. Irwin. – 2005. Picophytoplankton: bottom-up and top-down controls on ecology and evolution. Vie Milieu, 55(3-4): 209-215.
Robinson, C., A.J. Poulton, P.M. Holligan, A.R. Baker, G. Forster, N. Gist, T.D. Jickells, G. Malin, R. Upsill-Goddard, R.G. Wil-liams, E.M.S. Woodward and M.V. Zubkov. – 2006. The Atlan-tic Meridional Transect (AMT) Programme: A contextual view 1995-2005. Deep-Sea Res. II, 53: 1485-1515.
Tarran, G.A., J.L. Heywood and M.V. Zubkov. – 2006. Latitudi-nal changes in the standing stocks of nano- and picoeukaryo-tic phytoplankton in the Atlantic Ocean. Deep-Sea Res. II, 53: 1516-1529.
Teira, E., B. Mouriño, E. Marañón, V. Pérez, M.J. Pazó, P. Serret, D. de Armas, J. Escánez, E.M.S. Woodward and E. Fernán-dez.-2005. Variability of chlorophyll and primary production in the Eastern North Atlantic Subtropical Gyre: potential factors affecting phytoplankton activity. Deep-Sea Res. I, 52: 569-588.
Tremblay, J.E. and L. Legendre.-1994. A model for the size-fractionated biomass and production of marine phytoplankton. Limnol. Oceanogr., 39(8): 2004-2014.
Veldhuis, M.J.W., G.W. Kraay and K.R. Timmermans. – 2001. Cell death in phytoplankton: correlation between changes in mem-brane permeability, photosynthetic activity, pigmentation and growth. Eur. J. Phycol., 36: 167-177.
Veldhuis, M.J.W., K.R. Timmermans, P. Croot and B.V.D. Wagt. – 2005. Picophytoplankton; a comparative study in their biochemical composition and photosynthesis properties. J. Sea Res., 53: 7-24.
Welschmeyer, N.A. – 1994. Fluorometric analysis of chlorophyll a in the presence of chlorophyll b and pheopigments. Limnol. Oceanogr., 39(8): 1985-1992.
Worden, A.Z., J.K. Nolan and B. Palenik. – 2004. Assessing the dynamics and ecology of marine picophytoplankton: The importance of the eukaryotic component. Limnol. Oceanogr., 49(1): 168-179.
Zubkov, M.V., M.A. Sleigh, G.A. Tarran, P.H. Burkill, R.J.G. Leakey. – 1998. Picoplanktonic community structure on an Atlantic transect from 50ºN to 50ºS. Deep-Sea Res. I, 45: 1339-1355.
Scient. ed.: M. Estrada.Received June 23, 2010. Accepted November 5, 2010.Published online March 14, 2011.