Chemistry and Properties of Nanocrystals of Different Shapes
PHYSICAL REVIEW B 91, 125402 (2015)
Size dependence of the stability, electronic structure, and optical propertiesof silicon nanocrystals with various surface impurities
V. Kocevski, O. Eriksson, and J. RuszDepartment of Physics and Astronomy, Uppsala University, Box 516, S-751 20 Uppsala, Sweden
(Received 22 December 2014; revised manuscript received 18 February 2015; published 3 March 2015)
We present a comprehensive, ground-state density functional theory study of the size dependence of the opticaland electronic properties and the stability of spherical silicon nanocrystals (NCs) with different impurities onthe surface. We vary the size of the NCs from 1.0 to 3.5 nm, considering single-bonded (CH3, F, Cl, OH) anddouble-bonded (O, S) impurities and bridged oxygen. We show that the density of states (DOS) and absorptionindices of the NCs with single-bonded impurities are very similar to each other and the fully hydrogenated NCs,except for the 1.0-nm NCs, where a slight difference is present. In the case of the NCs with double-bondedimpurities, the DOS and absorption indices exhibit a significant difference, compared to the fully hydrogenatedNCs, for sizes up to 2.5 nm. We argue that this difference arises from the difference in the contribution fromthe impurity to the states around the gap, which can considerably change the character of the states. Wedemonstrate that the double-bonded impurities contribute significantly to the states around the gap, comparedto the single-bonded impurities, causing changes in the symmetry of these states. This observation was furthersupported by analyzing the changes of the Fourier transform of the charge densities of the highest occupied andlowest unoccupied eigenstate. We also show that the formation energies of NCs with bridged oxygen and fluorineare the lowest, regardless of the size. Furthermore, we show that high hydrogen concentration can be used tosuppress the addition of oxygen and fluorine on the surface of the Si NCs.
DOI: 10.1103/PhysRevB.91.125402 PACS number(s): 73.22.−f, 78.67.Hc, 42.70.Qs, 61.46.Hk
I. INTRODUCTION
Although bulk silicon has been used in many light-absorbing applications for decades, the existence of an indirectband gap, and hence the necessity of coupling of photonemission with a phonon, makes bulk silicon a very inefficientlight emitter. This property of bulk silicon can be greatlyinfluenced by making nanocrystals (NCs) [1], where it has beenshown that the wave function (WF) of the lowest unoccupiedeigenstate (LUMO) becomes more localized around the �
point, attaining a similar character to the WF of the highest oc-cupied eigenstate (HOMO) [2–4]. This change in the characterof the LUMO WF increases the probability of direct transitionsfrom the LUMO to the HOMO level, largely enhancing thephotoluminescence (PL) efficiency of Si NCs [5–7], comparedto that of bulk Si. Moreover, due to the quantum confinementeffect, the band gap in the Si NCs widens with decreasingsize, allowing for the band gap to be tailored according to thespecific needs. The increased PL efficiency and the tunableband of the Si NCs has been realized in many differentapplications, from lasers [8,9], light-emitting diodes [10–13],and other optical devices [14–16], to sensors [17–21] andphotovoltaics [22–25]. Because of the biocompatibility andnontoxicity, the Si NCs are furthermore becoming one of theleading materials for biological fluorescent imaging [26–31].
However, when left under ambient conditions, the hydro-genated Si NCs are extremely prone to surface oxidation. Thissurface oxidation considerably changes the PL properties byinducing localized defect states within the gap and redshiftingthe emitted light [32–37]. Moreover, the localized midgapstates and the trapping of the exciton at the Si=O bond [33]give rise to PL with very similar energy, when the size of theNCs is less than ∼3 nm [33,38–41]. In many applications,Si NCs that emit light in a particular spectral range areneeded; thus, it is necessary to suppress the oxidation of the
NCs. To reduce the surface oxidation, the Si NCs’ surfacesare passivated with organic molecules [27,42,43], which cangreatly improve the PL properties of the NCs. Also, on thesurface of the Si NCs there can be other surface impurities,coming as residues from the specific chemicals used in thesynthesis of the NCs. Therefore, it is important to have anunderstanding of the changes in the electronic and opticalproperties of the Si NCs induced by the addition of varioustypes of surface impurities.
In the past, the dependence of the electronic and opticalproperties of hydrogenated Si NCs on the size of the NCs,has been extensively studied, employing various theoreticalmethods; see Refs. [2–4,32,33,44–55], to name a few. How-ever, there have been only a limited number of theoreticalstudies concerning the size dependence of the electronic andoptical properties of Si NCs with different surface impurities[4,33–35,52–58]. A number of these articles focus on theinfluence of only one surface impurity [33,34,52,54,55], whilein others, the Si NCs with partially passivated or fullypassivated surface with impurities are studied [4,35,53,56–58].Among these works, there have been only a few studies of theeffect of the surface impurities on the electronic and opticalproperties for Si NCs larger than 2 nm [4,33,55]. Based on theircalculations, Vasiliev et al. [34] estimated that the effect of theoxygen on the states around the gap should be present for NCswith size ∼2–2.5 nm, and Wolkin et al. [33] showed that theelectron can be trapped in oxidized NCs smaller than ∼3 nm.This motivated us to perform a more detailed theoretical studyof the size dependence of the electronic and optical propertiesof Si NCs with surface impurities, where NCs larger than 2 nmare also considered.
Here we present a first-principles study, where Si NCs withsize up to 3.5 nm are considered, with various single-bondedand double-bonded impurities, assuming only one impurity
1098-0121/2015/91(12)/125402(13) 125402-1 ©2015 American Physical Society

V. KOCEVSKI, O. ERIKSSON, AND J. RUSZ PHYSICAL REVIEW B 91, 125402 (2015)
located the surface. We use the ground-state density functionaltheory (DFT) to calculate the density of states (DOS) and theabsorption indices of the studied NCs. From there we extractthe HOMO-LUMO gap and the optical absorption gap, andwe follow the changes of both gaps with size of the NCs andthe type of impurity. We also calculate the projected DOS, tohave an overview of the changes in the contribution fromthe surface impurities, to the states around the gap. Wecomplement these findings by looking into the size evolutionof the Fourier transform of the charge densities of the HOMOand LUMO. In addition, we investigate the stability of the NCs,depending on the surface impurity and the size and the changesin the stability with increasing concentration of the impurity.
This paper is structured as follows. In Sec. II we introducethe used surface impurities and the methodology employedin this study. In Sec. III we demonstrate the stability of theSi NCs with different surface impurities, as a function of theNC size, and the dependence of the stability of the NCs onthe impurity concentration. In Sec. IV we discuss in detailsthe size dependence of the HOMO-LUMO gap and the opticalabsorption gap, as well as the DOS and absorption indices.In Sec. V we investigate the contribution from the differentimpurities to the states around the gap, and the changes thatthese impurities induce to the HOMO and LUMO WFs, inreal and reciprocal space. Finally, in Sec. VI we summarizethe concluding remarks.
II. STRUCTURAL MODELS AND METHODOLOGY
To follow the size evolution of the electronic and opticalproperties of the Si NCs with surface impurities, we considerfully hydrogenated Si NCs, with diameters from 1.0 to 3.5 nm.On the surface of these NCs we inserted various impuritieshaving distinct properties and different types of bonding withthe surface Si atoms. We considered a methyl group (−CH3)as a representative of the most common way of passivating theSi NCs and two highly electronegative elements, F and Cl, asimpurities. Furthermore, to understand the changes in the prop-erties with the changes in the bonding between the Si atom andthe impurity atom, we have considered two types of double-bonded impurities, =O and =S. Because the performance ofthe Si NCs can be greatly affected by surface oxidation, we alsotook into account other forms in which oxygen can be bonded
on the surface-hydroxyl group (–OH) and bridged oxygen(−O−). At the end, we have Si NCs with four different types ofsingle-bonded (SB) impurities (−CH3,−F,−Cl,−OH), twodifferent types of double-bonded (DB) impurities (=O, =S),and bridged oxygen.
For the purpose of our study, we have used the DFTas implemented in the pseudopotential package SIESTA [59],employing local density approximation (LDA) exchangecorrelation potential. The integration is performed in a real-space three-dimensional (3D) grid, the fineness of which isdetermined by the plane-wave cutoff. We used a plane-wavecutoff of 160 Ry, the same cutoff as in our previous calculations[3]. Numerical atomic orbitals are used as a basis set, single ζ
with polarization orbital (SZP) for Si, double ζ (DZ) for H, andSZP for each of the other considered elements (O, C, F, Cl, S).We refer the reader to Ref. [3] for a more detailed discussionof basis sets for different elements. Furthermore, we explicitlyevaluated the dipole transition matrix elements between eachoccupied and unoccupied eigenstate up to 15 eV, from wherethe imaginary part of the dielectric tensor is calculated. Weused Gaussian broadening of 0.1 when performing the cal-culations. By employing the Kramers-Kroning transformationof the imaginary part of the dielectric tensor [εαα(ω)], weobtained the real part [Reεαα(ω)], from where the absorptionindices [kαα(ω)] can be calculated, using the equation
kαα(ω) =√
|εαα(ω)| − Reεαα(ω)
2.
In the previous study we showed that having a sphericalshape or a NC made using the Wulff construction has a ratherweak effect on the DOS and absorption indices of the SiNCs [3]. Therefore, in this study we consider only sphericalsilicon NCs with surface impurities, and as a starting modelwe used already-relaxed, fully hydrogenated spherical Si NCsfrom Ref. [3]. The SB impurities (−OH,−F,−Cl,−CH3) areinserted by replacing single hydrogen on the surface of theNC. In the remaining cases, two hydrogens, bonded at thesame Si atom, are replaced with DB impurities (=O, =S), ortwo neighboring hydrogens, bonded to neighboring Si atoms,are replaced with O to make −O−. Finally, all of the structuresare relaxed until the forces acting on every atom are lower than0.04 eV/A. Shown in Fig. 1 are the models of relaxed NCswith oxygen type impurity on the surface.
FIG. 1. (Color online) Ball-and-stick models of 1.5-nm Si NCs with (a) −OH, (b) −O-, and (c) =O. The Si, H, and O atoms are shown intan, white, and red color, respectively.
125402-2

SIZE DEPENDENCE OF THE STABILITY, ELECTRONIC . . . PHYSICAL REVIEW B 91, 125402 (2015)
III. FORMATION AND GIBBS FREE ENERGY
Despite the great number of experimental, as well astheoretical, studies of Si NCs, there are only few studiesconcerning the size dependence of the stability of Si NCswith surface impurities [55,60,61]. In order to investigatethe stability of the NCs with different surface impurities,depending on the size of the NCs, we calculated the formationenergy of the different NCs [Ef (SiNHMX)], per surface area,using the equation
Ef (SiNHMX) = 1
A
[Etot(SiNHMX) − NESi − M
2EH2 − EX
],
where Etot(SiNHMX) is the total energy of the NC with relaxedatomic positions and ESi and EX are the calculated energiesper atom for silicon and the impurity, respectively, and EH2
is the calculated energy of an H2 molecule. The surface area,
A (in A2), is calculated as the surface of a convex hull drawn
around a bare Si NC. For ESi we used the calculated energyper atom of bulk Si, −107.41 eV, and for EH2 we used thecalculated total energy for H2, −30.55 eV. For the energyof the O, Cl, F, S, CH3, and OH, we used the calculatedvalues −430.48, −406.06, −645.62, −277.93, −201.50, and−448.04 eV, respectively (see Ref. [62] for more details).
The calculated formation energies for each of the studiedNCs, with different types of surface impurities, are shownin Fig. 2. It is noticeable that the −O− and −F impuritieshave the biggest effect on the formation energy, significantlydecreasing it compared to the other impurities. This shows thatthe Si NCs with −O− and −F impurities are the most stableNCs, indicating that inserting this kind of impurity is favorablecompared to having only hydrogen passivated surface. Thiskind of behavior is seen in experiments, where it has beenshown that the surface of the Si NCs is easily oxidized andthe Si NCs are etched with HF. It is also evident that theformation energies of the 1.0-nm NCs with surface impuritiesshow the biggest difference, compared to the hydrogenated
−1
−0.5
0
0.5
1
1.5
2
2.5
1 1.5 2 2.5 3 3.5
Ef (
eV/Å
2 )
d (nm)
−H−CH3
−F−Cl
−OH−O−
=O=S
FIG. 2. (Color online) Formation energies per surface area of SiNCs with different types of surface impurities as functions of thesize of the NCs. The formation energies of the NCs with −CH3, −F,−Cl, −OH, −O−, =O, and =S impurities are shown in gray, purple,green, orange, blue, red, and yellow lines, respectively. The formationenergies of fully hydrogenated NCs (−H) are shown in black.
NC. The formation energies of the 1.0-nm NCs with −O−and −F impurity are even negative, indicating that the NCswith these impurities are spontaneously formed at T = 0 K.The difference in the formation energies decreases as the NCssize grows, eventually becoming rather small for the 2.5-nmNC. Considering that with increasing NC size the number ofSi atoms is growing, the influence of the impurity becomesless pronounced, and the formation energies of the NCs isexpected to approach common value. It is also evident that theformation energies of the NCs with SB and DB impurities aredistributed over a big energy interval.
Considering that oxygen influences the properties of SiNCs to the greatest extent, and fluorine can be left as a residueafter HF etching, it is of interest to investigate the influenceof the concentration of oxygen or fluorine, on the stabilityof the NCs with oxygen or fluorine impurity. Furthermore, itwould be instructive to determine at which H2 concentrationthe stability of hydrogenated Si NCs is higher than that ofthe NCs with oxygen or fluorine impurity. Therefore, wecalculated the difference between the Gibbs free energies, �G
of hydrogenated Si NCs, GH2 , and NCs with impurity, GX2
(X = O, F), using the following equation:
�G = GH2 − GX2 .
The GH2 and GX2 (X = O, F) are calculated using theequations
GH2 = Ef (SiNHM ) − ρH
2μH2 ,
GX2 = Ef (SiNHMX) − ρX
2μX2
where Ef (SiNHM ) and Ef (SiNHMX), (X = O, F) are theformation energies, as previously defined, and ρH = M
Aand
ρX = 1A
are the hydrogen and impurity density at the surfaceof the NC, respectively. The chemical potential of hydrogen,μH2 , and of the impurity, μX2 , at a temperature T and pressureP , is defined as
μ = H 0en(T ) − H 0
en(0) − T S0(T ) + kbT ln
(P
P 0
),
where S0 and Hen are the entropy and enthalpy at temperatureT = 300 K, taken from thermochemical tabular data [63],considering the studied species, H2, O2, and F2. P 0 is thereference pressure, set to 1 bar, according to the tabular data,and P and kb are the partial pressure and the Boltzmannconstant, respectively. Shown in Fig. 3 is the evolution of�G as a function of the impurity’s and hydrogen’s chemicalpotential, where μX2 = μH2 (X = O, F).
It is evident that GH2 becomes lower than the GX2 (X = O,F) at high values of the H2 partial pressure (see the μH2 valuesat which �G becomes negative in Fig. 3). This indicates thatto suppress the addition of oxygen or fluorine on the surfaceof the hydrogenated Si NCs, a very high H2 concentration isrequired. Moreover, comparing the �G of Si NCs with =Oand −O- [see Figs. 3(a) and 3(b)], it is noticeable that the �G
of the NCs with −O− impurity becomes negative for highervalues of μH2 , indicating that higher H2 pressure is requiredto avoid addition of −O− on the surface, compared to theaddition of =O. Also, to suppress the addition of −O− on
125402-3

V. KOCEVSKI, O. ERIKSSON, AND J. RUSZ PHYSICAL REVIEW B 91, 125402 (2015)
FIG. 3. (Color online) Difference between Gibbs free energies,�G, at T = 300 K, of hydrogenated Si NCs and Si NCs with (a) =O,(b) −O−, and (c) −F impurity. The �G is shown as a function of theμH2 and μX2 , where μX2 = μH2 . The crosses in (a) and (b) representthe μH2 value at which �G becomes negative, calculated at ambientO2 pressure, 0.0194 bar (μO2 = −0.59 eV). The �G of NCs with1.0, 1.5, 1.9, 2.5, 3.1, and 3.5 nm are respectively shown in black,blue, red, green, purple, and yellow.
the surface, a higher H2 pressure is needed, compared to theaddition of −F; see Figs. 3(b) and 3(c).
So far we discussed the case where μH2 = μX2 , and to seeif lowering the O2 concentration would considerably lowerthe H2 concentration, required to suppress the addition of Oon the surface, we consider the O2 to be at ambient partialpressure, ∼0.0194 bar (μO2 = −0.59 eV). Therefore, first wecalculated the GO2 for μO2 = −0.59 eV, and afterwards wecalculated the μH2 at which �G = GH2 − GO2 = 0 eV. Thesecalculated values of μH2 are shown as crosses in Figs. 3(a)and 3(b). It is evident that even when O2 is at ambient partialpressure, the H2 pressure needed to prevent the inclusion of
oxygen on the surface of Si NCs is very high for both types ofoxygen impurities.
IV. ELECTRONIC AND OPTICAL PROPERTIES
Although there have been studies showing the changesin the DOS of very small Si NCs with surface impurities,depending on the increasing size of the NCs [32,34], forNCs larger than 1.5 nm, these studies only focused on themodification of the DOS [34]. Here we present the DOS of SiNCs with various surface impurities, depending on the size ofthe NCs, from 1.0 to 3.5 nm; see Fig. 4 for more details.
In the case of SB impurities, −F, −Cl, −CH3, and −OH,the DOS are almost identical to the DOS of hydrogenated NC,regardless of the size. However, there is only one noticeabledifference of the DOS of the smallest NC, 1.0 nm, where twosmall peaks appear as shoulders at the top of the valence bandand the bottom of the conduction band. Unlike the bigger NCs,where these states are mainly localized in the center of the NCs,in the 1.0-nm NC, these states display a higher localizationaround the surface impurity. This was also previously seenfor small NCs [32]. These two peaks also appear in the DOSof the 1.0-nm NCs with −O−, but these are closer to eachother, compared to the peaks in the DOS of the NCs withSB impurities. Thus, they are almost detached from the Sistates at the top of the valence band and the bottom of theconduction band. On the other hand, the DOS of the NCs withDB impurities, =O and =S, show much bigger differencecompared to the DOS of the hydrogenated NCs. As the sizeof the NCs is growing, this difference in the DOS becomesless evident, eventually becoming insignificant for the NCs ofdiameter 3.1 nm or bigger.
Similarly to the DOS of 1.0-nm NCs with SB impurity,in the DOS of the 1.0-nm NCs with DB impurity there area few small peaks at the top of the valence band and thebottom of the conduction band. However, in the case of the NCswith DB impurity, these peaks are much closer to each other,narrowing the band gap even further. These two peaks can beconsistently seen in the DOS of the bigger NC, up to 3.1 nmdiameter, where they become absorbed by the conduction andvalence bands approaching each other due to reduced effectof the quantum confinement. This is an important observation,because it shows that the effect of a DB impurity on the DOSis becoming negligible for NCs bigger than 3.1 nm.
We further evaluate the influence of the surface impuritieson the optical properties of Si NCs with increasing NC size.For that purpose we calculated the absorption indices of theSi NCs with different types of surface impurities, as describedin Sec. II, and plotted them as a function of the size of theNCs; see Fig. 5. It is noticeable that the absorption indicesof the NCs with SB impurities are very similar to the onesof the hydrogenated NCs with the same size. The only minordifference occurs for the absorption indices of the 1.0-nm NCs,where the first few peaks appear to be more intense in the NCswith surface impurities. This difference can be best seen inFig. 5(h), where the positive difference between the absorptionindices (�k) of NCs with −F impurity and the absorptionindices of fully hydrogenated NCs (Ref. [3]) are shown.Similarly to the SB impurities, the −O− induces only slight
125402-4

SIZE DEPENDENCE OF THE STABILITY, ELECTRONIC . . . PHYSICAL REVIEW B 91, 125402 (2015)
(e) 3.1 nm (f) 3.5 nm
(b) 1.5 nm (c) 1.9 nm(a) 1.0 nm
(d) 2.5 nm
−4 −2 0 2 4 6
DO
S
E (eV)
=S
−OH
−Cl
−F
−CH3
−H
−4 −2 0 2 4 6
DO
SE (eV)
−4 −2 0 2 4 6
DO
S
E (eV)
−4 −2 0 2 4 6
DO
S
E (eV)
−4 −2 0 2 4 6
DO
S
E (eV)
−4 −2 0 2 4 6
DO
S
E (eV)
=S
−OH
−Cl
−F
−CH3
−H
=S
−OH
−Cl
−F
−CH3
−H
=S
−OH
−Cl
−F
−CH3
−H
=S
−OH
−Cl
−F
−CH3
−H
=S
−OH
−Cl
−F
−CH3
−H
=O
−O−
=O
−O−
=O
−O−
=O
−O−=O
−O−
=O
−O−
FIG. 4. (Color online) DOS of Si NCs with different surface impurities and size of (a) 1.0 nm, (b) 1.5 nm, (c) 1.9 nm, (d) 2.5 nm,(e) 3.1 nm, and (f) 3.5 nm. For a better view of the midgap states, the DOS are aligned so the most intense peak, at the top of the valence bandin each of the NCs, is at the same energy. The DOS of the NCs with −CH3, −F, −Cl, −OH, −O−, =O, and =S impurities are shown in gray,purple, green, orange, blue, red and yellow lines, respectively. The DOS of fully hydrogenated NCs (−H), taken from Ref. [3], are shown inblack lines.
change in the absorption index of the 1.0-nm NCs, comparedto the absorption index of the fully hydrogenated NC.
Contrary to the NCs with SB impurities, the absorptionindices of the NCs with DB impurities exhibit a much biggerchange with growing NC size. The most evident difference isin the absorption indices of the 1.0-nm NCs, with both =O and=S impurity, where several peaks emerge below the energy ofthe first peak in the absorption index of the hydrogenated NC.As the size of the NCs grows, the intensity of the peaks belowthe energy of the hydrogenated NC decreases, eventually beinginsignificant for the NCs bigger than 3.1 nm, which is mostnoticeable in Fig. 5(g). These changes in the absorption indicescan be attributed to the decreasing contribution from thesurface impurity to the states around the gap and are discussedin more detail later.
For use in many optical applications, from light-emitting tolight-absorbing ones, it is very important to know the HOMO-LUMO gap and the optical absorption gap. This becomes evenmore important when the gaps can be influenced by the surfaceimpurities and the size of the NCs. Therefore, we calculated theHOMO-LUMO gaps and the optical absorption gaps for the Si
NCs with different sizes and different surface impurities; seeTable I and Fig. 6. The optical absorption gaps are extractedfrom the absorption indices by considering the lowest energyat which the optical absorption is greater than 0.05. We shouldpoint out that the reported gaps are calculated employingground-state DFT; thus, the values should be considered withcare, especially because of the well-known underestimationof the gaps in LDA [64]. For a better comparison withexperiments, one should also go beyond the ground-stateDFT, considering many-body effects such as the electron-holeinteraction or more precise treatments of the electron-electroncorrelation. For example, in the case of hydrogenated Si NCsGW calculations [47–50], time-dependent DFT [47–49,51]or quantum Monte Carlo [32] can provide a more accurateestimate of the band gaps. However, it has been shown that forhydrogenated Si NCs the ground-state DFT-LDA gives a goodestimate of the gaps [3], comparable with experiments andother theoretical approaches. This similarity of the calculatedHOMO-LUMO gaps and the experimentally measured opticalgaps can be largely attributed to the cancellation of theexcitonic and quasiparticle effects [65–67]. In addition, the
125402-5

V. KOCEVSKI, O. ERIKSSON, AND J. RUSZ PHYSICAL REVIEW B 91, 125402 (2015)
(b) 1.5 nm NCs (c) 2.0 nm NCs
(f) 3.5 nm NCs(e) 3.1 nm NCs(d) 2.5 nm NCs
(g) =O (h) F
(a) 1.0 nm NCs
0
0.02
0.04
0.06
0.08
0.1
0.12
1 1.5 2 2.5 3 3.5 4
Δk
E (eV)
1.0 nm NC1.5 nm NC1.9 nm NC2.5 nm NC3.1 nm NC3.5 nm NC
0
0.02
0.04
0.06
0.08
0.1
0.12
1 1.5 2 2.5 3 3.5 4
Δk
E (eV)
1.0 nm NC1.5 nm NC2.0 nm NC2.5 nm NC3.0 nm NC3.5 nm NC
k
0
0.5
1
1.5
2
2.5
3
0 1 2 3 4 5 6 7 8
E (eV)
−H
−CH3
−F
−Cl
−OH
−O−
=O
=S
k
0
0.5
1
1.5
2
2.5
3
3.5
0 1 2 3 4 5 6 7 8
E (eV)
−H
−CH3
−F
−Cl
−OH
−O−
=O
=S
0
0.5
1
1.5
2
2.5
3
3.5
4
0 1 2 3 4 5 6 7 8
E (eV)
−H
−CH3
−F
−Cl
−OH
−O−
=O
=Sk k
0
0.5
1
1.5
2
2.5
3
3.5
4
0 1 2 3 4 5 6 7 8
E (eV)
−H
−CH3
−F
−Cl−OH
−O−
=O
=S k
0
0.5
1
1.5
2
2.5
3
3.5
4
0 1 2 3 4 5 6 7 8
E (eV)
−H
−CH3
−F
−Cl
−OH
−O−
=O
=S
k
0
0.5
1
1.5
2
2.5
3
3.5
0 1 2 3 4 5 6 7 8
E (eV)
−H
−CH3
−F
−Cl
−OH
−O−
=O
=S
FIG. 5. (Color online) Absorption indices of Si NCs with different surface impurities and sizes of (a) 1.0 nm, (b) 1.5 nm, (c) 1.9 nm, (d)2.5 nm, (e) 3.1 nm, and (f) 3.5 nm. The absorption indices of the NCs with −CH3, −F, −Cl, −OH, −O−, =O, and =S impurities are shownin gray, purple, green, orange, blue, red, and yellow lines, respectively. The absorption indices of fully hydrogenated NCs (−H), taken fromRef. [3], are shown in black lines. Positive values of the difference between the absorption indices (�k) of NCs with (g) =O impurity and (h)−F impurity, compared to the absorption indices of the fully hydrogenated NCs (Ref. [3]), as a function of the NC size. �k of NCs with 1.0,1.5, 1.9, 2.5, 3.1, and 3.5 nm are respectively shown in black, blue, red, green, purple, and yellow.
125402-6
SIZE DEPENDENCE OF THE STABILITY, ELECTRONIC . . . PHYSICAL REVIEW B 91, 125402 (2015)
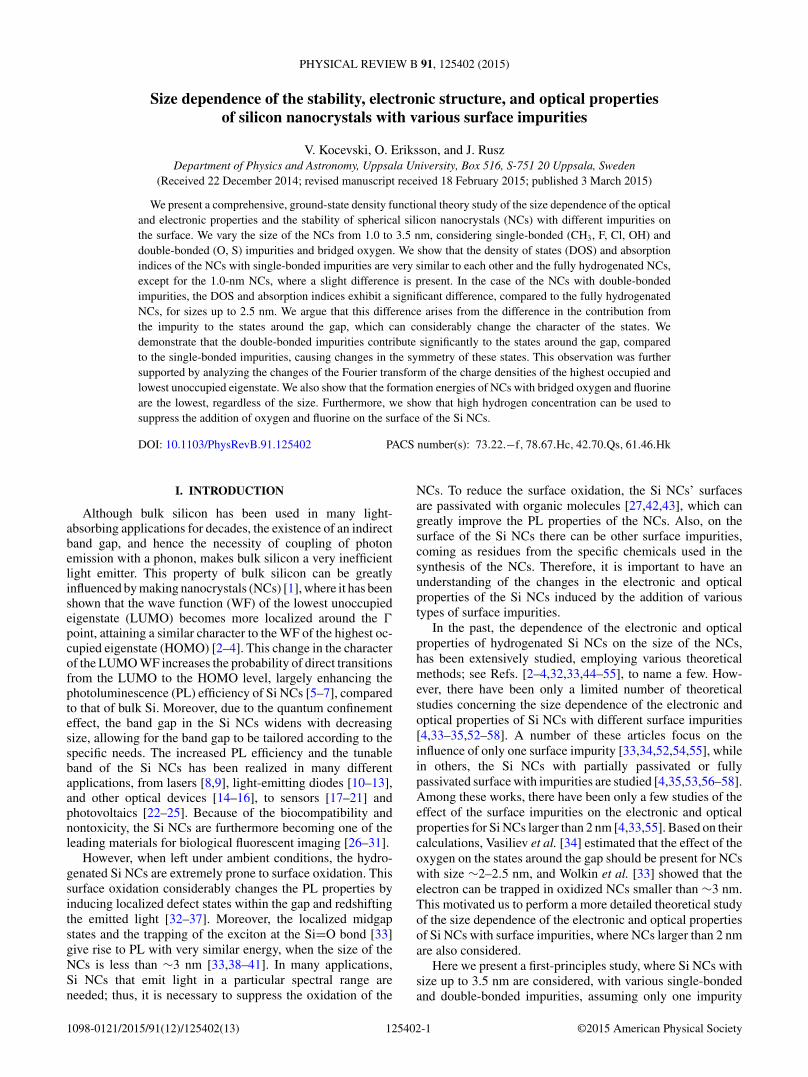
TABLE I. Calculated HOMO-LUMO gaps (Fund.) and optical absorption gaps (Opt.) of Si NCs with different diameter (d) and varioussurface impurities. The gaps are compared to the HOMO-LUMO and optical absorption gaps of fully hydrogenated NC (−H), taken from Ref.[3].
Type of atomic impurity
−H −CH3 −Cl −F −OH −O− =O =S
Particlea d (nm) Fund. Opt. Fund. Opt. Fund. Opt. Fund. Opt. Fund. Opt. Fund. Opt. Fund. Opt. Fund. Opt.
Si29H 36 1.0 3.75 3.70 3.74 3.71 3.63 3.66 3.61 3.62 3.53 3.62 3.33 3.48 2.51 2.82 1.79 2.41Si87H 76 1.5 2.73 3.14 2.72 3.14 2.71 3.10 2.72 3.11 2.72 3.08 2.62 2.98 2.13 2.56 1.62 2.23Si175H 116 1.9 2.24 2.84 2.25 2.87 2.24 2.83 2.24 2.85 2.23 2.84 2.18 2.77 1.97 2.81 1.57 2.45Si389H 196 2.5 1.80 2.70 1.80 2.70 1.80 2.70 1.80 2.70 1.80 2.70 1.76 2.66 1.79 2.65 1.56 2.29Si705H 300 3.0 1.51 2.59 1.51 2.60 1.51 2.59 1.51 2.59 1.51 2.59 1.51 2.60 1.50 2.56 1.42 2.53Si1087H 412 3.5 1.35 2.56 1.35 2.57 1.35 2.57 1.35 2.57 1.35 2.57 1.35 2.57 1.34 2.55 1.29 2.54
aThe number of hydrogen atoms refers to fully hydrogenated Si NCs. Note that in the NC models every Si atom with only one Si neighbor wasreplaced by hydrogen; for more details, see Ref. [3].
calculated HOMO-LUMO gaps are in good agreement withother theoretical calculations for Si NCs with different surfaceimpurities; see Fig. 7.
The most noticeable feature in Fig. 6 is the different effectthat the −O−, SB, and DB impurities have on both theHOMO-LUMO gap and the optical absorption gap. Both gapsin the NCs with SB impurities closely follow the gaps inthe hydrogenated NCs, getting lower as the NCs size grows.Furthermore, with increasing NC size, the difference betweenthe HOMO-LUMO gap and the optical absorption gap getslarger, regardless of the SB impurity. The only small difference,between the hydrogenated NC and the NCs with surfaceimpurities, appears for the 1.0-nm NCs, where both gaps of theNCs with surface impurities are slightly lower than the gapsin the hydrogenated NC. The −O− has greater influence onboth gaps, compared to the SB impurities, lowering the gapseven for the bigger NCs, showing a slight difference with thefully hydrogenated NCs up to 2.5 nm in size.
1
1.5
2
2.5
3
3.5
4
1 1.5 2 2.5 3 3.5
Ega
p (e
V)
d (nm)
−H−CH3
−F−Cl
−OH−O−
=O=S
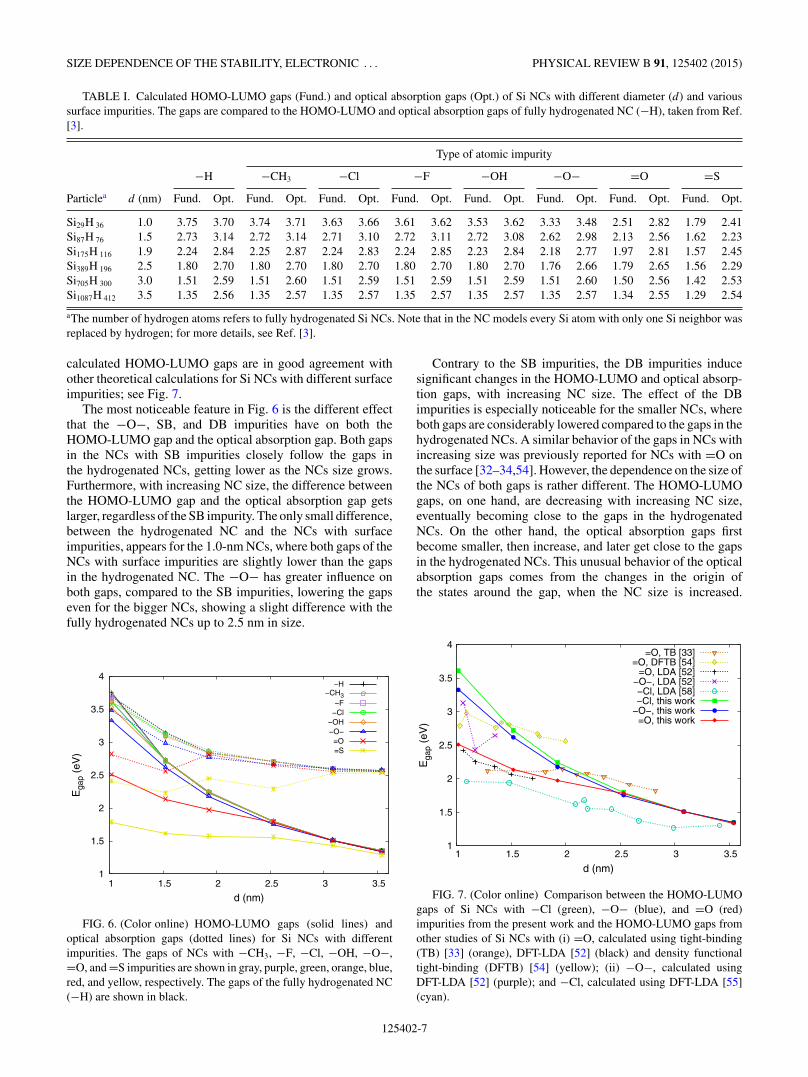
FIG. 6. (Color online) HOMO-LUMO gaps (solid lines) andoptical absorption gaps (dotted lines) for Si NCs with differentimpurities. The gaps of NCs with −CH3, −F, −Cl, −OH, −O−,=O, and =S impurities are shown in gray, purple, green, orange, blue,red, and yellow, respectively. The gaps of the fully hydrogenated NC(−H) are shown in black.
Contrary to the SB impurities, the DB impurities inducesignificant changes in the HOMO-LUMO and optical absorp-tion gaps, with increasing NC size. The effect of the DBimpurities is especially noticeable for the smaller NCs, whereboth gaps are considerably lowered compared to the gaps in thehydrogenated NCs. A similar behavior of the gaps in NCs withincreasing size was previously reported for NCs with =O onthe surface [32–34,54]. However, the dependence on the size ofthe NCs of both gaps is rather different. The HOMO-LUMOgaps, on one hand, are decreasing with increasing NC size,eventually becoming close to the gaps in the hydrogenatedNCs. On the other hand, the optical absorption gaps firstbecome smaller, then increase, and later get close to the gapsin the hydrogenated NCs. This unusual behavior of the opticalabsorption gaps comes from the changes in the origin ofthe states around the gap, when the NC size is increased.
1
1.5
2
2.5
3
3.5
4
1 1.5 2 2.5 3 3.5
Ega
p (e
V)
d (nm)
=O, TB [33]=O, DFTB [54]
=O, LDA [52]−O−, LDA [52]−Cl, LDA [58]−Cl, this work
−O−, this work=O, this work
FIG. 7. (Color online) Comparison between the HOMO-LUMOgaps of Si NCs with −Cl (green), −O− (blue), and =O (red)impurities from the present work and the HOMO-LUMO gaps fromother studies of Si NCs with (i) =O, calculated using tight-binding(TB) [33] (orange), DFT-LDA [52] (black) and density functionaltight-binding (DFTB) [54] (yellow); (ii) −O−, calculated usingDFT-LDA [52] (purple); and −Cl, calculated using DFT-LDA [55](cyan).
125402-7
V. KOCEVSKI, O. ERIKSSON, AND J. RUSZ PHYSICAL REVIEW B 91, 125402 (2015)
The latter issue is discussed in more detail below, where thecharacteristics of the states around the gap are presented.
Moreover, we point out that for SB impurities and −O− theHOMO-LUMO and optical absorption gaps are approachingeach other as the NCs size decreases. This follows the trendof transition from indirect band gap in bulk and large NCsto a direct band gap from small NCs [2–4]. In contrast, itis noticeable that the DB impurity induced a fairly largedifference between the HOMO-LUMO gap and the opticalabsorption gap. Similar to the SB impurities, this difference in
the gaps also grows as the size of the NCs with DB impuritiesincreases, though it is less obvious compared to the otherconsidered NCs. The effect of the =O impurity on both gapsis already reduced for the 2.0-nm NC, and both gaps are veryclose to the gaps of the hydrogenated 2.5-nm NC. Similarbehavior of both gaps can be seen for the 3.1-nm NC with =Simpurity, although the HOMO-LUMO gap is slightly lowerthan the gap in the hydrogenated 3.1-nm NC.
From the presented findings, concerning the effects of the−O−, SB, and DB impurities on the HOMO-LUMO and
-2 -1 0 1 2 3 4
DO
S
SiO
SiO
SiO
SiO
SiO
SiOx2
x4
x10
x20
x30
1.0 nm N
Cs
1.5 nm N
Cs
1.9 nm N
Cs
2.5 nm N
Cs
3.1 nm N
Cs
3.5 nm N
Cs
-2 -1 0 1 2 3 4
SiF
SiF
SiF
SiF
SiF
SiF
x20
x40
x100
x100
x100
0
0.5
1
1.5
2
1 1.5 2 2.5 3 3.5
HO
MO
per
eV
per
orb
ital (
⋅10−
3 )
d (nm)
−CH3−F
−Cl−OH−O−
=O=S
0
0.1
0.2
0.3
0.4
0.5
0.6
1 1.5 2 2.5 3 3.5
LUM
O p
er e
V p
er o
rbita
l (⋅1
0−3 )
d (nm)
−CH3−F
−Cl−OH−O−
=O=S
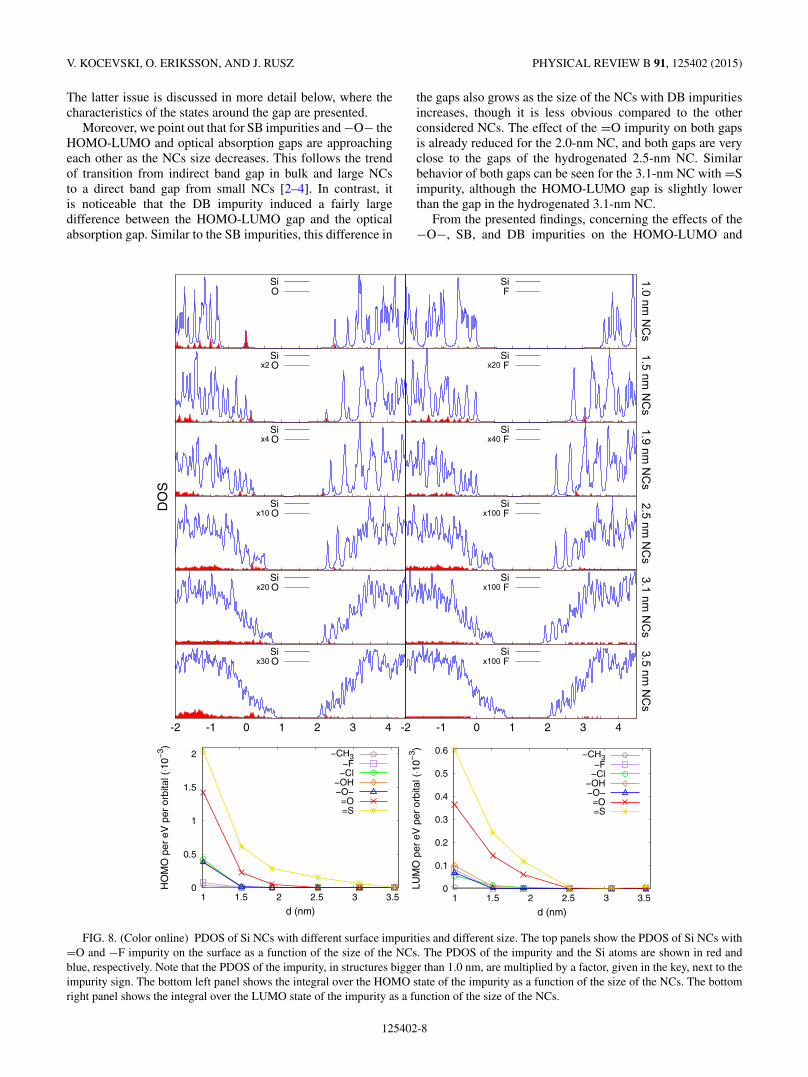
FIG. 8. (Color online) PDOS of Si NCs with different surface impurities and different size. The top panels show the PDOS of Si NCs with=O and −F impurity on the surface as a function of the size of the NCs. The PDOS of the impurity and the Si atoms are shown in red andblue, respectively. Note that the PDOS of the impurity, in structures bigger than 1.0 nm, are multiplied by a factor, given in the key, next to theimpurity sign. The bottom left panel shows the integral over the HOMO state of the impurity as a function of the size of the NCs. The bottomright panel shows the integral over the LUMO state of the impurity as a function of the size of the NCs.
125402-8
SIZE DEPENDENCE OF THE STABILITY, ELECTRONIC . . . PHYSICAL REVIEW B 91, 125402 (2015)
optical absorption gaps in the NCs with various sizes, thereare a few points that need to be kept in mind. The effect ofthe impurity on both the HOMO-LUMO gap and the opticalabsorption gap, of the 1.0-nm NC is the biggest, regardless ofthe type of impurity. Already at the 1.5-nm NC, the changeinduced by the SB impurity becomes negligible. However, theDB impurity and −O− affects both gaps of the bigger NCs,with the difference becoming insignificant only for the 3.1-nmNC or larger. This shows that the NCs bigger than 3.1 nm areexpected to perform similarly, despite the distinct impuritieson the surface. This difference will increase as the size of theNCs decreases, being especially noticeable between the SBand DB impurities. Finally, not only the gaps, but also theDOS and absorption indices of the 1.0-nm NCs are the mostsusceptible to the changes of the surface impurities, followingnearly the same trend as the HOMO-LUMO gaps.
V. HIGHEST OCCUPIED AND LOWESTUNOCCUPIED EIGENSTATES
To gain a better insight into how the surface impurityaffects the HOMO-LUMO gap and the optical absorption gap,we investigated the contribution from the states of the impurityto the total DOS. Shown in Fig. 8 are the projected density ofstates (PDOS) of the impurity, compared to the PDOS of the Siatoms, for the NCs with =O and −F impurity. We have chosenthese types of impurities because they are good representativesfor the DB and SB impurities, respectively, as shown in theDOS and absorption indices. Moreover, oxygen is the mostcommon surface impurity found on Si NCs, as discussed inthe Introduction, and fluorine can be left as a residue whenforming porous Si by HF etching of bulk Si. It is evidentthat the impurity states’ contribution to the states around thegap decreases as the size of the NCs grows, regardless of thetype of impurity. Furthermore, the contribution of the =Oto the states around the gap in the NCs with same size issignificantly larger compared to the contribution from the −F(note that the multiplication factor for the F states is an orderof magnitude bigger than the one for O states).
To give a better overview for the changes in the contributionfrom the impurities, we calculated the integral over the HOMOand LUMO states for each of the studied structures; seethe bottom two panels in Fig. 8. It is noticeable that thecontribution to both the HOMO state and the LUMO statefrom the impurity decreases with increasing NC size in eachof the studied impurities. The −O− and the SB impuritiescontribute to both states much less than the DB impurities,and their contribution becomes negligible for NCs biggerthan 1.5 nm. The DB impurities, on the other hand, have arather high contribution for NCs with size up to 2.5 nm, withthe contribution from the =S impurity to the HOMO stateextending to the bigger NC. It is also interesting to noticethe fairly minor contribution from the =O to both HOMOand LUMO states for structures bigger than 2.5 nm. This isin agreement with Vasiliev et al. [34], who predicted thatthe contribution from the O states to the HOMO and LUMOstates should disappear for structures bigger than 2–2.5 nm.
To illustrate in more detail how the states around thegap are changing with increasing NC size, and to makea comparison with the the hydrogenated Si NCs [3], we
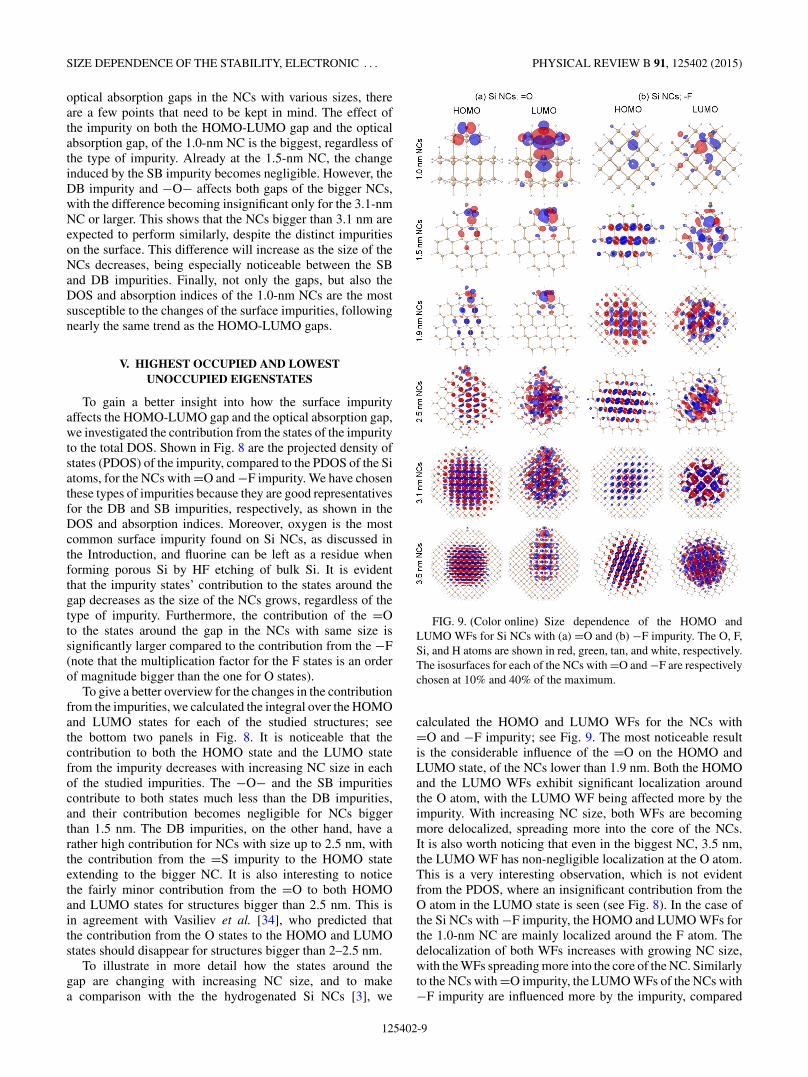
FIG. 9. (Color online) Size dependence of the HOMO andLUMO WFs for Si NCs with (a) =O and (b) −F impurity. The O, F,Si, and H atoms are shown in red, green, tan, and white, respectively.The isosurfaces for each of the NCs with =O and −F are respectivelychosen at 10% and 40% of the maximum.
calculated the HOMO and LUMO WFs for the NCs with=O and −F impurity; see Fig. 9. The most noticeable resultis the considerable influence of the =O on the HOMO andLUMO state, of the NCs lower than 1.9 nm. Both the HOMOand the LUMO WFs exhibit significant localization aroundthe O atom, with the LUMO WF being affected more by theimpurity. With increasing NC size, both WFs are becomingmore delocalized, spreading more into the core of the NCs.It is also worth noticing that even in the biggest NC, 3.5 nm,the LUMO WF has non-negligible localization at the O atom.This is a very interesting observation, which is not evidentfrom the PDOS, where an insignificant contribution from theO atom in the LUMO state is seen (see Fig. 8). In the case ofthe Si NCs with −F impurity, the HOMO and LUMO WFs forthe 1.0-nm NC are mainly localized around the F atom. Thedelocalization of both WFs increases with growing NC size,with the WFs spreading more into the core of the NC. Similarlyto the NCs with =O impurity, the LUMO WFs of the NCs with−F impurity are influenced more by the impurity, compared
125402-9

V. KOCEVSKI, O. ERIKSSON, AND J. RUSZ PHYSICAL REVIEW B 91, 125402 (2015)
FIG. 10. (Color online) Fourier transform of the HOMO and LUMO charge density of Si NCs with (a) =O and (b) −F impurity, as afunction of the size of the NCs. The Fourier transform of the HOMO charge densities are shown in the left column of each panel, and theLUMO charge density in the right column of each panel. The Fourier transform is an average of the projections on x-y, x-z, and y-z planes.The red color maps the highest values and the blue color the lowest value of the charge densities within a fixed range for all sizes (in arbitraryunits). The k is scaled by the reciprocal vector G of size 2π
a.
125402-10
SIZE DEPENDENCE OF THE STABILITY, ELECTRONIC . . . PHYSICAL REVIEW B 91, 125402 (2015)
to the HOMO WFs, though the delocalization and shift ofHOMO and LUMO from surface impurity to the core beginat smaller size for −F impurity and appear to be complete forNCs larger than 3 nm.
Although in the real space, the localization of the WFs isclearly visualized, the Fourier transform (FT) of the chargedensities gives a complementary angle of view and additionalinsight into the changes in both the localization and the sym-metry of the HOMO and LUMO states. Ultimately, changes inboth of these features will affect the properties of the Si NCswith changes in the surface impurities and the NC size. There-fore, we calculated the FT of the HOMO and LUMO chargedensities for the NCs with =O and −F impurity. Because theorientation of the various impurities on the surface of the NCsdiffers from each other, choosing a particular plane on whichthe 3D FT is being projected can be biased. Hence, we calcu-lated an average of the projection of the 3D FT on the x-y, x-z,and y-z planes, and the resulting averages are shown on Fig. 10.
Similarly to the WFs in real space, in the FT of the chargedensities there is also noticeable influence of the =O on theHOMO and LUMO states. The FT of both HOMO and LUMOstates is rather delocalized, suggesting that there is a significantlocalization of the charge density and indicating no apparentperiodicity within the NC, as seen from the WFs in real space(see Fig. 9). However, the FT of the HOMO charge density ofthe 1.9-nm NCs has some distinct spots, indicating that the WFis spread across the core of the NC and is very different fromthe FT of the LUMO charge density, which shows a ratherhigh delocalization in k space. Similarly, using a tight-bindingmethod, Wolkin et al. [33] have shown that, depending onthe NCs size, the hole and electron states in Si NCs with one=O impurity on the surface become closer to the respectivestates in hydrogenated NCs. They show that the hole statesare closing up already in ∼1.5 nm NCs and, on the otherhand, the electron states are becoming close for larger NCs,∼2.9 nm.
As the size of the NCs is growing beyond 1.9 nm, theinfluence of the =O becomes negligible, and the FT of thecharge densities reveals higher periodicity of the states inthe NCs, shown by higher number of spots in the FT. Thisincreased periodicity suggests that the WFs are delocalized inthe core of the NCs, which is also observed for the WFs inreal space (see Fig. 9). Moreover, the FT of the HOMO andLUMO charge densities for the NCs with =O is very similarto the FT of the NCs with −F for the NCs bigger than 1.9 nm.For the smaller NCs with −F, the FT of the charge densitiesshows some periodicity, except for the 1.0-nm NC, where thedelocalization of the FT is the highest, seen as an increasedlocalization in the real space (see Fig. 9). Increased numberof spots in the FT of the HOMO and LUMO charge densitieswith growing NC size is also observed for hydrogenated SiNCs [3].
The increased contribution from the impurities to the statesaround the gap will influence the symmetry of the states, asseen from the top three rows in Fig. 10, causing the transitionsfrom the unoccupied to the occupied states to be more proba-ble. This, in turn, will increase the optical response, giving riseto additional peaks in the gap region of the absorption indices.These peaks are almost nonexistent in the larger NCs (seeFig. 5), where the contribution from the impurity to the states
around the gap is significantly low. However, as the size of theNCs is reduced, this contribution increases, manifesting itselfwith an increased number of small peaks in the absorptionindices. This is particularly noticeable for the smaller NCswith DB impurities, where the peaks become more intense asthe size of the NCs deceases [see Fig. 5(g)].
VI. CONCLUSIONS
We have presented a detailed first-principles, ground-stateDFT study of the evolution of the electronic and opticalproperties of Si NCs, with surface impurities, as a functionof NC size. We show that the DOS and absorption indicesof NCs with SB impurities (−CH3, −F, −Cl, −OH) andbridged oxygen (−O−) are very similar to the properties ofthe hydrogenated NCs, except for the 1.0-nm NCs showingslightly different properties. Unlike the NCs with SB impuri-ties, the NCs with DB impurities (=O, =S) show significantdifferences in the DOS and absorption indices, compared tothe respective properties of hydrogenated NCs. This differenceis especially noticeable for the smaller NCs, with size less than2.5 nm, where the states in the gap region appear. Furthermore,we show that the HOMO-LUMO and optical absorption gapsof the NCs with SB impurities follow the same trend as the gapsin the hydrogenated NCs. However, both gaps, in the NCs withDB impurities and bridged oxygen, are very different from thegaps in the hydrogenated NCs, showing significant differencefor NCs smaller than 2.5 nm.
We argue that this difference in both gaps arises from thedifferent contribution from the states of the impurity atomto the states around the gap. This is especially noticeablefor the smaller NCs, where the contribution of the statesof the impurity is the highest. Moreover, we show that thestates of the impurity are shifted towards the body of theNCs, as the size of the NCs are growing. We further supportthis finding by demonstrating that the real part and the FTof the HOMO and LUMO charge densities, for the smallerNCs, indicate a significant localization of the charge densitiesaround the impurity. We argue that this observation, togetherwith the insignificant contribution from the states of the DBimpurity, are the main factors for the very small differencein HOMO-LUMO and optical absorption gaps of the NCsbigger than 2.5 nm. Finally, we show that the stability ofthe smallest NCs depends substantially on the impurity andbecomes rather similar with increasing NC size. In addition,we demonstrate that high hydrogen concentration is neededto give the hydrogenated Si NCs higher stability than thatof Si NC with oxygen or fluorine impurity. A high H2
concentration is required even at very low concentrations ofoxygen.
ACKNOWLEDGMENTS
This work was supported by the EU’s 7th Frame-work Programme SNAPSUN. J.R. and O.E. acknowledgethe support of Swedish Research Council. O.E. also ac-knowledges support from the Knut and Alice Wallenbergsfoundation and the European Research Council (ProjectNo. 247062-ASD), as well as eSSENCE and STANDUPP.
125402-11

V. KOCEVSKI, O. ERIKSSON, AND J. RUSZ PHYSICAL REVIEW B 91, 125402 (2015)
[1] L. T. Canham, Appl. Phys. Lett. 57, 1046 (1990).[2] F. Trani, G. Cantele, D. Ninno, and G. Iadonisi, Phys. Rev. B
72, 075423 (2005).[3] V. Kocevski, O. Eriksson, and J. Rusz, Phys. Rev. B 87, 245401
(2013).[4] P. Hapala, K. Kusova, I. Pelant, and P. Jelınek, Phys. Rev. B 87,
195420 (2013).[5] L. Pavesi, L. Dal Negro, C. Mazzoleni, G. Franzo, and F. Priolo,
Nature (London) 408, 440 (2000).[6] R. Anthony and U. Kortshagen, Phys. Rev. B 80, 115407
(2009).[7] D. Timmerman, J. Valenta, K. Dohnalova, W. D. A. M. de Boer,
T. Gregorkiewicz, Nat. Nanotechnol. 6, 710 (2011).[8] J. R. Rodrguez, J. G. C. Veinot, P. Bianucci, and A. Meldrum,
Appl. Phys. Lett. 92, 131119 (2008).[9] M. Ghulinyan, D. Navarro-Urrios, A. Pitanti, A. Lui, G. Pucker,
and L. Pavesi, Opt. Express 16, 13218 (2008).[10] K. D. Hirschman, L. Tsybeskov, S. P. Duttagupta, and P. M.
Fauchet, Nature (London) 384, 338 (1996).[11] R. J. Walters, G. I. Bourianoff, and H. A. Atwater, Nat. Mater.
4, 143 (2005).[12] K.-Y. Cheng, R. Anthony, U. R. Kortshagen, and R. J. Holmes,
Nano Lett. 11, 1952 (2011).[13] F. Maier-Flaig, J. Rinck, M. Stephan, T. Bocksrocker, M. Bruns,
C. Kubel, A. K. Powell, G. A. Ozin, and U. Lemmer, Nano Lett.13, 475 (2013).
[14] E. H. Sargent, Adv. Mater. 17, 515 (2005).[15] N. Daldosso and L. Pavesi, Laser Photon. Rev. 3, 508 (2009).[16] K.-Y. Cheng, R. Anthony, U. R. Kortshagen, and R. J. Holmes,
Nano Lett. 10, 1154 (2010).[17] S. Chan, Y. Lib, L. J. Rothbergb, B. L. Millerb, P. M. Faucheta,
Mater. Sci. Eng., C 15, 277 (2001).[18] E. A. Konstantinova, L. A. Osminkina, K. S. Sharov, E. V.
Kurepina, P. K. Kashkarov, V. Yu. Timoshenko, J. Exp. Theor.Phys. 99, 741 (2004).
[19] L. Rebohle, T. Gebel, R. A. Yankov, T. Trautmann, W. Skorupa,J. Sun, G. Gauglitz, and R. Frank, Opt. Mater. 27, 1055(2005).
[20] C. M. Gonzalez, M. Iqbal, M. Dasog, D. G. Piercey, R.Lockwood, T. M. Klapotke, and J. G. C. Veinot, Nanoscale6, 2608 (2014).
[21] Y. Feng, Y. Liu, C. Su, X. Ji, and Z. He, Sens. Actuators, B 203,795 (2014).
[22] V. Svrcek, A. Slaoui, and J.-C. Muller, Thin Solid Films 451-452, 384 (2004).
[23] G. Conibeer, M. Green, R. Corkish, Y. Cho, E.-C. Cho, C.-W.Jiang, T. Fangsuwannarak, E. Pink, Y. Huang, T. Puzzer, T.Trupke, B. Richards, A. Shalav, and K.-L. Lin, Thin Solid Films511, 654 (2006).
[24] D. Song, E.-C. Cho, G. Conibeer, C. Flynn, Y. Huang, andM. A. Green, Sol. Energy Mater. Sol. Cells 92, 474 (2008).
[25] M. Govoni, I. Marri, and S. Ossicini, Nat. Photonics 6, 672(2012).
[26] Z. F. Li and E. Ruckenstein, Nano Lett. 4, 1463 (2004).[27] J. H. Warner, A. Hoshino, K. Yamamoto, and R. D. Tilley,
Angew. Chem. Int. Ed. 44, 4550 (2005).[28] F. Erogbogbo, K.-T. Yong, I. Roy, G. Xu, P. N. Prasad, and
M. T. Swihart, ACS Nano 2, 873 (2008).[29] J. Park, L. Gu, G. von Maltzahn, E. Ruoslahti, S. N. Bhatia, and
M. J. Sailor, Nat. Mater. 8, 331 (2009).
[30] E. Borsellaa, R. DAmatoa, M. Falconieria, E. Travea, A.Panaritia, and I. Rivolta, J. Mater. Res. 28, 193 (2013).
[31] Y. Zhong, F. Peng, F. Bao, S. Wang, X. Ji, L. Yang, Y. Su, S.-T.Lee, and Y. He, J. Am. Chem. Soc. 135, 8350 (2013).
[32] A. Puzder, A. J. Williamson, J. C. Grossman, and G. Galli, Phys.Rev. Lett. 88, 097401 (2002).
[33] M. V. Wolkin, J. Jorne, P. M. Fauchet, G. Allan, and C. Delerue,Phys. Rev. Lett. 82, 197 (1999).
[34] I. Vasiliev, J. R. Chelikowsky, and R. M. Martin, Phys. Rev. B65, 121302(R) (2002).
[35] L. E. Ramos, J. Furthmuller, and F. Bechstedt, Phys. Rev. B 70,033311 (2004).
[36] M. Luppi and S. Ossicini, Mater. Sci. Eng. B 101, 34 (2003).[37] L. E. Ramos, J. Furthmuller, and F. Bechstedt, Appl. Phys. Lett.
87, 143113 (2005).[38] M. S. Brandt, H. D. Fuchs, M. Stutzmann, J. Weber, and M.
Cardona, Solid State Commun. 81, 307 (1992).[39] S. Schuppler, S. L. Friedman, M. A. Marcus, D. L. Adler, Y.-H.
Xie, F. M. Ross, T. D. Harris, W. L. Brown, Y. J. Chabal, L. E.Brus, and P. H. Citrin, Phys. Rev. Lett. 72, 2648 (1994).
[40] J. von Behrena, T. van Buurenb, M. Zachariasc, E. H. Chimow-itzd, and P. M. Fauchete, Solid State Commun. 105, 317 (1998).
[41] T. van Buuren, L. N. Dinh, L. L. Chase, W. J. Siekhaus, andL. J. Terminello, Phys. Rev. Lett. 80, 3803 (1998).
[42] D. S. English, L. E. Peli, Z. Yu, P. F. Barbara, and B. A. Korgel,Nano Lett. 2, 681 (2002).
[43] J. H. Warner, H. Rubinsztein-Dunlop, and R. D. Tilley, J. Phys.Chem. Lett. 109, 19064 (2005).
[44] C. Delerue, G. Allan, and M. Lannoo, Phys. Rev. B 48, 11024(1993).
[45] L.-W. Wang and A. Zunger, Phys. Rev. Lett. 73, 1039 (1994).[46] S. Ogut, J. R. Chelikowsky, and S. G. Louie, Phys. Rev. Lett.
79, 1770 (1997).[47] M. Rohlfing and S. G. Louie, Phys. Rev. Lett. 80, 3320 (1998).[48] L. X. Benedict, A. Puzder, A. J. Williamson, J. C. Grossman, G.
Galli, J. E. Klepeis, J.-Y. Raty, and O. Pankratov, Phys. Rev. B68, 085310 (2003).
[49] L. E. Ramos, J. Paier, G. Kresse, and F. Bechstedt, Phys. Rev. B78, 195423 (2008).
[50] D. Neuhauser, Y. Gao, C. Arntsen, C. Karshenas, E. Rabani, andR. Baer, Phys. Rev. Lett. 113, 076402 (2014).
[51] I. Vasiliev, S. Ogut, and J. R. Chelikowsky, Phys. Rev. Lett. 86,1813 (2001).
[52] A. Puzder, A. J. Williamson, J. C. Grossman, and G. Galli, J.Chem. Phys. 117, 6721 (2002).
[53] C. S. Garoufalis and A. D. Zdetsis, Phys. Chem. Chem. Phys. 8,808 (2006).
[54] Q. S. Li, R. Q. Zhang, and S. T. Lee, Appl. Phys. Lett. 91,043106 (2007).
[55] A. Carvalho, S. Oberg, M. J. Rayson, P. R. Briddon, Phys. Rev.B 86, 045308 (2012).
[56] E. Ramos, B. M. Monroy, J. C. Alonso, L. E. Sansores, R.Salcedo, and A. Martınez, J. Phys. Chem. C 116, 3988 (2012).
[57] M. Luppi and S. Ossicini, J. Appl. Phys. 94, 2130 (2003).[58] F. A. Reboredo and G. Galli, J. Phys. Chem. B 109, 1072
(2005).[59] P. Ordejon, E. Artacho, and J. M. Soler, Phys. Rev. B 53,
R10441 (1996); J. M. Soler, E. Artacho, J. D. Gale, A. Garcıa, J.Junquera, P. Ordejon, and D. Sanchez-Portal, J. Phys. Condens.Matter 14, 2745 (2002).
125402-12
SIZE DEPENDENCE OF THE STABILITY, ELECTRONIC . . . PHYSICAL REVIEW B 91, 125402 (2015)
[60] E. Degoli, S. Ossicini, G. Cantele, E. Luppi, R. Magri, D. Ninno,O. Bisi1, Phys. Status Solidi C 2, 3354 (2005).
[61] X. Chen, X. Pi, and D. Yang, J. Phys. Chem. C 114, 8774(2010).
[62] The energies of O, Cl, and F correspond to the calculated energyper atom for O2, Cl2, and F2 molecules, respectively. The energyof S is taken from the calculated energy per atom of bulk S.The energy of CH3 is calculated as a difference between thecalculated energy of CH4 molecule and the energy per atom ofH2. The energy of OH is calculated as a difference between theenergy of an H2O molecule and the energy per atom of H2.
[63] M. W. Chase, Jr., NIST-JANAF Thermochemical Tables, 4thEdition, Monograph No. 9, Journal of Physical and ChemicalReference Data, (1998), p. 1051, 1261, 1717.
[64] A. Zunger and A. J. Freeman, Phys. Rev. B 17, 4850 (1978); A.E. Carlsson, ibid. 31, 5178 (1985).
[65] H.-Ch. Weissker, J. Furthmuller, and F. Bechstedt, Phys. Rev. B65, 155328 (2002).
[66] C. Delerue, M. Lannoo, and G. Allan, Phys. Rev. Lett. 84, 2457(2000).
[67] A. J. Williamson, J. C. Grossman, R. Q. Hood, A. Puzder, andG. Galli, Phys. Rev. Lett. 89, 196803 (2002).
125402-13
Copyright © 2022 FDOKUMEN