singularity value management for optimized concrete design
41
Hanna Syrjälä SINGULARITY VALUE MANAGEMENT FOR OPTIMIZED CONCRETE DESIGN Technology and Communication 2019
-
Upload
khangminh22 -
Category
Documents
-
view
0 -
download
0
Transcript of singularity value management for optimized concrete design

Hanna Syrjälä
SINGULARITY VALUE
MANAGEMENT FOR OPTIMIZED
CONCRETE DESIGN
Technology and Communication
2019

VAASAN AMMATTIKORKEAKOULU
Rakennustekniikka
TIIVISTELMÄ
Tekijä Hanna Syrjälä
Opinnäytetyön nimi Singulariteettiarvojen hallinta optimoidulle betonisuunnitte-
lulle
Vuosi 2019
Kieli englanti
Sivumäärä 40 + 1 liitettä
Ohjaaja Marja Naaranoja
Opinnäytetyö tehtiin insinööritoimiston toimeksiannosta. Työn tilaajalla oli tie-
dostanut tarpeen saada suunnittelijoilleen ohjeistus, joka ottaisi huomioon singula-
riteettiarvojen hallinnan mallinnettaessa betonilaattarakenteita FEM-mitoitusoh-
jelmalla.
Opinnäytetyön tarkoitus oli selvittää teräsbetonilaatan mallinnukseen sekä sen mi-
toitukseen vaikuttavia erinäisiä tekijöitä sekä ratkaista singulariteettiongelmat,
jotka vaikuttavat teräsbetonilaatan mitoitukseen. Opinnäytetyön tavoite oli luoda
selkeä ja helppolukuinen ohjeistus teräsbetonilaatan mallinnukseen singulariteetti-
arvojen hallinta huomioiden.
Työ koostuu teoriaosuudesta, jossa selvitetään hyväksyttäviä tapoja käsitellä sin-
gulariteettiarvojen hallintaa sekä laskentaosuudesta, jossa eri lähestymistapoja on-
gelmaan testataan FEM-mallin sekä Excel-taulukkolaskennan avulla sekä vertail-
laan niistä saatuja tuloksia.
Opinnäytetyön tuloksena syntynyt singulariteettiarvojen hallinnan huomioiva op-
timoitu betonisuunnittelun ohjeistus on salassa pidettävä liite. Työn julkinen osuus
ottaa kantaa teräsbetonilaatan oikeanlaiseen FEM-mallintamiseen sekä antaa nä-
kemyksiä siihen, miten singulariteettiarvot kannattaa ottaa teräsbetonilaatan suun-
nittelussa huomioon.
Avainsanat FEM-laskenta, elementtiverkko, singulariteetti arvot, optimoitu be-
tonilaatan raudoitus

VAASAN AMMATTIKORKEAKOULU
UNIVERSITY OF APPLIED SCIENCES
Rakennustekniikka
ABSTRACT
Author Hanna Syrjälä
Title Singularity Value Management for Optimized Concrete De-
sign
Year 2019
Language English
Pages 40 + 1 Appendices
Name of Supervisor Marja Naaranoja
The thesis was commissioned by an engineering company, to develop alternatives
and best practice for peak value management when analyzing concrete slab struc-
tures with FEM design software.
The purpose of the thesis was to find out various factors affecting the modelling
of the reinforced concrete slab and its dimensioning, and to solve the singularity
problems that affect the dimensioning of the reinforced concrete slab. The aim of
the thesis was to create a clear and easy-to-read guideline for the modelling of re-
inforced concrete slabs, focusing on the management of singularity values.
The thesis consists of a theoretical part, which explores acceptable ways to deal
with singularity values management, and a calculation part, where different ap-
proaches to the problem are tested using the FEM model and Excel calculations,
and compare the results obtained between these two.
The result of the thesis, the guideline for optimized concrete design taking into ac-
count the management of singularity values, is a confidential annex. The public
part of the thesis takes a stand on the correct FEM modelling of the reinforced
concrete slab and gives an insight on how to analyze singularity values when de-
signing a reinforced concrete slab.
Keywords Finite Element Method, mesh, singularity values and optimized re-
inforced concrete slab

CONTENTS
TIIVISTELMÄ
ABSTRACT
1. INTRODUCTION ............................................................................................ 8
1.1 Background ............................................................................................... 8
1.2 Contents .................................................................................................... 8
1.3 Aims and Goals of the Thesis ................................................................... 8
2. LITERATURE REVIEW ............................................................................... 10
2.1 General .................................................................................................... 10
2.2 The Finite Element Method .................................................................... 10
2.3 RFEM ...................................................................................................... 11
2.4 Model Creation ....................................................................................... 11
2.4.1 Design Process ............................................................................ 11
2.4.2 Meshing ....................................................................................... 13
2.4.3 Boundary Conditions .................................................................. 15
2.4.4 Problems with Model Creation ................................................... 16
2.5 Stress Analysis ........................................................................................ 17
2.5.1 Moment Distribution ................................................................... 17
2.5.2 Smoothing of the Shear ............................................................... 20
2.5.3 Punching and Deflection Control ................................................ 24
3. CALCULATIONS ......................................................................................... 25
3.1 FEM Model ............................................................................................. 25
3.2 FEM Model – without Singularity Management .................................... 26
3.3 FEM Model with Singularity Value Management.................................. 29
3.3.1 Dependency of Mesh Size ........................................................... 29
3.3.2 Smoothing of the Peak Values: Moment .................................... 31
3.3.3 Smoothing of the Peak Values: Shear Force ............................... 32
3.4 Excel Comparison ................................................................................... 33
4. EVALUATION .............................................................................................. 36
4.1 Comparison ............................................................................................. 36
4.2 Risks of Singularity Value Management ................................................ 37

4.3 Open Points ............................................................................................. 38
5. CONCLUSION .............................................................................................. 39
6. REFERENCES ............................................................................................... 40
APPENDIX 1 DESIGN GUIDE FOR FEM IMPLEMENTATION
(CONFIDENTIAL) ............................................................................................... 41
LIST OF FIGURES
Figure 1. Numerical analysis, Finite Element Method /redrawn 4/ ............................... 10
Figure 2. Design process when using FEA /redrawn 2/ ................................................ 12
Figure 3. Choice of the model type /redrawn 5/ ............................................................ 13
Figure 4. Surface divided into mesh /redrawn 2/ ........................................................... 13
Figure 5. Mesh refinements around column support /redrawn 1/ .................................. 15
Figure 6. The relation between mesh size and moment distribution /redrawn 3/ .......... 17
Figure 7. Moment peak value management /redrawn 3/ ............................................... 18
Figure 8. Reinforcement moment’s redistribution /redrawn 3/ ..................................... 19
Figure 9. ULS distribution width recommendations for a support /1/ ........................... 19
Figure 10. Smoothing the bending moment /redrawn 4/ ............................................... 20
Figure 11. Redistribution of the shear forces resultant /redrawn 1/ .............................. 21
Figure 12. Distribution width recommendations for shear forces /redrawn 1/ .............. 22
Figure 13. Direction of the resultant shear force /redrawn 1/ ........................................ 22
Figure 14. The critical result section of the shear force /redrawn 1/ ............................. 24
Figure 15. The example model of the tower foundation ............................................... 25
Figure 16. Slab shear capacity without shear reinforcement ......................................... 26
Figure 17. The design moment without singularity value management ........................ 26
Figure 18. Calculation results for the reinforcement Client EC2 Slab Excel tool ......... 27
Figure 19. The provided bending reinforcement ........................................................... 28
Figure 20. The maximum shear force in the design. ..................................................... 28
Figure 21. Moment distribution, mesh size 250mm ...................................................... 29
Figure 22. Moment distribution, mesh size 500mm ...................................................... 30
Figure 23. Moment distribution, mesh size 750mm ...................................................... 30
Figure 24. Max bottom moments with width of critical section marked....................... 31
Figure 25. The recalculated bending reinforcement ...................................................... 32
Figure 26. The reaction forces in the FEM model ......................................................... 33
Figure 27. Calculation results for the reinforcement, Client EC2 pedestal Excel tool .. 34
Figure 28. The provided reinforcement ......................................................................... 35
Figure 29. Singularity problem in the regions /redrawn 4/ ............................................ 37

7
LIST OF APPENDICES
APPENDIX 1. Design guide for FEM implementation (CONFIDENTIAL)

1. INTRODUCTION
1.1 Background
The Client for this thesis is a technical engineering company, which provides professional
multi-discipline engineering and design services for the global energy and power indus-
try. The company consists of several different services; energy, oil & gas, process, civil,
manufacturing and vehicles. The Client’s Concrete group has invested in improved opti-
mization in their concrete design.
The Concrete team uses FEM software to model and calculate structures. Correctly used
FEM models provides data that can be used for cost-optimizing the structures.
This thesis studies how to manage best the singularity values in FEM when analyzing
concrete structures. The thesis focuses on finding the most cost–efficient solutions, to pro-
vide optimized concrete design for the Client’s end–customers.
1.2 Contents
The thesis consist of three main chapters: The literary part studies how to find out what
the accepted methods for FEA singularity value management are through, university
books and the RFEM software manual. The second part consists of an FEM model and
calculations. This part will concentrate on solving the correct ways to model the structure.
The third part is Excel calculations and a comparison between the FEM and Excel results.
Through these findings and results, the thesis studies what the optimal average area
around peak values is that gives the most realistic moment for reinforcement design.
1.3 Aims and Goals of the Thesis
The aim of this thesis is through comparisons, examinations and studying literature to
find the most optimized mesh size, giving the most cost-effective design, without com-
promising the structural safety. The aim is construction cost savings from an optimized
FEM analysis of reinforced concrete slabs. This leads to more satisfied customers for the
Client through better quality and cost.

9
The goal is to find proper methods for the FEM– analysis of concrete slabs, a topic that
has limited guidance in both the building code, our educational system and at designer
levels.
The result of the thesis is a confidential guide for the RFEM implementation. The public
thesis is an explanation of methods and resources for FEM in general.

2. LITERATURE REVIEW
2.1 General
The finite element method is commonly used in the civil sector for designing of the rein-
forcement in concrete slabs. Due to necessary simplifications in the model, unrealistic
concentrations of moments and shear forces will occur. To obtain an economical design
it is important to put deeper attention to these concentrations. The study focusses on solv-
ing the width, which is distributed over a certain length that gives realistic design moment.
/1/
2.2 The Finite Element Method
In the Finite Element Method, a complex structure is subdivided into a finite number of
individual components. The components are referred to as “elements”. /4/
Figure 1. Numerical analysis, Finite Element Method /redrawn 4/
It is possible to specify the relation between the nodal displacements of the elements and
their nodal reactions. In the FE method, all displacements, strains and stresses within an
element, as well as the resulting nodal forces, are treated as unknown variables to be
11
solved by a series of algebraic equations. The result of the complete system comes from
the assembly of all of these calculated elements. The main task in the Finite Element
Method is to discover form functions that can best approximate the behavior of a special
structural element and also satisfy the compatibility condition. /4/
2.3 RFEM
RFEM is a powerful 3D FEA program for the analysis and design of plates, walls, shells,
solids, and frame structures. The program forms the basis of a modular software system:
RFEM is used to define internal forces, deformations, and support reactions for planar
and spatial structural systems with or without member and solid elements. /6/
FEA is a computer method of analysis that can be used by engineers to perform solutions
to a wide range of one–, two– and three– dimensional structural problems. /2/
2.4 Model Creation
2.4.1 Design Process
It is very important to remember that the designer has a strong impact on the FE analysis
results due the modelling of the structure and choices made during the modelling.
The correctly done model creation of reinforced concrete slab follows a certain path (see
Figure 2) and there are numerous issues to consider during the model creation.

Figure 2. Design process when using FEA /redrawn 2/
When modelling the reinforced concrete structure, the designer needs to determine at
least:
The properties of used concrete
Type of the model
Element size and shape
Loading
Support conditions
Result interpretation /2/
When modelling the reinforced slab, standards determine regulations for plate structures
regarding size and direction of the reinforcement to be used.
13
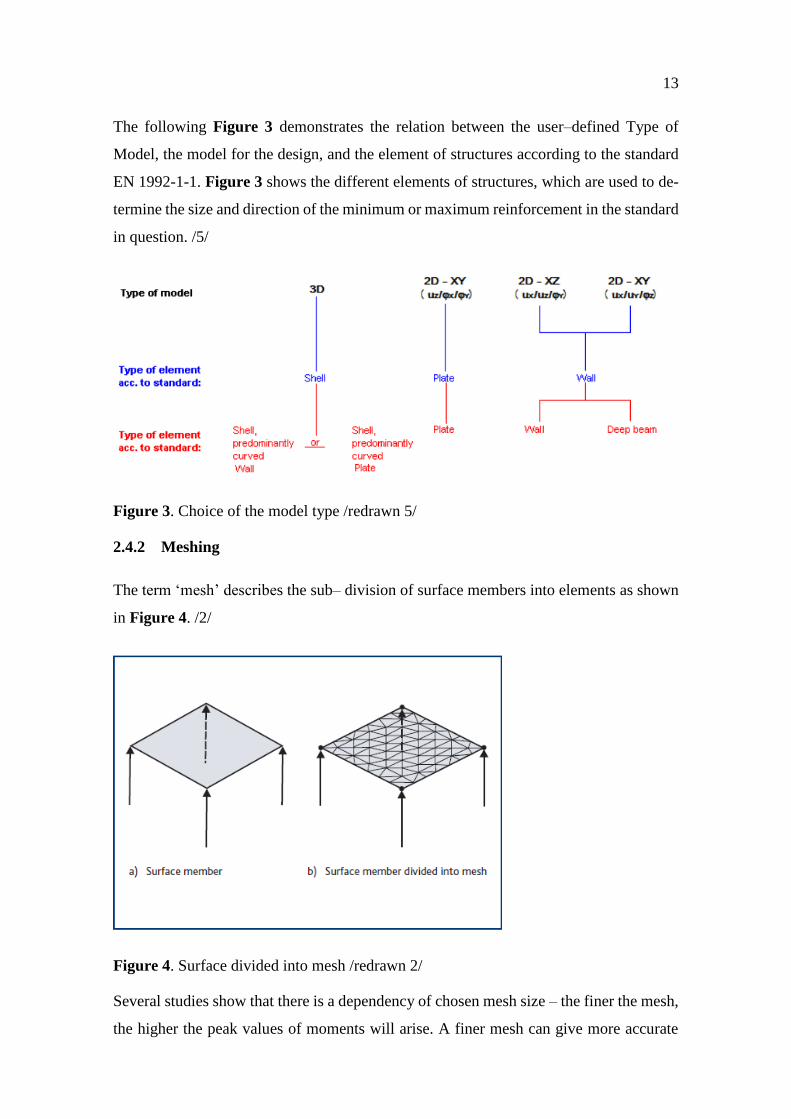
The following Figure 3 demonstrates the relation between the user–defined Type of
Model, the model for the design, and the element of structures according to the standard
EN 1992-1-1. Figure 3 shows the different elements of structures, which are used to de-
termine the size and direction of the minimum or maximum reinforcement in the standard
in question. /5/
Figure 3. Choice of the model type /redrawn 5/
2.4.2 Meshing
The term ‘mesh’ describes the sub– division of surface members into elements as shown
in Figure 4. /2/
Figure 4. Surface divided into mesh /redrawn 2/
Several studies show that there is a dependency of chosen mesh size – the finer the mesh,
the higher the peak values of moments will arise. A finer mesh can give more accurate

results but the designer must have the knowledge to estimate, which results are usable for
the design and which are not. A finer mesh takes more time to analyse and it is subject to
the law of diminishing returns. It should be noted that the finer mesh gives higher peak
moments and can lead to over–dimensioning in concrete design, if the peak values are not
considered and understand correctly. /2/
It is also important to acknowledge that a coarse mesh does not always give a correct
demonstration of the forces. This is due to locations where the stresses change quickly in
a short space. These kind of locations are for example at certain type of supports, near
openings or under concentrated loads. /2/
The designer has to assess how fine or coarse the mesh should be. For sufficiently accu-
rate results, it is important to select the correct mesh size or at least, understand the results
and the influence of the mesh size on the peak values. There are no definite answer for
the ideal mesh size. A good starting point for elements can be considered a span/10 or
1000mm, depending on which gives a smallest value. /2 /
When assessing the right mesh size, it is good to remember that in an FE analysis of a
concrete slab, moments and cross–sectional forces tend to go towards the infinity upon
mesh refinement. In order to obtain sufficiently accurate results at these critical sections,
the mesh density around the point support node in a slab should be chosen so that there is
at least one shell element regardless of order, between the support node and the critical
cross-section. This mesh refinement is illustrated in Figure 5. /1/

15
Figure 5. Mesh refinements around column support /redrawn 1/
2.4.3 Boundary Conditions
In reality, a structure does not show any singularities. The singularity problem is caused
by the inaccuracy of the boundary conditions of the model. Therefore, it is not always
important to calculate with the maximum value of the stresses. The support from a foun-
dation or other structural parts provides stiffness with respect to both translation and ro-
tation. It is easy to make a model error when modelling the support conditions. For ex-
ample, the line support to which the rotation is released, allows the outer edge of the slab
to rotate freely versus a slab with a rigid support, the results of the calculations differ
significantly. In reality, the support of the slab is somewhat in between a rigid and a
hinged support. /1, 4/
It is of high importance that the modelling of the support conditions is done correctly, to
ensure realistic bending moments at the supports and in the mid-span. In this way, the
column moments can be derived and the punching shear stress can be evaluated realisti-
cally. The model should also have a sufficient amount of mesh nodes in order to obtain
correct results. However, it is possible that the model contains too many nodes, especially
at supports, where the peak moments tend to be highlighted. /2/
It is good to know that singularity issues do not arise in cases where a slab is supported
by a line support. The element mesh still needs to be fine enough in order to give sufficient

results in the adjacent critical sections. In addition, it is recommended that at least one
element length is provided between the line support node and the critical cross section,
no matter the order of the shell element. As an alternative, one can use the maximum
moment and shear force at the line support as a sufficient approximation. /1/
The support conditions for slabs supported by bearings or columns are often modelled as
concentrated at single nodes. By doing so, the singularity is introduced in the solution.
The moments and sectional forces tend to go towards infinity upon the mesh refinement.
There are in two different ways to deal with this kind of problem: either the modeling of
the support can be improved to avoid the singularity, or the results in the failure-critical
sections adjacent to the supports can be evaluated. /1/
2.4.4 Problems with Model Creation
When using the RFEM software, the designer must pay attention to several important
points when modelling the concrete structure.
First, there are potential program errors. There are problems that may occur in a numerical
model due the necessary simplifications in it. Problems also can occur due the false as-
sumptions of the element behavior.
These are also the model errors to consider. FE analysis results are highly dependent on
the user and the chosen FE code. The designer must have a good knowledge of FEM and
software behavior to design the structure correctly enough to get sufficient results.
The designer must pay attention to material choices in the model. The calculation in the
concrete slab model are based on a linear elastic behavior. In reality, it is known that
concrete is a nonlinear material.
When modelling the structure, the load distributions are also a point of interest. The de-
signer must consider for example how to evaluate the concentrated load results properly.
The modelling of support conditions is when the model errors are very easily made. The
designer needs to model the support conditions with great care to ensure that resulting
bending moments in the mid– span and at the supports are realistic. /4, 2, 1/

17
2.5 Stress Analysis
2.5.1 Moment Distribution
Moment distributions occur on top of columns and at receding walls. The problem is also
the dependency on the mesh fineness; the finer the mesh, the higher the peak.
One should not concentrate on the peak value itself, but on the area of the moment dia-
gram over the section. For this area, it is sufficient to consider a part of the section, which
extends to the left and right of the column. This is an average area, which gives the design
moment for the reinforcement calculations. /1, 3/
As Figure 6 illustrates: The area of the bending moment diagram should be the area of
interest. The designer should not pay too much attention to the peak bending moments.
Figure 6. The relation between mesh size and moment distribution /redrawn 3/

Figure 7. Moment peak value management /redrawn 3/
There are a couple ways to try to smooth out the peak moments. One example is
introduced in Figure 7: The plate length two times the column width at each side of the
column, in total five times the column width. The integral over this section part gives a
good estimate for the reinforcement which is needed in this section part. /1/
It needs to be noted that when modelling the supports in a simplified way, in single points
or for example along discrete lines, the maximum bending moments obtained from the
FE analysis will over–estimate the real moments. This does not mean that the modelling
of the supports should be done in a different way, it just has to be noted that this way of
modelling the supports gives peak moments that can be neglegted and smoothed out.
When studyin the bending moments in a slab over a support with a certain width, it will
be discovered that the bending moment has its maximum above the support. /1/

19
Figure 8. Reinforcement moment’s redistribution /redrawn 3/
In Figure 8 w means a certain width, over which the reinforcement moments can be re-
distributed. The distribution widths at a support can be chosen from the recommendations
in Figure 9.
Figure 9. ULS distribution width recommendations for a support /1/
Another way of reducing the peak moment values is introduced in the following Figure
10.

Figure 10. Smoothing the bending moment /redrawn 4/
2.5.2 Smoothing of the Shear
There are no specific guidelines given for redistribution of shear forces from a linear FE
analysis in Eurocode 2. Additionally, very little scientifically based information has been
found in literature on the subject. /1/
There are some recommendations, which are based on the assumption that the reinforce-
ment concrete structures in ULS have good capabilities for plastic redistributions. It is
also assumed that the same method can be used for choosing the distribution widths for
shear forces that is used for the reinforcement moments. /1/
When starting to re– evaluate the shear force distribution, it has to be taken into account
that the redistribution is done in a direction, which is orthogonal to the direction of the
resultant shear force. Figure 11 demonstrates this.

21
Figure 11. Redistribution of the shear forces resultant /redrawn 1/
The distribution width for shear forces can, as earlier mentioned, be chosen as equal to
that is used for the reinforcement moments.
There are some limitations to this rule:
The distribution width should not exceed 5h. The thickness of the slab is h.
The same rules apply that are given in Figure 9.
The distribution width should be restricted to a variation of the angle α of less than
45°. See Figure 12. /1/
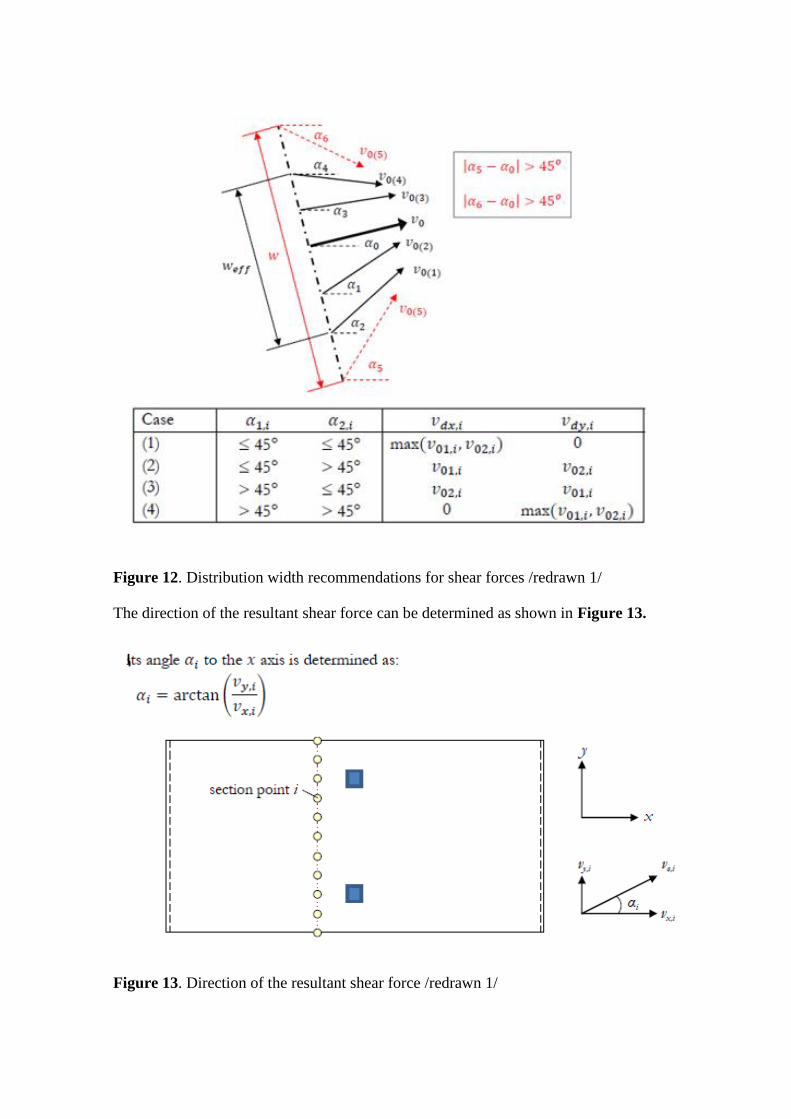
Figure 12. Distribution width recommendations for shear forces /redrawn 1/
The direction of the resultant shear force can be determined as shown in Figure 13.
Figure 13. Direction of the resultant shear force /redrawn 1/

23
The maximum values and the distribution of the shear forces over the supports are usually
irrelevant for the design of concrete slabs. In case of a stiff monolithic connection between
the slab and the supported columns or walls, the design in bending is carried out for the
forces at the face of the support. If the slab is restrained in vertical direction only, the
maximum design bending moment is calculated from the values at the face of the supports
and then smoothed out. /4/
One way to check the punching shear is to take the reactions from the FEM model, then
carry out the calculation, for example using a spreadsheet for the design of reinforced
concrete. If there is a need to model the area of the column, then shear stresses can be
taken from the model. It still necessary to have knowledge of the structural behavior of
the model to make a sufficient decision how to take into account the fact that there will
be peaks which are greater than the design limits in the codes. /2/
The slab should be designed for punching in regions of concentrated single loads or pin
supports by columns and not for the high resultant shear forces. /4/
The critical result section of the shear force in the slab are not placed closer to the support
edge than d. This is illustrated in Figure 14. This helps the designer to estimate the correct
location for the critical result section in the concrete slab. However, it has to be remem-
bered that this is dependent on the stiffness of the slab-support connection and the design
itself. /1/
To summarize, the maximum values and the distribution of the bending moments and
shear forces over the supports are generally not required for the design of concrete slabs.

Figure 14. The critical result section of the shear force /redrawn 1/
2.5.3 Punching and Deflection Control
The slab should be designed for punching in regions of concentrated single loads or pin
supports by columns and not for the high resultant shear forces. The punching shear can
determine the thickness of the concrete slab. If the maximum shear force of the model
overcomes the maximum shear capacity of the structure, the concrete will crack. /4/
Punching shear and deflection control are usually the main criteria for flat slabs. Punching
shear should be checked using code rules. /2/
Deflection in concrete is dependent on:
Concrete tensile and compressive strength
Elastic modulus
Creep
Shrinkage
Cracking of the member
Ambient conditions
Restraint
Magnitude, time and duration of loading
Stiffening by other elements
Deflection prediction is based on various different assumptions and therefore can only be
an estimate at its best. /2/

25
3. CALCULATIONS
3.1 FEM Model
The model is an example from a foundation for a transmission tower. The FEM model is
a concrete slab:
Concrete Grade: C30/37
Slab Dimensions: 5.6 m x 7.0m x 0.6m
Pedestals 4 pcs 700x700mm, 2.90 m high.
Figure 15. The example model of the tower foundation
Loads were imported from Project data for steel structure, and critical load case for bot-
tom reinforcement and for the calculation was determined to be thermal minimum (- 50
degrees). In this temperature the electrical cables shrink and add max load to the founda-
tion. The mesh size in the calculated model was 250 mm.

The minimum reinforcement for bending was 746 mm² (0,13%), and the maximum rein-
forcement was 24000 mm² (4%).
Slab shear capacity without shear reinforcement was 338 kN/m (338 kN/m -> 203 kN),
as illustrated in Figure 16.
Figure 16. Slab shear capacity without shear reinforcement
3.2 FEM Model – without Singularity Management
The design moment without singularity value management in the model is 774 kNm/m
as Figure 17 below shows.
Figure 17. The design moment without singularity value management
The required reinforcement in the slab are presented in Figure 18 below.

27
Figure 18. Calculation results for the reinforcement Client EC2 Slab Excel tool

Figure 19 shows the Excel calculation of the reinforcement that is required for the design
moment 774 kNm/m. The total amount of the reinforcement provided in the bottom slab
in main direction is 3703 mm².
Figure 19. The provided bending reinforcement
The maximum shear in the design without singularity value management is 943 kN/m.
This is presented in the Figure 20. As presented earlier in Figure 16, this exceeds capacity
by 240%, and thus needs thicker slab or better analysis.
Figure 20. The maximum shear force in the design.

29
3.3 FEM Model with Singularity Value Management
3.3.1 Dependency of Mesh Size
The following Figures 21, 22 and 23 demonstrate the fact that the peak forces of the
structure depend on the given mesh size. The structure, its supports and its loads are iden-
tical in the examples. The only thing changed in the model is the mesh size. As it can be
seen in the Figures: The finer the mesh is – the higher the moment peak values become.
The different mesh sizes are chosen according to the following:
The recommendation 10/span (500 mm)
250 mm, finer than the recommendation for comparison
750 mm, coarser than the recommendation for comparison
Figure 21. Moment distribution, mesh size 250mm

Figure 22. Moment distribution, mesh size 500mm
Figure 23. Moment distribution, mesh size 750mm

31
As the calculation results in Figures 21, 22 and 23 demonstrate, there is a 50 % difference
in the design moment between the mesh size 250 mm and the mesh size 750 mm. For the
reinforcement in the concrete this means that As. req = 1722 mm² increases to As. req =
3624 mm², a difference of 52 %.
3.3.2 Smoothing of the Peak Values: Moment
The determination of the allowable width for the moment peak values starts by testing of
the different recommendations. One has the moment distribution showing in the FEM–
model and then the right size of the currently studied average width is measured in the
model. When the width of the critical section is known, then the average of the moments
of this width is calculated. In Figure 24 the basic idea is presented.
Figure 24. Max bottom moments with width of critical section marked.

The Excel calculation (presented in appendix) gives the following distribution widths:
5 x d – Method (illustrated in the Figure 7) gives a width 3.0 m
Lc/4 – ULS Distribution Method (illustrated in the Figure 9) gives a width 0.9 m
From the calculation of the most suitable recommendations found for the optimized de-
sign moment, the results are the following:
5 x d – Method gives a design moment: 256 kNm/m
Lc/4 – ULS Distribution Method gives a design moment: 256 kNm/m
The reinforcement provided for the slab is recalculated with the new given design mo-
ment: 256 kNm/m, and a new result for the reinforcement is shown in the Figure 25.
Figure 25. The recalculated bending reinforcement
The total amount of the reinforcement provided in bottom slab is 1116 mm².
3.3.3 Smoothing of the Peak Values: Shear Force
When determining the allowed average width for the shear forces, the same distribution
widths can be tested when determining the average width for the moments.
The Excel calculations gives the following distribution widths:
5 x h – gives a width: 3.0 m
Lc/4 – ULS Distribution gives a width: 0.9 m
a/2 + d – Method (illustrated in the Figure 14) gives a width: 1.05 m
The calculation of the most suitable recommendations found for the optimized design
shear force, the results are the following:

33
5 x h – gives a design shear force: 268 kN/m
Lc/4 – ULS Distribution gives a design shear force: 290 kN/m
a/2 + d – Method gives a design shear force: 210 kN/m
The new shear force calculated is now: 290 kN/m. The maximum shear capacity of the
slab was calculated in the Client EC2 Slab Excel Tool to be 338 kN/m. With the shear
force being 290 kN/m, the concrete structure will not crack.
3.4 Excel Comparison
Loads for the excel comparison was taken by adding a support at top of column to get the
result forces from the respective load combination.
Figure 26 shows the FEM model and the ULS forces:
Nd= 818 kN, Vdy=76kN, Vdx= 33kN.
Figure 26. The reaction forces in the FEM model
On the next page, Figure 27 presents the Excel calculation of the reinforcement. Dimen-
sions were modified to have matching edge distances, as the excel tool is built for a single
pedestal. The redefined dimensions for the structure in the Excel calculation are 4.4m x
4.8m.

Figure 27. Calculation results for the reinforcement, Client EC2 pedestal Excel tool

35
The required reinforcement in the main direction of the slab are presented in Figure 28.
The total amount of the reinforcement provided is 804 mm².
Figure 28. The provided reinforcement

4. EVALUATION
4.1 Comparison
It is clear that the singularity value management approach gives more optimized design
moments. The difference between reinforcement with singularity value management and
without the singularity value management is significant:
With SVM: The total amount of the reinforcement provided in bottom slab in
main direction is 1116 mm².
Without SVM: The total amount of the reinforcement provided in bottom slab in
main direction is 3703 mm².
The difference between the reinforcements provided is: 70 %
It can be noted that the Excel calculations give the reinforcement amount provided
804mm². This is in line with the calculations done with singularity value management,
but not fully comparable as it was for a single pedestal. It might be safe to say that there
is some truth in the assumption that the moment peak values are not the point of the
interest, when designing a reinforced concrete slab.
Other observation is the mesh size comparison and the different result in the design mo-
ments. The calculation results show that there is a 50 % difference in the design moment
between the mesh size 250 mm and the mesh size 750 mm. It should be taken into account,
when modelling the structure that is not necessary to calculate the model with too fine a
mesh.
For the reinforcement in the concrete the difference in the design moments means that
As. req = 1722 mm² increases to As. req = 3624 mm², when the mesh size changes from
250 mm to 750 mm. The difference in reinforcement required is then 52 %. The change
between the design moments with the different mesh sizes is substantial and cannot be
neglected.
When smoothing out the shear force, the results also point out the fact that there is a huge
difference with the maximum shear force and the smoothed one. The maximum shear
force is 70 % larger. The higher shear force will lead to increased thickness of the concrete

37
slab and higher costs. The difference between the shear force results are in line with the
differences in calculations between the different design moments as well.
4.2 Risks of Singularity Value Management
The structure cannot be modelled to be an exact copy of the real structure. It should al-
ways be kept in mind that even at its best a numerical model is only a simplification of
reality. It is only as accurate as its basic assumptions. There is a lot that depends on the
designer itself. Different designers will get different results from the same structure.
Most design engineers believe that a detailed model and numerical calculation saves re-
inforcement. Because of the complexity of the model, that is not very often the case. /4/
If the singularity problems are neglected without any singularity value management, there
is a risk for over–dimensioning of the structures. Singularity problems usually may occur
in the regions of:
Walls that end within a slab
Discontinuous line supports
Pin supports
Openings
Re–entrant corner and obtuse corners
Concentrated loads /4/
Figure 29. Singularity problem in the regions /redrawn 4/

4.3 Open Points
There is a limited guidance and literature about the subject. That makes the assumptions
and recommendations about singularity value management a difficult issue to investigate.
At its best, the findings and comparison results can only be a good estimate.
It would be useful to do further research on the results of several real projects, so there
can be even more accurate results to present.
The thesis does not take any stand on singularity value management on other structures
than a concrete slab. The subject is quite challenging to limit and there would be different
type of structures that can be studied about the topic, if the study was expanded to other
concrete structures as well.

39
5. CONCLUSION
There was a real need for a guide that uses singularity value management when optimiz-
ing concrete structures. The differences between the calculations with or without the sin-
gularity value management revealed that the peak value issues of the moments and shear
forces are important and need to be taken into account in order to prevent over–dimen-
sioning the structure and to improve the cost–efficiency in the concrete design.
The understanding of the Finite Element Method and singularity value management are
the keys in understanding how optimally design the concrete structure.
Through the study I have learned a great deal regarding the Finite Element Method, the
behavior of concrete structures, the singularity value management and how to model the
structures in FEM properly. The aim of the thesis was achieved by studying the literature
about the subject and by implementing the learned things into to FEM-model and calcu-
lations.
The challenge during the thesis was the fact that there was limited information about the
subject area of the thesis. This made the study very time consuming, but on the other
hand, very interesting to explore.
The goal of the thesis was to provide a short and easy-to-read summery for designers to
use, when modelling the reinforcement slabs. The goal was achieved and the summary
will be shared to all designers in the concrete team.

6. REFERENCES
/1/ Pacoste, C., Plos, M. & Johansson, M. 2012. Recommendations for finite ele-
ment analysis for the design of reinforced concrete slabs. Stockholm.
/2/ The Concrete Center. 2006. How to design reinforced concrete flat slabs using
FEA. Surrey.
/3/ Blauuwendraad, J. 2010. Plates and FEM. Surprises and Pitfalls. London:
Springer Publishing.
/4/ Rombach G.A. 2011. Finite-element Design of Concrete Structures. Practical
problems and their solutions. 2. Edition. London: ICE Publishing.
/5/ Dlubal 2017. RFEM Add-on Module RF-Concrete Surfaces. Program descrip-
tion. Accessed 29.4.2019. https://www.dlubal.com/en/downloads-and-information/doc-
uments/online-manuals/rf-concrete-surfaces/01/01.
/6/ Dlubal 2016. RFEM 5 Spatial Models Calculated According to Finite Element
Method. Program Description. Accessed 03.5.2019. https://www.dlubal.com/en/down-
loads-and-information/documents/online-manuals/rfem-5/01/0.

APPENDIX 1 Design guide for FEM implementation (CONFIDENTIAL)