Single particle impingement current transients for prediction of erosion-enhanced corrosion on 304...
10
Single particle impingement current transients for prediction of erosion-enhanced corrosion on 304 stainless steel Farzad Mohammadi, Jingli Luo * , Baotong Lu, Artin Afacan Department of Chemical and Materials Engineering, University of Alberta, Edmonton, Alberta, Canada T6G 2V4 article info Article history: Received 4 November 2009 Accepted 6 March 2010 Available online 12 March 2010 Keywords: C. Current transient B. Single particle impact C. Depassivation abstract A new device was used to study the characteristics of a single particle impact on the surface of stainless steel. Maximum depassivation occurred at 30° where nearly 30% of the scar area was depassivated. The kinetics of particles motion and electrochemical response of the surface were correlated. The predicted erosion-enhanced corrosion current under slurry flow conditions based on the correlation reasonably matched the experimental results at lower sand concentrations. The predicted currents deviated from experimental values at higher sand concentrations where interactions between particles before and after impact are not negligible. Ó 2010 Elsevier Ltd. All rights reserved. 1. Introduction Erosion–corrosion, the simultaneous action that is a conse- quence of mechanical forces on the surface due to particle impacts and electrochemical corrosion, is a major problem in most fossil fuel related and mineral processing industries. The damage on materials caused by synergism of erosion and corrosion is some- times twice the sum of the damages caused by erosion and corro- sion separately. It is well known that the erosion rate of metals depends on impact angle and impact velocity of the particles impacting on the surface [1–4], and the effects of these parameters on erosion–corrosion rate of materials have been quantified [5–7,10]. Burstein et al. reported that the current transients de- tected from single impacts at oblique angles are larger than those observed at normal angles of impact [4,8]. It is known that both erosion and corrosion enhance one another. In a recent study per- formed by us using an in situ nanoindentation device, it was shown that increasing the applied anodic current reduces hardness on the surface of a metal [9]. We also have studied the repassivation behaviour of passive materials during erosion–corrosion. We found that repassivation current transients usually develop in two steps; one very fast initial step of passive film nucleation on the surface and then the consequent growth of the film [11]. Sundararajan reported that when a single spherical particle impacts on a flat me- tal surface, in air and at a normal impact angle, the produced scar volume correlates well with kinetic energy of the particles impact- ing on the surface of materials [12]. The primary objective of the present study was to correlate the mechanical characteristics of a single particle impact on a passive metal surface with the conse- quent electrochemical response of the surface to this impact in an aqueous medium. A second objective, based on the above corre- lation and the flowing slurry characteristics, was to determine whether the correlation could be used to predict the erosion-en- hanced corrosion rate of the passive metal in different slurry flow conditions. 2. Experimental methods An apparatus was designed to impinge single particles on the surface of the samples while they are kept at desired passive potentials. This device is capable of impinging particles of various sizes up to 3 mm in diameter at different angles and different velocities. Experiments can be run in corrosive environments since the whole device is made of stainless steel. Fig. 1 shows a sche- matic diagram of the single impingement system. Single particles are inserted into the fluid stream using two pistons. These pistons are designed so they can be removed completely from their cylin- der. One of the pistons blocks the fluid stream while the particle is inserted from the other. Then a change in the position of the pis- tons introduces the particle along the wall into the stream towards the nozzle. As it was difficult to determine values for the low current peaks when particle velocities were below 5 m/s, a velocity range be- tween 5 and 11 m/s was chosen for experiments. A cone-shaped nozzle was used to accelerate single particles. To confirm that the particles reached the desired velocities at the nozzle tip, a con- ical nozzle 0.2 m in length was required based on the equations of motion of a particle introduced in a fluid stream (Eq. (1)) [13,14]. 0010-938X/$ - see front matter Ó 2010 Elsevier Ltd. All rights reserved. doi:10.1016/j.corsci.2010.03.007 * Corresponding author. Tel.: +1 780 492 2232; fax: +1 780 492 2881. E-mail address: [email protected] (J. Luo). Corrosion Science 52 (2010) 2331–2340 Contents lists available at ScienceDirect Corrosion Science journal homepage: www.elsevier.com/locate/corsci
-
Upload
independent -
Category
Documents
-
view
0 -
download
0
Transcript of Single particle impingement current transients for prediction of erosion-enhanced corrosion on 304...

Corrosion Science 52 (2010) 2331–2340
Contents lists available at ScienceDirect
Corrosion Science
journal homepage: www.elsevier .com/ locate /corsc i
Single particle impingement current transients for prediction of erosion-enhancedcorrosion on 304 stainless steel
Farzad Mohammadi, Jingli Luo *, Baotong Lu, Artin AfacanDepartment of Chemical and Materials Engineering, University of Alberta, Edmonton, Alberta, Canada T6G 2V4
a r t i c l e i n f o a b s t r a c t
Article history:Received 4 November 2009Accepted 6 March 2010Available online 12 March 2010
Keywords:C. Current transientB. Single particle impactC. Depassivation
0010-938X/$ - see front matter � 2010 Elsevier Ltd. Adoi:10.1016/j.corsci.2010.03.007
* Corresponding author. Tel.: +1 780 492 2232; faxE-mail address: [email protected] (J. Luo).
A new device was used to study the characteristics of a single particle impact on the surface of stainlesssteel. Maximum depassivation occurred at 30� where nearly 30% of the scar area was depassivated. Thekinetics of particles motion and electrochemical response of the surface were correlated. The predictederosion-enhanced corrosion current under slurry flow conditions based on the correlation reasonablymatched the experimental results at lower sand concentrations. The predicted currents deviated fromexperimental values at higher sand concentrations where interactions between particles before and afterimpact are not negligible.
� 2010 Elsevier Ltd. All rights reserved.
1. Introduction
Erosion–corrosion, the simultaneous action that is a conse-quence of mechanical forces on the surface due to particle impactsand electrochemical corrosion, is a major problem in most fossilfuel related and mineral processing industries. The damage onmaterials caused by synergism of erosion and corrosion is some-times twice the sum of the damages caused by erosion and corro-sion separately. It is well known that the erosion rate of metalsdepends on impact angle and impact velocity of the particlesimpacting on the surface [1–4], and the effects of these parameterson erosion–corrosion rate of materials have been quantified[5–7,10]. Burstein et al. reported that the current transients de-tected from single impacts at oblique angles are larger than thoseobserved at normal angles of impact [4,8]. It is known that botherosion and corrosion enhance one another. In a recent study per-formed by us using an in situ nanoindentation device, it was shownthat increasing the applied anodic current reduces hardness on thesurface of a metal [9]. We also have studied the repassivationbehaviour of passive materials during erosion–corrosion. We foundthat repassivation current transients usually develop in two steps;one very fast initial step of passive film nucleation on the surfaceand then the consequent growth of the film [11]. Sundararajanreported that when a single spherical particle impacts on a flat me-tal surface, in air and at a normal impact angle, the produced scarvolume correlates well with kinetic energy of the particles impact-ing on the surface of materials [12]. The primary objective of the
ll rights reserved.
: +1 780 492 2881.
present study was to correlate the mechanical characteristics of asingle particle impact on a passive metal surface with the conse-quent electrochemical response of the surface to this impact inan aqueous medium. A second objective, based on the above corre-lation and the flowing slurry characteristics, was to determinewhether the correlation could be used to predict the erosion-en-hanced corrosion rate of the passive metal in different slurry flowconditions.
2. Experimental methods
An apparatus was designed to impinge single particles on thesurface of the samples while they are kept at desired passivepotentials. This device is capable of impinging particles of varioussizes up to 3 mm in diameter at different angles and differentvelocities. Experiments can be run in corrosive environments sincethe whole device is made of stainless steel. Fig. 1 shows a sche-matic diagram of the single impingement system. Single particlesare inserted into the fluid stream using two pistons. These pistonsare designed so they can be removed completely from their cylin-der. One of the pistons blocks the fluid stream while the particle isinserted from the other. Then a change in the position of the pis-tons introduces the particle along the wall into the stream towardsthe nozzle.
As it was difficult to determine values for the low current peakswhen particle velocities were below 5 m/s, a velocity range be-tween 5 and 11 m/s was chosen for experiments. A cone-shapednozzle was used to accelerate single particles. To confirm thatthe particles reached the desired velocities at the nozzle tip, a con-ical nozzle 0.2 m in length was required based on the equations ofmotion of a particle introduced in a fluid stream (Eq. (1)) [13,14].
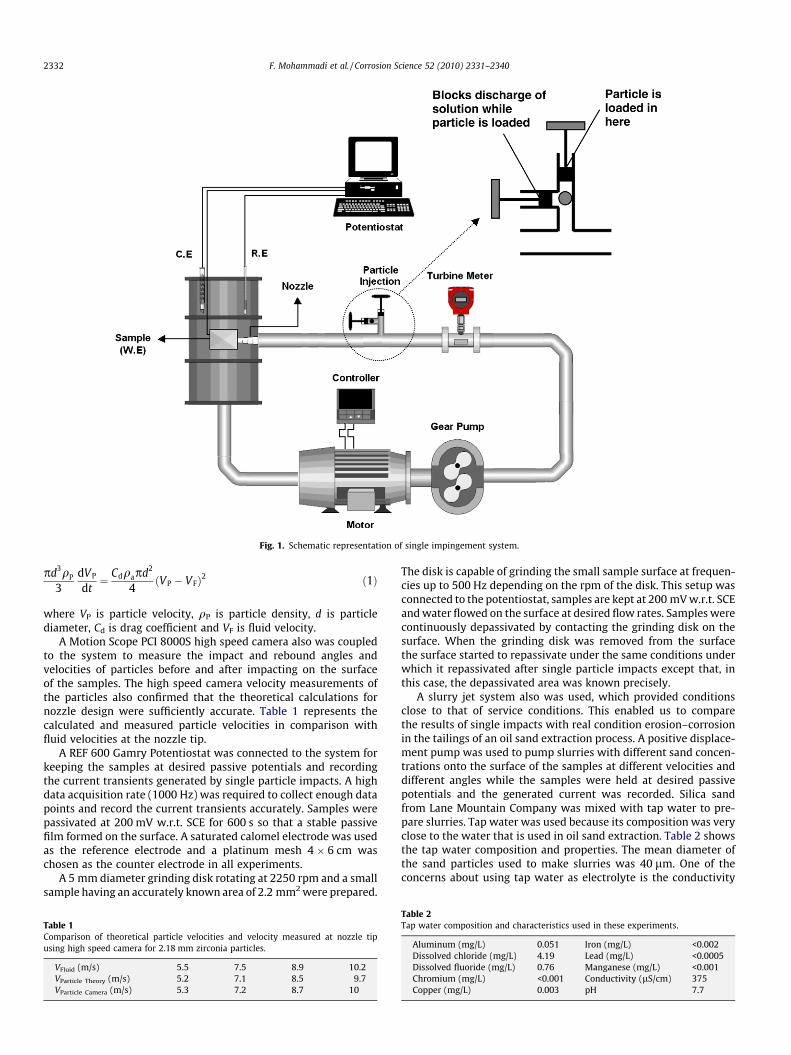
Fig. 1. Schematic representation of single impingement system.
2332 F. Mohammadi et al. / Corrosion Science 52 (2010) 2331–2340
pd3qP
3dVP
dt¼ Cdqapd2
4ðVP � VFÞ2 ð1Þ
where VP is particle velocity, qP is particle density, d is particlediameter, Cd is drag coefficient and VF is fluid velocity.
A Motion Scope PCI 8000S high speed camera also was coupledto the system to measure the impact and rebound angles andvelocities of particles before and after impacting on the surfaceof the samples. The high speed camera velocity measurements ofthe particles also confirmed that the theoretical calculations fornozzle design were sufficiently accurate. Table 1 represents thecalculated and measured particle velocities in comparison withfluid velocities at the nozzle tip.
A REF 600 Gamry Potentiostat was connected to the system forkeeping the samples at desired passive potentials and recordingthe current transients generated by single particle impacts. A highdata acquisition rate (1000 Hz) was required to collect enough datapoints and record the current transients accurately. Samples werepassivated at 200 mV w.r.t. SCE for 600 s so that a stable passivefilm formed on the surface. A saturated calomel electrode was usedas the reference electrode and a platinum mesh 4 � 6 cm waschosen as the counter electrode in all experiments.
A 5 mm diameter grinding disk rotating at 2250 rpm and a smallsample having an accurately known area of 2.2 mm2 were prepared.
Table 1Comparison of theoretical particle velocities and velocity measured at nozzle tipusing high speed camera for 2.18 mm zirconia particles.
VFluid (m/s) 5.5 7.5 8.9 10.2VParticle Theory (m/s) 5.2 7.1 8.5 9.7VParticle Camera (m/s) 5.3 7.2 8.7 10
The disk is capable of grinding the small sample surface at frequen-cies up to 500 Hz depending on the rpm of the disk. This setup wasconnected to the potentiostat, samples are kept at 200 mV w.r.t. SCEand water flowed on the surface at desired flow rates. Samples werecontinuously depassivated by contacting the grinding disk on thesurface. When the grinding disk was removed from the surfacethe surface started to repassivate under the same conditions underwhich it repassivated after single particle impacts except that, inthis case, the depassivated area was known precisely.
A slurry jet system also was used, which provided conditionsclose to that of service conditions. This enabled us to comparethe results of single impacts with real condition erosion–corrosionin the tailings of an oil sand extraction process. A positive displace-ment pump was used to pump slurries with different sand concen-trations onto the surface of the samples at different velocities anddifferent angles while the samples were held at desired passivepotentials and the generated current was recorded. Silica sandfrom Lane Mountain Company was mixed with tap water to pre-pare slurries. Tap water was used because its composition was veryclose to the water that is used in oil sand extraction. Table 2 showsthe tap water composition and properties. The mean diameter ofthe sand particles used to make slurries was 40 lm. One of theconcerns about using tap water as electrolyte is the conductivity
Table 2Tap water composition and characteristics used in these experiments.
Aluminum (mg/L) 0.051 Iron (mg/L) <0.002Dissolved chloride (mg/L) 4.19 Lead (mg/L) <0.0005Dissolved fluoride (mg/L) 0.76 Manganese (mg/L) <0.001Chromium (mg/L) <0.001 Conductivity (lS/cm) 375Copper (mg/L) 0.003 pH 7.7
F. Mohammadi et al. / Corrosion Science 52 (2010) 2331–2340 2333
and the corresponding IR drop problems. However, in these exper-iments the reference electrode was always positioned at a fixeddistance of 0.5 cm from the working electrode. Also, based on theconductivity of the solution (Table 2), the maximum current of4 lA (Fig. 2) and the sample area of 0.54 cm2, the maximum con-tribution of IR drop in the applied potential was calculated to bebelow 10 mV:
IR drop ¼ Il
rA� 4� 10�6ðAÞ � 0:5 cm
375� 10�6 ðS=cmÞ � 0:54 cm2
� 10 mV
This means that a maximum error of 10 mV in the 200 mV ap-plied potential can be caused by IR drop, a value which is less than5% and so is negligible.
Three kinds of spherical particles with two different sizes werechosen to conduct single impingement experiments. Table 3 pre-sents the properties of the particles used in these experiments.The particles were selected in a manner that the ratio of their hard-ness to the hardness of the samples was greater than 1.5 so that theresults were independent of the hardness of the impacting parti-cles as for the data reported by Sundararajan [9,15].
Glass particles were used to study only the effect of impactangle on repassivation charge, since these particles were less
0
1
2
3
4
5
0 15 30Impa
Peak
Cur
rent
(10-6
A)
Si3N4 5.5 m/sZrO2 5.5 m/sGlass 6.4 m/sGlass 8.7 m/sSi3N4 7.5 m/sGlass 5.5 m/s
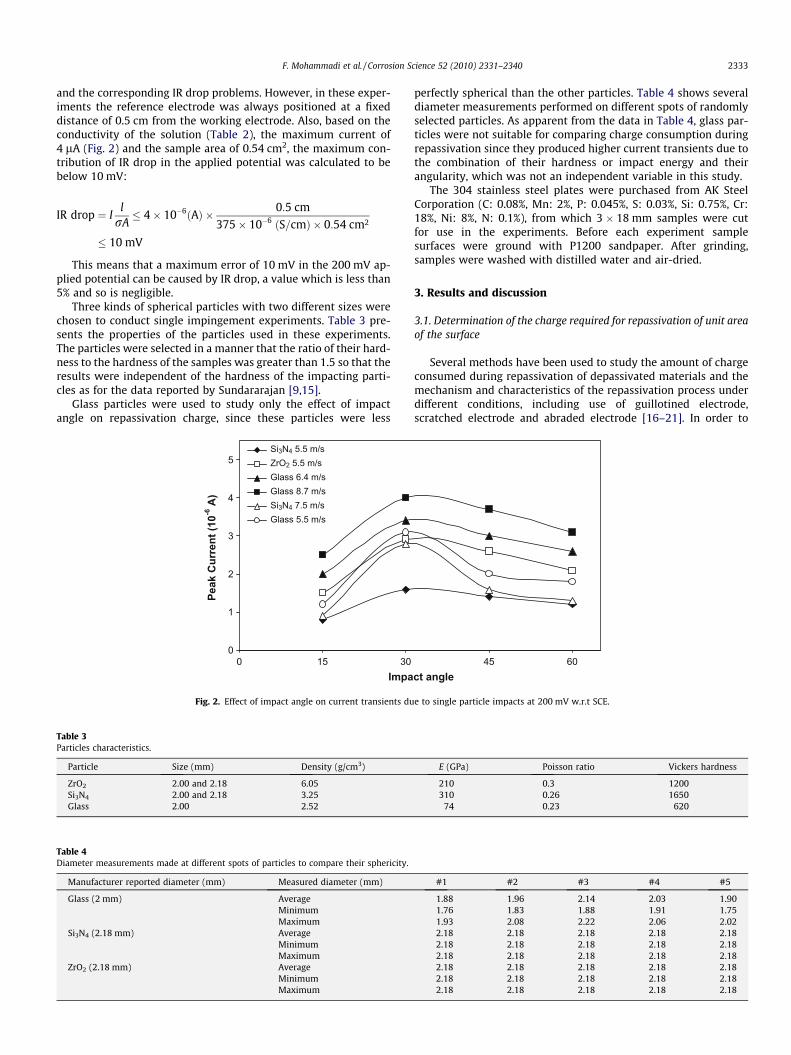
Fig. 2. Effect of impact angle on current transients du
Table 3Particles characteristics.
Particle Size (mm) Density (g/cm3)
ZrO2 2.00 and 2.18 6.05Si3N4 2.00 and 2.18 3.25Glass 2.00 2.52
Table 4Diameter measurements made at different spots of particles to compare their sphericity.
Manufacturer reported diameter (mm) Measured diameter (mm)
Glass (2 mm) AverageMinimumMaximum
Si3N4 (2.18 mm) AverageMinimumMaximum
ZrO2 (2.18 mm) AverageMinimumMaximum
perfectly spherical than the other particles. Table 4 shows severaldiameter measurements performed on different spots of randomlyselected particles. As apparent from the data in Table 4, glass par-ticles were not suitable for comparing charge consumption duringrepassivation since they produced higher current transients due tothe combination of their hardness or impact energy and theirangularity, which was not an independent variable in this study.
The 304 stainless steel plates were purchased from AK SteelCorporation (C: 0.08%, Mn: 2%, P: 0.045%, S: 0.03%, Si: 0.75%, Cr:18%, Ni: 8%, N: 0.1%), from which 3 � 18 mm samples were cutfor use in the experiments. Before each experiment samplesurfaces were ground with P1200 sandpaper. After grinding,samples were washed with distilled water and air-dried.
3. Results and discussion
3.1. Determination of the charge required for repassivation of unit areaof the surface
Several methods have been used to study the amount of chargeconsumed during repassivation of depassivated materials and themechanism and characteristics of the repassivation process underdifferent conditions, including use of guillotined electrode,scratched electrode and abraded electrode [16–21]. In order to
45 60ct angle
e to single particle impacts at 200 mV w.r.t SCE.
E (GPa) Poisson ratio Vickers hardness
210 0.3 1200310 0.26 1650
74 0.23 620
#1 #2 #3 #4 #5
1.88 1.96 2.14 2.03 1.901.76 1.83 1.88 1.91 1.751.93 2.08 2.22 2.06 2.022.18 2.18 2.18 2.18 2.182.18 2.18 2.18 2.18 2.182.18 2.18 2.18 2.18 2.182.18 2.18 2.18 2.18 2.182.18 2.18 2.18 2.18 2.182.18 2.18 2.18 2.18 2.18
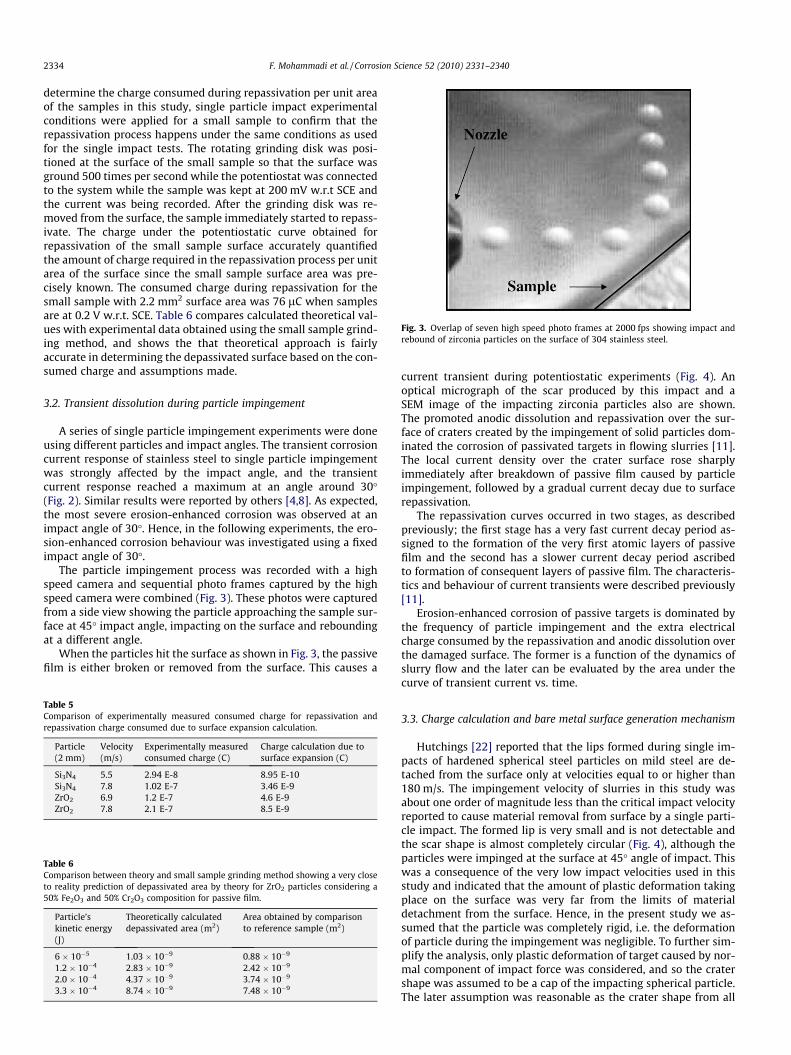
Fig. 3. Overlap of seven high speed photo frames at 2000 fps showing impact andrebound of zirconia particles on the surface of 304 stainless steel.
2334 F. Mohammadi et al. / Corrosion Science 52 (2010) 2331–2340
determine the charge consumed during repassivation per unit areaof the samples in this study, single particle impact experimentalconditions were applied for a small sample to confirm that therepassivation process happens under the same conditions as usedfor the single impact tests. The rotating grinding disk was posi-tioned at the surface of the small sample so that the surface wasground 500 times per second while the potentiostat was connectedto the system while the sample was kept at 200 mV w.r.t SCE andthe current was being recorded. After the grinding disk was re-moved from the surface, the sample immediately started to repass-ivate. The charge under the potentiostatic curve obtained forrepassivation of the small sample surface accurately quantifiedthe amount of charge required in the repassivation process per unitarea of the surface since the small sample surface area was pre-cisely known. The consumed charge during repassivation for thesmall sample with 2.2 mm2 surface area was 76 lC when samplesare at 0.2 V w.r.t. SCE. Table 6 compares calculated theoretical val-ues with experimental data obtained using the small sample grind-ing method, and shows the that theoretical approach is fairlyaccurate in determining the depassivated surface based on the con-sumed charge and assumptions made.
3.2. Transient dissolution during particle impingement
A series of single particle impingement experiments were doneusing different particles and impact angles. The transient corrosioncurrent response of stainless steel to single particle impingementwas strongly affected by the impact angle, and the transientcurrent response reached a maximum at an angle around 30�(Fig. 2). Similar results were reported by others [4,8]. As expected,the most severe erosion-enhanced corrosion was observed at animpact angle of 30�. Hence, in the following experiments, the ero-sion-enhanced corrosion behaviour was investigated using a fixedimpact angle of 30�.
The particle impingement process was recorded with a highspeed camera and sequential photo frames captured by the highspeed camera were combined (Fig. 3). These photos were capturedfrom a side view showing the particle approaching the sample sur-face at 45� impact angle, impacting on the surface and reboundingat a different angle.
When the particles hit the surface as shown in Fig. 3, the passivefilm is either broken or removed from the surface. This causes a
Table 6Comparison between theory and small sample grinding method showing a very closeto reality prediction of depassivated area by theory for ZrO2 particles considering a50% Fe2O3 and 50% Cr2O3 composition for passive film.
Particle’skinetic energy(J)
Theoretically calculateddepassivated area (m2)
Area obtained by comparisonto reference sample (m2)
6 � 10�5 1.03 � 10�9 0.88 � 10�9
1.2 � 10�4 2.83 � 10�9 2.42 � 10�9
2.0 � 10�4 4.37 � 10�9 3.74 � 10�9
3.3 � 10�4 8.74 � 10�9 7.48 � 10�9
Table 5Comparison of experimentally measured consumed charge for repassivation andrepassivation charge consumed due to surface expansion calculation.
Particle(2 mm)
Velocity(m/s)
Experimentally measuredconsumed charge (C)
Charge calculation due tosurface expansion (C)
Si3N4 5.5 2.94 E-8 8.95 E-10Si3N4 7.8 1.02 E-7 3.46 E-9ZrO2 6.9 1.2 E-7 4.6 E-9ZrO2 7.8 2.1 E-7 8.5 E-9
current transient during potentiostatic experiments (Fig. 4). Anoptical micrograph of the scar produced by this impact and aSEM image of the impacting zirconia particles also are shown.The promoted anodic dissolution and repassivation over the sur-face of craters created by the impingement of solid particles dom-inated the corrosion of passivated targets in flowing slurries [11].The local current density over the crater surface rose sharplyimmediately after breakdown of passive film caused by particleimpingement, followed by a gradual current decay due to surfacerepassivation.
The repassivation curves occurred in two stages, as describedpreviously; the first stage has a very fast current decay period as-signed to the formation of the very first atomic layers of passivefilm and the second has a slower current decay period ascribedto formation of consequent layers of passive film. The characteris-tics and behaviour of current transients were described previously[11].
Erosion-enhanced corrosion of passive targets is dominated bythe frequency of particle impingement and the extra electricalcharge consumed by the repassivation and anodic dissolution overthe damaged surface. The former is a function of the dynamics ofslurry flow and the later can be evaluated by the area under thecurve of transient current vs. time.
3.3. Charge calculation and bare metal surface generation mechanism
Hutchings [22] reported that the lips formed during single im-pacts of hardened spherical steel particles on mild steel are de-tached from the surface only at velocities equal to or higher than180 m/s. The impingement velocity of slurries in this study wasabout one order of magnitude less than the critical impact velocityreported to cause material removal from surface by a single parti-cle impact. The formed lip is very small and is not detectable andthe scar shape is almost completely circular (Fig. 4), although theparticles were impinged at the surface at 45� angle of impact. Thiswas a consequence of the very low impact velocities used in thisstudy and indicated that the amount of plastic deformation takingplace on the surface was very far from the limits of materialdetachment from the surface. Hence, in the present study we as-sumed that the particle was completely rigid, i.e. the deformationof particle during the impingement was negligible. To further sim-plify the analysis, only plastic deformation of target caused by nor-mal component of impact force was considered, and so the cratershape was assumed to be a cap of the impacting spherical particle.The later assumption was reasonable as the crater shape from all
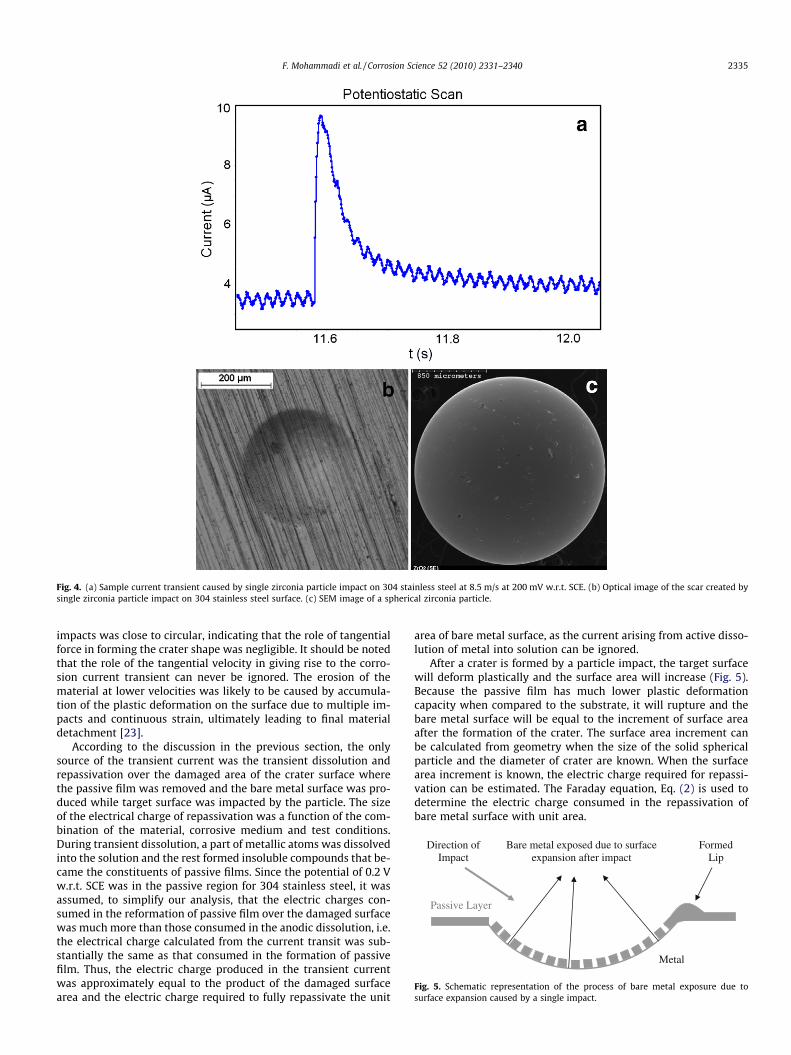
Fig. 4. (a) Sample current transient caused by single zirconia particle impact on 304 stainless steel at 8.5 m/s at 200 mV w.r.t. SCE. (b) Optical image of the scar created bysingle zirconia particle impact on 304 stainless steel surface. (c) SEM image of a spherical zirconia particle.
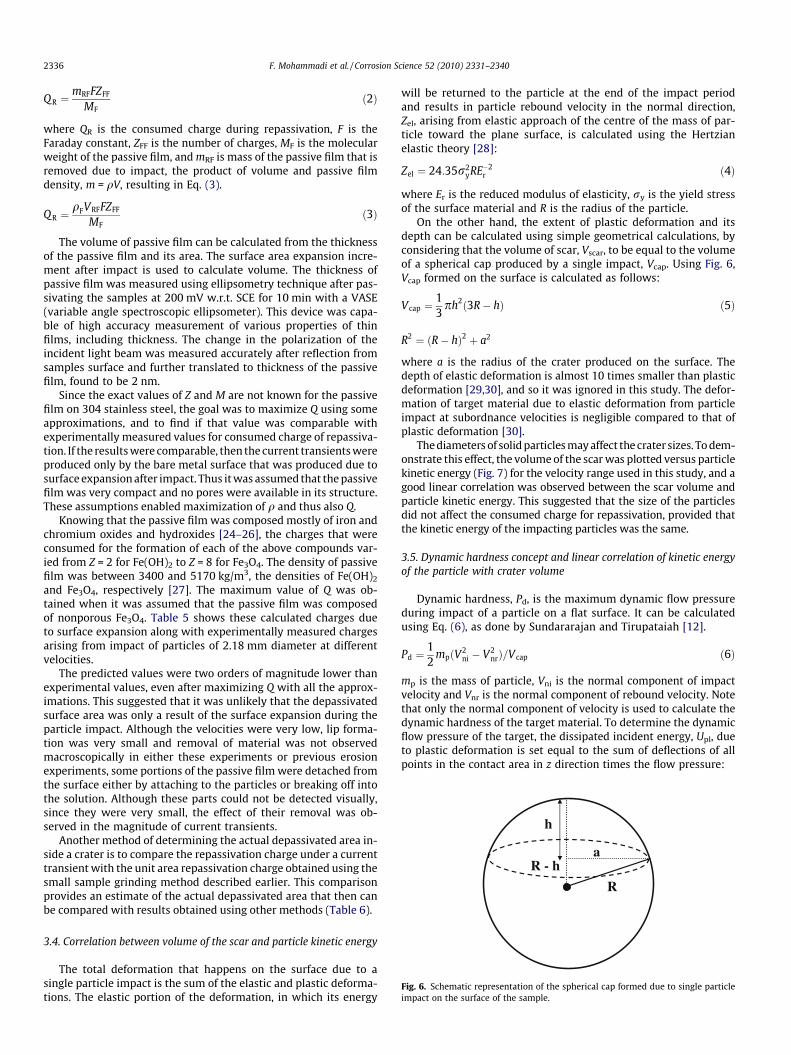
Metal
Passive Layer
Bare metal exposed due to surface expansion after impact
Formed Lip
Direction of Impact
Fig. 5. Schematic representation of the process of bare metal exposure due tosurface expansion caused by a single impact.
F. Mohammadi et al. / Corrosion Science 52 (2010) 2331–2340 2335
impacts was close to circular, indicating that the role of tangentialforce in forming the crater shape was negligible. It should be notedthat the role of the tangential velocity in giving rise to the corro-sion current transient can never be ignored. The erosion of thematerial at lower velocities was likely to be caused by accumula-tion of the plastic deformation on the surface due to multiple im-pacts and continuous strain, ultimately leading to final materialdetachment [23].
According to the discussion in the previous section, the onlysource of the transient current was the transient dissolution andrepassivation over the damaged area of the crater surface wherethe passive film was removed and the bare metal surface was pro-duced while target surface was impacted by the particle. The sizeof the electrical charge of repassivation was a function of the com-bination of the material, corrosive medium and test conditions.During transient dissolution, a part of metallic atoms was dissolvedinto the solution and the rest formed insoluble compounds that be-came the constituents of passive films. Since the potential of 0.2 Vw.r.t. SCE was in the passive region for 304 stainless steel, it wasassumed, to simplify our analysis, that the electric charges con-sumed in the reformation of passive film over the damaged surfacewas much more than those consumed in the anodic dissolution, i.e.the electrical charge calculated from the current transit was sub-stantially the same as that consumed in the formation of passivefilm. Thus, the electric charge produced in the transient currentwas approximately equal to the product of the damaged surfacearea and the electric charge required to fully repassivate the unit
area of bare metal surface, as the current arising from active disso-lution of metal into solution can be ignored.
After a crater is formed by a particle impact, the target surfacewill deform plastically and the surface area will increase (Fig. 5).Because the passive film has much lower plastic deformationcapacity when compared to the substrate, it will rupture and thebare metal surface will be equal to the increment of surface areaafter the formation of the crater. The surface area increment canbe calculated from geometry when the size of the solid sphericalparticle and the diameter of crater are known. When the surfacearea increment is known, the electric charge required for repassi-vation can be estimated. The Faraday equation, Eq. (2) is used todetermine the electric charge consumed in the repassivation ofbare metal surface with unit area.
R
h
R - ha
Fig. 6. Schematic representation of the spherical cap formed due to single particleimpact on the surface of the sample.
2336 F. Mohammadi et al. / Corrosion Science 52 (2010) 2331–2340
Q R ¼mRFFZFF
MFð2Þ
where QR is the consumed charge during repassivation, F is theFaraday constant, ZFF is the number of charges, MF is the molecularweight of the passive film, and mRF is mass of the passive film that isremoved due to impact, the product of volume and passive filmdensity, m = qV, resulting in Eq. (3).
Q R ¼qFVRFFZFF
MFð3Þ
The volume of passive film can be calculated from the thicknessof the passive film and its area. The surface area expansion incre-ment after impact is used to calculate volume. The thickness ofpassive film was measured using ellipsometry technique after pas-sivating the samples at 200 mV w.r.t. SCE for 10 min with a VASE(variable angle spectroscopic ellipsometer). This device was capa-ble of high accuracy measurement of various properties of thinfilms, including thickness. The change in the polarization of theincident light beam was measured accurately after reflection fromsamples surface and further translated to thickness of the passivefilm, found to be 2 nm.
Since the exact values of Z and M are not known for the passivefilm on 304 stainless steel, the goal was to maximize Q using someapproximations, and to find if that value was comparable withexperimentally measured values for consumed charge of repassiva-tion. If the results were comparable, then the current transients wereproduced only by the bare metal surface that was produced due tosurface expansion after impact. Thus it was assumed that the passivefilm was very compact and no pores were available in its structure.These assumptions enabled maximization of q and thus also Q.
Knowing that the passive film was composed mostly of iron andchromium oxides and hydroxides [24–26], the charges that wereconsumed for the formation of each of the above compounds var-ied from Z = 2 for Fe(OH)2 to Z = 8 for Fe3O4. The density of passivefilm was between 3400 and 5170 kg/m3, the densities of Fe(OH)2
and Fe3O4, respectively [27]. The maximum value of Q was ob-tained when it was assumed that the passive film was composedof nonporous Fe3O4. Table 5 shows these calculated charges dueto surface expansion along with experimentally measured chargesarising from impact of particles of 2.18 mm diameter at differentvelocities.
The predicted values were two orders of magnitude lower thanexperimental values, even after maximizing Q with all the approx-imations. This suggested that it was unlikely that the depassivatedsurface area was only a result of the surface expansion during theparticle impact. Although the velocities were very low, lip forma-tion was very small and removal of material was not observedmacroscopically in either these experiments or previous erosionexperiments, some portions of the passive film were detached fromthe surface either by attaching to the particles or breaking off intothe solution. Although these parts could not be detected visually,since they were very small, the effect of their removal was ob-served in the magnitude of current transients.
Another method of determining the actual depassivated area in-side a crater is to compare the repassivation charge under a currenttransient with the unit area repassivation charge obtained using thesmall sample grinding method described earlier. This comparisonprovides an estimate of the actual depassivated area that then canbe compared with results obtained using other methods (Table 6).
3.4. Correlation between volume of the scar and particle kinetic energy
The total deformation that happens on the surface due to asingle particle impact is the sum of the elastic and plastic deforma-tions. The elastic portion of the deformation, in which its energy
will be returned to the particle at the end of the impact periodand results in particle rebound velocity in the normal direction,Zel, arising from elastic approach of the centre of the mass of par-ticle toward the plane surface, is calculated using the Hertzianelastic theory [28]:
Zel ¼ 24:35r2yRE�2
r ð4Þ
where Er is the reduced modulus of elasticity, ry is the yield stressof the surface material and R is the radius of the particle.
On the other hand, the extent of plastic deformation and itsdepth can be calculated using simple geometrical calculations, byconsidering that the volume of scar, Vscar, to be equal to the volumeof a spherical cap produced by a single impact, Vcap. Using Fig. 6,Vcap formed on the surface is calculated as follows:
Vcap ¼13ph2ð3R� hÞ ð5Þ
R2 ¼ ðR� hÞ2 þ a2
where a is the radius of the crater produced on the surface. Thedepth of elastic deformation is almost 10 times smaller than plasticdeformation [29,30], and so it was ignored in this study. The defor-mation of target material due to elastic deformation from particleimpact at subordnance velocities is negligible compared to that ofplastic deformation [30].
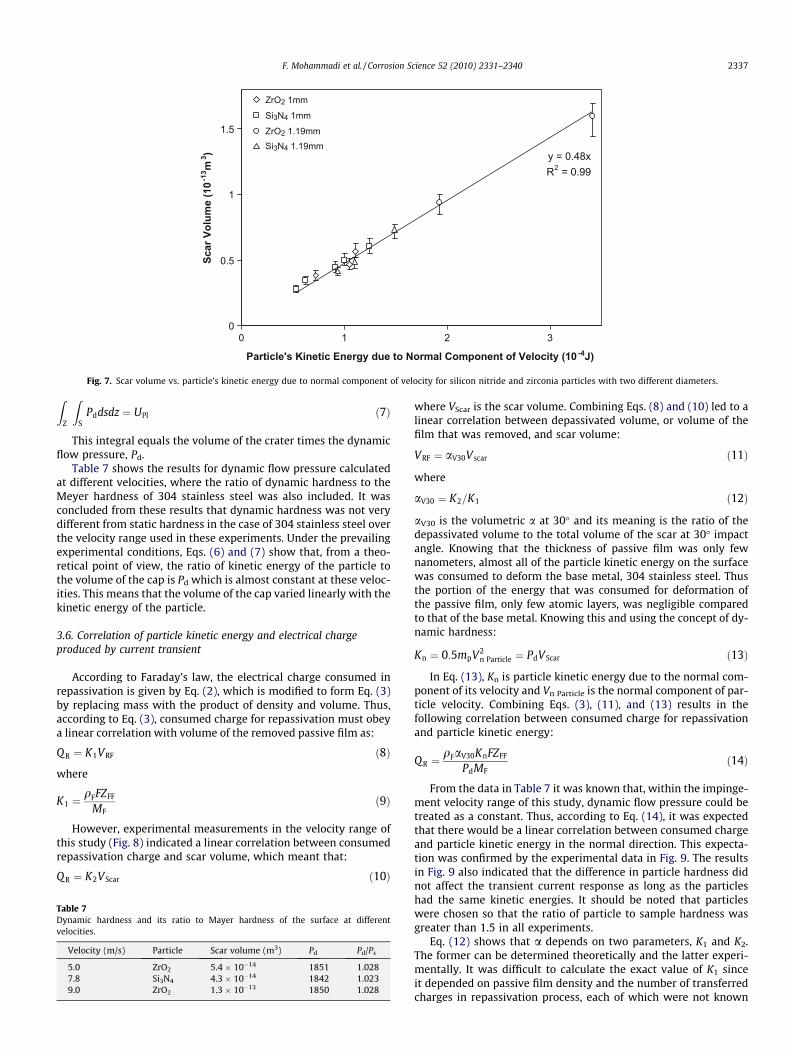
The diameters of solid particles may affect the crater sizes. To dem-onstrate this effect, the volume of the scar was plotted versus particlekinetic energy (Fig. 7) for the velocity range used in this study, and agood linear correlation was observed between the scar volume andparticle kinetic energy. This suggested that the size of the particlesdid not affect the consumed charge for repassivation, provided thatthe kinetic energy of the impacting particles was the same.
3.5. Dynamic hardness concept and linear correlation of kinetic energyof the particle with crater volume
Dynamic hardness, Pd, is the maximum dynamic flow pressureduring impact of a particle on a flat surface. It can be calculatedusing Eq. (6), as done by Sundararajan and Tirupataiah [12].
Pd ¼12
mpðV2ni � V2
nrÞ=V cap ð6Þ
mp is the mass of particle, Vni is the normal component of impactvelocity and Vnr is the normal component of rebound velocity. Notethat only the normal component of velocity is used to calculate thedynamic hardness of the target material. To determine the dynamicflow pressure of the target, the dissipated incident energy, Upl, dueto plastic deformation is set equal to the sum of deflections of allpoints in the contact area in z direction times the flow pressure:
y = 0.48xR2 = 0.99
0
0.5
1
1.5
0 1 2 3
Particle's Kinetic Energy due to Normal Component of Velocity (10 -4J)
Scar
Vol
ume
(10-1
3 m3 )
ZrO2 1mm
Si3N4 1mm
ZrO2 1.19mmSi3N4 1.19mm
Fig. 7. Scar volume vs. particle’s kinetic energy due to normal component of velocity for silicon nitride and zirconia particles with two different diameters.
F. Mohammadi et al. / Corrosion Science 52 (2010) 2331–2340 2337
ZZ
ZS
Pddsdz ¼ UPl ð7Þ
This integral equals the volume of the crater times the dynamicflow pressure, Pd.
Table 7 shows the results for dynamic flow pressure calculatedat different velocities, where the ratio of dynamic hardness to theMeyer hardness of 304 stainless steel was also included. It wasconcluded from these results that dynamic hardness was not verydifferent from static hardness in the case of 304 stainless steel overthe velocity range used in these experiments. Under the prevailingexperimental conditions, Eqs. (6) and (7) show that, from a theo-retical point of view, the ratio of kinetic energy of the particle tothe volume of the cap is Pd which is almost constant at these veloc-ities. This means that the volume of the cap varied linearly with thekinetic energy of the particle.
3.6. Correlation of particle kinetic energy and electrical chargeproduced by current transient
According to Faraday’s law, the electrical charge consumed inrepassivation is given by Eq. (2), which is modified to form Eq. (3)by replacing mass with the product of density and volume. Thus,according to Eq. (3), consumed charge for repassivation must obeya linear correlation with volume of the removed passive film as:
Q R ¼ K1VRF ð8Þ
where
K1 ¼qFFZFF
MFð9Þ
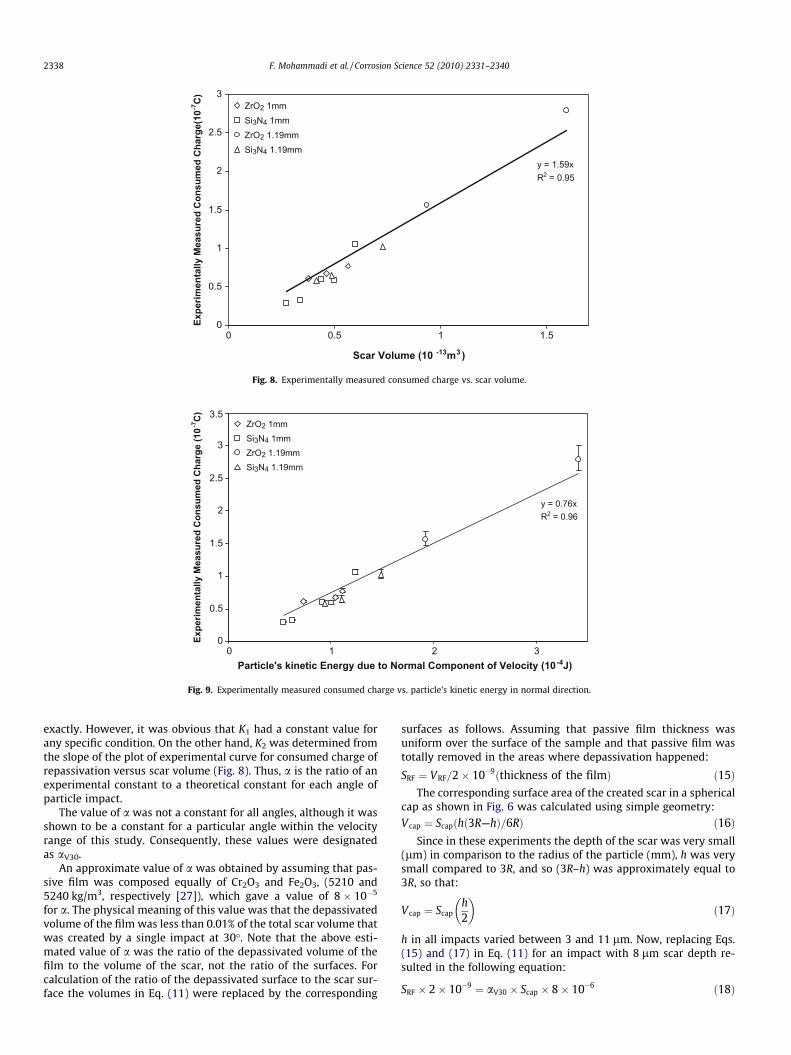
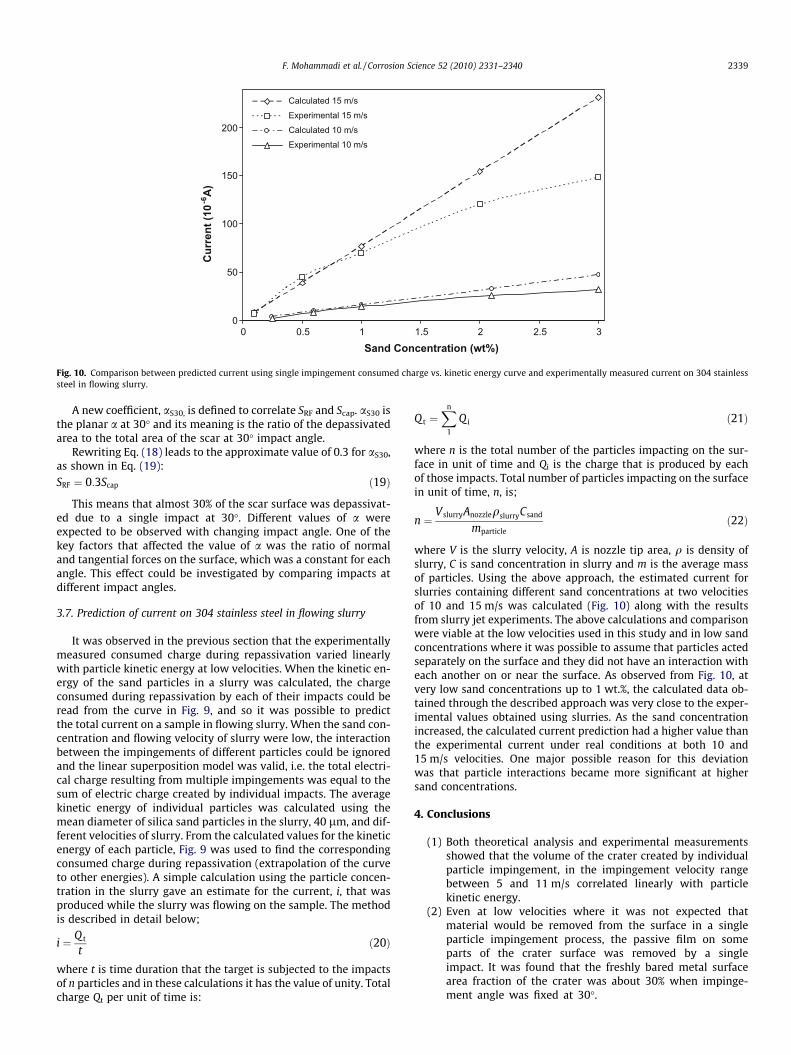
However, experimental measurements in the velocity range ofthis study (Fig. 8) indicated a linear correlation between consumedrepassivation charge and scar volume, which meant that:
Q R ¼ K2VScar ð10Þ
Table 7Dynamic hardness and its ratio to Mayer hardness of the surface at differentvelocities.
Velocity (m/s) Particle Scar volume (m3) Pd Pd/Ps
5.0 ZrO2 5.4 � 10�14 1851 1.0287.8 Si3N4 4.3 � 10�14 1842 1.0239.0 ZrO2 1.3 � 10�13 1850 1.028
where VScar is the scar volume. Combining Eqs. (8) and (10) led to alinear correlation between depassivated volume, or volume of thefilm that was removed, and scar volume:
VRF ¼ aV30V scar ð11Þ
where
aV30 ¼ K2=K1 ð12Þ
aV30 is the volumetric a at 30� and its meaning is the ratio of thedepassivated volume to the total volume of the scar at 30� impactangle. Knowing that the thickness of passive film was only fewnanometers, almost all of the particle kinetic energy on the surfacewas consumed to deform the base metal, 304 stainless steel. Thusthe portion of the energy that was consumed for deformation ofthe passive film, only few atomic layers, was negligible comparedto that of the base metal. Knowing this and using the concept of dy-namic hardness:
Kn ¼ 0:5mpV2n Particle ¼ PdVScar ð13Þ
In Eq. (13), Kn is particle kinetic energy due to the normal com-ponent of its velocity and Vn Particle is the normal component of par-ticle velocity. Combining Eqs. (3), (11), and (13) results in thefollowing correlation between consumed charge for repassivationand particle kinetic energy:
QR ¼qFaV30KnFZFF
PdMFð14Þ
From the data in Table 7 it was known that, within the impinge-ment velocity range of this study, dynamic flow pressure could betreated as a constant. Thus, according to Eq. (14), it was expectedthat there would be a linear correlation between consumed chargeand particle kinetic energy in the normal direction. This expecta-tion was confirmed by the experimental data in Fig. 9. The resultsin Fig. 9 also indicated that the difference in particle hardness didnot affect the transient current response as long as the particleshad the same kinetic energies. It should be noted that particleswere chosen so that the ratio of particle to sample hardness wasgreater than 1.5 in all experiments.
Eq. (12) shows that a depends on two parameters, K1 and K2.The former can be determined theoretically and the latter experi-mentally. It was difficult to calculate the exact value of K1 sinceit depended on passive film density and the number of transferredcharges in repassivation process, each of which were not known
y = 1.59xR2 = 0.95
0
0.5
1
1.5
2
2.5
3
1.510.50
Scar Volume (10 -13m3 )
Expe
rimen
tally
Mea
sure
d C
onsu
med
Cha
rge(
10-7
C)
ZrO2 1mmSi3N4 1mmZrO2 1.19mmSi3N4 1.19mm
Fig. 8. Experimentally measured consumed charge vs. scar volume.
y = 0.76xR2 = 0.96
0
0.5
1
1.5
2
2.5
3
3.5
3210Particle's kinetic Energy due to Normal Component of Velocity (10-4J)
Expe
rimen
tally
Mea
sure
d C
onsu
med
Cha
rge
(10-7
C)
ZrO2 1mmSi3N4 1mmZrO2 1.19mmSi3N4 1.19mm
Fig. 9. Experimentally measured consumed charge vs. particle’s kinetic energy in normal direction.
2338 F. Mohammadi et al. / Corrosion Science 52 (2010) 2331–2340
exactly. However, it was obvious that K1 had a constant value forany specific condition. On the other hand, K2 was determined fromthe slope of the plot of experimental curve for consumed charge ofrepassivation versus scar volume (Fig. 8). Thus, a is the ratio of anexperimental constant to a theoretical constant for each angle ofparticle impact.
The value of a was not a constant for all angles, although it wasshown to be a constant for a particular angle within the velocityrange of this study. Consequently, these values were designatedas aV30.
An approximate value of a was obtained by assuming that pas-sive film was composed equally of Cr2O3 and Fe2O3, (5210 and5240 kg/m3, respectively [27]), which gave a value of 8 � 10�5
for a. The physical meaning of this value was that the depassivatedvolume of the film was less than 0.01% of the total scar volume thatwas created by a single impact at 30�. Note that the above esti-mated value of a was the ratio of the depassivated volume of thefilm to the volume of the scar, not the ratio of the surfaces. Forcalculation of the ratio of the depassivated surface to the scar sur-face the volumes in Eq. (11) were replaced by the corresponding
surfaces as follows. Assuming that passive film thickness wasuniform over the surface of the sample and that passive film wastotally removed in the areas where depassivation happened:
SRF ¼ VRF=2� 10�9ðthickness of the filmÞ ð15ÞThe corresponding surface area of the created scar in a spherical
cap as shown in Fig. 6 was calculated using simple geometry:
Vcap ¼ Scapðhð3R—hÞ=6RÞ ð16ÞSince in these experiments the depth of the scar was very small
(lm) in comparison to the radius of the particle (mm), h was verysmall compared to 3R, and so (3R–h) was approximately equal to3R, so that:
Vcap ¼ Scaph2
� �ð17Þ
h in all impacts varied between 3 and 11 lm. Now, replacing Eqs.(15) and (17) in Eq. (11) for an impact with 8 lm scar depth re-sulted in the following equation:
SRF � 2� 10�9 ¼ aV30 � Scap � 8� 10�6 ð18Þ
0
50
100
150
200
0 0.5 1 1.5 2 2.5 3
Sand Concentration (wt%)
Cur
rent
(10-6
A)
Calculated 15 m/sExperimental 15 m/sCalculated 10 m/sExperimental 10 m/s
Fig. 10. Comparison between predicted current using single impingement consumed charge vs. kinetic energy curve and experimentally measured current on 304 stainlesssteel in flowing slurry.
F. Mohammadi et al. / Corrosion Science 52 (2010) 2331–2340 2339
A new coefficient, aS30, is defined to correlate SRF and Scap. aS30 isthe planar a at 30� and its meaning is the ratio of the depassivatedarea to the total area of the scar at 30� impact angle.
Rewriting Eq. (18) leads to the approximate value of 0.3 for aS30,as shown in Eq. (19):
SRF ¼ 0:3Scap ð19Þ
This means that almost 30% of the scar surface was depassivat-ed due to a single impact at 30�. Different values of a wereexpected to be observed with changing impact angle. One of thekey factors that affected the value of a was the ratio of normaland tangential forces on the surface, which was a constant for eachangle. This effect could be investigated by comparing impacts atdifferent impact angles.
3.7. Prediction of current on 304 stainless steel in flowing slurry
It was observed in the previous section that the experimentallymeasured consumed charge during repassivation varied linearlywith particle kinetic energy at low velocities. When the kinetic en-ergy of the sand particles in a slurry was calculated, the chargeconsumed during repassivation by each of their impacts could beread from the curve in Fig. 9, and so it was possible to predictthe total current on a sample in flowing slurry. When the sand con-centration and flowing velocity of slurry were low, the interactionbetween the impingements of different particles could be ignoredand the linear superposition model was valid, i.e. the total electri-cal charge resulting from multiple impingements was equal to thesum of electric charge created by individual impacts. The averagekinetic energy of individual particles was calculated using themean diameter of silica sand particles in the slurry, 40 lm, and dif-ferent velocities of slurry. From the calculated values for the kineticenergy of each particle, Fig. 9 was used to find the correspondingconsumed charge during repassivation (extrapolation of the curveto other energies). A simple calculation using the particle concen-tration in the slurry gave an estimate for the current, i, that wasproduced while the slurry was flowing on the sample. The methodis described in detail below;
i ¼ Q t
tð20Þ
where t is time duration that the target is subjected to the impactsof n particles and in these calculations it has the value of unity. Totalcharge Qt per unit of time is:
Q t ¼Xn
1
Q i ð21Þ
where n is the total number of the particles impacting on the sur-face in unit of time and Qi is the charge that is produced by eachof those impacts. Total number of particles impacting on the surfacein unit of time, n, is;
n ¼V slurryAnozzleqslurryCsand
mparticleð22Þ
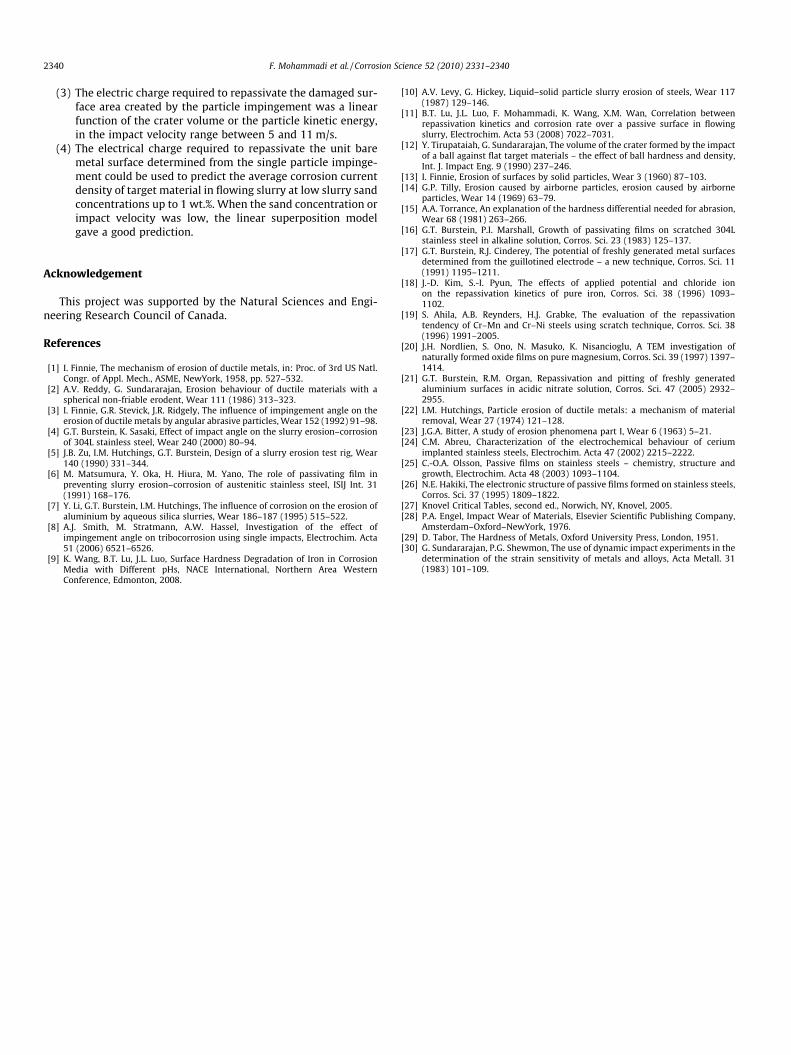
where V is the slurry velocity, A is nozzle tip area, q is density ofslurry, C is sand concentration in slurry and m is the average massof particles. Using the above approach, the estimated current forslurries containing different sand concentrations at two velocitiesof 10 and 15 m/s was calculated (Fig. 10) along with the resultsfrom slurry jet experiments. The above calculations and comparisonwere viable at the low velocities used in this study and in low sandconcentrations where it was possible to assume that particles actedseparately on the surface and they did not have an interaction witheach another on or near the surface. As observed from Fig. 10, atvery low sand concentrations up to 1 wt.%, the calculated data ob-tained through the described approach was very close to the exper-imental values obtained using slurries. As the sand concentrationincreased, the calculated current prediction had a higher value thanthe experimental current under real conditions at both 10 and15 m/s velocities. One major possible reason for this deviationwas that particle interactions became more significant at highersand concentrations.
4. Conclusions
(1) Both theoretical analysis and experimental measurementsshowed that the volume of the crater created by individualparticle impingement, in the impingement velocity rangebetween 5 and 11 m/s correlated linearly with particlekinetic energy.
(2) Even at low velocities where it was not expected thatmaterial would be removed from the surface in a singleparticle impingement process, the passive film on someparts of the crater surface was removed by a singleimpact. It was found that the freshly bared metal surfacearea fraction of the crater was about 30% when impinge-ment angle was fixed at 30�.
2340 F. Mohammadi et al. / Corrosion Science 52 (2010) 2331–2340
(3) The electric charge required to repassivate the damaged sur-face area created by the particle impingement was a linearfunction of the crater volume or the particle kinetic energy,in the impact velocity range between 5 and 11 m/s.
(4) The electrical charge required to repassivate the unit baremetal surface determined from the single particle impinge-ment could be used to predict the average corrosion currentdensity of target material in flowing slurry at low slurry sandconcentrations up to 1 wt.%. When the sand concentration orimpact velocity was low, the linear superposition modelgave a good prediction.
Acknowledgement
This project was supported by the Natural Sciences and Engi-neering Research Council of Canada.
References
[1] I. Finnie, The mechanism of erosion of ductile metals, in: Proc. of 3rd US Natl.Congr. of Appl. Mech., ASME, NewYork, 1958, pp. 527–532.
[2] A.V. Reddy, G. Sundararajan, Erosion behaviour of ductile materials with aspherical non-friable erodent, Wear 111 (1986) 313–323.
[3] I. Finnie, G.R. Stevick, J.R. Ridgely, The influence of impingement angle on theerosion of ductile metals by angular abrasive particles, Wear 152 (1992) 91–98.
[4] G.T. Burstein, K. Sasaki, Effect of impact angle on the slurry erosion–corrosionof 304L stainless steel, Wear 240 (2000) 80–94.
[5] J.B. Zu, I.M. Hutchings, G.T. Burstein, Design of a slurry erosion test rig, Wear140 (1990) 331–344.
[6] M. Matsumura, Y. Oka, H. Hiura, M. Yano, The role of passivating film inpreventing slurry erosion–corrosion of austenitic stainless steel, ISIJ Int. 31(1991) 168–176.
[7] Y. Li, G.T. Burstein, I.M. Hutchings, The influence of corrosion on the erosion ofaluminium by aqueous silica slurries, Wear 186–187 (1995) 515–522.
[8] A.J. Smith, M. Stratmann, A.W. Hassel, Investigation of the effect ofimpingement angle on tribocorrosion using single impacts, Electrochim. Acta51 (2006) 6521–6526.
[9] K. Wang, B.T. Lu, J.L. Luo, Surface Hardness Degradation of Iron in CorrosionMedia with Different pHs, NACE International, Northern Area WesternConference, Edmonton, 2008.
[10] A.V. Levy, G. Hickey, Liquid–solid particle slurry erosion of steels, Wear 117(1987) 129–146.
[11] B.T. Lu, J.L. Luo, F. Mohammadi, K. Wang, X.M. Wan, Correlation betweenrepassivation kinetics and corrosion rate over a passive surface in flowingslurry, Electrochim. Acta 53 (2008) 7022–7031.
[12] Y. Tirupataiah, G. Sundararajan, The volume of the crater formed by the impactof a ball against flat target materials – the effect of ball hardness and density,Int. J. Impact Eng. 9 (1990) 237–246.
[13] I. Finnie, Erosion of surfaces by solid particles, Wear 3 (1960) 87–103.[14] G.P. Tilly, Erosion caused by airborne particles, erosion caused by airborne
particles, Wear 14 (1969) 63–79.[15] A.A. Torrance, An explanation of the hardness differential needed for abrasion,
Wear 68 (1981) 263–266.[16] G.T. Burstein, P.I. Marshall, Growth of passivating films on scratched 304L
stainless steel in alkaline solution, Corros. Sci. 23 (1983) 125–137.[17] G.T. Burstein, R.J. Cinderey, The potential of freshly generated metal surfaces
determined from the guillotined electrode – a new technique, Corros. Sci. 11(1991) 1195–1211.
[18] J.-D. Kim, S.-I. Pyun, The effects of applied potential and chloride ionon the repassivation kinetics of pure iron, Corros. Sci. 38 (1996) 1093–1102.
[19] S. Ahila, A.B. Reynders, H.J. Grabke, The evaluation of the repassivationtendency of Cr–Mn and Cr–Ni steels using scratch technique, Corros. Sci. 38(1996) 1991–2005.
[20] J.H. Nordlien, S. Ono, N. Masuko, K. Nisancioglu, A TEM investigation ofnaturally formed oxide films on pure magnesium, Corros. Sci. 39 (1997) 1397–1414.
[21] G.T. Burstein, R.M. Organ, Repassivation and pitting of freshly generatedaluminium surfaces in acidic nitrate solution, Corros. Sci. 47 (2005) 2932–2955.
[22] I.M. Hutchings, Particle erosion of ductile metals: a mechanism of materialremoval, Wear 27 (1974) 121–128.
[23] J.G.A. Bitter, A study of erosion phenomena part I, Wear 6 (1963) 5–21.[24] C.M. Abreu, Characterization of the electrochemical behaviour of cerium
implanted stainless steels, Electrochim. Acta 47 (2002) 2215–2222.[25] C.-O.A. Olsson, Passive films on stainless steels – chemistry, structure and
growth, Electrochim. Acta 48 (2003) 1093–1104.[26] N.E. Hakiki, The electronic structure of passive films formed on stainless steels,
Corros. Sci. 37 (1995) 1809–1822.[27] Knovel Critical Tables, second ed., Norwich, NY, Knovel, 2005.[28] P.A. Engel, Impact Wear of Materials, Elsevier Scientific Publishing Company,
Amsterdam–Oxford–NewYork, 1976.[29] D. Tabor, The Hardness of Metals, Oxford University Press, London, 1951.[30] G. Sundararajan, P.G. Shewmon, The use of dynamic impact experiments in the
determination of the strain sensitivity of metals and alloys, Acta Metall. 31(1983) 101–109.