Insulating, Semiconducting and Metallic 2D Materials for ...
Upload
independentCategory
view
1download
0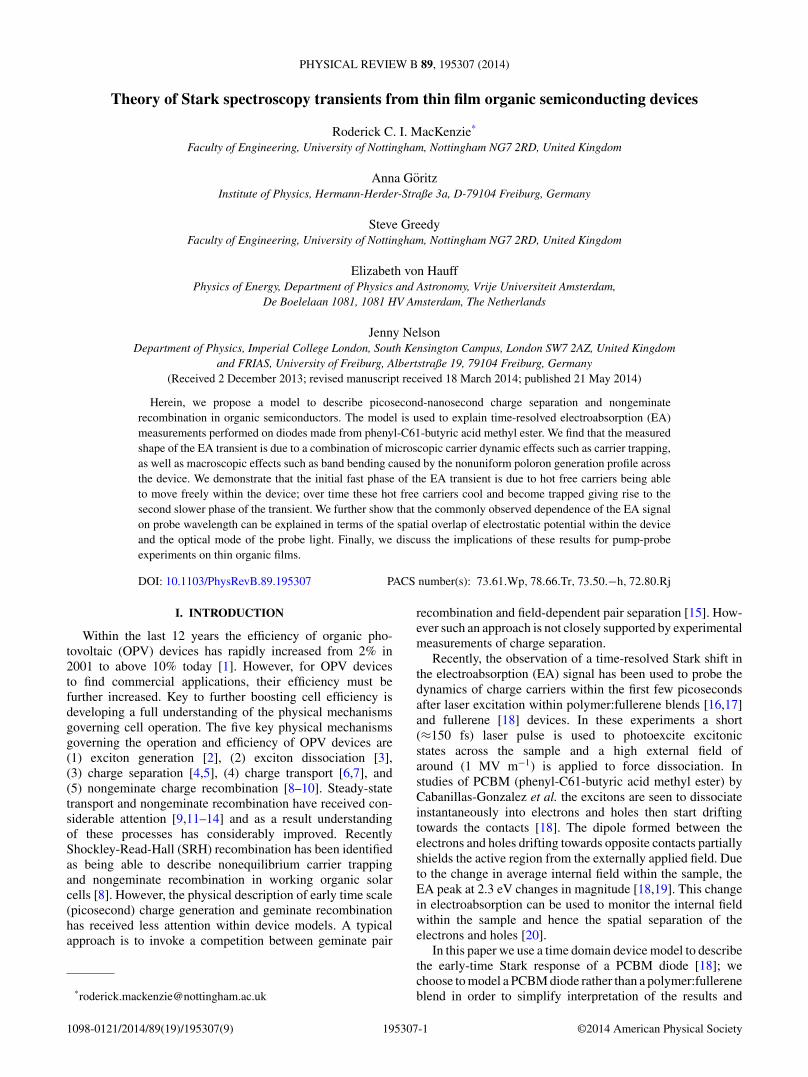
PHYSICAL REVIEW B 89, 195307 (2014)
Theory of Stark spectroscopy transients from thin film organic semiconducting devices
Roderick C. I. MacKenzie*
Faculty of Engineering, University of Nottingham, Nottingham NG7 2RD, United Kingdom
Anna GoritzInstitute of Physics, Hermann-Herder-Straße 3a, D-79104 Freiburg, Germany
Steve GreedyFaculty of Engineering, University of Nottingham, Nottingham NG7 2RD, United Kingdom
Elizabeth von HauffPhysics of Energy, Department of Physics and Astronomy, Vrije Universiteit Amsterdam,
De Boelelaan 1081, 1081 HV Amsterdam, The Netherlands
Jenny NelsonDepartment of Physics, Imperial College London, South Kensington Campus, London SW7 2AZ, United Kingdom
and FRIAS, University of Freiburg, Albertstraße 19, 79104 Freiburg, Germany(Received 2 December 2013; revised manuscript received 18 March 2014; published 21 May 2014)
Herein, we propose a model to describe picosecond-nanosecond charge separation and nongeminaterecombination in organic semiconductors. The model is used to explain time-resolved electroabsorption (EA)measurements performed on diodes made from phenyl-C61-butyric acid methyl ester. We find that the measuredshape of the EA transient is due to a combination of microscopic carrier dynamic effects such as carrier trapping,as well as macroscopic effects such as band bending caused by the nonuniform poloron generation profile acrossthe device. We demonstrate that the initial fast phase of the EA transient is due to hot free carriers being ableto move freely within the device; over time these hot free carriers cool and become trapped giving rise to thesecond slower phase of the transient. We further show that the commonly observed dependence of the EA signalon probe wavelength can be explained in terms of the spatial overlap of electrostatic potential within the deviceand the optical mode of the probe light. Finally, we discuss the implications of these results for pump-probeexperiments on thin organic films.
DOI: 10.1103/PhysRevB.89.195307 PACS number(s): 73.61.Wp, 78.66.Tr, 73.50.−h, 72.80.Rj
I. INTRODUCTION
Within the last 12 years the efficiency of organic pho-tovoltaic (OPV) devices has rapidly increased from 2% in2001 to above 10% today [1]. However, for OPV devicesto find commercial applications, their efficiency must befurther increased. Key to further boosting cell efficiency isdeveloping a full understanding of the physical mechanismsgoverning cell operation. The five key physical mechanismsgoverning the operation and efficiency of OPV devices are(1) exciton generation [2], (2) exciton dissociation [3],(3) charge separation [4,5], (4) charge transport [6,7], and(5) nongeminate charge recombination [8–10]. Steady-statetransport and nongeminate recombination have received con-siderable attention [9,11–14] and as a result understandingof these processes has considerably improved. RecentlyShockley-Read-Hall (SRH) recombination has been identifiedas being able to describe nonequilibrium carrier trappingand nongeminate recombination in working organic solarcells [8]. However, the physical description of early time scale(picosecond) charge generation and geminate recombinationhas received less attention within device models. A typicalapproach is to invoke a competition between geminate pair
recombination and field-dependent pair separation [15]. How-ever such an approach is not closely supported by experimentalmeasurements of charge separation.
Recently, the observation of a time-resolved Stark shift inthe electroabsorption (EA) signal has been used to probe thedynamics of charge carriers within the first few picosecondsafter laser excitation within polymer:fullerene blends [16,17]and fullerene [18] devices. In these experiments a short(≈150 fs) laser pulse is used to photoexcite excitonicstates across the sample and a high external field ofaround (1 MV m−1) is applied to force dissociation. Instudies of PCBM (phenyl-C61-butyric acid methyl ester) byCabanillas-Gonzalez et al. the excitons are seen to dissociateinstantaneously into electrons and holes then start driftingtowards the contacts [18]. The dipole formed between theelectrons and holes drifting towards opposite contacts partiallyshields the active region from the externally applied field. Dueto the change in average internal field within the sample, theEA peak at 2.3 eV changes in magnitude [18,19]. This changein electroabsorption can be used to monitor the internal fieldwithin the sample and hence the spatial separation of theelectrons and holes [20].
In this paper we use a time domain device model to describethe early-time Stark response of a PCBM diode [18]; wechoose to model a PCBM diode rather than a polymer:fullereneblend in order to simplify interpretation of the results and
1098-0121/2014/89(19)/195307(9) 195307-1 ©2014 American Physical Society
RODERICK C. I. MACKENZIE et al. PHYSICAL REVIEW B 89, 195307 (2014)
because reliable experimental data exist. The model describesnongeminate recombination and carrier trapping using amechanism similar to one which has previously been usedto describe the steady-state JV curve and slow (microsecond)transient measurements from disordered organic materials [8].Thus we demonstrate a model which can describe both the fastcarrier dynamics a few picoseconds after generation and theslower (ns-μs) recombination processes which define the JVcurve and thus efficiency in organic devices. We then apply thismodel to understand the time-resolved Stark spectroscopy datapresented by Cabanillas-Gonzalez et al. The result is a betterunderstanding of EA data from films of organic molecules.
II. EXPERIMENTAL DATA
In pump-probe Stark spectroscopy measurements, the field-induced change in transmission is given as
�2T /T = (�T /T )F − (�T /T ), (1)
where (�T /T )F is the transmitted probe signal under field and(�T /T ) is the transmitted probe signal under no field. Figure 1plots Stark spectroscopy data for a PCBM diode as a functionof time at different fields obtained by Cabanillas-Gonzalezet al. The pump laser was applied at time 0 and had an energyof 3.2 eV, power density of 0.35 mJ cm−2, and pulse lengthof 180 fs [18]. The solid lines within the picture represent thefit of the model (described in detail later) to the experimentaldata. The inset of Fig. 1 plots the maximum of the probe signalbefore the laser pulse is applied against the applied field. Themagnitude of the electroabsorption signal is known to changeas the square of the field [18],
F (t) = (EA/A)12 . (2)
Using linear regression the constant A was found to be2.5 × 10−13 au m2/V2 (see the inset of Fig. 1). Equation (2)can be used to transform the transient Stark data after theapplication of the laser pulse in Fig. 1 to a value of averageinternal field. Once the average internal field within the device
FIG. 1. (Color online) Evolution of the electroabsorption signalunder different applied fields. Simulated (lines) and experimental(points; Cabanillas-Gonzalez’s et al.). Inset: Electroabsorption signalvs field before application of the laser pulse (t < 0); the curve is usedto transform measured electroabsorption signal to internal electricfield.
FIG. 2. (Color online) Charge separation distance extracted fromEA data using Eq. (3) (points). Charge separation data taken directlyfrom numerically calculated carrier profile of the model (lines). Thedifference between the two data sets is due to Eq. (3) only consideringthe microscopic separation of electron hole pairs.
is known, by treating the separating charge pairs as electricdipoles with in a unit volume, the following expression canbe derived to relate change of internal field to electron-holedisplacement,
r(t) = ε0εr [F0 − F (t)]
qn, (3)
where r is the charge pair separation distance, F0 is the fieldbefore the laser pulse is applied, F (t) is the field intensity attime t , n is the dipole density, ε0 is the permittivity of freespace, εr is the relative permittivity (see the SupplementalMaterial [43] for a full derivation), and q is the charge on anelectron. The charge carrier separation distance extracted fromthe Stark data is shown in Fig. 2 as symbols.
Once the charge carrier pair separation distance and thefield within the device are known, an instantaneous mobilitycan be defined using
μ = dr(t)
dt
/F (t). (4)
This is plotted in Fig. 3 as the lines with points.Equation (3) and therefore the above analysis assumes that
the measured change in EA signal can be fully describedby simply considering the microscopic process of boundpair disassociation. In this interpretation of the experimentalresults, the microscopic dipole generated by the separatingelectron and hole shields the medium between them from theexternally applied field. This local reduction in field leads to areduction in the EA signal. It is assumed that there is a uniformdistribution of dipoles throughout the device with density n,that the change in field due to charge separation is also uniformacross the device, and that changes to the electric field dueto photoexcited carrier dynamics are only a perturbation tothe applied field. These assumptions also implicitly assumethat carrier generation, recombination, trapping, and transportare also uniform across the entire device. However, it iswell known from previous studies that these processes varystrongly as a function of position. For example, the opticalgeneration profile is known to have maxima and minima due
195307-2

THEORY OF STARK SPECTROSCOPY TRANSIENTS FROM . . . PHYSICAL REVIEW B 89, 195307 (2014)
FIG. 3. (Color online) Instantaneous carrier mobility calculatedfrom the EA data using Eq. (4) (lines + points), and the instantaneouscarrier mobility numerically calculated from the model (lines).
to constructive and destructive interference of light within thedevice [21]. Furthermore, carrier injection and collection atthe contacts will create carrier gradients within the devicemaking charge fluxes vary as a function of position. Theeffect of nonuniform generation, injection from electrodes,and significant recombination are likely to influence theelectric field profile and spatial distribution of excitons, thusinfluencing the EA response. In the following pages wedevelop a macroscopic numerical device model to describecarrier separation process across the whole device on thepicosecond to nanosecond time scale. We then use this modelto obtain a better interpretation of the experimental EA data.
III. NUMERICAL MODEL
The process of exciton generation, charge separation, car-rier transport, trapping, and recombination must be describedin the time domain along with the time-dependent and elec-trostatic effects. We use an effective medium approximationto model the fullerene layer [15,22]. To calculate the transientelectric field within the diode, Poisson’s equation is solved,
d
dxε0εr
dφ
dx= q(nf + nt − pf − pt ), (5)
between the anode (x = 0) and cathode (x = d), where ε0 isthe permittivity of free space, εr the relative permittivity ofthe medium, φ the (instantaneous) electrostatic potential, andq the electron charge. The transient densities of free electrons,trapped electrons, free holes, and trapped holes are given bynf , nt , pf , pt , respectively. To describe charge transport thedrift diffusion equations are solved for positive and negativecharge carriers
Jn = qμenf
∂ELUMO
∂x+ qDn
∂nf
∂x, (6)
Jp = qμhpf
∂EHOMO
∂x− qDp
∂pf
∂x, (7)
where Jn and Jp are the electron and hole carrier densities,Dn and Dp are the electron and hole diffusion coefficients,μe and μh are the carrier mobilities, and ELUMO and EHOMO
represent the free carrier mobility edges. To force conservationof charges the carrier continuity equations are also solved.
In disordered materials such as those used in organicelectronics, it is well known that the presence of localizedtrap states below the mobility edge [23–27] is a key factor indetermining the transport properties [23]. The distribution ofenergies of such trap states influences the charge dynamicsand the relationship between charge density and bias. It hasrecently been shown that in poly(3-hexylthiophene):phenyl-C61-butyric acid methyl ester (P3HT:PCBM) cells recom-bination can be described using the Shockley-Read-Hall(SRH) [8,22,28] mechanism in which carriers recombine whena free charge carrier of one polarity meets a trapped carrier ofthe other polarity. To account for carrier trap states within ourmodel we introduce exponential distributions of trap states forboth electrons,
ρe(E) = Ne exp(E/Ee
u
), (8)
and holes,
ρh(E) = Nh exp(E/Eh
u
), (9)
where ρ is the energy-resolved density of trap states, Ne/h
is the density of states at the mobility edge, and Ee/hu is the
characteristic energy of the exponential tails. Although recentwork suggests the trap distribution is more complex than apure exponential [29], we use an exponential because it hasbeen shown to reproduce experimental data well [22,28–30].
To calculate the spatial photon distribution within thedevice due to the 3.2 eV pump laser the transfer matrixmethod [31] is used. This calculates the forward and backwardpropagating electric fields within the multilayer device whiletaking into account interfaces between layers and absorptionof the materials. The complex refractive index values for ITO,PEDOT, PCBM, and Au are taken from previously publisheddata [32,33].
The full blue line in Fig. 4 plots the calculated modal profileof the pump light. It is assumed that every absorbed photongenerates an electron-hole pair at time t = 0. The generation ofcharge within the model will change the local potential throughPoisson’s equation [Eq. (5)]. By solving Poisson’s equation,
FIG. 4. (Color online) Calculated photon distributions of lightwithin the solar cell for the pump and probe wavelengths of3.2 eV and 2.3 eV, respectively.
195307-3

RODERICK C. I. MACKENZIE et al. PHYSICAL REVIEW B 89, 195307 (2014)
Coulomb interactions between charges are always includedin the model, so that the electric field charges experience isinfluenced by the presence of other charges within the device.Within this picture where all photogenerated charges areincluded, more and less mobile charges can be distinguishedby the gradual relaxation of some of the charges into deeperlying trap states with a consequent reduction in their abilityto take part in transport. Those charges that quickly relax intotraps could be considered as equivalent to the charge pairs thatdo not succeed in dissociating within simpler models such asthat used by Cabanillas-Gonzalez et al. The local contributionto the EA signal due to the sum of the internal and externalfields can be calculated as
I (ω,t,x) = C
(dφ
dx
)2
, (10)
where C is a constant. Therefore, the EA averaged over theentire device is given by
�T/T (t,ω) = d−1∫ d
0I (ω,t,x)m(x,ω)dx, (11)
where m(x,ω) is the normalized optical modal profile of theprobe light. As with the pump light, the modal profile of the2.3 eV probe light within the device over the ITO, PEDOT,PCBM, and the gold contact layer is calculated using a transfermatrix based approach. Thus, in a region of the device wherethere is constructive interference of the probe light �T/T (t,ω)is very sensitive to changes in field at that location; howeverwhere there is destructive interference of the probe light themeasurement is less sensitive to changes in local field at thatlocation. The dashed green line in Fig. 4 plots the calculatedmodal profile of the 2.3 eV probe light.
The model was fitted to the data in Fig. 1; the result ofthe fit is shown as solid lines plotted with the experimentaldata (dots). The resulting model parameters are given in theSupplemental Material [43]. Figure 1 shows that with the givenpump and probe wavelengths, the modeled EA signal shows asharp drop upon excitation then decays more slowly. In the nextsection we examine carrier distributions within the device as afunction of time and visualize the charge separation process.
IV. INTERPRETING ELECTROABSORPTION DATAFROM A PCBM DIODE
Figure 5(a) plots the distribution of carriers within thedevice just after photoexcitation at 3.2 eV. It can be seen thatthe initial carrier distribution follows that of the pump photondistribution plotted in Fig. 4 (blue line). A large negativepotential (−6 V) has been applied to the right-hand side ofthe device; therefore as time increases the hole populationwill drift to the right and the electron population will slideto the left. As these sinusoidal charge carrier distributionspass over one another, dipoles will form where there is anet positive or negative charge. Such a dipole can be seenin Fig. 5(b) at 60 nm, where the net carrier density (holeminus electron) has been plotted at different times. At theright-hand side of Fig. 5(b) a sharp rise in hole density can beseen. This is due to the photogenerated electron sheet driftingto the left, exposing a net positive charge near the contact.A corresponding but smaller increase in the electron densitycan be seen on the left-hand side of the device. These localchanges in charge density result in local potential changesand thus band bending. This can be seen in Fig. 5(c) wherethe LUMO level (electron mobility edge) has been plottedacross the device as a function of time. From Figs. 5(a)–5(c),we can see that the local potential does not reduce uniformlythroughout the device as a described by the simple analyticalanalysis in Sec. II. Instead, the local changes in potentialare closely linked to how the initial macroscopic sinusoidaldistribution of the photogenerated charge clouds drift/diffuseover each other.
Sometimes the pump wavelength is varied in an EA exper-iment [3,34,35] resulting in different shaped EA transients.In the next paragraphs we use the model to theoreticallyinvestigate how the chosen pump and probe wavelengths canaffect the EA signal. Figure 6(a) plots the distribution ofphotogenerated charge carriers within the device when a pumpenergy of 2.5 eV is used instead of 3.2 eV. An excitationenergy where absorption is weak may be chosen with theaim of generating charges uniformly across a device. Thephotogenerated carrier distribution at 2.5 eV [Fig. 6(a)] issignificantly different from that at 3.2 eV [Fig. 5(a)]. A clearexponential decay can be observed in the distribution at 3.2 eVdue to the high absorption of PCBM above 3.1 eV, whereas at2.5 eV there is no exponential decay in the photon distribution
FIG. 5. (Color online) (a) Generation profile of charge carriers within device for a pump energy of 3.2 eV (blue line = hole density,red line = electron density), (b) corresponding difference between hole and hole electron populations as a function of time (holes minuselectrons), and (c) resulting bending of the LUMO level within the device.
195307-4

THEORY OF STARK SPECTROSCOPY TRANSIENTS FROM . . . PHYSICAL REVIEW B 89, 195307 (2014)
FIG. 6. (Color online) (a) Generation profile of charge carriers within the device for a pump energy of 2.5 eV (blue line = hole density,red line = electron density), (b) corresponding difference between hole and hole electron populations as a function of time (hole minuselectrons), and (c) resulting bending of the LUMO level within device. Note, by changing the pump wavelength from 3.2 eV (Fig. 5) to 2.5 eV,the LUMO band bending is significantly altered. This will also affect the corresponding EA signal.
due to the low absorption of PCBM at this energy. The spatialperiod of the light can also be seen to be longer at 2.5 eV thanat 3.2 eV.
Figure 6(b) plots the corresponding net carrier (hole minuselectron) density within the device. By comparing Fig. 6(b) andFig. 5(b), it can be seen that changing the pump energy hasshifted the photoinduced charge dipole from 60 nm to 25 nmand increased its magnitude. The influence this photogeneratedcharge distribution has on the potential within the device canbe seen in Fig. 6(c), where the LUMO has again been plottedas a function of time. The LUMO can be seen to bow upwardsdue to the macroscopic charge dipole centered around 25 nm.The band bending resulting from pumping at 2.5 eV is verydifferent from that observed when the device is pumped at3.2 eV. Since the EA signal is proportional to the average ofthe square of the electrostatic field within the device (i.e., howmuch the bands are bent), we would therefore expect the EAsignal from a device pumped at 3.2 eV to be very differentfrom a device pumped at 2.5 eV.
The blue line in Fig. 7 plots the EA signal correspondingto Figs. 6(a)–6(c). It can be seen that after photoexcitation(at time = 0), there is a sudden reduction in EA signal toa minimum at 5 ps, followed by a gradual increase in EAsignal between 5 and 40 ps. In contrast, the corresponding EAresponse at a pump energy of 3.2 eV in Fig. 1 (−6 V; red line)shows a gradual reduction in EA signal between 0 and 40 ps.Thus from the above discussion we can say that the choiceof pump energy will determine the initial spatial distributionof photogenerated carriers, which in turn determine where netpositive or negative regions of charge within the device aregenerated and how the bands bend and thus the exact natureof the EA response.
Figure 7 also plots the simulated EA responses of thedevice when probed at 2.6 eV and 3.0 eV (still pumped at2.5 eV). It can be seen from this figure that not only is the EAsignal dependent on the pump energy, but also on the chosenprobe wavelength. In fact a probe energy of 3.0 eV producesa positive EA response whereas a probe energy of 2.3 eVproduces a negative response. This is because the measuredEA signal is calculated by multiplying the square of the localelectric field by the local photon density of the probe light[Eq. (11)]. Thus at a spatial position within the device wherethe probe light is at a maximum, the EA signal will be verysensitive to electrostatic potential changes; where the probe
light is at a minimum, the EA signal will be less sensitiveto potential changes. Thus different energies of probe lightwill sample the nonuniform potential gradients in Fig. 6(c) atdifferent places. Figure 8 plots the spatial photon distributionsof the 2.3 eV, 2.6 eV, and 3.0 eV probe light. It can be seenthat the higher the probe energy the more photons there arebetween 0–50 nm and thus the more sensitive the EA signalwill be to the band bending in Fig. 6(c) between 0 and 50 nm.
The impact of different light absorption profiles for pumpand probe wavelengths is also relevant to time-resolvedtransient absorption measurements which are used toobserve the evolution of excited states—particularly chargepair generation—on early (fs-μs) time scales followingphotoexcitation [35–39]. Although such experiments areoften done on films, where optical interference effects are lesspronounced than in devices with reflective back contacts, theeffects of different pump and probe wavelengths on the spatialgeneration of charges and internal electrostatic fields are stillsignificant. For example, in a recent study of ultrafast transientabsorption in blend films of poly[2,1,3-benzothiadiazole-4,7-diyl[4,4-bis(2-ethylhexyl)-4H-cyclopenta[2,1-b:3,4-b]dithiophene-2,6-diyl]:Phenyl-C61-butyric acid methyl ester
FIG. 7. (Color online) EA signals for a device pumped at 2.4 eVand probed at 2.3 eV, 2.6 eV, and 3.0 eV. It can be seen that bychanging the probe energy the EA signal can be significantly altered.This is because different probe energies will have different photondistributions (see Fig. 8) within the active layer of the device, and thusprobe the nonlinear band bending of the device at different spatiallocations.
195307-5

RODERICK C. I. MACKENZIE et al. PHYSICAL REVIEW B 89, 195307 (2014)
FIG. 8. (Color online) Normalized modal profiles of the probelight for photon energies of 2.3 (blue), 2.6 (green), and 3.0 eV (red).It can be seen that as photon energy is increased the photon densityon the left-hand side of the device increases. Thus at low photonenergies the EA measurement will only be sensitive to band bendingon the right-hand side of the device, while at higher photon energies,the EA measurement will be able to measure average band bendingover the whole device.
(PCPDTBT:PC61BM) [3] the authors interpret transientabsorption phenomena to the kinetics of exciton dissociation,charge carrier generation, and relaxation and stimulatedemission, without considering any spatial variation in chargeand exciton densities. They attribute changes in dynamicsresulting from changes in pump photon energy solely tomicroscopic phenomena. However, the method we presentabove would predict a significant influence on the transientabsorption as a result of the different pump (1.7–2.4 eV) andprobe (0.8–1.5 eV) energies on the macroscopic response ofcharges in those experiments. Based on the above analysis,we would expect both microscopic carrier relaxation effectsand the macroscopic effects to have influenced the recordedtransient absorption signal in their measurements.
V. DISCUSSION
Above, we demonstrated that due to constructive anddestructive interference the pump light will generate a spatialvariation in the internal field electromagnetic of the device.These macroscopic effects were not taken into account in thederivation of the transient charge separation distance [Eq. (3)].Thus, next we examine the validity of Eq. (3), by comparingthe predicted carrier separation distance r(t) to that calculateddirectly from the carrier populations within the model. Figure 2plots the charge separation distance calculated directly fromStark data using Eq. (3). Also plotted in the same figure isthe carrier separation distance calculated directly from themodeled internal charge distributions within the model usinga geometric average (lines),
〈xn〉 =∫ d
0 [nf (x) + nt (x) − ni]xdx∫ d
0 nf (x) + nt (x)dx, (12)
where ni is the sum of the initial distributions of trapped andfree electrons at the given applied bias, at a time just afterthe pump laser has generated carriers within the device. Ananalogous expression can be written for holes. To calculatethe average electron-hole separation distance the geometriccenters of the charge packets are subtracted 〈x〉 = 〈xn〉 − 〈xp〉.If Fig. 2 is examined, it can be seen that the charge separationdistance calculated from the Stark data and the separation ofelectron and hole centers of mass obtained directly from themodel 2 are significantly different. The ultrafast phase seen inthe experimental data between 0–2 ps is far more gradual inthe model and the dependence of separation on field is strongerin the experimental data. Furthermore, key to accuratelyevaluating the charge separation distance is correctly calculat-ing the the density of photogenerated charge pairs n [Eq. (3)].For the experimental data in Fig. 2, Cabanillas-Gonzalezet al. estimated the value of 4.6 × 1024 m−3 by estimatingthe absorption cross section of the S1 − Sn states, whileusing a transfer matrix model to directly calculate the excitondensity yields a value of 2.88 × 1026 m−3. When calculatingthe curves in Fig. 2, we used the value of 4.6 × 1024 m−3
for consistency with Cabanillas-Gonzalez et al. However,we stress that the total photogenerated exciton density alsoinfluences the charge dynamics and separation velocity in ourmodel, mainly as a result of the nonuniform electric field inthe device.
If Fig. 2 is examined it can be seen that at early times(<10 ps) the average charge separation distance increasesrapidly; however after this point the charge separation processslows. We can explain this trend by examining what happensto the photoinduced charge within our model as a functionof time. Figure 9 plots the time evolution of the density ofboth free and trapped charge carriers under an applied field of−6 V. It can be seen that immediately after photoexcitation,
FIG. 9. (Color online) The average carrier density correspondingto free (hot) and trapped (cool) electrons during the measurement.Initially all photogenerated carriers are free but as they cool theybecome trapped. It can be seen that during the first 10 ps there aremore free carriers than trapped carriers; this is the reason for theinitial fast separation of the charge packets. It can be seen that past10 ps most carriers are trapped and thus do not move; this is thereason for the second slow phase to the charge separation transient.At long times the number of trapped carriers decreases; this is due torecombination.
195307-6

THEORY OF STARK SPECTROSCOPY TRANSIENTS FROM . . . PHYSICAL REVIEW B 89, 195307 (2014)
FIG. 10. (Color online) Influence of trap states on carrier sepa-ration distance. When recombination is low the traps act to arrestthe separating charge populations. When recombination is high,recombination eats away at the charge packets and causes driftcurrents and increasing measured separation distance.
free (hot) charge carriers dominate the carrier population; thenas time passes and the carrier population cools the numberof free charge carriers decreases as the number of trappedcarrier increases. Thus there are two distinct regions of themeasurement, the first when there are more free carriers thantrapped carriers and the other when there are more trappedcarriers than free carriers. When carriers are hot and freethey can move; however once they become trapped movementbecomes slow because they must detrap first.
Figure 10 (top) plots the calculated charge separationdistance extracted directly from the model [using Eq. (4)]as a function of trap density. From the discussion in theprevious paragraph, it would be expected that the higherthe number of trap states in the material the faster hotcarriers would relax into these states and so the slower chargeseparation would be. This can be seen in Fig. 10 (top) wherea larger number of traps slow charge separation. However,when the recombination cross sections are increased [seeFig. 10 (bottom)], the influence of an increased density oftrapped states is reversed. This is because more trap stateswill increase the rate of free-to-trapped carrier recombination;thus increased recombination will change the shape of thecarrier clouds over time and so the macroscopic field withinthe device will also be altered. Therefore, when interpretingEA measurements, it is key to remember that what is beingmeasured is the macroscopic field due to two macroscopiccharge clouds moving away from one another rather than amicroscopic process; therefore if the shape of the charge cloudschanges due to recombination or other dynamic events thenthe estimated microscopic carrier separation distance will alsochange. We note that recombination is not usually invokedto describe fast dynamic effects but intensity-dependentrecombination has previously been reported on the nanosecondand subnanosecond scale [40–42].
Figure 11 plots the average charge separation distance curveat −6 V (red line) from Fig. 2. Also plotted in Fig. 11 isthe average charge separation distance curve for the samesimulation where the Coulombic electron-hole interaction isturned off by setting the relative permittivity to 1 × 10⁶ (greenline); the inset to Fig. 11 plots the corresponding net charge
FIG. 11. (Color online) Simulated charge separation distancewith the Coulombic effect of charge carriers taken into account (redline), and not taken into account within the simulations (green line). Itcan be seen that Coulombic attraction significantly slows the chargeseparation process. Inset: The photogenerated electron distributionsubtracted from the hole population when Coulombic attraction isturned off. It can be seen that the peaks and troughs of the dipoles aremuch higher than in Figs. 5(b) and 6(b) due to the faster movementof charges.
profile (holes minus electrons) as a function of time. Thesimulations were carried out with a pump/probe wavelengthsidentical to those in Figs. 6(a)–6(c). It can be seen thatthe average charge separation distance increases much morerapidly when the Coulombic electron-hole interaction is turnedoff. If the inset is compared to Fig. 2(b), it can be seen thatwhen there is no electron-hole attraction the net charge profilegrows much more quickly as a function of time, also indicatingthe electron-hole populations are sliding over each other morequickly. All this suggests that the Coulombic electron-holeattraction is key to determining how fast the electrons and holescan move apart before becoming trapped and immobile. Indeedif Fig. 6(c) is examined there is a flattening of the LUMOcentered around 60 nm which corresponds to the formation ofa macroscopic charge dipole around 60 nm in Fig. 6(b). Thisflattening of the bands around the dipole is what is responsiblefor the slow charge separation in Fig. 11 when Coulombicinteraction is turned on.
Cabanillas-Gonzalez et al. also defined a simple equationfor calculating instantaneous carrier mobility [Eq. (4)]. How-ever, mobility in disordered materials is known to be a strongfunction of carrier density; this is because the higher the carrierdensity, the more filled the deep trap states there will be and theare less likely it will be for photogenerated carriers to becometrapped. As can be seen from Fig. 6(a), the charge density inthe device varies as a strong function of position; thus it isdifficult to define a single value of mobility for the device, sofar away from equilibrium. One definition of mobility that haspreviously been used to define nonequilibrium mobility is
μe = 1
d
∫ d
0μ0e
nfree(x,t)
nfree(x,t) + ntrap(x,t)dx, (13)
where nfree is the density of free electrons, ntrap the density oftrapped carriers, μ0 the free carrier mobility, and x the position
195307-7

RODERICK C. I. MACKENZIE et al. PHYSICAL REVIEW B 89, 195307 (2014)
within the device and d the thickness. An analogous expressioncan be defined for the holes.
Both Eq. (4) and Eq. (13) have been applied to extract theaverage carrier mobilities and the results are shown in Fig. 2.Here, we merely point that out that it is difficult to define asingle value of mobility in nonequilibrium situations.
VI. CONCLUSION
We demonstrate that a model including trap states andShockley-Read-Hall recombination can reproduce experi-mental charge separation data obtained with subpicosecondphotoinduced Stark spectroscopy under a range of appliedfields. We have demonstrated that at least part of the observedtime-resolved electroabsorption signals is due to dynamicmacroscopic charge carrier effects. A nonuniform charge car-rier generation profile across the device leads to a nonuniformelectrostatic potential profile. Probing at different wavelengthsmeans that potential gradients at different spatial regions are
preferentially probed. This varying spatial overlap betweenthe nonuniform internal field and the modal profile of theprobe light can significantly influence the measured EA signal.We demonstrate that macroscopic effects such as nongeminaterecombination and band bending can significantly changethe effective measured charge separation distance by changingthe shape of the charge clouds. The model is able toexplain why the measured charge separation distance initiallyincreases rapidly then slows. In our model, the initial fastphase of the transient is due to unrelaxed or hot charge carriersmoving freely within the device. Over time these hot carrierscool and become trapped giving rise to the second phase of thetransient. We also discuss the implications of these results forother pump probe experiments. We recommend that differentfilm thicknesses be used to check whether optical interferenceeffects are indeed influencing the measured signal. With the aidof simple optical modeling this strategy could help transientelectroabsorption measurements to result in a more completepicture of the charge carrier dynamics within the device.
[1] M. A. Green, K. Emery, Y. Hishikawa, W. Warta, and E. D.Dunlop, Prog. Photovolt: Res. Appl. 20, 12 (2012).
[2] C. H. Woo, P. M. Beaujuge, T. W. Holcombe, O. P. Lee, andJ. M. J. Frchet, J. Am. Chem. Soc. 132, 15547 (2010).
[3] G. Grancini, M. Maiuri, D. Fazzi, A. Petrozza, H. Egelhaaf,D. Brida, G. Cerullo, and G. Lanzani, Nat. Mater. 12, 29 (2013).
[4] T. M. Clarke and J. R. Durrant, Chem. Rev. 110, 6736 (2010).[5] D. Vithanage, A. Deviis, V. Abramaviius, Y. Infahsaeng,
D. Abramaviius, R. MacKenzie, P. Keivanidis, A. Yartsev,D. Hertel, J. Nelson, V. Sundstrom, and V. Gulbinas, Nat.Commun. 4, 2334 (2013).
[6] R. C. I. MacKenzie, J. M. Frost, and J. Nelson, J. Chem. Phys.132, 064904 (2010).
[7] M. M. Mandoc, F. B. Kooistra, J. C. Hummelen, B. de Boer, andP. W. M. Blom, Appl. Phys. Lett. 91, 263505 (2007).
[8] R. C. I. MacKenzie, C. G. Shuttle, M. L. Chabinyc, andJ. Nelson, Adv. Energy Mater. 2, 662 (2012).
[9] M. Hilczer and M. Tachiya, J. Phys. Chem. C 114, 6808(2010).
[10] C. L. Braun, J. Chem. Phys. 80, 4157 (1984).[11] C. Groves and N. C. Greenham, Phys. Rev. B 78, 155205
(2008).[12] B. J. Tremolet de Villers, R. C. I. MacKenzie, J. J. Jasieniak,
N. D. Treat, and M. L. Chabinyc, Adv. Energy Mater. 4,1301290 (2014).
[13] L. J. A. Koster, V. D. Mihailetchi, and P. W. M. Blom, Appl.Phys. Lett. 88, 052104 (2006).
[14] R. A. Street, Phys. Rev. B 84, 075208 (2011).[15] L. J. A. Koster, E. C. P. Smits, V. D. Mihailetchi, and P. W. M.
Blom, Phys. Rev. B 72, 085205 (2005).[16] D. A. Vithanage, A. Devizis, V. Abramavicius, Y. Infahsaeng,
D. Abramavicius, R. C. I. MacKenzie, P. E. Keivanidis, A.Yartsev, D. Hertel, J. Nelson, V. Sundstrom, and V. Gulbinas,Nat. Commun. 4, 2334 (2013).
[17] S. Gelinas, A. Rao, A. Kumar, S. L. Smith, A. W. Chin, J. Clark,T. S. van der Poll, G. C. Bazan, and R. H. Friend, Science 343,512 (2014).
[18] J. Cabanillas-Gonzalez, T. Virgili, A. Gambetta, G. Lanzani,T. D. Anthopoulos, and D. M. de Leeuw, Phys. Rev. Lett. 96,106601 (2006).
[19] V. Gulbinas, R. Kananavicius, L. Valkunas, and H. Bassler, Phys.Rev. B 66, 233203 (2002).
[20] J. Cabanillas-Gonzalez, T. Virgili, A. Gambetta, L. Luer,G. Lanzani, T. D. Anthopoulos, and D. M. de Leeuw, Phys.Rev. B 75, 045207 (2007).
[21] R. Hausermann, E. Knapp, M. Moos, N. Reinke, T. Flatz, andB. Ruhstaller, J. Appl. Phys. 106, 104507 (2009).
[22] R. C. I. MacKenzie, T. Kirchartz, G. F. A. Dibb, and J. Nelson,J. Phys. Chem. C 115, 9806 (2011).
[23] H. Bassler, Phys. Status Solidi B 175, 15 (1993).[24] B. Bohnenbuck, E. von Hauff, J. Parisi, C. Deibel, and
V. Dyakonov, J. Appl. Phys. 99, 024506 (2006).[25] Y. Roichman and N. Tessler, Appl. Phys. Lett. 80, 1948
(2002).[26] F. F. Stelzl and U. Wurfel, Phys. Rev. B 86, 075315 (2012).[27] N. Tessler and Y. Roichman, Org. Electron. 6, 200 (2005).[28] T. Kirchartz, B. E. Pieters, J. Kirkpatrick, U. Rau, and J. Nelson,
Phys. Rev. B 83, 115209 (2011).[29] A. Foertig, J. Rauh, V. Dyakonov, and C. Deibel, Phys. Rev. B
86, 115302 (2012).[30] J. Nelson, Phys. Rev. B 67, 155209 (2003).[31] P. Peumans, A. Yakimov, and S. R. Forrest, J. Appl. Phys. 93,
3693 (2003).[32] G. F. Burkhard, E. T. Hoke, and M. D. McGehee, Adv. Mater.
22, 3293 (2010).[33] P. B. Johnson and R. W. Christy, Phys. Rev. B 6, 4370
(1972).[34] J. Cabanillas-Gonzalez, G. Grancini, and G. Lanzani, Adv.
Mater. 23, 5468 (2011).[35] G. Cerullo, S. Stagira, M. Nisoli, S. De Silvestri, G. Lanzani,
G. Kranzelbinder, W. Graupner, and G. Leising, Phys. Rev. B57, 12806 (1998).
[36] A. Devizis, K. Meerholz, D. Hertel, and V. Gulbinas, Phys. Rev.B 82, 155204 (2010).
195307-8

THEORY OF STARK SPECTROSCOPY TRANSIENTS FROM . . . PHYSICAL REVIEW B 89, 195307 (2014)
[37] A. Devizis, A. Serbenta, K. Meerholz, D. Hertel, andV. Gulbinas, Phys. Rev. Lett. 103, 027404 (2009).
[38] A. Devizis, K. Meerholz, D. Hertel, and V. Gulbinas, Chem.Phys. Lett. 498, 302 (2010).
[39] W. Graupner, G. Cerullo, G. Lanzani, M. Nisoli, E. J. W. List,G. Leising, and S. De Silvestri, Phys. Rev. Lett. 81, 3259 (1998).
[40] F. Etzold, I. A. Howard, R. Mauer, M. Meister, T.-D. Kim, K.-S.Lee, N. S. Baek, and F. Laquai, J. Am. Chem. Soc. 133, 9469(2011).
[41] L. M. Andersson, A. Melianas, Y. Infahasaeng, Z. Tang,A. Yartsev, O. Ingans, and V. Sundstrom, J. Phys. Chem. Lett.4, 2069 (2013).
[42] F. Etzold, I. A. Howard, N. Forler, D. M. Cho, M. Meister,H. Mangold, J. Shu, M. R. Hansen, K. Mllen, and F. Laquai,J. Am. Chem. Soc. 134, 10569 (2012).
[43] See Supplemental Material at http://link.aps.org/supplemental/10.1103/PhysRevB.89.195307 for a more detailed descriptionof the model.
195307-9
Copyright © 2022 FDOKUMEN