Direct In Vivo Manipulation and Imaging of Calcium Transients ...
27
Report Direct In Vivo Manipulation and Imaging of Calcium Transients in Neutrophils Identify a Critical Role for Leading-Edge Calcium Flux Graphical Abstract Highlights d Light-sheet microscopy in zebrafish reveals neutrophil calcium dynamics d Migrating zebrafish neutrophils display enriched leading- edge calcium flux d Mammalian TRPV1 allows drug-inducible, cell-specific regulation of calcium d Leading-edge calcium signals can be instructive in setting neutrophil direction Authors Rebecca W. Beerman, Molly A. Matty, Gina G. Au, Loren L. Looger, Kingshuk Roy Choudhury, Philipp J. Keller, David M. Tobin Correspondence [email protected] In Brief In vivo visualization of subcellular calcium dynamics in leukocytes has been challenging. Beerman et al. deploy light- sheet microscopy to identify leading- edge calcium enrichment in migrating zebrafish neutrophils. Calcium manipulation using cell-specific expression of a mammalian ion channel or pharmacological inhibition implicates leading-edge calcium in directional control of migrating neutrophils. Beerman et al., 2015, Cell Reports 13, 2107–2117 December 15, 2015 ª2015 The Authors http://dx.doi.org/10.1016/j.celrep.2015.11.010
-
Upload
khangminh22 -
Category
Documents
-
view
0 -
download
0
Transcript of Direct In Vivo Manipulation and Imaging of Calcium Transients ...

Report
Direct In Vivo Manipulatio
n and Imaging of CalciumTransients in Neutrophils Identify a Critical Role forLeading-Edge Calcium FluxGraphical Abstract
Highlights
d Light-sheet microscopy in zebrafish reveals neutrophil
calcium dynamics
d Migrating zebrafish neutrophils display enriched leading-
edge calcium flux
d Mammalian TRPV1 allows drug-inducible, cell-specific
regulation of calcium
d Leading-edge calcium signals can be instructive in setting
neutrophil direction
Beerman et al., 2015, Cell Reports 13, 2107–2117December 15, 2015 ª2015 The Authorshttp://dx.doi.org/10.1016/j.celrep.2015.11.010
Authors
Rebecca W. Beerman, Molly A. Matty,
Gina G. Au, Loren L. Looger,
Kingshuk Roy Choudhury,
Philipp J. Keller, David M. Tobin
In Brief
In vivo visualization of subcellular calcium
dynamics in leukocytes has been
challenging. Beerman et al. deploy light-
sheet microscopy to identify leading-
edge calcium enrichment in migrating
zebrafish neutrophils. Calcium
manipulation using cell-specific
expression of a mammalian ion channel
or pharmacological inhibition implicates
leading-edge calcium in directional
control of migrating neutrophils.

Cell Reports
Report
Direct In Vivo Manipulation and Imagingof Calcium Transients in Neutrophils Identifya Critical Role for Leading-Edge Calcium FluxRebecca W. Beerman,1 Molly A. Matty,1,2 Gina G. Au,1 Loren L. Looger,3 Kingshuk Roy Choudhury,4 Philipp J. Keller,3
and David M. Tobin1,5,*1Department of Molecular Genetics and Microbiology, Duke University, Durham, NC 27710, USA2University Program in Genetics and Genomics, Duke University, Durham, NC 27710, USA3Howard Hughes Medical Institute, Janelia Research Campus, Ashburn, VA 20147, USA4Department of Biostatistics and Bioinformatics, Duke University, Durham, NC 27710, USA5Department of Immunology, Duke University, Durham, NC 27710, USA
*Correspondence: [email protected]
http://dx.doi.org/10.1016/j.celrep.2015.11.010This is an open access article under the CC BY-NC-ND license (http://creativecommons.org/licenses/by-nc-nd/4.0/).
SUMMARY
Calcium signaling has long been associated with keyevents of immunity, including chemotaxis, phagocy-tosis, and activation. However, imaging and manipu-lation of calcium flux in motile immune cells in liveanimals remain challenging. Using light-sheet micro-scopy for in vivo calcium imaging in zebrafish, weobserve characteristic patterns of calcium flux trig-gered by distinct events, including phagocytosis ofpathogenic bacteria and migration of neutrophils to-ward inflammatory stimuli. In contrast to findingsfrom ex vivo studies, we observe enriched calciuminflux at the leading edge of migrating neutrophils.To directly manipulate calcium dynamics in vivo,we have developed transgenic lineswith cell-specificexpression of the mammalian TRPV1 channel,enabling ligand-gated, reversible, and spatiotem-poral control of calcium influx. We find thatcontrolled calcium influx can function to help definethe neutrophil’s leading edge. Cell-specific TRPV1expression may have broad utility for precise controlof calcium dynamics in other immune cell types andorganisms.
INTRODUCTION
Intracellular calcium concentrations [Ca2+]i are tightly regulated;
changes in the frequency and spatial distribution of [Ca2+]i affect
multiple aspects of cellular activity. The first neutrophil behavior
associated with calcium flux was identified almost 40 years ago
(Boucek and Snyderman, 1976). However, subsequent analysis
using alternative methods to visualize [Ca2+]i dynamics (Grien-
berger and Konnerth, 2012; Tsien, 1980) were surprisingly diver-
gent, with reports of enriched calcium at the front edge of
migrating neutrophils (Sawyer et al., 1985), whole-cell calcium
flux in migrating neutrophils with no calcium gradient (Marks
Cell Rep
and Maxfield, 1990), and no detectable changes in neutrophil
calcium levels during chemotaxis (Laffafian and Hallett, 1995).
A low-amplitude leading-edge Ca2+ signal has been detected
in polarized RAW cells in culture, a model system for macro-
phage chemotaxis, and this Ca2+ signal was shown to be essen-
tial for leading edge stability and ruffling (Evans and Falke, 2007).
However, the presence of a leading-edge Ca2+ signal has not
been demonstrated for any leukocyte in tissue.
Light-sheet microscopy enables whole-animal recordings of
calcium dynamics inmultiple cells simultaneously in small, trans-
parent organisms (Keller et al., 2015). Zebrafish larvae are opti-
cally transparent and therefore ideal for studying immune-cell
behaviors in real time and in whole animals (Renshaw and Trede,
2012). There is a high degree of genetic and functional conserva-
tion between the zebrafish and mammalian innate immune sys-
tems (Cambier et al., 2014; Harvie and Huttenlocher, 2015;
Henry et al., 2013). Detailed characterizations of zebrafish neu-
trophils have motivated the establishment of new animal models
for both neutrophil dysfunction, such as WHIM (Warts, Hypo-
gammaglobulinemia, Infections, and Myelokathexis) syndrome,
and bacterial infections, including Pseudomonas aeruginosa
(Brannon et al., 2009; Clatworthy et al., 2009; Phennicie et al.,
2010; Walters et al., 2010).
Here, we carry out high-resolution intravital recordings of
calcium signaling in migrating neutrophils in whole, live verte-
brates. Analysis of calcium dynamics using light-sheet micro-
scopy reveals calcium enrichment at the leading edge of
migrating neutrophils, rather than the classical model of highest
calcium levels at the uropod (Wei et al., 2012). We describe a
tool to perturb calcium dynamics in a cell-specific and control-
lable manner that has broad application for other immune
cells. Cell-specific expression of a pharmacologically inducible
calcium channel enables temporal and spatial regulation of cal-
cium influx in live animals. We find that regulated neutrophil cal-
cium flux is required for neutrophil migration and that calcium
enrichment at the leading edge can help direct polarized migra-
tion. These approaches provide a platform for direct in vivo
observation and manipulation of calcium dynamics in specific
immune cell populations.
orts 13, 2107–2117, December 15, 2015 ª2015 The Authors 2107

RESULTS
In Vivo Detection of Leading-Edge Calcium Enrichmentin Migrating NeutrophilsTo examine in vivo calcium dynamics during neutrophil recruit-
ment, we coupled light-sheet microscopy with transgenic zebra-
fish lines expressing the genetically encoded calcium indicator
GCaMP3 specifically in neutrophils. We expressed GCaMP3
specifically in neutrophils using the LysC promoter and gener-
ated Tg(LysC:GCaMP3) transgenic animals (Hall et al., 2007;
Meijer et al., 2008; Oehlers et al., 2015; Tian et al., 2009). We
amputated a small segment of the caudal fin, a well-established
injury assay for inducing a local inflammatory response and
robust neutrophil recruitment (Figure 1A) (Henry et al., 2013).
We employed light-sheet fluorescence microscopy to image
intracellular calcium with high spatial and temporal resolution
in live animals 3 days post-fertilization (3 dpf) (Ahrens et al.,
2013). To avoid artifacts associated with cell movement, we per-
formed ratiometric imaging in animals that carried both GCaMP3
and a cytoplasmic red fluorescent protein, both driven under
the same neutrophil-specific promoter, Tg(LysC:GCaMP3;
LysC:dsRed) (Figure 1A).
Ratiometric analyses of neutrophils migrating toward the
wound site revealed fluctuations in calcium across the migrating
cells through time (Figures 1B and S1; Movie S1, part 1). In
contrast to previous ex vivo observations in neutrophils (Laffafian
and Hallett, 1995), but similar to observations in a macrophage
model (Evans and Falke, 2007), the zone of highest calcium
enrichment was consistently observed at the leading edge of
migrating neutrophils in vivo (Figures 1C, 1D, andS2). Themiddle
of the cell generally displayed the lowest calcium, and the lagging
edge had transient instances of high calcium, but overall showed
only slightly elevatedcalcium levels that did not reach thoseof the
leading edge (Figures 1C, 1D, andS2). Stationary cells from these
same animals failed to show any consistent subcellular calcium
enrichment patterns over time (Figure S3; Movie S1, part 2).
Thus, elevated calcium concentrations at the leading edge are
a notable feature of migrating neutrophils in vivo.
Neutrophils Exhibit Whole-Cell Calcium Flux at WoundSites and during PhagocytosisNeutrophils from Tg(LysC:GCaMP3) larvae also exhibited dra-
matic whole-cell calcium flux once they reached a distance of
�50 mm from the wound. To analyze calcium flux during recruit-
ment, we carried out ventral fin wounding assays (Figure 2A).
Neutrophils migrating toward the wound exhibited whole-cell
calcium flux more often as they approached the site of injury
compared to nearby neutrophils that were stationary (Figures
2B and 2C; Movie S2). The duration and frequency of whole-
cell calcium signals were variable among the migrating neutro-
phils, lasting from �30 s to well over 1 min.
Calcium signaling has also been implicated in phagocytosis
and ensuing downstream responses (Nunes and Demaurex,
2010). We infected Tg(LysC:GCaMP3) larvae with fluorescently
labeled P. aeruginosa and performed high-speed time-lapse im-
aging to capture individual phagocytosis events (Brannon et al.,
2009). We found that larval neutrophils consistently exhibited an
increase in intracellular calcium (lasting �20–30 s) upon phago-
2108 Cell Reports 13, 2107–2117, December 15, 2015 ª2015 The Au
cytosis of P. aeruginosa (Figure 2D; Movie S2, parts 2–4). These
studies highlight the complex nature of calcium signaling in vivo,
as we observed distinct calcium signaling patterns for each
neutrophil activity examined: leading-edge enrichment of cal-
cium during migration, long whole-cell pulses of calcium influx
at close proximity to a wound site, and relatively shorter
whole-cell calcium pulses upon phagocytosis of P. aeruginosa.
Pharmacological Control of Calcium Dynamics inZebrafish Neutrophils via Expression of a MammalianIon ChannelTo assess the functional relevance of these dynamics, we devel-
oped a generalizable method for directly manipulating calcium in
immune cells in vivo. The cation channel TRPV1 is highly perme-
able to calcium,widely studied for its role in nociception, andwas
first identified based on its gating by capsaicin (Caterina et al.,
1997). Administration of capsaicin to transgenic Caenorhabditis
elegans expressing mammalian TRPV1 in specific sensory
neurons can mediate neuronal depolarization (Tobin et al.,
2002). We used the zebrafish LysC promoter to drive rat TRPV1
(rTRPV1) specifically in neutrophils, creating the stable line
Tg(LysC:rTRPV1-tdTomato). The critical amino acid residues
required to confer capsaicin sensitivity to mammalian TRPV1
are not conserved in zebrafish, and wild-type zebrafish exhibit
no behavioral response to capsaicin treatment (Caterina et al.,
1997; Graham et al., 2013; Jordt and Julius, 2002). We found
that intracellular calcium flux was specifically induced in neutro-
phils from Tg(LysC:rTRPV1; LysC:GCaMP3) larvae treated with
capsaicin but was absent if treated with vehicle or in control
larvae lacking the rTRPV1channel andexposed tocapsaicin (Fig-
ures 3A and 3B;Movie S3; data not shown). Prolonged capsaicin
treatment resulted in sustained calcium entry in rTRPV1 positive
neutrophils for up to 60min (Figures 3A and 3B;Movie S3, part 2).
Targeted Perturbation of Calcium Flux InhibitsNeutrophil RecruitmentWe next developed a pulsed capsaicin delivery protocol that
would maximize calcium influx while minimizing any potential
cell death from prolonged depolarization (see Experimental
Procedures). We amputated the caudal fin to induce ne-
utrophil recruitment and then pulsed with capsaicin or vehicle.
2 hr post-wounding (2 hpw), neutrophils in the control
groups (Tg(LysC:dsRed) larvae pulsed with capsaicin or
Tg(LysC:rTRPV1) treated with vehicle) were recruited normally
to the wound (Figures 3C and 3D). However, neutrophils in the
Tg(LysC:rTRPV1) larvae pulsed with capsaicin failed to reach
the wound site (Figures 3C and 3D), suggesting that disrupted
calcium flux is sufficient to perturb recruitment. We also pre-
treated Tg(LysC:rTRPV1) larvae with capsaicin pulses before
amputation and then followed the amputation with a 2-hr treat-
ment in ethanol vehicle. Neutrophils from these pretreated
animals exhibited partial to full recovery, showing that the sup-
pression of neutrophil recruitment after capsaicin treatment is
reversible (Figures 3C and 3D).
Neutrophil recruitment is associated with the immune
response to bacterial infection with P. aeruginosa (Deng et al.,
2013; Yang et al., 2012). We assessed whether the neutrophil-
specific rTRPV1 could modulate neutrophil recruitment to
thors

Figure 1. Calcium Is Enriched at the Leading Edge of Migrating Neutrophils In Vivo
(A) Illustration of a caudal fin amputation (red dotted line) in a double-transgenic larva Tg(LysC:GCaMP3; LysC:dsRed) with the field of view in the red box. White
arrow indicates fin amputation, and white box highlights the neutrophil in the still frames in (B). Scale bar, 50 mm.
(B) Maximum-intensity projections from time-lapse experiments with light-sheet fluorescence microscopy follow a single neutrophil migrating toward wound,
displaying image data from each channel (GCaMP3 or dsRed) and resulting ratiometric image (GCaMP3/dsRed). Arrow indicates overall direction of migration.
t = 0 corresponds to 40 min post-wounding. Scale bar, 10 mm.
(C) Time-averaged calcium activity profile across the length of amigrating neutrophil (normalized relative to direction of migration, where 0 is the lagging edge and
100 is the leading edge). Each neutrophil is graphed in black (n = 15, from four animals) with themean profile (red line), bound by 95%confidence intervals (dashed
red lines).
(D) Left box plot shows the difference between the average calcium signal at the leading and lagging edge (one-fifth of the length) for each neutrophil examined in
(C). Middle line is the median, the box is the middle 50%, and the upper and lower bars indicate data range, with outliers as dots. Calculations were also repeated
using the leading and lagging one-third of each cell (right box plot). Hypothesis that the average difference was positive was tested using a one-sample t test.
See also Figures S1–S3 and Movie S1.
Cell Reports 13, 2107–2117, December 15, 2015 ª2015 The Authors 2109

Figure 2. Neutrophils Undergo Whole-Cell Calcium Flux at Sites of Injury and upon Phagocytosis of Bacteria(A) Cartoon of a ventral fin wound (red notch) and field of view during imaging (red square).
(B) Fluorescent images from a time-lapse following GCaMP3 expression in a neutrophil migrating toward a ventral fin wound in a Tg(LysC:GCaMP3) larva. t = 0
corresponds to 5 min post-wounding. Arrow highlights a single neutrophil as it periodically flashes during migration toward a ventral wound.
(C) Mean number of whole-cell calcium flashes per cell per minute during the first hour post-wounding in migrating neutrophils and stationary neutrophils. Error
bars are mean ± SD. Mann-Whitney test ***p < 0.0001 (n = 15 cells from five larvae for migrating cells, and n = 8 cells from four larvae for stationary cells).
(D) Still frames from time-lapse capturing calcium flash upon LysC:GCaMP3 neutrophil (green) phagocytosis of P. aeruginosa (red). Dotted line surrounds the
phagocytic neutrophil in each frame, and the arrow highlights bacteria that will be phagocytosed. t = 0 corresponds to 30 min post-infection. Scale bars, 10 mm.
Graphs quantify the increase in relative fluorescence intensity from GCaMP3 (F/F0) during phagocytosis of PAO1. Left graph corresponds to the panels above,
and the center and right graphs correspond to additional examples shown in Movie S2, parts 3 and 4, respectively.
See also Movie S2.
2110 Cell Reports 13, 2107–2117, December 15, 2015 ª2015 The Authors

Figure 3. Regulated Calcium Flux Is Required for Neutrophil Recruitment
(A and B) Time-lapse experiment shows no change in GCaMP3 fluorescence in neutrophils from control Tg(LysC:dsRed; LysC:GCaMP3) larva after addition of
capsaicin and increasedGCaMP3 fluorescence in neutrophils from Tg(LysC:rTRPV1; LysC:GCaMP3) larva. (A) Selected still frames showGCaMP fluorescence in
Tg(LysC:rTRPV1; LysC:GCaMP3) larva during extended exposure to capsaicin. t = 0 corresponds to 5 min after addition of capsaicin. Scale bar, 20 mm. (B)
Quantification of the relative GCaMP fluorescence intensity (F/F0) during extended capsaicin treatment (n = 5 neutrophils for each larva). Error bars are mean ±
SD. See also Movie S3.
(C–F) Tg(LysC:rTRPV1; LysC:GCaMP3) or Tg(LysC:dsRed; LysC:GCaMP3) larvaewere wounded (C andD) or infectedwithP. aeruginosa in the hindbrain (E and F)
and briefly pulsed with capsaicin (CAP) or soaked in ethanol (EtOH) for 2 hr before neutrophil recruitment was quantified. Recovery Tg(LysC:rTRPV1; LysC:
GCaMP3) larvae were pulsed with CAP before wounding, followed by EtOH soak for 2 hr to assess neutrophil recovery after capsaicin treatment (C and D).
(C) Representative maximum-intensity projections show red-fluorescent neutrophils merged with bright field at 2 hr post-wounding. (E) Representative
maximum-intensity projections show red-fluorescent neutrophils and green-fluorescent P. aeruginosa at 2 hr post-infection within the hindbrain ventricle outlined
by white dashed line. Scale bars, 100 mm. (D and F) Graphs display the number of neutrophils recruited for each larva. Error bars are mean ± SD. Kruskal-Wallis
test followed by Dunn’smultiple comparison test: ****, adjusted p < 0.0001; ***, adjusted p = 0.0002; and *, adjusted p = 0.014. Each experiment was carried out at
least twice.
Cell Reports 13, 2107–2117, December 15, 2015 ª2015 The Authors 2111

Figure 4. A Capsaicin Gradient Directs rTRPV1-Neutrophil Motility(A) Injecting capsaicin (red) into surrounding agarose generates an intracellular calcium gradient (green) in neutrophils expressing rTRPV1 channels (blue lines).
R indicates the reference point, defined as the initial point source of the gradient. Three experimental groups were imaged: Tg(LysC:dsRed; LysC:GCaMP3) larvae
in a capsaicin gradient (dsRed+CAP), Tg(LysC:rTRPV1; LysC:GCaMP3) larvae in an ethanol gradient (rTRPV1+EtOH), or capsaicin gradient (rTRPV1+CAP).
(B) Last frames fromMovie S4 show the tracks of individual neutrophils from each experimental group (quantified in D and E) relative to the reference point R at the
focal point of the gradient.
(C) (x,y) coordinates for each neutrophil at every frame tracked within the Tg(LysC:rTRPV1) larvae exposed to a capsaicin gradient visually illustrate the directed
motion toward the source. The track for each cell was normalized such that the starting (x,y) position was (0,0) for every cell. All units are mm. One larva from the
(legend continued on next page)
2112 Cell Reports 13, 2107–2117, December 15, 2015 ª2015 The Authors

sites of infection. We infected Tg(LysC:rTRPV1) animals
with P. aeruginosa in the hindbrain ventricle, an epithelial-lined
compartment normally devoid of leukocytes, and quantified
the number of neutrophils recruited 2 hr post-infection
(2 hpi) (Figures 3E and 3F). Neutrophil recruitment to the
P. aeruginosa-filled hindbrain was normal in both control groups
but severely impaired in capsaicin-pulsed Tg(LysC:rTRPV1)
larvae (Figures 3E and 3F). Thus, in both sterile inflammation
and bacterial infection, excess calcium flux through capsaicin-
gated rTRPV1 prevents normal neutrophil recruitment.
Generation of a Capsaicin Gradient Drives DirectedNeutrophil MigrationWe next tested whether the observed calcium enrichment at the
leading edge of neutrophils could instruct neutrophil movement
in vivo. We sought to generate an intracellular calcium gradient
by producing a directional capsaicin gradient, based on potential
bias for channel gating on the side of the cell that first experi-
ences an effective concentration of ligand (Figure 4A). We
embedded Tg(LysC:rTRPV1) larvae in agarose and injected
capsaicin proximal to the caudal fin. We observed sequential
caudal to rostral fluorescence increases in GCaMP3-expressing
neutrophils along the tail of Tg(LysC:rTRPV1; LysC:GCaMP3)
larvae, suggesting that we could generate a gradient in the
context of embedded larvae (Movie S4, part 1). However, the
rapid neutrophil depolarization we observed with the high-dose
gradient was incompatible with the slower time frame of endog-
enous neutrophil migration. Thus, we developed a lower-dose
capsaicin gradient to attempt to experimentally induce leading-
edge calcium enrichment in the absence of endogenous stimuli
(Figure 4A).
The lower-dose capsaicin gradient had no effect on neutrophil
migration in either control group (Tg(LysC:dsRed) plus a capsa-
icin gradient or Tg(LysC: rTRPV1) plus an ethanol gradient)
(Figures 4B and S4; Movie S4). However, upon exposure to a
capsaicin gradient, neutrophils expressing the rTRPV1 transgene
migrated in amore directed trajectory toward the source (Figures
4B–4E; Movie S4), in the absence of any other stimulus. In com-
parison to controls, neutrophils in Tg(LysC:rTRPV1) animals trav-
eled greater distances along straighter paths toward the highest
point source of capsaicin (Figures 4D and 4E; Movie S4, parts 2–
4). rTRPV1-neutrophils exhibited greater directionality toward the
capsaicin gradient, but their mean velocities and total distances
traveled were similar to those quantified from neutrophils in the
control groups (Figures S4D and S4E). The similar velocities for
random and directed neutrophil migration are consistent with
previous recordings during baseline motility in interstitial tissue
compared with chemotaxis toward a wound site (Yoo et al.,
2010, 2011). Importantly, when we moved the point source of
the capsaicin to the ventral side of the larva,migrating neutrophils
rTRPV1 + CAP group was assessed after exposure to a ventrally centered gradien
highlighted with red arrows.
(D and E) Graphs show the final distance traveled toward the reference point (D
(D) Kruskal-Wallis test followed by Dunn’smultiple comparison test: *, adjusted p =
multiple comparisons test: **, adjusted p value = 0.0052 for dsRed+ CAP vers
rTRPV1+CAP. For each group, n R 30 cells from R10 larvae.
See also Figure S4 and Movie S4.
Cell Rep
were redirected toward the new source, illustrating that the
capsaicin gradient itself may help to define the direction ofmigra-
tion of rTRPV1-expressing neutrophils, even in the absence of
any other stimuli (Figure S4C; Movie S4, part 5).
Calcium Channels Influence Directed NeutrophilMotilityWe next asked, via a reciprocal loss-of-function approach,
whether calcium influx is required for chemotaxis in vivo. The cal-
cium channel antagonist SKF 96365 displays activity against
multiple calcium channels, including TRP channels and
voltage-gated calcium channels (Harteneck et al., 2011; Merritt
et al., 1990). Application of 20 mM SKF 96365 to whole animals
after caudal fin amputations compromised neutrophil recruit-
ment (Figure 5A). We next modified these experiments, allowing
a 30-min window after injury for chemotactic gradients to be es-
tablished before applying the calcium channel antagonist, a time
frame in which neutrophils have already begun tomigrate toward
the wound site (Niethammer et al., 2009; Movie S5). Neutrophils
from larvae treated at these later time points were also compro-
mised for recruitment, suggesting acute effects of the antagonist
on neutrophil directional motility (Figure 5B).
To determine how limiting calcium influx acutely affects
neutrophil behavior in vivo, we carried out detailed time-lapse
microscopy and tracking in fin-amputated Tg(LysC:GFP) larvae.
In a result consistent with the capsaicin gradient experiments,
neutrophils in SKF 96365-treated larvae showed normal motility,
traveling similar distances at similar velocities as control neutro-
phils (Figure 5C; Movie S5). However, administration of the
calcium channel antagonist resulted in compromised direc-
tionality, with most neutrophils in treated animals exhibiting
wandering, undirected patterns of migration (Figures 5C and
5D; Movie S5).
DISCUSSION
Direct recording of intracellular calcium concentrations [Ca2+]i in
migrating neutrophils was previously limited to ex vivo analyses
(Boucek and Snyderman, 1976; Laffafian and Hallett, 1995;
Marks and Maxfield, 1990; Sawyer et al., 1985), and observa-
tions have ranged from transient whole-cell flux to leading-
edge calcium enrichment to no change in calcium flux at all
(Laffafian and Hallett, 1995; Marks and Maxfield, 1990; Sawyer
et al., 1985).
Using light-sheet microscopy and ratiometric imaging, we
found enrichment of calcium at the leading edge of migrating
neutrophils. This description is different from the high-resolution
studies on calcium flux patterns in cultured chemotactic endo-
thelial cells and fibroblasts, where there is high [Ca2+]i at the lag-
ging edge and a low calcium concentration at the leading edge
t along the bottom of the animal and the three tracked cells from that animal are
), and straightness ratio (E) for tracked neutrophils. Error bars are mean ± SD.
0.012 and **, adjusted p value = 0.0075. (E) One-way ANOVA followed Tukey’s
us rTRPV1+CAP and **, adjusted p value = 0.005 for rTRPV1+ EtOH versus
orts 13, 2107–2117, December 15, 2015 ª2015 The Authors 2113

Figure 5. Inhibition of Calcium Channels Disrupts Neutrophil Directionality during Recruitment
(A–D) After caudal fin amputation, Tg(LysC:GFP) or Tg(LysC:dsRed) larvae were immediately treated with vehicle alone (control) or 20 mM SKF 96365 (SKF),
followed by quantification of neutrophil recruitment 3 hr post-wounding (A and B). (A) Error bars are mean ± SD. Mann-Whitney test ****p < 0.0001. (B) Groups of
larvae were placed in control treatments for 10, 20, or 30 min before replacement of media with SKF for the remainder. Error bars are mean ± SD. One-way
ANOVA followed by Tukey’s multiple comparisons test ***p < 0.001. Each experiment was carried out at least twice. (C and D) Immediately after wounding, larvae
were mounted in agarose, immersed with either control or SKF, then imaged with time-lapse microscopy. (C) For the neutrophils tracked, graphs show their total
distance traveled, average velocity, and straightness ratio. Total distance and straightness ratio error bars are mean ± SD, and average velocity error bars are
mean ± SEM. t test, ***p = 0.0002. For each group, n = 8 cells from two to three larvae. (D) Final frames from Movie S5 show the tracks of individual neutrophils
(quantified in C) near the amputated fin (approximated by the white line). See also Movie S5.
2114 Cell Reports 13, 2107–2117, December 15, 2015 ª2015 The Authors

punctuated with periodic sparks of localized [Ca2+]i (Tsai et al.,
2014; Wei et al., 2009). In vivo analysis of neutrophils also
showed moderately increased [Ca2+]i at the lagging edge, but
the highest calcium signal was found at the leading edge. One
unique feature of the neutrophils studied here was their fast
pace. In vivo, chemotactic neutrophils moved at velocities up
to 70 times greater than those recorded in the cited cell culture
studies with other cell types.
The leading edge has been molecularly defined by a signaling
cascade that translates an extracellular chemokine gradient into
cytoskeletal rearrangements that promote movement (Falke and
Ziemba, 2014). Many factors enriched at the leading edge of
migrating cells also have direct or indirect associations with cal-
cium, including phosphoinositide 3-kinases (PI3Ks) and PKCa
(Ching et al., 2001; Evans and Falke, 2007; Hsu et al., 2000; Vos-
sebeld et al., 1997). PI3K activity has been localized to the lead-
ing edge of mouse neutrophils in cell culture and in zebrafish
neutrophils in vivo, while PKCa is enriched at the leading edge
of polarizedmurinemacrophages (Evans and Falke, 2007; Nishio
et al., 2007; Yoo et al., 2010). In macrophages, it has been hy-
pothesized that a leading-edge calcium signal plays a role in
directional control of cell migration (Evans and Falke, 2007; Falke
and Ziemba, 2014).
The role of calcium signaling in immune cell phagocytosis and
post-phagocytic vacuole trafficking has also generated conflict-
ing results depending on the model system employed (Dewitt
and Hallett, 2002; Jaconi et al., 1990; Lew et al., 1985; Marks
and Maxfield, 1990; Murata et al., 1987; Nunes and Demaurex,
2010; Sawyer et al., 1985). We have been able to directly image
these dynamics in vivo. The transient rise in [Ca2+]i as
P. aeruginosa is phagocytosed is similar to that observed for
cultured human neutrophils phagocytosing opsonized antigens
(Marks and Maxfield, 1990; Murata et al., 1987). The establish-
ment of an in vivo model system for studying calcium dynamics
during neutrophil phagocytosis should motivate greater under-
standing of how receptor-mediated phagocytosis of bacterial
pathogens in animal models compares with cell culture models
of opsonized antigens. These methods allow in vivo analysis of
calcium flux in single immune cells for hours at high frame rates.
Although many regulators of calcium are used broadly in cell
culture, they are largely incompatible with administration in a
live organism. Cell-specific expression of TRPV1 provides a
generalizable in vivo method to manipulate calcium dynamics
in targeted immune cell subtypes. The rTRPV1-capsaicin system
is pharmacologically inducible, titratable, and relatively sensitive
to small variations, allowing for in vivo manipulation of subcellu-
lar calcium. By applying a low-dose capsaicin gradient across
immobilized zebrafish larvae, neutrophils expressing the capsa-
icin-activated channel rTRPV1 were stimulated to move in the
direction of the gradient. Asymmetric influx of calcium may be
a key event in cell migration and may facilitate definition of the
leading edge of some chemotactic cells. Additionally, we used
a pharmacological loss-of-function approach to demonstrate
an acute requirement for calcium channels in defining neutrophil
directionality during an endogenous wounding response. Both
the gain-of-function and loss-of-function manipulations of cal-
cium influx resulted in reciprocal changes in directionality, but
overall velocity remained largely unaffected, suggesting that
Cell Rep
leading-edge calcium may be an important component of a
neutrophil compass (Falke and Ziemba, 2014).
In summary, we have found that, in vivo, migrating neutrophils
exhibit enriched calcium flux at the leading edge and that this
pattern of intracellular calcium helps define the direction of
movement. In addition, we describe a generalizable method for
manipulating calcium directly in specific immune cells in vivo.
The rTRPV1-capsaicin system requires no additional co-factors
or prior knowledge of the functional endogenous calcium chan-
nels, thereby making it widely applicable as a method of interro-
gating the role of calcium signaling in many different cell types in
whole animals.
EXPERIMENTAL PROCEDURES
Zebrafish Strains
All zebrafish husbandry and experimental protocols were performed in com-
pliance with policies approved by the Duke University Institutional Animal Care
and Use Committee. The transgenic lines Tg(LysC:GCaMP3xt1) and
Tg(LysC:rTRPV1-tdTomatoxt4) were made by injecting transposase mRNA and
Tol2 containing DNA constructs into single-cell embryos, with additional details
provided in Supplemental Experimental Procedures. Tg(LysC:dsRednz50) and
Tg(LysC:GFPnz117) have been described elsewhere (Hall et al., 2007).
Time-Lapse Imaging
Tg(LysC:GCaMP3) larvae were imaged at 2 dpf for bacterial infection experi-
ments, and all other transgenic larvae were imaged at 3 dpf. For microscopy,
larvae were anesthetized in 0.016% Tricaine (MS-222) and immobilized in 1%
low-melting-point agarose and imaged with a SiMViewmicroscope (light-sheet
microscopy), a Zeiss axio observer Z1, or Nikon TE-2000U. Additional experi-
mental details are provided in Supplemental Experimental Procedures.
Infections and Bacterial Preparations
P. aeruginosa (PAO1) carrying a constitutively expressed mCherry or GFP
plasmid was grown in LB media supplemented with carbenicillin (200 mg/ml)
as previously described in (Brannon et al., 2009) and detailed in Supplemental
Experimental Procedures.
Quantitation of Calcium Flashes and Ratiometric Analyses
Light-sheet microscopy images were analyzed using maximum projections
with background fluorescence subtracted. Details of ratiometric analyses
are supplied in Supplemental Experimental Procedures. Whole-cell calcium
flashes were quantified by manually scoring cells that displayed a notable in-
crease in green fluorescence during the time-lapse session.
Capsaicin and SKF 96365 Treatments
The final working capsaicin (Sigma) concentration was 20 mM in 1.4% ethanol.
Capsaicin gradient experiments were carried out by injecting 100 mM capsa-
icin into the agarose, adjacent to the mounted larvae, followed by time-lapse
microscopy. 10 mM SKF 96365 (Cayman Chemical) stock was made freshly
in DMSO for each experiment. The final concentration was 20 mM SKF
96365 in 0.5% DMSO. See Supplemental Experimental Procedures for addi-
tional details.
SUPPLEMENTAL INFORMATION
Supplemental Information includes Supplemental Experimental Procedures,
four figures, and five movies and can be found with this article online at
http://dx.doi.org/10.1016/j.celrep.2015.11.010.
ACKNOWLEDGMENTS
We thank Misha Ahrens, Sam Johnson, Wolfgang Liedtke, and Chao-Tsung
Yang for helpful discussions and technical advice and support; Jorg Grandl,
orts 13, 2107–2117, December 15, 2015 ª2015 The Authors 2115
Wolfgang Liedtke, Sam Moskowitz, and John Rawls for reagents and con-
structs; Jason Comparetto for assistance with video compilations; and Mark
Cronan, Allison Rosenberg, and Jorn Coers for helpful discussions and critical
comments on the manuscript. This work was supported by the Howard
Hughes Medical Institute Janelia Visitor Program, a National Science Founda-
tion Graduate Research Fellowship (M.A.M.), the Duke University Center for
AIDS Research, an NIH-funded program (5P30 AI064518), and a Mallinckrodt
Scholar Award, a Searle Scholar Award, a Vallee Foundation Young Investi-
gator Award, and an NIH Director’s New Innovator Award 1DP2-OD008614
(D.M.T.).
Received: July 11, 2015
Revised: September 21, 2015
Accepted: October 30, 2015
Published: December 3, 2015
REFERENCES
Ahrens, M.B., Orger, M.B., Robson, D.N., Li, J.M., and Keller, P.J. (2013).
Whole-brain functional imaging at cellular resolution using light-sheet micro-
scopy. Nat. Methods 10, 413–420.
Boucek, M.M., and Snyderman, R. (1976). Calcium influx requirement for hu-
man neutrophil chemotaxis: inhibition by lanthanum chloride. Science 193,
905–907.
Brannon, M.K., Davis, J.M., Mathias, J.R., Hall, C.J., Emerson, J.C., Crosier,
P.S., Huttenlocher, A., Ramakrishnan, L., and Moskowitz, S.M. (2009). Pseu-
domonas aeruginosa Type III secretion system interacts with phagocytes to
modulate systemic infection of zebrafish embryos. Cell. Microbiol. 11,
755–768.
Cambier, C.J., Takaki, K.K., Larson, R.P., Hernandez, R.E., Tobin, D.M.,
Urdahl, K.B., Cosma, C.L., and Ramakrishnan, L. (2014). Mycobacteria manip-
ulate macrophage recruitment through coordinated use of membrane lipids.
Nature 505, 218–222.
Caterina, M.J., Schumacher, M.A., Tominaga, M., Rosen, T.A., Levine, J.D.,
and Julius, D. (1997). The capsaicin receptor: a heat-activated ion channel in
the pain pathway. Nature 389, 816–824.
Ching, T.T., Hsu, A.L., Johnson, A.J., and Chen, C.S. (2001). Phosphoinositide
3-kinase facilitates antigen-stimulated Ca(2+) influx in RBL-2H3 mast cells via
a phosphatidylinositol 3,4,5-trisphosphate-sensitive Ca(2+) entry mechanism.
J. Biol. Chem. 276, 14814–14820.
Clatworthy, A.E., Lee, J.S., Leibman,M., Kostun, Z., Davidson, A.J., and Hung,
D.T. (2009). Pseudomonas aeruginosa infection of zebrafish involves both host
and pathogen determinants. Infect. Immun. 77, 1293–1303.
Deng, Q., Sarris, M., Bennin, D.A., Green, J.M., Herbomel, P., and Hutten-
locher, A. (2013). Localized bacterial infection induces systemic activation of
neutrophils through Cxcr2 signaling in zebrafish. J. Leukoc. Biol. 93, 761–769.
Dewitt, S., and Hallett, M.B. (2002). Cytosolic free Ca(2+) changes and calpain
activation are required for beta integrin-accelerated phagocytosis by human
neutrophils. J. Cell Biol. 159, 181–189.
Evans, J.H., and Falke, J.J. (2007). Ca2+ influx is an essential component of
the positive-feedback loop that maintains leading-edge structure and activity
in macrophages. Proc. Natl. Acad. Sci. USA 104, 16176–16181.
Falke, J.J., and Ziemba, B.P. (2014). Interplay between phosphoinositide lipids
and calcium signals at the leading edge of chemotaxing ameboid cells. Chem.
Phys. Lipids 182, 73–79.
Graham, D.M., Huang, L., Robinson, K.R., and Messerli, M.A. (2013).
Epidermal keratinocyte polarity and motility require Ca2+ influx through
TRPV1. J. Cell Sci. 126, 4602–4613.
Grienberger, C., and Konnerth, A. (2012). Imaging calcium in neurons. Neuron
73, 862–885.
Hall, C., Flores, M.V., Storm, T., Crosier, K., and Crosier, P. (2007). The zebra-
fish lysozyme C promoter drives myeloid-specific expression in transgenic
fish. BMC Dev. Biol. 7, 42.
2116 Cell Reports 13, 2107–2117, December 15, 2015 ª2015 The Au
Harteneck, C., Klose, C., and Krautwurst, D. (2011). Synthetic modulators of
TRP channel activity. Adv. Exp. Med. Biol. 704, 87–106.
Harvie, E.A., and Huttenlocher, A. (2015). Neutrophils in host defense: new in-
sights from zebrafish. J. Leukoc. Biol. 98, 523–537.
Henry, K.M., Loynes, C.A., Whyte, M.K., and Renshaw, S.A. (2013). Zebrafish
as a model for the study of neutrophil biology. J. Leukoc. Biol. 94, 633–642.
Hsu, A.L., Ching, T.T., Sen, G., Wang, D.S., Bondada, S., Authi, K.S., and
Chen, C.S. (2000). Novel function of phosphoinositide 3-kinase in T cell
Ca2+ signaling. A phosphatidylinositol 3,4,5-trisphosphate-mediated Ca2+
entry mechanism. J. Biol. Chem. 275, 16242–16250.
Jaconi, M.E., Lew, D.P., Carpentier, J.L., Magnusson, K.E., Sjogren, M., and
Stendahl, O. (1990). Cytosolic free calcium elevation mediates the phago-
some-lysosome fusion during phagocytosis in human neutrophils. J. Cell
Biol. 110, 1555–1564.
Jordt, S.E., and Julius, D. (2002). Molecular basis for species-specific sensi-
tivity to ‘‘hot’’ chili peppers. Cell 108, 421–430.
Keller, P.J., Ahrens, M.B., and Freeman, J. (2015). Light-sheet imaging for
systems neuroscience. Nat. Methods 12, 27–29.
Laffafian, I., and Hallett, M.B. (1995). Does cytosolic free Ca2+ signal neutro-
phil chemotaxis in response to formylated chemotactic peptide? J. Cell Sci.
108, 3199–3205.
Lew, D.P., Andersson, T., Hed, J., Di Virgilio, F., Pozzan, T., and Stendahl, O.
(1985). Ca2+-dependent and Ca2+-independent phagocytosis in human neu-
trophils. Nature 315, 509–511.
Marks, P.W., and Maxfield, F.R. (1990). Transient increases in cytosolic free
calcium appear to be required for themigration of adherent human neutrophils.
J. Cell Biol. 110, 43–52.
Meijer, A.H., van der Sar, A.M., Cunha, C., Lamers, G.E., Laplante, M.A.,
Kikuta, H., Bitter, W., Becker, T.S., and Spaink, H.P. (2008). Identification
and real-time imaging of a myc-expressing neutrophil population involved in
inflammation and mycobacterial granuloma formation in zebrafish. Dev.
Comp. Immunol. 32, 36–49.
Merritt, J.E., Armstrong, W.P., Benham, C.D., Hallam, T.J., Jacob, R., Jaxa-
Chamiec, A., Leigh, B.K., McCarthy, S.A., Moores, K.E., and Rink, T.J.
(1990). SK&F 96365, a novel inhibitor of receptor-mediated calcium entry. Bio-
chem. J. 271, 515–522.
Murata, T., Sullivan, J.A., Sawyer, D.W., and Mandell, G.L. (1987). Influence of
type and opsonization of ingested particle on intracellular free calcium distri-
bution and superoxide production by human neutrophils. Infect. Immun. 55,
1784–1791.
Niethammer, P., Grabher, C., Look, A.T., and Mitchison, T.J. (2009). A tissue-
scale gradient of hydrogen peroxide mediates rapid wound detection in zebra-
fish. Nature 459, 996–999.
Nishio, M., Watanabe, K., Sasaki, J., Taya, C., Takasuga, S., Iizuka, R.,
Balla, T., Yamazaki, M., Watanabe, H., Itoh, R., et al. (2007). Control of
cell polarity and motility by the PtdIns(3,4,5)P3 phosphatase SHIP1. Nat.
Cell Biol. 9, 36–44.
Nunes, P., and Demaurex, N. (2010). The role of calcium signaling in phagocy-
tosis. J. Leukoc. Biol. 88, 57–68.
Oehlers, S.H., Cronan, M.R., Scott, N.R., Thomas, M.I., Okuda, K.S., Wal-
ton, E.M., Beerman, R.W., Crosier, P.S., and Tobin, D.M. (2015). Interception
of host angiogenic signalling limits mycobacterial growth. Nature 517,
612–615.
Phennicie, R.T., Sullivan, M.J., Singer, J.T., Yoder, J.A., and Kim, C.H. (2010).
Specific resistance to Pseudomonas aeruginosa infection in zebrafish is medi-
ated by the cystic fibrosis transmembrane conductance regulator. Infect.
Immun. 78, 4542–4550.
Renshaw, S.A., and Trede, N.S. (2012). A model 450 million years in the mak-
ing: zebrafish and vertebrate immunity. Dis. Model. Mech. 5, 38–47.
Sawyer, D.W., Sullivan, J.A., and Mandell, G.L. (1985). Intracellular free
calcium localization in neutrophils during phagocytosis. Science 230,
663–666.
thors

Tian, L., Hires, S.A., Mao, T., Huber, D., Chiappe, M.E., Chalasani, S.H., Pet-
reanu, L., Akerboom, J., McKinney, S.A., Schreiter, E.R., et al. (2009). Imaging
neural activity in worms, flies and mice with improved GCaMP calcium indica-
tors. Nat. Methods 6, 875–881.
Tobin, D., Madsen, D., Kahn-Kirby, A., Peckol, E., Moulder, G., Barstead, R.,
Maricq, A., and Bargmann, C. (2002). Combinatorial expression of TRPV chan-
nel proteins defines their sensory functions and subcellular localization in C.
elegans neurons. Neuron 35, 307–318.
Tsai, F.C., Seki, A., Yang, H.W., Hayer, A., Carrasco, S., Malmersjo, S., and
Meyer, T. (2014). A polarized Ca2+, diacylglycerol and STIM1 signalling sys-
tem regulates directed cell migration. Nat. Cell Biol. 16, 133–144.
Tsien, R.Y. (1980). New calcium indicators and buffers with high selectivity
against magnesium and protons: design, synthesis, and properties of proto-
type structures. Biochemistry 19, 2396–2404.
Vossebeld, P.J., Homburg, C.H., Schweizer, R.C., Ibarrola, I., Kessler, J.,
Koenderman, L., Roos, D., and Verhoeven, A.J. (1997). Tyrosine phosphoryla-
tion-dependent activation of phosphatidylinositide 3-kinase occurs upstream
of Ca2+-signalling induced by Fcgamma receptor cross-linking in human neu-
trophils. Biochem. J. 323, 87–94.
Cell Rep
Walters, K.B., Green, J.M., Surfus, J.C., Yoo, S.K., and Huttenlocher, A. (2010).
Live imaging of neutrophil motility in a zebrafish model of WHIM syndrome.
Blood 116, 2803–2811.
Wei, C., Wang, X., Chen, M., Ouyang, K., Song, L.S., and Cheng, H. (2009).
Calcium flickers steer cell migration. Nature 457, 901–905.
Wei, C., Wang, X., Zheng, M., and Cheng, H. (2012). Calcium gradients under-
lying cell migration. Curr. Opin. Cell Biol. 24, 254–261.
Yang, C.T., Cambier, C.J., Davis, J.M., Hall, C.J., Crosier, P.S., and Ramak-
rishnan, L. (2012). Neutrophils exert protection in the early tuberculous
granuloma by oxidative killing of mycobacteria phagocytosed from infected
macrophages. Cell Host Microbe 12, 301–312.
Yoo, S.K., Deng, Q., Cavnar, P.J., Wu, Y.I., Hahn, K.M., and Huttenlocher, A.
(2010). Differential regulation of protrusion and polarity by PI3K during neutro-
phil motility in live zebrafish. Dev. Cell 18, 226–236.
Yoo, S.K., Starnes, T.W., Deng, Q., and Huttenlocher, A. (2011). Lyn is a redox
sensor that mediates leukocyte wound attraction in vivo. Nature 480, 109–112.
orts 13, 2107–2117, December 15, 2015 ª2015 The Authors 2117

Cell Reports
Supplemental Information
Direct In Vivo Manipulation and Imaging
of Calcium Transients in Neutrophils Identify
a Critical Role for Leading-Edge Calcium Flux
Rebecca W. Beerman, Molly A. Matty, Gina G. Au, Loren L. Looger, Kingshuk Roy
Choudhury, Philipp J. Keller, and David M. Tobin

Supplemental Figures
Figure S1 (Relates to Figure 1). Calcium activity profiles from a migrating neutrophil. (A) The migrating cell was sectioned into 25 parts across its length (1-100 units), such that L=4 (the upper left hand box) displays the average GCaMP3/dsRed signal (y axis) across time (x axis,
Migratory Cell
Time (min)
Rat
io (G
CaM
P3/
dsR
ed)
Figure S1A
B
0100

minutes) within the lagging edge of the cell and L=100 corresponds to the leading edge of the migrating cell. This profile corresponds to the cell images in Figure 1. (B) Example of defining cell length at time t for ratiometric quantitation described in the Supplemental Experimental Procedures. The red arrow indicates the direction of motion, passing through the centroid of the cell (blue circle). The back of the cell is distance d = 0 on the line and front of the cell is d = 100. Calcium expression from all points in the cell is mapped to the nearest point on the line.

Figure S2 (Relates to Figure 1). Detailed analysis of calcium activity profile from a migrating neutrophil. The top image of a cell illustrates how the boxes L=4, 20, 36, 52, 68, 84, and 100 from Figure S1 were rotated, stretched, and magnified to highlight the enriched calcium flux at the leading edge, and to a lesser extent the lagging edge over time. The y axis is time (min) and the x axis is the GCaMP3/dsRed ratio oriented such that the turquoise line shows a visual threshold of the ratio at 15 and the dark-blue line shows a visual threshold of the ratio at 10. The time-lapse ratiometric cell images on the left correspond approximately to the time axis on the calcium activity profiles to provide a visual readout of the quantified signal graphed adjacently.
5 10 15 20
13:16
1:02
2:02
0:02
3:04
4:02
4:59
6:01
7:00
8:02
8:59
10:02
11:00
11:59
12:59
FrontBack
0 min
10 min
5 min
Figure S21:59

Figure S3 (Relates to Figure 1). Stationary neutrophils do not exhibit a distinguishable pattern of calcium localization. (A) Still frames from time-lapse microscopy show a stationary neutrophil in a Tg(LysC:GCaMP3; LysC:dsRed) larva after a caudal fin wound. Each channel was captured
Sta
ndar
dize
d ac
tivity
Figure S3
A B
C
GCaMP3 dsRed Ratio
0
8
14
202:00
4:00
6:00
0
-2
-3
-1
0
1
2
3
4
20 40 60 80 100Normalized cell length
Time averaged calcium activity profile
Time (min)
Rat
io (G
CaM
P3/
dsR
ed)

sequentially (GCaMP3 or dsRed) and the resulting ratiometric image is GCaMP3/dsRed. t=0 corresponds to approximately 40 min post wounding. The scale bar is 10µm. (B) Summary graph displays the time-averaged calcium activity profile across the length of a stationary neutrophil (normalized to 100 units at each frame; 0 is edge most distal to wound and 100 is edge most proximal to the wound). Each individual neutrophil is graphed in black (n=11 from 5 animals) with the average profile outlined in red and bound by the 95% confidence intervals (dashed red lines). (C) Calcium activity profiles from stationary neutrophil in (A). The stationary cell was sectioned into 25 parts across its length (1-100 units), such that L=4 (the upper left hand box) displays the average GCaMP3/dsRed signal (y axis) across time (x axis, minutes) within the left-most (distal to wound) edge of the cell and L=100 corresponds to the right-most (proximal to wound) edge of the stationary cell.
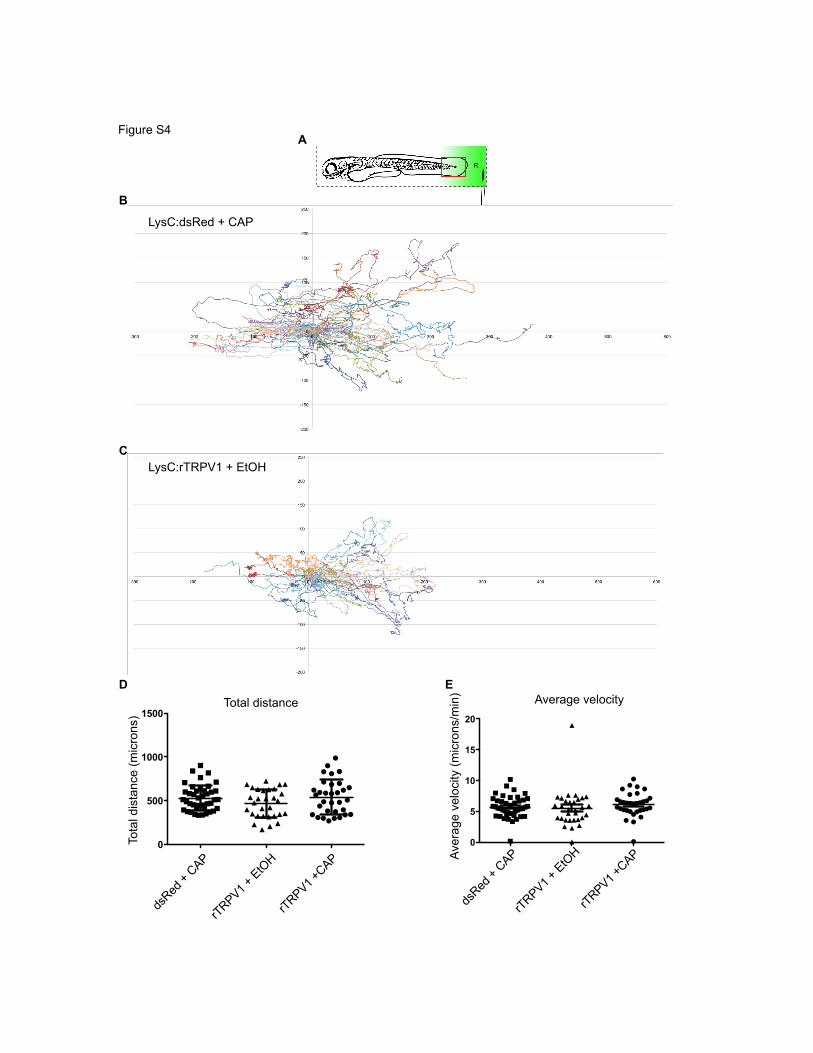
Figure S4A
B
R
C
LysC:dsRed + CAP
LysC:rTRPV1 + EtOH
DE
dsRed
+ CAP
rTRPV1 + EtO
H
rTRPV1 +CAP
dsRed
+ CAP
rTRPV1 + EtO
H
rTRPV1 +CAP
Average velocityTotal distance
Tota
l dis
tanc
e (m
icro
ns)
Aver
age
velo
city
(mic
rons
/min
)
0
5
10
15
20
E
0
500
1000
1500

Figure S4 (Relates to Figure 4). Neither low-dose capsaicin gradient alone nor rTRPV1 transgene alone is sufficient to alter neutrophil migratory behavior. (A) Cartoon depicting larval orientation. The red box approximates where the tracks on the graph below would superimpose onto the larvae analyzed in Figure 4 and Figure S4. (B,C) (x,y) coordinates for each neutrophil at every time-point tracked. The track for each cell was normalized such that the starting (x,y) position was (0,0) for every cell. The unit of measurement on the axes is microns. (D,E) Graphs show no difference in the average distance (D) or average velocity (E) for tracked neutrophils amongst all three experimental groups. Error bars are mean ± s.d. (D) and mean ± s.e.m (E).

Supplemental Movie Legends Movie S1 (Relates to Figures 1A and S3A). Excerpts from ratiometric time-lapse of migrating neutrophil (Part 1) and stationary neutrophil (Part 2). Tg(LysC:GCaMP3; LysC:dsRed) larvae after caudal fin amputation. Colorimetric scale is the same as referenced figures. Movie S2 (Relates to Figures 2A and 2C). Excerpts from time-lapse of neutrophils migrating toward a ventral fin wound in Tg(LysC:GCaMP3) larva (Part 1) and calcium flashes upon neutrophil phagocytosis of P.aeruginosa-mCherry in Tg(LysC:GCaMP3) larvae (Parts 2-4). There is a pause for manual re-focusing between 20:20 and 20:35 in Part 1. Parts 2-4: There are three different examples of phagocytosis, Parts 2 and 3 follow different neutrophils within the same animal and Part 4 follows a neutrophil within a different animal. Movie S3 (Relates to Figure 3A). Time-lapse microscopy shows GCaMP3 fluorescence in control Tg(LysC:dsRed; LysC:GCaMP3) larva (Part 1) and Tg(LysC:rTRPV1; LysC:GCaMP3) larva (Part 2) after addition of capsaicin. Movie S4 (Relates to Figure 4). Part 1 shows a Tg(LysC:rTRPV1; LysC:GCaMP3) larva embedded in agarose after exposure to a high-dose capsaicin gradient and Parts 2-5 show neutrophil migratory responses to low-dose capsaicin and vehicle gradients. (Part 1) The time-lapse shows GCaMP3 fluorescence increasing in a caudal to rostral pattern after injecting a high-dose of capsaicin into the agarose proximal to the caudal fin (right-hand side). (Parts 2-5) Examples of neutrophil tracking with the following strains and conditions (real-time duration for each time-lapse was 1.5 hr): Tg(LysC:dsRed; LysC:GCaMP3) (Part 2) and Tg(LysC:rTRPV1; LysC:GCaMP3) (Parts 4,5) were treated with low-dose capsaicin gradients and Tg(LysC:rTRPV1; LysC:GCaMP3) (Part 3) was treated with an ethanol gradient. R designates the reference point closest to the gradient focal point. Part 5 depicts neutrophil migration in an Tg(LysC:dsRed; LysC:GCaMP3) animal with a ventrally located capsaicin gradient, reference point (R). Movie S5 (Relates to Figure 5). Neutrophil motility in amputated larvae under control or SKF 96365 treatment. Time-lapse shows GFP fluorescence with a representative Tg(LysC:GFP) larva treated with DMSO-vehicle control water (top) or 20µM SKF 96365 (bottom) after caudal fin amputation. Each neutrophil track is a different color, the white dashed line approximately indicates the amputation, and the real-time duration for each time-lapse was 1 hr.

Supplemental Experimental Procedures Zebrafish strains. All zebrafish husbandry and experimental protocols were performed in compliance with policies approved by the Duke University Institutional Animal Care and Use Committee. The transgenic lines Tg(LysC:GCaMP3xt1) and Tg(LysC:rTRPV1-tdTomatoxt4), were made by injecting transposase mRNA (25ng/µl) (from p3T3, transcribed with MEGAscript T3 kit, Life Technologies) and Tol2 containing DNA constructs (50ng/µl) into single cell embryos (background, *AB). The constructs were assembled with Tol2kit reagents and Gateway Cloning methods (Life Technologies) (Kwan et al., 2007). The 5’ LysC promoter element has been previously described (Hall et al., 2007; Oehlers et al., 2015). The middle elements were generated via PCR amplification of plasmids containing GCaMP3 (Tian et al., 2009) or rat TRPV1 (rTRPV1) (Grandl et al., 2010) using primers containing attB1 and attB2 sites and recombining into pDONR 221, and the 3’ elements were tdTomato (for rTRPV1 construct) or SV40polA (for GCaMP3 construct) in pDONR P2R-P3. The destination vector was pDestTol2pA2. Tg(LysC:dsRednz50) and Tg(LysC:GFPnz117) have been described elsewhere (Hall et al., 2007). Time-lapse imaging. All solutions used with live embryos were diluted in filtered fish water (from Aquaneering fish system, pH, electrolyte balanced). Embryos were cleaned in 0.5% hypochlorite solution (Fisher SS290), and transferred to phenylthiourea (PTU) (0.03g/L final concentration) at 24hpf to facilitate fluorescence imaging by preventing pigmentation. Tg(LysC:GCaMP3) larvae were imaged at 2 days post fertilization (dpf) for bacterial infection experiments and all other transgenic larvae were imaged at 3 dpf. For microscopy, larvae were anesthetized in 0.016% Tricaine (MS-222) and immobilized in 1% low melting point agarose (Fisher BP165) and imaged through no. 1.5 coverslip in the bottom of a 35mm petri dish (MatTek) on an inverted Zeiss axio observer Z1 (20x objective, 0.645 µm/pixel) or inverted Nikon TE-2000U (20x objective, 0.32µm/pixel). Phagocytosis was captured by caudal artery injection of bacteria and immediate imaging in agarose. Ventral fin wounding and caudal tail wounds were carried out with a sterile no. 11 miltex razor in tricaine anesthetized larvae and imaged immediately or several hours post wounding as determined by the experiment.
Light-sheet fluorescence microscopy experiments were carried out with a SiMView microscope using specimens embedded in 1.0% low melting point agarose and immobilized with 0.016% tricaine (Tomer et al., 2012). Fluorescence was detected with Nikon 16x detection objectives and Orca Flash 4.0 sCMOS cameras (Hamamatsu), providing a lateral pixel size of 0.41 µm. Three-dimensional image stacks were recorded for a ~50 µm deep volume, using piezo-stepping of the detection objective and galvanometer scanning of the light sheet with a z-spacing of 5.0 µm (Ahrens et al., 2013). Two-color imaging was performed by rapid, sequential acquisition of GCaMP3 and tdTomato channels, using a temporal sampling of 2 seconds for the entire imaging volume and both color channels. Infections/bacterial preparations. Pseudomonas aeruginosa (PAO1) carrying a constitutively expressed mCherry or GFP plasmid was grown in LB media or LB agar plates supplemented with carbenicillin (200µg/ml) as previously described in (Brannon et al., 2009). Briefly, PAO1 cultures were grown to an OD600 of 0.6-0.8 before injecting approximately 50-100 CFU into the hindbrains or caudal artery (with trace amount of phenol red to follow injection). Approximate

CFU for injected bacteria was counted by carrying out an identical injection directly onto agar plates supplemented with the appropriate antibiotic. Quantification of calcium flashes and ratiometric analyses. Light-sheet microscopy images were analyzed using maximum projections with background fluorescence subtracted. The signal in the green channel was multiplied by a constant factor to generate a positive ratio for the GCaMP3/dsRed ratiometric analysis. Individual cells were masked using the Imaris tracking function and subsequently setting all pixels outside the mask to zero for both the red and green fluorescent channels before undergoing additional analyses as detailed below.
Quantification of calcium profiles. Quantification of the intra-cellular calcium distribution is complicated by the fact that the
cell changes shape over time. This makes it difficult to identify a ‘back’ and a ‘front’ for the cell. We use the path of the cell over time to identify the direction of motion and the orientation of the cell. The path of the cell is estimated as , where c(t) is the centroid of the
cell at time t. The orientation of the cell is estimated as , i.e. the direction of the tangent to the motion path at time t. Calcium expression within the cell at time t, C(t), is quantified by the ratio image . The two-dimensional expression R(t) is mapped to a line running through the centroid of the cell c(t), in the orientation θ(t) by mapping points (x,y) within the cell C(t), using the formula (1.1)
Where Pθ is the projection matrix mapping points (x,y) to the aforementioned line. We normalize the distance d along the line to be 0 at the rear of the cell and 100 at the front of the cell (Figure S1B).
The calcium expression profile R(d,t) can be visualized in time (Figure S1) or space
(Figure 1C). For Figure 1C, we calculate a time-averaged spatial profile: ,
where T is the number of time points imaged. The advantage of this quantification is that it allows us to map the calcium expression of cells of different shapes and sizes, which were observed for different lengths of time, to a common spatial co-ordinate system (Figure 1C). The calcium expression of each cell is a 1-d curve, which can then be averaged across cells as:
, where is the spatial profile of the i-th cell. Similarly, we can
quantify inter-cell variation by calculating the standard deviation across cells as:
. These means and SDs can then be used to construct a
pointwise 95% confidence band for the average spatial profile as:
(1.2)
Quadratic modelling and inference of profile shapes.
( ) ( ) ( )( ),x yc t c t c t=
( ) ( )( )arctant t c tθ = ∂ ∂
( ) ( ) ( )( ), : ,R t R x y x y C t= ∈
( ) ( )( ) ( ) ( ){ }, : ,
, ,P x y d x y C t
R d t R x yθ = ∈
= ∑
( ) ( )1
1,
T
tR d T R d t−
=
= ∑
( ) ( )1
1
n
ii
R d n R d−
=
= ∑ ( )iR d
( ) ( ) ( ) ( )( )21
11
n
R ii
SD d n R d R d−
=
= − −∑
( ) ( )95% C.I.: 1.96 RSD dR d
n±

For a more descriptive comparison, we fit a quadratic model to the average calcium activity profiles, of the form:
(1.1)
Where Ri(d) is the average calcium profile for cell i at a position d along the length of the cell (l = 0 is rear and l = 100 is front). The coefficient, aj denotes the mean value of the profile at the middle of the cell (d = 50), bj denotes the trend of the profile along the length of the cell and cj denotes the curvature of the profile. A positive curvature implies a convex curve (like a cup) while a negative curvature implies a concave curve (like an arch), while 0 curvature implies a linear curve. The quadratic model appears to fit a number of the profiles quite well, which is reflected in median R2 values above 80% for both stationary and mobile cells. We analyzed the estimated curvature values separately for mobile and stationary cells. For mobile cells, the mean curvature across all cells was 1.55, with a 95% confidence interval of (0.98, 2.13). The null hypothesis of the mean curvature for mobile cells being 0 is rejected with a p-value = 0.00006 using a one sample t-test. For stationary cells, the mean curvature across all cells was -0.02, with a 95% confidence interval of (-1.43, 1.40). The null hypothesis of the mean curvature for stationary cells being 0 cannot be rejected with a p-value = 0.98 using a one sample t-test. We can thus conclude that the average spatial profile of calcium expression of a mobile neutrophil cell has a convex shape, i.e. elevated at the front and rear and lowest in the middle. For stationary cells, since there is no preferred direction of motion, the average spatial profile of calcium expression is approximately constant all through the cell.
For Figure 1D, cells were demarcated by mapping all points within the cell, using a standardized scale of 0 to 100 for the cell length, with 0 being the lagging edge and 100 being the leading edge, along the principal axis of the cell's motion. The average activity of all these points, with a length greater than 80, was averaged across all time points, and then calculated to get the average activity for the leading one-fifth of the cell. The average activity for the lagging one-fifth of the cell was analogously calculated. These two numbers were differenced within each cell to yield the distribution in the box plot. We tested the hypothesis that the average difference was positive using a one sample t-test. This analysis was also repeated using one-third of the leading and lagging edges as well. Whole-cell calcium flashes from ventral wounded 3dpf Tg(LysC:GCaMP3) larvae were quantified by manually scoring cells that displayed an obvious increase in green fluorescence during the time-lapse session. The number of flashes for each cell was then divided by the total time the cell was observed. Whole-cell calcium flashes associated with phagocytosis in Tg(LysC:GCaMP3) larvae were assessed by analyzing multiple imaging sessions, counting phagocytosis as occurring if the bacteria became trapped and moved with the immune cell in subsequent frames. Capsaicin treatments and measured calcium flux response. 10mM capsaicin (Sigma) stock was made in ethanol and stored at 4°C and fresh dilutions were prepared for each experiment such that the final ethanol concentration was 1.4% to help maintain solubility; the final capsaicin concentration was 20µM. To record and measure calcium flux in Tg(LysC:rTRPV1) animals after treatment with capsaicin, anesthetized larvae were mounted in ~50-100µl 1% low-melt
( ) ( ) ( ) ( )250 50i j j j jR d a b d c d d= + − + − +ε
agarose, followed by addition of 3ml of 20µM capsaicin before starting the multi-position time-lapse sessions as quickly as possible. To measure the change in GCaMP3 fluorescence over time (Figure 2 and Figure 3), the fluorescence intensity for each neutrophil was quantified by measuring the mean fluorescence intensity within a region of interest (ROI) that fit inside the neutrophil being tracked. The background fluorescence was subtracted from each mean ROI measurement (F) at each timepoint and at the first frame of the time lapse (F0). For Figure 3, a few of the time points for the Tg(LysC:rTRPV1) were averaged from fewer than 5 cells because some cells went out of focus or migrated out of the field of view during the time-lapse.
For wounding/PAO1 infection experiments, larvae were subjected to treatment with vehicle alone (1.4% ethanol) or repeated 10 min pulses in 20µM capsaicin, followed by 30 min recovery sessions in 1.4% ethanol for up to 2 hr post wounding or post hindbrain injections with PAO1. Capsaicin pulsing was chosen to maximize the amount of time the neutrophils would experience high intracellular calcium levels before channel desensitization or induction of cell death. To control for capsaicin-mediated cell death during extended periods of calcium influx, one group of Tg(LysC:rTRPV1) larvae was pulsed with 20µM capsaicin for 2 hours before caudal fin wounding and then soaked in 1.4% ethanol for 2 hr before quantification of neutrophil recruitment to the caudal wound. Quantification of neutrophil recruitment was carried out in anesthetized larvae by counting the number of fluorescent neutrophils within 100µm of the caudal fin wound or within the hindbrain ventricle. Generating capsaicin gradient and subsequent quantification of cell movement. Anesthetized 3dpf larvae were mounted in MatTek dishes in 100µl of 1% low-melt agarose as described previously and arranged in parallel to each other. The injection needle was placed approximately 500µm away from the most distal point of the mounted larvae such that the needle would go into the agarose, but not touch the bottom of the MatTek dish (see Figure 4A). Approximately 0.5µl of low-dose capsaicin (100µM) or high-dose capsaicin (1mM, only used in Movie S4 part 1 for proof of principle) (in 1.4% ethanol and phenol red to visually track the injection) was injected into a straight line perpendicular to the mounted larvae (with the exception of Movie S4 part 5 in which capsaicin was injected in parallel with the mounted larva). After capsaicin injection, the larvae were immediately imaged using time-lapse fluorescent microscopy, as previously described in “Capsaicin treatments and measured calcium flux response,” but with no additional liquid media added on top of the agarose. The larvae were imaged with a 5x objective (2.58µm per pixel), approximately every 10 seconds for 1.5 hours, with z resolution set to 15-20µm per section, for 50-120µm total as dictated by larval mounting conditions.
Each larva was carefully inspected for any tissue tearing or wounds from a brightfield z-stack taken before each time-lapse, and eliminated from quantification if they were found to carry any wounds. Cells were manually tracked from maximum-projections of time-lapses (tracking every 5th frame, or every 50-60sec) using MTrackJ (ImageJ). For each animal, a reference point, R, was selected outside of the caudal fin to approximate the center of the injected gradient. Cells were selected for tracking if they displayed motility and were located proximal to the caudal fin. “Distance traveled toward R” (D2R) was calculated by subtracting the final distance to R from the initial distance to R for each tracked cell. “Straightness ratio” was calculated by dividing the final D2S (Euclidean distance from start point to current point) by the final Len (total length traveled), such that “1” indicates the cell traveled in a straight line and a straightness ratio closer to “0” indicates a more circuitous, meandering route. “Total distance”
(Len) was calculated by MTrackJ as the total length traveled. “Average velocity” (average v) was calculated by MTrackJ. SKF 96365 treatments and analyses. 10mM SKF 96365 (Cayman Chemical) stock was made freshly in DMSO for each experiment with 1mg aliquots. The final working concentration was 20µM SKF 96365 in 0.5% DMSO in fish water and the control solution was 0.5% DMSO in fish water. Experiments were carried out at 3dpf using either Tg(LysC:dsRed) or Tg(LysC:GFP) for each experiment. Fin amputation, neutrophil quantification, and time-lapse experiments with control or SKF 96365 treatments were carried out similarly to those described for “Capsaicin treatments and measured calcium flux response,” except that treatments were constant (no pulsing), and neutrophil recruitment was measured 3 hours post wounding and the amputated larvae were imaged with a 5x objective (2.58µm per pixel), approximately every 30 seconds for 1hr, with a z-resolution of 48µm total. Tracking neutrophil migration patterns was carried out similarly to that described for “Generating capsaicin gradient and subsequent quantification of cell movement,” except that cells were tracked every 30 seconds in this group of experiments.
Supplemental References Ahrens, M.B., Orger, M.B., Robson, D.N., Li, J.M., and Keller, P.J. (2013). Whole-brain functional imaging at cellular resolution using light-sheet microscopy. Nat Methods 10, 413-420.
Brannon, M.K., Davis, J.M., Mathias, J.R., Hall, C.J., Emerson, J.C., Crosier, P.S., Huttenlocher, A., Ramakrishnan, L., and Moskowitz, S.M. (2009). Pseudomonas aeruginosa Type III secretion system interacts with phagocytes to modulate systemic infection of zebrafish embryos. Cell Microbiol 11, 755-768.
Grandl, J., Kim, S.E., Uzzell, V., Bursulaya, B., Petrus, M., Bandell, M., and Patapoutian, A. (2010). Temperature-induced opening of TRPV1 ion channel is stabilized by the pore domain. Nature neuroscience 13, 708-714.
Hall, C., Flores, M.V., Storm, T., Crosier, K., and Crosier, P. (2007). The zebrafish lysozyme C promoter drives myeloid-specific expression in transgenic fish. BMC developmental biology 7, 42.
Kwan, K.M., Fujimoto, E., Grabher, C., Mangum, B.D., Hardy, M.E., Campbell, D.S., Parant, J.M., Yost, H.J., Kanki, J.P., and Chien, C.B. (2007). The Tol2kit: a multisite gateway-based construction kit for Tol2 transposon transgenesis constructs. Dev Dyn 236, 3088-3099.
Oehlers, S.H., Cronan, M.R., Scott, N.R., Thomas, M.I., Okuda, K.S., Walton, E.M., Beerman, R.W., Crosier, P.S., and Tobin, D.M. (2015). Interception of host angiogenic signalling limits mycobacterial growth. Nature 517, 612-615.
Tian, L., Hires, S.A., Mao, T., Huber, D., Chiappe, M.E., Chalasani, S.H., Petreanu, L., Akerboom, J., McKinney, S.A., Schreiter, E.R., et al. (2009). Imaging neural activity in worms, flies and mice with improved GCaMP calcium indicators. Nat Methods 6, 875-881.
Tomer, R., Khairy, K., Amat, F., and Keller, P.J. (2012). Quantitative high-speed imaging of entire developing embryos with simultaneous multiview light-sheet microscopy. Nat Methods 9, 755-763.