Experimental Investigations on Repaired AISI 304 A by ...
193
Experimental Investigations on Repaired AISI 304 A by Optimized Parameters of Various Welding Techniques Using Nitinol Wire A Thesis submitted to Gujarat Technological University for the Award of Doctor of Philosophy in Mechanical Engineering by Kavita K. Kripalani Enrollment No. 179999919024 under supervision of Prof. (Dr.) Piyush S. Jain GUJARAT TECHNOLOGICAL UNIVERSITY AHMEDABAD [February - 2022]
-
Upload
khangminh22 -
Category
Documents
-
view
0 -
download
0
Transcript of Experimental Investigations on Repaired AISI 304 A by ...

Experimental Investigations on Repaired AISI 304 A
by Optimized Parameters of Various Welding
Techniques Using Nitinol Wire
A Thesis submitted to Gujarat Technological University
for the Award of
Doctor of Philosophy
in
Mechanical Engineering
by
Kavita K. Kripalani
Enrollment No. 179999919024
under supervision of
Prof. (Dr.) Piyush S. Jain
GUJARAT TECHNOLOGICAL UNIVERSITY
AHMEDABAD
[February - 2022]

iii
© Kavita K. Kripalani

iv
DECLARATION
I declare that the thesis entitled Experimental Investigations on Repaired AISI
304 A by Optimized Parameters of Various Welding Techniques Using Nitinol
Wire submitted by me for the degree of Doctor of Philosophy is the record of
research work carried out by me during the period from December 2017 to
February 2022 under the supervision of Prof. (Dr.) Piyush S. Jain and this has not
formed the basis for the award of any degree, diploma, associateship, fellowship,
titles in this or any other University or other institution of higher learning. I further
declare that the material obtained from other sources has been duly acknowledged
in the thesis. I shall be solely responsible for any plagiarism or other irregularities,
if noticed in the thesis.
Signature of the Research Scholar: Date: 28/02/2022
Name of Research Scholar: Ms. Kavita K. Kripalani
Place: Ahmedabad
v
CERTIFICATE
I certify that the work incorporated in the thesis Experimental Investigations on
Repaired AISI 304 A by Optimized Parameters of Various Welding
Techniques Using Nitinol Wire submitted by Ku. Kavita K. Kripalani was carried
out by the candidate under my supervision/guidance. To the best of my knowledge:
(i) the candidate has not submitted the same research work to any other institution
for any degree/diploma, Associateship, Fellowship or other similar titles (ii) the
thesis submitted is a record of original research work done by the Research Scholar
during the period of study under my supervision, and (iii) the thesis represents
independent research work on the part of the Research Scholar.
Signature of Supervisor: Date: 28/02/2022
Name of Supervisor: Prof. (Dr.) Piyush S. Jain
Place: Bardoli, Dist-Surat

vi
Course-work Completion Certificate
This is to certify that Ms. Kavita K. Kripalani, Enrolment No. 179999919024 is a PhD scholar
enrolled for PhD program in the branch Mechanical Engineering of Gujarat Technological
University, Ahmedabad.
She has been exempted from the course-work (successfully completed during M.Phil
Course)
She has been exempted from Research Methodology Course only (successfully completed
during M.Phil Course)
She has successfully completed the PhD course work for the partial requirement for the
award of PhD Degree. His performance in the course work is as follows-
Grade Obtained in Research Methodology
(PH001)
Grade Obtained in Self Study Course
(Core Subject)
(PH002)
BB AB
Prof. (Dr.) Piyush S. Jain
PhD. Supervisor

vii
Originality Report Certificate
It is certified that PhD Thesis titled Experimental Investigations on Repaired AISI 304 A by
Optimized Parameters of Various Welding Techniques Using Nitinol Wire by Kavita K.
Kripalani has been examined by us. We undertake the following:
a. Thesis has significant new work / knowledge as compared already published or are under
consideration to be published elsewhere. No sentence, equation, diagram, table,
paragraph or section has been copied verbatim from previous work unless it is placed
under quotation marks and duly referenced.
b. The work presented is original and own work of the author (i.e. there is no plagiarism).
No ideas, processes, results or words of others have been presented as Author own work.
c. There is no fabrication of data or results which have been compiled / analysed.
d. There is no falsification by manipulating research materials, equipment or processes, or
changing or omitting data or results such that the research is not accurately represented in
the research record.
e. The thesis has been checked using URKUND (copy of originality report attached) and
found within limits as per GTU Plagiarism Policy and instructions issued from time to
time (i.e. permitted similarity index <10%).
Signature of the Research Scholar: Date: 28/02/2022
Name of Research Scholar: Kavita K. Kripalani
Place: Ahmedabad
Signature of Supervisor: Date: 28/02/2022
Name of Supervisor: Prof. (Dr.) Piyush S. Jain
Place: Bardoli, Dist-Surat.

viii

ix

x
PhD THESIS Non-Exclusive License to
GUJARAT TECHNOLOGICAL UNIVERSITY
In consideration of being a PhD Research Scholar at GTU and in the interests of the
facilitation of research at GTU and elsewhere, I, Kavita K. Kripalani having Enrollment No.
179999919024 hereby grant a non-exclusive, royalty free and perpetual license to GTU on
the following terms:
a) GTU is permitted to archive, reproduce and distribute my thesis, in whole or in part,
and/or my abstract, in whole or in part (referred to collectively as the “Work”) anywhere
in the world, for non-commercial purposes, in all forms of media;
b) GTU is permitted to authorize, sub-lease, sub-contract or procure any of the acts
mentioned in paragraph (a);
c) GTU is authorized to submit the Work at any National / International Library, under the
authority of their “Thesis Non-Exclusive License”;
d) The Universal Copyright Notice (©) shall appear on all copies made under the authority
of this license;
e) I undertake to submit my thesis, through my University, to any Library and Archives.
Any abstract submitted with the thesis will be considered to form part of the thesis.
f) I represent that my thesis is my original work, does not infringe any rights of others,
including privacy rights, and that I have the right to make the grant conferred by this non-
exclusive license.

xi
g) If third party copyrighted material was included in my thesis for which, under the terms
of the Copyright Act, written permission from the copyright owners is required, I have
obtained such permission from the copyright owners to do the acts mentioned in
paragraph (a) above for the full term of copyright protection.
h) I retain copyright ownership and moral rights in my thesis, and may deal with the
copyright in my thesis, in any way consistent with rights granted by me to my University
in this non-exclusive license.
i) I further promise to inform any person to whom I may hereafter assign or license my
copyright in my thesis of the rights granted by me to my University in this non-exclusive
license.
j) I am aware of and agree to accept the conditions and regulations of PhD including all
policy matters related to authorship and plagiarism.
Signature of the Research Scholar:
Name of Research Scholar: Kavita K. Kripalani
Date: 28/02/2022
Place: Ahmedabad
Signature of Supervisor:
Name of Supervisor: Prof. (Dr.) Piyush S. Jain
Principal, S.N.Patel Institute of Technology & Research Centre,
Umrakh, Bardoli.
Date: 28/02/2022
Place: Bardoli, Dist-Surat
xii
Thesis Approval Form
The viva-voce of the PhD Thesis submitted by Kavita K. Kripalani (Enrollment No.
179999919024) entitled Experimental Investigations on Repaired AISI 304 A by
Optimized Parameters of Various Welding Techniques Using Nitinol Wire was
conducted on 28/02/2022, Monday at Gujarat Technological University.
The performance of the candidate was satisfactory. We recommend that he should be
awarded the PhD degree.
Any further modifications in research work recommended by the panel after 3 months
from the date of first viva-voce upon request of the Supervisor or request of
Independent Research Scholar after which viva-voce can be re-conducted by the same
panel again.
The performance of the candidate was unsatisfactory. We recommend that he should
not be awarded the PhD degree.
Dr. Piyush S. Jain
Principal, S.N.P.I.T & R.C,
Umrakh, Bardoli.
Name and signature of supervisor (1) (External Examiner-1)
Dr. Amitava De
(2) (External Examiner-2) (3) (External Examiner-3)
Dr. Kiran C. More Name and signature
(Briefly specify the modifications suggested by the panel)
(The panel must give justifications for rejecting the research work)

xiii
ABSTRACT
Experimental Investigations of various welding parameters of repaired AISI 304A using Design
of Experimentation for optimizing parameter subset of welding by shape memory alloy NiTinol
is done using prominent six joinery methods viz: Tungsten Inert Gas, Micro Plasma, Laser,
Friction Stir, Induction Brazing and Capacitor Discharge and its smart material effect is studied
along with determining repaired properties of Tensile Strength, hardness, pseudo elasticity.
NiTinol alloy in wire form is used for experimentation study. However, unlike other shapes of
NiTinol like powder, plates, tubes and other forms NiTinol in wire form is used for
experimentation as it is favorable for obtaining loading high plateau stress in joineries. The
experimental investigation has been made on optimized parameter study based on DOE and its
computational and simulation validation to find the most fitting range of parameters subset in
these welding processes for NiTinol Wire with and without curing process for most apt method
of Friction Stir welding. Comparative analysis graphically and analytically is made on repaired
part of AISI 304A plate of various joinery methods using Nitinol as filler material to assess the
most apt technique of the repaired strength, yield elongation, hardness and micro grain structure
properties, pool gravity, nugget zone contact study to determine micro grain and valence
structure of NiTinol properties impact on welded component. The study reveals that welding
Nitinol requires utmost calculative parameters control of amperage, voltage, pulse frequency,
pulse duty cycle, secondary current, feed distance, axial force, tilt angle of tool, lens source,
gravity pool of amalgamation, travel speed which plays prominent role varying from process in
determining characteristic weld strength for joint analysis. Optimized with design set up and
tooling, selected most appropriate mechanical joining technique for these welding methods after
comparing with other alternative techniques, which improved the process of repaired welding
through Nitinol and dissimilar metals which were further analyzed. The core weldability
difficulties associated with NiTi were strength reduction, formation of intermetallic compounds,
modification of phase transformation and transformation temperatures as well as changes in both
super elastic and shape memory effects. Welding Nitinol with AISI 304A was a challenge due to
formation of fragile intermetallic components which formed marked loss in tenacity in welded
joints during remelting stage due to solidification cracks associated with dendritic microstructure
of weld metal, along with this precipitation due to phase transformation in thermally affected
zone resulted in loss of mechanical resistance. Friction Stir Welding and Induction Brazing
depending upon its repaired component process and applicability were found more suitable
unlike all other four joinery methods. These two joinery methods parameters further validated by

xiv
computational and simulation to formulate optimum designs of these two processes for NiTinol
wire with 0.00278% bias error feasible in mechanized Friction Stir Welding with retained smart
material feature in welded plate due to formation of epitaxial layer of thin film of NiTinol in
transition at Heat affected zone. The NiTinol welded specimen after tests of surface analysis
determined that partial affected weld zone is 115 µm and heat affected zone of 31-47µin width,
unlike devoid of gravity pull in contact nugget area. Thus, research in welding and its effects on
the joint’s performance has been conducted with a detailed review of welding and joining
processes applied to NiTi, in similar and dissimilar combinations considering both fusion and
solid- state in Micro Plasma arc welding, Micro TIG/Pulsed Arc, Laser & Friction Stir Welding
Manual as well as Mechanized Friction Stir Welding, Induction brazing techniques. The joinery
experimentation done after studying the changes in nugget zone while welding as it depends on
phase diagram of Nitinol and its curing characteristic features. However, negative effects during
welding while using filler material of Nitinol was far extent reduced using post weld heat
treatment procedure in friction stir welding. This Ph.D. thesis will be useful for researchers and
industry domain personnel to cater with the issues and approaches to overcome the problems
faced to form intricate finish joinery by NiTi shape memory alloy on AISI 304A material. The
experimentation which is based on optimized parameter subset exhibiting an overview of
advanced welding development procedure of Friction Stir Welding joining technique will be
useful to understand the methodology so as to retain super alloy characteristic joinery with its
distinct feature.

xv
Acknowledgement
Embarking journey of persistent work on NiTinol material in my Ph.D. studies, I would
like to bow whole-heartedly and with devotion to Almighty God & Guru Nanak Saheb to
guide me throughout with his eternal grace and my parents Mohini Kripalani, and Kishin
Kripalani who have been the strongest pillar of my life. My work is dedicated to my family
Guru Sant Shree Swami Lilashah Maharaj ji [1880-1973] & Shree Santoshi Maa who has
always blessed me with inner strength of giving self-belief and solace. Without their
blessings, this could not have ever been possible.
I would like to sincerely express my sincere gratitude to my guide, Dr. Piyush. S. Jain,
Principal, Sitarambhai .Naranji Patel Institute of Technology & Research Centre, Umrakh.
His continuous momentum and immense contribution and motivation have made it
possible to complete this endeavor. He is very considerate, inspirational, generous and
straightforward Mentor.
Furthermore, my sincere gratitude goes to my DPC members Dr. Piyush Gohil , Associate
Professor, Faculty of Technology and Engineering Department, M.S University Baroda &
Dr. Vijay Chaudhary, Professor and Head Mechanical Engineering of C.S.Patel Institute of
Technology, Charusat University, Changa for showing me the appropriate path in this
research without their valuable guidance and in depth insights this could not be done with
such considerate.
I am sincerely thankful and obliged to GTU Vice Chancellor Hon. Prof. (Dr.) Navin Sheth
Sir & Respected Registrar Sir Dr. K. N. Kher of GTU.
Finally the last but not the least to everyone who have one or the other way helped in this
research work.
Sant Shree Swami Lilashah Maharaj Saheb.1880-1973
Kavita K. Kripalani
xvi
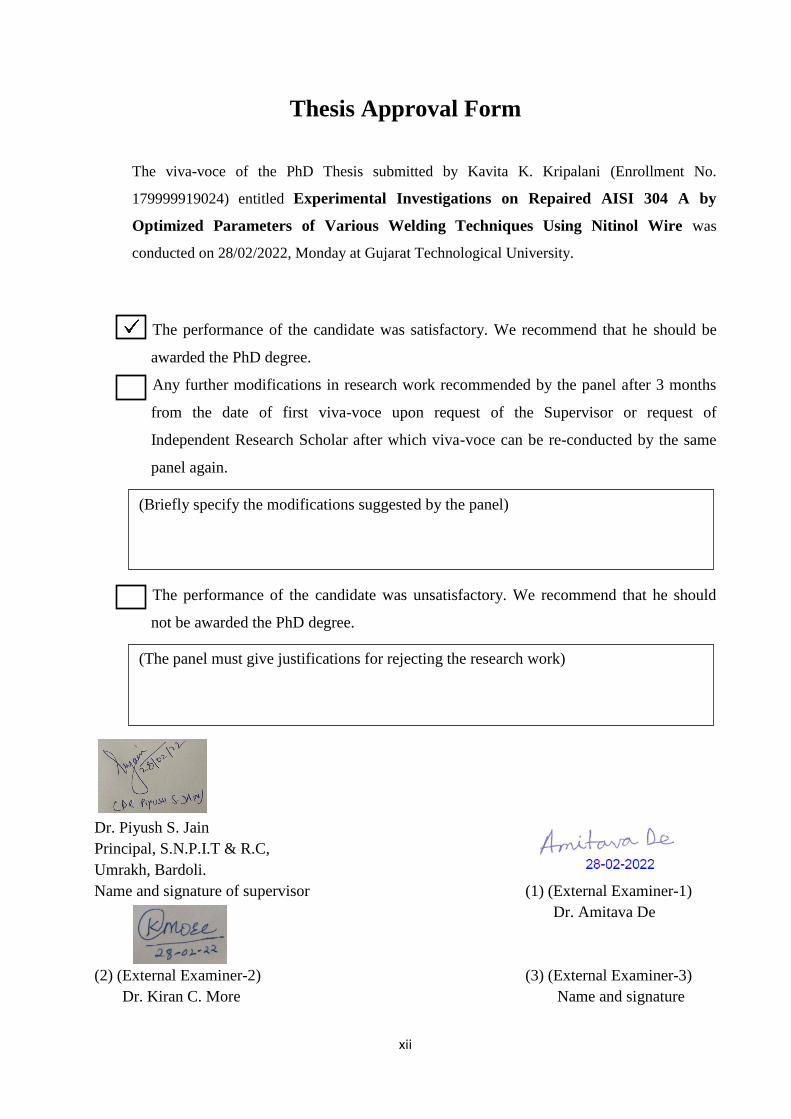
Table of Content
Abstract…………………………………………………………………………………..xiii
Acknowledgement……………………………………………………………...................xv
List of Figures……………………………………………………………………………xix
List of Tables…………………………………………………………………………..xxviii
List of Abbreviation.…………………………………………………………………….xxx
List of Symbols ................................................................................................................xxxi
List of Appendices……………………………………………………………………..xxxii
CHAPTER – 1 Introduction……………………………………………………...............1
1.1 General .............................................…………………………………………..1
1.2 Schematic Diagram of NiTinol Wire Welding...………………………………2
1.3 Comparative Analysis of Various Joinery Methods.……………......................2
1.4 Comparative Study of Conventional Methods using NiTinol Wire on
AISI 304 of Various Joinery Process..................................................................4
1.5 Overview of Thesis................……………………………………………..……6
CHAPTER – 2 Literature Review…………………………………………………..........9
2.1 State of Art Literature Review......………………………………..…………...9
2.2 Plasma Arc Welding by NiTinol Wire..……………………………..………..9
2.3 Tungsten Inert Gas Welding……………………..………………………….12
2.4 Friction Stir Welding...........………………………………………..……….17
2.5 Induction Brazing............................................................................................23
2.6 Laser Welding ................................................................................................28
2.7 Capacitor Discharge Welding ........................................................................37
2.8 Conclusion of the Literature Review .............................................................41
2.9 Objectives of the Research Work...................................................................42

xvii
2.10 Research Gap and Definition of the Problem...............................................45
2.11 Original Contribution by this Thesis..............................................................45
CHAPTER – 3 Design of Experimentation Techniques………………..…….…........46
3.1 Design of Experimentation......……………………………………..…….......46
3.2 Plasma Arc Welding...……………………………………………..................46
3.3 Tungsten Inert Gas Welding....…………….………………………….…..….49
3.4 Laser Welding .................................................................................................51
3.5 Friction Stir Welding.......................................................................................53
3.6 Capacitor Discharge Welding..........................................................................59
3.7 Induction Brazing............................................................................................61
CHAPTER – 4 Experimental Investigations Performing Joinery by NiTinol
Wire on AISI 304 A Plate………………..…….…................................46
4.1 Plasma Arc Welding......……………………………………..……................63
4.2 Tungsten Inert Gas Welding............................................................................64
4.3 Laser Welding..................................................................................................66
4.4 Manual and Robotic Friction Stir Welding......................................................69
4.5 Mechanized Friction Stir Welding...................................................................72
4.6 Capacitor Discharge Welding .........................................................................76
4.7 Induction Brazing............................................................................................77
CHAPTER – 5 Simulation Modelling & Analytical Optimization of Parameters....81
5.1 Simulation of Friction Stir and Induction Brazing Repaired Techniques
Based on Comparative Anlysis..……………………………..……................63
5.2 Mechanized Friction.........................................................................................85
5.3 Simulated Modelling of Induction Brazing Welding.......................................90
CHAPTER – 6 Comparative Analysis of Real-Time Parameters for Repaired

xviii
Specimen ................................................................................................95
6.1 Mechanized Friction Stir Welding………………………………..……........96
6.2 Induction Brazing ..........................................................................................102
CHAPTER – 7 Study of Design of Experiments, Simulation & Analytical Results
of Various Joineries and Their Discussions........................................107
7.1 Parameter Validation by Design of Experimentation using Poisson &
Johnson-Cook Model For The Test Run of Welding Later to be
Validated by Computational Method ……………………………..…….......107
7.2 Friction Stir Welding ......................................................................................108
7.3 Induction Brazing.............................................................................................115
7.4 Computational Validation of Optimized Parameters of Friction Stir
Welding and Induction Brazing.......................................................................121
7.5 Simulation Results of Joinery Process.............................................................127
7.6 Comparative Results of Friction Stir Welding and their Discussion...............134
CHAPTER – 8 Conclusion and Future Scope.................………………..…….…........138
8.1 Conclusion from Various Joinery Techniques…………………..……...........139
8.2 Main Concluding Points of Most Apt Joinery Friction Stir Welding...............140
8.3 Future Scope ....................................................................................................142
List of References .............................................................................................................143
List of Publications ..........................................................................................................154
Appendix – I .....................................................................................................................155
Appendix – II ...................................................................................................................159

xix
List of Figures
1. Figure 1.1 Reference CAD Model of Simulated Laser Welding by
Nitinol Wire.
3
2. Figure 2.1 Plasma Arc welding Reference Image courtesy by
Unbox Factory, different types of welding
10
3. Figure 2.2 Microstructure content of NiTi welded cross section 13
4. Figure 2.3 Scanning electron Microscope images shows fracture
structure of welded AISI 304 by TIG Welding
14
5. Figure 2.4 Potential (mV vs SCE) and Current density 15
6. Figure 2.5 (a) Curves of base metal & Weld metal with diff % Ni
in Ar gas (b) Specimen welded bead using speed lower than 2
mm sec-1, results observed on face side, root side and welded
cross section respectively in a, b, c
16
7. Figure 2.6 Weld Geometry at various power output 16
8. Figure 2.7 Tensile strength, hardness, and impact toughness graph
of Martensite steel joinery
17
9. Figure 2.8 Friction stir welding: probability for various
mechanical properties
18
10. Figure 2.9 Total deformation and temperature profile and tensile
test graph of 4mm and 6mm
18
11. Figure 2.10 Longitudinal stress (a) FSW & (b) SSFSW 19
12. Figure 2.11 Temperature Maps (a) FSW & (b) SSFSW 20
13. Figure 2.12 Microstructure for grain interior and along grain
boundary (a) base Metal (b) H HAZ (c) TMAZ near HAZ and
(d) TMAZ near nugget zone with different parameter
20
14. Figure 2.13 Distance from weld cente 21
15. Figure 2.14 150 Tons Mechanized Linear Friction image courtesy
from website
21
16. Figure 2.15 (a) Welding with NiTi and SS weld (b) EDS
Composition
22
xx
17. Figure 2.16 Wt. and differences of different material 22
18. Figure 2.17 Binary Diagram of Ni and Ti 23
19. Figure 2.18 Quasi binary eutectic system 24
20. Figure 2.19 Time resolved brazing microstructure at 120 seconds 24
21. Figure 2.20 Temperature profile of Induction Brazing 25
22. Figure 2.21 NiTinol Wire heating image courtesy from website 26
23. Figure 2.22 NiTinol Wire heating’s susceptibility for MRI Scan 26
24. Figure 2.23 Stress-strain surface temperature for NiTi at various
temperature
27
25. Figure 2.24 Joint Design and Brazing of Cemented Carbide WC-
Co and Steel
28
26. Figure 2.25 Surface magnetic flux density at room temperature
image courtesy LANTHA TECH
29
27. Figure 2.26 Parameter for Magnetic flux by LANTHA TECH 30
28. Figure 2.27 Microstructure of NiTi-304 laser welded at HAZ and
FZ zone
30
29. Figure 2.28 Peak Strain 31
30. Figure 2.29 Bend Test K10 specimen (b) Bending K4 33
31. Figure 2.30 Multiple plateau of laser welded specimen 33
32. Figure 2.31 DCS scan of wires in different conditions 35
33. Figure 2.32 2D XRD frame gathered at 1D11 beamline of ESRF
from wires
35
34. Figure 2.33 Exploded diagram of NiTi/304SS pilot weld 36
35. Figure 2.34 (b) Pilot joint weld (c) Laser welded 36
36. Figure 2.35 Temperature profile at 36 J heat for 1.31ms welding
time
37
37. Figure 2.36 CD Weld deposited on Fe3Al 37
38. Figure 2.37 Tip length of 1.4 mm Capacitor discharge welding 38
xxi
process used to join 6.35 mm Fe3Al solid cylinders with 100V
39. Figure 2.38 Characterization of capacitor discharge welding
process and simulation
39
40. Figure 2.39 Simulation results of temperature T distribution at
t=0.75ms
39
41. Figure 2.40 Electrical voltage of different contacts 40
42. Figure 2.41 Micro hardness test of welded NiTi and steel tube by
Micro Electron beam welding without filler material
40
43. Figure 2.42 Welding with NITinol wire 43
44. Figure 2.43 Flow chart of research work 44
45. Figure 2.44 Publications statistics in the world 44
46. Figure 3.1 Schematic Diagram of Plasma Arc Welding 47
47. Figure 3.2 Taguchi Analysis: Tensile Strength vs Ampere &
Voltage of PAW
48
48. Figure 3.3 Response Table for Signal to Noise ratio for PAW 48
49. Figure 3.4 Empirical Cumulative Distribution Function of
Ampere of PAW
49
50. Figure 3.5 Surface Plot of PAW 49
51. Figure 3.6 Schematic Diagram of Tungsten Inert Gas Welding 50
52. Figure 3.7 DOE of TIG 50
53. Figure 3.8 Surface Plot of TIG 51
54. Figure 3.9 Schematic diagram of Laser Welding by NiTinol Wire 52
55. Figure 3.10 CDF Empirical for Laser welding by NiTinol wire 52
56. Figure 3.11 Surface Plot of Laser Welding by NiTinol Wire 53
57. Figure 3.12 Schematic Diagram of Friction Stir Welding 53
58. Figure 3.13 DOE of FSW 54
59. Figure 3.14 Empirical CDF of FSW 54
60. Figure 3.15 Surface plot of RPM v/s Upset Force v/s Hot Rolled 55

xxii
61. Figure 3.16 Surface Plot of FSW 55
62. Figure 3.17 Upset time v/s Upset force 56
63. Figure 3.18 SN ratio v/s Ampere 56
64. Figure 3.19 Statistical analysis for models 57
65. Figure 3.20 Response table for standard deviations 57
66. Figure 3.21 Estimated model coefficients for means 57
67. Figure 3.22 Response table for means 58
68. Figure 3.23 Estimated model coefficient for standard deviations 58
69. Figure 3.24 Schematic Diagram of Capacitor Discharge Welding 59
70. Figure 3.25 Capacitor Discharge Welding DOE 60
71. Figure 3.26 Empirical CDF of CD Welding 60
72. Figure 3.27 Surface Plot of CDW 61
73. Figure 3.28 Induction Brazing 61
74. Figure 3.29 Empirical CDF of IB 62
75. Figure 3.30 Surface plot of temperature v/s frequency v/s power 62
76. Figure 4.1 Plasma arc welded 304 plates with NiTinol wire 64
77. Figure 4.2 Laboratory photograph 65
78. Figure 4.3 Computerized Compression Testing Machine 66
79. Figure 4.4 Lab experiment photograph 66
80. Figure 4.5 Laser welding machine 67
81. Figure 4.6 Laser welding machine setup 68
82. Figure 4.7 Laser welded specimen 68
83. Figure 4.8 NiTinol Wire 69
84. Figure 4.9 NiTinol wire welded 69
85. Figure 4.10 Schematic Diagram of Friction Stir Welding 70

xxiii
86. Figure 4.11 CAD Model of FSW using Grab CAD 70
87. Figure 4.12 Experimentation on Lathe Machine 71
88. Figure 4.13 FSW AISI 304 A with NiTinol Wire 71
89. Figure 4.14 Robotic/Mechanized Friction Stir Welded Specimen 72
90. Figure 4.15 CAD Model showing the path of the welding 72
91. Figure 4.16 Experimentation on AISI 304 plate with NiTinol
Wire
73
92. Figure 4.17 CAD Model 73
93. Figure 4.18 Simulation model of welded specimen 74
94. Figure 4.19 Grain Structure 74
95. Figure 4.20 Grain Structure 75
96. Figure 4.21 Simulation software for welding 76
97. Figure 4.22 Capacitor Discharge 76
98. Figure 4.23 NiTinol welded specimen with rivets 77
99. Figure 4.24 Induction Brazing Machine 78
100. Figure 4.25 Induction Brazing specimen 78
101. Figure 4.26 Micro grain structure of the welded specimen 79
102. Figure 5.1 Simulated Models of Friction Stir Welded plate by
NiTinol wire engulfed to Stud by Lathe Machine (a)
81
103. Figure 5.2 Simulated Models of Friction Stir Welded plate by
NiTinol wire engulfed to Stud by Lathe Machine (b)
82
104. Figure 5.3 Simulated Models of Friction Stir Welded plate by
NiTinol wire in four orientation axis to capture weld penetration
82
105. Figure 5.4 Simulated Models of Friction Stir Welded plate by
NiTinol wire shows nugget zone of specimen
83
106. Figure 5.5 Mesh analysis with brown spot with traces of NiTinol 83
107. Figure 5.6 Surface texture of repaired AISI 304 with NiTinol 84

xxiv
108. Figure 5.7 Matlab Simulation for stress analysis of welded joint
(a)
84
109. Figure 5.8 MATLAB Simulation for stress analysis of welded
joint (b)
85
110. Figure 5.9 Simulation of specimen welded by Mechanized
Friction Stir Welding (a)
85
111. Figure 5.10 Simulation by Mechanized Friction Stir Welding (b) 86
112. Figure 5.11 Simulation by Mechanized Friction Stir Welding (c) 86
113. Figure 5.12 Simulation by Mechanized Friction Stir Welding:
mesh analysis with orange line stress zone
87
114. Figure 5.13 Simulated Models of Friction Stir Welded plate by
NiTinol wire engulfed to Stud by Mechanized Machine (e): mesh
analysis with orange line stress zone
87
115. Figure 5.14 Mesh analysis & UV texture map of repaired AISI
304 with NiTinol by Mechanized FSW: red area shows stress
depicting weld flow at HAZ
88
116. Figure 5.15 Mesh analysis of weld flow & UV texture map of
repaired AISI 304A with NiTinol by Mechanized FSW
88
117. Figure 5.16 Surface texture at fusion zone with frictional
resistance
89
118. Figure 5.17 Mesh analysis & UV texture map of repaired AISI
304 with NiTinol by Mechanized: dark layer shows
amalgamation
89
119. Figure 5.18 Mesh analysis of amalgamation zone 90
120. Figure 5.19 Mesh analysis of amalgamation zone & UV texture
map of repaired AISI 304 with NiTinol by Mechanized
90
121. Figure 5.20 Simulated Models of Induction Brazed Welded plate
by NiTinol wire: nugget area (square) portion shows uneven weld
flow
91
122. Figure 5.21 Simulated Models of Induction Brazed Weld: stress
concentration is more in starting and reduced as it advances
91
123. Figure 5.22 Simulated Models of Induction Brazed Weld: mess 92
xxv
analysis of stressed zone
124. Figure 5.23 Mesh analysis & UV texture map of repaired AISI
304 with NiTinol by Induction Brazing: mess analysis of stressed
zone
92
125. Figure 5.24 Mesh analysis & UV texture map of repaired AISI
304 with NiTinol by Induction Brazing: camera capture of
surface texture (a)
93
126. Figure 5.25 Mesh analysis & UV texture map of repaired AISI
304 with NiTinol by Induction Brazing: camera capture of
surface texture (b)
93
127. Figure 6.1 Multiple regression for V1 summary report 98
128. Figure 6.2 Multiple regression effect report 99
129. Figure 6.3 Multiple regression for V1 model building report 100
130. Figure 6.4 Multiple regression for V1 Prediction and
Optimization report
100
131. Figure 6.5 Box plot of V1 by rpm, mm/s, diagnostic report 101
132. Figure 6.6 Box plot of V1 by rpm, mm/s, broken down report 101
133. Figure 6.7 Before/after Poisson capability Comparison for center
pt. v/s stdorder_1
102
134. Figure 6.8 Induction brazing by Nitinol wire 103
135. Figure 6.9 Screening design 104
136. Figure 6.10 Paired test for the mean of V0 and V1, summary
report
104
137. Figure 6.11 Paired test for the mean of V0 and V1, diagnostic
report
105
138. Figure 6.12 DOE of Real-time parameters welding by calculation
and camera captured the flow of weld (a)
106
139. Figure 6.13 DOE of Real-time parameters welding by calculation
and camera captured the flow of weld (b)
106
140. Figure 7.1 Chi-square test for Nitinol wire by Temperature 108

xxvi
141. Figure 7.2 Poisson process capability report for rpm 109
142. Figure 7.3 Johnson transformation for V0, rpm, mm/s 110
143. Figure 7.4 Before/after Poisson capability comparison for run
order vs 1, diagnostic report
110
144. Figure 7.5 Before/after Poisson capability comparison for run
order vs 1, summary report
111
145. Figure 7.6 Poisson capability analysis for f 111
146. Figure 7.7 Probability plot for rpm 112
147. Figure 7.8 Before/after Poisson capability comparison for centre
Pt v/s Std Order_1
112
148. Figure 7.9 Main effects plot for signal 113
149. Figure 7.10 Main effect plot for signal (b) 113
150. Figure 7.11 Contour plot of Power v/s Operating Current, Max.
Coating thickness
114
151. Figure 7.12 Surface plot of RPM v/s Upset force v/s Hot rolled % 114
152. Figure 7.13 Before/after Poisson capability comparison for run
order vs 1
115
153. Figure 7.14 Johnson transformation for power 116
154. Figure 7.15 Formation for current density in coil 116
155. Figure 7.16 Fit linear model for V3.1 117
156. Figure 7.17 Interaction plot for signals 117
157. Figure 7.18 Interaction plot for signals (b) 118
158. Figure 7.19 Contour plot of Std Order vs f, j 118
159. Figure 7.20 Surface plot of STd Order v/s f, j 119
160. Figure 7.21 Graphical Comparison of Six Welding Process based
on Joint Analysis
125
161. Figure 7.22 Simulation result 125
162. Figure 7.23 Simulation result (b) 127

xxvii
163. Figure 7.24 Simulation result (c) 127
164. Figure 7.25 Simulation results (d) 128
165. Figure 7.26 Surface plot 128
166. Figure 7.27 Surface plot (b) 129
167. Figure 7.28 Graphical analysis based on comparative analysis 130
168. Figure 7.29 Residual’s v/s fitted values and observation order 132
169. Figure 7.30 Multiple regression for current dens 132
170. Figure 7.31 Comparative analysis of all three methods for FSW &
IB for block 1 and block 2
133
171. Figure 7.32 NiTinol & AISI 304A Stress-Strain Curve for FSW 133
172. Figure 7.33 Comparative analysis of FSW Experimental,
Analytical & Simulation Data Parameter With bias error
136
173. Figure 7.34 Comparative analysis of Parameter subset 137
174. Figure 7.35 Comparative analysis of properties of optimum four
welding processes from six processes
137
xxviii
List of Tables
1. Table 2.1 Basic physical and mechanical properties of NiTinol
and 304 steel
13
2. Table 2.2 TIG Welding Parameters for Experimentation. 15
3. Table 2.3 Ultrafine grained microstructure 21
4. Table 2.4 Summary of Laser Operating Parameter 32
5. Table 3.1 Characteristic Properties of NiTinol and 304 steel 47
6. Table 4.1 Parameters for Plasma Welding 64
7. Table 4.2 Parameter set by DOE 65
8. Table 4.3 Parameter set based on DOE 67
9. Table 4.4 Laser Nd: Yag Welding Machine specifications 67
10. Table 4.5 Welding parameters 72
11. Table 4.6 Parameters set by machines 75
12. Table 4.7 Parameters for welding machine 77
13. Table 4.8 Parameters for Induction Brazing 79
14. Table 6.1 Coded Co-efficient 96
15. Table 6.2 Robotic Friction real-time parameters 97
16. Table 7.1 Basic Properties of AISI 304 A & NiTinol 108
17. Table 7.2 DOE Parameter comparison for FSW and IB 119
18. Table 7.3 Parameter Exponential by Poisson’s Method 120
19. Table 7.4 Induction Brazing DOE t value and p-value 121
20. Table 7.5 Mechanized & Manual Friction Stir Welding DOE t
value and p-value
121
21. Table 7.6 Analytical Comparative analysis of Experimental
Data Parameter
129

xxix
22. Table 7.7 Micro grain Structure of Joinery Method to determine
shape memory alloy features
129
23. Table 7.8 Comparative analysis of computational simulation
linear regression with experiment value of FSW
131
24. Table 7.9 Analytical Comparative analysis of Experimental
Data Parameter
134
25. Table 7.10 Friction Stir Computational Validation based on
Research Paper
135
xxx
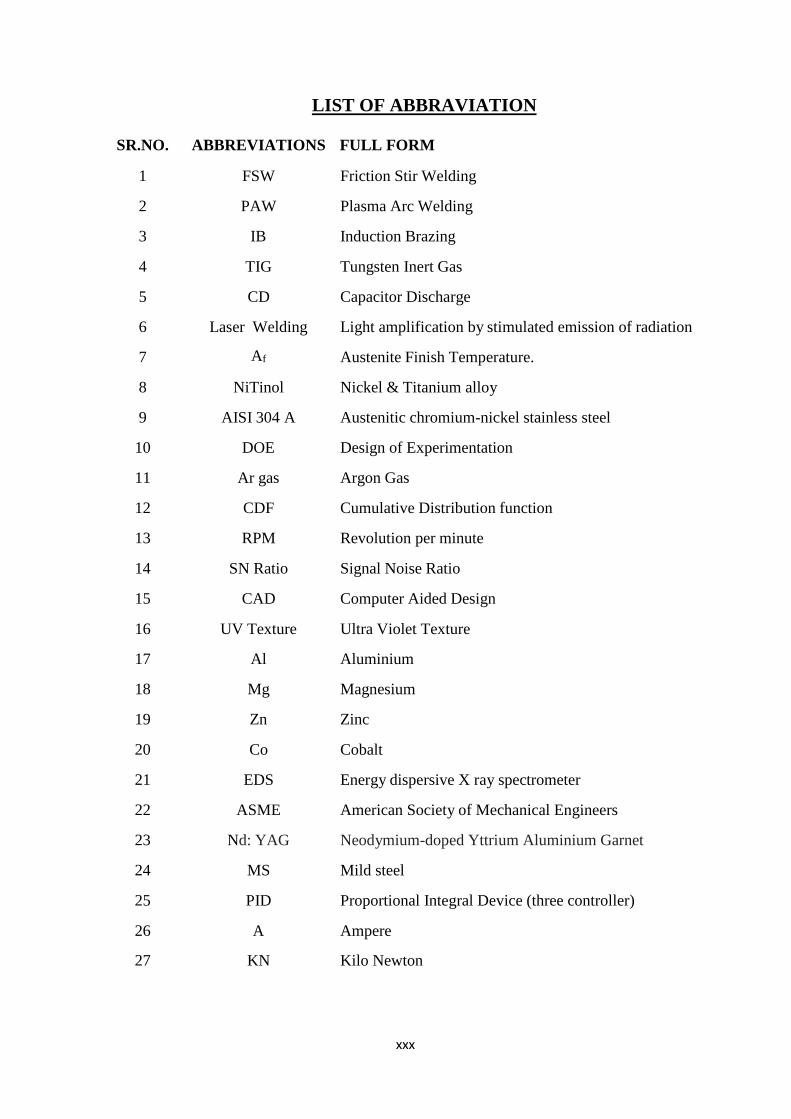
LIST OF ABBRAVIATION
SR.NO. ABBREVIATIONS FULL FORM
1 FSW Friction Stir Welding
2 PAW Plasma Arc Welding
3 IB Induction Brazing
4 TIG Tungsten Inert Gas
5 CD Capacitor Discharge
6 Laser Welding Light amplification by stimulated emission of radiation
7 Af Austenite Finish Temperature.
8 NiTinol Nickel & Titanium alloy
9 AISI 304 A Austenitic chromium-nickel stainless steel
10 DOE Design of Experimentation
11 Ar gas Argon Gas
12 CDF Cumulative Distribution function
13 RPM Revolution per minute
14 SN Ratio Signal Noise Ratio
15 CAD Computer Aided Design
16 UV Texture Ultra Violet Texture
17 Al Aluminium
18 Mg Magnesium
19 Zn Zinc
20 Co Cobalt
21 EDS Energy dispersive X ray spectrometer
22 ASME American Society of Mechanical Engineers
23 Nd: YAG Neodymium-doped Yttrium Aluminium Garnet
24 MS Mild steel
25 PID Proportional Integral Device (three controller)
26 A Ampere
27 KN Kilo Newton

xxxi
LIST OF SYMBOLS
SR.NO. SYMBOL NAME
1 µ Micron
2 δ Delta
3 Π Pi
4 λ Lambda
5 σ Sigma
6 τ Tau
7 υ Upsilon
8 Ψ Psi
9 ξ Xi

xxxii
APPENDIX
APPENDIX-I: Lab Reports
APPENDIX-II: Calculations

INTRODUCTION
1
CHAPTER 1
INTRODUCTION
1.1 General
Emerging Trends in Subtractive Manufacturing joinery on repaired AISI 304A by
NiTinol wire is finding its prominence due to a greater amount of precision and
pseudo elasticity being one of the prominent factors. NiTinol constituents of an
equiatomic alloy of nickel and titanium. Nickel Titanium alloy is an expensive
material possesses unique functional characteristic features like shape memory, the
effect of pseudo elasticity, stiffness, dampness, corrosion-resistant biocompatibility
which make its conventional use in various joinery methods on the plate of AISI 304
A/L. Amongst the various shape memory alloys, NiTinol is the most commonly used
in medical, automotive sector-specific.
However, joining by Nitinol is difficult because of its high reactivity and ductility
with dissimilar material. This restricts its usage in the joinery domain and makes it
supplement. D u e t o its substantial distinct quality of shape memory and restoring large
strain of almost 8% by unloading and heating, if the proper methodology is used to
join with this unique material without detrimentally affecting its properties such as
curing and autoclave. The study of micro structural properties of NiTinol and
influencing factors on the transformation temperature of NiTinol, its uniqueness can be
revived thus the welding procedure making it useful as a filler material in joinery.
NiTinol is available in various shapes and grades in the forms of Tubes, Rods, Wires,
Powder form, but for welding usually, powder and wire form is preferable. However,
there are various methods by which NiTinol is made like Casting and Powder
Metallurgy. Near Net device with limitations like complexity in resulting parts and
controlling size and shape of porosity is preferred. However, additive manufacturing is
gaining substantial attention for manufacturing NiTinol as they overcome challenges
as these processes rely on CAD data. This method uses either powder bed-based
INTRODUCTION
2
technologies like Selective Laser Melting (SLM) or Laser Engineered Net Shaping
(LENS). The powder form of the method is suitable to make NiTinol in powder form
such as water atomization, gas atomization, hydriding, mechanical attrition. Welding
by Stainless steel is a widely used material in medical for implants and surgical
instruments, aeronautical domain to name specifically. Since it is expensive and it has
poor machinability, the increased demand for dissimilar welding of NiTinol
components to steel components leads to the intermetallic formation of titanium and
iron which causes cracks and thus making inferior joint strength due to its brittle phase.
However, sound welds without the presence of any crack can be produced by using
methods like curing, using super elastic Nitinol by providing good quality weld seams
with accuracy in arc/beam alignment, controlling the level of dilution in the weld
metal. The austenite stainless steel plate 304 L is initially electric arc melted, with
refinement to homogeneity and purity yields minimal voids with surface roughness
less than 7 micro inches.
1.2 Schematic Diagram of Nitinol Wire Welding
Figure 1.1 depicts the schematic representation of NiTinol wire welding and then
checking the joint strength by Camera Vision for one of the experimented joinery
technique so as to demonstrate that tool setup also plays an important role in joint
strength with NiTinol wire. The research study reveals that NiTi to NiTi similar
welding when done near Heat Affected Zone, hardness is minimum near the fusion
line as there is grain growth which substantially increases towards base metal, whereas
unlike to dissimilar metal of AISI 304, it shows the increased hardness value due to
its fine structure and microstructure homogeneity at weld zone.
1.3 Comparative analysis of Various Joinery Methods by NiTinol Wire and
Problem Definition
With various parameters of travel speed, feed, depth, sheet thickness, preheated,
Cured. In this section, the comparison of various methods is done after in-depth
research of literature study, from books, ASTM Journals, and available databases of
the web. The comparison is done in tabular and graphical mode for research done
and my work in this reference. The quality of weld varies depending on the size of
the Plate, heat input source so for experimentation the dimension of AISI 304 A plate
is kept to some extent the same.

INTRODUCTION
3
Figure 1.1 Reference CAD Model of Simulated Laser Welding by Nitinol Wire.
1.4 Comparative Study of Conventional m e t h o d & using NiTinol Wire on
AISI 304 of Various Joinery Process
Sr. No.
Method of
Welding
Conventional Method
Description (1-13)
Joinery Method on AISI 304 by NiTinol Wire
1. Plasma Arc
/Pulsed Arc
Welding
Method
Arc is formed between the
pointed tungsten electrode and
304 A Steel/work piece.
Three operating modes can be
produced by varying bore
diameters. and varying bore
The plasma arc is operated with
DC, with a dropped
characteristic power
source.
A pilot arc is formed between
welds, which results in electrical
interference.
The electrode comprises tungsten
having 2% thoria with plasma
nozzle is of copper, wherein its
tip diameter is made around 30-
60 degrees.
Modular Plasma/TIG
welding machine with
Comfort 2.0 P control.
Plasma and pulsed TIG
welding up to the kHz range
allow a high welding speed
with minimal heat input using
a constricted arc.
Plasma welding current
adjustable in 0.1 A
increments Pilot arc current
adjustable in 0.1 A increments
between 2–15 A. The pilot
arc current can be adjusted at
four operating points during
the welding process
(beforehand, during, and the
following welding, as well as
INTRODUCTION
4
during pauses in welding)
Non-latched/latched
operation Spot welding/tack
function (spot Arc/spot matic)
Spotmatic – reduce the time
required for tacking by up to
50% (TIG only)
Adjustable up-slope and
down- slope time
3.5 m mains supply lead with
16 A shock-proof plug.
It comprises high welding
speed with in-depth
penetration.
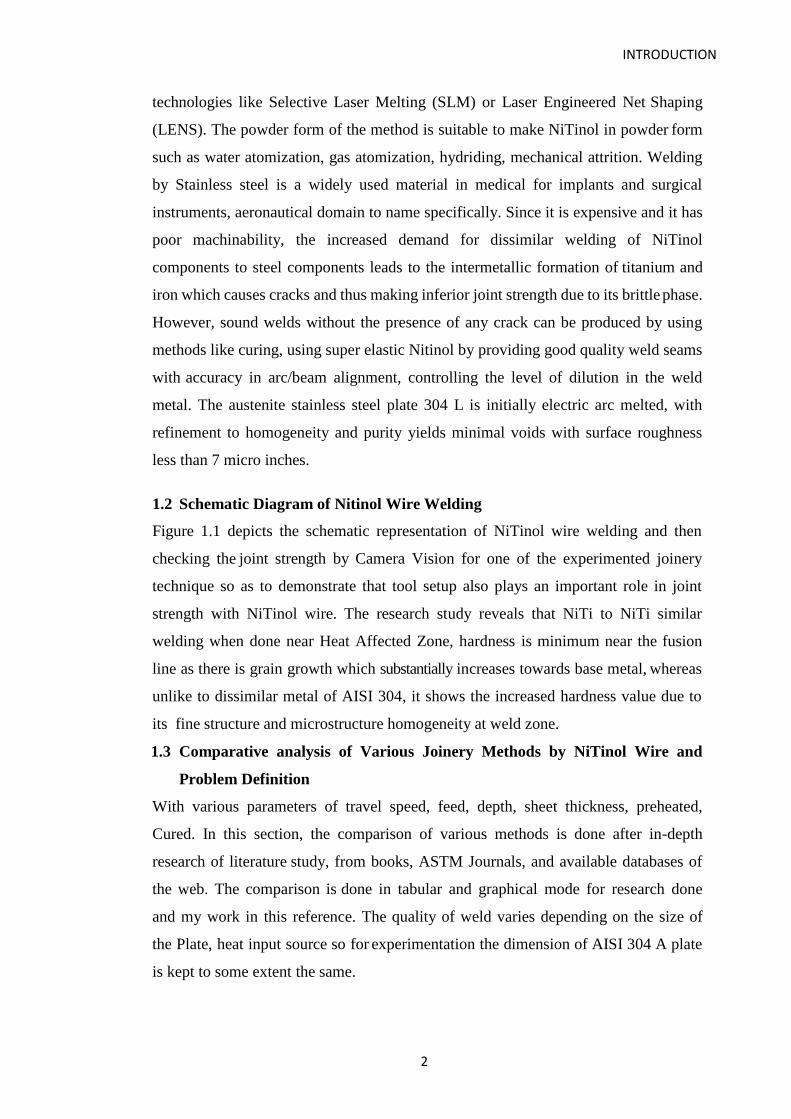
2. TIG Welding
Method
Zero contact process welding
utilizes an electric arc struck
between a tungsten electrode
and target component in an inert
atmosphere.
The filler material can be added
separately to the weld pool.
Closed-loop linear power
supplies apply for maintaining
precise arc generation.
Factors like duration of weld
and amplitude produce effective
changes in heating pattern and
control in the welding process.
Produces weld with a non-
consumable tungsten electrode.
It is operated with DC or AC,
with a constant current power
source.
Pure Tungsten with 1to 4 %
thoria with alternative additives
like lanthanum oxide and cerium
oxide are used to enhance its
performance.
In DC electrode is connected to
negative polarity and positive to
work piece.
Fusion-based processes with
reduced thermal affected
regions are provided.
For a total of 600 cycles, 4-8
% strain can be imposed
without rupture.
It is an inexpensive process
and is simple to operate in
the industrial environment.
Low heat input.
Good quality
joints.
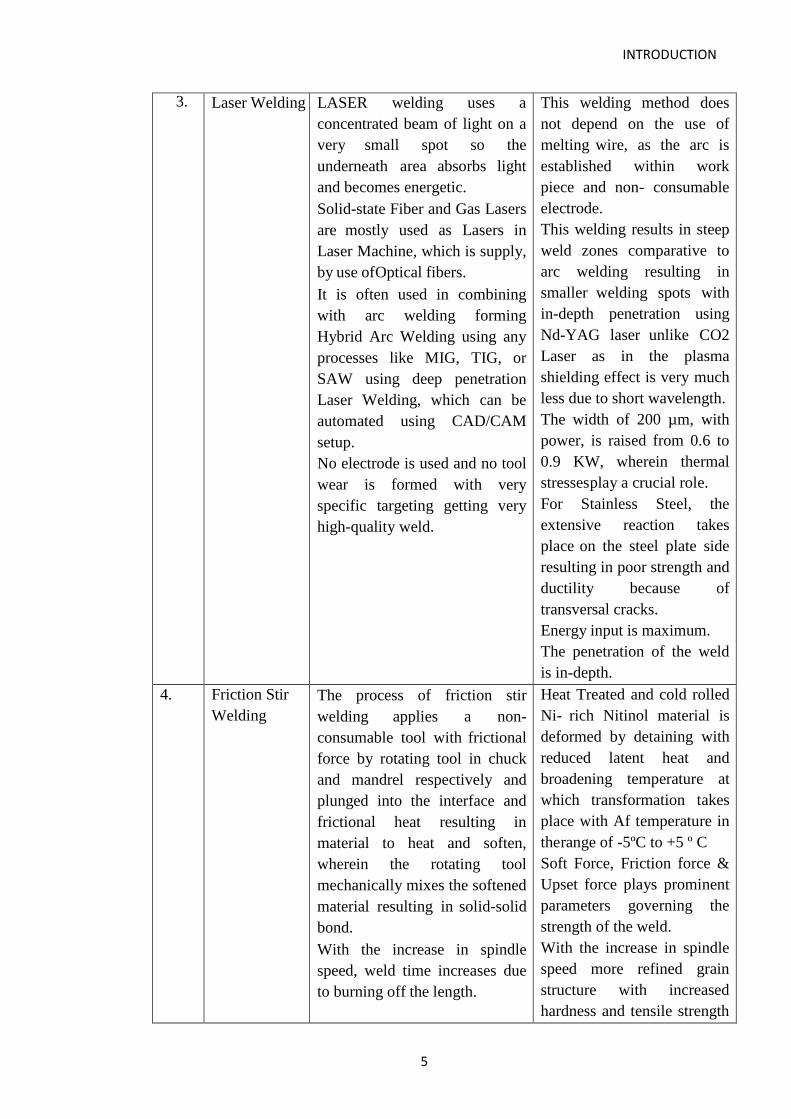
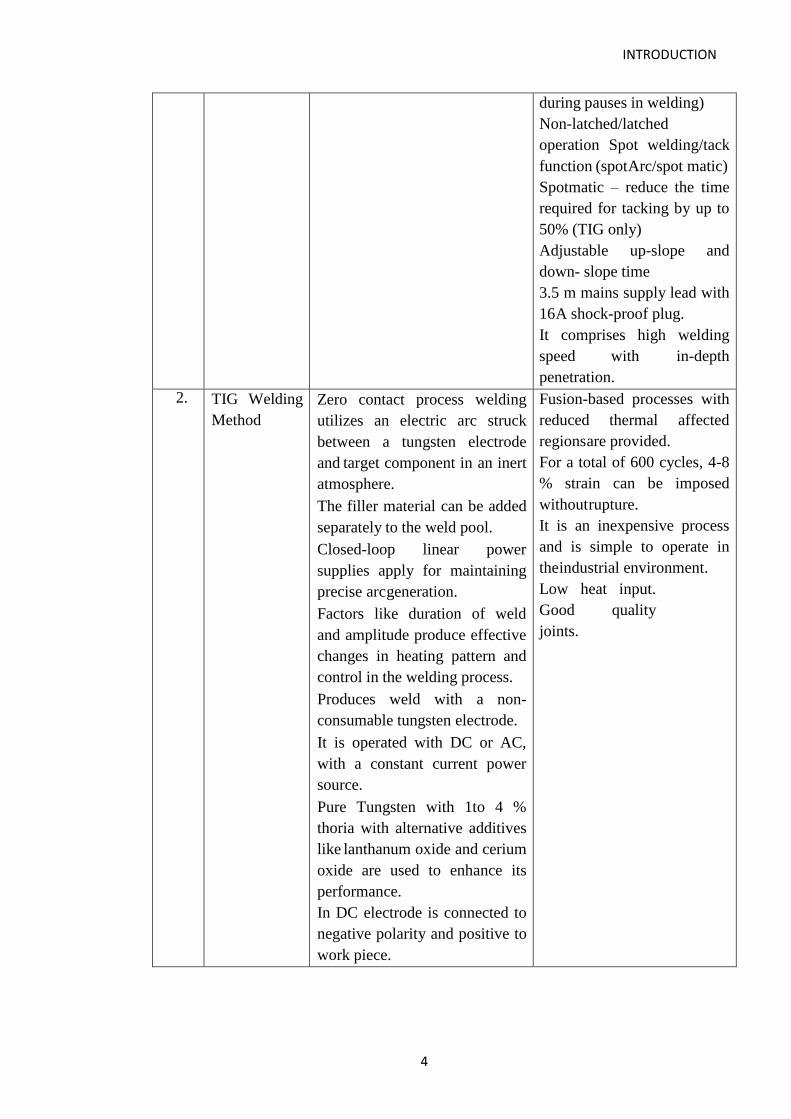
INTRODUCTION
5
3. Laser Welding LASER welding uses a
concentrated beam of light on a
very small spot so the
underneath area absorbs light
and becomes energetic.
Solid-state Fiber and Gas Lasers
are mostly used as Lasers in
Laser Machine, which is supply,
by use of Optical fibers.
It is often used in combining
with arc welding forming
Hybrid Arc Welding using any
processes like MIG, TIG, or
SAW using deep penetration
Laser Welding, which can be
automated using CAD/CAM
setup.
No electrode is used and no tool
wear is formed with very
specific targeting getting very
high-quality weld.
This welding method does
not depend on the use of
melting wire, as the arc is
established within work
piece and non- consumable
electrode.
This welding results in steep
weld zones comparative to
arc welding resulting in
smaller welding spots with
in-depth penetration using
Nd-YAG laser unlike CO2
Laser as in the plasma
shielding effect is very much
less due to short wavelength.
The width of 200 µm, with
power, is raised from 0.6 to
0.9 KW, wherein thermal
stresses play a crucial role.
For Stainless Steel, the
extensive reaction takes
place on the steel plate side
resulting in poor strength and
ductility because of
transversal cracks.
Energy input is maximum.
The penetration of the weld
is in-depth.
4. Friction Stir
Welding
The process of friction stir
welding applies a non-
consumable tool with frictional
force by rotating tool in chuck
and mandrel respectively and
plunged into the interface and
frictional heat resulting in
material to heat and soften,
wherein the rotating tool
mechanically mixes the softened
material resulting in solid-solid
bond.
With the increase in spindle
speed, weld time increases due
to burning off the length.
Heat Treated and cold rolled
Ni- rich Nitinol material is
deformed by detaining with
reduced latent heat and
broadening temperature at
which transformation takes
place with Af temperature in
the range of -5ºC to +5 º C
Soft Force, Friction force &
Upset force plays prominent
parameters governing the
strength of the weld.
With the increase in spindle
speed more refined grain
structure with increased
hardness and tensile strength

INTRODUCTION
6
in welded structure.
5. Induction
Brazing
Usually, the specification of the
machine is of ranges from
handheld heating to the
Induction Machine ranging in
the power of generally from 300
KW- 30 KW.
Its applicability is found in
optical cable manufacturing
company repair due to enhanced
productivity and efficiency in
the manufacturing process.
Specification used:
Power:160KW
Frequency:18-
25KHZ
Current:230A
Voltage:3-phase
380V- 50/60HZ
The joinery is done in
presence of an argon
atmosphere for 20-
60 seconds. Exhibits good
wetting within AISI plate
and NiTinol wire used as
filler material after treated by
curing for the 20s, which
creates homogeneous
bonding region.
Tensile strength up to 250
MPa was achieved.
6. Capacitor
Discharge
Welding
CDW allows welding small
diameter studs on the base
plate, which utilizes short
welding time. The weld cycle
time varies from 0.01 seconds to
1 second.
It possesses the distinct
advantage of minimal heat
buildup with minimal distortion.
It utilizes a capacitor storage
system producing electrical
discharge using the Contact and
Gap technique.
Stud with projection or ignition
tip is used, wherein ignition tip
is considered more precise.
Welding Range: -2-10
mm Stud length range:31
mm Hand Tool length-
201 mm Cable length-3
meters Hand Tool
Length-1.9 Kg. Power
Supply 120 V
Charge range 80 VDC to
200 VDC. With the increase
in pressure, weld heat is
reduced and weld strength is
increased. Tensile Strength
up to 524.55 N/mm2 is
obtained. Preheating, thicker
material, increasing stud area
are major factors affecting
weld strength by NiTinol
Wire.
1.5 Overview of Thesis
The work is bifurcated into eight chapters to present the outcome and overview of the
research work.
INTRODUCTION
7
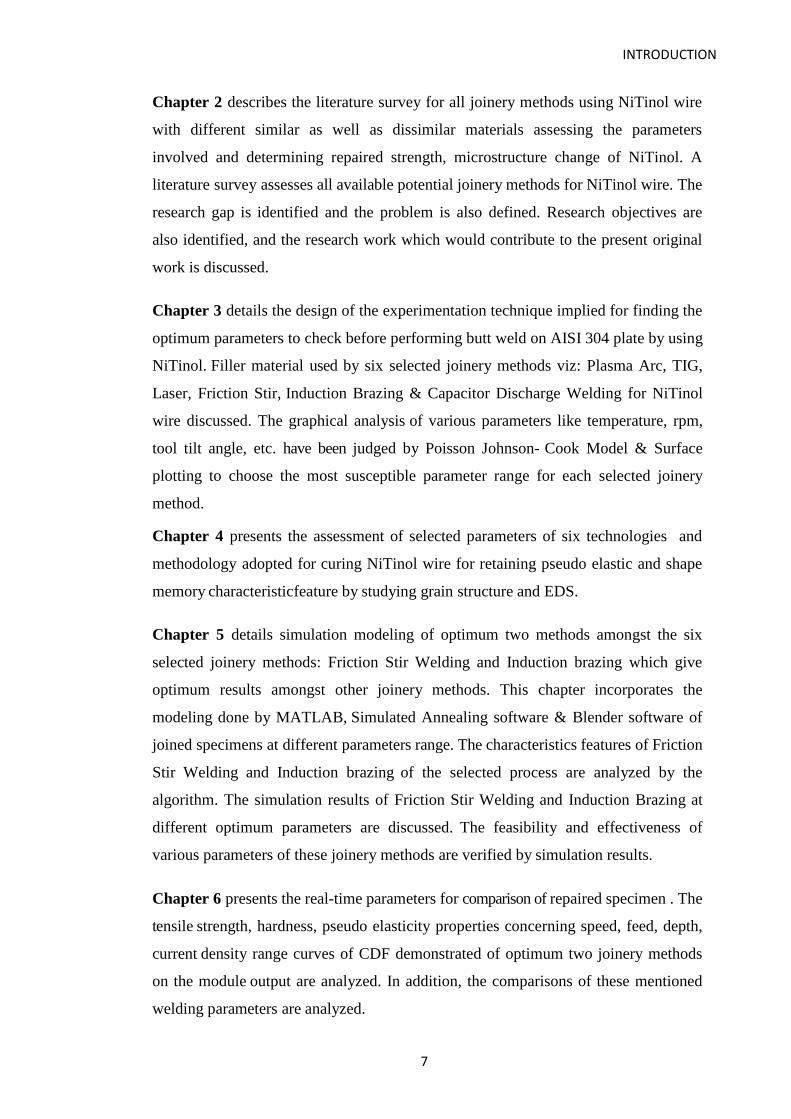
Chapter 2 describes the literature survey for all joinery methods using NiTinol wire
with different similar as well as dissimilar materials assessing the parameters
involved and determining repaired strength, microstructure change of NiTinol. A
literature survey assesses all available potential joinery methods for NiTinol wire. The
research gap is identified and the problem is also defined. Research objectives are
also identified, and the research work which would contribute to the present original
work is discussed.
Chapter 3 details the design of the experimentation technique implied for finding the
optimum parameters to check before performing butt weld on AISI 304 plate by using
NiTinol. F iller material used by six selected joinery methods viz: Plasma Arc, TIG,
Laser, Friction Stir, Induction Brazing & Capacitor Discharge Welding for NiTinol
wire discussed. The graphical analysis of various parameters like temperature, rpm,
tool tilt angle, etc. have been judged by Poisson Johnson- Cook Model & Surface
plotting to choose the most susceptible parameter range for each selected joinery
method.
Chapter 4 presents the assessment of selected parameters of six technologies and
methodology adopted for curing NiTinol wire for retaining pseudo elastic and shape
memory characteristic feature by studying grain structure and EDS.
Chapter 5 details simulation modeling of optimum two methods amongst the six
selected joinery methods: Friction Stir Welding and Induction brazing which give
optimum results amongst other joinery methods. This chapter incorporates the
modeling done by MATLAB, Simulated Annealing software & Blender software of
joined specimens at different parameters range. The characteristics features of Friction
Stir Welding and Induction brazing of the selected process are analyzed by the
algorithm. The simulation results of Friction Stir Welding and Induction Brazing at
different optimum parameters are discussed. The feasibility and effectiveness of
various parameters of these joinery methods are verified by simulation results.
Chapter 6 presents the real-time parameters for comparison of repaired specimen . The
tensile strength, hardness, pseudo elasticity properties concerning speed, feed, depth,
current density range curves of CDF demonstrated of optimum two joinery methods
on the module output are analyzed. In addition, the comparisons of these mentioned
welding parameters are analyzed.

INTRODUCTION
8
Chapter 7 deals with experimentation results presented after verification by
numerical assessment for FSW & Induction Brazing joinery methods by 2nd
Polynomial algorithm at various modes of parameter testing with comparative results
of DOE, Simulation & analytical finding the bias error so, as to arrive with suitable
range for selected joinery.
Chapter 8 finally depicts the summary with concluding remarks and the future scope
of this research work.
LITERATURE REVIEW
9
CHAPTER 2
LITERATURE REVIEW
2.1 State of the art Literature Review
This chapter describes the research work done on various methods of joinery using NiTinol
wire on AISI 304 plate along with the analysis of its dependences on various parameters
for tensile strength and hardness for repaired base material. This chapter comprises review
of literature survey of six welding methods namely Plasma Arc, Tungsten Inert Gas
Welding, Laser, Friction Stir, Induction Brazing and Capacitor Discharge welding which
are bifurcated in six joinery techniques respectively. The literature review is done by first
presenting the principle of these six joining techniques along with the difficulties faced
while joining by NiTinol wire and their applicability in the sectors like medical,
manufacturing industry, aviation and many more. Optimization of parameters by Taguchi
method for Additive Manufacturing and subtractive manufacturing using NiTinol Wire
were studied which explores that quality of weld repair depends primarily on the type of
NiTinol shape in the form of rods, tubes, wire or powder. The base material, speed, feed,
type of welding is also studied. Finally, at the end of this chapter, the research gap is
identified and objectives of the present work have been stated.
2.2 Plasma Arc Welding by NiTinol Wire
Plasma arc welding is a liquid state process of metal joining using Plasma as ionized gas.
Arc is formed between the plate and constricted nozzle using NiTinol wire as filler
material. Temperature maintained is around 2000°C. The basic drawback of welded
specimen by this method is formation of toxicological effects. The study of corrosion
behavior of Nitinol in the repaired base material after weld is of critical importance because
of the known toxicological effects of nickel manufactured commonly from casting, powder
metallurgy with vast challenges in heat treatment during joineries [1]. The effect of the
Mechano-chemical treatment on structural properties of the matrix and surface layer of the
LITERATURE REVIEW
10
drawn TiNi-based alloy wire optimized by Taguchi method DOE analysis is studied to
understand the phenomena of toxicological. However, the research over additive
manufacturing and subtractive manufacturing by NiTinol wire explores that quality of
weld repair depends primarily on type of NiTinol shape whether it is in the form of rods,
tubes, wire or powder form along with base material, speed, feed, type of welding which
are also important. The crux of research gap of reviewed literature survey and the objective
of current work states the methodologies to curb it. For this process, a range of samples
were prepared using different drawing and etching procedures to remove these toxicological
defects. From the results, it was obtained that the fabricated samples showed a composite
structure comprising the complex matrix and textured oxycarbonitride spitted surface
layer. The suggested method of surface treatment increased the surface roughness for the
enhanced bio-performance and better in-vivo integration additive manufacturing is
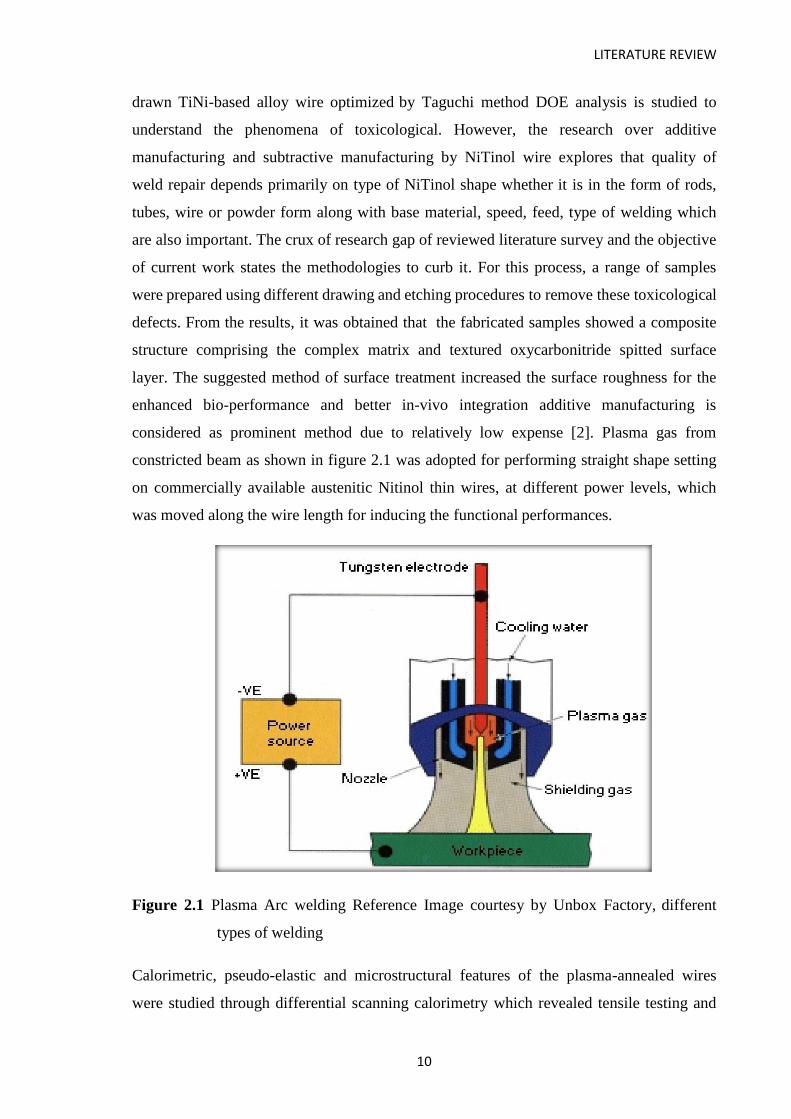
considered as prominent method due to relatively low expense [2]. Plasma gas from
constricted beam as shown in figure 2.1 was adopted for performing straight shape setting
on commercially available austenitic Nitinol thin wires, at different power levels, which
was moved along the wire length for inducing the functional performances.
Figure 2.1 Plasma Arc welding Reference Image courtesy by Unbox Factory, different
types of welding
Calorimetric, pseudo-elastic and microstructural features of the plasma-annealed wires
were studied through differential scanning calorimetry which revealed tensile testing and

LITERATURE REVIEW
11
high-energy X-ray diffraction. Challenge faced in joining by this technique is
amalgamation in HAZ zone and transition temperature of Austenite to Martensitic phase of
NiTinol is high, therefore it is difficult for spatter free joinery. It can be stated that the
plasma technology can induce SE Itn thin Nitinol wires: the wire performance can be
modulated as in function of the laser power and improved functional properties are
obtained. However, half bead welding method is more favorable in nuclear reactors
pressure repair [3] with the purpose of catheter improvement made by NiTi super elastic
wire which purportedly used in lieu of standardized 304 wires. This process of PAW has
limitation in process characteristic that at minimal heat input results into negative change
of NiTi leading to degrading usability hence NiTi+304 AISI heterogeneous welds find its
limitation. However, for PAW, the properties of welding feature can be enhanced by using
different types of material similar to dissimilar combination, product designing and
welding technique [4] fatigue behavior of additively manufactured (AM) NiTi (i.e. Nitinol)
specimens and compared results to the wrought material. Automized PAW specimen can
be further enhanced by finishing using additive manufacturing technique wherein
components are fabricated using a sliced CAD model based on the desired geometry. NiTi
rods can also be used apart from NiTinol wire for PAW which is fabricated using Laser
Engineered Net Shaping (LENS) and Direct Laser Deposition (DLD) AM technique. Due to
the high plateau stress of the as-fabricated NiTi, all the PAW specimens are heat- treated to
reduce their plateau stress, close to the one for the wrought material. Two different heat
treatment processes, resulting in different stress plateaus, are employed t o b e able to compare
the results in stress- and strain-based fatigue analysis.
Strain controlled constant amplitude pulsating fatigue experiments were conducted on
heat- treated AM NiTi specimens at room temperature (~24°C) to investigate their cyclic
deformation and fatigue behavior. SEM revealed the presence of microstructural defects
such as voids, resulting from entrapped gas or lack of fusion and serving as crack initiation
sites, to be the main reason for the shorter fatigue lives of PAW NiTi specimens.
However, the maximum stress level found to be the most influential factor in the fatigue
behavior of super elastic NiTi. The stability of NiTinol primarily relies on TiO2 layer [5].
Also, as in laser welding process, microstructure and anti wear property of laser cladding
Ni– Co duplex coating on copper examined by Yivong Wang et al. [6].
Ni–Co duplex coatings were cladded onto Cu to improve the anti-wear properties of Cu
products. Prior to laser cladding, n-Al2O3/Ni layers were introducing as interlayers
between laser cladding coatings and Cu substrates to improve the laser absorptivity of

LITERATURE REVIEW
12
these substrates and ensure defect-free laser cladding coatings. The structure and
morphology of the coatings of PAW were characterizing by scanning electron microscopy
and optical microscopy, and the phases of the coatings were analyzed by X-ray diffraction.
Their hardness was measured using a micro hardness tester. Experimental results showed
that defect-free composite coatings were obtain and that the coatings were metallurgically
bonded to the substrates. The surface of the Ni–Co duplex coatings comprised a Co-based
solid solution, Cr7C3, (Fe,Ni)23C6, and other strengthening phases.
The micro hardness and wear resistance of the duplex coatings were significantly improved
compared with the Cu substrates. The average micro hardness of the cladded coatings was
845.6 HV, which was approximately 8.2 times greater than that of the Cu substrates (102.6
HV). The volume loss of the Cu substrates was approximately 7.5 times greater than that
of the Ni–Co duplex coatings after 60 min of sliding wear testing. The high hardness of
and lack of defects in Ni–Co duplex coatings reduced the plastic deformation and adhesive
wear of the Cu substrates, resulting in improved wear properties. [6]
2.3 Tungsten Inert Gas Welding
Basic principle of Tungsten Inert Gas welding is of producing high intensity generated arc
which induces increased energy thus joining plate with NiTinol wire. During this process
with the solid-liquid amalgamation layer, arc generation to joinery remains permeable with
temperature induced gaseous impurities during the process. Thus, forming the increased air
compression in heat affected zone leading to sieved forming area. However, the reacting
gases have an impact on conductive & convective heat transfer process. The specific
reaction area is occupied by apportion of liquid, which is then, shifted from reaction zone
to surface joined zone, which if not properly done forms crevices, while repairing the
cracks. Hence, to avoid the matrix and grain structure of NiTinol to devoid refined shell
structure formulation which is formed by amorphous ox carbonitrides in form of bi
substrate as the welded specimen has elasticity and biocompatibility, thus makes Nitinol
alloy susceptible usage for medical [7].
For this process of joinery, NiTinol wire with curing is a challenge for forming straight
shape and regaining super elastic feature after joinery which can be done in annealing heat-
treating furnace to some extent and obtained with good tensile strength. NiTinol wire when
used in joining can give optimized functional characteristic feature comparable to other
conventional processes bend wire with recovery of almost 96.3% [8]. Basic physical
properties of NiTinol & 304 steel used in medical are as shown in Table 2.1 [8].

LITERATURE REVIEW
13
Table 2.1 Basic physical and mechanical properties of NiTinol and 304 steel [8]
NiTi 304
Density [g/cm3] 6,5 8
Fusion Temperature [ºC] 1240-1310 1450
Thermal Conductivity[W/mºC] 18 16
Thermal Expansion Ratio [10-6ºC] 11 17,5
Heat Capacity [J/gºC] 0,32 0,5
Ultimate Tensile strength [MPa] 754-960 500
Young Modulus [GPa] 40(M),75(A) 193
It is found by researchers that filler material forms brittle phase in nugget zone while using
TIG method for repairing of steel with the NiTinol as filler material. The matrix phase is
an amalgamation of Ti, Ni and Fe content, wherein in eutectic spectrum are Ni rich content
and the spectrum 3 comprises Ti carbonitrides. The weldability can be improved by
product designs, welding procedures [9]. The shape memory characteristic features at
heating, wherein elasticity varies from almost 4 to 6%. Stress level plays an important role
in fatigue behavior [10]. Figure 2.2 shows that when analysis of microstructure of NiTi
welded specimen is done, it reveals that welded joint micro hardness was higher in TIG
compared to plasma arc welding and dependent on filler material unlike laser welding.
NiTi welded joints had 11% strain in LBW unlike PAW of 8% [11].
Figure 2.2 Microstructure content of NiTi welded cross section [12]
LITERATURE REVIEW
14
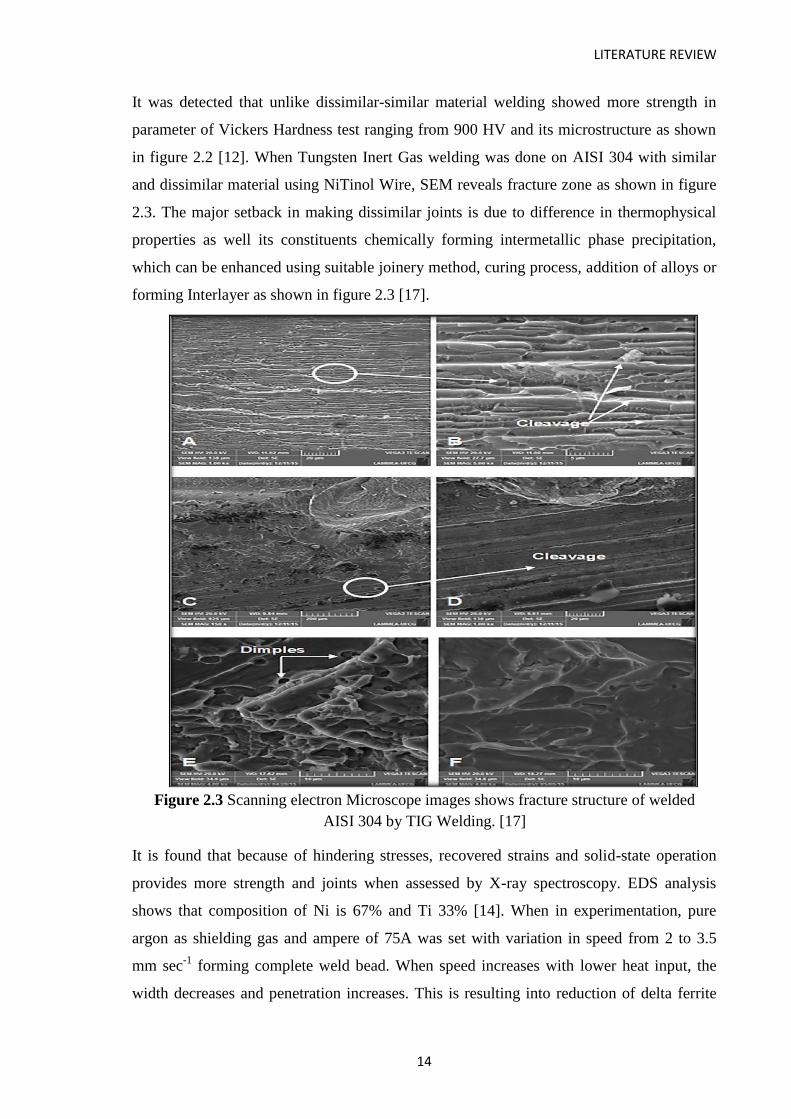
It was detected that unlike dissimilar-similar material welding showed more strength in
parameter of Vickers Hardness test ranging from 900 HV and its microstructure as shown
in figure 2.2 [12]. When Tungsten Inert Gas welding was done on AISI 304 with similar
and dissimilar material using NiTinol Wire, SEM reveals fracture zone as shown in figure
2.3. The major setback in making dissimilar joints is due to difference in thermophysical
properties as well its constituents chemically forming intermetallic phase precipitation,
which can be enhanced using suitable joinery method, curing process, addition of alloys or
forming Interlayer as shown in figure 2.3 [17].
Figure 2.3 Scanning electron Microscope images shows fracture structure of welded
AISI 304 by TIG Welding. [17]
It is found that because of hindering stresses, recovered strains and solid-state operation
provides more strength and joints when assessed by X-ray spectroscopy. EDS analysis
shows that composition of Ni is 67% and Ti 33% [14]. When in experimentation, pure
argon as shielding gas and ampere of 75A was set with variation in speed from 2 to 3.5
mm sec-1
forming complete weld bead. When speed increases with lower heat input, the
width decreases and penetration increases. This is resulting into reduction of delta ferrite
LITERATURE REVIEW
15
fraction in austenite structure, thereby increasing pitting corrosion potential. When
nitrogen content increased the weld reduced delta ferrite in an austenite matrix, which
enhanced corrosion resistance shifting pitting to noble direction. It also thereby imparted
optimum microstructure and making weld resistant from solidification cracking as
mentioned in following parameters and figure revealing the results for AISI 304 as stated in
Table 2.2 [15].
Table 2.2 TIG Welding Parameters for Experimentation. [15]
Welding parameter
Welding Current/A 75
Welding Voltage/V 12±1
Welding Speed/ (mm·s−1) 2,3,3.5
Arc Length/mm 1.6
Nozzle Size 8
Tungsten electrode diameter (EWTh2)/mm 2.4
Flow rate of shielding gas on the face side using pure argon and argon mixed with
nitrogen/(min-1
) 101
Flow rate of backing gas on the root side using pure argon/(min-1
) 91
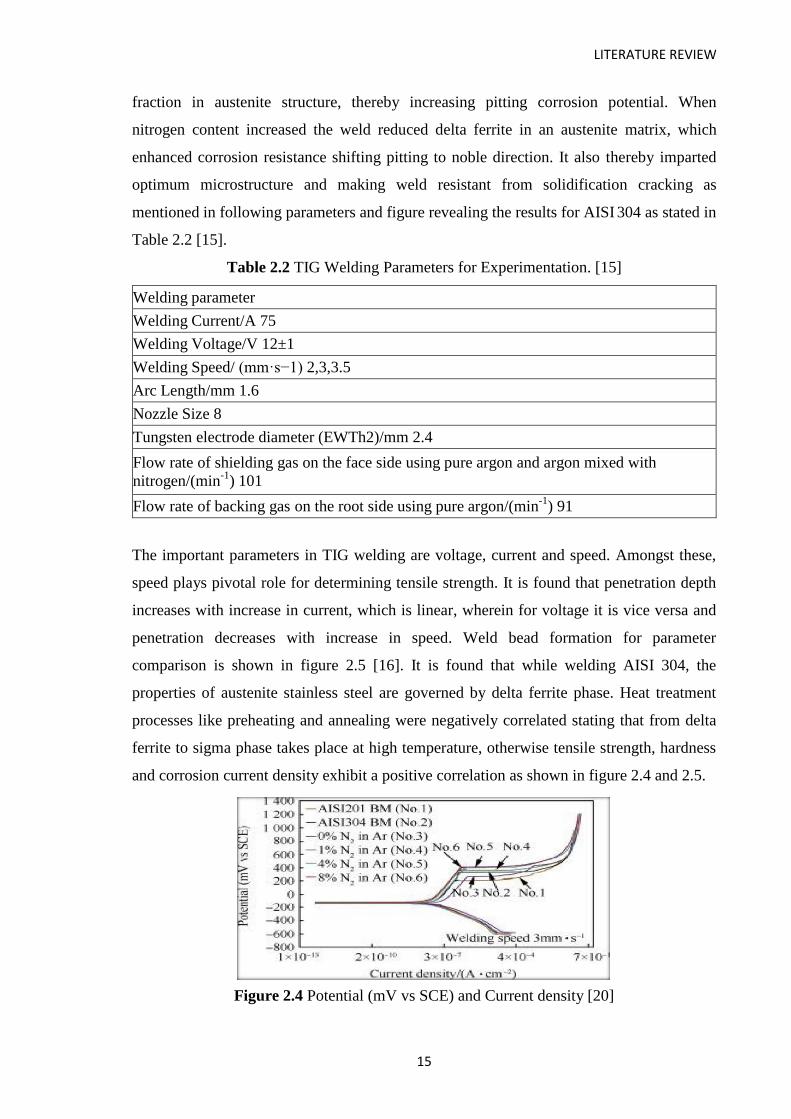
The important parameters in TIG welding are voltage, current and speed. Amongst these,
speed plays pivotal role for determining tensile strength. It is found that penetration depth
increases with increase in current, which is linear, wherein for voltage it is vice versa and
penetration decreases with increase in speed. Weld bead formation for parameter
comparison is shown in figure 2.5 [16]. It is found that while welding AISI 304, the
properties of austenite stainless steel are governed by delta ferrite phase. Heat treatment
processes like preheating and annealing were negatively correlated stating that from delta
ferrite to sigma phase takes place at high temperature, otherwise tensile strength, hardness
and corrosion current density exhibit a positive correlation as shown in figure 2.4 and 2.5.
Figure 2.4 Potential (mV vs SCE) and Current density [20]

LITERATURE REVIEW
16
Figure 2.5 (a) Curves of base metal & Weld metal with diff % Ni in Ar gas. (b) Specimen
welded bead using speed lower than 2 mm sec-1
, results observed on face side, root side and
welded cross section respectively in a, b, c [20]
The weld geometry at various power output is shown in figure 2.6.
Figure 2.6 Weld Geometry at various power output [21]
LITERATURE REVIEW
17
2.4 Friction Stir Welding
In this welding process, either through lathe machine or VMC machine, one tool made of
steel or Al or Cu is rotated in chuck and other in mandrel, and the steel plate is placed in
between these two tools. Because of frictional heat, generated joinery takes place wherein
with NiTinol wire is engulfed in between these two tools. It is of importance as a solid-
state welding process. Controlling various parameters of rotational speed of tool and
transverse speed, tool angle tilt along with axial load plays crucial role in quality and
tensile strength of weld. The study was done to find relation between varying transverse
speed and the tool profile. It is found in study that from 575-900 rpm and traverse speed of
3.16 mm/min - 8.16 mm/min forms good joinery. When the rotational speed is increased
mechanical properties decreases for AA6061-T6 aluminium [18] as shown in figure 2.7,
2.8 and 2.9.
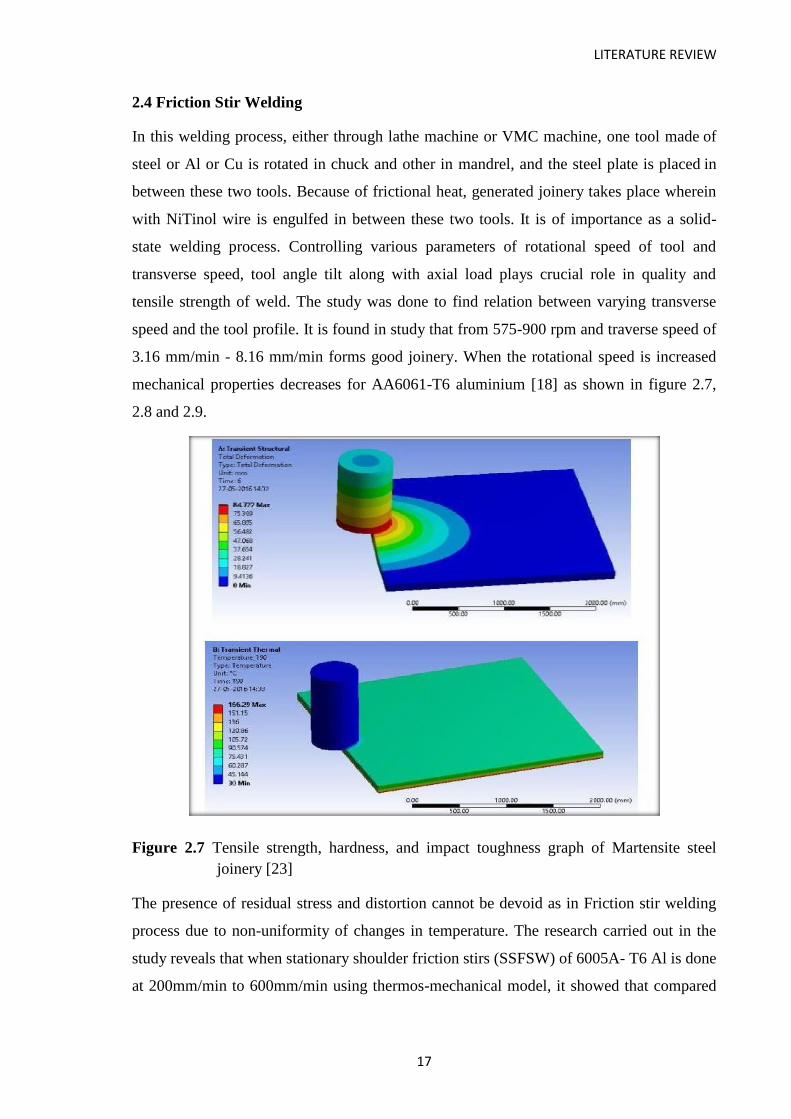
Figure 2.7 Tensile strength, hardness, and impact toughness graph of Martensite steel
joinery [23]
The presence of residual stress and distortion cannot be devoid as in Friction stir welding
process due to non-uniformity of changes in temperature. The research carried out in the
study reveals that when stationary shoulder friction stirs (SSFSW) of 6005A- T6 Al is done
at 200mm/min to 600mm/min using thermos-mechanical model, it showed that compared

LITERATURE REVIEW
18
to conventional FSW SSFSW possessed good joinery with mechanical characteristic
features.
Figure 2.8 Friction stir welding: probability for various mechanical properties[22]
Figure 2.9 Total deformation and temperature profile and tensile test graph of 4mm and
6mm [23]

LITERATURE REVIEW
19
Stationary shoulder was used to produce minimal residual stress and distortion, while
joinery of 6005A-T6 alloys with comparative analysis for conventional type of FSW and
SSFS welded, which showed that a bowl like shape contracted in size with increasing
welding speed during conventional weld.
In addition, it is deduced that in case of SSFSW, it is increased slowly while heating and
reduced rapidly during cooling, when added stationary shoulder it decreased peak
temperature during welding. The stress induced in welding zone increases with increase in
speed in case of SSFSW, which is deliberately lower than 50% compared to conventional
FSW. The welded plate had an apparent saddle type of shape and its geometry changed
with increase in welding speed, which was reduced by adding shoulder [19] as shown in
figure 2.10 and 2.11.
Figure 2.10 Longitudinal stress (a) FSW & (b) SSFSW [24]
Emphasis is therefore focused on the pattern of experimentation which are responsible to
form welds and microstructural refinement, as this also has its effects which varies with
parameters and technology diffusion leading to better understanding of microstructure and
and its characteristic features relationship. Parameters of tool geometry, joint design,
process modelling, metal flow were studied [19].
LITERATURE REVIEW
20
Figure 2.11 Temperature Maps (a) FSW & (b) SSFSW
It is found that amongst these, tool geometry plays vital role. Cylindrical threaded pin,
concave shoulders and tri-fluted pins are widely used. In addition, other parameters like
tool rotation rate, traverse speed, tool tilt angle and target depth are equally important to be
studied.
For joinery of butt or lap, flow is crucial, and it is very less researched which is understood
as situ extrusion method with stirring taking place at surface layer. For Al temperature rise
of 400-500 degree centigrade is crucial for fine recrystallized grains of 0.1-18 µm texture,
forming specifically three zones nugget region, thermomechanical and heat affected
region. It is found that almost 80% of yield stress to base Al metal is achieved with good
ductility feature. As melting point is high, it depends heavily on parameters for strength of
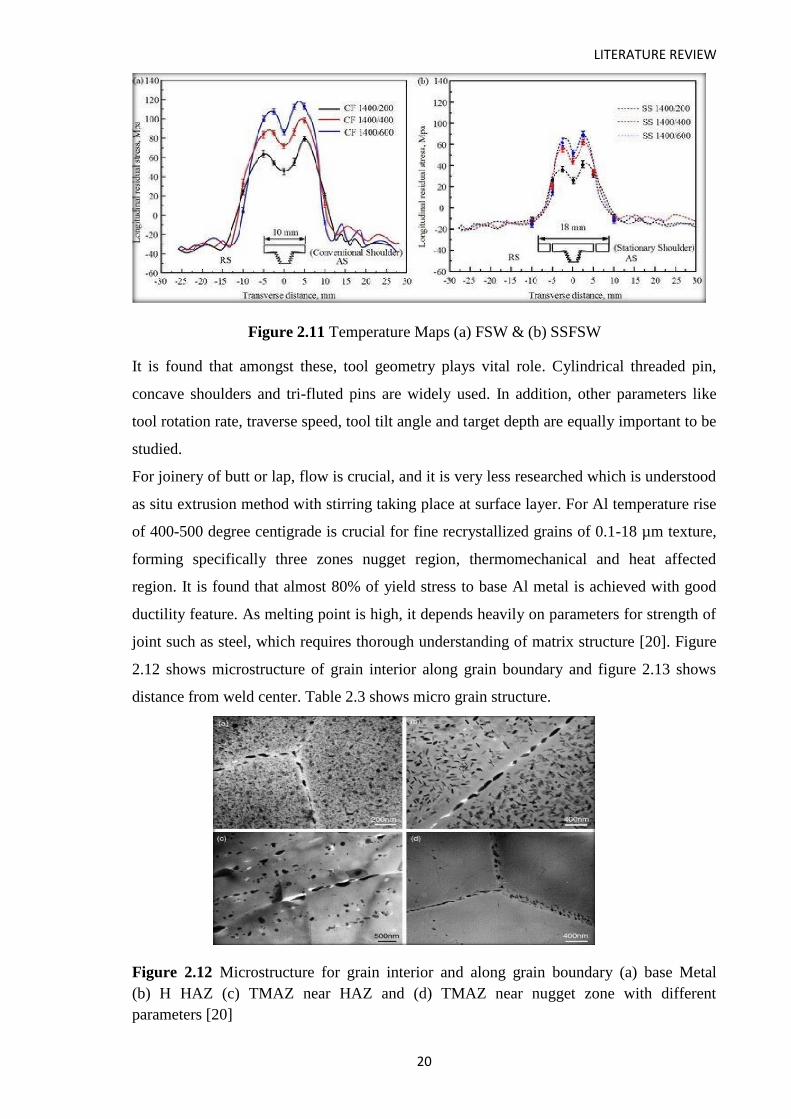
joint such as steel, which requires thorough understanding of matrix structure [20]. Figure
2.12 shows microstructure of grain interior along grain boundary and figure 2.13 shows
distance from weld center. Table 2.3 shows micro grain structure.
Figure 2.12 Microstructure for grain interior and along grain boundary (a) base Metal
(b) H HAZ (c) TMAZ near HAZ and (d) TMAZ near nugget zone with different
parameters [20]

LITERATURE REVIEW
21
Figure 2.13 Distance from weld center [20]
Table 2.3 Ultrafine grained microstructure [20]
Material Plate
Thickness Tool
Geometry Cooling
Rotation rate
Traverse speed Grain
2024Al-T4 6.5 Threade,
cylindrical Ni 650 60 0.5-0.8
1050Al 5.0
Conical pin
without
thread N/A 155 N/A 0.5
075Al 7 N/R dry ice 2.0 120 0.1
Cast Al-Zn-
Mg-Sc 6.7 Threaded
cylindrical N/A 25.4 N/A 0.68
The advance mechanized machine for friction stir welding is shown in figure 2.14.
Figure 2.14 150 Tons Mechanized Linear Friction image courtesy from website
LITERATURE REVIEW
22
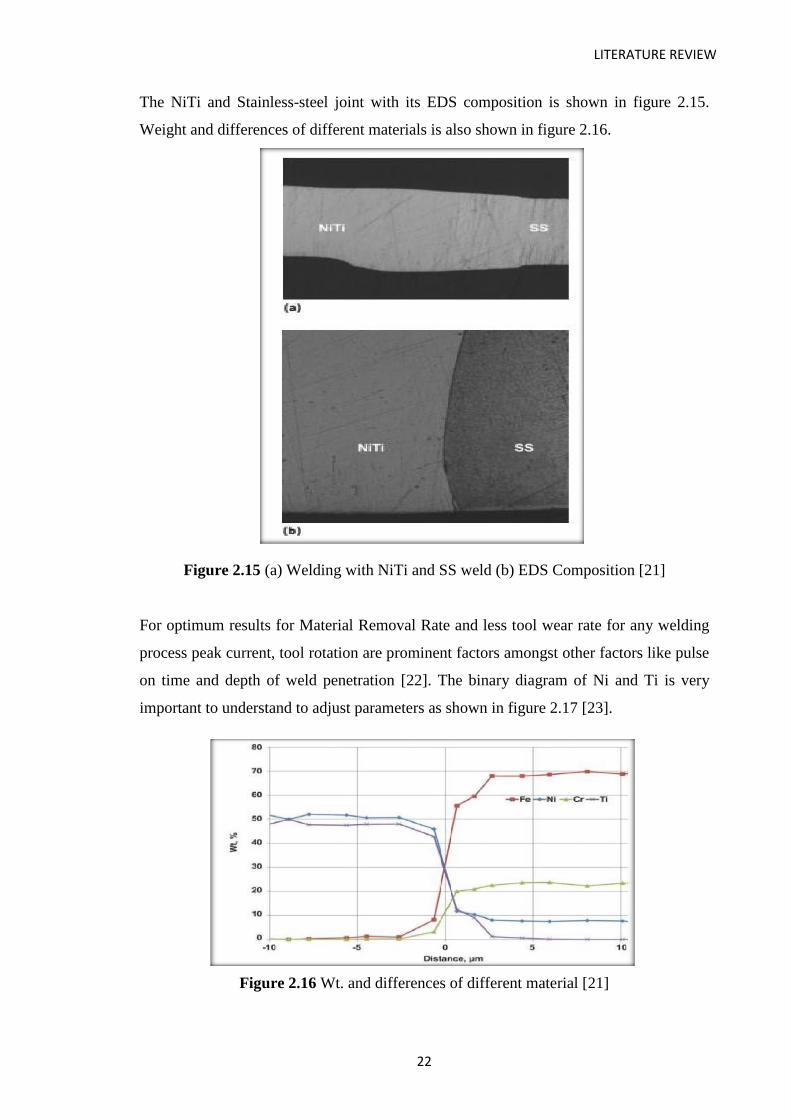
The NiTi and Stainless-steel joint with its EDS composition is shown in figure 2.15.
Weight and differences of different materials is also shown in figure 2.16.
Figure 2.15 (a) Welding with NiTi and SS weld (b) EDS Composition [21]
For optimum results for Material Removal Rate and less tool wear rate for any welding
process peak current, tool rotation are prominent factors amongst other factors like pulse
on time and depth of weld penetration [22]. The binary diagram of Ni and Ti is very
important to understand to adjust parameters as shown in figure 2.17 [23].
Figure 2.16 Wt. and differences of different material [21]
LITERATURE REVIEW
23
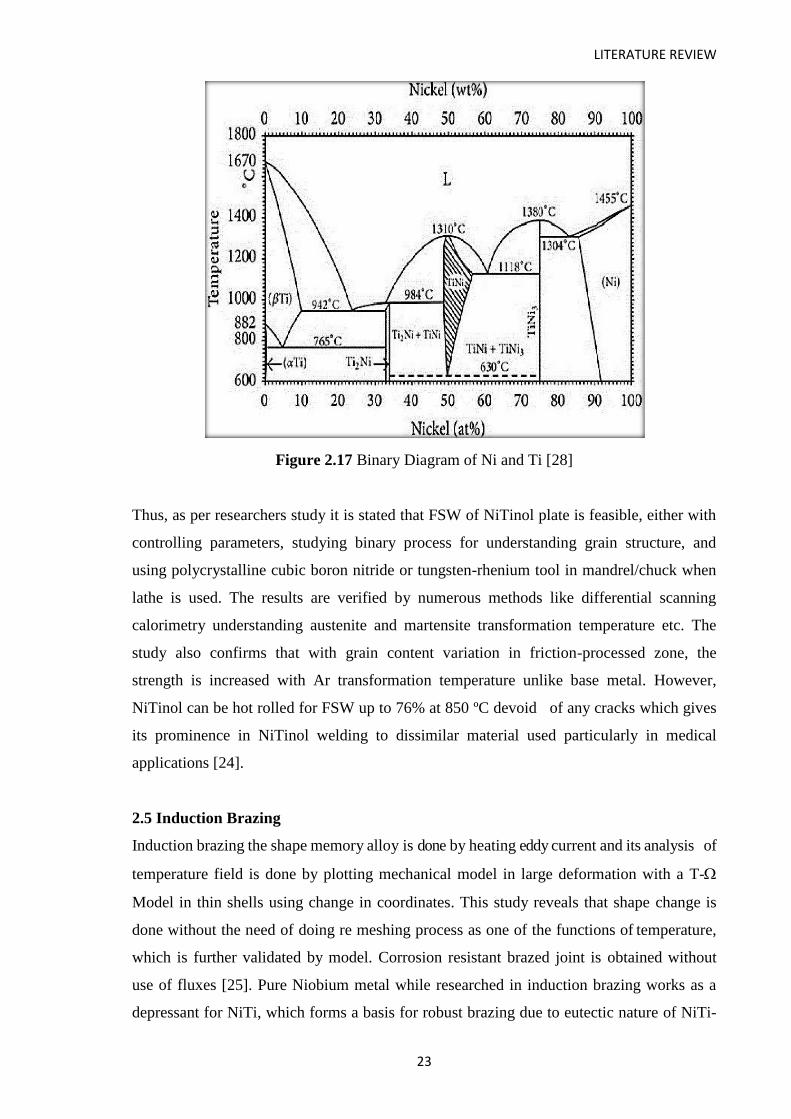
Figure 2.17 Binary Diagram of Ni and Ti [28]
Thus, as per researchers study it is stated that FSW of NiTinol plate is feasible, either with
controlling parameters, studying binary process for understanding grain structure, and
using polycrystalline cubic boron nitride or tungsten-rhenium tool in mandrel/chuck when
lathe is used. The results are verified by numerous methods like differential scanning
calorimetry understanding austenite and martensite transformation temperature etc. The
study also confirms that with grain content variation in friction-processed zone, the
strength is increased with Ar transformation temperature unlike base metal. However,
NiTinol can be hot rolled for FSW up to 76% at 850 ºC devoid of any cracks which gives
its prominence in NiTinol welding to dissimilar material used particularly in medical
applications [24].
2.5 Induction Brazing
Induction brazing the shape memory alloy is done by heating eddy current and its analysis of
temperature field is done by plotting mechanical model in large deformation with a T-
Model in thin shells using change in coordinates. This study reveals that shape change is
done without the need of doing re meshing process as one of the functions of temperature,
which is further validated by model. Corrosion resistant brazed joint is obtained without
use of fluxes [25]. Pure Niobium metal while researched in induction brazing works as a
depressant for NiTi, which forms a basis for robust brazing due to eutectic nature of NiTi-

LITERATURE REVIEW
24
Nb equilibrium. The joinery possesses excellent strength apart from transforming
characteristic, which can be achieved in low-cost batch process topology enhanced from
conventional wrought type of precursors understanding transition range of quasi binary
eutectic system [26]. It is found that for welding by Induction brazing, different materials
and joint thickness play prominent role in brazed joints [27]. NiTi wire temperature in
induction heating process is eluded to influence transient time so as to reach target
temperature of 55 ºC which overshoots [28-30.] The unusual behavior is due to martensitic
conversion as shown in figure 2.18 and 2.19 depict transition range of quasi binary eutectic
system [31].
Figure 2.18 Quasi binary eutectic system [31]
Figure 2.19 Time resolved brazing microstructure at 120 seconds [31]
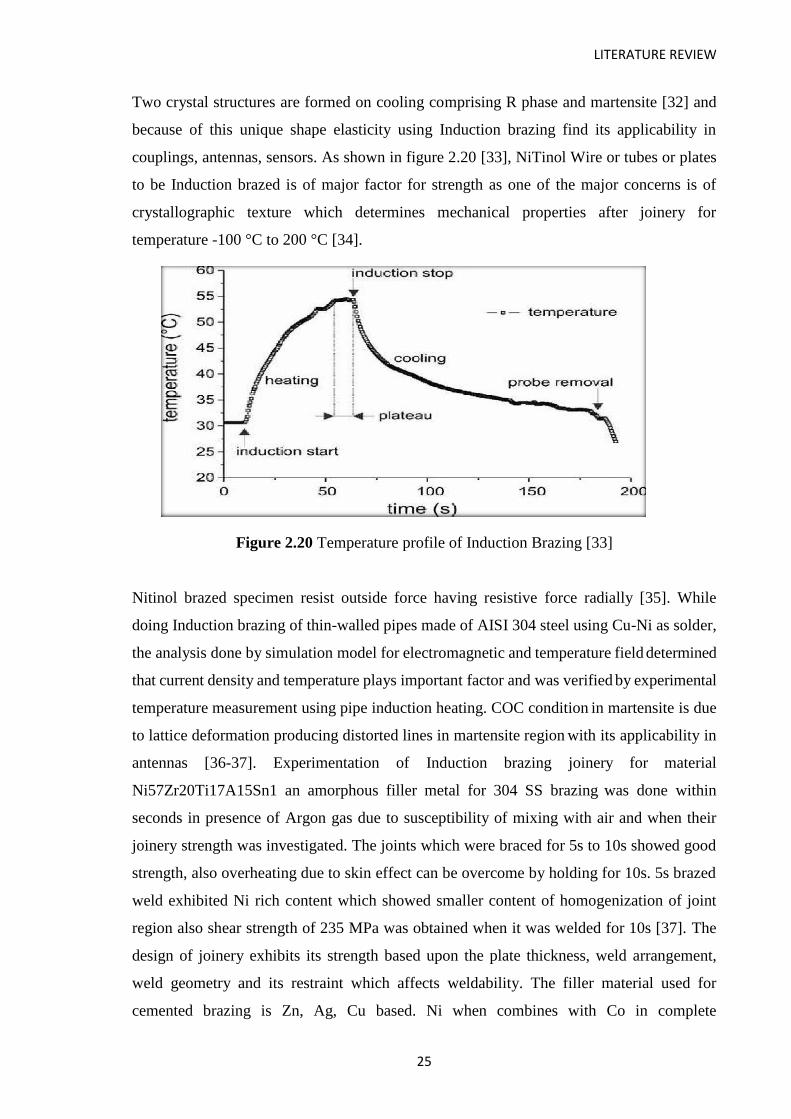
LITERATURE REVIEW
25
Two crystal structures are formed on cooling comprising R phase and martensite [32] and
because of this unique shape elasticity using Induction brazing find its applicability in
couplings, antennas, sensors. As shown in figure 2.20 [33], NiTinol Wire or tubes or plates
to be Induction brazed is of major factor for strength as one of the major concerns is of
crystallographic texture which determines mechanical properties after joinery for
temperature -100 °C to 200 °C [34].
Figure 2.20 Temperature profile of Induction Brazing [33]
Nitinol brazed specimen resist outside force having resistive force radially [35]. While
doing Induction brazing of thin-walled pipes made of AISI 304 steel using Cu-Ni as solder,
the analysis done by simulation model for electromagnetic and temperature field determined
that current density and temperature plays important factor and was verified by experimental
temperature measurement using pipe induction heating. COC condition in martensite is due
to lattice deformation producing distorted lines in martensite region with its applicability in
antennas [36-37]. Experimentation of Induction brazing joinery for material
Ni57Zr20Ti17A15Sn1 an amorphous filler metal for 304 SS brazing was done within
seconds in presence of Argon gas due to susceptibility of mixing with air and when their
joinery strength was investigated. The joints which were braced for 5s to 10s showed good
strength, also overheating due to skin effect can be overcome by holding for 10s. 5s brazed
weld exhibited Ni rich content which showed smaller content of homogenization of joint
region also shear strength of 235 MPa was obtained when it was welded for 10s [37]. The
design of joinery exhibits its strength based upon the plate thickness, weld arrangement,
weld geometry and its restraint which affects weldability. The filler material used for
cemented brazing is Zn, Ag, Cu based. Ni when combines with Co in complete
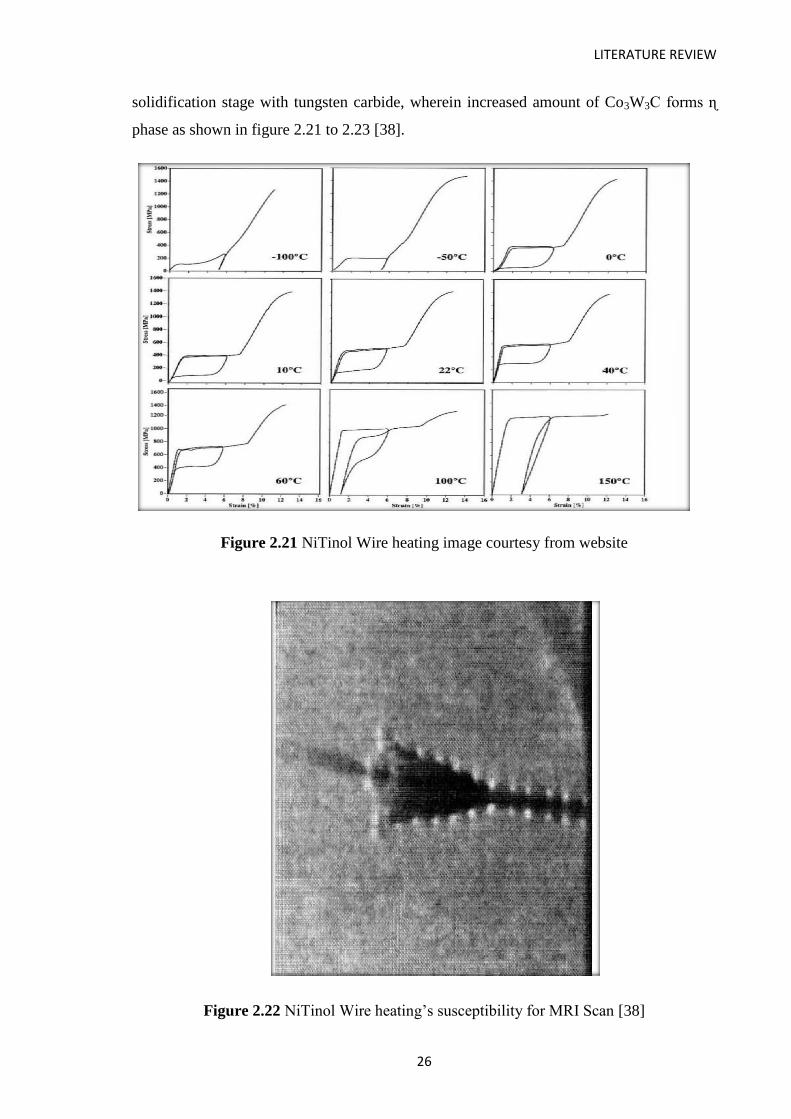
LITERATURE REVIEW
26
solidification stage with tungsten carbide, wherein increased amount of Co3W3C forms ɳ
phase as shown in figure 2.21 to 2.23 [38].
Figure 2.21 NiTinol Wire heating image courtesy from website
Figure 2.22 NiTinol Wire heating’s susceptibility for MRI Scan [38]

LITERATURE REVIEW
27
Figure 2.23 Stress-strain surface temperature for NiTi at various temperature [38]
The Ag –Cu-Ni pseudo alloy in air exhibited good properties of wettability & strength with
contact angle of less than 10º, wherein Ag based alloy is used for dissimilar joinery,
increasing the temperature or variation in joinery time showed that amount of Ag material
as filler was used less during welding process. It is studied that preferably a solder
comprising material with low melting point is preferable. The brazing temperature varying
from 600 ºC to over 1050 ºC was found apt and dependent on brazing parameters. The
advantages and applicability are enormous. The techniques like torch brazing, furnace
brazing, induction brazing have their characteristic determination. As such when slow and
even heating and cooling and big sized structure are to be joined it is preferred. Smaller
equipment’s can be repaired by torch brazing and when mass production is required
Induction brazing is preferred which is clean, easy and fast method of brazing. For
dissimilar joinery, tungsten-based alloy is suitable but when it is used, the defects of cracks
are observed due to formation of coalescence of small voids are formed in grain structure.
With increase in % of Ni60% Ti40% the activation energy and strain energy variation takes
place. Due to 60% Ni workability of joinery stress varies when the temperature drops
below 850 ºC in vacuum furnace. Microstructure constituent of dynamic recrystallization
takes when strain range which is important where flat geometry is preferred compared to
curved geometry [39]. Figure 2.24 shows the joint design and brazing of cemented carbide.
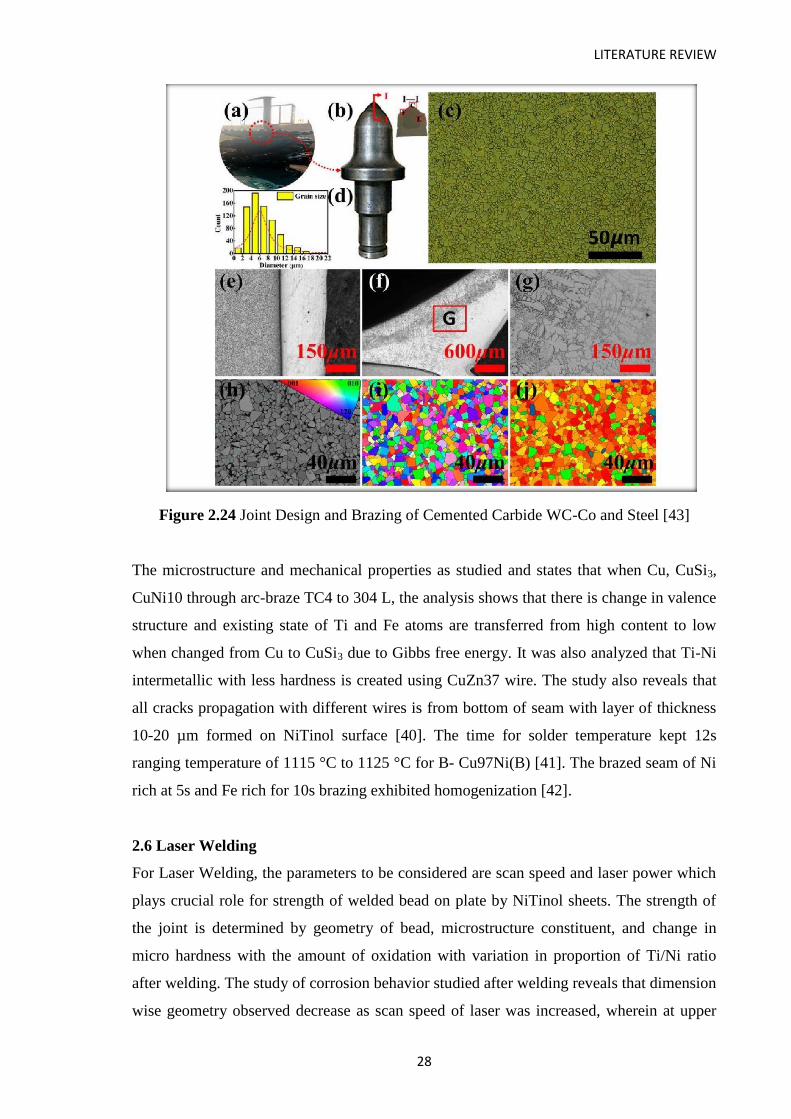
LITERATURE REVIEW
28
Figure 2.24 Joint Design and Brazing of Cemented Carbide WC-Co and Steel [43]
The microstructure and mechanical properties as studied and states that when Cu, CuSi3,
CuNi10 through arc-braze TC4 to 304 L, the analysis shows that there is change in valence
structure and existing state of Ti and Fe atoms are transferred from high content to low
when changed from Cu to CuSi3 due to Gibbs free energy. It was also analyzed that Ti-Ni
intermetallic with less hardness is created using CuZn37 wire. The study also reveals that
all cracks propagation with different wires is from bottom of seam with layer of thickness
10-20 µm formed on NiTinol surface [40]. The time for solder temperature kept 12s
ranging temperature of 1115 °C to 1125 °C for B- Cu97Ni(B) [41]. The brazed seam of Ni
rich at 5s and Fe rich for 10s brazing exhibited homogenization [42].
2.6 Laser Welding
For Laser Welding, the parameters to be considered are scan speed and laser power which
plays crucial role for strength of welded bead on plate by NiTinol sheets. The strength of
the joint is determined by geometry of bead, microstructure constituent, and change in
micro hardness with the amount of oxidation with variation in proportion of Ti/Ni ratio
after welding. The study of corrosion behavior studied after welding reveals that dimension
wise geometry observed decrease as scan speed of laser was increased, wherein at upper

LITERATURE REVIEW
29
part of joinery showed the same aspects change with decrease in power. The proportional
properties of micro hardness content slowly became more with scan speed with dual failure
and single for parent metal, which showed that corrosion property of welded sample was
far more superior to actual metal plate. The research reveals that post weld heat treatment
when observed for study, weldability by laser welding with cemented carbides with Invar
increased as martensite was formed infusion zone with WC grain ≈ 30 µm [42]. The study
revealed that while laser welding of Ti6Al4 butt joint of 2 mm thickness the specific heat
input plays vital role. With increased speed, HAZ and FZ formed conic bead shape. Using
proper shielding gas with proper amount of devices usage in this method can be an apt
procedure. The specific heat variation was done with change in welding speed with Laser
power, Vickers Test determined strength as no filler wire, and shaped grooves were used
during this welding procedure. For involving Ti to reach at high temperature to study
thermal process temperature variation by specific heat was done as shown in figure 2.25 to
2.26 [43] with increase in % of Ni60% Ti40% the activation energy and strain energy
variation takes place.
Figure 2.25 Surface magnetic flux density at room temperature image courtesy
LANTHA TECH

LITERATURE REVIEW
30
Figure 2.26 Parameter for Magnetic flux by LANTHA TECH
Due to 60% Ni workability of joinery stress varies when the temperature drops below
950ºC.Microstrure constituent of dynamic recrystallization takes when strain ranges from
0.2 to 1.0 as shown in figure 2.27 and 2.28 [44].
Figure 2.27 Microstructure of NiTi-304 laser welded at HAZ and FZ zone [44]
It was also analyzed that Ti-Ni intermetallic with less hardness is created using CuNi10
wire decreasing from 769 Hv and max tensile strength increases from 186.4 to 319.4 MPa.
The study also reveals that all cracks propagation with different wires is from bottom of
seamin TC4 due to high Schmidt factor which is almost more than 200 m/s which was
measured by high-speed camera 200000 fps [45]. This paper researched determining these

LITERATURE REVIEW
31
two features, which were assessed by Transmission electron microscopy for microstructure
content determination whereas for corrosion 0.9% NaCl and Hank’s solution was
employed. It was studied that base metal showed single austenite (B2) phase exhibiting
highest corrosion resistance. Whereas, base metal showed a single austenite matrix with
the phase constitute with the precipitation of R-phase, hence reduced the corrosion
potential, which resulted in weakest zone [45].
Figure 2.28 Peak Strain [44]
Zhi Zeng Mao Yang Jao Pedro Oliveira, Di Song, Bi Peng researched that mechanical,
physical along with distinct phase change characteristics of base material of equivalent base
and other specimen with dissimilar material laser welded which reached 88.4% and 67.5%
of the wire BM ductility. Microhardness value slowly increases from center to base region
[46]. The research reveals that post weld heat treatment when observed for study, the
corrosion resistant increased at 200 ºC with tensile strength up to ~ 1.8 times.

LITERATURE REVIEW
32
However, at 400 ºC the properties depreciated forming precipitates of intermetallic of
Fe2Ti, Cr2Ti, FeNi, Ni3Ti, which deduced that proper control of PWHT temperature is a
requisite for good strength of joinery of NiTi-304 AISI [47]. When heat treated Ti- 6Al-4V
with 1-2 mm thickness weld strength was assessed laser welded by Nd:YAG by
determining welding speed as prominent factor of surface morphology and shape, defects,
strength of joinery. The amalgamation zone comprised of higher joint strength with
reduced ductility due to micro pores an Al2O presence [48]. Laser welding is found to be
most apt method and find its prominence in medical sector for NiTinol, However, limited
knowledge prevails as to how laser-welding parameter determines microstructure
properties and corrosion resistance as shown in Table 2.4 [48-49].
Table 2.4 Summary of Laser Operating Parameter [48]
Processing
Parameter CO2 Laser
Nd: YAG (cw)
laser
Nd:YAG (pw)
laser
Laser 2200 2000 315
Average Peak --- --- 3000
Pulse frequency ---- ---- 70
Pulse duration --- --- 1.5
Travel 1.75 2.5 38×10-3
Focal point -0.4 -0.4 -0.8
Focal spot 0.30 0.48 0.05
Heat 75.4 48.0 497.4
Shielding Gas Argon Argon Argon
This paper researched these two features, which were assessed by transmission electron
microscopy for microstructure content determination whereas for corrosion 0.9% NaCl and
Hank’s solution was employed [50]. It was found in study that joint breaking force exertion
was 77.2% and 71.4%. The residual plastic strain variation of dissimilar material was of
study at different temperature during cycling test helping for design of multi- functional
monolithic structure [51]. The NiTinol pseudo elasticity content makes it a preferable
material in auto sector, aero sector, though challenges are associated with its joinery as
process parameters plays vital role in strength of laser-welded joinery. Schloßmaker et al.
investigated Ni rich and Ti rich NiTinol welding procedure, whereas Tussi et al. studied
the functional properties of welding. Cyclic loading increases after welding procedure as
shown in figure 2.29 and 2.30 [52].

LITERATURE REVIEW
33
Figure 2.29 Bend Test K10 specimen (b) Bending K40 [52]
Figure 2.30 Multiple plateau of laser welded specimen [52]

LITERATURE REVIEW
34
Falvo et al. stated that large strain application of Ti needs to be avoided; commercially
SE508 Ni strip of 0.37 mm thickness was used for laser welding. The test indicated that at
room temperature the base metal is predominantly austenite, therefore pseudo elasticity
behavior is exhibited. The researcher’s study revealed that fracture surface analysis was
made by varying welding parameters to analyze the weld strength, pseudoelastic and cyclic
loading of joinery. Peak power and pulse frequency played prominent role in determining
tensile strength and ductility of micro laser welded material. As shown in figure multiple
plateaus existed due to SIM transformation during welding deformation. Welded specimen
showed higher permanent residual strain with large efficiency during starting of 5 cycles
and then latter base metal showed the presence of ductile dimpled surface, while welded
specimen both brittle at low peak power and ductility at high peak power [53]. The shape
setting procedure of NiTinol Wire was carried out by Laser beam at various intensities. It
was researched that single-track type of beam induces pseudo elasticity property, which
was studied by calorimeter, mechanical & microstructural properties. Laser in power range
of 37-45% were used for this study. With extension in unloading plateaus, over 6% strain,
mechanical hysteresis of almost 42.5% was reduced. With high energy, XRD while power
rate increased the mechanical crystallographic leading to defectively reduced and increased
strain property. NiTi to NiTi laser welding shows 75% of tensile strength unlike pure
NiTinol wire tensile strength. However, for welding NiTinol to steel no interlayer was used
during the process. For dissimilar joints, provided strong bonding strength in fusion and
HAZ compared to higher plateaus stress level, as shown in figure 2.31 and 2.32 [54].
Properties of nickel-titanium exhibits 75% of ultimate tensile strength when joined NiTi to
NiTi for joining with steel, no interlayer was required. NiTi to thin NiTi wire also shows
the good strength. [55]. Butt joint two NiTinol sheets when laser welded with thickness of
1mm using ytterbium: yttrium aluminum garnet-Yb: YAG, the studies of phase
transformation temperature, UTS, hardness revealed that nominal difference existed in the
assessed properties in between water quenched and normalized one. It was deduced that
water quenched laser welded specimen had better characteristics than latter one. Laser
hybrid welding utilizes laser and arc welding producing gap bridging qualities [56] as
shown in figure 2.33, 2.34 and 2.35 [57]. While laser welding NiTi and 304 SS, to reduce
the content of alloying of Ti and Fe were suppressed by Ni rich filler metal. Pulse energy
did not form more penetration of weld. The maximum penetration of zone obtained was 483
µm and 13.1 µm.

LITERATURE REVIEW
35
Figure 2.31 DCS scan of wires in different conditions [54]
Figure 2.32 2D XRD frame gathered at 1D11 beamline of ESRF from wires [54]
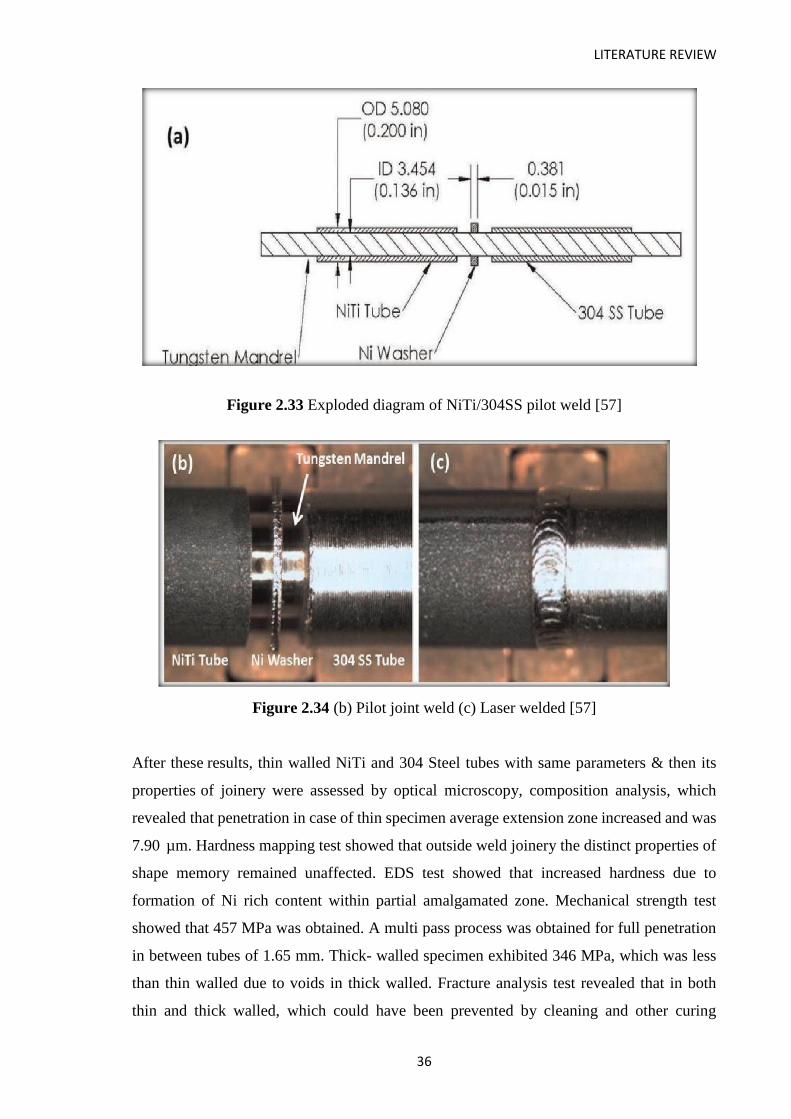
LITERATURE REVIEW
36
Figure 2.33 Exploded diagram of NiTi/304SS pilot weld [57]
Figure 2.34 (b) Pilot joint weld (c) Laser welded [57]
After these results, thin walled NiTi and 304 Steel tubes with same parameters & then its
properties of joinery were assessed by optical microscopy, composition analysis, which
revealed that penetration in case of thin specimen average extension zone increased and was
7.90 µm. Hardness mapping test showed that outside weld joinery the distinct properties of
shape memory remained unaffected. EDS test showed that increased hardness due to
formation of Ni rich content within partial amalgamated zone. Mechanical strength test
showed that 457 MPa was obtained. A multi pass process was obtained for full penetration
in between tubes of 1.65 mm. Thick- walled specimen exhibited 346 MPa, which was less
than thin walled due to voids in thick walled. Fracture analysis test revealed that in both
thin and thick walled, which could have been prevented by cleaning and other curing
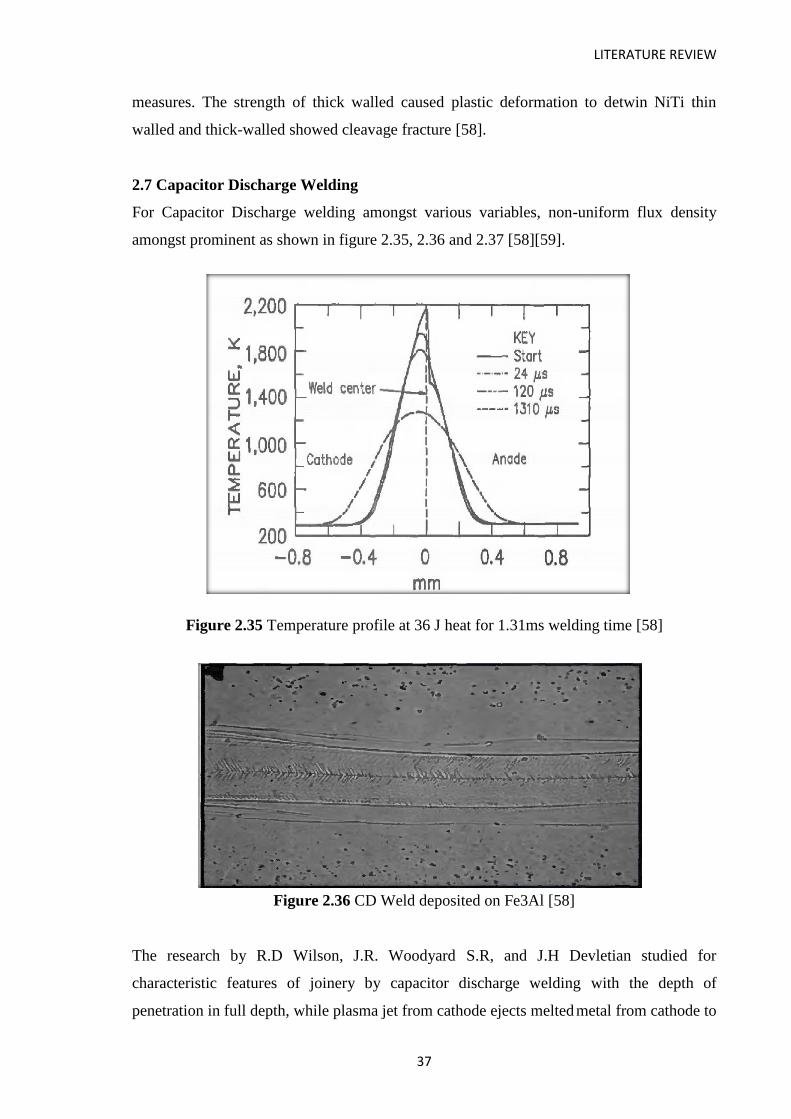
LITERATURE REVIEW
37
measures. The strength of thick walled caused plastic deformation to detwin NiTi thin
walled and thick-walled showed cleavage fracture [58].
2.7 Capacitor Discharge Welding
For Capacitor Discharge welding amongst various variables, non-uniform flux density
amongst prominent as shown in figure 2.35, 2.36 and 2.37 [58][59].
Figure 2.35 Temperature profile at 36 J heat for 1.31ms welding time [58]
Figure 2.36 CD Weld deposited on Fe3Al [58]
The research by R.D Wilson, J.R. Woodyard S.R, and J.H Devletian studied for
characteristic features of joinery by capacitor discharge welding with the depth of
penetration in full depth, while plasma jet from cathode ejects melted metal from cathode to

LITERATURE REVIEW
38
anode during arcing time which led to cooling of anode. Metal spatter did not caused
extrusion but from expulsion during capacitor discharge welding time. With unequal
heating and cooling ratio in anode and cathode due to unequal heating time due to plasma
jet defining as one-dimensional process [63].
Figure 2.37 Tip length of 1.4 mm Capacitor discharge welding process used to join 6.35
mm Fe3Al solid cylinders with 100 V [58]
As suggested by F.Palano, F.W Panella, V Dattoma, the capacitor discharge welding uses
high–intensity current pulses, discharged by large capacitors. Multipoint contact
characteristic features minimize stress concentration effect at weld toe, which formed thin
weld beads with excellent material continuity [59]. As studied by Johannes Koal, Martin
Baumgarten, Stefan Heilmann, Jorg Zschetzsche and UWE Fussel have studied about
capacitor discharge welding with high current pulses in short welding times. Experimental
process investigated were restricted for the limited zones in the confined area due to
covered contact zone with short processing time with finite element for suitable time with
usage of multiphysics numerical model in APDL with ring projection for joining. Materials
En-AW-6082 used for ring projection and EN-AW-5083 used for sheet metal. The model
design was investigated for thermal-electric for measured voltage. The discontinuous
geometry using simulated time up to 0.57 ms to 1.67 ms. indirect coupling allowed the
dynamic calculation of contact resistance with model to complexity with large
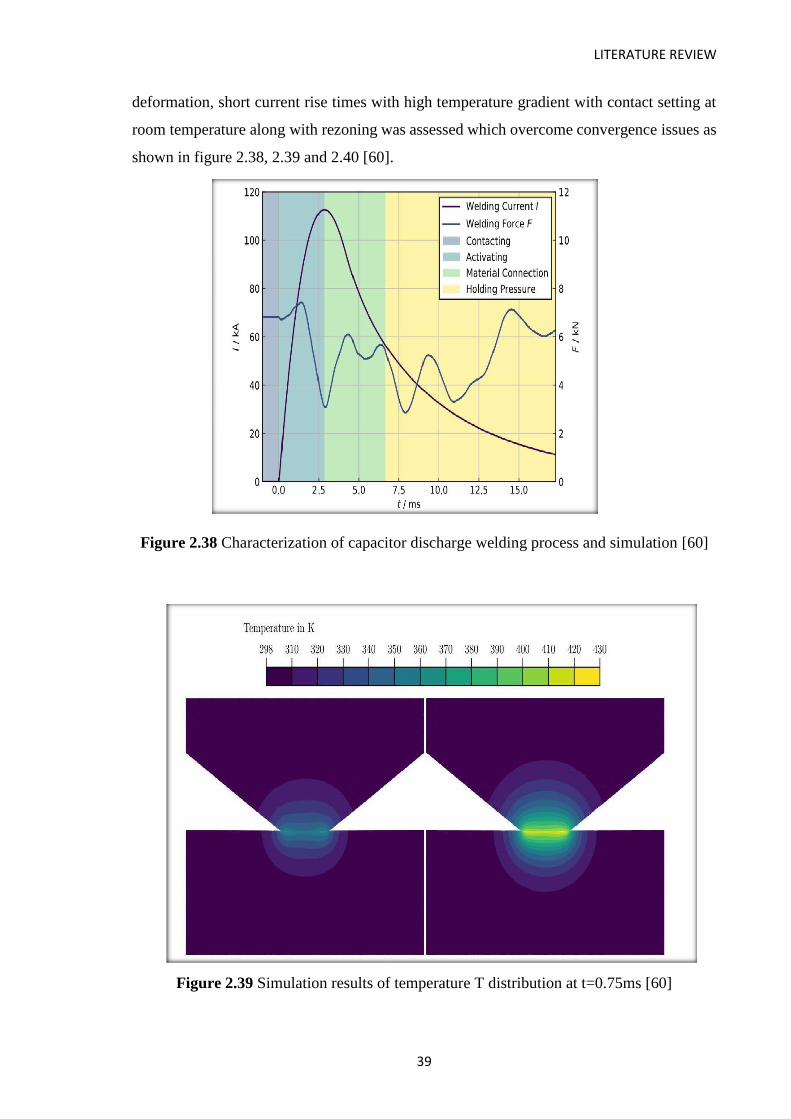
LITERATURE REVIEW
39
deformation, short current rise times with high temperature gradient with contact setting at
room temperature along with rezoning was assessed which overcome convergence issues as
shown in figure 2.38, 2.39 and 2.40 [60].
Figure 2.38 Characterization of capacitor discharge welding process and simulation [60]
Figure 2.39 Simulation results of temperature T distribution at t=0.75ms [60]
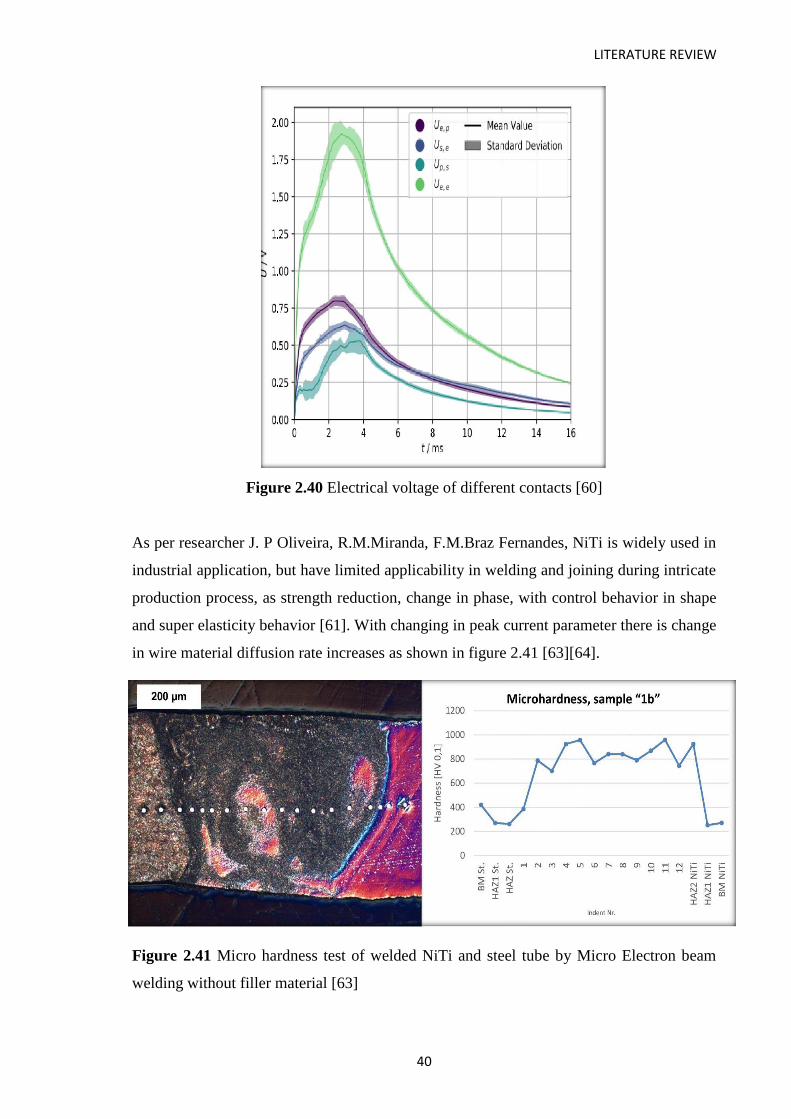
LITERATURE REVIEW
40
Figure 2.40 Electrical voltage of different contacts [60]
As per researcher J. P Oliveira, R.M.Miranda, F.M.Braz Fernandes, NiTi is widely used in
industrial application, but have limited applicability in welding and joining during intricate
production process, as strength reduction, change in phase, with control behavior in shape
and super elasticity behavior [61]. With changing in peak current parameter there is change
in wire material diffusion rate increases as shown in figure 2.41 [63][64].
Figure 2.41 Micro hardness test of welded NiTi and steel tube by Micro Electron beam
welding without filler material [63]

LITERATURE REVIEW
41
WEDM is thermal process [65] in which drilling forces can exceed above 5000 N due to
viscosity and pseudo elasticity content of NiTinol [66]. In EDM cracks subsequently start
at vertical portion when using NiTinol [67]. MRR depends upon melting temperature and
alloy composition [68-69]. WEDM and EDM find applicability by using hybrid process by
using NiTinol [70-71]. The stability of NiTinol alloy is primarily dependent on TiO2 layer
existing on surface layer can be propagated by self-synthesis temperature which can be
heat treated due to high plateau stress using additive manufacturing process as NiTinol
possess biocompatibility feature with thermo mechanical affected zone TMAZ [72-77].
Heat treatment at 950 °C -1 h is optimized for bimetallic additively manufactured structure,
hinderance is nondestructive testing of parts [78-79-80].
2.8 Conclusion of the literature review
• The research paper published so far present study of NiTinol wire welding on
different similar as well as dissimilar material.
• The various joinery methods have different parameters implications while joinery
with NiTinol.
• Dissimilar material strength is less as compared to similar material welding or
welding with Ni or Ti content or as filler material.
• Joinery with Nitinol is not simple as other material. It is expensive except few
domains like Medical, Aero, Auto sectors. It finds limited applicability but repaired
or joinery is very accurate similar to new part if it is done with optimized controlled
parameters. Temperature, feed, power, voltage, tool tilt angle, axial load, shielding
with gas and filler material should be specific. However, apart from this as while
welding there is change in crystal structure so change in pseudo elasticity content
of NiTinol and to retain its mechanical properties of Nitinol after welding, it
requires utmost specific process of curing which varies with process to process of
joinery.
• Curing of Nitinol methods are heat treatment, acetone bath, vacuum autoclave
which is implied based upon joinery methods.
• However, no research is available, which focuses on optimizing welding
parameters of welding of NiTinol wire on AISI 304 butt joint using NiTinol as
filler material by assessing its repaired strength using DOE method with Taguchi of
all specified six joinery methods and then applying the Poisson method of Johnson
Cook Model, simulated annealing i. e using combination of analytical & simulation
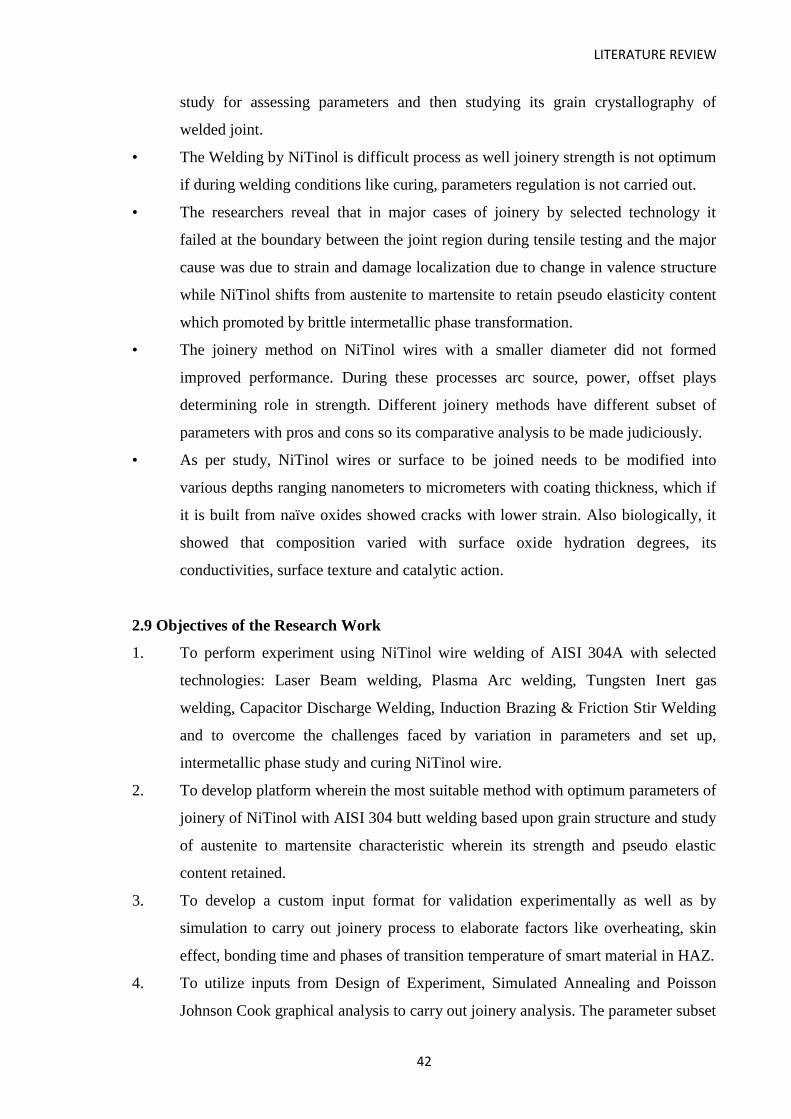
LITERATURE REVIEW
42
study for assessing parameters and then studying its grain crystallography of
welded joint.
• The Welding by NiTinol is difficult process as well joinery strength is not optimum
if during welding conditions like curing, parameters regulation is not carried out.
• The researchers reveal that in major cases of joinery by selected technology it
failed at the boundary between the joint region during tensile testing and the major
cause was due to strain and damage localization due to change in valence structure
while NiTinol shifts from austenite to martensite to retain pseudo elasticity content
which promoted by brittle intermetallic phase transformation.
• The joinery method on NiTinol wires with a smaller diameter did not formed
improved performance. During these processes arc source, power, offset plays
determining role in strength. Different joinery methods have different subset of
parameters with pros and cons so its comparative analysis to be made judiciously.
• As per study, NiTinol wires or surface to be joined needs to be modified into
various depths ranging nanometers to micrometers with coating thickness, which if
it is built from naïve oxides showed cracks with lower strain. Also biologically, it
showed that composition varied with surface oxide hydration degrees, its
conductivities, surface texture and catalytic action.
2.9 Objectives of the Research Work
1. To perform experiment using NiTinol wire welding of AISI 304A with selected
technologies: Laser Beam welding, Plasma Arc welding, Tungsten Inert gas
welding, Capacitor Discharge Welding, Induction Brazing & Friction Stir Welding
and to overcome the challenges faced by variation in parameters and set up,
intermetallic phase study and curing NiTinol wire.
2. To develop platform wherein the most suitable method with optimum parameters of
joinery of NiTinol with AISI 304 butt welding based upon grain structure and study
of austenite to martensite characteristic wherein its strength and pseudo elastic
content retained.
3. To develop a custom input format for validation experimentally as well as by
simulation to carry out joinery process to elaborate factors like overheating, skin
effect, bonding time and phases of transition temperature of smart material in HAZ.
4. To utilize inputs from Design of Experiment, Simulated Annealing and Poisson
Johnson Cook graphical analysis to carry out joinery analysis. The parameter subset

LITERATURE REVIEW
43
formulated can overcome the challenges faced through these joinery techniques
specifically of wetting between the base material and NiTinol as cured and uncured
filler material, overheating, metallurgical interaction between liquidous NiTinol
and AISI 304 A base plate.
Figure: 2.42 describes graphically the statistics of experiments conducted by researchers of
six joinery techniques studied here by using NiTinol wire to understand the concept
viability of joinery process.
Figure 2.42 Welding with NITinol wire
Figure 2.43 describes the flow and methodology implied for this research. Figure 2.44
describes publication statistics of various joinery methods in the world to find the
applicability of joinery method by NiTinol Wire.

LITERATURE REVIEW
44
Figure 2.43 Flow chart of research work
Figure 2.44 Publications statistics in the world

LITERATURE REVIEW
45
2.10 Research Gap and Definition of the Problem
From the above mentioned literature review and study of various joinery methods using
NiTinol wire with AISI 304 /Ti-Al2O4 plate, following said problems and gap have been
identified.
The study reveals NiTinol wire welding with similar or dissimilar material with AISI
304A, but detailed analysis is not done as to why this range of parameters has been
selected. The difficulties faced in this type of joinery and expense incurred is not technique
to material specific.
As explained diagrammatically, more than 100 research papers reveal different conditions
and parameters range and their study of strength, hardness testing, amongst papers the
focus is made on heat control, pulse range, feed depth, etc.
These parameters vary from processes of joinery to NiTinol material shape, like wire,
tubes or sheet with similar to dissimilar materials to select optimum parameter, but from
DOE to select optimum for making comparative analysis keeping factors similar is not
done specifically yet.
When parameters are kept same but processes vary so the strength and pseudoelastic range
vary. NiTinol is very difficult material to weld with dissimilar material without carrying
out curing procedure.
Challenges in joinery in researched techniques does not elaborate how parameters affect
for wetting between the base material and Nitinol as filler material.
2.11 Original Contribution by this Thesis
The contribution of this research will help the researchers and welding personnel to
explore the possibilities of repair work with NiTinol material. Still its current applicability
is limited for repair work of fine intricacy in aero-foil blades, medical applications,
actuators because of expenses and other complexities associated while joining NiTinol
with dissimilar materials. It has to be cured and carried out heat treatment process before
welding process in optimum parameters settings. The study explored unattended facets to
overcome the challenges faced in joining by smart material and the parameter and
experimental set up to understand phase transition for retaining smart material feature,
mechanical properties enhancement and preserving light joint weight feature.
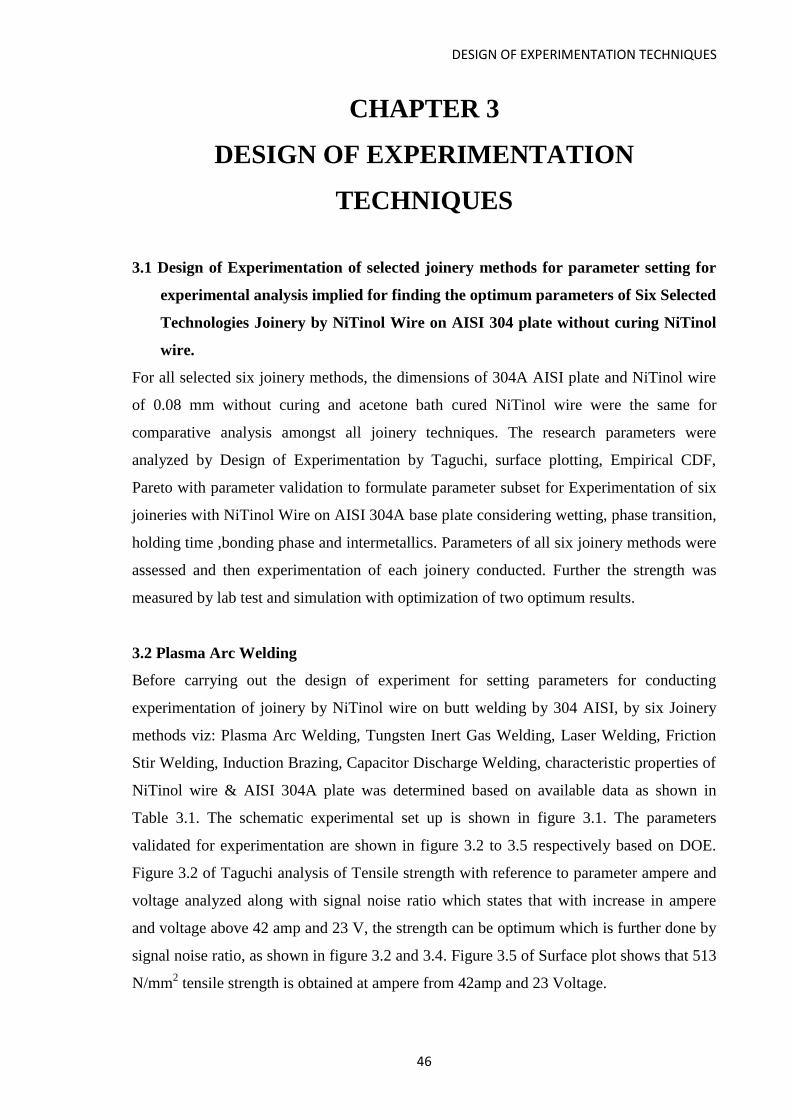
DESIGN OF EXPERIMENTATION TECHNIQUES
46
CHAPTER 3
DESIGN OF EXPERIMENTATION
TECHNIQUES
3.1 Design of Experimentation of selected joinery methods for parameter setting for
experimental analysis implied for finding the optimum parameters of Six Selected
Technologies Joinery by NiTinol Wire on AISI 304 plate without curing NiTinol
wire.
For all selected six joinery methods, the dimensions of 304A AISI plate and NiTinol wire
of 0.08 mm without curing and acetone bath cured NiTinol wire were the same for
comparative analysis amongst all joinery techniques. The research parameters were
analyzed by Design of Experimentation by Taguchi, surface plotting, Empirical CDF,
Pareto with parameter validation to formulate parameter subset for Experimentation of six
joineries with NiTinol Wire on AISI 304A base plate considering wetting, phase transition,
holding time ,bonding phase and intermetallics. Parameters of all six joinery methods were
assessed and then experimentation of each joinery conducted. Further the strength was
measured by lab test and simulation with optimization of two optimum results.
3.2 Plasma Arc Welding
Before carrying out the design of experiment for setting parameters for conducting
experimentation of joinery by NiTinol wire on butt welding by 304 AISI, by six Joinery
methods viz: Plasma Arc Welding, Tungsten Inert Gas Welding, Laser Welding, Friction
Stir Welding, Induction Brazing, Capacitor Discharge Welding, characteristic properties of
NiTinol wire & AISI 304A plate was determined based on available data as shown in
Table 3.1. The schematic experimental set up is shown in figure 3.1. The parameters
validated for experimentation are shown in figure 3.2 to 3.5 respectively based on DOE.
Figure 3.2 of Taguchi analysis of Tensile strength with reference to parameter ampere and
voltage analyzed along with signal noise ratio which states that with increase in ampere
and voltage above 42 amp and 23 V, the strength can be optimum which is further done by
signal noise ratio, as shown in figure 3.2 and 3.4. Figure 3.5 of Surface plot shows that 513
N/mm2 tensile strength is obtained at ampere from 42amp and 23 Voltage.

DESIGN OF EXPERIMENTATION TECHNIQUES
47
Table 3.1 Characteristic Properties of NiTinol and 304 steel
Properties 304 AISI NiTi
Density[g/cm3] 8 6,5
Fusion Temperatureº C 1450 1240-1310
Thermal Conductivity[W/mº C] 16 18
Heat Capacity [J/gº C] 0,5 0,32
Thermal Expansion Ratio[10-6/º C] 17,5 11
Ultimate Tensile strength[MPa] 500 754-960
Young Modulus[G Pa] 193 40(M),75(A)
Figure 3.1 Schematic Diagram of Plasma Arc Welding

DESIGN OF EXPERIMENTATION TECHNIQUES
48
Figure 3.2 Taguchi Analysis: Tensile Strength vs Ampere & Voltage of PAW
Figure 3.3 Response Table for Signal to Noise ratio for PAW

DESIGN OF EXPERIMENTATION TECHNIQUES
49
Figure 3.4 Empirical Cumulative Distribution Function of Ampere of PAW
Figure 3.5 Surface Plot of PAW
3.3 Tungsten Inert Gas Welding
Tungsten with 2.322 % thorium in electrode with 2.75 diameter nozzle was used with the
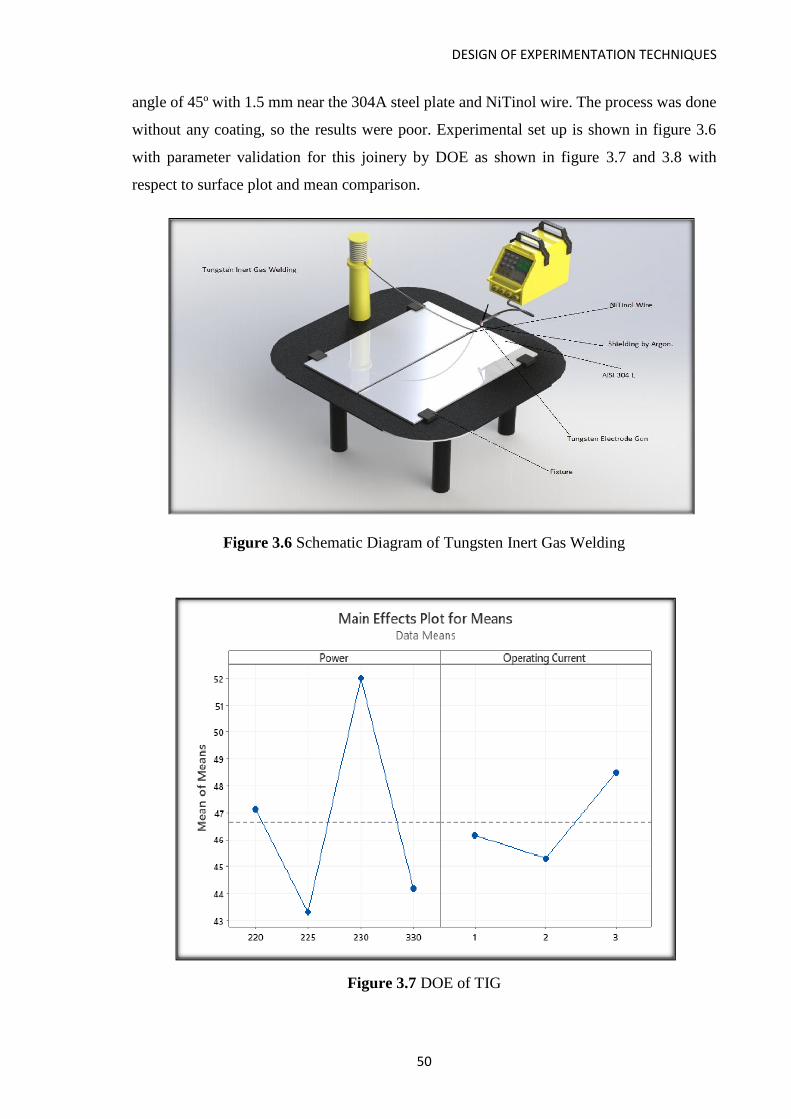
DESIGN OF EXPERIMENTATION TECHNIQUES
50
angle of 45º with 1.5 mm near the 304A steel plate and NiTinol wire. The process was done
without any coating, so the results were poor. Experimental set up is shown in figure 3.6
with parameter validation for this joinery by DOE as shown in figure 3.7 and 3.8 with
respect to surface plot and mean comparison.
Figure 3.6 Schematic Diagram of Tungsten Inert Gas Welding
Figure 3.7 DOE of TIG
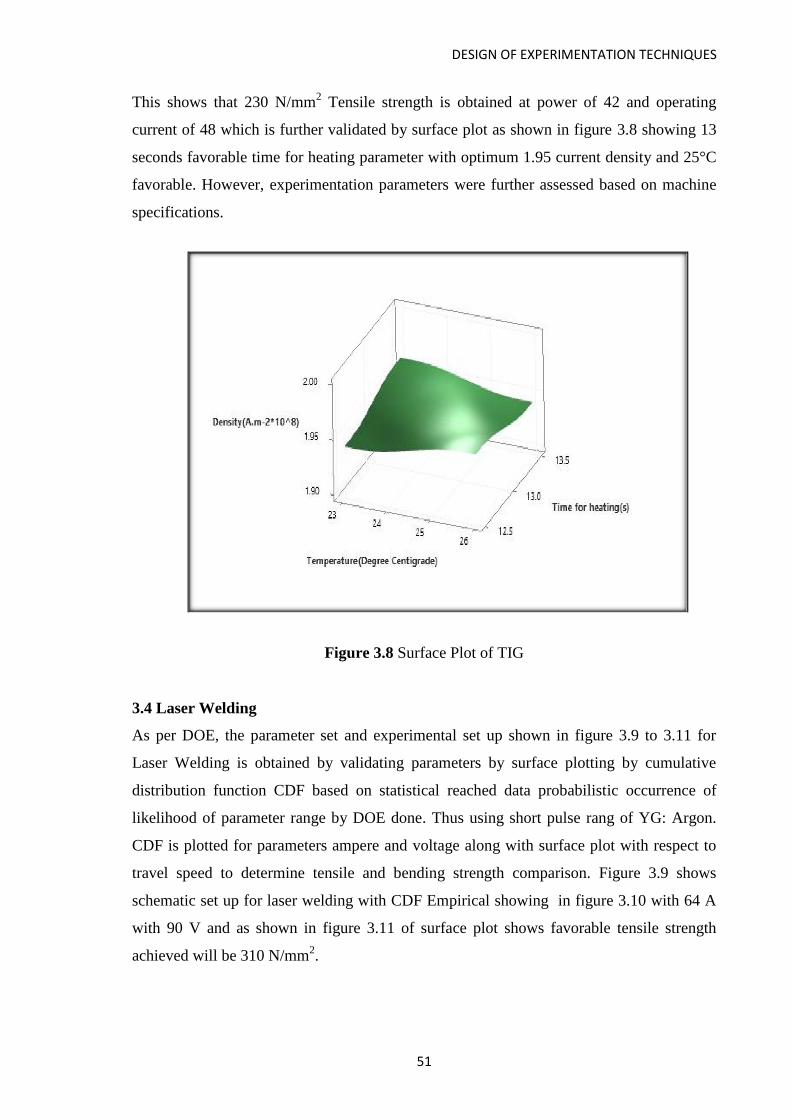
DESIGN OF EXPERIMENTATION TECHNIQUES
51
This shows that 230 N/mm2 Tensile strength is obtained at power of 42 and operating
current of 48 which is further validated by surface plot as shown in figure 3.8 showing 13
seconds favorable time for heating parameter with optimum 1.95 current density and 25°C
favorable. However, experimentation parameters were further assessed based on machine
specifications.
Figure 3.8 Surface Plot of TIG
3.4 Laser Welding
As per DOE, the parameter set and experimental set up shown in figure 3.9 to 3.11 for
Laser Welding is obtained by validating parameters by surface plotting by cumulative
distribution function CDF based on statistical reached data probabilistic occurrence of
likelihood of parameter range by DOE done. Thus using short pulse rang of YG: Argon.
CDF is plotted for parameters ampere and voltage along with surface plot with respect to
travel speed to determine tensile and bending strength comparison. Figure 3.9 shows
schematic set up for laser welding with CDF Empirical showing in figure 3.10 with 64 A
with 90 V and as shown in figure 3.11 of surface plot shows favorable tensile strength
achieved will be 310 N/mm2.
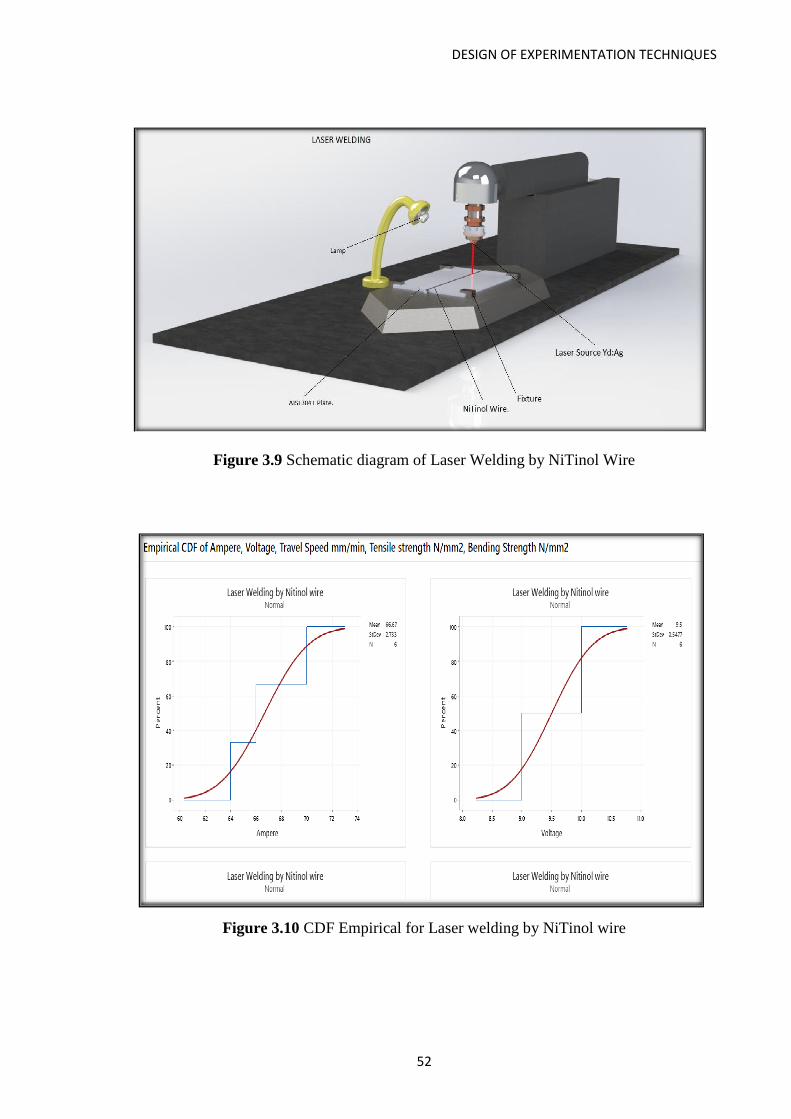
DESIGN OF EXPERIMENTATION TECHNIQUES
52
Figure 3.9 Schematic diagram of Laser Welding by NiTinol Wire
Figure 3.10 CDF Empirical for Laser welding by NiTinol wire

DESIGN OF EXPERIMENTATION TECHNIQUES
53
Figure 3.11 Surface Plot of Laser Welding by NiTinol Wire
3.5 Friction Stir Welding
The schematic diagram of FSW on manual lathe machine is shown in figure 3.12.
Figure 3.12 Schematic Diagram of Friction Stir Welding
The parameter subset was set by DOE as shown in figure 3.13 to 3.23. Taguchi analysis for
parameters of rpm is done which plays prominent factor in this welding. Surface Plot,
ANOVA, CDF and signal to noise ratio analysis done by MINITAB. Friction Stir welding

DESIGN OF EXPERIMENTATION TECHNIQUES
54
method decides parameter subset for factors of utilizing frictional force with exertion of
axial force up to 1 KN [84], the p values which is statistically later optimized as per
parameters subset. As shown in figure 3.13, 1200 rpm and upset forged force of 2 KN
validated by Empirical CDF as shown in figure 3.14 and 3.15, 3.16 of surface plot.
Figure 3.13 DOE of FSW
Figure 3.14 Empirical CDF of FSW

DESIGN OF EXPERIMENTATION TECHNIQUES
55
Figure 3.15 Surface plot of RPM v/s Upset Force v/s Hot Rolled
Figure 3.16 Surface Plot of FSW

DESIGN OF EXPERIMENTATION TECHNIQUES
56
Figure 3.17 Upset time v/s Upset force
Figure 3.18 SN ratio v/s Ampere

DESIGN OF EXPERIMENTATION TECHNIQUES
57
Figure 3.19 Statistical analysis for models
Figure 3.20 Response table for standard deviations
Figure 3.21 Estimated model coefficients for means

DESIGN OF EXPERIMENTATION TECHNIQUES
58
Figure 3.22 Response table for means
Figure 3.23 Estimated model coefficient for standard deviations
The parameters are further validated by ANOVA analysis 3.17 for upset times and upset
force. As shown in figure 3.18 S/N ratio validates S value of 0.4058 for ampere parameter
as shown in figure 3.19 which is further validated in 3.19 and 3.20 to 3.23 in statistical
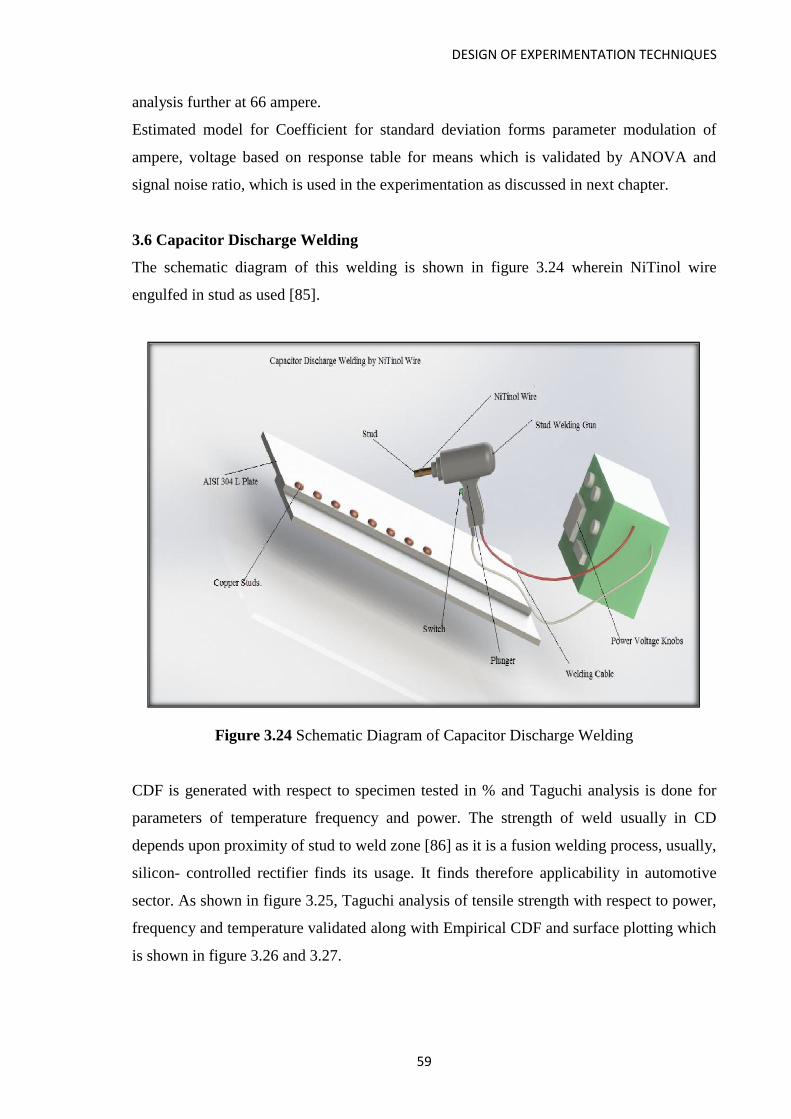
DESIGN OF EXPERIMENTATION TECHNIQUES
59
analysis further at 66 ampere.
Estimated model for Coefficient for standard deviation forms parameter modulation of
ampere, voltage based on response table for means which is validated by ANOVA and
signal noise ratio, which is used in the experimentation as discussed in next chapter.
3.6 Capacitor Discharge Welding
The schematic diagram of this welding is shown in figure 3.24 wherein NiTinol wire
engulfed in stud as used [85].
Figure 3.24 Schematic Diagram of Capacitor Discharge Welding
CDF is generated with respect to specimen tested in % and Taguchi analysis is done for
parameters of temperature frequency and power. The strength of weld usually in CD
depends upon proximity of stud to weld zone [86] as it is a fusion welding process, usually,
silicon- controlled rectifier finds its usage. It finds therefore applicability in automotive
sector. As shown in figure 3.25, Taguchi analysis of tensile strength with respect to power,
frequency and temperature validated along with Empirical CDF and surface plotting which
is shown in figure 3.26 and 3.27.

DESIGN OF EXPERIMENTATION TECHNIQUES
60
Figure 3.25 Capacitor Discharge Welding DOE
Figure 3.26 Empirical CDF of CD Welding.
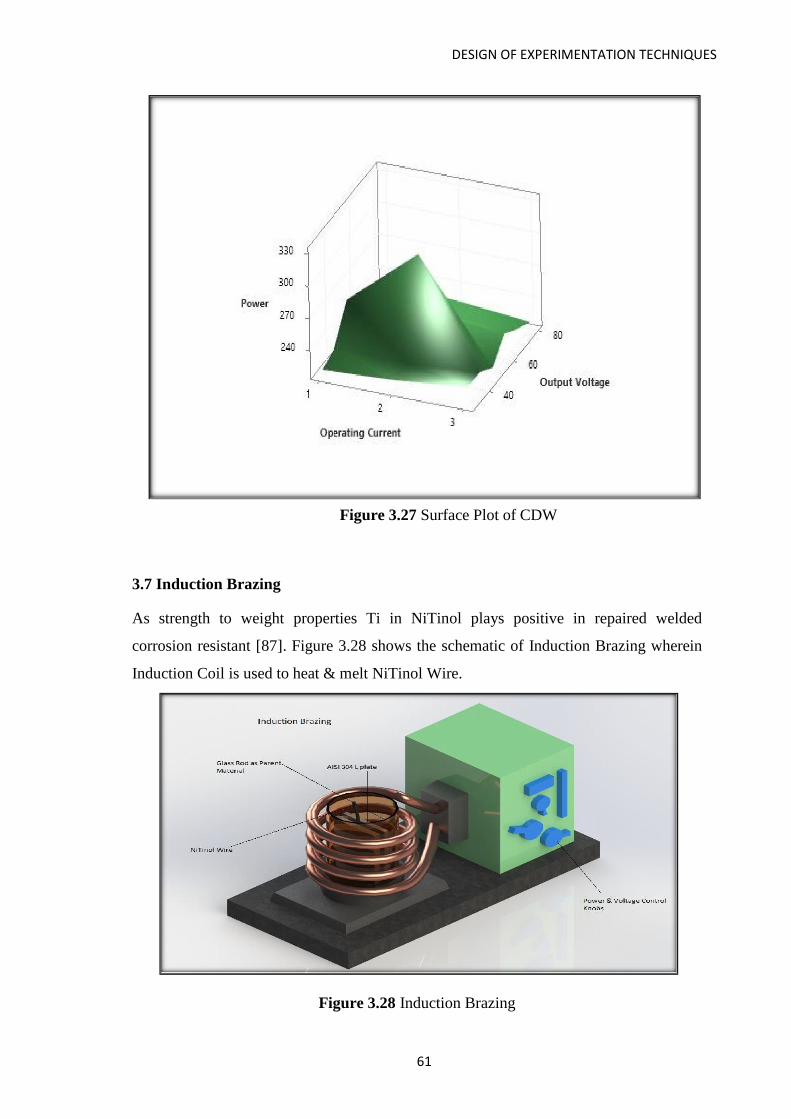
DESIGN OF EXPERIMENTATION TECHNIQUES
61
Figure 3.27 Surface Plot of CDW
3.7 Induction Brazing
As strength to weight properties Ti in NiTinol plays positive in repaired welded
corrosion resistant [87]. Figure 3.28 shows the schematic of Induction Brazing wherein
Induction Coil is used to heat & melt NiTinol Wire.
Figure 3.28 Induction Brazing

DESIGN OF EXPERIMENTATION TECHNIQUES
62
Empirical CDF in figure 3.29 shows temperature and frequency with current density
parameter analysis. Surface plot of temperature parameter shown in figure 3.30 depicts
the UTS of 222 N/mm2.
Figure 3.29 Empirical CDF of IB
Figure 3.30 Surface plot of temperature v/s frequency v/s power

EXPERIMENTAL INVESTIGATIONS
63
CHAPTER 4
EXPERIMENTAL INVESTIGATIONS
PERFORMING J O I N E R Y BY NiTinol WIRE ON
AISI 304A PLATE
DOE results set parameter ranges for ampere, voltage, frequency, pulse duty cycle, current
density, axial load, tilt angle, power varying in selected six joinery methods were
performed for butt welding 304 AISI plate using NiTinol wire without curing. Lab tests
reports and optical microscopy analyzed the following results for crystal grain structure
change of NiTinol from austenite to Martensite.
The comparative results of the tensile strength, bend test and hardness test were then
determined to select two optimum processes favorable for carrying out welding by uncured
NiTinol wire. Friction Stir Welding –Manual & Robotics and Induction Brazing were
selected technologies, which were later analyzed with simulated annealing and algorithm
analytical to find controlled optimized parameters to find bias percentage error check of
these processes to validate the same.
4.1 Plasma Arc Welding
AISI 304 Plate with dimension 100 W × 1T × 250 was butt welded by Nitinol wire with
diameter 0.96 as filler material which was kept same while welding with all selected six
technologies with parameters variations. Nitinol wire was used for welding. The Table 4.1
shows the parameters set while performing plasma arc welding on AISI 304 by NiTinol
wire. The welding parameters were based on DOE and analysis based on a lab report
which is given in Table 4.1. Experimentation performed as shown in figure 4.1 using the
validated parameter subset. Experiment comprised of using concise high velocity plasma
of 0.5 Lpm in presence of shielding gas with non-consumable electrode with butt welding
base plate using NiTinol cured in acetone bath for 15 s. In between two bases AISI 304A
NiTinol wire diffused forming amalgamation in nugget area with phase transition from
austenite to martensite.

EXPERIMENTAL INVESTIGATIONS
64
Table 4.1 Parameters for Plasma Welding
Description Parameter
Plasma Gas 0.5 LpM
Shielding Gas 8 LpM
Ampere 40
Volt 22
Pulse frequency 3.5
Secondary Current 50% of main current (27.5)
Pulse Duty Cycle 50%
Travel Speed 140 mm/min
Figure 4.1 Plasma arc welded 304 plates with NiTinol wire
4.2 Tungsten Inert Gas Welding
The optimum parameter is based on breaking load and standard deviation over 960 MPa
[88-89]. The TIG welding was carried out on AISI 304 A plate with NiTinol wire using
TIG torch & NiTinol wire from the fixture in spool form as shown in figure 4.2, while butt

EXPERIMENTAL INVESTIGATIONS
65
welding AISI 304 plate which is based on the parameters set by DOE as shown in the
Table 4.2
Figure 4.2 Laboratory photograph
Table 4.2 Parameter set by DOE
Description Parameter
Argon Gas 0.8 LpM
Shielding Gas 12 LpM
Temperature 24º C
Current Density 1.95
Ampere 55 Ampere
Voltage 9 V to 10 V
Pulse frequency 3.5
Secondary Current 50% of main current(27.5 amp)
Pulse Duty Cycle 50%
Travel Speed. 140 mm/min.
The test report which is performed on computerized testing machine as shown in figure
4.3, reveals that tensile strength does not meet with ASME standards.

EXPERIMENTAL INVESTIGATIONS
66
Figure 4.3 Computerized Compression Testing Machine
4.3 Laser Welding
Interlayer formation during welding plays prominent role including refinement of grain
size [90-91]. Taguchi analysis with L9 series used using parameter variations in samples
[92-93]. Laser welding as shown in the figure 4.4 was performed with Nd: Yag with the
following machine specification as shown in Table 4.3 and 4.4.
Figure 4.4 Lab experiment photograph

EXPERIMENTAL INVESTIGATIONS
67
Table 4.3 Parameter set based on DOE
Table 4.4 Laser Nd: Yag Welding Machine specifications.
Material AISI 304 & NiTinol wire
Automatic Grade Automatic
Output Current 100-200 A
Frequency 50 - 60 Hz
Voltage 380 - 440 V
Weld Thickness 0.5 - 3 mm
Laser Power 500-3000 W
Laser Wavelength 1064 NM
The Laser welding as shown in figure 4.5 and 4.6 depicts the experimentation done by
Laser welding on AISI 304 A plate with NiTinol Wire using short range of LASER pulse.
Figure 4.5 Laser welding machine
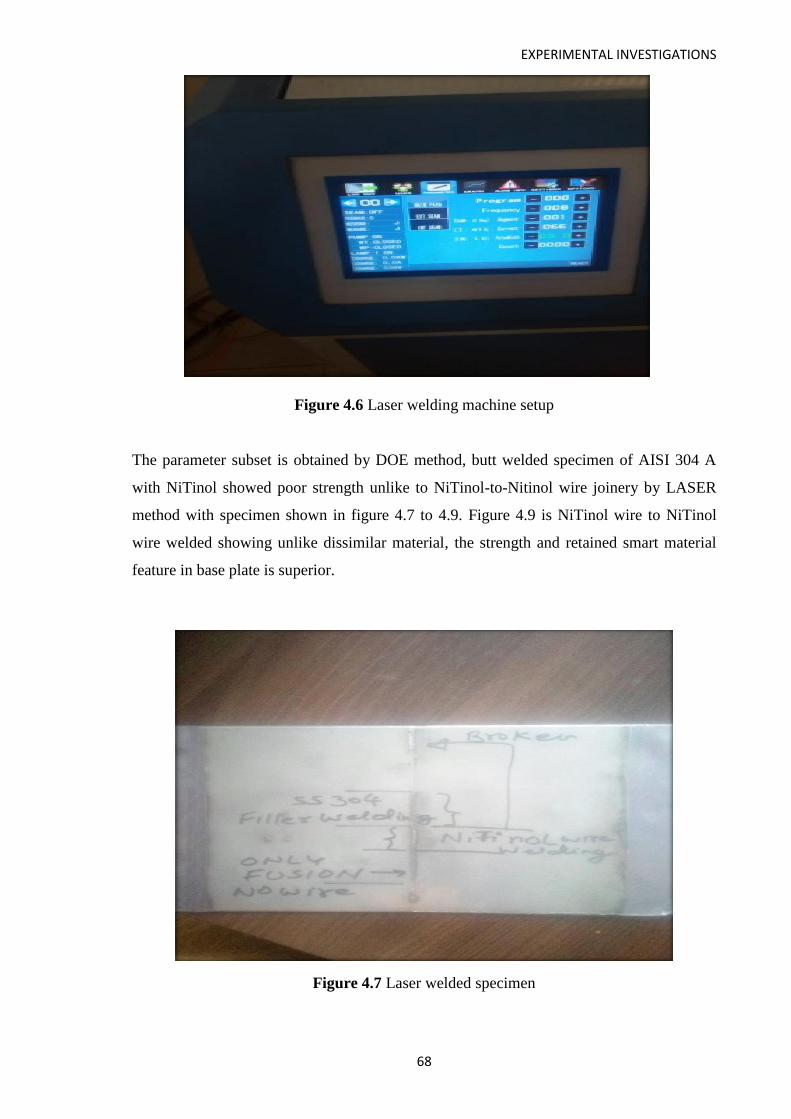
EXPERIMENTAL INVESTIGATIONS
68
Figure 4.6 Laser welding machine setup
The parameter subset is obtained by DOE method, butt welded specimen of AISI 304 A
with NiTinol showed poor strength unlike to NiTinol-to-Nitinol wire joinery by LASER
method with specimen shown in figure 4.7 to 4.9. Figure 4.9 is NiTinol wire to NiTinol
wire welded showing unlike dissimilar material, the strength and retained smart material
feature in base plate is superior.
Figure 4.7 Laser welded specimen

EXPERIMENTAL INVESTIGATIONS
69
Figure 4.8 NiTinol Wire
Figure 4.9 NiTinol wire welded
The welding report revealed cracks formulation in AISI 304 plate and NiTinol wire, but
while joining NiTinol wire to NiTinol wire, the strength was as per confirmation and
minute welding as possible [94].
4.4 Manual and Robotic Friction Stir Welding
Schematic diagram in figure 4.10, 4.11 and 4.12 show the parameters application for
manual FSW with experimental set up forming plastic and thermal strains along welded
zone using parameters subset by design of Experimentation [95,97,98]. An automated lathe
machine was used for experimentation where a steel plate 304 A parallel was vertically
butt welded with the frictional force generated by MS and AL stud mounted on chuck and
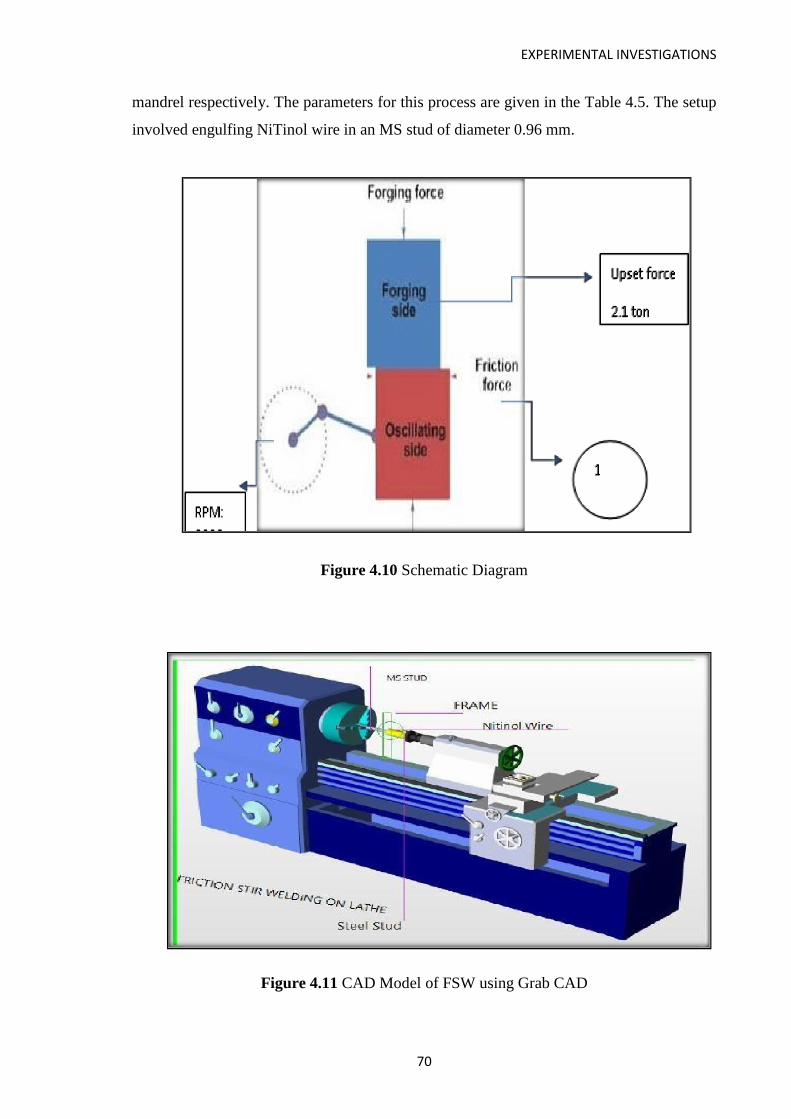
EXPERIMENTAL INVESTIGATIONS
70
mandrel respectively. The parameters for this process are given in the Table 4.5. The setup
involved engulfing NiTinol wire in an MS stud of diameter 0.96 mm.
Figure 4.10 Schematic Diagram
Figure 4.11 CAD Model of FSW using Grab CAD

EXPERIMENTAL INVESTIGATIONS
71
Figure 4.12 Experimentation on Lathe Machine
The chuck was rotated whereas mandrel was kept stationary while creating axial pressure
of 2.1 tons with tool tilt of 3° over stationary plate mounted on the fixture as shown in
figure 4.12. This resulting increases in temperature upto 1200 rpm which started with 900
rpm. After 1200 rpm crack was observed resulting in the red-hot zone. A reverse braking
process was used for creating good quality weld. During the process, steel fixtures were
used to clamp the AISI 304 plate and the back plate was used for bottom support. Welded
specimen as shown in figure 4.13 using parameter subset shown in Table 4.5.
Figure 4.13 FSW AISI 304 A with NiTinol Wire
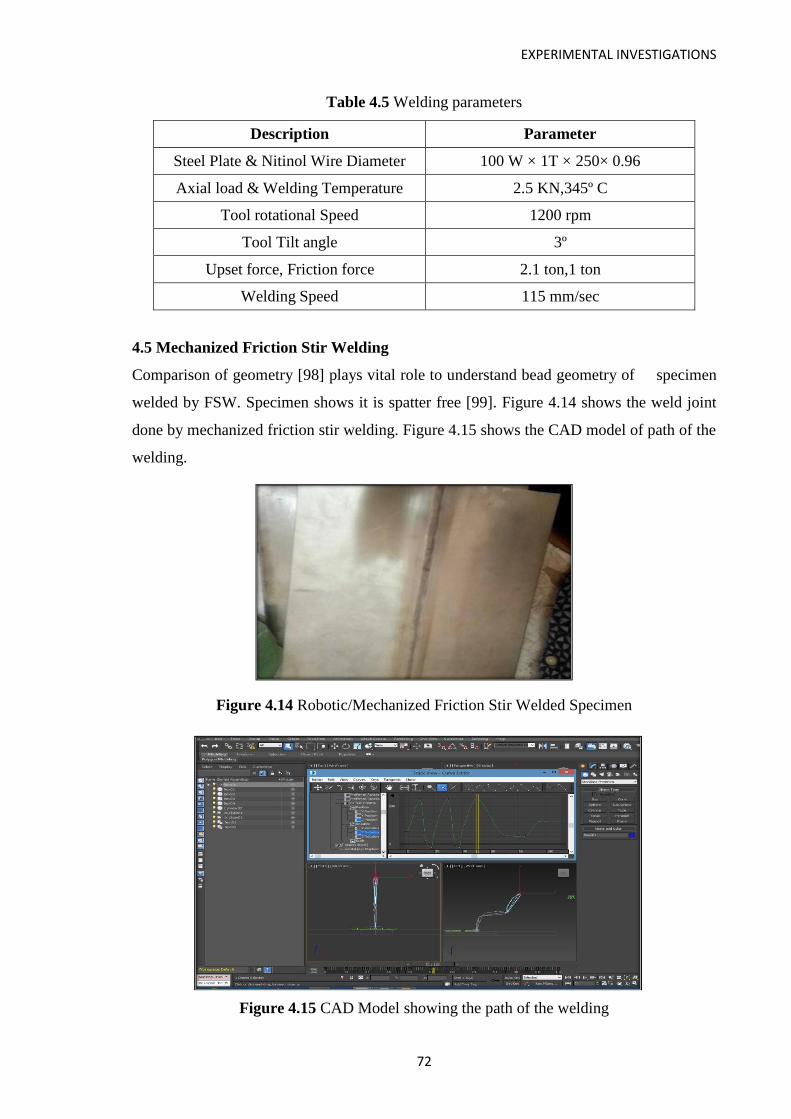
EXPERIMENTAL INVESTIGATIONS
72
Table 4.5 Welding parameters
Description Parameter
Steel Plate & Nitinol Wire Diameter 100 W × 1T × 250× 0.96
Axial load & Welding Temperature 2.5 KN,345º C
Tool rotational Speed 1200 rpm
Tool Tilt angle 3º
Upset force, Friction force 2.1 ton,1 ton
Welding Speed 115 mm/sec
4.5 Mechanized Friction Stir Welding
Comparison of geometry [98] plays vital role to understand bead geometry of specimen
welded by FSW. Specimen shows it is spatter free [99]. Figure 4.14 shows the weld joint
done by mechanized friction stir welding. Figure 4.15 shows the CAD model of path of the
welding.
Figure 4.14 Robotic/Mechanized Friction Stir Welded Specimen
Figure 4.15 CAD Model showing the path of the welding

EXPERIMENTAL INVESTIGATIONS
73
Figure 4.16 shows experimentation on AISI 304 plate with NiTinol wire using robotic
welding.
Figure 4.16 Experimentation on AISI 304 plate with NiTinol Wire
The Robotic Friction Stir Welding was performed on AISI 304 plate with Nitinol wire.
Based on CAD modelling as shown in figure 4.17 to 4.19 were controlled.
Figure 4.17 CAD Model
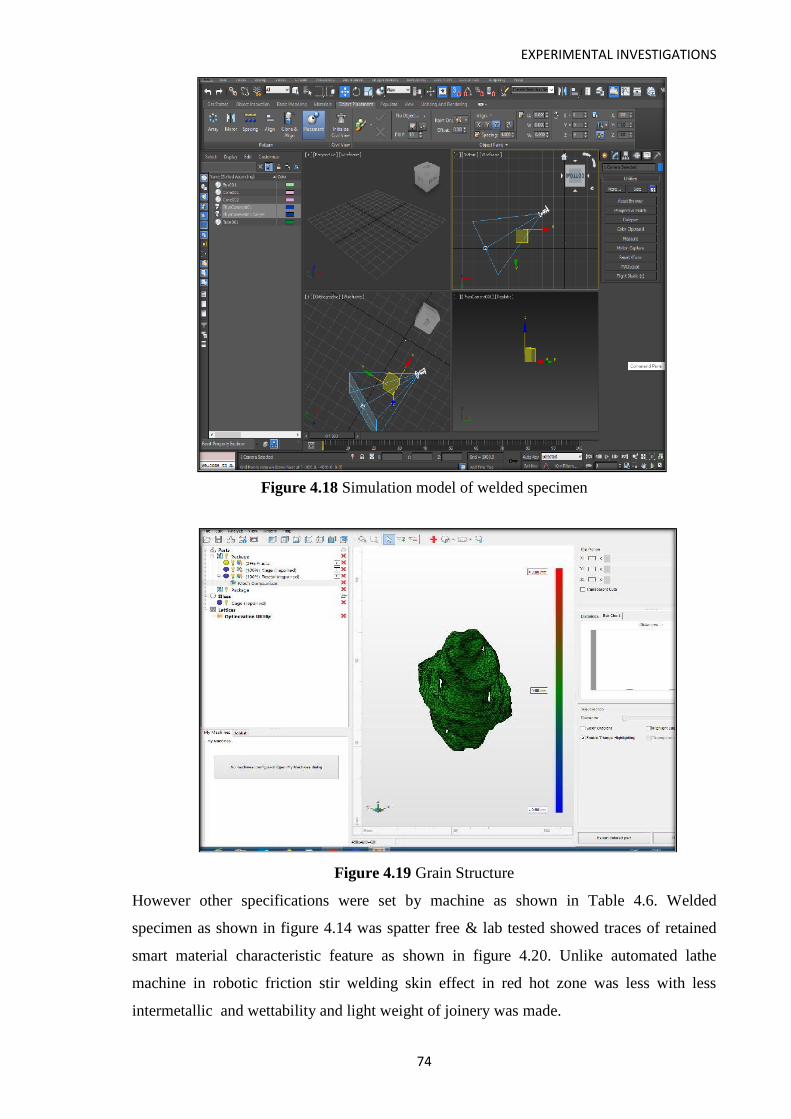
EXPERIMENTAL INVESTIGATIONS
74
Figure 4.18 Simulation model of welded specimen
Figure 4.19 Grain Structure
However other specifications were set by machine as shown in Table 4.6. Welded
specimen as shown in figure 4.14 was spatter free & lab tested showed traces of retained
smart material characteristic feature as shown in figure 4.20. Unlike automated lathe
machine in robotic friction stir welding skin effect in red hot zone was less with less
intermetallic and wettability and light weight of joinery was made.
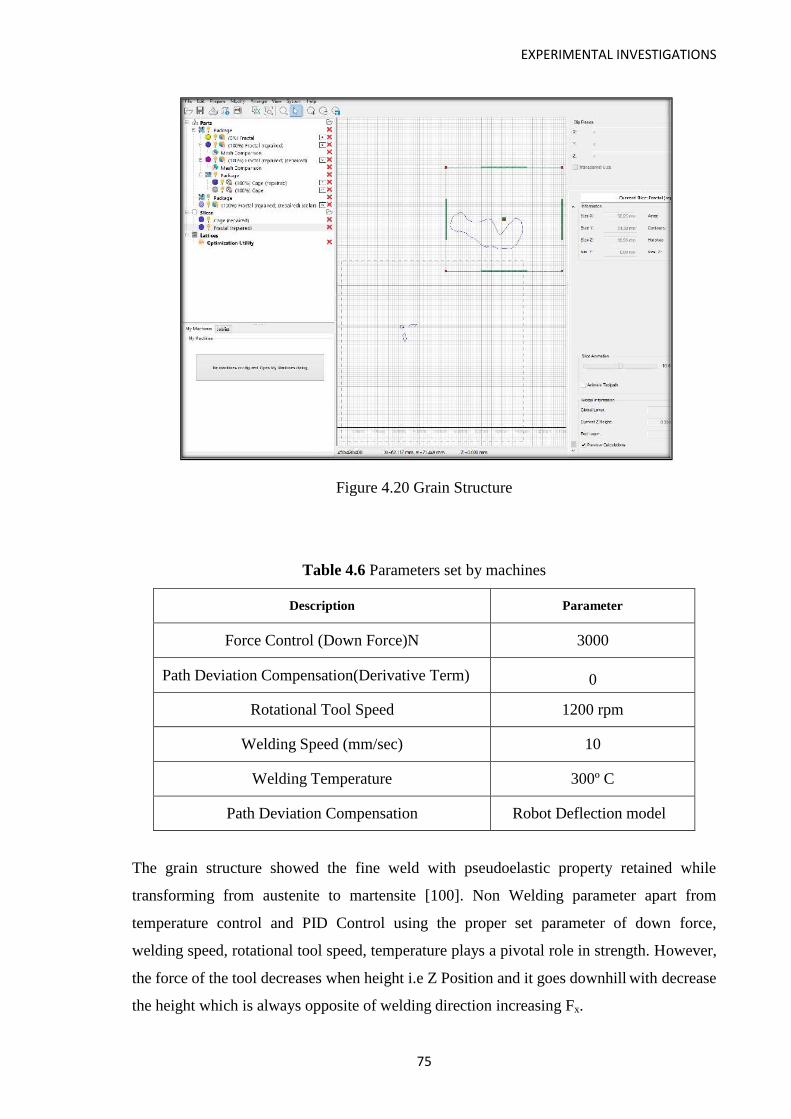
EXPERIMENTAL INVESTIGATIONS
75
Figure 4.20 Grain Structure
Table 4.6 Parameters set by machines
Description Parameter
Force Control (Down Force)N 3000
Path Deviation Compensation(Derivative Term) 0
Rotational Tool Speed 1200 rpm
Welding Speed (mm/sec) 10
Welding Temperature 300º C
Path Deviation Compensation Robot Deflection model
The grain structure showed the fine weld with pseudoelastic property retained while
transforming from austenite to martensite [100]. Non Welding parameter apart from
temperature control and PID Control using the proper set parameter of down force,
welding speed, rotational tool speed, temperature plays a pivotal role in strength. However,
the force of the tool decreases when height i.e Z Position and it goes downhill with decrease
the height which is always opposite of welding direction increasing Fx.
EXPERIMENTAL INVESTIGATIONS
76
4.6 Capacitor Discharge Welding
The stud engulfed with NiTinol wire was used to rivet at steel plate by Capacitor discharge
gun of the solenoid, based on following parameters as shown in figure 4.21 and 4.22.
Narrow rupture and discontinuous strips [101] were observed and the specimen was
cracked at corners of riveting, so was not suitable for the test based on parameter subset as
shown in Table 4.7 and figure 4.23 welded specimen.
Figure 4.21 Simulation software for welding
Figure 4.22 Capacitor Discharge

EXPERIMENTAL INVESTIGATIONS
77
Figure 4.23 NiTinol welded specimen with rivets
Table 4.7 Parameters for welding machine
Description Parameter
Weld Cycle time 0.02 seconds
Weld Technique Contact & Gap
Stud Design Ignition Tip
Upsetting force 20 KN
Peak Current 62 A
Discharge Time of rivet 15ms
4.7 Induction Brazing
Induction brazing method was selected for performing the experimental process of welding
NiTinol wire with AISI 304 as the throughput time is more due to fast heating cycle time
and is controllable. Along with this, the main reason was only narrowly defined areas are
heated unlike leaving other adjacent areas so parameters check is more favorable [102].
The experimental setup assembly of the AISI 304 plate was made on mandrel as shown in
figure 4.24 with heated NiTinol Wire on fixture was induction brazed as shown specimen
in figure 4.25 with grain structure as shown in figure 4.26 shows Af transition of austenite
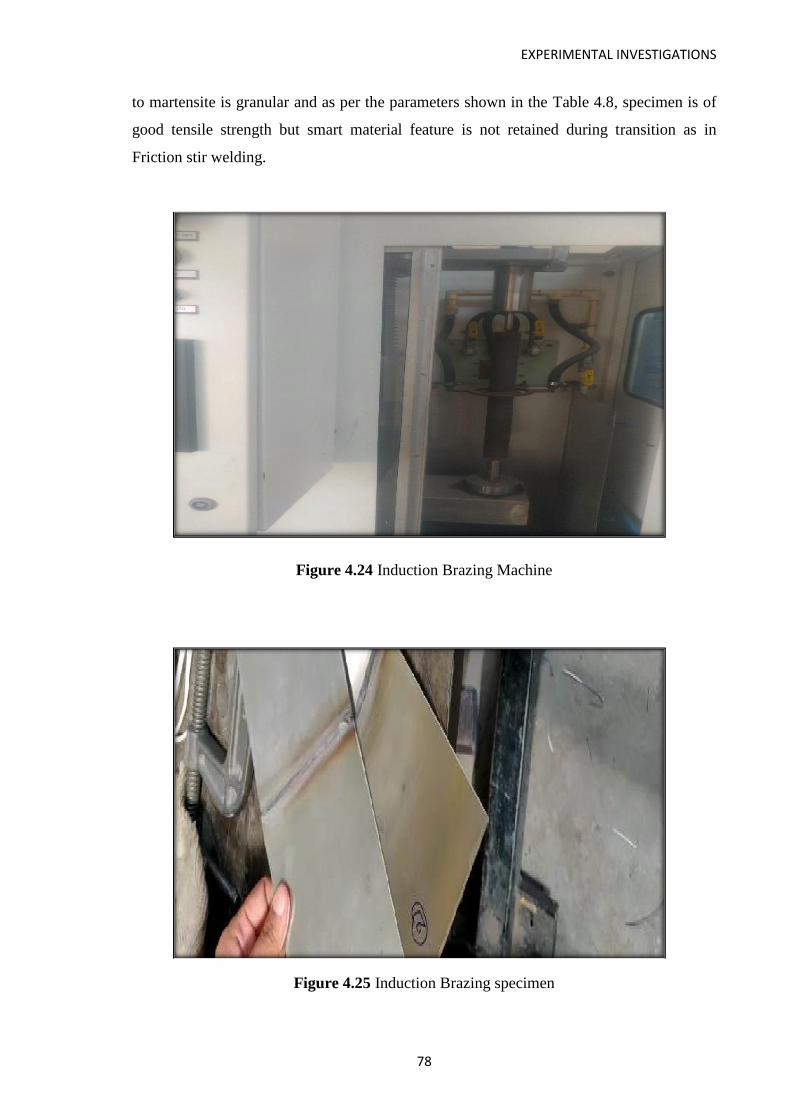
EXPERIMENTAL INVESTIGATIONS
78
to martensite is granular and as per the parameters shown in the Table 4.8, specimen is of
good tensile strength but smart material feature is not retained during transition as in
Friction stir welding.
Figure 4.24 Induction Brazing Machine
Figure 4.25 Induction Brazing specimen
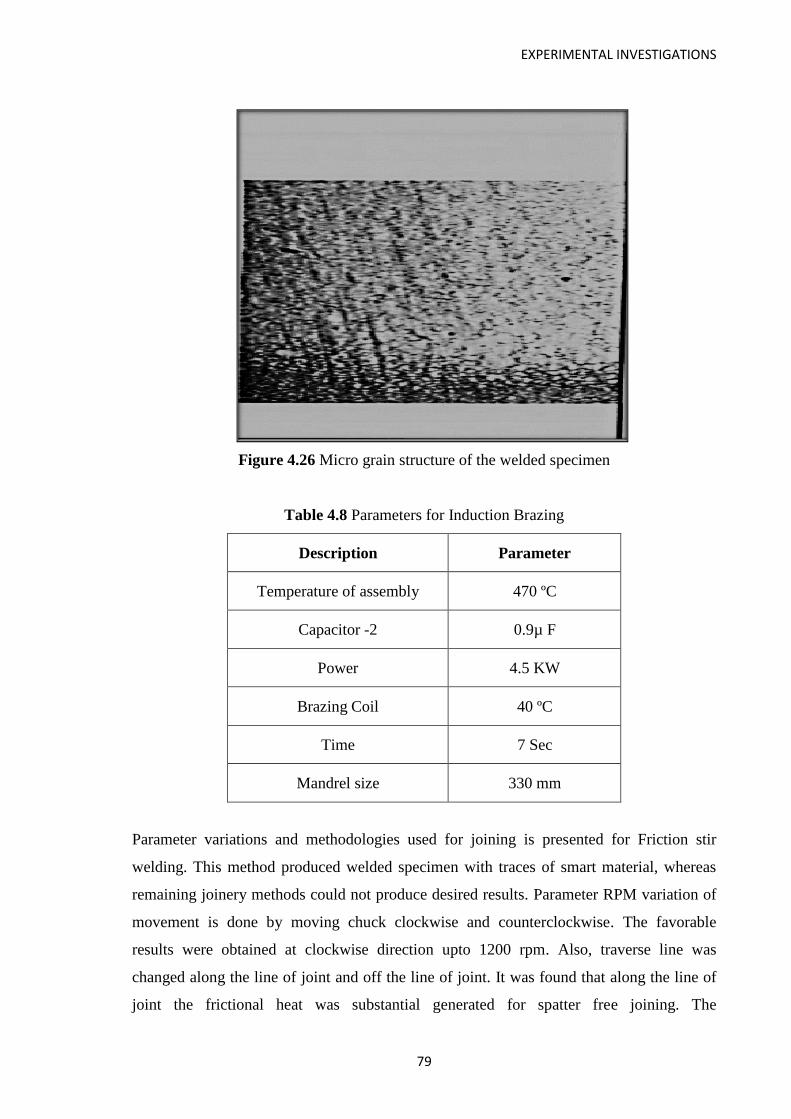
EXPERIMENTAL INVESTIGATIONS
79
Figure 4.26 Micro grain structure of the welded specimen
Table 4.8 Parameters for Induction Brazing
Description Parameter
Temperature of assembly 470 ºC
Capacitor -2 0.9µ F
Power 4.5 KW
Brazing Coil 40 ºC
Time 7 Sec
Mandrel size 330 mm
Parameter variations and methodologies used for joining is presented for Friction stir
welding. This method produced welded specimen with traces of smart material, whereas
remaining joinery methods could not produce desired results. Parameter RPM variation of
movement is done by moving chuck clockwise and counterclockwise. The favorable
results were obtained at clockwise direction upto 1200 rpm. Also, traverse line was
changed along the line of joint and off the line of joint. It was found that along the line of
joint the frictional heat was substantial generated for spatter free joining. The

EXPERIMENTAL INVESTIGATIONS
80
methodology of joining was changed by frictional force keeping mandrel Al tool stationary
and by Robotic Friction with continuous heat generation by pedant, favorable result were
obtained by Robotic Friction process, which is further assessed and validated in next
chapters.
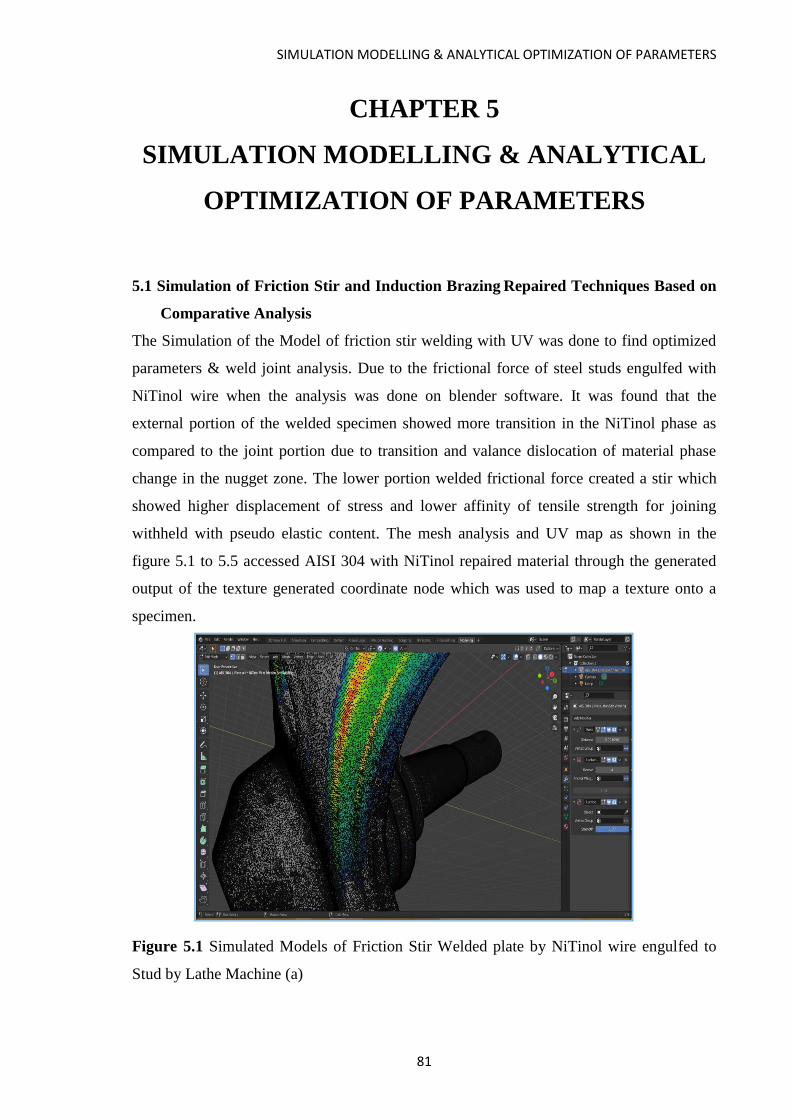
SIMULATION MODELLING & ANALYTICAL OPTIMIZATION OF PARAMETERS
81
CHAPTER 5
SIMULATION MODELLING & ANALYTICAL
OPTIMIZATION OF PARAMETERS
5.1 Simulation of Friction Stir and Induction Brazing Repaired Techniques Based on
Comparative Analysis
The Simulation of the Model of friction stir welding with UV was done to find optimized
parameters & weld joint analysis. Due to the frictional force of steel studs engulfed with
NiTinol wire when the analysis was done on blender software. It was found that the
external portion of the welded specimen showed more transition in the NiTinol phase as
compared to the joint portion due to transition and valance dislocation of material phase
change in the nugget zone. The lower portion welded frictional force created a stir which
showed higher displacement of stress and lower affinity of tensile strength for joining
withheld with pseudo elastic content. The mesh analysis and UV map as shown in the
figure 5.1 to 5.5 accessed AISI 304 with NiTinol repaired material through the generated
output of the texture generated coordinate node which was used to map a texture onto a
specimen.
Figure 5.1 Simulated Models of Friction Stir Welded plate by NiTinol wire engulfed to
Stud by Lathe Machine (a)

SIMULATION MODELLING & ANALYTICAL OPTIMIZATION OF PARAMETERS
82
Figure 5.1 describes the simulation of mesh analysis with red region showing stress area of
friction stir welded specimen and which is further shown in figure 5.2 of welded specimen
with light blue describes the weld flow with red region of stress concentration in heat
affected zone. It is depicting the red zone shows a high value of repaired strength and with
a low value shown in blue whereas the geometry with the range of repair is shown in green
color.
Figure 5.2 Simulated Models of Friction Stir Welded plate by NiTinol wire engulfed to
Stud by Lathe Machine (b)
Figure 5.3 Simulated Models of Friction Stir Welded plate by NiTinol wire in four
orientation axis to capture weld penetration

SIMULATION MODELLING & ANALYTICAL OPTIMIZATION OF PARAMETERS
83
The angle and axis displayed with minimum and maximum range helps while doing job
repair by Robotic friction welding using distance range for determining the thickness of
welded geometry intersection width to avoid any welded distortion [103]. However, mesh
analysis results applicability had limitations as the results displayed based on Deform
Modifiers for high poly-meshes with low performance.
Figure 5.4 Simulated Models of Friction Stir Welded plate by NiTinol wire shows nugget
zone of specimen
Figure 5.5 Mesh analysis with brown spot with traces of NiTinol

SIMULATION MODELLING & ANALYTICAL OPTIMIZATION OF PARAMETERS
84
Figure 5.6 Surface texture of repaired AISI 304 with NiTinol
The fatigue resistance of repaired AISI 304 with NiTinol wire was analyzed in MATLAB-
19 for singular stress field zone. It was found in the joint area of the plate, and stud, which
calculated across three axes as shown in the figure 5.7 and 5.8. It shows that maximum 200
MPa stress with dislocation of 150 mm at 1.25 mm distance after weld penetration was
observed. Showing best stress at 0.491302 and mean 664119 for less geometric
discontinuities at the region of interface between plate and NiTinol engulfed stud.
Figure 5.7 Matlab Simulation for stress analysis of welded joint (a)

SIMULATION MODELLING & ANALYTICAL OPTIMIZATION OF PARAMETERS
85
Figure 5.8 MATLAB Simulation for stress analysis of welded joint (b)
5.2 Mechanized Friction
As shown in figure from 5.9 to 5.19, specimen welded by mechanized friction stir welding
through Blender software produces mesh analysis and UV surface texture of welded zone
highlights HAZ which shows that austenite to martensite phase transformation shows the
traces of smart material NiTinol by stress application technique.
Figure 5.9 Simulation of specimen welded by Mechanized Friction Stir Welding (a)
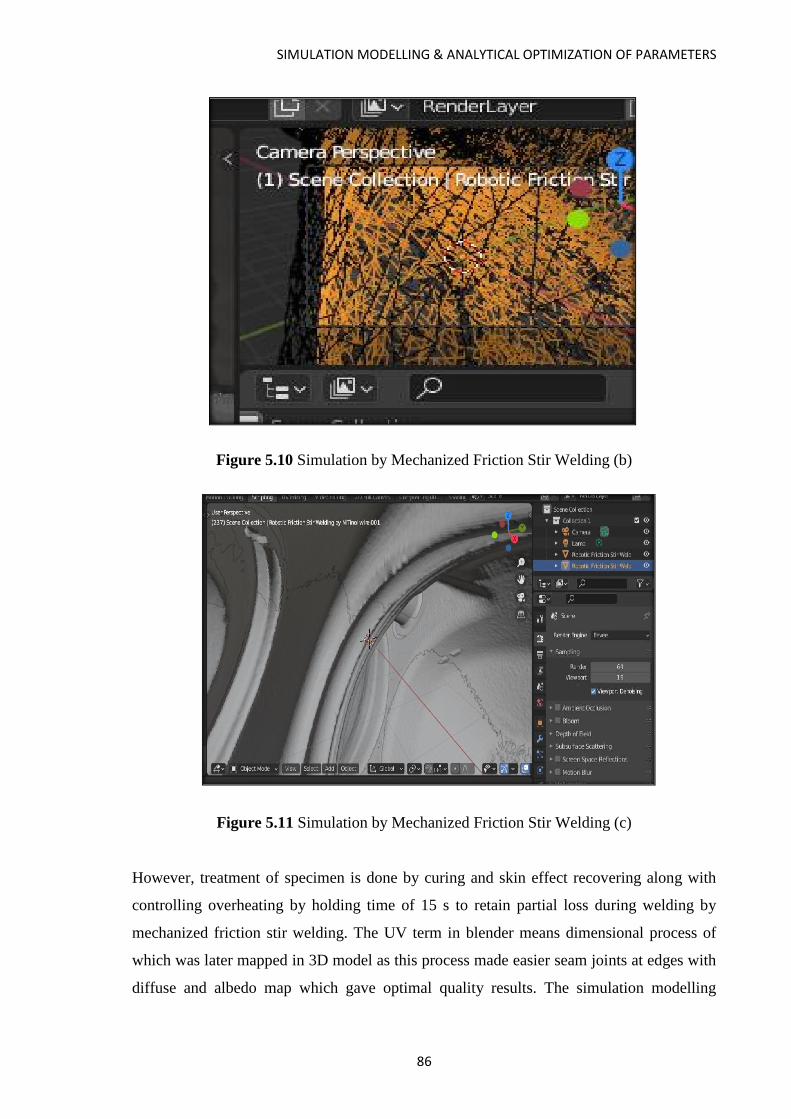
SIMULATION MODELLING & ANALYTICAL OPTIMIZATION OF PARAMETERS
86
Figure 5.10 Simulation by Mechanized Friction Stir Welding (b)
Figure 5.11 Simulation by Mechanized Friction Stir Welding (c)
However, treatment of specimen is done by curing and skin effect recovering along with
controlling overheating by holding time of 15 s to retain partial loss during welding by
mechanized friction stir welding. The UV term in blender means dimensional process of
which was later mapped in 3D model as this process made easier seam joints at edges with
diffuse and albedo map which gave optimal quality results. The simulation modelling

SIMULATION MODELLING & ANALYTICAL OPTIMIZATION OF PARAMETERS
87
shows that gradient of temperature in horizontal and vertical axis shows that traces of
martensite is there with grain growth of 2 µm which shows traces of smart material feature
in base plate after weld at 1200 rpm with 3° tool tilt with tool material of 45NiCrMo16
with numerical designation 1.2767. The coefficient of friction was calculatedly done to
control the frictional heat range.
Figure 5.12 Simulation by Mechanized Friction Stir Welding: mesh analysis with orange
line stress zone
Figure 5.13 Simulated Models of Friction Stir Welded plate by NiTinol wire engulfed to
Stud by Mechanized Machine (e): mesh analysis with orange line stress zone

SIMULATION MODELLING & ANALYTICAL OPTIMIZATION OF PARAMETERS
88
Figure 5.14 Mesh analysis & UV texture map of repaired AISI 304 with NiTinol by
Mechanized FSW: red area shows stress depicting weld flow at HAZ
Figure 5.15 Mesh analysis of weld flow & UV texture map of repaired AISI 304A with
NiTinol by Mechanized FSW
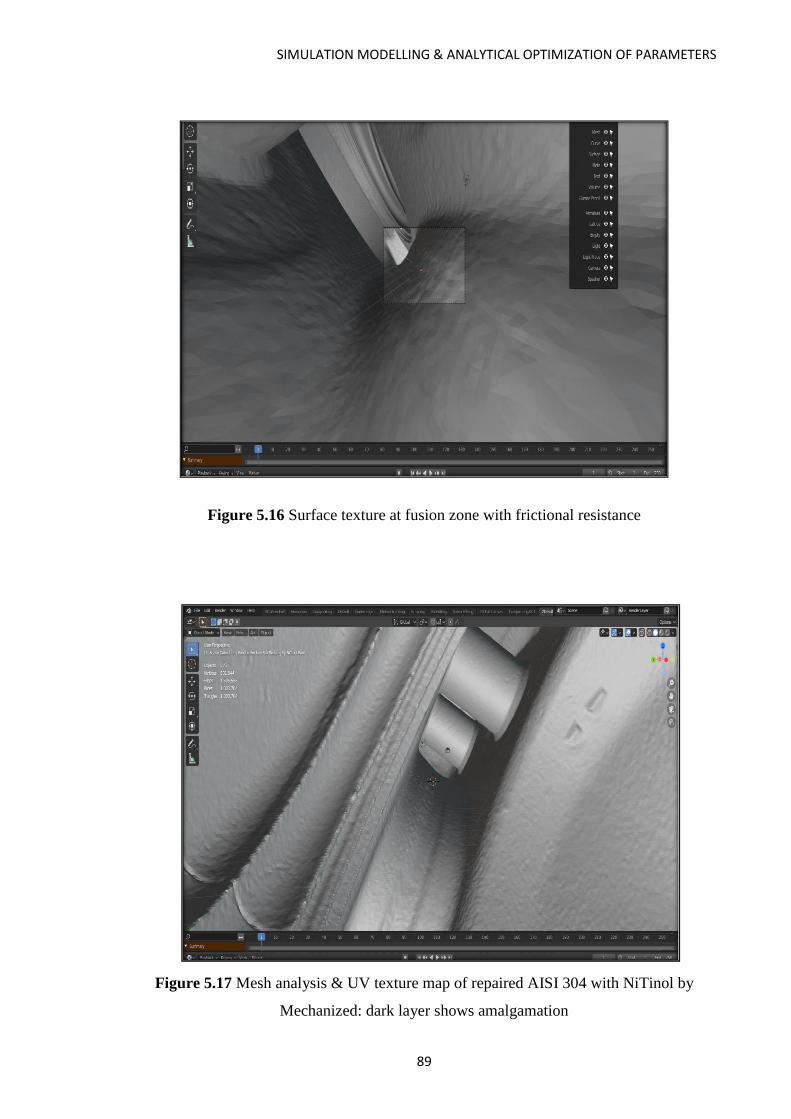
SIMULATION MODELLING & ANALYTICAL OPTIMIZATION OF PARAMETERS
89
Figure 5.16 Surface texture at fusion zone with frictional resistance
Figure 5.17 Mesh analysis & UV texture map of repaired AISI 304 with NiTinol by
Mechanized: dark layer shows amalgamation

SIMULATION MODELLING & ANALYTICAL OPTIMIZATION OF PARAMETERS
90
Figure 5.18 Mesh analysis of amalgamation zone
Figure 5.19 Mesh analysis of amalgamation zone & UV texture map of repaired AISI 304
with NiTinol by Mechanized
5.3 Simulated Modelling of Induction Brazing Welding
As shown in figure 5.20 to 5.25, UV mapping & Mesh analysis is done in Blender

SIMULATION MODELLING & ANALYTICAL OPTIMIZATION OF PARAMETERS
91
Software to analyze joint mesh for thermo mechanical analysis. The analysis showed
reduced distortion and stress but smart material feature was not retained after weld unlike
friction stir welding in Induction Brazing.
Figure 5.20 Simulated Models of Induction Brazed Welded plate by NiTinol wire: nugget
area (square) portion shows uneven weld flow
Figure 5.21 Simulated Models of Induction Brazed Weld: stress concentration is more in
starting and reduced as it advances
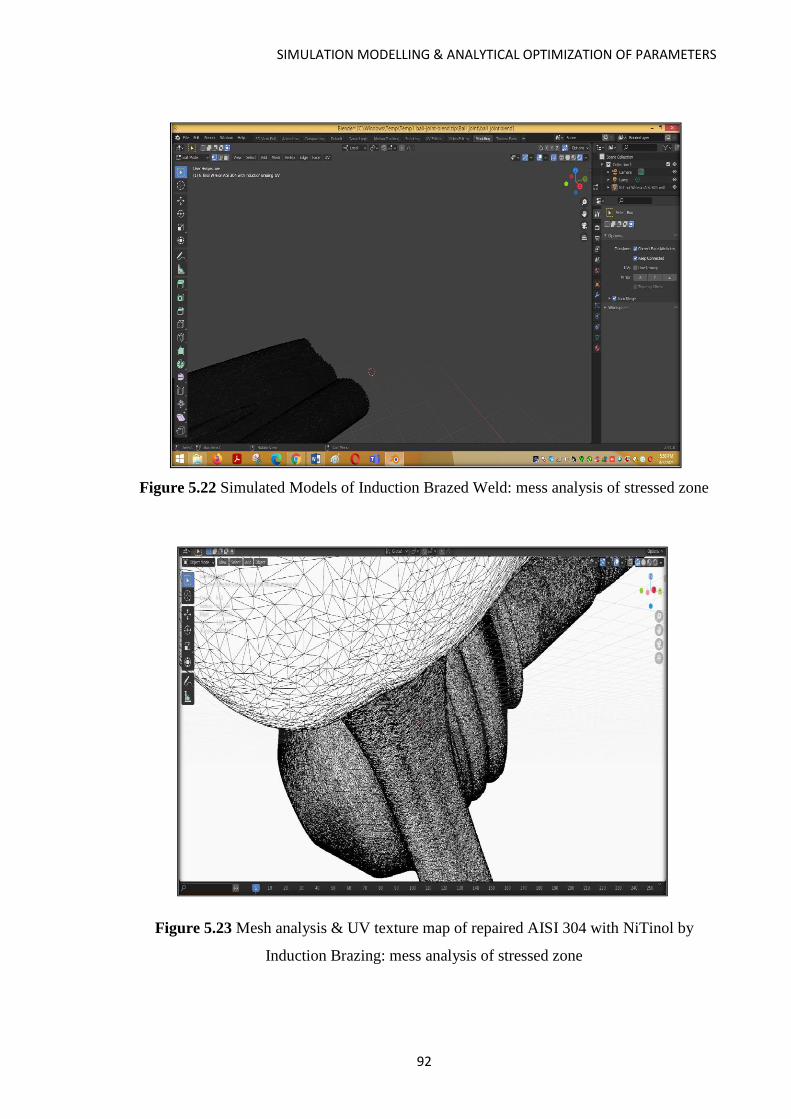
SIMULATION MODELLING & ANALYTICAL OPTIMIZATION OF PARAMETERS
92
Figure 5.22 Simulated Models of Induction Brazed Weld: mess analysis of stressed zone
Figure 5.23 Mesh analysis & UV texture map of repaired AISI 304 with NiTinol by
Induction Brazing: mess analysis of stressed zone

SIMULATION MODELLING & ANALYTICAL OPTIMIZATION OF PARAMETERS
93
Figure 5.24 Mesh analysis & UV texture map of repaired AISI 304 with NiTinol by
Induction Brazing: camera capture of surface texture (a)
Figure 5.25 Mesh analysis & UV texture map of repaired AISI 304 with NiTinol by
Induction Brazing: camera capture of surface texture (b)
The simulation analysis of various specimen of FSW and IB made it to finalize the
parameters suitable to produce results, which were further optimized computationally after
DOE. The results showed that specimen of Induction Brazing has good hardness due to

SIMULATION MODELLING & ANALYTICAL OPTIMIZATION OF PARAMETERS
94
retained martensite but smart material features were not found, however Friction Stir
welded specimen showed good hardness as well specimen was light weight with traces of
smart material, hence based on UV texture reports, simulation mesh analysis friction stir
welded specimen were found of desired results which are further validated computationally
to find appropriate parameter module.

COMPARATIVE ANALYSIS OF REAL-TIME PARAMETERS
95
CHAPTER 6
COMPARATIVE ANALYSIS OF REAL-TIME
PARAMETERS FOR REPAIRED SPECIMEN
The real time computational model is developed to obtain desired accurate friction stir
welding with retained smart material feature. The real time optimization by Kalman filter
of Poisson method and then by Johnson Cook Model by Taguchi Method is derived to
obtain basic characteristic feature of NiTinol wire in Friction welding parameter after
comparative analysis with simulation of Induction Brazing narrows down to Friction Stir
welding Parameter optimization. This process by MATLAB and computational algorithm
helped in fine tuning the parameters. Statistical technique is used to refine the results for
Tensile strength, hardness, pseudo elasticity properties of Nitinol Wire when friction stir
welded with AISI 304 A plate controlling parameters of speed, feed, depth, current
density range, tilt angle axial force as shown in curves of Cumulative Distribution Function
demonstrated of optimum joinery method: Robotic Friction Stir Welding & Manual
Friction stir welded on the module output are analyzed. In addition, the comparisons of
these mentioned welding parameters are analyzed. In Friction Stir Welding, real-time
parameters are developed to attend desirable weld strength by NiTinol Wire. Difficulty in
modelling was overcome by optimized parameters run by Design Test Modulation by
Taguchi by DOE Method. Kalman Filter Algorithm by Poisson Method was optimized for
the position of NiTinol Wire welding and velocity of the tool, using the equation and
measurement model. The predicted model compared with experimental results, which
accurately predicted the bead geometry [104-117].

COMPARATIVE ANALYSIS OF REAL-TIME PARAMETERS
96
6.1 Mechanized Friction Stir Welding
Real Time Parameters of DOE after tuning is shown in Table 6.1 and 6.2 with coded
coefficient. As shown in Table 6.1 for coded coefficient, VO tool angle, V1 tool velocity
V2 rpm of tool and V3 thickness of base plate, this table analysis is used to define size and
direction of relationship. Amongst all parameters to understand the proportion VIF
(variance inflation factor) for VF>5, the parameters are highly correlated and p < α value
judges it is going towards null hypothesis. Hence from the given table all the stated
parameters are correlated with specific response optimization.
Table 6.1 Coded Co-efficient
Term Effect Coef SE Coef T-Value P-Value VIF
Constant 7.958 0.723 11.00 0.058
v0-Tool angle 4.632 2.316 0.789 2.94 0.209 16.08
v1-Tool
Velocity 3.601 1.800 0.387 4.65 0.135 3.88
rpm 0.149 0.075 0.311 0.24 0.851 2.51
mm/s -1.416 -0.708 0.982 -0.72 0.603 11.07
mm -0.500 -0.250 0.433 -0.58 0.667 4.85
v0*v1 -0.149 -0.075 0.444 -0.17 0.894 5.10
v0*rpm -0.601 -0.300 0.354 -0.85 0.552 3.24
v0*mm/s 2.62 1.31 1.17 1.12 0.464 19.96
v0*mm 0.500 0.250 0.433 0.58 0.667 4.85
v1*rpm -1.750 -0.875 0.331 -2.65 0.230 2.83
v1*mm -1.000 -0.500 0.354 -1.41 0.392 2.31

COMPARATIVE ANALYSIS OF REAL-TIME PARAMETERS
97
Table 6.2 Robotic Friction real-time parameters
Model Summary
S R-sq R-sq(adj) R-sq(pred)
0.707107 99.73% 96.70% *
Analysis of Variance
Source DF Adj SS Adj MS F-Value P-Value
Model 11 181.500 16.5000 33.00 0.135
Linear 5 59.873 11.9746 23.95 0.154
v0 1 4.313 4.3125 8.63 0.209
v1 1 10.800 10.8000 21.60 0.135
rpm 1 0.029 0.0286 0.06 0.851
mm/s 1 0.260 0.2595 0.52 0.603
mm 1 0.167 0.1667 0.33 0.667
2-Way Interactions 6 9.452 1.5754 3.15 0.406
v0*v1 1 0.014 0.0141 0.03 0.894
v0*rpm 1 0.360 0.3605 0.72 0.552
v0*mm/s 1 0.626 0.6255 1.25 0.464
v0*mm 1 0.167 0.1667 0.33 0.667
v1*rpm 1 3.500 3.5000 7.00 0.230
v1*mm 1 1.000 1.0000 2.00 0.392
Error 1 0.500 0.5000
Total 12 182.000
Regression Equation in Uncoded Units
Run Order = -126.8 + 4.40 v0 + 47.2 v1 + 0.0747 rpm - 0.120 mm/s + 8.0 mm - 0.60 v0*v1 - 0.00401 v0*rpm + 0.0433 v0*mm/s + 1.00 v0*mm - 0.02333 v1*rpm - 4.00 v1*mm
Fits and Diagnostics for Unusual Observations
Obs RunOrder Fit Resid Std Resid
3 3.000 3.000 0.000 * X
4 4.000 4.000 0.000 * X
5 5.000 5.000 0.000 * X
6 6.000 6.000 0.000 * X
7 7.000 7.000 -0.000 * X
8 8.000 8.000 0.000 * X
9 9.000 9.000 0.000 * X
10 10.000 10.000 -0.000 * X
11 11.000 11.000 0.000 * X
12 12.000 12.000 0.000 * X
13 13.000 13.000 -0.000 * X
X Unusual X
Alias Structure
Factor Name
A v0
B v1
C rpm
D mm/s
E mm
Aliases
I - 0.60 BD + 0.05 CD + CE + 0.15 DE - 0.60 ABC - ABE + 0.55 ACD + 0.40 ACE + 0.75 ADE + 0.05 BCD + 0.25 BDE - 0.20 CDE + 0.35 ABCD + 0.25 ABDE + 0.10 ACDE - 0.70 BCDE - 0.20 ABCDE
A + 0.15 BD + 0.55 CD + 0.15 DE - 0.60 ABC - 0.75 ABD + ABE + 0.05 ACD - 0.60 ACE - 0.75 ADE
+ 0.80 BCD + 0.80 CDE - 0.40 ABCD - 0.40 ACDE + 0.55 BCDE + 0.05 ABCDE
B + 0.60 BD - 0.05 CD - 0.15 DE + 0.60 ABC + ABE + 0.45 ACD - 0.40 ACE + 0.25 ADE - 0.05 BCD
+ BCE - 0.25 BDE + 0.20 CDE + 0.65 ABCD + 0.75 ABDE - 0.10 ACDE + 0.70 BCDE + 0.20 ABCDE
C + 0.15 BD + 0.55 CD + 0.15 DE - 0.60 ABC + 0.25 ABD + 0.05 ACD - 0.60 ACE + 0.25 ADE
- 0.20 BCD + BCE - 0.20 CDE - 0.40 ABCD - 0.40 ACDE + 0.55 BCDE + 0.05 ABCDE
D + 0.60 BD + 0.20 CD + 0.60 DE + 1.60 ABC - 0.80 ACD + 1.60 ACE + 0.20 BCD + BDE + 0.20 CDE
+ 0.40 ABCD + 0.40 ACDE + 0.20 BCDE - 0.80 ABCDE
E + 0.25 CD + 0.75 DE - ABE - 0.25 ACD + ACE - 0.25 ADE + 0.25 BCD - BCE + 0.25 BDE - 0.25 ABCD - 0.75 ABDE + 0.50 ACDE - 0.50 BCDE

COMPARATIVE ANALYSIS OF REAL-TIME PARAMETERS
98
AB - 0.15 BD + 0.45 CD + 0.85 DE + 0.60 ABC + 0.75 ABD - ABE - 0.05 ACD + 1.60 ACE + 0.75 ADE + 0.20 BCD + BDE - 0.80 CDE + 0.40 ABCD + ABCE + 0.40 ACDE - 0.55 BCDE - 0.05 ABCDE
AC + 0.40 BD + 0.05 CD + 0.40 DE - 0.60 ABC + 0.55 ACD - 0.60 ACE + 0.05 BCD + 0.05 CDE - 0.65 ABCD + ABCE - 0.65 ACDE + 0.05 BCDE + 0.55 ABCDE
AD - 0.40 BD - 0.80 CD - 0.40 DE + 1.60 ABC + ABD + 0.20 ACD + 1.60 ACE + ADE - 0.80 BCD - 0.80 CDE + 1.40 ABCD + ABDE + 1.40 ACDE - 0.80 BCDE + 0.20 ABCDE
AE - 0.25 CD - DE + ABE + 0.25 ACD - ACE - 0.25 BCD - BDE + 0.75 CDE + 0.25 ABCD - ABCE + 0.25 ACDE + 0.75 BCDE + 0.25 ABCDE
BC + 0.25 BD + CE + 0.25 DE - ABC - 0.25 ABD - ACE - 0.25 ADE + 0.75 BCD + 0.75
CDE - 0.75 ABCD - 0.75 ACDE
BE - CE - 0.75 DE + ABE - ACE - 0.75 ADE - 0.25 BDE + 0.25 CDE - 0.25 ABDE + 0.25
ACDE + 0.75 BCDE + 0.75 ABCDE
As shown in figure 6.1 for multiple regression for parameter V1, judging p value parameter
optimization is done. Table 6.2 gives the summary of parameters optimized by
Mechanized/Robotic Friction Stir Welding, with following operatives: Run Order = -126.8
+ 4.40 v0 + 47.2 v1 + 0.0747 rpm - 0.120 mm/s + 8.0 mm - 0.60 v0*v1 - 0.00401 v0*rpm
+ 0.0433 v0*mm/s + 1.00 v0*mm - 0.02333 v1*rpm - 4.00 v1*mm which is further
validated. Figure 6.2 with Multiple Regression report dependence of V1 and V3. As shown
in figure 6.3 further Parameters V1 are fine-tuned checking for normality and residual
output .Further as shown in figure 6.4 shows optimization parameters report, all parameters
V0,V1,V2,V3 are optimized.
Figure 6.1 Multiple regression for V1 summary report

COMPARATIVE ANALYSIS OF REAL-TIME PARAMETERS
99
Figure 6.2 Multiple regression effect report

COMPARATIVE ANALYSIS OF REAL-TIME PARAMETERS
100
Figure 6.3 Multiple regression for V1 model building report
Figure 6.4 Multiple regression for V1 Prediction and Optimization report
As shown in figure 6.5 Box plot of V1 tool velocity as per previous table as VIF was
moderately correlated is further analyzed at tool rpm correlation to state that range of
experiment performed is from 900rpm to 1200 rpm, experimentally it was proved that after
1200 rpm, strength reduced and due to high frictional force tool was tilted.

COMPARATIVE ANALYSIS OF REAL-TIME PARAMETERS
101
Figure 6.5 Box plot of V1 by rpm, mm/s, diagnostic report
Further, it is validated by Box plot as shown in figure 6.6 which is DOE and analytically
validated by Poisson 2 way Exponential method.
Figure 6.6 Box plot of V1 by rpm, mm/s, broken down report

COMPARATIVE ANALYSIS OF REAL-TIME PARAMETERS
102
Figure 6.7 Before/after Poisson capability Comparison for center pt. v/s stdorder_1
As shown from figure 6.1 to 6.7 by Poisson method of tool tilt shoulder, rpm of tool in
chuck parameter before and after is tuned to obtain more refined results with diagnostic
and multiple Regression report to find fine-tuned parameter subset for friction stir welding
with better % of retained super alloy feature .Also as apart from smart material as hardness
and stress factor in Induction Brazed weld was of good quality, its process parameters are
also made for real time parameter testing by double exponential method.
6.2 Induction Brazing
The real-time parameters were optimized by the Double Exponential Method using the
formula & DOE optimized [118-120].
Where, µ is the location parameter and β is the scale parameter, µ=0 and β=1 are used for
this double exponential method calculation based on optimized parameters by DOE,
graphically its validation by an actual and smoothed factor of α and Y level trend is shown
in the figure 6.8.

COMPARATIVE ANALYSIS OF REAL-TIME PARAMETERS
103
Figure 6.8 Induction brazing by Nitinol wire
As discussed in equations (5) and (6) the location of solder tip as location factor and its
temperature in nugget zone is analysed. However by DOE as shown in figure 6.8 Double
Exponential method for smoothing by MAPE,MSD & MAD as accuracy measures and as
MAPE is suitable value to measure which is 2.94230 but however smallest value of MSD
0.69692 is selected, but this value unlike friction stir welding is higher when the
parameters are made to real time tuning. α smoothing constant in IB is 0.448324, γ is
0.066837 and for FSW it is 0.34561 and 0.412215 respectively, choosing FSW for
optimization and validation of the same.
The figure 6.9 to 6.12 shows DOE real time of parameters which by Blender simulation
shows as captured in camera does not show retained smart material feature specifically at
nugget zone as shown in figure 6.12 and 6.13. The paired t-test shows the comparative

COMPARATIVE ANALYSIS OF REAL-TIME PARAMETERS
104
analysis of IB and FSW with 0.43169 difference of α of FSW compared to IB is favorable
with parameter of power, voltage, frequency comparison of vo, tool angle and v1 tool
velocity ,v2 axial force,v3 rpm,v4 coefficient friction,v5 axial load with 90 % favorable
chance as shown in figure 6.11 and 6.12.
Figure 6.9 Screening design
Figure 6.10 Paired test for the mean of V0 and V1, summary report

COMPARATIVE ANALYSIS OF REAL-TIME PARAMETERS
105
Hence, after comparative analysis of two processes of Induction Brazing and Friction Stir
Welding, FRICTION STIR WELD is found to make solid state welding of NiTinol on
AISI 304 A with retained Smart material feature feasible. As shown in Figure 6.9,
screening it states that using 12 runs of experiment it gives 1.68 value of standard deviation
and with 24 run 1.06, based on this 18 runs were made of experimental trial.
As shown in figure 6.10 and 6.11 paired t test is used to study relationship of these two
parameters of Power and Velocity to decide experimental run value.
Figure 6.11 Paired test for the mean of V0 and V1, diagnostic report
As shown in figure 6.13 (a) & (b) the specimen is analyzed by Blender software to
adjudge Real time parameter analysis of Friction Stir Welded specimen and Induction
Brazed specimen. The image shows that in Friction Welded specimen the flow of weld is
tangential unlike Induction Brazing, hence retained values of NiTinol traces are found in
Friction Stir Welded specimen for almost 35 seconds, which makes this process of welding
by optimized real time parameters in Friction Stir welding method. However, in Induction
Brazing traces of NiTinol were not there in Welded specimen though hardness of joint was
of good quality also it lacked aesthetic finish like Friction stir welded specimen.

COMPARATIVE ANALYSIS OF REAL-TIME PARAMETERS
106
Figure 6.12 DOE of Real-time parameters welding by calculation and camera captured the
flow of weld (a)
Figure 6.13 DOE of Real-time parameters welding by calculation and camera captured the
flow of weld (b)

STUDY OF DOE, SIMULATION AND ANALYTICAL RESULTS OF VARIOUS JOINERIES
107
CHAPTER 7
STUDY OF DESIGN OF EXPERIMENT,
SIMULATION AND ANALYTICAL RESULTS
OF VARIOUS
JOINERIES AND THEIR DISCUSSIONS
This chapter deals with experimentation results presented after verification by numerical
assessment for FSW & Induction Brazing joinery methods by analytical validation by
Poisson, Johnson-Cook Model calculation at various modes of parameter testing for
comparative analysis of optimized parameters of DOE with Linear Regression & Fitness to
Good Test, Simulation & Lab Test Report which arrives with finding the bias error for
deciding the suitable range of parameter for selected two joinery methods for NiTinol wire
on AISI 304 plate. These processes tend to find analysis in various forms.
7.1 Parameter Validation by Design of Experimentation using Poisson & Johnson-
Cook Model for the test run of Welding later to be validated by computational
Method
Parameter for experimentation of Friction Stir Welding & Induction Brazing was first set
by DOE method and each parameter was further validated by Poisson process, Johnson-
Cook Model and linear regression fit and Chi-square % defective samples after an
optimized parameter with the further diagnostic report is shown in figure 7.1. Butt-welded
AISI 304 A 250 L×100W×1 thick and NiTinol basic properties are shown in Table 7.1.
NiTi (SMA), martensitic Nickel content 50.8 ± 0.4 at − % 49.7 ± 0.4 at − % Titanium
content Balance Balance Young’s modulus 70-80 GPa 23-41 GPa Tensile strength,
annealed ~ 900 MPa Tensile strength, cold-work hardened Up to 1900 MPa Poisson’s ratio
0.33 Elongation at break, annealed 20-60% Elongation at break, cold-work hardened 5-
20%, Melting point ~ 1310 °C, Density 6.45-6.5 g/cm3, Thermal conductivity ~ 18 W/mK
to ~ 9 W/mK.

STUDY OF DOE, SIMULATION AND ANALYTICAL RESULTS OF VARIOUS JOINERIES
108
Table 7.1 Basic Properties of AISI 304 A & NiTinol
C Cr Ni M n Mo Si P S Fe
0.03 16 10 2 2 1 0.045 0.03 balance
Parameter NiTi SMA
Martensite 304
Density [g/cm3] 6,5 8
Fusion Temp [ºC] 1240-1310 1450
Thermal Conductivity
[W/m ºC] 18 16
Heat Capacity [J/g ºC] 0,32 0,5
Thermal expansion ratio
[10-6/ºC]
Thermal Conductivity (W/mK)
11
~ 9
17,5
Ultimate Tensile
Strength [MPa] 754-960 500
Young’s modulus
[GPa],Poisson’s Ratio
23+41
0.33 193
7.2 Friction Stir Welding
Figure 7.1 shows the Chi square test conducted for Friction stir welded specimen by
providing hypothesis test of parameter of temperature with subset range of temperature
frequency available, stating value of p is less than 0.005 so null hypothesis is rejected for
defectives at temperature produced at more than 1200 rpm is rejected stating there is
significance association with this parameter.
Figure 7.1 Chi-square test for Nitinol wire by Temperature
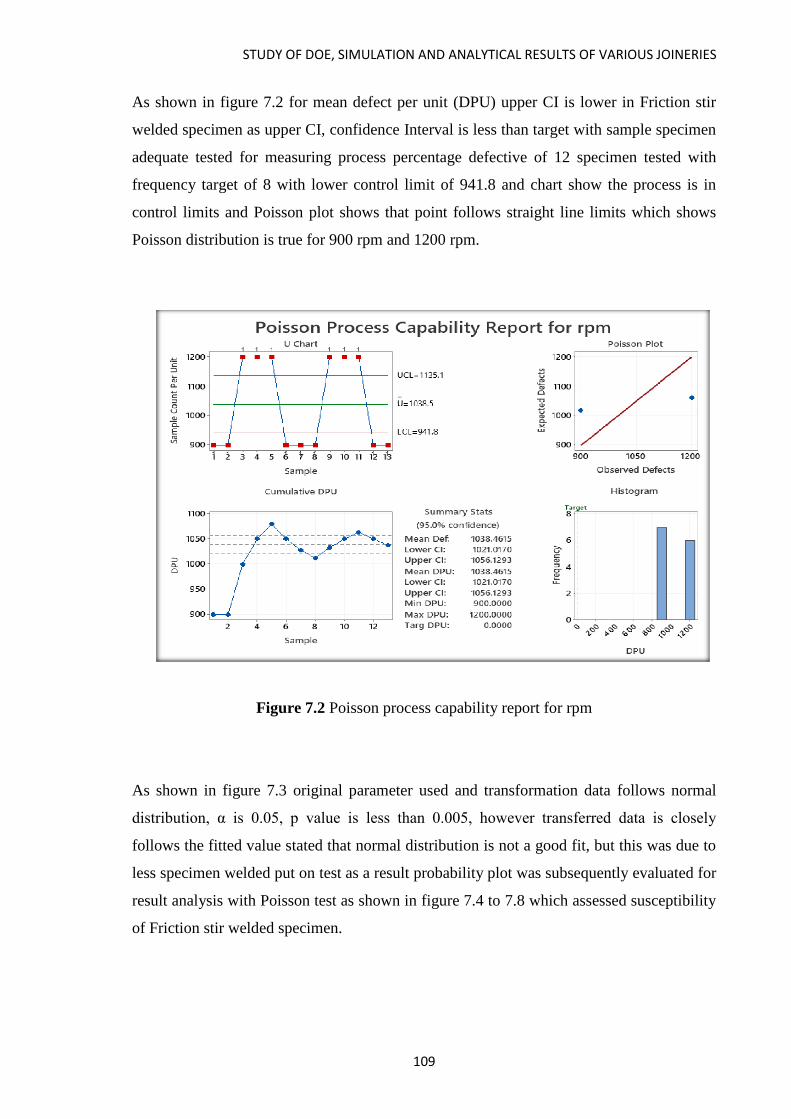
STUDY OF DOE, SIMULATION AND ANALYTICAL RESULTS OF VARIOUS JOINERIES
109
As shown in figure 7.2 for mean defect per unit (DPU) upper CI is lower in Friction stir
welded specimen as upper CI, confidence Interval is less than target with sample specimen
adequate tested for measuring process percentage defective of 12 specimen tested with
frequency target of 8 with lower control limit of 941.8 and chart show the process is in
control limits and Poisson plot shows that point follows straight line limits which shows
Poisson distribution is true for 900 rpm and 1200 rpm.
Figure 7.2 Poisson process capability report for rpm
As shown in figure 7.3 original parameter used and transformation data follows normal
distribution, α is 0.05, p value is less than 0.005, however transferred data is closely
follows the fitted value stated that normal distribution is not a good fit, but this was due to
less specimen welded put on test as a result probability plot was subsequently evaluated for
result analysis with Poisson test as shown in figure 7.4 to 7.8 which assessed susceptibility
of Friction stir welded specimen.

STUDY OF DOE, SIMULATION AND ANALYTICAL RESULTS OF VARIOUS JOINERIES
110
Figure 7.3 Johnson transformation for V0, rpm, mm/s
Figure 7.4 Before/after Poisson capability comparison for run order vs 1, diagnostic report

STUDY OF DOE, SIMULATION AND ANALYTICAL RESULTS OF VARIOUS JOINERIES
111
Figure 7.5 Before/after Poisson capability comparison for run order vs 1, summary report
Figure 7.6 Poisson capability analysis for f

STUDY OF DOE, SIMULATION AND ANALYTICAL RESULTS OF VARIOUS JOINERIES
112
Figure 7.7 Probability plot for rpm
Figure 7.8 Before/after Poisson capability comparison for centre Pt v/s Std Order_1

STUDY OF DOE, SIMULATION AND ANALYTICAL RESULTS OF VARIOUS JOINERIES
113
As shown in figure 7.9 of IB variable unlike figure 7.10 main signal plot of FSW main
effect parameter plot for signal stating how each parameter affects Response characteristic
stating output voltage has maximum with maximum coating of friction stir welded
specimen thickness minimal and as the lines are not parallel there is interaction amongst
all the variables.
Figure 7.9 Main effects plot for signal
Figure 7.10 Main effect plot for signal (b)

STUDY OF DOE, SIMULATION AND ANALYTICAL RESULTS OF VARIOUS JOINERIES
114
Figure 7.11 shows the contour plot of operating current vs max coating thickness for FSW
darker areas indicates good quality of welded specimen at that parameter range. These
parameters are connected as they have same response values deduced from previous
graphs. As the contour lines are arranged closely stating that the values of parameters
changes rapidly as shown optimized as shown in figure 7.12 which shows 3 dimensional
view of parameters upset force, rpm and hot rolled and contour plot showing two
dimensional view shows optimization of parameters in limits of FSW procedure.
Figure 7.11 Contour plot of Power v/s Operating Current, Max. Coating thickness
Figure 7.12 Surface plot of RPM v/s Upset force v/s Hot rolled %

STUDY OF DOE, SIMULATION AND ANALYTICAL RESULTS OF VARIOUS JOINERIES
115
The Chi-square test was conducted to find an association between rpm and frictional heat
generated, test report reveals that p=0.078 and the % level defective is not significant after
analyzing parameters range stating the association between rpm and frictional force
depends significantly. Hence Poisson process capability report for rpm was conducted for
samples which stated 1200 rpm with the optimized parameter for defect-free joinery.
Johnson Cook Model analyzed the strain rate and based on this pseudoelasticity which
determined the range of parameter set for the heating rate and temperature, for results
confirmation with experimentation procedure. The range of parameters resulted in an
increase in 91 MPa tensile strength at HAZ with strain hardening of 0.004. Signal Noise
ratio determined the rank of parameter affecting joinery, stating that rpm has a major effect
amongst all the parameter set for experimentation procedure.
7.3 Induction Brazing
As shown in figure 7.13 Poisson Capability report states that chance of producing defective
items deteriorated from 78.17 % to 51.3% with CI level before and after increased stating
that overall process capability yield is -27.3 % stating that parameter subset cannot be
optimized further.
Figure 7.13 Before/after Poisson capability comparison for run order vs 1
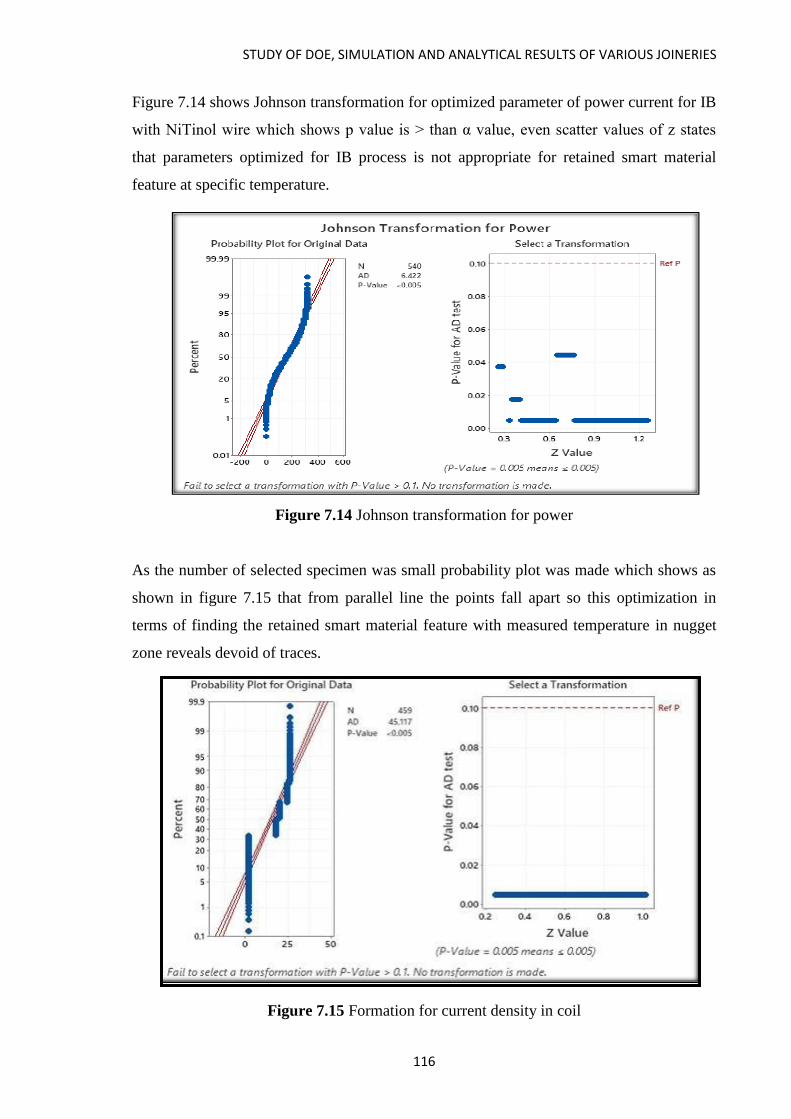
STUDY OF DOE, SIMULATION AND ANALYTICAL RESULTS OF VARIOUS JOINERIES
116
Figure 7.14 shows Johnson transformation for optimized parameter of power current for IB
with NiTinol wire which shows p value is > than α value, even scatter values of z states
that parameters optimized for IB process is not appropriate for retained smart material
feature at specific temperature.
Figure 7.14 Johnson transformation for power
As the number of selected specimen was small probability plot was made which shows as
shown in figure 7.15 that from parallel line the points fall apart so this optimization in
terms of finding the retained smart material feature with measured temperature in nugget
zone reveals devoid of traces.
Figure 7.15 Formation for current density in coil
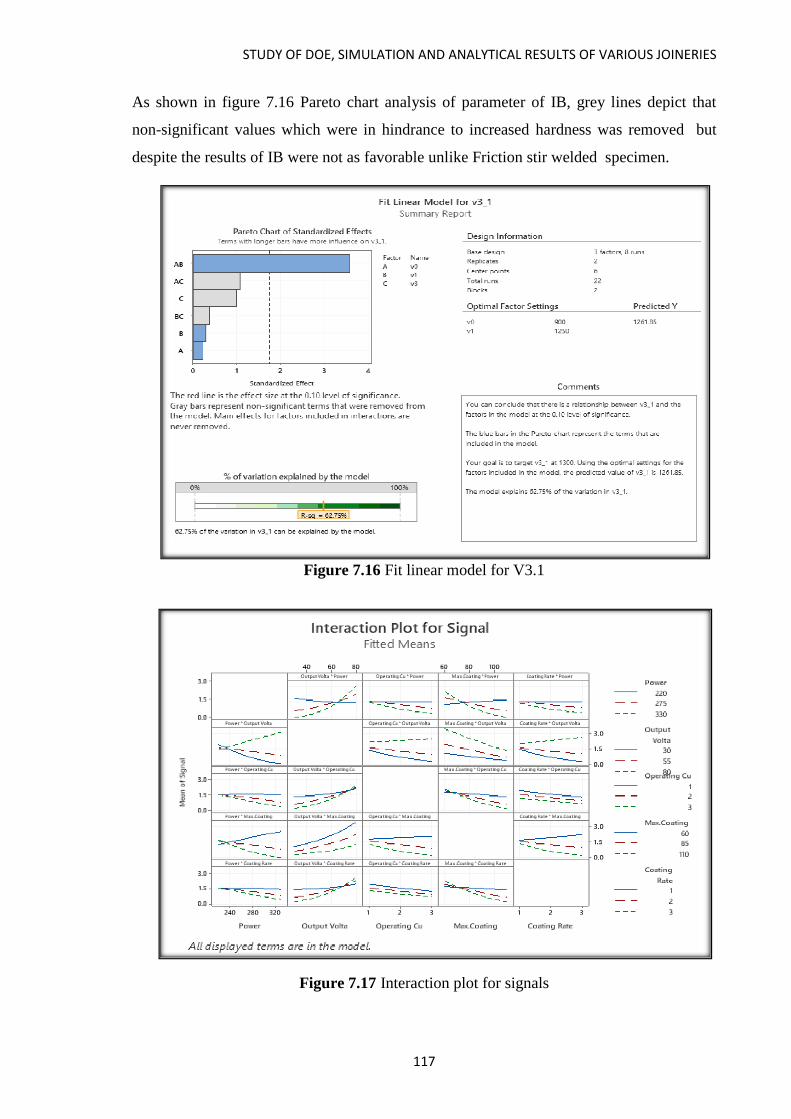
STUDY OF DOE, SIMULATION AND ANALYTICAL RESULTS OF VARIOUS JOINERIES
117
As shown in figure 7.16 Pareto chart analysis of parameter of IB, grey lines depict that
non-significant values which were in hindrance to increased hardness was removed but
despite the results of IB were not as favorable unlike Friction stir welded specimen.
Figure 7.16 Fit linear model for V3.1
Figure 7.17 Interaction plot for signals

STUDY OF DOE, SIMULATION AND ANALYTICAL RESULTS OF VARIOUS JOINERIES
118
As shown in figure 7.17 signal to noise ratio is plotted, which identified power, output
voltage, cooling rate, coating thickness as control factor levels for optimizing parameters
of Induction brazing process which were further assessed by process capability. Based on
this, as shown in figure 7.19, 2 D and figure 7.20 3D surface plot generated of optimized
parameter Power frequency and current density.
Figure 7.18 Interaction plot for signals (b)
Figure 7.19 Contour plot of Std Order vs f, j
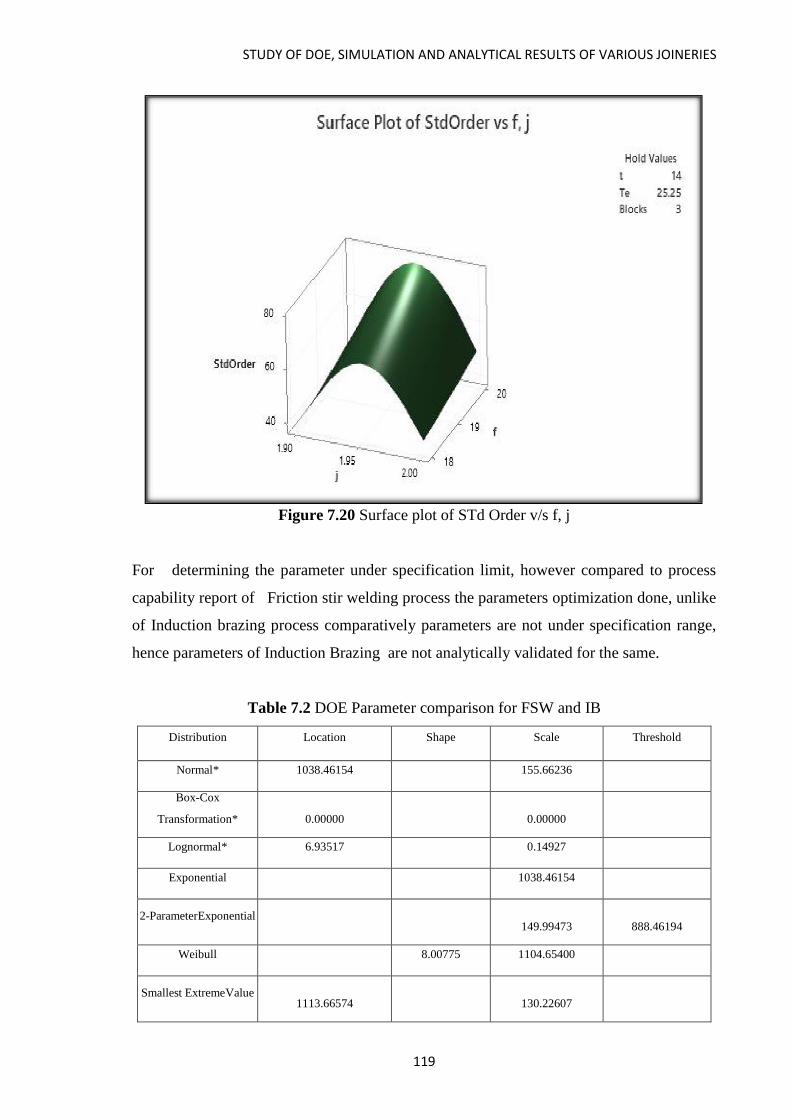
STUDY OF DOE, SIMULATION AND ANALYTICAL RESULTS OF VARIOUS JOINERIES
119
Figure 7.20 Surface plot of STd Order v/s f, j
For determining the parameter under specification limit, however compared to process
capability report of Friction stir welding process the parameters optimization done, unlike
of Induction brazing process comparatively parameters are not under specification range,
hence parameters of Induction Brazing are not analytically validated for the same.
Table 7.2 DOE Parameter comparison for FSW and IB
Distribution Location Shape Scale Threshold
Normal* 1038.46154 155.66236
Box-Cox
Transformation*
0.00000
0.00000
Lognormal* 6.93517 0.14927
Exponential 1038.46154
2-Parameter Exponential
149.99473
888.46194
Weibull 8.00775 1104.65400
Smallest Extreme Value
1113.66574
130.22607

STUDY OF DOE, SIMULATION AND ANALYTICAL RESULTS OF VARIOUS JOINERIES
120
Largest Extreme Value
965.77236
119.09036
Gamma 48.59457 21.36991
Logistic 1033.31562 96.60068
Loglogistic 6.93024 0.09263
Table 7.3 Parameter Exponential by Poisson’s Method
Distribution AD P LRT P
Normal 2.195 <0.005
Box-Cox Transformation 2.195 <0.005
Lognormal 2.195 <0.005
Exponential 4.613 <0.003
2-Parameter Exponential 4.586 <0.010 0.000
Weibull 2.332 <0.010
Smallest Extreme Value 2.332 <0.010
Largest Extreme Value 2.458 <0.010
Gamma 2.354 <0.005
Logistic 2.088 <0.005
Loglogistic 2.088 <0.005
Hence as shown in Table 7.2 and 7.3 parameter comparison of FSW and IB is done by
mentioned methods, for additional parameter LRT P (likelihood ratio test) p value along
with AD (Anderson Darling) test Logistic and Log logistics of AD is smallest which states
fit value of 2.088 for Friction Stir welding process, all the distribution values of p is below
0.005 and hence it falls under normal process for LRDP including and hence further
validation of optimized parameters of Friction Stir welding was done by 2-parameter
Exponential by Poisson method.
The DOE method parameters comparison stated as shown in Table 7.4 and 7.5, that 2-
Parameter Exponential is the suitable method as the threshold is 888.46194. Poisson
Capability report and DOE report statistics defined the range for analytical validation of
parameters.

STUDY OF DOE, SIMULATION AND ANALYTICAL RESULTS OF VARIOUS JOINERIES
121
Table 7.4 Induction Brazing DOE t value and p-value
Difference
of Levels
Difference
of Means
SE of
Difference 95% CI T-Value
Adjusted
P-Value
70 - 60 7.44 7.75 (-12.40, 27.27) 0.96 0.807
80 - 60 49.26 8.64 (27.16, 71.36) 5.70 0.000
90 - 60 4.11 9.00 (-18.92, 27.14) 0.46 0.989
100 - 60 0.26 8.01 (-20.23, 20.76) 0.03 1.000
110 - 60 0.82 8.22 (-20.23, 21.86) 0.10 1.000
Robotic& Manual Friction Stir Welding DOE t value and p-value
Table 7.5 Mechanized & Manual Friction Stir Welding DOE t value and p-value
Difference
of Levels
Difference
of Means
SE of
Difference 95% CI T-Value
Adjusted
P-Value
70 - 60 7.44 7.75 (-7.94, 22.81) 0.96 0.340
80 - 60 49.26 8.64 (32.13, 66.39) 5.70 0.000
90 - 60 4.11 9.00 (-13.74, 21.96) 0.46 0.649
100 - 60 0.26 8.01 (-15.63, 16.15) 0.03 0.974
110 - 60 0.82 8.22 (-15.49, 17.13) 0.10 0.921
80 - 70 41.83 8.30 (25.37, 58.29) 5.04 0.000
90 - 70 -3.33 8.68 (-20.54, 13.88) -0.38 0.702
100 - 70 -7.17 7.65 (-22.34, 7.99) -0.94 0.350
110 - 70 -6.62 7.87 (-22.23, 8.99) -0.84 0.402
90 - 80 -45.15 9.48 (-63.95, -26.36) -4.77 0.000
100 - 80 -49.00 8.54 (-65.94, -32.06) -5.74 0.000
110 - 80 -48.44 8.74 (-65.78, -31.10) -5.54 0.000
100 - 90 -3.85 8.91 (-21.52, 13.82) -0.43 0.667
110 - 90 -3.29 9.10 (-21.34, 14.76) -0.36 0.718
110 - 100 0.56 8.12 (-15.56, 16.67) 0.07 0.946
7.4 Computational Validation of Optimized parameters of Friction Stir Welding and
Induction Brazing
As DOE parameters and simulations in Friction stir welding and Induction brazing
processes are dependent on the flow stress input data, the flow stress is computed from
empirical models based on material parameters, the values of which are derived from
various mathematical optimization techniques. The derived flow stress parameters vary
based on the nature of techniques used and the flow stress testing procedure utilized. These
results are in variations in the numerical simulation results when working with different
models. In this work, the Johnson-Cook flow stress model is tested for its sensitivity

STUDY OF DOE, SIMULATION AND ANALYTICAL RESULTS OF VARIOUS JOINERIES
122
towards the finite element (FE) results. The test is conducted with AISI 304 A with NiTinol
Wire and the process is simulated in MATLAB. The flow stress computed from the Johnson-
Cook model is input to the FE code and the cutting force and chip thickness are recorded.
The FE results are input to the Minitab statistical code and an optimization process is
conducted based on the concept of the orthogonal array. Calculating the sensitivity of the
five parameters of the material model towards the tensile strength determination is the basic
procedure. Simeon Denis Poisson for describing the probability event in allotted time interval
wherein means is known with time as an independent factor. λ is the mean for rpm and the
following formula states the probability for mean equals to variance. The size of the plate is
350 mm × 150 mm butt welded AISI 304 A with NiTinol wire.
Probability event in allotted time interval wherein means is known with time as an
independent factor. λ is the mean for rpm and the following formula states the probability
for mean equals to variance.
(𝑌 = 𝑦|𝜆) = 𝜆 𝑦𝑒 –𝜆/ 𝑦! ----------------------------------------------------------------------------7(1)
(𝑌 = 𝑦|𝜆) is the probability mass function for specific rate y given in mean. The following
formula describes the Normal distribution also known as Gaussian function which is the
density function.
ϕ (𝑥) = 1 𝛿√2𝜋 𝑒 − 1 2 (− ) 2 , 𝜆 = 𝑒 𝑋β ------------------------------------------------------7(2)
X value determines the predictor’s vector and β is the regression coefficient vector,
Following is linear regression.
�̂�𝑖 = 𝛽0 + 𝛽1𝑥t
𝑦𝑖 = 𝛽0 + 𝛽1𝑥𝑖 + 휀t
휀𝑖 = 𝑦𝑖 − 𝑦̂ t --------------------------------------------------------------------------------------7(3)
Multivariable linear regression
𝑦𝑖 = 𝛽0 + 𝛽1𝑥t1 + 𝛽2𝑥t2 + 휀t --------------------------------------------------------------------7(4)
As per Okerblom, this formula is limited to fast welding
⸹L=0.355Q/AV
⸹T=17.4Q/sv×10-4
--------------------------------------------------------------------------------7(5)
Using the law of energy conservation and Fourier’s Law, considering the thermal
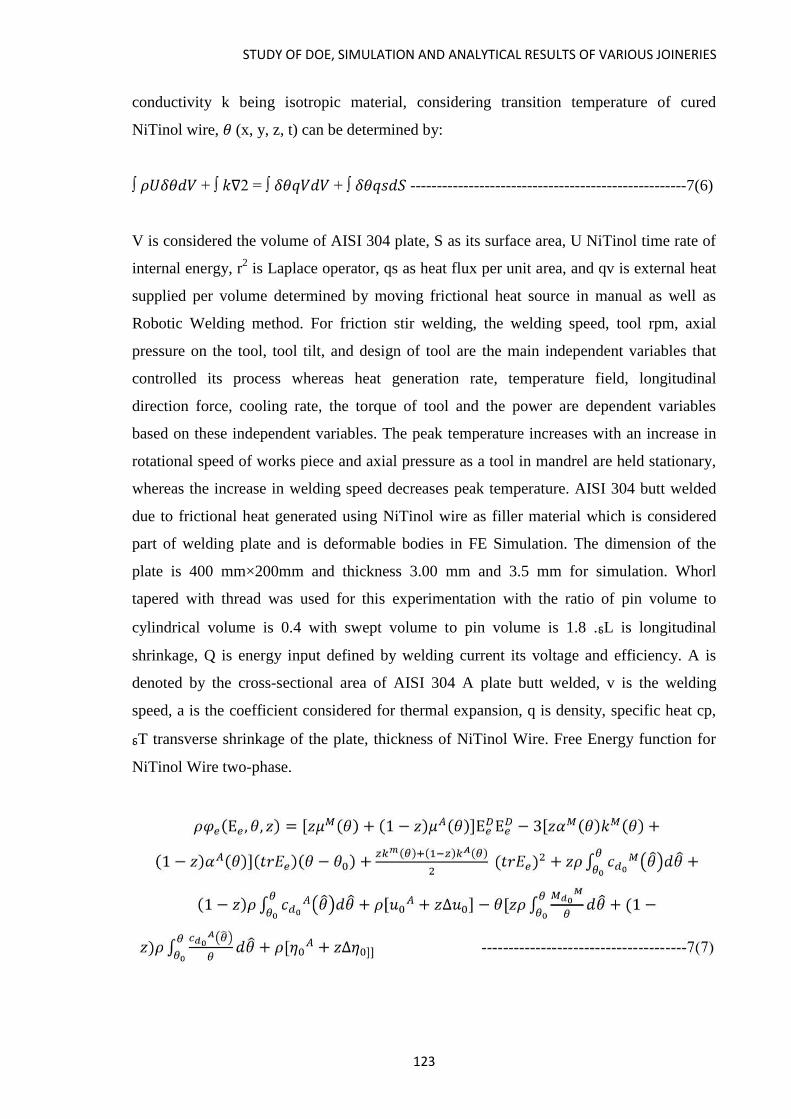
STUDY OF DOE, SIMULATION AND ANALYTICAL RESULTS OF VARIOUS JOINERIES
123
conductivity k being isotropic material, considering transition temperature of cured
NiTinol wire, 𝜃 (x, y, z, t) can be determined by:
∫ 𝜌𝑈𝛿𝜃𝑑𝑉 + ∫ 𝑘∇2 = ∫ 𝛿𝜃𝑞𝑉𝑑𝑉 + ∫ 𝛿𝜃𝑞𝑠𝑑𝑆 ----------------------------------------------------7(6)
V is considered the volume of AISI 304 plate, S as its surface area, U NiTinol time rate of
internal energy, r2 is Laplace operator, qs as heat flux per unit area, and qv is external heat
supplied per volume determined by moving frictional heat source in manual as well as
Robotic Welding method. For friction stir welding, the welding speed, tool rpm, axial
pressure on the tool, tool tilt, and design of tool are the main independent variables that
controlled its process whereas heat generation rate, temperature field, longitudinal
direction force, cooling rate, the torque of tool and the power are dependent variables
based on these independent variables. The peak temperature increases with an increase in
rotational speed of works piece and axial pressure as a tool in mandrel are held stationary,
whereas the increase in welding speed decreases peak temperature. AISI 304 butt welded
due to frictional heat generated using NiTinol wire as filler material which is considered
part of welding plate and is deformable bodies in FE Simulation. The dimension of the
plate is 400 mm×200mm and thickness 3.00 mm and 3.5 mm for simulation. Whorl
tapered with thread was used for this experimentation with the ratio of pin volume to
cylindrical volume is 0.4 with swept volume to pin volume is 1.8 .⸹L is longitudinal
shrinkage, Q is energy input defined by welding current its voltage and efficiency. A is
denoted by the cross-sectional area of AISI 304 A plate butt welded, v is the welding
speed, a is the coefficient considered for thermal expansion, q is density, specific heat cp,
⸹T transverse shrinkage of the plate, thickness of NiTinol Wire. Free Energy function for
NiTinol Wire two-phase.
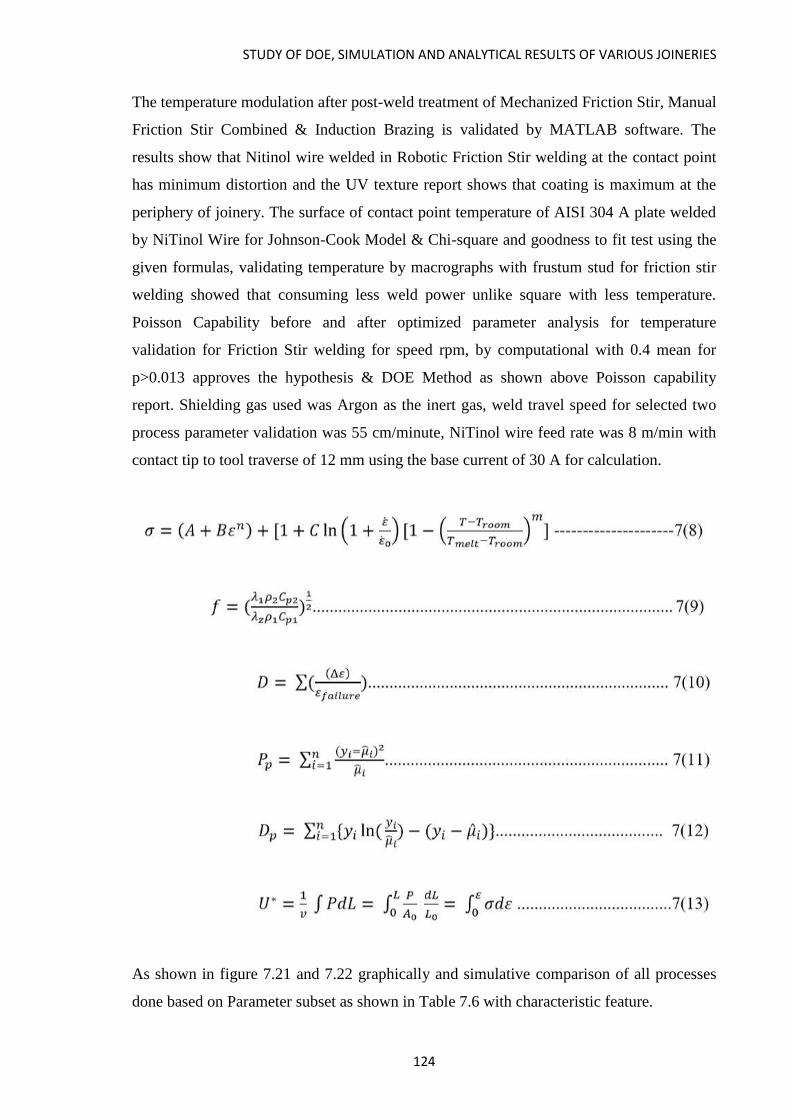
STUDY OF DOE, SIMULATION AND ANALYTICAL RESULTS OF VARIOUS JOINERIES
124
The temperature modulation after post-weld treatment of Mechanized Friction Stir, Manual
Friction Stir Combined & Induction Brazing is validated by MATLAB software. The
results show that Nitinol wire welded in Robotic Friction Stir welding at the contact point
has minimum distortion and the UV texture report shows that coating is maximum at the
periphery of joinery. The surface of contact point temperature of AISI 304 A plate welded
by NiTinol Wire for Johnson-Cook Model & Chi-square and goodness to fit test using the
given formulas, validating temperature by macrographs with frustum stud for friction stir
welding showed that consuming less weld power unlike square with less temperature.
Poisson Capability before and after optimized parameter analysis for temperature
validation for Friction Stir welding for speed rpm, by computational with 0.4 mean for
p>0.013 approves the hypothesis & DOE Method as shown above Poisson capability
report. Shielding gas used was Argon as the inert gas, weld travel speed for selected two
process parameter validation was 55 cm/minute, NiTinol wire feed rate was 8 m/min with
contact tip to tool traverse of 12 mm using the base current of 30 A for calculation.
As shown in figure 7.21 and 7.22 graphically and simulative comparison of all processes
done based on Parameter subset as shown in Table 7.6 with characteristic feature.

STUDY OF DOE, SIMULATION AND ANALYTICAL RESULTS OF VARIOUS JOINERIES
125
Figure 7.21 Graphical Comparison of Six Welding Process based on Joint Analysis
Figure 7.22 Simulation result

STUDY OF DOE, SIMULATION AND ANALYTICAL RESULTS OF VARIOUS JOINERIES
126
Table 7.6 Analytical Comparative analysis of Experimental Data Parameter
.Para
met
er
s/R
esu
lts
P
uls
ed A
rc
Wel
din
g
Mic
ro P
lasm
a
Arc
Wel
din
g
La
ser
Wel
din
g
Fri
ctio
n S
tir
Man
ual
&
Rob
oti
c
Wel
din
g
In
du
ctio
n
bra
zin
g
C
ap
aci
tor-
Dis
charg
e
Ampere
55 Ampere
22(0.5LpM &
8LpM of
Argon
Shielding gas
66 Ampere
304 A steel plate
8Ø 50×80 mm
240 A & 280 A
2 KW
power
supply.
62 A
Voltage
9 V to 10 V
40
9-10 V
Upset force 2.1
tons, Friction
force 1 ton
220 V I
Phase
220 V I Phase
Pulse frequency
3.5
----
----
------
250 KHz
110KHz
Secondary 50% of 1200 rpm suitable
from
900,1000,1100
rpm,10 mm/sec
for Robotic
Current/ main
Traverse current
speed (27.5 amp)
Pulse Duty
Cycle/
Temp. of
operation
50%
----
-------
345º C
Manual
FSW 300º C
Robotic FSW
80%
(Nitinol
at liquidus
temperat
ure above
470°C
80%
(Nitinol at
liquidus
temperatur
e above
410ºC
Travel
Speed/Axial
Load/Upsetting
force
Power
Force Control
140 mm/min
----
-------
Upset time: 1-sec
Soft force-time :
2.5
sec,115mm/sec
welding speed
with traverse
speed 2.76
mm/min
1 KVA
3000 N Down
(Robotic)
7 seconds
Upsetting
force 20
KN
UTS Actual N/mm2
218.79
514.5
4.07
Partial
No
UTS DOE 297 82.17 N/mm2 502.47 441.12 334.27
Load KN 495 310 552.34 477.5 417.8
Pseudoelasticity 4.9 1.53 7.83 6.11 5.280
behavior in the No Partial YES Partial No
tensile test
Bending Test
Straightness No No YES Partial No
Recovery
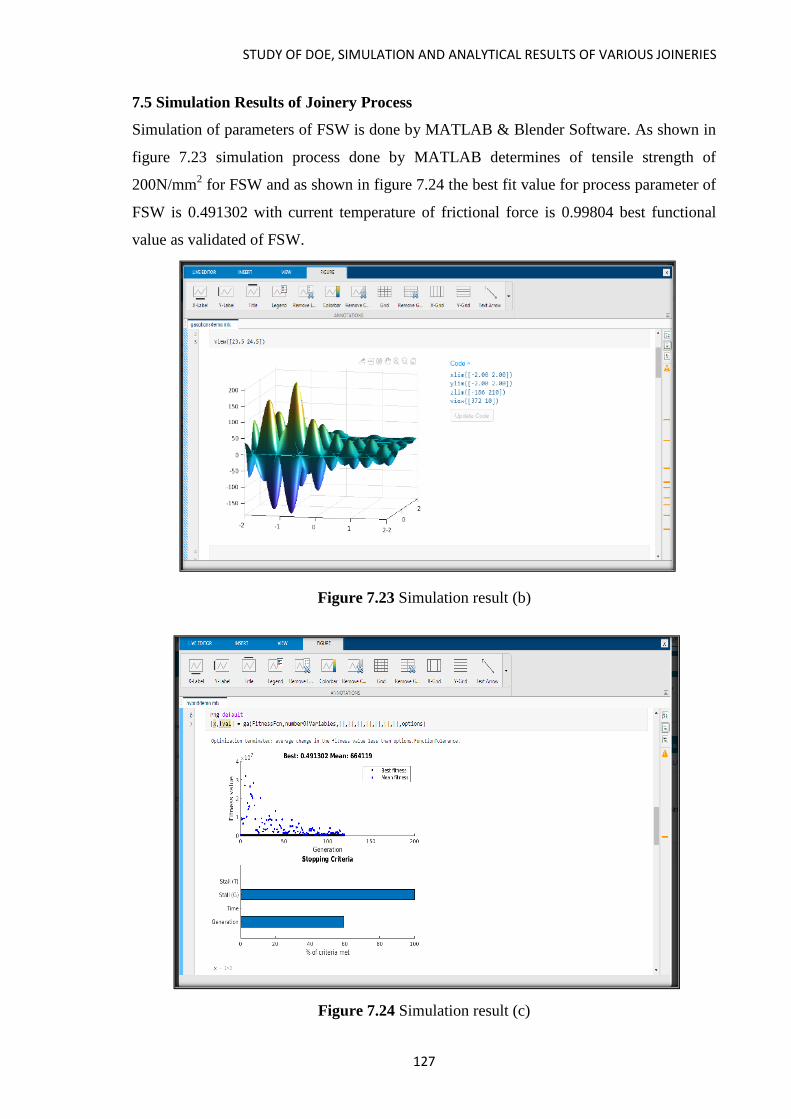
STUDY OF DOE, SIMULATION AND ANALYTICAL RESULTS OF VARIOUS JOINERIES
127
7.5 Simulation Results of Joinery Process
Simulation of parameters of FSW is done by MATLAB & Blender Software. As shown in
figure 7.23 simulation process done by MATLAB determines of tensile strength of
200N/mm2 for FSW and as shown in figure 7.24 the best fit value for process parameter of
FSW is 0.491302 with current temperature of frictional force is 0.99804 best functional
value as validated of FSW.
Figure 7.23 Simulation result (b)
Figure 7.24 Simulation result (c)

STUDY OF DOE, SIMULATION AND ANALYTICAL RESULTS OF VARIOUS JOINERIES
128
Figure 7.25 Simulation results (d)
Figure 7.26 Surface plot

STUDY OF DOE, SIMULATION AND ANALYTICAL RESULTS OF VARIOUS JOINERIES
129
Figure 7.27 Surface plot (b)
The Table 7.7 below shows the validated parameter subset of FSW, however as validated
optimized parameters of FSW for NiTinol joinery on AISI 304A, based on Tensile strength
bias error of all three processes of simulation, analytical & experimental shows minimum
bias error of 0.00278 for friction stir welding at 1200 rpm with 90 mm/sec tool velocity at
3.5 KN axial load and 2.5° tilt of tool angle at tool post of lathe machine, whereas for
Robotic Friction at 1200 rpm with welding speed 10 mm/sec and 1 KVA force control
3000 down force and 300 °C. Based on DOE results of mean and Chi-square and Pareto
analysis stated the frequency of defect of FSW and IB with the count of 26 for further
analytical validation procedure done.
Table 7.7 Micro grain Structure of Joinery Method to determine shape memory alloy
features
Test DF Estimate Mean Chi-Square P-Value
Deviance 112 32.99525 0.29460 33.00 0.004
Pearson 112 18.00000 0.16071 18.00 0.049
AS shown in Table 7.7 for FSW, deviance and Pearson Method validation opts for
deviance with higher Chi value and lower P value which validates optimized parameters of
FSW. Deviance method further measured the discrepancy of parameters of FSW
formulated and experimental value maximizing the log likelihood functions using the
scaled deviation of the Poisson Model. Further, based on computation and the graphical

STUDY OF DOE, SIMULATION AND ANALYTICAL RESULTS OF VARIOUS JOINERIES
130
analysis, for validation and acceptance criteria research data were validated of FSW, of
research paper [121], compared which proves the correctness of experimentation of FSW
by optimized parameters as bias error of 0.002078 of performed experimentation of FSW
method is less compared to Research paper of 0.0234, hence validating the propounded
parameter subset with optimum module for Friction stir welding comparing UTS, impact
strength & elongation of 18 samples as shown in series form in figure 7.28 with
parameters.
Figure 7.28 Graphical analysis based on comparative analysis
However, table 7.8 finally depicts the comparative analysis of computational, simulation,
linear regression with parameters of FSW of Tool angle(Vo), Axial Load (V1), Tool RPM
(V2), Tool Velocity (V3), Tool Thickness (V4) which is 1mm, hence in Table 7.28 is not
taken. Bias % Error of welded specimen of FSW by Nitinol Wire on AISI 304A is
compared of each parameter by Computational, Linear Regression Simulation to formulate
the best fit optimized parameter set, which is validated by Research paper. The validated
parameter shows less % bias Error as per Research paper [121].
The formulated parameter for FSW is shown in Table 7.8 with highlighted of 14 series.
Vo-2.5 mm, V1 3.5 mm, V2 1200 rpm, V3 90 mm/sec with % bias error 0.00278 is
selected for the same.
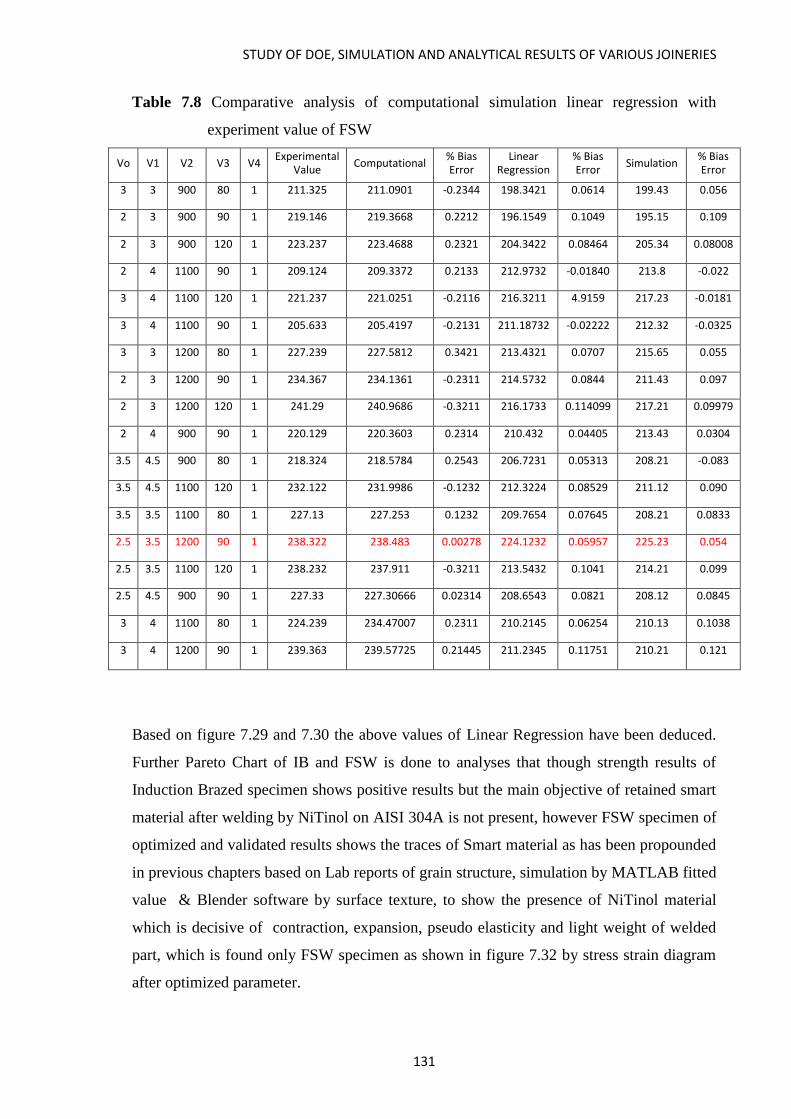
STUDY OF DOE, SIMULATION AND ANALYTICAL RESULTS OF VARIOUS JOINERIES
131
Table 7.8 Comparative analysis of computational simulation linear regression with
experiment value of FSW
Vo V1 V2 V3 V4 Experimental
Value Computational
% Bias Error
Linear Regression
% Bias Error
Simulation % Bias Error
3 3 900 80 1 211.325 211.0901 -0.2344 198.3421 0.0614 199.43 0.056
2 3 900 90 1 219.146 219.3668 0.2212 196.1549 0.1049 195.15 0.109
2 3 900 120 1 223.237 223.4688 0.2321 204.3422 0.08464 205.34 0.08008
2 4 1100 90 1 209.124 209.3372 0.2133 212.9732 -0.01840 213.8 -0.022
3 4 1100 120 1 221.237 221.0251 -0.2116 216.3211 4.9159 217.23 -0.0181
3 4 1100 90 1 205.633 205.4197 -0.2131 211.18732 -0.02222 212.32 -0.0325
3 3 1200 80 1 227.239 227.5812 0.3421 213.4321 0.0707 215.65 0.055
2 3 1200 90 1 234.367 234.1361 -0.2311 214.5732 0.0844 211.43 0.097
2 3 1200 120 1 241.29 240.9686 -0.3211 216.1733 0.114099 217.21 0.09979
2 4 900 90 1 220.129 220.3603 0.2314 210.432 0.04405 213.43 0.0304
3.5 4.5 900 80 1 218.324 218.5784 0.2543 206.7231 0.05313 208.21 -0.083
3.5 4.5 1100 120 1 232.122 231.9986 -0.1232 212.3224 0.08529 211.12 0.090
3.5 3.5 1100 80 1 227.13 227.253 0.1232 209.7654 0.07645 208.21 0.0833
2.5 3.5 1200 90 1 238.322 238.483 0.00278 224.1232 0.05957 225.23 0.054
2.5 3.5 1100 120 1 238.232 237.911 -0.3211 213.5432 0.1041 214.21 0.099
2.5 4.5 900 90 1 227.33 227.30666 0.02314 208.6543 0.0821 208.12 0.0845
3 4 1100 80 1 224.239 234.47007 0.2311 210.2145 0.06254 210.13 0.1038
3 4 1200 90 1 239.363 239.57725 0.21445 211.2345 0.11751 210.21 0.121
Based on figure 7.29 and 7.30 the above values of Linear Regression have been deduced.
Further Pareto Chart of IB and FSW is done to analyses that though strength results of
Induction Brazed specimen shows positive results but the main objective of retained smart
material after welding by NiTinol on AISI 304A is not present, however FSW specimen of
optimized and validated results shows the traces of Smart material as has been propounded
in previous chapters based on Lab reports of grain structure, simulation by MATLAB fitted
value & Blender software by surface texture, to show the presence of NiTinol material
which is decisive of contraction, expansion, pseudo elasticity and light weight of welded
part, which is found only FSW specimen as shown in figure 7.32 by stress strain diagram
after optimized parameter.

STUDY OF DOE, SIMULATION AND ANALYTICAL RESULTS OF VARIOUS JOINERIES
132
Figure 7.29 Residual’s v/s fitted values and observation order
Figure 7.30 Multiple regression for current dens

STUDY OF DOE, SIMULATION AND ANALYTICAL RESULTS OF VARIOUS JOINERIES
133
Figure 7.31 Comparative analysis of all three methods for FSW & IB for block 1 and
block 2
Figure 7.32 NiTinol & AISI 304A Stress-Strain Curve for FSW
The stress-strain curve depicts the stress-strain plateau of retained smart material
characteristics after well, due to different martensite properties of Ni-Ti and AISI 304.
Steel, during Friction stir welding unlike Induction Brazing welding due to changed
solidification modes, microstructure study revealed epitaxial growth of NiTi which
identified martensite structure during cooling of weld resulting into crack-free weld zone.

STUDY OF DOE, SIMULATION AND ANALYTICAL RESULTS OF VARIOUS JOINERIES
134
The formation of fine intermetallics which is higher than base material AISI determines the
hardness strength of repaired joinery by FSW. However, test results show that when
frictional heat generated is made to tend closer to base material compared to farther in the
sample the prior one shows more UTS results.
7.6 Comparative Results of Friction Stir Welding and their discussions
The experimental results reveal that welding NiTinol requires utmost calculative
parameters control of amperage, voltage, pulse frequency, pulse duty cycle, secondary
current and travel speed which played vital role in characteristic weld strength. As Nitinol
is a very hard material presence of oxide with 45% Titanium makes difficult task for
welding. The properties of super elasticity and shape memory did not remain intact while
performing these welding processes except in friction stir welding process. However,
tensile strength tests revealed that degradation and resistance to permanent deformation in
nugget zone was noticed in particular to Plasma Arc, Capacitor Discharge & TIG Welding.
Tensile strength almost 70-72% of the base metal maintained permanent deformation
below 0.2 % after a 6% deformation of welded specimen proved to undergo the least
thermal degradation except in Friction stir welding. The tensile strength of Capacitor
discharge welding process was prominently affected by welding time and stud material.
Following are the implications of NiTinol wire on AISI 304 A by six selected joinery
process as elaborated in Table 7.9.
Table 7.9 Analytical Comparative analysis of Experimental Data Parameter
Parameters /Remarks
TIG PAW LW FSW- Lathe
IB CD
Experimental UTS N/mm2
218.79 219.12 82.17 238.478 227.12 221.27
DOE 224.5 229.53 110.12 243.127 234.46 219.81
Load 4.07 4.9 1.53 7.83 6.11 5.280
Pseudoelasticity behaviour
Partial No Partial YES Partial No
Bending 136 137 132 145.6 138 139.1
Straightness Recovery
No No No YES Partial No

STUDY OF DOE, SIMULATION AND ANALYTICAL RESULTS OF VARIOUS JOINERIES
135
Amongst all six-joinery experimental investigation done after parameter subset obtained by
DOE, it was found that Friction Stir Welding was the most apt method for NiTinol wire
joinery, hence its parameters were further optimized by computational, Simulation by
MATLAB & Blender Software. Table 7.10 gives comparative analysis between
experimental and analytical as based on research paper for validation and it was found less
compared to research which showed 0.02854 to actual with 0.00287% bias error which
showed the fit, based on calculations of research paper [121] & if superior value.
Table 7.10 Friction Stir Computational Validation based on Research Paper
As shown in figure 7.33 graphically comparative analysis of optimized parameters of FSW
validated by three methods of analytical based on Research paper validated formula of
Tensile, Impact and hardness and Simulation value by MATLAB & Blender along with
Lab Reports and Linear Regression in comparison to actual experimentation result show
simulation shows better results and Experimental and actual values are close to each other.
Tensile strength
174.2-1.03V0+9.09V1+0.01463V2+0.1243V3+0.12V4 ------------------------------7(14)
Elongation
1.76+1.832V0+0.615V1-0.000659V2 ------------------------------------------------7(15)

STUDY OF DOE, SIMULATION AND ANALYTICAL RESULTS OF VARIOUS JOINERIES
136
Impact Strength
0.915+0.0031V0-0.0376V1+0.000118V2+0.000119V3-0.0422V4 --------------------7 (16)
Figure 7.33 Comparative analysis of FSW Experimental, Analytical & Simulation Data
Parameter With bias error
As shown in figure 7.34 comparative analysis of parameter is done and as shown in figure
7.35 comparative analysis of properties of optimum four welding processes from six
selected technologies after analyzing graphically, shows that ultimate tensile strength of
Friction Stir Welding is 238.483 MPa unlike all other processes as well retained smart
material properties of pseudoelasticity as shown in joint analysis phases stages from 0 to 8
with phase transformation Ar. Hence, solid state Friction Stir Welding method is found to
be the most appropriate joinery technique for welding AISI 304A with NiTinol Wire.

STUDY OF DOE, SIMULATION AND ANALYTICAL RESULTS OF VARIOUS JOINERIES
137
Figure 7.34 Comparative analysis of Parameter subset
Figure 7.35 Comparative analysis of properties of optimum four welding processes from
six processes
CONCLUSION AND FUTURE SCOPE
138
CHAPTER 8
CONCLUSION AND FUTURE SCOPE
This chapter finally depicts the summary with concluding remarks marking the future
scope of this research work. The perspective of this research is to understand the
phenomenal transition of phases of NiTinol during welding and retaining its smart material
characteristic features post-weld with AISI 304 A plate using selected six joineries. The
parameters for Experimental Investigations are propounded based on research and then
based on the Design of Experimentation Taguchi Method, these subsets of parameters were
used to conduct respective joinery by NiTinol Wire. Comparative analysis of these six
selected joinery methods based on joint strength, pseudoelastic features based on
Compression, UTS, bend test, and micro-grain structure by optical microscope, further
zeroed down on two joinery methods of Friction Stir Welding – Manual Lathe & Robotic
Friction and Induction Brazing. The parameters of these processes were further optimized
to make the defect-free joint.
The research of the validation of optimized parameters was further based on
Computational Poisson Johnson-Cook Model, Energy distribution and Simulation UV
surface Texture and Mesh analysis. Based on these statistics and graphical analysis,
Friction Stir Welding based on a Manual Lathe process for batch work of repair finds
suitability & Robotic Friction for mass production with complex geometry components.
The study showed that joining NiTinol with NiTinol is showing good results compared to
dissimilar materials due to the formation of oxides during welding. Also, the heat input
source played a crucial role in retaining smart material features in the welded specimen
which was kept minimal up to 1 J as the diameter of NiTinol wire used is 0.98 mm for the
experiment.
The study showed that as heat input source increased above I J embrittlement in the
specimen was found. Therefore, to overcome it curing of NiTinol wire was used after
acetone bath for 15s and AISI 304A plate base plate was further etched to remove
oxidation content.

CONCLUSION AND FUTURE SCOPE
139
8.1 Conclusion from various joinery techniques
Manual & Mechanized Friction Stir Welding produced quality repair strength amongst
selected six joinery methods. Lab reports showed retained pseudo elasticity & smart material
characteristics for Friction Stir Welded specimen unlike Induction Brazing, also tensile
strength in Friction Stir Welding almost 60-62% of the base metal was maintained with
permanent deformation below 0.3 % after a 7% deformation of welded specimen proved to
undergo the least thermal degradation. It was observed that AISI 304 A steel welded with
NiTinol wire is less prone to cracking in FSW. Also, it was observed that Ti laced curing
in NiTinol wire and dip in HCL bath for removing oxides resulted in epitaxial NiTi film at
the contact zone of FSW. Tool angle and tool velocity for frictional heat generation at the
contact zone is an important parameter for FSW. Future scope for Friction Stir Welding
process can be using this optimized process welding parameters for dissimilar welding of
AISI 304 repairing and exploring on gravity pool of melt zone of nugget area and curing
technique.
• Laser Welding not produced a favorable result due to the long pulse used in the
experimentation procedure but the specimen obtained was a clean weld as no
contact was done with the source. Welding speed and shielding gas played a
prominent role in the process. HAZ showed an Af transition change resulting in the
weak zone at the contact area. The corrosion performance when assessed showed
that after post-weld treatment it improved.
• Plasma Arc Welding the plasma arc source heat input impact was drastically
producing significant negative changes in the micro-grain structure of NiTi as
revealed by lab test report also UTS was 297 MPa. The mechanical test showed that
the specimen fractured at HAZ with the presence of rough grains and was devoid of
shape memory features. However, gravity melt pool formation was substantially
progressive which suggests that tooling and proper heat treatment process can
improvise weld strength.
• Tungsten Inert Gas Welding Cyclic loading showed rupture of 10%, this method is
favorable with a short weld distance and had less grain dislocation at fusion zone
but remelting stage caused NiTi forming oxide layers losing pseudoelastic content
& weak joinery. The bead geometry was with a general slope observed.
• Capacitor-Discharge Welding The source location played an important role along
with stud design area but as AISI 304 A plate butt welding area was substantially
less, stud penetration was proper but the force exerted for stud dislocated stress

CONCLUSION AND FUTURE SCOPE
140
valence at fusion zone hence this welding produced no shape memory properties
but clean & crack free joint was made.
• Induction Brazing Thermal cycles harmed pseudoelasticity content due to remelting
process. The bead geometry, however, was with a gentle slope hence fracture and
embrittlement were reduced producing quality weld with good contact resistance.
8.2 Main Concluding points of Most Apt Joinery Friction Stir Welding
Six joining techniques were selected to experiment parameter subset formulating based on
research analysis to find the most apt method with retained smart material feature in
welded specimen as explained fundamental principle of conventional method and using
Nitinol wire joinery.
Challenges faced in joining the dissimilar material with NiTinol wire in theses selected
techniques of austenite steel was basically reduction in strength as well intermetallics.
Other main challenge was to retain both superelastic and shape memory alloy feature of
NiTinol wire which was done by phase transformation temperature control. Other major
hindrance for desired result was related to non compability of material properties, fusion
zone temperature.
• A slight amount of grain size refinement in the friction Stir processed zone caused
an increase in strength and a decrease in the Ar transformation temperature
compared to the base metal. Friction stir processed specimen was also hot rolled
76% at 850°C without cracking.
• As Spindle Force increased from 900 to 1200 rpm, weld time, burn off length,
actual upset burn off was found to be increased.
• With the increase in the spindle speed, more grain refinement occurred in the weld
compared to base material, ultrafine grained microstructure was obtained and the
twins were not observed like the base region.
• Hardness was found to be increased with the increase in spindle force due to the
increase in the mechanical work of the friction welding process which promotes
grain refining and consequent increase of resistance.
• The tensile strength is found to be increased with the increase in spindle force due
to the microstructure refinement in the welded region compared to base region,
hence higher strength in the weld and specimen is found broken outside the welded
regionFriction Stir Welding process can be using this optimized process welding
parameters for dissimilar welding of AISI 304 repairing and exploring on gravity
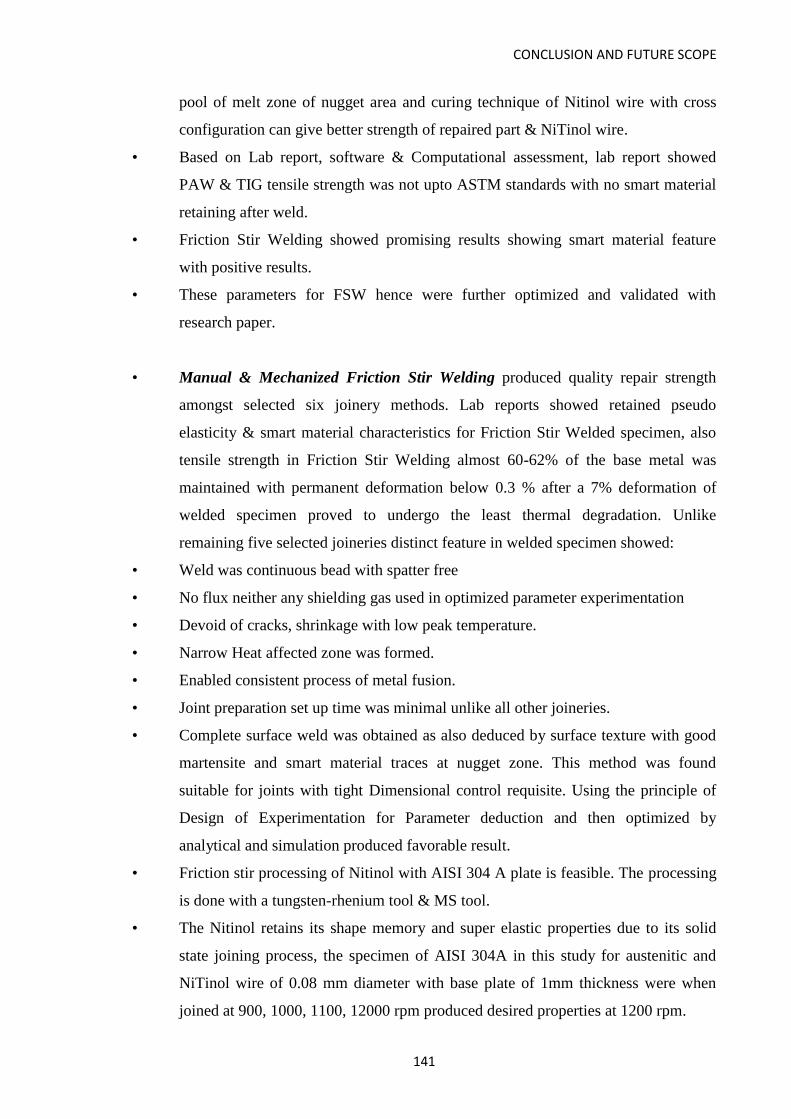
CONCLUSION AND FUTURE SCOPE
141
pool of melt zone of nugget area and curing technique of Nitinol wire with cross
configuration can give better strength of repaired part & NiTinol wire.
• Based on Lab report, software & Computational assessment, lab report showed
PAW & TIG tensile strength was not upto ASTM standards with no smart material
retaining after weld.
• Friction Stir Welding showed promising results showing smart material feature
with positive results.
• These parameters for FSW hence were further optimized and validated with
research paper.
• Manual & Mechanized Friction Stir Welding produced quality repair strength
amongst selected six joinery methods. Lab reports showed retained pseudo
elasticity & smart material characteristics for Friction Stir Welded specimen, also
tensile strength in Friction Stir Welding almost 60-62% of the base metal was
maintained with permanent deformation below 0.3 % after a 7% deformation of
welded specimen proved to undergo the least thermal degradation. Unlike
remaining five selected joineries distinct feature in welded specimen showed:
• Weld was continuous bead with spatter free
• No flux neither any shielding gas used in optimized parameter experimentation
• Devoid of cracks, shrinkage with low peak temperature.
• Narrow Heat affected zone was formed.
• Enabled consistent process of metal fusion.
• Joint preparation set up time was minimal unlike all other joineries.
• Complete surface weld was obtained as also deduced by surface texture with good
martensite and smart material traces at nugget zone. This method was found
suitable for joints with tight Dimensional control requisite. Using the principle of
Design of Experimentation for Parameter deduction and then optimized by
analytical and simulation produced favorable result.
• Friction stir processing of Nitinol with AISI 304 A plate is feasible. The processing
is done with a tungsten-rhenium tool & MS tool.
• The Nitinol retains its shape memory and super elastic properties due to its solid
state joining process, the specimen of AISI 304A in this study for austenitic and
NiTinol wire of 0.08 mm diameter with base plate of 1mm thickness were when
joined at 900, 1000, 1100, 12000 rpm produced desired properties at 1200 rpm.

CONCLUSION AND FUTURE SCOPE
142
• Grain refinement was observed at bead of fusion due to recrystallization with super
elastic plateau at 1200 rpm.
• The study of phase transformation done by differential scanning calorimetry of
processed samples to determine their austenite and martensite transformation
temperatures.
• Welded specimen showed regain of smart material feature after 34 seconds at
60 °C.
8.3 Future Scope
• Detailed Fatigue analysis and shear tests can be carried out for further
investigations of optimized parameters in selected joinery methods.
• Welding Technique can be investigated for higher thickness AISI 304 steel plates
by employing double-sided Friction Stir Welding.
• Genetic Programming application as well Poisson 2-way Polynomial of Friction
Stir Welding can be extended by employing on other materials such as copper,
titanium and magnesium for future studies.
Experimentation process of welding by all joinery process has further scope of findings for
future research work. NiTi to NiTi welding showed promising results in Laser Welding
unlike dissimilar materials so study should be done about fusion welding and its material
characteristic structure. Dissimilar materials joineries failed to retain pseudoelastic content
except Friction Stir Welding and the prominent reason was when remelting stage took
place NiTi formed the tenacity layer.
Proper curing and heat input source study can explore some positive results. During
experimentation it was found that set up as well configuration of NiTinol wire produced
different results which can be further studied. Post weld heat treatment as well as fusion
joining methods like crimping, swaging, adhesive bonding has wide area of scope of study.
Basic study of melting point control during amalgamation, formulating specific thermal
coefficient of expansion, controlling difference of electrochemical constituent with its
solubility can affect result if material chemistry studied. Nugget zone transition
temperature produced change in Af for phase transition from austenite to martensite which
needs to be studied. Validation by Finite Element can produce better results for optimized
parameter range.

143
REFERENCES
[1] Elahinia, M. H., Hashemi, M., Tabesh, M., & Bhaduri, S. B. (2012). “Manufacturing
and processing of NiTi implants: A review”. Progress in materials science, 57(5), 911-
946.
[2] Elahinia, M., Moghaddam, N. S., Andani, M. T., Amerinatanzi, A., Bimber, B. A., &
Hamilton, R. F. (2016). “Fabrication of NiTi through additive manufacturing: A
review”. Progress in Materials Science, 83, 630-663.
[3] Pilous, V., & Kovarik, R. (1987). Welding in repair of nuclear reactor pressure
vessels. Zvaranie, 36(9), 279-282.
[4] Fox, G. R. (2012). Joining of Shape-Memory NiTi Torque Tubes to Structural
Materials (Doctoral dissertation, The Ohio State University).
[5] Clarke, B., Carroll, W., Rochev, Y., Hynes, M., Bradley, D., & Plumley, D. (2006).
“Influence of nitinol wire surface treatment on oxide thickness and composition and its
subsequent effect on corrosion resistance and nickel ion release”. Journal of
Biomedical Materials Research Part A: An Official Journal of The Society for
Biomaterials, The Japanese Society for Biomaterials, and The Australian Society for
Biomaterials and the Korean Society for Biomaterials, 79(1), 61-70.
[6] Wang, Y., Liang, Z., Zhang, J., Ning, Z., & Jin, H. (2016). “Microstructure and
antiwear property of laser cladding Ni–Co duplex coating on copper”. Materials, 9(8),
634.
[7] Anikeev, S., Hodorenko, V., Gunther, V., Chekalkin, T., Kang, J. H., & Kang, S. B.
(2018). “The effect of mechano-chemical treatment on structural properties of the
drawn TiNi-based alloy wire”. Materials Research Express, 5(1), 016510.
[8] Tuissi, A., Coduri, M., & Biffi, C. A. (2017). “Laser shape setting of superelastic
nitinol wires: Functional properties and microstructure”. Functional Materials Letters,
10(01), 1740008.
[9] Vondrous, P., Kolarik, L., & Kolarikova, M. (2012). “Plasma arc welding of NiTi and
304 steel”. In Annals of DAAAM for 2012, proceedings of the 23rd international
DAAAM symposium (Vol. 23, No. 1, pp. 2304-1382).
[10] Bagheri, A., Mahtabi, M. J., & Shamsaei, N. (2018). “Fatigue behavior and cyclic
deformation of additive manufactured NiTi.” Journal of Materials Processing
Technology, 252, 440-453.
[11] Vondrous, P., Kolarik, L., & Kolarikova, M. (2012). “Plasma arc welding of NiTi and

144
304 steel”. In Annals of DAAAM for 2012, proceedings of the 23rd international
DAAAM symposium (Vol. 23, No. 1, pp. 2304-1382).
[12] Taheri Andani, M. (2015). “Modeling, simulation, additive manufacturing, and
experimental evaluation of solid and porous NiTi” (Doctoral dissertation, University
of Toledo).
[13] Mehrpouya, M. (2017). “Laser welding of NiTi shape memory sheets: experimental
analysis and numerical modeling”. Department of Mechanical and Aerospace
Engineering, Sapienza University of Rome, 134.
[14] Van der Eijk, C., Fostervoll, H., Sallom, Z. K., & Akselsen, O. M. (2003, October).
Plasma welding of NiTi to NiTi, stainless steel and hastelloy C276”. In of the ASM
Materials Solutions Conference (pp. 125-129).
[15] Paton, B. E., Kaleko, D. M., Shevchenko, V. P., Koval, Y. N., Slipchenko, V. N.,
Neganov, L. M., & Musienko, R. Y. (2006). “Weldability of shape-memory alloys of
Ni-Ti system”. PATON WELDING JOURNAL C/C OF AVTOMATICHESKAIA
SVARKA, 2006(5), 2.
[16] D. Melo, R. H. F., D Oliveira, M. J. C., D Oliveira, P. Í. V., D Lima, M. S. F., Maciel,
T. M., & de Araújo, C. J. (2018). “Mechanical Properties of NiTi Shape Memory
Alloys Welded Joints: A Comparative Study between the GTAW, PAW and LBW
Processes” In Materials Science Forum (Vol. 930, pp. 526-531). Trans Tech
Publications Ltd.
[17] Oliveira, M. J. C. D., Melo, R. H. F. D., Maciel, T. M., & Araújo, C. J. D. (2019).
“Nickel-Titanium Alloys Welding of Thin Sheets Using GTAW: Comparative Study
Between Similar and Dissimilar Welding with AISI 304 Stainless Steel”. Materials
Research, 22(1).
[18] Costa, J. D., Sousa, M. B., Fook, N. L., de Almeida, A. F., Alves, J. J. N., Evaristo, B.
O,& Santana, R. A. C. (2019). “Electrochemical Characterization of a Welded Joint of
NiTi/TiMo Dissimilar Wires” Materials Today: Proceedings, 14, 671-677.
[19] Hahnlen, R., Fox, G., & Dapino, M. J. (2013). “Fusion welding of nickel– titanium
and 304 stainless steel tubes: Part I: laser welding. Journal of intelligent material
systems and structures” 24(8), 945-961.
[20] Chuaiphan, W., & Srijaroenpramong, L. (2019). “Optimization of gas tungsten arc
welding parameters for the dissimilar welding between AISI 304 and AISI 201
stainless steels”. Defence technology, 15(2), 170-178.

145
[21] Abioye, T. E., Olugbade, T. O., & Ogedengbe, T. I. (2017). “Welding of dissimilar
metals using gas metal arc and laser welding techniques: a review” Journal of
Emerging Trends in Engineering and Applied Sciences, 8(6), 225-228.
[22] Muhammed, M., Mustapha, M., Ginta, T. L., Ali, A. M., Mustapha, F., & Hampo, C.
C. (2020). “Statistical Review of Microstructure-Property Correlation of Stainless
Steel: Implication for Pre-and Post-Weld Treatment. Processes” 8(7), 811.
[23] Patel, P., Patel, S., & Shah, H. (2016). “Design and Experimental study of Friction stir
welding of AA6061-T6 Alloy for optimization of welding parameters by using Lathe
Machine”
[24] He, W., Liu, J., Hu, W., Wang, G., & Chen, W. (2019). “Controlling residual stress
and distortion of friction stir welding joint by external stationary shoulder” High
Temperature Materials and Processes, 38(2019), 662-671.
[25] Mishra, R. S., & Ma, Z. Y. (2005). “Friction stir welding and processing” Materials
science and engineering: R: Reports, 50(1-2), 1-78.
[26] Eff, M., Gould, J., & Stotler, T. (2016). “LINEAR FRICTION WELDING UPDATE:
LOWER COSTS, BROADER APPLICATIONS” ADVANCED MATERIALS &
PROCESSES, 174(1), 26-28.
[27] Sree Arravind, M., Kumar, S. R., Kumaran, S. S., & Venkateswarlu, D. (2019).
“Effect of Mechanical Properties and Corrosion Behaviour of Martensitic Stainless
Steel 410 1.6 mm Butt Welded by Plasma Arc Welding” In Materials Science Forum
(Vol. 969, pp. 601-606). Trans Tech Publications Ltd.
[28] Kramár, T., Tauer, J., & Vondrouš, P. (2019). “WELDING OF NITINOL BY
SELECTED TECHNOLOGIES” Acta Polytechnica, 59(1), 42-50.
[29] London, B., Fino, J., Pelton, A. R., Mahoney, M., Lienert, T. J., & TMS, W. (2005).
“Friction stir processing of Nitinol” Friction Stir Welding and Processing III, 67-74.
[30] Dufour, S., & Vinsard, G. (2018). “Induction heating of a shape memory alloy beam”
The European Physical Journal Applied Physics, 83(3), 30905.
[31] Grummon, D., Low, K. B., Foltz, J., & Shaw, J. (2007). “A new method for brazing
Nitinol-based on the quasi binary Ti Ni-Nb system”. In48th
AIAA/ASME/ASCE/AHS/ASC Structures, Structural Dynamics and Materials
Conference (p. 1741).
[32] Wayman, C. M. (1990). “Engineering aspects of shape memory alloys” ed. by TW
During, KN Melton, D. Stöckel and CM Wayman.

146
[33] Müller, C. W., Pfeifer, R., El‐Kashef, T., Hurschler, C., Herzog, D., Oszwald, M., &
Gösling, T. (2010). “Electromagnetic induction heating of an orthopedic nickel–
titanium shape memory device: Journal of Orthopaedic Research, 28(12), 1671-1676.
[34] Pelton, A. R., Dicello, J., & Miyazaki, S. (2000). “Optimisation of processing and
properties of medical-grade Nitinol wire” Minimally Invasive Therapy & Allied
Technologies, 9(2), 107-118.
[35] Stoeckel, D., Pelton, A., & Duerig, T. (2004). “Self-expanding nitinol stents: material
and design considerations” European radiology, 14(2), 292-301.
[36] Michal, G. M. (1979). “Diffusion less transformations in TiNi “(Doctoral dissertation,
Department of Materials Science and Engineering, Stanford University).
[37] Otsuka, K., & Kakeshita, T. (2002). “Science and technology of shape- memory
alloys: new developments” mrs bulletin, 27(2), 91-100.
[38] Duerig, T., Pelton, A., & Stöckel, D. (1999). “An overview of nitinol medical
applications” Materials Science and Engineering: A, 273, 149-160.
[39] Robertson, S. W., Imbeni, V., Notkina, E., Wenk, H. R., & Ritchie, R. O. (2003).
“Texture in Tubes and Plates of the Superelastic/Shape-Memory Alloy Nitinol. In
Shape Memory and Super elastic” Technologies Conference.
[40] Lotfi Neyestanak, A. A., & Daneshmand, S. (2013). “The effect of operational cutting
parameters on Nitinol-60 in wire electro-discharge machining” Advances in Materials
Science and Engineering, 2013.
[41] Behúlová, M., Vrtiel, Š., & Nagy, M. (2019). “Induction brazing of thin- walled pipes
from AISI 304 steel using copper-based solder”. In IOP Conference Series: Materials
Science and Engineering (Vol. 465, No. 1, p. 012001). IOP Publishing.
[42] Zhou, K., & Zhang, T. (2017). “Induction Brazing of 304 Stainless Steel with a
Metalloid-Free Ni-Zr-Ti-Al-Sn Amorphous Foil” Materials transactions, 58(4), 663-
667.
[43] Ma, B., Wang, X., Chen, C., Zhou, D., Xu, P., & Zhao, X. (2019). “Dissimilar welding
and joining of cemented carbides” Metals, 9(11), 1161.
[44] Khamei, A. A., & Dehghani, K. (2010). “A study on the mechanical behavior and
microstructural evolution of Ni60 wt%–Ti40 wt%(60Nitinol) intermetallic compound
during hot deformation” Materials Chemistry and Physics, 123(1), 269-277.
[45] Mou, G., Hua, X., Huang, Y., Shen, C., & Wang, M. (2020). “Study on the
microstructure optimization and mechanical properties of dissimilar TC4-304L arc-

147
brazing joints” Materials Science and Engineering: A, 139566.
[46] Datta, S., Raza, M. S., Saha, P., & Pratihar, D. K. (2019). “Effects of process
parameters on the quality aspects of weld-bead in laser welding of NiTinol sheets”
Materials and Manufacturing Processes, 34(6), 648-659.
[47] Mirshekari, G. R., Saatchi, A., Kermanpur, A., & Sadrnezhaad, S. K. (2016). “Effect
of post weld heat treatment on mechanical and corrosion behaviors of NiTi and
stainless steel laser-welded wires” Journal of Materials Engineering and Performance,
25(6), 2395-2402.
[48] Gao, X. L., Zhang, L. J., Liu, J., & Zhang, J. X. (2013). “A comparative study of
pulsed Nd: YAG laser welding and TIG welding of thin Ti6Al4V titanium alloy plate”
Materials Science and Engineering: A, 559, 14-21.
[49] Cao, X., & Jahazi, M. (2009). “Effect of welding speed on butt joint quality of Ti–
6Al–4V alloy welded using a high-power Nd: YAG laser” Optics and Lasers in
Engineering, 47(11), 1231-1241.
[50] Dong, P., Yao, R., Yan, Z., Yan, Z., Wang, W., He, X., & Zhou, J. (2018).
“Microstructure and corrosion resistance of laser-welded crossed nitinol wires”
Materials, 11(5), 842.
[51] Zeng, Z., Yang, M., Oliveira, J. P., Song, D., & Peng, B. (2016). “Laser welding of
NiTi shape memory alloy wires and tubes for multi-functional design applications”
Smart Materials and Structures, 25(8), 085001.
[52] Costa, A. P., Quintino, L., & Greitmann, M. (2003). “Laser beam welding hard metals
to steel” Journal of Materials Processing Technology, 141(2), 163- 173.
[53] MI, K., & Zhou, Y. (2008). “Effects of welding parameters on the mechanical
performance of laser-welded nitinol” Materials Transactions, 49(11), 2702-2708.
[54] Tuissi, A., Coduri, M., & Biffi, C. A. (2017). “Laser shape setting of super elastic
nitinol wires: Functional properties and microstructure” Functional Materials Letters,
10(01), 1740008.
[55] Gugel, H., Schuermann, A., & Theisen, W. (2008). “Laser welding of NiTi wires.”
Materials Science and Engineering: A, 481, 668-671.
[56] Kannan, T. D. B., Pegada, R., Sathiya, P., & Ramesh, T. (2018). “A comparison of the
effect of different heat treatment processes on laser- welded NiTinol sheets”, Journal
of the Brazilian Society of Mechanical Sciences and Engineering, 40(12), 562.
[57] Hahnlen, R., Fox, G., & Dapino, M. J. (2011, January). “Laser Welding of Nickel

148
Titanium and 304 Stainless Steel Tubes. In Smart Materials”, Adaptive Structures and
Intelligent Systems (Vol. 54716, pp. 685-693).
[58] Wilson, R. D., Woodyard, J. R., & Devletian, J. H. (1993). “Capacitor discharge
welding: Analysis through ultrahigh-speed photography:”, WELDING JOURNAL-
NEW YORK-, 72, 101-s.
[59] Palano, F., Panella, F. W., & Dattoma, V. (2010). “Characterization of aeronautical
engine parts welded with capacitor discharge welding technology”, Proceedings of the
Institution of Mechanical Engineers, Part G: Journal of Aerospace Engineering,
224(1), 11-22.
[60] Ketzel, M. M., Hertel, M., Zschetzsche, J., & Füssel, U. (2019). “Heat development of
the contact area during capacitor discharge welding”, Welding in the World, 63(5),
1195-1203.
[61] Oliveira, J. P., Miranda, R. M., & Fernandes, F. B. (2017). “Welding and joining of
NiTi shape memory alloys: a review”, Progress in Materials Science, 88, 412-466.
[62] Casalino, G., & Panella, F. (2006). “Numerical simulation of multi-point capacitor
discharge welding of AISI 304 bars”, Proceedings of the Institution of Mechanical
Engineers,
[63] Hellberg, S., Hummel, J., Krooß, P., Niendorf, T., & Böhm, S. (2020).
“Microstructural and mechanical properties of dissimilar nitinol and stainless steel
wire joints produced by micro electron beam welding without filler material”, Welding
in the World, 64(12), 2159-2168.
[64] Lotfi, A., Daneshmand, S., & Adib Nazari, S. (2009). “The effect of operational
cutting parameters in the wire electro-discharge machining (WEDM) on micro
hardness of alloy surface layer.”, ADMT Journal, 2(4).
[65] Kuriakose, S., & Shunmugam, M. S. (2004). “Characteristics of wire-electro discharge
machined Ti6Al4V surface”, Materials Letters, 58(17-18), 2231-2237.
[65] Lin, H. C., Lin, K. M., & Chen, Y. C. (2000). “A study on the machining
characteristics of TiNi shape memory alloys”, Journal of materials processing
technology, 105(3), 327-332.
[66] Theisen, W., & Schuermann, A. (2004). “Electro discharge machining of nickel–
titanium shape memory alloys”, Materials Science and Engineering: A, 378(1- 2), 200-
204.
[67] Chen, S. L., Hsieh, S. F., Lin, H. C., Lin, M. H., & Huang, J. S. (2008). “Electrical

149
discharge machining of a NiAlFe ternary shape memory alloy”, Journal of alloys and
compounds, 464(1-2), 446-451.
[68] McGeough, J. A. (1988). “Advanced methods of machining”, Springer Science &
Business Media.
[69] Jameson, E. C. (2001). “Electrical discharge machining”, Society of Manufacturing
Engineers.
[70] Ho, K. H., Newman, S. T., Rahimifard, S., & Allen, R. D. (2004). “State of the art in
wire electrical discharge machining (WEDM):, International Journal of Machine Tools
and Manufacture, 44(12-13), 1247-1259.
[71] Sommer, C., & Sommer, S. (2017). “Complete EDM handbook”, Advance Publishing
Incorporated.
[72] Clarke, B., Carroll, W., Rochev, Y., Hynes, M., Bradley, D., & Plumley, D. (2006).
“Influence of nitinol wire surface treatment on oxide thickness and composition and its
subsequent effect on corrosion resistance and nickel ion release”, Journal of
Biomedical Materials Research Part A: An Official Journal of The Society for
Biomaterials, The Japanese Society for Biomaterials, and The Australian Society for
Biomaterials and the Korean Society for Biomaterials, 79(1), 61-70.
[73] Sergey, A., Valentina, H., Timofey, C., Nadezhda, A., Victor, G., Anatoliy, P., & Ji-
soon, K. (2018). “Evaluation of reversible shape memory effect in porous SHS TiNi-
based compounds fabricated at various ignition temperature”, Materials Research
Express, 6(2), 026570.
[74] Bagheri, A., Mahtabi, M. J., & Shamsaei, N. (2018). “Fatigue behavior and cyclic
deformation of additive manufactured NiTi”, Journal of Materials Processing
Technology, 252, 440-453.
[75] Samal, B. B., Jena, A., & Mishra, D. “Controlled Shape Changing Components by
Using 4D Printing Technology”
[76] Ibrahim, H., Jahadakbar, A., Dehghan, A., Moghaddam, N. S., Amerinatanzi, A., &
Elahinia, M. (2018). In vitro corrosion assessment of additively manufactured porous
NiTi structures for bone fixation applications. Metals, 8(3), 164.
[77] West, P., Shunmugasamy, V. C., Usman, C. A., Karaman, I., & Mansoor, B. (2021).
Part II.: Dissimilar friction stir welding of nickel titanium shape memory alloy to
stainless steel–microstructure, mechanical and corrosion behavior. Journal of
Advanced Joining Processes, 4, 100072.
150
[78] Ahsan, M. R., Tanvir, A. N. M., Seo, G. J., Bates, B., Hawkins, W., Lee, C., ... & Kim,
D. B. (2020). Heat-treatment effects on a bimetallic additively- manufactured structure
(BAMS) of the low-carbon steel and austenitic-stainless steel. Additive
Manufacturing, 32, 101036.
[79] Rodrigues, T. A., Duarte, V., Miranda, R. M., Santos, T. G., & Oliveira, J. P. (2019).
“Current status and perspectives on wire and arc additive manufacturing (WAAM)”,
Materials, 12(7),
[80] Sgobba, S. (2006). “Materials for high vacuum technology, an overview”, (No.
CERN-TS-2006-004). Cern.
[81] Yuan, B., Chung, C. Y., & Zhu, M. (2004). “Microstructure and martensitic
transformation behavior of porous NiTi shape memory alloy prepared by hot isostatic
pressing processing”, Materials Science and Engineering: A, 382(1-2), 181-187.
[82] Li, J., Panton, B., Liang, S., Vivek, A., & Daehn, G. (2020). “High Strength Welding
of NiTi and Stainless Steel by Impact: Process, Structure, and Properties”, Materials
Today Communications, 101306.
[83] Abbasi, K., Beidokhti, B., & Sajjadi, S. A. (2017). “Microstructure and mechanical
properties of Ti-6Al-4V welds using α, near-α and α+ β filler alloys”, Materials
Science and Engineering: A, 702, 272-278.
[84] Miyamoto, G., Usuki, H., Li, Z. D., & Furuhara, T. (2010). “Effects of Mn, Si and Cr
addition on reverse transformation at 1073 K from spheroidized cementite structure in
Fe–0.6 mass% C alloy”, Acta Materialia, 58(13), 4492-4502.
[85] Davis, D. Capacitor Discharge Resistance Welding Emerges As Important Projection
Welding Option, the Fabricator. 2020..
[86] Babu, N. K., Raman, S. G. S., Mythili, R., & Saroja, S. (2007). “Correlation of
microstructure with mechanical properties of TIG weldments of Ti–6Al–4V made
with and without current pulsing”, Materials characterization, 58(7), 581-587.
[87] Balasubramanian, M., Jayabalan, V., & Balasubramanian, V. (2008). “Effect of pulsed
gas tungsten arc welding on corrosion behavior of Ti–6Al–4V titanium alloy”,
Materials & Design, 29(7), 1359-1363.
[88] Ikai, A., Kimura, K., & Tobushi, H. (1996). “TIG welding and shape memory effect of
TiNi shape memory alloy”, Journal of Intelligent Material Systems and Structures,
7(6), 646-655.
[89] Fox, G., Hahnlen, R., & Dapino, M. (2011, January). “TIG welding of nickel- titanium

151
to 304 stainless steel” In Smart Materials, Adaptive Structures and Intelligent Systems
(Vol. 54716, pp. 625-632).
[90] Chatterjee, S., Mahapatra, S. S., Arora, K. S., & Behera, A. (2020). Physical and
mechanical characterization of dissimilar laser welded joints of AISI 316/Cu/SMA
using fiber laser technology. Journal of Laser Applications, 32(3), 032018.
[91] Balasubramanian, M., Jayabalan, V., & Balasubramanian, V. (2008). “Effect of pulsed
gas tungsten arc welding on corrosion behavior of Ti–6Al–4V titanium alloy”,
Materials & Design, 29(7), 1359-1363.
[92] Singh, A., & Mittal, R. (2017). “Experimental Analysis on TIG welding process
parameters of dissimilar metals SS304-SS202 using Taguchi Method”, International
Journal of Engineering and Manufacturing Science, 7(2), 248-249.
[93] Choudhury, N., Bandyopadhyay, A., & Rudrapati, R. (2014). “Design optimization of
process parameters for TIG welding based on Taguchi method”, International Journal
of Current Engineering and Technology, 2, 12-16.
[94] Mudaliyar, G. S., Patel, P. B., Patel, J. D., & Doi, A. M. “OPTIMIZATION OF A-TIG
WELDING PARAMETERS FOR IMPROVING WELD GEOMETRY OF AISI 304L
STAINLESS STEEL BY TAGUCHI APPROACH”.
[95] Prasad, V. V., Varghese, V. J., Suresh, M. R., & Kumar, D. S. (2016). “3D simulation
of residual stress developed during TIG welding of stainless steel pipes”, Procedia
Technology, 24, 364-371.
[96] Patel, L. S., & Patel, T. C. (2014). “Optimization of welding parameters for TIG
welding of 304L using Taguchi Approach”, IJEDR, 2(1), 1165-1170.
[97] Singh, B., Singhal, P., & Sharma, A. (2018). “Multiobjective Optimization of
Submerged Arc Welding Parameters on AISI 5130 Alloy Steel using Taguchi
Method”, Carbon, 100, 0-15.
[98] Chauhan, V., & Jadoun, R. S. (2014). “Parametric optimization of MIG welding for
stainless steel (SS-304) and low carbon steel using Taguchi design method”, Int J Adv
Technol Eng Res (IJATER), 2(1), 224-229.
[99] Batool, S., Khan, M., Jaffery, S. H. I., Khan, A., Mubashar, A., Ali, L, & Anwar, M.
N. (2016). “Analysis of weld characteristics of micro-plasma arc welding and tungsten
inert gas welding of thin stainless steel (304L) sheet, Proceedings of the Institution of
Mechanical Engineers, Part L: Journal of Materials: Design and Applications, 230(6),
1005-1017.
152
[100] KUMAR, A. P., & KRISHNA, C. S. R. “SENSITIVITY ANALYSIS OF TIG
WELDING PARAMETERS FOR ASTM-500 GRADE B WELDMENTS”.
[101] Joseph, G. B., Mageshwaran, G., Kumar, R. A., Raj, R. D., Jeevahan, J., & Kunjan,
M. (2016). “Characteristics studies of stainless steel (AISI type 304l) welded by
ER310L filler using TIG welding”, Int. J. Chem. Sci, 14(4), 2527-2534.
[102] Jin, G., Li, Y., Cui, H., Cui, X., & Cai, Z. (2016). “Microstructure and tribological
properties of in situ synthesized TiN reinforced Ni/Ti alloy clad layer prepared by
plasma cladding technique”, Journal of Materials Engineering and Performance, 25(6),
2412-2419.
[103] Bhamji, I., Preuss, M., Threadgill, P. L., & Addison, A. C. (2011). “Solid- state
joining of metals by linear friction welding: a literature review” Materials Science and
Technology, 27(1), 2-12.
[104] Fall, M. Jahazi, A.R. Khodabandeh, and M.H. Fesharaki, (2017), “Effect of Process
Parameters on Microstructure and Mechanical Properties of Friction Stir- Welded Ti–
6Al–4V Joints”, The International Journal of Advanced Manufacturing Technology,
91, 5-8, (2919-2931), 10.1007/s00170-016-9527-Y.
[105] Wanjara, P., & Jahazi, M. (2005). Linear friction welding of Ti-6Al-4V:
“Processing, microstructure, and mechanical-property inter-relationships”,
Metallurgical and Materials Transactions A, 36(8), 2149-2164.
[106] Li, W. Y., Ma, T., & Li, J. (2010). “Numerical simulation of linear friction welding
of titanium alloy: effects of processing parameters”, Materials & Design, 31(3), 1497-
1507.
[107] Greiner, C., Oppenheimer, S. M., & Dunand, D. C. (2005). “High strength, low
stiffness, porous NiTi with superelastic properties”, Acta biomaterials, 1(6), 705- 716.
[108] Li, W. Y., Ma, T. J., Yang, S. Q., Xu, Q. Z., Zhang, Y., Li, J. L., & Liao, H. L.
(2008). “Effect of friction time on flash shape and axial shortening of linear friction
welded 45 steel”, Materials Letters, 62(2), 293-296.
[109] Lienert, T. J., Stellwag Jr, W. L., Grimmett, B. B., & Warke, R. W. (2003).
“Friction stir welding studies on mild steel”, Welding Journal-New York-, 82(1), 1-S.
[110] Zandsalimi, S., Heidarzadeh, A., & Saeid, T. (2019). “Dissimilar friction-stir
welding of 430 stainless steel and 6061 aluminum alloy: Microstructure and
mechanical properties of the joints”, Proceedings of the Institution of Mechanical
Engineers, Part L: Journal of Materials: Design and Applications, 233(9), 1791-1801.

153
[111] Liu, H., Nakata, K., Yamamoto, N., & Liao, J. (2010). “Friction stir welding of
pure titanium lap joint”, Science and Technology of Welding and Joining, 15(5), 428-
432.
[112] He, W., Liu, J., Hu, W., Wang, G., & Chen, W. (2019). “Controlling residual stress
and distortion of friction stir welding joint by external stationary shoulder”, High
Temperature Materials and Processes, 38(2019), 662-671.
[113] Genevois, C., Deschamps, A., & Vacher, P. (2006). “Comparative study on local
and global mechanical properties of 2024 T351, 2024 T6 and 5251 O friction stir
welds”, Materials Science and Engineering: A, 415(1-2), 162-170.
[114] Taheri, H., Kilpatrick, M., Norvalls, M., Harper, W. J., Koester, L. W., Bigelow,
T., & Bond, L. J. (2019). “Investigation of nondestructive testing methods for friction
stir welding”, Metals, 9(6), 624.
[115] Sathiya, P., Aravindan, S., Haq, A. N., & Paneerselvam, K. (2009). “Optimization
of friction welding parameters using evolutionary computational techniques”, Journal
of materials processing technology, 209(5), 2576-2584.
[116] Zhang, Z., He, C., Li, Y., Yu, L., Zhao, S., & Zhao, X. (2020). “Effects of
ultrasonic assisted friction stir welding on flow behavior, microstructure and
mechanical properties of 7N01-T4 aluminum alloy joints”, Journal of Materials
Science & Technology, 43, 1-13.
[117] Akselsen, O. M. (2010). “Joining of shape memory alloys”, Shape Memory Alloys,
183-210.
[118] Müller, C. W., Pfeifer, R., El‐Kashef, T., Hurschler, C., Herzog, D., Oszwald, M.,&
Gösling, T. (2010). “Electromagnetic induction heating of an orthopedic nickel–
titanium shape memory device”, Journal of Orthopedic Research, 28(12), 1671-1676.
[119] Mou, G., Hua, X., Huang, Y., Shen, C., & Wang, M. (2020). “Study on the micro
structure optimization and mechanical properties of dissimilar TC4-304L arc-brazing
joints”, Materials Science and Engineering: A, 139566.
[120] Gilbert, H. B., & Webster III, R. J. (2016). “Rapid, reliable shape setting of super
elastic Nitinol for prototyping robots”, IEEE robotics and automation letters, 1(1), 98.
[121] Yunus, M., & Alsoufi, M. S. (2018). Mathematical modelling of a friction stir-
welding process to predict the joint strength of two dissimilar aluminum alloys using
experimental data and genetic programming. Modelling and Simulation in
Engineering, 2018.

154
LIST OF PUBLICATIONS
1. Kripalani. Kavita, & Jain. P (2020), “Comprehensive Study of Laser Cladding by
NiTinol Wire”, Materials Today Proceedings by Elsevier Journal
https://doi.org/10.1016/j.matpr.2020.05.631 : ISSN: 2214-7853.
2. Kripalani. Kavita, & Jain. P (2020), “Experimental Investigations of Various joinery
methods repaired AISI 304 A plate with NiTinol Wire.”, by Elsevier Journal, Science
Direct, https://doi.org/10.1016/j.matpr.2020.07.522: ISSN: 2214-7853.
3. Kripalani Kavita & Jain P(2021)” Repair Work Done By Additive Manufacturing
Welding of Optimized Parameters by NiTinol Wire on 304 A Plate”, by Juni Khyat
Journal, ISSN:2278-4632
4 Kripalani Kavita & Jain.P (2021) “Experimental analysis of NiTinol wire joinery on
AISI 304 by selected technologies and comparative analysis of its optimized
parameters” by Journal of the Maharaja Sayajirao University of Baroda, published in
volume No:55 No.1(X) ISSN :0025-0422(UGC Care listed & indexed)

155
APPENDIX-I
LAB REPORTS
Invoice of NiTinol Wire
Inspection Certificate of NiTinol
Divine Metallurgy Report for PAW

156
Divine Metallurgy Report for PAW

157
HERTZ Metallurgy Report for FSW
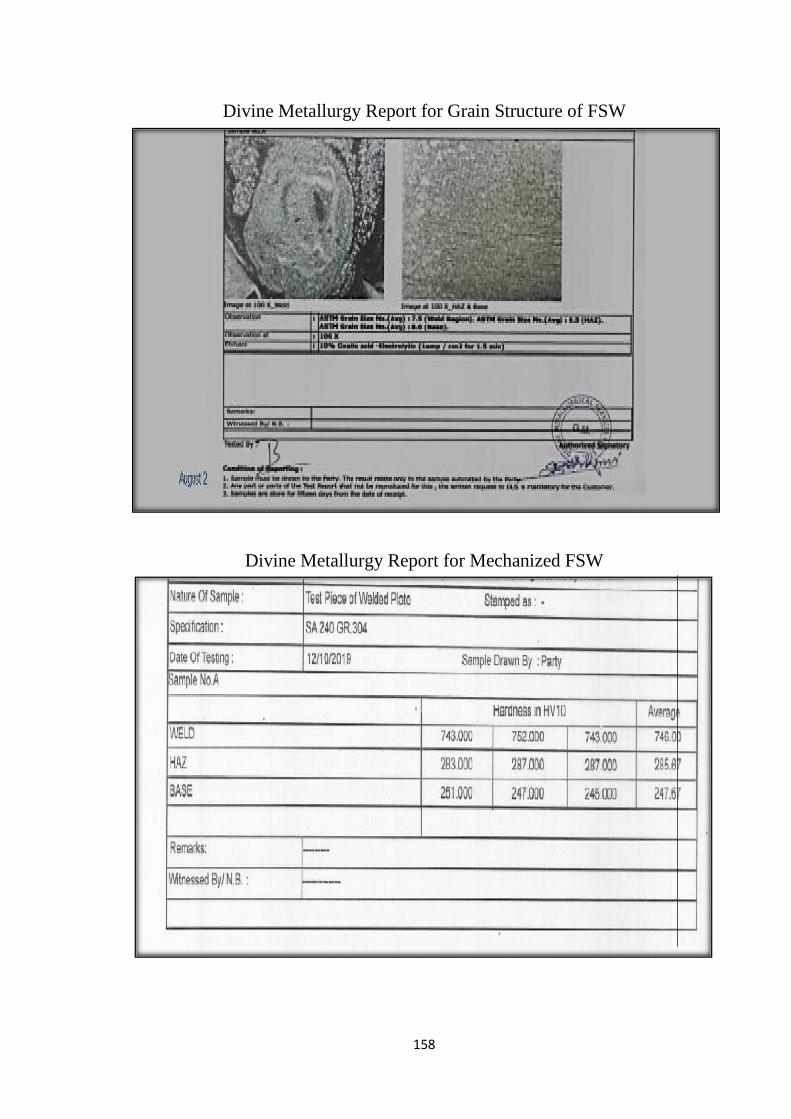
158
Divine Metallurgy Report for Grain Structure of FSW
Divine Metallurgy Report for Mechanized FSW

159
APPENDIX-II
CALCULATIONS FOR FSW
Comparative analysis of computational simulation linear regression with experiment value
of FSW
Vo V1 V2 V3 V4 Experimental
Value Computational
% Bias Error
Linear Regression
% Bias Error
Simulation % Bias Error
3 3 900 80 1 211.325 211.0901 -0.2344 198.3421 0.0614 199.43 0.056
2 3 900 90 1 219.146 219.3668 0.2212 196.1549 0.1049 195.15 0.109
2 3 900 120 1 223.237 223.4688 0.2321 204.3422 0.08464 205.34 0.08008
2 4 1100 90 1 209.124 209.3372 0.2133 212.9732 -0.01840 213.8 -0.022
3 4 1100 120 1 221.237 221.0251 -0.2116 216.3211 4.9159 217.23 -0.0181
3 4 1100 90 1 205.633 205.4197 -0.2131 211.18732 -0.02222 212.32 -0.0325
3 3 1200 80 1 227.239 227.5812 0.3421 213.4321 0.0707 215.65 0.055
2 3 1200 90 1 234.367 234.1361 -0.2311 214.5732 0.0844 211.43 0.097
2 3 1200 120 1 241.29 240.9686 -0.3211 216.1733 0.114099 217.21 0.09979
2 4 900 90 1 220.129 220.3603 0.2314 210.432 0.04405 213.43 0.0304
3.5 4.5 900 80 1 218.324 218.5784 0.2543 206.7231 0.05313 208.21 -0.083
3.5 4.5 1100 120 1 232.122 231.9986 -0.1232 212.3224 0.08529 211.12 0.090
3.5 3.5 1100 80 1 227.13 227.253 0.1232 209.7654 0.07645 208.21 0.0833
2.5 3.5 1200 90 1 238.322 238.483 0.00278 224.1232 0.05957 225.23 0.054
2.5 3.5 1100 120 1 238.232 237.911 -0.3211 213.5432 0.1041 214.21 0.099
2.5 4.5 900 90 1 227.33 227.30666 0.02314 208.6543 0.0821 208.12 0.0845
3 4 1100 80 1 224.239 234.47007 0.2311 210.2145 0.06254 210.13 0.1038
3 4 1200 90 1 239.363 239.57725 0.21445 211.2345 0.11751 210.21 0.121
Bias Error in % = Experimental Value-Analytical Value × 100
Experimental Value
= 0.00278

160
Tensile Strength
174.2×2.5+9.09×3.5+0.014641200+0.12×1=238.483N/mm2
--Computational,
Experimental = 238.483 N/mm2 Bias Error = 0.00278
Vo =Tool Angle in °
V1 =Axial Load in KN
V2 =Tool RPM
V3 =Tool Velocity in mm/sec
V4 = Thickness of Plate, mm
Thickness of Plate V4 is same so value not taken in table Dimension
mentioned.
Elongation
1.76+1.8322×2.5+0.615×3.5-0.000659×1200 =7.7022
Impact Strength
0.915+0.0031V0-0.0376V1+0.000118V2+0.000119V3-0.0422V4
0.915+0.00775-0.1316+0.1428-0.0422=0.89175

161
Welding
Method
Nitinol to
Fused metal
AISI 304 A
As (°C)
Af (°C)
Ms (°C)
Mf (°C)
FSW Nitinol/AISI 61/65 94/96 51/54 6/29
IB Nitinol/AISI 52/54 87/93 41/67 4/23