Internal Friction on AISI 304 Stainless Steels with low tensile deformations at temperatures between...
15
Internal Friction on AISI 304 Stainless Steels with low tensile deformations at temperatures between -50 to 20ºC T.F.A. Santos 1 , M.S. Andrade 2 (*) . 1 School of Mechanical Engineering, State University of Campinas (Unicamp), Campinas, SP, 13083-860, Brazil. 2 Metallurgical Techonology Division, Fundação Centro Tecnológico de Minas Gerais (CETEC), Av. José Cândido da Silveira, 2000, 31170-000, Belo Horizonte, MG, Brazil. (*) [email protected] Abstract AISI 304 austenitic stainless steels may generate - and/or ’- martensites when deformed. Those martensites alter the steel formability. The aim of this work is the study of different kinds of martensite present in the austenitic stainless steel, by means of the damping behavior of mechanical vibrations in function of a gradual change in the temperature during heatings or coolings. With this purpose, tensile tests were performed with true strain from 0.03 to 0.12 in the temperature range from -50 ºC to 20 ºC. Internal friction measurements were performed with an inverted torsion pendulum in the temperature range between of 40 ºC to 400 ºC. Internal friction curves indicated the presence of three peaks on deformed samples. The internal friction peak, situated around 130 ºC, is related to the reverse transformation. This transformation was evaluated by dilatometer tests, which showed the -martensite reversion occurring in temperature range from 50 to 200 ºC. The internal friction spectra at temperatures between 40 and 300 ºC move into higher temperatures as the ’-martensite amount increases. The ’-martensite volumetric fraction was measured with a ferritoscope which indicated that the amount of ’- martensite increases with deformation and at lower temperatures. The reverse transformation from ’ to austenite was detected by dilatometry which indicates a reversion temperature range from 500 to 800ºC. .
-
Upload
independent -
Category
Documents
-
view
2 -
download
0
Transcript of Internal Friction on AISI 304 Stainless Steels with low tensile deformations at temperatures between...
Internal Friction on AISI 304 Stainless Steels with low tensile deformations at
temperatures between -50 to 20ºC
T.F.A. Santos1, M.S. Andrade
2 (*).
1 School of Mechanical Engineering, State University of Campinas (Unicamp),
Campinas, SP, 13083-860, Brazil.
2 Metallurgical Techonology Division, Fundação Centro Tecnológico de Minas Gerais
(CETEC), Av. José Cândido da Silveira, 2000, 31170-000, Belo Horizonte, MG,
Brazil. (*) [email protected]
Abstract
AISI 304 austenitic stainless steels may generate - and/or ’- martensites when
deformed. Those martensites alter the steel formability. The aim of this work is the
study of different kinds of martensite present in the austenitic stainless steel, by means
of the damping behavior of mechanical vibrations in function of a gradual change in
the temperature during heatings or coolings. With this purpose, tensile tests were
performed with true strain from 0.03 to 0.12 in the temperature range from -50 ºC to
20 ºC. Internal friction measurements were performed with an inverted torsion
pendulum in the temperature range between of 40 ºC to 400 ºC.
Internal friction curves indicated the presence of three peaks on deformed samples.
The internal friction peak, situated around 130 ºC, is related to the reverse
transformation. This transformation was evaluated by dilatometer tests, which showed
the -martensite reversion occurring in temperature range from 50 to 200 ºC. The
internal friction spectra at temperatures between 40 and 300 ºC move into higher
temperatures as the ’-martensite amount increases. The ’-martensite volumetric
fraction was measured with a ferritoscope which indicated that the amount of ’-
martensite increases with deformation and at lower temperatures. The reverse
transformation from ’ to austenite was detected by dilatometry which indicates a
reversion temperature range from 500 to 800ºC.
.

1. Introduction
Austenitic stainless steels have a complex mechanical behavior at room temperature.
Generally, behavior differences are associated to a higher or lower stability related to
martensite transformation [1,2]. Depending on the chemical composition and work
temperature, austenitic stainless steels may form, when deformed, and ’ martensite
phases of hexagonal close-packed and body-centered tetragonal crystal structures
respectively [3-7]. The formation of and ’, depends on the stacking fault energy
which is related to the chemical composition, the quantity and temperature of
deformation [6].
The strain-induced martensites change the steel mechanical behavior, for example, the
austenitic stainless steels formability, one of the demanded properties of this steel in
industrial applications [8,9]. Because of this, the austenitic stainless steel is an object
of continuous studies. This work evaluated the damping behavior of mechanical
vibrations on the AISI 304 austenic stainless steel due to the different quantities and
kinds of strain-induced martensites.
Studies by X-ray diffraction [6,10] in an AISI 304 austenic stainless steel showed that
when the relative volumetric fraction of the -martensite reaches the maximum
quantity close to 0.05 of true deformation and so, it diminishes, while ’-martensite
increases with deformation increment. Petit et al [11] show that the amount of -
martensite at the initial stage of straining is almost as large as the amount of ’-
martensite. Nevertheless, the -martensite decreases near to zero when ’ reaches a
maximum at 10% strain. De et al [12] had indicated through X-ray measurements that
the formation of -martensite was favored over ’-marteniste during initial straining.
Increasingly, steels used in modern automobilist production require rigorous chemical
control procedures. The carbon control is particularly important, once the strength and
formability of the steel can be affected by the presence of this element. Traditionally,
carbon atoms in solid solution were measured initially by the internal friction
technique, based on the phenomenon described by Snoek, on which internal friction
peaks are produced on a steel sample, with small carbon additions, submitted to an
elastic oscillating tension.
The internal friction can be defined as the capacity of a material to damp mechanical
vibrations. The change of capacity of a material to damp mechanical vibrations as
function of time or temperature corresponds to a microstructural, substructural or
structural change [13].
The internal friction technique or the mechanical relaxation spectroscopy emerged
around the 1940’s, based on the Snoek effect [13,14]. This effect is caused by the
redistribution of solute atoms in octahedral sites of body-centered cubic metal (BCC)
submitted to an oscillating tension. When a BCC metal is submitted to a tension, in the
elastic regime, the elastic deformation appears with a temporal delaey. As
consequence, interstitial atoms jump among interstitials sites of the crystalline
structure, and an anelastic deformation emerges. The internal friction peak height gives
information about the phenomenon intensity which causes the damping [14]. In the
case of a steel sample with small additions of carbon, the internal friction peak, also
called Snoek peak, is related to the quantity of atoms of carbon in solid solution.
An internal friction measurement commonly used is the natural logarithmic decrement
between the successive oscillations of a sample submitted to a cyclical tension of
torsion during the elastic regime. So, the equation of the logarithmic decrement can be
expressed by [13-16]:
1 1ln
i
n i
AQ
n A
Where “n” is the number of cycles, “Ai” is the oscillation amplitude after i-cycles. Q-1
is the internal friction. Internal friction measurements can be used to evaluate
phenomena which affect the mechanical performance of a material, such as the ageing
after deformation, precipitation, changes of Young modulus or shear modulus and
phase transformations [13,14]. Some internal friction applications which involve phase
transformations are: the study of martensite in alloys with shape memory effect [17]
and phase transformations in magnetic oxides [18]. Studies of mechanical relaxation
spectroscopy in copper alloys [19] showed that the higher internal friction in
martensite phase was caused by movement of twin boundaries and martensites plate
boundaries.
Baraz et al [20] found four internal friction peaks in an 18/8 austenitic stainless steel in
1-Hz frequency tests. The peaks were located around the following temperatures:
70ºC, 130ºC, 220ºC and 320ºC. The first and the last peaks were related to the
deformed austenitic phase. The other two peaks were associated with the presence of
’-martensite.
Talonen et al [21] studying two AISI 304 and 304LN austenitic stainless steels carried
out measurements of internal friction with a 1.8 Hz frequency. At the studied
temperatures, - 196 ºC to 250 ºC, two internal friction peaks were found in deformed
materials. The first peak occurred at a 0 ºC and had its maximum value for samples
rolled from 10% to 15%. According to the authors this peak is probably related to the
existence of stacking fault and -martensite. The other peak was found at a 130 ºC
temperature and related to the presence of ’-martensite. The authors indicated that
this peak could be related to the tempered martensite. Ageing treatment at 200 ºC for
20 minutes diminished the damping of the studied materials [19].
Pinto et al [22] working with an AISI 304 austenitic stainless steel observed three
peaks of internal friction at temperatures 120 ºC, 220 ºC and 330 ºC for 1 Hz. In 0.3
true strain, the 220 ºC peak increases proportionally with the content of ’-martensite.
2. Experimental Procedure.
An AISI 304 austenitic stainless was used, its chemical composition, given by the
manufacturer, is shown in table 1. The steel of commercial fabrication was produced
by ArcelorMittal Inox Brazil, in 0.6 mm thick plates.
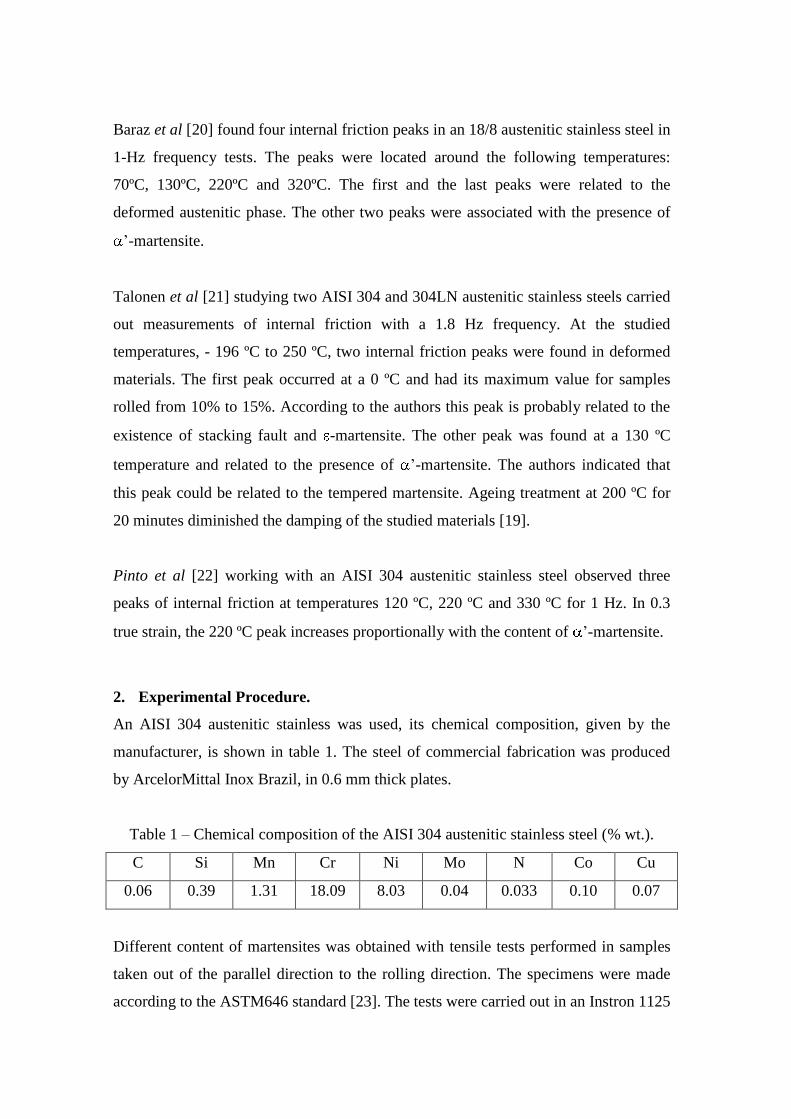
Table 1 – Chemical composition of the AISI 304 austenitic stainless steel (% wt.).
C Si Mn Cr Ni Mo N Co Cu
0.06 0.39 1.31 18.09 8.03 0.04 0.033 0.10 0.07
Different content of martensites was obtained with tensile tests performed in samples
taken out of the parallel direction to the rolling direction. The specimens were made
according to the ASTM646 standard [23]. The tests were carried out in an Instron 1125
universal machine with a temperature conditioning chamber model 3111, which uses
CO2 to be refrigerated and electrical resistance to be warmed. The tests were
interrupted at the true deformations of 0.03, 0.06, 0.09 and 0.12. The specimen
temperatures of - 50ºC, -30ºC, -10ºC and 20ºC during the test were monitored through
thermocouples welded on the sample.
The volumetric fraction of ’-martensite was determined through a Fischer MP3C
ferritoscope. It was used the conversion factor 2 defined by Vilela et al [24] found
through comparisons with X–ray diffraction techniques, magnetic saturation balance,
optic and scanning probe microscopy.
X-ray diffraction spectra were obtained before and after deforming the samples. The
measurements were carried out in the Shimadzu difractometer, XRD-6000 model,
using Cu-K radiation to determine the presence of martensitic phases [25].
The metallographic preparation consisted on sanding and polishing with a 1- m
diamond. Eletrolytical polishing was adopted in order to eliminate superficial
martensite induced during the preparation process which facilitated the chemical
etching of the deformed samples. The sample as received was etched with glyceregia
reagent and the ones deformed were etched with beraha II. The glyceregia reagent was
constituted of 3 parts of HCl, 2 parts of glycerol and 1 part of HNO3. The beraha II
reagent was constituted of 100 ml stock solution and 1 g of K2S2O5. The stock solution
was made of 48 g of NH4HF2, 800 ml of distilled water and 400 ml of concentrated
HCl.
In order to verify reverse transformations in the 304 steel and also to relate the
information obtained by the dilatometry with internal friction, dilatometric tests were
performed in deformed samples from 0.03 to 0.12 at temperatures from -50ºC to 20ºC.
The samples used in an Adamael Lhomargy LK02 dilatometer were measured with
dimensions 12.0 mm x 2.0 mm x 0.6 mm and were cut on a parallel direction from the
tensile tests. The dilatometry tests were performed in temperatures range from 50 ºC to
1000 ºC with a heating rate of 1.0 ºC/s.
Internal friction essays were performed in deformed samples from 0.03 to 0.12 at
temperatures range from 40ºC to 400ºC. Specimens were 50 mm long and 3 mm width
and were cut in the rolling direction. The internal friction spectra were obtained in an
inverted torsion pendulum. The oscillation frequency was 0.5 – 1 Hz. After cooling
until room temperature, a second cycle was done in the same temperature range aiming
at verifying others events and supporting the data interpretation.
3. Results and discussion
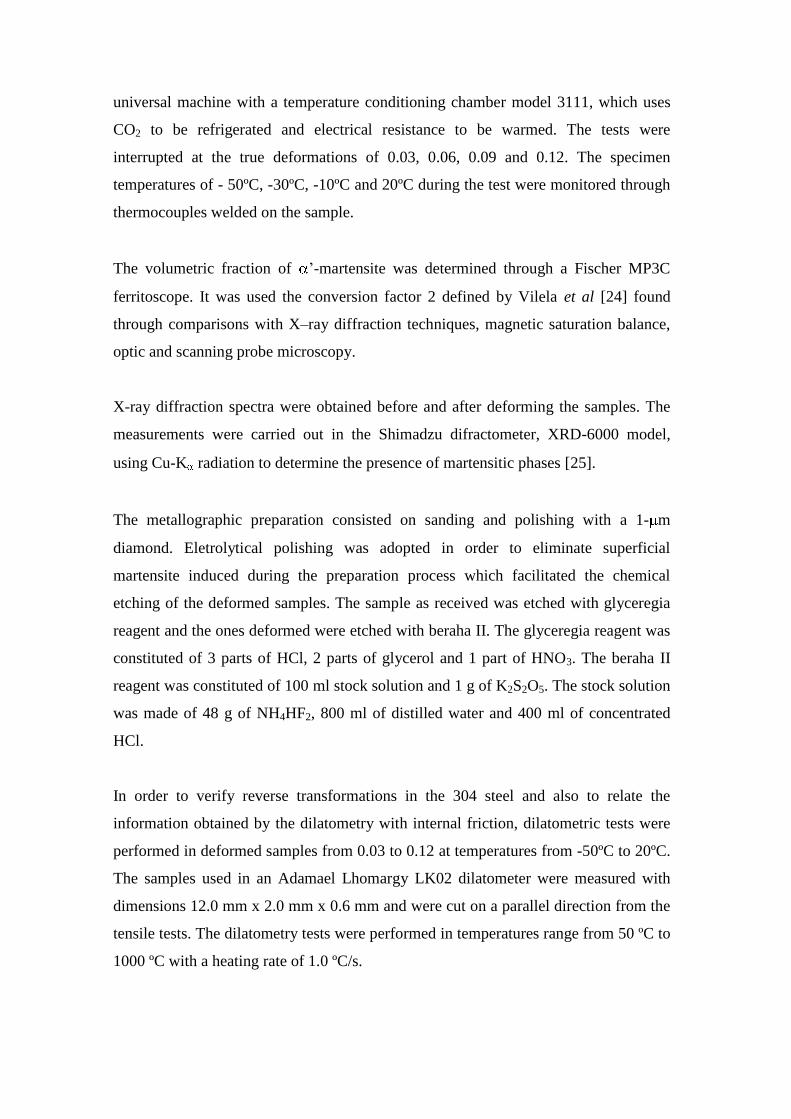
Figure 1 (a) shows an optical micrograph of the steel as received, where the
microstructure is constituted by equiaxial grains with annealing twins in gama phase.
Figure 1 (b) displays micrograph of a deformed sample, which is observed with thin
laths of ’-martensite on the austenitic matrix. -martensite is difficult to be visualized
by optical microscopy, but according to Mangonon and Thomas [6] ’-martensite is
formed in crossings and in the -martensites plates intersections. Recent studies are
indicating [26,27] that the embryos of ’ are capable of nuclei from -martensite such
as intersections of ε. Some authors [28,29] have indicated in the transformation route
γ→ε→α` that the -martensite acts as the precursors of ’. Other transformation routes
are possible such as γ→ε, γ→α`, γ→deformation twin→α` [26,27].
Figure 1. (a) Photomicrograph of a 304 sample as received. Etching: Glyceregia
reagent. (b) Photomicrograph of a sample with true deformation of 0.03 at -10ºC.
Etching: Beraha II reagent.
(a) (b)
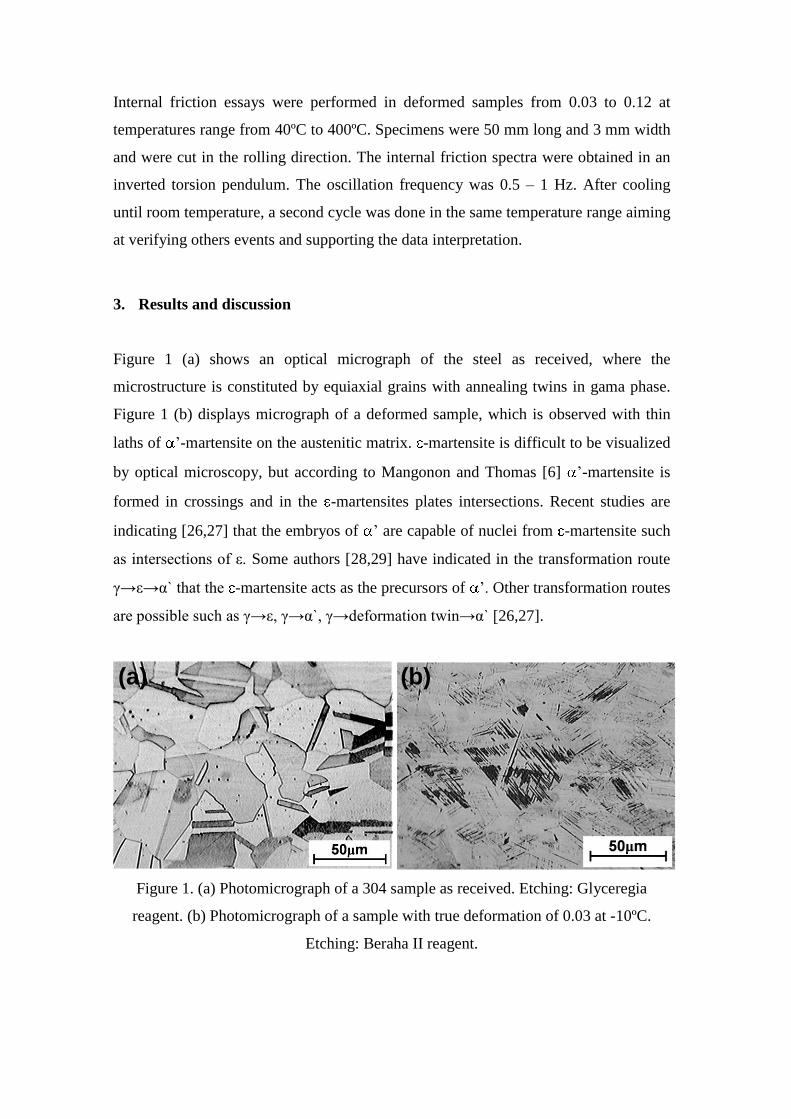
Santos and Andrade [25] show the diffraction spectrum of the sample deformed 0.06
of true strain at -10 ºC. The presence of the and ’-martensites was observed. In the
Figure 2 the austenitic phase and epsilon and alpha prime martensite phases are
detected.
Figure 2. X-ray diffraction spectrum of sample deformed of 0.06 at -10 ºC.
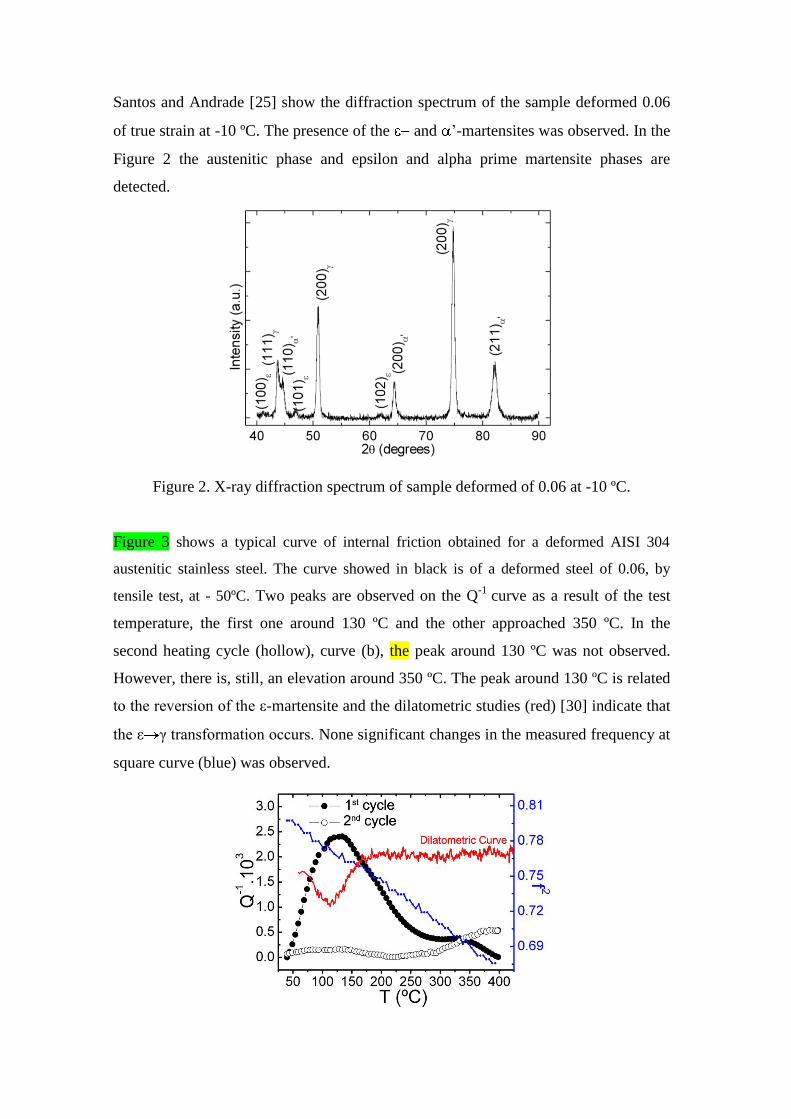
Figure 3 shows a typical curve of internal friction obtained for a deformed AISI 304
austenitic stainless steel. The curve showed in black is of a deformed steel of 0.06, by
tensile test, at - 50ºC. Two peaks are observed on the Q-1
curve as a result of the test
temperature, the first one around 130 ºC and the other approached 350 ºC. In the
second heating cycle (hollow), curve (b), the peak around 130 ºC was not observed.
However, there is, still, an elevation around 350 ºC. The peak around 130 ºC is related
to the reversion of the ε-martensite and the dilatometric studies (red) [30] indicate that
the ε γ transformation occurs. None significant changes in the measured frequency at
square curve (blue) was observed.
Figure 3. Internal friction spectra of sample with previous true deformation of 0.06 by
tensile test at -50ºC during the first heating (in black) and the second heating cycle
(hollow) in the same sample. The respective dilatometric curve from Figure 4 (b) was
added.
Measurements of ’-martensite were perfomed with the ferritoscope and are shown in
Figure 4 (a). Notice that the amount of ’-martensite increases continuously with the
applied deformation. It is also verified that lower temperatures are more appropriated
to ’-martensites formation.
Figure 4 (b) shows dilatometric curves of samples deformed from 0.03 to 0.12 at -50.
ε γ and α’ γ transformations are observed in temperatures range from 50 ºC to 200
ºC and from 500 ºC to 800 ºC, respectively. It was observed that with lower
deformations the ε-martensite forms in higher amount. When the deformation
increases the ε-martensite amount diminishes and the α’-martensite amount increases.
Figure 4 (c) shows the linear relationship ’-martensite measured by ferritoscope and
the α’ γ transformation area calculated with the software Peaking Fitting Origin
6.1® from dilatometric curves in the sample deformed at -50 ºC. The samples
deformed at the other temperatures showed the same behavior. For samples deformed
at 20 ºC, the ’-martensite content is so small that the α’ γ transformation peak was
not detected for 0.03 and 0.06 true strains (Figure 4 (a)). It is possible to observe the
direct proportionality between the amount of α’-martensite and the α’ γ
transformation peak area. So, the transformation behavior is identical to the one
indicated by determinations with the ferritoscope, the quantity of α’-martensite
increases with deformation. Das et al [26] studying an AISI 304LN stainless steel
showed that the amount of α’-martensite increases very rapidly with true strain in a
linearly proportional manner. In comparison between the curves for different strain
rates, it was observed that while the increase in strain rate favours martensite
formation at low strain level, the maximum amount of martensite formed due to tensile
deformation is reduced with the increase in the strain rate.
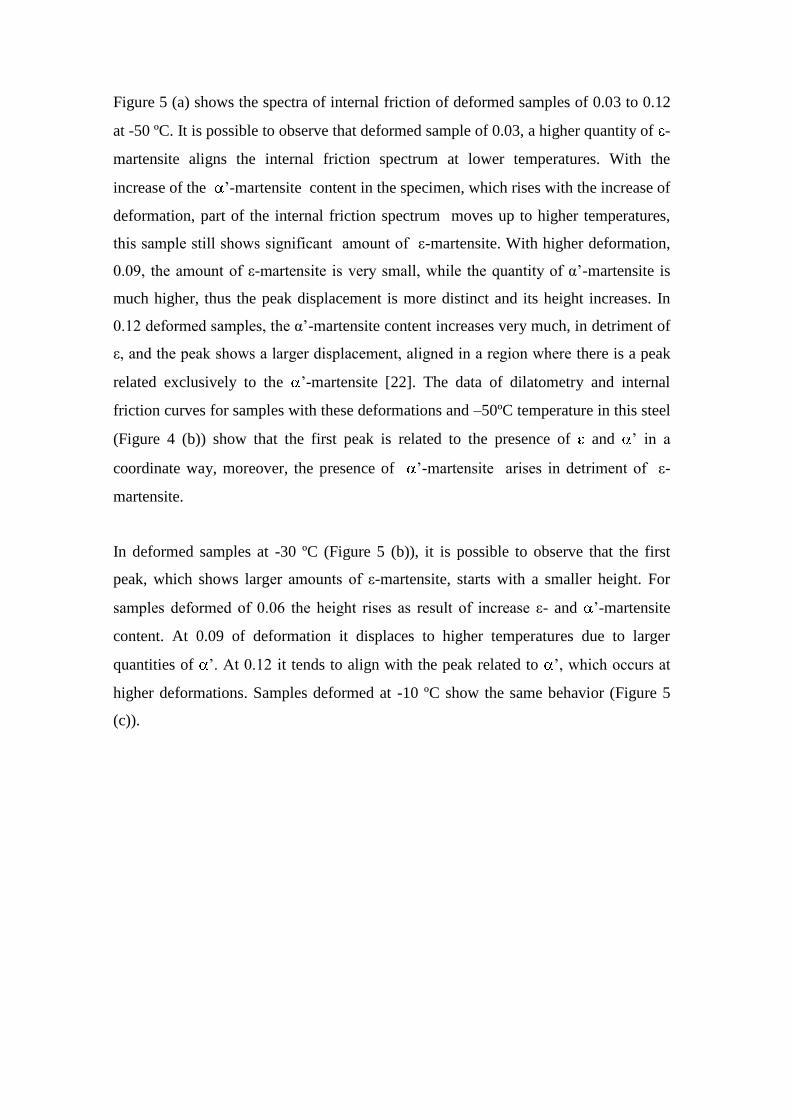
Figure 5 (a) shows the spectra of internal friction of deformed samples of 0.03 to 0.12
at -50 ºC. It is possible to observe that deformed sample of 0.03, a higher quantity of -
martensite aligns the internal friction spectrum at lower temperatures. With the
increase of the ’-martensite content in the specimen, which rises with the increase of
deformation, part of the internal friction spectrum moves up to higher temperatures,
this sample still shows significant amount of ε-martensite. With higher deformation,
0.09, the amount of ε-martensite is very small, while the quantity of α’-martensite is
much higher, thus the peak displacement is more distinct and its height increases. In
0.12 deformed samples, the α’-martensite content increases very much, in detriment of
ε, and the peak shows a larger displacement, aligned in a region where there is a peak
related exclusively to the ’-martensite [22]. The data of dilatometry and internal
friction curves for samples with these deformations and –50ºC temperature in this steel
(Figure 4 (b)) show that the first peak is related to the presence of and ’ in a
coordinate way, moreover, the presence of ’-martensite arises in detriment of ε-
martensite.
In deformed samples at -30 ºC (Figure 5 (b)), it is possible to observe that the first
peak, which shows larger amounts of ε-martensite, starts with a smaller height. For
samples deformed of 0.06 the height rises as result of increase ε- and ’-martensite
content. At 0.09 of deformation it displaces to higher temperatures due to larger
quantities of ’. At 0.12 it tends to align with the peak related to ’, which occurs at
higher deformations. Samples deformed at -10 ºC show the same behavior (Figure 5
(c)).
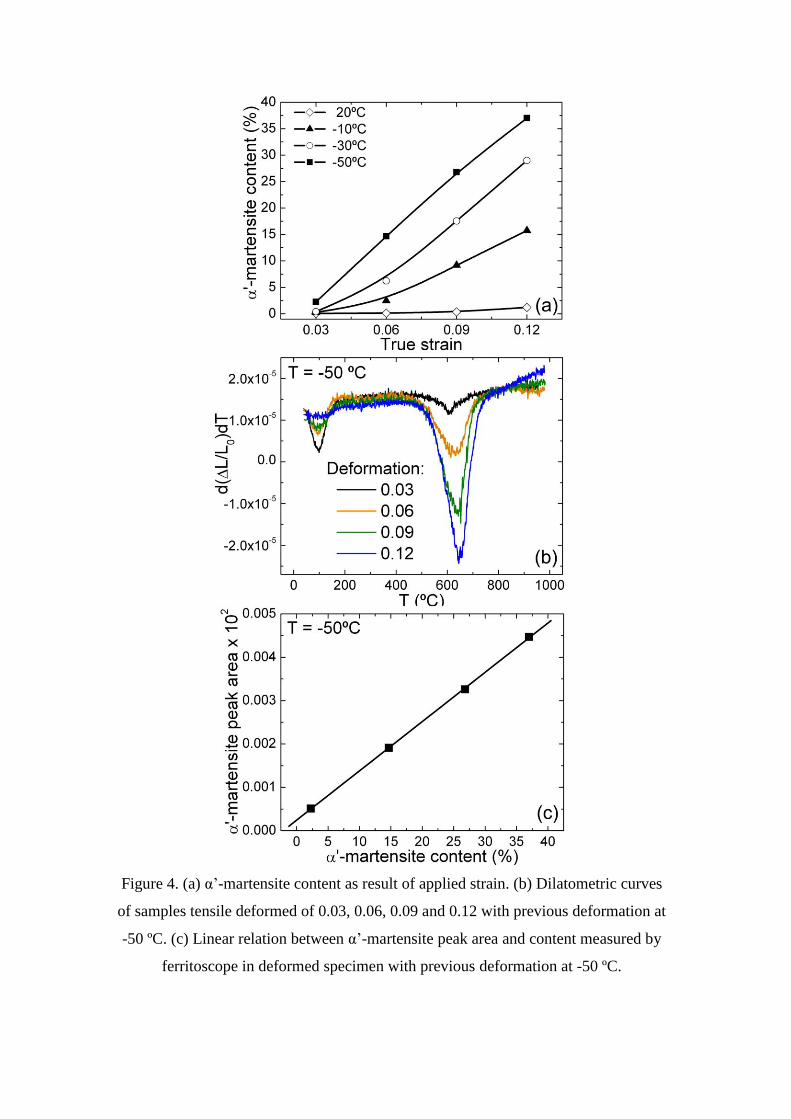
Figure 4. (a) α’-martensite content as result of applied strain. (b) Dilatometric curves
of samples tensile deformed of 0.03, 0.06, 0.09 and 0.12 with previous deformation at
-50 ºC. (c) Linear relation between α’-martensite peak area and content measured by
ferritoscope in deformed specimen with previous deformation at -50 ºC.

In the samples deformed at 20ºC (Figure 5 (d)), it is possible to observe that samples
deformed at 0.03, the appearing of the first peak aligns with the ε γ transformation
region, and with the increase of deformation it is verify that the peak height is related
to the quantity of ε that reverts to γ. At higher deformations, the peak starts a soft
displacement due to the beginning of α’-martensite formation, accompanied by an
increase in the friction level around 250 ºC and the 350 ºC peak appearance.
The internal friction peak around 350 ºC increases with deformation and it becomes
more evident with higher deformations. Baraz et al [15] was found this peak working
with an austenitic stainless steel with a composition very close to the one which was
studied on this work. The authors related to the deformed austenitic structure. Our
studies suggest that this peak is also related to the presence of ’-martensite, i.e. to a
mixture of deformed γ and interfaces of ’ in austenite.
Figure 6 shows the internal friction and the measured frequency at square curve for
samples deformed at -50 ºC. None significant changes in the measured frequency at
square curve was observed. But, the figure 4 shows clearly the concordance between
the internal friction first peak and the ε γ transformation, which occurs in the same
region. Samples deformed in the temperatures others show the same behavior.
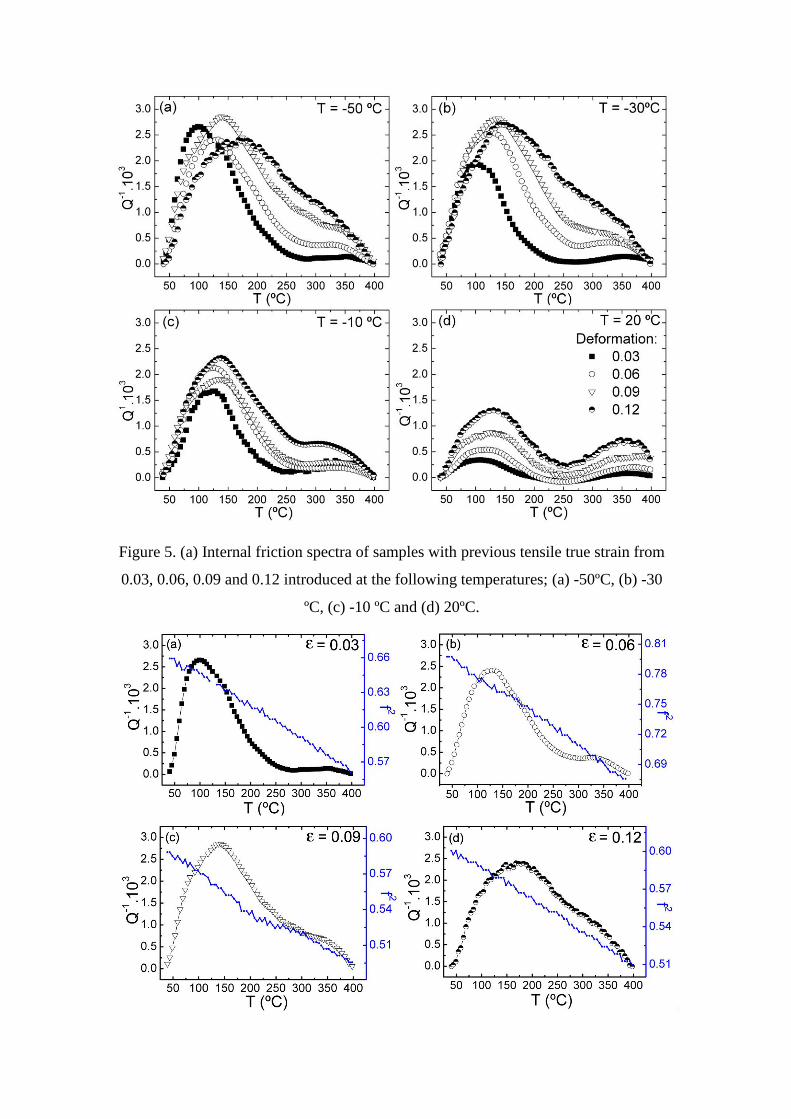
Figure 5. (a) Internal friction spectra of samples with previous tensile true strain from
0.03, 0.06, 0.09 and 0.12 introduced at the following temperatures; (a) -50ºC, (b) -30
ºC, (c) -10 ºC and (d) 20ºC.
Figure 6. Internal friction spectra of samples with previous tensile true strain from
0.03, 0.06, 0.09 and 0.12 introduced at -50 ºC showing the measured frequency at
square curve.
4. Conclusions
The ε-martensite forms first in the deformed samples, giving place to ’-martensite
formation, evidencing the ’ mechanism on this steel, for the -50 to 20 ºC range
of temperature and deformation conditions.
Measurements with the ferritoscope allowed checking the increase of ’-martensite
with the applied deformation. The same effect was detected with the dilatometric tests
that helped to verify the diminishing of ε-martensite as result of the ’-martensite
increase, corroborating the information obtained from the internal friction spectra.
The internal friction spectra of the AISI 304 austenitic stainless steel, containing
strain-induced - and ’-martensite can be interpreted considering the occurrences of
three distinct phenomena which over lag in the same temperatures range.
The first internal friction peak is related to sum of the amount of and ’-martensites.
For low deformations it aligns around 130 ºC and it is related only to the ε γ reverse
transformation. This transformation was evaluated by dilatometric tests that showed a
reversion of the ε-martensite occurring in temperature range from 50 a 200 ºC.
Part of the internal friction spectrum at temperatures in the 40-300 ºC range displaces
to higher temperatures while the ’-martensite content increases. The displacement of
the first internal friction peak to higher temperatures is a consequence of the increase
of ’-martensite quantity in detriment of ε-martensite.
The internal friction peak situated 350 ºC increases with the applied deformation. The
effect starts more evidently in deformed samples at 0.09 for all deformation
temperatures used in this work. This last peak is probably related to deformed
austenite and the presence of ’/γ interfaces.
Measurements of frequency at square curve do not indicate any significant changes in
the deformed samples. However, there are a clear concordance between the internal
friction first peak and the ε γ transformation, which occurs in the same region
References
[1] A.F. Padilha, P.R. Rios, ISIJ Int. 42 (2002) 325-337.
[2] C. Blanc, in: P. Lacombe, B. Baroux, G. Beranger (Org.), Les Aciers Inoxydables,
Éditions de Physique, Courtaboeuf, 1990, pp. 611-617.
[3] K. Guy, E.P. Butler, D.R.F. West, J. of Phys. 43 (1982) C4-575-580.
[4] G.J. Fischer, R.J. Maciag, in: D. Peckner, I.M. Bernstein (Eds.), Handbook of
Stainless Steels, McGraw-Hill Book Company, New York, 1977, p. 1.1-1.9.
[5] L.F.M. Martins, R.L. Plaut, A.F. Padilha. ISIJ Int. 38 (1998) 572-579.
[6].L. Mangonon, G. Thomas, Metall. Trans. 1 (1970) 1577-1581.
[7] L.J. Baker, J.D. Parker, S.R. Daniel, J. of Mat. Proc. 143-144 (2003) 442-447.
[8] M.S. Andrade, O.A. Gomes, J.M.C. Vilela, A.T.L. Serrano, J.M.D. Moraes, J. of
the Braz. Soc. of Mec. Sci. & Eng. XXVI (2004) 47-50.
[9] V. Taylan, R.H. Wagoner, J.K. Lee, Met. Mater. Trans. A 37 (2006) 1875-1886.
[10] A.K. De, D.C. Murdock, M.C. Mataya, .G. Spper, D.K. Matlock, Scripta Mater.
50 (2004) 1445-1449.
[11] B. Petit, N. Gey, M. Cherkaoui, B. Bolle, M. Humbert, Int. Journal of Plasticity
23 (2007) 323-341.
[12] A.K. De, J.G. Speer, D.K. Matlock, D.C. Murdock, M.C. Mataya, R.J. Comstock,
Met. Mater. Trans. 37 (2006) 1875-1886.
[13] I.G. Ritchie, P.M. Mathew, Z.I. Pan, C. Osborne, J.K. Prikryl, Wire J. Int., 1989,
pp. 201-218.
[14] A.S. Nowick, B.S. Berry, Anelastic Relaxation in Crystalline Solids, Academic
Press, New York, 1972, pp. 226-246.
[15] R.E. Reed-Hill, Physical Metallurgy Principles, PWS-Kent Publishing Company,
Boston, 1992, pp. 403-420.
[16] P. Shewmon, Diffusion in Solids, Minerals, Metals & Materials Society,
Pennsylvania, 1989. pp. 99-104.

[17] N. Yu, G.S. Koval, J.V. Firstov, J. Van Humbeeck, L. Delaey, W.Y. Jang, J. of
Phys. 5, 1995, C8-1103
[18] R. Zenati, C. Bernard, C. Calmet, S. Guillemet, G. Fantozzi, B. Durant. J. of the
Eur. Cer. Soc., vol. 25, pp. 914-935, 2005.
[19] J. Perkins, Shape Memory Effects in Alloys, Metallurgical Society of AIME,
California, 1975, pp. 451-466.
[20] V.R. Baraz, S.V. Grachev, L.D. Rol’schikov, Steel in the USSR, vol. 2, pp. 670-
672, 1972
[21] J. Talonen, H. Hänninen. Metall. Mater. Trans. A, vol. 35, pp. 2401-2406, 2004.
[22] T.B. Pinto, O.A. Gomes, J.M.C. Vilela, M.S. Andrade, A.L. Serrano, J.M.D. de
Moraes, Proceedings of the 58th Annual International Congress of the Brazilian
Association of Metallurgy and Materials (in Portuguese), Rio de Janeiro, 2003, pp.
3137-3144
[23] ASTM Standard E-646. 1993: 3.
[24] J.M.C. Vilela, N.J.L. Oliveira, M.S. Andrade, B.M. Gonzalez, C.E.R. Santos,
J.M.D. de Moraes, Proceedings of the 56th Annual International Congress of the
Brazilian Association of Metallurgy and Materials (in Portuguese), Belo Horizonte,
2001, pp. 510-519.
[25] T.F.A. Santos, M.S. Andrade, Matéria, vol. 13 pp. 587-596, 2008 (in Portuguese).
[26] Das, S. Tarafder, Int. Journal of Plasticity, vol. 25, pp. 2222-2247, 2009.
[27] K.H. Lo, C.H. Shek, J.K.L. Lai, Mat. Sci. Eng. R, vol. 65, pp. 39-104, 2009.
[28] N. Gey, B. Petit, M. Humbert, Met. Trans. A, vol. 36, pp. 3291-3299, 2005.
[29] M. Humbert, B. Petit, B. Bolle, N. Gey, Mat. Sci. Eng. A, vol. 454-455, pp. 508-
517, 2007.
[30] T.F.A. Santos, M.S. Andrade, A.L.R. Castro, R. Esc. Minas, vol. 62 pp. 53-58,
2009 (in Portuguese).
Acknowledgments
The authors are indebt to CNPq and FINEP for financial support. T.F.A Santos and
M.S. Andrade thank CNPq and Fapemig, respectively, for scholarships.