
Single Cord far-infrared polarimetry experiment on RFX G ...
13
Single Cord far-infrared polarimetry experiment on RFX G. Gadani, A. Parini, and E. Zilli Gruppo di Padova per Ricerche sulla Fusione, Associazioni EURATON-ENEA-CNR-Universita di Padova, Sede: Istituto Gas Ionizzati, CNR, Corso Stati Uniti, 4-35020 Padova, Italy P. O’Leary EURTATOM-University College Cork, Ireland S.L. Prunty and M.C. Sexton Department of Electrical Engineering and Microelectronics, University College Cork, Ireland (Received 3 February 1995; accepted for publication 16 May 1995) This paper summarises the work of the authors in the realisation and testing of a pilot single chord polarimetry experiment on the RFX (reversed field experiment) machine, at the far- infrared wavelength of 118.8 μm. The fundamental purpose of this experiment is to demonstrate the feasibility of a Faraday rotation angle measurement on RFX, with the required resolution, and to clarify all the aspects which may be useful for the final six-chord version of the diagnostic. The apparatus which has been developed is described, with emphasis on some of the modifications which proved essential in order to obtain a satisfactory measurement, in spite of the hostile environment of the machine. Typical results of Faraday angle measurements are presented and discussed, and the reliability of the measurement is demonstrated. In particular, the required + 0.2 o accuracy is achieved and the results are consistent with magnetic field profiles similar to the ones predicted by the Bessel function model. Suitable design considerations are formulated in order to guarantee the required performance in the six-chord version, even when the machine moves into full regime. 1. Introduction RFX is a large toroidal reversed field pinch (RFP) experiment (I p =2 MA, a=0.5 m, R=2 m) in operation in Padova since the end of 1991. 1-3 An overall description of the RFX diagnostics has already been presented, 4,5 with regard to their purpose and specific characteristics. Among these, a far-infrared (FIR) multichannel polarimeter has been considered useful for its ability to give information on the magnetic field distribution in the equilibrium configurations. 6-8 The multichannel FIR polarimetric measurement of the Faraday rotation angle, associated with a measurement of the electron density distribution, has been proven a very effective tool for the reconstruction of the poloidal field distribution in tokamak devices. 9-12 A very interesting aspect of this technique is the possibility of determining other physical quantities which could be derived from the measured poloidal field profile, such as the current density profile and the safety factor profile. 9 If this technique is applied to a RFP device, one should also expect to obtain some information about the toroidal field profile. 8 In order to understand this, it should be
-
Upload
khangminh22 -
Category
Documents
-
view
0 -
download
0
Transcript of Single Cord far-infrared polarimetry experiment on RFX G ...

Single Cord far-infrared polarimetry experiment on RFX
G. Gadani, A. Parini, and E. Zilli
Gruppo di Padova per Ricerche sulla Fusione, Associazioni EURATON-ENEA-CNR-Universita di Padova,
Sede: Istituto Gas Ionizzati, CNR, Corso Stati Uniti, 4-35020 Padova, Italy
P. O’Leary
EURTATOM-University College Cork, Ireland
S.L. Prunty and M.C. Sexton
Department of Electrical Engineering and Microelectronics, University College Cork, Ireland
(Received 3 February 1995; accepted for publication 16 May 1995)
This paper summarises the work of the authors in the realisation and testing of a pilot single
chord polarimetry experiment on the RFX (reversed field experiment) machine, at the far-
infrared wavelength of 118.8 µm. The fundamental purpose of this experiment is to
demonstrate the feasibility of a Faraday rotation angle measurement on RFX, with the
required resolution, and to clarify all the aspects which may be useful for the final six-chord
version of the diagnostic. The apparatus which has been developed is described, with
emphasis on some of the modifications which proved essential in order to obtain a
satisfactory measurement, in spite of the hostile environment of the machine. Typical results
of Faraday angle measurements are presented and discussed, and the reliability of the
measurement is demonstrated. In particular, the required +0.2o accuracy is achieved and the
results are consistent with magnetic field profiles similar to the ones predicted by the Bessel
function model. Suitable design considerations are formulated in order to guarantee the
required performance in the six-chord version, even when the machine moves into full
regime.
1. Introduction
RFX is a large toroidal reversed field pinch (RFP) experiment (Ip=2 MA, a=0.5 m,
R=2 m) in operation in Padova since the end of 1991.1-3
An overall description of the
RFX diagnostics has already been presented, 4,5
with regard to their purpose and
specific characteristics. Among these, a far-infrared (FIR) multichannel polarimeter
has been considered useful for its ability to give information on the magnetic field
distribution in the equilibrium configurations. 6-8
The multichannel FIR polarimetric measurement of the Faraday rotation angle,
associated with a measurement of the electron density distribution, has been proven a
very effective tool for the reconstruction of the poloidal field distribution in tokamak
devices.9-12
A very interesting aspect of this technique is the possibility of determining
other physical quantities which could be derived from the measured poloidal field
profile, such as the current density profile and the safety factor profile.9
If this technique is applied to a RFP device, one should also expect to obtain some
information about the toroidal field profile.8
In order to understand this, it should be

emphasized that the equilibrium magnetic configuration is rather different in RFP
devices compared to tokamak devices. Unlike the tokamak case where the toroidal
magnetic field is a large (BΦ>>Bθ) and known quantity, a basic property of the RFP
configuration is that the toroidal and poloidal magnetic field components are
comparable (BΦ≈Bθ), the toroidal field decreases with minor radius and reverses itself
on the outside of the plasma with respect to its value on the axis.13
The toroidal field
component is not completely imposed by external coils, but is strongly determined by
plasma currents, so that a specific problem of the RFP configuration is an accurate
control of the toroidal field, especially in the outer regions, and sustaining the reversal
beyond its natural decay.
On the other hand, measurements performed with external probes alone may not be
sufficient to determine field profiles. In the case of RFX, it has been ascertained that
different field profiles may exist that have the same values the pinch parameters Θ
and F.7
However, if the poloidal magnetic field and the pressure profiles are known,
there is no difficulty in calculating the toroidal field profile through the
magnetohydrodynamics equilibrium equation.8
So, the possibility of obtaining
information on the whole magnetic field configuration, associated with a very small
ellipticity in the probing beam polarization (Cotton-Mouton effect) makes the
application of FIR polarimetry to RFP devices very attractive.
Although it was initially planned to install a combined interferometer polarimeter for
RFX,6
similar to the diagnostic on TEXTOR,10
it was subsequently decided to
implement a polarimeter only, because the electron density profile is given with
sufficient accuracy by a CO2 interferometer14
and a microwave reflectometer.15
The
CO2 interferometer is situated at 30o
in the toroidal direction from the polarimeter and
the reflectometer is in the same section as the polarimeter.
Figure 1 Principle of operation of the polarimeter

The method of polarimetric measurement which has been adopted consists of a
differential measurement of the transmitted and reflected signals from a wire grid
analyser at 45o with respect to a linearly polarized incident beam. The principle of
operation16,17
is described in Fig. 1 and can be summarised as follows. The probing
beam (with the electric field initially in the s direction) traverses the plasma cross
section and a half-wave plate. Let Ψ be the angle of the emerging beam between the
electric field and the s axis. It then encounters the wire-grid analyser with wires
parallel to the principal plane of Fig. 1. The reflected and transmitted waves are
collected by detectors 1 and 2, respectively, and their output signals S1 and S2
(proportional to their beam intensities) are sent to a differential amplifier in order to
obtain a signal proportional to SD=S1-S2.
At first, the half-wave plate is rotated in order to set the difference signal to zero in
the absence of plasma. This is accomplished for Ψ=Ψo. Ψo being an angle near 45o.
When a small Faraday rotation angle ΔΨ is introduced by the plasma, so that Ψ=Ψo+
ΔΨ, we obtain a difference signal proportional to ΔΨ and to the probing beam power,
SD≈2Pinc RG ΔΨ
R being the responsivity of the detectors and G the gain of the amplifier chain. The
sum signal, S1+S2 should be independent of Ψ and can be used to monitor Pinc. A
simple calculation of the S/N ratio shows that the angular resolution should be related
to the incident power, Pinc, and to the noise equivalent power (NEP) of the detectors,
if no other noise source is present.
The choice of the wavelength (λ=118.8 µm , using CH3OH FIR laser, optically
pumped by a CO2 laser) has been strongly conditioned by the access port geometry.6
A special vessel section was designed to guarantee the maximum number of chords
with the most uniform distribution, consistent with the coil spacing and other
constraints. Six chords are used, each passing through a pipe of 35 mm i.d. The
required accuracy in Faraday angle measurement was calculated by a series of
computer simulations, which were performed in order to test the reconstruction
capability of the poloidal magnetic field profiles.8 As a result, an accuracy of about
+0.2 o
was found to be adequate. A time resolution of the order of 1 ms is considered
to be adequate, in relation to the expected macroscopic magnetic field fluctuations.
Although the proposed method of the Faraday angle measurement has been
successfully tested on an optical bench,17
it was decided to implement a pilot
experiment with one chord on RFX before considering the full six chord polarimeter
project. Its purpose is to demonstrate the feasibility of a Faraday angle measurement
on RFX with the required resolution and to acquire the necessary information to
sketch out completely the design of the six chord polarimeter.
In particular, the effects of disturbances produced by RFX (stray magnetic fields,
vibrations, etc.) on the various devices (laser, detectors, electronic circuits, optical

components, etc.), were not sufficiently well known at the beginning and thus tests on
the machine were deemed necessary.
Apart from an attempt to carry out a polarimetric measurement on ZT-40M in Los
Alamos,18
this is the first time that a FIR polarimetric diagnostic has been installed
and operated on a RFP device for a reliable and routine measurement of the poloidal
magnetic field.
In this paper we intend to summarise the work on the realisation and testing of the
pilot single chord polarimetry experiment on RFX. We start with a description of the
apparatus which has been installed on the machine, with emphasis on the
improvements and modifications which have been necessary for the satisfactory
performance of the diagnostic, in spite of the adverse conditions near the machine.
We then report on the main results of the measurements, with a discussion on their
reliability and interpretation. Finally we discuss the design considerations requisite
for the six chord experiment.
II. THE SINGLE CHORD APPARATUS
The laser is made up of a CO2 pump laser (about 50 W cw power) and a FIR cavity,
which gives about 200 mW cw output power. At present, it is chopped by a
mechanical chopper on the CO2 beam. The laser system is on a bench situated about
8.5 m away from the central axis of the machine on a platform surrounding the
machine. The FIR beam arrives at the plasma vessel via a large diameter tube, in a
controlled nitrogen atmosphere, in order to avoid attenuation due to air humidity. The
optical path from the laser to the detectors is approximately 11 m long.
The beam is focused and steered into the entrance port of the vacuum vessel by means
of a mirror system, as shown in Fig. 2. The optical system has been designed so that
the beam waist is on the equatorial plane of the machine with a diameter of about 7 mm
(1/e of the intensity). The first wire-grid analyzer is placed on the entrance port, to restore a
well-defined polarization on the probing beam (perpendicular to the toroidal direction), as it
has passed through several optical elements, since leaving the laser (with horizontal
polarization). The passage of the beam into and out of the vacuum vessel is via two quartz
crystal windows, which are plane parallel plates made out of Z-cut crystal quartz. Their
thickness (4.987+0.001 mm) was calculated to minimise their reflectivity at λ=118.8 µm.
They are installed with a tilt of 2o. The measured transmission (~71% agrees very well with
the calculated value. The pair of windows will transmit about 50% of the incident power, the
rest being absorbed as dielectric loss. The chord is 220 mm distant from the center of the
vessel section. Under optimal operating conditions, the measured power of the beam
emerging through the output port is about 20 mW (the mean power of the chopped beam).
The optical components for analysing the probing beam (half-wave plate, wire grid, etc.) and
the detectors with their preamplifiers are assembled in a section placed directly over the
torus. The wire-grid analyzer is made of 10 µm tungsten wire, with a 35 mm spacing. The
half-wave plate made of crystal quartz with anti-reflecting coating on both sides is mounted

on a precision rotary stage which is driven by a dc motor. An optical encoder with a
resolution of 200 steps/degree is used to measure displacement. A mechanical rotation of
an angle θ of the plate produces a 2θ Rotation of the beam’s polarization. Pyroelectric
detectors are used in this experiment, being preferred to other detectors at room
temperature such as Schottky diode detectors, because of their robustness and suitability
for operation close to the machine. Both the beam-steering and detectors sections are
placed near the machine, between the torus and the outer magnetizing coils.
Figure 2 Schematic diagram indicating the installation of the polarimetric diagnostic
The rest of the electronic equipment is placed far away in the diagnostics hall. A block
diagram of the signal conditioning electronics is shown in Fig. 3. The two signals from the
detectors preamplifiers are sent to the signal elaboration, data acquisition, and diagnostic
control unit in the diagnostic hall via 45-m long coaxial cables, where they are filtered and
amplified and sent to a difference amplifier and a sum amplifier. The difference signal is
then fed into a lock-in amplifier, whose reference frequency is supplied by the chopper, via
an optical fiber. The sum signal is ac-to-dc converted using the same time constant as the
lock-in amplifier.
The probing beam intensity may fluctuate due to variations in the laser power or beam
deviations caused by plasma refraction, and thus Sd will also change in the same way. In
order to eliminate the dependence on the beam intensity, the difference signal Sd must be
divided by the sum signal S1+S2. This division is carried out by the computer. Monitor signals
of the FIR and CO2 laser power are also processed in a similar way (amplified, filtered, and
ac-to-dc converted) and stored in the computer.
Furthermore the half-wave plate has a position control system, which enables the zeroing of
the difference signal as well as an initial calibration of the difference signal versus
mechanical rotation of the plate. Fiber optic cables from the diagnostics hall to the machine
are used to carry the encoder signals. Also the laser cavities [via the piezoceramic control
(PZT) of the CO2, and output coupling mirror sliding control on the FIR cavity] are
controllable remotely from the diagnostic hall.

Figure 3 Block diagram of the polarimetric data processing. S1 and S2 are the output signals from the detectors 1 and 2
The experimental activity started in Spring 1993 and since that time various sources of
disturbances had been found in the measurements and intensive work was required in order
to investigate their causes and subsequently remove them. Some of the more important
changes necessary will be outlined here. A strong source of disturbance was traced back to
the vibrations in the beam detection section, which analyzes the beam coming from the
vessel’s output port. The best solution to this problem was the construction of a new
assembly, which is more rigid, more compact, and completely non-metallic. Moreover, it is
fixed onto the outer structure of the machine instead of being suspended over the machine
as was previously the case, thus also avoiding the use of long and complex supporting arms.
The assembly uses off-axis, parabolic mirrors, operating at 90o with a focal length of about
100 mm (see Fig. 4). In this way, the FIR beam having come out of the RFX exit ports and
having passed through the half-wave plate, is divided into two components by a wire grid,
with each component subsequently being focused onto the respective detectors. The beams
have very short, equal length paths from the grid to the detectors. Given that the Faraday
angle measurement is determined by a small difference between the two signals, it is
important that the structure of the grid, mirrors, and detectors be very rigid and solid.
Figure 4 Rigid vertical assembly for the optical and detector components: 1-rotatable half-wave plate, 2-wire grid, 3-parabolic mirrors, 4-detectors and preamplifiers

Good maintenance of the laser system in order to guarantee stable and constant
performance has been ascertained to be necessary for a high-resolution measurement.
Other-wise the output signal from the FIR laser can have rapid fluctuations, which cannot be
removed using the compensation method (division of the difference signal by the sum
signal).
Moreover, possible depolarization effects of the beam when it goes through metal pipes
should also be taken into account.19 Simulations using pipes with the same dimensions as on
RFX have shown that it is important to center the FIR beam in the input and output ports of
the vacuum vessel with an accuracy of less than 5 mm. If this is not so, depolarization of the
beam can occur, thus altering the resultant polarization measurement. This result has been
confirmed in tests on RFX.
The choice of the pyroelectric detectors is not critical for the one chord experiment. Lithium
tantalate detectors (responsivity of about 0.25 V/W and NEP of about 2X10⁻⁷ W/√Hz) detect
very well, as can be seen from the results shown in this paper and have also proven that they
behave very well, despite the strong time-varying magnetic field, near the coils around the
machine. Pyroelectric detectors from the TGS family (such as DTGS, LATGS, and DLATGS),
which should offer better performances as regards responsivity and noise, are also under
test and their use is envisaged in the six-chord version.
No significant disturbance has been found in the long cables necessary to transport the
signal from RFX to the diagnostic hall for subsequent analysis, but it has been necessary to
screen very carefully the detectors and their preamplifiers by means of a housing with thick
aluminium walls (about 10 mm thick). Moreover, the preamplifier boards are mounted
parallel to the magnetic field. This was necessary in order to eliminate an electrical
disturbance which was generated by the capacitor bank for the RFX reversal current (at t=0 s
on the graphs), and which was particularly disagreeable in our case because it was not
eliminated or even reduced by the differential amplifier circuit.
III. EXPERIMENTAL RESULTS AND NUMERICAL SIMULATIONS
The data obtained by the polarimeter (and other associated measurements in RFX) have
been examined in order to ascertain their reliability and physical significance. More than
300 shots were considered and about 30 of these, with measured Faraday angles in the
range of 1.5o – 4.5o, have been chosen and analyzed in detail. The plasma current, Ip, was
between 0.5 and 0.8 MA, the electron density, ne between 0.3 and 1.0X10²⁰ m-3. The current
in the magnetizing coils was in the range 20-25 kA. We used a chopping frequency of around
3 kHz and a lock-in time constant of 3 ms (in the near future we will chop at 10 kHz and use a
1 ms time constant). The electron density measurements come from the eight-chord
interferometer. The density profile being rather flat,20 we take the density averaged along
one of the chords.
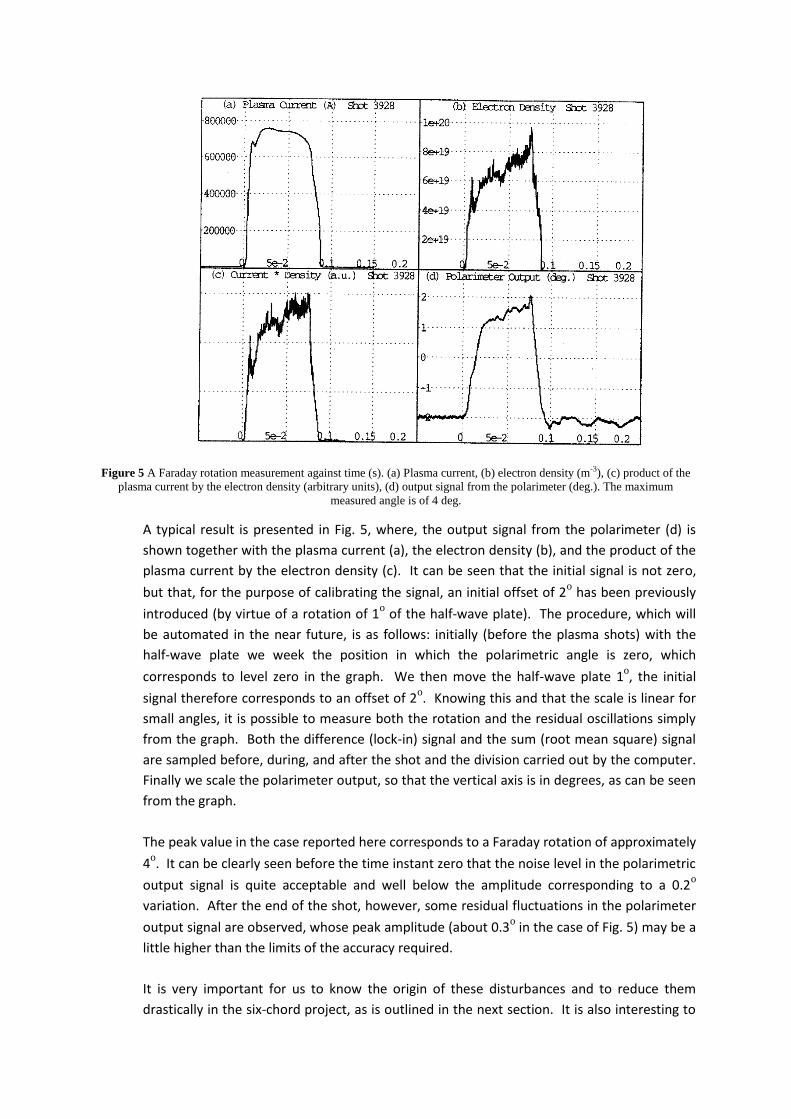
Figure 5 A Faraday rotation measurement against time (s). (a) Plasma current, (b) electron density (m-3), (c) product of the
plasma current by the electron density (arbitrary units), (d) output signal from the polarimeter (deg.). The maximum
measured angle is of 4 deg.
A typical result is presented in Fig. 5, where, the output signal from the polarimeter (d) is
shown together with the plasma current (a), the electron density (b), and the product of the
plasma current by the electron density (c). It can be seen that the initial signal is not zero,
but that, for the purpose of calibrating the signal, an initial offset of 2o has been previously
introduced (by virtue of a rotation of 1o of the half-wave plate). The procedure, which will
be automated in the near future, is as follows: initially (before the plasma shots) with the
half-wave plate we week the position in which the polarimetric angle is zero, which
corresponds to level zero in the graph. We then move the half-wave plate 1o, the initial
signal therefore corresponds to an offset of 2o. Knowing this and that the scale is linear for
small angles, it is possible to measure both the rotation and the residual oscillations simply
from the graph. Both the difference (lock-in) signal and the sum (root mean square) signal
are sampled before, during, and after the shot and the division carried out by the computer.
Finally we scale the polarimeter output, so that the vertical axis is in degrees, as can be seen
from the graph.
The peak value in the case reported here corresponds to a Faraday rotation of approximately
4o. It can be clearly seen before the time instant zero that the noise level in the polarimetric
output signal is quite acceptable and well below the amplitude corresponding to a 0.2o
variation. After the end of the shot, however, some residual fluctuations in the polarimeter
output signal are observed, whose peak amplitude (about 0.3o in the case of Fig. 5) may be a
little higher than the limits of the accuracy required.
It is very important for us to know the origin of these disturbances and to reduce them
drastically in the six-chord project, as is outlined in the next section. It is also interesting to

observe that the curve traced out by the output signal of the polarimeter is very similar to
the curve traced out by the product of the plasma current and the electron density, apart
from a smoothing out effect due to the 3 ms time constant of the lock-in amplifier. This can
be expected from theory, if during the shot the profiles of the electron density and the
poloidal magnetic field do not change significantly.
Table I. Experimental data of selected pulses: Plasma current (Ip), electron density (ne), pinch
parameters (Θ and F), Faraday rotation angle, (ΔΨ). ΔΨc is the Faraday rotation angle
calculated by the numerical simulation
For the shots which have been selected, the measured quantities which are found to be
significant for our analysis are collected in Table I. Apart from the plasma current and the
electron density, there are also the pinch parameters Θ and F, which come from external
probe measurements. The pulse duration is of about 100 ms or somewhat more in the
present working conditions of RFX. For each shot the reported data correspond to the
instant in which the Faraday rotation angle is near its maximum value and also the plasma
parameters do not show fast fluctuations of large amplitude. The Faraday rotation angle,
ΔΨ, measured by the FIR polarimeter, is compared with the angle ΔΨc, calculated by a
numerical computation. The numerical computation has been undertaken as follows. First
of all, we calculate the toroidal and poloidal field profiles in cylindrical geometry, using the

µ&p model, 21 where the pressure profile is assumed flat and the profile of the parameter
µ=µ0J.B/B2 is assumed to be of the type
a being the first wall radius (0.457 m in our case).
The parameters and α are determined in such a way that the subsequently calculated
values of the pinch parameters Θ and F coincide with their measured values. Then the field
profiles, determined in this way, are used in the calculation of the expected Faraday angle
ΔΨc, assuming a flat density profile. The method of calculation we used also allows for the
evaluation of the ellipticity experienced by the wave.22 The ellipticity turns out to be very
small (in the range from 2x10⁻⁸ to 2x10⁻⁶) unlike in the tokamak case, due to the modest
toroidal magnetic field. The difference between the measured Faraday angle and the
calculated one (ΔΨ-ΔΨc) is also shown and in most cases turns out to be less than or
comparable to the required +0.2o, uncertainty. The maximum absolute value of the
discrepancy is about 0.5o and it is observed only in a few cases.
Figure 6 A typical example of calculated profiles
of . The B.F.M. profiles (dashed lines) are
represented for comparison
Figure 7 Variation of the FIR power against time (s)
during a shot with 20kA of magnetising current (a) FIR
monitor (arbitrary units), (b) sum signal (arbitrary units)
(c) Magnetizing current (Amp)

It has also been ascertained that α typically assumes values greater than 10. This clearly
indicates that the µ profile should be rather flat and, as a consequence, that the magnetic
field profiles should be similar to the ones predicted by the Bessel function model (BFM).13
In a typical example, the profiles of the two magnetic field components and the µ profile are
shown (Fig. 6).
Radical displacements of the plasma column due to toroidal effects (shifts in the magnetic
axis of up to about 2 cm) do not seem to modify the calculated Faraday angle significantly.
IV. DISCUSSION AND DESIGN CONSIDERATIONS
The Faraday rotation angle measured by the FIR polarimeter and the one calculated
assuming a magnetic field profile consistent with the external probe measurements agree
satisfactorily in most of the shots considered, the differences being less or comparable with
the required uncertainty. This is an important confirmation for us of the reliability of the FIR
polarimetric measurement on RFX.
There are, however, some “anomalous” cases in which discrepancies greater than the
experimental errors have been observed. This fact may be a practical demonstration that
the system of magnetic probes at the boundary cannot give complete information on the
magnetic field configuration of RFX. The six-chord version of this diagnostic should help very
much, because it should allow the reconstruction of the actual magnetic field profiles.
The other important aspect is to find solutions for eliminating, or drastically reducing, the
disturbances in the measurements, with the assurance that they will be kept to acceptable
levels, even when the machine will operate in its full regime.
It has been ascertained that these fluctuations originate from two effects:
(a) Mechanical vibrations in the mirrors, which guide the beam to the input port of the
vacuum vessel (Beam Steering Section in Fig. 2).
(b) Perturbations in the laser system operation (such as destabilising effects, which may
appear during shots) due to both mechanical vibrations and the varying magnetic
field.
Another effect of the magnetic field (vertically incident on the laser, at the moment being of
the order 8 mT) on the laser performance is shown in Fig. 7. During a plasma shot the FIR
power decreases (visible both in the FIR power monitor signal and also in the sum signal) in a
manner dependent on the current in the magnetizing coils (for a duration of 2 s before the
beginning of the shot in which the current decreases). Up to now this effect has not been
serious as it can be compensated adequately by dividing the difference signal by the sum in
the data processing. It is, however, very likely that this disturbance shall grow as RFX moves
into full regime (when the current in the magnetizing coils increases from the present 20 kA
to 50 kA).

For these reasons, we intend to carry out two operations for the six-chord experiment:
(a) To design the new beam splitter and steering section with the same criteria which have
been adopted in modifying the beam detection section, as previously outlined. This
means that it must be very rigid and compact. Large metal parts or loops, which may
cause induced eddy currents, should be avoided and the supporting structure on the
machine will have to be carefully designed.
(b) To move the laser further from the machine, to a point where both mechanical
vibrations and the magnetic field are tolerable. The beam will, of course, be
transmitted down a longer pipe in a controlled nitrogen-filled atmosphere. We
estimated that a distance between the laser and the axis of the torus greater than 14 m
should be adequate. Therefore a new laser position, outside the machine room is
under study, which will also give the added advantage of allowing laser maintenance
during machine operation.
Moreover, it is planned to complete the tests on the pyroelectric detectors and to optimise
the preamplifier design, with the purpose of obtaining the best performance as regards
responsivity and NEP. This is very important, because in the new version of the diagnostic,
there will be less FIR power per chord, as a consequence both of the beam splitting into six
and the expected larger attenuation of the new line.
ACKNOWLEDGMENTS
The authors are very much obliged to D. Vencato, M. Okolicsanyi, F. Trevisan, E. Crepaldi, F.
Ravelli, J. Goulding, and B. Aherne for their cooperation with the experimental work. The
assistance of H. Mansfield of UCC and of the technical staff of RFX is gratefully
acknowledged. This work is supported by EURATOM under a collaboration contract
between the University of Cork and the Istituto Gas Ionizzati del CNR, Padova. A Euratom
Bursary award to P. O’Leary is also gratefully acknowledged.
1 G. Malesani and G. Rostagni, Fusion Technology 1986, Proceedings of 14th SOFT, Avignon,
France (C.E.C., Brussels, 1986), Vol.I, p.173.
2 G. Malesani, Proceedings of the International School of Plasma Physics, Varenna, Italy, 1987
(Editrice Compositori, Bologna, 1988), Vol. 1, p.331.
3 Topical issue on the RFX-experiment, Padova (editor: P.Komarek), Fus. Eng. Design 25, 301
(1995).
4 E. Zilli, Proceedings of the International School of Plasma Physics, Varenna, Italy, 1991
(Editrice Compositori, Bologna), p.633.
5 M. Bagatin et al., Fus. Eng. Design 25, 425 (1995).
6 A. Buffa and E. Zilli, Istituto Gas Ionizzati, Internal Report No. 88/04, 1988.

7 A. Buffa, P. Innocente, S. Martini, M. Moresco, E. Spada, and E. Zilli, Proceedings of the 16th
European Conference on Controlled Fusion and Plasma, Physics, Venice, Italy, 1989
(European Physical Society, 1989), Part IV, p.1493.
8 P. Innocente, S. Martini, and E. Zilli, Istituto Gas Ionizzati, Internal Report No. 91/02, 1991.
9 H. Soltwisch, Proceedings of the 11th European Conference on Controlled Fusion and
Plasma Physics, Aachen, 1983 (European Physical Society, 1983), Part I, p.123.
10 H. Soltwisch, Rev. Sci. Instrum. 57, 1939 (1986).
11 C.H. Ma, D.P. Hutchinson, K.L. Van der Sluis, D.K. Mansfield, H. Park, and L.C. Johnson, Rev.
Sci. Instrum. 57, 1994 (1986).
12 G. Braithwaite, N. Gottardi, G. Magyar, J. O’Rourke, J. Ryan and D. Veron, Rev. Sci. Instrum.
60, 2825 (1989).
13 J.B. Taylor, Proceedings of the 5th International Conference on Plasma Physics and
Controlled Nuclear Fusion, Tokyo, 1974 (IAEA Vienna, 1975), Vol. I, p.161.
14 P. Innocente and S. Martini, Rev. Sci. Instrum. 63, 4996 (1992.
15 M. Moresco, R. O’Dubhghaill, and E. Spada, Int. J. Infrared Millimeter Waves 12, 609
(1992).
16 E. Zilli, Istituto Gas Ionizzati, Internal Report No. 90/01, 1990.
17 S.L. Prunty, M.C. Sexton, and E. Zilli, Int. J. Infrared Millimeter Waves 12, 591 (1992).
18 R.M. Erickson, P.R. Forman, F.C. Jahoda, and J.R. Roberts, IEEE Trans. Plasma Sci. PS-12,
275 (1984).
19 G. Magyar and J. O’Rourke, Infrared Phys. 34, 543 (1993).
20 S. Martini, V. Antoni, L. Garzotti, P. Innocente, and G. Serianni, Proceedings of the 21st
European Conference on Controlled Fusion and Plasma Physics, Montpellier, France, 1994
(European Physical Society, 1994), Part I, p. 454.
21 S. Ortolani, Course on Mirror-based and Field-Reversed Approaches to Magnetic Fusion,
International School of Plasma Physics, Varenna, Italy, 1983 (Monotypia Franchi, Citta di
Castello, Perugia, Italy, 1983), Vol. II, p.513.
22 S.E. Segre, Plasma Phys. 20, 295 (1978).