Single cell analysis facilitates staging of Blimp1-dependent primordial germ cells derived from...
11
Single Cell Analysis Facilitates Staging of Blimp1- Dependent Primordial Germ Cells Derived from Mouse Embryonic Stem Cells John J. Vincent 1,2,3 , Ziwei Li 1,2 , Serena A. Lee 1,2 , Xian Liu 1 , Marisabel O. Etter 1,2 , Silvia V. Diaz-Perez 1,2 , Sara K. Taylor 1 , Sofia Gkountela 1,2 , Anne G. Lindgren 1,2 , Amander T. Clark 1,2,3,4 * 1 Department of Molecular Cell and Developmental Biology, University of California Los Angeles, Los Angeles, California, United States of America, 2 Eli and Edythe Broad Center of Regenerative Medicine and Stem Cell Research, University of California Los Angeles, Los Angeles, California, United States of America, 3 Molecular Biology Institute, University of California Los Angeles, Los Angeles, California, United States of America, 4 Jonsson Comprehensive Cancer Center, University of California Los Angeles, Los Angeles, California, United States of America Abstract The cell intrinsic programming that regulates mammalian primordial germ cell (PGC) development in the pre-gonadal stage is challenging to investigate. To overcome this we created a transgene-free method for generating PGCs in vitro (iPGCs) from mouse embryonic stem cells (ESCs). Using labeling for SSEA1 and cKit, two cell surface molecules used previously to isolate presumptive iPGCs, we show that not all SSEA1+/cKit+ double positive cells exhibit a PGC identity. Instead, we determined that selecting for cKit bright cells within the SSEA1+ fraction significantly enriches for the putative iPGC population. Single cell analysis comparing SSEA1+/cKit bright iPGCs to ESCs and embryonic PGCs demonstrates that 97% of single iPGCs co-express PGC signature genes Blimp1, Stella, Dnd1, Prdm14 and Dazl at similar levels to e9.5–10.5 PGCs, whereas 90% of single mouse ESC do not co-express PGC signature genes. For the 10% of ESCs that co-express PGC signature genes, the levels are significantly lower than iPGCs. Microarray analysis shows that iPGCs are transcriptionally distinct from ESCs and repress gene ontology groups associated with mesoderm and heart development. At the level of chromatin, iPGCs contain 5-methyl cytosine bases in their DNA at imprinted and non-imprinted loci, and are enriched in histone H3 lysine 27 trimethylation, yet do not have detectable levels of Mvh protein, consistent with a Blimp1-positive pre- gonadal PGC identity. In order to determine whether iPGC formation is dependent upon Blimp1, we generated Blimp1 null ESCs and found that loss of Blimp1 significantly depletes SSEA1/cKit bright iPGCs. Taken together, the generation of Blimp1- positive iPGCs from ESCs constitutes a robust model for examining cell-intrinsic regulation of PGCs during the Blimp1- positive stage of development. Citation: Vincent JJ, Li Z, Lee SA, Liu X, Etter MO, et al. (2011) Single Cell Analysis Facilitates Staging of Blimp1-Dependent Primordial Germ Cells Derived from Mouse Embryonic Stem Cells. PLoS ONE 6(12): e28960. doi:10.1371/journal.pone.0028960 Editor: Martin Pera, University of Southern California, United States of America Received July 5, 2011; Accepted November 17, 2011; Published December 15, 2011 Copyright: ß 2011 Vincent et al. This is an open-access article distributed under the terms of the Creative Commons Attribution License, which permits unrestricted use, distribution, and reproduction in any medium, provided the original author and source are credited. Funding: This work was supported by NIH R01HD058047 and a research award from the UCLA Eli and Edythe Broad Center of Regenerative Medicine and Stem Cell Research (http://stemcell.ucla.edu). Training grant support was provided to JJV and AGL by the California Institute for Regenerative Medicine Grants T1-0005 and TG2-01169 (http://www.cirm.ca.gov). The funders had no role in study design, data collection and analysis, decision to publish, or preparation of the manuscript. Competing Interests: The authors have declared that no competing interests exist. * E-mail: [email protected] Introduction The molecular events that regulate cell fate decisions in post- implantation mammalian embryonic development are largely uncharacterized due to the challenge in identifying and isolating small populations of specific precursor cells that are develop- mentally transient in the early embryo. In particular, precursors of the germ cell lineage are initially set aside as four to six cells in the murine embryonic epiblast, which proliferate and migrate through the primitive streak to generate the initial founder primordial germ cell (PGC) pool of approximately forty cells at the base of the allantois at embryonic (e) day e7.5 [1,2]. The PGCs migrate out of the allantois and into the embryonic hindgut endoderm at e8.0–8.5 where they continue to proliferate and begin to accumulate nuclear histone H3 lysine 27 trimethylation (H3K27m3) [3]. By e10.5–e11.0 a single embryo has approx- imately 1,000–2,000 PGCs, which exit the hindgut and begin colonization of the indifferent gonad and express Mvh protein [3,4,5]. The transcription factors that specify and sustain PGC identity prior to gonadal colonization are not well understood. One of the most characterized regulators of PGC fate is the transcriptional repressor B-lymphocyte induced maturation protein 1 (Blimp1), the transcriptional product of the PRD1-BF1 and RIZ (PR) domain 1 (Prdm1) gene. Blimp1 expression is detected in epiblast-derived PGCs and persists until e11.5, when PGCs have colonized the gonad [2,6]. Loss of one Prdm1 allele significantly reduces PGC numbers in the allantois, with the loss of both causing almost a complete loss of PGCs [2]. The major direct target of Blimp1 in PGCs is hypothesized to be Hoxb1 [7]. However, direct binding of Blimp1 at the Hoxb1 locus in PGCs has not been demonstrated. The mechanism by which Blimp1 mediates gene repression is hypothesized to involve recruitment of the chromatin-remodeling enzyme Protein arginine methyltransferase 5 (Prmt5) to chromatin PLoS ONE | www.plosone.org 1 December 2011 | Volume 6 | Issue 12 | e28960
-
Upload
independent -
Category
Documents
-
view
1 -
download
0
Transcript of Single cell analysis facilitates staging of Blimp1-dependent primordial germ cells derived from...

Single Cell Analysis Facilitates Staging of Blimp1-Dependent Primordial Germ Cells Derived from MouseEmbryonic Stem CellsJohn J. Vincent1,2,3, Ziwei Li1,2, Serena A. Lee1,2, Xian Liu1, Marisabel O. Etter1,2, Silvia V. Diaz-Perez1,2,
Sara K. Taylor1, Sofia Gkountela1,2, Anne G. Lindgren1,2, Amander T. Clark1,2,3,4*
1 Department of Molecular Cell and Developmental Biology, University of California Los Angeles, Los Angeles, California, United States of America, 2 Eli and Edythe Broad
Center of Regenerative Medicine and Stem Cell Research, University of California Los Angeles, Los Angeles, California, United States of America, 3 Molecular Biology
Institute, University of California Los Angeles, Los Angeles, California, United States of America, 4 Jonsson Comprehensive Cancer Center, University of California Los
Angeles, Los Angeles, California, United States of America
Abstract
The cell intrinsic programming that regulates mammalian primordial germ cell (PGC) development in the pre-gonadal stageis challenging to investigate. To overcome this we created a transgene-free method for generating PGCs in vitro (iPGCs)from mouse embryonic stem cells (ESCs). Using labeling for SSEA1 and cKit, two cell surface molecules used previously toisolate presumptive iPGCs, we show that not all SSEA1+/cKit+ double positive cells exhibit a PGC identity. Instead, wedetermined that selecting for cKitbright cells within the SSEA1+ fraction significantly enriches for the putative iPGCpopulation. Single cell analysis comparing SSEA1+/cKitbright iPGCs to ESCs and embryonic PGCs demonstrates that 97% ofsingle iPGCs co-express PGC signature genes Blimp1, Stella, Dnd1, Prdm14 and Dazl at similar levels to e9.5–10.5 PGCs,whereas 90% of single mouse ESC do not co-express PGC signature genes. For the 10% of ESCs that co-express PGCsignature genes, the levels are significantly lower than iPGCs. Microarray analysis shows that iPGCs are transcriptionallydistinct from ESCs and repress gene ontology groups associated with mesoderm and heart development. At the level ofchromatin, iPGCs contain 5-methyl cytosine bases in their DNA at imprinted and non-imprinted loci, and are enriched inhistone H3 lysine 27 trimethylation, yet do not have detectable levels of Mvh protein, consistent with a Blimp1-positive pre-gonadal PGC identity. In order to determine whether iPGC formation is dependent upon Blimp1, we generated Blimp1 nullESCs and found that loss of Blimp1 significantly depletes SSEA1/cKitbright iPGCs. Taken together, the generation of Blimp1-positive iPGCs from ESCs constitutes a robust model for examining cell-intrinsic regulation of PGCs during the Blimp1-positive stage of development.
Citation: Vincent JJ, Li Z, Lee SA, Liu X, Etter MO, et al. (2011) Single Cell Analysis Facilitates Staging of Blimp1-Dependent Primordial Germ Cells Derived fromMouse Embryonic Stem Cells. PLoS ONE 6(12): e28960. doi:10.1371/journal.pone.0028960
Editor: Martin Pera, University of Southern California, United States of America
Received July 5, 2011; Accepted November 17, 2011; Published December 15, 2011
Copyright: � 2011 Vincent et al. This is an open-access article distributed under the terms of the Creative Commons Attribution License, which permitsunrestricted use, distribution, and reproduction in any medium, provided the original author and source are credited.
Funding: This work was supported by NIH R01HD058047 and a research award from the UCLA Eli and Edythe Broad Center of Regenerative Medicine and StemCell Research (http://stemcell.ucla.edu). Training grant support was provided to JJV and AGL by the California Institute for Regenerative Medicine Grants T1-0005and TG2-01169 (http://www.cirm.ca.gov). The funders had no role in study design, data collection and analysis, decision to publish, or preparation of themanuscript.
Competing Interests: The authors have declared that no competing interests exist.
* E-mail: [email protected]
Introduction
The molecular events that regulate cell fate decisions in post-
implantation mammalian embryonic development are largely
uncharacterized due to the challenge in identifying and isolating
small populations of specific precursor cells that are develop-
mentally transient in the early embryo. In particular, precursors
of the germ cell lineage are initially set aside as four to six cells in
the murine embryonic epiblast, which proliferate and migrate
through the primitive streak to generate the initial founder
primordial germ cell (PGC) pool of approximately forty cells at
the base of the allantois at embryonic (e) day e7.5 [1,2]. The
PGCs migrate out of the allantois and into the embryonic hindgut
endoderm at e8.0–8.5 where they continue to proliferate and
begin to accumulate nuclear histone H3 lysine 27 trimethylation
(H3K27m3) [3]. By e10.5–e11.0 a single embryo has approx-
imately 1,000–2,000 PGCs, which exit the hindgut and begin
colonization of the indifferent gonad and express Mvh protein
[3,4,5].
The transcription factors that specify and sustain PGC identity
prior to gonadal colonization are not well understood. One of the
most characterized regulators of PGC fate is the transcriptional
repressor B-lymphocyte induced maturation protein 1 (Blimp1), the
transcriptional product of the PRD1-BF1 and RIZ (PR) domain 1
(Prdm1) gene. Blimp1 expression is detected in epiblast-derived
PGCs and persists until e11.5, when PGCs have colonized the
gonad [2,6]. Loss of one Prdm1 allele significantly reduces PGC
numbers in the allantois, with the loss of both causing almost a
complete loss of PGCs [2]. The major direct target of Blimp1 in
PGCs is hypothesized to be Hoxb1 [7]. However, direct binding of
Blimp1 at the Hoxb1 locus in PGCs has not been demonstrated.
The mechanism by which Blimp1 mediates gene repression is
hypothesized to involve recruitment of the chromatin-remodeling
enzyme Protein arginine methyltransferase 5 (Prmt5) to chromatin
PLoS ONE | www.plosone.org 1 December 2011 | Volume 6 | Issue 12 | e28960

[6]. However, genome-wide analysis of PGC chromatin is
currently not feasible due to the challenge in performing
chromatin immunoprecipitation on small cell numbers, necessi-
tating the development of a scalable model to accurately capture
the Blimp1-positive phase of PGC development.
The differentiation of pluripotent stem cells, including embry-
onic stem cells (ESCs), has emerged as a novel technology for
generating sufficient numbers of embryonic progenitors at-scale to
evaluate embryonic lineage development. A number of methods
for identifying in vitro PGCs (iPGCs) have been described that
mostly involve use of integrated fluorescent reporters, including
Oct4-delta-PE-Gfp [8,9,10,11,12], Stella-Gfp [13,14,15], Dazl-Gfp
[16] and Mvh-LacZ/Rfp transgenes [10,17,18]. A small number of
studies have used Stage Specific Embryonic Antigen 1 (SSEA1) to
enrich for germ cells [19,20], but the identity of PGCs from ESCs
within the SSEA1+ fraction has not been interrogated at a single
cell level. Furthermore, the majority of PGC differentiation studies
have been designed to characterize the post-colonized Blimp1-
negative PGC. Therefore, the goal of the current study is to
generate a robust ESC differentiation system to acquire PGCs in
the Blimp1-positive stage of development for future in-depth
analysis of the pre-gonadal stage.
Results
cKitbright refines an Oct4+/SSEA1+ iPGC population inembryoid bodies
To identify pre-gonadal iPGCs with differentiation, we first used
Oct4-Gfp ESCs [21] to generate hanging-drop embryoid bodies
(EBs) containing 300 cells per drop (Figure 1A). EBs could be
maintained for up to 8 days in this system (Figure S1A), but cell
viability decreased rapidly after day 6 from 69% to 19% by day 8
(Figure S1B). Using flow cytometry we show that Gfp is retained in
the majority of cells in the first four days of differentiation
(Figure 1B), reminiscent of sustained Oct4 expression in vivo in
both PGCs and embryonic somatic cells up to e8.5 [22,23]. On
day 5 of differentiation, we observed the emergence of a shoulder
of Gfpbright cells and the formation of a distinct Gfp+ peak by day
6 (Figure 1B, arrow).
To generate a transgene-free method of iPGC differentiation,
we correlated expression of Oct4 protein in day 6 EBs derived
from V6.5 ESCs with the cell surface marker SSEA1. In the
embryo, SSEA1 is highly expressed on Blimp1-positive stage
PGCs and PGC precursors derived from epiblast stem cells
[24,25]. We found that Oct4 is co-expressed with SSEA1 in small
cell clusters at day 6 of differentiation by immunofluorescence
(Figure 1C). Given that Oct4 and SSEA1 are also expressed by
undifferentiated ESCs, we used the membrane-localized tyrosine
kinase receptor cKit to assist in further defining the iPGC
population within either the SSEA1+ or Oct4+ fractions. cKit is
highly expressed by endogenous PGCs from e7.25 to e13.5
[7,22,26] and is not expressed by epiblast cells [22]. Indeed, flow
cytometry analysis of V6.5 ESC-derived EBs at day 6 of
differentiation revealed a discreet a side population of SSEA1+/
cKit+ cells (Figure 1D). A side population of Oct4-Gfp+/cKit+cells was also identified beginning at day 6 of differentiation in EBs
derived from Oct4-gfp ESCs, and this was sustained to day 8
(Figure S1C).
To interrogate PGC identity in specific fractions of SSEA1+/
cKit+ cells when the population is first identified at day 6, we used
real time PCR to determine relative levels of PGC-expressed genes
in discreet cKit+ fractions. These fractions include SSEA1+/
cKitbright (green), SSEA1+/cKitmid (light blue), and SSEA1+/
cKitdim (dark blue), and SSEA1-/cKit- cells (red) as a negative
control (Figure 1E). cKitbright cells were selected based on
increased signal intensity above the main population. PGC genes
including cKit, Blimp1, Stella and Dazl were all enriched in the
SSEA1+/cKitbright fraction, with lower expression in the cKitmid
and cKitdim fractions of SSEA1+ cells (Figure 1F). Mvh was also
expressed in the SSEA1+/cKitbright fraction, but was not
specifically enriched in SSEA1+/cKitbright cells relative to cKitmid
and cKitdim. Furthermore, analysis of Mvh levels in SSEA1+/
cKitbright cells at day 8 of differentiation also did not show an
increase relative to day 6 (data not shown). In contrast,
transcription factors expressed in somatic cells such as Hoxa1
and Hoxb1 were highly expressed in SSEA1-/cKit- and SSEA1+/
cKitdim relative to SSEA1+/cKitbright cells. Together, we conclude
that not every SSEA1+/cKit+ cell in EBs at day 6 of
differentiation is a putative PGC, and that selecting for cKitbight
cells enriches for the iPGCs beginning at day 6 of differentiation
and persisting until day 8. We next determined if Oct4-gfp could
further sub-fractionate the putative SSEA1+/cKitbright putative
iPGC population, and found equal enrichment of Oct4-gfp in all
SSEA1+ cells regardless of cKit intensity (Figure S1D). Therefore
the use of the Oct4-Gfp reporter together with SSEA1 and cKit
does not further refine the isolation of putative iPGCs, but instead
shows that Oct4-Gfp and SSEA1 report the same population
when used with cKit.
We next evaluated the yield of SSEA1+/cKitbright or Oct4-
gfp+/cKitbright cells (called iPGCs) isolated at day 6 of differen-
tiation (Figure 1G). We determined that 1–4% of total live EB cells
exhibited an iPGC surface signature, and there was no statistical
difference between genetic backgrounds (Figure 1G). Furthermore,
gene expression profiling of Oct4-gfp+/cKitbright cells from the
Oct4-gfp line and SSEA1+/cKitbright cells from J1 EBs at day 6
revealed enriched expression of cKit, Stella, Blimp1, Dazl and Mvh
relative to the SSEA1-/cKit- somatic cell controls (Figure S1E).
Conversely, somatic gene expression as documented by Hoxa1 and
Hoxb1 were not enriched in the putative iPGCs relative to somatic
cells (Figure S1F).
To test identity of SSEA1+/cKitbright cells derived from V6.5
ESCs we sorted putative iPGCs and cultured them on mouse
embryonic fibroblasts (MEFs) supplemented with basic Fibroblast
Growth Factor 2 (FGF2), Stem Cell Factor (SCF), Leukemia
Inhibitory Factor (LIF) and retinoic acid (RA), a driver of PGC
proliferation (Figure 1H). This assay has been used previously to
confirm PGC identity relative to undifferentiated ESCs, which
respond to RA by undergoing differentiation and becoming
alkaline phosphatase (AP) negative [15,19,20]. AP+ colony
forming ability is almost exclusively associated with SSEA1+/
cKitbright population when compared to sorted undifferentiated
ESCs, SSEA1+/cKitmid or SSEA1+/cKitdim cells plated at
equivalent numbers (Figure 1I). The three non-iPGC populations
generate mostly mixed colonies or AP negative colonies.
Withdrawal of RA, FGF2 and SCF while retaining LIF in the
media of RA-treated SSEA1+/cKitbright sorted cells results in the
formation of self-renewing pluripotent embryonic germ cells
(EGCs), which could be maintained for at least 10 passages
(Figure 1J).
Day 6 iPGCs have a pre-gonadal, pre-reprogrammed PGCidentity
Day 6 EB-derived SSEA1+/cKitbright or Oct4-Gfp+/cKitbright
iPGCs consistently express Dazl and Mvh RNA in addition to
Blimp1 (Figure 1F & Figure S1E). Therefore we could hypothesize
that putative iPGCs correspond to newly colonized PGCs that
have expressed Mvh protein and have potentially undergone
whole genome reprogramming. To address this, we performed
Developmental Staging of In Vitro PGCs
PLoS ONE | www.plosone.org 2 December 2011 | Volume 6 | Issue 12 | e28960

immunofluorescence for Mvh, which is first detectable in gonadal
PGCs at e11.5 [27,28,29]. We also evaluated DNA demethylation
at imprinted and non-imprinted genes, which is erased by e12.5
[30,31]. Immunofluorescence analysis of e10.5 embryos with
antibodies against Mvh and Oct4 confirms that e10.5 Oct4-
positive PGCs are negative for Mvh protein, whereas gonadal-
stage PGCs are Mvh positive (Figure 2A). Analysis of SSEA1+/
cKitbright sorted iPGCs derived from V6.5 ESCs reveals that Mvh
protein is not detectable above background (Figure 2B). We also
tested J1 ESC-derived iPGCs and were unable to detect Mvh
protein similar to V6.5 iPGCs (data not shown). Furthermore we
evaluated H3K27m3 in SSEA1+/cKitbright iPGCs, a histone
modification that is depleted from the PGC genome from e11.5–
e12.5 [4]. We found a high nuclear content of H3K27me3 in
iPGCs (Figure 2C). Together this data suggests that the SSEA1+/
cKitbright iPGCs are pre-reprogrammed and younger than e11.5.
Figure 1. Transgene-free method for isolating iPGCs from embryoid bodies. A: V6.5 embryoid bodies in hanging drops at days 4, 5, and 6of differentiation. Scale bar = 500 microns. B: Oct4-Gfp expression (red) relative to V6.5 EBs (black) at days 4, 5 and 6 of differentiation. Arrows indicateshoulder of Oct4-Gfpbright cells at day 5 and an Oct4-Gfpbright peak at day 6. C: Immunofluorescence of EBs at day 6 for Oct4 (red) and SSEA1 (green).Double positive cells localize in discreet clusters (arrow). Scale bar = 20 microns. D: Flow cytometry plot of V6.5 day 6 EBs stained for SSEA1 and cKit.Oval gate defines the SSEA1+/cKit+ side population. E: Flow plot day 6 EBs from V6.5 ESCs fractionated by expression of SSEA1 and cKit into SSEA1+/cKitbright (green), SSEA1+/cKitmid (light blue), SSEA1+/cKitdim (dark blue), and SSEA1-/cKit- cells (red) populations. Quadrant gates are drawn todemonstrate the criteria for selecting SSEA1+/cKitbright cells. The remaining cKit+ population was split into two equal fractions, mid and dim. F: Semi-quantitative real-time PCR from the populations isolated in E, with levels normalized to Gapdh. SSEA1+/cKitbright cells are set at 1.0. Data is from twobiological replicates each performed in technical duplicate. Error bars represent s.e.m. G: Percentage of live iPGCs acquired from differentiation ofESCs of different genetic backgrounds. Each line was tested at least seven independent times. H: Diagrammatic representation of iPGC replatingassay. I: Quantification of alkaline phosphatase (AP) staining of colonies derived from indicated cell populations after 5 days of culture. Right,representative images of colony types. Scale bar = 500 microns. J: Self-renewing EGCs at passage 10 derived from RA/FGF2/LIF/SCF cultured iPGCs,followed by routine passaging in the presence of LIF only. Error bars represent s.d.doi:10.1371/journal.pone.0028960.g001
Developmental Staging of In Vitro PGCs
PLoS ONE | www.plosone.org 3 December 2011 | Volume 6 | Issue 12 | e28960

To further confirm a pre-reprogrammed identity, we next
evaluated the methylation status of an imprinted gene (Snrpn) and
two non-imprinted loci, Xist and Intracisternal A Particle 1 (IAP), by
bisulfite sequencing (Figure 2D). Analysis of undifferentiated
ESCs shows that the differentially methylated region (DMR) of
Snrpn is 49.6% methylated, the Xist promoter is 66.3%
methylated, and IAP is 83.5% methylated. In the putative iPGCs,
methylation at the Snrpn DMR is modestly reduced to 38.7%,
while Xist and IAP methylation levels are the same as ESCs. To
determine if the DMR of Snrpn also exhibits partial demethylation
in endogenous PGCs, we performed bisulfite sequencing of sorted
PGCs from e9.5 and e10.5 Oct4-gfp embryos. Methylation at the
Snrpn DMR in e9.5 and e10.5 PGCs from the embryo were still
present (47.6% and 54.2% respectively) consistent with previously
published findings [31]. Furthermore, we observed evidence of
demethylation at the 59 and 39 ends of three clones in endogenous
PGCs at e9.5 and two sequences at e10.5 similar to what was
observed in iPGCs (Figure 2D, arrows). Taken together, using
real time PCR, immunofluorescence and bisulfite sequencing, our
data strongly argue that the Blimp1-positive PGCs isolated from
EBs at day 6 of differentiation correspond to a pre-e11.5 stage
germ cell in vitro.
Germ line signature genes including Blimp1 are co-expressed in single SSEA1+/cKitbright cells
To determine whether the relative levels of PGC signature
genes in SSEA1+/cKitbright cells are comparable to the levels
found in PGCs sorted from the embryo prior to e11.5, we sorted
Gfp+ cells from Oct4-gfp embryos at 9.5 and e10.5 (Figure 3A–C,
shown is e9.5). A distinct Gfp+ population was detected from e9.5
to at least e13.5 (Figure 3C and data not shown). Sorted Oct4-gfp+PGCs from the embryo are SSEA1+ and exhibit bright cKit+staining (Figure 3C). We confirmed that the Gfp+ cells are PGCs
due to enriched expression of cKit, Blimp1, Stella, and Mvh relative
to the Gfp- somatic cells at a population level by real time PCR
(Figure 3D). Detection of cKit and Blimp1 RNA in the Gfp-
population was not unexpected as these genes are also expressed in
endothelial and hematopoietic cells during early embryogenesis
[32,33].
We next evaluated the transcriptional identity of undifferenti-
ated ESCs, iPGCs and embryonic PGCs at e9.5 and e10.5 at a
single cell level by examining expression of five signature PGC
markers (Blimp1, Stella, Prdm14, Dnd1 and Dazl) using the BioMark
Fluidigm Real Time PCR platform (Figure 3E–H). We evaluated
38 single undifferentiated ESCs (Figure 3E), 34 single embryonic
Oct4-Gfp+ PGCs at e9.5 (Figure 3F), 24 single Oct4-Gfp+ PGCs
at e10.5 (Figure 3G), and 30 iPGCs from day 6 EBs (Figure 3H).
In undifferentiated ESCs, 17 of the 38 cells (44%) expressed
Blimp1. Of the 17 Blimp1+ cells, 6 did not express Stella and 12 did
not express Dnd1. In contrast to ESCs where less than 50% of cells
expressed Blimp1, 100% of e9.5 and e10.5 PGCs from the embryo
and iPGCs expressed Blimp1 (Figure 3F–H). Heat maps of the
single cell analysis indicate that e9.5 PGCs are relatively
homogeneous when comparing individual cells to each other for
each gene, whereas at e10.5 and in iPGCs expression levels
between individual cells is more heterogeneous (Figure 3G,H).
Critically, only one cell in the iPGC cohort was not a germ cell
(Figure 3H, asterisk).
Figure 2. iPGCs have characteristics of pre-gonadal, pre-reprogrammed in vivo PGCs. A: Immunofluorescence of pre-gonadal e10.5 PGCsstained for Oct4 (red) and Mvh (green). e13.5 male gonadal PGCs were stained as a positive control. Dotted circles mark the testis cords. B: SortedSSEA1+/cKitbright iPGCs stained for Mvh (green, left) or secondary antibody alone (right). C: iPGCs stained for H3K27m3 (red, left), and secondaryantibody alone (right). Arrows point to individual iPGCs. D: Bisulfite sequencing of ESCs, iPGCs, and endogenous e9.5 PGCs for Snrpn, the Xistpromoter, and IAP. Circles represent individual CG dinucleotides, black = methylated and white = unmethylated cytosines. Arrows indicate individualalleles that display characteristic demethylation. N.D. = not determined.doi:10.1371/journal.pone.0028960.g002
Developmental Staging of In Vitro PGCs
PLoS ONE | www.plosone.org 4 December 2011 | Volume 6 | Issue 12 | e28960

Figure 3. Developmental staging of pre-gonadal iPGCs at single cell resolution. A: Bright field image of representative e9.5 Oct4-gfpembryo. Dotted line indicates where the embryo was bisected at somite 13 for FACS. Scale bar = 1 mm. B: Whole mount confocal microscopy of liveembryos with migratory Oct4-gfp+ PGCs within the hindgut (arrows). C: Flow cytometry of the bisected lower half of e9.5 Oct4-gfp embryos. Oct4-
Developmental Staging of In Vitro PGCs
PLoS ONE | www.plosone.org 5 December 2011 | Volume 6 | Issue 12 | e28960
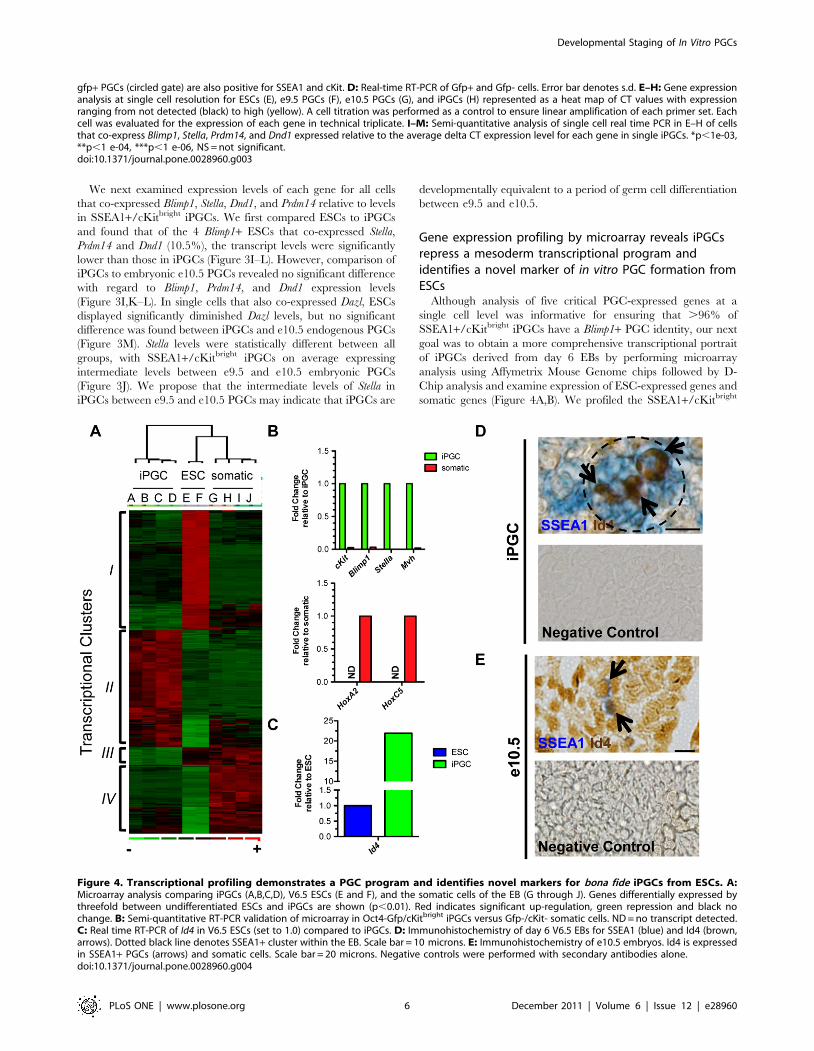
We next examined expression levels of each gene for all cells
that co-expressed Blimp1, Stella, Dnd1, and Prdm14 relative to levels
in SSEA1+/cKitbright iPGCs. We first compared ESCs to iPGCs
and found that of the 4 Blimp1+ ESCs that co-expressed Stella,
Prdm14 and Dnd1 (10.5%), the transcript levels were significantly
lower than those in iPGCs (Figure 3I–L). However, comparison of
iPGCs to embryonic e10.5 PGCs revealed no significant difference
with regard to Blimp1, Prdm14, and Dnd1 expression levels
(Figure 3I,K–L). In single cells that also co-expressed Dazl, ESCs
displayed significantly diminished Dazl levels, but no significant
difference was found between iPGCs and e10.5 endogenous PGCs
(Figure 3M). Stella levels were statistically different between all
groups, with SSEA1+/cKitbright iPGCs on average expressing
intermediate levels between e9.5 and e10.5 embryonic PGCs
(Figure 3J). We propose that the intermediate levels of Stella in
iPGCs between e9.5 and e10.5 PGCs may indicate that iPGCs are
developmentally equivalent to a period of germ cell differentiation
between e9.5 and e10.5.
Gene expression profiling by microarray reveals iPGCsrepress a mesoderm transcriptional program andidentifies a novel marker of in vitro PGC formation fromESCs
Although analysis of five critical PGC-expressed genes at a
single cell level was informative for ensuring that .96% of
SSEA1+/cKitbright iPGCs have a Blimp1+ PGC identity, our next
goal was to obtain a more comprehensive transcriptional portrait
of iPGCs derived from day 6 EBs by performing microarray
analysis using Affymetrix Mouse Genome chips followed by D-
Chip analysis and examine expression of ESC-expressed genes and
somatic genes (Figure 4A,B). We profiled the SSEA1+/cKitbright
gfp+ PGCs (circled gate) are also positive for SSEA1 and cKit. D: Real-time RT-PCR of Gfp+ and Gfp- cells. Error bar denotes s.d. E–H: Gene expressionanalysis at single cell resolution for ESCs (E), e9.5 PGCs (F), e10.5 PGCs (G), and iPGCs (H) represented as a heat map of CT values with expressionranging from not detected (black) to high (yellow). A cell titration was performed as a control to ensure linear amplification of each primer set. Eachcell was evaluated for the expression of each gene in technical triplicate. I–M: Semi-quantitative analysis of single cell real time PCR in E–H of cellsthat co-express Blimp1, Stella, Prdm14, and Dnd1 expressed relative to the average delta CT expression level for each gene in single iPGCs. *p,1e-03,**p,1 e-04, ***p,1 e-06, NS = not significant.doi:10.1371/journal.pone.0028960.g003
Figure 4. Transcriptional profiling demonstrates a PGC program and identifies novel markers for bona fide iPGCs from ESCs. A:Microarray analysis comparing iPGCs (A,B,C,D), V6.5 ESCs (E and F), and the somatic cells of the EB (G through J). Genes differentially expressed bythreefold between undifferentiated ESCs and iPGCs are shown (p,0.01). Red indicates significant up-regulation, green repression and black nochange. B: Semi-quantitative RT-PCR validation of microarray in Oct4-Gfp/cKitbright iPGCs versus Gfp-/cKit- somatic cells. ND = no transcript detected.C: Real time RT-PCR of Id4 in V6.5 ESCs (set to 1.0) compared to iPGCs. D: Immunohistochemistry of day 6 V6.5 EBs for SSEA1 (blue) and Id4 (brown,arrows). Dotted black line denotes SSEA1+ cluster within the EB. Scale bar = 10 microns. E: Immunohistochemistry of e10.5 embryos. Id4 is expressedin SSEA1+ PGCs (arrows) and somatic cells. Scale bar = 20 microns. Negative controls were performed with secondary antibodies alone.doi:10.1371/journal.pone.0028960.g004
Developmental Staging of In Vitro PGCs
PLoS ONE | www.plosone.org 6 December 2011 | Volume 6 | Issue 12 | e28960

fraction from V6.5 EBs at day 6 of differentiation (Samples A and
B), Oct4-Gfp+/cKitbright cells from day 6 Oct4-gfp EBs (Samples C
and D), undifferentiated V6.5 SSEA1+/cKit+ ESCs (Samples E
and F), and SSEA1-/cKit- and Oct4-/cKit- day 6 EB cells
(Samples G–J).
Cluster analysis of genes that are differentially expressed at
greater than three-fold between undifferentiated ESCs and iPGCs
(348 genes, p,0.01) generated four major transcriptional clusters
(Figure 4A & Table S1). Gene ontology (GO) analysis of Cluster I
(enriched in ESCs but not iPGCs or somatic cells) identified genes
associated with transcription factor activity and DNA binding.
Cluster II (enriched in iPGCs but not ESCs or somatic cells)
revealed enrichment in genes associated with hydrolyase activity,
cytoplasmic proteins and MAPK signaling pathways. Genes in
Cluster III (enriched in ESCs and somatic cells but not iPGCs)
were associated with GO terms for stress fibers and actin filament
bundle genes. Finally, GO analysis of Cluster IV (repressed in
iPGCs and ESCs but not somatic cells) revealed genes associated
with mesoderm formation including heart and blood development,
and morphogenesis. Together, these data suggest that iPGCs
repress genes associated with mesoderm differentiation, similar to
what has been proposed for endogenous PGC formation through
the activity of Blimp1 [2,7]. Expression of candidate PGC genes
from the microarray was validated by real time RT-PCR from
Oct4-Gfp+/cKitbright iPGCs (Figure 4B). Similarly, expression of
additional somatic genes (Hoxa2 and Hoxc5) which were not
evaluated earlier (Figure S1F) revealed undetectable expression in
iPGCs, whereas somatic cells were positive.
Next, we compared our microarray data between iPGCs and
undifferentiated ESCs to identify a marker that could distinguish
between these two cell types. We identified Inhibitor of DNA binding
4 (Id4) as being significantly higher in iPGCs relative to ESCs. We
confirmed the microarray data showing significant enrichment of
Id4 RNA in independently collected iPGC samples relative to
undifferentiated ESCs (Figure 4C). To determine if Id4 protein is
expressed in iPGCs, we performed immunohistochemistry of day 6
EBs with SSEA1 and Id4, and identified Id4 positive cells within
the clusters of SSEA1+ cells (Figure 4D). Likewise, immunohis-
tochemistry of e10.5 embryos shows that Id4 protein is expressed
in SSEA1+ PGCs (Figure 4E, arrow). However, Id4 was also
expressed in the surrounding embryonic somatic cells. Taken
together, Id4 is a new marker for distinguishing iPGCs from
undifferentiated ESCs, but does not distinguish PGCs from
somatic cells of the embryo.
Blimp1 is specifically required for iPGC differentiationfrom EBs
Dosage of Blimp1 is essential for the specification of PGCs in vivo
[2,32]. To determine if the emergence of SSEA1+/cKitbright PGCs
in vitro is similarly dependent upon Blimp1 expression, we derived
Blimp1fl/fl ESCs from e3.5 blastocysts. We performed Y chromo-
some FISH to identify a male line (Figure 5A), and generated three
independent Blimp1 knockout sub-lines (Blimp1D/D) via transfection
of Cre recombinase fused to Gfp followed by re-plating of Gfp+cells at limiting dilutions. Clones were screened by Southern blot
to verify Blimp1 deletion (Figure 5B). To compare overall self-
renewal and pluripotency in Blimp1D/D cells relative to the parental
line, we performed flow cytometry for SSEA1 under self-renewing
conditions in the presence of LIF (Figure 5C), and teratoma
analysis by injection of undifferentiated ESCs into the testicles of
SCID mice (Figure 5D). In both assays, all Blimp1D/D lines were
indistinguishable from parental Blimp1fl/fl cells, indicating that loss
of Blimp1 does not cause gross defects in overall ESC self-renewal
or differentiation.
Finally, to evaluate in vitro PGC formation, we performed paired
differentiation experiments with Blimp1fl/fl and Blimp1D/D lines and
evaluated iPGC differentiation by flow cytometry (Figure 5E).
Quantification of SSEA1+/cKitbright cells revealed that iPGCs
constitute approximately 3–4% of the live cell EB population in
the parental Blimp1fl/fl line at day 6 (Figure 5F). In contrast, all
Blimp1D/D sub-lines displayed between a 70–90% decrease in
SSEA1+/cKitbright iPGCs, with the average percentage constituting
less than 1% of the EB in all three sub-lines examined (Figure 5F,G).
Functionally, this demonstrates that sorting for SSEA1+/cKitbright
iPGCs captures a Blimp1-dependent PGC population in vitro, whereas
generation of SSEA1+/cKitmid and SSEA1+/cKitdim fractions of
EBs do not exhibit the same reliance on Blimp1 as in vivo PGCs.
Discussion
Emerging cell populations in the early embryo are challenging
to investigate. Therefore, we used mouse ESCs from multiple
genetic backgrounds to differentiate transgene-free, pre-gonadal
stage PGCs where 100% of the single iPGCs express Blimp1 in vitro.
Here we show that sorting for the cKitbright fraction of SSEA1+cells at day 6 of differentiation when the population is first
discernable yields an iPGC population with an identity suggestive
of PGCs younger than e11.5.
One of the major challenges in the ESC and PGC fields has
been to distinguish early progenitor PGCs from undifferentiated
ESCs due to their similar expression patterns. Indeed, e11.5 PGCs
isolated from the genital ridge prior to sex determination cluster
very closely to undifferentiated ESCs in 2-dimensional principle
component analysis after microarray [11]. Therefore, it has been
proposed that ESCs originate from a progenitor germ cell
consistent with detectable expression of PGC-signature genes,
including Dazl and Tissue non specific alkaline phosphatase in the
undifferentiated state [34,35]. Although our studies do not address
the origin of ESCs, our data does indicate that a small nascent
PGC-like population corresponding to about 10% of cells can be
identified in an ESC culture in the self-renewing state, agreeing
strongly with previous work which demonstrated that Dazl null
ESCs exhibit reduced expression of PGC-signature genes [8].
However, our data also show that despite co-expression of germ
cell genes in these 10% of cells, the transcript levels are
significantly lower than the levels found in bona fide PGCs isolated
form the embryo between e9.5–e10.5 as well as the iPGCs. Taken
together, our data argues that the majority of undifferentiated
ESCs are not PGCs, and that a single cell analysis is critical to
uncouple differences between ESCs and progenitor PGCs.
In the current study, we identified Id4 as a new marker enriched
in iPGCs relative to undifferentiated ESCs. Id4 was recently found
to be a germ line marker expressed in gonocytes and spermato-
gonia of postnatal and adult murine gonads [36]. We extend these
findings to show that Id4 is expressed during the earliest stage of
germ line development, prior to gonadal colonization (Figure 4E).
Interestingly, Id4 similar to Stella constitutes a marker for defining
PGC identity yet has no functional role in specifying PGC fate
[13,36,37]. However, by combining Id4, SSEA1, and Oct4
expression in day 6 EBs, we propose a model for germ line
formation in vitro that involves the generation of multiple SSEA1+/
Oct4+ niches during EB formation, with Id4+ iPGCs emerging
from within these niches (Figure 6). We propose that similar to
PGC development in the allantois of the embryo, the tight
clustering of SSEA1+/Oct4+ cells creates a microenvironment in
the EB to protect the iPGCs against somatic cell differentiation
signals [38]. Given that Id4+ cells constitute only a subpopulation
of cells within SSEA1+ clusters, we hypothesize that the clusters
Developmental Staging of In Vitro PGCs
PLoS ONE | www.plosone.org 7 December 2011 | Volume 6 | Issue 12 | e28960

are composed of a heterogeneous mixture of immature cells,
including epiblast-like cells (Stella negative, Blimp1 negative), PGC
precursors (Stella negative, Blimp1 positive) and definitive Id4-
positive cKitbright iPGCs (Figure 6). Whether the SSEA1+/
cKitbright PGCs emerge from a subpopulation of the SSEA1+/
cKitmid fraction of cells remains to be determined. However, our
data strongly argue that iPGCs do not differentiate from SSEA1+/
cKitdim cells, which have no colony forming potential, and express
high levels of Hoxa1 and Hoxb1, indicating commitment to a
somatic fate.
Although our data suggest that the iPGCs are younger than
e11.5 of development due to lack of Mvh protein expression, it is
conceivable that iPGCs at day 6 are more similar to e11.5 in some
aspects, but have not received the appropriate cues to express Mvh
protein. The signals that promote Mvh protein expression in
PGCs at e11.5 are not well understood, but one study has
indicated that gonadal somatic cells are involved in this process
[29]. Lack of Mvh protein expression in our model suggests that
the hanging drop EB system by day 6 of differentiation does not
provide the necessary signals to promote developmental progres-
sion to Mvh protein-positive iPGCs. This result implies that
progression of iPGCs in vitro may require a gonadal niche to
promote differentiation to the Mvh protein-positive stage. Indeed,
while this manuscript was under review, Hayashi and colleagues
demonstrated that a neonatal seminiferous tubule niche was
necessary to promote differentiation of ESC-derived PGCs, which
this group called PGC like cells (PGCLCs), into functional post-
meiotic male germ cells [39]. In these studies, PGCLCs were
isolated using SSEA1 and Integrin Beta 3 and were hypothesized
to be equivalent to e9.5 of development. Similar to this group,
iPGCs isolated at day 6 also express significantly high levels of
Integrin Beta 3 RNA (Figure S2).
In the current study, we successfully acquired PGCs in the
Blimp1-positive stage of development. Blimp1 is not expressed in
Figure 5. Blimp1 is required for the differentiation of iPGCs from ESCs. A: DNA-FISH for the Y chromosome in Blimp1fl/fl ESCs. B: Southernblot for detection of wild type (WT), flox, and knock-out (KO) alleles of Blimp1. C: Flow cytometry for SSEA1 on undifferentiated ESCs. D:Representative histological sections from Blimp1fl/fl and Blimp1D/D teratomas. All lines were capable of differentiation to ectoderm (Ecto), mesoderm(Meso) and endoderm (Endo). Scale bar = 100 microns. E: Representative paired EB differentiations of Blimp1fl/fl and Blimp1D/D ESCs. Quadrant gatesindicate criteria for gating SSEA1+/cKitbright iPGCs, which are contained within the rectangular gate (black lines). F: Percentage iPGC yield in thecontrol Blimp1fl/fl line and Blimp1D/D sub-lines. Error bars represent s.e.m. G: Quantification of data from F, expressed as a percent of the Blimp1fl/fl
iPGC yield from each paired experiment. Error bars represent the standard error of the mean. *p,0.05, ** p,161027.doi:10.1371/journal.pone.0028960.g005
Developmental Staging of In Vitro PGCs
PLoS ONE | www.plosone.org 8 December 2011 | Volume 6 | Issue 12 | e28960

meiotic or post-meiotic cells and therefore our model is not useful
for evaluating meiotic progression; however, we propose that this
model can be used to successfully evaluate molecular events in PGC
formation prior to gonadal colonization, gonadal reprogramming
and sex determination. As an example of the utility of our model,
one hundred male e10.5 embryos would be required to obtain
approximately 100,000 PGCs via FACS, if we estimate that there
are ,1,000 PGCs per embryo at this developmental age [5]. In
contrast, generating iPGCs equivalent to e9.5–10.5 of development
using ESC differentiation required 50 plates of hanging drop EBs,
which takes 1 hour to set up from only two wells of undifferentiated
ESCs. This yields on average 150,000–175,000 Blimp1 positive
iPGCs at day 6 of differentiation, resulting in more than 100-fold
enrichment in cell numbers over embryonic dissections [40].
In conclusion, we propose that the ESC-to-PGC differentiation
model is an essential tool for examining molecular events in PGC
development. In this study we developed a model that specifically
captures the Blimp1-positive stage of male PGC formation prior to
the expression of Mvh protein. This period of germ cell
development (prior to e11.5) is uniquely regulated in mammals
and is not conserved with lower model organisms such as
Drosophila, C. elegans, frog, and chick (for example, the role of
Blimp1). Therefore, creating models that study the initial formation
of mammalian PGCs such as the one described here, as well as
extending this model to female ESC lines, will be critical to our
understanding of the mechanisms that govern fundamental
principles of inheritance via the germ line.
Materials and Methods
Ethics StatementMouse embryo dissection, breeding colony maintenance, and
animal surgery were all performed following Institutional Approval
for Appropriate Care and use of Laboratory animals by the UCLA
Institutional Animal Care and Use Committee (Chancellor’s
Animal Research Committee (ARC)), Animal Welfare assurance
number A3196-01.
Cell Culture and EB DifferentiationAll ESC lines in this study were maintained as described
previously with lot-tested FBS (Hyclone Lot #ATJ33070) on
inactivated CF-1 mouse embryonic fibroblasts (MEFs) [41]. Cells
were passaged every three days at 5,300 cells/cm2. For EB
formation, ESCs were subjected to MEF depletion by plating a
single cell suspension on tissue culture dishes twice for five minutes
each. Cells were seeded in drops of 20 microliters each containing
300 cells on the lids of Petri dishes with 5 mL PBS in the plate
bottom and cultured in the absence of LIF for six days, with
addition of 3.5 mL PBS on day 3 of differentiation. For ESC
derivation, e3.5 blastocysts were isolated from homozygous
Blimp1flox/flox (C57BL6/J) crosses and cultured in ESC media
containing PD98059 (Cell Signaling) for four days. ESC lines were
then passaged and maintained routinely. To generate Blimp1 null
ESCs, Blimp1flox/flox cells were transfected with pCAG-Cre:Gfp
[42] and sorted to generate sublines.
MiceOct4-gfp embryos were dissected and dissociated with TrypLE
(Invitrogen) prior to flow cytometry or FACS. For teratoma
analysis, 100,000 ESCs were injected into the testicles of SCID
recipient mice and collected 6 weeks after transplant for histology
[40].
iPGC Colony AssayiPGCs were sorted from EBs by FACS and re-plated on
inactivated CF-1 MEFs. iPGCs were cultured in ESC media
Figure 6. Model for iPGC emergence from SSEA1/Oct4+ clusters in EBs. In day 6 of EBs (pink circle) multiple discreet clusters of Oct4+ (red)and SSEA1+ (green) cells are identified. SSEA1+ cells within these clusters exhibit a range of cKit signal intensities identified by flow cytometryincluding cKitbright (iPGCs), cKitmid (iPGC precursors and epiblast stem cells) and cKitdim (somatic lineage primed epiblast) cells (black box). DefinitiveiPGCs are enriched in the cKitbright fraction of SSEA1+ or Oct4+ cells, and the generation of this population in vitro is dependent upon Blimp1. Using adifferential colony forming assay in the presence FGF2, SCF, LIF and RA which promotes survival and proliferation of PGCs, we show that RA-iPGCpotential is highest in the cKitbright fraction and is absent in the cKitdim subpopulation of SSEA1+ cells. Furthermore, converting RA-iPGCs to mediacontaining LIF supports the generation of self-renewing EGCs in vitro.doi:10.1371/journal.pone.0028960.g006
Developmental Staging of In Vitro PGCs
PLoS ONE | www.plosone.org 9 December 2011 | Volume 6 | Issue 12 | e28960

supplemented with 15 ngml21 bFGF2 (R&D), 30 ngml21 SCF
(Peprotech), and 2 micromolar retinoic acid (Sigma), for five days
as described previously [15]. Cells were cultured for five days with
daily media changes followed by assaying for AP activity. EGCs
were derived from iPGCs by culture of iPGCs for five days with
LIF/SCF/bFGF2/RA, followed by passaging in LIF-only con-
taining media for subsequent passages.
Flow cytometry and FACSStaining for SSEA1 (DSHB, 1:200) and cKit (BD, 1:200) was
performed on ice. Indirect labeling was performed with Cy5-
conjugated goat anti-mouse IgG and IgM (1:500) and PE-
conjugated goat anti-rat IgG (1:1000) (Jackson ImmunoResearch).
7AAD or DAPI were added prior to all acquisitions to examine
only live cells for downstream analyses with FlowJo software
(TreeStar).
ImmunostainingEmbryoid bodies were fixed and embedded in paraffin
according to standard protocols. For iPGC stains, cells were
sorted by FACS and plated onto poly-lysine coated cover slips.
The following antibodies were used at the indicated dilutions:
SSEA1 (DSHB, 1:100), Oct4 (1:100, Santa Cruz), Mvh (1:100,
Abcam), and H3K27m3 (1:500, Millipore). All samples were
incubated with primary antibodies overnight at 4uC. Sections were
washed, incubated with FITC anti-mouse IgM, TRITC anti-goat
IgG, or FITC/TRITC conjugated anti-rabbit IgG antibodies
(Jackson Immunoresearch) for 30 minutes at room temperature. Y
chromosome FISH was performed on chromosome spreads.
SSEA1 and Id4 immunohistochemical detection was performed
using anti-Id4 (1:100, Novus Biologicals) and anti-SSEA1 (DSHB)
with standard protocols (Vector Labs).
Real-time PCRRNA was extracted from sorted samples using the RNEasy
Micro Kit (Qiagen) and reverse-transcribed using Superscript RT
II (Invitrogen). All gene expression analysis was performed using
commercially available TaqMan Gene Expression Assays (Applied
Biosystems), with the exception of Id4, which as examined by
SYBR Green PCR (Roche). See Table S2 for additional primer
information. CT values were normalized to Gapdh expression and
expressed as fold change relative to a control cell type referenced
in each experiment.
Single-cell Real Time RT-PCRSingle cells were sorted by FACS and subjected to reverse
transcription and specific target amplification of relevant genes
using the Fluidigm BioMark 48.48 dynamic gene expression
system according to manufacturer’s instructions, with PCR
performed by the UCLA Genotyping and Sequencing core
facility. A dilution series of cells were used as detection controls
and also to establish primer correlation coefficients and ensure
linear amplification of amplicons. Heat map data was generated
using Fluidigm Real Time PCR Analysis software.
Microarray and Data AnalysisRNA extraction, labeling amplification and hybridization to
Affymetrix Mouse Genome 430 2.0 arrays were performed as
previously described [41]. Analysis was performed using model-
based expression and invariant set probe normalization using D-
Chip software [43]. Gene ontology (GO) terms were identified
using DAVID [44,45]. Microarray data is deposited under GEO
accession number GSE33121.
Bisulfite SequencingGenomic DNA was isolated from sorted samples (Zymo
Research). Bisulfite conversion was performed using the EZ
DNA Methylation Kit according to manufacturer’s instructions
(Zymo Research). PCR was performed on bisulfite converted
genomic DNA and cloned into pCR2.1-TOPO (Invitrogen).
Clones were sequenced and aligned using Lasergene software
(DNASTAR). See Table S2 for PCR primer information.
Southern BlotPrdm1/Blimp1 deletion was verified with dUTP-digoxigenin-
labeled probe generated by PCR upstream of the deleted exons of
Blimp1 (fwd:59- CTCGTGGCTCTTGTGTGTGT -39, rev:59-
AACGCTGTACCCATGACTCC -39), after digestion with
EcoRI. Detection of wild type (15 kb), flox, (13.5 kb), and KO
(10 kb) alleles of Blimp1 have been described [46].
Supporting Information
Figure S1 Kinetics of EB formation and the transcrip-tional identity of iPGCs. A: Oct4-gfp embryoid bodies at days
5–8 of differentiation. Scale bar = 500 microns. B: Quantification
of EB cell viability recorded as the percent of 7AAD- cells at each
time point by flow cytometry. C: Flow cytometry of the live cell EB
fraction for Oct4-gfp and cKit at the corresponding time point.
Blue oval indicates the Oct4-gfp+/cKit+ side population, which
first appears at day 6. Oct4-gfp+/cKitbright cells correspond to
iPGCs. D: Oct4-gfp EBs at day 6 were stained with SSEA1 and
cKit, and Oct4-gfp expression was examined in SSEA1+/
cKitbright, SSEA1+/cKitmid and SSEA1+/cKitdim populations. E:
PGC gene expression data for Oct4-gfp and J1-derived iPGCs and
somatic cells. F: Somatic gene expression data for Oct4-gfp and J1-
derived iPGCs and somatic cells.
(TIF)
Figure S2 Integrin Beta 3 is enriched in iPGCs. Normal-
ized signal intensity from probe sets for Integrin beta 3 (Itgb3) for
ESCs and iPGCs were determined from the microarray presented
in Figure 4A.
(TIF)
Table S1 DAVID Gene Ontology of transcriptional clusters
identified between ESCs and iPGCs. Gene ontology analysis of
genes corresponding to Affymetrix probe sets identified from each
transcriptional cluster in Figure 4A differentially expressed more
than 3-fold with p,0.01.
(DOC)
Table S2 Primers used in this study.
(DOCX)
Acknowledgments
We acknowledge Konrad Hochedlinger for Oct4-gfp mice, Robert Blelloch
for V6.5 ESCs, Hong Wu and Rudolph Jaenisch for Oct4-gfp ESCs, and
Kathrin Plath for Rosa26-gfp ESCs. We thank Katrina Adams, Nicole
Walsh, Xinmin Li, Bennet Novitch, and Michael Teitell for technical
assistance, and Felicia Codrea and Jessica Scholes for FACS. The SSEA1
antibody developed by D. Solter and B. Knowles was obtained from the
Developmental Studies Hybridoma Bank developed under the auspices of
the NICHD and maintained by the University of Iowa.
Author Contributions
Conceived and designed the experiments: JJV ATC. Performed the
experiments: JJV ZL SAL XL MOE SVDP SKT SG AGL. Analyzed the
data: JJV ATC. Contributed reagents/materials/analysis tools: JJV. Wrote
the paper: JJV ATC.
Developmental Staging of In Vitro PGCs
PLoS ONE | www.plosone.org 10 December 2011 | Volume 6 | Issue 12 | e28960

References
1. Ginsburg M, Snow MH, McLaren A (1990) Primordial germ cells in the mouseembryo during gastrulation. Development 110: 521–528.
2. Ohinata Y, Payer B, O’Carroll D, Ancelin K, Ono Y, et al. (2005) Blimp1 is acritical determinant of the germ cell lineage in mice. Nature 436: 207–213.
3. Seki Y, Hayashi K, Itoh K, Mizugaki M, Saitou M, et al. (2005) Extensive andorderly reprogramming of genome-wide chromatin modifications associated
with specification and early development of germ cells in mice. Dev Biol 278:
440–458.
4. Seki Y, Yamaji M, Yabuta Y, Sano M, Shigeta M, et al. (2007) Cellular
dynamics associated with the genome-wide epigenetic reprogramming inmigrating primordial germ cells in mice. Development 134: 2627–2638.
5. Tam PP, Snow MH (1981) Proliferation and migration of primordial germ cellsduring compensatory growth in mouse embryos. J Embryol Exp Morphol 64:
133–147.
6. Ancelin K, Lange UC, Hajkova P, Schneider R, Bannister AJ, et al. (2006)Blimp1 associates with Prmt5 and directs histone arginine methylation in mouse
germ cells. Nat Cell Biol 8: 623–630.
7. Kurimoto K, Yabuta Y, Ohinata Y, Shigeta M, Yamanaka K, et al. (2008)
Complex genome-wide transcription dynamics orchestrated by Blimp1 for the
specification of the germ cell lineage in mice. Genes Dev 22: 1617–1635.
8. Haston KM, Tung JY, Reijo Pera RA (2009) Dazl functions in maintenance of
pluripotency and genetic and epigenetic programs of differentiation in mouseprimordial germ cells in vivo and in vitro. PLoS ONE 4: e5654.
9. Hubner K, Fuhrmann G, Christenson LK, Kehler J, Reinbold R, et al. (2003)Derivation of oocytes from mouse embryonic stem cells. Science 300:
1251–1256.
10. Imamura M, Aoi T, Tokumasu A, Mise N, Abe K, et al. (2010) Induction ofprimordial germ cells from mouse induced pluripotent stem cells derived from
adult hepatocytes. Mol Reprod Dev 77: 802–811.
11. Sabour D, Arauzo-Bravo MJ, Hubner K, Ko K, Greber B, et al. (2010)
Identification of genes specific to mouse primordial germ cells through dynamicglobal gene expression. Hum Mol Genet.
12. Young JC, Dias VL, Loveland KL (2010) Defining the window of germline
genesis in vitro from murine embryonic stem cells. Biology of reproduction 82:390–401.
13. Payer B, Chuva De Sousa Lopes SM, Barton SC, Lee C, Saitou M, et al. (2006)Generation of stella-GFP transgenic mice: a novel tool to study germ cell
development. Genesis 44: 75–83.
14. Wei W, Qing T, Ye X, Liu H, Zhang D, et al. (2008) Primordial germ cellspecification from embryonic stem cells. PLoS ONE 3: e4013.
15. West JA, Viswanathan SR, Yabuuchi A, Cunniff K, Takeuchi A, et al. (2009) Arole for Lin28 in primordial germ-cell development and germ-cell malignancy.
Nature 460: 909–913.
16. Nicholas CR, Xu EY, Banani SF, Hammer RE, Hamra FK, et al. (2009)
Characterization of a Dazl-GFP germ cell-specific reporter. Genesis 47: 74–84.
17. Mizuno K, Tokumasu A, Nakamura A, Hayashi Y, Kojima Y, et al. (2006)Genes associated with the formation of germ cells from embryonic stem cells in
cultures containing different glucose concentrations. Mol Reprod Dev 73:437–445.
18. Toyooka Y, Tsunekawa N, Akasu R, Noce T (2003) Embryonic stem cells canform germ cells in vitro. Proc Natl Acad Sci USA 100: 11457–11462.
19. Geijsen N, Horoschak M, Kim K, Gribnau J, Eggan K, et al. (2004) Derivation
of embryonic germ cells and male gametes from embryonic stem cells. Nature427: 148–154.
20. Qing T, Shi Y, Qin H, Ye X, Wei W, et al. (2007) Induction of oocyte-like cellsfrom mouse embryonic stem cells by co-culture with ovarian granulosa cells.
Differentiation 75: 902–911.
21. Wernig M, Meissner A, Foreman R, Brambrink T, Ku M, et al. (2007) In vitro
reprogramming of fibroblasts into a pluripotent ES-cell-like state. Nature 448:
318–324.
22. Yabuta Y, Kurimoto K, Ohinata Y, Seki Y, Saitou M (2006) Gene expression
dynamics during germline specification in mice identified by quantitative single-cell gene expression profiling. Biology of reproduction 75: 705–716.
23. Yoshimizu T, Sugiyama N, De Felice M, Yeom YI, Ohbo K, et al. (1999)
Germline-specific expression of the Oct-4/green fluorescent protein (GFP)transgene in mice. Dev Growth Differ 41: 675–684.
24. Fox N, Damjanov I, Martinez-Hernandez A, Knowles BB, Solter D (1981)Immunohistochemical localization of the early embryonic antigen (SSEA-1) in
postimplantation mouse embryos and fetal and adult tissues. DevelopmentalBiology 83: 391–398.
25. Hayashi K, Surani MA (2009) Self-renewing epiblast stem cells exhibit continualdelineation of germ cells with epigenetic reprogramming in vitro. Development
(Cambridge, England) 136: 3549–3556.26. Morita-Fujimura Y, Tokitake Y, Matsui Y (2009) Heterogeneity of mouse
primordial germ cells reflecting the distinct status of their differentiation,
proliferation and apoptosis can be classified by the expression of cell surfaceproteins integrin a6 and c-Kit. Development, growth & differentiation 51:
567–583.27. Fujiwara Y, Komiya T, Kawabata H, Sato M, Fujimoto H, et al. (1994) Isolation
of a DEAD-family protein gene that encodes a murine homolog of Drosophila
vasa and its specific expression in germ cell lineage. Proceedings of the NationalAcademy of Sciences of the United States of America 91: 12258–12262.
28. Tanaka SS, Toyooka Y, Akasu R, Katoh-Fukui Y, Nakahara Y, et al. (2000) Themouse homolog of Drosophila Vasa is required for the development of male
germ cells. Genes & Development 14: 841–853.
29. Toyooka Y, Tsunekawa N, Takahashi Y, Matsui Y, Satoh M, et al. (2000)Expression and intracellular localization of mouse Vasa-homologue protein
during germ cell development. Mechanisms of Development 93: 139–149.30. Hajkova P, Ancelin K, Waldmann T, Lacoste N, Lange UC, et al. (2008)
Chromatin dynamics during epigenetic reprogramming in the mouse germ line.Nature 452: 877–881.
31. Hajkova P, Erhardt S, Lane N, Haaf T, El-Maarri O, et al. (2002) Epigenetic
reprogramming in mouse primordial germ cells. Mech Dev 117: 15–23.32. Vincent SD, Dunn NR, Sciammas R, Shapiro-Shalef M, Davis MM, et al.
(2005) The zinc finger transcriptional repressor Blimp1/Prdm1 is dispensable forearly axis formation but is required for specification of primordial germ cells in
the mouse. Development 132: 1315–1325.
33. Yokomizo T, Ng CEL, Osato M, Dzierzak E (2011) 3-dimensional imaging ofwhole midgestation murine embryos show an intravascular localization for all
hematopoietic clusters. Blood 117: 6132–4.34. Zwaka TP, Thomson JA (2005) A germ cell origin of embryonic stem cells?
Development (Cambridge, England) 132: 227–233.35. Chu L-F, Surani MA, Jaenisch R, Zwaka TP (2011) Blimp1 expression predicts
embryonic stem cell development in vitro. Curr Biol 21: 1759–1765.
36. Oatley MJ, Kaucher AV, Racicot KE, Oatley JM (2011) Inhibitor of DNABinding 4 Is Expressed Selectively by Single Spermatogonia in the Male
Germline and Regulates the Self-Renewal of Spermatogonial Stem Cells inMice. Biology of Reproduction 85: 347–56.
37. Saitou M, Barton SC, Surani MA (2002) A molecular programme for the
specification of germ cell fate in mice. Nature 418: 293–300.38. Maye P, Becker S, Kasameyer E, Byrd N, Grabel L (2000) Indian hedgehog
signaling in extraembryonic endoderm and ectoderm differentiation in ESembryoid bodies. Mech Dev 94: 117–132.
39. Hayashi K, Ohta H, Kurimoto K, Saitou M (2011) Reconstitution of the MouseGerm Cell Specification Pathway in Culture by Pluripotent Stem Cells. Cell. pp
1–27.
40. Popp C, Dean W, Feng S, Cokus SJ, Andrews S, et al. (2010) Genome-wideerasure of DNA methylation in mouse primordial germ cells is affected by AID
deficiency. Nature 463: 1101–1105.41. Lindgren AG, Natsuhara K, Tian E, Vincent JJ, Li X, et al. (2011) Loss of Pten
causes tumor initiation following differentiation of murine pluripotent stem cells
due to failed repression of Nanog. PLoS ONE 6: e16478.42. Matsuda T, Cepko CL (2007) Controlled expression of transgenes introduced by
in vivo electroporation. Proc Natl Acad Sci USA 104: 1027–1032.43. Li C, Wong WH (2001) Model-based analysis of oligonucleotide arrays:
expression index computation and outlier detection. Proceedings of the NationalAcademy of Sciences of the United States of America 98: 31–36.
44. Dennis G, Sherman BT, Hosack DA, Yang J, Gao W, et al. (2003) DAVID:
Database for Annotation, Visualization, and Integrated Discovery. Genome Biol4: P3.
45. Huang DW, Sherman BT, Lempicki RA (2009) Systematic and integrativeanalysis of large gene lists using DAVID bioinformatics resources. Nat Protoc 4:
44–57.
46. Shapiro-Shelef M, Lin K-I, McHeyzer-Williams LJ, Liao J, McHeyzer-Williams MG, et al. (2003) Blimp-1 is required for the formation of
immunoglobulin secreting plasma cells and pre-plasma memory B cells.Immunity 19: 607–620.
Developmental Staging of In Vitro PGCs
PLoS ONE | www.plosone.org 11 December 2011 | Volume 6 | Issue 12 | e28960